UNITED STATES
SECURITIES AND EXCHANGE COMMISSION
Washington, D.C. 20549
FORM 10-K
[X] ANNUAL REPORT PURSUANT TO SECTION 13 OR 15(d)
OF THE SECURITIES EXCHANGE ACT OF 1934
For the Fiscal Year Ended
December 31, 2014
2015
[ ] TRANSITION REPORT PURSUANT TO SECTION 13 OR 15(d)
OF THE SECURITIES EXCHANGE ACT OF 1934
For the Transition Period From
(Not Applicable)
Commission File Number 001-36636
CITIZENS FINANCIAL GROUP, INC.
(Exact name of the registrant as specified in its charter)
|
| | |
| Delaware | | 05-0412693 |
(State or Other Jurisdiction of Incorporation or Organization) | | (I.R.S. Employer Identification Number) |
One Citizens Plaza, Providence, RI 02903
(Address of principal executive offices, including zip code)
(401) 456-7000
(Registrant’s telephone number, including area code)
Securities registered pursuant to Section 12(b) of the Act:
|
| | |
| Title of each class | | Name of each exchange on which registered |
| Common stock, $0.01 par value per share | | New York Stock Exchange |
Securities registered pursuant to Section 12(g) of the Act:
None
Indicate by check mark if the registrant is a well-known seasoned issuer, as defined in Rule 405 of the Securities Act. [X] Yes [ ] Yes [X] No
Indicate by check mark if the registrant is not required to file reports pursuant to Section 13 or Section 15(d) of the Act. [ ] Yes [X] No
Indicate by check mark whether the Registrant (1) has filed all reports required to be filed by Section 13 or 15(d) of the Securities Exchange Act of 1934 during the preceding 12 months (or for such shorter period that the registrant was required to file such reports) and (2) has been subject to such filing requirements for the past 90 days.
[X] Yes [ ] No
Indicate by check mark whether the registrant has submitted electronically and posted on its corporate Web site, if any, every Interactive Data File required to be submitted and posted pursuant to Rule 405 of Regulation S-T (§232.405 of this chapter) during the preceding 12 months (or for such shorter period that the registrant was required to submit and post such files). [X] Yes [ ] No
Indicate by check mark if disclosure of delinquent filers pursuant to Item 405 of Regulation S-K is not contained herein, and will not be contained, to the best of registrant’s knowledge, in definitive proxy or information statements incorporated by reference in Part III of this Form 10-K or any amendment to this Form 10-K. [X]
Indicate by check mark whether the registrant is a large accelerated filer, an accelerated filer, a non-accelerated filer, or a smaller reporting company. See the definitions of “large accelerated filer,” “accelerated filer” and “smaller reporting company” in Rule 12b-2 of the Exchange Act:
|
| | | |
| Large accelerated filer | [ ]X] | Accelerated filer | [ ] |
| Non-accelerated filer (Do not check if a smaller reporting company) | [X] ] | Smaller reporting company | [ ] |
Indicate by check mark whether the registrant is a shell company (as defined in Rule 12b-2 of the Exchange Act). [ ] Yes [X] No
The aggregate market value of voting stock held by nonaffiliates of the Registrant was $8,672,625,866 (based on the June 30, 2015 closing price of
Citizens Financial Group, Inc. common shares of $27.31 as reported on the New York Stock Exchange). There were 545,901,116527,811,625 shares of Registrant'sRegistrant’s common stock ($0.01 par value) outstanding on February 1, 2015.
2016.
Documents incorporated by reference
Portions of Citizens Financial Group, Inc.’s proxy statement to be filed with the United States Securities and Exchange Commission in connection with Citizens Financial Group, Inc.’s 20152016 annual meeting of stockholders (the “Proxy Statement”) are incorporated by reference into Part III hereof. Such Proxy Statement will be filed within 120 days of Citizens Financial Group, Inc.’s fiscal year ended December 31, 2014.2015.
CITIZENS FINANCIAL GROUP, INC.
FORWARD-LOOKING STATEMENTS
GLOSSARY OF ACRONYMS AND TERMS
The following listing provides a comprehensive reference of common acronyms and terms we regularly use in our financial reporting:
|
| | |
| AFS | | Available for Sale |
| ALLL | | Allowance for Loan and Lease Losses |
| AOCI | | Accumulated Other Comprehensive Income (Loss) |
| ASU | | Accounting Standards Update |
| ATM | | Automated Teller Machine |
| BHC | | Bank Holding Company |
| bps | | Basis Points |
| C&I | | Commercial and Industrial |
| Capital Plan Rule | | Federal Reserve’s Regulation Y Capital Plan Rule |
| CBNA | | Citizens Bank, N.A. |
| CBPA | | Citizens Bank of Pennsylvania |
| CCAR | | Comprehensive Capital Analysis and Review |
| CCO | | Chief Credit Officer |
| CET1 | | Common Equity Tier 1 |
| CEO | | Chief Executive Officer |
| CFPB | | Consumer Financial Protection Bureau |
| Citizens or CFG or the Company | | Citizens Financial Group, Inc. and its Subsidiaries |
| CLTV | | Combined Loan-to-Value |
| CLO | | Collateralized Loan Obligation |
| CMO | | Collateralized Mortgage Obligation |
| CRA | | Community Reinvestment Act |
| CRE | | Commercial Real Estate |
| CRO | | Chief Risk Officer |
| CSA | | Credit Support Annex |
| DFAST | | Dodd-Frank Act Stress Test |
| DIF | | Deposit Insurance Fund |
| Dodd-Frank Act | | The Dodd-Frank Wall Street Reform and Consumer Protection Act of 2010 |
| DTA | | Deferred Tax Assets |
| EPS | | Earnings Per Share |
| ESPP | | Employee Stock Purchase Program |
| ERISA | | Employee Retirement Income Security Act of 1974 |
| Fannie Mae (FNMA) | | Federal National Mortgage Association |
| FASB | | Financial Accounting Standards Board |
| FDIA | | Federal Deposit Insurance Act |
| FDIC | | Federal Deposit Insurance Corporation |
| FHLB | | Federal Home Loan Bank |
| FICO | | Fair Isaac Corporation (credit rating) |
| FINRA | | Financial Industry Regulation Authority |
| FRB | | Federal Reserve Bank |
| FRBG | | Federal Reserve Board of Governors |
| Freddie Mac (FHLMC) | | Federal Home Loan Mortgage Corporation |
| FTE | | Full Time Equivalent |
CITIZENS FINANCIAL GROUP, INC.
|
| | |
| FTP | | Funds Transfer Pricing |
| GAAP | | Accounting Principles Generally Accepted in the United States of America |
| GDP | | Gross Domestic Product |
| GLBA | | Gramm-Leach-Bliley Act of 1999 |
| Ginnie Mae (GNMA) | | Government National Mortgage Association |
| HELOC | | Home Equity Line of Credit |
| HLS | | Home Lending Solutions |
| HTM | | Held To Maturity |
| IPO | | Initial Public Offering |
| LCR | | Liquidity Coverage Ratio |
| LGD | | Loss Given Default |
| LIBOR | | London Interbank Offered Rate |
| LIHTC | | Low Income Housing Tax Credit |
| LTV | | Loan-to-Value |
| MBS | | Mortgage-Backed Securities |
| MSA | | Metropolitan Statistical Area |
| MSR | | Mortgage Servicing Right |
| NSFR | | Net Stable Funding Ratio |
| NYSE | | New York Stock Exchange |
| OCC | | Office of the Comptroller of the Currency |
| OCI | | Other Comprehensive Income |
| OFAC | | Office of Foreign Assets Control |
| OIS | | Overnight Index Swap |
| OTC | | Over the Counter |
| PD | | Probability of Default |
| peers or peer banks or peer regional banks | | BB&T, Comerica, Fifth Third, KeyCorp, M&T, PNC, Regions, SunTrust and U.S. Bancorp |
| RBS | | The Royal Bank of Scotland Group plc or any of its subsidiaries |
| REITs | | Real Estate Investment Trusts |
| ROTCE | | Return on Average Tangible Common Equity |
| RPA | | Risk Participation Agreement |
| RWA | | Risk-weighted Assets |
| SBO | | Serviced by Others loan portfolio |
| SCA | | Strategic Client Acquisition |
| SEC | | United States Securities and Exchange Commission |
| SVaR | | Stressed Value-at-Risk |
| TDR | | Troubled Debt Restructuring |
| VaR | | Value-at-Risk |
CITIZENS FINANCIAL GROUP, INC.
FORWARD-LOOKING STATEMENTS
FORWARD-LOOKING STATEMENTS
This document contains forward-looking statements within the Private Securities Litigation Reform Act of 1995. AnyStatements regarding potential future share repurchases and future dividends are forward-looking statements. Also, any statement that does not describe historical or current facts is a forward-looking statement. These statements often include the words “believes,” “expects,” “anticipates,” “estimates,” “intends,” “plans,” “goals,” “targets,” “initiatives,” “potentially,” “probably,” “projects,” “outlook” or similar expressions or future conditional verbs such as “may,” “will,” “should,” “would,” and “could.”
Forward-looking statements are based upon the current beliefs and expectations of management, and on information currently available to management. Our statements speak as of the date hereof, and we do not assume any obligation to update these statements or to update the reasons why actual results could differ from those contained in such statements in light of new information or future events. We caution you, therefore, against relying on any of these forward-looking statements. They are neither statements of historical fact nor guarantees or assurances of future performance. While there is no assurance that any list of risks and uncertainties or risk factors is complete, important factors that could cause actual results to differ materially from those in the forward-looking statements include the following, without limitation:
negativeNegative economic conditions that adversely affect the general economy, housing prices, the job market, consumer confidence and spending habits which may affect, among other things, the level of nonperforming assets, charge-offs and provision expense;
theThe rate of growth in the economy and employment levels, as well as general business and economic conditions;
ourOur ability to implement our strategic plan, including the cost savings and efficiency components, and achieve our indicative performance targets;
ourOur ability to remedy regulatory deficiencies and meet supervisory requirements and expectations;
liabilitiesLiabilities and business restrictions resulting from litigation and regulatory investigations;
ourOur capital and liquidity requirements (including under regulatory capital standards, such as the Basel III capital standards) and our ability to generate capital internally or raise capital on favorable terms;
theThe effect of the current low interest rate environment or changes in interest rates on our net interest income, net interest margin and our mortgage originations, mortgage servicing rights and mortgages held for sale;
changesChanges in interest rates and market liquidity, as well as the magnitude of such changes, which may reduce interest margins, impact funding sources and affect the ability to originate and distribute financial products in the primary and secondary markets;
theThe effect of changes in the level of checking or savings account deposits on our funding costs and net interest margin;
financialFinancial services reform and other current, pending or future legislation or regulation that could have a negative effect on our revenue and businesses, including the Dodd-Frank Wall Street Reform and Consumer Protection Act (“Dodd-Frank Act”) and other legislation and regulation relating to bank products and services;
aA failure in or breach of our operational or security systems or infrastructure, or those of our third party vendors or other service providers, including as a result of cyber attacks;cyber-attacks;
management’sManagement’s ability to identify and manage these and other risks; and
anyAny failure by us to successfully replicate or replace certain functions, systems and infrastructure provided by The Royal Bank of Scotland Group plc (“RBS Group”).
RBS.
In addition to the above factors, we also caution that the amount and timing of any future common stock dividends or share repurchases will depend on our financial condition, earnings, cash needs, regulatory constraints, capital requirements (including requirements of our subsidiaries), and any other factors that our Board of Directors deems relevant in making such a determination. Therefore, there can be no assurance that we will pay any dividends to holders of our common stock, or as to the
CITIZENS FINANCIAL GROUP, INC.
FORWARD-LOOKING STATEMENTS
amount of any such dividends. In addition, the timing and manner of the sale of RBS Group’s remaining ownership of our common stock remains uncertain, and we have no control over the manner in which RBS Group may seek to divest such remaining shares. Any such sale could harm the price of our shares of common stock. See “Risk Factors — Risks Related to our Common Stock” in Part I, Item 1A, included elsewhere in this report.
More information about factors that could cause actual results to differ materially from those described in the forward-looking statements can be found under “Risk Factors” in Part I, Item 1A, included elsewhere in this report.
Percentage changes, per share amounts, and ratios presented in this report are calculated using whole dollars.
CITIZENS FINANCIAL GROUP, INC.
PART I
ITEM 1. BUSINESS
Headquartered in Providence, Rhode Island, with $132.9$138.2 billion of total assets as of December 31, 2014,2015, we arewere the 13th largest retail bank holding company in the United States (according to SNL Financial).States.(1) Our approximately 17,700 employeescolleagues strive to meet the financial needs of customers and prospects through approximately 1,200 branches operating in an 11-state footprint across the New England, Mid-Atlantic and Midwest regions and through our online, telephone and mobile banking platforms. Our branch banking footprint contained approximately 30 million households and 3.1 million businesses as of December 31, 2015.(1)We also maintain over 100 retail and commercial non-branch offices located both in our banking footprint and in eleven other states and the District of Columbia.
Columbia largely contiguous to our footprint. We deliver a comprehensive range of retail and commercial banking products and services to more than five million individuals, institutions and companies. Our 11-state branch banking footprint contains approximately 29.9 million households and 3.1 million businesses according to SNL Financialcompanies and as of December 31, 2014, approximately 75%2015 nearly 70% of our loans were to customers located in our footprint.footprint and eight contiguous states where we maintain offices.
Our primary subsidiaries are Citizens Bank, N.A. (“CBNA”),CBNA, a national banking association whose primary federal regulator is the Office of the Comptroller of the Currency (“OCC”),OCC, and Citizens Bank of Pennsylvania (“CBPA”),CBPA, a Pennsylvania-chartered savings bank regulated by the Department of Banking of the Commonwealth of Pennsylvania and supervised by the Federal Deposit Insurance Corporation (“FDIC”)FDIC as its primary federal regulator.
Our History
In September 2014, Citizens Financial Group (CFG: NYSE) became a publicly-traded company in the largest traditional bank IPO in U.S. history. Following three subsequent follow on equity offerings in March, July, and November of 2015, Citizens is now fully separated from RBS.
Our history dates back to High Street Bank, founded in 1828, which established Citizens Savings Bank in 1871. Citizens Savings Bank acquired a controlling interest in its founder by the 1940s, renaming the entity Citizens Trust Company. By 1981, we had grown to 29 branches in Rhode Island with approximately $1.0 billion of assets, and in 1988 we became a wholly-owned subsidiary of RBS. Over the following two decades, we grew substantially through a series of over 25 strategic bank acquisitions, which greatly expanded our footprint throughout New England and into the Mid-Atlantic and the Midwest, transforming us from a local retail bank into one of the largest retail U.S. bank holding companies.
Business Segments
We offer a broad set of banking products and services through our two operating segments — Consumer Banking and Commercial Banking — with a focus on providing local delivery and a differentiated customer experience. Because we operate in a highly competitive industry and believe that banking should have a personal touch, we have programs in place to train and prepare our colleagues to deliver a consistent, high-quality experience through every customer interaction. Furthermore, weWe seek to ensure that customers select us as their primary banking partner by taking the time to understand their banking needs and we tailor our full range of products and services accordingly. To that end, our Consumer Banking value proposition is based on providing simple, easy to understand product offerings and a convenient banking experience with a more personalized approach. Commercial Banking focuses on offering a client-centric experience by leveraging an in-depth understanding of our clients’ and prospects’ businesses in order to proactively provide a solutions-oriented “Thought Leadership” value proposition.
The following table presents certain financial information for our segments as of and for the year ended December 31, 2014 and as of and for the year ended December 31, 2013:segments:
|
| | | | | | | | | | | | | | | | | | | | | | | | | | | | | | | | |
| | | As of and for the Year Ended December 31, 2014 | | As of and for the Year Ended December 31, 2013 |
| |
| | (in millions) | Consumer Banking | | Commercial Banking | | Other (1) |
| | Consolidated | | Consumer Banking | | Commercial Banking | | Other (1) |
| | Consolidated |
| | | | | | | | | | | | | | | | | |
| | Total loans and leases and loans held for sale (average) |
| $47,745 |
| |
| $37,683 |
| |
| $4,316 |
| |
| $89,744 |
| |
| $45,106 |
| |
| $34,647 |
| |
| $6,044 |
| |
| $85,797 |
|
| | Total deposits and deposits held for sale (average) | 68,214 |
| | 19,838 |
| | 4,513 |
| | 92,565 |
| | 72,158 |
| | 17,516 |
| | 3,662 |
| | 93,336 |
|
| | Net interest income (expense) | 2,151 |
| | 1,073 |
| | 77 |
| | 3,301 |
| | 2,176 |
| | 1,031 |
| | (149 | ) | | 3,058 |
|
| | Noninterest income | 899 |
| | 429 |
| | 350 |
| | 1,678 |
| | 1,025 |
| | 389 |
| | 218 |
| | 1,632 |
|
| | Total revenue | 3,050 |
| | 1,502 |
| | 427 |
| | 4,979 |
| | 3,201 |
| | 1,420 |
| | 69 |
| | 4,690 |
|
| | Net income (loss)(2) |
| $182 |
| |
| $561 |
| |
| $122 |
| |
| $865 |
| |
| $242 |
| |
| $514 |
| |
| ($4,182 | ) | |
| ($3,426 | ) |
|
| | | | | | | | | | | | | | | | | | | | | | | | | | | | | | | |
| | For the Year Ended December 31, |
| 2015 | | 2014 |
| (in millions) | Consumer Banking | | Commercial Banking | | Other (2) |
| | Consolidated | | Consumer Banking | | Commercial Banking | | Other (2) |
| | Consolidated |
| Total average loans and leases and loans held for sale |
| $51,484 |
| |
| $41,593 |
| |
| $3,469 |
| |
| $96,546 |
| |
| $47,745 |
| |
| $37,683 |
| |
| $4,316 |
| |
| $89,744 |
|
| Total average deposits and deposits held for sale | 69,748 |
| | 23,473 |
| | 5,933 |
| | 99,154 |
| | 68,214 |
| | 19,838 |
| | 4,512 |
| | 92,564 |
|
| Net interest income | 2,198 |
| | 1,162 |
| | 42 |
| | 3,402 |
| | 2,151 |
| | 1,073 |
| | 77 |
| | 3,301 |
|
| Noninterest income | 910 |
| | 415 |
| | 97 |
| | 1,422 |
| | 899 |
| | 429 |
| | 350 |
| | 1,678 |
|
| Total revenue | 3,108 |
| | 1,577 |
| | 139 |
| | 4,824 |
| | 3,050 |
| | 1,502 |
| | 427 |
| | 4,979 |
|
| Noninterest expense | 2,456 |
| | 709 |
| | 94 |
| | 3,259 |
| | 2,513 |
| | 652 |
| | 227 |
| | 3,392 |
|
| Net income (loss) |
| $262 |
| |
| $579 |
| |
| ($1 | ) | |
| $840 |
| |
| $182 |
| |
| $561 |
| |
| $122 |
| |
| $865 |
|
(1) According to SNL Financial.
(2) Includes the financial impact of non-core, liquidating loan portfolios and other non-core assets and liabilities, our treasury activities, wholesale funding activities, securities portfolio, community development assets and other unallocated assets, liabilities, revenues, provision for credit losses and expenses not attributed to the Consumer Banking or Commercial Banking segments. For a description of non-core assets, see “Management's“Management’s Discussion and Analysis of Financial Condition and Results of Operations — Analysis of Financial Condition — December 31, 20142015 Compared with December 31, 20132014 — Loans and Leases — Non-Core Assets” in Part II, Item 7, included elsewhere in this report.
(2) Includes a goodwill impairment charge of $4.4 billion ($4.1 billion after tax) in 2013. For more information, see “Management's Discussion and Analysis of Financial Condition and Results of Operations — Results of Operations — Year Ended December 31, 2014 Compared with Year Ended December 31, 2013 — Net Income (Loss)” in Part II, Item 7 and Note 8 “Goodwill” to our audited Consolidated Financial Statements in Part II, Item 8, included elsewhere in the report.
CITIZENS FINANCIAL GROUP, INC.
BUSINESS
Our History
In September 2014, Citizens Financial Group (CFG: NYSE) became a publicly-traded company in the largest traditional bank IPO in U.S. history. Following three subsequent follow on equity offerings in March, July, and November of 2015, Citizens is now fully separated from RBS.
Our history dates back to High Street Bank, founded in 1828, which established Citizens Savings Bank in 1871. Citizens Savings Bank acquired a controlling interest in its founder by the 1940s, renaming the entity Citizens Trust Company. By 1981, we had grown to 29 branches in Rhode Island with approximately $1.0 billion of assets, and in 1988 we became a wholly-owned subsidiary of RBS. Over the following two decades, we grew substantially through a series of over 25 strategic bank acquisitions, which greatly expanded our footprint throughout New England and into the Mid-Atlantic and the Midwest, transforming us from a local retail bank into one of the largest retail U.S. bank holding companies.
Business Segments
We offer a broad set of banking products and services through our two operating segments — Consumer Banking Segmentand Commercial Banking — with a focus on providing local delivery and a differentiated customer experience. We seek to ensure that customers select us as their primary banking partner by taking the time to understand their banking needs and we tailor our full range of products and services accordingly.
The following table presents certain financial information for our segments:
|
| | | | | | | | | | | | | | | | | | | | | | | | | | | | | | | |
| | For the Year Ended December 31, |
| 2015 | | 2014 |
| (in millions) | Consumer Banking | | Commercial Banking | | Other (2) |
| | Consolidated | | Consumer Banking | | Commercial Banking | | Other (2) |
| | Consolidated |
| Total average loans and leases and loans held for sale |
| $51,484 |
| |
| $41,593 |
| |
| $3,469 |
| |
| $96,546 |
| |
| $47,745 |
| |
| $37,683 |
| |
| $4,316 |
| |
| $89,744 |
|
| Total average deposits and deposits held for sale | 69,748 |
| | 23,473 |
| | 5,933 |
| | 99,154 |
| | 68,214 |
| | 19,838 |
| | 4,512 |
| | 92,564 |
|
| Net interest income | 2,198 |
| | 1,162 |
| | 42 |
| | 3,402 |
| | 2,151 |
| | 1,073 |
| | 77 |
| | 3,301 |
|
| Noninterest income | 910 |
| | 415 |
| | 97 |
| | 1,422 |
| | 899 |
| | 429 |
| | 350 |
| | 1,678 |
|
| Total revenue | 3,108 |
| | 1,577 |
| | 139 |
| | 4,824 |
| | 3,050 |
| | 1,502 |
| | 427 |
| | 4,979 |
|
| Noninterest expense | 2,456 |
| | 709 |
| | 94 |
| | 3,259 |
| | 2,513 |
| | 652 |
| | 227 |
| | 3,392 |
|
| Net income (loss) |
| $262 |
| |
| $579 |
| |
| ($1 | ) | |
| $840 |
| |
| $182 |
| |
| $561 |
| |
| $122 |
| |
| $865 |
|
(1) According to SNL Financial.
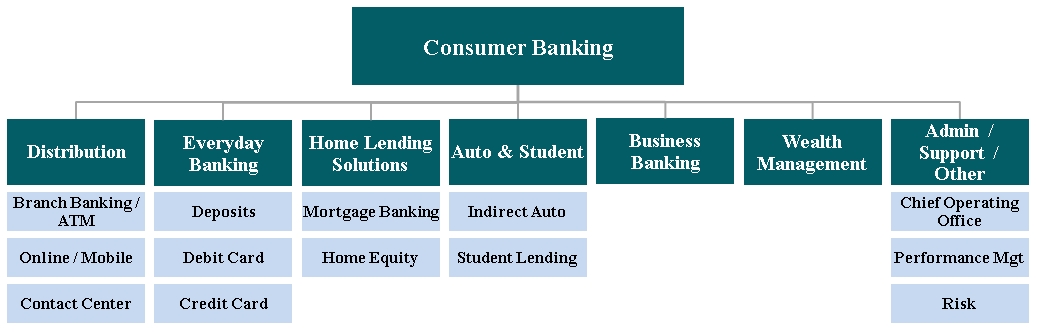
(2) Includes the financial impact of non-core, liquidating loan portfolios and other non-core assets and liabilities, our treasury activities, wholesale funding activities, securities portfolio, community development assets and other unallocated assets, liabilities, revenues, provision for credit losses and expenses not attributed to the Consumer Banking serves retail customersor Commercial Banking segments. For a description of non-core assets, see “Management’s Discussion and small businessesAnalysis of Financial Condition and Results of Operations — Analysis of Financial Condition — December 31, 2015 Compared with annual revenues of up to $25 million through a network that as of December 31, 2014 — Loans and Leases — Non-Core Assets” in Part II, Item 7, included approximately 1,200 branches operatedelsewhere in an 11-state footprint across the New England, Mid-Atlantic and Midwest regions, as well as through online, telephone and mobile banking platforms. Consumer Banking products and services include deposit products, mortgage and home equity lending, student loans, auto financing, credit cards, business loans, wealth management and investment services. Our Consumer Banking value proposition is based on providing simple, easy to understand product offerings and a convenient banking experience with a more personalized approach.
Consumer Banking is focused on winning, expanding and retaining customers through its value proposition: “Simple. Clear. Personal.” and is committed to delivering a differentiated experience through convenience and service. We were named by this report.Money Magazine in its 2014 list of “The Best Banks in America” for the second year in a row and were cited for the level of customer convenience available through the branch network, customer contact center, and access to banking specialists via instant messaging.
Consumer Banking accounted for $49.9 billion, or 56%, of outstanding loan balances in our operating segments as of December 31, 2014 and is organized around the customer products and services as follows:
Distribution: Provides a multi-channel distribution system with a network of approximately 1,200 branches, including over 345 in-store locations, as well as approximately 3,200 ATMs and a workforce of approximately 7,000 branch full-time equivalent (“FTE”) employees, which is complemented by a network of over 1,100 specialists covering home lending, wealth management and business banking. Our online and mobile capabilities offer customers the convenience of paying bills, transferring money between accounts and from person to person, in addition to a host of other everyday transactions through a robust digital platform. Lastly, the customer contact center provides customers with extended access to services.
Everyday Banking: Provides customers with deposit and payment products and services, including checking, savings, money market, certificates of deposit, debit cards, credit cards and overdraft protection. The business included approximately 2.2 million checking households and $67.0 billion in deposits as of December 31, 2014.
Home Lending Solutions (“HLS”): Offers home equity loans, home equity lines of credit (“HELOCs”) and residential mortgages primarily in footprint and in select out-of-footprint states through a direct-to-consumer call center and a mortgage loan officer base of over 410 as of December 31, 2014. We ranked sixth nationally in HELOCs by outstanding balances as of December 31, 2014, according to SNL Financial. Our HLS business maintains relatively conservative underwriting practices. Home equity originations in 2014 of $4.2 billion had a weighted average FICO score of 789 and an average loan-to-value ratio of 63%. In addition, 2014 mortgage originations of $3.7 billion had a weighted average FICO score of 765 and loan-to-value of 71%.
Indirect Auto Finance: Provides financing for the purchase of both new and used vehicles through a network of over 6,700 automotive dealerships in 43 states as of December 31, 2014. We implemented a new origination platform in October 2013 that has facilitated more granular credit and pricing strategies which will enable us to optimize risk-adjusted returns. Our underwriting strategy, which has historically focused on serving super-prime borrowers, continues to focus on serving high quality borrowers through prudent expansion of originations across a broader credit spectrum to include predominantly prime borrowers. As a result, we have been able to increase organic originations and have entered into a flow purchase agreement with a third party to accelerate our move into the prime space. The business ranked 10th nationally among regulated depository institutions by outstanding balances as of December 31, 2014, according to SNL Financial, and ranked in the top five in three of our top nine markets according to
CITIZENS FINANCIAL GROUP, INC.
BUSINESS
Autocount based on third quarter 2014 loan originations. 2014 origination volume of $6.4 billion had a weighted average FICO score of 759.
Student Lending: Offers a variety of student loan products including the TruFit Student Loan program, which features no origination, application or disbursement fees, competitive rates and a choice of repayment options. We launched the Student Lending business in 2009 and have expanded to partner with over 1,300 higher education schools in all 50 states. TruFit loan origination volume has increased from $112 million in 2010 to $305 million in 2014 and 2014 originations had a weighted-average FICO score of 779. We also launched the Education Refinance Loan product in January 2014, which provides consumers a way to refinance or consolidate multiple existing private and federal student loans. We originated approximately $230 million of these loans in 2014 with a weighted-average FICO score of 786.
Business Banking: Serves small and medium enterprise businesses with annual revenues of up to $25 million through a combination of branch-based employees, business banking officers and relationship managers. As of December 31, 2014, we employed a team of approximately 335 bankers with loans outstanding of $3.0 billion and deposit balances of $12.9 billion.
Wealth Management: Provides a full range of advisory services to clients with an array of banking, investment and insurance products and services through a sales force which includes more than 305 financial consultants, over 130 premier bankers and nine private banker teams. As of December 31, 2014, wealth management had approximately $4.1 billion in assets under management and $17.8 billion in investment brokerage assets.
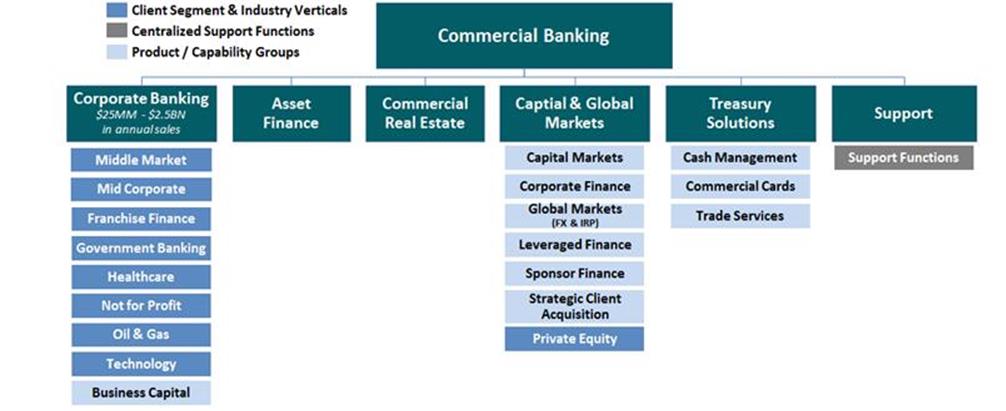
Commercial Banking Segment
Commercial Banking primarily targets companies and institutions with annual revenues of $25 million to $2.5 billion and strives to be the lead bank for its clients. Commercial Banking offers a broad complement of financial products and solutions, including lending and leasing, trade financing, deposit and treasury management, foreign exchange and interest rate risk management, corporate finance and debt and equity capital markets capabilities. Commercial Banking provides thought leadership by leveraging an in-depth understanding of our clients' and prospects' businesses to proactively deliver compelling financial solutions with quality execution. While activity is concentrated within the 11-state footprint, Commercial Banking pursues business opportunities nationally on a targeted basis in a way that reinforces its core footprint business.
We believe our Commercial Banking segment provides a compelling value proposition based on “Thought Leadership” for clients. Results are evidenced by a top five ranking in both client penetration and number of lead relationships in middle market banking within the footprint based on Greenwich Associates research (Citizens - Footprint - $25-500 million - Full Year 2014 survey). In addition, Commercial Banking strengthened its market share in loan syndications from 25th by dollar volume of syndicated loans and 18th by number of syndicated loans in 2010 to 10th by dollar volume and 8th by number of syndicated middle market loan deals for full year 2014, according to the Thomson Reuters Overall National Middle Market Bookrunner league table.
Commercial Banking is structured along lines of business, as well as product groups. Both the Corporate Finance & Capital Markets and the Treasury Solutions product groups support all lines of business. These business lines and product groups work in teams to understand and determine client needs and provide comprehensive solutions to meet those needs. New clients are acquired through a coordinated approach to the market ranging from leveraging deep industry knowledge in specialized banking groups to deploying a regional coverage approach for middle market businesses with targeted profiles that are headquartered in its branch geographic footprint.
CITIZENS FINANCIAL GROUP, INC.
Commercial Banking accounted for $39.9 billion, or approximately 44%, of total loans outstanding in our operating segments as of December 31, 2014, and is organized as follows:
Corporate Banking: Targets domestic commercial and industrial clients, serving middle-market companies with annual gross revenues of $25 million to $500 million and mid-corporate companies with annual revenues of $500 million to $2.5 billion. The business offers a broad range of products, including lines of credit, term loans, commercial mortgages, domestic and global treasury management solutions, trade services, interest rate products and foreign exchange. The average revenue mix is approximately 70% interest income and 30% fee income. Loans are extended on both a secured and unsecured basis, and are substantially all at floating rates of interest. Corporate Banking is a general lending practice, however there are specialty industry verticals addressing U.S. subsidiaries of foreign corporations, technology, government entities, healthcare, not-for-profit and educational institutions, security alarm services, professional firms, franchise finance and business capital (asset-based lending). Additionally, we recently created an energy vertical and in the fourth quarter of 2014 acquired from RBS Group an experienced team of lending professionals and a portfolio of reserve-based lending commercial loans with an outstanding principal balance of $417 million.
Asset Finance: Offers loan and tax- and non-tax-oriented leases for long-lived assets such as rail cars. The team also offers equipment financing term loans for middle-market and mid-corporate companies located in its branch footprint, as well as Fortune 500 companies throughout the United States. All transactions are secured by the assets financed and commitments tend to be fully drawn and most leases and loans are fixed rate. Areas of industry specialization include energy, utilities, and chemicals. The business also deploys dedicated teams to financing corporate aircraft.
Commercial Real Estate (“CRE”): Provides customized debt capital solutions for middle market and institutional developers and investors as well as real estate investment trusts (“REITs”). CRE provides financing for projects in the office, multi-family, industrial, core retail, healthcare and hospitality sectors. Loan types include construction financing, term debt and lines of credit. Most loans are secured by commercial real estate properties and all are non-owner occupied. Any owner-occupied commercial real estate would be originated through our Corporate Banking business.
Corporate Finance & Capital Markets: Delivers to customers through four key product groups including debt capital markets, corporate finance, global markets and strategic client acquisitions.
Capital Markets originates structures and underwrites multibank credit facilities and targets middle market, mid-corporate and private equity sponsors with a focus on offering value-added ideas to optimize their capital structure. From 2010 through 2014, Capital Markets was involved in closing 485 transactions and served in the lead-left role on 226 transactions and as joint-lead arranger on 259 transactions.
CITIZENS FINANCIAL GROUP, INC.
Corporate Finance provides advisory services to middle-market and mid-corporate companies, including mergers and acquisitions, equity private placements and capital structure advisory. The team works closely with industry sector specialists within debt capital markets on proprietary transaction development which serves to originate deal flow in multiple bank products.
Global Markets is a customer-facing business providing foreign exchange and interest rate risk management services. The lines of business include the centralized leveraged finance team, which provides underwriting and portfolio management expertise for all leveraged transactions and relationships; the private equity team, which serves the unique and time-sensitive needs of private equity firms, management companies and funds; and the sponsor finance team, which provides acquisition and follow-on financing for new and recapitalized portfolio companies of key sponsors.
Strategic Client Acquisition (“SCA”) was created to accelerate new client relationships through active participation in primary and secondary loan markets. The team efficiently sources transactions through long-established relationships in traditional pro rata markets as well as institutional, or term loan B, markets across all sectors. The combination of pro rata and term loan B tranches allows SCA’s traditional banking team to forge new relationships and accelerate existing relationship development while generating accretive returns.
Treasury Solutions: Supports all lines of business in Commercial Banking and Business Banking with treasury management solutions, including domestic and international cash management, commercial cards and trade finance. Treasury Solutions provides products to solve client needs related to receivables, payables, information reporting and liquidity management. Treasury Solutions serves small business banking clients (up to $500,000 annual revenue) up to large mid-corporate clients (over $2.5 billion annual revenue).
Our History
In September 2014, Citizens Financial Group (CFG: NYSE) became a publicly-traded company in the largest traditional bank initial public offering (“IPO”)IPO in U.S. history. The IPO represented an important stepFollowing three subsequent follow on equity offerings in our planned separationMarch, July, and November of 2015, Citizens is now fully separated from RBS Group, which has announced its plans to monetize its remaining ownership stake by the end of 2016.RBS.
Our history dates back to High Street Bank, founded in 1828, which established Citizens Savings Bank in 1871. Citizens Savings Bank acquired a controlling interest in its founder by the 1940s, renaming the entity Citizens Trust Company. By 1981, we had grown to 29 branches in Rhode Island with approximately $1.0 billion of assets, and in 1988 we became a wholly-owned subsidiary of RBS Group.RBS. Over the following two decades, we grew substantially through a series of over 25 strategic bank acquisitions, including:
In 1988, we acquired Fairhaven Savings Bank in Massachusetts, our first retail banking expansion beyond Rhode Island;
In 1996, we moved beyond southern New England when RBS and Bank of Ireland combined their New England banking operations through the merger of Citizens and First NH Bank in New Hampshire;
In 1999 and 2000, we acquired the commercial banking group of State Street Corporation and Boston-based UST Corporation, including its U.S. Trust branches in the Boston area; these acquisitions doubled the size of our Massachusetts operations and made us New England’s second-largest bank, with more than $30.0 billion in assets;
In 2001, we acquired the regional banking business of Mellon Financial Corporation, which included $14.4 billion in deposits, expanding our retail network outside of New England to Pennsylvania, Delaware and New Jersey; and
In 2004, we completed the largest transaction in our history by acquiring Charter One, which operated approximately 680 branches in nine states, and had $41.3 billion in assets, and expanded our branch footprint into New York, Vermont, Michigan, Ohio, Illinois and Indiana.
These acquisitions greatly expanded our footprint throughout New England and into the Mid-Atlantic and the Midwest, transforming us from a local retail bank into one of the largest retail U.S. bank holding companies.
Business Segments
We offer a broad set of banking products and services through our two operating segments — Consumer Banking and Commercial Banking — with a focus on providing local delivery and a differentiated customer experience. We seek to ensure that customers select us as their primary banking partner by taking the time to understand their banking needs and we tailor our full range of products and services accordingly.
The following table presents certain financial information for our segments:
|
| | | | | | | | | | | | | | | | | | | | | | | | | | | | | | | |
| | For the Year Ended December 31, |
| 2015 | | 2014 |
| (in millions) | Consumer Banking | | Commercial Banking | | Other (2) |
| | Consolidated | | Consumer Banking | | Commercial Banking | | Other (2) |
| | Consolidated |
| Total average loans and leases and loans held for sale |
| $51,484 |
| |
| $41,593 |
| |
| $3,469 |
| |
| $96,546 |
| |
| $47,745 |
| |
| $37,683 |
| |
| $4,316 |
| |
| $89,744 |
|
| Total average deposits and deposits held for sale | 69,748 |
| | 23,473 |
| | 5,933 |
| | 99,154 |
| | 68,214 |
| | 19,838 |
| | 4,512 |
| | 92,564 |
|
| Net interest income | 2,198 |
| | 1,162 |
| | 42 |
| | 3,402 |
| | 2,151 |
| | 1,073 |
| | 77 |
| | 3,301 |
|
| Noninterest income | 910 |
| | 415 |
| | 97 |
| | 1,422 |
| | 899 |
| | 429 |
| | 350 |
| | 1,678 |
|
| Total revenue | 3,108 |
| | 1,577 |
| | 139 |
| | 4,824 |
| | 3,050 |
| | 1,502 |
| | 427 |
| | 4,979 |
|
| Noninterest expense | 2,456 |
| | 709 |
| | 94 |
| | 3,259 |
| | 2,513 |
| | 652 |
| | 227 |
| | 3,392 |
|
| Net income (loss) |
| $262 |
| |
| $579 |
| |
| ($1 | ) | |
| $840 |
| |
| $182 |
| |
| $561 |
| |
| $122 |
| |
| $865 |
|
(1) According to SNL Financial.
(2) Includes the financial impact of non-core, liquidating loan portfolios and other non-core assets and liabilities, our treasury activities, wholesale funding activities, securities portfolio, community development assets and other unallocated assets, liabilities, revenues, provision for credit losses and expenses not attributed to the Consumer Banking or Commercial Banking segments. For a description of non-core assets, see “Management’s Discussion and Analysis of Financial Condition and Results of Operations — Analysis of Financial Condition — December 31, 2015 Compared with December 31, 2014 — Loans and Leases — Non-Core Assets” in Part II, Item 7, included elsewhere in this report.
CITIZENS FINANCIAL GROUP, INC.
BUSINESS
Consumer Banking Segment
Consumer Banking serves retail customers and small businesses with annual revenues of up to $25 million through a network that as of December 31, 2015 included approximately 1,200 branches operating in an 11-state footprint across the New England, Mid-Atlantic and Midwest regions, as well as through online, telephone and mobile banking platforms. Consumer Banking products and services include deposit products, mortgage and home equity lending, student loans, auto financing, credit cards, business loans, wealth management and investment services.
Consumer Banking is focused on winning, expanding and retaining customers through its value proposition: “Simple. Clear. Personal.” and is committed to delivering a differentiated experience through convenience and service. We were named one of the “Most Reputable Banks” in the country, according to the American Banker/Reputation Institute Survey of Bank Reputations released in 2015, which focused on factors including products, corporate citizenship, financial performance and company leadership.
Consumer Banking accounted for $51.5 billion, or 55%, of average loans and leases (including loans held for sale) in our operating segments as of December 31, 2015 and is organized around the customer products and services as follows:
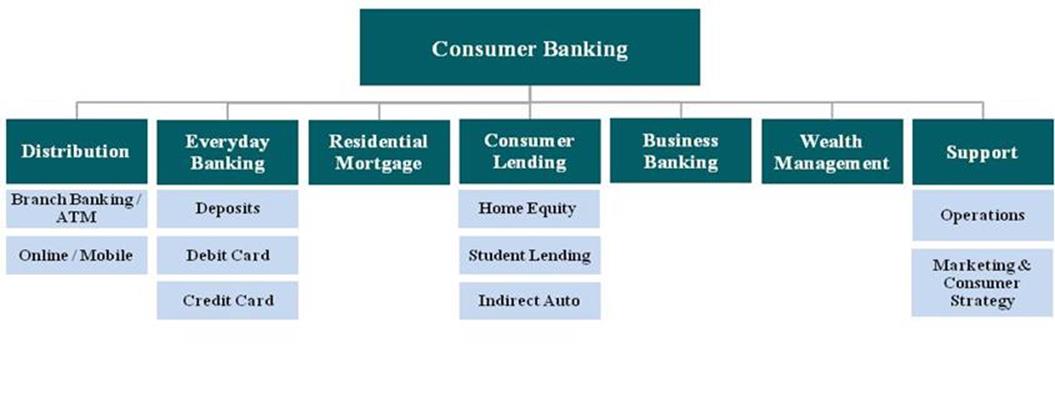 Distribution: Provides a multi-channel distribution system a workforce of approximately 7,000 branch colleagues with a network of approximately 1,200 branches, including over 340 in-store locations, as well as approximately 3,200 ATMs. Our network includes approximately 1,300 specialists covering savings and investments, lending needs and business banking. Our online and mobile capabilities offer customers the convenience of paying bills, transferring money between accounts and from person to person, in addition to a host of other everyday transactions through a robust digital platform.
Everyday Banking: Provides customers with deposit and payment products and services, including checking, savings, money market, certificates of deposit, debit cards, credit cards and overdraft protection. The business included approximately 2.2 million checking households and $53.8 billion in average deposits as of December 31, 2015.
Residential Mortgage: Our mortgage business is primarily in footprint and in select out-of-footprint states through a direct-to-consumer call center and a mortgage loan officer base of over 440 as of December 31, 2015. In October of 2015, we brought together the end-to-end mortgage business to maximize talent, strengthen our service quality front-to-back, and simplify how the business operates. Full year 2015 mortgage originations totaled $5.7 billion with a weighted average FICO score of 763 and loan-to-value of 73%.
Consumer Lending: Provides home equity, personal unsecured lines and loans, student lending, and auto finance products. Aligning these lending products enabled sales and operations synergies, sharing of best practices, and better prioritization of resources to maximize growth opportunities.
Home Equity: Offers home equity loans and home equity lines of credit. We originated $4.0 billion of HELOCs in 2015 and were ranked sixth nationally by outstanding balances as of September 30, 2015(1) and ranked in the top 5 in 8 of our top 9 markets for HELOC originations.(2)
(1) According to SNL Financial.
(2) According to Equifax as of September 30, 2015.
CITIZENS FINANCIAL GROUP, INC.
BUSINESS
Student Lending: We launched the Student Lending business in 2009 and have expanded to partner with nearly 2,400 high-quality not-for-profit higher education schools in all 50 states. InSchool loan origination volume has increased from $112 million in 2010 to $387 million in 2015 with a weighted-average FICO score of 771. We launched the Education Refinance Loan (“ERL”) product in January 2014, which provides those who have entered the workforce a way to refinance or consolidate multiple existing private and federal student loans. We originated approximately $230 million ERL loans in 2014 and approximately $1.1 billion in 2015 with a weighted average FICO score of 781.
Indirect Auto Finance: Provides new and used vehicle financing to prime borrowers through a network of over 6,800 automotive dealerships in 43 states as of December 31, 2015. We implemented a new origination platform in October 2013 that has facilitated more granular credit and pricing strategies which will enable us to optimize risk-adjusted returns. The business ranked seventh nationally among regulated depository institutions by outstanding balances as of September 30, 2015(1) with 2015 origination volume of $7.0 billion with a weighted average FICO score of approximately 744.
Business Banking: Serves businesses with annual revenues of up to $25 million through a combination of branch-based employees, business banking officers and relationship managers. As of December 31, 2015, we employed a team of over 360 bankers with loans outstanding of $3.0 billion and average deposit balances of $13.3 billion.
Wealth Management: Provides a full range of advisory services to clients with an array of banking, investment and insurance products and services through a sales force which includes more than 315 financial consultants, over 160 premier bankers and 13 private banker teams. As of December 31, 2015, wealth management had approximately $6.5 billion in assets under management (including $2.4 billion of separately managed accounts) and $12.9 billion in investment brokerage assets.
Commercial Banking Segment
Commercial Banking primarily targets companies and institutions with annual revenues of $25 million to $2.5 billion and strives to be the lead bank for its clients. Commercial Banking offers a broad complement of financial products and solutions, including lending and leasing, deposit and treasury management, foreign exchange and interest rate risk management, corporate finance and debt and equity capital markets capabilities. Commercial Banking provides “Thought Leadership” by leveraging an in-depth understanding of our clients’ and prospects’ businesses to proactively deliver compelling financial solutions with quality execution. Commercial Banking focuses each business unit in sectors that maximize its ability to be relevant and deliver value added solutions to our clients. In middle-market, this involves a business unit highly focused on our 11-state footprint. In vertical market-oriented businesses, our focus is national within our areas of expertise.
We believe our Commercial Banking segment provides a compelling value proposition based on “Thought Leadership” for clients. Results are evidenced by a fifth place ranking for client penetration and a fourth place ranking for number of lead relationships in middle-market banking within the footprint.(2)
Commercial Banking is structured along lines of business, as well as product groups. Both the Capital & Global Markets and the Treasury Solutions product groups support all lines of business. These business lines and product groups work in teams to understand and determine client needs and provide comprehensive solutions to meet those needs. New clients are acquired through a coordinated approach to the market ranging from leveraging deep industry knowledge in specialized banking groups to a geographic coverage model targeting organizations headquartered in the branch geographic footprint.
(1) According to SNL Financial.
(2) According to Greenwich Associates syndicated market research.
CITIZENS FINANCIAL GROUP, INC.
BUSINESS
Commercial Banking accounted for $41.6 billion, or approximately 45%, of average loans and leases (including loans held for sale) in our operating segments as of December 31, 2015, and is organized as follows:
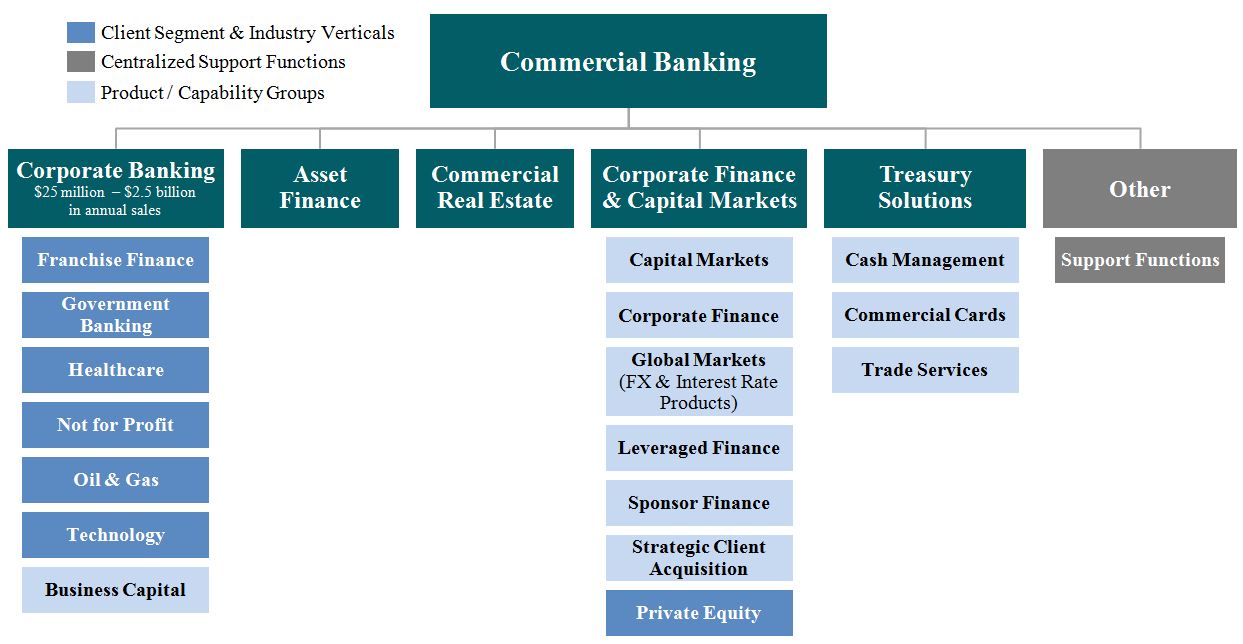
Corporate Banking: Targets domestic commercial and industrial clients, serving middle-market companies with annual gross revenues of $25 million to $500 million and mid-corporate companies with annual revenues of $500 million to $2.5 billion. The business offers a broad range of products, including lines of credit, term loans, commercial mortgages, domestic and global treasury management solutions, trade services, interest rate products and foreign exchange. Loans are extended on both a secured and unsecured basis, and are substantially all at floating rates of interest. Corporate Banking is a general lending practice, however there are specialty industry verticals addressing U.S. subsidiaries of foreign corporations, technology, government entities, healthcare, oil and gas, not-for-profit and educational institutions, professional firms, franchise finance, and business capital (asset-based lending).
Asset Finance: Offers equipment financing term loans and leases for middle-market and mid-corporate companies, as well as Fortune 500 companies. All transactions are secured by the assets financed and commitments tend to be fully drawn and most leases and loans are fixed rate. Areas of industry specialization include energy, utilities, and chemicals. The business also has expertise in financing corporate aircraft and tax- and non-tax-oriented leases for other long-lived assets such as rail cars.
Commercial Real Estate: Provides customized debt capital solutions for middle-market operators, institutional developers and investors as well as REITs. CRE provides financing for projects in the office, multi-family, industrial, retail, healthcare and hospitality sectors. Loan types include term debt, lines of credit, as well as construction financing. Most loans are secured by commercial real estate properties and are typically non-owner occupied. Owner-occupied commercial real estate is typically originated through our Corporate Banking business.
Capital & Global Markets: Delivers to clients through key product groups including Capital Markets, Corporate Finance, and Global Markets
Capital Markets originates, structures and underwrites multi-bank credit facilities targeting middle-market, mid-corporate and private equity sponsors with a focus on offering value-added ideas to optimize their capital structure. From 2010 through 2015, Capital Markets was involved in closing 607 lead or co-lead transactions.
Corporate Finance provides advisory services to middle-market and mid-corporate companies, including mergers and acquisitions, equity private placements and capital structure advisory. The team works closely with industry sector specialists within debt capital markets on proprietary transaction development which serves to originate deal flow in multiple bank products.
Global Markets is a customer-facing business providing foreign exchange and interest rate risk management services. The lines of business include the centralized leveraged finance team, which provides underwriting and portfolio management expertise for all leveraged transactions and relationships; the private equity team, which serves the unique and time-sensitive needs of private equity firms, management companies and funds; and the sponsor finance team, which provides acquisition and follow-on financing for new and recapitalized portfolio companies of key sponsors.
CITIZENS FINANCIAL GROUP, INC.
BUSINESS
Treasury Solutions: Supports all lines of business in Commercial Banking and Business Banking with treasury management solutions, including domestic and international cash management, commercial credit cards and trade finance. Treasury Solutions provides products to solve client needs related to receivables, payables, information reporting and liquidity management. Treasury Solutions serves small business banking clients (up to $500,000 annual revenue) up to large mid-corporate clients (over $2.5 billion annual revenue).
Our Competitive Strengths
Our long operating history, through a range of challenging economic cycles, forms the basis forof our competitive strengths. From our community bank roots, we bring a commitment to strong customer relationships, local service and an active involvement in the communities we serve. Our acquisitions enabled us to develop significant scale in highly desirable markets and broad product capabilities. The actions taken since the global financial crisis have resulted in a business model with solid asset quality, a stable core deposit mix and a superior capital position. In particular, we believe that the following strengths differentiate us from our competitors and provide a strong foundation from which to execute our strategy to deliver enhanced growth, profitability and returns.
| |
| • | Significant Scale with Strong Market Penetration in Attractive Geographic Markets: We believe our market share and scale in our footprint is central to our success and growth. With approximately 1,200 branches, approximately 3,200 ATMs, approximately 17,700 employees,colleagues, and over 100 non-branch offices as well as our online, telephone and mobile banking platforms, we serve more than five million individuals, institutions and companies. As of June 30, 2014,2015, we ranked second by deposit market share in the New England region (Maine, New Hampshire, Vermont, Massachusetts, Rhode Island and Connecticut), and we ranked in the top five in nine of our key metropolitan statistical areas (“MSAs”),MSAs, including Boston, Providence, Philadelphia, Pittsburgh and Cleveland according to SNL Financial.Cleveland.(1) We believe this strong market share in our core regions, which have relatively diverse economies and affluent demographics, will help us achieve our long-term growth objectives. The following table sets forth information regarding our competitive position in our principal MSAs. |
The following table sets forth information regarding our competitive position in our principal MSAs:
| | | (dollars in millions) | | |
MSA | Total Branches | Deposits | Market Rank (1) | Market Share (1) | Total Branches | Deposits | Market Rank | Market Share |
| Boston, MA | 206 | $26,937 | 2 | 14.9% | 204 | $29,167 | 2 | 15.5% |
| Philadelphia, PA | 181 | 14,307 | 5 | 4.4 | 186 | 16,642 | 5 | 5.2 |
| Providence, RI | 100 | 10,544 | 1 | 29.5 | 100 | 11,065 | 1 | 29.8 |
| Pittsburgh, PA | 128 | 7,505 | 2 | 8.6 | 127 | 9,375 | 2 | 9.6 |
| Cleveland, OH | 58 | 5,207 | 4 | 9.2 | 57 | 5,698 | 3 | 8.9 |
| Detroit, MI | 90 | 4,374 | 8 | 4.2 | 90 | 4,768 | 8 | 4.1 |
| Manchester, NH | 22 | 4,250 | 1 | 39.9 | 21 | 4,639 | 1 | 38.3 |
| Albany, NY | 25 | 3,139 | 2 | 13.1 | 25 | 2,660 | 2 | 12.7 |
| Buffalo, NY | 41 | 1,582 | 4 | 4.4 | 41 | 1,706 | 4 | 4.3 |
| Rochester, NY | 34 | 1,520 | 4 | 9.6 | 34 | 1,578 | 5 | 9.5 |
Source: FDIC, June 2014.2015. Excludes “non-retail banks” as defined by SNL Financial. The scope of “non-retail banks” is subject to the discretion of SNL Financial, but typically includes: industrial bank and non-depository trust charters, institutions with over 20% brokered deposits (of total deposits), institutions with over 20% credit card loans (of total loans), institutions deemed not to broadly participate in the banking services market, and other nonretail competitor banks.
| |
| • | Strong Customer Relationships: We focus on building strong customer relationships by delivering a consistent, high-quality level of service supported by a wide range of products and services. We believe that we provide a distinctive customer experience characterized by offering the personal touch of a local bank with the product selection of a larger financial institution. Our Consumer Banking cross-sell efforts have improved to 5.1 products and services per retail household as of December 31, 2015 compared to 4.4 products and services as of December 31, 2010. Additionally, the overall customer satisfaction index continued to improve in the New England region (up 1% from 2014 to 2015).(1)(2) | Excludes “non-retail banks” as defined by SNL Financial. The scope In addition, we maintained our top 10 ranking in the overall national middle market bookrunner league table (by number of “non-retail banks” is subjectsyndicated loans) for the full year 2015(3) and received a number 1 rank in our Net Promoter Score compared to the discretiontop four competitors in our footprint based on rolling four-quarter data through September 30, 2015.(1) Net Promoter Score is a customer loyalty metric, which is calculated by subtracting the percentage of SNL Financial, but typically includes: industrial bank and non-depository trust charters, institutions with over 20% brokered deposits (of total deposits), institutions with over 20% credit card loans (of total loans), institutions deemed not to broadly participate incustomers who on a scale of 1-10 are detractors (rating 0-6) from the banking services market, and other nonretail competitor banks.percentage of customers who are promoters (rating 9-10). |
Strong Customer Relationships:(1) We focus on building strong customer relationships by delivering a consistent, high-quality level of service supported by a wide range of products and services. We believe that we provide a distinctive customer experience characterized by offering the personal touch of a local bank with the product selection of a larger financial institution. Our Consumer Banking cross-sell efforts have improvedAccording to 5.0 products and services per retail household as of December 31, 2014 compared to 4.4 products and services as of December 31, 2010. Additionally, the overall customer satisfaction index asGreenwich Associates syndicated market research.
(2) As measured by J.D. Power and Associates improved 6.5% in the New England region from 2013Associates.
(3) According to 2014. Our ability to provide a unique customer experience is also evidenced by our Commercial Banking middle market team ranking among the top five in customer and lead bank penetration, with a 10% market penetration in our footprint based on Greenwich Associates’ rolling four-quarter data as of December 31, 2014.Thomson Reuters.
Stable, Low-Cost Core Deposit Base: We have a strong funding profile, with $95.7 billion of total deposits as of December 31, 2014, consisting of 27% in noninterest-bearing deposits and 73% in interest-bearing deposits. Noninterest-bearing deposits provide a lower-cost funding base, and we grew this base to $26.1 billion at December 31, 2014, up 32% from $19.7 billion at December 31, 2010. For the year ended December 31, 2014, our total average cost of deposits was 0.17%, down from 0.23% for the year ended December 31, 2013, 0.40% for the year ended December 31, 2012, 0.54% for the year ended December 31, 2011 and 0.77% for the year ended December 31, 2010.
CITIZENS FINANCIAL GROUP, INC.
BUSINESS
Superior Capital Position: We are among the most well capitalized large regional banks in the United States, with a Tier 1 common equity ratio of 12.4% compared to a peer average of 10.4% as of December 31, 2014 according to SNL Financial. Our peer regional banks consist of BB&T, Comerica, Fifth Third, KeyCorp, M&T, PNC, Regions, SunTrust and U.S. Bancorp. Our fully phased-in pro forma Basel III Common Equity Tier 1 (“CET1”) ratio at December 31, 2014 was 12.1%. Our strong capital position provides us the financial flexibility to continue to invest in our businesses and execute our strategic growth initiatives. Through recent capital optimization efforts, we have sought to better align our capital base with that of our bank peers by reducing our Tier 1 common equity capital and increasing other Tier 1 and Tier 2 capital levels. Most recently, we executed a capital exchange transaction with RBS Group on October 8, 2014 which involved the issuance of $334 million of Tier 2 subordinated debt and the simultaneous repurchase of 14.3 million shares of common stock owned by RBS Group. In addition, we plan to continue our strategy of capital optimization by exchanging an additional $500 million to $750 million of common equity with the issuance of preferred stock, subordinated debt, or senior debt in 2015 and 2016, subject to regulatory approval and market conditions.
Solid Asset Quality Throughout a Range of Credit Cycles: Our experienced credit risk professionals and conservative credit culture, combined with centralized processes and consistent underwriting standards across all business lines, have allowed us to maintain strong asset quality through a variety of business cycles. As a result, we weathered the global financial crisis better than our peers: for the two-year period ending December 31, 2009, net charge-offs averaged 1.63% of average loans compared to a peer average of 1.76% according to SNL Financial. More recently, the credit quality of our loan portfolio has continued to improve with nonperforming assets as a percentage of total assets of 0.86% at December 31, 2014 compared to 1.20% and 1.55% as of December 31, 2013 and 2012, respectively. Net charge-offs declined substantially to 0.36% of average loans in 2014 versus 0.59% in 2013. Our allowance for loan and lease losses was 1.28% of total loans at December 31, 2014 compared with 1.42% as of December 31, 2013. We believe the high quality of our loan portfolio provides us with significant capacity to prudently seek to add more attractive, higher yielding risk-adjusted returns while still maintaining appropriate risk discipline and solid asset quality.
Experienced Management Team Supported by a High-Performing and Talented Workforce: Our leadership team of seasoned industry professionals is supported by a highly motivated, diverse set of managers and employees committed to delivering a strong customer value proposition. Our highly experienced and talented executive management team, whose members have more than 20 years of banking experience on average, provideprovides strong leadership to deliver on our overall business objectives. We have recently made selective additions to our management team and added key business line leaders. Bruce Van Saun, our Chairman and CEO, has more than 30 years of financial services experience including four years as RBS Group Finance Director. Earlier in his career, Mr. Van Saun held a number of senior positions at The Bank of New York Mellon, Deutsche Bank, Wasserstein Perella Group and Kidder Peabody & Co. We continued to attract top talent throughout 2015. Don McCree recently joined the bank as our Vice Chairman and Head of Commercial Banking, and Eric Aboaf became our Chief Financial Officer. Mr. McCree previously served in a number of senior leadership positions over the course of 31 years at JPMorgan Chase & Co., and Mr. Aboaf most recently held the role of global Treasurer at Citigroup Inc. In addition, we have also hired new leadership in our mortgage and wealth businesses to drive growth in those key areas.
Stable, Low-Cost Core Deposit Base: We have a strong funding profile, with $102.5 billion of total deposits as of December 31, 2015, consisting of 27% in noninterest-bearing deposits and 73% in interest-bearing deposits. Noninterest-bearing deposits provide a lower-cost funding base, and we grew this base to $27.6 billion at December 31, 2015, up 40% from $19.7 billion at December 31, 2010. For the year ended December 31, 2015, our total average cost of deposits was 0.24%, up from 0.17% for the year ended December 31, 2014, 0.23% for the year ended December 31, 2013, 0.40% for the year ended December 31, 2012 and 0.54% for the year ended December 31, 2011.
| |
| • | Superior Capital Position: We are among the most well capitalized large regional banks in the United States, with a CET1 ratio of 11.7% as of December 31, 2015 compared to a peer average of 10.4%(1) as of December 31, 2015. Our strong capital position provides us the financial flexibility to continue to invest in our businesses and execute our strategic growth initiatives. Through recent capital optimization efforts, we have sought to better align our capital base with that of our peers banks by reducing our common equity Tier 1 capital and increasing other Tier 1 and Tier 2 capital levels. We continued our capital optimization strategy in 2015 by repurchasing $500 million of common stock funded by the issuance of $250 million of preferred stock and $250 million of subordinated debt. |
| |
| • | Solid Asset Quality Throughout a Range of Credit Cycles: Our experienced credit risk professionals and prudent credit culture, combined with centralized processes and consistent underwriting standards across all business lines, have allowed us to maintain strong asset quality through a variety of business cycles. As a result, we weathered the global financial crisis better than our peers: for the two-year period ending December 31, 2009, net charge-offs averaged 1.63% of average loans compared to a peer average of 1.76%.(1) More recently, the credit quality of our loan portfolio has continued to improve with nonperforming assets as a percentage of total assets of 0.80% at December 31, 2015 compared to 0.86% and 1.20% as of December 31, 2014 and 2013, respectively. Net charge-offs declined substantially to 0.30% of average loans in 2015 versus 0.36% in 2014. Our ALLL was 1.23% of total loans at December 31, 2015 compared with 1.28% as of December 31, 2014. We believe the high quality of our loan portfolio provides us with capacity to prudently seek to add more attractive, higher yielding risk-adjusted returns while still maintaining appropriate risk discipline and solid asset quality. |
Commitment to Communities: Community involvement is one of our principal values and we strive to contribute to a better quality of life by serving the communities across our footprint through employee volunteer efforts, a foundation that funds a range of non-profit organizations and executives that provide board leadership to community organizations. These efforts contribute to a culture that seeks to promote positive employee morale and provide differentiated brand awareness in the community relative to peer banks, while also making a positive difference within the communities we serve. Employees gave more than 59,00070,000 volunteer hours companywide in 20142015 and also served on approximately 480over 550 community boards across our footprint. We believe our strong commitment to our communities provides a competitive advantage by strengthening customer relationships and increasing loyalty.
Business Strategy
Building on our core strengths, our objective is to be a top-performing bank that delivers well for each of our stakeholders by offering the best possible banking experience for customers. We plan to achieve this by leveraging our strong customer relationships, leading market share rankings in attractive markets, customer-centric colleagues, and our high quality balance sheet.
Our strategy is designed to maximize the full potential of our business and drive sustainable growth and enhanced profitability. As a core measure of success, our two- to three-yearmedium-term financial targets include a Return on Tangible Common Equity ("ROTCE")ROTCE ratio of greater than 10% and an efficiency ratio in the 60% range. Our financial targets are based on numerous assumptions including the yield curve evolving consistent with market implied forward rates as of February 28, 2014, and that macroeconomic and competitive conditions are consistent with those used in our planning assumptions.
(1) According to SNL Financial.
CITIZENS FINANCIAL GROUP, INC.
BUSINESS
While our strategic plan and our ROTCE target and its components are presented with numerical specificity and we believe such targets to be reasonable given the uncertainties surrounding our assumptions, including possible regulatory restrictions on activities we intend to pursue, there are significant risks that these assumptions may not be realized and thus our goals may not be achieved. Accordingly, our actual results may differ from these targets and the differences may be material and adverse, particularly if actual events adversely differ from one or more of our key assumptions. We caution investors not to place undue reliance on any of these assumptions or targets.
We intend to deliver on this by adhering to the following strategic principles:
Offer customers a differentiated experience through the quality of our colleagues, products and services, and foster a culture around customer-centricity, commitment to excellence, leadership, teamwork and integrity.
Build a great brand that invokes trust from customers and reinforces our value proposition of being “Simple. Clear. Personal.” for Consumer customers and providing solutions-oriented “Thought Leadership” to Commercial clients.
Deliver attractive risk-adjusted returns by making good capital and resource allocation decisions, being good stewards of our resources, and rigorously evaluating our execution.
Operate with a strong balance sheet with regards to capital, liquidity and funding, coupled with a well-defined and prudent risk appetite.
Maintain a balanced business mix between Commercial Banking and Consumer Banking.
Position the bank as a ‘community leader’ that makes a positive impact on the communities and local economies we serve.
In order to successfully execute on these principles, we have developed the following strategic priorities, each of which are underpinned by a series of initiatives as summarized below. We have made solid progress on our strategic priorities and the underlying initiatives over the past year, due primarily to the strength of our business model, management team, culture of accountability and risk management framework.
management.
Position Consumer Banking to deliver improved capabilities and profitability: Consumer Banking offers a “Simple. Clear. Personal.” value proposition to our customers. The focus is on building strong customer relationships along with a robust product portfolio that is designed to be simple and easy to understand while creating a fair value exchange for our customers. The following initiatives are being implemented to execute against our value proposition:
ReenergizeRe-energize household growth and deepen relationships.relationships— We strive to grow and deepen existing customer relationships by delivering a differentiated customer experience. We believe this approach will enable us to win, retain and expand customer relationships, as well as increase cross-sell and share of wallet penetration. We will also continue to invest in our online and mobile channels and optimize our distribution network. We recently launched an effort to improve multi-channel sales effectiveness, with the goal of deepening customer relationships using a needs based approach (“Citizens Checkup”).
Expand and enhance Wealth Management— We view our wealth management business as an opportunity for continued growth and as vital to deepening the customer relationship and improving fee income generation.
Build a strong residential mortgageResidential Mortgage business.— Recognizing the critical importance of the mortgage product to the customer experience and relationship, we are building out our mortgage team and platform to achieve a solid market share position and generate consistent origination volumes. We are focused on improving penetration with our existing customer base and increasing our origination mix of conforming loans.
Invest in and grow Business Banking. We have recognized that strengthening efforts in the business banking market is critical to grow profitable relationships and drive scalable growth of the franchise.
Expand and enhance Wealth Management. We view our wealth management business as an opportunity for continued growth and as vital to deepening the customer relationship and improving fee income generation.
Grow our Auto business. Our auto initiative supports diversification of revenue generation outside of our traditional retail distribution channels.
Drive growth in Education FinanceStudent Lending and installment loans.— We have identified the underserved private student lending market as an attractive source of risk-adjusted revenue growth. We are well-positioned for growth in student lending with a unique education refinance product that serves a critical borrower need. We also have strong expertise in unsecured based lending based on a partnership with Apple.
11Invest in and grow Business Banking— We have recognized that strengthening efforts in the business banking market is critical to grow profitable relationships and drive scalable growth of the franchise. We view this as an important source for loans, deposits, and cash management revenue.
CITIZENS FINANCIAL GROUP, INC.Optimize indirect Auto business— Our auto initiative supports diversification of revenue generation outside of our traditional retail distribution channels. We continue to optimize this business through prudent expansion of originations across a broader credit spectrum to include predominantly prime borrowers and enhancing our pricing strategy to price loans in more granular ways (e.g., vehicle type, geography).
These initiatives have already resulted in a stronger Consumer franchise in 2015, highlighted by 2014 net checking account growth of over 78,000approximately 28,000 and nearly 2.2 million checking households. The percent of new-to-bank customers with over two products within 30 days of account opening increased by 7.8 percentage points from 2013 to 30.4% in 2014. Additionally, Consumer Banking average loans and leases of $49.9$51.5 billion atfor the year ended December 31, 20142015 grew $4.9$3.7 billion, or 11%8%, from the year ended December 31, 2013. Finally, the overall customer satisfaction index for Consumer Banking as measured by J.D. Power and Associates improved 6.5% in the New England region from 2013 to 2014.
CITIZENS FINANCIAL GROUP, INC.
BUSINESS
Continue the momentum in Commercial Banking: We continue to see further build-out of the Commercial Banking business as critical to achieving a balanced business mix, and consequently have grown the contribution of Commercial loans to be 44%45% of operating segment loans (compared to 38% at year end 2010).loans. The initiatives below have enabled the Commercial Banking business to continue its positive momentum while building upon existing strengths to further develop the “Thought Leadership” value proposition.
Strengthen Middle Market— We are continuing to build on our strong core relationships and capabilities in the middle market, which will drive client growth and better share of wallet penetration. In 2015, we improved customer pricing and cross-sell efforts through enhanced pricing calculators and customer analytics.
Build out mid-corporateMid-Corporate and verticalsIndustry Verticals.— Since the third quarter of 2013, we have been building capabilities nationally in the mid-corporate space, which is focused on serving larger, mostly public clients with annual revenue of more than $500 million. The geographic expansion has been selective and in markets where our established expertise and product capabilities can be relevant. We have focused our growth on specialty verticals where we can leverage industry expertise (e.g., Healthcare, Technology, Oil and Gas).
Development of Capital & Global Markets.— We are strengthening capabilities in Capital Markets to provide comprehensive solutions to meet client needs, including the recent addition ofbuilding an institutional sales capability, and loan trading desk.desk, broker-dealer, and fixed income capabilities.
Build out Treasury Solutions.— We have made investments to upgrade our Treasury Solutions systems and products while also strengthening the leadership team to better meet client needs and diversifydiversifying the revenue base into other noninterest income areas. In 2015, we better aligned our Treasury Services pricing to the market, allowing us to continue to invest in our products and capabilities.
LeveragingLeverage Franchise Finance capabilities with credibility.— We are a top provider of capital to leading franchisesfranchisees from concepts including McDonald’s, Taco Bell, Dunkin’ Donuts, Buffalo Wild Wings, Wendy’s and Applebee’s. We are also broadening our target market to focus on regional restaurant operating companies and expanding penetration of gas station and convenience dealers.
Core Commercial Banking growth. We continue to build on our strong core lending capabilities in Middle Market,Optimize Commercial Real Estate— New product and Asset Finance which has resultedmarket investments we’ve made in solid origination volumes.CRE have improved asset and return growth in recent years. We will continue to grow our CRE business, while prudently balancing market and product risk with portfolio growth.
Reposition Asset Finance— We are repositioning our asset finance business to focus on cross-sell referrals from our Middle Market and Mid-Corporate businesses (while in the past we leveraged referrals from RBS). In addition, we are focusing on industries and collaterals where we have expertise including trucking, rail, construction, and renewable energy. These moves are designed to improve returns, while focusing on areas where we have demonstrated a strong balance of risk and returns.
The Commercial Banking business has continued to display solid financial results and executed well on these initiatives with loan portfolio growth of $3.7$3.9 billion, or 10%, year-over-year along with strong deposit growth as average deposits increased $2.3$3.6 billion in 2014,2015, or 13%18%, compared to the average level of deposits for 2013. In addition, we improved our league table standings in the overall national middle market bookrunner league table to 8th by number of syndicated loans for the full year 2014 according to Thomson Reuters and received a number one rank by Greenwich Associates in our Net Promoter Score compared to the top four competitors in our footprint based on rolling four-quarter data through December 31, 2014. Net Promoter Score is a customer loyalty metric, which is calculated by subtracting the percentage of customers who on a scale of 1-10 are detractors (rating 0-6) from the percentage of customers who are promoters (rating 9-10).
Grow the balance sheet to build scale and better leverage our cost base and infrastructure: We have a scalable operating platform that has the capacity to accommodate a significantly larger balance sheet than our current size. Prior to the global financial crisis, we had expanded to nearly $170 billion in assets which was then intentionally contracted in order to reposition the bank and strengthen our business profile through the runoffrun off of non-core assets and reduced dependency on wholesale funding.
Over the past year, we have begun to grow the consolidated balance sheet again, through organic growth and selective portfolio purchases:
Total assets increased $10.7$5.4 billion to $132.9$138.2 billion at December 31, 2014,2015, or 9%4%, compared to December 31, 2013;
2014;
Loans and leases (excluding loans and leases held for sale) increased by $7.6$5.6 billion, or 9%6%, from December 31, 2013,2014, reflecting a $3.8$3.0 billion increase in commercial and a $3.7$2.6 billion increase in retail loans; and
CITIZENS FINANCIAL GROUP, INC.
Total deposits (excluding deposits held for sale) increased $8.8$6.8 billion, or 10%7%, compared with December 31, 2013,2014, driven by growth in term deposits, checking with interest, money market, demand, and demand deposits.
regular savings.
Balance sheet expansion is critical to executing on our strategic priority of enhancing our return profile and efficiency by better leveraging our existing capital position, infrastructure and expense base.
Develop a high-performing, customer-centric organization and culture: In the midst of an evolving and challenging business environment, we are focused on delivering the best possible banking experience through our colleagues. As such, we strive to ensure that managers and colleagues are customer centric, have a commitment to excellence and live the values and credo every day. To further strengthen the organization’s health, we have embarked on initiatives focused on a variety of people issues including recruiting, talent management, succession planning, leadership development, organizational structure and incentives.
CITIZENS FINANCIAL GROUP, INC.
BUSINESS
Continue to embed risk management throughout the organization and build strong relationships with regulators: We remain committed to implementingembedding a comprehensive enterprise risk management program through enhancements across key management areas. Critical objectives of the program areWe continued to havestrengthen our capabilities by fully developed and embeddeddeveloping policies and risk appetite, frameworks and standards, clearly articulatedarticulating roles and responsibilities across all lines of defense, and enabling a culture that reinforces and rewards risk-based behaviors.
Focus on Improved Efficiency and Disciplined Expense Management: We believe that our focus on operational efficiency is critical to our profitability and ability to reinvest in the franchise. We launched an initiative in late 20132014 designed to improve the effectiveness, efficiency, and competitiveness of the franchise.franchise (“Project Top”). Reflecting our focus on cost discipline, theseability to execute, Project Top has achieved approximately $200 million of run-rate expense initiatives delivered against milestones with 28% of targeted efficiency initiatives savings in 2014 with an expectation that we will achieve $200 million by the end of 2016. Proceeds from2015. As part of our continuous improvement efforts, we began executing on the programsecond phase of efficiency improvements as part of Project Top 2. As part of Project Top 2, there are being reinvested in the franchise, including investments in technologyseveral efficiency initiatives that focus on improving our operations and inbetter discipline around our strategic initiatives designed to further improve the customer experience and position us for future growth.third party spend.
Our strategic initiatives are focused on the fundamentals of growing customers, relationships, loans, deposits, total revenue and overall profitability. While the above priorities are designed to enhance performance over the long-term, successful execution to date has resulted in improved financial performance in 2014,2015, as highlighted below:
Net income forof $871 million in 2015 (excluding after-tax restructuring charges and special items of $31 million) increased 10% compared to $790 million in 2014 of $865 million increased from a loss of $3.4 billion in 2013, which included an after-tax goodwill impairment charge of $4.1 billion. Adjusted net income (excluding a net $180 million after-tax gain related to the Chicago Divestiture and $105 million after-tax restructuring charges and special noninterest expense items) of $790 million in 2014 increased 18% compared to $671 million in 2013 (excluding the goodwill impairment charge);
Net interest margin of 2.83%2.75% in 2014 remained relatively stable,2015 was down twoeight basis points comparedfrom 2014 due to 2013 despite the continued effect of the relatively stable low interest rate environment;
Credit quality continued to improve with net charge-offs declining to 0.30% of average loans in 2015 compared to 0.36% of average loans in 2014 compared to 0.59% of average loans in 2013;2014; and
ROTCE improved to 6.71%, from (25.91%) in 2013. Adjusted ROTCE (excluding the impact of the goodwill impairment, restructuring charges and special items previously mentioned)items) of 6.13%6.69% in 2014 improved 1052015 increased 56 basis points from 5.08%6.13% in 2013.
2014.
The adjusted results above are not recognized under Accounting Principles Generally Accepted in the United States of America (“GAAP”).GAAP. For more information on the computation of these non-GAAP financial measures, see “Management’s Discussion and Analysis of Financial Condition and Results of Operations — Principal Components of Operations and Key Performance Metrics Used By Management — Key Performance Metrics and Non-GAAP Financial Measures” in Part II, Item 7, included elsewhere in this report.
Initial Public Offering
In September 2014, we completed the largest traditional bank IPO in U.S. history which involved the sale of 161 million shares at $21.50 per share, or $3.5 billion of our common stock which was held by RBS Group. We did not receive any proceeds from the initial public offering. Our common stock is listed on the New York Stock Exchange (“NYSE”) under the symbol “CFG.”
CITIZENS FINANCIAL GROUP, INC.
As of December 31, 2014, RBS Group owned 70.5% of our common shares outstanding and has an agreement with its primary regulator and the European Commission that it will divest its remaining ownership interest by December 31, 2016, unless certain conditions occur.
Chicago Divestiture
Effective June 20, 2014, we divested certain assets and liabilities associated with our Chicago-area retail branches, small business relationships and select middle market relationships in a sale to U.S. Bancorp (“Chicago Divestiture”). The transaction included 103 branches, including 94 full-service branches, $4.8 billion of deposits and $1.0 billion in loans as of June 20, 2014. We received a 6% deposit premium in the sale which resulted in a gain on sale of $288 million as a result of the transaction. The strategic rationale underlying the decision to sell the franchise was an inability to gain market share in the intensely competitive Chicago market without expending considerable resources. Rather, we were able to leverage the competitive dynamics of the demographically attractive market to sell the franchise at a meaningful gain. The capital generated from the gain on sale is being utilized to fund a number of key performance enhancement initiatives including delivery of greater efficiency and incremental earning asset generation.
Competition
The financial services industry in general and in our branch footprint is highly competitive. Our branch footprint is in the New England, Mid-Atlantic and Midwest regions, though certain lines of business serve broader, national markets. Within those markets we face competition from community banks, super-regional and national financial institutions, credit unions, savings and loan associations, mortgage banking firms, consumer finance companies, securities brokerage firms, insurance companies and money market funds. Some of our larger competitors may make available to their customers a broader array of product, pricing and structure alternatives while some smaller competitors may have more liberal lending policies and processes. Competition among providers of financial products and services continues to increase, with consumers having the opportunity to select from a growing variety of traditional and nontraditional alternatives. The ability of non-banking financial institutions to provide services previously limited to commercial banks has intensified competition.
In Consumer Banking, the industry has become increasingly dependent on and oriented towards technology-driven delivery systems, permitting transactions to be conducted by telephone and computer, as well as through online and mobile channels. In addition, technology has lowered the barriers to entry and made it possible for non-bank institutions to attract funds and provide lending and other financial services in our footprint despite not having a physical presence within our footprint. Given their lower cost structure, these institutions are often able to offer rates on deposit products that are higher than what may be average for the market for retail banking institutions with a traditional branch footprint, such as us. The primary factors driving competition for loans and deposits are interest rates, fees charged, customer service levels, convenience, including branch location and hours of operation, and the range of products and services offered. In particular, the competition for home equity lines and auto loans has intensified, resulting in pressure on pricing.
In Commercial Banking, there is intense competition for quality loan originations from traditional banking institutions, particularly large regional banks, as well as commercial finance companies, leasing companies and other non-bank lenders, and institutional investors including collateralized loan obligation (“CLO”)CLO managers, hedge funds and private equity firms. Some larger competitors, including certain national banks that have a significant presence in our market area, may offer a broader array of products and, due to their asset size, may sometimes be in a position to hold more exposure on their own balance sheet. We compete on a number of factors including, among others, customer service, quality of execution, range of products offered, price and reputation.
CITIZENS FINANCIAL GROUP, INC.
BUSINESS
Intellectual Property
In the highly competitive banking industry in which we operate, trademarks, service marks, trade names and logos are important to the success of our business. We own and license a variety of trademarks, service marks, trade names, logos and pending registrations and are spending significant resources to develop our stand-alone brands. In connection with our initial public offering, we entered into a trademark license agreement, pursuant to which we were granted a limited license to use certain RBS trademarks (including the daisywheel logo) for an initial term of five years and, at our option, up to 10 years. The trademark license agreement was partially terminated in 2015, in connection with RBS’s exit of its ownership interest in our common stock. As part of the partial termination, we were required to remove the “RBS” brand name from our products and services, which we completed in the third quarter of 2015. Under the agreement, we lose the right to use the “RBS” acronym in connection with the marketing of any product or service as we rebrand and cease using the RBS brand in connection with such product or service, subject to certain limited exceptions. We have changed the legal names of anysubstantially all of our subsidiaries that included “RBS” and have continued operational and legal work to rebrandrebranded CFG and our banking subsidiaries. We expect the process of changing all marketing materials, operational materials, signage, systems, and legal entities containing “RBS” to our new brand name will take approximately 14 months and cost approximately $14 million, excluding any incremental advertising and customer communication expenses. We expect to then shift the majority of our advertising and marketing budget to our new brand progressively as the different legal entities complete their individual brand name changes. We expect the shift in advertising and marketing investment to be completed no later than July 31, 2015.
CITIZENS FINANCIAL GROUP, INC.
Information Technology Systems
We have recently made and continue to make significant investments in our information technology systems for our banking, and lending and cash management activities. We believe this is a necessary investment in order to offer new products and improve our overall customer experiences, as well as to provide scale for future growth and acquisitions. The technology investments include replacing systems that support our branch tellers, commercial loans, automobile loans and treasury solutions. Additional investments that are in process include creating an enterprise data warehouse to capture and manage data to better understand our customers, identify our capital requirements and support regulatory reporting and a new mortgage system for our home lending solutions business.
Regulation and Supervision
Our operations are subject to extensive regulation, supervision and examination under federal and state law. These laws and regulations cover all aspects of our business, including lending practices, safeguarding deposits, customer privacy and information security, capital structure, transactions with affiliates and conduct and qualifications of personnel. These laws and regulations are intended primarily for the protection of depositors, the Deposit Insurance Fund and the banking system as a whole and not for the protection of shareholders and creditors.
In 2010, President Obama signed into law theThe Dodd-Frank Act, whichand the rules that followed restructured the financial regulatory regime in the United States. The Dodd-Frank Act represents a significant overhaul of many aspects of the regulation of the financial services industry, addressing, among other things, systemic risk, capital adequacy, deposit insurance assessments, consumer financial protection, regulation of derivatives and securities markets, restrictions on an insured bank’s transactions with its affiliates, lending limits and mortgage-lending practices. Various provisions of the Dodd-Frank Act discussed in greater detail below,continue to require the issuance of many implementing regulations, which will take effect over several years, making it difficult to anticipate the ultimate overall impact to us, our subsidiaries or the financial industry more generally. Although the overall impact cannot be predicted with any degree of certainty, the Dodd-Frank Act will affect us across a wide range of areas.
As a result of and in addition to new legislation aimed at regulatory reform, such as the Dodd-Frank Act, and the increased capital and liquidity requirements introduced by the U.S. implementation of the Basel III framework (the capital components of which have become effective as to us on January 1, 2015, subject to certain phase-in provisions),general matter, the federal banking agencies (the Federal Reserve Board,FRB, the OCC and the FDIC) as well as the Consumer Financial Protection Bureau (“CFPB”)CFPB are taking a more stringent approach to supervising and regulating financial institutions and financial products and services over which they exercise their respective supervisory authorities.authorities, including in connection with enforcement matters. We, our two banking subsidiaries and our products and services are all subject to greater supervisory scrutiny and enhanced supervisory requirements and expectations and face significant challenges in meeting them. We expect to continue to face greater supervisory scrutiny and enhanced supervisory requirements for the foreseeable future.
General
AsCFG is a bank holding company and financial holding company (as defined inunder the Bank Holding Company Act of 1956 (“Bank Holding Company Act”)), we. We have elected to be treated as a financial holding company under amendments to the Bank Holding Company Act as effected by GLBA. We are subject to regulation, supervision and examination by the Federal Reserve Board,FRB, including through the Federal Reserve Bank of Boston. The FRB serves as the primary regulator of our consolidated organization.
CBNA is a national banking association. As such, it is subject to regulation, examination and supervision by the OCC as its primary federal regulator and by the FDIC as the insurer of its deposits.
CBPA is a Pennsylvania-chartered savings bank. Accordingly, it is subject to supervision by the Department of Banking of the Commonwealth of Pennsylvania (the “PA Banking Department”), as its chartering agency, and regulation, supervision and examination by the FDIC as the primary federal regulator of state-chartered savings banks and as the insurer of its deposits.
A principal objective of the U.S. bank regulatory system is to protect depositors by ensuring the financial safety and soundness of banks. To that end, the banking regulators have broad regulatory, examination and enforcement authority. The regulators regularly examine our operations, and CFG and our banking subsidiaries are subject to periodic reporting requirements.
CITIZENS FINANCIAL GROUP, INC.
BUSINESS
The regulators have various remedies available if they determine that the financial condition, capital resources, asset quality, earnings prospects, management, liquidity or other aspects of a banking organization’s operations are unsatisfactory. The regulators may also take action if they determine that the banking organization or its management is violating or has violated any law or regulation. The regulators have the power to, among other things:
enjoinEnjoin “unsafe or unsound” practices;
requireRequire affirmative actions to correct any violation or practice;
issueIssue administrative orders that can be judicially enforced;
CITIZENS FINANCIAL GROUP, INC.enforced and could result in disqualifications from certain activities;
directDirect increases in capital;
directDirect the sale of subsidiaries or other assets;
limitLimit dividends and distributions;
restrictRestrict growth;
assessAssess civil monetary penalties;penalties and require restitution to injured parties;
removeRemove officers and directors; and
terminateTerminate deposit insurance.
CBNA and CBPA are subject to various requirements and restrictions under federal and state law, including requirements to maintain reserves against deposits, restrictions on the types and amounts of loans that may be granted and the interest that may be charged and limitations on the types of investments that may be made, activities that may be engaged in, the opening and closing of branches and types of services that may be offered. The consumer lending and finance activities of CBNA and CBPA are also subject to extensive regulation under various federal and state laws. These statutes impose requirements on the making, enforcement and collection of consumer loans and on the types of disclosures that must be made in connection with such loans. CBNA and CBPA and certain of their subsidiaries are also prohibited from engaging in certain tie-in arrangements in connection with extensions of credit, leases or sales of property, or furnishing products or services.
In addition, CBNA and CBPA are subject to regulation, supervision and examination by the CFPB. The CFPB has broad authority to, among other things, regulate the offering and provision of consumer financial products by depository institutions with more than $10 billion in total assets. The CFPB may promulgate rules under a variety of consumer financial protection statutes, including the Truth in Lending Act, the Electronic Funds Transfer Act and the Real Estate Settlement Procedures Act.
The Dodd-Frank Act established the Financial Stability Oversight Council, which has oversight authority for monitoring and regulating systemic risk, and can recommend prudential standards, reporting and disclosure requirements to the Federal Reserve Board for systemically important financial institutions.
Financial Holding Company Regulation
The Gramm-Leach-Bliley Act of 1999 (“GLBA”)GLBA permits a qualifying bank holding company to become a financial holding company. Financial holding companies may engage in a broader range of activities than those permitted for a bank holding company, which are limited to (i) banking, managing or controlling banks, (ii) furnishing services to or performing services for subsidiaries and (iii) activities that the Federal Reserve BoardFRB has determined to be so closely related to banking as to be a proper incident thereto. GLBA broadens the scope of permissible activities for financial holding companies to include, among other things, securities underwriting and dealing, insurance underwriting and brokerage, merchant banking and other activities that are declared by the Federal Reserve Board,FRB, in cooperation with the Treasury Department, to be “financial in nature or incidental thereto” or that the Federal Reserve BoardFRB declares unilaterally to be “complementary” to financial activities. In addition, a financial holding company may conduct permissible new financial activities or acquire permissible non-bank financial companies with after-the-fact notice to the Federal Reserve Board.FRB.
We have elected and qualified forto be treated as a financial holding company status under amendments to the Bank Holding Company Act as effected by GLBA. To maintain financial holding company status, a financial holding company and its banking subsidiaries must remain well capitalized and well managed, and maintain a Community Reinvestment Act (“CRA”)CRA rating of at least “Satisfactory.” If a financial holding company ceases to meet these requirements, the Federal Reserve Board’sFRBs regulations provide that we must enter into an agreement with the Federal Reserve BoardFRB to comply with all applicable capital and management requirements. Until the financial holding company returns to compliance, the Federal Reserve BoardFRB may impose limitations or conditions on the conduct of its activities, and the company may not commence any of the broader financial activities permissible for financial holding companies or acquire a company engaged in such financial activities without prior approval of the Federal Reserve Board.FRB. In addition, the failure to meet such requirements could result in other material restrictions on the activities of the financial holding company and may also adversely affect the financial holding company'scompany’s ability to enter into certain transactions, including acquisition transactions, or obtain necessary approvals in connection therewith. Any restrictions imposed on our activities by the Federal Reserve BoardFRB may not necessarily be made known to the public. If the company does not return to compliance within 180 days, the Federal Reserve BoardFRB may require divestiture of the financial holding company’s depository institutions. Failure to satisfy the financial holding company requirements could also result in loss of financial holding company status. Bank holding companies and banks must also be both well capitalized and well managed in order to acquire banks located outside their home state.
In March 2014,addition, if any insured depository institution subsidiary of a financial holding company fails to maintain at least a “satisfactory” rating under the OCC communicated its determination that CBNA is not currently both well capitalized and well managed, as those terms are defined in applicable regulations, based on certain minimum capital ratios and supervisory ratings,Community Reinvestment Act, the financial holding company would be subject to similar activities restrictions.
CITIZENS FINANCIAL GROUP, INC.
BUSINESS
respectively, and consequentlyOn March 13, 2014, the OCC determined that CBNA no longer meets the condition to own a financial subsidiary.subsidiary - namely that CBNA must be both well capitalized and well managed. A financial subsidiary is permitted to engage in a broader range of activities, similar to those of a financial holding company, than those permissible for a national bank itself. CBNA has two financial subsidiaries, Citizens Securities, Inc. (doing business as CCO Investment Services Corp.), a registered broker-dealer, and RBS Citizens Insurance Agency, Inc., a dormant entity, although it continues to collect commissions on certain outstanding insurance policies.entity. CBNA has entered into an agreement with the OCC (the “OCC Agreement”) pursuant to which it must developthe Company has developed and submitted to the OCC a remediation plan, which must be approved by the OCC, settingthat sets forth the specific actions it will take to bring itself back into compliance with the conditions to own a financial subsidiary andsubsidiary. CBNA has made substantial progress toward completing those actions. However, until the schedule for achieving that objective. Until CBNA addresses the deficienciesplan has been completed to the OCC’s satisfaction, CBNA will be subject to restrictions on its ability to acquire control or buildhold an interest in any new financial subsidiary and to commence new activities in any existing financial subsidiary without the prior approvalconsent of the OCC. If CBNA fails to remediate the deficiencies, it may have to divest itself of its financial subsidiaries and comply with any additional limitations or conditions on its conduct as the OCC may impose. CBNA has developed a plan to address the deficiencies and has implemented a comprehensive enterprise-wide program, through which many deficiencies, we believe, have been addressed.
Separately, CBNA isour bank subsidiaries, either together or separately, are also making improvements to itstheir compliance management systems, fair lending compliance, risk management, identity theft and debt cancellation add-on product practices, overdraft fees and deposit reconciliation practices, mortgage servicing, third-party payment processor activities, oversight of third-party providers, consumer compliance program, policies, procedures and training, information security, consumer complaints process and anti-money laundering controls in order to address deficiencies in those areas. CBPA is making improvements to address deficiencies in its deposit reconciliation practices, overdraft fees, identity theft add-on products, third-party payment processor activities, oversight of third-party providers, compliance program, policies, procedures and training, consumer complaints process and anti-money laundering controls. These efforts require us to make investments in additional resources and systems and also require a significant commitment of managerial time and attention.
We are also required to make improvements to our overall compliance and operational risk management programs and practices in order to comply with enhanced supervisory requirements and expectations and to address weaknesses in retail credit risk management, liquidity risk management, model risk management, outsourcing and vendor risk management and related oversight and monitoring practices and tools. Our and our banking subsidiaries' consumer compliance program and controls also require improvement, particularly with respect to deposit reconciliation processes, fair lending and mortgage servicing.
Currently, under the Bank Holding Company Act, we may not be able to engage in certain categories of new activities or acquire shares or control of other companies other than in connection with internal reorganizations.
Standards for Safety and Soundness
The Federal Deposit Insurance Act (“FDIA”)FDIA requires the Federal Reserve Board,FRB, OCC and FDIC to prescribe operational and managerial standards for all insured depository institutions, including CBNA and CBPA. The agencies have adopted regulations and interagency guidelines which set forth the safety and soundness standards used to identify and address problems at insured depository institutions before capital becomes impaired. If an agency determines that a bank fails to satisfy any standard, it may require the bank to submit an acceptable plan to achieve compliance, consistent with deadlines for the submission and review of such safety and soundness compliance plans.
Under Section 616 of the Dodd-Frank Act, which codifies the Federal Reserve Board’sFRB’s long-standing “source of strength” doctrine, any bank holding company that controls an insured depository institution must serve as a source of financial and managerial strength for its depository institution subsidiary. The statute defines “source of financial strength” as the ability to provide financial assistance in the event of the financial distress at the insured depository institution. The Federal Reserve BoardFRB may require a bank holding company to provide such support at times when it may not have the financial resources to do so or when doing so is not otherwise in the interests of CFG or its shareholders or creditors.
CBPA is also subject to supervision by the PA Banking Department. The PA Banking Department may order any Pennsylvania-chartered savings bank to discontinue any violation of law or unsafe or unsound business practice. It may also order the termination of any trustee, officer, attorney or employee of a savings bank engaged in objectionable activity.
Dividends
Various federal and state statutory provisions and regulations, as well as regulatory expectations, limit the amount of dividends that we and our subsidiaries may pay. Dividends payable by CBNA, as a national bank subsidiary, are limited to the lesser of the amount calculated under a “recent earnings” test and an “undivided profits” test. Under the recent earnings test, a dividend may not be paid if the total of all dividends declared by a bank in any calendar year is in excess of the current year’s net income combined with the retained net income of the two preceding years, less any required transfers to surplus, unless the national bank obtains the approval of the OCC. Under the undivided profits test, a dividend may be paid only to the extent that retained net profits (as defined and interpreted by regulation), including the portion transferred to surplus, exceed bad debts (as defined by regulation). CBNA is currently required to seek the OCC’s approval prior to paying any dividends to us. Federal bank regulatory agencies have issued policy statements which provide that FDIC-insured depository institutions and their holding companies should generally pay dividends only out of their current operating earnings. Under Pennsylvania law, CBPA may declare and pay dividends
CITIZENS FINANCIAL GROUP, INC.
only out of accumulated net earnings and only if (i) any required transfer to surplus has been made prior to declaration of the dividend and (ii) payment of the dividend will not reduce surplus.
Furthermore, with respect to both CBNA and CBPA, if, in the opinion of the applicable federal regulatory agency, either is engaged in or is about to engage in an unsafe or unsound practice (which, depending on the financial condition of the bank, could include the payment of dividends), the regulator may require, after notice and hearing, that such bank cease and desist from
CITIZENS FINANCIAL GROUP, INC.
BUSINESS
such practice. The OCC and the FDIC have indicated that the payment of dividends would constitute an unsafe and unsound practice if the payment would reduce a depository institution’s capital to an inadequate level. The banking agencies have significant discretion to limit or even preclude dividends, even if the statutory quantitative thresholds are satisfied.
Supervisory stress tests conducted by the Federal Reserve BoardFRB in connection with its annual Comprehensive Capital and Analysis Review (“CCAR”)CCAR process, discussed in greater detail below, affect our ability to make capital distributions. As part of the CCAR process, the Federal Reserve BoardFRB evaluates institutions’ capital adequacy and internal capital adequacy assessment processes to ensure that they have sufficient capital to continue operations during periods of economic and financial stress. The Federal Reserve BoardFRB must approve any planned distribution of capital in connection with the CCAR process. The Federal Reserve Board will either object to
In March 2015, the FRBG assessed our current capital plan in whole or in part, or provide a notice of non-objection to us by March 31 of a calendar year. In March 2014, the Federal Reserve Board objected on qualitative grounds to our capital planas submitted as part of the CCAR process. In its public report entitled “Comprehensive Capital Analysis and Review 2014: Assessment Framework and Results,” the Federal Reserve Board cited significant deficiencies in our capital planning processes, including inadequate governance, weak internal controls and deficiencies in our practices for estimating revenues and lossesdocumented under a stress scenario and for ensuring the appropriateness of loss estimates across our business lines in a specific stress scenario. Although the Federal Reserve Board acknowledged that bank holding companies such as ours that are new to the CCAR process and raised no objection to the plan. Unless we choose to file an amended capital plan prior to April 2016, the maximum levels at which we may declare dividends and repurchase shares of our common stock through June 30, 2016 are governed by our 2015 capital plan, subject to different expectations,actual financial performance and ongoing compliance with internal governance and all other regulatory requirements. The payment of dividends after June 30, 2016 will be subject to FRB objection or non-objection to our weaknesses were considered serious enough to warrant the Federal Reserve Board’s objection based on its qualitative assessment of our capital planning process. As a result, we are not permitted to increase our capital distributions above 2013 levels until a new2016 capital plan is approvedto be filed by the Federal Reserve Board. We submitted a new capital plan on JanuaryApril 5, 2015, and we cannot assure you that the Federal Reserve Board will not object to that capital plan or that, even if it does not object to it, our planned capital distributions will not be significantly modified.2016.
In addition, under the U.S. Basel III capital framework (described further below), the ability of banks and bank holding companies to pay dividends and make other forms of capital distribution will also depend on their ability to maintain a sufficient capital conservation buffer under the U.S. Basel III capital framework (described further below).above minimum risk-based ratio requirements that is composed entirely of CET1 capital. The capital conservation buffer requirements will be phasedbegan phasing in beginning on January 1, 2016. The ability of banks and bank holding companies to pay dividends, and the contents of their respective dividend policies, could be impacted by a range of regulatory changes made pursuant to the Dodd-Frank Act, many of which still require final implementing rules to become effective. In addition, the Federal Reserve Board recently amended its capital planning and stress testing rules to, among other things,FRB generally limitlimits a bank holding company’s ability to make quarterly capital distributions — that is, dividends and share repurchases — commencing April 1, 2015 if the amount of the bank’s actual cumulative quarterly capital issuances of instruments that qualify as regulatory capital are less than the bank had indicated in its submitted capital plan as to which it received a non−objectionnon-objection from the Federal Reserve Board,FRB, subject to certain qualifications and exceptions.
Federal Deposit Insurance Act
The FDIA imposes various requirements on insured depository institutions. For example, the FDIA requires, among other things, that the federal banking agencies take “prompt corrective action” in respect of depository institutions that do not meet minimum capital requirements, which are described below in “Capital.” The FDIA sets forth the following five capital tiers: “well-capitalized,” “adequately capitalized,” “undercapitalized,” “significantly undercapitalized” and “critically undercapitalized.” A depository institution’s capital tier will depend upon how its capital levels compare with various relevant capital measures and certain other factors that are established by regulation.
The FDIA prohibits any depository institution from making any capital distributions (including payment of a dividend) or paying any management fee to its parent holding company if the depository institution would thereafter be “undercapitalized.” “Undercapitalized” institutions are subject to growth limitations and are required to submit a capital restoration plan. For a capital restoration plan to be acceptable, among other things, the depository institution’s parent holding company must guarantee that the institution will comply with the capital restoration plan. If a depository institution fails to submit an acceptable capital restoration plan, it is treated as if it is “significantly undercapitalized.” “Significantly undercapitalized” depository institutions may be subject to a number of requirements and restrictions, including orders to sell sufficient voting stock to become “adequately capitalized,” orders to elect a new board of directors, requirements to reduce total assets and cessation of receipt of deposits from correspondent banks. “Critically undercapitalized” institutions are subject to the appointment of a receiver or conservator.
The FDIA prohibits insured banks from accepting brokered deposits or offering interest rates on any deposits significantly higher than the prevailing rate in the bank’s normal market area or nationally (depending upon where the deposits are solicited),
CITIZENS FINANCIAL GROUP, INC.
unless it is “well-capitalized,” or it is “adequately capitalized” and receives a waiver from the FDIC. A bank that is “adequately capitalized” and that accepts brokered deposits under a waiver from the FDIC may not pay an interest rate on any deposit in excess of 75 basis points over certain prevailing market rates. The FDIA imposes no such restrictions on a bank that is “well-capitalized.”
The FDIA requires CBNA and CBPA to pay deposit insurance assessments. Deposit insurance assessments are based on average consolidated total assets, less average tangible equity and various other regulatory factors included in aan FDIC assessment scorecard. Deposit insurance assessments are also affected by the minimum reserve ratio with respect to the Deposit Insurance Fund (“DIF”).DIF. The minimum reserve ratio is currently 2%, and the FDIC is free to increase this ratio in the future. In October 2015, the FDIC issued a proposed rule that would increase the reserve ratio for the Deposit Insurance Fund to 1.35% of total insured deposits. The proposed rule would impose a surcharge on the assessments of larger depository institutions, beginning the quarter after the reserve ratio first reaches or exceeds 1.15% and continuing through the earlier of the quarter that the reserve ratio first reaches or exceeds 1.35% and December 31, 2018. Under the proposed rule, if the reserve ratio does not reach 1.35% by December 31, 2018, the FDIC would impose a shortfall assessment on larger depository institutions. This may result in increased costs for CBNA and CBPA.
CITIZENS FINANCIAL GROUP, INC.
BUSINESS
Because of the uncertainty as to the outcome of the FDIC's proposals, we cannot provide any assurance as to the ultimate impact of any surcharges on the amount of deposit insurance expense reported in future periods.
Under the FDIA, banks may also be held liable by the FDIC for certain losses incurred, or reasonably expected to be incurred, by the DIF. Either CBNA and CBPA may be liable for losses caused by the other’s default and also may be liable for any assistance provided by the FDIC to the other if it is in danger of default.
Capital
We must comply with capital adequacy standards established by the Federal Reserve Board.FRB. CBNA and CBPA must comply with similar capital adequacy standards established by the OCC and FDIC, respectively. We currently have capital in excess of the “well-capitalized” standards described below. For more detail on our regulatory capital, see “Management’s Discussion and Analysis of Financial Condition and Results of Operations — Capital” in Part II, Item 7, included elsewhere in this report.
Basel III Final Rules Applicable to Us and Our Banking Subsidiaries
In July 2013, the Federal Reserve Board,FRB, OCC and FDIC issued the U.S. Basel III final rule.rules. The final rule implementsrules implement the Basel Committee on Banking Supervision’s Basel III capital framework and certain provisions of the Dodd-Frank Act, including the Collins Amendment, which establishes minimumAmendment. The U.S. Basel III final rules substantially revised the risk-based capital and leverage requirements on a consolidated basis forapplicable to bank holding companies and their insured depository institutionsinstitution subsidiaries, including CBNA and their bank holding companies. Certain aspects of theCBPA. The U.S. Basel III final rule, such as the new minimum capital ratios, changes to the prompt corrective action ratios to reflect the higher minimum capital ratiosrules became effective for the various capital tiersCFG and the revised methodology for calculating risk-weighted assets, became effectiveits depository institution subsidiaries, including CBNA and CBPA, on January 1, 2015. Other aspects of the final rule, such as the capital conservation buffer and the new regulatory deductions from and adjustments2015 (subject to capital, will be phased in over several years beginning on January 1, 2015.a phase-in period for certain provisions).
The U.S. Basel III final rule includesrules, among other things, (i) introduced a new capital measure called CET1, (ii) specify that Tier 1 capital consists of CET1 and “Additional Tier 1 capital” instruments meeting certain revised requirements, (iii) define CET1 narrowly by requiring that most deductions/adjustments to regulatory capital measures be made to CET1 and not to the other components of capital, and (iv) expand the scope of the deductions/ adjustments to capital as compared to existing regulations. Under the U.S. Basel III final rules, the minimum capital ratios effective as of January 1, 2015 are:
4.5% CET1 to risk-weighted assets;
6.0% Tier 1 capital (that is, CET1 plus Additional Tier 1 capital) to risk-weighted assets;
8.0% Total capital (that is, Tier 1 capital plus Tier 2 capital) to risk-weighted assets; and
4.0% Tier 1 capital to average consolidated assets as reported on consolidated financial statements (known as the “leverage ratio”).
The U.S. Basel III final rules also introduced a new “capital conservation buffer”, composed entirely of CET1, on top of these minimum risk-weighted asset ratios. The implementation of the capital conservation buffer began on January 1, 2016 at the 0.625% level and will increase by 0.625% on each subsequent January 1, until it reaches 2.5% on January 1, 2019. Banking institutions with a ratio of CET1 to risk-weighted assets below the effective minimum (4.5% plus the capital conservation buffer and, if applicable, the countercyclical capital buffer) will face constraints on dividends, equity repurchases and compensation based on the amount of the shortfall.
When fully phased in on January 1, 2019, the U.S. Basel III final rules will require CFG, CBNA and CBPA to maintain an additional capital conservation buffer of 2.5% of CET1, effectively resulting in minimum ratios of (i) CET1 to risk-weighted assets of 4.5% and a CET1 capital conservation buffer of greater than 2.5% of risk-weighted assets that will apply to all U.S. banking organizations. Failure to maintain the capital conservation buffer will result in increasingly stringent restrictions on a banking organization’s ability to make dividend payments and other capital distributions and pay discretionary bonuses to executive officers. The final rule also increases the minimum ratio ofat least 7%, (ii) Tier 1 capital to risk-weighted assets from 4% to 6%of at least 8.5%, while maintaining the(iii) a minimum total risk-based capital ratio of 8%. In addition, for the largestTotal capital to risk-weighted assets of at least 10.5%; and most internationally active U.S. banking organizations, the final rule includes(iv) a new minimum supplementary leverage ratio that takes into account certain off-balance sheet exposures.of 4%.
The U.S. Basel III final rule focuses regulatory capital on CET1 capital, and introduces new regulatory adjustments andrules also provide for a number of deductions from capital as well as narrower eligibility criteriaand adjustments to CET1. These include, for regulatory capital instruments. Consistent withexample, the requirements of the Collins Amendment, the new eligibility criteria for regulatory capital instruments results in, among other things, trust preferred securities no longer qualifying as Tier 1 capital for bank holding companies, such as us. The final rule also revises the methodology for calculating risk-weighted assets forrequirement that certain types ofdeferred tax assets and exposures.
Capital Requirements Applicable to Us, Assignificant investments in Effect on December 31, 2014
Under the “Basel I” regulatory capital framework that was in effect for us and our banking subsidiaries as of December 31, 2014, capital was divided into two tiers. Tier 1 capital consisted principally of stockholders’ equity less any amounts of goodwill, other intangible assets, non-financial equity investments and other items that are required to be deducted. Tier 2 capital consisted principally of term subordinated debt and, subject to limitations, general allowances for loan losses. Assets were adjusted under the risk-based guidelines to take into account different risk characteristics. Quarterly average on-balance sheet assets for purpose of the leverage ratio did not include goodwill, other intangible assets or items that the Federal Reserve Board has determined shouldnon-consolidated financial entities be deducted from TierCET1 to the extent that any one such category exceeds 10% of CET1 or all such items, in the aggregate, exceed 15% of CET1. Implementation of the deductions and other adjustments to CET1 began on January 1, capital.2015 and will be phased-in over a 4-year period (beginning at 40% on January 1, 2015 and an additional 20% per year thereafter).
UnderThe U.S. Basel III final rules prescribe a standardized approach for risk weightings that expanded the then-applicable capital adequacy guidelines, bank holding companies had to maintain a Tier 1risk-weighting categories from the general risk-based capital ratiorules to a much larger and more risk-sensitive number of at least 4%,categories, depending on the nature of the assets, generally ranging from 0% for U.S. government and agency securities, to 600% for certain equity exposures, and resulting in higher risk weights for a total risk-based capital ratiovariety of at least 8%asset categories.
With respect to CBNA and a leverage ratioCBPA, the U.S. Basel III final rules also revise the “prompt corrective action” regulations pursuant to Section 38 of at least 4%. To qualifythe Federal Deposit Insurance Act, as “well capitalized,discussed above in “Federal Deposit Insurance Act.” a bank holding company had to maintain a Tier 1 risk-based capital ratio of at least 6%, a total risk-based capital ratio of at least 10% and a leverage ratio of at least 5%.
CITIZENS FINANCIAL GROUP, INC.
Liquidity Standards
The Federal Reserve Board evaluatesHistorically, the FRB had evaluated our liquidity as part of the supervisory process.process, without required formulaic measures. Liquidity risk management and supervision have become increasingly important since the financial crisis. In September 2014, the Federal Reserve Board,FRB, OCC and FDIC issued a final rule to implement the Basel III Liquidity Coverage Ratio (“LCR”). TheIII-based U.S. LCR, which is a quantitative liquidity metric
CITIZENS FINANCIAL GROUP, INC.
BUSINESS
designed by the Basel Committee to ensure that banks have sufficienta covered bank or bank holding company maintains an adequate level of unencumbered high-quality liquid assets to cover expected net cash outflows over a 30-day time horizon under an acute liquidity stress period.scenario. The Basel Committee contemplates that major jurisdictions will begin to phase in the LCR requirement on January 1, 2015. The final U.S. LCR rule, as adopted, applies a modified version of the LCRin its most comprehensive form only to largeadvanced approaches bank holding companies and depository institutions subsidiaries of such bank holding companies and, in a modified form, to bank holding companies having $50 billion or more in total consolidated assets such as us.CFG. The modified version of the LCR differs in certain respects from the Basel Committee’s version of the LCR, including a narrower definition of high-quality liquid assets, different prescribed cash inflow and outflow assumptions for certain types of instruments and transactions, and a shorter phase-in schedule that beginsbegan on January 1, 2015 and ends on January 1, 2017. The rule is currently being phased in with 90% compliance required on January 1, 2016 and 100% compliance required on January 1, 2017. We are required to calculate our LCR on a monthly basis. If a covered company fails to meet the required LCR, it must promptly notify its primary federal banking regulator and may be required to take remedial actions. Under a rule proposed by the FRB in November 2015, we would be required to disclose publicly information about certain components of our LCR beginning January 1, 2018. At December 31, 2015, our LCR was above the January 1, 2016 requirement of 90%.
The Basel Committee also has finalized its Net Stable Funding Ratio (“NSFR”),NSFR, a quantitative liquidity metric designed to promote the resiliencemore medium- and long-term funding of a bank’s liquidity risk profile over a longer period than the LCR. The NSFR establishes a minimum acceptable amount of stable funding based on the liquidity characteristics of an institution’s assets and activities of banks over a one-year time horizon. TheAlthough the Basel committee finalized its formulation of the NSFR has been developed to providein 2014 contemplating a sustainable maturity structure of assets and liabilities. The final rule will be implemented as a minimum standard by January 1, 2018. Federal2018 effective date, the U.S. banking regulatorsagencies have not yet proposed rulesan NSFR for application to implementU.S. banking organizations or addressed the NSFR in the United States.scope of banking organizations to which it will apply.
In addition, under the Dodd-Frank Act, the Federal Reserve BoardFRB has implemented enhanced prudential standards for bank holding companies with $50 billion or more in total consolidated assets. See “—Enhanced Prudential Standards.” These regulations will require us to conduct regular liquidity stress testing over various time horizons and to maintain a buffer of higher liquid assets sufficient to cover expected net cash outflows and projected loss or impairment of funding sources for a short-term liquidity stress scenario. This liquidity buffer requirement is designed to complement the Basel IIIIII-based U.S. LCR.
Capital Planning and Stress Testing Requirements
The Federal Reserve Board, OCC and FDIC have promulgated final rules under the Dodd-Frank Act requiring us, CBNA and CBPA to conduct annual stress tests and publish a summary of the results. Separately, the Federal Reserve Board has issued an interim final rule specifying how large bankBank holding companies should incorporate the U.S. Basel III capital standards into their 2014with $50 billion or more in total consolidated assets, such as CFG, are required to develop and maintain a capital plan, and to submit the capital plan to the FRB for review under its CCAR process. CCAR is designed to evaluate the capital adequacy, capital adequacy process and planned capital distributions, such as dividend payments and common stock repurchases, of a bank holding company subject to CCAR. As part of CCAR, the FRB evaluates whether a bank holding company has sufficient capital to continue operations under various scenarios of economic and financial market stress test(both bank holding company- and FRB- developed, including an “adverse” and “severely adverse” stress scenario developed by the Federal Reserve). The FRB will also evaluate whether the bank holding company has robust, forward-looking capital projections. Among other things,planning processes that account for its unique risks.
The capital plan must cover a “planning horizon” of at least nine quarters (beginning with the interim final rule requires largequarter preceding the submission of the plan). The FRB has broad authority to object to capital plans, and to require bank holding companies to projectrevise and resubmit their capital plans. Bank holding companies are also subject to an ongoing requirement to revise and resubmit their capital plans upon the occurrence of certain events specified by rule, or when required by the FRB. In addition to other limitations, our ability to make any capital distributions (including dividends and share repurchases) is contingent on the FRB’s non-objection to our capital plan under both quantitative and qualitative tests. Should the FRB object to a capital plan, a bank holding company may not make any capital distribution other than those capital distributions that the FRB has indicated non-objection to in writing. Beginning in 2016, participating firms are required to submit their CET 1 risk-based capital ratio usingplans and stress testing results to the methodology under existing capital guidelines and their CET 1 risk-based capital ratioFRB on or before April 5 of each year, instead of on or before January 5 of each year under the U.S. Basel IIIprior rules.
The FRB is expected to publish the decisions for all the bank holding companies participating in CCAR 2016, including the reasons for any objection to capital standards, as such standards phase inplans, by June 30, 2016. In addition, the Federal Reserve will separately publish the results of its supervisory stress test under both the supervisory severely adverse and adverse scenarios. The information to be released will include, among other things, the FRB’s projection of company-specific information, including post-stress capital ratios and the minimum value of these ratios over the nine-quarter planning horizon.
The FRB recently amended its capital planning and stress testing rules to, among other things, generally limit our ability to make quarterly capital distributions - that is, dividends and share repurchases - commencing July 1, 2016 if the amount of our actual cumulative quarterly capital issuances of instruments that qualify as regulatory capital are less than we had indicated in our submitted capital plan as to which we receive a non-objection from the FRB.
Due to the importance and intensity of the stress tests and the CCAR process, we have dedicated significant resources to comply with stress testing and capital planning requirements and expect to continue to do so in the future.
CITIZENS FINANCIAL GROUP, INC.
BUSINESS
Final Regulations Under the Volcker Rule
The Dodd-Frank Act prohibits banks and their affiliates from engaging in proprietary trading and investing in, sponsoring and having certain relationships with private funds such as hedge funds or private equity funds that would be an investment company for purposes of the Investment Company Act of 1940 but for the exclusions in sections 3(c)(1) or 3(c)(7) of that act, both subject to certain limited exceptions. The statutory provision is commonly called the “Volcker Rule.” In December 2013, the Federal Reserve Board,FRB, OCC, FDIC, the United States Securities and Exchange Commission (“SEC”)SEC and the Commodity Futures Trading Commission issued final rules to implement the Volcker Rule. The Volcker Rule prohibits an insured depository institution, such as CBNA and CBPA, and its affiliates from (1) engaging in proprietary trading or (2) investing in, sponsoring or having certain relationships with certain types of funds, both subject to certain limited exceptions. On December 18, 2014, the Federal Reserve BoardFRB issued an order extending the Volcker Rule’s conformance period until July 21, 2016, for investments in and relationships with “covered funds” and certain foreign funds that were in place on or prior to December 31, 2013. Subject to these extensions, we havehad until July 2015 to comply with other provisions of the Volcker Rule. These Volcker Rule prohibitions are expected to impact the ability of U.S. banking organizations to provide investment management products and services that are competitive with non-banking firms generally and with non-U.S. banking organizations in overseas markets. The Volcker Rule would also effectively prohibit short-term trading strategies by any U.S. banking organization if those strategies do not fall under the limited exceptions, such as the exceptions for market making-related activities and risk-mitigating hedging.
Resolution Plans
Federal Reserve BoardFRB and FDIC regulations require a bank holding company with more than $50 billion in assets to annually submit a resolution plan that explains how,the company’s strategy, in the event of material financial distress or failure, the bank holding company would be resolved in afor rapid, orderly and systemically safe manner under the bankruptcy code. An insured depository institution with more than $50 billion in assets must submit to the FDIC a resolution plan that explains how the institution can be resolved in a manner that is orderly and that ensures that depositors will receive access to insured funds within certain required timeframes.resolution. If the Federal Reserve BoardFRB and the FDIC jointly determine that the resolution plan of a bank holding company is not credible, and the company fails to cure the deficiencies in a timely manner, then the Federal Reserve BoardFRB and the FDIC may jointly impose on the company, or on any of its subsidiaries, more stringent capital, leverage or liquidity requirements or restrictions on growth, activities or operations, or require the divestment of certain assets or operations. We timely submitted our resolution plan, jointly
CITIZENS FINANCIAL GROUP, INC.
with RBS, on October 1, 2014. WhenBecause RBS no longer controls us for bank regulatory purposes, we will separately file our own bank holding company resolution plan with the Federal Reserve BoardFRB and FDIC in accordance with their regulations, including required timelines.
In addition, an insured depository institution with more than $50 billion in assets, including CBNA, must submit to the FDIC a resolution plan that explains how that institution could be resolved in a manner that is orderly and that ensures that depositors will receive access to insured funds within certain required timeframes. On December 23, 2015, we submitted our resolution plan for CBNA to the FDIC.
Enhanced Prudential Standards
The Dodd-Frank Act requires the Federal Reserve BoardFRB to impose liquidity, single counterparty credit limits, risk management and other enhanced prudential standards for bank holding companies with $50 billion or more in total consolidated assets, including us. The Federal Reserve Board on February 18, 2014 approved a final rule implementing certain ofSince January 1, 2015, the enhanced prudential standards. Understandards implemented by the final rule, weFRB, have required subject bank holding companies to comply with variousenhanced liquidity and overall risk management standards and maintain a liquidity buffer of unencumbered highly liquid assets based on the results of internal liquidity stress testing. The final rulerules also establishesestablished certain requirements and responsibilities for our risk committee and mandates certain risk management standards. Although the liquidity buffer under these rules has some similarities to the LCR (and is described by the agencies as complementary to the LCR), it is a separate requirement that is in addition to the LCR. Final rules on single counterparty credit limits and an early remediation framework have not yet been promulgated.
Heightened ExpectationsRisk Governance Standards
In September 2014, the OCC finalized guidelines that establish heightened standards for large national banks with average total consolidated assets of $50 billion or more, including CBNA. The guidelines set forth minimum standards for the design and implementation of a bank’s risk governance framework, and minimum standards for oversight of that framework by a bank’s board of directors. The guidelines are an extension of the OCC’s “heightened expectations” for large banks that the OCC began informally communicating to certain banks in 2010. The guidelines are intended to protect the safety and soundness of covered banks and improve bank examiners’ ability to assess compliance with the OCC’s expectations. Under the guidelines, a bank could use certain components of its parent company’s risk governance framework, but the framework must ensure that the bank’s risk profile is easily distinguished and separate from the parent for risk management and supervisory purposes. A bank’s board of directors is required to have two members who are independent of the bank and parent company management. A bank’s board of directors is responsible for ensuring that the risk governance framework meets the standards in the guidelines, providing active oversight and a credible challenge to management’s recommendations and decisions and ensuring that the parent company decisions do not jeopardize the safety and soundness of the bank.
Protection of Customer Personal Information and Cybersecurity
The privacy provisions of the GLBA generally prohibit financial institutions, including us, from disclosing nonpublic personal financial information of consumer customers to third parties for certain purposes (primarily marketing) unless customers have the
CITIZENS FINANCIAL GROUP, INC.
BUSINESS
opportunity to opt out of the disclosure. The Fair Credit Reporting Act restricts information sharing among affiliates for marketing purposes. Both the Fair Credit Reporting Act and Regulation V, issued by the Federal Reserve Board,FRB, govern the use and provision of information to consumer reporting agencies.
FederalIn March 2015, federal regulators issued two related statements regarding cybersecurity. One statement indicates that financial institutions should design multiple layers of security controls to establish lines of defense and state banking agencies have prescribed standards for maintainingto ensure that their risk management processes also address the risk posed by compromised customer credentials, including security measures to reliably authenticate customers accessing Internet-based services of the financial institution. The other statement indicates that a financial institution’s management is expected to maintain sufficient business continuity planning processes to ensure the rapid recovery, resumption and confidentialitymaintenance of consumer information,the institution’s operations after a cyber attack involving destructive malware. A financial institution is also expected to develop appropriate processes to enable recovery of data and business operations and address rebuilding network capabilities and restoring data if the institution or its critical service providers fall victim to this type of cyber attack. If we arefail to observe the regulatory guidance, we could be subject to such standards, as well as certain federal and state laws or standardsvarious regulatory sanctions, including financial penalties. See Item 1A. Risk Factors for notifying consumers in the eventa further discussion of a security breach.risks related to cybersecurity.
Anti-Tying Restrictions
Generally, a bank may not extend credit, lease, sell property or furnish any services or fix or vary the consideration for them on the condition that (1) the customer obtain or provide some additional credit, property or services from or to that bank or its bank holding company or their subsidiaries or (2) the customer not obtain some other credit, property or services from a competitor, except to the extent reasonable conditions are imposed to assure the soundness of the credit extended. A bank may, however, offer combined-balance products and may otherwise offer more favorable terms if a customer obtains two or more traditional bank products. Certain foreign transactions are exempt from the general rule.
Community Reinvestment Act (“CRA”) Requirements
The CRA requires the banking agencies to evaluate the record of us and our banking subsidiaries in meeting the credit needs of our local communities, including low and moderate income neighborhoods. The CRA requires each appropriate federal bank regulatory agency, in connection with its examination of a depository institution, to assess such institution’s record in assessing and meeting the credit needs of the community served by that institution and assign ratings. The regulatory agency’s assessment of the institution’s record is made available to the public. These evaluations are also considered in evaluating mergers, acquisitions and applications to open a branch or facility and, in the case of a bank holding company that has elected financial holding company status, a CRA rating of “satisfactory” is required to commence certain new financial activities or to acquire a company engaged in such activities. We received a rating of “satisfactory” in our most-recent CRA evaluation.
Rules Affecting Debit Card Interchange Fees
The Federal Reserve Board issued finalInterchange fees, or “swipe” fees, are charges that merchants pay to us and other card-issuing banks for processing electronic payment transactions. FRB rules effective Octoberapplicable to financial institutions that have assets of $10 billion or more provide that the maximum permissible interchange fee for an electronic debit transaction is the sum of 21 cents per transaction and 5 basis points multiplied by the value of the transaction. An upward adjustment of no more than 1 2011, that establish standards, including a cap, forcent to an issuer’s debit card interchange fee is allowed if the card issuer develops and implements policies and procedures reasonably designed to achieve certain fraud-prevention standards.
Consumer Financial Protection Regulations
The retail activities of banks are subject to a variety of statutes and regulations designed to protect consumers. Loan operations are also subject to federal laws applicable to credit transactions, such as:
Federal Truth-In-Lending Act and Regulation Z issued by the CFPB, governing disclosures of credit terms to consumer borrowers;
Home Mortgage Disclosure Act and Regulation C issued by the CFPB, requiring financial institutions to provide information to enable the public and public officials to determine whether a financial institution is fulfilling its obligation to help meet the housing needs of the community it serves;
Equal Credit Opportunity Act and Regulation B issued by the CFPB, prohibiting discrimination on the basis of various prohibited factors in extending credit;
Fair Debt Collection Act, governing the manner in which consumer debts may be collected by collection agencies; and
Service Members Civil Relief Act, applying to all debts incurred prior to commencement of active military service (including credit card and other open-end debt) and limiting the amount of interest, including service and renewal charges and any other fees and prohibiting network exclusivity arrangements and routing restrictions.or charges (other than bona fide insurance) that is related to the obligation or liability.
Deposit operations also are subject to, among others:
CITIZENS FINANCIAL GROUP, INC.
BUSINESS
ConsumerTruth in Savings Act and Regulation DD issued by the CFPB, which require disclosure of deposit terms to consumers;
Expected Funds Availability Act and Regulation CC issued by the FRB, which relates to the availability of deposit funds to consumers;
Right to Financial Protection RegulationsPrivacy Act, which imposes a duty to maintain the confidentiality of consumer financial records and prescribes procedures for complying with administrative subpoenas of financial records; and
Electronic Funds Transfer Act and Regulation E issued by the CFPB, which governs automatic deposits to and withdrawals from deposit accounts and consumer rights and liabilities arising from the use of automated teller machines and other electronic banking services.
In addition to these federal laws and regulations, the guidance and interpretations of the various federal agencies charged with the responsibility of implementing such regulations also influences loan and deposit operations.
The consumer protection provisions of the Dodd-Frank Act, including the transfer of much of the rulemaking, supervision and enforcement authority under various consumer financial laws to the CFPB, and the CFPB’s subsequent regulatory, supervisory, and enforcement activity have created a more intense and complex environment for consumer finance regulation. The CFPB is authorized to, among other things, engage in consumer financial education, monitor consumer complaints, request data and promote the availability of financial services to underserved consumers and communities. We expect increased oversight of financial services products by the CFPB, which are likely to affect our operations. The CFPB has significant authority to implement and enforce federal consumer finance laws, including the Truth in Lending Act, the Equal Credit Opportunity Act, the Fair Credit Billing Act and new requirements for financial services products provided for in the Dodd-Frank Act, as well asAct. The CFPB also has examination and primary enforcement authority with respect to depository institutions with $10 billion or more in assets, including the authority to identify and prohibitprevent unfair, deceptive or abusive acts and practices.practices in connection with the offering of consumer financial products. We expect increased oversight of financial services products by the CFPB, which are likely to affect our operations. The review of products and practices to prevent such acts and practices is a continuing focus of the CFPB, and of banking regulators more broadly. The ultimate impact of this heightened scrutiny is uncertain but could result in changes to pricing, practices, products and procedures. It also could result in increased costs related to regulatory oversight, supervision and examination, additional remediation efforts and possible penalties.
In addition, the Dodd-Frank Act provides the CFPB with broad supervisory, examination and enforcement authority over various consumer financial products and services, including the ability to require reimbursements and other payments to customers for alleged legal violations and to impose significant penalties, as well as injunctive relief that prohibits lenders from engaging in allegedly unlawful practices. The CFPB also has the authority to obtain cease and desist orders providing for affirmative relief and/or monetary penalties. The Dodd-Frank Act and accompanying regulations, including regulations to be promulgated by the CFPB, are being phased in over time. Although some regulations have been promulgated, many others have not yet been proposed or finalized. For example, the CFPB announced that it is considering new rules regarding debt collection practices, and has proposed new regulations of prepaid accounts and proposed amendments to its regulations implementing the Home Mortgage Disclosure Act. We cannot predict the terms of all of the final regulations, their intended consequences or how such regulations will affect us or our industry.
The Dodd-Frank Act does not preventpermits states from adoptingto adopt stricter consumer protection standards.laws and standards that are more stringent than those adopted at the federal level and, in certain circumstances, permits state attorneys general to enforce compliance with both the state and federal laws and regulations. State regulation of financial products and potential enforcement actions could also adversely affect our business, financial condition or results of operations.
Moreover, retail activities of banks are subject to a variety of statutes and regulations designed to protect consumers. Interest and other charges collected or contracted for by banks are subject to state usury laws and federal laws concerning interest rates. Loan operations are also subject to federal laws applicable to credit transactions, such as:
the federal Truth-In-Lending Act and Regulation Z issued by the CFPB, governing disclosures of credit terms to consumer borrowers;
the Home Mortgage Disclosure Act and Regulation C issued by the CFPB, requiring financial institutions to provide information to enable the public and public officials to determine whether a financial institution is fulfilling its obligation to help meet the housing needs of the community it serves;
the Equal Credit Opportunity Act and Regulation B issued by the CFPB, prohibiting discrimination on the basis of various prohibited factors in extending credit;
the Fair Debt Collection Act, governing the manner in which consumer debts may be collected by collection agencies; and
the Service Members Civil Relief Act, applying to all debts incurred prior to commencement of active military service (including credit card and other open-end debt) and limiting the amount of interest, including service and renewal charges and any other fees or charges (other than bona fide insurance) that is related to the obligation or liability.
Deposit operations also are subject to, among others:
the Truth in Savings Act and Regulation DD issued by the CFPB, which require disclosure of deposit terms to consumers;
the Expected Funds Availability Act and Regulation CC issued by the Federal Reserve Board, which relates to the availability of deposit funds to consumers;
the Right to Financial Privacy Act, which imposes a duty to maintain the confidentiality of consumer financial records and prescribes procedures for complying with administrative subpoenas of financial records; and
CITIZENS FINANCIAL GROUP, INC.
the Electronic Funds Transfer Act and Regulation E issued by the CFPB, which governs automatic deposits to and withdrawals from deposit accounts and consumer rights and liabilities arising from the use of automated teller machines and other electronic banking services.
In addition to these federal laws and regulations, the guidance and interpretations of the various federal agencies charged with the responsibility of implementing such regulations also influences loan and deposit operations.
The CFPB has finalized a number of significant rules which will impact nearly every aspect of the life cycle of a residential mortgage. The final rules require banks to, among other things: (i) develop and implement procedures to ensure compliance with a new “ability to repay” standard and identify whether a loan meets a new definition for a “qualified mortgage;” (ii) implement new or revised disclosures, policies and procedures for servicing mortgages including, but not limited to, early intervention with delinquent borrowers and specific loss mitigation procedures for loans secured by a borrower’s principal residence; (iii) comply with additional restrictions on mortgage loan originator compensation; and (iv) comply with new disclosure requirements and standards for appraisals and escrow accounts maintained for “higher priced mortgage loans.” These new rules create operational and strategic challenges for us, as we are both a mortgage originator and a servicer. Additional rulemaking affecting the residential mortgage business is also expected. These rules and any other new regulatory requirements promulgated by the CFPB and other federal or state regulators could require changes to our business, result in increased compliance costs and affect the streams of revenue of such business.
In addition, our two banking subsidiaries are currently subject to consent orders issued by the OCC and the FDIC in connection with their findings of deceptive marketing and implementation of some of our checking account and funds transfer products and services. Among other things, the consent orders require us to remedy deficiencies and develop stronger compliance controls, policies and procedures. We have made progress and continue to make progress in addressing these requirements, but the consent orders remain in place and we are unable to predict when they may be terminated.
CITIZENS FINANCIAL GROUP, INC.
BUSINESS
Commercial Real Estate Lending
Lending operations that involve concentrations of commercial real estate loans are subject to enhanced scrutiny by federal banking regulators. Regulators have advised financial institutions of the risks posed by commercial real estate lending concentrations. Such loans generally include land development, construction loans and loans secured by multifamily property and nonfarm, nonresidential real property where the primary source of repayment is derived from rental income associated with the property. The relevant regulatory guidance prescribes the following guidelines for examiners to help identify institutions that are potentially exposed to concentration risk and may warrant greater supervisory scrutiny:
totalTotal reported loans for construction, land development and other land represent 100% or more of the institution’s total capital, or
totalTotal commercial real estate loans represent 300% or more of the institution’s total capital, and the outstanding balance of the institution’s commercial real estate loan portfolio has increased by 50% or more during the prior 36 months.
In 2009, the federal banking regulators issued additional guidance on commercial real estate lending that emphasizes these considerations.
In addition, the Dodd-Frank Act contains provisions that may cause us to reduce the amount of our commercial real estate lending and increasingincrease the cost of borrowing, including rules relating to risk retention of securitized assets. Section 941 of the Dodd-Frank Act requires, among other things, a loan originator or a securitizer of asset-backed securities to retain a percentage of the credit risk of securitized assets. The banking agencies and other federal agencies have jointly promulgated a final rule to implement these requirements.
Transactions with Affiliates and Insiders
A variety of legal limitations restrict us from lending money to, borrowing money from, or in some cases transacting business with CBNA and CBPA. Among such restrictions to which we are subject are Sections 23A and 23B of the Federal Reserve Act and Federal Reserve BoardFRB Regulation W. Section 23A places limits on certain specified “covered transactions,” which include loans or extensions of credit to, investments in or certain other transactions with affiliates, as well as the amount of advances to third parties collateralized by the securities or obligations of affiliates. The aggregate of all covered transactions is limited to 10% of a bank’s capital and surplus for any one affiliate and 20% for all affiliates. Furthermore, within the foregoing limitations as to amount, certain covered transactions must meet specified collateral requirements ranging from 100% to 130%. Also, a bank is prohibited from purchasing low-quality assets from any of its affiliates. Section 608 of the Dodd-Frank Act broadens the definition of “covered transactions” to include derivative transactions and the borrowing or lending of securities if the transaction will cause a bank to have credit exposure to an affiliate. The revised definition also includes the acceptance of debt obligations of an affiliate as collateral for a loan or extension of credit to a third party. Furthermore, reverse repurchase transactions are viewed as extensions
CITIZENS FINANCIAL GROUP, INC.
of credit (instead of asset purchases) and thus become subject to collateral requirements. The Federal Reserve has not yet issued regulations to implement Section 608.
Section 23B prohibits an institution from engaging in certain transactions with affiliates unless the transactions are on terms substantially the same, or at least as favorable to the bank, as those prevailing at the time for comparable transactions with non-affiliated companies. Except for limitations on low-quality asset purchases and transactions that are deemed to be unsafe or unsound, Regulation W generally excludes affiliated depository institutions from treatment as affiliates. Transactions between a bank and any of its subsidiaries that are engaged in certain financial activities may be subject to the affiliated transaction limits. The Federal Reserve BoardFRB also may designate banking subsidiaries as affiliates.
Pursuant to Federal Reserve BoardFRB Regulation O, we are also subject to quantitative restrictions on extensions of credit to executive officers, directors, principal stockholders and their related interests. In general, such extensions of credit (i) may not exceed certain dollar limitations, (ii) must be made on substantially the same terms, including interest rates and collateral, as those prevailing at the time for comparable transactions with third parties and (iii) must not involve more than the normal risk of repayment or present other unfavorable features. Certain extensions of credit also require the approval of our Board.
Anti-Money Laundering;Laundering
The USA PATRIOT Act; OfficeAct, enacted in 2001 and renewed in 2006, substantially broadened the scope of Foreign Assets Control (“OFAC”)
U.S. anti-money laundering laws and regulations by imposing significant new compliance and due diligence obligations, creating new crimes and penalties and expanding the extra-territorial jurisdiction of the United States. Institutions must maintain anti-money laundering programs that include established internal policies, procedures and controls; a designated compliance officer; an ongoing employee training program; and testing of the program by an independent audit function. We are prohibited from entering into specified financial transactions and account relationships and must meet enhanced standards for due diligence in dealings with foreign financial institutions and foreign customers. We also must take reasonable steps to conduct enhanced scrutiny of account relationships to guard against money laundering and to report any suspicious transactions. Recent laws provide law enforcement authorities with increased access to financial information maintained by banks. Anti-money laundering obligations have been substantially strengthened as a result of the USA PATRIOT Act, enacted in 2001 and renewed in 2006. Bank regulators routinely examine institutions for compliance with these obligations and are required to consider compliance in connection with the regulatory review of applications.
CITIZENS FINANCIAL GROUP, INC.
BUSINESS
The USA PATRIOT Act also provides for the facilitation of information sharing among governmental entities and financial institutions for the purpose of combating terrorism and money laundering. The statute also creates enhanced information collection tools and enforcement mechanics for the U.S. government, including: (i) requiring standards for verifying customer identification at account opening; (ii) promulgating rules to promote cooperation among financial institutions, regulators and law enforcement entities in identifying parties that may be involved in terrorism or money laundering; (iii) requiring reports by non-financial trades and businesses filed with the Treasury’s Financial Crimes Enforcement Network for transactions exceeding $10,000; and (iv) mandating the filing of suspicious activities reports if a bank believes a customer may be violating U.S. laws and regulations. The statute also requires enhanced due diligence requirements for financial institutions that administer, maintain or manage private bank accounts or correspondent accounts for non-U.S. persons. Bank regulators routinely examine institutions for compliance with these obligations and are required to consider compliance in connection with the regulatory review of applications.
TheIn addition, the Federal Bureau of Investigation may send bank regulatory agencies lists of the names of persons suspected of involvement in terrorist activities. We can be requested to search our records for any relationships or transactions with persons on those lists and may be required to report any identified relationships or transactions. Furthermore,
Office of Foreign Assets Control Regulation
OFAC is responsible for helping to ensure that U.S. entities do not engage in transactions with certain prohibited parties, as defined by various Executive Orders and Acts of Congress. OFAC publishes, and routinely updates, lists of names of persons and organizations suspected of aiding, harboring or engaging in terrorist acts, including the Specially Designated Nationals and Blocked Persons. We are responsible for, among other things, blocking accounts of, and transactions with, such targets and countries, prohibiting unlicensed trade and financial transactions with them and reporting blocked transactions after their occurrence. If we find a name on any transaction, account or wire transfer that is on an OFAC list, we must freeze such account, file a suspicious activity report and notify the appropriate authorities. Failure to comply with these sanctions could have serious legal and reputational consequences.
Other Regulatory Matters
We and our subsidiaries and affiliates are subject to numerous examinations by federal and state banking regulators, as well as the SEC, the Financial Industry Regulation Authority (“FINRA”)FINRA and various state insurance and securities regulators. In some cases, regulatory agencies may take supervisory actions that may not be publicly disclosed, and such actions may restrict or limit our activities or activities of our subsidiaries. As part of our regular examination process, our and our banking subsidiaries’ respective regulators may advise us or our banking subsidiaries to operate under various restrictions as a prudential matter. We and our subsidiaries have from time to time received requests for information from regulatory authorities at the federal and state level, including from state insurance commissions, state attorneys general, federal agencies or law enforcement authorities, securities regulators and other regulatory authorities, concerning their business practices. Such requests are considered incidental to the normal conduct of business.
In order to remedy certain weaknesses, including the weaknesses cited by the Federal Reserve BoardFRB in relation to our capital planning processes and the weaknesses we are working to remedy pursuant to the OCC and FDIC consent orders, and meet
CITIZENS FINANCIAL GROUP, INC.
our significant regulatory and supervisory challenges, we believe we need to make substantial improvements to our processes, systems and controls. See Note 1617 “Commitments and Contingencies” to our audited Consolidated Financial Statements in Part II, Item 8 — Financial Statements and Supplementary Data, included elsewhere in this report. We expect to continue to dedicate significant resources and managerial time and attention and to make significant investments in enhanced processes, systems and controls. This in turn may increase our operational costs and limit our ability to implement aspects of our strategic plan or otherwise pursue certain business opportunities. We also expect to make restitution payments to our banking subsidiaries'subsidiaries’ customers, which could be significant, arising from certain customer compliance deficiencies and may be required to pay civil money penalties in connection with certain of these deficiencies. We have established reserves in respect of these future payments, but the amounts that we are ultimately obligated to pay could be in excess of our reserves. Moreover, if we are unsuccessful in remedying these weaknesses and meeting the enhanced supervisory requirements and expectations that apply to us and our banking subsidiaries, we could remain subject to existing restrictions or become subject to additional restrictions on our activities, supervisory actions or public enforcement actions, including the payment of civil money penalties.
Employees
As of December 31, 2014,2015, we had approximately 17,700 FTEs, which included the full-time equivalent of our approximately 17,07017,100 full-time employees, 625colleagues, 300 part-time employeescolleagues and approximately 615300 positions filled by temporary employees. None of our employees are parties to a collective bargaining agreement. We consider our relationship with our employees to be good and have not experienced interruptions of operations due to labor disagreements.
CITIZENS FINANCIAL GROUP, INC.
RISK FACTORS
ITEM 1A. RISK FACTORS
We are subject to a number of risks potentially impacting our business, financial condition, results of operations and cash flows. As a financial services organization, certain elements of risk are inherent in our transactions and operations and are present in the business decisions we make. We, therefore, encounter risk as part of the normal course of our business and we design risk management processes to help manage these risks. Our success is dependent on our ability to identify, understand and manage the risks presented by our business activities so that we can appropriately balance revenue generation and profitability. These risks include, but are not limited to, credit risk, market risk, liquidity risk, operational risk, model risk, technology, regulatory and legal risk and strategic and reputational risk. We discuss our principal risk management processes and, in appropriate places, related historical performance in “Management'sthe “Management’s Discussion and Analysis of Financial Condition and Results of Operations — Risk Governance” includedsection in Part II, Item 7 of this report.
TheYou should carefully consider the following discussion sets forth some of the more important risk factors that could materiallymay affect our business, financial condition and results of operations. Other factors that could affect our business, financial condition and results of operation are discussed in the “Forward-Looking Statements” section above. However, there may be additional risks that are not presently material or known, and factors besides those discussed below, or elsewhere in this or other reports that we file or furnish with the SEC, that could also adversely affect us.
Risks Related to Our Business
We may not be able to successfully execute our strategic plan or achieve our performance targets.
Our strategic plan, which we began to implement in the second half of 2013, involves four principal elements: (a)(i) increasing revenue in both Consumer Banking and Commercial Banking; (b)(ii) enhancing cost reduction efforts across the company; (c) leveraging(iii) taking capital actions aimed at better aligning our capital structure with those of regional bank peers; and (d)(iv) the beneficial impact of a rising interest rate environment on our asset-sensitive balance sheet. Our future success and the value of our stock will depend, in part, on our ability to effectively implement our strategic plan. There are risks and uncertainties, many of which are not within our control, associated with each element of our plan discussed further below.
plan. In addition, certain of our key initiatives require regulatory approval, which may not be obtained on a timely basis, if at all. Moreover, even if we do obtain required regulatory approval, it may be conditioned on certain organizational changes, such as those discussed below, that could reduce the profitability of those initiatives.
Revenue Generation Component of Strategic Plan, Assumptions and Associated Risks. Our plans to increase revenue involve reallocating resources toward businesses that will further increase and diversify our revenue base, including by prudently growing higher-return earning assets, identifying and capitalizing on more fee income opportunities and selectively expanding our balance sheet through increased loan origination volume principally in mortgage, small business and auto. Our revenue growth plans If we are based on a number of assumptions, many of which involve factors that are outside our control. Our key assumptions include:
that we will be able to attract and retain the requisite number of skilled and qualified personnel required to increase our loan origination volume in mortgage, business banking, auto, wealth, mid-corporate and specialty verticals. The marketplace for skilled personnel is competitive, which means hiring, training and retaining skilled personnel is costly and challenging and we may not be able to increase the number of our loan professionals sufficiently to achieve our loan origination targets successfully;
that we will be able to grow higher-return earning assets with acceptable risk performance and increase fee income in part by means of increased management discipline, industry focus, expansion of target markets, focus on higher-return yielding assets and increased origination efforts;
that we will be able to successfully identify and purchase high-quality interest-earning assets that perform over time in accordance with our projected models;
that we will be able to fund asset growth by growing deposits with our cost of funds increasing at a rate consistent with our expectations;
that our expansion into specialized industries, as well as our efforts to expand nationally in the mid-corporate space, will not materially alter our risk profile from existing business operations in ways that our existing risk models cannot effectively or accurately model;
CITIZENS FINANCIAL GROUP, INC.
RISK FACTORS
that there will be no material change in competitive dynamics, including as a result of our seeking to increase market share and enter into new markets (as discussed below, we operate in a highly competitive industry and any change in our ability to retain deposits or attract new customers in line with our current expectations would adversely affect our ability to grow our revenue);
that the foot traffic in our branches, on which certain sales and marketing efforts are focused, does not significantly decrease more than expected as a result of technological advances or otherwise; and
that software we have recently licensed and implemented throughout our business, including an automated loan origination platform, will function consistent with our expectations.
If one or more of our assumptions prove incorrect, we may not be able to successfully execute our strategic plan, we may never achieve our indicative performance targets and any shortfall may be material.
Cost Savings and Efficiency Component of Strategic Plan and Associated Risks. In order for us to execute our strategic plan successfully, we must continue to pursue a number of cost reduction and efficiency improvement initiatives, including streamlining processes, reducing redundancy and improving cost structures, which we believe will allow us to reduce overall expenses. There may be unanticipated difficulties in implementing our efficiency initiatives, and while we achieved our targeted cost savings for 2014, there can be no assurance that we will fully realize our target expense reductions, or be able to sustain any annual cost savings achieved by our efficiency initiative. Reducing costs may prove difficult in light of our efforts to continue to establish and maintain our stand-alone operational and infrastructural capabilities as a banking institution fully separate from RBS Group, including our rebranding efforts associated with our separation from RBS Group. Reducing our structural costs also may be difficult as a result of our efforts to continue to invest in technology and people in order to make further organizational improvements in risk management and various other policies and procedures in order to comply with increased guidance, new regulations and requirements imposed by our regulators. In addition, any significant unanticipated or unusual charges, provisions or impairments, including as a result of any ongoing legal and regulatory proceedings or industry regulatory changes, would adversely affect our ability to reduce our cost structure in any particular period. If we are unable to reduce our cost structure as we anticipate, we may not be able to successfully execute our strategic plan, we may never achieve our indicative performance targets and any shortfall may be material.
Reduction of Our Common Equity Tier 1 Ratio. Our strategic plan requires us to complete capital initiatives that would result in a lower overall CET1 ratio. Because our capital structure is subject to extensive regulatory scrutiny, including under the Federal Reserve Board’s CCAR process, and because CET1 is used in calculating risk-based capital ratios, we may not be able to consummate the capital initiatives required to bring our CET1 ratio in line with our expectations. This could prevent us from achieving our ROTCE targets. For more information about risks relating to our ability to obtain the requisite approval from the Federal Reserve Board, see “—Supervisory requirements and expectations on us as a financial holding company and a bank holding company, our need to make improvements and devote resources to various aspects of our controls, processes, policies and procedures, and any regulator-imposed limits on our activities, could limit our ability to implement our strategic plan, expand our business, improve our financial performance and make capital distributions to our stockholders.”
Rising Interest Rate Environment. Our earnings are dependent to a large extent on our net interest income, which is interest income and fees earned on loans and investments, less interest paid on deposits and other borrowings. Net interest income growth has been challenged by the relatively persistent low interest rate environment, which continued through 2014 and is continuing into 2015. Our strategic plan includes assumptions about rising interest rates in the coming periods. However, interest rates are highly sensitive to numerous factors which are beyond the control of our management, and they have not, in recent periods, increased in line with our expectations. If the current low interest rate environment were to continue or if interest rates do not rise as much or as quickly as we expect, then we may not be able to achieve our ROTCE or other targets. For further information about our interest rate sensitivity, see “Management’s Discussion and Analysis of Financial Condition and Results of Operations — Risk Governance and Market Risk” in Part II, Item 7 included elsewhere in this report.
In addition to the four principal elements of our strategic plan, we also anticipate that our ROTCE will be affected by a number of additional factors. We anticipate a benefit to our ROTCE from runoffrun off of our non-core portfolio, and existing pay-fixed interest rate swaps, which we expect will be offset by the negative impact on our ROTCE of some deterioration in the credit environment as they return to historical levels and a decline in gains on investments in securities. We do not control many aspects of these factors (or others) and actual results could differ from our expectations materially, which could impair our ability to achieve our strategic ROTCE goals. See “Business Strategy” in Part I, Item 1 — Business, included elsewhere in this report for further information.
CITIZENS FINANCIAL GROUP, INC.
RISK FACTORS
Supervisory requirements and expectations on us as a financial holding company and a bank holding company, our need to make improvements and devote resources to various aspects of our controls, processes, policies and procedures, and any regulator-imposed limits on our activities could limit our ability to implement our strategic plan, expand our business, improve our financial performance and make capital distributions to our stockholders.
As a result of and in addition to new legislation aimed at regulatory reform, such as the Dodd-Frank Act, and the increased capital and liquidity requirements introduced by the U.S. implementation of the Basel III framework (the capital components of which have become effective), the federal banking agencies (the Federal Reserve Board,FRB, the OCC and the FDIC), as well as the CFPB, generally are taking a more stringent approach to supervising and regulating financial institutions and financial products and services over which they exercise their respective supervisory authorities. We, our two banking subsidiaries and our products and services are all subject to greater supervisory scrutiny and enhanced supervisory requirements and expectations and face significant challenges in meeting them. We expect to continue to face greater supervisory scrutiny and enhanced supervisory requirements in the foreseeable future.
Our two banking subsidiaries are currently subject to consent orders issued by the OCC and the FDIC in connection with their findings of deceptive marketing and implementation of some of our checking account and funds transfer products and services. Among other things, the consent orders require us to remedy deficiencies and develop stronger compliance controls, policies and procedures. We have made progress and continue to make progress in addressing these requirements, but the consent orders remain in place and we are unable to predict when they may be terminated. CBNA is also making improvements to its compliance management systems, fair lending compliance, risk management, deposit reconciliation practices and overdraft fees in order to address deficiencies in those areas. CBPA is making improvements to address deficiencies in its deposit reconciliation practices, overdraft fees, identity theft add-on products, third-party payment processor activities, oversight of third-party service providers, compliance program, policies, procedures and training, consumer complaints process and anti-money laundering controls. These efforts require us to make investments in additional resources and systems and also require a significant commitment of managerial time and attention.
In March 2014, the OCC communicated its determination that CBNA does not meet the condition—namely, that CBNA must be both well capitalized and well managed, as those terms are defined in applicable regulations, based on certain minimum capital ratios and supervisory ratings, respectively, necessary to own a financial subsidiary. A financial subsidiary is permitted to engage in a broader range of activities, similar to those of a financial holding company, than those permissible for a national bank itself. CBNA has two financial subsidiaries, Citizens Securities, Inc., a registered broker-dealer, and RBS Citizens Insurance Agency, Inc., a dormant entity, although it continues to collect commissions on certain outstanding insurance policies. CBNA has entered into an agreement with the OCC (the “OCC Agreement”) pursuant to which it must develop a remediation plan, which must be submitted to the OCC, setting forth the specific actions it will take to bring itself back into compliance with the condition to own a financial subsidiary and the schedule for achieving that objective. Until CBNA addresses the deficiencies to the OCC’s satisfaction, CBNA will be subject to restrictions on its ability to acquire control of or hold an interest in any new financial subsidiary and to commence new activities in any existing financial subsidiary, without the prior approval of the OCC. The OCC Agreement provides that if CBNA fails to remediate the deficiencies, it may have to divest itself of its financial subsidiaries and comply with any additional limitations or conditions on its conduct as the OCC may impose. CBNA has developed a plan to address the deficiencies and has implemented a comprehensive enterprise-wide program, through which, we believe, many deficiencies have been addressed.
In March 2014, the Federal Reserve Board objected on qualitative grounds to our capital plan submitted as part of the CCAR process. In its public report entitled “Comprehensive Capital Analysis and Review 2014: Assessment Framework and Results,” the Federal Reserve Board cited significant deficiencies in our capital planning processes, including inadequate governance, weak internal controls and deficiencies in our practices for estimating revenues and losses under a stress scenario and for ensuring the appropriateness of loss estimates across our business lines in a specific stress scenario. Although the Federal Reserve Board acknowledged that bank holding companies such as ours that are new to the CCAR process are subject to different expectations, our weaknesses were considered serious enough to warrant the Federal Reserve Board’s objection based on its qualitative assessment of our capital planning process. As a result, we are not permitted to increase our capital distributions above 2013 levels until a new capital plan is approved by the Federal Reserve Board. We submitted a new capital plan on January 5, 2015. We cannot assure you that the Federal Reserve Board will not object to that capital plan or that, even if it does not object to it, our planned capital distributions will not be significantly modified from 2013 levels.
We are also required to make improvements to our overall compliance and operational risk management programs and practices in order to comply with enhanced supervisory requirements and expectations and to address weaknesses in retail credit risk management, liquidity risk management, model risk management, outsourcing and vendor risk management and related oversight and monitoring practices and tools. Our and our banking subsidiaries’ consumer compliance program and controls also
CITIZENS FINANCIAL GROUP, INC.
RISK FACTORS
require improvement particularlyin a variety of areas, including with respect to deposit reconciliation processes, fair lending and mortgage servicing. In addition to all of the foregoing, as part of ourthe supevisory and our banking subsidiaries’ regular examination process, from time to time we and our banking subsidiaries may become, and currently are, subject to prudential restrictions on our activities. The restrictions that apply to CBNA are described above. Similarly, under the Bank Holding
CITIZENS FINANCIAL GROUP, INC.
RISK FACTORS
Company Act, currently we may not be able to engage in certain categories of new activities or acquire shares or control of other companies other than in connection with internal reorganizations.
In order to remedy these weaknesses and meet these regulatory and supervisory challenges,While we need to make substantial improvements tohave made significant progress in enhancing our compliance and risk management and other processes, systems and controls. We expect to continue to dedicate significant resources and managerial time and attention and to make significant investments in enhanced compliance, risk management and other processes, systems and controls. We also expect to make restitution payments to our banking subsidiaries’ customers, which could be significant, arising from certain of the consumer compliance deficiencies described above and may be required to pay civil money penalties in connection with certain of these deficiencies. We have established reserves in respect of these future payments, but the amounts that we are ultimately obligated to pay could be in excess of our reserves.
The remediation efforts and other matters described above will increase our operational costs and may limit our ability to implement aspects of our strategic plan or otherwise pursue certain business opportunities. Moreover,programs, if we are unsuccessful in remedying these weaknesses and meeting the enhanced supervisory requirements and expectations that apply to us and our banking subsidiaries, we could remain subject to existing restrictions or become subject to additional restrictions on our activities, informal (nonpublic) or formal (public) supervisory actions or public enforcement actions, including the payment of civil money penalties. Any such actions or restrictions, if and in whatever manner imposed, would likely increase our costs and could limit our ability to implement our strategic plans and expand our business, and as a result could have a material adverse effect on our business, financial condition or results of operations. For more information regarding ongoing regulatory actions in which we are involved and certain identified past practices and policies for which we faced formal administrative enforcement actions, see Note 17 “Commitments and Contingencies” and Note 21 “Regulatory Matters” to our audited Consolidated Financial Statements included in Part II, Item 8 — Financial Statements and Supplementary Data, included elsewhere in the report, for further discussion.
A continuation of the current low interest rate environment or subsequent movements in interest rates may have an adverse effect on our profitability.
Net interest income historically has been, and in the near-to-medium term we anticipate that it will remain a significant component of our total revenue. This is due to the fact that a high percentage of our assets and liabilities have been and will likely continue to be in the form of interest-bearing or interest-related instruments. Our net interest income was $3.3 billion for the year ended December 31, 2014 and $3.1 billion for the year ended December 31, 2013. Changes in interest rates can have a material effect on many areas of our business, including the following:
Netnet interest income, deposit costs, loan volume and delinquency, and value of our mortgage servicing rights. Interest Income. In recent years, it has been the policyrates are highly sensitive to many factors that are beyond our control, including general economic conditions and policies of various governmental and regulatory agencies and, in particular, the Federal Reserve BoardOpen Market Committee. Changes in monetary policy, including changes in interest rates, could influence not only the interest we receive on loans and securities and the U.S. Treasuryamount of interest we pay on deposits and borrowings, but such changes could also affect our ability to maintainoriginate loans and obtain deposits and the fair value of our financial assets and liabilities. If the interest rates on our interest-bearing liabilities increase at historically low levels through its targeted federal funds rate anda faster pace than the purchase of U.S. Treasury and mortgage-backed securities. As a result, yields on securities we have purchased, and marketinterest rates on the loans we have originated, have been at levels lower than were available prior to 2008. Consequently, the average yield on our interest-earninginterest earning assets, has decreased during the low interest rate environment. If a low interest rate environment persists, our net interest income and other financing income may further decrease. This would be the case becausedecline and, with it, a decline in our ability to lower our interest expense has been limited at these interest rate levels, while the average yield on our interest-earning assets has continued to decrease. Moreover, as interest rates begin to increase, if our floating rate interest-earning assets do not reprice faster than our interest-bearing liabilities in a rising rate environment, ourearnings may occur. Our net interest income couldand other financing income and our earnings would be adversely affected. If our net interest income decreases, this could have an adverse effect on our profitability.
Deposit Costs. As interest rates increase, our net interest margin would narrow if our cost of funding increases without a correlative increase in the interest we earn from loans and investments. Because we rely extensively on deposits to fund our operations, our cost of funding would increase if there is an increase in the interest rate we are required to pay our customers to retain their deposits. This could occur, for instance, if we are faced with competitive pressures to increase rates on deposits. In addition,similarly affected if the interest rates we are required to pay for other sources of funding (for example, inon our interest earning assets declined at a faster pace than the interbank or capital markets) increases, our cost of funding would increase. If any of the foregoing risks occurs, our net interest margin could narrow. Although our assets currently reprice faster than our liabilities (which would result in a benefit to net interest income as interest rates rise), the benefit from rising rates could be less than we assume, which may have an adverse effect on our profitability.
Loan Volume and Delinquency. Increases in interest rates may decrease customer demand for loans as the higher cost of obtaining credit may deter customers from seeking new loans. Further, higher interest rates might also lead to an increased number of delinquent loans and defaults, which would affect the value of our loans.
Value of Our Mortgage Servicing Rights. As a residential mortgage servicer, we have a portfolio of mortgage servicing rights (“MSRs”). MSRs are subject to interest rate risk in that their fair value will fluctuate as a result of changes in the interest rate environment. When interest rates fall, borrowers are generally more likely to prepay their mortgage loans by refinancing them
CITIZENS FINANCIAL GROUP, INC.
RISK FACTORS
at a lower rate. As the likelihood of prepayment increases, the fair value of MSRs can decrease. A decrease in the fair value below the carrying value of MSRs will reduce earnings in the period in which the decrease occurs.interest-bearing liabilities.
We cannot control or predict with certainty changes in interest rates. Global, national, regional and local economic conditions, competitive pressures and the policies of regulatory authorities, including monetary policies of the Federal Reserve Board,FRB, affect interest income and interest expense. Although we have policies and procedures designed to manage the risks associated with changes in market interest rates, as further discussed under “Management’s Discussion and Analysis of Financial Condition and Results of Operations — Risk Governance” in Part II, Item 7, included elsewhere in this report, changes in interest rates still may have an adverse effect on our profitability.
If our assumptions regarding borrower behavior are wrong or overall economic conditions are significantly different than we anticipate, then our risk mitigation may be insufficient to protect against interest rate risk and our net income would be adversely affected.
We could fail to attract, retain or motivate highly skilled and qualified personnel, including our senior management, other key employees or members of our Board, which could impair our ability to successfully execute our strategic plan and otherwise adversely affect our business.
A key cornerstone of our strategic plan involves the hiring of a large number of highly skilled and qualified personnel. Accordingly, our ability to implement our strategic plan and our future success depends on our ability to attract, retain and motivate highly skilled and qualified personnel, including our senior management and other key employees and directors, competitivelycompetitive with our peers. The marketplace for skilled personnel is becoming more competitive, which means the cost of hiring, incentivizing and retaining skilled personnel may continue to increase. The failure to attract or retain, including as a result of an untimely death or illness of key personnel, or replace a sufficient number of appropriately skilled and key personnel could place us at a significant competitive disadvantage and prevent us from successfully implementing our strategy, which could impair our ability to implement our strategic plan successfully, achieve our performance targets and otherwise have a material adverse effect on our business, financial condition and results of operations.
Governmental scrutiny with respect to matters relating to compensation and other business practices in the financial services industry has increased dramatically in the past several years and has resulted in more aggressive and intense regulatory supervision and the application and enforcement of more stringent standards. For example, in June 2010, the Federal Reserve Board and other federal banking regulators jointly issued comprehensive final guidance designed to ensure that incentive compensation policies do not undermine the safety and soundness of banking organizations by encouraging employees to take imprudent risks. The recent financial crisis and the current political and public sentiment regarding financial institutions has resulted in a significant amount of adverse press coverage, as well as adverse statements or charges by regulators and elected officials. Future legislation or regulation or government views on compensation may result in us altering compensation practices in ways that could adversely affect our ability to attract and retain talented employees.
In addition to complying with U.S. laws relating to compensation, we are also required to comply with certain United Kingdom (“UK”) and European Union (“EU”) remuneration requirements for so long as the UK Prudential Regulation Authority (“PRA”) considers RBS Group to control us. As a result of the implementation of the EU Capital Requirements Directive IV (“CRD IV”), certain of our most senior employees, including our CEO, may not receive variable compensation in excess of 100% of fixed compensation (up to 200% with shareholder approval) starting with performance year 2014. Because shareholder approval was not sought by RBS, a 100% limitation applied for 2014 and will continue to apply until CRD IV no longer applies to us. We intend to maintain competitive total compensation levels for affected employees, although it is possible that the structure of our compensation packages may not be considered in line with our peers.
Our ability to meet our obligations, and the cost of funds to do so, depend on our ability to access sources of liquidity and the particular sources available to us.
Liquidity risk is the risk that we will not be able to meet our obligations, including funding commitments, as they come due. This risk is inherent in our operations and can be heightened by a number of factors, including an over-reliance on a particular source of funding (including, for example, short-term and overnight funding)secured FHLB advances), changes in credit ratings or market-wide phenomena such
CITIZENS FINANCIAL GROUP, INC.
RISK FACTORS
as market dislocation and major disasters. Like many banking groups, our reliance on customer deposits to meet a considerable portion of our funding has grown over recent years, and we continue to seek to increase the proportion of our funding represented by customer deposits. However, these deposits are subject to fluctuation due to certain factors outside our control, such as a loss of confidence by customers in us or in the banking sector generally, increasing competitive pressures for retail or corporate customer deposits, changes in interest rates and returns on other investment classes, which could result in a significant outflow of deposits
CITIZENS FINANCIAL GROUP, INC.
RISK FACTORS
within a short period of time. To the extent that there is heavy competition among U.S. banks for retail customer deposits, this competition may increase the cost of procuring new deposits and/or retaining existing deposits, and otherwise negatively affect our ability to grow our deposit base. An inability to grow, or any material decrease in, our deposits could have a material adverse effect on our ability to satisfy our liquidity needs.
In addition, volatility in the interbank funding market can negatively affect our ability to fund our operations. For example, funding in the interbank markets, a traditional source of unsecured short-term funding, was severely disrupted throughout the global economic and financial crisis. If market disruption or significant volatility returns to the interbank or wholesale funding market, our ability to access liquidity in these funding markets could be materially impaired. Additionally, other factors outside our control, such as an operational problem that affects third parties, could impair our ability to access market liquidity or create an unforeseen outflow of cash or deposits. Our inability to access adequate funding, whether from bank deposits, the interbank funding market or the broader capital markets, would constrain our ability to make new loans, to meet our existing lending commitments and ultimately jeopardize our overall liquidity and capitalization.
Maintaining a diverse and appropriate funding strategy for our assets consistent with our wider strategic risk appetite and plan remains challenging, and any tightening of credit markets could have a material adverse impact on us. In particular, there is a risk that corporate and financial institution counterparties may seek to reduce their credit exposures to banks and other financial institutions (for example, reflected in reductions in unsecured deposits supplied by these counterparties), which may cause funding from these sources to no longer be available. Under these circumstances, we may need to seek funds from alternative sources, potentially at higher costs than has previously been the case, or may be required to consider disposals of other assets not previously identified for disposal, in order to reduce our funding commitments.
A reduction in our credit ratings, which are based on a number of factors, including the credit ratings of RBS or other members of RBS Group, could have a material adverse effect on our business, financial condition and results of operations.
Credit ratings affect the cost and other terms upon which we are able to obtain funding. Rating agencies regularly evaluate us, and their ratings are based on a number of factors, including our financial strength. Other factors considered by rating agencies include the financial strength of, and other factors relating to, RBS and RBS Group, as well as conditions affecting the financial services industry generally. Any downgrade in our ratings would likely increase our borrowing costs, could limit our access to capital markets, and otherwise adversely affect our business. For example, a ratings downgrade could adversely affect our ability to sell or market in the capital markets certain of our securities, including long-term debt, engage in certain longer-term and derivatives transactions and retain our customers, particularly corporate customers who needmay require a minimum rating threshold in order to place funds with us. In addition, under the terms of certain of our derivatives contracts, we may be required to maintain a minimum credit rating or have to post additional collateral or terminate such contracts. Any of these results of a rating downgrade could increase our cost of funding, reduce our liquidity and have adverse effects on our business, financial condition and results of operations.
Any downgrade in the credit rating of RBS or other members of RBS Group may negatively impact the rating agencies’ evaluation of us and our business which could ultimately result in a downgrade of our credit ratings. The credit ratings of RBS and other members of RBS Group, along with a number of other European financial institutions, were downgraded during the course of the last four years as part of the rating agencies’ rating methodology changes, review of systemic support assumptions incorporated into bank ratings and the likelihood, in the case of banks located in the United Kingdom, that the UK government is more likely in the future to make greater use of its regulatory tools to allow burden sharing among bank creditors. Rating agencies continue to evaluate the rating methodologies applicable to European financial institutions, including RBS and other members of RBS Group, and any change in such methodologies could ultimately affect our credit ratings. Separately, adverse changes in the credit ratings of the United Kingdom could adversely affect the credit ratings of RBS or other members of RBS Group which may ultimately have an adverse impact on our credit ratings.
On November 29, 2011, Standard & Poor’s lowered its long-term debt rating of RBS to A- and, at the same time, lowered our long-term debt rating to A. On June 22, 2012, Moody’s downgraded the long-term bank deposit rating of our banking subsidiaries to A3 following its downgrade of RBS on June 21, 2012. On November 11, 2013, Standard & Poor’s lowered its ratings on 20 of CBNA’s letter of credit-backed U.S. public finance issues. This action followed Standard & Poor’s’ November 7, 2013 downgrade of the long-term debt of RBS to BBB+ and its simultaneous lowering of our long-term debt rating to BBB+. On November 3, 2013, Fitch downgraded our long-term debt rating to BBB+ following RBS’s announcement of its intention to fully divest us by 2016. On August 21, 2014, Fitch affirmed our long-term debt rating of BBB+, and on December 3, 2014, Fitch rated CBNA’s subordinated debt as BBB. Although Moody’s confirmed the long-term bank deposit rating of our banking subsidiaries on March 13, 2014, its ratings outlook is negative. On May 7, 2014, Standard & Poor’s lowered our stand-alone credit profile to A- from A. On February 3, 2015, Standard & Poor's lowered its long-term debt rating of RBS from BBB+ to BBB- and lowered its short-term
CITIZENS FINANCIAL GROUP, INC.
RISK FACTORS
debt rating of RBS from A-2 to A-3. At the same time, Standard & Poor's affirmed its issuer ratings of both CFG (BBB+/A-2) and CBNA (A-/A-2), while its ratings outlook for both entities remained negative. These ratings could be further downgraded as a result of a number of factors, such as our financial strength and economic conditions generally. Under current rating methodologies, the ratings could also be further downgraded due to RBS’s continued ownership interest in us, reflecting the potential adverse effects of challenges faced by RBS Group, including uncertainty around political developments in the United Kingdom and Europe, or in connection with our separation from RBS Group, if the rating agencies perceive that we would not benefit from the support of RBS Group. Any further reductions in our credit ratings or those of our banking subsidiaries could adversely affect our access to liquidity, our competitive position, increase our funding costs or otherwise have a material adverse effect on our business, financial condition and results of operations.
We are subject to certain risks related to originating and selling mortgages and we may be required to repurchase mortgage loans or indemnify mortgage loan purchasers, which could adversely impact our business, financial condition and results of operations.
We originate and often sell mortgage loans. When we sell mortgage loans, whether as whole loans or pursuant to a securitization, we are required to make customary representations and warranties to the purchaser about the mortgage loans and the manner in which they were originated. Our loan sale agreements require us to repurchase or substitute mortgage loans in the event of certain breaches of these representations or warranties. In addition, we may be required to repurchase mortgage loans as a result of borrower fraud or in the event of early payment default of the borrower on a mortgage loan. Likewise, we are required to repurchase or substitute mortgage loans if we breach certain representations or warranties in connection with our securitizations, whether or not we were the originator of the loan. While in many cases we may have a remedy available against certain parties, often these may not be as broad as the remedies available to a purchaser of mortgage loans against us, and we face the further risk that such parties may not have the financial capacity to satisfy remedies that may be available to us. Therefore, if a purchaser enforces its remedies against us, we may not be able to recover our losses from third parties. We have received repurchase and indemnity demands from purchasers in the past, which have resulted in an increase in the amount of losses for repurchases. In particular, between the start of 2009 and December 31, 2014, we received approximately $158 million in repurchase demands and $99 million in indemnification payment requests in respect of loans originated, for the most part, since 2003. Of those claims presented, $88 million was paid to repurchase residential mortgages and $33 million was incurred for indemnification costs to make investors whole. We repurchased mortgage loans totaling $25 million and $35 million for the years ended December 31, 2014 and 2013, respectively. We incurred indemnification costs of $8 million and $12 million for the years ended December 31, 2014 and 2013, respectively. We responded to subpoenas issued by the Office of the Inspector General for the Federal Housing Authority Agency in December 2013 which requested information about loans sold to The Federal National Mortgage Association and The Federal Home Loan Mortgage Corporation from 2003 to 2011. We cannot estimate what the future level of repurchase demands will be or our ultimate exposure, and cannot give any assurance that the historical experience will or will not continue in the future. The volume of repurchase demands may increase, which could have a material adverse effect on our business, financial condition and results of operations.
We face risks as a servicer of loans. We may be terminated as a servicer or master servicer, be required to repurchase a mortgage loan or reimburse investors for credit losses on a mortgage loan, or incur costs, liabilities, fines and other sanctions if we fail to satisfy our servicing obligations, including our obligations with respect to mortgage loan foreclosure actions.
We act as servicer or master servicer for mortgage loans included in securitizations and for unsecuritized mortgage loans owned by investors. As a servicer or master servicer for those loans, we have certain contractual obligations to the securitization trusts, investors or other third parties, including, in our capacity as a servicer, foreclosing on defaulted mortgage loans or, to the extent consistent with the applicable securitization or other investor agreement, considering alternatives to foreclosure (such as loan modifications, short sales and deed-in-lieu of foreclosures), and, in our capacity as a master servicer, overseeing the servicing of mortgage loans by the servicer. Generally, our servicing obligations as a servicer or master servicer described above are set by contract, for which we receive a contractual fee. However, the costs to perform contracted-for services have been increasing, which reduces our profitability. In addition, we serve as a servicer for government sponsored enterprises (“GSEs”) under servicing guides. The GSEs can amend their servicing guides, which can increase the scope or costs of the services we are required to perform without any corresponding increase in our servicing fee. Further, the CFPB has issued two regulations that amended the mortgage servicing provisions of Regulation Z and Regulation X, which became effective on January 10, 2014 and which may further increase the scope and costs of services we are required to perform, including as it relates to servicing loans that we own. In addition, there has been a significant increase in state laws that impose additional servicing requirements that increase the scope and cost of our servicing obligations.
CITIZENS FINANCIAL GROUP, INC.
RISK FACTORS
If we commit a material breach of our obligations as servicer or master servicer, we may be subject to termination if the breach is not cured within a specified period of time following notice, which can generally be given by the securitization trustee or a specified percentage of security holders, causing us to lose servicing income. In addition, we may be required to indemnify the securitization trustee against losses from any failure by us, as a servicer or master servicer, to perform our servicing obligations or any act or omission on our part that involves willful misfeasance, bad faith or gross negligence. For certain investors and/or certain transactions, we may be contractually obligated to repurchase a mortgage loan or reimburse the investor for credit losses incurred on the loan as a remedy for servicing errors with respect to the loan. If we experience increased repurchase obligations because of claims that we did not satisfy our obligations as a servicer or master servicer, or increased loss severity on such repurchases, we may have to materially increase our repurchase reserve.
We rely on the mortgage secondary market and GSEs for some of our liquidity.
We sell some of the mortgage loans we originate to reduce our credit risk and to provide funding for additional loans. We rely on GSEs to purchase loans that meet their conforming loan requirements. Strategically, we may originate and hold nonconforming loans on-balance sheet for investment purposes, or from time to time, we will rely on other capital markets investors to purchase nonconforming loans (i.e., loans that do not meet GSE requirements). A viable, consistent outlet for nonconforming loans continues to be a challenge that has impacted the liquidity in this space. Retaining nonconforming loans on balance sheet is a trend that continues. When we retain a loan not only do we keep the credit risk of the loan but we also do not receive any sale proceeds that could be used to generate new loans. However, we receive net interest margin as our income stream as loan payments are received on a monthly basis in lieu of sale proceeds. Depending on balance sheet capacity, a persistent lack of liquidity could limit our ability to fund and thus originate new mortgage loans, reducing the fees we earn from originating and servicing loans. In addition, we cannot provide assurance that GSEs will not materially limit their purchases of conforming loans due to capital constraints or change their criteria for conforming loans (e.g., maximum loan amount or borrower eligibility). We note that proposals have been presented to reform the housing finance market in the United States, including the role of the GSEs in the housing finance market. The extent and timing of any such regulatory reform regarding the housing finance market and the GSEs, as well as any effect on our business and financial results, are uncertain.
We are subject to increased risk of credit losses associated with HELOCs originated prior to the global financial and economic crisis.
During the years prior to the global financial and economic crisis, financial institutions, including us, originated a significant number of HELOCs. The terms of HELOCs generally provided for the deferral of borrowers’ obligations to begin to repay principal until a specified future date. As of December 31, 2014, approximately 29% of our $16.0 billion HELOC portfolio, or $4.6 billion in drawn balances, and $3.8 billion in undrawn balances, were subject to a payment reset or balloon payment between January 1, 2015 and December 31, 2017, including $245 million in balloon balances where full payment is due at the end of a ten-year interest-only draw period. Although we launched a program in September 2013 to manage the exposure by providing heightened outreach to borrowers, there remains a risk of increased credit losses as borrowers become obligated to make principal and interest payments. For further information regarding the expected HELOC payment shock, see “Management’s Discussion and Analysis of Financial Condition and Results of Operations — Key Factors Affecting Our Business — HELOC Payment Shock” in Part II, Item 7, included elsewhere in this report.
Our financial performance may be adversely affected by deterioration in borrower credit quality, particularly in the New England, Mid-Atlantic and Midwest regions, where our operations are concentrated.
We have exposure to many different industries and risks arising from actual or perceived changes in credit quality and uncertainty over the recoverability of amounts due from borrowers is inherent in our businesses. Our exposure may be exacerbated by the geographic concentration of our operations, which are predominately located in the New England, Mid-Atlantic and Midwest regions. The credit quality of our borrowers may deteriorate for a number of reasons that are outside our control, including as a result of prevailing economic and market conditions and asset valuation. The trends and risks affecting borrower credit quality, particularly in the New England, Mid-Atlantic and Midwest regions, have caused, and in the future may cause, us to experience impairment charges, increased repurchase demands, higher costs, additional write-downs and losses and an inability to engage in routine funding transactions, which could have a material adverse effect on our business, financial condition and results of operations.
CITIZENS FINANCIAL GROUP, INC.
RISK FACTORS
Our framework for managing risks may not be effective in mitigating risk and loss and our use of models presents risks to our risk management framework.loss.
Our risk management framework is made up of various processes and strategies to manage our risk exposure. The framework to manage risk, including the framework’s underlying assumptions, may not be effective under all conditions and circumstances. If the risk management framework proves ineffective, we could suffer unexpected losses and could be materially adversely affected.
One of the main types of risks inherent in our business is credit risk. An important feature of our credit risk management system is to employ an internal credit risk control system through which we identify, measure, monitor and mitigate existing and emerging credit risk of our customers. As this process involves detailed analyses of the customer or credit risk, taking into account both quantitative and qualitative factors, it is subject to human error. In exercising their judgment, our employees may not always be able to assign an accurate credit rating to a customer or credit risk, which may result in our exposure to higher credit risks than indicated by our risk rating system.
In addition, we have undertaken a strategic initiativecertain actions to enhance our credit policies and guidelines to address potential risks associated with particular industries or types of customers, as discussed in more detail under “Management’s Discussion and Analysis of Financial Condition and Results of Operations — Risk GovernanceGovernance” and “— Market Risk” in Part II, Item 7, included
CITIZENS FINANCIAL GROUP, INC.
RISK FACTORS
elsewhere in this report. However, we may not be able to effectively implement these initiatives, or consistently follow and refine our credit risk management system. If any of the foregoing were to occur, it may result in an increase in the level of nonperforming loans and a higher risk exposure for us, which could have a material adverse effect on us.
Our accounting estimates and risk management framework rely on analytical forecasting and models.
The processes we use to estimate our inherent loan losses and to measure the fair value of financial instruments, as well as the processes used to estimate the effects of changing interest rates and other market measures on our financial condition and results of operations, depends upon the use of analytical and forecasting models. Some of our tools and metrics for managing risk are based upon our use of observed historical market behavior. We rely on quantitative models to measure risks and to estimate certain financial values. Models may be used in such processes as determining the pricing of various products, grading loans and extending credit, measuring interest rate and other market risks, predicting losses, assessing capital adequacy and calculating regulatory capital levels, as well as estimating the value of financial instruments and balance sheet items. Poorly designed or implemented models present the risk that our business decisions based on information incorporating such models will be adversely affected due to the inadequacy of that information. Moreover, our models may fail to predict future risk exposures if the information used in the model is incorrect, obsolete or not sufficiently comparable to actual events as they occur. We seek to incorporate appropriate historical data in our models, but the range of market values and behaviors reflected in any period of historical data is not at all times predictive of future developments in any particular period and the period of data we incorporate into our models may turn out to be inappropriate for the future period being modeled. In such case, our ability to manage risk would be limited and our risk exposure and losses could be significantly greater than our models indicated. For example, we experienced certain technical issues relating to our market risk measurement processes when we began incorporating trade level detail for foreign exchange contracts in 2013. Despite rigorous pilot testing of our processes, during the initial phase of implementation our processes failed to incorporate certain positions we maintained to offset client exposure, which led to an immaterial overstatement of foreign exchange currency rate risk positions during 2013 compared to our position at year end. We have adjusted our processes and have experienced no further issues. In addition, if existing or potential customers believe our risk management is inadequate, they could take their business elsewhere. This could harm our reputation as well as our revenues and profits. Finally, information we provide to our regulators based on poorly designed or implemented models could also be inaccurate or misleading. Some of the decisions that our regulators make, including those related to capital distributions to our stockholders, could be affected adversely due to their perception that the quality of the models used to generate the relevant information is insufficient.
The preparation of our financial statements requires the use of estimates that may vary from actual results. Particularly, various factors may cause our allowance for loan and lease lossesALLL to increase.
The preparation of audited consolidated financial statements in conformity with accounting principles generally accepted in the United States of America (“GAAP”)GAAP requires management to make significant estimates that affect the financial statements. Our most critical accounting estimate is the allowance for loan and lease losses.ALLL. The allowance for loan and lease lossesALLL is a reserve established through a provision for loan and lease losses charged to expense and represents our estimate of incurred but unrealized losses within the existing portfolio of loans. The allowanceALLL is necessary to reserve for estimated loan and lease losses and risks inherent in the loan portfolio. The level of the allowanceALLL reflects our ongoing evaluation of industry concentrations, specific credit risks, loan and lease loss experience, current loan portfolio quality, present economic, political and regulatory conditions and incurred losses inherent in the current loan portfolio.
The determination of the appropriate level of the allowance for loan and lease lossesALLL inherently involves a degree of subjectivity and requires that we make significant estimates of current credit risks and future trends, all of which may undergo
CITIZENS FINANCIAL GROUP, INC.
RISK FACTORS
material changes. Changes in economic conditions affecting borrowers, the stagnation of certain economic indicators that we are more susceptible to, such as unemployment and real estate values, new information regarding existing loans, identification of additional problem loans and other factors, both within and outside our control, may require an increase in the allowance for loan and lease losses.ALLL. In addition, bank regulatory agencies periodically review our allowance for loan and lease lossesALLL and may require an increase in the allowance for loan and lease lossesALLL or the recognition of further loan charge-offs, based on judgments that can differ from those of our own management. In addition, if charge-offs in future periods exceed the allowance for loan and lease losses—ALLL—that is, if the allowance for loan and lease lossesALLL is inadequate—we will need additional loan and lease loss provisions to increase the allowance for loan and lease losses.ALLL. Should such additional provisions become necessary, they would result in a decrease in net income and capital and may have a material adverse effect on us.
We could also sustain credit losses that are significantly higher than the amountThe value of our allowance for loan and lease losses, and therefore have an adverse impact on earnings. Higher credit losses could arise for a variety of reasons. A severe downturngoodwill may decline in the economy would generate increased charge-offs andfuture.
As of December 31, 2015, we had $6.9 billion of goodwill. A significant decline in our expected future cash flows, a need for higher reserves. In particular, a severe decrease in housing prices or spike in unemployment would cause higher losses and a larger allowance for loan and lease losses, particularlysignificant adverse change in the residential real estate secured portfolios. Withinbusiness climate, substantially slower economic growth or a significant and sustained decline in the residential real estate portfolios, we have HELOCs forprice of our common stock, any or all of which could be materially impacted by many of the end of draw is happening overrisk factors discussed herein, may necessitate our taking charges in the next two years. If there is a spike in interest rates, these customers will not only have to deal with an increased or first time principal payment but also an increase in interest payments, potentially leading to larger losses and allowance for loan and lease losses. For more information about risksfuture related to HELOCs,the impairment of our goodwill. If we were to conclude that a future write-down of our goodwill is necessary, we would record the appropriate charge, which could be material to our operations. For additional information regarding our goodwill impairment testing, see “—We are subject to increased risk of credit losses associated with HELOCs originated prior to the global financial and economic crisis” and “Management’s Discussion and Analysis of Financial Condition and Results of Operations — Key Factors Affecting Our Business — HELOC Payment Shock”Critical Accounting Estimates” in Part II, Item 7, included elsewhere in this report. While we believe that our allowance for loan and lease losses was adequate on December 31, 2014, there is no assurance that it will be sufficient to cover all incurred loan and lease credit losses, particularly if economic conditions worsen. In the event of deterioration in economic conditions, we may be required to increase reserves in future periods, which would reduce our earnings.
The value of certain financial instruments recorded at fair value is determined using financial models incorporating assumptions, judgments and estimates that may change over time or may ultimately not turn out to be accurate.
Under GAAP, we recognize at fair value: (i) financial instruments classified as held for trading or designated at fair value through profit or loss; (ii) financial assets classified as available for sale (“AFS”); and (iii) derivatives. Generally, to establish the fair value of these instruments, we rely on quoted market prices. If such market prices are not available, we rely on internal valuation models that utilize observable market data and/or independent third-party pricing. For example, observable market data may not be available for certain individual financial instruments or classes of financial instruments, such as venture capital investments. In such circumstances, we utilize complex internal valuation models to establish fair value; these models require us to make assumptions, judgments and estimates regarding matters that are inherently uncertain. When practical, we supplement internal models using independent price verification in order to lessen the uncertainties in our models. These assumptions, judgments and estimates are periodically updated to reflect changing facts, trends and market conditions. The resulting change in the fair values of the financial instruments may have a material adverse effect on our earnings and financial condition.
Operational risks are inherent in our businesses.
Our operations depend on our ability to process a very large number of transactions efficiently and accurately while complying with applicable laws and regulations. Operational risk and losses can result from internal and external fraud; errors by employees or third parties; failure to document transactions properly or to obtain proper authorization; failure to comply with
CITIZENS FINANCIAL GROUP, INC.
RISK FACTORS
applicable regulatory requirements and conduct of business rules; equipment failures, including those caused by natural disasters or by electrical, telecommunications or other essential utility outages; business continuity and data security system failures, including those caused by computer viruses, cyber-attacks or unforeseen problems encountered while implementing major new computer systems or upgrades to existing systems; or the inadequacy or failure of systems and controls, including those of our suppliers or counterparties. Although we have implemented risk controls and loss mitigation actions, and substantial resources are devoted to developing efficient procedures, identifying and rectifying weaknesses in existing procedures and training staff, it is not possible to be certain that such actions have been or will be effective in controlling each of the operational risks faced by us. Any weakness in these systems or controls, or any breaches or alleged breaches of such laws or regulations, could result in increased regulatory supervision, enforcement actions and other disciplinary action, and have an adverse impact on our business, applicable authorizations and licenses, reputation and results of operations.
CITIZENS FINANCIAL GROUP, INC.
RISK FACTORS
The financial services industry, including the banking sector, is undergoing rapid technological changes as a result of competition and changes in the legal and regulatory framework, and we may not be able to compete effectively as a result of these changes.
The financial services industry, including the banking sector, is continually undergoing rapid technological change with frequent introductions of new technology-driven products and services. In addition, new, unexpected technological changes could have a disruptive effect on the way banks offer products and services. We believe our success depends, to a great extent, on our ability to use technology to offer products and services that provide convenience to customers and to create additional efficiencies in our operations. However, we may not be able to, among other things, keep up with the rapid pace of technological changes, effectively implement new technology-driven products and services or be successful in marketing these products and services to our customers. As a result, our ability to compete effectively to attract or retain new business may be impaired, and our business, financial condition or results of operations may be adversely affected.
In addition, changes in the legal and regulatory framework under which we operate require us to update our information systems to ensure compliance. Our need to review and evaluate the impact of ongoing rule proposals, final rules and implementation guidance from regulators further complicates the development and implementation of new information systems for our business. Also, recent regulatory guidance has focused on the need for financial institutions to perform increased due diligence and ongoing monitoring of third-party vendor relationships, thus increasing the scope of management involvement and decreasing the efficiency otherwise resulting from our relationships with third-party technology providers. Given the significant number of ongoing regulatory reform initiatives, it is possible that we incur higher than expected information technology costs in order to comply with current and impending regulations. See “—Supervisory requirements and expectations on us as a financial holding company and a bank holding company, our need to make improvements and devote resources to various aspects of our controls, processes, policies and procedures, and any regulator-imposed limits on our activities, could limit our ability to implement our strategic plan, expand our business, improve our financial performance and make capital distributions to our stockholders.”
Cyber-attacks, distributed denial of service attacks and other cyber-security matters, if successful, could adversely affect how we conduct our business.
We are under continuous threat of loss due to cyber-attacks, especially as we continue to expand customer capabilities to utilize the Internet and other remote channels to transact business. Two of the most significant cyber-attack risks that we face are e-fraud and loss of sensitive customer data. Loss from e-fraud occurs when cybercriminals extract funds directly from customers’ or our accounts using fraudulent schemes that may include Internet-based funds transfers. We have been subject to a number of e-fraud incidents historically. We have also been subject to attempts to steal sensitive customer data, such as account numbers and social security numbers, through unauthorized access to our computer systems including computer hacking. Such attacks are less frequent but could present significant reputational, legal and regulatory costs to us if successful.
Recently, there has been a series of distributed denial of service attacks on financial services companies, including us. Distributed denial of service attacks are designed to saturate the targeted online network with excessive amounts of network traffic, resulting in slow response times, or in some cases, causing the site to be temporarily unavailable. Generally, these attacks are conducted to interrupt or suspend a company’s access to Internet service. The attacks can adversely affect the performance of a company’s website and in some instances prevent customers from accessing a company’s website. We are implementinghave implemented certain technology protections such as Customer Profiling and Step-Up Authentication to be in compliance with the Federal Financial Institutions Examination Council (“FFIEC”) Authentication in Internet Banking Environment (“AIBE”) guidelines. However, potential cyber threats that include hacking and other attempts to breach information technology security controls are rapidly evolving and we may not be able to anticipate or prevent all such attacks. In the event that a cyber-attack is successful, our business, financial condition or results of operations may be adversely affected.
We rely heavily on communications and information systems to conduct our business.
We rely heavily on communications and information systems to conduct our business. Any failure, interruption or breach in security of these systems, including due to hacking or other similar attempts to breach information technology security protocols,
CITIZENS FINANCIAL GROUP, INC.
RISK FACTORS
could result in failures or disruptions in our customer relationship management, general ledger, deposit, loan and other systems. Although we have established policies and procedures designed to prevent or limit the effect of the possible failure, interruption or security breach of our information systems, there can be no assurance that these policies and procedures will be successful and that any such failure, interruption or security breach will not occur or, if they do occur, that they will be adequately addressed. The occurrence of any failure, interruption or security breach of our information systems could damage our reputation, result in a loss of customer business, subject us to additional regulatory scrutiny, or expose us to civil litigation and possible financial liability.
CITIZENS FINANCIAL GROUP, INC.
RISK FACTORS
We rely on third parties for the performance of a significant portion of our information technology.
We rely on third parties for the performance of a significant portion of our information technology functions and the provision of information technology and business process services. For example, (i) certain components and services relating to our online banking system rely on data communications networks operated by unaffiliated third parties, (ii) many of our applications are hosted or maintained by third parties, including our Commercial Loan System, which is hosted and maintained by Automated Financial Systems, Inc., and (iii) our core deposits system is maintained by Fidelity Information Services, Inc. Also, in 2015, we entered into an agreement with IBM Corporation for the provision of a wide range of information technology support services, including end user, data center, network, mainframe, storage and database services. The success of our business depends in part on the continuing ability of these (and other) third parties to perform these functions and services in a timely and satisfactory manner. If we experience a disruption in the provision of any functions or services performed by third parties, we may have difficulty in finding alternate providers on terms favorable to us and in reasonable timeframes. If these services are not performed in a satisfactory manner, we would not be able to serve our customers well. In either situation, our business could incur significant costs and be adversely affected.
We are exposed to reputational risk and the risk of damage to our brands and the brands of our affiliates, including RBS Group.affiliates.
Our success and results depend, in part, on our reputation and the strength of our brands. We are vulnerable to adverse market perception as we operate in an industry where integrity, customer trust and confidence are paramount. We are exposed to the risk that litigation, employee misconduct, operational failures, the outcome of regulatory or other investigations or actions, press speculation and negative publicity, among other factors, could damage our brands or reputation. Our brands and reputation could also be harmed if we sell products or services that do not perform as expected or customers’ expectations for the product are not satisfied.
Negative publicity could result, for example, from an allegation or determination that we have failed to comply with regulatory or legislative requirements, from failure in business continuity or performance of our information technology systems, loss of customer data or confidential information, fraudulent activities, unsatisfactory service and support levels or insufficient transparency or disclosure of information. Negative publicity adversely affecting our brands or reputation could also result from misconduct or malpractice by partners or other third parties with whom we have relationships. In particular, because of our relationship with RBS Group, negative publicity about RBS Group could have a negative effect on us. Adverse publicity, governmental scrutiny, any pending future investigations by regulators or law enforcement agencies involving us, any of our affiliates or RBS Group can also have a negative impact on our reputation and business, which could adversely affect our results of operations.
Any damage to our brands or reputation could cause existing customers or other third parties to terminate their business relationships with us and potential customers or other third parties to be reluctant to do business with us. Such damage to our brands or reputation could cause disproportionate damage to our business, even if the negative publicity is factually inaccurate or unfounded. Furthermore, negative publicity could result in greater regulatory scrutiny and influence market or rating agencies’ perceptions of us, which could make it more difficult for us to maintain our credit rating. The occurrence of any of these events could have an adverse effect on our business, financial condition and results of operations.
We may be adversely affected by unpredictable catastrophic events or terrorist attacks and our business continuity and disaster recovery plans may not adequately protect us from serious disaster.
The occurrence of catastrophic events such as hurricanes, tropical storms, tornadoes and other large-scale catastrophes and terrorist attacks could adversely affect our business, financial condition or results of operations if a catastrophe rendered both our production data center in Rhode Island and our recovery data center in MassachusettsNorth Carolina unusable. The distance between the data center locations (approximately 45 miles) provides diversity in resources, but not sufficient diversity in the event of a catastrophe as described above. Although we are building arecently enhanced our disaster recovery capabilities through the completion of the new, out-of-region backup data center in North Carolina, scheduled for completion in 2015, we do not currently have a backup data center outside New England.
Our principal communicationsthere can be no assurance that our current disaster recovery plans and information systems are housed in the Rhode Island primary data center and our operations are concentrated in the New England, Mid-Atlantic and Midwest regions. If a natural disaster, severe weather, power outage or other event were to occur in New England or if we were subject to a terrorist attack prior to the opening of the North Carolina recovery data center that preventedcapabilities will adequately protect us from using all or a significant portion of our communications and information systems, damaged critical infrastructure or otherwise disrupted our operations, it may be difficult or, in certain cases, impossible for us to continue our business for a substantial period of time. Although we have implemented disaster recovery and business continuity plans, these plans may prove inadequate in the event of a disaster or similar event that seriously compromises our information systems. We may incur substantial expenses as a result of any limitations relating to our disaster recovery and business
CITIZENS FINANCIAL GROUP, INC.
RISK FACTORS
continuity plans, which, particularly when taken together with the geographic concentration of our operations, could have a material adverse effect on our business.serious disaster.
An inability to realize the value of our deferred tax assets could adversely affect operating results.
Our net deferred tax assets (“DTAs”)DTAs are subject to an evaluation of whether it is more likely than not that they will be realized for financial statement purposes. In making this determination, we consider all positive and negative evidence available, including the impact of recent operating results, as well as potential carry-back of tax to prior years’ taxable income, reversals of existing taxable temporary differences, tax planning strategies and projected earnings within the statutory tax loss carryover period. We have determined that the DTAs are more likely than not to be realized at December 31, 20142015 (except for $157$123 million related to state DTAs for which a valuation allowance was established). If we were to conclude that a significant portion of the DTAs were not more likely than not to be realized, the required valuation allowance could adversely affect our financial condition and results of operations.
We maintain a significant investment in projects that generate tax credits, which we may not be able to fully utilize, or, if utilized, may be subject to recapture or restructuring.
At December 31, 2014,2015, we maintained an investment of approximately $399$598 million in entities for which we receive allocations of tax credits, which we utilize to offset our taxable income. We accrued $26$45 million and $14$26 million in credits for the years ended December 31, 20142015 and December 31, 2013,2014, respectively. As of December 31, 2014,2015, all tax credits have been utilized to offset taxable income. Substantially all of these tax credits are related to development projects that are subject to ongoing compliance requirements over certain periods of time to fully realize their value. If these projects are not operated in full compliance with the required terms, the tax credits could be subject to recapture or restructuring. Further, we may not be able to utilize any future tax credits. If we are unable to utilize our tax credits or, if our tax credits are subject to recapture or restructuring, it could have a material adverse effect on our business, financial condition and results of operations.
We may have exposure to greater than anticipated tax liabilities.
The tax laws applicable to our business activities, including the laws of the United States and other jurisdictions, are subject to interpretation. The taxing authorities in the jurisdictions in which we operate may challenge our tax positions, which could increase our effective tax rate and harm our financial position and results of operations. In addition, our future income taxes could be adversely affected by earnings being lower than anticipated in jurisdictions that have lower statutory tax rates and higher than anticipated in jurisdictions that have higher statutory tax rates, or by changes in tax laws, regulations, or accounting principles. We are subject to regular review and audit by U.S. federal and state tax authorities. Any adverse outcome of such a review or audit could have a negative effect on our financial position and results of operations. In addition, the determination of our provision for income taxes and other tax liabilities requires significant judgment by management. Although we believe that our estimates are reasonable, the ultimate tax outcome may differ from the amounts recorded in our financial statements and may materially affect our financial results in the period or periods for which such determination is made.
If we are unable to implement and maintain effective internal control over financial reporting in the future, investors may lose confidence in the accuracy and completeness of our financial reports and the market price of our common stock may be negatively affected.
We are required to maintain internal controls over financial reporting and to report any material weaknesses in such internal controls. As a public company, we are currently subject to the requirements of the Sarbanes-Oxley Act, and as a U.S. bank holding company, we are also subject to the FDIC Part 363 Annual Report rules, which incorporate certain items from the Sarbanes-Oxley Act Section 404 into the Federal Deposit Insurance Corporation Improvement Act of 1991 (“FDICIA”) requirements. In addition, beginning with our second annual report on Form 10-K, we will be required to furnish a report by management on the effectiveness of our internal control over financial reporting, pursuant to Section 404 of the Sarbanes-Oxley Act. Our independent registered public accounting firm is required to express an opinion as to the effectiveness of our internal control over financial reporting beginning with our second annual report on Form 10-K. The process of designing, implementing and testing the internal control over financial reporting required to comply with this obligation is time-consuming, costly and complicated. If we identify material weaknesses in our internal control over financial reporting, if we are unable to comply with the requirements of Section 404 of the Sarbanes-Oxley Act in a timely manner or to assert that our internal control over financial reporting is effective, or if our independent registered public accounting firm is unable to express an opinion as to the effectiveness of our internal control over financial reporting, investors may lose confidence in the accuracy and completeness of our financial reports and the market price of our common stock could be negatively affected, and we could become subject to civil lawsuits filed by investors or
CITIZENS FINANCIAL GROUP, INC.
RISK FACTORS
investigations by the stock exchange on which our securities are listed, the SEC, or other regulatory authorities, which could require additional financial and management resources.
We depend on the accuracy and completeness of information about clients and counterparties.
In deciding whether to extend credit or enter into other transactions with clients and counterparties, we rely on information furnished by or on behalf of clients and counterparties, including financial statements and other financial information. We also may rely on representations of clients and counterparties as to the accuracy and completeness of that information and, with respect to financial statements, on reports of independent auditors. If any of such information is incorrect, then the creditworthiness of our clients and counterparties may be misrepresented, which would increase our credit risk and expose us to possible write-downs and losses.
We may not be able to successfully manage our intellectual property and may be subject to infringement claims.
We rely on a combination of owned and licensed trademarks, service marks, trade names, logos and other intellectual property rights. Third parties may challenge, invalidate, infringe or misappropriate our intellectual property, or such intellectual property may not be sufficient to provide us with competitive advantages, which could result in costly redesign efforts, discontinuance of certain services or other competitive harm. For example, words contained in our trademarks and trade names (including the word “Citizens”) are also found in the trade names of a significant number of third parties, including other banks. This has resulted in, and may in the future result in, challenges to our ability to use our trademarks and trade names in particular geographical areas or lines of business. Such challenges could impede our future expansion into new geographic areas or lines of business and could limit our ability to realize the full value of our trademarks and trade names. We may have to litigate to enforce or determine the scope and enforceability of our intellectual property rights, which is expensive, could cause a diversion of resources and may not prove successful. Existing use by others of trademarks and trade names that are similar to ours could limit our ability to challenge third parties when their use of such marks or names may cause consumer confusion, negatively affect consumers’ perception of our brand and products or dilute our brand identity. In addition, certain aspects of our business and our services rely on technologies and intellectual property licensed by third parties, and we may not be able to obtain or continue to obtain licenses and technologies from these third parties on reasonable terms or at all. The loss or diminution of our intellectual property protection or the inability to obtain third party intellectual property could harm our business and ability to compete.
We may also be subject to costly litigation in the event our services infringe upon or otherwise violate a third party’s proprietary rights. Third parties may have, or may eventually be granted, intellectual property rights, including trademarks, that could be infringed by our services or other aspects of our business. Third parties have made, and may make, claims of infringement against us with respect to our services or business. As we continue rebranding CFG and our banking subsidiaries and expand our business, the likelihood of receiving third party challenges or claims of infringement related to our intellectual property may increase. Any claim from third parties may result in a limitation on our ability to use the intellectual property subject to such claims. Even if we believe that intellectual property related claims are without merit, defending against such claims is time consuming and expensive and could result in the diversion of the time and attention of our management and employees. Claims of intellectual property infringement also might require us to redesign affected services, enter into costly settlement or license agreements, pay costly damage awards, or face a temporary or permanent injunction prohibiting us from marketing or selling certain of our services. Any intellectual property related dispute or litigation could have a material adverse effect on our business, financial condition and results of operations.
Risks Related to Our Relationship with and Separation from RBS Group
RBS is our controlling stockholder and its interests may conflict with ours or yours in the future.
As a result of being our controlling stockholder, RBS Group has significant power to control our affairs and policies including with respect to the election of directors (and, through the election of directors, the appointment of management), the entering into of mergers, sales of substantially all of our assets and other extraordinary transactions. In particular, under the separation and shareholder agreement that we entered into with RBS in connection with our initial public offering (the “Separation Agreement”), for so long as RBS maintains beneficial ownership of our outstanding common stock in excess of certain thresholds, we will be required to obtain the consent of RBS to complete certain significant transactions, including our merger or consolidation, entrance into joint ventures in excess of certain thresholds or similar corporate transactions, issuance of common stock (other than pursuant to our equity incentive plans), issuance or the guarantee of indebtedness in excess of certain thresholds, the termination or appointment of a replacement of our Chief Executive Officer, Chief Financial Officer or Chief Risk Officer and certain other significant transactions. The interests of RBS Group may not align with our or your interests and we may not be able to manage our business in a manner that is in your best interests, which could cause the price of our stock to decline.
CITIZENS FINANCIAL GROUP, INC.
RISK FACTORS
As of December 31, 2014, RBS was 79.1% owned by the UK government and its interests may conflict with ours or yours in the future.
Following placing and open offers in December 2008 and in April 2009, Her Majesty’s Treasury (“HM Treasury”) owned approximately 70.3% of the enlarged ordinary share capital of RBS. In December 2009, RBS issued a further £25.5 billion of new capital to HM Treasury. This new capital took the form of B shares, which do not generally carry voting rights at general meetings of ordinary stockholders but are convertible into ordinary shares. Following the issuance of the B shares, HM Treasury’s holding of ordinary shares of the company remained at 70.3%, although its economic interest rose to 84.4%. As of December 31, 2014, HM Treasury held 62.3% of the voting rights in RBS and had an economic interest of 79.1%.
HM Treasury’s stockholder relationship with RBS is managed on its behalf by UK Financial Investments Limited (“UKFI”) and, although HM Treasury has indicated that it intends to respect the commercial decisions of RBS and that RBS will continue to have its own independent board of directors and management team determining its own strategy, should its current intentions change, HM Treasury’s position as a majority stockholder (and UKFI’s position as manager of this stockholding) means that HM Treasury or UKFI may be able to exercise a significant degree of influence over RBS. The manner in which HM Treasury or UKFI exercises HM Treasury’s rights as majority stockholder could give rise to conflict between the interests of HM Treasury and the interests of our stockholders, and RBS may make decisions impacting our operations and the value of our common stock based on UK policy imperatives rather than traditional stockholder economic considerations. We cannot accurately predict whether any restrictions and limitations imposed on RBS on account of HM Treasury’s ownership position, or the implementation of RBS’s restructuring plan agreed to with HM Treasury, will have a negative effect on our businesses and financial flexibility or result in conflicts between the interests of RBS and our interests. In addition, it is difficult for us to predict whether any changes to, or termination of, HM Treasury’s current relationship with RBS will have any effect on our business. We also note that we cannot predict the possible effect of RBS not satisfying its commitment to divest CFG as agreed with HM Treasury, for instance, by having a remaining ownership interest in CFG and its subsidiaries beyond any deadline agreed with HM Treasury.
RBS Group and its UK bank subsidiaries are subject to the provisions of the UK Banking Act 2009, as amended by the UK Financial Services (Banking Reform) Act 2013, which includes special resolution powers including nationalization and bail-in.
Under the Banking Act 2009, substantial powers have been granted to UK banking regulators as part of a special resolution regime. These powers enable such regulators to deal with and stabilize certain deposit-taking UK incorporated institutions that are failing, or are likely to fail, to satisfy the “FSMA threshold conditions” (within the meaning of section 41 of the Financial Services and Markets Act 2000 (“FSMA”), which are the conditions that a relevant entity must satisfy in order to obtain its authorization to perform regulated activities). The special resolution regime consists of three stabilization options: (i) transfer of all or part of the business of the relevant entity and/or the securities of the relevant entity to a private sector purchaser, (ii) transfer of all or part of the business of the relevant entity to a “bridge bank” wholly owned by the Bank of England and (iii) temporary public ownership (nationalization) of the relevant entity. If the UK regulators determine that RBS Group has failed, or is likely to fail, to satisfy the FSMA threshold conditions, then HM Treasury could decide to take RBS Group into temporary public ownership pursuant to the powers granted under the Banking Act 2009, and it may then take various actions in relation to any securities without the consent of holders of the securities. In each case, the UK banking regulators would have the authority to modify contractual arrangements of RBS Group and disapply or modify laws (with possible retrospective effect) to enable their powers under UK law to be used effectively.
Among the changes introduced by the Financial Services (Banking Reform) Act 2013, the Banking Act 2009 was amended to insert a bail-in option as part of the powers of the UK regulators. This option will come into force on such date as shall be stipulated by HM Treasury (HM Treasury has applied the bail-in provisions from January 1, 2015, which is ahead of the deadline of January 1, 2016 that is set out in the European Bank Recovery and Resolution Directive (“BRRD”)). The bail-in option will be introduced as an additional power available to the Bank of England to enable it to recapitalize a failed institution by allocating losses first to its shareholders and then to eligible unsecured creditors in a manner that seeks to respect the hierarchy of claims in liquidation. The bail-in option includes the power to cancel a liability, to modify the form of a liability (including the power to convert a liability from one form to another) or to provide that a contract under which the institution has a liability is to have effect as if a specified right had been exercised under it, each for the purposes of reducing, deferring or canceling the liabilities of the bank under resolution, as well as to transfer a liability. The Financial Services (Banking Reform) Act 2013 is consistent with the range of tools that European Member States will be required to make available to their resolution authorities under the BRRD, although some amendments are expected to the current UK bail-in provisions to ensure that they are fully compliant with the requirements of the BRRD.
CITIZENS FINANCIAL GROUP, INC.
RISK FACTORS
If the UK regulators were to take such stabilization actions with respect to RBS Group due to a failure, or likely failure, by RBS Group to satisfy the FSMA threshold conditions, it could result in the creation, modification or canceling of certain of our contractual arrangements that we entered into with RBS Group in connection with the completion of our initial public offering, including the Transitional Services Agreement and Separation Agreement. In addition, the UK regulators could seek to impose additional obligations on us, including the provision of services to third parties who may purchase some or all of RBS Group’s assets. The UK regulators could also materially modify RBS Group’s restructuring efforts, including the acceleration of its disclosed intention to sell its remaining shares of our common stock. Any of these actions could have a material adverse effect on our business, contractual obligations and the value of our common stock.
Regulatory proceedings to which the RBS Group is subject could adversely affect our business, prospects, financial condition or results of operations.
RBS Group is a banking and financial services group that is from time to time subject to reviews, investigations and proceedings (both formal and informal) by governmental agencies and self-regulatory organizations in multiple jurisdictions. As a consolidated subsidiary of RBS, regulatory actions against other members of RBS Group that result in adverse judgments, settlements, fines, penalties, injunctions or other remedial action may materially impact our business even where we neither participated in nor contributed to the underlying conduct giving rise to the regulatory action. For example, RBS has disclosed that it is in discussions with various governmental and regulatory authorities, including the Criminal Division of the U.S. Department of Justice, regarding their investigations of RBS Group’s foreign exchange trading and sales activities. Although none of the alleged underlying conduct that is the subject of these investigations involved us, we could be subject to a number of adverse consequences in connection with RBS’ resolution of these investigations, including but not limited to potential impacts on our broker dealer, capital markets, investment advisory and trustee businesses. In addition, any of our businesses could be impacted to the extent that our reputation is adversely affected by a finding of improper conduct by RBS and/or its affiliates other than us. Whether one or more of these consequences is imposed upon us will depend on the decisions of our regulators who, in most cases, have discretion under applicable regulation whether to apply, or in the case of automatic consequences, whether to suspend or hold in abeyance the imposition of, these potential consequences. We believe that, because we were not involved in the alleged conduct at issue, there is a reasonable basis for these consequences not to be imposed on us. However, the application of these consequences is at the discretion of our regulators and if such consequences were imposed, our business, prospects, financial condition or results of operations may be adversely affected. In addition, if RBS affiliates with whom we do business as swaps and other transactional counterparties, were to lose their ability to engage in such businesses, we could incur costs associated with moving our business to other, non-group counterparties.
Conflicts of interest and disputes may arise between RBS Group and us that could be resolved in a manner unfavorable to us.
Questions relating to conflicts of interest and actual disputes may arise between RBS Group and us in a number of areas relating to our past and ongoing relationships. Areas in which conflicts of interest or disputes between RBS Group and us could arise include, but are not limited to, the following:
Competing business activities. RBS Group is a large banking and financial services group principally engaged in the business of providing banking and financial services. In the ordinary course of its business activities, RBS Group may engage in activities where their interests conflict with our interests or those of our stockholders. Our amended and restated certificate of incorporation provides that, to the fullest extent permitted by law, none of RBS Group or any of its affiliates will have any duty to refrain from engaging, directly or indirectly, in the same business activities or similar business activities or lines of business in which we operate. RBS Group also may pursue acquisition opportunities that may be complementary to our business, and, as a result, those acquisition opportunities may not be available to us. As a result, our future competitive position and growth potential could be adversely affected.
Cross officerships, directorships and stock ownership. The ownership interests of our directors or executive officers in the common stock of RBS or service as a director or officer of both RBS and us could create, or appear to create, conflicts of interest when directors and executive officers are faced with decisions that could have different implications for the two companies. For example, these decisions could relate to (i) the nature, quality and cost of services rendered to us by RBS Group, (ii) disagreement over the desirability of a potential business or acquisition opportunity or business plans, (iii) employee retention or recruiting or (iv) our dividend policy.
Separation Agreement. We entered into a Separation Agreement immediately prior to the completion of our initial public offering that governs the relationship between RBS Group and us. Following our initial public offering, the Separation Agreement provides RBS Group with certain governance rights over our business, as well as obligates us
CITIZENS FINANCIAL GROUP, INC.
RISK FACTORS
to comply with certain covenants including certain information rights, access privileges and confidentiality matters. Disagreements regarding the rights and obligations of RBS Group or us under the Separation Agreement could create conflicts of interest for certain of our directors and officers, as well as actual disputes that may be resolved in a manner unfavorable to us.
Transitional Services Agreement. We entered into a Transitional Services Agreement with RBS Group for the continued provision of certain services by RBS Group to us (including specified information technology, operations, compliance, business continuity, legal, human resources, back office and web services) and by us to RBS Group. The services that are to be provided under the Transitional Services Agreement generally will continue to be provided until December 31, 2016, although certain services may have an earlier termination date or be terminated prior to that time. Interruptions to or problems with services provided under the Transitional Services Agreement could result in conflicts between us and RBS Group that increase our costs both for the processing of business and the potential remediation of disputes.
Commercial Matters. In addition to the agreements that we entered into as part of our separation from RBS Group, we have and expect to continue certain of our commercial relationships with RBS Group for which we intend to continue or enter into one or more commercial matters agreements. The principal commercial activities to be covered by such agreements include certain swap agreements and foreign exchange risk contracts with RBS Group for the purpose of reducing our exposure to interest rate fluctuations or to meet the financing needs of our customers, as well as commercial and referral arrangements related to transaction services, debt capital markets transactions, underwriting of loan syndications, commercial mortgage securitization transactions, mortgage servicing, asset finance and loan syndications and corporate credit card services. Despite our current expectation, there is no guarantee that RBS Group will continue to provide such commercial services to us or that the prices at which they are willing to provide such services will remain consistent with historical periods. If RBS Group were to terminate any of these arrangements, our financial results may be adversely affected. Moreover, disagreements may arise between us and RBS Group regarding the provision or quality of any such services rendered, which may materially adversely affect this portion of our business.
Business opportunities. Our directors nominated by RBS and RBS Group may have or make investments in other companies that may compete with us. Our Amended and Restated Certificate of Incorporation provides that, to the fullest extent permitted by law, none of RBS or any of its affiliates will have any duty to refrain from (i) engaging in a corporate opportunity in the same or similar lines of business in which we or our affiliates now engage or propose to engage or (ii) otherwise competing with us or our affiliates. As a result of these charter provisions, our future competitive position and growth potential could be adversely affected.
Our separation from RBS Group could adversely affect our business and profitability due to RBS Group’s recognizable brand and reputation.
Prior to our initial public offering, as a wholly owned indirect subsidiary of RBS, we marketed our products and services using the “RBS” brand name and logo. We believe the association with RBS Group has provided us with preferred status among certain of our customers, vendors and other persons due to RBS Group’s globally recognized brand, perceived high-quality products and services and strong capital base and financial strength.
Our separation from RBS Group could adversely affect our ability to attract and retain customers, which could result in reduced sales of our products. In connection with our initial public offering, we entered into a trademark license agreement pursuant to which we were granted a limited license to use certain RBS trademarks (including the daisywheel logo) for an initial term of five years, and, at our option, up to 10 years. We are required under the agreement to remove the “RBS” brand name from all of our products and services by the time RBS beneficially owns less than 50% of our outstanding common stock (but in no event earlier than October 1, 2015), and we lose the right to use RBS trademarks in connection with the marketing of any product or service once we rebrand and cease using RBS trademarks in connection with such product or service. We have changed the legal names of our subsidiaries that included “RBS” and have continued operational and legal work to rebrand CFG and our banking subsidiaries. The process of changing all marketing materials, operational materials, signage, systems, and legal entities containing “RBS” to our new brand name will take approximately 14 months and cost approximately $14 million, excluding any incremental advertising and customer communication expenses. We expect to shift the majority of our advertising and marketing budget to our new brand progressively as the different legal entities complete their individual brand name changes. We expect the shift in advertising and marketing investment to be completed no later than July 31, 2015. As a result of this rebranding, some of our existing customers may choose to stop doing business with us, which could increase customer withdrawals. In addition, other potential customers may decide not to purchase our products and services because we no longer will be a part of RBS Group. We may also receive decreased referrals of business from RBS Group. Our separation from RBS Group could prompt some third
CITIZENS FINANCIAL GROUP, INC.
RISK FACTORS
parties to reprice, modify or terminate their distribution or vendor relationships with us. We cannot accurately predict the effect that our separation from RBS Group will have on our business, customers or employees.
The risks relating to our separation from RBS Group could materialize or evolve at any time, including:
when RBS reduces its beneficial ownership in our common stock to a level below 50%; and
when we cease using the “RBS” name or the daisywheel logo in our sales and marketing materials, particularly when we deliver notices to our distributors and customers that the names of some of our subsidiaries will change.
Any failure by us to successfully replicate or replace certain functions, systems and infrastructure previously provided by RBS Groupor fail to resolve conflicts of interest or disputes between RBS and us in areas relating to our past and ongoing relationships could have a material adverse effect on us.
We will need to replicate or replace certain functions, systems and infrastructure to which we no longer have the same access as we separatesince our separation from RBS, Group, including services we receive pursuant to the Transitional Services Agreement. We will also need to make infrastructure investments in order to operate without the same access to RBS Group’sRBS’s existing operational and administrative infrastructure. Any failure to successfully implement these initiatives or to do so in a timely manner could have an adverse effect on us.
We expect to make an investment of approximately $18 millionAlthough RBS has fully exited its ownership stake in our systemscommon stock, questions relating to complete the migrationconflicts of technological services followinginterest and actual disputes may arise between RBS and us in a number of areas relating to our separation frompast and ongoing relationships. Areas in which conflicts of interest or disputes between RBS Group. In particular, we will separate our shared global network and where services such as corporate risk, back office, audit and human resourcesus could arise include, but are being provided by RBS Group, we will establish those services for CFG. These initiatives may not be completed on the expected timetable or within the expected budget and may not provide the system functionality or performance levels requiredlimited to, support the current and future needs of our business. Further, the systems and services provided to us by RBS Group under the Transitional Services Agreement will need to be replaced on or before the date of the expiration of the Transitional Services Agreement. The terms on which we purchase these new systems and services, or the functionality of the systems themselves, may be inferior to those of the systems provided by RBS Group or those available elsewhere in the market and, in relation to third-party suppliers, may be on terms that are less favorable than the terms on which services were previously provided by third parties to RBS Group, and from which we have historically benefited and will continue to benefit during the period of the Transitional Services Agreement. For more information regarding the Transitional Services Agreement, see “Management’s Discussion and Analysis of Financial Condition and Results of Operations” in Part II, Item 7, included elsewhere in this report.
Any failure by RBS Group to deliver the services to be provided under the Transitional Services Agreement could have a material adverse effect on our business, financial condition and results of operations.
In connection with our separation from RBS Group, we entered into a Transitional Services Agreement with RBS Group for the continued provision of certain services to us for a specified period. Services provided for under the Transitional Services Agreement include certain information technology, operations, compliance, business continuity, legal, human resources, back office and web services. In particular, we rely on RBS Group to provide hosting, support and maintenance services that are critical to maintaining the level of support for the ongoing needs of our business. Although the majority of the systems run under the Transitional Services Agreement are independent of RBS Group’s other systems, any technical problems occurring within RBS Group could have an adverse effect on us. As with all of our systems, interruptions to or problems with our systems and services provided under the Transitional Services Agreement or as a resultwith RBS that increase our costs both for the processing of migration from RBS Group infrastructure could cause material damage to our business and reputation.the potential remediation of disputes and other commercial and referral arrangements with RBS. If RBS Group failswe are unable to provideidentify or procure the services envisagedexecute on opportunities that offset any decrease or provide them in a timely manner, it could have a material adverse effect on our business, financial condition and resultstermination of operations.
RBS Group maintains a number of defined benefit pension schemes under which we could be subject to liability.
RBS Group maintains a number of defined benefit pension schemes for certain former and current employees, and as of December 31, 2014, had a reported net pension deficit of approximately £1.7 billion under certain international financial reporting standards assumptions. The UK Pensions Regulator has the powers to require that CFG, as an employer connectedany commercial relationships with RBS, Group, make a contribution to a UK defined benefit pension scheme if there has been an actour financial results may be adversely affected. Moreover, disagreements may arise between us and RBS regarding the provision or failure to act, onequality of the main purposesany such services rendered, which may materially adversely affect this portion of which was to avoid or reduce RBS Group’s statutory obligations under the scheme or if the UK Pensions Regulator considers that an act or omission is materially detrimental to the likelihood of a member receiving their accrued scheme benefits.our business.
CITIZENS FINANCIAL GROUP, INC.
RISK FACTORS
Risks Related to Our Industry
Any deterioration in national economic conditions could have a material adverse effect on our business, financial condition and results of operations.
Our business is affected by national economic conditions, as well as perceptions of those conditions and future economic prospects. Changes in such economic conditions are not predictable and cannot be controlled. Adverse economic conditions that could affect us include:
reduced consumer spending;
lower wage income levels;
declines in the market value of residential or commercial real estate (“CRE”);
inflation or deflation;
fluctuations in the value of the U.S. dollar;
volatility in short-term and long-term interest rates and commodity prices; and
higher bankruptcy filings.
These scenarios could require us to charge off a higher percentage of loans and increase provision for credit losses, which would reduce our net income and otherwise have a material adverse effect on our business, financial condition and results of operations. For example, our business was significantly affected by the global economic and financial crisis that began in 2008. The falling home prices, increased rate of foreclosure and high levels of unemployment in the United States triggered significant write-downs by us and other financial institutions. These write-downs adversely impacted our financial results in material respects. Although the U.S. economy continues to recover, an interruption or reversal of this recovery would adversely affect the financial services industry and banking sector. In particular, although the ongoing general economic recovery has positively impacted the real estate market, the fundamentals within the real estate sector, including asset values, high vacancy rates and rent values, remain relatively weak compared to prior to the global economic and financial crisis. Should the recovery of real estate asset values, reduction in vacancies and improvement in rents be interrupted for an extended period of time, it could have a material adverse effect on our business, financial condition and results of operations.
We operate in an industry that is highly competitive, which could result in losing business or margin declines and have a material adverse effect on our business, financial condition and results of operations.
We operate in a highly competitive industry. The industry could become even more competitive as a result of reform of the financial services industry resulting from the Dodd-Frank Act and other legislative, regulatory and technological changes, as well as continued consolidation. We face aggressive competition from other domestic and foreign lending institutions and from numerous other providers of financial services, including the following:
Non-banking financial institutions. The ability of these institutions to offer services previously limited to commercial banks has intensified competition. Because non-banking financial institutions that are not subject to the same regulatory restrictions as banks and bank holding companies, they can often operate with greater flexibility and lower cost structures.
Securitiessecurities firms and insurance companies. These companies, if they elect to become financial holding companies, can offer virtually any type of financial service. Thisand competitors that may significantly change the competitive environment in which we conduct our business.
Competitors that have greater financial resources. resources.
With respect to non-banking financial institutions, technology and other changes have lowered barriers to entry and made it possible for non-banks to offer products and services traditionally provided by banks. For example, consumers can maintain funds that would have historically been held as bank deposits in brokerage accounts or mutual funds. Consumers can also complete transactions such as paying bills and/or transferring funds directly without the assistance of banks. The process of eliminating banks as intermediaries, known as “disintermediation,” could result in the loss of fee income, as well as the loss of customer deposits and the related income generated from those deposits. Some of our largernon-bank competitors including certain nationalare not subject to the same extensive regulations we are and, international banks that have a significant presence in our market area,therefore, may have greater capital and resources, higher lending limits and may offer products, services and technology that we do not. We cannot predict the reaction of our customers and other third parties with respect to our financial or commercial strength relative to our competition, including our larger competitors.
flexibility in competing for business. As a result of these and other sources of competition, we could lose business to competitors or be forced to price products and services on less advantageous terms to retain or attract clients, either of which would adversely affect our profitability and business.
CITIZENS FINANCIAL GROUP, INC.
RISK FACTORS
Volatility in the global financial markets resulting from relapse of the Eurozone crisis, geopolitical developments in Eastern Europe or otherwise could have a material adverse effect on our business, financial condition and results of operations.
Volatility in the global financial markets could have an adverse effect on the economic recovery in the United States and could result from a number of causes, including a relapse in the Eurozone crisis, geopolitical developments in Eastern Europe or otherwise. The effects of the Eurozone crisis, which began in late 2009 as part of the global economic and financial crisis, continued to impact the global financial markets through 2014. Numerous factors continued to fuel the Eurozone crisis, including continued high levels of government debt, the undercapitalization and liquidity problems of many banks in the Eurozone and relatively low levels of economic growth. These factors made it difficult or impossible for some countries in the Eurozone to repay or refinance their debt without the assistance of third parties. As a combination of austerity programs, debt write-downs and the European Central Bank’s commitment to restore financial stability to the Eurozone and the finalization of the primary European Stability Mechanism bailout fund, in 2013 and into 2014 interest rates began to fall and stock prices began to increase. Although these trends helped to stabilize the effects of the Eurozone crisis in the first half of 2014, the underlying causes of the crisis were not completely eliminated. As a result, the financial markets relapsed toward the end of 2014. In addition, Russian intervention in Ukraine during 2014 significantly increased regional geopolitical tensions. In response to Russian actions, U.S. and European governments have imposed sanctions on a limited number of Russian individuals and business entities. The situation remains fluid with potential for further escalation of geopolitical tensions, increased severity of sanctions against Russian interests, and possible Russian counter-measures. Further economic sanctions could destabilize the economic environment and result in increased volatility. Should the economic recovery in the United States be adversely impacted by a return in volatility in the global financial markets caused by a continued relapse in the Eurozone crisis or developments in respect of the Russian sanctions or for any other reason, loan and asset growth and liquidity conditions at U.S. financial institutions, including us, may deteriorate. Moreover, until RBS divests its interest in us, adverse trends in the Eurozone and Eastern Europe could increase investor concern or, even if not accurate, stimulate perceptions of funding difficulties for our business because RBS is based in the United Kingdom and has significant exposure to European economies. If any of these factors were to materialize, it could have a material adverse effect on our business, financial condition and results of operations.
Further downgrades to the U.S. government’s credit rating, or the credit rating of its securities, by one or more of the credit ratings agencies could have a material adverse effect on general economic conditions, as well as our operations, earnings and financial condition.
On August 5, 2011, Standard & Poor’s cut the U.S. government’s sovereign credit rating of long-term U.S. federal debt from AAA to AA+ while also keeping its outlook negative. Moody’s also lowered its outlook to “Negative” on August 2, 2011, and Fitch lowered its outlook to “Negative” on November 28, 2011. During 2013, both Moody’s and Standard & Poor’s revised their outlook from “Negative” to “Stable,” and on March 21, 2014, Fitch revised its outlook from “Negative” to “Stable.” Further downgrades of the U.S. government’s sovereign credit rating, and the perceived creditworthiness of U.S. government-related obligations, could impact our ability to obtain funding that is collateralized by affected instruments. Such downgrades could also affect the pricing of funding when it is available. A downgrade may also adversely affect the market value of such instruments. A downgrade of the sovereign credit ratings of the U.S. government or the credit ratings of related institutions, agencies or instrumentalities would significantly exacerbate the other risks to which we are subject and any related adverse effects on its business, financial condition and results of operations.
The conditions of other financial institutions or of the financial services industry could adversely affect our operations and financial conditions.
Financial services institutions that deal with each other are interconnected as a result of trading, investment, liquidity management, clearing, counterparty and other relationships. Within the financial services industry, the default by any one institution could lead to defaults by other institutions. Concerns about, or a default by, one institution could lead to significant liquidity problems and losses or defaults by other institutions, as the commercial and financial soundness of many financial institutions are closely related as a result of these credit, trading, clearing and other relationships. Even the perceived lack of creditworthiness of, or questions about, a counterparty may lead to market-wide liquidity problems and losses or defaults by various institutions. This
CITIZENS FINANCIAL GROUP, INC.
RISK FACTORS
systemic risk may adversely affect financial intermediaries, such as clearing agencies, banks and exchanges with which we interact on a daily basis, or key funding providers such as the Federal Home Loan Banks (“FHLBs”),FHLBs, any of which could have a material adverse effect on our access to liquidity or otherwise have a material adverse effect on our business, financial condition and results of operations.
CITIZENS FINANCIAL GROUP, INC.
RISK FACTORS
Risks Related to Regulations Governing Our Industry
As a financial holding company and a bank holding company, we are subject to comprehensive regulation that could have a material adverse effect on our business and results of operations.
As a financial holding company and a bank holding company, we are subject to comprehensive regulation, supervision and examination by the Federal Reserve Board.FRB. In addition, CBNA is subject to comprehensive regulation, supervision and examination by the OCC and CBPA is subject to comprehensive regulation, supervision and examination by the FDIC and the PA Banking Department. Our regulators supervise us through regular examinations and other means that allow the regulators to gauge management’s ability to identify, assess and control risk in all areas of operations in a safe and sound manner and to ensure compliance with laws and regulations. In the course of their supervision and examinations, our regulators may require improvements in various areas. If we are unable to implement and maintain any required actions in a timely and effective manner, we could become subject to informal (non-public) or formal (public) supervisory actions and public enforcement orders that could lead to significant restrictions on our existing business or on our ability to engage in any new business. Such forms of supervisory action could include, without limitation, written agreements, cease and desist orders, and consent orders and may, among other things, result in restrictions on our ability to pay dividends, requirements to increase capital, restrictions on our activities, the imposition of civil monetary penalties, and enforcement of such actions through injunctions or restraining orders. We could also be required to dispose of certain assets and liabilities within a prescribed period. The terms of any such supervisory or enforcement action could have a material adverse effect on our business, financial condition and results of operations.
We are a bank holding company that has elected to become a financial holding company pursuant to the Bank Holding Company Act. Financial holding companies are allowed to engage in certain financial activities in which a bank holding company is not otherwise permitted to engage. However, to maintain financial holding company status, a bank holding company (and all of its depository institution subsidiaries) must be “well capitalized” and “well managed.” If a bank holding company ceases to meet these capital and management requirements, there are many penalties it would be faced with, including (i) the Federal Reserve BoardFRB may impose limitations or conditions on the conduct of its activities, and (ii) it may not undertake any of the broader financial activities permissible for financial holding companies or acquire a company engaged in such financial activities without prior approval of the Federal Reserve Board.FRB. If a company does not return to compliance within 180 days, which period may be extended, the Federal Reserve BoardFRB may require divestiture of that company’s depository institutions. To the extent we do not meet the requirements to be a financial holding company in the future, there could be a material adverse effect on our business, financial condition and results of operations.
We may be unable to disclose some restrictions or limitations on our operations imposed by our regulators.
From time to time, bank regulatory agencies take supervisory actions that restrict or limit a financial institution’s activities and lead it to raise capital or subject it to other requirements. Directives issued to enforce such actions may be confidential and thus, in some instances, we are not permitted to publicly disclose these actions. In addition, as part of our regular examination process, our and our banking subsidiaries’ respective regulators may advise us or our banking subsidiaries to operate under various restrictions as a prudential matter. Any such actions or restrictions, if and in whatever manner imposed, could adversely affect our costs and revenues. Moreover, efforts to comply with any such nonpublic supervisory actions or restrictions may require material investments in additional resources and systems, as well as a significant commitment of managerial time and attention. As a result, such supervisory actions or restrictions, if and in whatever manner imposed, could have a material adverse effect on our business and results of operations; and, in certain instances, we may not be able to publicly disclose these matters.
The regulatory environment in which we operate could have a material adverse effect on our business and earnings.
We are heavily regulated by bank and other regulatory agencies at the federal and state levels. This regulatory oversight is established to protect depositors, the FDIC’s Deposit Insurance Fund, and the banking system as a whole, not security holders. Changes to statutes, regulations, rules or policies including the interpretation or implementation of statutes, regulations, rules or policies could affect us in substantial and unpredictable ways including subjecting us to additional costs, limiting the types of financial services and other products we may offer, limiting our ability to pursue acquisitions and increasing the ability of third parties, including non-banks, to offer competing financial services and products.
We are subject to capital adequacy and liquidity standards, and if we fail to meet these standards our financial condition and operations would be adversely affected.
We are subject to several capital adequacy and liquidity standards. To the extent that we are unable to meet these standards, our ability to make distributions of capital will be limited and we may be subject to additional supervisory actions and limitations on our activities. The capital adequacySee “Regulation and liquidity standards that we must meet include the following:Supervision” in Part I, Item 1 — Business, and “Management’s Discussion and Analysis
CITIZENS FINANCIAL GROUP, INC.
RISK FACTORS
Current capital requirements. Under regulatory capital adequacy guidelines and other regulatory requirements, CFG and its banking subsidiaries must meet guidelines that include quantitative measures of assets, liabilities and certain off-balance sheet items, subject to qualitative judgments by regulators about components of qualifying capital, risk weightings and other factors. We are regulated as a bank holding company and subject to consolidated regulatory capital requirements administered by the Federal Reserve. Our banking subsidiaries are subject to similar capital requirements, administered by the OCC in the case of CBNA and by the FDIC in the case of CBPA. Failure by us or one of our banking subsidiaries to maintain its status as “adequately capitalized” would lead to regulatory sanctions and limitations and could lead the federal banking agencies to take “prompt corrective action.” Furthermore, a failure by our banking subsidiaries to be “well capitalized” under applicable regulatory guidelines could lead to higher FDIC assessments, and failure by us or our bank subsidiaries to be “well capitalized” could also impair our financial holding company status.
Basel III. The U.S. Basel III final rule and provisions in the Dodd-Frank Act, including the Collins Amendment, are increasing capital requirements for banking organizations such as us. Consistent with the Basel Committee’s Basel III capital framework, the U.S. Basel III final rule includes a new minimum ratio of CET1 capital to risk-weighted assets of 4.5% and a CET1 capital conservation buffer of greater than 2.5% of risk-weighted assets. We have established capital ratio targets that align with U.S. regulatory expectations under fully phased-in Basel III rules. Although we currently have capital ratios that exceed these minimum levels and a strategic plan to keep them at least at these levels, failure to maintain the capital conservation buffer would result in increasingly stringent restrictions on our ability to make dividend payments and other capital distributions and pay discretionary bonuses to executive officers. As to us, the U.S. Basel III final rule phases in over time beginning on January 1, 2015, and will become fully effective on January 1, 2019.
Capital Plans. We are required to submit an annual capital plan to the Federal Reserve Board. The capital plan must include an assessment of our expected uses and sources of capital over a forward-looking planning horizon of at least nine quarters, a detailed description of our process for assessing capital adequacy, our capital policy and a discussion of any expected changes to our business plan that are likely to have a material impact on our capital adequacy or liquidity. Based on a qualitative and quantitative assessment, including a supervisory stress test conducted as part of the CCAR process, the Federal Reserve Board will either object to our capital plan, in whole or in part, or provide a notice of non-objection to us by March 31 of a calendar year. If the Federal Reserve Board objects to a capital plan, we may not make any capital distribution other than those with respect to which the Federal Reserve Board has indicated its non-objection. Although we were permitted to continue capital actions at a level consistent with those executed in 2013, the Federal Reserve Board objected to certain qualitative aspects of our 2014 capital plan and we are not permitted to increase our capital distributions above 2013 levels until a new capital plan is approved by the Federal Reserve Board. We submitted our capital plan on January 5, 2015, and we cannot assure you that the Federal Reserve Board will not object to that capital plan or that, even if it does not object to it, our planned capital distributions will not be significantly modified from 2013 levels.
Stress Tests. In addition to capital planning, we and our banking subsidiaries are subject to capital stress testing requirements imposed by the Dodd-Frank Act that will likely require us to hold more capital than the minimum requirements applicable to us. The stress testing requirements are designed to show that we can meet our capital requirements even under stressed economic conditions.
Liquidity Coverage Ratio. The federal banking regulators also evaluate our liquidity as part of the supervisory process. In September 2014, the U.S. federal banking regulators issued a final rule with respect to the U.S. implementation of the LCR. This rule includes a modified version of the Basel Committee’s LCR in the United States, which applies to bank holding companies with more than $50 billion but less than $250 billion in total assets, and less than $10 billion in on-balance sheet foreign exposure, such as us. The modified version of the LCR differs in certain respects from the Basel Committee’s version of the LCR, including a narrower definition of high-quality liquid assets, different prescribed cash inflow and outflow assumptions for certain types of instruments and transactions and a shorter phase-in schedule that begins on January 1, 2016 and ends on January 1, 2017. The Basel Committee also has finalized its NSFR rule, which is expected to be adopted in the United States and could be applicable to us.
See “Management’s Discussion and Analysis of Financial Condition and Results of Operations — Capital” and “—Liquidity” in Part II, Item 7, included elsewhere in this report, for further discussion of the capital adequacy and liquidity standardsregulations to which we are subject.
CITIZENS FINANCIAL GROUP, INC.
RISK FACTORS
We could be required to act as a “source of strength” to our banking subsidiaries, which would have a material adverse effect on our business, financial condition and results of operations.
Federal Reserve BoardFRB policy historically required bank holding companies to act as a source of financial and managerial strength to their subsidiary banks. The Dodd-Frank Act codified this policy as a statutory requirement. This support may be required by the Federal Reserve BoardFRB at times when we might otherwise determine not to provide it or when doing so is not otherwise in the interests of CFG or our stockholders or creditors, and may include one or more of the following:
We may be compelled to contribute capital to our subsidiary banks, including by engaging in a public offering to raise such capital. Furthermore, any extensions of credit from us to our banking subsidiaries that are included in the relevant bank’s capital would be subordinate in right of payment to depositors and certain other indebtedness of such subsidiary banks.
In the event of a bank holding company’s bankruptcy, any commitment that the bank holding company had been required to make to a federal bank regulatory agency to maintain the capital of a subsidiary bank will be assumed by the bankruptcy trustee and entitled to priority of payment.
In certain circumstances one of our banking subsidiaries could be assessed for losses incurred by the other. In addition, in the event of impairment of the capital stock of one of our banking subsidiaries, we, as our banking subsidiary’s stockholder, could be required to pay such deficiency.
We depend on our banking subsidiaries for most of our revenue, and restrictions on dividends and other distributions by our banking subsidiaries could affect our liquidity and ability to fulfill our obligations.
As a bank holding company, we are a separate and distinct legal entity from our banking subsidiaries: CBNA and CBPA. We typically receive substantially all of our revenue from dividends from our banking subsidiaries. These dividends are the principal source of funds to pay dividends on our equity and interest and principal on our debt. Various federal and/or state laws and regulations, as well as regulatory expectations, limit the amount of dividends that our banking subsidiaries may pay. For example:
CBNApay to us. Also, our right to participate in a distribution of assets upon a subsidiary’s liquidation or reorganization is required by federal lawsubject to obtain the prior approvalclaims of the OCC forsubsidiary’s creditors. In the payment of cash dividends if the total of all dividends declared byevent CBNA in the calendar yearor CPBA is in excess of its current year net income combined with its retained net income of the two preceding years, less any required transfersunable to surplus (the “recent earnings test”).
CBNA may pay dividends only to the extent that retained net profits (as defined and interpreted by regulation), including the portion transferred to surplus, exceed bad debts (as defined by regulation).
CBPA may only pay dividends out of accumulated net earnings and dividendsus, we may not be declared unless surplus is at least equalable to contributed capital.service debt, pay obligations or pay dividends on our common stock. The inability to receive dividends from CBNA or CPBA could have a material adverse effect on our business, financial condition and results of operations.
Neither CBNA nor CBPA may pay a dividend if,See “Supervision and Regulation” in the opinionPart I, Item 1 — Business, and and “Management’s Discussion and Analysis of the applicable federal regulatory agency, either is engagedFinancial Condition and Results of Operations — Capital” in or is about to engagePart II, Item 7, included elsewhere in an unsafe or unsound practice, which would include a dividend payment that would reduce either bank’s capital to an inadequate level.
As a result of the goodwill impairment recognized by CBNA in the second quarter of 2013, CBNA does not meet the recent earnings test and must obtain specific prior approval from the OCC before making a capital distribution. We expect the recent earnings test to remain negative through 2015. As a result, we expect that CBNA will be required to obtain specific prior approval from the OCC before making a capital distribution through 2015. Since the goodwill impairment in 2013, the OCC has approved each request by CBNA to distribute to us up to 30% of its prior quarter after-tax net income. However, CBNA may not rely on past or current approvals as a guarantee of future approvals. Under the Pennsylvania Banking Code of 1965, as amended (the “PA Code”), CBPA is restricted from paying dividends in excess of accumulated net earnings. As of December 31, 2014, CBPA’s accumulated net earnings were $87 million. More generally, the banking agencies have significant discretion to limit or even preclude dividends, even if the statutory quantitative thresholds are satisfied.this report.
We are and may be subject to regulatory actions that may have a material impact on our business.
We may become or are involved, from time to time, in reviews, investigations and proceedings (both formal and informal) by governmental and self-regulatory agencies regarding our business. These regulatory actions involve, among other matters, accounting, consumer compliance and operational matters, certain of which may result in adverse judgments, settlements, fines, penalties, injunctions or other relief that
CITIZENS FINANCIAL GROUP, INC.
RISK FACTORS
may require changes to our business or otherwise materially impact our business. For example, in April 2013, our banking subsidiaries consented to the issuance of orders by the OCC and the FDIC (the “Consent Orders”). In the Consent Orders (which are publicly available and will remain in effect until terminated by the regulators), our banking subsidiaries neither admitted nor denied the regulators’ findings that they had engaged in deceptive marketing and implementation of the bank’s overdraft protection program, checking rewards programs and stop-payment process for pre-authorized recurring electronic fund transfers. Under the Consent Orders, our banking subsidiaries paid a total of $10 million in civil monetary penalties and $8 million in restitution to affected customers, agreed to cease and desist any operations in violation of Section 5 of the Federal Trade Commission Act, and submit to the regulators periodic written progress reports regarding compliance with the Consent Orders. For more information regarding ongoing significant regulatory actions in which we are involved and certain identified past practices and policies for which we could face potential formal administrative enforcement actions, see Note 16 “Commitments and Contingencies” to our audited Consolidated Financial Statements included in Part II, Item 8 — Financial Statements and Supplementary Data, included elsewhere in the report, for further discussion.
In regulatory actions, such as those referred to above, it is inherently difficult to determine whether any loss is probable or possible to reasonably estimate the amount of any loss. We cannot predict with certainty if, how or when such proceedings will be resolved or what the eventual fine, penalty or other relief, conditions or restrictions, if any, may be, particularly for actions that are in their early stages of investigation. We expect to make significant restitution payments to our banking subsidiaries’ customers arising from certain of the consumer compliance issues and also expect to pay civil money penalties in connection with certain of these issues. Adverse regulatory actions could have a material adverse effect on our business, financial condition and results of operations.
We are and may be subject to litigation that may have a material impact on our business.
Our operations are diverse and complex and we operate in legal and regulatory environments that expose us to potentially significant litigation risk. In the normal course of business, we have been named, from time to time, as a defendant in various legal actions, including arbitrations, class actions and other litigation, arising in connection with our activities as a financial services institution, including with respect to alleged unfair or deceptive business practices and mis-selling of certain products. Certain of the actual or threatened legal actions include claims for substantial compensatory and/or punitive damages or claims for indeterminate amounts of damages. In some cases, the entities that would otherwise be the primary defendants in such cases are bankrupt or in financial distress. We recently settled legal actions alleging violations under the Fair Labor Standards Act and certain state fair wage laws. Moreover, a number of recent judicial decisions have upheld the right of borrowers to sue lending institutions on the basis of various evolving legal theories, collectively termed “lender liability.” Generally, lender liability is
CITIZENS FINANCIAL GROUP, INC.
RISK FACTORS
founded on the premise that a lender has either violated a duty, whether implied or contractual, of good faith and fair dealing owed to the borrower or has assumed a degree of control over the borrower resulting in the creation of a fiduciary duty owed to the borrower or its other creditors or stockholders. This could increase the amount of private litigation to which we are subject. For more information regarding ongoing significant legal proceedings in which we are involved and certain identified past practices and policies for which we could face potential civil litigation, see Note 1617 “Commitments and Contingencies” to our audited Consolidated Financial Statements included in Part II, Item 8 — Financial Statements and Supplementary Data, included elsewhere in the report, for further discussion.
In disputes and legal proceedings, such as those referred to above, it is inherently difficult to determine whether any loss is probable or possible to reasonably estimate the amount of any loss. We cannot predict with certainty if, how or when such proceedings will be resolved or what the eventual settlement, fine, penalty or other relief, if any, may be, particularly for proceedings that are in their early stages of development or where plaintiffs seek substantial or indeterminate damages. Numerous issues may need to be resolved, including through potentially lengthy discovery and determination of important factual matters, determination of issues related to class certification and the calculation of damages and by addressing novel or unsettled legal questions relevant to the proceedings in question, before a loss or additional loss or range of loss or additional loss can be reasonably estimated for any proceeding. Adverse judgments in litigation or adverse regulatory actions could have a material adverse effect on our business, financial condition and results of operations.
The Dodd-Frank Act has changed and will likely continue to substantially change the legal and regulatory framework under which we operate our business.
On July 21, 2010, President Obama signed into law theCongress and federal regulatory agencies continually review banking laws, regulations and policies for possible changes. The Dodd-Frank Act, which has changedenacted in July 2010, instituted major changes to the banking and will likely continue to substantially change the legal andfinancial institutions regulatory framework under which we operate.regimes. The Dodd-Frank Act represents a significant overhaul of many aspects of the regulation of the financial-services industry, addressing, among other things, (i) systemic risk, (ii) capital adequacy, (iii) consumer financial protection, (iv) interchange fees, (v) mortgage lending practices, and (vi) regulation of derivatives and securities markets. A significant number of the provisions of the Dodd-Frank Act still require extensive rulemaking
CITIZENS FINANCIAL GROUP, INC.
RISK FACTORS
and interpretation by regulatory authorities. In several cases, authorities have extended implementation periods and delayed effective dates. Accordingly, in many respects the ultimate impact of the Dodd-Frank Act and its effects on the U.S. financial system and on us will not be known for an extended period of time.
The following are some See “Regulation and Supervision” in Part I, Item 1 — Business, included elsewhere in this report, for further discussion of the current provisions of the Dodd-Frank Act that may affect our operations:regulations to which we are subject.
Creation of the CFPB with centralized authority for consumer protection in the banking industry.
New limitations on federal preemption.
Application of heightened capital, liquidity, single counterparty credit limits, stress testing, risk management and other enhanced prudential standards.
Changes to the assessment base for deposit insurance premiums.
Creation of a new framework for the regulation of over-the-counter derivatives and new regulations for the securitization market and the strengthening of the regulatory oversight of securities and capital markets by the SEC.
Some of these and other major changes under the Dodd-Frank Act could materially impact the profitability of our business, the value of assets we hold or the collateral available for coverage under our loans, require changes to our business practices or force us to discontinue businesses and expose us to additional costs, taxes, liabilities, enforcement actions and reputational risk.
The Dodd-Frank Act’s provisions and related rules that restrict bank interchange fees may negatively impact our revenues and earnings.
Pursuant to the Dodd-Frank Act, the Federal Reserve Board adopted rules effective October 1, 2011, limiting the interchange fees that may be charged with respect to electronic debit transactions. Interchange fees, or “swipe” fees, are charges that merchants pay to us and other credit card companies and card-issuing banks for processing electronic payment transactions. Since taking effect, these limitations have reduced our debit card interchange revenues and have created meaningful compliance costs. Additional limits may further reduce our debit card interchange revenues and create additional compliance costs.
The CFPB’s residential mortgage regulations could adversely affect our business, financial condition or results of operations.
The CFPB finalized a number of significant rules that will impact nearly every aspect of the lifecycle of a residential mortgage. These rules implement the Dodd-Frank Act amendments to the Equal Credit Opportunity Act, the Truth in Lending Act and the Real Estate Settlement Procedures Act. The final rules require banks to, among other things: (i) develop and implement procedures to ensure compliance with a new “reasonable ability to repay” test and identify whether a loan meets a new definition for a “qualified mortgage,” (ii) implement new or revised disclosures, policies and procedures for servicing mortgages including, but not limited to, early intervention with delinquent borrowers and specific loss mitigation procedures for loans secured by a borrower’s principal residence, (iii) comply with additional restrictions on mortgage loan originator compensation, and (iv) comply with new disclosure requirements and standards for appraisals and escrow accounts maintained for “higher priced mortgage loans.” These new rules create operational and strategic challenges for us, as we are both a mortgage originator and a servicer. For example, business models for cost, pricing, delivery, compensation and risk management will need to be reevaluated and potentially revised, perhaps substantially. Additionally, programming changes and enhancements to systems will be necessary to comply with the new rules. We also expect additional rulemaking affecting our residential mortgage business to be forthcoming. These rules and any other new regulatory requirements promulgated by the CFPB and state regulatory authorities could require changes to our business, in addition to the changes we have been required to make thus far. Such changes would result in increased compliance costs and potential changes to our product offerings, which would have an adverse effect on the revenue derived from such business.
The Dodd-Frank Act’s consumer protection regulations could adversely affect our business, financial condition or results of operations.
The Federal Reserve BoardFRB enacted consumer protection regulations related to automated overdraft payment programs offered by financial institutions. Prior to the enactment of these regulations, our overdraft and insufficient funds fees represented a significant amount of noninterest fees. Since taking effect on July 1, 2010, the fees received by us for automated overdraft payment services have decreased, thereby adversely impacting our noninterest income. Complying with these regulations has resulted in increased operational costs for us, which may continue to rise. The actual impact of these regulations in future periods could vary due to a variety of factors, including changes in customer behavior, economic conditions and other factors, which could
CITIZENS FINANCIAL GROUP, INC.
RISK FACTORS
adversely affect our business, financial condition or results of operations. The CFPB has since then published additional studies of overdraft practices and has announced that it is considering enacting further regulations regarding overdrafts and related services.
The consumer protection provisions of the Dodd-Frank Act and the examination, supervision and enforcement of those laws and implementing regulations by the CFPB have created a more intense and complex environment for consumer finance regulation. The CFPB is authorized to engage in consumer financial education, track consumer complaints, request data and promote the availability of financial services to underserved consumers and communities. We expect increased oversight of financial
CITIZENS FINANCIAL GROUP, INC.
RISK FACTORS
services products by the CFPB, which is likely to affect our operations. The CFPB has significant authority to implement and enforce federal consumer finance laws, including the Truth in Lending Act, the Equal Credit Opportunity Act, the Fair Credit Billing Act and new requirements for financial services products provided for in the Dodd-Frank Act, as well as the authority to identify and prohibit unfair, deceptive or abusive acts and practices (“UDAAP”). The review of products and practices to prevent UDAAP is a continuing focus of the CFPB, and of banking regulators more broadly. The ultimate impact of this heightened scrutiny is uncertain but could result in changes to pricing, practices, products and procedures. It could also result in increased costs related to regulatory oversight, supervision and examination, additional remediation efforts and possible penalties.
In addition, the Dodd-Frank Act provides the CFPB with broad supervisory, examination and enforcement authority over various consumer financial products and services, including the ability to require reimbursements and other payments to customers for alleged legal violations, and to impose significant penalties, as well as injunctive relief that prohibits lenders from engaging in allegedly unlawful practices. The CFPB also has the authority to obtain cease and desist orders providing for affirmative relief and/or monetary penalties. The Dodd-Frank Act and accompanying regulations, including regulations to be promulgated by the CFPB, are being phased in over time, and while some regulations have been promulgated, many others have not yet been proposed or finalized. For example, the CFPB has announced that it is considering new rules regarding debt collection practices, and has proposed new regulations of prepaid accounts and proposed amendments to its regulations implementing the Home Mortgage Disclosure Act. We cannot predict the terms of all of the final regulations, their intended consequences or how such regulations will affect us or our industry.
The Dodd-Frank Act does not prevent states from adopting stricter consumer protection standards. State regulation of financial products and potential enforcement actions could also adversely affect our business, financial condition or results of operations.
Compliance with anti-money laundering and anti-terrorism financing rules involve significant cost and effort.
We are subject to rules and regulations regarding money laundering and the financing of terrorism. Monitoring compliance with anti-money laundering and anti-terrorism financing rules can put a significant financial burden on banks and other financial institutions and poses significant technical challenges. Although we believe our current policies and procedures are sufficient to comply with applicable rules and regulations, we cannot guarantee that our anti-money laundering and anti-terrorism financing policies and procedures completely prevent situations of money laundering or terrorism financing. Any such failure events may have severe consequences, including sanctions, fines and reputational consequences, which could have a material adverse effect on our business, financial condition or results of operations.
We may become subject to more stringent regulatory requirements and activity restrictions, or have to restructure, if the Federal Reserve BoardFRB and FDIC determine that our resolution plan is not credible.
Federal Reserve BoardFRB and FDIC regulations require bank holding companies with more than $50 billion in assets to submit resolution plans that, in the event of material financial distress or failure, establish the rapid, orderly and systemically safe liquidation of the company under the U.S. Bankruptcy Code. InsuredSeparately, insured depository institutions with more than $50 billion in assets must submit to the FDIC a resolution plan whereby they can be resolved in a manner that is orderly and that ensures that depositors will receive access to insured funds within certain required timeframes. If the Federal Reserve BoardFRB and the FDIC jointly determine that the resolution plan of a bank holding company is not credible, and the company fails to cure the deficiencies in a timely manner, then the Federal Reserve BoardFRB and the FDIC may jointly impose on the company, or on any of its subsidiaries, more stringent capital, leverage or liquidity requirements or restrictions on growth, activities or operations, or require the divestment of certain assets or operations. If the Federal Reserve BoardFRB and the FDIC determine that our resolution plan is not credible or would not facilitate our orderly resolution under the U.S. Bankruptcy Code, we could become subject to more stringent regulatory requirements or business restrictions, or have to divest certain of our assets or businesses. Any such measures could have a material adverse effect on our business, financial condition or results of operations.
CITIZENS FINANCIAL GROUP, INC.
RISK FACTORS
Risks Related to our Common Stock
Our stock price could decline due to the large number of outstanding shares of our common stock eligible for future sale, and RBS has committed to sell its remaining beneficial ownership of our common stock by the end of 2016 with a possible 12 month extension in certain circumstances. The exact timing of such sale or sales remains uncertain.
The sale of substantial amounts of shares of our common stock in the public market, or the perception that such sales could occur, could harm the prevailing market price of common stock. These sales, or the possibility that these sales may occur, also might make it more difficult for us to sell equity securities in the future at a time and at a price that we deem appropriate. Upon completion of our initial public offering, we had a total of 559,998,324 outstanding shares of common stock. Of the outstanding shares, the 161,000,000 shares sold in our initial public offering are freely tradable without restriction or further registration under the Securities Act, except that any shares held by our affiliates, as that term is defined under Rule 144 of the Securities Act, may be sold only in compliance with applicable limitations.
The remaining 398,998,324 shares that were outstanding following completion of the initial public offering were held by RBSG International Holdings Limited, a wholly owned subsidiary of RBS. These shares are subject to certain restrictions on resale. We, our officers, directors and the selling stockholders that own shares of our common stock following the completion of the initial public offering, signed lock-up agreements with the underwriters that, subject to certain customary exceptions, restrict the sale of the shares of our common stock held by them for 180 days following the date of our initial public offering, subject to extension in the case of an earnings release or material news or a material event relating to us. Morgan Stanley & Co. LLC, Goldman, Sachs & Co. and J.P. Morgan Securities LLC may, in their sole discretion, terminate these lock-up agreements or release all or any portion of the shares of common stock subject to lock-up agreements.
Upon the expiration, waiver, or release of the lock-up agreements described above, all such shares will be eligible for resale in a public market, subject, in the case of shares held by our affiliates, to volume, manner of sale and other limitations under Rule 144. We expect that the members of RBS Group will be considered affiliates after the expiration of the lock-up agreements based on their expected share ownership as well as their veto and board nomination rights under the Separation Agreement we entered into with RBS prior to the completion of our initial public offering. However, commencing after the expiration of the lock-up agreements, RBS has the right, subject to certain exceptions and conditions, to require us to register its shares of common stock under the Securities Act, and it will have the right to participate in future registrations of securities by us. Registration of any of these outstanding shares of common stock would result in such shares becoming freely tradable without compliance with Rule 144 upon effectiveness of the registration statement.
As restrictions on resale end, the market price of our shares of common stock could drop significantly as RBS has publicly stated its intent to sell its remaining shares in the short to medium term. RBS Group, which is currently controlled by the UK government, is undertaking a restructuring plan to facilitate its eventual privatization. As part of its obligations under the European Commission’s State Aid Amendment Decision of April 9, 2014, RBS has committed to dispose of its remaining ownership of our common stock by December 31, 2016, with an automatic 12-month extension depending on market conditions. RBS’s current intention for disposal of its remaining ownership of our common stock is to sell, over time, such remaining shares in a series of tranches, subject to market conditions and the terms of the lock-up provisions discussed above. The timing and manner of the sale of RBS’s remaining ownership of our common stock remains uncertain, and we have no control over the manner in which RBS may seek to divest such remaining shares. RBS could elect to sell its common stock in a number of different ways, including in a number of tranches via future registrations or, alternatively, by the sale of all or a significant tranche of such remaining shares to a single third-party purchaser. Any such sale would impact the price of our shares of common stock and there can be no guarantee that the price at which RBS is willing to sell its remaining shares will be at a level that our Board would be prepared to recommend to holders of our common stock or that you determine adequately values our shares of common stock.
In addition, these factors could also make it more difficult for us to raise additional funds through future offerings of our shares of common stock or other securities.
If RBS sells a controlling interest in our company to a third party in a private transaction, you may not realize any change-of-control premium on shares of our common stock and we may become subject to the control of a presently unknown third party.
RBS beneficially owns a significant equity interest of our company. RBS will have the ability, should it choose to do so, to sell some or all of its shares of our common stock in a privately negotiated transaction, which, if sufficient in size, could result in a change of control of our company.
CITIZENS FINANCIAL GROUP, INC.
RISK FACTORS
The ability of RBS to privately sell its shares of our common stock, with no requirement for a concurrent offer to be made to acquire all of the shares of our outstanding common stock that will be publicly traded hereafter, could prevent you from realizing any change-of-control premium on your shares of our common stock that may otherwise accrue to RBS on its private sale of our common stock. Additionally, if RBS privately sells its significant equity interest in our company, we may become subject to the control of a presently unknown third party. Such third party may have conflicts of interest with those of other stockholders. In addition, if RBS sells a controlling interest in our company to a third party, RBS may terminate the license agreement and other transitional arrangements, and our other commercial agreements and relationships could be impacted, all of which may adversely affect our ability to run our business and may have a material adverse effect on our business, operating results and financial condition.
Our stock price may be volatile, and you could lose all or part of your investment as a result.
You should consider an investment in our common stock to be risky, and you should invest in our common stock only if you can withstand a significant loss and wide fluctuation in the market value of your investment. The market price of our common stock could be subject to wide fluctuations in response to, among other things, the factors described in this “Risk Factors” section, and other factors, some of which are beyond our control. These factors include:
quarterly variations in our results of operations or the quarterly financial results of companies perceived to be similar to us;
changes in expectations as to our future financial performance, including financial estimates by securities analysts and investors;
CITIZENS FINANCIAL GROUP, INC.
RISK FACTORS
our announcements or our competitors’ announcements regarding new products or services, enhancements, significant contracts, acquisitions or strategic investments;
fluctuations in the market valuations of companies perceived by investors to be comparable to us;
future sales of our common stock;
additions or departures of members of our senior management or other key personnel;
changes in industry conditions or perceptions; and
changes in applicable laws, rules or regulations and other dynamics.
Furthermore, the stock markets have experienced price and volume fluctuations that have affected and continue to affect the market price of equity securities of many companies. These fluctuations have often been unrelated or disproportionate to the operating performance of these companies.
These broad market fluctuations, as well as general economic, systemic, political and market conditions, such as recessions, loss of investor confidence, interest rate changes or international currency fluctuations, may negatively affect the market price of our common stock.
If any of the foregoing occurs, it could cause our stock price to fall and may expose us to securities class action litigation that, even if unsuccessful, could be costly to defend and a distraction to management.
We may not pay cash dividends on our common stock.
Although we intend to pay dividends to our stockholders, we have no obligation to do so and may change our dividend policy at any time without notice to our stockholders. Holders of our common stock are only entitled to receive such cash dividends as our Boardits board of directors may declare out of funds legally available for such payments. Any decisionAlthough we have historically declared cash dividends on our common stock, we are not required to do so and may reduce or eliminate our common stock dividend in the future. This could adversely affect the market price of our common stock. Also, as a bank holding company, our ability to declare and pay dividends will beis dependent on a varietycertain federal regulatory considerations, including the guidelines of factors,the Federal Reserve Board regarding capital adequacy and dividends. Additionally, we are required to submit annual capital plans to the Federal Reserve for review before we can take certain capital actions, including declaring and paying dividends and repurchasing or redeeming capital securities. If our financial condition, earnings, legalcapital plan or any amendment to our capital plan is objected to for any reason, our ability to declare and pay dividends on our capital stock may be limited. Further, if we are unable to satisfy the capital requirements applicable to us for any reason, we may be limited in our ability to declare and other factors thatpay dividends on our Board deems relevant, as well as obtaining applicable regulatory consents and approvals as described undercapital stock. See “Regulation and Supervision,”Supervision” in Part I, Item 1 — Business, included elsewhere in this report, includingfor further discussion of the CCAR process. In addition, our abilityregulations to pay dividends may be limited by covenants of any future indebtedness we or our subsidiaries incur. As a result, you may not receive any return on an investment in our common stock unless you sell our common stock for a price greater than that which you paid for it. In addition, since we are a holding company with no significant assets other than the capital stock of our banking subsidiaries, we depend upon dividends from our banking subsidiaries for substantially all of our income. Accordingly, our ability to pay dividends depends primarily upon the receipt of dividends or other capital distributions from our banking subsidiaries. The ability of our banking subsidiaries to pay dividends to us is subject to, among other things, their earnings, financial condition and need for funds, as well as federal and state governmental policies and regulations applicable to us and our banking subsidiaries, which limit the
CITIZENS FINANCIAL GROUP, INC.
RISK FACTORS
amount that may be paid as dividends without prior regulatory approval. See “—We depend on our banking subsidiaries for most of our revenue, and restrictions on dividends and other distributions by our banking subsidiaries could affect our liquidity and ability to fulfill our obligations” and “Regulation and Supervision,” in Part I, Item 1 — Business, included elsewhere in this report.subject.
“Anti-takeover” provisions and the regulations to which we are subject may make it more difficult for a third party to acquire control of us, even if the change in control would be beneficial to stockholders.
We are a bank holding company incorporated in the state of Delaware. Anti-takeover provisions in Delaware law and our amended and restated certificate of incorporation and amended and restated bylaws, as well as regulatory approvals that would be required under federal law, could make it more difficult for a third party to take control of us and may prevent stockholders from receiving a premium for their shares of our common stock. These provisions could adversely affect the market price of our common stock and could reduce the amount that stockholders might get if we are sold.
These provisions include the following, some of which may only become effective when RBS no longer owns shares of our common stock representing at least 50% of our issued and outstanding capital stock:
the sole ability of our Board to fill a director vacancy on our Board;
advance notice requirements for stockholder proposals and director nominations;
provisions limiting the stockholders’ ability to call special meetings of stockholders, to require special meetings of stockholders to be called and to take action by written consent;
the approval of holders of at least 75% of the shares entitled to vote generally to amend, alter, change or repeal specified provisions, including those relating to actions by written consent of stockholders, calling of special meetings of stockholders, business combinations and amendment of our amended and restated certificate of incorporation and amended and restated bylaws; and
the ability of our Board to designate the terms of and issue new series of preferred stock without stockholder approval, which could be used, among other things, to institute a rights plan that would have the effect of significantly diluting the stock ownership of a potential hostile acquirer, likely preventing acquisitions that have not been approved by our Board.
We believe these provisions protect our stockholders from coercive or otherwise unfair takeover tactics by requiring potential acquirers to negotiate with our Board and by providing our Board with more time to assess any acquisition proposal. However, these provisions apply even if the offer may be determined to be beneficial by some stockholders and could delay or prevent an acquisition that our Board determines is not in our best interest and that of our stockholders.
Furthermore, banking laws impose notice, approval and ongoing regulatory requirements on any stockholder or other party that seeks to acquire direct or indirect “control” of an FDIC-insured depository institution. These laws include the Bank Holding Company Act and the Change in Bank Control Act. These laws could delay or prevent an acquisition.
CITIZENS FINANCIAL GROUP, INC.
ITEM 1B. UNRESOLVED STAFF COMMENTS
None.
ITEM 2. PROPERTIES
Our headquarters is in Providence, Rhode Island. As of December 31, 2014,2015, we leased approximately 5.65.5 million square feet of office and retail branch space. Our portfolio of leased space consisted of 3.73.6 million square feet of retail branch space which spanned eleven states and 1.9 million square feet of non-branch office space. As of December 31, 2014,2015, we owned an additional 800,000600,000 square feet of office and branch space. We operated 82 branches in Rhode Island, 4544 in Connecticut, 247246 in Massachusetts, 20 in Vermont, 7371 in New Hampshire, 146 in New York, 11 in New Jersey, 358 in Pennsylvania, 23 in Delaware, 116114 in Ohio and 97 in Michigan. Of these branches, 1,175 are1,171 were leased and the rest were owned. These properties were used by both the Consumer Banking and Commercial Banking segments. Management believes the terms of the various leases were consistent with market standards and were derived through arm’s-length bargaining. We also believe that our properties are in good operating condition and adequately serve our current business operations. We anticipate that suitable additional or alternative space, including those under lease options, will be available at commercially reasonable terms for future expansion.
ITEM 3. LEGAL PROCEEDINGS
Information required by this item is presented in Note 1617 “Commitments and Contingencies” to our audited Consolidated Financial Statements in Part II, Item 8 — Financial Statements and Supplementary Data, and is incorporated herein by reference.
ITEM 4. MINE SAFETY DISCLOSURES
Not applicable.
CITIZENS FINANCIAL GROUP, INC.
PART II
ITEM 5. MARKET FOR REGISTRANT'SREGISTRANT’S COMMON EQUITY, RELATED STOCKHOLDER MATTERS AND ISSUER PURCHASES OF EQUITY SECURITIES
The common stock of Citizens is traded on the New York Stock Exchange under the symbol “CFG.” As of February 18, 2015,January 5, 2016, our common stock was owned by two holdersone holder of record (RBSG International Holdings Limited and Cede(Cede & Co.) and approximately 31,500104,000 beneficial shareholders whose shares were held in “street name” through a broker or bank. Information regarding the high and low sale prices of our common stock and cash dividends declared on such shares, as required by this item, is presented in “Management’s Discussion and Analysis of Financial Condition and Results of Operations — Quarterly Results of Operations” in Part II, Item 7, included elsewhere in this report. Information regarding restrictions on dividends, as required by this Item, is presented in Note 2021 “Regulatory Matters” and Note 2627 “Parent Company Only Financials” to our audited Consolidated Financial Statements in Part II, Item 8 — Financial Statements and Supplementary Data, included elsewhere in this report. Information relating to compensation plans under which our equity securities are authorized for issuance is presented in “Security Ownership of Certain Beneficial Owners and Management and Related Stockholder Matters” in Part III, Item 12, included elsewhere in this report.
The following table provides information regarding our repurchases of common stock during the year ended December 31, 2014:
|
| | | | | | |
| Period | Total Number of Shares Repurchased | Average Price Paid Per Share | Total Number of Shares Purchased as Part of Publicly Announced Plans or Programs | Maximum Number of Shares That May Yet Be Purchased As Part of Publicly Announced Plans or Programs |
October 1, 2014 — October 30, 2014(1) | 14,297,761 |
| $23.36 |
| Not Applicable | Not Applicable |
(1)Represents shares purchased from RBS Group. For further information, see Note 12 "Stockholders' Equity" to our audited Consolidated Financial Statements in Part II, Item 8 — Financial Statements and Supplementary Data, included elsewhere in this report.
CITIZENS FINANCIAL GROUP, INC.
The following graph compares the cumulative total stockholder returns relative to the performance of the Standard & Poor’s 500 Composite Stock Index,500® index, a commonly referenced U.S. equity benchmark consisting of leading companies from a diversity ofdiverse economic sectors; the Keefe, Bruyette & Woods RegionalKBW Nasdaq Bank Index (“BKX”), composed of 24 leading national money center and regional banks and thrifts; and a group of other banks that constitute our regional banks peers (BB&T, Comerica, Fifth Third, KeyCorp, M&T, PNC, Regions, SunTrust and U.S. Bancorp) for our fiscal 2014 performance commencing onsince September 24, 2014, Citizens'Citizens’ initial day of trading. The graph assumes $100 invested at the closing price on September 24, 2014 in each of CFG common stock, the S&P 500 index, the BKX and the peer group average and assumes all dividends were reinvested on the date paid. The points on the graph represent the date our shares first began to trade on the NYSE and fiscal month-endquarter-end amounts based on the last trading day in each fiscal month.
quarter.
This graph shall not be deemed “soliciting material” or to be filed with the Securities and Exchange Commission for purposes of Section 18 of the Securities Exchange Act of 1934, as amended (“Exchange Act”), or otherwise subject to the liabilities under that Section, and shall not be deemed to be incorporated by reference into any filing of Citizens Financial Group, Inc. under the Securities Act of 1933, as amended, or the Exchange Act.
|
| | | | | | | | | | | | | | | |
| | 9/24/2014 |
| 9/30/2014 |
| 10/31/2014 |
| 11/30/2014 |
| 12/31/2014 |
|
| CFG |
| $100 |
|
| $101 |
|
| $102 |
|
| $107 |
|
| $108 |
|
| S&P 500 Index | 100 |
| 99 |
| 101 |
| 104 |
| 104 |
|
| KBW BKX Index | 100 |
| 98 |
| 99 |
| 100 |
| 103 |
|
| Peer Regional Bank Average |
| $100 |
|
| $99 |
|
| $100 |
|
| $102 |
|
| $105 |
|
|
| | | | | | | | | | | | | | | | | | | | | |
| | 9/24/2014 |
| 9/30/2014 |
| 12/31/2014 |
| 3/31/2015 |
| 6/30/2015 |
| 9/30/2015 |
| 12/31/2015 |
|
| CFG |
| $100 |
|
| $101 |
|
| $108 |
|
| $105 |
|
| $120 |
|
| $105 |
|
| $116 |
|
| S&P 500 Index | 100 |
| 99 |
| 104 |
| 105 |
| 105 |
| 98 |
| 105 |
|
| KBW BKX Index | 100 |
| 98 |
| 103 |
| 100 |
| 108 |
| 98 |
| 103 |
|
| Peer Regional Bank Average |
| $100 |
|
| $99 |
|
| $105 |
|
| $104 |
|
| $107 |
|
| $99 |
|
| $105 |
|
CITIZENS FINANCIAL GROUP, INC.
SELECTED CONSOLIDATED FINANCIAL DATA
ITEM 6. SELECTED CONSOLIDATED FINANCIAL DATA
We derived the selected Consolidated Statement of Operating data for the years ended December 31, 2015, 2014,, 2013, 2012 and the selected Consolidated Balance Sheet data as of December 31, 20142015 and 20132014 from our audited Consolidated Financial Statements in Part II, Item 8 — Financial Statements and Supplementary Data, included elsewhere in this report. We derived the selected Consolidated Statement of Operations data for the years ended December 31, 20112012 and 20102011 and the selected Consolidated Balance Sheet data as of December 31, 2013, 2012, 2011, and 20102011 from our audited Consolidated Financial Statements, not included herein. Our historical results are not necessarily indicative of the results expected for any future period.
You should read the following selected consolidated financial data in conjunction with “Management's“Management’s Discussion and Analysis of Financial Condition and Results of Operations” in Part II, Item 7 and our audited Consolidated Financial Statements and the Notes thereto in Part II, Item 8 — Financial Statements and Supplementary Data, both included elsewhere in this report.
| | | | For the Year Ended December 31, | For the Year Ended December 31, |
| (dollars in millions, except per share amounts) | 2014 | | 2013 | | 2012 | | 2011 | | 2010 | 2015 | | 2014 | | 2013 | | 2012 | | 2011 |
| OPERATING DATA: | | | | | | | | | | | | | | | | | | |
| Net interest income |
| $3,301 |
| |
| $3,058 |
| |
| $3,227 |
| |
| $3,320 |
| |
| $3,345 |
|
| $3,402 |
| |
| $3,301 |
| |
| $3,058 |
| |
| $3,227 |
| |
| $3,320 |
|
| Noninterest income | 1,678 |
| | 1,632 |
| | 1,667 |
| | 1,711 |
| | 1,733 |
| 1,422 |
| | 1,678 |
| | 1,632 |
| | 1,667 |
| | 1,711 |
|
| Total revenue | 4,979 |
| | 4,690 |
| | 4,894 |
| | 5,031 |
| | 5,078 |
| 4,824 |
| | 4,979 |
| | 4,690 |
| | 4,894 |
| | 5,031 |
|
| Provision for credit losses | 319 |
| | 479 |
| | 413 |
| | 882 |
| | 1,644 |
| 302 |
| | 319 |
| | 479 |
| | 413 |
| | 882 |
|
| Noninterest expense | 3,392 |
| | 7,679 |
| | 3,457 |
| | 3,371 |
| | 3,483 |
| 3,259 |
| | 3,392 |
| | 7,679 |
| | 3,457 |
| | 3,371 |
|
Noninterest expense, excluding goodwill impairment (1) | 3,392 |
| | 3,244 |
| | 3,457 |
| | 3,371 |
| | 3,483 |
| 3,259 |
| | 3,392 |
| | 3,244 |
| | 3,457 |
| | 3,371 |
|
| Income (loss) before income tax expense (benefit) | 1,268 |
| | (3,468 | ) | | 1,024 |
| | 778 |
| | (49 | ) | 1,263 |
| | 1,268 |
| | (3,468 | ) | | 1,024 |
| | 778 |
|
| Income tax expense (benefit) | 403 |
| | (42 | ) | | 381 |
| | 272 |
| | (61 | ) | 423 |
| | 403 |
| | (42 | ) | | 381 |
| | 272 |
|
| Net income (loss) | 865 |
| | (3,426 | ) | | 643 |
| | 506 |
| | 11 |
| 840 |
| | 865 |
| | (3,426 | ) | | 643 |
| | 506 |
|
Net income, excluding goodwill impairment (1) | 865 |
| | 654 |
| | 643 |
| | 506 |
| | 11 |
| 840 |
| | 865 |
| | 654 |
| | 643 |
| | 506 |
|
| Net income (loss) available to common stockholders | | 833 |
| | 865 |
| | (3,426 | ) | | 643 |
| | 506 |
|
Net income available to common stockholders, excluding goodwill impairment (1) | | 833 |
| | 865 |
| | 654 |
| | 643 |
| | 506 |
|
Net income (loss) per average common share - basic (2) | 1.55 |
| | (6.12 | ) | | 1.15 |
| | 0.90 |
| | 0.02 |
| 1.55 |
| | 1.55 |
| | (6.12 | ) | | 1.15 |
| | 0.90 |
|
Net income (loss) per average common share - diluted (2) | 1.55 |
| | (6.12 | ) | | 1.15 |
| | 0.90 |
| | 0.02 |
| 1.55 |
| | 1.55 |
| | (6.12 | ) | | 1.15 |
| | 0.90 |
|
Net income per average common share - basic, excluding goodwill impairment (1) (2) | 1.55 |
| | 1.17 |
| | 1.15 |
| | 0.90 |
| | 0.02 |
| 1.55 |
| | 1.55 |
| | 1.17 |
| | 1.15 |
| | 0.90 |
|
Net income per average common share - diluted, excluding goodwill impairment (1) (2) | 1.55 |
| | 1.17 |
| | 1.15 |
| | 0.90 |
| | 0.02 |
| 1.55 |
| | 1.55 |
| | 1.17 |
| | 1.15 |
| | 0.90 |
|
| Dividends declared and paid per common share | 1.43 |
| | 2.12 |
| | 0.27 |
| | — |
| | — |
| 0.40 |
| | 1.43 |
| | 2.12 |
| | 0.27 |
| | — |
|
| OTHER OPERATING DATA: | | | | | | | | | | | | | | | | | | |
Return on average common equity (3) | 4.46 | % | | (15.69 | %) | | 2.69 | % | | 2.19 | % | | 0.05 | % | 4.30 | % | | 4.46 | % | | (15.69 | %) | | 2.69 | % | | 2.19 | % |
Return on average common equity, excluding goodwill impairment (1) | 4.46 |
| | 3.00 |
| | 2.69 |
| | 2.19 |
| | 0.05 |
| 4.30 |
| | 4.46 |
| | 3.00 |
| | 2.69 |
| | 2.19 |
|
Return on average tangible common equity (1) | 6.71 |
| | (25.91 | ) | | 4.86 |
| | 4.18 |
| | 0.11 |
| 6.45 |
| | 6.71 |
| | (25.91 | ) | | 4.86 |
| | 4.18 |
|
Return on average tangible common equity, excluding goodwill impairment (1) | 6.71 |
| | 4.95 |
| | 4.86 |
| | 4.18 |
| | 0.11 |
| 6.45 |
| | 6.71 |
| | 4.95 |
| | 4.86 |
| | 4.18 |
|
Return on average total assets (4) | 0.68 |
| | (2.83 | ) | | 0.50 |
| | 0.39 |
| | 0.01 |
| 0.62 |
| | 0.68 |
| | (2.83 | ) | | 0.50 |
| | 0.39 |
|
Return on average total assets, excluding goodwill impairment (1) | 0.68 |
| | 0.54 |
| | 0.50 |
| | 0.39 |
| | 0.01 |
| 0.62 |
| | 0.68 |
| | 0.54 |
| | 0.50 |
| | 0.39 |
|
Return on average total tangible assets (1) | 0.71 |
| | (3.05 | ) | | 0.55 |
| | 0.43 |
| | 0.01 |
| 0.65 |
| | 0.71 |
| | (3.05 | ) | | 0.55 |
| | 0.43 |
|
Return on average total tangible assets, excluding goodwill impairment (1) | 0.71 |
| | 0.58 |
| | 0.55 |
| | 0.43 |
| | 0.01 |
| 0.65 |
| | 0.71 |
| | 0.58 |
| | 0.55 |
| | 0.43 |
|
Efficiency ratio (1) | 68.12 |
| | 163.73 |
| | 70.64 |
| | 67.00 |
| | 68.59 |
| 67.56 |
| | 68.12 |
| | 163.73 |
| | 70.64 |
| | 67.00 |
|
Efficiency ratio, excluding goodwill impairment (1) | 68.12 |
| | 69.17 |
| | 70.64 |
| | 67.00 |
| | 68.59 |
| 67.56 |
| | 68.12 |
| | 69.17 |
| | 70.64 |
| | 67.00 |
|
Net interest margin (5) | 2.83 |
| | 2.85 |
| | 2.89 |
| | 2.97 |
| | 2.78 |
| 2.75 |
| | 2.83 |
| | 2.85 |
| | 2.89 |
| | 2.97 |
|
CITIZENS FINANCIAL GROUP, INC.
SELECTED CONSOLIDATED FINANCIAL DATA
|
| | | | | | | | | | | | | | | | | | | |
| | As of December 31, |
| (in millions) | 2014 |
| | 2013 |
| | 2012 |
| | 2011 |
| | 2010 |
|
| BALANCE SHEET DATA: | | | | | | | | | |
| Total assets |
| $132,857 |
| |
| $122,154 |
| |
| $127,053 |
| |
| $129,654 |
| |
| $129,689 |
|
Loans and leases (6) | 93,410 |
| | 85,859 |
| | 87,248 |
| | 86,795 |
| | 87,022 |
|
| Allowance for loan and lease losses | 1,195 |
| | 1,221 |
| | 1,255 |
| | 1,698 |
| | 2,005 |
|
| Total securities | 24,676 |
| | 21,245 |
| | 19,417 |
| | 23,352 |
| | 21,802 |
|
| Goodwill | 6,876 |
| | 6,876 |
| | 11,311 |
| | 11,311 |
| | 11,311 |
|
| Total liabilities | 113,589 |
| | 102,958 |
| | 102,924 |
| | 106,261 |
| | 106,995 |
|
Total deposits (7) | 95,707 |
| | 86,903 |
| | 95,148 |
| | 92,888 |
| | 92,155 |
|
| Federal funds purchased and securities sold under agreements to repurchase | 4,276 |
| | 4,791 |
| | 3,601 |
| | 4,152 |
| | 5,112 |
|
| Other short-term borrowed funds | 6,253 |
| | 2,251 |
| | 501 |
| | 3,100 |
| | 1,930 |
|
| Long-term borrowed funds | 4,642 |
| | 1,405 |
| | 694 |
| | 3,242 |
| | 5,854 |
|
| Total stockholders' equity | 19,268 |
| | 19,196 |
| | 24,129 |
| | 23,393 |
| | 22,694 |
|
| | | | As of December 31, | As of December 31, |
| | 2014 | | 2013 | | 2012 | | 2011 | | 2010 | |
| (in millions) | | 2015 |
| | 2014 |
| | 2013 |
| | 2012 |
| | 2011 |
|
| BALANCE SHEET DATA: | | | | | | | | | | |
| Total assets | |
| $138,208 |
| |
| $132,857 |
| |
| $122,154 |
| |
| $127,053 |
| |
| $129,654 |
|
Loans and leases (6) | | 99,042 |
| | 93,410 |
| | 85,859 |
| | 87,248 |
| | 86,795 |
|
| Allowance for loan and lease losses | | 1,216 |
| | 1,195 |
| | 1,221 |
| | 1,255 |
| | 1,698 |
|
| Total securities | | 24,075 |
| | 24,704 |
| | 21,274 |
| | 19,439 |
| | 23,371 |
|
| Goodwill | | 6,876 |
| | 6,876 |
| | 6,876 |
| | 11,311 |
| | 11,311 |
|
| Total liabilities | | 118,562 |
| | 113,589 |
| | 102,958 |
| | 102,924 |
| | 106,261 |
|
Total deposits (7) | | 102,539 |
| | 95,707 |
| | 86,903 |
| | 95,148 |
| | 92,888 |
|
| Federal funds purchased and securities sold under agreements to repurchase | | 802 |
| | 4,276 |
| | 4,791 |
| | 3,601 |
| | 4,152 |
|
| Other short-term borrowed funds | | 2,630 |
| | 6,253 |
| | 2,251 |
| | 501 |
| | 3,100 |
|
| Long-term borrowed funds | | 9,886 |
| | 4,642 |
| | 1,405 |
| | 694 |
| | 3,242 |
|
| Total stockholders’ equity | | 19,646 |
| | 19,268 |
| | 19,196 |
| | 24,129 |
| | 23,393 |
|
| OTHER BALANCE SHEET DATA: | | | | | | | | | | | | | | | | | | |
| Asset Quality Ratios | | | | | | | | | | | | | | | | | | |
| Allowance for loan and lease losses as a % of total loans and leases | 1.28 | % | | 1.42 | % | | 1.44 | % | | 1.96 | % | | 2.30 | % | 1.23 | % | | 1.28 | % | | 1.42 | % | | 1.44 | % | | 1.96 | % |
| Allowance for loan and lease losses as a % of nonperforming loans and leases | 109 |
| | 86 |
| | 67 |
| | 95 |
| | 85 |
| 115 |
| | 109 |
| | 86 |
| | 67 |
| | 95 |
|
| Nonperforming loans and leases as a % of total loans and leases | 1.18 |
| | 1.65 |
| | 2.14 |
| | 2.06 |
| | 2.71 |
| 1.07 |
| | 1.18 |
| | 1.65 |
| | 2.14 |
| | 2.06 |
|
| Capital ratios | | | | | | | | | | |
Tier 1 risk-based capital ratio (8) | 12.4 |
| | 13.5 |
| | 14.2 |
| | 13.9 |
| | 13.0 |
| |
Total risk-based capital ratio (9) | 15.8 |
| | 16.1 |
| | 15.8 |
| | 15.1 |
| | 14.4 |
| |
Tier 1 common equity ratio (10) | 12.4 |
| | 13.5 |
| | 13.9 |
| | 13.3 |
| | 12.5 |
| |
Tier 1 leverage ratio (11) | 10.6 |
| | 11.6 |
| | 12.1 |
| | 11.6 |
| | 10.4 |
| |
Capital Ratios:(8) | | | | | | | | | | |
CET1 capital ratio (9) | | 11.7 |
| | 12.4 |
| | 13.5 |
| | 13.9 |
| | 13.3 |
|
Tier 1 capital ratio (10) | | 12.0 |
| | 12.4 |
| | 13.5 |
| | 14.2 |
| | 13.9 |
|
Total capital ratio (11) | | 15.3 |
| | 15.8 |
| | 16.1 |
| | 15.8 |
| | 15.1 |
|
Tier 1 leverage ratio (12) | | 10.5 |
| | 10.6 |
| | 11.6 |
| | 12.1 |
| | 11.6 |
|
(1) These measures are non-GAAP financial measures. For more information on the computation of these non-GAAP financial measures, see “Management’s Discussion and Analysis of Financial Condition and Results of Operations — Principal Components of Operations and Key Performance Metrics Used By Management — Key Performance Metrics and Non-GAAP Financial Measures” in Part II, Item 7, included elsewhere in this report.
(2) Earnings per share information reflects a 165,582-for-1 forward stock split effective on August 22, 2014.
(3) We define “Return“Return on average common equity” is defined as net income (loss) available to common stockholders divided by average common equity.
(4) We define “Return“Return on average total assets” is defined as net income (loss) divided by average total assets.
(5) We define “Net“Net interest margin” is defined as net interest income divided by average total interest-earning assets.
(6) Excludes loans held for sale of $365 million, $281 million, $1.3 billion, $646 million, $564 million, and $716$564 million as of December 31, 2015, 2014, 2013, 2012, 2011, and 2010,2011, respectively.
(7) Excludes deposits held for sale of $5.3 billion as of December 31, 2013.
(8) “TierBasel III transitional rules for institutions applying the Standardized approach to calculating risk-weighted assets became effective January 1, 2015. The capital ratios and associated components as of December 31, 2015 are prepared using the Basel III Standardized transitional approach. The capital ratios and associated components for periods December 31, 2014 and prior are prepared under the Basel I general risk-based capital ratio” is Tierrule.
(9) CET1 under Basel III replaced the concept of tier 1 common capital that existed under Basel I effective January 1, 2015. “Common equity tier 1 capital balanceratio” as of December 31, 2015 represents CET1 divided by total risk-weighted assets as defined under Basel I.III Standardized approach. The “tier 1 common capital ratio” reported prior to January 1, 2015, represented tier 1 common equity divided by total risk-weighted assets as defined under the Basel I general risk-based capital rule.
(9)(10) “Total risk-basedTier 1 capital ratio” is totaltier 1 capital, balancewhich includes CET1 capital plus non-cumulative perpetual preferred equity that qualifies as additional tier 1 capital, divided by total risk-weighted assets as defined under Basel I.III Standardized approach. The “tier 1 capital ratio” reported prior to January 1, 2015, represented tier 1 capital divided by total risk-weighted assets as defined under the Basel I general risk-based capital rule.
(10)(11) “Tier 1 common equityTotal capital ratio” is Tier 1total capital balance, minus preferred stock, divided by total risk-weighted assets as defined under Basel I.III Standardized approach. The “Total capital ratio” reported prior to January 1, 2015, represented total capital divided by total risk-weighted assets as defined under the Basel I general risk-based capital rule.
(11)(12) “Tier 1 leverage ratio” is Tiertier 1 capital balance divided by quarterly average total assets as defined under Basel I.III Standardized approach. The “tier 1 leverage ratio” reported prior to January 1, 2015, represented tier 1 capital divided by quarterly average total assets as defined under the Basel I general risk-based capital rule.
CITIZENS FINANCIAL GROUP, INC.
MANAGEMENT'SMANAGEMENT’S DISCUSSION AND ANALYSIS
ITEM 7. MANAGEMENT’S DISCUSSION AND ANALYSIS OF FINANCIAL CONDITION AND RESULTS OF OPERATIONS
CITIZENS FINANCIAL GROUP, INC.
MANAGEMENT'SMANAGEMENT’S DISCUSSION AND ANALYSIS
CITIZENS FINANCIAL GROUP, INC.
MANAGEMENT'SMANAGEMENT’S DISCUSSION AND ANALYSIS
Overview
We wereare one of the 13thnation’s oldest and largest retail bank holding company in the United Statesfinancial institutions, with $138.2 billion of total assets as of December 31, 20142015, according to SNL Financial, with $132.9 billion of total assets.. Headquartered in Providence, Rhode Island, we deliver a broad range of retail and commercial banking products and services to individuals, institutions and companies. Our approximately 17,700 employeescolleagues strive to meet the financial needs of customers and prospects through approximately 1,200 branches and approximately 3,200 ATMs operated in an 11-state footprint across11 states in the New England, Mid-Atlantic and Midwest regions and through our online, telephone and mobile banking platforms. We conduct our banking operations through our two wholly-owned banking subsidiaries, Citizens Bank, National AssociationN.A. and Citizens Bank of Pennsylvania.
We operate our business through two operating segments: Consumer Banking and Commercial Banking. Consumer Banking accounted for $47.7$51.5 billion and $45.1$47.7 billion, or approximately 53% and 53% of our average loan and lease balances (including loans held for sale) for both the yearsyear ended December 31, 20142015 and 2013, respectively.2014. Consumer Banking serves retail customers and small businesses with annual revenues of up to $25 million with products and services that include deposit products, mortgage and home equity lending, student loans, auto financing, credit cards, business loans and wealth management and investment services.
Commercial Banking accounted for $37.7$41.6 billion and $34.6$37.7 billion, or approximately 42%43% and 40%42% of our average loan and lease balances (including loans held for sale) for the years ended December 31, 20142015 and 2013,2014, respectively. Commercial Banking offers corporate, institutional and not-for-profit clients a broad complementfull range of financialwholesale banking products and solutions,services including lending and leasing, trade financing, deposit anddeposits, capital markets, treasury management,services, foreign exchange and interest rate risk management, corporatehedging, leasing and asset finance, specialty finance and debt and equity capital markets capabilities.trade finance.
As of December 31, 20142015 and 2013,2014, we had $3.1$2.3 billion and $3.8$3.1 billion, respectively, of non-core asset balances, which were included in Other along with our treasury function, securities portfolio, wholesale funding activities, goodwill, community development assets and other unallocated assets, liabilities, capital, revenues, provision for credit losses and expenses not attributed to the Consumer Banking or Commercial Banking segments. Non-core assets are primarily loans inconsistent with our strategic goals, generally as a result of geographic location, industry, product type or risk level. We have actively managed these assets down since they were designated as non-core on June 30, 2009, and the2009; this portfolio has decreased a further 19%by an additional 25% as of December 31, 20142015 compared to December 31, 2013.2014. The largest component of our non-core portfolio is our home equity products serviced by others (a portion of which we now service internally).
Recent Events
On December 4, 2014, our subsidiary, CBNA,3, 2015, the Company issued $1.5 billion aggregate principal amount of senior notes (collectively, the “senior notes”). The senior notes consisted of $750 million of 1.600% senior unsecured4.300% fixed-rate subordinated notes due December 2017 at an issue price of 99.947%2025, and used the proceeds to repurchase $750 million of 2.450% senior unsecured notes due December 2019 at an issue price of 99.906%. The senior notes were offered under the Bank's Global Bank Note Program dated December 1, 2014. The Bank used the proceeds for general corporate purposes. The securities have not been registered under the Securities Act of 1933. subordinated debt held by RBS.
On September 29, 2014, we completedNovember 23, 2015, The Company announced that the initial public offering through the sale byCompany had reached agreement with RBS Groupto address RBS’s then ownership of 161,000,000 shares, or 28.8%, of our common stock, which included the full exercise$2 billion of the underwriters’ option to purchase an additional 21,000,000 shares. Our common stock began trading onsubordinated notes. On December 3, 2015, the New York Stock Exchange on September 24, 2014, under the ticker symbol “CFG.” Subsequently, on October 8, 2014, we executed a capital exchange transaction with RBS Group which involved the issuance of $334 million of 10-year subordinated notes at a rate of 4.082% and the simultaneous repurchase of 14,297,761 shares of common stock owned by RBS Group at an average price per share of $23.36. We plan to continue our strategy of capital optimization by repurchasing an additional $500 million toCompany repurchased $750 million of the subordinated notes held by RBS. In addition, the Company secured the ability through July 2016 to purchase $500 million of our shares of common stock with the proceeds from the issuance of preferred stock, subordinated debt, or senior debt in 2015 and 2016,notes held by RBS, subject to regulatory approval and market conditions. Upon completionratings agency considerations. The remaining $750 million of the capital transaction withsubordinated notes held by RBS Group on October 8, 2014, RBS Group owned 70.5%includes $333 million of the outstanding common stock5.158% Fixed-to-Floating Callable Notes due 2023 and callable in 2018, $250 million of CFG. For additional information, see “—Capital.”
4.153% Notes due 2024, and $167 million of 4.023% Notes due 2024.
On June 20, 2014, weNovember 3, 2015, RBS completed the sale of certain assetsall of its remaining shares of CFG’s common stock. In the registered underwritten public offering, RBS sold 110,461,782 shares, or 20.9% of CFG’s outstanding common stock, to the underwriters at a price of $23.38 per share. In connection with completion of the offering, Mr. Robert Gillespie, who served as RBS’s board representative, resigned from the CFG Board of Directors, effective November 3, 2015. The CFG Board of Directors appointed Christine Cumming, former First Vice President and liabilities associated with our Chicago-area retail branches, small business relationships and select middle market relationshipsChief Operating Officer for the Federal Reserve Bank of New York, to U.S. Bancorp. The agreement to sell these assets and liabilities to U.S. Bancorp had previously been announced in January 2014. This sale included 103 branches, including 94 full-service branches, with $4.8 billion of deposits and $1.0 billion in loansthe board effective as of June 20, 2014. We recorded a pre-tax gain onOctober 1, 2015.
On August 3, 2015, RBS completed the sale of $28898,900,000 shares, or 18.4%, of CFG’s outstanding common stock, at a public offering price of $26.00 per share. On the same day, CFG used the net proceeds of its public offering of $250 million and also incurred related expensesaggregate principal amount 4.350% Subordinated Notes due 2025 issued on July 31, 2015, to repurchase 9,615,384 shares of $17 million. Management estimates thatits outstanding common stock directly from RBS at $26.00 per share. Immediately following the Chicago Divestiture hascompletion of this stock repurchase transaction, RBS owned 110,461,782 shares, or 20.9%, of CFG’s outstanding common stock.
On April 6, 2015, we completed a private offering of $250 million, or 250,000 shares, of 5.500% fixed-to-floating rate non-cumulative perpetual Series A Preferred Stock, par value of $25.00 per share with a liquidation preference $1,000 per share (the “Preferred Stock”). The net proceeds of the effectPreferred Stock offering were used to repurchase 10,473,397 shares of reducing quarterly net interest income by approximately $13 million, noninterest income by approximately $12 million andour common stock from RBS, at a purchase price equal to the volume-weighted average price of our common stock for all traded volume during the five trading days preceding the repurchase agreement date of April 1, 2015.
On March 30, 2015, RBS completed the sale of 155,250,000 shares, or 28%, of our outstanding common stock at a price to the public of $23.75 per share.
CITIZENS FINANCIAL GROUP, INC.
MANAGEMENT'SMANAGEMENT’S DISCUSSION AND ANALYSIS
noninterest expense by approximately $21 million. We intend to invest the majority of the sale proceeds over time into higher returning activities.
On May 29, 2014, we entered into an agreement with a third party to purchase predominantly prime auto loans, including an initial purchase of $150 million in principal balances of loans. On the same date, we entered into an agreement with the same party to purchase auto loans for future rolling 90-day periods that automatically renew until termination by either party. For the first year ended May 29, 2015, we are required to purchase a minimum of $250 million in principal balances of loans up to a maximum of $600 million in principal balances of loans per rolling 90-day period. After May 29, 2015, the minimum per each rolling 90-day period increases to $400 million in principal balances of loans, with a maximum of $600 million in principal balances of loans. We may cancel the agreement at any time at will; however, if we elect to cancel at any time during the first three years of the agreement, we will be charged a variable termination fee.
Key Factors Affecting Our Business
Macro-economic conditions
Our business is affected by national regional and localregional economic conditions, as well as the perception of thosefuture conditions and future economic prospects. The significant macro-economic factors that impact our business are: the U.S. and global economic landscapes, unemploymentinclude interest rates, the health of the housing marketsmarket, the rate of the U.S.’s economic expansion, and interest rates.unemployment levels.
The U.S. economy as measuredcontinued to expand at a moderate pace, with real GDP rising by the real gross domestic product (“GDP”), expanded 2.4% in 2015, following 2.4% growth in 2014. Growth in household spending has declined and the year ended December 31, 2014, driven by gainshousing sector has slowed as well with the three month average of existing home sales falling to 5.2 million units from 5.5 million units in personal consumption, non-residentialthe previous quarter. Business fixed investment and inventory investment,net exports remained soft.
The labor market continued to improve, with growth in the fourth quarter of 2.6%. This expansion followed considerable improvement in the economic landscape in the United States in 2013, with GDP growth of 2.2%. We currently expect that U.S. GDP growth in 2015 may be challenged by a stronger dollarmoderate job gains and weak international growth. The Euro area economy (“EU18”) expanded 0.3% in the year ended December 31, 2014, after having emerged from recession in the second half of 2013. Concerns of deflation and less favorable financial condition added to fears of a weaker recovery in Europe. In response, on January 22, 2015, the European Central Bank announced a new quantitative easing plan that includes the purchasing of €60 billion of assets per month, at least through September 2016, contributing to the low domestic rate environment.
declining unemployment. The U.S. unemployment rate dropped to 5.0% at December 31, 2015 from 5.6% at December 31, 2014 from 6.7% at December 31, 2013. The overall improvement was partially driven2014. Average monthly nonfarm employment increased by 228,000 in 2015, after increasing a decrease in the labor force participation rate, which declined to its lowest level in over 35 years. U.S job growth has been a key support to GDP growth, with the economy adding three million jobsrevised 251,000 in 2014. After a pause in the first quarter of 2014, and a recovery through the second quarter, the housing market moved sideways in the fourth quarter of 2014, as demonstrated by a trendline in new and existing home sales as well as flat to modestly declining prices.
The Federal Reserve BoardFRB maintained very accommodative monetary policy conditions during 2014, continuing2015, notwithstanding the small 25 bps rate increase in December, and continues to effectively target a zero0.25% to 0.50% federal funds rate range at the short end of the yield curve, and through its quantitative easing programs, purchasing Treasury and agency mortgage-backed securities in the intermediate and long end of the yield curve. The Federal Reserve ended its quantitative easing purchases on October 29, 2014. Interest rates remain relatively low. See “—Interest rates” below for further discussion of the impact of interest rates on our results.
Observable inflation levels remain below the FRB’s longer-term objective of 2%. Further labor market improvement and the dissipation of the effects of a decline in energy and import prices are expected to bring inflation closer to the FRB’s inflation objective.
Credit trends
Credit trends continued to improveremained favorable in 2014 as evidenced by2015 with a continuedyear-over-year reduction in both net charge-offs and nonperforming loans. Net charge-offs in 2015 of $284 million decreased $39 million from $323 million decreased $178 million, or 36%, from $501 million in 2013.2014, driven by favorable credit conditions and higher recoveries. Annualized net charge-offs as a percentage of total average loans improved to 0.30% in 2015, compared to 0.36% in 2014, compared to 0.59% in 2013. We currently expect overall charge-off rates to increase marginally in 20152014. Asset quality remained strong and 2016 as commercial recovery opportunities dissipate, home prices stabilize and non-core portfolios continue to decrease.within expectations.
Interest rates
Net interest income is our largest source of revenue and is the difference between the interest earned on interest-earning assets (usually loans and investment securities) and the interest expense incurred in connection with interest-bearing liabilities (usually deposits and borrowings). The level of net interest income is primarily a function of the average balance of interest-earning assets, the average balance of interest-bearing liabilities and the spread between the contractual yield on such assets and the contractual cost of such liabilities. These factors are influenced by both the pricing and mix of interest-earning assets and interest-bearing liabilities which, in turn, are impacted by external factors such as local economic conditions, competition for loans and deposits, the monetary policy of the Federal Reserve BoardFRB and market interest rates. For further discussion, refer to “—Risk Governance” and “—Market Risk — Non-Trading Risk.”
CITIZENS FINANCIAL GROUP, INC.
MANAGEMENT'S DISCUSSION AND ANALYSIS
The cost of our deposits and short-term wholesale borrowings is largely based on short-term interest rates, which are primarily driven by the Federal Reserve Board’sFRB’s actions. However, the yields generated by our loans and securities are typically driven by both short-term and long-term interest rates, which are set by the market or, at times, by the Federal Reserve Board’sFRB’s actions. The level of net interest income is therefore influenced by movements in such interest rates and the pace at which such movements occur. In 20132014 and 2014,2015, short-term and long-term interest rates remained at very low levels by historical standards, with many benchmark rates, such as the federal funds rate and one- and three-month LIBOR, near zero. Further declines in the yield curve or a decline in longer-term yields relative to short-term yields (a flatter yield curve) would have an adverse impact on our net interest margin and net interest income.
In 20132014 and 2014,2015, the Federal Reserve BoardFRB maintained a highly accommodative monetary policy, and indicated that this policy would remain in effect for a considerable time after its asset purchase program ended on October 29, 2014 and the economic recovery strengthens in the United States. More recently, the FRB has started to move down the path of interest rate normalization by raising the federal funds rate by 25 basis points. However, the FRB will likely continue to target a highly accommodative monetary policy for some time to come. As of December 31, 20142015, the Federal ReserveFRB had ended its asset purchases of Treasury securities and agency mortgage-backed securities. However, until further notice, the Federal ReserveFRB will continue to re-invest runoffrun off from its $1.7 trillion mortgage-backed portfolio.
CITIZENS FINANCIAL GROUP, INC.
MANAGEMENT’S DISCUSSION AND ANALYSIS
Regulatory trends
We are subject to extensive regulation and supervision, which continue to evolve as the legal and regulatory framework governing our operations continues to change. The current operating environment also has heightened regulatory expectations around many regulations including consumer compliance, the Bank Secrecy Act, and anti-money laundering compliance, and increased internal audit activities. As a result of these heightened expectations, we expect to incur additional costs for additional compliance personnel and/or professional fees associated with advisors and consultants.
Dodd-Frank regulation
As described under “Regulation and Supervision” in Part I, Item 1 — Business included elsewhere in this report, we are subject to a variety of laws and regulations, including the Dodd-Frank Act. The Dodd-Frank Act is complex, and many aspects of the Dodd-Frank Act are subject to final rulemaking or phased implementation that will take effect over several years. The Dodd-Frank Act will continue to impact our earnings through fee reductions, higher costs and imposition of new restrictions on us. The Dodd-Frank Act may also continue to have a material adverse impact on the value of certain assets and liabilities held on our balance sheet. The ultimate impact of the Dodd-Frank Act on our business will depend on regulatory interpretation and rulemaking as well as the success of any of our actions to mitigate the negative impacts of certain provisions. Key parts of the Dodd-Frank Act that specifically impact our business are the repeal of a previous prohibition against payment of interest on demand deposits, which became effective in July 2011, and the introduction of a stress-testingcapital planning and capital planningstress-testing framework developed by the Federal Reserve Board,FRBG, known as CCAR and the Dodd-Frank Act Stress Test (“DFAST”) framework.DFAST. The DFAST process projects net income, loan losses and capital ratios overduring a nine-quarter horizon under hypothetical, stressful macroeconomic and financial market scenarios developed by the Federal Reserve BoardFRBG as well as certain mandated assumptions about capital distributions prescribed in the DFAST rule. During the third quarter
In March and July of 2014, as part of our obligations under DFAST,2015 we published estimated impacts of stress, as required by applicable regulation processes, which may be accessed on our regulatory filings and disclosures page on http://investor.citizensbank.com. In 2016, we will publish the results of our mid-cycle severely adverse scenario.disclosure requirements in June and October. Consistent with the purpose of the DFAST processthese exercises and the assumptions used in order to assess our likely performance during hypothetical economic conditions, the projected results under the DFAST severely adverserequired stress scenarios show severe negative impacts on earnings. However, these pro forma results should not be interpreted to be management expectations in light of the current economic and operating environment.
Repeal During March 2015, the Federal Reserve also published results from the latest supervisory stress tests performed for and by large bank holding companies supervised by the Federal Reserve (See FRB website). In 2016, the Federal Reserve is expected to publish results from the 2016 supervisory stress test performed for and by large bank holding companies supervised by the Federal Reserve in June. These tests are conducted and published by the FRB annually in fulfillment of the prohibition on depository institutions paying interest on demand deposits
We began offering interest-bearing corporate checking accounts after the 2011 repeal of the prohibition on depository institutions paying interest on demand deposits. Currently, industrywide interest rates for this product are very lowCCAR and thus far the impact of the repeal has not had a significant effect on our results. However, market rates could increase more significantly in the future. If we need to pay higher interest rates on checking accounts to maintain current clients or attract new clients, our interest expense would increase, perhaps materially. Furthermore, if we fail to offer interest rates at a sufficient level to retain demand deposits, our core deposits may be reduced, which would require us to obtain funding in other ways or limit potential future asset growth.DFAST requirements.
Comprehensive Capital Analysis and Review
CCAR is an annual exercise by the Federal Reserve BoardFRBG to ensure that the largest bank holding companies have sufficient capital to continue operations throughout times of economic and financial stress and robust forward-looking capital planning processes that account for their unique risks.
CITIZENS FINANCIAL GROUP, INC.
MANAGEMENT'S DISCUSSION AND ANALYSIS
As part of CCAR, the Federal Reserve BoardFRBG evaluates institutions’ capital adequacy, internal capital adequacy assessment processes and their plans to make capital distributions, such as dividend payments or stock repurchases. In March 2014, the Federal Reserve Board objected on qualitative groundsThe FRBG may either object to our capital plan, submitted asin whole or in part, or provide a notice of non-objection. If the CCAR process. In additionFRBG objects to modificationsour capital plan, we may be requirednot make any capital distribution other than those with respect to make in connection withwhich the FRBG has indicated its non-objection.
In March 2015, the FRBG assessed our proposedcurrent capital distributions throughplan as submitted and documented under the CCAR process and raised no objection to the plan. Unless we may incur additional expenses in connection withchoose to file an amended capital plan prior to April 2016, the CCAR process that would affect our profitability and results of operations. The Federal Reserve Board is currently conducting a review of the capital plans submitted by us and other large bank holding companies in January 2015. Themaximum levels at which we will be able tomay declare dividends and repurchase shares of our common stock after Marchthrough June 30, 2016 are governed by our 2015 capital plan, subject to actual financial performance and ongoing compliance with internal governance and all other regulatory requirements.
For subsequent cycles, beginning in 2016, BHCs will depend onbe required to submit their annual capital plans and stress testing results to the Federal Reserve Board’s qualitative and quantitative assessment of our capital plan and our projected performance under the stress scenarios. The Federal Reserve announced on February 12, 2015 that results from the latest supervisory stress tests conducted as partor before April 5.
Repeal of the Dodd-Frank Actprohibition on depository institutions paying interest on demand deposits
We began offering interest-bearing corporate checking accounts after the 2011 repeal of the prohibition on depository institutions paying interest on demand deposits. Currently, industrywide interest rates for large bank holding companies supervised bythis product are very low and thus far the Federal Reserve willimpact of the repeal has not had a significant effect on our results. However, market rates could increase more significantly in the future. If we need to pay higher interest rates on checking accounts to maintain current clients or attract new clients, our interest expense would increase, perhaps materially. Furthermore, if we fail to offer interest rates at a sufficient level to retain demand deposits, our core deposits may be released on March 5, 2015 and the related results from the CCAR will be released on March 11, 2015.reduced, which would require us to obtain funding in other ways or limit potential future asset growth.
CITIZENS FINANCIAL GROUP, INC.
MANAGEMENT’S DISCUSSION AND ANALYSIS
Basel III final rules applicable to us and our banking subsidiaries
In July 2013, the Federal Reserve Board,FRB, OCC, and FDIC issued the U.S. Basel III final rules. The final rules implementsimplement the Committee on Banking Supervision’s Basel III capital framework and certain provisions of the Dodd-Frank Act, including the Collins Amendment. Certain aspects of theThe U.S. Basel III final rules such assubstantially revised the new minimumrisked-based capital ratios,and leverage requirements applicable to bank holding companies and their insured depository institution subsidiaries, including CBNA and CBPA. The U.S. Basel III final rules became effective for CFG and its depository institution subsidiaries, including CBNA and CBPA, on January 1, 2015.2015 (subject to a phase-in period for certain provisions). In order to comply with the new capital requirements, we established internal capital ratio targets that meet or exceed U.S. regulatory expectations under fully phased-in Basel III rules, and as a resultincreased our capital requirements were increased.in anticipation of the transition that is underway.
HELOC Payment Shockpayment shock
Recent attentionAttention has been given by regulators, rating agencies, and the general press regarding the potential for increased exposure to credit losses associated with HELOCs that were originated during the period of rapid home price appreciation between 2003 and 2007. Industrywide, many of the HELOCs originated during this timeframe were structured with an extended interest-only payment period followed by a requirement to convert to a higher payment amount that would begin fully amortizing both principal and interest beginning at a certain date in the future. As of December 31, 2014,2015, approximately 29% of our $16.0$15.1 billion HELOC portfolio, or $4.6$4.4 billion in drawn balances, and $3.8 billion in undrawn balances were subject to a payment reset or balloon payment between January 1, 20152016 and December 31, 2017,2018, including $245$80 million in balloon balances where full payment is due at the end of a ten-year interest only draw period.
To help manage this exposure, in September 2013 we launched a comprehensive program designed to provide heightened customer outreach to inform, educate and assist customers through the reset process as well as to offer alternative financing and forbearance options. Preliminary resultsResults indicate that our efforts to assist customers at risk of default have successfully reduced delinquency and charge-off rates compared to our original expectations.
As of December 31, 2014,2015, for the $898 million of our HELOC portfolio that was originally structured with a reset period in 2014, 93.7% of the balances were refinanced, paid off or were current on payments, 4.9% were past due and 1.4% had been charged off. As of December 31, 2014, for the $668 million$1.6 billion of our HELOC portfolio that was originally structured with a reset period in 2013 93.2%and 2014, 94% of the balances had beenwere refinanced, paid off or were current on payments, 3.4%3% were past due and 3.4%3% had been charged off. As of December 31, 2015, for the $1.3 billion in balances originally structured with a reset period in 2015, 94% of the balances were refinanced, paid off or were current on payments, 5% were past due and 1% had been charged off. A total of $1.4 billion in$995 million of these balances are structured with ascheduled to reset period in 2015.2016. Factors that affect our future expectations for charge-off risk for the portion of our HELOC portfolio subject to reset periods in the future include improved loan-to-value ratios resulting from continued home price appreciation, stable portfolio credit score profiles and more robust loss mitigation efforts.
Factors Affecting Comparability of Our Results
Goodwill
During the 19-year period from 1988 to 2007, we completed a series of more than 25 acquisitions of other financial institutions and financial assets and liabilities. We accounted for these types of business combinations using the purchase method of accounting. Under this accounting method, the acquired company’s net assets are recorded at fair value at the date of acquisition, and the difference between the purchase price and the fair value of the net assets acquired is recorded as goodwill.
Under relevant accounting guidance, we are required to review goodwill for impairment annually, or more frequently if events or circumstances indicate that the fair value of any of our business units might be less than its carrying value. The valuation of goodwill is dependent on forward-looking expectations related to the performance of the U.S. economy and our associated financial performance.
CITIZENS FINANCIAL GROUP, INC.
MANAGEMENT'S DISCUSSION AND ANALYSIS
The prolonged delay in the full recovery of the U.S. economy, and the impact of that delay on our earnings expectations, prompted us to record a $4.4 billion pre-tax ($4.1 billion after-tax) goodwill impairment as of June 30, 2013 related to our Consumer Banking reporting unit. For segment reporting purposes, the impairment charge is reflected in Other.
Although the U.S. economy had at the time demonstrated signs of recovery, notably improvements in unemployment and housing, the pace and extent of recovery in these indicators, as well as in overall gross domestic product, lagged behind previous expectations. The impact of the slow recovery was most evident in Consumer Banking. The forecasted lower economic growth for the United States, coupled with increasing costs of complying with the new regulatory framework in the financial industry, resulted in a deceleration of expected growth for Consumer Banking’s future income, which resulted in our recording of a goodwill impairment charge during the second quarter of 2013. We have recorded goodwill impairment charges in the past, most recently in 2013, and any further impairment to our goodwill could materially affect our results in any given period. As of both December 31, 20142015 and 2013,2014, we had a carrying value of goodwill of $6.9 billion. For additional information regarding our goodwill impairment testing, see Note 1 “Significant Accounting Policies” and Note 89 “Goodwill” to our audited Consolidated Financial Statements in Part II, Item 8 — Financial Statements and Supplementary Data, included elsewhere in this report.
CITIZENS FINANCIAL GROUP, INC.
MANAGEMENT’S DISCUSSION AND ANALYSIS
Investment in our business
We regularly incur expenses associated with investments in our infrastructure, and,infrastructure. For example, from 2010 to 2014,2015 we invested more than $1.3$1.6 billion in infrastructure and technology, and plan to invest an additional $280a total of $245 million in 20152016 and about $170$160 million in 2016.2017. We invested $219 million in our infrastructure in 2015. These investments, which are designed to lower our operating costs and improve our customer experience, include significant programs to enhance our resiliency, upgrade customer-facing technology and streamline operations. Recent significant investments included the 2013 launch of our new teller system, new commercial loan platform and new auto loan platform and the 2013 upgrade of the majority of our ATM network, including equipping more than 1,450 ATMs with advanced deposit-taking functionality as well as additional investment in our Treasury Services platform. These investments also involved spending to prepare forSolutions platform in 2014. In the planned rolloutthird quarter of 2015 we enhanced our data resiliency via a new back up data center and began rolling out a new mortgage platform. We expect that these investments will increase our long-term overall efficiency and add to our capacity to increase revenue.
Operating expenses to operate as a fully independent public company
As part of our transition to a stand-alonefully independent public company, we expect to incurincurred cumulative one-time expenditures of approximately $55$52 million overthrough the courseend of 2014 to 2016,2015, including capitalized costs of $18approximately $14 million, as well as ongoing incremental expenses of approximately $34 million per year, which were substantially reflected in our run-rate at the end of 2014. We expect theseyear. These ongoing costs will include higher local charges associated with exiting worldwide vendor relationships and incremental expenses to support information technology, compliance, corporate governance, regulatory, financial and risk infrastructure that are necessary to enable us to operate as a fully stand-aloneindependent public company.
Principal Components of Operations and Key Performance Metrics Used by Management
As a banking institution, we manage and evaluate various aspects of both our results of operations and our financial condition. We evaluate the levels and trends of the line items included in our balance sheet and statement of operations, as well as various financial ratios that are commonly used in our industry. We analyze these ratios and financial trends against our own historical performance, our budgeted performance and the financial condition and performance of comparable banking institutions in our region and nationally.
The primary line items we use in our key performance metrics to manage and evaluate our statement of operations include net interest income, noninterest income, total revenue, provision for credit losses, noninterest expense and net income (loss). The primary line items we use in our key performance metrics to manage and evaluate our balance sheet data include loans and leases, securities, allowance for credit losses, deposits, borrowed funds and derivatives.
Net interest income
Net interest income is the difference between the interest earned on interest-earning assets (usually loans and investment securities) and the interest expense incurred in connection with interest-bearing liabilities (usually deposits and borrowings). The level of net interest income is primarily a function of the average balance of interest-earning assets, the average balance of interest-bearing liabilities and the spread between the contractual yield on such assets and the cost of such liabilities. Net interest income is impacted by the relative mix of interest-earning assets and interest-bearing liabilities, movements in market interest rates, levels of nonperforming assets and pricing pressure from competitors. The mix of interest-earning assets is influenced by loan demand and by management’s continual assessment of the rate of return and relative risk associated with various classes of interest-earning assets.
CITIZENS FINANCIAL GROUP, INC.
MANAGEMENT'S DISCUSSION AND ANALYSIS
The mix of interest-bearing liabilities is influenced by management’s assessment of the need for lower cost funding sources weighed against relationships with customers and growth requirements and is impacted by competition for deposits in our market and the availability and pricing of other sources of funds.
Noninterest income
The primary components of our noninterest income are service charges and fees, card fees, trust and investment services fees and securities gains, net.
mortgage banking fees.
Total revenue
Total revenue is the sum of our net interest income and our noninterest income.
Provision for credit losses
The provision for credit losses is the amount of expense that, based on our judgment, is required to maintain the allowance for credit losses at an amount that reflects probable losses inherent in the loan portfolio at the balance sheet date and that, in management’s judgment, is appropriate under relevant accounting guidance. The provision for credit losses includes the provision for loan and lease losses as well as the provision for unfunded commitments. The determination of the amount of the allowance for credit losses is complex and involves a high degree of judgment and subjectivity. For additional information regarding the provision for credit losses, see “—Critical
CITIZENS FINANCIAL GROUP, INC.
MANAGEMENT’S DISCUSSION AND ANALYSIS
Accounting Estimates—Estimates — Allowance for Credit Losses,” and Note 1 “Significant Accounting Policies” and Note 5 “Allowance for Credit Losses, Nonperforming Assets, and Concentrations of Credit Risk” to our audited Consolidated Financial Statements in Part II, Item 8 — Financial Statements and Supplementary Data, included elsewhere in this report.
Noninterest expense
Noninterest expense includes salaries and employee benefits, outside services, occupancy expense, equipment expense, amortization of software, goodwill impairment, and other operating expenses.
Net income (loss)
We evaluate our net income (loss) based on measures including return on average common equity, return on average total assets and return on average tangible common equity and efficiency ratio.equity.
Loans and leases
We classify our loans and leases pursuant to the following classes: commercial, commercial real estate, leases, residential mortgages, home equity loans, home equity lines of credit, home equity loans serviced by others, home equity lines of credit serviced by others, automobile, student, credit cards and other retail.
Loans are reported at the amount of their outstanding principal, net of charge-offs, unearned income, deferred loan origination fees and costs and unamortized premiums or discounts (on purchased loans). Deferred loan origination fees and costs and purchase discounts and premiums are amortized as an adjustment of yield over the life of the loan, using the level yield interest method. Unamortized amounts remaining upon prepayment or sale are recorded as interest income or gain (loss) on sale, respectively. Credit card receivables include billed and uncollected interest and fees.
Leases are classified at the inception of the lease by type. Lease receivables, including leveraged leases, are reported at the aggregate of lease payments receivable and estimated residual values, net of unearned and deferred income, including unamortized investment credits. Lease residual values are reviewed at least annually for other-than-temporary impairment, with valuation adjustments recognized currently against noninterest income. Leveraged leases are reported net of non-recourse debt. Unearned income is recognized to yield a level rate of return on the net investment in the leases.
Mortgage loans and commercial loans held for sale are carried at fair value. As of December 31, 2013, other loans held for sale primarily include loans relating to the Chicago Divestiture and were carried at the lower of cost or fair value.
Securities
Our securities portfolio is managed to seek return while maintaining prudent levels of quality, market risk and liquidity. Investments in debt and equity securities are carried in four portfolios: available for sale, held to maturity,AFS, HTM, trading account assetssecurities and other investment securities. We determine the appropriate classification at the time of purchase. Securities in our available-for-saleAFS portfolio will be held for indefinite periods of time and may be sold in response to changes in interest rates, changes in
CITIZENS FINANCIAL GROUP, INC.
MANAGEMENT'S DISCUSSION AND ANALYSIS
prepayment risk or other factors relevant to our asset and liability strategy. Securities in our available-for-saleAFS portfolio are carried at fair value, with unrealized gains and losses reported in other comprehensive income,OCI, as a separate component of stockholders’ equity, net of taxes. Securities are classified as held to maturityHTM because we have the ability and intent to hold the securities to maturity, and securities in our HTM portfolio are carried at amortized cost. DebtOther investment securities are composed mainly of FHLB stock and equity securities thatFRB stock (which are boughtcarried at cost), and money market mutual fund investments held principally forby the purpose of being sold in the near term are classified as trading account assets andCompany’s broker-dealer (which are carried at fair value. Realized and unrealized gains and losses on such assets are reportedvalue, with changes in fair value recognized in noninterest income. Other investment securities are comprised mainly of FHLB and Federal Reserve Bank stock, which are carried at cost.
income).
Allowance for credit losses
Our estimate of probable losses in the loan and lease portfolios is recorded in the allowance for loan and lease lossesALLL and the reserve for unfunded lending commitments. Together these are referred to as the allowance for credit losses. We evaluate the adequacy of the allowance for credit losses using the following ratios: allowance for loan and lease lossesALLL as a percentage of total loans and leases; allowance for loan and lease lossesALLL as a percentage of nonperforming loans and leases; and nonperforming loans and leases as a percentage of total loans and leases. For additional information, see “—Critical Accounting Estimates — Allowance for Credit Losses,” and Note 1 “Significant Accounting Policies” and Note 5 “Allowance for Credit Losses, Nonperforming Assets and Concentrations of Credit Risk” to our audited Consolidated Financial Statements in Part II, Item 8 — Financial Statements and Supplementary Data, included elsewhere in this report.
Deposits
Our deposits include: on demand checking, checking with interest, regular savings accounts, money market accounts and term deposits.
CITIZENS FINANCIAL GROUP, INC.
MANAGEMENT’S DISCUSSION AND ANALYSIS
Borrowed funds
As of December 31, 2014,2015, our total short-term borrowed funds included federal funds purchased, securities sold under agreement to repurchase, the current portion of FHLB advances and other short-term borrowed funds. As of December 31, 2014,2015, our long-term borrowed funds included subordinated debt, unsecured notes, Federal Home loan advances and other long-term borrowed funds. For additional information, see “—Analysis of Financial Condition—Condition — Borrowed Funds,” and Note 1112 “Borrowed Funds” to our audited Consolidated Financial Statements in Part II, Item 8 — Financial Statements and Supplementary Data, included elsewhere in this report.
Derivatives
In prior years, we usedWe use pay-fixed interest rate swaps to synthetically lengthen liabilities offsettingsynthetically and offset duration in fixed-rate assets. In 2008, we determined that theseWe also use pay-fixed swaps were no longer needed and have elected to terminate them or allow them to runoff.hedge floating-rate wholesale funding.
During the fourth quarter of 2014, we entered into anWe use receive-fixed interest rate swap agreementswaps to manage the interest rate exposure on our medium term fixed-rate borrowings. This agreement involves the receipt of fixed-rate amounts in exchange for floating-rate interest payments over the life of the agreement.
We also use receive-fixed swaps to minimize the exposure to variability in the interest cash flows on our floating rate assets. The assets and liabilities recorded for derivatives designated as hedges reflect the market value of these hedge instruments.
We also sell interest rate swaps and foreign exchange forwards to commercial customers. Offsetting swap and forward agreements are simultaneously transacted to minimize our market risk associated with the customer derivative products.contracts. The assets and liabilities recorded for derivatives not designated as hedges reflect the market value of these transactions. For additional information, see “—Analysis of Financial Condition—Condition — Derivatives,” and Note 1516 “Derivatives” to our audited Consolidated Financial Statements in Part II, Item 8 — Financial Statements and Supplementary Data, included elsewhere in this report.
Key Performance Metricsperformance metrics and Non-GAAP Financial Measuresnon-GAAP financial measures
We consider various measures when evaluating our performance and making day-to-day operating decisions, as well as evaluating capital utilization and adequacy, including:
Return on average common equity, which we define as net income (loss) available to common stockholders divided by average common equity;
Return on average tangible common equity, which we define as net income (loss) available to common stockholders divided by average common equity excluding average goodwill (net of related deferred tax liability), and average other intangibles;
Return on average total assets, which we define as net income (loss) divided by average total assets;
CITIZENS FINANCIAL GROUP, INC.
MANAGEMENT'S DISCUSSION AND ANALYSIS
Return on average total tangible assets, which we define as net income (loss) divided by average total assets excluding average goodwill (net of related deferred tax liability), and average other intangibles;
Efficiency ratio, which we define as the ratio of our total noninterest expense to the sum of net interest income and total noninterest income. We measure our efficiency ratio to evaluate the efficiency of our operations as it helps us monitor how costs are changing compared to our income. A decrease in our efficiency ratio represents improvement; and
Net interest margin, which we calculate by dividing annualized net interest income for the period by average total interest-earning assets, is a key measure that we use to evaluate our net interest income.
Certain of the above financial measures, including return on average tangible common equity, return on average total tangible assets and the efficiency ratio are not recognized under GAAP. We also present noninterest expense, net income (loss), return on average total tangible assets, return on average tangible common equity, return on average common equity, return on average total assets, efficiency ratio, and net income per average common share (basic and diluted), excluding the 2013 $4.4 billion pre-tax ($4.1 billion after-tax) goodwill impairment charge. In addition, we present net income (loss), net income (loss) available to common stockholders, and return on average tangible common equity,and efficiency ratio net of goodwill impairment restructuring charges and special items for the years ended December 31, 2014 and 2013.items. We believe these non-GAAP measures provide useful information to investors because these are among the measures used by our management team to evaluate our operating performance and make day-to-day operating decisions. In addition, we believe goodwill impairment, restructuring charges and special items in any period do not reflect the operational performance of the business in that period and, accordingly, it is useful to consider these line items with and without goodwill impairment, restructuring charges and special items. We believe this presentation also increases comparability of period-to-period results.
We also consider pro forma capital ratios defined by banking regulators but not effective at each yearperiod end to be non-GAAP financial measures. SinceAs analysts and banking regulators may assessevaluate our capital adequacy using these pro forma ratios, we believe they are useful to provide investors the ability to assessevaluate our capital adequacy on the same basis.
Other companies may use similarly titled non-GAAP financial measures that are calculated differently from the way we calculate such measures. Accordingly, our non-GAAP financial measures may not be comparable to similar measures used by other companies. We caution investors not to place undue reliance on such non-GAAP measures, but instead to consider them with the most directly comparable GAAP measure. Non-GAAP financial measures have limitations as analytical tools, and should not be considered in isolation or as a substitute for our results reported under GAAP.
CITIZENS FINANCIAL GROUP, INC.
MANAGEMENT'SMANAGEMENT’S DISCUSSION AND ANALYSIS
The following table reconciles non-GAAP financial measures to GAAP:
|
| |
| | | | | As of and for the Year Ended December 31, | | | As of and for the Year Ended December 31, |
| (dollars in millions, except per share amounts) | Ref. | | 2014 |
| | 2013 |
| | 2012 |
| | 2011 |
| | 2010 |
| |
| (dollars in millions, except per-share amounts) | | Ref. | | 2015 | | 2014 | | 2013 | | 2012 | | 2011 |
| Noninterest expense, excluding goodwill impairment: | | | | | | | | | | | | | | | | | | | | | | |
| Noninterest expense (GAAP) | A | |
| $3,392 |
| |
| $7,679 |
| |
| $3,457 |
| |
| $3,371 |
| |
| $3,483 |
| A | |
| $3,259 |
| |
| $3,392 |
| |
| $7,679 |
| |
| $3,457 |
| |
| $3,371 |
|
| Less: Goodwill impairment (GAAP) | | | — |
| | 4,435 |
| | — |
| | — |
| | — |
| | | — |
| | — |
| | 4,435 |
| | — |
| | — |
|
| Noninterest expense, excluding goodwill impairment (non-GAAP) | B | |
| $3,392 |
| |
| $3,244 |
| |
| $3,457 |
| |
| $3,371 |
| |
| $3,483 |
| B | |
| $3,259 |
| |
| $3,392 |
| |
| $3,244 |
| |
| $3,457 |
| |
| $3,371 |
|
| Net income (loss), excluding goodwill impairment: | | | | | | | |
| | |
| | | | | | | | | | | | | |
| Net income (loss) (GAAP) | C | |
| $865 |
| |
| ($3,426 | ) | |
| $643 |
| |
| $506 |
| |
| $11 |
| C | |
| $840 |
| |
| $865 |
| |
| ($3,426 | ) | |
| $643 |
| |
| $506 |
|
| Add: Goodwill impairment, net of income tax benefit (GAAP) | | | — |
| | 4,080 |
| | — |
| | — |
| | — |
| | | — |
| | — |
| | 4,080 |
| | — |
| | — |
|
| Net income, excluding goodwill impairment (non-GAAP) | D | |
| $865 |
| |
| $654 |
| |
| $643 |
| |
| $506 |
| |
| $11 |
| |
| Net income (loss), excluding goodwill impairment (non-GAAP) | | D | |
| $840 |
| |
| $865 |
| |
| $654 |
| |
| $643 |
| |
| $506 |
|
| | | | | | | | | | | | | |
| Net income (loss) available to common stockholders, excluding goodwill impairment: | | | | | | | | | | | |
| Net income (loss) available to common stockholders (GAAP) | | E | |
| $833 |
| |
| $865 |
| |
| ($3,426 | ) | |
| $643 |
| |
| $506 |
|
| Add: Goodwill impairment, net of income tax benefit (GAAP) | | | — |
| | — |
| | 4,080 |
| | — |
| | — |
|
| Net income (loss) available to common stockholders, excluding goodwill impairment (non-GAAP) | | F | |
| $833 |
| |
| $865 |
| |
| $654 |
| |
| $643 |
| |
| $506 |
|
| | | | | | | | | | | | |
| Return on average common equity, excluding goodwill impairment: | | | | | | | |
| | |
| | | | | | | | | | | | | |
| Average common equity (GAAP) | E | |
| $19,399 |
| |
| $21,834 |
| |
| $23,938 |
| |
| $23,137 |
| |
| $22,425 |
| G | |
| $19,354 |
| |
| $19,399 |
| |
| $21,834 |
| |
| $23,938 |
| |
| $23,137 |
|
| Return on average common equity, excluding goodwill impairment (non-GAAP) | D/E | | 4.46 | % | | 3.00 | % | | 2.69 | % | | 2.19 | % | | 0.05 | % | F/G | | 4.30 | % | | 4.46 | % | | 3.00 | % | | 2.69 | % | | 2.19 | % |
| | | | | | | | | | | | |
| Return on average tangible common equity, excluding goodwill impairment: | | | | | | | |
| | |
| | | | | | | | | | | | | |
| Average common equity (GAAP) | E | |
| $19,399 |
| |
| $21,834 |
| |
| $23,938 |
| |
| $23,137 |
| |
| $22,425 |
|
| |
| $19,354 |
| |
| $19,399 |
| |
| $21,834 |
| |
| $23,938 |
| |
| $23,137 |
|
| Less: Average goodwill (GAAP) | | | 6,876 |
| | 9,063 |
| | 11,311 |
| | 11,311 |
| | 11,674 |
| | | 6,876 |
| | 6,876 |
| | 9,063 |
| | 11,311 |
| | 11,311 |
|
| Less: Average other intangibles (GAAP) | | | 7 |
| | 9 |
| | 12 |
| | 15 |
| | 19 |
| | | 4 |
| | 7 |
| | 9 |
| | 12 |
| | 15 |
|
| Add: Average deferred tax liabilities related to goodwill (GAAP) | | | 377 |
| | 459 |
| | 617 |
| | 295 |
| | 27 |
| | | 445 |
| | 377 |
| | 459 |
| | 617 |
| | 295 |
|
| Average tangible common equity (non-GAAP) | F | |
| $12,893 |
| |
| $13,221 |
| |
| $13,232 |
| |
| $12,106 |
| |
| $10,759 |
| H | |
| $12,919 |
| |
| $12,893 |
| |
| $13,221 |
| |
| $13,232 |
| |
| $12,106 |
|
| Return on average tangible common equity (non-GAAP) | C/F | | 6.71 | % | | (25.91 | %) | | 4.86 | % | | 4.18 | % | | 0.11 | % | E/H | | 6.45 | % | | 6.71 | % | | (25.91 | )% | | 4.86 | % | | 4.18 | % |
| Return on average tangible common equity, excluding goodwill impairment (non-GAAP) | D/F | | 6.71 | % | | 4.95 | % | | 4.86 | % | | 4.18 | % | | 0.11 | % | F/H | | 6.45 | % | | 6.71 | % | | 4.95 | % | | 4.86 | % | | 4.18 | % |
| | | | | | | | | | | | |
| Return on average total assets, excluding goodwill impairment: | | | | | | | | | | | | |
| Average total assets (GAAP) | | I | |
| $135,070 |
| |
| $127,624 |
| |
| $120,866 |
| |
| $127,666 |
| |
| $128,344 |
|
| Return on average total assets, excluding goodwill impairment (non-GAAP) | | D/I | | 0.62 | % | | 0.68 | % | | 0.54 | % | | 0.50 | % | | 0.39 | % |
| | | | | | | | | | | | |
| Return on average total tangible assets, excluding goodwill impairment: | | | | | | | | | | | | |
| Average total assets (GAAP) | | I | |
| $135,070 |
| |
| $127,624 |
| |
| $120,866 |
| |
| $127,666 |
| |
| $128,344 |
|
| Less: Average goodwill (GAAP) | | | | 6,876 |
| | 6,876 |
| | 9,063 |
| | 11,311 |
| | 11,311 |
|
| Less: Average other intangibles (GAAP) | | | | 4 |
| | 7 |
| | 9 |
| | 12 |
| | 15 |
|
| Add: Average deferred tax liabilities related to goodwill (GAAP) | | | | 445 |
| | 377 |
| | 459 |
| | 617 |
| | 295 |
|
| Average tangible assets (non-GAAP) | | J | |
| $128,635 |
| |
| $121,118 |
| |
| $112,253 |
| |
| $116,960 |
| |
| $117,313 |
|
| Return on average total tangible assets (non-GAAP) | | C/J | | 0.65 | % | | 0.71 | % | | (3.05 | )% | | 0.55 | % | | 0.43 | % |
| Return on average total tangible assets, excluding goodwill impairment (non-GAAP) | | D/J | | 0.65 | % | | 0.71 | % | | 0.58 | % | | 0.55 | % | | 0.43 | % |
CITIZENS FINANCIAL GROUP, INC.
MANAGEMENT'SMANAGEMENT’S DISCUSSION AND ANALYSIS
|
| | | | | | | | | | | | | | | | | | | | | |
| | | | As of and for the Year Ended December 31, |
| (dollars in millions, except per share amounts) | Ref. | | 2014 |
| | 2013 |
| | 2012 |
| | 2011 |
| | 2010 |
|
| Return on average total assets, excluding goodwill impairment: | | | | | | | |
| | | | |
| Average total assets (GAAP) | G | |
| $127,624 |
| |
| $120,866 |
| |
| $127,666 |
| |
| $128,344 |
| |
| $138,253 |
|
| Return on average total assets, excluding goodwill impairment (non-GAAP) | D/G | | 0.68 | % | | 0.54 | % | | 0.50 | % | | 0.39 | % | | 0.01 | % |
| Return on average total tangible assets, excluding goodwill impairment: | | | | | | | |
| | |
| | |
| Average total assets (GAAP) | G | |
| $127,624 |
| |
| $120,866 |
| |
| $127,666 |
| |
| $128,344 |
| |
| $138,253 |
|
| Less: Average goodwill (GAAP) | | | 6,876 |
| | 9,063 |
| | 11,311 |
| | 11,311 |
| | 11,674 |
|
| Less: Average other intangibles (GAAP) | | | 7 |
| | 9 |
| | 12 |
| | 15 |
| | 19 |
|
| Add: Average deferred tax liabilities related to goodwill (GAAP) | | | 377 |
| | 459 |
| | 617 |
| | 295 |
| | 27 |
|
| Average tangible assets (non-GAAP) | H | |
| $121,118 |
| |
| $112,253 |
| |
| $116,960 |
| |
| $117,313 |
| |
| $126,587 |
|
| Return on average total tangible assets (non-GAAP) | C/H | | 0.71 | % | | (3.05 | %) | | 0.55 | % | | 0.43 | % | | 0.01 | % |
Return on average total tangible assets, excluding goodwill impairment (non-GAAP)(1) | D/H | | 0.71 | % | | 0.58 | % | | 0.55 | % | | 0.43 | % | | 0.01 | % |
| Efficiency ratio, excluding goodwill impairment: | | | | | | | |
| | |
| | |
| Net interest income (GAAP) | | |
| $3,301 |
| |
| $3,058 |
| |
| $3,227 |
| |
| $3,320 |
| |
| $3,345 |
|
| Noninterest income (GAAP) | | | 1,678 |
| | 1,632 |
| | 1,667 |
| | 1,711 |
| | 1,733 |
|
| Total revenue (GAAP) | I | |
| $4,979 |
| |
| $4,690 |
| |
| $4,894 |
| |
| $5,031 |
| |
| $5,078 |
|
| Efficiency ratio (non-GAAP) | A/I | | 68.12 | % | | 163.73 | % | | 70.64 | % | | 67.00 | % | | 68.59 | % |
| Efficiency ratio, excluding goodwill impairment (non-GAAP) | B/I | | 68.12 | % | | 69.17 | % | | 70.64 | % | | 67.00 | % | | 68.59 | % |
| Net income per average common share-basic and diluted, excluding goodwill impairment: | | | | | | | |
| | |
| | |
| Average common shares outstanding - basic (GAAP) | J | | 556,674,146 |
| | 559,998,324 |
| | 559,998,324 |
| | 559,998,324 |
| | 559,998,324 |
|
| Average common shares outstanding - diluted (GAAP) | K | | 557,724,936 |
| | 559,998,324 |
| | 559,998,324 |
| | 559,998,324 |
| | 559,998,324 |
|
| Net income (loss) applicable to common stockholders (GAAP) | L | |
| $865 |
| |
| ($3,426 | ) | |
| $643 |
| |
| $506 |
| |
| $11 |
|
| Add: Goodwill impairment, net of income tax benefit (GAAP) | | | — |
| | 4,080 |
| | — |
| | — |
| | — |
|
| Net income applicable to common stockholders, excluding goodwill impairment (non-GAAP) | M | |
| $865 |
| |
| $654 |
| |
| $643 |
| |
| $506 |
| |
| $11 |
|
| Net income per average common share-basic, excluding goodwill impairment (non-GAAP) | M/J | | 1.55 |
| | 1.17 |
| | 1.15 |
| | 0.90 |
| | 0.02 |
|
| Net income per average common share-diluted, excluding goodwill impairment (non-GAAP) | M/K | | 1.55 |
| | 1.17 |
| | 1.15 |
| | 0.90 |
| | 0.02 |
|
|
| | | | | | | | | | | | | | | | | | | | | |
| | | | As of and for the Year Ended December 31, |
| (dollars in millions, except per-share amounts) | Ref. | | 2015 | | 2014 | | 2013 | | 2012 | | 2011 |
| | | | | | | | | | | | |
| Efficiency ratio, excluding goodwill impairment: | | | | | | | | | | | |
| Noninterest expense (GAAP) | A | |
| $3,259 |
| |
| $3,392 |
| |
| $7,679 |
| |
| $3,457 |
| |
| $3,371 |
|
| Net interest income (GAAP) | | |
| $3,402 |
| |
| $3,301 |
| |
| $3,058 |
| |
| $3,227 |
| |
| $3,320 |
|
| Noninterest income (GAAP) | | | 1,422 |
| | 1,678 |
| | 1,632 |
| | 1,667 |
| | 1,711 |
|
| Total revenue (GAAP) | K | |
| $4,824 |
| |
| $4,979 |
| |
| $4,690 |
| |
| $4,894 |
| |
| $5,031 |
|
| Efficiency ratio (non-GAAP) | A/K | | 67.56 | % | | 68.12 | % | | 163.73 | % | | 70.64 | % | | 67.00 | % |
| Efficiency ratio, excluding goodwill impairment (non-GAAP) | B/K | | 67.56 | % | | 68.12 | % | | 69.17 | % | | 70.64 | % | | 67.00 | % |
| Net income (loss) per average common share-basic and diluted, excluding goodwill impairment: | | | | | | | | | | | |
| Average common shares outstanding - basic (GAAP) | L | | 535,599,731 |
| | 556,674,146 |
| | 559,998,324 |
| | 559,998,324 |
| | 559,998,324 |
|
| Average common shares outstanding - diluted (GAAP) | M | | 538,220,898 |
| | 557,724,936 |
| | 559,998,324 |
| | 559,998,324 |
| | 559,998,324 |
|
| Net income (loss) (GAAP) | E | |
| $833 |
| |
| $865 |
| |
| ($3,426 | ) | |
| $643 |
| |
| $506 |
|
| Add: Goodwill impairment, net of income tax benefit (GAAP) | | | — |
| | — |
| | 4,080 |
| | — |
| | — |
|
| Net income (loss), excluding goodwill impairment (non-GAAP) | F | |
| $833 |
| |
| $865 |
| |
| $654 |
| |
| $643 |
| |
| $506 |
|
| Net income (loss) per average common share-basic, excluding goodwill impairment (non-GAAP) | F/L | | 1.55 |
| | 1.55 |
| | 1.17 |
| | 1.15 |
| | 0.90 |
|
| Net income (loss) per average common share-diluted, excluding goodwill impairment (non-GAAP) | F/M | | 1.55 |
| | 1.55 |
| | 1.17 |
| | 1.15 |
| | 0.90 |
|
CITIZENS FINANCIAL GROUP, INC.
MANAGEMENT'SMANAGEMENT’S DISCUSSION AND ANALYSIS
|
| | | | | | | | |
| | | | As of and for the Year Ended December 31, |
| (dollars in millions, except per share amounts) | Ref. | | 2014 | 2013 |
| Pro forma Basel III common equity Tier 1 capital ratio: | | | | |
| Tier 1 risk-based common capital (regulatory) | | |
| $13,173 |
|
| $13,301 |
|
| Less: Change in DTA and other threshold deductions (GAAP) | | | (6 | ) | 6 |
|
| Basel III common equity Tier 1 (non-GAAP) | N | |
| $13,179 |
|
| $13,295 |
|
| Risk-weighted assets (regulatory general risk weight approach) | | |
| $105,964 |
|
| $98,634 |
|
| Add: Net change in credit and other risk-weighted assets (regulatory) | | | 2,882 |
| 2,687 |
|
| Basel III standardized approach risk-weighted assets (non-GAAP) | O | |
| $108,846 |
|
| $101,321 |
|
| Pro forma Basel III common equity Tier 1 capital ratio (non-GAAP) | N/O | | 12.1 | % | 13.1 | % |
| Pro forma Basel III Tier 1 capital ratio: | | | | |
| Basel III common equity Tier 1 (non-GAAP) | N | |
| $13,179 |
|
| $13,295 |
|
| Add: Trust preferred and minority interest (GAAP) | | | — |
| — |
|
| Basel III Tier 1 capital (non-GAAP) | P | |
| $13,179 |
|
| $13,295 |
|
| Pro forma Basel III Tier 1 capital ratio (non-GAAP) | P/O | | 12.1 | % | 13.1 | % |
| Pro forma Basel III total capital ratio: | | | | |
| Total Tier 2 common capital (regulatory) | | |
| $3,608 |
|
| $2,584 |
|
| Add: Excess allowance for loan and lease losses (regulatory) | | | — |
| 27 |
|
| Less: Reserves exceeding 1.25% of risk-weighted assets (regulatory) | | | — |
| — |
|
| Basel III common equity Tier 2 (non-GAAP) | Q | |
| $3,608 |
|
| $2,611 |
|
| Pro forma Basel III total capital (non-GAAP) | P+Q | |
| $16,787 |
|
| $15,906 |
|
| Pro forma Basel III total capital ratio (non-GAAP) | (P+Q)/O | | 15.4 | % | 15.7 | % |
| Pro forma Basel III leverage ratio: | | | | |
| Quarterly average assets (GAAP) | | |
| $130,629 |
|
| $120,705 |
|
| Less: Goodwill (GAAP) | | | 6,876 |
| 6,876 |
|
Less: Restricted core capital elements (regulatory)(1) | | | 11 |
| 17 |
|
| Add: Deferred tax liability related to goodwill (GAAP) | | | 420 |
| 351 |
|
| Add: Other comprehensive income pension adjustments (GAAP) | | | 377 |
| 259 |
|
| Basel III adjusted average assets (non-GAAP) | R | |
| $124,539 |
|
| $114,422 |
|
| Pro forma leverage ratio (non-GAAP) | P/R | | 10.6 | % | 11.6 | % |
|
| | | | | | | | | | | | | |
| | | | Year Ended December 31, |
| (dollars in millions) | Ref. | | 2015 | | 2014 | | 2013 |
| Total revenue, excluding special items: | | | | | | | |
| Total revenue (GAAP) | K | |
| $4,824 |
| |
| $4,979 |
| |
| $4,690 |
|
| Less: Special items - Gain on Chicago Divestiture | | | — |
| | 288 |
| | — |
|
| Total revenue, excluding special items (non-GAAP) | N | |
| $4,824 |
| |
| $4,691 |
| |
| $4,690 |
|
| | | | | | | | |
| Noninterest expense excluding goodwill impairment, restructuring charges and special items: | | | | | | | |
| Noninterest expense (GAAP) | A | |
| $3,259 |
| |
| $3,392 |
| |
| $7,679 |
|
| Less: Goodwill impairment (GAAP) | | | — |
| | — |
| | 4,435 |
|
| Less: Restructuring charges (GAAP) | | | 26 |
| | 114 |
| | 26 |
|
Less: Special items (1) | | | 24 |
| | 55 |
| | — |
|
| Noninterest expense, excluding goodwill impairment, restructuring charges and special items (non-GAAP) | O | |
| $3,209 |
| |
| $3,223 |
| |
| $3,218 |
|
| Efficiency ratio, excluding goodwill impairment, restructuring charges and special items (non-GAAP) | O/N | | 66.52 | % | | 68.70 | % | | 68.61 | % |
| | | | | | | | |
| Net income, excluding goodwill impairment, restructuring charges and special items: | | | | | | | |
| Net income (loss) (GAAP) | C | |
| $840 |
| |
| $865 |
| |
| ($3,426 | ) |
| Add: Goodwill impairment (GAAP) | | | — |
| | — |
| | 4,080 |
|
| Add: Restructuring charges (GAAP) | | | 16 |
| | 72 |
| | 17 |
|
| Special items: | | | | | | | |
| Less: Net gain on the Chicago Divestiture (GAAP) | | | — |
| | 180 |
| | — |
|
| Add: Regulatory charges (GAAP) | | | 1 |
| | 22 |
| | — |
|
| Add: Separation expenses / IPO related (GAAP) | | | 14 |
| | 11 |
| | — |
|
| Net income, excluding goodwill impairment, restructuring charges and special items (non-GAAP) |
| |
| $871 |
| |
| $790 |
| |
| $671 |
|
| | | | | | | | |
| Net income (loss) available to common stockholders, excluding goodwill impairment, restructuring charges and special items: | | | | | | | |
| Net income (loss) available to common stockholders (GAAP) | E | |
| $833 |
| |
| $865 |
| |
| ($3,426 | ) |
| Add: Goodwill impairment (GAAP) | | | — |
| | — |
| | 4,080 |
|
| Add: Restructuring charges (GAAP) | | | 16 |
| | 72 |
| | 17 |
|
| Special items: | | | | | | | |
| Less: Net gain on the Chicago Divestiture (GAAP) | | | — |
| | 180 |
| | — |
|
| Add: Regulatory charges (GAAP) | | | 1 |
| | 22 |
| | — |
|
| Add: Separation expenses / IPO related (GAAP) | | | 14 |
| | 11 |
| | — |
|
| Net income available to common shareholders, excluding goodwill impairment, restructuring charges and special items (non-GAAP) | P | |
| $864 |
| |
| $790 |
| |
| $671 |
|
| | | | | | | | |
| Return on average tangible common equity, excluding goodwill impairment, restructuring charges and special items: | | | | | | | |
| Average common equity (GAAP) | G | |
| $19,354 |
| |
| $19,399 |
| |
| $21,834 |
|
| Less: Average goodwill (GAAP) | | | 6,876 |
| | 6,876 |
| | 9,063 |
|
| Less: Average other intangibles (GAAP) | | | 4 |
| | 7 |
| | 9 |
|
| Add: Average deferred tax liabilities related to goodwill (GAAP) | | | 445 |
| | 377 |
| | 459 |
|
| Average tangible common equity (non-GAAP) | H | |
| $12,919 |
| |
| $12,893 |
| |
| $13,221 |
|
| | | | | | | | |
| Return on average tangible common equity (non-GAAP) | E/H | | 6.45 | % | | 6.71 | % | | (25.91 | %) |
| Return on average tangible common equity, excluding goodwill impairment, restructuring charges and special items (non-GAAP) | P/H | | 6.69 | % | | 6.13 | % | | 5.08 | % |
(1) Restricted core capital elements include other intangibles, intangible mortgage servicing assets, and disallowed mortgage servicing assets.
CITIZENS FINANCIAL GROUP, INC.
MANAGEMENT'S DISCUSSION AND ANALYSIS
|
| | | | | | | | | |
| | | | Year Ended December 31, |
| (dollars in millions) | Ref. | | 2014 | | 2013 |
| Noninterest expense excluding goodwill impairment, restructuring charges and special items: | | | | | |
| Noninterest expense (GAAP) | A | |
| $3,392 |
| |
| $7,679 |
|
| Less: Goodwill impairment (GAAP) | | | — |
| | 4,435 |
|
| Less: Restructuring charges (GAAP) | | | 114 |
| | 26 |
|
Less: Special items(2) | | | 55 |
| | — |
|
| Noninterest expense, excluding goodwill impairment, restructuring charges and special items (non-GAAP) | S | |
| $3,223 |
| |
| $3,218 |
|
| Net income, excluding goodwill impairment, restructuring charges and special items: | | | | | |
| Net income (loss) (GAAP) | C | |
| $865 |
| |
| ($3,426 | ) |
| Add: Goodwill impairment (GAAP) | | | — |
| | 4,080 |
|
| Add: Restructuring charges (GAAP) | | | 72 |
| | 17 |
|
| Special items: | | | | | |
| Less: Net gain on the Chicago Divestiture (GAAP) | | | 180 |
| | — |
|
| Add: Regulatory charges (GAAP) | | | 22 |
| | — |
|
| Add: Separation expenses / IPO related (GAAP) | | | 11 |
| | — |
|
| Net income, excluding goodwill impairment, restructuring charges and special items (non-GAAP) | T | |
| $790 |
| |
| $671 |
|
| Return on average tangible common equity, excluding goodwill impairment, restructuring charges and special items: | | | | | |
| Average common equity (GAAP) | E | | 19,399 |
| | 21,834 |
|
| Less: Average goodwill (GAAP) | | | 6,876 |
| | 9,063 |
|
| Less: Average other intangibles (GAAP) | | | 7 |
| | 9 |
|
| Add: Average deferred tax liabilities related to goodwill (GAAP) | | | 377 |
| | 459 |
|
| Average tangible common equity (non-GAAP) | F | |
| $12,893 |
| |
| $13,221 |
|
| Return on average tangible common equity (non-GAAP) | C/F | | 6.71 | % | | (25.91 | %) |
| Return on average tangible common equity, excluding goodwill impairment, restructuring charges and special items (non-GAAP) | T/F | | 6.13 | % | | 5.08 | % |
(2)Special items include the following: regulatory charges, separation items and IPO related expenses.
CITIZENS FINANCIAL GROUP, INC.
MANAGEMENT'SMANAGEMENT’S DISCUSSION AND ANALYSIS
| | | | | | As of and for the Year Ended December 31, | | | As of and for the Year Ended December31, |
| | | | 2014 | | 2013 | | 2012 | | | 2015 | | 2014 | | 2013 |
| (dollars in millions) | Ref. | | Consumer Banking | Commercial Banking | Other | Consolidated | | Consumer Banking | Commercial Banking | Other | Consolidated | | Consumer Banking | Commercial Banking | Other | Consolidated | Ref. | | Consumer
Banking | Commercial
Banking | Other | Consolidated | | Consumer
Banking | Commercial
Banking | Other | Consolidated | | Consumer
Banking | Commercial
Banking | Other | Consolidated |
| Net income (loss), excluding goodwill impairment: | | | | | | | | Net income (loss), excluding goodwill impairment: | | | | | |
| Net income (loss) (GAAP) | U | |
| $182 |
|
| $561 |
|
| $122 |
|
| $865 |
| |
| $242 |
|
| $514 |
|
| ($4,182 | ) |
| ($3,426 | ) | |
| $185 |
|
| $453 |
|
| $5 |
|
| $643 |
| Q | |
| $262 |
|
| $579 |
|
| ($1 | ) |
| $840 |
| |
| $182 |
|
| $561 |
|
| $122 |
|
| $865 |
| |
| $242 |
|
| $514 |
|
| ($4,182 | ) |
| ($3,426 | ) |
| Add: Goodwill impairment, net of income tax benefit (GAAP) | | | — |
| — |
| — |
| — |
| | — |
| — |
| 4,080 |
| 4,080 |
| | — |
| — |
| — |
| — |
| | — |
| — |
| — |
| — |
| | — |
| — |
| — |
| — |
| | — |
| — |
| 4,080 |
| 4,080 |
|
| Net income (loss), excluding goodwill impairment (non-GAAP) | V | |
| $182 |
|
| $561 |
|
| $122 |
|
| $865 |
| |
| $242 |
|
| $514 |
|
| ($102 | ) |
| $654 |
| |
| $185 |
|
| $453 |
|
| $5 |
|
| $643 |
| R | |
| $262 |
|
| $579 |
|
| ($1 | ) |
| $840 |
| |
| $182 |
|
| $561 |
|
| $122 |
|
| $865 |
| |
| $242 |
|
| $514 |
|
| ($102 | ) |
| $654 |
|
| Net income (loss) available to common stockholders, excluding goodwill impairment: | | Net income (loss) available to common stockholders, excluding goodwill impairment: | | | | | |
| Net income (loss) (GAAP) | | Q | |
| $262 |
|
| $579 |
|
| ($1 | ) |
| $840 |
| |
| $182 |
|
| $561 |
|
| $122 |
|
| $865 |
| |
| $242 |
|
| $514 |
|
| ($4,182 | ) |
| ($3,426 | ) |
| Less: Preferred stock dividends | | | — |
| — |
| 7 |
| 7 |
| | — |
| — |
| — |
| — |
| | — |
| — |
| — |
| — |
|
| Net income (loss) available to common stockholders (GAAP) | | S | |
| $262 |
|
| $579 |
|
| ($8 | ) |
| $833 |
| |
| $182 |
|
| $561 |
|
| $122 |
|
| $865 |
| |
| $242 |
|
| $514 |
|
| ($4,182 | ) |
| ($3,426 | ) |
| Add: Goodwill impairment, net of income tax benefit (GAAP) | | | — |
| — |
| — |
| — |
| | — |
| — |
| — |
| — |
| | — |
| — |
| 4,080 |
| 4,080 |
|
| Net income available to common stockholders, excluding goodwill impairment (non-GAAP) | | T | |
| $262 |
|
| $579 |
|
| ($8 | ) |
| $833 |
| |
| $182 |
|
| $561 |
|
| $122 |
|
| $865 |
| |
| $242 |
|
| $514 |
|
| ($102 | ) |
| $654 |
|
| Efficiency ratio: | | | | | | | | Efficiency ratio: | |
| | | |
| |
| |
| |
| | |
| Total revenue (GAAP) | W | |
| $3,050 |
|
| $1,502 |
|
| $427 |
|
| $4,979 |
| |
| $3,201 |
|
| $1,420 |
|
| $69 |
|
| $4,690 |
| |
| $3,384 |
|
| $1,385 |
|
| $125 |
|
| $4,894 |
| U | |
| $3,108 |
|
| $1,577 |
|
| $139 |
|
| $4,824 |
| |
| $3,050 |
|
| $1,502 |
|
| $427 |
|
| $4,979 |
| |
| $3,201 |
|
| $1,420 |
|
| $69 |
|
| $4,690 |
|
| Noninterest expense (GAAP) | X | | 2,513 |
| 652 |
| 227 |
| 3,392 |
| | 2,522 |
| 635 |
| 4,522 |
| 7,679 |
| | 2,691 |
| 625 |
| 141 |
| 3,457 |
| V | |
| $2,456 |
|
| $709 |
|
| $94 |
|
| $3,259 |
| |
| $2,513 |
|
| $652 |
|
| $227 |
|
| $3,392 |
| |
| $2,522 |
|
| $635 |
|
| $4,522 |
|
| $7,679 |
|
| Less: Goodwill impairment (GAAP) | | | — |
| — |
| — |
| — |
| | — |
| — |
| 4,435 |
| 4,435 |
| | — |
| — |
| — |
| — |
| | |
| $— |
|
| $— |
|
| $— |
|
| $— |
| | $ | — |
|
| $— |
|
| $— |
|
| $— |
| |
| $— |
|
| $— |
|
| $4,435 |
|
| $4,435 |
|
| Noninterest expense, excluding goodwill impairment (non- GAAP) | Y | |
| $2,513 |
|
| $652 |
|
| $227 |
|
| $3,392 |
| |
| $2,522 |
|
| $635 |
|
| $87 |
|
| $3,244 |
| |
| $2,691 |
|
| $625 |
|
| $141 |
|
| $3,457 |
| W | |
| $2,456 |
|
| $709 |
|
| $94 |
|
| $3,259 |
| |
| $2,513 |
|
| $652 |
|
| $227 |
|
| $3,392 |
| |
| $2,522 |
|
| $635 |
|
| $87 |
|
| $3,244 |
|
| Efficiency ratio (non-GAAP) | X/W | | 82.39 | % | 43.37 | % | NM |
| 68.12 | % | | 78.76 | % | 44.66 | % | NM |
| 163.73 | % | | 79.45 | % | 45.22 | % | NM |
| 70.64 | % | V/U | | 79.02 | % | 44.94 | % | NM |
| 67.56 | % | | 82.39 | % | 43.30 | % | NM |
| 68.12 | % | | 78.76 | % | 44.66 | % | NM |
| 163.73 | % |
| Efficiency ratio, excluding goodwill impairment (non-GAAP) | Y/W | | 82.39 | % | 43.37 | % | NM |
| 68.12 | % | | 78.76 | % | 44.66 | % | NM |
| 69.17 | % | | 79.45 | % | 45.22 | % | NM |
| 70.64 | % | W/U | | 79.02 | % | 44.94 | % | NM |
| 67.56 | % | | 82.39 | % | 43.30 | % | NM |
| 68.12 | % | | 78.76 | % | 44.66 | % | NM |
| 69.17 | % |
| Return on average total tangible assets: | | | |
| |
| |
| |
| | |
| |
| |
| |
| | | Return on average total tangible assets: | | | | | |
| Average total assets (GAAP) | Z | |
| $48,939 |
|
| $38,483 |
|
| $40,202 |
|
| $127,624 |
| |
| $46,465 |
|
| $35,229 |
|
| $39,172 |
|
| $120,866 |
| |
| $47,824 |
|
| $33,474 |
|
| $46,368 |
|
| $127,666 |
| |
| $52,848 |
|
| $42,800 |
|
| $39,422 |
|
| $135,070 |
| |
| $48,939 |
|
| $38,483 |
|
| $40,202 |
|
| $127,624 |
| |
| $46,465 |
|
| $35,229 |
|
| $39,172 |
|
| $120,866 |
|
| Less: Average goodwill (GAAP) | | | — |
| — |
| 6,876 |
| 6,876 |
| | — |
| — |
| 9,063 |
| 9,063 |
| | — |
| — |
| 11,311 |
| 11,311 |
| | | — |
| — |
| 6,876 |
| 6,876 |
| | — |
| — |
| 6,876 |
| 6,876 |
| | — |
| — |
| 9,063 |
| 9,063 |
|
| Less: Average other intangibles (GAAP) | | | — |
| — |
| 7 |
| 7 |
| | — |
| — |
| 9 |
| 9 |
| | — |
| — |
| 12 |
| 12 |
| | | — |
| — |
| 4 |
| 4 |
| | — |
| — |
| 7 |
| 7 |
| | — |
| — |
| 9 |
| 9 |
|
| Add: Average deferred tax liabilities related to goodwill (GAAP) | | | — |
| — |
| 377 |
| 377 |
| | — |
| — |
| 459 |
| 459 |
| | — |
| — |
| 617 |
| 617 |
| | | — |
| — |
| 445 |
| 445 |
| | — |
| — |
| 377 |
| 377 |
| | — |
| — |
| 459 |
| 459 |
|
| Average total tangible assets (non-GAAP) | AA | |
| $48,939 |
|
| $38,483 |
|
| $33,696 |
|
| $121,118 |
| |
| $46,465 |
|
| $35,229 |
|
| $30,559 |
|
| $112,253 |
| |
| $47,824 |
|
| $33,474 |
|
| $35,662 |
|
| $116,960 |
| X | |
| $52,848 |
|
| $42,800 |
|
| $32,987 |
|
| $128,635 |
| |
| $48,939 |
|
| $38,483 |
|
| $33,696 |
|
| $121,118 |
| |
| $46,465 |
|
| $35,229 |
|
| $30,559 |
|
| $112,253 |
|
| Return on average total tangible assets (non-GAAP) | U/AA | | 0.37 | % | 1.46 | % | NM |
| 0.71 | % | | 0.52 | % | 1.46 | % | NM |
| (3.05 | %) | | 0.39 | % | 1.35 | % | NM |
| 0.55 | % | Q/X | | 0.50 | % | 1.35 | % | NM |
| 0.65 | % | | 0.37 | % | 1.46 | % | NM |
| 0.71 | % | | 0.52 | % | 1.46 | % | NM |
| (3.05 | )% |
| Return on average total tangible assets, excluding goodwill impairment (non-GAAP) | V/AA | | 0.37 | % | 1.46 | % | NM |
| 0.71 | % | | 0.52 | % | 1.46 | % | NM |
| 0.58 | % | | 0.39 | % | 1.35 | % | NM |
| 0.55 | % | R/X | | 0.50 | % | 1.35 | % | NM |
| 0.65 | % | | 0.37 | % | 1.46 | % | NM |
| 0.71 | % | | 0.52 | % | 1.46 | % | NM |
| 0.58 | % |
| Return on average tangible common equity: | | | |
| |
| |
| |
| | |
| |
| |
| |
| | | Return on average tangible common equity: | |
| |
| | |
| |
| |
| |
| | |
Average common equity (GAAP)(3) | BB | |
| $4,665 |
|
| $4,174 |
|
| $10,560 |
|
| $19,399 |
| |
| $4,395 |
|
| $3,897 |
|
| $13,542 |
|
| $21,834 |
| |
| $3,813 |
|
| $3,626 |
|
| $16,499 |
|
| $23,938 |
| |
Average common equity (GAAP)(2) | | |
| $4,739 |
|
| $4,666 |
|
| $9,949 |
|
| $19,354 |
| |
| $4,665 |
|
| $4,174 |
|
| $10,560 |
|
| $19,399 |
| |
| $4,395 |
|
| $3,897 |
|
| $13,542 |
|
| $21,834 |
|
| Less: Average goodwill (GAAP) | | — |
| — |
| 6,876 |
| 6,876 |
| | — |
| — |
| 9,063 |
| 9,063 |
| | — |
| — |
| 11,311 |
| 11,311 |
| | — |
| — |
| 6,876 |
| 6,876 |
| | — |
| — |
| 6,876 |
| 6,876 |
| | — |
| — |
| 9,063 |
| 9,063 |
|
| Less: Average other intangibles (GAAP) | | | — |
| — |
| 7 |
| 7 |
| | — |
| — |
| 9 |
| 9 |
| | — |
| — |
| 12 |
| 12 |
| | | — |
| — |
| 4 |
| 4 |
| | — |
| — |
| 7 |
| 7 |
| | — |
| — |
| 9 |
| 9 |
|
| Add: Average deferred tax liabilities related to goodwill (GAAP) | | | — |
| — |
| 377 |
| 377 |
| | — |
| — |
| 459 |
| 459 |
| | — |
| — |
| 617 |
| 617 |
| | | — |
| — |
| 445 |
| 445 |
| | — |
| — |
| 377 |
| 377 |
| | — |
| — |
| 459 |
| 459 |
|
Average tangible common equity (non-GAAP)(3) | CC | |
| $4,665 |
|
| $4,174 |
|
| $4,054 |
|
| $12,893 |
| |
| $4,395 |
|
| $3,897 |
|
| $4,929 |
|
| $13,221 |
| |
| $3,813 |
|
| $3,626 |
|
| $5,793 |
|
| $13,232 |
| |
Return on average tangible common equity (non-GAAP)(3) | U/CC | | 3.90 | % | 13.43 | % | NM |
| 6.71 | % | | 5.48 | % | 13.20 | % | NM |
| (25.91 | %) | | 4.89 | % | 12.45 | % | NM |
| 4.86 | % | |
Return on average tangible common equity, excluding goodwill impairment (non-GAAP)(3) | V/CC | | 3.90 | % | 13.43 | % | NM |
| 6.71 | % | | 5.48 | % | 13.20 | % | NM |
| 4.95 | % | | 4.89 | % | 12.45 | % | NM |
| 4.86 | % | |
| Average tangible common equity (non-GAAP)(2) | | Y | |
| $4,739 |
|
| $4,666 |
|
| $3,514 |
|
| $12,919 |
| |
| $4,665 |
|
| $4,174 |
|
| $4,054 |
|
| $12,893 |
| |
| $4,395 |
|
| $3,897 |
|
| $4,929 |
|
| $13,221 |
|
Return on average tangible common equity (non-GAAP)(2) | | S/Y | | 5.53 | % | 12.41 | % | NM |
| 6.45 | % | | 3.90 | % | 13.43 | % | NM |
| 6.71 | % | | 5.48 | % | 13.20 | % | NM |
| (25.91 | )% |
Return on average tangible common equity, excluding goodwill impairment (non-GAAP)(2) | | T/Y | | 5.53 | % | 12.41 | % | NM |
| 6.45 | % | | 3.90 | % | 13.43 | % | NM |
| 6.71 | % | | 5.48 | % | 13.20 | % | NM |
| 4.95 | % |
(2) Operating segments are allocated capital on a risk-adjusted basis considering economic and regulatory capital requirements. We approximate that regulatory capital is equivalent to a sustainable target level for common equity tier 1 and then allocate that approximation to the segments based on economic capital.
CITIZENS FINANCIAL GROUP, INC.
MANAGEMENT’S DISCUSSION AND ANALYSIS
Results of Operations — Year Ended December 31, 2015 Compared with Year Ended December 31, 2014
Highlights
For the year ended December 31, 2015:
Net income of $840 million decreased $25 million, compared to $865 million in 2014;
| |
| • | Net income included $31 million in after-tax restructuring charges and special noninterest expense items, compared with a net $180 million after-tax gain related to the Chicago Divestiture and $105 million after-tax in restructuring charges and special noninterest expense items in 2014. Excluding the restructuring charges and special items, net income increased $81 million, or 10%, to $871 million,(1) from $790 million(1) in 2014; |
| |
| • | Net income available to common stockholders of $833 million decreased $32 million, compared to $865 million in 2014. Excluding the impact of the Chicago Divestiture gain, restructuring charges and special items net income available to common stockholders of $864 million(1) increased $74 million, or 9%, from 2014. |
Net interest income of $3.4 billion increased $101 million, or 3%, from $3.3 billion in 2014, as the benefit of earning asset growth and a reduction in pay-fixed swap costs was partially offset by continued pressure from the relatively persistent low-rate environment on loan yields and mix, the effect of the Chicago Divestiture, higher borrowing costs related to debt issuances, and higher deposit costs;
Net interest margin of 2.75% decreased 8 basis points, compared to 2.83% in 2014, given the impact of the continued low-rate environment on loan yields and mix, higher borrowing costs related to the issuance of subordinated debt and senior notes, higher deposit costs and the impact of the Chicago Divestiture;
Noninterest income of $1.4 billion decreased $256 million, or 15%, compared to $1.7 billion in 2014, which included a $288 million pre-tax gain related to the Chicago Divestiture. Excluding the Chicago Divestiture gain, noninterest income increased $32 million, or 2%, as higher mortgage banking fees, bank-owned life insurance income, other income, and service charges and fees were partially offset by lower foreign exchange and trade finance fees, capital markets fees, trust and investment services fees and card fees;
Noninterest expense of $3.3 billion was down $133 million, or 4%, compared to $3.4 billion in 2014 driven by a $119 million decrease in restructuring charges and special items, and the impact of the Chicago Divestiture as investments to drive future growth were offset by the benefit of efficiency initiatives;
Provision for credit losses totaled $302 million, down $17 million, or 5%, from $319 million in 2014, reflecting continued improvement in credit quality. Results in 2015 included a net provision build of $18 million compared with a net $4 million release in 2014;
| |
| • | Return on average tangible common equity ratio of 6.45%(1) compared to 6.71%(1) for 2014. Excluding the impact of restructuring charges and special items mentioned above, our return on average tangible common equity improved to 6.69%(1) from 6.13%(1) in 2014; |
Average loans and leases of $96.2 billion increased $7.1 billion, or 8%, from $89.0 billion in 2014, driven by commercial loan growth and growth in auto, residential mortgage, and student loans, partially offset by a decrease in home equity balances and a reduction in the non-core loan portfolio;
Average interest-bearing deposits of $72.5 billion increased $8.1 billion, or 13%, from $64.4 billion (excluding deposits held for sale) in 2014, driven by growth in all deposit products;
Net charge-offs of $284 million decreased $39 million, or 12%, from $323 million in 2014 reflecting continued improvement in credit quality. The ALLL of $1.2 billion increased $21 million compared to year end 2014. ALLL to total loans and leases was 1.23% as of December 31, 2015, compared with 1.28% as of December 31, 2014. ALLL to non-performing loans and leases ratio was 115% as of December 31, 2015, compared with 109% as of December 31, 2014; and
Net income per average common share, basic and diluted, was $1.55 for 2015, which was unchanged from 2014 due to the impact on 2015 earnings per share of a $7 million preferred stock dividend.
(1) These measures are non-GAAP financial measures. For more information on the computation of these non-GAAP financial measures, see “—Principal Components of Operations and Key Performance Metrics Used By Management — Key Performance Metrics and Non-GAAP Financial Measures.”
CITIZENS FINANCIAL GROUP, INC.
MANAGEMENT’S DISCUSSION AND ANALYSIS
Net Income
Net income totaled $840 million in 2015, down $25 million, or 3%, from $865 million in 2014, driven by a $106 million after-tax decrease in restructuring charges and special items. 2015 results included $31 million of after-tax restructuring charges. 2014 results included the benefit of a $180 million after-tax gain related to the Chicago Divestiture and $105 million of after-tax restructuring charges related to our separation from RBS and enhanced efficiencies across the organization. Excluding the restructuring charges and special items, net income increased $81 million, or 10%, from 2014, driven by a pre-tax $133 million increase in revenue and a pre-tax $14 million decrease in noninterest expense.
The following table details the significant components of our net income for the periods indicated:
|
| | | | | | | | | | | | | |
| | Year Ended December 31, | | | | |
| (dollars in millions) | 2015 |
| | 2014 |
| | Change | | Percent |
| Operating Data: | | | | | | | |
| Net interest income |
| $3,402 |
| |
| $3,301 |
| |
| $101 |
| | 3% |
| Noninterest income | 1,422 |
| | 1,678 |
| | (256 | ) | | (15) |
| Total revenue | 4,824 |
| | 4,979 |
| | (155 | ) | | (3) |
Total revenue, excluding special items (1) | 4,824 |
| | 4,691 |
| | 133 |
| | 3 |
| Provision for credit losses | 302 |
| | 319 |
| | (17 | ) | | (5) |
| Noninterest expense | 3,259 |
| | 3,392 |
| | (133 | ) | | (4) |
Noninterest expense, excluding restructuring charges and special items (1) | 3,209 |
| | 3,223 |
| | (14 | ) | | — |
| Income before income tax expense | 1,263 |
| | 1,268 |
| | (5 | ) | | — |
| Income tax expense | 423 |
| | 403 |
| | 20 |
| | 5 |
| Net income | 840 |
| | 865 |
| | (25 | ) | | (3) |
Net income, excluding restructuring charges and special items (1) | 871 |
| | 790 |
| | 81 |
| | 10 |
| Net income available to common stockholders | 833 |
| | 865 |
| | (32 | ) | | (4) |
Net income available to common stockholders, excluding restructuring charges and special items (1) | 864 |
| | 790 |
| | 74 |
| | 9 |
Return on average tangible common equity (1) | 6.45 | % | | 6.71 | % | | (26 | ) bps | | — |
Return on average tangible common equity, excluding restructuring charges and special items (1) | 6.69 | % | | 6.13 | % | | 56 | bps | | — |
(1) These are non-GAAP financial measures. For more information on the computation of this non-GAAP financial measure, see “—Principal Components of Operations and Key Performance Metrics Used By Management — Key Performance Metrics and Non-GAAP Financial Measures.”
CITIZENS FINANCIAL GROUP, INC.
MANAGEMENT’S DISCUSSION AND ANALYSIS
Net Interest Income
The following table shows the major components of net interest income and net interest margin:
|
| | | | | | | | | | | | | | | | | | | | | | |
| | Year Ended December 31, | | |
| 2015 | | 2014 | | Change |
| (dollars in millions) | Average Balances | Income/ Expense | Yields/ Rates | | Average Balances | Income/ Expense | Yields/ Rates | | Average Balances | Yields/ Rates |
| Assets | | | | | | | | | | |
| Interest-bearing cash and due from banks and deposits in banks |
| $1,746 |
|
| $5 |
| 0.29 | % | |
| $2,113 |
|
| $5 |
| 0.22 | % | |
| ($367 | ) | 7 bps |
| Taxable investment securities | 24,649 |
| 621 |
| 2.52 |
| | 24,319 |
| 619 |
| 2.55 |
| | 330 |
| (3) |
| Non-taxable investment securities | 9 |
| — |
| 2.60 |
| | 11 |
| — |
| 2.60 |
| | (2 | ) | — |
| Total investment securities | 24,658 |
| 621 |
| 2.52 |
| | 24,330 |
| 619 |
| 2.55 |
| | 328 |
| (3) |
| Commercial | 32,673 |
| 951 |
| 2.87 |
| | 29,993 |
| 900 |
| 2.96 |
| | 2,680 |
| (9) |
| Commercial real estate | 8,231 |
| 211 |
| 2.53 |
| | 7,158 |
| 183 |
| 2.52 |
| | 1,073 |
| 1 |
| Leases | 3,902 |
| 97 |
| 2.50 |
| | 3,776 |
| 103 |
| 2.73 |
| | 126 |
| (23) |
| Total commercial | 44,806 |
| 1,259 |
| 2.78 |
| | 40,927 |
| 1,186 |
| 2.86 |
| | 3,879 |
| (8) |
| Residential mortgages | 12,338 |
| 465 |
| 3.77 |
| | 10,729 |
| 425 |
| 3.96 |
| | 1,609 |
| (19) |
| Home equity loans | 3,025 |
| 163 |
| 5.38 |
| | 3,877 |
| 205 |
| 5.29 |
| | (852 | ) | 9 |
| Home equity lines of credit | 14,958 |
| 441 |
| 2.95 |
| | 15,552 |
| 450 |
| 2.89 |
| | (594 | ) | 6 |
Home equity loans serviced by others (1) | 1,117 |
| 77 |
| 6.94 |
| | 1,352 |
| 91 |
| 6.75 |
| | (235 | ) | 19 |
Home equity lines of credit serviced by others (1) | 453 |
| 11 |
| 2.44 |
| | 609 |
| 16 |
| 2.68 |
| | (156 | ) | (24) |
| Automobile | 13,516 |
| 372 |
| 2.75 |
| | 11,011 |
| 282 |
| 2.57 |
| | 2,505 |
| 18 |
| Student | 3,313 |
| 167 |
| 5.03 |
| | 2,148 |
| 102 |
| 4.74 |
| | 1,165 |
| 29 |
| Credit cards | 1,621 |
| 178 |
| 10.97 |
| | 1,651 |
| 167 |
| 10.14 |
| | (30 | ) | 83 |
| Other retail | 1,003 |
| 78 |
| 7.75 |
| | 1,186 |
| 88 |
| 7.43 |
| | (183 | ) | 32 |
| Total retail | 51,344 |
| 1,952 |
| 3.80 |
| | 48,115 |
| 1,826 |
| 3.80 |
| | 3,229 |
| — |
| Total loans and leases | 96,150 |
| 3,211 |
| 3.32 |
| | 89,042 |
| 3,012 |
| 3.37 |
| | 7,108 |
| (5) |
| Loans held for sale, at fair value | 301 |
| 10 |
| 3.47 |
| | 163 |
| 5 |
| 3.10 |
| | 138 |
| 37 |
| Other loans held for sale | 95 |
| 7 |
| 7.22 |
| | 539 |
| 23 |
| 4.17 |
| | (444 | ) | 305 |
| Interest-earning assets | 122,950 |
| 3,854 |
| 3.12 |
| | 116,187 |
| 3,664 |
| 3.14 |
| | 6,763 |
| (2) |
| Allowance for loan and lease losses | (1,196 | ) | | | | (1,230 | ) | | | | 34 |
| |
| Goodwill | 6,876 |
| | | | 6,876 |
| | | | — |
| |
| Other noninterest-earning assets | 6,440 |
| | | | 5,791 |
| | | | 649 |
| |
| Total noninterest-earning assets | 12,120 |
| | | | 11,437 |
| | | | 683 |
| |
| Total assets |
| $135,070 |
| | | |
| $127,624 |
| | | |
| $7,446 |
| |
| Liabilities and Stockholders’ Equity | | | | | | | | | | |
| Checking with interest |
| $16,666 |
|
| $19 |
| 0.11 | % | |
| $14,507 |
|
| $12 |
| 0.08 | % | |
| $2,159 |
| 3 bps |
| Money market and savings | 43,458 |
| 117 |
| 0.27 |
| | 39,579 |
| 77 |
| 0.19 |
| | 3,879 |
| 8 |
| Term deposits | 12,424 |
| 101 |
| 0.82 |
| | 10,317 |
| 67 |
| 0.65 |
| | 2,107 |
| 17 |
| Total interest-bearing deposits | 72,548 |
| 237 |
| 0.33 |
| | 64,403 |
| 156 |
| 0.24 |
| | 8,145 |
| 9 |
| Interest-bearing deposits held for sale | — |
| — |
| — |
| | 1,960 |
| 4 |
| 0.22 |
| | (1,960 | ) | (22) |
Federal funds purchased and securities sold under agreements to repurchase (2) | 3,364 |
| 16 |
| 0.46 |
| | 5,699 |
| 32 |
| 0.55 |
| | (2,335 | ) | (9) |
| Other short-term borrowed funds | 5,865 |
| 67 |
| 1.13 |
| | 5,640 |
| 89 |
| 1.56 |
| | 225 |
| (43) |
| Long-term borrowed funds | 4,479 |
| 132 |
| 2.95 |
| | 1,907 |
| 82 |
| 4.25 |
| | 2,572 |
| (130) |
| Total borrowed funds | 13,708 |
| 215 |
| 1.56 |
| | 13,246 |
| 203 |
| 1.51 |
| | 462 |
| 5 |
| Total interest-bearing liabilities | 86,256 |
| 452 |
| 0.52 |
| | 79,609 |
| 363 |
| 0.45 |
| | 6,647 |
| 7 |
| Demand deposits | 26,606 |
| | | | 25,739 |
| | | | 867 |
| |
| Demand deposits held for sale | — |
| | | | 462 |
| | | | (462 | ) | |
| Other liabilities | 2,671 |
| | | | 2,415 |
| | | | 256 |
| |
| Total liabilities | 115,533 |
| | | | 108,225 |
| | | | 7,308 |
| |
| Stockholders’ equity | 19,537 |
| | | | 19,399 |
| | | | 138 |
| |
| Total liabilities and stockholders’ equity |
| $135,070 |
| | | |
| $127,624 |
| | | |
| $7,446 |
| |
| Interest rate spread | | | 2.60 |
| | | | 2.69 |
| | | (9) |
| Net interest income | |
| $3,402 |
| | | |
| $3,301 |
| | |
|
| |
| Net interest margin | | | 2.75 | % | | | | 2.83 | % | | | (8)bps |
| Memo: Total deposits (interest-bearing and demand) |
| $99,154 |
|
| $237 |
| 0.24 | % | |
| $92,564 |
|
| $160 |
| 0.17 | % | |
| $6,590 |
| 7 bps |
(1) Our SBO portfolio consists of purchased home equity loans and lines that were originally serviced by others. We now service a portion of this portfolio internally.
(2) Balances are net of certain short-term receivables associated with reverse repurchase agreements. Interest expense includes the full cost of the repurchase agreements and certain hedging costs. The rate on federal funds purchased is elevated due to the impact from pay-fixed interest rate swaps that are scheduled to run off by the end of 2016. See “—Analysis of Financial Condition — December 31, 2015 Compared with December 31, 2014 — Derivatives” for further information.
CITIZENS FINANCIAL GROUP, INC.
MANAGEMENT’S DISCUSSION AND ANALYSIS
Net interest income of $3.4 billion in 2015 increased $101 million, or 3%, compared to $3.3 billion in 2014, as the benefit of earning asset growth and a reduction in pay-fixed swap costs was partially offset by continued pressure from the relatively persistent low-rate environment on loan yields and mix, higher borrowing costs related to debt issuances, and higher deposit costs.
Average interest-earning assets increased $6.8 billion, or 6%, from 2014 due to a $3.9 billion increase in average commercial loans and leases, and a $3.2 billion increase in average retail loans as growth in auto, mortgage, and student loan balances, were partially offset by lower home equity outstandings, and a reduction in the non-core loan portfolio.
2015 net interest margin of 2.75% declined eight basis points compared to 2.83% in 2014 as the benefit of lower pay-fixed swap costs was more than offset by increased deposit costs, higher senior and subordinated debt borrowing costs and a modest decrease in loan yields. 2015 average interest-earning asset yields of 3.12% declined two basis points from 3.14% in 2014, reflecting the decline in the commercial loan and lease portfolio yields given the continued impact of the relatively persistent low-rate environment. Investment portfolio income of $621 million in 2015 remained relatively stable compared to $619 million in 2014.
Total interest-bearing deposit costs of $237 million in 2015 increased $81 million, or 52%, from $156 million in 2014 and reflected a nine basis point increase in the rate paid on deposits to 0.33% from 0.24%. The increase in deposit costs reflected a shift in mix to longer duration deposits, largely term and money market products. The cost of term deposits increased to 0.82% in 2015 from 0.65% in 2014, and money market accounts and savings accounts increased to 0.27% in 2015 from 0.19% in 2014.
Total borrowed funds costs of $215 million in 2015 increased modestly from 2014. Within the federal funds purchased and securities sold under agreements to repurchase and other short-term borrowed funds, pay-fixed swap expense declined to $58 million for 2015 compared to $99 million in 2014. Including the impact of hedging costs, total borrowed funds rates increased to 1.56% from 1.51% in 2014. The increase in long-term borrowing expense of $50 million was driven by an increase in senior and subordinated debt as we continued to realign our liability and capital structure to better align with peers.
Noninterest Income
The following table details the significant components of our noninterest income:
|
| | | | | | | | | | | | | | |
| | Year Ended December 31, | | | | |
| (dollars in millions) | 2015 |
| | 2014 |
| | Change |
| | Percent |
|
| Service charges and fees |
| $575 |
| |
| $574 |
| |
| $1 |
| | — | % |
| Card fees | 232 |
| | 233 |
| | (1 | ) | | — |
|
| Trust and investment services fees | 157 |
| | 158 |
| | (1 | ) | | (1 | ) |
| Mortgage banking fees | 101 |
| | 71 |
| | 30 |
| | 42 |
|
| Capital markets fees | 88 |
| | 91 |
| | (3 | ) | | (3 | ) |
| Foreign exchange and trade finance fees | 90 |
| | 95 |
| | (5 | ) | | (5 | ) |
| Bank-owned life insurance income | 56 |
| | 49 |
| | 7 |
| | 14 |
|
| Securities gains, net | 29 |
| | 28 |
| | 1 |
| | 4 |
|
Other income (1) | 94 |
| | 379 |
| | (285 | ) | | (75 | ) |
| Noninterest income |
| $1,422 |
| |
| $1,678 |
| |
| ($256 | ) | | (15 | %) |
(1) Includes net securities impairment losses on securities available for sale recognized in earnings and other income. Additionally, noninterest income for the year ended December 31, 2014 reflects a $288 million pre-tax gain related to the Chicago Divestiture.
Noninterest income of $1.4 billion in 2015 decreased $256 million, or 15%, compared to $1.7 billion in 2014, which included a $288 million pre-tax gain related to the Chicago Divestiture. Excluding the gain, noninterest income increased $32 million. Service charges and fees, card fees and trust and investment services fees remained relatively stable. Mortgage banking fees increased $30 million reflecting the benefit of improved portfolio sales gains and higher origination volumes. Capital markets fees decreased $3 million, reflecting lower overall market conditions. Securities gains remained relatively stable. Other income, excluding the impact of the $288 million pre-tax Chicago gain recorded in the second quarter of 2014, increased $3 million.
Provision for Credit Losses
Provision for credit losses of $302 million in 2015 declined $17 million from $319 million in 2014, reflecting continued improvement in credit quality. Net charge-offs for 2015 totaled $284 million, or 0.30% of average loans, compared to $323 million, or 0.36%, in 2014. The provision for credit losses includes the provision for loan and lease losses as well as the provision for unfunded commitments.
The provision for loan and lease losses is the result of a detailed analysis performed to estimate an appropriate and adequate ALLL. The total provision for credit losses included the provision for loan and lease losses as well as the provision for unfunded commitments. Refer to “—Analysis of Financial Condition — Allowance for Credit Losses and Nonperforming Assets” for more information.
CITIZENS FINANCIAL GROUP, INC.
MANAGEMENT’S DISCUSSION AND ANALYSIS
Noninterest Expense
The following table displays the significant components of our noninterest expense for the periods indicated:
|
| | | | | | | | | | | | | | |
| | Year Ended December 31, | | | | |
| (dollars in millions) | 2015 |
| | 2014 |
| | Change |
| | Percent |
|
| Salaries and employee benefits |
| $1,636 |
| |
| $1,678 |
| |
| ($42 | ) | | (3 | %) |
| Outside services | 371 |
| | 420 |
| | (49 | ) | | (12 | ) |
| Occupancy | 319 |
| | 326 |
| | (7 | ) | | (2 | ) |
| Equipment expense | 257 |
| | 250 |
| | 7 |
| | 3 |
|
| Amortization of software | 146 |
| | 145 |
| | 1 |
| | 1 |
|
| Other operating expense | 530 |
| | 573 |
| | (43 | ) | | (8 | ) |
| Noninterest expense |
| $3,259 |
| |
| $3,392 |
| |
| ($133 | ) | | (4 | %) |
Noninterest expense of $3.3 billion in 2015 declined $133 million or 4%, compared to $3.4 billion 2014, driven by a $119 million decrease in restructuring charges and special items. Excluding the impact of the restructuring charges and special items, noninterest expense decreased $14 million, driven by lower occupancy expense, salaries and employee benefits and other operating expense, partially offset by higher equipment, amortization of software, and outside services. Results reflected the impact of the Chicago Divestiture and investments to drive future growth, offset by the benefit of efficiency initiatives.
Provision for Income Taxes
Provision for income taxes of $423 million decreased from $403 million in 2014, respectively and reflected an effective tax rate of 33.5%, which increased from 31.8% in 2014. The increase in the effective income tax rate related to the tax-rate impact of combined reporting legislation, non-deductible permanent expense items, and the adoption of ASU No. 2014-01, “Accounting for Investments in Qualified Affordable Housing Projects.” The application of this guidance resulted in the reclassification of the amortization of these investments to income tax expense from noninterest income. Furthermore, these increases were partially offset by the tax rate impact of the gain on the Chicago Divestiture in the second quarter of 2014.
At December 31, 2015, we reported a net deferred tax liability of $730 million, compared to a $493 million liability at December 31, 2014. The increase in the net deferred tax liability was primarily attributable to the increase in the deferred tax liability related to temporary differences of $261 million. For further discussion, see Note 15 “Income Taxes” to our Consolidated Financial Statements in Part II, Item 8 — Financial Statements and Supplementary Data, included elsewhere in this report.
CITIZENS FINANCIAL GROUP, INC.
MANAGEMENT’S DISCUSSION AND ANALYSIS
Business Segments
We operate our business through two operating segments: Consumer Banking and Commercial Banking. Segment results are derived from our business-line profitability reporting systems by specifically attributing managed assets, liabilities, capital and their related revenues, provision for credit losses and expenses. Residual assets, liabilities, capital and their related revenues, provision for credit losses and expenses are attributed to Other.
Other includes our treasury function, securities portfolio, wholesale funding activities, goodwill and goodwill impairment, community development assets and other unallocated assets, liabilities, capital, revenues, provision for credit losses and expenses not attributed to Consumer Banking or Commercial Banking. Other also includes our non-core assets. Non-core assets are primarily loans inconsistent with our strategic goals, generally as a result of geographic location, industry, product type or risk level. The non-core portfolio totaled $2.3 billion as of December 31, 2015, down 25% from December 31, 2014. The largest component of our non-core portfolio is our home equity products currently or formerly serviced by others portfolio.
The following tables present certain financial data of our business segments:
|
| | | | | | | | | | | | | | | |
| | As of and for the Year Ended December 31, 2015 |
| (dollars in millions) | Consumer Banking | | Commercial Banking | | Other |
| (1) | Consolidated |
| Net interest income |
| $2,198 |
| |
| $1,162 |
| |
| $42 |
| |
| $3,402 |
|
| Noninterest income | 910 |
| | 415 |
| | 97 |
| | 1,422 |
|
| Total revenue | 3,108 |
| | 1,577 |
| | 139 |
| | 4,824 |
|
| Noninterest expense | 2,456 |
| | 709 |
| | 94 |
| | 3,259 |
|
| Profit before provision for credit losses | 652 |
| | 868 |
| | 45 |
| | 1,565 |
|
| Provision for credit losses | 252 |
| | (13 | ) | | 63 |
| | 302 |
|
| Income (loss) before income tax expense (benefit) | 400 |
| | 881 |
| | (18 | ) | | 1,263 |
|
| Income tax expense (benefit) | 138 |
| | 302 |
| | (17 | ) | | 423 |
|
| Net income (loss) |
| $262 |
| |
| $579 |
| |
| ($1 | ) | |
| $840 |
|
| Loans and leases and loans held for sale (year-end) |
| $53,344 |
| |
| $42,987 |
| |
| $3,076 |
| |
| $99,407 |
|
| Average Balances: | | | | | | | |
| Total assets |
| $52,848 |
| |
| $42,800 |
| |
| $39,422 |
| |
| $135,070 |
|
| Loans and leases and loans held for sale | 51,484 |
| | 41,593 |
| | 3,469 |
| | 96,546 |
|
| Deposits | 69,748 |
| | 23,473 |
| | 5,933 |
| | 99,154 |
|
| Interest-earning assets | 51,525 |
| | 41,689 |
| | 29,736 |
| | 122,950 |
|
| Key Metrics | | | | | | | |
| Net interest margin | 4.27 | % | | 2.79 | % | | NM |
| | 2.75 | % |
Efficiency ratio (2) | 79.02 |
| | 44.94 |
| | NM |
| | 67.56 |
|
Average loans to average deposits ratio (3) | 73.81 |
| | 177.19 |
| | NM |
| | 97.37 |
|
Return on average total tangible assets (2) | 0.50 |
| | 1.35 |
| | NM |
| | 0.65 |
|
Return on average tangible common equity (2) (4) | 5.53 |
| | 12.41 |
| | NM |
| | 6.45 |
|
(1) Includes the financial impact of non-core, liquidating loan portfolios and other non-core assets, our treasury activities, wholesale funding activities, securities portfolio, community development assets and other unallocated assets, liabilities, capital, revenues, provision for credit losses and expenses not attributed to our Consumer Banking or Commercial Banking segments. For a description of non-core assets, see “—Analysis of Financial Condition — December 31, 2015 Compared with December 31, 2014 — Loans and Leases-Non-Core Assets.”
(2) These are non-GAAP financial measures. For more information on the computation of these non-GAAP financial measures, see “—Principal Components of Operations and Key Performance Metrics Used By Management — Key Performance Metrics and Non-GAAP Financial Measures.”
(3)Ratios include loans and leases held for sale.
(4) Operating segments are allocated capital on a risk-adjusted basis considering economic and regulatory capital requirements. We approximate that regulatory capital is equivalent to a sustainable target level for CET1 and then allocate that approximation to the segments based on economic capital.
Our capital levels are evaluated and managed centrally, however, capital is allocated to the operating segments to support evaluation of business performance. Operating segments are allocated capital on a risk-adjusted basis considering economic and regulatory capital requirements. We approximate that regulatory capital is equivalent to a sustainable target level for common equity tier 1 and then allocate that approximation to the segments based on economic capital. Interest income and expense is determined based on the assets and liabilities managed by the business segment. Because funding and asset liability management is a central function, funds transfer-pricing methodologies are utilized to allocate a cost of funds used, or credit for the funds provided, to all business segment assets, liabilities and capital, respectively, using a matched-funding concept. The residual effect on net interest income of asset/liability management, including the residual net interest income related to the funds transfer pricing process, is included in Other.
CITIZENS FINANCIAL GROUP, INC.
MANAGEMENT'SMANAGEMENT’S DISCUSSION AND ANALYSIS
Provision for credit losses is allocated to each business segment based on actual net charge-offs that have been recognized by the business segment. The difference between the consolidated provision for credit losses and the business segments’ net charge-offs is reflected in Other.
Noninterest income and expense directly managed by each business segment, including fees, service charges, salaries and benefits, and other direct revenues and costs are accounted for within each segment’s financial results in a manner similar to our Consolidated Financial Statements. Occupancy costs are allocated based on utilization of facilities by the business segment. Noninterest expenses incurred by centrally managed operations or business segments that directly support another business segment’s operations are charged to the applicable business segment based on its utilization of those services.
Income taxes are assessed to each business segment at a standard tax rate with the residual tax expense or benefit to arrive at the consolidated effective tax rate included in Other.
Developing and applying methodologies used to allocate items among the business segments is a dynamic process. Accordingly, financial results may be revised periodically as management systems are enhanced, methods of evaluating performance or product lines change, or our organizational structure changes.
Consumer Banking
|
| | | | | | | | | | | | | | |
| | As of and for the Year Ended December 31, | | | | |
| (dollars in millions) | 2015 |
| | 2014 |
| | Change | | Percent |
|
| Net interest income |
| $2,198 |
| |
| $2,151 |
| |
| $47 |
| | 2 | % |
| Noninterest income | 910 |
| | 899 |
| | 11 |
| | 1 |
|
| Total revenue | 3,108 |
| | 3,050 |
| | 58 |
| | 2 |
|
| Noninterest expense | 2,456 |
| | 2,513 |
| | (57 | ) | | (2 | ) |
| Profit before provision for credit losses | 652 |
| | 537 |
| | 115 |
| | 21 |
|
| Provision for credit losses | 252 |
| | 259 |
| | (7 | ) | | (3 | ) |
| Income before income tax expense | 400 |
| | 278 |
| | 122 |
| | 44 |
|
| Income tax expense | 138 |
| | 96 |
| | 42 |
| | 44 |
|
| Net income |
| $262 |
| |
| $182 |
| |
| $80 |
| | 44 |
|
| Loans and leases and loans held for sale (year-end) |
| $53,344 |
| |
| $49,919 |
| |
| $3,425 |
| | 7 |
|
| Average Balances: | | | | | | | |
| Total assets |
| $52,848 |
| |
| $48,939 |
| |
| $3,909 |
| | 8 |
|
Loans and leases and loans held for sale (1) | 51,484 |
| | 47,745 |
| | 3,739 |
| | 8 |
|
Deposits and deposits held for sale (2) | 69,748 |
| | 68,214 |
| | 1,534 |
| | 2 |
|
| Interest-earning assets | 51,525 |
| | 47,777 |
| | 3,748 |
| | 8 | % |
| Key Metrics | | | | | | | |
| Net interest margin | 4.27 | % | | 4.50 | % | | (23) bps |
| | — |
|
Efficiency ratio (3) | 79.02 |
| | 82.39 |
| | (337) bps |
| | — |
|
Average loans to average deposits ratio (4) | 73.81 |
| | 69.99 |
| | 382 bps |
| | — |
|
Return on average total tangible assets (3) | 0.50 |
| | 0.37 |
| | 13 bps |
| | — |
|
Return on average tangible common equity (3) (5) | 5.53 |
| | 3.90 |
| | 163 bps |
| | — |
|
(1) Average loans held for sale for the year ended December 31, 2014 include loans relating to the Chicago Divestiture.
(2) Average deposits held for sale for the year ended December 31, 2014 include deposits relating to the Chicago Divestiture.
(3) These are non-GAAP financial measures. For more information on the computation of these non-GAAP financial measures, see “—Principal Components of Operations and Key Performance Metrics Used By Management — Key Performance Metrics and Non-GAAP Financial Measures.”
(4) Ratios include both loans and leases held for sale and deposits held for sale.
(5) Operating segments are allocated capital on a risk-adjusted basis considering economic and regulatory capital requirements. We approximate that regulatory capital is equivalent to a sustainable target level for CET1 and then allocate that approximation to the segments based on economic capital.
Consumer Banking net income of $262 million in 2015 increased $80 million, or 44%, from 2014, reflecting higher revenue and lower expense.
Consumer Banking total revenue of $3.1 billion in 2015 increased $58 million from 2014 despite the impact of the Chicago Divestiture, driven by loan and deposit growth as well as growth in overall fee revenue tied to mortgage banking and service charges, net.
Net interest income of $2.2 billion increased 2% from 2014, driven by the benefit of loan growth, with particular strength in auto, residential mortgage and student loans of $910 million partially offset by the effect of the relatively persistent low-rate
CITIZENS FINANCIAL GROUP, INC.
MANAGEMENT’S DISCUSSION AND ANALYSIS
environment as well as the impact of the Chicago Divestiture. Noninterest income increased 1% driven by strength in mortgage banking and higher service charges, partially offset by the Chicago Divestiture.
Noninterest expense of $2.5 billion in 2015 decreased $57 million, or 2%, from $2.5 billion in 2014, reflecting a combination of Chicago Divestiture and cost saving actions and offset by the continued investment in the business to drive future growth.
Provision for credit losses of $252 million in 2015 decreased $7 million, or 3%, from $259 million in 2014, reflecting continued improvement in credit quality, partially offset by the continued growth in loan balances.
Commercial Banking
|
| | | | | | | | | | | | | | |
| | As of and for the Year Ended December 31, | | | | |
| (dollars in millions) | 2015 |
| | 2014 |
| | Change | | Percent |
|
| Net interest income |
| $1,162 |
| |
| $1,073 |
| |
| $89 |
| | 8 | % |
| Noninterest income | 415 |
| | 429 |
| | (14 | ) | | (3 | ) |
| Total revenue | 1,577 |
| | 1,502 |
| | 75 |
| | 5 |
|
| Noninterest expense | 709 |
| | 652 |
| | 57 |
| | 9 |
|
| Profit before provision for credit losses | 868 |
| | 850 |
| | 18 |
| | 2 |
|
| Provision for credit losses | (13 | ) | | (6 | ) | | (7 | ) | | (117 | ) |
| Income before income tax expense | 881 |
| | 856 |
| | 25 |
| | 3 |
|
| Income tax expense | 302 |
| | 295 |
| | 7 |
| | 2 |
|
| Net income |
| $579 |
| |
| $561 |
| |
| $18 |
| | 3 |
|
| Loans and leases and loans held for sale (year-end) |
| $42,987 |
| |
| $39,861 |
| |
| $3,126 |
| | 8 |
|
| Average Balances: | | | | | | | |
| Total assets |
| $42,800 |
| |
| $38,483 |
| |
| $4,317 |
| | 11 |
|
Loans and leases and loans held for sale (1) | 41,593 |
| | 37,683 |
| | 3,910 |
| | 10 |
|
Deposits and deposits held for sale (2) | 23,473 |
| | 19,838 |
| | 3,635 |
| | 18 |
|
| Interest-earning assets | 41,689 |
| | 37,809 |
| | 3,880 |
| | 10 |
|
| Key Metrics | | | | | | | |
| Net interest margin | 2.79 | % | | 2.84 | % | | (5) bps |
| | — |
|
Efficiency ratio (3) | 44.94 |
| | 43.37 |
| | 157 bps |
| | — |
|
Average loans to average deposits ratio (4) | 177.19 |
| | 189.96 |
| | (1,277) bps |
| | — |
|
Return on average total tangible assets (3) | 1.35 |
| | 1.46 |
| | (11) bps |
| | — |
|
Return on average tangible common equity (3) (5) | 12.41 |
| | 13.43 |
| | (102) bps |
| | — |
|
(1) Average loans held for sale for the year ended December 31, 2014 include loans relating to the Chicago Divestiture.
(2) Average deposits held for sale for the year ended December 31, 2014 include deposits relating to the Chicago Divestiture.
(3) These are non-GAAP financial measures. For more information on the computation of these non-GAAP financial measures, see “—Principal Components of Operations and Key Performance Metrics Used By Management — Key Performance Metrics and Non-GAAP Financial Measures.”
(4) Ratios include both loans and leases held for sale and deposits held for sale.
(5) Operating segments are allocated capital on a risk-adjusted basis considering economic and regulatory capital requirements. We approximate that regulatory capital is equivalent to a sustainable target level for CET1 and then allocate that approximation to the segments based on economic capital.
Commercial Banking net income of $579 million increased $18 million, or 3%, from 2014, as an increase in net interest income driven by strong balance sheet growth, deposit cost improvement and reduced impairment costs more than offset lower noninterest income and an increase in noninterest expense.
Net interest income of $1.2 billion in 2015 increased $89 million, or 8%, from 2014, reflecting the benefit of an increase of $3.9 billion in average loan balances and $3.6 billion in average deposits, partially offset by spread compression.
Noninterest income of $415 million in 2015 decreased $14 million, or 3%, from 2014 as the benefit of an increase in service charges and fees, interest rate products, and card fees was more than offset by lower leasing income, foreign exchange and trade finance fees, and capital markets fee income.
Noninterest expense of $709 million in 2015 increased $57 million, or 9%, from $652 million in 2014, reflecting increased salary and benefits costs, outside services, and insurance expense, including continued investments to drive future growth.
Provision for credit losses resulted in a net recovery of $13 million in 2015 compared to a net recovery of $6 million in 2014 and reflected continued improvement in credit quality.
CITIZENS FINANCIAL GROUP, INC.
MANAGEMENT’S DISCUSSION AND ANALYSIS
Other
|
| | | | | | | | | | | | | | |
| | As of and for the Year Ended December 31, | | | | |
| (dollars in millions) | 2015 |
| | 2014 |
| | Change |
| | Percent |
|
| Net interest income |
| $42 |
| |
| $77 |
| |
| ($35 | ) | | (45 | %) |
| Noninterest income | 97 |
| | 350 |
| | (253 | ) | | (72 | ) |
| Total revenue | 139 |
| | 427 |
| | (288 | ) | | (67 | ) |
| Noninterest expense | 94 |
| | 227 |
| | (133 | ) | | (59 | ) |
| Profit before provision for credit losses | 45 |
| | 200 |
| | (155 | ) | | (78 | ) |
| Provision for credit losses | 63 |
| | 66 |
| | (3 | ) | | (5 | ) |
| (Loss) income before income tax (benefit) expense | (18 | ) | | 134 |
| | (152 | ) | | (113 | ) |
| Income tax (benefit) expense | (17 | ) | | 12 |
| | (29 | ) | | (242 | ) |
| Net (loss) income |
| ($1 | ) | |
| $122 |
| |
| ($123 | ) | | (101 | ) |
| Loans and leases and loans held for sale (year-end) |
| $3,076 |
| |
| $3,911 |
| |
| ($835 | ) | | (21 | ) |
| Average Balances: | | | | | | | |
| Total assets |
| $39,422 |
| |
| $40,202 |
| |
| ($780 | ) | | (2 | ) |
| Loans and leases and loans held for sale | 3,469 |
| | 4,316 |
| | (847 | ) | | (20 | ) |
| Deposits and deposits held for sale | 5,933 |
| | 4,512 |
| | 1,421 |
| | 31 |
|
| Interest-earning assets | 29,736 |
| | 30,601 |
| | (865 | ) | | (3 | ) |
Other recorded a net loss of $1 million in 2015 compared to net income of $122 million in 2014. The net loss in 2015 included $31 million of after-tax restructuring charges and special items. Net income in 2014 included a $180 million after-tax gain related to the Chicago Divestiture partially offset by $105 million of after-tax restructuring charges and special items. Excluding these items, net income decreased by $17 million.
Net interest income in 2015 decreased $35 million to $42 million compared to $77 million in 2014. The decrease was driven primarily by an increase in wholesale funding costs, and lower non-core loans, partially offset by a reduction in interest rate swap costs.
Noninterest income in 2015 decreased $253 million driven by the $288 million pre-tax gain on the Chicago Divestiture. Excluding the gain, noninterest income increased $35 million driven by an accounting change for low-income housing investments, which is offset in income tax expense.
Noninterest expense in 2015 of $94 million decreased $133 million from 2014, reflecting lower restructuring charges and special items of $119 million and lower employee incentive costs.
The provision for credit losses in 2015 decreased $3 million to $63 million compared to $66 million in 2014, reflecting stable credit quality and a decrease in non-core net charge-offs of $23 million to $44 million in 2015 compared to $67 million in 2014. On a quarterly basis, we review and refine our estimate of the allowance for credit losses, taking into consideration changes in portfolio size and composition, historical loss experience, internal risk ratings, current economic conditions, industry-performance trends and other pertinent information. The provision also reflected an increase in overall credit exposure associated with growth in our loan portfolio.
Total assets as of December 31, 2015 included $2.1 billion and $4.7 billion of goodwill related to the Consumer Banking and Commercial Banking reporting units, respectively. For further information regarding the reconciliation of segment results to GAAP results, see Note 24 “Business Segments” to our audited Consolidated Financial Statements in Part II, Item 8 — Financial Statements and Supplementary Data, included elsewhere in this report.
CITIZENS FINANCIAL GROUP, INC.
MANAGEMENT’S DISCUSSION AND ANALYSIS
Results of Operations — Year Ended December 31, 2014 Compared with Year Ended December 31, 2013
Highlights
For the year ended December 31, 2014:
netNet income of $865 million increased $4.3 billion compared to a loss of $3.4 billion in 2013;
| |
| • | Net income included a net $180 million after-tax gain related to the Chicago Divestiture and $105 million after-tax restructuring charges and special noninterest expense items largely related to our separation from RBS and ongoing efforts to improve processes and enhance efficiencies across the organization. 2013 included an after-tax goodwill impairment charge of $4.1 billion. Excluding the Chicago gain, restructuring charges and special items and the goodwill impairment charge, net income increased $119 million, or 18%, to $790 million(1), from $671 million(1) in 2013; |
net income included a net $180 million after-tax gain related to the Chicago Divestiture and $105 million after-tax restructuring charges and special noninterest expense items largely related to our separation from RBS Group and ongoing efforts to improve processes and enhance efficiencies across the organization. 2013 included an after-tax goodwill impairment charge of $4.1 billion. Excluding the Chicago gain, restructuring charges and special items and the goodwill impairment charge, net income increased $119 million, or 18%, to $790 million, from $671 million in 2013;
netNet interest income of $3.3 billion increased $243 million, or 8%, from $3.1 billion in 2013, largely reflecting growth in investment securities and loan portfolios, and a reduction in pay-fixed swap costs and deposit costs as we continued to reduce our reliance on higher cost certificate of deposit and money market deposits. These results were partially offset by the impact of declining loan yields given the relatively persistent low-rate environment and higher long-term borrowing costs;
netNet interest margin of 2.83%, compared to 2.85% in 2013, remained relatively stable as the impact of continued pressure on commercial and retail loan yields and higher long-term borrowing costs were partially offset by a reduction in pay-fixed swap costs and deposit costs;
noninterestNoninterest income of $1.7 billion included a $288 million pre-tax gain on the Chicago Divestiture, and increased $46 million, or 3%, to $1.7 billion, compared to $1.6$1.6 billion in 2013. Excluding the gain, noninterest income decreased $242 million, or 15%, driven by the effect of a $116 million reduction in net securities gains, lower mortgage banking fees, and lower service charges and fees, which were partially offset by growth in trust and investment services fees and capital markets fees;
noninterestNoninterest expense of $3.4 billion decreased $4.3 billion, or 56%, compared to $7.7 billion in 2013, which included a pre-tax $4.4 billion goodwill impairment charge. Results in 2014 included $169 million in pre-tax restructuring charges and special items compared with $26 million in 2013. Excluding the goodwill impairment and restructuring charges and special items, noninterest expense remained relatively stable;
provisionProvision for credit losses totaled $319$319 million and decreased $160 million, or 33%, from $479$479 million in 2013. Results in 2014 included a net provision release of $4 million compared with a $22 million release in 2013;
| |
| • | Our return on average tangible common equity ratio improved to 6.71%(1), from (25.91%)(1) in 2013. Excluding the impact of the goodwill impairment, restructuring charges and special items mentioned above, our return on average tangible common equity improved to 6.13%(1) from 5.08%(1) in 2013; |
our return on average tangible common equity ratio improved to 6.71%, from (25.91%) in 2013. Excluding the impact of the goodwill impairment, restructuring charges and special items mentioned above, our return on average tangible common equity improved to 6.13% from 5.08% in 2013;
averageAverage loans and leases of $89.0 billion increased $3.6 billion, or 4%, from $85.4 billion in 2013, due to growth in commercial loans, residential mortgages and auto loans, which more than offset the reduction in home equity loans and lines of credit;
averageAverage interest-bearing deposits of $64.4 billion decreased $3.5 billion, or 5%, from $67.9 billion in 2013, primarily driven by a $2.0 billion decrease associated with the Chicago Divestiture as well as a reduction of higher cost money market and term deposits; and
netNet income per average common share, basic and diluted, was $1.55 in 2014, compared to a loss of $6.12 in 2013, which included a goodwill impairment charge of $7.29 per share.
(1) These measures are non-GAAP financial measures. For more information on the computation of these non-GAAP financial measures, see “—Principal Components of Operations and Key Performance Metrics Used By Management — Key Performance Metrics and Non-GAAP Financial Measures.”
CITIZENS FINANCIAL GROUP, INC.
MANAGEMENT'SMANAGEMENT’S DISCUSSION AND ANALYSIS
Net Income (Loss)
Net income totaled $865 million in 2014, and included $75 million of after-tax net restructuring charges and special items related to our separation from RBS, Group, efforts to improve processes and enhance efficiencies across the organization, and the Chicago Divestiture. These results increased $4.3 billion from 2013, which included a $4.1 billion after-tax goodwill impairment charge. Excluding the gain, restructuring charges and special items and impairment charge noted above, 2014 net income increased $119 million, or 18%, from 2013, as the benefit of lower provision for credit losses and higher net interest income was partially offset by the effect of lower noninterest income and increased noninterest expense.
The special items and restructuring charges in 2014 included a $288 million pre-tax gain ($180 million after tax) on the sale of the Chicago-area deposits, $17 million of pre-tax expenses ($11 million after tax) related to the Chicago Divestiture, $97 million of pre-tax expenses ($61 million after tax), related to our efficiency initiatives, $20 million of pre-tax expenses ($11 million after tax) related to our separation from RBS, and $35 million of other pre-tax expenses ($22 million after tax) related to regulatory initiatives. The restructuring charges in 2013 related to our implementation of a new branch image capture system on the teller line which automated several key processes within the branch network, and our decision to close certain branches, which resulted in lease termination costs and other fixed asset write-offs.
The following table details the significant components of our net income (loss) for the periods indicated:
| | | | Year Ended December 31, | | | | | Year Ended December 31, | | | | |
| (dollars in millions) | 2014 | | 2013 | | Change | | Percent | 2014 | | 2013 | | Change | | Percent |
| Operating Data: | | | | | | | | | | | | | | |
| Net interest income |
| $3,301 |
| |
| $3,058 |
| |
| $243 |
| | 8 | % |
| $3,301 |
| |
| $3,058 |
| |
| $243 |
| | 8 | % |
| Noninterest income | 1,678 |
| | 1,632 |
| | 46 |
| | 3 |
| 1,678 |
| | 1,632 |
| | 46 |
| | 3 |
|
| Total revenue | 4,979 |
| | 4,690 |
| | 289 |
| | 6 |
| 4,979 |
| | 4,690 |
| | 289 |
| | 6 |
|
Total revenue, excluding special items (1) | | 4,691 |
| | 4,690 |
| | 1 |
| | — |
|
| Provision for credit losses | 319 |
| | 479 |
| | (160 | ) | | (33 | ) | 319 |
| | 479 |
| | (160 | ) | | (33 | ) |
| Noninterest expense | 3,392 |
| | 7,679 |
| | (4,287 | ) | | (56 | ) | 3,392 |
| | 7,679 |
| | (4,287 | ) | | (56 | ) |
Noninterest expense, excluding goodwill impairment (1) | 3,392 |
| | 3,244 |
| | 148 |
| | 5 |
| 3,392 |
| | 3,244 |
| | 148 |
| | 5 |
|
Noninterest expense, excluding goodwill impairment, restructuring charges and special items (1) | 3,223 |
| | 3,218 |
| | 5 |
| | — |
| 3,223 |
| | 3,218 |
| | 5 |
| | — |
|
| Income (loss) before income tax expense (benefit) | 1,268 |
| | (3,468 | ) | | 4,736 |
| | 137 |
| 1,268 |
| | (3,468 | ) | | 4,736 |
| | 137 |
|
| Income tax expense (benefit) | 403 |
| | (42 | ) | | 445 |
| | 1,060 |
| 403 |
| | (42 | ) | | 445 |
| | 1,060 |
|
| Net income (loss) | 865 |
| | (3,426 | ) | | 4,291 |
| | 125 |
| 865 |
| | (3,426 | ) | | 4,291 |
| | 125 |
|
Net income, excluding goodwill impairment (1) | 865 |
| | 654 |
| | 211 |
| | 32 |
| 865 |
| | 654 |
| | 211 |
| | 32 |
|
Net income, excluding goodwill impairment, restructuring charges and special items(1) | 790 |
| | 671 |
| | 119 |
| | 18 |
| 790 |
| | 671 |
| | 119 |
| | 18 |
|
Return on average tangible common equity (1) | 6.71 | % | | (25.91 | %) | | NM |
| | — |
| 6.71 | % | | (25.91 | %) | | NM |
| | — |
|
Return on average tangible common equity, excluding goodwill impairment (1) | 6.71 | % | | 4.95 | % | | 176 | bps | | — |
| 6.71 | % | | 4.95 | % | | 176 | bps | | — |
|
Return on average tangible common equity, excluding goodwill impairment, restructuring charges and special items (1) | 6.13 | % | | 5.08 | % | | 105 | bps | | — |
| 6.13 | % | | 5.08 | % | | 105 | bps | | — |
|
(1) These are non-GAAP financial measures. For more information on the computation of this non-GAAP financial measure, see “—Principal Components of Operations and Key Performance Metrics Used By Management — Key Performance Metrics and Non-GAAP Financial Measures.”
CITIZENS FINANCIAL GROUP, INC.
MANAGEMENT'SMANAGEMENT’S DISCUSSION AND ANALYSIS
Net Interest Income
The following table shows the major components of net interest income and net interest margin:
| | | | Year Ended December 31, | | Change | Year Ended December 31, | | Change |
| 2014 | | 2013 | | | | 2014 | | 2013 | | | |
| (dollars in millions) | Average Balances | | Income/ Expense | | Yields/ Rates | | Average Balances | | Income/ Expense | | Yields/ Rates | | Average Balances | | Yields/ Rates | Average Balances | | Income/ Expense | | Yields/ Rates | | Average Balances | | Income/ Expense | | Yields/ Rates | | Average Balances | | Yields/ Rates |
| Assets | | | | | | | | | | | | | | | | | | | | | | | | | | | | |
| Interest-bearing cash and due from banks and deposits in banks |
| $2,113 |
| |
| $5 |
| | 0.22 | % | |
| $2,278 |
| |
| $11 |
| | 0.46 | % | |
| ($165 | ) | | (24) bps |
| $2,113 |
| |
| $5 |
| | 0.22 | % | |
| $2,278 |
| |
| $11 |
| | 0.46 | % | |
| ($165 | ) | | (24) bps |
| Taxable investment securities | 24,319 |
| | 619 |
| | 2.55 |
| | 19,062 |
| | 477 |
| | 2.50 |
| | 5,257 |
| | 5 | 24,319 |
| | 619 |
| | 2.55 |
| | 19,062 |
| | 477 |
| | 2.50 |
| | 5,257 |
| | 5 |
| Non-taxable investment securities | 11 |
| | — |
| | 2.60 |
| | 12 |
| | — |
| | 2.66 |
| | (1 | ) | | (6) | 11 |
| | — |
| | 2.60 |
| | 12 |
| | — |
| | 2.66 |
| | (1 | ) | | (6) |
| Total investment securities | 24,330 |
| | 619 |
| | 2.55 |
| | 19,074 |
| | 477 |
| | 2.50 |
| | 5,256 |
| | 5 | 24,330 |
| | 619 |
| | 2.55 |
| | 19,074 |
| | 477 |
| | 2.50 |
| | 5,256 |
| | 5 |
| Commercial | 29,993 |
| | 900 |
| | 2.96 |
| | 28,654 |
| | 900 |
| | 3.10 |
| | 1,339 |
| | (14) | 29,993 |
| | 900 |
| | 2.96 |
| | 28,654 |
| | 900 |
| | 3.10 |
| | 1,339 |
| | (14) |
| Commercial real estate | 7,158 |
| | 183 |
| | 2.52 |
| | 6,568 |
| | 178 |
| | 2.67 |
| | 590 |
| | (15) | 7,158 |
| | 183 |
| | 2.52 |
| | 6,568 |
| | 178 |
| | 2.67 |
| | 590 |
| | (15) |
| Leases | 3,776 |
| | 103 |
| | 2.73 |
| | 3,463 |
| | 105 |
| | 3.05 |
| | 313 |
| | (32) | 3,776 |
| | 103 |
| | 2.73 |
| | 3,463 |
| | 105 |
| | 3.05 |
| | 313 |
| | (32) |
| Total commercial | 40,927 |
| | 1,186 |
| | 2.86 |
| | 38,685 |
| | 1,183 |
| | 3.02 |
| | 2,242 |
| | (16) | 40,927 |
| | 1,186 |
| | 2.86 |
| | 38,685 |
| | 1,183 |
| | 3.02 |
| | 2,242 |
| | (16) |
| Residential mortgages | 10,729 |
| | 425 |
| | 3.96 |
| | 9,104 |
| | 360 |
| | 3.96 |
| | 1,625 |
| | — | 10,729 |
| | 425 |
| | 3.96 |
| | 9,104 |
| | 360 |
| | 3.96 |
| | 1,625 |
| | — |
| Home equity loans | 3,877 |
| | 205 |
| | 5.29 |
| | 4,606 |
| | 246 |
| | 5.35 |
| | (729 | ) | | (6) | 3,877 |
| | 205 |
| | 5.29 |
| | 4,606 |
| | 246 |
| | 5.35 |
| | (729 | ) | | (6) |
| Home equity lines of credit | 15,552 |
| | 450 |
| | 2.89 |
| | 16,337 |
| | 463 |
| | 2.83 |
| | (785 | ) | | 6 | 15,552 |
| | 450 |
| | 2.89 |
| | 16,337 |
| | 463 |
| | 2.83 |
| | (785 | ) | | 6 |
Home equity loans serviced by others (1) | 1,352 |
| | 91 |
| | 6.75 |
| | 1,724 |
| | 115 |
| | 6.65 |
| | (372 | ) | | 10 | 1,352 |
| | 91 |
| | 6.75 |
| | 1,724 |
| | 115 |
| | 6.65 |
| | (372 | ) | | 10 |
Home equity lines of credit serviced by others (1) | 609 |
| | 16 |
| | 2.68 |
| | 768 |
| | 22 |
| | 2.88 |
| | (159 | ) | | (20) | 609 |
| | 16 |
| | 2.68 |
| | 768 |
| | 22 |
| | 2.88 |
| | (159 | ) | | (20) |
| Automobile | 11,011 |
| | 282 |
| | 2.57 |
| | 8,857 |
| | 235 |
| | 2.65 |
| | 2,154 |
| | (8) | 11,011 |
| | 282 |
| | 2.57 |
| | 8,857 |
| | 235 |
| | 2.65 |
| | 2,154 |
| | (8) |
| Student | 2,148 |
| | 102 |
| | 4.74 |
| | 2,202 |
| | 95 |
| | 4.30 |
| | (54 | ) | | 44 | 2,148 |
| | 102 |
| | 4.74 |
| | 2,202 |
| | 95 |
| | 4.30 |
| | (54 | ) | | 44 |
| Credit cards | 1,651 |
| | 167 |
| | 10.14 |
| | 1,669 |
| | 175 |
| | 10.46 |
| | (18 | ) | | (32) | 1,651 |
| | 167 |
| | 10.14 |
| | 1,669 |
| | 175 |
| | 10.46 |
| | (18 | ) | | (32) |
| Other retail | 1,186 |
| | 88 |
| | 7.43 |
| | 1,453 |
| | 107 |
| | 7.36 |
| | (267 | ) | | 7 | 1,186 |
| | 88 |
| | 7.43 |
| | 1,453 |
| | 107 |
| | 7.36 |
| | (267 | ) | | 7 |
| Total retail | 48,115 |
| | 1,826 |
| | 3.80 |
| | 46,720 |
| | 1,818 |
| | 3.89 |
| | 1,395 |
| | (9) | 48,115 |
| | 1,826 |
| | 3.80 |
| | 46,720 |
| | 1,818 |
| | 3.89 |
| | 1,395 |
| | (9) |
| Total loans and leases | 89,042 |
| | 3,012 |
| | 3.37 |
| | 85,405 |
| | 3,001 |
| | 3.50 |
| | 3,637 |
| | (13) | 89,042 |
| | 3,012 |
| | 3.37 |
| | 85,405 |
| | 3,001 |
| | 3.50 |
| | 3,637 |
| | (13) |
| Loans held for sale | 163 |
| | 5 |
| | 3.10 |
| | 392 |
| | 12 |
| | 3.07 |
| | (229 | ) | | 3 | |
| Loans held for sale, at fair value | | 163 |
| | 5 |
| | 3.10 |
| | 392 |
| | 12 |
| | 3.07 |
| | (229 | ) | | 3 |
| Other loans held for sale | 539 |
| | 23 |
| | 4.17 |
| | — |
| | — |
| | — |
| | 539 |
| | NM | 539 |
| | 23 |
| | 4.17 |
| | — |
| | — |
| | — |
| | 539 |
| | NM |
| Interest-earning assets | 116,187 |
| | 3,664 |
| | 3.14 |
| | 107,149 |
| | 3,501 |
| | 3.25 |
| | 9,038 |
| | (11) | 116,187 |
| | 3,664 |
| | 3.14 |
| | 107,149 |
| | 3,501 |
| | 3.25 |
| | 9,038 |
| | (11) |
| Allowance for loan and lease losses | (1,230 | ) | | | | | | (1,219 | ) | | | | | | (11 | ) | | (1,230 | ) | | | | | | (1,219 | ) | | | | | | (11 | ) | |
| Goodwill | 6,876 |
| | | | | | 9,063 |
| | | | | | (2,187 | ) | | 6,876 |
| | | | | | 9,063 |
| | | | | | (2,187 | ) | |
| Other noninterest-earning assets | 5,791 |
| | | | | | 5,873 |
| | | | | | (82 | ) | | | 5,791 |
| | | | | | 5,873 |
| | | | | | (82 | ) | | |
| Total noninterest-earning assets | 11,437 |
| | | | | | 13,717 |
| | | | | | (2,280 | ) | | 11,437 |
| | | | | | 13,717 |
| | | | | | (2,280 | ) | |
| Total assets |
| $127,624 |
| | | | | |
| $120,866 |
| | | | | |
| $6,758 |
| | |
| $127,624 |
| | | | | |
| $120,866 |
| | | | | |
| $6,758 |
| | |
| Liabilities and Stockholders' Equity | | | | | | | | | | | | | | | | | | | | | | | | | | | | |
| Checking with interest |
| $14,507 |
| |
| $12 |
| | 0.08 | % | |
| $14,096 |
| |
| $8 |
| | 0.06 | % | |
| $411 |
| | 2 bps |
| $14,507 |
| |
| $12 |
| | 0.08 | % | |
| $14,096 |
| |
| $8 |
| | 0.06 | % | |
| $411 |
| | 2 bps |
| Money market and savings | 39,579 |
| | 77 |
| | 0.19 |
| | 42,575 |
| | 105 |
| | 0.25 |
| | (2,996 | ) | | (6) | 39,579 |
| | 77 |
| | 0.19 |
| | 42,575 |
| | 105 |
| | 0.25 |
| | (2,996 | ) | | (6) |
| Term deposits | 10,317 |
| | 67 |
| | 0.65 |
| | 11,266 |
| | 103 |
| | 0.91 |
| | (949 | ) | | (26) | 10,317 |
| | 67 |
| | 0.65 |
| | 11,266 |
| | 103 |
| | 0.91 |
| | (949 | ) | | (26) |
| Total interest-bearing deposits | 64,403 |
| | 156 |
| | 0.24 |
| | 67,937 |
| | 216 |
| | 0.32 |
| | (3,534 | ) | | (8) | 64,403 |
| | 156 |
| | 0.24 |
| | 67,937 |
| | 216 |
| | 0.32 |
| | (3,534 | ) | | (8) |
| Interest-bearing deposits held for sale | 1,960 |
| | 4 |
| | 0.22 |
| | — |
| | — |
| | — |
| | 1,960 |
| | 22 | 1,960 |
| | 4 |
| | 0.22 |
| | — |
| | — |
| | — |
| | 1,960 |
| | 22 |
Federal funds purchased and securities sold under agreements to repurchase (2) | 5,699 |
| | 32 |
| | 0.55 |
| | 2,400 |
| | 192 |
| | 7.89 |
| | 3,299 |
| | NM | 5,699 |
| | 32 |
| | 0.55 |
| | 2,400 |
| | 192 |
| | 7.89 |
| | 3,299 |
| | NM |
| Other short-term borrowed funds | 5,640 |
| | 89 |
| | 1.56 |
| | 251 |
| | 4 |
| | 1.64 |
| | 5,389 |
| | (8) | 5,640 |
| | 89 |
| | 1.56 |
| | 251 |
| | 4 |
| | 1.64 |
| | 5,389 |
| | (8) |
| Long-term borrowed funds | 1,907 |
| | 82 |
| | 4.25 |
| | 778 |
| | 31 |
| | 3.93 |
| | 1,129 |
| | 32 | 1,907 |
| | 82 |
| | 4.25 |
| | 778 |
| | 31 |
| | 3.93 |
| | 1,129 |
| | 32 |
| Total borrowed funds | 13,246 |
| | 203 |
| | 1.51 |
| | 3,429 |
| | 227 |
| | 6.53 |
| | 9,817 |
| | NM | 13,246 |
| | 203 |
| | 1.51 |
| | 3,429 |
| | 227 |
| | 6.53 |
| | 9,817 |
| | NM |
| Total interest-bearing liabilities | 79,609 |
| | 363 |
| | 0.45 |
| | 71,366 |
| | 443 |
| | 0.61 |
| | 8,243 |
| | (16) | 79,609 |
| | 363 |
| | 0.45 |
| | 71,366 |
| | 443 |
| | 0.61 |
| | 8,243 |
| | (16) |
| Demand deposits | 25,739 |
| | | | | | 25,399 |
| | | | | | 340 |
| | 25,739 |
| | | | | | 25,399 |
| | | | | | 340 |
| |
| Demand deposits held for sale | 462 |
| | | | | | — |
| | | | | | 462 |
| | 462 |
| | | | | | — |
| | | | | | 462 |
| |
| Other liabilities | 2,415 |
| | | | | | 2,267 |
| | | | | | 148 |
| | | 2,415 |
| | | | | | 2,267 |
| | | | | | 148 |
| | |
| Total liabilities | 108,225 |
| | | | | | 99,032 |
| | | | | | 9,193 |
| | 108,225 |
| | | | | | 99,032 |
| | | | | | 9,193 |
| |
| Stockholders' equity | 19,399 |
| | | | | | 21,834 |
| | | | | | (2,435 | ) | | 19,399 |
| | | | | | 21,834 |
| | | | | | (2,435 | ) | |
| Total liabilities and stockholders' equity |
| $127,624 |
| | | | | |
| $120,866 |
| | | | | |
| $6,758 |
| | |
| $127,624 |
| | | | | |
| $120,866 |
| | | | | |
| $6,758 |
| | |
| Interest rate spread | | | | | 2.69 |
| | | | | | 2.64 |
| | | | 5 | | | | | 2.69 |
| | | | | | 2.64 |
| | | | 5 |
| Net interest income | | |
| $3,301 |
| | | | | |
| $3,058 |
| | | | | | | |
| $3,301 |
| | | | | |
| $3,058 |
| | | | | |
| Net interest margin | | | | | 2.83 | % | | | | | | 2.85 | % | | | | (2) bps | | | | | 2.83 | % | | | | | | 2.85 | % | | | | (2) bps |
| Memo: Total deposits (interest-bearing and demand) |
| $92,564 |
| |
| $160 |
| | 0.17 | % | |
| $93,336 |
| |
| $216 |
| | 0.23 | % | |
| ($772 | ) | | (6) bps |
| $92,564 |
| |
| $160 |
| | 0.17 | % | |
| $93,336 |
| |
| $216 |
| | 0.23 | % | |
| ($772 | ) | | (6) bps |
(1) Our Serviced by Others (“SBO”)SBO portfolio consists of home equity loans and lines that were originally serviced by others. We now service a portion of this portfolio internally.
(2) Balances are net of certain short-term receivables associated with reverse repurchase agreements. Interest expense includes the full cost of the repurchase agreements and certain hedging costs. The rate on federal funds purchased is elevated due to the impact from pay-fixed interest rate swaps that are scheduled to runoffrun off by the end of 2015. See “—Analysis of Financial Condition — December 31, 20142015 Compared with December 31, 20132014 — Derivatives” for further information.
CITIZENS FINANCIAL GROUP, INC.
MANAGEMENT'SMANAGEMENT’S DISCUSSION AND ANALYSIS
Net interest income of $3.3 billion in 2014 increased $243 million, or 8%, from $3.1 billion in 2013 driven by growth in average interest-earning assets, a reduction in interest rate hedging costs, as well as lower deposit costs. These benefits were partially offset by the effect of declining loan yields and a continued shift in loan mix to lower yielding loans, increased borrowing costs related to our issuance of subordinated debt and the effect of the Chicago Divestiture. Average interest-earning assets of $116.2$116.2 billion in 2014 increased $9.0 billion from 2013 driven by a $5.3$5.3 billion increase in the investment securities portfolio, a $2.2$2.2 billion increase in commercial loans, a $1.6$1.6 billion increase in residential mortgages, and a $2.2$2.2 billion increase in automobile loans, partially offset by a $2.0$2.0 billion decrease in home equity outstandings, a $54 million reduction in student loans, and a $267 million decrease in other retail loans.
2014 net interest margin of 2.83% remained broadly stable compared to 2.85% in 2013 despite continued pressure from the relatively persistent low interest-rate environment. Average interest-earning asset yields continued to decline at a pace that exceeded our ability to reduce our cost of interest-bearing deposits. 2014 average interest-earning asset yields of 3.14% declined 11 basis points from 3.25% in 2013, largely reflecting a 13 basis point decline in the loan and lease portfolio yield despite a five basis point improvement in the securities portfolio yield. The decline in loan and lease yields was driven by the effect of a reduction in higher-yielding consumer real estate secured outstandings. In addition, intense industry-wide competition for commercial loans continued to compress spreads on new originations and resulted in additional downward pressure on overall loan yields. Investment portfolio income of $619$619 million for the year ended December 31, 2014 increased $142$142 million,, or 30%, compared to the year ended December 31, 2013.
Total interest-bearing deposit costs of $156 million in 2014 decreased $60 million, or 28%, from $216 million in 2013 and reflected an eight basis point decrease in the rate paid on deposits to 0.24% from 0.32%. The cost of term deposits decreased to 0.65% in 2014 from 0.91% in 2013, while rates on money market and savings declined to 0.19% in 2014 from 0.25% in 2013. Due to the historically low interest rate environment, many deposit products have hit pricing floors at or near zero, limiting further rate reduction and thus compressing margins.
The total borrowed funds costs of $203 million in 2014 declined $24 million, or 11%, from $227 million in 2013 driven by the benefit of a $101 million reduction in pay-fixed swap costs which was partially offset by an increase in long-term borrowed funds costs largely related to our issuance of subordinated debt.
Total borrowed funds rates declined to 1.51% in 2014 from 6.53% in 2013. Within the federal funds purchased and securities sold under agreement category and other short-term borrowed funds categories, pay-fixed swap expense declined to $99 million in 2014 from $200 million in 2013. Excluding the impact of hedging costs, 2014 borrowed funds costs were 0.78% compared to 1.16% in 2013.
Noninterest Income
The following table details the significant components of our noninterest income for the periods indicated:income:
|
| | | | | | | | | | | | | | |
| | Year Ended December 31, | | | | |
| (dollars in millions) | 2014 |
| | 2013 |
| | Change |
| | Percent |
| Service charges and fees |
| $574 |
| |
| $640 |
| |
| ($66 | ) | | (10 | %) |
| Card fees | 233 |
| | 234 |
| | (1 | ) | | — |
|
| Mortgage banking fees | 71 |
| | 153 |
| | (82 | ) | | (54 | ) |
| Trust and investment services fees | 158 |
| | 149 |
| | 9 |
| | 6 |
|
| Foreign exchange and trade finance fees | 95 |
| | 97 |
| | (2 | ) | | (2 | ) |
| Capital markets fees | 91 |
| | 53 |
| | 38 |
| | 72 |
|
| Bank-owned life insurance income | 49 |
| | 50 |
| | (1 | ) | | (2 | ) |
| Securities gains, net | 28 |
| | 144 |
| | (116 | ) | | (81 | ) |
Other income (1) | 379 |
| | 112 |
| | 267 |
| | 238 |
|
| Noninterest income |
| $1,678 |
| |
| $1,632 |
| |
| $46 |
| | 3 | % |
(1) Includes net securities impairment losses on securities available for sale recognized in earnings and other income. Additionally, noninterest income for the year ended December 31, 2014 reflects a $288 million pre-tax gain related to the Chicago Divestiture.
CITIZENS FINANCIAL GROUP, INC.
MANAGEMENT'S DISCUSSION AND ANALYSIS
Noninterest income of $1.7 billion in 2014 increased $46 million, or 3%, from $1.6 billion in 2013, driven by a $288 million pre-tax gain on the Chicago Divestiture, which was recorded in other income, and a $38 million increase in capital markets fees, partially offset by a $116 million decrease in net securities gains, an $82 million decrease in mortgage banking fees, and a $66 million decrease in service charges and fees. Mortgage banking fees reflected overall lower origination volume, the decision to hold more loans on-balance sheet, and were also negatively impacted by a reduction in the recovery of mortgage servicing rights
CITIZENS FINANCIAL GROUP, INC.
MANAGEMENT’S DISCUSSION AND ANALYSIS
valuations from the prior year. The decrease in service charges and fees are driven by lower personal overdraft fees resulting from a November 2013 change to our check-posting methodology.
Provision for Credit Losses
Provision for credit losses of $319$319 million in 2014 decreased $160 million from $479$479 million in 2013, driven by a $178 million reduction in net charge-offs. Additionally, while overall credit quality continued to improve in 2014, the rate of improvement slowed relative to 2013. As a result, 2014 provision for credit losses included a release of $4 million from the allowance for credit losses (the amount by which net charge-offs exceeded the provision) compared with a release of $22 million in 2013. The provision for loan and lease losses is the result of a detailed analysis performed to estimate an appropriate and adequate allowance for loan and lease losses (“ALLL”).ALLL. The total provision for credit losses included the provision for loan and lease losses as well as the provision for unfunded commitments. Refer to “—Analysis of Financial Condition — Allowance for Credit Losses and Nonperforming Assets” for more information.
Noninterest Expense
The following table displays the significant components of our noninterest expense for the periods indicated:expense:
|
| | | | | | | | | | | | | | |
| | Year Ended December 31, | | | | |
| (dollars in millions) | 2014 |
| | 2013 |
| | Change |
| | Percent |
|
| Salaries and employee benefits |
| $1,678 |
| |
| $1,652 |
| |
| $26 |
| | 2 | % |
| Outside services | 420 |
| | 360 |
| | 60 |
| | 17 |
|
| Occupancy | 326 |
| | 327 |
| | (1 | ) | | — |
|
| Equipment expense | 250 |
| | 275 |
| | (25 | ) | | (9 | ) |
| Amortization of software | 145 |
| | 102 |
| | 43 |
| | 42 |
|
| Goodwill impairment | — |
| | 4,435 |
| | (4,435 | ) | | (100 | ) |
| Other operating expense | 573 |
| | 528 |
| | 45 |
| | 9 |
|
| Noninterest expense |
| $3,392 |
| |
| $7,679 |
| |
| ($4,287 | ) | | (56 | %) |
Noninterest expense of $3.4 billion in 2014 decreased $4.3 billion from 2013, which included a $4.4 billion pre-tax goodwill impairment charge. Our 2014 noninterest expense included $169 million of pre-tax restructuring charges and special items largely related to our separation from RBS Group as well as ongoing efforts to improve processes and enhance efficiencies across the organization compared with $26 million of restructuring charges and special items in 2013. The 2014 charge included $78 million in outside services, $44 million in salaries and employee benefits, $16 million in occupancy, $6 million in software, $4 million in equipment and $21 million in other operating expense. Excluding the restructuring charges and special items and the goodwill impairment, noninterest expense remained relatively stable, as the benefit of our efficiency initiatives helped offset investment in the business to drive future earnings growth as well as higher regulatory costs. See Note 2122 “Exit Costs and Restructuring Reserves” to our audited Consolidated Financial Statements in Part II, Item 8 — Financial Statements and Supplementary Data, included elsewhere in this report.
Provision (Benefit) for Income Taxes
In 2014, we recorded income tax expense of $403$403 million,, compared to an income tax benefit of $42$42 million in 2013. The effective tax rates for the years ended December 31, 2014 and 2013 were 31.8% and 1.2%, respectively. The increase in the effective rate largely reflected the tax rate impact of the goodwill impairment charge taken in 2013. Goodwill not deductible for tax purposes accounted for 78.4% of the total goodwill impairment charge and generated a reduction of 35.1% in our effective tax rate for the year ended December 31, 2013.
Additionally, the effective income tax rate will be affected in future periods by the impact of the adoption of Accounting Standard Update No. 2014-01, “Accounting for Investments in Qualified Affordable Housing Projects.” We expect this change in accounting method to increase the 2015 effective income tax rate by approximately 2.4 percentage points; however this is not
CITIZENS FINANCIAL GROUP, INC.
MANAGEMENT'S DISCUSSION AND ANALYSIS
expected to have a material impact on our Consolidated Financial Statements. For further information, see Recent Accounting Pronouncements in Note 1 “Significant Accounting Policies” to our audited Consolidated Financial Statements in Part II, Item 8 — Financial Statements and Supplementary Data, included elsewhere in this report.
At December 31, 2014, we reported a net deferred tax liability of $493 million, compared to a $199 million liability at December 31, 2013. The increase in the net deferred tax liability was attributable to the utilization of net operating loss and tax credit carryforwards of $76 million (which decreased the deferred tax asset), a decrease in the tax effect on Other Comprehensive Income (“OCI”)OCI of $153 million (which also decreased the deferred tax asset) and an increase in the deferred tax liability related to temporary differences of $65 million. For further discussion, see Note 1415 “Income Taxes” to our audited Consolidated Financial Statements in Part II, Item 8 — Financial Statements and Supplementary Data, included elsewhere in this report.
CITIZENS FINANCIAL GROUP, INC.
MANAGEMENT’S DISCUSSION AND ANALYSIS
Business Segments
The following tables present certain financial data of our business segments:
|
| | | | | | | | | | | | | | | |
| | As of and for the Year Ended December 31, 2014 |
| (dollars in millions) | Consumer Banking | | Commercial Banking | | Other |
| (4) | Consolidated |
| Net interest income |
| $2,151 |
| |
| $1,073 |
| |
| $77 |
| |
| $3,301 |
|
| Noninterest income | 899 |
| | 429 |
| | 350 |
| | 1,678 |
|
| Total revenue | 3,050 |
| | 1,502 |
| | 427 |
| | 4,979 |
|
| Noninterest expense | 2,513 |
| | 652 |
| | 227 |
| | 3,392 |
|
| Profit before provision for credit losses | 537 |
| | 850 |
| | 200 |
| | 1,587 |
|
| Provision for credit losses | 259 |
| | (6 | ) | | 66 |
| | 319 |
|
| Income before income tax expense | 278 |
| | 856 |
| | 134 |
| | 1,268 |
|
| Income tax expense | 96 |
| | 295 |
| | 12 |
| | 403 |
|
| Net income |
| $182 |
| |
| $561 |
| |
| $122 |
| |
| $865 |
|
Loans and leases and loans held for sale (year-end) (1) |
| $49,919 |
| |
| $39,861 |
| |
| $3,911 |
| |
| $93,691 |
|
| Average Balances: | | | | | | | |
| Total assets |
| $48,939 |
| |
| $38,483 |
| |
| $40,202 |
| |
| $127,624 |
|
Loans and leases and loans held for sale (1) | 47,745 |
| | 37,683 |
| | 4,316 |
| | 89,744 |
|
| Deposits and deposits held for sale | 68,214 |
| | 19,838 |
| | 4,513 |
| | 92,565 |
|
| Interest-earning assets | 47,777 |
| | 37,809 |
| | 30,601 |
| | 116,187 |
|
| Key Metrics | | | | | | | |
| Net interest margin | 4.50 | % | | 2.84 | % | | NM |
| | 2.83 | % |
Efficiency ratio (2) | 82.39 |
| | 43.37 |
| | NM |
| | 68.12 |
|
| Average loans to average deposits ratio | 69.99 |
| | 189.96 |
| | NM |
| | 96.95 |
|
Return on average total tangible assets (2) | 0.37 |
| | 1.46 |
| | NM |
| | 0.71 |
|
Return on average tangible common equity (2) (3) | 3.90 |
| | 13.43 |
| | NM |
| | 6.71 |
|
(1) Loans held for sale refer to mortgage loans held for sale recorded in the Consumer Banking segment, as well as the loans relating to the Chicago Divestiture, which were recorded in both the Consumer Banking and Commercial Banking segments.
(2) These are non-GAAP financial measures. For more information on the computation of these non-GAAP financial measures, see “—Principal Components of Operations and Key Performance Metrics Used By Management — Key Performance Metrics and Non-GAAP Financial Measures.”
(3) Operating segments are allocated capital on a risk-adjusted basis considering economic and regulatory capital requirements. We approximate that regulatory capital is equivalent to a sustainable target level for CET1 and then allocate that approximation to the segments based on economic capital.
(4) Includes the financial impact of non-core, liquidating loan portfolios and other non-core assets, our treasury activities, wholesale funding activities, securities portfolio, community development assets and other unallocated assets, liabilities, revenues, provision for credit losses and expenses not attributed to our Consumer Banking or Commercial Banking segments. For a description of non-core assets, see “—Analysis of Financial Condition — December 31, 20142015 Compared with December 31, 20132014 — Loans and Leases-Non-Core Assets.”
We operate our business through two operating segments: Consumer Banking and Commercial Banking. Segment results are derived from our business line profitability reporting systems by specifically attributing managed assets, liabilities, capital and
CITIZENS FINANCIAL GROUP, INC.
MANAGEMENT'S DISCUSSION AND ANALYSIS
their related revenues, provision for credit losses and expenses. Residual assets, liabilities, capital and their related revenues, provision for credit losses and expenses are attributed to Other.
Other includes our treasury function, securities portfolio, wholesale funding activities, goodwill and goodwill impairment, community development assets and other unallocated assets, liabilities, capital, revenues, provision for credit losses and expenses not attributed to Consumer Banking or Commercial Banking. Other also includes our non-core assets. Non-core assets are primarily loans inconsistent with our strategic goals, generally as a result of geographic location, industry, product type or risk level. The non-core portfolio totaled $3.1 billion as of December 31, 2014, down 19% from December 31, 2013. The largest component of our non-core portfolio is our home equity products currently or formerly serviced by others portfolio.
Our capital levels are evaluated and managed centrally; however, capital is allocated to the operating segments to support evaluation of business performance. Operating segments are allocated capital on a risk-adjusted basis considering economic and regulatory capital requirements. We approximate that regulatory capital is equivalent to a sustainable target level for common equity Tier 1 and then allocate that approximation to the segments based on economic capital. Interest income and expense is determined based on the assets and liabilities managed by the business segment. Because funding and asset liability management is a central function, funds transfer-pricing methodologies are utilized to allocate a cost of funds used, or credit for the funds provided, to all business segment assets, liabilities and capital, respectively, using a matched funding concept. The residual effect on net interest income of asset/liability management, including the residual net interest income related to the funds transfer pricing process, is included in Other.
CITIZENS FINANCIAL GROUP, INC.
MANAGEMENT’S DISCUSSION AND ANALYSIS
Provision for credit losses is allocated to each business segment based on actual net charge-offs that have been recognized by the business segment. The difference between the consolidated provision for credit losses and the business segments’ net charge-offs is reflected in Other.
Noninterest income and expense directly managed by each business segment, including fees, service charges, salaries and benefits, and other direct revenues and costs are accounted for within each segment’s financial results in a manner similar to our audited Consolidated Financial Statements. Occupancy costs are allocated based on utilization of facilities by the business segment. Generally, operating losses are charged to the business segment when the loss event is realized in a manner similar to a loan charge-off. Noninterest expenses incurred by centrally managed operations or business segments that directly support another business segment’s operations are charged to the applicable business segment based on its utilization of those services.
Income taxes are assessed to each business segment at a standard tax rate with the residual tax expense or benefit to arrive at the consolidated effective tax rate included in Other.
Developing and applying methodologies used to allocate items among the business segments is a dynamic process. Accordingly, financial results may be revised periodically as management systems are enhanced, methods of evaluating performance or product lines change, or our organizational structure changes.
CITIZENS FINANCIAL GROUP, INC.
MANAGEMENT'S DISCUSSION AND ANALYSIS
Consumer Banking
|
| | | | | | | | | | | | | | |
| | As of and for the Year Ended December 31, | | | | |
| (dollars in millions) | 2014 | | 2013 | | Change | | Percent |
| Net interest income |
| $2,151 |
| |
| $2,176 |
| |
| ($25 | ) | | (1 | %) |
| Noninterest income | 899 |
| | 1,025 |
| | (126 | ) | | (12 | ) |
| Total revenue | 3,050 |
| | 3,201 |
| | (151 | ) | | (5 | ) |
| Noninterest expense | 2,513 |
| | 2,522 |
| | (9 | ) | | — |
|
| Profit before provision for credit losses | 537 |
| | 679 |
| | (142 | ) | | (21 | ) |
| Provision for credit losses | 259 |
| | 308 |
| | (49 | ) | | (16 | ) |
| Income before income tax expense | 278 |
| | 371 |
| | (93 | ) | | (25 | ) |
| Income tax expense | 96 |
| | 129 |
| | (33 | ) | | (26 | ) |
| Net income |
| $182 |
| |
| $242 |
| |
| ($60 | ) | | (25 | ) |
Loans and leases and loans held for sale (year-end) (1) |
| $49,919 |
| |
| $45,019 |
| |
| $4,900 |
| | 11 |
|
| Average Balances: | | | | | | | |
| Total assets |
| $48,939 |
| |
| $46,465 |
| |
| $2,474 |
| | 5 |
|
Loans and leases and loans held for sale (1) | 47,745 |
| | 45,106 |
| | 2,639 |
| | 6 |
|
| Deposits and deposits held for sale | 68,214 |
| | 72,158 |
| | (3,944 | ) | | (5 | ) |
| Interest-earning assets | 47,777 |
| | 45,135 |
| | 2,642 |
| | 6 | % |
| Key Metrics | | | | | | | |
| Net interest margin | 4.50 | % | | 4.82 | % | | (32) bps |
| | — |
|
Efficiency ratio (2) | 82.39 |
| | 78.76 |
| | 363 bps |
| | — |
|
| Average loans to average deposits ratio | 69.99 |
| | 62.51 |
| | 748 bps |
| | — |
|
Return on average total tangible assets (2) | 0.37 |
| | 0.52 |
| | (15) bps |
| | — |
|
Return on average tangible common equity (2) (3) | 3.90 |
| | 5.48 |
| | (158) bps |
| | — |
|
(1) Loans held for sale include mortgage loans held for sale and loans relating to the Chicago Divestiture.
(2) These are non-GAAP financial measures. For more information on the computation of these non-GAAP financial measures, see “—Principal Components of Operations and Key Performance Metrics Used By Management — Key Performance Metrics and Non-GAAP Financial Measures.”
(3) Operating segments are allocated capital on a risk-adjusted basis considering economic and regulatory capital requirements. We approximate that regulatory capital is equivalent to a sustainable target level for CET1 and then allocate that approximation to the segments based on economic capital.
Consumer Banking segment net income of $182 million in 2014 decreased $60 million, or 25%, from $242 million in 2013, as the benefit of a reduction in provision for credit losses was more than offset by lower revenue, driven by overall mortgage banking headwinds, and lower service charges and fee income.
Total revenue was $3.1 billion in 2014, down $151 million, or 5%, from $3.2 billion in 2013. Net interest income of $2.2 billion in 2014 remained broadly stable with the prior year, as the benefit of lower deposit costs and loan growth was more than offset by the effect of the relatively persistent low-rate environment and the Chicago Divestiture. Loan growth reflected higher residential mortgage and auto loan outstandings, partially offset by lower home equity outstandings. Noninterest income of $899 million decreased $126 million, or 12%, from $1.0 billion in 2013, driven by lower mortgage banking fees, service charges and fees, and the impact of the Chicago Divestiture, partially offset by growth in trust and investment services fees and a gain on sale of discontinued student loan portfolio.
CITIZENS FINANCIAL GROUP, INC.
MANAGEMENT’S DISCUSSION AND ANALYSIS
Mortgage banking fees of $71 million in 2014 decreased $82 million, driven by overall lower origination volume and the decision to hold more loans on-balance sheet. Mortgage banking fees were also negatively impacted by a reduction in the recovery of mortgage servicing rights valuations from the prior year. Service charges and fees of $416 million decreased $58 million, or 12%, from 2013, driven by the impact of a change in check-posting order as well as the Chicago Divestiture. Results also reflected the benefit of growth in trust and investment services fees as well as a $9 million gain on sale of student loans.
Noninterest expense of $2.5 billion in 2014 remained relatively stable with the prior year as the benefit of our efficiency initiatives and the impact of the Chicago Divestiture were offset by continued investment in the business to drive future growth.
Provision for credit losses of $259 million in 2014 decreased $49 million, or 16%, from $308 million in 2013, reflecting improved credit quality.
CITIZENS FINANCIAL GROUP, INC.
MANAGEMENT'S DISCUSSION AND ANALYSIS
Commercial Banking
| | | | As of and for the Year Ended December 31, | | | | | As of and for the Year Ended December 31, | | | | |
| (dollars in millions) | 2014 | | 2013 | | Change | | Percent | 2014 | | 2013 | | Change | | Percent |
| Net interest income |
| $1,073 |
| |
| $1,031 |
| |
| $42 |
| | 4 | % |
| $1,073 |
| |
| $1,031 |
| |
| $42 |
| | 4 | % |
| Noninterest income | 429 |
| | 389 |
| | 40 |
| | 10 |
| 429 |
| | 389 |
| | 40 |
| | 10 |
|
| Total revenue | 1,502 |
| | 1,420 |
| | 82 |
| | 6 |
| 1,502 |
| | 1,420 |
| | 82 |
| | 6 |
|
| Noninterest expense | 652 |
| | 635 |
| | 17 |
| | 3 |
| 652 |
| | 635 |
| | 17 |
| | 3 |
|
| Profit before provision for credit losses | 850 |
| | 785 |
| | 65 |
| | 8 |
| 850 |
| | 785 |
| | 65 |
| | 8 |
|
| Provision for credit losses | (6 | ) | | (7 | ) | | 1 |
| | 14 |
| (6 | ) | | (7 | ) | | 1 |
| | 14 |
|
| Income before income tax expense | 856 |
| | 792 |
| | 64 |
| | 8 |
| 856 |
| | 792 |
| | 64 |
| | 8 |
|
| Income tax expense | 295 |
| | 278 |
| | 17 |
| | 6 |
| 295 |
| | 278 |
| | 17 |
| | 6 |
|
| Net income |
| $561 |
| |
| $514 |
| |
| $47 |
| | 9 |
|
| $561 |
| |
| $514 |
| |
| $47 |
| | 9 |
|
Loans and leases and loans held for sale (year-end) (1) |
| $39,861 |
| |
| $36,155 |
| |
| $3,706 |
| | 10 |
|
| $39,861 |
| |
| $36,155 |
| |
| $3,706 |
| | 10 |
|
| Average Balances: | | | | | | | | | | | | | | |
| Total assets |
| $38,483 |
| |
| $35,229 |
| |
| $3,254 |
| | 9 |
|
| $38,483 |
| |
| $35,229 |
| |
| $3,254 |
| | 9 |
|
Loans and leases and loans held for sale (1) | 37,683 |
| | 34,647 |
| | 3,036 |
| | 9 |
| 37,683 |
| | 34,647 |
| | 3,036 |
| | 9 |
|
| Deposits and deposits held for sale | 19,838 |
| | 17,516 |
| | 2,322 |
| | 13 |
| 19,838 |
| | 17,516 |
| | 2,322 |
| | 13 |
|
| Interest-earning assets | 37,809 |
| | 34,771 |
| | 3,038 |
| | 9 | % | 37,809 |
| | 34,771 |
| | 3,038 |
| | 9 | % |
| Key Metrics | | | | | | | | | | | | | | |
| Net interest margin | 2.84 | % | | 2.97 | % | | (13) bps |
| | — |
| 2.84 | % | | 2.97 | % | | (13) bps |
| | — |
|
Efficiency ratio (2) | 43.37 |
| | 44.66 |
| | (129) bps |
| | — |
| 43.37 |
| | 44.66 |
| | (129) bps |
| | — |
|
| Average loans to average deposits ratio | 189.96 |
| | 197.80 |
| | (784) bps |
| | — |
| 189.96 |
| | 197.80 |
| | (784) bps |
| | — |
|
Return on average total tangible assets (2) | 1.46 |
| | 1.46 |
| | — |
| | — |
| 1.46 |
| | 1.46 |
| | — bps |
| | — |
|
Return on average tangible common equity (2) (3) | 13.43 |
| | 13.20 |
| | 23 bps |
| | — |
| 13.43 |
| | 13.20 |
| | 23 bps |
| | — |
|
(1) Loans held for sale include loans relating to the Chicago Divestiture.
(2) These are non-GAAP financial measures. For more information on the computation of these non-GAAP financial measures, see “—Principal Components of Operations and Key Performance Metrics Used By Management — Key Performance Metrics and Non-GAAP Financial Measures.”
(3) Operating segments are allocated capital on a risk-adjusted basis considering economic and regulatory capital requirements. We approximate that regulatory capital is equivalent to a sustainable target level for CET1 and then allocate that approximation to the segments based on economic capital.
Commercial Banking net income of $561 million in 2014 increased $47 million, or 9%, from $514 million in 2013, driven by an $82 million increase in total revenue, partially offset by higher expenses and slightly lower credit net recoveries.
Net interest income of $1.1 billion in 2014 increased $42 million, or 4%, from $1.0 billion in 2013, largely due to a $3.0 billion increase in interest-earning assets and a $2.3 billion increase in customer deposits which was partially offset by continued downward pressure on loan yields given the relatively persistent low-rate environment and increased industry-wide competition.
Noninterest income of $429 million in 2014 increased $40 million, or 10%, from $389 million in 2013, as a $51 million increase in leasing income and capital markets fees was partially offset by lower interest rate product, foreign exchange and trade finance fees.
Noninterest expense of $652 million in 2014 increased $17 million from $635 million in 2013.
Provision for credit losses in 2014 reflected a net recovery on prior period charge-offs of $6 million compared with a net recovery of $7 million in 2013.
CITIZENS FINANCIAL GROUP, INC.
MANAGEMENT'SMANAGEMENT’S DISCUSSION AND ANALYSIS
Other
| | | | As of and for the Year Ended December 31, | | | | | As of and for the Year Ended December 31, | | | | |
| (dollars in millions) | 2014 |
| | 2013 |
| | Change |
| | Percent | 2014 |
| | 2013 |
| | Change |
| | Percent |
| Net interest income (expense) |
| $77 |
| |
| ($149 | ) | |
| $226 |
| | 152 | % |
| $77 |
| |
| ($149 | ) | |
| $226 |
| | 152 | % |
| Noninterest income | 350 |
| | 218 |
| | 132 |
| | 61 |
| 350 |
| | 218 |
| | 132 |
| | 61 |
|
| Total revenue | 427 |
| | 69 |
| | 358 |
| | 519 |
| 427 |
| | 69 |
| | 358 |
| | 519 |
|
| Noninterest expense | 227 |
| | 4,522 |
| | (4,295 | ) | | (95 | ) | 227 |
| | 4,522 |
| | (4,295 | ) | | (95 | ) |
| Profit (loss) before provision for credit losses | 200 |
| | (4,453 | ) | | 4,653 |
| | 104 |
| 200 |
| | (4,453 | ) | | 4,653 |
| | 104 |
|
| Provision for credit losses | 66 |
| | 178 |
| | (112 | ) | | (63 | ) | 66 |
| | 178 |
| | (112 | ) | | (63 | ) |
| Income (loss) before income tax expense (benefit) | 134 |
| | (4,631 | ) | | 4,765 |
| | 103 |
| 134 |
| | (4,631 | ) | | 4,765 |
| | 103 |
|
| Income tax expense (benefit) | 12 |
| | (449 | ) | | 461 |
| | 103 |
| 12 |
| | (449 | ) | | 461 |
| | 103 |
|
| Net income (loss) |
| $122 |
| |
| ($4,182 | ) | |
| $4,304 |
| | 103 |
|
| $122 |
| |
| ($4,182 | ) | |
| $4,304 |
| | 103 |
|
| Loans and leases and loans held for sale (year-end) |
| $3,911 |
| |
| $5,939 |
| |
| ($2,028 | ) | | (34 | ) |
| $3,911 |
| |
| $5,939 |
| |
| ($2,028 | ) | | (34 | ) |
| Average Balances: | | | | | | | | | | | | | | |
| Total assets |
| $40,202 |
| |
| $39,172 |
| |
| $1,030 |
| | 3 |
|
| $40,202 |
| |
| $39,172 |
| |
| $1,030 |
| | 3 |
|
| Loans and leases and loans held for sale | 4,316 |
| | 6,044 |
| | (1,728 | ) | | (29 | ) | 4,316 |
| | 6,044 |
| | (1,728 | ) | | (29 | ) |
| Deposits and deposits held for sale | 4,513 |
| | 3,662 |
| | 851 |
| | 23 |
| 4,512 |
| | 3,662 |
| | 851 |
| | 23 |
|
| Interest-earning assets | 30,601 |
| | 27,243 |
| | 3,358 |
| | 12 | % | 30,601 |
| | 27,243 |
| | 3,358 |
| | 12 | % |
Other recorded net income of $122 million in 2014 compared with a net loss of $4.2 billion in 2013, which included an after-tax goodwill impairment charge of $4.1 billion. Excluding the goodwill impairment, the net loss in 2013 was $102 million. Net income in 2014 included a $180 million after-tax gain related to the Chicago Divestiture, partially offset by $105 million of after-tax restructuring charges and special items. Net loss in 2013 also included $17 million of after-tax restructuring charges and special items. Excluding these items, net income increased $132 million driven by higher net interest income as well as lower provision for credit losses, partially offset by lower noninterest income.
Net interest income in 2014 increased $226 million to $77 million compared to an expense of $149 million in 2013. The increase was driven by the benefit of a $5.1 billion increase in average investment securities, a reduction in interest rate swap costs, and an increase in residual net interest income related to funds transfer pricing, partially offset by higher wholesale funding costs, and a $1.3 billion decrease in average non-core loan balances.
Noninterest income in 2014 increased $132 million driven by the $288 million pre-tax gain on the Chicago Divestiture. Excluding the gain, noninterest income decreased $156 million driven by a $116 million reduction in securities gains and higher net losses on low-income housing investments, which are more than offset by increased tax credits.
Noninterest expense in 2014 of $227 million included $169 million of pre-tax restructuring charges and special items and decreased $4.3 billion from 2013, which included the $4.4 billion pre-tax goodwill impairment charge, and $26 million of pre-tax restructuring charges and special items. Excluding the goodwill impairment, restructuring charges and special items, noninterest expense decreased $3 million largely reflecting lower costs related to the non-core loan portfolio, largely offset by higher employee incentive costs. For further information about these special items, including expected additional future costs, see Note 2122 “Exit Costs and Restructuring Reserves” to our audited Consolidated Financial Statements in Part II, Item 8 — Financial Statements and Supplementary Data, included elsewhere in this report.
The provision for credit losses within Other mainly represents the residual change in the consolidated allowance for credit losses after attributing the respective net charge-offs to the Consumer Banking and Commercial Banking segments. It also includes net charge-offs related to the non-core portfolio. The provision for credit losses in 2014 decreased $112 million to $66 million compared to $178 million in 2013, reflecting continued improvement in credit quality and decreased non-core net charge-offs of $128 million. On a quarterly basis, we review and refine our estimate of the allowance for credit losses, taking into consideration changes in portfolio size and composition, historical loss experience, internal risk ratings, current economic conditions, industry performance trends and other pertinent information. In 2014, changes in these factors led to a net release of $4 million in the allowance for credit losses compared with a net release of $22 million in 2013. The provision also reflected an increase in overall credit exposure associated with growth in our loan portfolio.
Total assets as of December 31, 2014 included $2.1 billion and $4.7 billion of goodwill related to the Consumer Banking and Commercial Banking reporting units, respectively. For further information regarding the reconciliation of segment results to
CITIZENS FINANCIAL GROUP, INC.
MANAGEMENT'S DISCUSSION AND ANALYSIS
GAAP results, see Note 2324 “Business Segments” to our audited Consolidated Financial Statements in Part II, Item 8 — Financial Statements and Supplementary Data, included elsewhere in this report.
Results of Operations — Year Ended December 31, 2013 Compared with Year Ended December 31, 2012
Net Income (Loss)
We reported a net loss of $3.4 billion for the year ended December 31, 2013, after recording a goodwill impairment charge of $4.1 billion after tax in the second quarter of 2013 and $26 million ($17 million after-tax) in restructuring charges. Excluding the goodwill impairment and restructuring charges above and a net $158 million of pre-tax unusual items in 2012, net income decreased $97 million, or 13%, from 2012, largely driven by the effect of the relatively persistent low interest rate environment on net interest income and a reduction in fee income, driven by continued pressure from regulatory changes and lower mortgage banking fees. Results also reflected increased provision for credit losses and lower noninterest expense, excluding goodwill impairment.
The restructuring charges in 2013 related to our implementation of a new branch image capture system on the teller line which automated several key processes within the branch network, and our decision to close certain branches, which resulted in lease termination costs and other fixed asset write-offs. Unusual expenses in 2012 included a $138 million ($87 million after tax) overdraft litigation settlement, a $77 million ($49 million after tax) settlement of defined benefit pension plan obligation to vested former employees, a $25 million charge related to a state tax settlement and a $23 million ($15 million after tax) loss on sale of a commercial real estate portfolio, offset by a $75 million ($48 million after tax) gain on sale of our VISA, Inc. Class B shares and a net $5 million ($3 million after tax) reversal of prior restructuring charges.
The following table details the significant components of our net income (loss) for the periods indicated:
|
| | | | | | | | | | | | | | |
| | Year Ended December 31, | | | | |
| (dollars in millions) | 2013 | | 2012 | | Change | | Percent |
| Operating Data: | | | | | | | |
| Net interest income |
| $3,058 |
| |
| $3,227 |
| |
| ($169 | ) | | (5 | %) |
| Noninterest income | 1,632 |
| | 1,667 |
| | (35 | ) | | (2 | ) |
| Total revenue | 4,690 |
| | 4,894 |
| | (204 | ) | | (4 | ) |
| Provision for credit losses | 479 |
| | 413 |
| | 66 |
| | 16 |
|
| Noninterest expense | 7,679 |
| | 3,457 |
| | 4,222 |
| | 122 |
|
Noninterest expense, excluding goodwill impairment (1) | 3,244 |
| | 3,457 |
| | (213 | ) | | (6 | ) |
| (Loss) income before income tax (benefit) expense | (3,468 | ) | | 1,024 |
| | (4,492 | ) | | (439 | ) |
| Income tax (benefit) expense | (42 | ) | | 381 |
| | (423 | ) | | (111 | ) |
| Net (loss) income | (3,426 | ) | | 643 |
| | (4,069 | ) | | (633 | ) |
Net income, excluding goodwill impairment (1) | 654 |
| | 643 |
| | 11 |
| | 2 |
|
Return on average tangible common equity (1) | (25.91 | %) | | 4.86 | % | | NM |
| | |
Return on average tangible common equity, excluding goodwill impairment (1) | 4.95 | % | | 4.86 | % | | 9 | bps | | |
(1) These are non-GAAP financial measures. For more information on the computation of this non-GAAP financial measure, see “—Principal Components of Operations and Key Performance Metrics Used By Management — Key Performance Metrics and Non-GAAP Financial Measures.”
CITIZENS FINANCIAL GROUP, INC.
MANAGEMENT'SMANAGEMENT’S DISCUSSION AND ANALYSIS
Net Interest Income
The following table shows the major components of net interest income and net interest margin:
|
| | | | | | | | | | | | | | | | | | | | | | | | | | | |
| | Year Ended December 31, | | Change |
| 2013 | | 2012 | | | | |
| (dollars in millions) | Average Balances | | Income/ Expense | | Yields/ Rates | | Average Balances | | Income/ Expense | | Yields/ Rates | | Average Balances | | Yields/ Rates |
| Assets | | | | | | | | | | | | | | | |
| Interest-bearing cash and due from banks and deposits in banks |
| $2,278 |
| |
| $11 |
| | 0.46 | % | |
| $1,562 |
| |
| $4 |
| | 0.46 | % | |
| $716 |
| | — |
| Taxable investment securities | 19,062 |
| | 477 |
| | 2.50 |
| | 22,030 |
| | 618 |
| | 2.79 |
| | (2,968 | ) | | (29) |
| Non-taxable investment securities | 12 |
| | — |
| | 2.66 |
| | 40 |
| | 2 |
| | 4.32 |
| | (28 | ) | | (166) |
| Total investment securities | 19,074 |
| | 477 |
| | 2.50 |
| | 22,070 |
| | 620 |
| | 2.79 |
| | (2,996 | ) | | (29) |
| Commercial | 28,654 |
| | 900 |
| | 3.10 |
| | 27,273 |
| | 849 |
| | 3.07 |
| | 1,381 |
| | 3 |
| Commercial real estate | 6,568 |
| | 178 |
| | 2.67 |
| | 7,063 |
| | 196 |
| | 2.72 |
| | (495 | ) | | (5) |
| Leases | 3,463 |
| | 105 |
| | 3.05 |
| | 3,216 |
| | 112 |
| | 3.48 |
| | 247 |
| | (43) |
| Total commercial | 38,685 |
| | 1,183 |
| | 3.02 |
| | 37,552 |
| | 1,157 |
| | 3.04 |
| | 1,133 |
| | (2) |
| Residential mortgages | 9,104 |
| | 360 |
| | 3.96 |
| | 9,551 |
| | 413 |
| | 4.32 |
| | (447 | ) | | (36) |
| Home equity loans | 4,606 |
| | 246 |
| | 5.35 |
| | 5,932 |
| | 332 |
| | 5.57 |
| | (1,326 | ) | | (22) |
| Home equity lines of credit | 16,337 |
| | 463 |
| | 2.83 |
| | 16,783 |
| | 470 |
| | 2.79 |
| | (446 | ) | | 4 |
Home equity loans serviced by others (1) | 1,724 |
| | 115 |
| | 6.65 |
| | 2,244 |
| | 149 |
| | 6.63 |
| | (520 | ) | | 2 |
Home equity lines of credit serviced by others (1) | 768 |
| | 22 |
| | 2.88 |
| | 962 |
| | 27 |
| | 2.80 |
| | (194 | ) | | 8 |
| Automobile | 8,857 |
| | 235 |
| | 2.65 |
| | 8,276 |
| | 273 |
| | 3.30 |
| | 581 |
| | (65) |
| Student | 2,202 |
| | 95 |
| | 4.30 |
| | 2,240 |
| | 91 |
| | 4.06 |
| | (38 | ) | | 24 |
| Credit cards | 1,669 |
| | 175 |
| | 10.46 |
| | 1,634 |
| | 166 |
| | 10.15 |
| | 35 |
| | 31 |
| Other retail | 1,453 |
| | 107 |
| | 7.36 |
| | 1,800 |
| | 127 |
| | 7.03 |
| | (347 | ) | | 33 |
| Total retail | 46,720 |
| | 1,818 |
| | 3.89 |
| | 49,422 |
| | 2,048 |
| | 4.14 |
| | (2,702 | ) | | (25) |
| Total loans and leases | 85,405 |
| | 3,001 |
| | 3.50 |
| | 86,974 |
| | 3,205 |
| | 3.67 |
| | (1,569 | ) | | (17) |
| Loans held for sale | 392 |
| | 12 |
| | 3.07 |
| | 538 |
| | 17 |
| | 3.10 |
| | (146 | ) | | (3) |
| Interest-earning assets | 107,149 |
| | 3,501 |
| | 3.25 |
| | 111,144 |
| | 3,846 |
| | 3.45 |
| | (3,995 | ) | | (20) |
| Allowance for loan and lease losses | (1,219 | ) | |
|
| |
|
| | (1,506 | ) | |
|
| |
|
| | 287 |
| |
|
| Goodwill | 9,063 |
| |
|
| |
|
| | 11,311 |
| |
|
| |
|
| | (2,248 | ) | |
|
| Other noninterest-earning assets | 5,873 |
| |
|
| |
|
| | 6,717 |
| |
|
| |
|
| | (844 | ) | |
|
| Total noninterest-earning assets | 13,717 |
| |
|
| |
|
| | 16,522 |
| |
|
| |
|
| | (2,805 | ) | |
|
| Total assets |
| $120,866 |
| |
|
| |
|
| |
| $127,666 |
| |
|
| |
|
| |
| ($6,800 | ) | |
|
| Liabilities and Stockholders' Equity |
|
| |
|
| |
|
| |
|
| |
|
| |
|
| |
|
| |
|
| Checking with interest |
| $14,096 |
| |
| $8 |
| | 0.06 | % | |
| $13,522 |
| |
| $10 |
| | 0.08 | % | |
| $574 |
| | (2) bps |
| Money market and savings | 42,575 |
| | 105 |
| | 0.25 |
| | 41,249 |
| | 121 |
| | 0.29 |
| | 1,326 |
| | (4) |
| Term deposits | 11,266 |
| | 103 |
| | 0.91 |
| | 13,534 |
| | 244 |
| | 1.80 |
| | (2,268 | ) | | (89) |
| Total interest-bearing deposits | 67,937 |
| | 216 |
| | 0.32 |
| | 68,305 |
| | 375 |
| | 0.55 |
| | (368 | ) | | (23) |
Federal funds purchased and securities sold under agreements to repurchase (2) | 2,400 |
| | 192 |
| | 7.89 |
| | 2,716 |
| | 119 |
| | 4.31 |
| | (316 | ) | | 358 |
| Other short-term borrowed funds | 251 |
| | 4 |
| | 1.64 |
| | 3,026 |
| | 101 |
| | 3.27 |
| | (2,775 | ) | | (163) |
| Long-term borrowed funds | 778 |
| | 31 |
| | 3.93 |
| | 1,976 |
| | 24 |
| | 1.20 |
| | (1,198 | ) | | 273 |
| Total borrowed funds | 3,429 |
| | 227 |
| | 6.53 |
| | 7,718 |
| | 244 |
| | 3.11 |
| | (4,289 | ) | | 342 |
| Total interest-bearing liabilities | 71,366 |
| | 443 |
| | 0.61 |
| | 76,023 |
| | 619 |
| | 0.80 |
| | (4,657 | ) | | (19) |
| Demand deposits | 25,399 |
| |
|
| |
|
| | 25,053 |
| |
|
| |
|
| | 346 |
| |
|
| Other liabilities | 2,267 |
| |
|
| |
|
| | 2,652 |
| |
|
| |
|
| | (385 | ) | |
|
| Total liabilities | 99,032 |
| |
|
| |
|
| | 103,728 |
| |
|
| |
|
| | (4,696 | ) | |
|
| Stockholders' equity | 21,834 |
| |
|
| |
|
| | 23,938 |
| |
|
| |
|
| | (2,104 | ) | |
|
| Total liabilities and stockholders' equity |
| $120,866 |
| |
|
| |
|
| |
| $127,666 |
| |
|
| |
|
| |
| ($6,800 | ) | |
|
| Interest rate spread |
| |
|
| | 2.64 |
| |
|
| |
|
| | 2.65 |
| |
|
| | (1) |
| Net interest income |
| |
| $3,058 |
| |
|
| |
|
| |
| $3,227 |
| |
|
| | | |
|
| Net interest margin |
| |
| | 2.85 | % | |
| |
| | 2.89 | % | |
| | (4) bps |
| Memo: Total deposits (interest-bearing and demand) |
| $93,336 |
| |
| $216 |
| | 0.23 | % | |
| $93,358 |
| |
| $375 |
| | 0.40 | % | |
| ($22 | ) | | (17) bps |
(1) Our SBO portfolio consists of home equity loans and lines that were originally serviced by others. We now service a portion of this portfolio internally.
(2) Balances are net of certain short-term receivables associated with reverse repurchase agreements. Interest expense includes the full cost of the repurchase agreements and certain hedging costs. The rate on federal funds purchased is elevated due to the impact from pay-fixed interest rate swaps that are scheduled to run off by the end of 2015. See “—Analysis of Financial Condition — December 31, 20132015 Compared with December 31, 2012 — Derivatives” for further information.2014
CITIZENS FINANCIAL GROUP, INC.
MANAGEMENT'S DISCUSSION AND ANALYSIS
Net interest income of $3.1 billion in 2013 decreased $169 million, or 5%, from $3.2 billion in 2012, and reflected a four basis point decline in net interest margin to 2.85%. The decrease in net interest income was driven by a reduction in earning asset yields given the relatively persistent low-rate environment, as well as a decrease in loan and securities portfolio balances, which were partially offset by a reduction in pay-fixed swap costs and improved deposit spreads. Average interest-earning assets decreased $4.0 billion driven by a $2.9 billion decrease in consumer real estate secured portfolios, a $2.3 billion decrease in the investment securities portfolio and a $385 million decrease in student and other installment loans, which were partially offset by a $1.1 billion increase in total commercial loans and a $581 million increase in auto loans.
The four basis point decrease in net interest margin reflected the effect of the relatively persistent low-rate environment, which led to a decline in earning asset yields that outpaced our ability to reduce the cost of interest-bearing liabilities. The decline in earning asset yields reflected continued prepayment of higher yielding consumer real estate secured loans as well as the contractual amortization of higher yield portfolios, which were entered into in higher interest rate environments. In addition, intense industry-wide competition for loans compressed spreads on new originations and resulted in downward pressure on loan yields. To a lesser extent, rates on interest-bearing deposits also declined compared to 2012. Industry wide, net interest margins experienced downward pressure as higher rate loan and securities balances ran off and deposit rates approached floors beneath which they cannot be reduced further.
The net yield on average interest-earning assets decreased 20 basis points to 3.25% in 2013 from 3.45% in 2012, reflecting a 17 basis point decline in the loan and lease portfolio yield and a 35 basis point decline in the investment portfolio yield from 2012. The decline in average yields largely reflected the effect of the continued low-rate environment as new loans and securities were issued at lower rates and prepayment speeds on higher rate fixed assets in the portfolio increased. Investment portfolio income of $488 million decreased $136 million, or 22%, from 2012, and the yield on the portfolio declined 35 basis points to 2.29%. These results were impacted by our strategic decision to slow down reinvestment activity in the first half of 2013, given extremely low levels of market rates.
Our total interest-bearing deposit costs in 2013 decreased $159 million, or 42%, from $375 million in 2012 and reflected a 23 basis point decrease in the rate paid on deposits to 0.32% from 0.55% in 2012. The rates paid on term deposits declined to 0.91% from 1.80% in 2012. As a result of the historically low interest rate environment, many deposit products have hit pricing floors at or near zero, limiting further rate reductions and thus compressing margin. The total cost of borrowed funds increased to 6.53% from 3.11% in 2012 due in part to additional subordinated debt issued in 2013 and the full expense impact of the subordinated debt issued in 2012, and also due to the impact of allocated hedge expense and netting of repurchase agreements. Excluding the cost of the hedge expense and netting, the total borrowed funds rates were 3.11% and 3.47% for 2013 and 2012, respectively.
Noninterest Income
The following table details the significant components of our noninterest income for the periods indicated:
|
| | | | | | | | | | | | | | |
| | Year Ended December 31, | | | | |
| (dollars in millions) | 2013 |
| | 2012 |
| | Change |
| | Percent |
| Service charges and fees |
| $640 |
| |
| $704 |
| |
| ($64 | ) | | (9 | %) |
| Card fees | 234 |
| | 249 |
| | (15 | ) | | (6 | ) |
| Mortgage banking fees | 153 |
| | 189 |
| | (36 | ) | | (19 | ) |
| Trust and investment services fees | 149 |
| | 131 |
| | 18 |
| | 14 |
|
| Foreign exchange and trade finance fees | 97 |
| | 105 |
| | (8 | ) | | (8 | ) |
| Capital markets fees | 53 |
| | 52 |
| | 1 |
| | 2 |
|
| Bank-owned life insurance income | 50 |
| | 51 |
| | (1 | ) | | (2 | ) |
| Securities gains, net | 144 |
| | 95 |
| | 49 |
| | 52 |
|
Other income (1) | 112 |
| | 91 |
| | 21 |
| | 23 |
|
| Noninterest income |
| $1,632 |
| |
| $1,667 |
| |
| ($35 | ) | | (2 | %) |
(1) Includes net impairment losses on securities available for sale recognized in earnings and other income.
Total noninterest income of $1.6 billion in 2013 decreased 2%, or $35 million, from 2012 largely as higher securities gains, net, other income and trust and investment services fees were more than offset by lower service charges and fees, mortgage
CITIZENS FINANCIAL GROUP, INC.
MANAGEMENT'S DISCUSSION AND ANALYSIS
banking fees and card fees. Service charges and fees of $640 million decreased 9% largely on lower account volume. Mortgage banking fees of $153 million decreased $36 million, or 19%, from $189 million in 2012. The decrease was primarily driven by lower loan sale gains reflecting the decision to retain more loans on our balance sheet, which was partially offset by higher mortgage servicing rights valuations. Card fees of $234 million declined $15 million, or 6%, compared to $249 million in 2012 driven by lower transaction volumes. Net gains on the sale of securities of $144 million increased $49 million, or 52%, from $95 million in 2012 primarily reflecting the sale of higher yielding investment securities. Other income of $112 million increased $21 million, or 23%, from 2012 primarily due to a $75 million gain on the sale of Visa Class B shares offset by a $23 million loss on the sale of a commercial real estate portfolio recorded in 2012. Excluding the gain on the sale of Visa Class B shares and the loss on commercial real estate, other income increased $73 million driven by higher derivatives income, leasing income, and a gain on sale of warrants.
Provision for Credit Losses
Provision for credit losses of $479 million in 2013 increased $66 million, or 16%, from $413 million in 2012, despite a $374 million decline in net charge-offs. The increase in the provision for credit losses reflected growth in the commercial loan portfolio and recognition of incremental loss exposure related to expected HELOC payment shock. Additionally, while overall credit quality continued to improve in 2013, the rate of improvement slowed relative to 2012. As a result, 2013 provision for credit losses included a release of $22 million from the allowance for credit losses (the amount by which net charge-offs exceeded the provision), compared with a release of $462 million in 2012. For further information regarding the expected HELOC payment shock, see “— Key Factors Affecting Our Business — HELOC Payment Shock.”
Noninterest Expense
The following table displays the significant components of our noninterest expense for the periods indicated:
|
| | | | | | | | | | | | | | |
| | Year Ended December 31, | | | | |
| (dollars in millions) | 2013 |
| | 2012 |
| | Change |
| | Percent |
| Salaries and employee benefits |
| $1,652 |
| |
| $1,743 |
| |
| ($91 | ) | | (5 | %) |
| Outside services | 360 |
| | 339 |
| | 21 |
| | 6 |
|
| Occupancy | 327 |
| | 310 |
| | 17 |
| | 5 |
|
| Equipment expense | 275 |
| | 279 |
| | (4 | ) | | (1 | ) |
| Amortization of software | 102 |
| | 77 |
| | 25 |
| | 32 |
|
| Goodwill impairment | 4,435 |
| | — |
| | 4,435 |
| | NM |
|
| Other operating expense | 528 |
| | 709 |
| | (181 | ) | | (26 | ) |
| Noninterest expense |
| $7,679 |
| |
| $3,457 |
| |
| $4,222 |
| | 122 | % |
Noninterest expense of $7.7 billion in 2013 increased $4.2 billion from $3.5 billion in 2012 and included a second quarter $4.4 billion goodwill impairment charge as described below. Excluding the goodwill impairment, noninterest expense of $3.2 billion declined $213 million, or 6%, from $3.5 billion in 2012. Results in 2012 included a $138 million litigation settlement related to overdraft protection and a $77 million settlement of defined benefit pension plan obligations to vested former employees, partially offset by a net $5 million reversal of prior restructuring charges. Excluding these unusual items and a $26 million restructuring charge in 2013, noninterest expense decreased $29 million, or 1%, driven by lower other operating expense and salaries and employee benefits.
In the second quarter of 2013, we recorded a $4.4 billion goodwill impairment charge driven by a deceleration of the expected future earnings associated with our Consumer Banking reporting unit as compared to our prior expectations. Although the U.S. economy has demonstrated signs of recovery, including notable improvements in unemployment and housing, the pace and extent of recovery in these indicators, as well as in overall gross domestic product, have lagged behind previous expectations and interest rates have remained at or near historically low levels for a protracted period of time. Lower economic growth rates for the United States, coupled with increased costs to comply with the new regulatory framework in the financial services industry, resulted in a deceleration of the expected growth rate for future earnings associated with the Consumer Banking reporting unit, which caused us to record a goodwill impairment charge during the second quarter of 2013. For segment reporting purposes, the impairment charge is reflected in Other, and the remaining carrying value of goodwill totaled $6.9 billion as of December 31, 2013. See Note 8 “Goodwill” to our audited Consolidated Financial Statements included in Part II, Item 8 — Financial Statements and Supplementary Data, included elsewhere in this report, for further information.
CITIZENS FINANCIAL GROUP, INC.
MANAGEMENT'S DISCUSSION AND ANALYSIS
Provision (Benefit) for Income Taxes
In 2013, we recorded an income tax benefit of $42 million compared to $381 million of income tax expense in 2012. The effective tax rates for the years ended December 31, 2013 and 2012 were 1.2% and 37.2%, respectively. The decrease in the effective rate was mainly due to the tax rate impact of the goodwill impairment in calculating our income tax benefit as well as the effect of a $25 million charge related to a state tax settlement in 2012. Goodwill not deductible for tax purposes accounted for 78.4% of the total goodwill impairment charge and generated a reduction of 35.1% in our effective tax rate for the year ended December 31, 2013. During 2012, we recorded a state tax settlement charge for the years 2003 through 2008 related to our real estate investment trust and various passive investment companies. For more information on our 2012 tax settlement see Note 14 “Income Taxes” to our audited Consolidated Financial Statements included in Part II, Item 8 — Financial Statements and Supplementary Data, included elsewhere in this report.
Business Segments
The following tables present certain financial data of our business segments for the year ended December 31, 2013:
|
| | | | | | | | | | | | | | | |
| | As of and for the Year Ended December 31, 2013 |
| (dollars in millions) | Consumer Banking | | Commercial Banking | | Other |
| (4) | Consolidated |
| Net interest income (expense) |
| $2,176 |
| |
| $1,031 |
| |
| ($149 | ) | |
| $3,058 |
|
| Noninterest income | 1,025 |
| | 389 |
| | 218 |
| | 1,632 |
|
| Total revenue | 3,201 |
| | 1,420 |
| | 69 |
| | 4,690 |
|
| Noninterest expense | 2,522 |
| | 635 |
| | 4,522 |
| | 7,679 |
|
| Profit (loss) before provision for credit losses | 679 |
| | 785 |
| | (4,453 | ) | | (2,989 | ) |
| Provision for credit losses | 308 |
| | (7 | ) | | 178 |
| | 479 |
|
| Income (loss) before income tax expense | 371 |
| | 792 |
| | (4,631 | ) | | (3,468 | ) |
| Income tax expense (benefit) | 129 |
| | 278 |
| | (449 | ) | | (42 | ) |
| Net income (loss) |
| $242 |
| |
| $514 |
| |
| ($4,182 | ) | |
| ($3,426 | ) |
Loans and leases and loans held for sale (year-end) (1) |
| $45,019 |
| |
| $36,155 |
| |
| $5,939 |
| |
| $87,113 |
|
| Average Balances: | | | | | | | |
| Total assets |
| $46,465 |
| |
| $35,229 |
| |
| $39,172 |
| |
| $120,866 |
|
Loans and leases and loans held for sale (1) | 45,106 |
| | 34,647 |
| | 6,044 |
| | 85,797 |
|
| Deposits and deposits held for sale | 72,158 |
| | 17,516 |
| | 3,662 |
| | 93,336 |
|
| Interest-earning assets | 45,135 |
| | 34,771 |
| | 27,243 |
| | 107,149 |
|
| Key Metrics: | | | | | | | |
| Net interest margin | 4.82 | % | | 2.97 | % | | NM |
| | 2.85 | % |
Efficiency ratio (2) | 78.76 |
| | 44.66 |
| | NM |
| | 163.73 |
|
Efficiency ratio, excluding goodwill impairment(2) | 78.76 |
| | 44.66 |
| | NM |
| | 69.17 |
|
| Average loans to average deposits ratio | 62.51 |
| | 197.80 |
| | NM |
| | 91.92 |
|
Return on average total tangible assets (2) | 0.52 |
| | 1.46 |
| | NM |
| | (3.05 | ) |
Return on average total tangible assets, excluding goodwill impairment (2) | 0.52 |
| | 1.46 |
| | NM |
| | 0.58 |
|
Return on average tangible common equity (2) (3) | 5.48 |
| | 13.20 |
| | NM |
| | (25.91 | ) |
Return on average tangible common equity, excluding goodwill impairment (2) (3) | 5.48 |
| | 13.20 |
| | NM |
| | 4.95 |
|
(1) Loans held for sale refer to mortgage loans held for sale recorded in the Consumer Banking segment, as well as the loans relating to the Chicago Divestiture, which are recorded in both the Consumer Banking and Commercial Banking segments.
(2) These are non-GAAP financial measures. For more information on the computation of these non-GAAP financial measures, see “—Principal Components of Operations and Key Performance Metrics Used By Management — Key Performance Metrics and Non-GAAP Financial Measures.”
(3) Operating segments are allocated capital on a risk-adjusted basis considering economic and regulatory capital requirements. We approximate that regulatory capital is equivalent to a sustainable target level for CET1 and then allocate that approximation to the segments based on economic capital.
(4) Includes the financial impact of non-core, liquidating loan portfolios and other non-core assets, our treasury activities, wholesale funding activities, securities portfolio, community development assets and other unallocated assets, liabilities, revenues, provision for credit losses, and expenses not attributed to our Consumer Banking or Commercial Banking segments. For a description of non-core assets, see “—Analysis of Financial Condition — December 31, 2013 Compared with December 31, 2012 — Loans and Leases-Non-Core Assets.”
CITIZENS FINANCIAL GROUP, INC.
MANAGEMENT'S DISCUSSION AND ANALYSIS
We operate our business through two operating segments: Consumer Banking and Commercial Banking. Segment results are derived from our business line profitability reporting systems by specifically attributing managed balance sheet assets, deposits, and other liabilities and their related income or expense. Residual assets and liabilities not attributed to Consumer Banking and Commercial Banking are attributed to Other.
Other includes our treasury function, securities portfolio, wholesale funding activities, goodwill and goodwill impairment, community development assets and other unallocated assets, liabilities, revenues, provision for credit losses and expenses not attributed to Consumer Banking or Commercial Banking. Other also includes our non-core assets. Non-core assets are primarily loans inconsistent with our strategic goals, generally as a result of geographic location, industry, product type or risk level. The non-core portfolio totaled $3.8 billion as of December 31, 2013, down 33% from December 31, 2012. The largest component of our non-core portfolio is our home equity products currently or formerly services by others.
Our capital levels are evaluated and managed centrally; however, capital is allocated to the operating segments to support evaluation of business performance. Operating segments are allocated capital on a risk-adjusted basis considering economic and regulatory capital requirements. We approximate that regulatory capital is equivalent to a sustainable target level for common equity Tier 1 and then allocate that approximation to the segments based on economic capital. Interest income and expense is determined based on the assets and liabilities managed by the business segment. Because funding and asset liability management is a central function, funds transfer-pricing methodologies are utilized to allocate a cost of funds used, or credit for the funds provided, to all business segment assets, liabilities and capital, respectively, using a matched funding concept. The residual effect on net interest income of asset/liability management, including the residual net interest income related to the funds transfer pricing process, is included in Other.
Provision for credit losses is allocated to each business segment based on actual net charge-offs that have been recognized by the business segment. The difference between the consolidated provision for credit losses and the business segments’ net charge-offs is reflected in Other.
Noninterest income and expense directly managed by each business segment, including fees, service charges, salaries and benefits, and other direct revenues and costs are accounted for within each segment’s financial results in a manner similar to our audited Consolidated Financial Statements. Occupancy costs are allocated based on utilization of facilities by the business segment. Generally, operating losses are charged to the business segment when the loss event is realized in a manner similar to a loan charge-off. Noninterest expenses incurred by centrally managed operations or business segments that directly support another business segment’s operations are charged to the applicable business segment based on its utilization of those services.
Income taxes are assessed to each business segment at a standard tax rate with the residual tax expense or benefit to arrive at the consolidated effective tax rate included in Other.
Developing and applying methodologies used to allocate items among the business segments is a dynamic process. Accordingly, financial results may be revised periodically as management systems are enhanced, methods of evaluating performance or product lines change, or our organizational structure changes.
CITIZENS FINANCIAL GROUP, INC.
MANAGEMENT'S DISCUSSION AND ANALYSIS
Consumer Banking
|
| | | | | | | | | | | | | | |
| | As of and for the Year Ended December 31, | | | | |
| (dollars in millions) | 2013 | | 2012 | | Change | | Percent |
| Net interest income |
| $2,176 |
| |
| $2,197 |
| |
| ($21 | ) | | (1 | %) |
| Noninterest income | 1,025 |
| | 1,187 |
| | (162 | ) | | (14 | ) |
| Total revenue | 3,201 |
| | 3,384 |
| | (183 | ) | | (5 | ) |
| Noninterest expense | 2,522 |
| | 2,691 |
| | (169 | ) | | (6 | ) |
| Profit before provision for credit losses | 679 |
| | 693 |
| | (14 | ) | | (2 | ) |
| Provision for credit losses | 308 |
| | 408 |
| | (100 | ) | | (24 | ) |
| Income before income tax expense | 371 |
| | 285 |
| | 86 |
| | 30 |
|
| Income tax expense | 129 |
| | 100 |
| | 29 |
| | 29 |
|
| Net income |
| $242 |
| |
| $185 |
| |
| $57 |
| | 31 |
|
Loans and leases and loans held for sale (year-end) (1) |
| $45,019 |
| |
| $46,289 |
| |
| ($1,270 | ) | | (3 | ) |
| Average Balances: | | | | | | | |
| Total assets |
| $46,465 |
| |
| $47,824 |
| |
| ($1,359 | ) | | (3 | ) |
Loans and leases and loans held for sale (1) | 45,106 |
| | 46,455 |
| | (1,349 | ) | | (3 | ) |
| Deposits and deposits held for sale | 72,158 |
| | 70,812 |
| | 1,346 |
| | 2 |
|
| Interest-earning assets | 45,135 |
| | 46,479 |
| | (1,344 | ) | | (3 | %) |
| Key Metrics: | | | | | | | |
| Net interest margin | 4.82 | % | | 4.73 | % | | 9 bps |
| | |
Efficiency ratio (2) | 78.76 |
| | 79.45 |
| | (69) bps |
| | |
| Average loans to average deposits ratio | 62.51 |
| | 65.60 |
| | (309) bps |
| | |
Return on average total tangible assets (2) | 0.52 |
| | 0.39 |
| | 13 bps |
| | |
Return on average tangible common equity (2) (3) | 5.48 |
| | 4.89 |
| | 59 bps |
| | |
(1) Loans held for sale include mortgage loans held for sale and loans relating to the Chicago Divestiture.
(2) These are non-GAAP financial measures. For more information on the computation of these non-GAAP financial measures, see “—Principal Components of Operations and Key Performance Metrics Used By Management — Key Performance Metrics and Non-GAAP Financial Measures.”
(3) Operating segments are allocated capital on a risk-adjusted basis considering economic and regulatory capital requirements. We approximate that regulatory capital is equivalent to a sustainable target level for CET1 and then allocate that approximation to the segments based on economic capital.
Consumer Banking net income of $242 million in 2013 increased $57 million, or 31%, from 2012 as a 5% decrease in revenue was more than offset by a 6% decrease in noninterest expense and a $100 million decrease in provision for credit losses. 2012 unusual items included a $75 million ($48 million after tax) benefit in revenue relating to a gain on the sale of Visa class B shares and a $138 million ($87 million after tax) settlement charge in noninterest expense associated with overdraft litigation. Excluding these items, net income increased $18 million as the benefit of lower provision for credit losses and continued expense discipline more than offset the lower revenue reflecting continued pressure from the relatively persistent low-rate environment as well as the impact of regulatory changes on service charges and card fees.
Net interest income of $2.2 billion in 2013 declined $21 million, or 1%, largely driven by a 3% decrease in earning assets and a reduction in deposit spreads. The average loan portfolio declined $1.3 billion to $45.1 billion, driven by a $1.8 billion decrease in home equity balances given industry wide higher levels of mortgage refinance activity. In 2013, we originated $5.7 billion in mortgages compared with $7.9 billion in 2012. We sold 67% of 2013 originations compared to 70% in 2012. Average deposits grew 2% to $72.2 billion reflecting a $3.0 billion increase in money market deposits, partially offset by a $2.4 billion decrease in certificates of deposit.
Noninterest income of $1.0 billion decreased $162 million, or 14%, from 2012, which included the benefit of the $75 million gain on the sale of Visa class B shares. Excluding this gain, noninterest income decreased $87 million driven by a $53 million decrease in service charges and a $36 million decrease in mortgage banking fees. The decrease in mortgage banking fees reflected a $2.2 billion decrease in origination volumes as well as lower gains on the sale of mortgages as secondary market spreads narrowed. Gains on sale of mortgages decreased $77 million and volume related fees declined $28 million, partially offset by the recovery of mortgage servicing rights valuations and lower amortization expense.
CITIZENS FINANCIAL GROUP, INC.
MANAGEMENT'S DISCUSSION AND ANALYSIS
Noninterest expense of $2.5 billion decreased $169 million, or 6%, from 2012, which included the $138 million overdraft settlement. Excluding this settlement charge, noninterest expense decreased $31 million driven by lower salaries and benefits and branch related costs partially offset by higher commissions expense.
Provision for credit losses of $308 million decreased $100 million, or 24%, from 2012, largely reflecting the benefit of decreased charge-offs in the residential real estate secured portfolio as well as general improvement in the credit environment.
Commercial Banking
|
| | | | | | | | | | | | | | |
| | As of and for the Year Ended December 31, | | | | |
| (dollars in millions) | 2013 | | 2012 | | Change | | Percent |
| Net interest income |
| $1,031 |
| |
| $1,036 |
| |
| ($5 | ) | | — | % |
| Noninterest income | 389 |
| | 349 |
| | 40 |
| | 11 |
|
| Total revenue | 1,420 |
| | 1,385 |
| | 35 |
| | 3 |
|
| Noninterest expense | 635 |
| | 625 |
| | 10 |
| | 2 |
|
| Profit before provision for credit losses | 785 |
| | 760 |
| | 25 |
| | 3 |
|
| Provision for credit losses | (7 | ) | | 63 |
| | (70 | ) | | (111 | ) |
| Income before income tax expense | 792 |
| | 697 |
| | 95 |
| | 14 |
|
| Income tax expense | 278 |
| | 244 |
| | 34 |
| | 14 |
|
| Net income |
| $514 |
| |
| $453 |
| |
| $61 |
| | 13 |
|
Loans and leases and loans held for sale (year-end) (1) |
| $36,155 |
| |
| $34,384 |
| |
| $1,771 |
| | 5 |
|
| Average Balances: | | | | | | | |
| Total assets |
| $35,229 |
| |
| $33,474 |
| |
| $1,755 |
| | 5 |
|
Loans and leases and loans held for sale (1) | 34,647 |
| | 32,499 |
| | 2,148 |
| | 7 |
|
| Deposits and deposits held for sale | 17,516 |
| | 17,650 |
| | (134 | ) | | (1 | ) |
| Interest-earning assets | 34,771 |
| | 32,600 |
| | 2,171 |
| | 7 | % |
| Key Metrics: | | | | | | | |
| Net interest margin | 2.97 | % | | 3.18 | % | | (21) bps |
| | |
Efficiency ratio (2) | 44.66 |
| | 45.22 |
| | (56) bps |
| | |
| Average loans to average deposits ratio | 197.80 |
| | 184.13 |
| | 1,367 bps |
| | |
Return on average total tangible assets (2) | 1.46 |
| | 1.35 |
| | 11 bps |
| | |
Return on average tangible common equity (2) (3) | 13.20 |
| | 12.45 |
| | 75 bps |
| | |
(1) Loans held for sale include loans relating to the Chicago Divestiture.
(2) These are non-GAAP financial measures. For more information on the computation of these non-GAAP financial measures, see “—Principal Components of Operations and Key Performance Metrics Used By Management — Key Performance Metrics and Non-GAAP Financial Measures.”
(3) Operating segments are allocated capital on a risk-adjusted basis considering economic and regulatory capital requirements. We approximate that regulatory capital is equivalent to a sustainable target level for CET1 and then allocate that approximation to the segments based on economic capital.
Commercial Banking net income of $514 million in 2013 increased $61 million, or 13%, from $453 million in 2012 driven by growth in noninterest income and continued improvement in credit quality. Total revenue rose 3% reflecting an 11% increase in noninterest income and relatively flat net interest income.
Net interest income of $1.0 billion in 2013 remained relatively flat with the prior year as the benefit of loan growth of 7%, largely in middle market, mid-corporate, and franchise lending, was offset by a 21 basis point decline in net interest margin given the relatively persistent low-rate environment.
Noninterest income of $389 million in 2013 increased $40 million, or 11%, from 2012, largely due to higher interest rate products and leasing income, which was partially offset by lower foreign exchange and trade finance fees.
Noninterest expense of $635 million in 2013 increased $10 million, driven by higher salary and benefits cost as well as continued investment in technology and risk management.
Average loans and leases increased $2.1 billion, or 7%, in 2013 due to strong new loan origination activity particularly in the second half of 2013 in commercial finance. Average deposit balances were relatively flat at $17.5 billion despite a $256 million increase in noninterest-bearing demand deposits.
CITIZENS FINANCIAL GROUP, INC.
MANAGEMENT'S DISCUSSION AND ANALYSIS
Provision for credit losses in 2013 reflected a net recovery of $7 million on prior charge-offs, compared with an expense of $63 million in 2012, as overall credit quality continued to improve.
Other
|
| | | | | | | | | | | | | | |
| | As of and for the Year Ended December 31, | | | | |
| (dollars in millions) | 2013 | | 2012 | | Change |
| | Percent |
| Net interest (expense) |
| ($149 | ) | |
| ($6 | ) | |
| ($143 | ) | | NM |
|
| Noninterest income | 218 |
| | 131 |
| | 87 |
| | 66 | % |
| Total revenue | 69 |
| | 125 |
| | (56 | ) | | (45 | ) |
| Noninterest expense | 4,522 |
| | 141 |
| | 4,381 |
| | NM |
|
| (Loss) before provision for credit losses | (4,453 | ) | | (16 | ) | | (4,437 | ) | | NM |
|
| Provision for credit losses | 178 |
| | (58 | ) | | 236 |
| | 406 |
|
| (Loss) income before income tax (benefit) expense | (4,631 | ) | | 42 |
| | (4,673 | ) | | NM |
|
| Income tax (benefit) expense | (449 | ) | | 37 |
| | (486 | ) | | NM |
|
| Net (loss) income |
| ($4,182 | ) | |
| $5 |
| |
| ($4,187 | ) | | NM |
|
| Loans and leases and loans held for sale (year-end) |
| $5,939 |
| |
| $7,221 |
| |
| ($1,282 | ) | | (18 | ) |
| Average Balances: | | | | | | | |
| Total assets |
| $39,172 |
| |
| $46,368 |
| |
| ($7,196 | ) | | (16 | ) |
| Loans and leases and loans held for sale | 6,044 |
| | 8,558 |
| | (2,514 | ) | | (29 | ) |
| Deposits and deposits held for sale | 3,662 |
| | 4,896 |
| | (1,234 | ) | | (25 | ) |
| Interest-earning assets | 27,243 |
| | 32,065 |
| | (4,822 | ) | | (15 | %) |
A net loss of $4.2 billion was recorded for the year ended December 31, 2013, which included a pre-tax goodwill impairment charge of $4.4 billion. Excluding the goodwill impairment, the net loss was $102 million compared with net income of $5 million in 2012. 2013 results reflected the benefit of higher noninterest income and lower noninterest expense, which was more than offset by higher provision for credit losses and a reduction in net interest income. Total revenue of $69 million in 2013 decreased by $56 million, or 45%, from $125 million in 2012.
Net interest income in 2013 decreased $143 million to a loss of $149 million compared to a loss of $6 million in 2012. The decrease was driven by lower average investment portfolio balances of $2.3 billion, a $2.2 billion decrease in average non-core loan balances and a decrease in residual net interest income related to funds transfer pricing, which was partially offset by the benefit of interest rate swaps used for hedging assets and liabilities.
Noninterest income of $218 million in 2013 increased $87 million, or 66%, from $131 million in 2012, which included a $23 million loss on sale of non-core loans. Noninterest income in 2013 also included higher net gains on sale of securities available for sale of $65 million.
The provision for credit losses within Other mainly represents the residual change in the consolidated allowance for credit losses after attributing the respective net charge-offs to the Consumer Banking and Commercial Banking segments. It also includes net charge-offs related to the non-core portfolio. The provision totaled $178 million in 2013, and was an increase of $236 million from a negative provision of $58 million in 2012. Non-core net charge-offs were $195 million and $393 million in 2013 and 2012, respectively, resulting from improved credit quality and continued runoff in the portfolio. 2013 provision for credit losses included a release of $22 million from the allowance for credit losses (the amount by which net charge-offs exceeded the provision), compared with a release of $462 million in 2012.
Noninterest expense of $4.5 billion increased $4.4 billion from $141 million in 2012 and included a $4.4 billion goodwill impairment charge. Noninterest expense, excluding goodwill impairment, of $87 million in 2013 decreased $54 million, or 38%, from $141 million in 2012. 2013 results included $26 million of restructuring charges, and 2012 results included a $77 million settlement of defined benefit pension plan obligations to vested former employees, partially offset by a net $5 million reversal of prior restructuring charges.
Total assets included $2.1 billion and $4.8 billion of goodwill related to the Consumer Banking and Commercial Banking reporting units, respectively. For further information regarding the reconciliation of segment results to GAAP results, see Note 23
CITIZENS FINANCIAL GROUP, INC.
MANAGEMENT'S DISCUSSION AND ANALYSIS
“Business Segments” to our audited Consolidated Financial Statements in Part II, Item 8 — Financial Statements and Supplementary Data, included elsewhere in this report.
Analysis of Financial Condition — December 31, 2014 Compared with December 31, 2013
Loans and Leases
The following table shows the composition of loans and leases, including non-core loans, as of:
| | | | December 31, | | | | | December 31, | | | | |
| (dollars in millions) | 2014 |
| | 2013 |
| | Change |
| | Percent | 2015 |
| | 2014 |
| | Change |
| | Percent |
|
| Commercial |
| $31,431 |
| |
| $28,667 |
| |
| $2,764 |
| | 10 | % |
| $33,264 |
| |
| $31,431 |
| |
| $1,833 |
| | 6 | % |
| Commercial real estate | 7,809 |
| | 6,948 |
| | 861 |
| | 12 |
| 8,971 |
| | 7,809 |
| | 1,162 |
| | 15 |
|
| Leases | 3,986 |
| | 3,780 |
| | 206 |
| | 5 |
| 3,979 |
| | 3,986 |
| | (7 | ) | | — |
|
| Total commercial | 43,226 |
| | 39,395 |
| | 3,831 |
| | 10 |
| 46,214 |
| | 43,226 |
| | 2,988 |
| | 7 |
|
| Residential mortgages | 11,832 |
| | 9,726 |
| | 2,106 |
| | 22 |
| 13,318 |
| | 11,832 |
| | 1,486 |
| | 13 |
|
| Home equity loans | 3,424 |
| | 4,301 |
| | (877 | ) | | (20 | ) | 2,557 |
| | 3,424 |
| | (867 | ) | | (25 | ) |
| Home equity lines of credit | 15,423 |
| | 15,667 |
| | (244 | ) | | (2 | ) | 14,674 |
| | 15,423 |
| | (749 | ) | | (5 | ) |
Home equity loans serviced by others (1) | 1,228 |
| | 1,492 |
| | (264 | ) | | (18 | ) | 986 |
| | 1,228 |
| | (242 | ) | | (20 | ) |
Home equity lines of credit serviced by others (1) | 550 |
| | 679 |
| | (129 | ) | | (19 | ) | 389 |
| | 550 |
| | (161 | ) | | (29 | ) |
| Automobile | 12,706 |
| | 9,397 |
| | 3,309 |
| | 35 |
| 13,828 |
| | 12,706 |
| | 1,122 |
| | 9 |
|
| Student | 2,256 |
| | 2,208 |
| | 48 |
| | 2 |
| 4,359 |
| | 2,256 |
| | 2,103 |
| | 93 |
|
| Credit cards | 1,693 |
| | 1,691 |
| | 2 |
| | — |
| 1,634 |
| | 1,693 |
| | (59 | ) | | (3 | ) |
| Other retail | 1,072 |
| | 1,303 |
| | (231 | ) | | (18 | ) | 1,083 |
| | 1,072 |
| | 11 |
| | 1 |
|
| Total retail | 50,184 |
| | 46,464 |
| | 3,720 |
| | 8 |
| 52,828 |
| | 50,184 |
| | 2,644 |
| | 5 |
|
Total loans and leases (2) (3) |
| $93,410 |
| |
| $85,859 |
| |
| $7,551 |
| | 9 | % |
| $99,042 |
| |
| $93,410 |
| |
| $5,632 |
| | 6 | % |
(1) Our SBO portfolio consists of purchased home equity loans and lines that were originally serviced by others. We now service a portion of this portfolio internally.
(2) Excluded from the table above are loans held for sale totaling $281$365 million and $1.3 billion$281 million as of December 31, 2015 and 2014, and 2013, respectively. Loans held for sale as of December 31, 2013 primarily related to the Chicago Divestiture. For further discussion, see Note 17 “Divestitures and Branch Assets and Liabilities Held for Sale” to our audited Consolidated Financial Statements in Part II, Item 8 — Financial Statements and Supplementary Data, included elsewhere in this report.
(3) Mortgage loans serviced for others by our subsidiaries are not included above, and amounted to $17.9$17.6 billion and $18.7$17.9 billion at December 31, 2015 and 2014, and 2013, respectively.
Our loans and leases are disclosed in portfolio segments and classes. Our loan and lease portfolio segments are commercial and retail. The classes of loans and leases are: commercial, commercial real estate, leases, residential mortgages, home equity loans, home equity lines of credit, home equity loans serviced by others, home equity lines of credit serviced by others, automobile, student, credit cards and other retail.
As of December 31, 2014, ourTotal loans and leases portfolio increased $7.6 billion, or 9%, to $93.4 billion compared to $85.9of $99.0 billion as of December 31, 2013,2015, increased $5.6 billion, or 6%, from $93.4 billion as of December 31, 2014, reflecting growth in both retail and commercial. Total commercial loans and leases of $43.2$46.2 billion grew $3.8$3.0 billion, or 10%7%, from $39.4$43.2 billion as of December 31, 2013.2014, reflecting commercial loan growth of $1.8 billion and growth in commercial real estate of $1.2 billion. Total retail loans of $50.2$52.8 billion increased $3.7$2.6 billion, or 8%5%, from $46.5$50.2 billion as of December 31, 2013, driven by2014, as a 35%$2.1 billion increase in automobile loans reflecting both purchases associated with our flow purchase agreementstudent, a $1.5 billion increase in residential mortgages, and stronger originations. Residential mortgages increased 22%, reflectinga $1.1 billion increase in auto, were partially offset by lower home equity balances, including continued run off in the benefitnon-core portfolio.
The effect of loan purchases and sales in 2015, net of run off of previously purchased loans, increased year-end loans by $1.2 billion. See Note 4 “Loans and Leases” to our decision to retain more originations on balance sheet. Results also reflected a reductionaudited Consolidated Financial Statements in home equity outstandings, including runoffPart II, Item 8 — Financial Statements and Supplementary Data, included elsewhere in the serviced by others portfolio.this report, for further information.
CITIZENS FINANCIAL GROUP, INC.
MANAGEMENT'SMANAGEMENT’S DISCUSSION AND ANALYSIS
Non-Core Assets
The table below shows the composition of our non-core assets as of the dates indicated:
| | | | December 31, | | | | | | | December 31, | | (Date of Designation) | | Change from | | Change from |
| (dollars in millions) | 2014 |
| | 2013 |
| | (Date of Designation) June 30, 2009 | | Change from 2014-2013 | | Change from 2014-2009 | 2015 |
| | 2014 |
| | June 30, 2009 | | 2015-2014 | | 2015-2009 |
| Commercial |
| $68 |
| |
| $108 |
| |
| $1,900 |
| | (37 | %) | | (96 | %) |
| $38 |
| |
| $68 |
| |
| $1,900 |
| | (44 | %) | | (98 | %) |
| Commercial real estate | 216 |
| | 381 |
| | 3,412 |
| | (43 | ) | | (94 | ) | 130 |
| | 216 |
| | 3,412 |
| | (40 | ) | | (96 | ) |
| Total commercial | 284 |
| | 489 |
| | 5,312 |
| | (42 | ) | | (95 | ) | 168 |
| | 284 |
| | 5,312 |
| | (41 | ) | | (97 | ) |
| Residential mortgages | 365 |
| | 432 |
| | 1,467 |
| | (16 | ) | | (75 | ) | 297 |
| | 365 |
| | 1,467 |
| | (19 | ) | | (80 | ) |
| Home equity loans | 118 |
| | 151 |
| | 384 |
| | (22 | ) | | (69 | ) | 69 |
| | 118 |
| | 384 |
| | (42 | ) | | (82 | ) |
| Home equity lines of credit | 121 |
| | 111 |
| | 231 |
| | 9 |
| | (48 | ) | 74 |
| | 121 |
| | 231 |
| | (39 | ) | | (68 | ) |
Home equity loans serviced by others (1) | 1,228 |
| | 1,492 |
| | 4,591 |
| | (18 | ) | | (73 | ) | 986 |
| | 1,228 |
| | 4,591 |
| | (20 | ) | | (79 | ) |
Home equity lines of credit serviced by others (1) | 550 |
| | 679 |
| | 1,589 |
| | (19 | ) | | (65 | ) | 389 |
| | 550 |
| | 1,589 |
| | (29 | ) | | (76 | ) |
| Automobile | — |
| | — |
| | 769 |
| | — |
| | (100 | ) | — |
| | — |
| | 769 |
| | — |
| | (100 | ) |
| Student | 369 |
| | 406 |
| | 1,495 |
| | (9 | ) | | (75 | ) | 329 |
| | 369 |
| | 1,495 |
| | (11 | ) | | (78 | ) |
| Credit cards | — |
| | — |
| | 995 |
| | — |
| | (100 | ) | — |
| | — |
| | 995 |
| | — |
| | (100 | ) |
| Other retail | — |
| | — |
| | 3,268 |
| | — |
| | (100 | ) | — |
| | — |
| | 3,268 |
| | — |
| | (100 | ) |
| Total retail | 2,751 |
| | 3,271 |
| | 14,789 |
| | (16 | ) | | (81 | ) | 2,144 |
| | 2,751 |
| | 14,789 |
| | (22 | ) | | (86 | ) |
| Total non-core loans | 3,035 |
| | 3,760 |
| | 20,101 |
| | (19 | ) | | (85 | ) | 2,312 |
| | 3,035 |
| | 20,101 |
| | (24 | ) | | (88 | ) |
| Other assets | 65 |
| | 81 |
| | 378 |
| | (20 | ) | | (83 | ) | 26 |
| | 65 |
| | 378 |
| | (60 | ) | | (93 | ) |
| Total non-core assets |
| $3,100 |
| |
| $3,841 |
| |
| $20,479 |
| | (19 | %) | | (85 | %) |
| $2,338 |
| |
| $3,100 |
| |
| $20,479 |
| | (25 | %) | | (89 | %) |
(1) Our SBO portfolio consists of purchased home equity loans and lines that were originally serviced by others. We now service a portion of this portfolio internally.
Non-core assets are primarily loans inconsistent with our strategic goals, generally as a result of geographic location, industry, product type or risk level. Non-core assets totaled $2.3 billion as of December 31, 2015. We have actively managed these loans down since they were designated as non-core on June 30, 2009. Between that time and December 31, 20142015, the portfolio has decreased $17.4$18.1 billion, including principal repayments of $9.4 billion;$10.1 billion; charge-offs of $3.9 billion;$3.9 billion; transfers back to the core portfolio of $2.8 billion;$2.8 billion; and sales of $1.3 billion.
$1.3 billion. Transfers from non-core back to core arewere handled on an individual requestindividual-request basis and managed through theour chief credit officer for our non-core portfolio. The rationale can vary and in the past some loan portfolio transfers have been approved after determination that the original decision to place them in non-core was not deemed appropriate. Individual loans can be reconsidered when the customer prospects change—typically related to situations where a non-strategic customer becomes a strategic customer due to growth or a new credit request that was previously considered to be unlikely.officer.
Non-core assets totaled $3.1$2.3 billion as of December 31, 2014,2015, down 19%25% from December 31, 20132014, driven by principal repayments of $604$696 million. Commercial non-core loan balances declined 42%41% compared to December 31, 2013,2014, ending at $284$168 million compared to $489$284 million at December 31, 2013.2014. Retail non-core loan balances of $2.8$2.1 billion decreased 16%$607 million, or $520 million22%, compared to December 31, 2013.
2014.
The largest component of our non-core portfolio is the home equity portfolio serviced by other firms (“SBO”).SBO portfolio. The SBO portfolio is a liquidating portfolio consisting of pools of home equity loans and lines of credit purchased between 2003 and 2007. Although our SBO portfolio consists of loans that were initially serviced by others, we now service a portion of this portfolio internally. SBO balances serviced externally totaled $1.1 billion$763 million and $1.3$1.1 billion as of December 31, 20142015 and December 31, 2013,2014, respectively. The SBO portfolio has been closed to new purchases since the third quarter of 2007, with exposure down to $1.4 billion as of December 31, 2015, compared to $1.8 billion as of December 31, 2014, compared to $2.2 billion as of December 31, 2013.2014. The SBO portfolio represented 6%4% of the retail real estate secured portfolio and 4%3% of the overall retail loan portfolio as of December 31, 2014.2015.
The credit profile of the SBO portfolio was significantly weaker than the core real estate portfolio, with a weighted-average refreshed FICO score of 713712 and combined loan-to-value (“CLTV”)CLTV of 88.9%90% as of December 31, 2014.2015. The proportion of the portfolio in a second lien (subordinated) position was 95%96% with 72% of the portfolio in out-of-footprint geographies including 29%28% in California, Nevada, Arizona and Florida.
CITIZENS FINANCIAL GROUP, INC.
MANAGEMENT'S DISCUSSION AND ANALYSIS
SBO credit performance continued to improve in 20142015 driven by continued portfolio liquidation (the weakest performing loans have already been charged off), more effective account servicing and collection strategies, and improvements in the real estate market. SBO portfolio year-to-date net charge-offs of $41$20.2 million, or 2.1%,1.3% annualized, as of SBO loans in 2014December 31, 2015 improved 82 basis points from $118 million, or 4.7%, in 2013.2.1% for the full year 2014.
CITIZENS FINANCIAL GROUP, INC.
MANAGEMENT’S DISCUSSION AND ANALYSIS
Allowance for Credit Losses and Nonperforming Assets
We and our banking subsidiaries, Citizens Bank, National AssociationCBNA and Citizens Bank of Pennsylvania,CBPA, maintain an allowance for credit losses, consisting of an ALLL and a reserve for unfunded lending commitments. This allowance is created through charges to income, or provision for credit losses, and is maintained at an appropriate level adequate to absorb anticipated losses and is determined in accordance with GAAP. For further information on our processes to determine our allowance for credit losses, see “—Critical Accounting Estimates — Allowance for Credit Losses”,Losses,” Note 1 “Significant Accounting Policies” and Note 5 “Allowance for Credit Losses, Nonperforming Assets, and Concentrations of Credit Risk” and Note 1 “Significant Accounting Policies” to our audited Consolidated Financial Statements both in Part II, Item 8 — Financial Statements and Supplementary Data, included elsewhere in this report.
The allowance for credit losses totaled $1.3 billion at December 31, 2015 and 2014, and December 31, 2013.respectively. Our allowance for loan and lease lossesALLL was 1.3%1.23% of total loans and leases and 109%115% of nonperforming loans and leases as of December 31, 20142015 compared with 1.4%1.28% and 86%109% as of December 31, 2013. The total2014.
Overall, loan portfolio credit performancequality continued to improve across all creditmany measures in the year ended December 31, 2014.2015; however, as expected, the rate of improvement began to level off in the second half of 2015 as credit trends continued to normalize from lower levels. As such, we expect asset quality trends to continue to normalize in the future. Net charge-offs for the year ended December 31, 20142015 of $323$284 million decreased 36%12% compared to $501$323 million for the year ended December 31, 2013, with a reduction in virtually every portfolio.2014. The portfolio annualized net charge-off rate declined to 0.30% for the year ended December 31, 2015 from 0.36% for the year ended December 31, 2014 from 0.59% for the year ended December 31, 2013.2014. The 90 day or more past due delinquency rate improved to 1.5%was 0.9% as of December 31, 2014 from 1.9% at December 31, 2013.2015 and 2014. Nonperforming loans and leases totaled $1.1 billion, or 1.2%1.07%, of the total portfolio as of December 31, 2014 as compared to $1.42015 and $1.1 billion, or 1.7%, of the total loan portfolio as of1.18% in December 31, 2013.2014. At December 31, 2014, $6242015, $742 million of nonperforming loans and leases had been designated as impaired and had no specific allowanceALLL because they had been written down to the fair value of their collateral. These impaired loans included $550$672 million of retail loans and $74$70 million of commercial loans. Excluding impaired loans that have been written down to their net realizable value, the allowance to nonperforming loans ratio totaled 251% at December 31, 2014 as compared to 151% at December 31, 2013.
Commercial Loan Asset Quality
Our commercial loan and lease portfolio consists of traditional commercial andloans, commercial real estate loans.loans and leases. The portfolio is predominantly focused primarily on in-footprint customers in our footprint where our local delivery model provides for strong client connectivity.
However, we also do business in certain specialized industry sectors on a national basis.
For commercial loans and leases, we use regulatory classification ratings to monitor credit quality. Loans with a “pass” rating are those that we believe will be fully repaid in accordance with the contractual loan terms. Commercial loans and leases that are “criticized” are those that have some weakness that indicates an increased probability of future loss. See Note 5 “Allowance for Credit Losses, Nonperforming Assets, and Concentrations of Credit Risk” to our audited Consolidated Financial Statements included in Part II, Item 8 — Financial Statements and Supplementary Data, included elsewhere in this report.
During the year ended As of December 31, 2015, nonperforming commercial loans and leases decreased $16 million, or 10%, to $148 million, compared to $164 million as of December 31, 2014,, the quality driven by a 38% decline in commercial nonperforming loans. As of December 31, 2015, total commercial nonperforming loans stood at 0.3% of the commercial loan portfolio, improved. Ascompared to 0.4% as of December 31, 2014,. Net charge-offs in our total commercial loan and lease portfolio for the year ended December 31, 2015 reflected a net recovery of $13 million compared to a net recovery of $15 million for the year ended December 31, 2014. See “—Key Factors Affecting Our Business — Credit Trends” for further details.
Notwithstanding the improvement in nonperforming loans and leases, during the year ended December 31, 2015, total criticized loans decreasedand leases in the total commercial loan and lease portfolio, including commercial real estate loans, increased to $2.6 billion, or 5.6% of the portfolio compared to $1.9 billion, or 4.5%, at December 31, 2014. Commercial loan criticized balances increased to $2.0 billion, or $1.9 billion6.0%, of the commercial loan portfolio compared to 4.9%$1.4 billion, or 4.5%, or $1.9 billion, at as of December 31, 2013.2014, driven by a $331 million increase in the oil and gas industry portfolio, with most of the commercial loan criticized balance increase occurring in fourth quarter 2015. Commercial real estate criticized balances decreased 21.8%increased to 5.8%,$521 million, or $455 million5.8%, of the commercial real estate portfolio compared to 8.4%,$455 million, or $582 million5.8%, as of December 31, 2013.2014. Commercial loans accounted for 76% of criticized loans as of December 31, 2015, compared to 73% as of December 31, 2014. Commercial real estate accounted for 23.6%20% of the criticized loans as of December 31, 2014,2015, compared to 30.4%24% as of December 31, 2013.2014.
Nonperforming balances and charge-offs displayed a positive trend in 2014. As of December 31, 2014, nonperforming commercial balances decreased $101 million, or 38.1%, to $164 million, compared to $265 million as of December 31, 2013, with a 70.4% decline in commercial real estate nonperforming loans over the same period. As of December 31, 2014, nonperforming commercial loans stood at 0.4% of the commercial loan portfolio compared to 0.7% as of December 31, 2013. Net charge-offs in our commercial loan portfolio for the year ended December 31, 2014 decreased $36 million ending in a net recovery position of $15 million compared to a net charge-off of $21 million for the year ended December 31, 2013 primarily due to lower gross charge-offs and continued recovery of prior period losses. The improvement was driven by improved economic conditions and a strategic focus on high quality new business. See “—Key Factors Affecting Our Business—Credit Trends” for further details.
CITIZENS FINANCIAL GROUP, INC.
MANAGEMENT'S DISCUSSION AND ANALYSIS
Retail Loan Asset Quality
For retail loans, we primarily use the loan’s payment and delinquency status to monitor credit quality. The furtherlonger a loan is past due, the greater the likelihood of future credit loss. These credit quality indicators are continually updated and monitored. Our retail loan portfolio remains predominantly focused on lending across the New England, Mid-Atlantic and Midwest regions, with continued geographic expansion outside the footprint withprimarily in the auto finance and student lending portfolios. Originations within the footprint are primarily initiated through the branch network, whereas out-of-footprint lending isRetail assets increased to $52.8 billion as of December 31, 2015, a 5% increase from December 31, 2014, driven by indirectgrowth in the student lending, residential mortgage and auto loansfinance portfolio, offset by a reduction in dealer networks and through purchase agreements, and student loans via our online platform.home equity balances, including run off in the non-core portfolio.
CITIZENS FINANCIAL GROUP, INC.
MANAGEMENT’S DISCUSSION AND ANALYSIS
The credit composition of our retail loan portfolio at December 31, 20142015 remained favorable and well positionedwell-positioned across all product lines with an average refreshed FICO score of 755, in line with757, an improvement of 2 points from December 31, 2013.2014. Our real estate CLTV ratio is calculated as the mortgage amountand second lien loan balance divided by the appraised value of the property and was 63.6% as of December 31, 2015 compared to 65.4% as of December 31, 2014 compared to 67.8% as of December 31, 2013.2014. Excluding the SBO portfolio, the real estate combined loan-to-valueCLTV was 62.3% as of December 31, 2015 compared to 63.8% as of December 31, 2014 compared to 65.1% as of December 31, 2013.2014. Asset quality remains stableis improving with a net charge-off rate (core and non-core) of 0.70%0.58% for the year ended December 31, 2014,2015, a decrease of 3312 basis points from the year ended December 31, 2013.
2014.
Nonperforming retail loans as a percentage of total retail loans were 1.9%1.7% as of December 31, 2014 which is an improvement of 612015, a 14 basis pointspoint decrease from December 31, 2013.2014. Retail nonaccrual loans of $904 million at December 31, 2015 decreased $26 million from $930 million at December 31, 2014, decreased $188 million from $1.1 billion at December 31, 2013 as continued improvement in real estate secured loans were modestlyreflecting lower mortgage and home equity portfolios, partially offset by increases in the student loanslending and automobile loans, largely reflecting expected portfolio seasoning given increased portfolio growth. The improvement in nonperforming retail loans was primarily driven by transfers of loans from nonaccrual to accrual status.
auto finance portfolios.
Special Topics-HELOC Payment Shock
For further information regarding the possible HELOC payment shock, see “—Key Factors Affecting Our Business — HELOC Payment Shock.”
Troubled Debt Restructuring
Troubled debt restructuring (“TDR”)TDR is the classification given to a loan that has been restructured in a manner that grants a concession, that we would not otherwise make, to a borrower that is experiencing financial hardship that we would not otherwise make.hardship. TDRs typically result from our loss mitigation efforts and are undertaken in order to improve the likelihood of recovery and continuity of the relationship. Our loan modifications are handled on a case by case basis and are negotiated to achieve mutually agreeable terms that maximize loan collectability and meet our borrower’s financial needs. The types of concessions include interest rate reductions, term extensions, principal forgiveness and other modifications to the structure of the loan that fall outside our lending policy. Depending on the specific facts and circumstances of the customer, restructuring can involve loans moving to nonaccrual, remaining on nonaccrual or continuing on accrual status. As of December 31, 2015 and 2014, we hadclassified $1.2 billion classified as retail TDRs, of which $387TDRs. In the retail TDR population, $379 million were in nonaccrual status. Within this nonaccrual population, 47.0%status of which 51% were current in payment. TDRs generally return to accrual status once repayment capacity and appropriate payment history can be established. TDRs are evaluated for impairment individually. Loans are classified as TDRs until paid off, sold or refinanced at market terms.
CITIZENS FINANCIAL GROUP, INC.
MANAGEMENT'S DISCUSSION AND ANALYSIS
For additional information regarding TDRs, see “—Critical Accounting Estimates — Allowance for Credit Losses,” and Note 1 “Significant Accounting Policies” and Note 5 “Allowance for Credit Losses, Nonperforming Assets, and Concentrations of Credit Risk” and Note 1 “Significant Accounting Policies” to our audited Consolidated Financial Statements both in Part II, Item 8 — Financial Statements and Supplementary Data, included elsewhere in this report.
The table below presents an aging of our retail TDRs in delinquent status:TDRs:
| | | | December 31, 2014 | December 31, 2015 |
| (in millions) | Current |
| | 30-89 Days
Past Due | | 90+ Days Past Due | | Total |
| Current |
| | 30-89 Days
Past Due | | 90+ Days Past Due | | Total |
|
| Recorded Investment: | | | | | | | | | | | | | | |
| Residential mortgages |
| $319 |
| |
| $41 |
| |
| $85 |
| |
| $445 |
|
| $327 |
| |
| $37 |
| |
| $77 |
| |
| $441 |
|
| Home equity loans | 203 |
| | 26 |
| | 41 |
| | 270 |
| 170 |
| | 19 |
| | 35 |
| | 224 |
|
| Home equity lines of credit | 134 |
| | 7 |
| | 20 |
| | 161 |
| 163 |
| | 11 |
| | 20 |
| | 194 |
|
Home equity loans serviced by others (1) | 82 |
| | 5 |
| | 4 |
| | 91 |
| 67 |
| | 3 |
| | 4 |
| | 74 |
|
Home equity lines of credit serviced by others (1) | 8 |
| | 1 |
| | 2 |
| | 11 |
| 6 |
| | 1 |
| | 3 |
| | 10 |
|
| Automobile | 10 |
| | 1 |
| | — |
| | 11 |
| 13 |
| | 1 |
| | — |
| | 14 |
|
| Student | 158 |
| | 7 |
| | 2 |
| | 167 |
| 157 |
| | 6 |
| | 2 |
| | 165 |
|
| Credit cards | 28 |
| | 3 |
| | 1 |
| | 32 |
| 25 |
| | 2 |
| | 1 |
| | 28 |
|
| Other retail | 19 |
| | 1 |
| | — |
| | 20 |
| 14 |
| | 1 |
| | — |
| | 15 |
|
| Total |
| $961 |
| |
| $92 |
| |
| $155 |
| |
| $1,208 |
|
| $942 |
| |
| $81 |
| |
| $142 |
| |
| $1,165 |
|
(1) Our SBO portfolio consists of home equity loans and lines that were originally serviced by others. We now service a portion of this portfolio internally.
The table below presents the accrual status of our retail TDRs:
|
| | | | | | | | | | | |
| | December 31, 2014 |
| (in millions) | Accruing |
| | Nonaccruing |
| | Total |
|
| Recorded Investment: | | | | | |
| Residential mortgages |
| $285 |
| |
| $160 |
| |
| $445 |
|
| Home equity loans | 172 |
| | 98 |
| | 270 |
|
| Home equity lines of credit | 82 |
| | 79 |
| | 161 |
|
Home equity loans serviced by others (1) | 63 |
| | 28 |
| | 91 |
|
Home equity lines of credit serviced by others (1) | 3 |
| | 8 |
| | 11 |
|
| Automobile | 6 |
| | 5 |
| | 11 |
|
| Student | 160 |
| | 7 |
| | 167 |
|
| Credit cards | 31 |
| | 1 |
| | 32 |
|
| Other retail | 19 |
| | 1 |
| | 20 |
|
| Total |
| $821 |
| |
| $387 |
| |
| $1,208 |
|
(1) Our SBO portfolio consists ofpurchased home equity loans and lines that were originally serviced by others. We now service a portion of this portfolio internally.
CITIZENS FINANCIAL GROUP, INC.
MANAGEMENT'SMANAGEMENT’S DISCUSSION AND ANALYSIS
The table below presents the accrual status of our retail TDRs:
|
| | | | | | | | | | | |
| | December 31, 2015 |
| (in millions) | Accruing |
| | Nonaccruing |
| | Total |
|
| Recorded Investment: | | | | | |
| Residential mortgages |
| $279 |
| |
| $162 |
| |
| $441 |
|
| Home equity loans | 158 |
| | 66 |
| | 224 |
|
| Home equity lines of credit | 107 |
| | 87 |
| | 194 |
|
Home equity loans serviced by others (1) | 52 |
| | 22 |
| | 74 |
|
Home equity lines of credit serviced by others (1) | 4 |
| | 6 |
| | 10 |
|
| Automobile | 6 |
| | 8 |
| | 14 |
|
| Student | 138 |
| | 27 |
| | 165 |
|
| Credit cards | 27 |
| | 1 |
| | 28 |
|
| Other retail | 15 |
| | — |
| | 15 |
|
| Total |
| $786 |
| |
| $379 |
| |
| $1,165 |
|
(1) Our SBO portfolio consists of purchased home equity loans and lines that were originally serviced by others. We now service a portion of this portfolio internally.
Securities
Our securities portfolio is managed to seek return while maintaining prudent levels of quality, market risk and liquidity. The following table presents our securities available for sale and held to maturity portfolios:maturity:
| | | | December 31, 2014 | | December 31, 2013 | | | December 31, 2015 | | December 31, 2014 | | |
| (dollars in millions) | Amortized Cost | | Fair Value | | Amortized Cost | | Fair Value | | Change in Fair Value | Amortized Cost | | Fair Value | | Amortized Cost | | Fair Value | | Change in Fair Value |
| Securities Available for Sale: | | | | | | | | | | | | | | | | | | | | | | |
| U.S. Treasury |
| $15 |
| |
| $15 |
| |
| $15 |
| |
| $15 |
| |
| $— |
| | — | % |
| $16 |
| |
| $16 |
| |
| $15 |
| |
| $15 |
| |
| $1 |
| | 7 | % |
| State and political subdivisions | 10 |
| | 10 |
| | 11 |
| | 10 |
| | — |
| | — |
| 9 |
| | 9 |
| | 10 |
| | 10 |
| | (1 | ) | | (10 | ) |
| Mortgage-backed securities: | | | | | | | | | | | | | | | | | | | | | | |
| Federal agencies and U.S. government sponsored entities | 17,683 |
| | 17,934 |
| | 14,970 |
| | 14,993 |
| | 2,941 |
| | 20 |
| 17,234 |
| | 17,320 |
| | 17,683 |
| | 17,934 |
| | (614 | ) | | (3 | ) |
| Other/non-agency | 703 |
| | 672 |
| | 992 |
| | 952 |
| | (280 | ) | | (29 | ) | 555 |
| | 522 |
| | 703 |
| | 672 |
| | (150 | ) | | (22 | ) |
| Total mortgage-backed securities | 18,386 |
| | 18,606 |
| | 15,962 |
| | 15,945 |
| | 2,661 |
| | 17 |
| 17,789 |
| | 17,842 |
| | 18,386 |
| | 18,606 |
| | (764 | ) | | (4 | ) |
| Total debt securities | 18,411 |
| | 18,631 |
| | 15,988 |
| | 15,970 |
| | 2,661 |
| | 17 |
| 17,814 |
| | 17,867 |
| | 18,411 |
| | 18,631 |
| | (764 | ) | | (4 | ) |
| Marketable equity securities | 10 |
| | 13 |
| | 10 |
| | 13 |
| | — |
| | — |
| 5 |
| | 5 |
| | 10 |
| | 13 |
| | (8 | ) | | (62 | ) |
| Other equity securities | 12 |
| | 12 |
| | 12 |
| | 12 |
| | — |
| | — |
| 12 |
| | 12 |
| | 12 |
| | 12 |
| | — |
| | — |
|
| Total equity securities | 22 |
| | 25 |
| | 22 |
| | 25 |
| | — |
| | — |
| 17 |
| | 17 |
| | 22 |
| | 25 |
| | (8 | ) | | (32 | ) |
| Total securities available for sale |
| $18,433 |
| |
| $18,656 |
| |
| $16,010 |
| |
| $15,995 |
| |
| $2,661 |
| | 17 |
|
| $17,831 |
| |
| $17,884 |
| |
| $18,433 |
| |
| $18,656 |
| |
| ($772 | ) | | (4 | ) |
| Securities Held to Maturity: | | | | | | | | | | | | | | | | | | | | | | |
| Mortgage-backed securities: | | | | | | | | | | | | | | | | | | | | | | |
| Federal agencies and U.S. government sponsored entities |
| $3,728 |
| |
| $3,719 |
| |
| $2,940 |
| |
| $2,907 |
| |
| $812 |
| | 28 |
|
| $4,105 |
| |
| $4,121 |
| |
| $3,728 |
| |
| $3,719 |
| |
| $402 |
| | 11 |
|
| Other/non-agency | 1,420 |
| | 1,474 |
| | 1,375 |
| | 1,350 |
| | 124 |
| | 9 |
| 1,153 |
| | 1,176 |
| | 1,420 |
| | 1,474 |
| | (298 | ) | | (20 | ) |
| Total securities held to maturity |
| $5,148 |
| |
| $5,193 |
| |
| $4,315 |
| |
| $4,257 |
| |
| $936 |
| | 22 |
|
| $5,258 |
| |
| $5,297 |
| |
| $5,148 |
| |
| $5,193 |
| |
| $104 |
| | 2 |
|
| Total securities available for sale and held to maturity |
| $23,581 |
| |
| $23,849 |
| |
| $20,325 |
| |
| $20,252 |
| |
| $3,597 |
| | 18 | % |
| $23,089 |
| |
| $23,181 |
| |
| $23,581 |
| |
| $23,849 |
| |
| ($668 | ) | | (3 | %) |
As of December 31, 2014,2015, the fair value of the AFS and HTM securities portfolio increaseddecreased by $3.6 billion,$668 million, or 18%3%, to $23.8$23.2 billion,, compared to $20.3$23.8 billion as of December 31, 2013,2014, reflecting our decision to continue tosales of mortgage-backed securities and a corresponding reduction in collateralized borrowings, partially offset by continued reinvestment of securities cashflows and an increase interest-earning assetsin the market value of the securities portfolio due to a level more consistent with our capital levels and the balance sheet profiledecline in interest rates as of regional bank peers.December 31, 2015. As of December 31, 2014,2015, the portfolio had a weighted-average expected life of 4.2portfolio’s average effective duration was 3.5 years compared with 4.64.2 years as of December 31, 2013.2014.
The securities portfolio included higherhigh quality, highly liquid investments reflecting our ongoing commitment to maintaining appropriate contingent liquidity and pledging capacity. U.S. Government guaranteedgovernment-guaranteed notes and government sponsored entity issuedgovernment-sponsored entity-issued mortgage-backed securities represented the vast majority of the securities portfolio holdings. The portfolio composition has also
CITIZENS FINANCIAL GROUP, INC.
MANAGEMENT’S DISCUSSION AND ANALYSIS
been dominated by holdings backed by mortgages so that they canmay be pledged to the FHLBs. This has become increasingly important due to the enhanced liquidity requirements of the liquidity coverage ratio. For further discussion of the liquidity coverage ratios, see “Regulation and Supervision — Liquidity Standards” in Part I, Item 1 — Business, included elsewhere in this report.
Securities portfolio incomeIncome on debt securities portfolios totaled $579 million for the year ended December 31, 2015, a decrease of $4 million, or 1%, from $583 million infor the year ended December 31, 2014, increased $137 million, or 31%, from $446 million in 2013, and reflected a yield of 2.49%2.44% compared with 2.47% in 2013.2.49% for the year ended December 31, 2014.
CITIZENS FINANCIAL GROUP, INC.
MANAGEMENT'S DISCUSSION AND ANALYSIS
Deposits
The table below represents the major components of our deposits:
|
| | | | | | | | | | | | | | |
| | December 31, | | | | |
| (dollars in millions) | 2014 |
| | 2013 |
| | Change |
| | Percent |
| Demand |
| $26,086 |
| |
| $24,931 |
| |
| $1,155 |
| | 5 | % |
| Checking with interest | 16,394 |
| | 13,630 |
| | 2,764 |
| | 20 |
|
| Regular savings | 7,824 |
| | 7,509 |
| | 315 |
| | 4 |
|
| Money market accounts | 33,345 |
| | 31,245 |
| | 2,100 |
| | 7 |
|
| Term deposits | 12,058 |
| | 9,588 |
| | 2,470 |
| | 26 |
|
| Total deposits | 95,707 |
| | 86,903 |
| | 8,804 |
| | 10 |
|
Deposits held for sale (1) | — |
| | 5,277 |
| | (5,277 | ) | | (100 | ) |
| Total deposits and deposits held for sale |
| $95,707 |
| |
| $92,180 |
| |
| $3,527 |
| | 4 | % |
(1)Reflects $5.3 billion in deposits that were reclassified to deposits held for sale at December 31, 2013 related to the Chicago Divestiture. For further discussion, see Note 17 “Divestitures and Branch Assets and Liabilities Held for Sale” to our audited Consolidated Financial Statements in Part II, Item 8 — Financial Statements and Supplementary Data, included elsewhere in this report. |
| | | | | | | | | | | | | | |
| | December 31, | | | | |
| (dollars in millions) | 2015 |
| | 2014 |
| | Change |
| | Percent |
|
| Demand |
| $27,649 |
| |
| $26,086 |
| |
| $1,563 |
| | 6 | % |
| Checking with interest | 17,921 |
| | 16,394 |
| | 1,527 |
| | 9 |
|
| Regular savings | 8,218 |
| | 7,824 |
| | 394 |
| | 5 |
|
| Money market accounts | 36,727 |
| | 33,345 |
| | 3,382 |
| | 10 |
|
| Term deposits | 12,024 |
| | 12,058 |
| | (34 | ) | | — |
|
| Total deposits |
| $102,539 |
| |
| $95,707 |
| |
| $6,832 |
| | 7 | % |
Total deposits as of December 31, 2014,2015, increased $8.8$6.8 billion, or 10%7%, to $102.5 billion compared to $95.7 billion compared to $86.9 billion as of December 31, 2013. All categories of deposits increased, led by2014 and reflected particular strength in money market accounts, demand and checking with interest which increased by $2.8 billion, or 20%. Deposits held for sale decreased $5.3 billion reflecting the impact of the June 2014 Chicago Divestiture.interest.
Borrowed Funds
The tables below present ourShort-term borrowed funds.
funds
The following is a summary of our short-term borrowed funds: | | | | December 31, | | | | | December 31, | | | | |
| (dollars in millions) | 2014 |
| | 2013 |
| | Change |
| | Percent | 2015 |
| | 2014 |
| | Change |
| | Percent |
|
| Federal funds purchased |
| $574 |
| |
| $689 |
| |
| ($115 | ) | | (17 | %) |
| $— |
| |
| $574 |
| |
| ($574 | ) | | (100 | %) |
| Securities sold under agreements to repurchase | 3,702 |
| | 4,102 |
| | (400 | ) | | (10 | ) | 802 |
| | 3,702 |
| | (2,900 | ) | | (78 | ) |
| Other short-term borrowed funds | 6,253 |
| | 2,251 |
| | 4,002 |
| | 178 |
| |
| Other short-term borrowed funds (primarily current portion of FHLB advances) | | 2,630 |
| | 6,253 |
| | (3,623 | ) | | (58 | ) |
| Total short-term borrowed funds |
| $10,529 |
| |
| $7,042 |
| |
| $3,487 |
| | 50 | % |
| $3,432 |
| |
| $10,529 |
| |
| ($7,097 | ) | | (67 | %) |
Short-term borrowed funds of $3.4 billion as of December 31, 2015, decreased $7.1 billion from December 31, 2014, as we reduced our reliance on short-term borrowings, including short-term FHLB borrowings, repurchase agreements, and federal funds purchased.
As of December 31, 2015, our total contingent liquidity was $23.1 billion, consisting of $2.0 billion in net cash at the FRB (which is defined as excess cash balances held at the FRBs), $17.0 billion in unencumbered high-quality securities, and $4.1 billion in unused FHLB borrowing capacity. Additionally, $11.0 billion in unencumbered loans pledged at the FRBs created total available liquidity of approximately $34.1 billion.
CITIZENS FINANCIAL GROUP, INC.
MANAGEMENT'SMANAGEMENT’S DISCUSSION AND ANALYSIS
Key data related to short-term borrowed funds is presented in the following table: | | | | As of and for the Year Ended December 31, | As of and for the Year Ended December 31, |
| (dollars in millions) | 2014 | | 2013 | | 2012 |
| 2015 |
| | 2014 |
| | 2013 |
|
| Weighted-average interest rate at year-end: | | | | | | | | | | |
| Federal funds purchased and securities sold under agreements to repurchase | 0.14 | % | | 0.09 | % | | 0.10 | % | 0.15 | % | | 0.14 | % | | 0.09 | % |
| Other short-term borrowed funds | 0.26 |
| | 0.20 |
| | 0.29 |
| |
| Other short-term borrowed funds (primarily current portion of FHLB advances) | | 0.44 |
| | 0.26 |
| | 0.20 |
|
| Maximum amount outstanding at month-end during the year: | | | | | | | | | | |
| Federal funds purchased and securities sold under agreements to repurchase |
| $7,022 |
| |
| $5,114 |
| |
| $4,393 |
|
| $5,375 |
| |
| $7,022 |
| |
| $5,114 |
|
| Other short-term borrowed funds | 7,702 |
| | 2,251 |
| | 5,050 |
| |
| Other short-term borrowed funds (primarily current portion of FHLB advances) | | 7,004 |
| | 7,702 |
| | 2,251 |
|
| Average amount outstanding during the year: | | | | | | | | | | |
| Federal funds purchased and securities sold under agreements to repurchase |
| $5,699 |
| |
| $2,400 |
| |
| $2,716 |
|
| $3,364 |
| |
| $5,699 |
| |
| $2,400 |
|
| Other short-term borrowed funds | 5,640 |
| | 251 |
| | 3,026 |
| |
| Other short-term borrowed funds (primarily current portion of FHLB advances) | | 5,865 |
| | 5,640 |
| | 251 |
|
| Weighted-average interest rate during the year: | | | | | | | | | | |
| Federal funds purchased and securities sold under agreements to repurchase | 0.12 | % | | 0.31 | % | | 0.22 | % | 0.22 | % | | 0.12 | % | | 0.31 | % |
| Other short-term borrowed funds | 0.25 |
| | 0.44 |
| | 0.33 |
| |
| Other short-term borrowed funds (primarily current portion of FHLB advances) | | 0.28 |
| | 0.25 |
| | 0.44 |
|
Long-term borrowed funds
The following is a summary of our long-term borrowed funds: | | | | December 31, | December 31, |
| (in millions) | 2014 |
| | 2013 |
| 2015 |
| | 2014 |
|
| Citizens Financial Group, Inc.: | | | | | | |
| 4.150% fixed rate subordinated debt, due 2022 |
| $350 |
| |
| $350 |
|
| $350 |
| |
| $350 |
|
5.158% fixed-to-floating rate subordinated debt, (LIBOR + 3.56%) callable, due 2023 (1) | 333 |
| | 333 |
| 333 |
| | 333 |
|
4.771% fixed rate subordinated debt, due 2023 (1) | 333 |
| | 333 |
| — |
| | 333 |
|
4.691% fixed rate subordinated debt, due 2024 (1) | 334 |
| | 334 |
| — |
| | 334 |
|
4.153% fixed rate subordinated debt, due 2024 (1) | 333 |
| | — |
| |
4.023% fixed rate subordinated debt, due 2024 (1) | 333 |
| | — |
| |
4.082% fixed rate subordinated debt, due 2025 (1) | 334 |
| | — |
| |
4.153% fixed rate subordinated debt, due 2024 (1) (2) | | 250 |
| | 333 |
|
4.023% fixed rate subordinated debt, due 2024 (1) (3) | | 331 |
| | 333 |
|
4.082% fixed rate subordinated debt, due 2025 (1) (4) | | 331 |
| | 334 |
|
| 4.350% fixed rate subordinated debt, due 2025 | | 250 |
| | — |
|
| 4.300% fixed rate subordinated debt, due 2025 | | 750 |
| | — |
|
| Banking Subsidiaries: | | | | | | |
1.600% senior unsecured notes, due 2017 (2)
| 750 |
| | — |
| |
2.450% senior unsecured notes, due 2019 (2) (3)
| 746 |
| | — |
| |
1.600% senior unsecured notes, due 2017 (5) (6) | | 749 |
| | 750 |
|
2.300% senior unsecured notes, due 2018 (5) (7) | | 747 |
| | — |
|
2.450% senior unsecured notes, due 2019 (5) (8) | | 752 |
| | 746 |
|
| Federal Home Loan advances due through 2033 | 772 |
| | 25 |
| 5,018 |
| | 772 |
|
| Other | 24 |
| | 30 |
| 25 |
| | 24 |
|
| Total long-term borrowed funds |
| $4,642 |
| |
| $1,405 |
|
| $9,886 |
| |
| $4,642 |
|
(1) (Intercompany borrowed1) Borrowed funds with RBS Group.RBS. See Note 1819 “Related Party Transactions”Transactions and Significant Transactions with RBS” to our audited Consolidated Financial Statements in Part II, Item 8 — Financial Statements and Supplementary Data, included elsewhere in this report.
(2) These securities were offered under Citizens Bank, National Association's Global Bank Note Program dated DecemberInterest is payable until January 1, 2014.2016 at a fixed rate per annum of 4.153% and at a fixed rate per annum of 3.750% thereafter.
(3) $750333 million principal balance of unsecured notes presented netsubordinated debt reflects the impact of $4$2 million hedge of interest rate risk on medium term debt using interest rate swaps.swaps at December 31, 2015. See Note 16 “Derivatives” to our Consolidated Financial Statements in Part II, Item 8 — Financial Statements and Supplementary Data, included elsewhere in this report.
(4) $334 million principal balance of subordinated debt reflects the impact of $3 million hedge of interest rate risk on medium term debt using interest rate swaps at December 31, 2015. See Note 16 “Derivatives” to our Consolidated Financial Statements in Part II, Item 8 — Financial Statements and Supplementary Data, included elsewhere in this report.
(5) These securities were offered under CBNA’s Global Bank Note Program dated December 1, 2014.
(6) $750 million principal balance of unsecured notes reflects the impact of $1 million hedge of interest rate risk on medium term debt using interest rate swaps at December 31, 2015. See Note 16 “Derivatives” to our Consolidated Financial Statements in Part II, Item 8 — Financial Statements and Supplementary Data, included elsewhere in this report.
(7) $750 million principal balance of unsecured notes reflects the impact of $3 million hedge of interest rate risk on medium term debt using interest rate swaps at December 31, 2015. See Note 16 “Derivatives” to our Consolidated Financial Statements in Part II, Item 8 — Financial Statements and Supplementary Data, included elsewhere in this report.
(8) $750 million principal balance of unsecured notes reflects the impact of $2 million hedge of interest rate risk on medium term debt using interest rate swaps at December 31, 2015. See Note 16 “Derivatives” to our Consolidated Financial Statements in Part II, Item 8 — Financial Statements and Supplementary Data, included elsewhere in this report.
CITIZENS FINANCIAL GROUP, INC.
MANAGEMENT’S DISCUSSION AND ANALYSIS
On December 3, 2015, we repurchased $750 million of outstanding subordinated debt instruments held by RBS. The $3 million difference between the repurchase price and the net carrying amount of the subordinated debt was recognized as a gain on extinguishment of the debt. To fund the repurchase, we issued $750 million of new subordinated debt with a 4.300% fixed rate and a ten year maturity.
Long-term borrowed funds of $9.9 billion as of December 31, 2015 increased $5.2 billion from December 31, 2014, primarily driven by a $4.2 billion increase in long term FHLB advances, a $750 million increase in senior bank debt, and a $250 million increase in subordinated debt used to fund the August 3, 2015 repurchase of 9,615,384 shares of our common stock.
Access to additional funding through repurchase agreements, collateralized borrowed funds or asset sales is available. Additionally, there is capacity to grow deposits or issue senior or subordinated notes.
Derivatives
We use pay-fixed swaps to lengthen liabilities synthetically and offset duration in fixed-rate assets. We also use pay-fixed swaps to hedge floating rate wholesale funding. Notional balances totaled $5.0 billion as of December 31, 2015, compared with $1.0 billion as of December 31, 2014, as we added $4.0 billion of new forward-starting swaps in 2015 to rebalance our interest profile. Pay-fixed rates on the swaps ranged from 1.96% to 4.30% as of December 31, 2015, compared to 4.18% to 4.30% as of December 31, 2014. We received the daily federal funds effective rate on the legacy $1.0 billion notional. The hedges that were added in 2015 are forward starting and begin accruing interest in 2017, at which point we will receive one-month LIBOR and pay an average fixed rate of 2.06%.
We use receive-fixed swaps to minimize the exposure to variability in the interest cash flows on our floating rate assets. At December 31, 2015 and 2014, the notional amount of receive-fixed swap hedges of floating-rate loans totaled $8.5 billion and $4.0 billion, respectively, and the fixed-rate ranges were 0.77% to 2.04% and 1.78% to 2.04%, respectively. We paid one-month LIBOR on these swaps.
In December 2015, we entered into:
A forward starting $500 million pay-fixed interest-rate swap agreement to manage the interest rate exposure on forecasted issuance of senior fixed-rate debt to be issued in July 2016. We pay a fixed rate of 1.82% on the swap agreement and receive three-month LIBOR;
A $166 million receive-fixed interest-rate swap agreement to manage the interest rate exposure on fixed-rate sub-debt issued in October 2014. This agreement converted the 4.02% fixed-rate debt coupon to three-month LIBOR. We receive a fixed rate of 2.02% on the swap agreement and pay three-month LIBOR; and,
A $334 million receive-fixed interest-rate swap agreement to manage the interest rate exposure on fixed-rate sub-debt issued in October 2014. This agreement converted the 4.08% fixed-rate debt coupon to three-month LIBOR. We receive a fixed rate of 2.05% on the swap agreement and pay three-month LIBOR.
In November 2015, we entered into a $750 million receive-fixed interest-rate swap agreement to manage the interest rate exposure on our three-year medium term fixed-rate debt issued in November 2015. This agreement converted the 2.30% fixed-rate debt coupon to three-month LIBOR. We receive a fixed rate of 1.24% on the swap agreement and pay three-month LIBOR.
In May 2015, we entered into a $750 million receive-fixed interest-rate swap agreement to manage the interest rate exposure on our three-year medium term fixed-rate debt issued in December 2014. This agreement converted the 1.60% fixed-rate debt coupon to three-month LIBOR plus 49 basis points. We receive a fixed rate of 1.11% on the swap agreement and pay three-month LIBOR.
In December 2014, we entered into a $750 million receive-fixed interest-rate swap agreement to manage the interest rate exposure on our five-year medium term fixed-rate debt issued in December 2014. This agreement converted the 2.45% fixed-rate debt coupon to three-month LIBOR plus 79 basis points. We receive a fixed rate of 1.66% on the swap agreement and pay three-month LIBOR.
We also sell interest rate swaps and foreign exchange forwards to commercial customers. Offsetting swap and forward agreements are simultaneously transacted to minimize our market risk associated with the customer derivative contracts. The assets and liabilities recorded for derivatives not designated as hedges reflect the market value of these transactions.
CITIZENS FINANCIAL GROUP, INC.
MANAGEMENT’S DISCUSSION AND ANALYSIS
The table below presents our derivative assets and liabilities. For additional information regarding our derivative instruments, see Note 16 “Derivatives” in our audited Consolidated Financial Statements in Part II, Item 8 — Financial Statements and Supplementary Data, included elsewhere in this report.
|
| | | | | | | | | | | | | | | | | | | |
| | December 31, 2015 | | December 31, 2014 |
| (dollars in millions) | Notional Amount (1) | Derivative Assets | Derivative Liabilities | | Notional Amount (1) | Derivative Assets | Derivative Liabilities |
| Derivatives designated as hedging instruments: | | | | | | | |
| Interest rate swaps |
| $16,750 |
|
| $96 |
|
| $50 |
| |
| $5,750 |
|
| $24 |
|
| $99 |
|
| Derivatives not designated as hedging instruments: | | | | | | | |
| Interest rate swaps | 33,719 |
| 540 |
| 455 |
| | 31,848 |
| 589 |
| 501 |
|
| Foreign exchange contracts | 8,366 |
| 163 |
| 156 |
| | 8,359 |
| 170 |
| 164 |
|
| Other contracts | 981 |
| 8 |
| 5 |
| | 730 |
| 7 |
| 9 |
|
| Total derivatives not designated as hedging instruments | | 711 |
| 616 |
| | | 766 |
| 674 |
|
| Gross derivative fair values | | 807 |
| 666 |
| | | 790 |
| 773 |
|
Less: Gross amounts offset in the Consolidated Balance Sheets (2) | | (178 | ) | (178 | ) | | | (161 | ) | (161 | ) |
Less: Cash collateral applied (2) | | (4 | ) | (3 | ) | | | — |
| — |
|
Total net derivative fair values presented in the Consolidated Balance Sheets (3) | |
| $625 |
|
| $485 |
| | |
| $629 |
|
| $612 |
|
(1) The notional or contractual amount of interest rate derivatives and foreign exchange contracts is the amount upon which interest and other payments under the contract are based. For interest rate derivatives, the notional amount is typically not exchanged. Therefore, notional amounts should not be taken as the measure of credit or market risk as they tend to greatly overstate the true economic risk of these contracts.
(2) Amounts represent the impact of legally enforceable master netting agreements that allow us to settle positive and negative positions.
(3) We also offset assets and liabilities associated with repurchase agreements on our Consolidated Balance Sheets. See Note 3, “Securities,” in our audited Consolidated Financial Statements in Part II, Item 8 — Financial Statements and Supplementary Data, included elsewhere in this report.
At December 31, 2015, the overall derivative asset value decreased $4 million and the liability balance decreased by $127 million from December 31, 2014, primarily due to decreased fixed interest rates at December 31, 2015, compared to December 31, 2014 and increased notional balances for the same period.
CITIZENS FINANCIAL GROUP, INC.
MANAGEMENT’S DISCUSSION AND ANALYSIS
Quarterly Results of Operations
The following table presents unaudited quarterly Consolidated Statements of Operations data and Consolidated Balance Sheet data as of and for the four quarters of 2015 and 2014, respectively. We have prepared the Consolidated Statement of Operations data and Balance Sheet data on the same basis as our audited Consolidated Financial Statements in Part II, Item 8 — Financial Statements and Supplementary Data, included elsewhere in this report and, in the opinion of management, each Consolidated Statement of Operations and Balance Sheet includes all adjustments, consisting solely of normal recurring adjustments, necessary for the fair statement of the results of operations and balance sheet data as of and for these periods. This information should be read in conjunction with our audited Consolidated Financial Statements and the related notes, included elsewhere in this report.
Supplementary Summary Consolidated Financial and Other Data (unaudited) |
| | | | | | | | | | | | | | | | | | | | | | | | | | | | | | | |
| | For the Three Months Ended |
| (dollars in millions, except per share amounts) | December 31, 2015 | | September 30, 2015 | | June 30, 2015 | | March 31, 2015 | | December 31, 2014 | | September 30, 2014 | | June 30, 2014 | | March 31, 2014 |
| Operating Data: | | | | | | | | | | | | | | | |
| Net interest income |
| $870 |
| |
| $856 |
| |
| $840 |
| |
| $836 |
| |
| $840 |
| |
| $820 |
| |
| $833 |
| |
| $808 |
|
| Noninterest income | 362 |
| | 353 |
| | 360 |
| | 347 |
| | 339 |
| | 341 |
| | 640 |
| | 358 |
|
| Total revenue | 1,232 |
| | 1,209 |
| | 1,200 |
| | 1,183 |
| | 1,179 |
| | 1,161 |
| | 1,473 |
| | 1,166 |
|
| Provision for credit losses | 91 |
| | 76 |
| | 77 |
| | 58 |
| | 72 |
| | 77 |
| | 49 |
| | 121 |
|
| Noninterest expense | 810 |
| | 798 |
| | 841 |
| | 810 |
| | 824 |
| | 810 |
| | 948 |
| | 810 |
|
| Income before income tax expense | 331 |
| | 335 |
| | 282 |
| | 315 |
| | 283 |
| | 274 |
| | 476 |
| | 235 |
|
| Income tax expense | 110 |
| | 115 |
| | 92 |
| | 106 |
| | 86 |
| | 85 |
| | 163 |
| | 69 |
|
| Net income |
| $221 |
| |
| $220 |
| |
| $190 |
| |
| $209 |
| |
| $197 |
| |
| $189 |
| |
| $313 |
| |
| $166 |
|
| Net income available to common stockholders |
| $221 |
| |
| $213 |
| |
| $190 |
| |
| $209 |
| |
| $197 |
| |
| $189 |
| |
| $313 |
| |
| $166 |
|
Net income per average common share- basic (1) |
| $0.42 |
| |
| $0.40 |
| |
| $0.35 |
| |
| $0.38 |
| |
| $0.36 |
| |
| $0.34 |
| |
| $0.56 |
| |
| $0.30 |
|
Net income per average common share- diluted (1) |
| $0.42 |
| |
| $0.40 |
| |
| $0.35 |
| |
| $0.38 |
| |
| $0.36 |
| |
| $0.34 |
| |
| $0.56 |
| |
| $0.30 |
|
| Other Operating Data: | | | | | |
| | |
| | |
| | | | |
| | |
|
Return on average common equity (2) (3) | 4.51 | % | | 4.40 | % | | 3.94 | % | | 4.36 | % | | 4.06 | % | | 3.87 | % | | 6.41 | % | | 3.48 | % |
Return on average total assets (3) (4) | 0.64 |
| | 0.65 |
| | 0.56 |
| | 0.63 |
| | 0.60 |
| | 0.58 |
| | 0.99 |
| | 0.54 |
|
Net interest margin (3) (5) | 2.77 |
| | 2.76 |
| | 2.72 |
| | 2.77 |
| | 2.80 |
| | 2.77 |
| | 2.87 |
| | 2.89 |
|
| Stock Activity: | | | | | | | | | | | | | | | |
| Share Price: | | | | | | | | | | | | | | | |
| High |
| $27.17 |
| |
| $28.18 |
| |
| $28.71 |
| |
| $25.84 |
| |
| $25.60 |
| |
| $23.57 |
| |
| $— |
| |
| $— |
|
| Low | 22.48 |
| | 21.14 |
| | 24.03 |
| | 22.67 |
| | 21.47 |
| | 21.35 |
| | — |
| | — |
|
| Share Data: | | | | | | | | | | | | | | | |
| Cash dividends declared and paid per common share |
| $0.10 |
| |
| $0.10 |
| |
| $0.10 |
| |
| $0.10 |
| |
| $0.10 |
| |
| $0.68 |
| |
| $0.61 |
| |
| $0.04 |
|
| Dividend payout ratio | 24 | % | | 25 | % | | 28 | % | | 26 | % | | 28 | % | | 203 | % | | 110 | % | | 15 | % |
CITIZENS FINANCIAL GROUP, INC.
MANAGEMENT’S DISCUSSION AND ANALYSIS
|
| | | | | | | | | | | | | | | | | | | | | | | | | | | | | | | |
| | As of |
| (dollars in millions) | December 31, 2015 | | September 30, 2015 | | June 30, 2015 | | March 31, 2015 | | December 31, 2014 | | September 30, 2014 | | June 30, 2014 | | March 31, 2014 |
| Balance Sheet Data: | | | | | |
| | |
| | |
| | |
| | |
| | |
|
| Total assets |
| $138,208 |
| |
| $135,447 |
| |
| $137,251 |
| |
| $136,535 |
| |
| $132,857 |
| |
| $131,341 |
| |
| $130,279 |
| |
| $126,892 |
|
Loans and leases (6) | 99,042 |
| | 97,431 |
| | 96,538 |
| | 94,494 |
| | 93,410 |
| | 90,749 |
| | 88,829 |
| | 87,083 |
|
| Allowance for loan and lease losses | 1,216 |
| | 1,201 |
| | 1,201 |
| | 1,202 |
| | 1,195 |
| | 1,201 |
| | 1,210 |
| | 1,259 |
|
| Total securities | 24,075 |
| | 24,354 |
| | 25,134 |
| | 25,121 |
| | 24,704 |
| | 24,885 |
| | 24,854 |
| | 24,828 |
|
| Goodwill | 6,876 |
| | 6,876 |
| | 6,876 |
| | 6,876 |
| | 6,876 |
| | 6,876 |
| | 6,876 |
| | 6,876 |
|
| Total liabilities | 118,562 |
| | 115,847 |
| | 117,665 |
| | 116,971 |
| | 113,589 |
| | 111,958 |
| | 110,682 |
| | 107,450 |
|
Deposits(7) | 102,539 |
| | 101,866 |
| | 100,615 |
| | 98,990 |
| | 95,707 |
| | 93,463 |
| | 91,656 |
| | 87,462 |
|
| Federal funds purchased and securities sold under agreements to repurchase | 802 |
| | 1,293 |
| | 3,784 |
| | 4,421 |
| | 4,276 |
| | 5,184 |
| | 6,807 |
| | 6,080 |
|
| Other short-term borrowed funds | 2,630 |
| | 5,861 |
| | 6,762 |
| | 7,004 |
| | 6,253 |
| | 6,715 |
| | 7,702 |
| | 4,950 |
|
| Long-term borrowed funds | 9,886 |
| | 4,153 |
| | 3,890 |
| | 3,904 |
| | 4,642 |
| | 2,062 |
| | 1,732 |
| | 1,403 |
|
| Total stockholders’ equity | 19,646 |
| | 19,600 |
| | 19,586 |
| | 19,564 |
| | 19,268 |
| | 19,383 |
| | 19,597 |
| | 19,442 |
|
| Other Balance Sheet Data: | | | | | |
| | |
| | |
| | |
| | |
| | |
|
| Asset Quality Ratios: | | | | | |
| | |
| | |
| | |
| | |
| | |
|
| Allowance for loan and lease losses as a percentage of total loans and leases | 1.23 | % | | 1.23 | % | | 1.24 | % | | 1.27 | % | | 1.28 | % | | 1.32 | % | | 1.36 | % | | 1.45 | % |
| Allowance for loan and lease losses as a percentage of nonperforming loans and leases | 115 |
| | 116 |
| | 114 |
| | 106 |
| | 109 |
| | 111 |
| | 101 |
| | 92 |
|
| Nonperforming loans and leases as a percentage of total loans and leases | 1.07 |
| | 1.06 |
| | 1.09 |
| | 1.20 |
| | 1.18 |
| | 1.19 |
| | 1.35 |
| | 1.57 |
|
Capital ratios:(8) | | | | | |
| | |
| | |
| | |
| | |
| | |
|
CET1 capital ratio (9) | 11.7 |
| | 11.8 |
| | 11.8 |
| | 12.2 |
| | 12.4 |
| | 12.9 |
| | 13.3 |
| | 13.4 |
|
Tier1 capital ratio (10) | 12.0 |
| | 12.0 |
| | 12.1 |
| | 12.2 |
| | 12.4 |
| | 12.9 |
| | 13.3 |
| | 13.4 |
|
Total capital ratio (11) | 15.3 |
| | 15.4 |
| | 15.3 |
| | 15.5 |
| | 15.8 |
| | 16.1 |
| | 16.2 |
| | 16.0 |
|
Tier 1 leverage ratio (12) | 10.5 |
| | 10.4 |
| | 10.4 |
| | 10.5 |
| | 10.6 |
| | 10.9 |
| | 11.1 |
| | 11.4 |
|
(1) Earnings per share information reflects a 165,582-for-1 forward stock split effective on August 22, 2014.
(2) “Return on average common equity” is defined as net income available to common stockholders divided by average common equity.
(3) Ratios for the periods above are presented on an annualized basis.
(4) “Return on average total assets” is defined as net income divided by average total assets.
(5) “Net interest margin” is defined as net interest income divided by average total interest-earning assets.
(6) Excludes loans held for sale of $365 million, $420 million, $697 million, $376 million, $281 million, $208 million, $262 million, and $1.4 billion as of December 31, 2015, September 30, 2015, June 30, 2015, March 31, 2015, December 31, 2014, September 30, 2014, June 30, 2014 and March 31, 2014, respectively.
(7) Excludes deposits held for sale of $5.2 billion as of March 31, 2014.
(8) Basel III transitional rules for institutions applying the Standardized approach to calculating risk-weighted assets became effective January 1, 2015. The capital ratios and associated components for periods December 31, 2014 and prior are prepared under the Basel I general risk-based capital rule.
(9) CET1 under Basel III replaced the concept of tier 1 common capital that existed under Basel I effective January 1, 2015. “Common equity tier 1 capital ratio” as of December 31, , 2015 represents CET1 divided by total risk-weighted assets as defined under Basel III Standardized approach. The “tier 1 common capital ratio” reported prior to January 1, 2015, represented tier 1 common equity divided by total risk-weighted assets as defined under the Basel I general risk-based capital rule .
(10) “Tier 1 capital ratio” is tier 1 capital, which includes CET1 capital plus non-cumulative perpetual preferred equity that qualifies as additional tier 1 capital, divided by total risk-weighted assets as defined under Basel III Standardized approach. The “tier 1 capital ratio” reported prior to January 1, 2015, represented tier 1 capital divided by total risk-weighted assets as defined under the Basel I general risk-based capital rule.
(11) “Total capital ratio” is total capital divided by total risk-weighted assets as defined under Basel III Standardized approach. The “Total capital ratio” reported prior to January 1, 2015, represented total capital divided by total risk-weighted assets as defined under the Basel I general risk-based capital rule.
(12) “Tier 1 leverage ratio” is tier 1 capital divided by quarterly average total assets as defined under Basel III Standardized approach. The “tier 1 leverage ratio” reported prior to January 1, 2015, represented tier 1 capital divided by quarterly average total assets as defined under the Basel I general risk-based capital rule.
CITIZENS FINANCIAL GROUP, INC.
MANAGEMENT’S DISCUSSION AND ANALYSIS
Capital
As a bank holding company and a financial holding company, we are subject to regulation and supervision by the FRBG. Our primary subsidiaries are our two insured depository institutions, CBNA, a national banking association whose primary federal regulator is the OCC, and CBPA, a Pennsylvania-charted savings bank regulated by the Department of Banking of the Commonwealth of Pennsylvania and supervised by the FDIC as its primary federal regulator.
In July 2013, the FRB, OCC and FDIC issued the U.S. Basel III final rules. The rules implement the Basel Committee on Banking Supervision’s Basel III capital framework and certain provisions of the Dodd-Frank Act, including the Collins Amendment. The U.S. Basel III final rules substantially revised the risk-based capital and leverage requirements applicable to bank holding companies and their insured depository institution subsidiaries, including CBNA and CBPA. The U.S. Basel III final rules became effective for CFG and its depository institution subsidiaries, including CBNA and CBPA, on January 1, 2015 (subject to a phase-in period for certain provisions).
The U.S. Basel III final rules, among other things, (i) introduced a new capital measure called CET1, (ii) specified that Tier 1 capital consists of CET1 and “Additional Tier 1 capital” instruments meeting certain revised requirements, (iii) defined CET1 narrowly by requiring that most deductions/adjustments to regulatory capital measures be made to CET1 and not to the other components of capital, and (iv) expanded the scope of the deductions/ adjustments to capital as compared to existing regulations. Under the U.S. Basel III final rules, the minimum capital ratios effective as of January 1, 2015 are:
4.5% CET1 to risk-weighted assets;
6.0% Tier 1 capital (CET1 plus Additional Tier 1 capital) to risk-weighted assets;
8.0% Total capital (Tier 1 capital plus Tier 2 capital) to risk-weighted assets; and
4.0% Tier 1 capital to average consolidated assets as reported on consolidated financial statements (known as the “leverage ratio”).
The U.S. Basel III final rules also introduced a new “capital conservation buffer”, composed entirely of CET1, on top of these minimum risk-weighted asset ratios. The implementation of the capital conservation buffer began on January 1, 2016 at the 0.625% level and will increase by 0.625% on each subsequent January 1, until it reaches 2.5% on January 1, 2019. Banking institutions with a ratio of CET1 to risk-weighted assets below the effective minimum (4.5% plus the capital conservation buffer and, if applicable, the countercyclical capital buffer) will face constraints on dividends, equity repurchases and compensation based on the amount of the shortfall.
When fully phased in on January 1, 2019, the U.S. Basel III final rules will require CFG, CBNA and CBPA to maintain an additional capital conservation buffer of 2.5% of CET1, effectively resulting in minimum ratios of (i) CET1 to risk-weighted assets of at least 7%, (ii) Tier 1 capital to risk-weighted assets of at least 8.5%, (iii) a minimum ratio of Total capital to risk-weighted assets of at least 10.5%, and (iv) a minimum leverage ratio of 4%.
The U.S. Basel III final rules also provide for a number of deductions from and adjustments to CET1. These include, for example, the requirement that certain deferred tax assets and significant investments in non-consolidated financial entities be deducted from CET1 to the extent that any one such category exceeds 10% of CET1 or all such items, in the aggregate, exceed 15% of CET1. Implementation of the deductions and other adjustments to CET1 began on January 1, 2015 and will be phased-in over a 4-year period (beginning at 40% on January 1, 2015 and an additional 20% per year thereafter).
The U.S. Basel III final rules prescribe a standardized approach for risk weightings that expanded the risk-weighting categories from the general risk-based capital rules to a much larger and more risk-sensitive number of categories, depending on the nature of the assets, generally ranging from 0% for U.S. government and agency securities, to 600% for certain equity exposures, and resulting in higher risk weights for a variety of asset categories.
With respect to CBNA and CBPA, the U.S. Basel III final rules also revise the “prompt corrective action” regulations pursuant to Section 38 of the Federal Deposit Insurance Act, as discussed above in “Federal Deposit Insurance Act.”
CITIZENS FINANCIAL GROUP, INC.
MANAGEMENT’S DISCUSSION AND ANALYSIS
The table below presents our actual regulatory capital ratios as of December 31, 2015 under Basel III Transitional rules and as of December 31, 2014 under Basel I rules. In addition, the table includes pro forma Basel III ratios as of December 31, 2015, after full phase-in of all requirements to which we will be subject by January 1, 2019. Based on both current and fully phased-in Basel III requirements, all ratios remain well above current and future Basel III minima:
|
| | | | | | | | | | | | | | | | |
| | | Transitional Basel III | | Pro Forma Basel III Assuming Full Phase-in |
| | Actual Amount | Actual Ratio | Required Minimum | Well-Capitalized Minimum for Purposes of Prompt Corrective Action | | Actual Ratio(1) | Required Minimum + Required Capital Conservation Buffer for Non-Leverage Ratios | FDIA Required Well-Capitalized Minimum for Purposes of Prompt Corrective Action |
| Basel III Transitional as of December 31, 2015 | | | | |
Common equity tier 1 capital(2) |
| $13,389 |
| 11.7 | % | 4.5 | % | 6.5 | % | | 11.7 | % | 7.0 | % | 6.5 | % |
Tier 1 capital(3) | 13,636 |
| 12.0 |
| 6.0 |
| 8.0 |
| | 11.9 |
| 8.5 |
| 8.0 |
|
Total capital(4) | 17,505 |
| 15.3 |
| 8.0 |
| 10.0 |
| | 15.3 |
| 10.5 |
| 10.0 |
|
Tier 1 leverage(5) | 13,636 |
| 10.5 |
| 4.0 |
| 5.0 |
| | 10.5 |
| 4.0 |
| 5.0 |
|
| Basel I as of December 31, 2014 | | | | |
Tier 1 common equity(2) |
| $13,173 |
| 12.4 | % | Not Applicable | Not Applicable | | | | |
Tier 1 capital(3) | 13,173 |
| 12.4 |
| 4.0 | % | 6.0 | % | | | | |
Total capital(4) | 16,781 |
| 15.8 |
| 8.0 |
| 10.0 |
| | | | |
Tier 1 leverage(5) | 13,173 |
| 10.6 |
| 4.0 |
| 5.0 |
| | | | |
(1) These are non-GAAP financial measures. For more information on the computation of these non-GAAP financial measures, see “-Principal Components of Operations and Key Performance Metrics Used By Management - Key Performance Metrics and Non-GAAP Financial Measures.”
(2) CET1 under Basel III replaced the concept of tier 1 common capital that existed under Basel I effective January 1, 2015. “Common equity tier 1 capital ratio” as of December 31, 2015 represents CET1 divided by total risk-weighted assets as defined under Basel III Standardized approach. The “tier 1 common capital ratio” reported prior to January 1, 2015, represented tier 1 common equity divided by total risk-weighted assets as defined under the Basel I general risk-based capital rule.
(3) “Tier 1 capital ratio” is tier 1 capital, which includes CET1 capital plus non-cumulative perpetual preferred equity that qualifies as additional tier 1 capital, divided by total risk-weighted assets as defined under Basel III Standardized approach. The “tier 1 capital ratio” reported prior to January 1, 2015, represented tier 1 capital divided by total risk-weighted assets as defined under the Basel I general risk-based capital rule.
(4) “Total capital ratio” is total capital divided by total risk-weighted assets as defined under Basel III Standardized approach. The “Total capital ratio” reported prior to January 1, 2015, represented total capital divided by total risk-weighted assets as defined under the Basel I general risk-based capital rule.
(5) “Tier 1 leverage ratio” is tier 1 capital divided by quarterly average total assets as defined under Basel III Standardized approach. The “tier 1 leverage ratio” reported prior to January 1, 2015, represented tier 1 capital divided by quarterly average total assets as defined under the Basel I general risk-based capital rule.
Standardized Approach
The Basel III Standardized approach measures risk-weighted assets primarily for market risk and credit risk exposures. Exposures subject to market risk are measured on a basis generally consistent with how market risk-weighted assets were measured using the market risk rules as defined under the Basel 2.5. Refer to “—Market Risk — Market Risk Regulatory Capital,” for further information. CFG applies the Basel III standardized approach, as defined by the U.S. regulators, for determining the assignment of risk-weighted assets. Under the Standardized approach, which is the risk-weight methodology applicable to CFG, no distinction is made for variations in credit quality for corporate exposures. Additionally, the economic benefit of collateral is restricted to a limited list of eligible securities and cash. We estimate our common equity tier 1 capital ratio under the Basel III Standardized approach, on a fully phased-in basis, to be 11.7% at December 31, 2015. As of December 31, 2015, we estimated that our Basel III Standardized common equity tier 1 capital would be $13.4 billion and total risk-weighted assets would be $114.3 billion, on a fully-phased in basis. Our estimates under the Basel III Standardized approach may be refined over time because of further rulemaking or clarification by U.S. banking regulators or as our understanding and interpretation of the rules evolve. Actual results could differ from those estimates and assumptions.
CITIZENS FINANCIAL GROUP, INC.
MANAGEMENT’S DISCUSSION AND ANALYSIS
A reconciliation of Basel III Standardized Transitional approach to Basel III Standardized estimates on a fully-phased in basis for common equity tier 1 capital and risk-weighted assets, see the following table.
|
| | | |
| (dollars in millions) | December 31, 2015 |
| Common equity tier 1 capital |
| $13,389 |
|
| Impact of intangibles at 100% | (2 | ) |
Fully phased-in common equity tier 1 capital(1) |
| $13,387 |
|
| Total capital |
| $17,505 |
|
| Impact of intangibles at 100% | (2 | ) |
Fully phased in common total capital(1) |
| $17,503 |
|
| Risk-weighted assets |
| $114,084 |
|
| Impact of intangibles - 100% capital deduction | (2 | ) |
| Impact of mortgage servicing assets at 250% risk weight | 246 |
|
Fully phased-in risk-weighted assets(1) |
| $114,328 |
|
Transitional common equity tier 1 ratio(2) | 11.7 | % |
Fully phased-in common equity tier 1 ratio(1)(2) | 11.7 |
|
Transitional total capital ratio(3) | 15.3 |
|
Fully phased-in total capital ratio(1)(3) | 15.3 |
|
(1) These are non-GAAP financial measures.
(2) CET1 under Basel III replaced the concept of tier 1 common capital that existed under Basel I effective January 1, 2015. “Common equity tier 1 capital ratio” as of December 31, 2015 represents CET1 divided by total risk-weighted assets as defined under Basel III Standardized approach.
(3) “Total capital ratio” is total capital divided by total risk-weighted assets as defined under Basel III Standardized approach.
Regulatory Capital Ratios and Capital Composition
The following table presents capital and capital ratio information evidencing our transition from Basel I as of December 31, 2014 to Basel III Standardized as of December 31, 2015:
|
| | | | | | | | | | | | | | | | | |
| | | | | | | | FDIA Requirements |
| | Actual | | Minimum Capital Adequacy | | Classification as “Well Capitalized” |
| (dollars in millions) | Amount | Ratio | | Amount | Ratio | | Amount | Ratio |
| Basel III Transitional as of December 31, 2015 | | | | | | | | |
Common equity tier 1 capital(1) |
| $13,389 |
| 11.7 | % | |
| $5,134 |
| 4.5 | % | |
| $7,415 |
| 6.5 | % |
Tier 1 capital(2) | 13,636 |
| 12.0 |
| | 6,845 |
| 6.0 |
| | 9,127 |
| 8.0 |
|
Total capital(3) | 17,505 |
| 15.3 |
| | 9,127 |
| 8.0 |
| | 11,408 |
| 10.0 |
|
Tier 1 leverage(4) | 13,636 |
| 10.5 |
| | 5,218 |
| 4.0 |
| | 6,523 |
| 5.0 |
|
| Risk-weighted assets | 114,084 |
| | | | | | | |
| Quarterly adjusted average assets | 130,455 |
| | | | | | | |
| Basel I as of December 31, 2014 | | | | | | | | |
Tier 1 common equity(1) |
| $13,173 |
| 12.4 | % | | Not Applicable | Not Applicable | | Not Applicable | Not Applicable |
Tier 1 capital(2) | 13,173 |
| 12.4 |
| |
| $4,239 |
| 4.0 | % | |
| $6,358 |
| 6.0 | % |
Total capital(3) | 16,781 |
| 15.8 |
| | 8,477 |
| 8.0 |
| | 10,596 |
| 10.0 |
|
Tier 1 leverage(4) | 13,173 |
| 10.6 |
| | 4,982 |
| 4.0 |
| | 6,227 |
| 5.0 |
|
| Risk-weighted assets | 105,964 |
| | | | | | | |
| Quarterly adjusted average assets | 124,539 |
| | | | | | | |
(1) CET1 under Basel III replaced the concept of tier 1 common capital that existed under Basel I effective January 1, 2015. “Common equity tier 1 capital ratio” as of December 31, 2015 represents CET1 divided by total risk-weighted assets as defined under Basel III Standardized approach. The “tier 1 common capital ratio” reported prior to January 1, 2015, represented tier 1 common equity divided by total risk-weighted assets as defined under the Basel I general risk-based capital rule.
(2) “Tier 1 capital ratio” is tier 1 capital, which includes CET1 capital plus non-cumulative perpetual preferred equity that qualifies as additional tier 1 capital, divided by total risk-weighted assets as defined under Basel III Standardized approach. The “tier 1 capital ratio” reported prior to January 1, 2015, represented tier 1 capital divided by total risk-weighted assets as defined under the Basel I general risk-based capital rule.
(3) “Total capital ratio” is total capital divided by total risk-weighted assets as defined under Basel III Standardized approach. The “Total capital ratio” reported prior to January 1, 2015, represented total capital divided by total risk-weighted assets as defined under the Basel I general risk-based capital rule.
(4) “Tier 1 leverage ratio” is tier 1 capital divided by quarterly average total assets as defined under Basel III Standardized approach. The “tier 1 leverage ratio” reported prior to January 1, 2015, represented tier 1 capital divided by quarterly average total assets as defined under the Basel I general risk-based capital rule.
CITIZENS FINANCIAL GROUP, INC.
MANAGEMENT’S DISCUSSION AND ANALYSIS
CET1 capital under Basel III Standardized Transitional rules was $13.4 billion at December 31, 2015, an increase of $216 million from tier 1 common equity under Basel I at December 31, 2014. The increase was primarily attributable to net income for year ended December 31, 2015, net of dividends paid to stockholders, $500 million in aggregate repurchases of common shares executed on April 7, 2015 and August 3, 2015, and amortization of deferred tax related to goodwill. At December 31, 2015, there was approximately $247 million of additional tier 1 capital, reflecting the capital value after issuance costs of the 5.500% Fixed-to-Floating Non-Cumulative Perpetual Preferred Stock, Series A, issued on April 6, 2015. Tier 1 capital at December 31, 2015 was $13.6 billion, an increase of $463 million over the year, as approximately half of the repurchase of common shares was offset by the issuance of preferred shares. Total capital was $17.5 billion at December 31, 2015, an increase of $724 million from December 31, 2014 driven primarily by net income, net of dividends paid to stockholders, as the combined impact of the repurchase of common shares, issuance of preferred shares and issuance of $250 million in subordinated debt on July 31, 2015 was generally neutral to total capital.
On January 1, 2015, we began reporting risk-weighted assets based on Basel III Standardized Transitional rules. The conversion from Basel I rules resulted in a $2.7 billion increase in RWAs as of December 31, 2014. This increase was primarily driven by risk weight changes for securitization, off-balance sheet commitments with original maturity one year or less, past due and nonaccruals and the removal of the cap on OTC derivatives.
Risk-weighted assets based on Basel III Standardized Transitional rules at December 31, 2015 were $114.1 billion, an increase of $8.1 billion as compared to December 31, 2014. The primary drivers for this change were the adoption of the Basel III Standardized approach, as well as growth in commercial, consumer auto and student loan exposures.
As of December 31, 2015, the tier 1 leverage ratio decreased approximately 13 basis points. This decline reflected the net impact of a $5.9 billion increase in adjusted quarterly average total assets, which drove a 49 basis point decline in the ratio, and the previously noted increase in tier 1 capital, which added 36 basis points to the ratio.
The following table presents our capital composition under the Basel III capital framework in effect for us at December 31, 2015 and under the Basel I capital framework in effect for us at December 31, 2014:
|
| | | | | | | |
| | Transitional Basel III | | Basel I |
| (dollars in millions) | December 31, 2015 | | December 31, 2014 |
| Total common stockholders’ equity |
| $19,399 |
| |
| $19,268 |
|
Exclusions(1): | | | |
| Net unrealized (gains) losses recorded in accumulated other comprehensive income, net of tax: | | | |
| Debt and marketable equity securities available for sale | 28 |
| | (74 | ) |
| Derivatives | (10 | ) | | 69 |
|
| Unamortized net periodic benefit costs | 369 |
| | 377 |
|
| Deductions: | | | |
| Goodwill | (6,876 | ) | | (6,876 | ) |
| Deferred tax liability associated with goodwill | 480 |
| | 420 |
|
| Other intangible assets | (1 | ) | | (6 | ) |
| | | | |
| Disallowed mortgage servicing | — |
| | (5 | ) |
Total Common Equity Tier 1(2) | 13,389 |
| | 13,173 |
|
| Qualifying preferred stock | 247 |
| | — |
|
| Total Tier 1 Capital | 13,636 |
| | 13,173 |
|
| | | | |
| Qualifying long-term debt securities as tier 2 | 2,595 |
| | 2,350 |
|
| Allowance for loan and lease losses | 1,216 |
| | 1,195 |
|
| Allowance for credit losses for off-balance sheet exposure | 58 |
| | 61 |
|
| Unrealized gains on equity securities | — |
| | 2 |
|
| Total capital |
| $17,505 |
| |
| $16,781 |
|
(1) As a Basel III Standardized approach institution, we selected the one-time election to opt out of the requirements to include all the components of AOCI.
(2) CET1 under Basel III replaced the concept of tier 1 common capital that existed under Basel I effective January 1, 2015.
Capital Adequacy Process
Our assessment of capital adequacy begins with our risk appetite and risk management framework. This framework provides for the identification, measurement and management of material risks. Capital requirements are determined for actual
CITIZENS FINANCIAL GROUP, INC.
MANAGEMENT’S DISCUSSION AND ANALYSIS
and forecasted risk portfolios using applicable regulatory capital methodologies. The assessment also considers the possible impacts of approved and proposed regulatory changes that will or may apply to future periods. Key analytical frameworks, which enable the comprehensive assessment of capital adequacy versus unexpected loss, supplement our base case forecast. These supplemental frameworks include integrated stress testing, as well as an internal capital adequacy requirement that builds on internally assessed economic capital requirements. A robust governance framework supports our capital planning process. This process includes capital management policies and procedures that document capital adequacy metrics and limits, as well as our comprehensive capital contingency plan and the active engagement of both the legal-entity boards and senior management in oversight and decision-making.
Forward-looking assessments of capital adequacy for us and for our banking subsidiaries feed development of capital plans that are submitted to the FRBG and other bank regulators. We prepare these plans in full compliance with the FRBG’s Capital Plan Rule and we participate annually in the FRBG’s extensive CCAR review process. In addition to the stress test requirements under CCAR, we also participate in semiannual stress tests required by the Dodd-Frank Act.
In March 2015, the FRBG assessed our current capital plan in response to the CCAR process and issued a notice of non-objection. Unless we choose to file an amended capital plan prior to April 2016, the maximum levels at which we may declare dividends and repurchase shares of our common stock through June 30, 2016 are governed by the proposed capital actions and, are subject to actual financial performance, as well as ongoing compliance with internal governance and all other regulatory requirements.
Capital Transactions
During the year ended December 31, 2015, we completed the following capital actions:
Declared and paid common dividends of $0.10 per share, aggregating to dividend payments of approximately $55 million, $53 million, $53 million and $53 million, respectively, in the first, second, third and fourth quarters of 2015;
Issued 250,000 shares of the 5.500% Fixed-To-Floating Non-cumulative Perpetual Preferred Stock, Series A, on April 6, 2015, with aggregate liquidation value of $250 million and approximately $247 million of net capital value after deduction of fixed issuance costs;
Repurchased 10,473,397 of our outstanding common shares from RBS, on April 7, 2015, at a price of $23.87 per share reducing market and regulatory capital by approximately $250 million;
Issued $250 million aggregate principal amount 4.350% Subordinated Notes due 2025 on July 31, 2015;
Repurchased 9,615,384 of our outstanding common shares from RBS on August 3, 2015, at a price of $26.00 per share reducing market and regulatory capital by approximately $250 million;
Declared a semi-annual dividend of $27.50 per share on the 5.500% fixed-to-floating rate non-cumulative perpetual Series A Preferred Stock, aggregating to approximately $7 million, and paid on October 6, 2015;
Issued $750 million aggregate principal amount 4.300% Subordinated Notes due 2025 on December 3, 2015;
Repurchased $333 million aggregate principal amount of our 4.771% Subordinated Notes due 2023 from RBS, on December 3, 2015;
Repurchased $334 million aggregate principal amount of our 4.691% Subordinated Notes due 2024 from RBS, on December 3, 2015; and
Repurchased $83 million aggregate principal amount of our 4.153% Subordinated Notes due 2024 from RBS, on December 3, 2015.
The direct repurchase of subordinated debt from RBS and the public issuance of subordinated debt during the fourth quarter of 2015 were generally neutral to our total capital level and ratios. The repurchase of common shares and the issuance of subordinated debt during the third quarter of 2015 were neutral to our total capital level and ratios but reduced common equity by $250 million, and the CET1 and tier 1 risk-based ratios by 22 basis points. The repurchase of common shares and the issuance of preferred shares during the second quarter of 2015 were generally neutral to our tier 1 and total capital levels and ratios but reduced common equity by $250 million and the CET1 ratio by approximately 23 basis points.
We intend to continue to repurchase common stock and subordinated debt, as appropriate, subject to regulatory approval and market conditions.
At December 31, 2015, all regulatory ratios remained well above their respective fully phased-in Basel III minimum, which includes the capital conservation buffer for the risk-based ratios. Fully phased-in regulatory ratios are non-GAAP financial measures. For more information on computation of these non-GAAP financial measures, see “—Principal Components of
CITIZENS FINANCIAL GROUP, INC.
MANAGEMENT’S DISCUSSION AND ANALYSIS
Operations and Key Performance Metrics Used By Management — Key Performance Metrics and Non-GAAP Financial Measures,”
Banking Subsidiaries’ Capital
The following table presents our banking subsidiaries’ capital ratios under Basel I as of December 31, 2014 and Basel III Standardized Transitional rules as of December 31, 2015:
|
| | | | | | | | | | | |
| | Transitional Basel III | | Basel I |
| | December 31, 2015 | | December 31, 2014 |
| (dollars in millions) | Amount |
| Ratio | | Amount |
| Ratio |
| Citizens Bank, N.A. | | | | | |
Common equity tier 1 capital (1) |
| $10,754 |
| 11.7 | % | | Not Applicable | Not Applicable |
Tier 1 capital(2) | 10,754 |
| 11.7 |
| |
| $10,406 |
| 12.2 | % |
Total capital(3) | 13,132 |
| 14.3 |
| | 12,584 |
| 14.8 |
|
Tier 1 leverage(4) | 10,754 |
| 10.7 |
| | 10,406 |
| 10.9 |
|
| Risk-weighted assets | 91,625 |
| | | | |
| Quarterly adjusted average assets | 100,504 |
| | | | |
| Citizens Bank of Pennsylvania | | | | | |
Common equity tier 1 capital(1) |
| $3,017 |
| 13.0 | % | | Not Applicable | Not Applicable |
Tier 1 capital(2) | 3,017 |
| 13.0 |
| |
| $2,967 |
| 14.1 | % |
Total capital(3) | 3,559 |
| 15.4 |
| | 3,494 |
| 16.6 |
|
Tier 1 leverage(4) | 3,017 |
| 9.1 |
| | 2,967 |
| 9.5 |
|
| Risk-weighted assets | 23,179 |
| | | | |
| Quarterly adjusted average assets | 33,045 |
| | | | |
(1) Basel III introduced the concept of CET I effective January 1, 2015. “Common equity tier 1 capital ratio” as of December 31, 2015 represents CET1 divided by total risk-weighted assets as defined under Basel III Standardized approach.
(2) “Tier 1 capital ratio” is tier 1 capital, which includes CET1 capital plus non-cumulative perpetual preferred equity that qualifies as additional tier 1 capital, divided by total risk-weighted assets as defined under Basel III Standardized approach. The “tier 1 capital ratio” reported prior to January 1, 2015, represented tier 1 capital divided by total risk-weighted assets as defined under the Basel I general risk-based capital rule.
(3) “Total capital ratio” is total capital divided by total risk-weighted assets as defined under Basel III Standardized approach. The “Total capital ratio” reported prior to January 1, 2015, represented total capital divided by total risk-weighted assets as defined under the Basel I general risk-based capital rule.
(4) “Tier 1 leverage ratio” is tier 1 capital divided by quarterly average total assets as defined under Basel III Standardized approach. The “tier 1 leverage ratio” reported prior to January 1, 2015, represented tier 1 capital divided by quarterly average total assets as defined under the Basel I general risk-based capital rule.
CBNA CET1 capital under Basel III Standardized Transitional rules was $10.8 billion at December 31, 2015, an increase of $348 million from tier 1 common equity under Basel I at December 31, 2014. The increase was primarily attributable to net income for the year ended December 31, 2015, net of dividends paid to CFG. At December 31, 2015, CBNA held minimal additional tier 1 capital. Total capital was $13.1 billion at December 31, 2015, an increase of $548 million driven primarily by the increase in CET1 capital.
On January 1, 2015, CBNA began reporting risk-weighted assets based on Basel III Standardized Transitional rules. The conversion from Basel I rules resulted in a $2.0 billion increase in RWAs as of December 31, 2014. This increase was primarily driven by risk weight changes for securitizations, commercial past due and nonaccruals, off-balance sheet commitments with an original maturity one year or less and the removal of the cap on OTC derivatives.
CBNA risk-weighted assets based on Basel III Standardized Transitional rules at December 31, 2015 were $91.6 billion, an increase of $6.3 billion as compared to December 31, 2014. The primary drivers for this change were the adoption of the Basel III Standardized approach, as well as growth in commercial, student and consumer auto loan exposures. These increases were partially offset by run off in home lending exposures.
As of December 31, 2015, the CBNA tier 1 leverage ratio decreased approximately 18 basis points, driven by an increase in adjusted quarterly average total assets of $4.9 billion resulting in a 54 basis point decline in the ratio, partially offset by a 36 basis point increase for higher CET1 capital described above.
CBPA CET1 capital under Basel III Standardized Transitional rules was $3.0 billion at December 31, 2015, an increase of $50 million from tier 1 common equity under Basel I at December 31, 2014. The increase was primarily attributable to amortization of deferred tax related to goodwill, as net income for the year ended December 31, 2015, net of dividends paid to CFG, was flat compared to 2014. At December 31, 2015, there was no additional tier 1 capital. Total capital was $3.6 billion at December 31, 2015, an increase of $65 million driven primarily by the increase in CET1 capital and a slight increase in allowance for credit losses.
CITIZENS FINANCIAL GROUP, INC.
MANAGEMENT’S DISCUSSION AND ANALYSIS
On January 1, 2015, CBPA began reporting risk-weighted assets based on Basel III Standardized Transitional rules. The conversion from Basel I rules resulted in a $705 million increase in RWAs as of December 31, 2014. This increase was primarily driven by risk-weight changes for off-balance sheet commitments with an original maturity one year or less, securitizations and the removal of the cap on OTC derivatives.
CBPA risk-weighted assets based on Basel III Standardized Transitional rules at December 31, 2015 were $23.2 billion, an increase of $2.1 billion as compared to December 31, 2014. The primary drivers for this change were the adoption of the Basel III Standardized approach, as well as growth in commercial, student loans and purchased auto loan exposures.
As of December 31, 2015, the CBPA tier 1 leverage ratio decreased approximately 37 basis points, driven by an increase in adjusted quarterly average total assets of $1.8 billion resulting in a 52 basis point decline in the ratio, partially offset by a 15 basis point increase resulting from higher CET1 capital described above.
Liquidity
We define liquidity as an institution’s ability to meet its cash-flow and collateral obligations in a timely manner, at a reasonable cost. An institution must maintain current liquidity to fund its daily operations and forecasted cash-flow needs as well as contingent liquidity to deliver funding in a stress scenario. We consider the effective and prudent management of liquidity to be fundamental to our health and strength.
We manage liquidity at the consolidated enterprise level and at each material legal entity, including us, CBNA and CBPA.
CFG Liquidity
Our primary sources of cash are (i) dividends and interest received from our banking subsidiaries as a result of investing in bank equity and subordinated debt and (ii) externally issued subordinated debt. Our uses of liquidity include the following: (i) routine cash flow requirements as a bank holding company, including payments of dividends, interest and expenses; (ii) needs of subsidiaries, including our banking subsidiaries, for additional equity and, as required, their needs for debt financing; and (iii) extraordinary requirements for cash.
On July 31, 2015, we issued $250 million aggregate principal amount 4.350% Subordinated Notes due 2025 in a public underwritten offering. We used the net proceeds of this offering to repurchase 9,615,384 shares of our outstanding common stock directly from RBS at $26.00 per share.
Our cash and cash equivalents represent a source of liquidity that can be used to meet various needs. As of December 31, 2015, we held cash and cash equivalents of approximately $400 million, which should be viewed as a liquidity reserve.
Our liquidity risk is low for the following reasons: (i) we have no material non-banking subsidiaries, and our banking subsidiaries are self-funding; (ii) we have no outstanding senior debt at the CFG level; (iii) the capital structures of our banking subsidiaries are similar to our capital structure. As of December 31, 2015, our double leverage ratio (the combined equity of our subsidiaries divided by our equity) was 101.4%; and, (iv) our other cash flow requirements, such as operating expenses, are relatively small.
Banking Subsidiaries’ Liquidity
In the ordinary course of business, the liquidity of CBNA and CBPA is managed by matching sources and uses of cash. The primary sources of bank liquidity include (i) deposits from our consumer and commercial franchise customers; (ii) payments of principal and interest on loans and debt securities; and (iii) wholesale borrowings, as needed, and as described under “—Liquidity Risk Management and Governance.” The primary uses of bank liquidity include (i) withdrawals and maturities of deposits; (ii) payment of interest on deposits; (iii) funding of loan commitments; and (iv) funding of securities purchases. To the extent that the banks have relied on wholesale borrowings, uses also include payments of related principal and interest.
Our banking subsidiaries’ major businesses involve taking deposits and making loans. Hence, a key role of liquidity management is to ensure that customers have timely access to funds from deposits and loans. Liquidity management also involves maintaining sufficient liquidity to repay wholesale borrowings, pay operating expenses and support extraordinary funding requirements when necessary.
From an external issuance perspective, during 2014, we created a $3.0 billion Global Note Program for CBNA. On December 3, 2015, CBNA issued $750 million in three-year fixed-rate senior notes under this program. This debt represents a key source of unsecured, term, and stable funding, further diversifies the funding sources of CBNA, and creates a more peer-like funding structure for the consolidated enterprise. Additionally, on December 1, 2014, CBNA issued $1.5 billion in senior notes under this program, consisting of $750 million of three-year fixed-rate notes and $750 million in five-year fixed-rate notes.
CITIZENS FINANCIAL GROUP, INC.
MANAGEMENT’S DISCUSSION AND ANALYSIS
Liquidity Risk
We define liquidity risk as the risk that an entity will be unable to meet our payment obligations in a timely manner. We manage liquidity risk at the consolidated enterprise level, and for each material legal entity including us, CBNA and CBPA. Liquidity risk can arise due to contingent liquidity risk and/or funding liquidity risk.
Contingent liquidity risk is the risk that market conditions may reduce an entity’s ability to liquidate, pledge and/or finance certain assets and thereby substantially reduce the liquidity value of such assets. Drivers of contingent liquidity risk include general market disruptions as well as specific issues regarding the credit quality and/or valuation of a security or loan, issuer or borrower and/or asset class.
Funding liquidity risk is the risk that market conditions and/or entity-specific events may reduce an entity’s ability to raise funds from depositors and/or wholesale market counterparties. Drivers of funding liquidity risk may be idiosyncratic or systemic, reflecting impediments to operations and/or undermining of market confidence.
Factors Affecting Liquidity
Given the composition of their assets and borrowing sources, contingent liquidity at both CBNA and CBPA would be materially affected by such events as deterioration of financing markets for high-quality securities (e.g., mortgage-backed securities and other instruments issued by the GNMA, FNMA and the FHLMC), by any inability of the FHLBs to provide collateralized advances and/or by a refusal of the FRB to act as lender of last resort in systemic stress. Given the quality of our unencumbered securities, the positive track record of the FHLBs in stress and the commitment of the FRB to continue as lender of last resort in systemic stress scenarios, we view contingent liquidity risk at our banking subsidiaries, both CBNA and CBPA, to be relatively modest, given the size and configuration of their respective balance sheets.
Given the structure of their balance sheets, funding liquidity of CBNA and CBPA would be materially affected by an adverse idiosyncratic event (e.g., a major loss, causing a perceived or actual deterioration in its financial condition), an adverse systemic event (e.g., default or bankruptcy of a significant capital markets participant), or a combination of both (e.g., the financial crisis of 2008-2010). However, during the financial crisis, our banking subsidiaries reduced their dependence on unsecured wholesale funding to virtually zero. Consequently, and despite ongoing exposure to a variety of idiosyncratic and systemic events, we view our funding liquidity risk to be relatively modest.
An additional variable affecting our access, and the access of our banking subsidiaries, to unsecured wholesale market funds and to large denomination (i.e., uninsured) customer deposits is the credit ratings assigned by such agencies as Moody’s, Standard & Poor’s and Fitch. The following table presents our credit ratings:
|
| | | | | | |
| | December 31, 2015 |
| | Moody’s | | Standard and Poor’s | | Fitch |
|
| Citizens Financial Group, Inc.: | | | | | |
| Long-term issuer | NR | | BBB+ | | BBB+ |
| Short-term issuer | NR | | A-2 | | F2 |
| Subordinated debt | NR | | BBB | | BBB |
| Preferred Stock | NR | | BB+ | | BB- |
| Citizens Bank, N.A.: | | | | | |
| Long-term issuer | Baa1 | | A- | | BBB+ |
| Short-term issuer | NR | | A-2 | | F2 |
| Long-term deposits | A1 | | NR | | A- |
| Short-term deposits | P-1 | | NR | | F2 |
| Citizens Bank of Pennsylvania: | | | | | |
| Long-term issuer | Baa1 | | A- | | BBB+ |
| Short-term issuer | NR | | A-2 | | F2 |
| Long-term deposits | A1 | | NR | | A- |
| Short-term deposits | P-1 | | NR | | F2 |
| NR = Not rated | | | | | |
Changes in our public credit ratings could affect both the cost and availability of our wholesale funding. As a result and in order to maintain a conservative funding profile, our banking subsidiaries continue to minimize reliance on unsecured wholesale funding. At December 31, 2015, the majority of wholesale funding consisted of secured borrowings primarily FHLB advances secured primarily by high-quality residential loan collateral. Our dependence on short-term, unsecured and credit-sensitive funding continues to be relatively low.
CITIZENS FINANCIAL GROUP, INC.
MANAGEMENT’S DISCUSSION AND ANALYSIS
Existing and evolving regulatory liquidity requirements represent another key driver of systemic liquidity conditions and liquidity management practices. The FRBG evaluates our liquidity as part of the supervisory process, and the Federal Reserve Board recently issued regulations that will require us to conduct regular liquidity stress testing over various time horizons and to maintain a buffer of highly liquid assets sufficient to cover expected net cash outflows and projected loss or impairment of funding sources for a short-term liquidity stress scenario. In addition, the Basel Committee has developed a set of internationally-agreed upon quantitative liquidity metrics: the LCR and the NSFR.
The LCR was developed to ensure banks have sufficient high-quality liquid assets to cover expected net cash outflows over a 30-day liquidity stress period. In September 2014, the U.S. federal banking regulators published the final rule to implement the LCR. This rule also introduced a modified version of the LCR in the United States, which generally applies to BHCs not active internationally (institutions with less than $10 billion of on-balance sheet foreign exposure), with total assets of greater than $50 billion but less than $250 billion. Under this definition, we are designated as a modified LCR company. As compared to the Basel Committee’s version of the LCR, the version of the LCR issued by the U.S. federal banking regulators includes a narrower definition of high-quality liquid assets, different prescribed cash inflow and outflow assumptions for certain types of instruments and transactions and a shorter phase-in schedule that began on January 1, 2015 and ends on January 1, 2017. Notably, as a modified LCR company, we were required to be 90% compliant beginning in January 2016, and 100% compliant beginning in January 2017. Achieving sustainable LCR compliance may require changes in the size and/or composition of our investment portfolio, the configuration of our discretionary wholesale funding portfolio, and our average cash position. We were compliant with the LCR as of December 31, 2015, and we were fully compliant with the LCR as of the required implementation date of January 2016.
The NSFR was developed to provide a sustainable maturity structure of assets and liabilities and has a time horizon of one year. The Basel Committee contemplates that the NSFR, including any revisions, will be implemented as a minimum standard by January 1, 2018; however, the U.S. federal banking regulators have not yet published a proposed rule to implement the NSFR in the United States.
We continue to review and monitor these liquidity requirements to develop appropriate implementation plans and liquidity strategies. We expect to be fully compliant with the final rules on or prior to the applicable effective date.
Liquidity Risk Management and Governance
Liquidity risk is measured and managed by the Funding and Liquidity Unit within our Treasury unit in accordance with policy guidelines promulgated by our Board and the Asset and Liability Management Committee. In managing liquidity risk, the Funding and Liquidity Unit delivers regular and comprehensive reporting, including current levels versus threshold limits for a broad set of liquidity metrics, explanatory commentary relating to emerging risk trends and, as appropriate, recommended remedial strategies.
The mission of our Funding and Liquidity Unit is to deliver prudent levels of current, projected and contingent liquidity from stable sources, in a timely manner and at a reasonable cost, without significant adverse consequences.
We seek to accomplish this mission by funding loans with stable deposits; by prudently controlling dependence on wholesale funding, particularly short-term unsecured funding; and by maintaining ample available liquidity, including a contingent liquidity buffer of unencumbered high-quality loans and securities.
As of December 31, 2015:
Core deposits, including loans and deposits held for sale, continued to be our primary source of funding and our consolidated year-end loan-to-deposit ratio was 96.9%;
Short-term unsecured wholesale funding was $527 million, substantially offset by our net overnight position (which is defined as excess cash balances held at the Federal Reserve Banks plus federal funds sold minus federal funds purchased) of $2.0 billion;
Contingent liquidity was $23.1 billion; net overnight position (defined above), totaled $2.0 billion; unencumbered liquid securities totaled $17.0 billion; and available FHLB capacity primarily secured by mortgage loans totaled $4.1 billion; and
Available discount window capacity, defined as available total borrowing capacity from the Federal Reserve based on identified collateral, is secured by non-mortgage commercial and consumer loans and totaled $11.0 billion. Use of this borrowing capacity would likely be considered only during exigent circumstances.
CITIZENS FINANCIAL GROUP, INC.
MANAGEMENT’S DISCUSSION AND ANALYSIS
The Funding and Liquidity Unit monitors a variety of liquidity and funding metrics, including specific risk threshold limits. The metrics are broadly classified as follows:
Current liquidity sources and capacities, including excess cash at the Federal Reserve Banks, free and liquid securities and available and secured FHLB borrowing capacity;
Contingent stressed liquidity, including idiosyncratic, systemic and combined stress scenarios, in addition to evolving regulatory requirements such as the LCR and the NSFR; and
Current and prospective exposures, including secured and unsecured wholesale funding and spot and cumulative cash-flow gaps across a variety of horizons.
Further, certain of these metrics are monitored for each of us, our banking subsidiaries, and for our consolidated enterprise on a daily basis, including net overnight position, unencumbered securities, internal liquidity, available FHLB borrowing capacity and total contingent liquidity. In order to identify emerging trends and risks and inform funding decisions, specific metrics are also forecasted over a one-year horizon.
Cash flows from operating activities contributed $1.2 billion in 2015. Net cash used by investing activities was $5.9 billion, primarily reflecting net securities available for sale portfolio purchases of $6.8 billion and a net increase in loans and leases of $6.0 billion, partially offset by proceeds from maturities, paydowns and sales of securities available for sale of $7.3 billion. Cash provided by financing activities was $4.5 billion, driven by a net increase in deposits of $6.8 billion and proceeds from long-term borrowed funds of $6.8 billion, partially offset by a decrease in federal funds purchased and securities sold under agreement to repurchase of $3.5 billion, a decrease in other short-term borrowed funds of $4.4 billion and repayments of long-term borrowed funds of $766 million. These activities represented a cumulative decrease in cash and cash equivalents of $191 million, which, when added to the cash and cash equivalents balance of $3.3 billion at the beginning of the year, resulted in an ending balance of cash and cash equivalents of $3.1 billion as of December 31, 2015.
For the year ended December 31, 2014, our operating activities contributed $1.4 billion in net cash, including an increase in other liabilities, which added $239 million, and an increase in depreciation, amortization and accretion, which added $386 million, partially offset by an increase in other assets of $295 million and a gain on sale of deposits of $286 million. For the year ended December 31, 2014, net cash used by investing activities was $10.3 billion, primarily reflecting net securities available for sale portfolio purchases of $8.3 billion, a net increase in loans and leases of $6.9 billion and securities held to maturity portfolio purchases of $1.2 billion, partially offset by proceeds from maturities, paydowns and sales of securities available for sale of $6.3 billion. Cash provided by financing activities was $9.4 billion, including a net increase in other short-term borrowed funds of $4.0 billion and a net increase in deposits of $3.8 billion. These activities represented a cumulative increase in cash and cash equivalents of $519 million, which, when added to the cash and cash equivalents balance of $2.8 billion at the beginning of the year, resulted in an ending balance of cash and cash equivalents of $3.3 billion as of December 31, 2014.
Contractual Obligations
The following table presents our outstanding contractual obligations as of December 31, 2015:
|
| | | | | | | | | | | | | | | |
| (in millions) | Total |
| Less than 1 year |
| 1 to 3 years |
| 3 to 5 years |
| After 5 years |
|
Long-term borrowed funds (1) |
| $9,886 |
|
| $— |
|
| $6,517 |
|
| $755 |
|
| $2,614 |
|
| Operating lease obligations | 817 |
| 190 |
| 298 |
| 149 |
| 180 |
|
Term deposits (1) | 12,024 |
| 9,994 |
| 1,737 |
| 287 |
| 6 |
|
Purchase obligations (2) | 675 |
| 491 |
| 79 |
| 48 |
| 57 |
|
| Total outstanding contractual obligations |
| $23,402 |
|
| $10,675 |
|
| $8,631 |
|
| $1,239 |
|
| $2,857 |
|
(1) Deposits and borrowed funds exclude interest.
(2) Includes purchase obligations for goods and services covered by non-cancelable contracts and contracts including cancellation fees.
CITIZENS FINANCIAL GROUP, INC.
MANAGEMENT’S DISCUSSION AND ANALYSIS
Off-Balance Sheet Commitments
The following table presents our outstanding off-balance sheet commitments. See Note 17 “Commitments and Contingencies” to our audited Consolidated Financial Statements in Part II, Item 8 — Financial Statements and Supplementary Data, included elsewhere in this report:
|
| | | | | | | | | | | | | | |
| | December 31, | | | | |
| (dollars in millions) | 2015 |
| | 2014 |
| | Change |
| | Percent |
|
| Commitment amount: | | | | | | | |
| Undrawn commitments to extend credit |
| $56,524 |
| |
| $55,899 |
| |
| $625 |
| | 1 | % |
| Financial standby letters of credit | 2,010 |
| | 2,315 |
| | (305 | ) | | (13 | ) |
| Performance letters of credit | 42 |
| | 65 |
| | (23 | ) | | (35 | ) |
| Commercial letters of credit | 87 |
| | 75 |
| | 12 |
| | 16 |
|
| Marketing rights | 47 |
| | 51 |
| | (4 | ) | | (8 | ) |
| Risk participation agreements | 26 |
| | 19 |
| | 7 |
| | 37 |
|
| Residential mortgage loans sold with recourse | 10 |
| | 11 |
| | (1 | ) | | (9 | ) |
| Total |
| $58,746 |
| |
| $58,435 |
| |
| $311 |
| | 1 | % |
In November 2015, the Company entered into an agreement with RBS to purchase $500 million of its subordinated notes held by RBS by July 30, 2016, subject to regulatory approval and rating agency considerations. See Note 19 “Related Party Transactions and Significant Transactions with RBS,” to our audited Consolidated Financial Statements in Part II, Item 8 — Financial Statements and Supplementary Data, included elsewhere in this report.
In June 2015, we amended our agreement originally entered into in May 2014, to purchase automobile loans on a quarterly basis in future periods. Commencing on the effective date and through July 31, 2015, the amended agreement requires the purchase of a minimum of $250 million of outstanding balances to a maximum of $600 million per quarterly period. For quarterly periods on or after August 1, 2015, the minimum and maximum purchases are $50 million and $200 million, respectively. The agreement automatically renews until terminated by either party. We may cancel the agreement at will with payment of a variable termination fee. After three years, there is no termination fee.
On January 7, 2016, the Company entered into an agreement to purchase student loans on a quarterly basis beginning with the first calendar quarter in 2016 and ending with the fourth calendar quarter in 2016. Under the terms of the agreement, the Company committed to purchase a minimum of $125 million of loans per quarter. The minimum and maximum amount of the aggregate purchase principal balance of loans under the terms of the agreement are $500 million and $1 billion, respectively. The agreement will terminate immediately if at any time during its term the aggregate purchase principal balance of loans equals the maximum amount. The agreement may be extended by written agreement of the parties for an additional four quarters. The Company may terminate the agreement at will with payment of a termination fee equal to the product of $1 million times the number of calendar quarters remaining in the term.
Critical Accounting Estimates
Our audited Consolidated Financial Statements, which are included elsewhere in this report, are prepared in accordance with GAAP. The preparation of financial statements in conformity with GAAP requires us to establish accounting policies and make estimates that affect amounts reported in our audited Consolidated Financial Statements.
An accounting estimate requires assumptions and judgments about uncertain matters that could have a material effect on our audited Consolidated Financial Statements. Estimates are made using facts and circumstances known at a point in time. Changes in those facts and circumstances could produce results substantially different from those estimates. The most significant accounting policies and estimates and their related application are discussed below.
See Note 1 “Significant Accounting Policies” to our audited Consolidated Financial Statements in Part II, Item 8 — Financial Statements and Supplementary Data, included elsewhere in this report, for further discussion of our significant accounting policies.
CITIZENS FINANCIAL GROUP, INC.
MANAGEMENT’S DISCUSSION AND ANALYSIS
Allowance for Credit Losses
Management’s estimate of probable losses in our loan and lease portfolios including unfunded lending commitments is recorded in the ALLL and the reserve for unfunded lending commitments, at levels that we believe to be appropriate as of the balance sheet date. Our determination of such estimates is based on a periodic evaluation of the loan and lease portfolios and unfunded credit facilities, as well as other relevant factors. This evaluation is inherently subjective and requires significant estimates and judgments of underlying factors, all of which are susceptible to change.
The ALLL and reserve for unfunded lending commitments could be affected by a variety of internal and external factors. Internal factors include portfolio performance such as delinquency levels, assigned risk ratings, the mix and level of loan balances, differing economic risks associated with each loan category and the financial condition of specific borrowers. External factors include fluctuations in the general economy, unemployment rates, bankruptcy filings, developments within a particular industry, changes in collateral values and factors particular to a specific commercial credit such as competition, business and management performance. The ALLL may be adjusted to reflect our current assessment of various qualitative risks, factors and events that may not be measured in our statistical procedures. There is no certainty that the ALLL and reserve for unfunded lending commitments will be appropriate over time to cover losses because of unanticipated adverse changes in any of these internal, external or qualitative factors.
The evaluation of the adequacy of the commercial, commercial real estate, and lease ALLL and reserve for unfunded lending commitments is primarily based on risk rating models that assess probability of default, loss given default and exposure at default on an individual loan basis. The models are primarily driven by individual customer financial characteristics and are validated against historical experience. Additionally, qualitative factors may be included in the risk rating models. After the aggregation of individual borrower incurred loss, additional overlays can be made based on back-testing against historical losses and forward loss curve ratios.
For nonaccruing commercial and commercial real estate loans with an outstanding balance of $3 million or greater and for all commercial and commercial real estate TDRs (regardless of size), we conduct specific analysis on a loan level basis to determine the probable amount of credit loss. If appropriate, a specific ALLL is established for the loan through a charge to the provision for credit losses. For all classes of impaired loans, individual loan measures of impairment may result in a charge-off to the ALLL, if deemed appropriate. In such cases, the provision for credit losses is not affected when a specific reserve for at least that amount already exists. Techniques utilized include comparing the loan’s carrying amount to the estimated present value of its future cash flows, the fair value of its underlying collateral, or the loan’s observable market price. The technique applied to each impaired loan is based on the workout officer’s opinion of the most probable workout scenario. Historically, this has generally led to the use of the estimated present value of future cash flows approach. The fair value of underlying collateral will be used if the loan is deemed collateral dependent. For loans that use the fair value of underlying collateral approach, a charge-off assessment is performed quarterly to write the loans down to fair value.
For most non-impaired retail loan portfolio types, the ALLL is based upon the incurred loss model utilizing the PD, LGD and exposure at default on an individual loan basis. When developing these factors, we may consider the loan product and collateral type, LTV ratio, lien position, borrower’s credit, time outstanding, geographic location, delinquency status and incurred loss period. Incurred loss periods are reviewed and updated at least annually, and potentially more frequently when economic situations change rapidly, as they tend to fluctuate with economic cycles. Incurred loss periods are generally longer in good economic times and shorter in bad times. Certain retail portfolios, including SBO home equity loans, student loans, and credit card receivables utilize roll rate models to estimate the ALLL. For the portfolios measured using the incurred loss model, roll rate models are also used to support management overlays if deemed necessary.
For home equity lines and loans, a number of factors impact the PD. Specifically, the borrower’s current FICO score, the utilization rate, delinquency statistics, borrower income, current CLTV ratio and months on books are all used to assess the borrower’s creditworthiness. Similarly, the loss severity is also impacted by various factors, including the utilization rate, the CLTV ratio, the lien position, the Housing Price Index change for the location (as measured by the Case-Shiller index), months on books and current loan balance.
When we are not in a first lien position, we use delinquency information on the first lien exposures obtained from third-party credit information providers in the credit assessment. For all first liens, whether owned by a third party or by us, an additional assessment is performed on a quarterly basis. In this assessment, the most recent three months’ performance of the senior liens is reviewed for delinquency (90 days or more past due), modification, foreclosure and/or bankruptcy statuses. If any derogatory status is present, the junior lien will be placed on nonaccrual status regardless of its delinquency status on our books. This subsequent change to nonaccrual status will alter the treatment in the PD model, thus affecting the reserve calculation.
In addition, the first lien exposure is combined with the second lien exposure to generate a CLTV. The CLTV is a more accurate reflection of the leverage of the borrower against the property value, as compared to the LTV from just the junior lien(s). The CLTV is used for modeling both the junior lien PD and LGD. This also impacts the ALLL rates for the junior lien HELOCs.
CITIZENS FINANCIAL GROUP, INC.
MANAGEMENT’S DISCUSSION AND ANALYSIS
The above measures are all used to assess the PD and LGD for HELOC borrowers for whom we originated the loans. There is also a portfolio of home equity products that were originated and serviced by others; however, we currently service some of the loans in this portfolio. The SBO portfolio is modeled as a separate class and the reserves for this class are generated by using the delinquency roll rate models as described below.
For retail TDRs that are not collateral-dependent, allowances are developed using the present value of expected future cash flows, compared to the recorded investment in the loans. Expected re-default factors are considered in this analysis. Retail TDRs that are deemed collateral-dependent are written down to the fair market value of the collateral less costs to sell. The fair value of collateral is periodically monitored subsequent to the modification.
Changes in the levels of estimated losses, even if minor, can significantly affect management’s determination of an appropriate ALLL. For consumer loans, losses are affected by such factors as loss severity, collateral values, economic conditions, and other factors. A 1% and 5% increase in the estimated loss rate for consumer loans at December 31, 2015 would have increased the ALLL by $5 million and $26 million, respectively. The ALLL for our Commercial Banking segment is sensitive to assigned credit risk ratings and inherent loss rates. If 10% and 20% of the December 31, 2015 year end loan balances (including unfunded commitments) within each risk rating category of our Commercial Banking segment had experienced downgrades of two risk categories, the ALLL would have increased by $36 million and $72 million, respectively.
Commercial loans and leases are charged off to the ALLL when there is little prospect of collecting either principal or interest. Charge-offs of commercial loans and leases usually involve receipt of borrower-specific adverse information. For commercial collateral-dependent loans, an appraisal or other valuation is used to quantify a shortfall between the fair value of the collateral less costs to sell and the recorded investment in the commercial loan. Retail loan charge-offs are generally based on established delinquency thresholds rather than borrower-specific adverse information. When a loan is collateral-dependent, any shortfalls between the fair value of the collateral less costs to sell and the recorded investment is promptly charged off. Placing any loan or lease on nonaccrual status does not by itself require a partial or total charge-off; however, any identified losses are charged off at that time.
For additional information regarding the ALLL and reserve for unfunded lending commitments, see Note 1 “Significant Accounting Policies” and Note 5 “Allowance for Credit Losses, Nonperforming Assets and Concentrations of Credit Risk” to our audited Consolidated Financial Statements in Part II, Item 8 — Financial Statements and Supplementary Data, included elsewhere in this report.
Fair Value
We measure fair value using the price that would be received to sell an asset or paid to transfer a liability in an orderly transaction between market participants at the measurement date. Fair value is based upon quoted market prices in an active market, where available. If quoted prices are not available, observable market-based inputs or independently sourced parameters are used to develop fair value, whenever possible. Such inputs may include prices of similar assets or liabilities, yield curves, interest rates, prepayment speeds and foreign exchange rates.
We classify our assets and liabilities that are carried at fair value in accordance with the three-level valuation hierarchy:
Level 1. Quoted prices (unadjusted) in active markets for identical assets or liabilities;
Level 2. Observable inputs other than Level 1 prices, such as quoted prices for similar instruments; quoted prices in markets that are not active; or other inputs that are observable or can be corroborated by market data for substantially the full term of the asset or liability; and
Level 3. Unobservable inputs that are supported by little or no market information and that are significant to the fair value measurement.
Classification in the hierarchy is based upon the lowest level input that is significant to the fair value measurement of the asset or liability. For instruments classified in Level 1 and 2 where inputs are primarily based upon observable market data, there is less judgment applied in arriving at the fair value. For instruments classified in Level 3, management judgment is more significant due to the lack of observable market data.
Significant assets measured at fair value on a recurring basis include our mortgage-backed securities available for sale. These instruments are priced using an external pricing service and are classified as Level 2 within the fair value hierarchy. The service’s pricing models use predominantly observable valuation inputs to measure the fair value of these securities under both the market and income approaches. The pricing service utilizes a matrix pricing methodology to price our U.S. agency pass-through securities, which involves making adjustments to to-be-announced security prices based on a matrix of various mortgage-backed securities characteristics such as weighted-average maturities, indices and other pool-level information. Other agency and non-agency mortgage-backed securities are priced using a discounted cash flow methodology. This methodology includes estimating the cash flows expected to be received for each security using projected prepayment speeds and default rates based on historical
CITIZENS FINANCIAL GROUP, INC.
MANAGEMENT’S DISCUSSION AND ANALYSIS
statistics of the underlying collateral and current market conventions. These estimated cash flows are then discounted using market-based discount rates that incorporate characteristics such as average life, volatility, ratings, performance of the underlying collateral, and prevailing market conditions.
We review and update the fair value hierarchy classifications on a quarterly basis. Changes from one quarter to the next related to the observability of inputs in fair value measurements may result in a reclassification between the fair value hierarchy levels and are recognized based on year-end balances. We also verify the accuracy of the pricing provided by our primary external pricing service on a quarterly basis. This process involves using a secondary external vendor to provide valuations for our securities portfolio for comparison purposes. Any securities with discrepancies beyond a certain threshold are researched and, if necessary, valued by an independent outside broker.
Fair value is also used on a nonrecurring basis to evaluate certain assets for impairment or for disclosure purposes. Examples of nonrecurring uses of fair value include mortgage servicing rights accounted for by the amortization method, loan impairments for certain loans and goodwill.
For additional information regarding our fair value measurements, see Note 1 “Significant Accounting Policies,” Note 3 “Securities,” Note 10 “Mortgage Banking,” and Note 16 “Derivatives” to our audited Consolidated Financial Statements in Part II, Item 8 — Financial Statements and Supplementary Data, included elsewhere in this report.
Goodwill
Goodwill is an asset that represents the future economic benefits arising from other assets acquired in a business combination that are not individually identified and separately recognized. Goodwill is not amortized, but is subject to annual impairment tests. Goodwill is assigned to reporting units at the date the goodwill is initially recorded. A reporting unit is a business operating segment or a component of a business operating segment. Once goodwill has been assigned to reporting units, it no longer retains its association with a particular acquisition, and all of the activities within a reporting unit, whether acquired or organically grown, are available to support the value of the goodwill.
The goodwill impairment analysis is a two-step test. The first step, used to identify potential impairment, involves comparing each reporting unit’s fair value to its carrying value including goodwill. If the fair value of a reporting unit exceeds its carrying value, applicable goodwill is deemed to be not impaired. If the carrying value exceeds fair value, there is an indication of impairment and the second step is performed to measure the amount of impairment.
The second step involves calculating an implied fair value of goodwill for each reporting unit for which the first step indicated impairment. The implied fair value of goodwill is determined in the same manner as the amount of goodwill recognized in a business combination, which is the excess of the fair value of the reporting unit, as determined in the first step, over the aggregate fair values of the individual assets, liabilities and identifiable intangible assets as if the reporting unit were being acquired in a business combination. If the implied fair value of goodwill exceeds the carrying value of goodwill assigned to the reporting unit, there is no impairment. If the carrying value of goodwill assigned to a reporting unit exceeds the implied fair value of the goodwill, an impairment charge is recorded for the excess. An impairment loss recognized cannot exceed the amount of goodwill assigned to a reporting unit, and the loss establishes a new basis in the goodwill. Subsequent reversal of goodwill impairment losses is not permitted.
We review goodwill for impairment annually as of October 31 or more often if events or circumstances indicate that it is more likely than not that the fair value of one or more reporting units is below its carrying value. We rely on the income approach (discounted cash flow method) as the primary method for determining fair value. Market-based methods are used as benchmarks to corroborate the value determined by the discounted cash flow method.
We rely on several assumptions when estimating the fair value of our reporting units using the discounted cash flow method. These assumptions include the current discount rate, as well as projected loan losses, income taxes and capital retention rates. Discount rates are estimated based on the Capital Asset Pricing Model, which considers the risk-free interest rate, market risk premium, beta and unsystematic risk and size premium adjustments specific to a particular reporting unit. The discount rates are also calibrated on the assessment of the risks related to the projected cash flows of each reporting unit. Multi-year financial forecasts are developed for each reporting unit by considering several key business drivers such as new business initiatives, customer retention standards, market share changes, anticipated loan and deposit growth, forward interest rates, historical performance and industry and economic trends, among other considerations. The long-term growth rate used in determining the terminal value of each reporting unit was estimated based on management’s assessment of the minimum expected terminal growth rate of each reporting unit, as well as broader economic considerations such as gross domestic product and inflation.
We corroborate the fair value of our reporting units determined by the discounted cash flow method using market-based methods: a comparable company method and a comparable transaction method. The comparable company method measures fair value of a business by comparing it to publicly traded companies in similar lines of business. This involves identifying and selecting the comparable companies based on a number of factors (i.e., size, growth, profitability, risk and return on investment), calculating
CITIZENS FINANCIAL GROUP, INC.
MANAGEMENT’S DISCUSSION AND ANALYSIS
the market multiples (i.e., price-to-tangible book value, price-to-cash earnings and price-to-net income) of these comparable companies and then applying these multiples to our operating results to estimate the value of the reporting unit’s equity on a marketable, minority basis. A control premium is then applied to this value to estimate the fair value of the reporting unit on a marketable, controlling basis. The comparable transaction method measures fair value of a business based on exchange prices in actual transactions and on asking prices for controlling interests in public or private companies currently offered for sale. The process involves comparison and correlation of us with other similar companies. Adjustments for differences in factors described earlier (i.e., size, growth, profitability, risk and return on investment) are also considered.
As a best practice, we also corroborate the fair value of our reporting units determined by the discounted cash flow method by adding the aggregated sum of these fair value measurements to the fair value of our non-segment operations and comparing this total to our observed market capitalization. As part of this process, we analyze the implied control premium to evaluate its reasonableness. All facts and circumstances are considered when completing this analysis, including observed transaction data and any additional external evidence supporting the implied control premium. Since none of our reporting units are publicly traded, individual reporting unit fair value determinations cannot be directly correlated to CFG’s common stock price. The sum of the fair values of the reporting units at October 31, 2015 exceeded the overall market capitalization of CFG as of October 31, 2015. Although we believe it is reasonable to conclude that market capitalization could be an indicator of fair value over time, we do not believe that our current market capitalization reflects the aggregate fair value of our individual reporting units.
The valuation of goodwill is dependent on forward-looking expectations related to the performance of the U.S. economy and our associated financial performance. The prolonged delay in the full recovery of the U.S. economy, and the impact of that delay on earnings expectations, prompted a goodwill impairment test as of June 30, 2013. Although the U.S. economy has demonstrated signs of recovery, notably improvements in unemployment and housing, the pace and extent of recovery in these indicators, as well as in overall gross domestic product, have lagged previous expectations. The impact of the slow recovery is most evident in our Consumer Banking reporting unit. Accordingly, the percentage by which the estimated fair value of our Consumer Banking reporting unit exceeded its carrying value declined from 7% at December 31, 2011 to 5% at December 31, 2012.
During the first half of 2013, we observed further deceleration of expected growth for our Consumer Banking reporting unit’s future profits based on forecasted economic growth for the U.S. economy and the continuing impact of the new regulatory framework in the financial industry. This deceleration was incorporated into our revised earnings forecast in the second quarter of 2013, and we subsequently concluded that there was a likelihood of greater than 50% that goodwill impairment had occurred as of June 30, 2013.
An interim goodwill impairment test was subsequently performed for our Consumer Banking and Commercial Banking reporting units. Step One of these tests indicated that (1) the fair value of our Consumer Banking reporting unit was less than its carrying value by 19% and (2) the fair value of our Commercial Banking reporting unit exceeded its carrying value by 27%. Step Two of the goodwill impairment test was subsequently performed for our Consumer Banking reporting unit, which resulted in the recognition of a pre-tax $4.4 billion impairment charge in our Consolidated Statement of Operations for the period ending June 30, 2013. The impairment charge, which was a non-cash item, had minimal impact on our tier 1 risk-based and total risk-based capital ratios. The impairment charge had no impact on our liquidity position or tangible common equity.
We performed an annual test for impairment of goodwill for both reporting units as of October 31, 2015. As of this testing date, the percentage by which the fair value of our Consumer Banking reporting unit exceeded its carrying value was 6%, and the percentage by which the fair value of our Commercial Banking reporting unit exceeded its carrying value was 8%.
We based the fair value estimates used in our annual goodwill impairment testing on assumptions we believe to be representative of assumptions that a market participant would use in valuing the reporting units but that are unpredictable and inherently uncertain, including estimates of future growth rates and operating margins and assumptions about the overall economic climate and the competitive environment for our reporting units. There can be no assurances that future estimates and assumptions made for purposes of goodwill testing will prove accurate predictions of the future. If the assumptions regarding business plans, competitive environments, market conditions or anticipated growth rates are not achieved, or a market participant view of our total fair value declines, we may be required to record goodwill impairment charges in future periods.
For additional information regarding our goodwill impairment testing, see Note 1 “Significant Accounting Policies,” and Note 9 “Goodwill” to our audited Consolidated Financial Statements in Part II, Item 8 — Financial Statements and Supplementary Data, included elsewhere in this report.
CITIZENS FINANCIAL GROUP, INC.
MANAGEMENT’S DISCUSSION AND ANALYSIS
Income Taxes
Accrued income taxes are reported as a component of either other assets or other liabilities, as appropriate, in the Consolidated Balance Sheets and reflect our estimate of income taxes to be paid or that effectively have been prepaid. Deferred income tax assets and liabilities represent the amount of future income taxes to be paid or that effectively have been prepaid, and the net balance is reported as an asset or liability in the Consolidated Balance Sheets. We determine the realization of the deferred tax asset based upon an evaluation of the four possible sources of taxable income: (1) the future reversals of taxable temporary differences; (2) future taxable income exclusive of reversing temporary differences and carryforwards; (3) taxable income in prior carryback years; and (4) tax planning strategies. In projecting future taxable income, we utilize forecasted pre-tax earnings, adjust for the estimated book tax differences and incorporate assumptions, including the amount of income allocable to taxing jurisdictions. These assumptions require significant judgment and are consistent with the plans and estimates that we use to manage the underlying businesses. The realization of the deferred tax assets could be reduced in the future if these estimates are significantly different than forecasted.
We are subject to income tax in the United States and multiple state and local jurisdictions. The tax laws and regulations in each jurisdiction may be interpreted differently in certain situations, which could result in a range of outcomes. Thus, we are required to exercise judgment regarding the application of these tax laws and regulations. We evaluate and recognize tax liabilities related to any tax uncertainties. Due to the complexity of some of these uncertainties, the ultimate resolution may differ from the current estimate of tax liabilities or refunds.
Our estimate of accrued income taxes, deferred income taxes and income tax expense can also change in any period as a result of new legislative or judicial guidance impacting tax positions, as well as changes in income tax rates. Any changes, if they occur, can be significant to our consolidated financial position, results of operations or cash flows.
For additional information regarding income taxes, see Note 1 “Significant Accounting Policies,” and Note 15 “Income Taxes” to our audited Consolidated Financial Statements in Part II, Item 8 — Financial Statements and Supplementary Data, included elsewhere in this report.
Risk Governance
We are committed to maintaining a strong, integrated and proactive approach to the management of all risks to which we are exposed in pursuit of our business objectives. A key aspect of our Board’s responsibility as the main decision making body is setting our risk appetite to ensure that the levels of risk that we are willing to accept in the attainment of our strategic business and financial objectives are clearly understood.
To enable the Board to carry out its objectives, it has delegated authority for risk management activities, as well as governance and oversight of those activities, to a number of Board and executive management level risk committees. The key committees that specifically consider risk across the enterprise are set out in the diagram below.
CITIZENS FINANCIAL GROUP, INC.
MANAGEMENT’S DISCUSSION AND ANALYSIS
Chief Risk Officer
The CRO directs our overall risk management function overseeing the credit, interest rate , market, liquidity, operational, compliance, strategic and reputational risk management. The CRO reports to our CEO and to the Board Risk Committee.
Risk Framework
Our risk management framework is embedded in our business through a “Three Lines of Defense” model which defines responsibilities and accountabilities.
First Line of Defense
The business lines (including their associated support functions) are the First Line of Defense and are accountable for owning and managing, within our defined risk appetite, the risks which exist in their respective business areas. The business lines are responsible for performing regular risk assessments to identify and assess the material risks that arise in their area of responsibility, complying with relevant risk policies, testing and certifying the adequacy and effectiveness of their controls on a regular basis, establishing and documenting operating procedures and establishing and owning a governance structure for identifying and managing risk.
Second Line of Defense
The Second Line of Defense includes independent monitoring and control functions accountable for developing and ensuring implementation of risk and control frameworks and related policies. This centralized risk function is appropriately independent from the business and is accountable for overseeing and challenging our business lines on the effective management of their risks. This risk function utilizes training, communications and awareness to provide expert support and advice to the business lines. This includes interpreting the risk policy standards and risk management framework, overseeing compliance by the businesses with policies and responsibilities, including providing relevant management information and escalating concerns where appropriate.
The Executive Risk Committee, chaired by the CRO, actively considers our inherent material risks, analyzes our overall risk profile and seeks confirmation that the risks are being appropriately identified, assessed and mitigated.
Third Line of Defense
Our Internal Audit function is the Third Line of Defense providing independent assurance with a view of the effectiveness of Citizens’ internal controls, governance practices, and culture so that risk is managed appropriately for the size, complexity, and risk profile of the organization. Internal Audit has complete and unrestricted access to any and all Bank records, physical properties, and personnel. Internal Audit issues a report following each internal review and provides an audit opinion to Citizens’ Audit Committees on a quarterly basis.
Credit Quality Assurance also reports to the Chief Audit Executive and also provides the Boards, senior management and other stakeholders with independent assurance on the quality of credit portfolios and adherence to agreed Credit Risk Appetite and Credit Policies and processes. In line with its procedures and regulatory expectations, the Credit Quality Assurance function undertakes a program of portfolio testing, assessing and reporting through four Risk Pillars of Asset Quality, Rating and Data Integrity, Risk Management and Credit Risk Appetite.
Risk Appetite
Risk appetite is a strategic business and risk management tool. We define our risk appetite as the maximum limit of acceptable risk beyond which we would either be unable to achieve our strategic objectives and capital adequacy obligations or would assume an unacceptable amount of risk to do so. The Board Risk Committee advises our Board of Directors in relation to current and potential future risk strategies, including determination of risk appetite and tolerance.
The principal non-market risks to which we are subject are: credit risk, operational risk, liquidity risk, strategic risk and reputational risk. We are also subject to market risks. Market risk refers to potential losses arising from changes in interest rates, foreign exchange rates, equity prices, commodity prices and/or other relevant market rates or prices. Modest market risk arises from trading activities that serve customer needs, including hedging of interest rate and foreign exchange risk. As described below, more material market risk arises from our non-trading banking activities, such as loan origination and deposit gathering. We have established enterprise-wide policies and methodologies to identify, measure, monitor and report market risk. We actively manage both trading and non-trading market risks. We are also subject to liquidity risk, discussed under “—Liquidity.”
Our risk appetite framework and risk limit structure establishes guidelines to determine the balance between existing and desired levels of risk and supports the implementation, measurement and management of our risk appetite.
CITIZENS FINANCIAL GROUP, INC.
MANAGEMENT’S DISCUSSION AND ANALYSIS
Credit Risk
Overview
Credit risk represents the potential for loss arising from a customer, counterparty, or issuer failing to perform in accordance with the contractual terms of the obligation. While the majority of our credit risk is associated with lending activities, we do engage with other financial counterparties for a variety of purposes including investing, asset and liability management, and trading activities. Given the financial impact of credit risk on our earnings and balance sheet, the assessment, approval, and management of credit risk represents a major part of our overall risk-management responsibility.
Objective
The credit risk management organization is responsible for approving credit transactions, monitoring portfolio performance, identifying problem loans, and ensuring remedial management.
Organizational Structure
Management and oversight of credit risk is the responsibility of both the line of business and the second line of defense. The second line of defense, the independent Credit Risk Function, is led by the Chief Credit Officer who oversees all of our credit risk. The CCO reports to the Chief Risk Officer. The CCO, acting in a manner consistent with Board policies, has responsibility for, among other things, the governance process around policies, procedures, risk acceptance criteria, credit risk appetite, limits, and authority delegation. The CCO and his team also have responsibility for credit approvals for larger or more risky transactions and oversight of line of business credit risk activities. Reporting to the CCO are the heads of the second line of defense credit functions specializing in: Consumer Banking; Business Banking; Commercial Banking; Citizens Restructuring Management; Portfolio Analytics and Reporting; and Credit Policy and Administration. Each team under these leaders is composed of highly experienced credit professionals.
The credit risk teams operate independently from the business lines to ensure decisions are not influenced by unbalanced objectives.
Governance
The primary mechanisms used to govern our credit risk function are our consumer and commercial credit policies. These policies outline the minimum acceptable lending standards that align with our desired risk appetite. Material issues or changes are identified by the individual committees and presented to the Credit Policy Committee, Executive Risk Committee and the Board Risk Committee for approval as appropriate.
Key Management Processes
To ensure credit risks are managed within our risk appetite and business and risk strategies are achieved, we employ a comprehensive and integrated control program. The program’s objective is to proactively (1) identify, (2) measure, (3) monitor, and (4) mitigate existing and emerging credit risks across the credit lifecycle (origination, account management/portfolio management, and loss mitigation and recovery).
Consumer
On the consumer banking side of credit risk, our teams use models to evaluate consumer loans across the lifecycle of the loan. Starting at origination, credit scoring models are used to forecast the probability of default of an applicant. These models are embedded in the loan origination system, which allows for real-time scoring and automated decisions for many of our products. Periodic validations are performed on our purchased and proprietary scores to ensure fit for purpose. When approving customers for a new loan or extension of an existing credit line, credit scores are used in conjunction with other credit risk variables such as affordability, length of term, collateral value, collateral type, and lien subordination.
The origination process is supported by dedicated underwriting teams that reside in the business line. The size of each team depends on the intensity of the approval process as the number of handoffs, documentation, and verification requirements differ substantially depending on the loan product.
To ensure proper oversight of the underwriting teams, lending authority is granted by the second line of defense credit risk function to each underwriter. The amount of delegated authority depends on the experience of the individual. We periodically evaluate the performance of each underwriter and annually reauthorize their delegated authority. Only senior members of the second line of defense credit risk team are authorized to approve significant exceptions to credit policies. It is not uncommon to make exceptions to established policies when compensating factors are present. There are exception limits which, when reached, trigger a comprehensive analysis.
CITIZENS FINANCIAL GROUP, INC.
MANAGEMENT’S DISCUSSION AND ANALYSIS
Once an account is established, credit scores and collateral values are refreshed at regular intervals to allow for proactive identification of increasing or decreasing levels of credit risk. For accounts with contingent liability (revolving feature), credit policies have been developed that leverage the refreshed customer data to determine if a credit line should be increased, decreased, frozen, or closed. Lastly, behavioral modeling, segmentation, and loan modifications are used to cure delinquency, reduce the severity of loss, and maximize recoveries. Our approach to managing credit risk is highly analytical and, where appropriate, is automated, to ensure consistency and efficiency.
The credit risk team is constantly evaluating current and projected economic conditions, internal credit performance in relation to budget and predefined risk tolerances, and current and expected regulatory guidance to determine the optimal balance of expansion and contraction policies. All policy change proposals receive intense scrutiny and discussion prior to approval and implementation. This process ensures decisions are made based on risk-based analytics with full adherence to regulatory requirements.
Commercial
On the commercial banking side of credit risk, the structure is broken into C&I loans and leases and CRE. Within C&I there are separate verticals established for certain specialty products (e.g., asset-based lending, leasing, franchise finance, health care, technology, mid-corporate). A “specialty vertical” is a stand-alone team of industry or product specialists. Substantially all activity that falls under the ambit of the defined industry or product is managed through a specialty vertical when one exists. CRE also operates as a specialty vertical.
Commercial credit risk management begins with defined credit products and policies.
Commercial transactions are subject to individual analysis and approval at origination and, with few exceptions, are subject to a formal annual review requirement. The underwriting process includes the establishment and approval of Credit Grades that confirm the Probability of Default (“PD”) and Loss Given Default (“LGD”). Approval then requires both a business line approver and an independent Credit Approver with the requisite level of delegated authority. The approval level of a particular credit facility is determined by the size of the credit relationship as well as the PD. The checks and balances in the credit process and the independence of the credit approver function are designed to appropriately assess and sanction the level of credit risk being accepted, facilitate the early recognition of credit problems when they occur, and to provide for effective problem asset management and resolution. All authority to grant credit is delegated through the independent Credit Risk function and is closely monitored and regularly updated.
The primary factors considered in commercial credit approvals are the financial strength of the borrower, assessment of the borrower’s management capabilities, cash flows from operations, industry sector trends, type and sufficiency of collateral, type of exposure, transaction structure, and the general economic outlook. While these are the primary factors considered, there are a number of other factors that may be considered in the decision process. In addition to the credit analysis conducted during the approval process at origination and annual review, our Credit Quality Assurance group performs testing to provide an independent review and assessment of the quality of the portfolio and new originations. This group conducts portfolio reviews on a risk-based cycle to evaluate individual loans, validate risk ratings, as well as test the consistency of the credit processes and the effectiveness of credit risk management.
The maximum level of credit exposure to individual credit borrowers is limited by policy guidelines based on the perceived risk of each borrower or related group of borrowers. Concentration risk is managed through limits on industry (sector), loan type (asset class), and loan quality factors. We focus predominantly on extending credit to commercial customers with existing or expandable relationships within our primary markets (for this purpose defined as our 11 state footprint plus contiguous states), although we do engage in lending opportunities outside our primary markets if we believe that the associated risks are acceptable and aligned with strategic initiatives.
Apart from Industrials and CRE (which together make up 30% of the commercial outstandings as of December 31, 2015), there are no material sector concentrations. As of December 31, 2015, our CRE outstandings amounted to 9% of total loans and leases. The Industrial sector includes basic C&I lending focused on general manufacturing. The sector is diversified and not managed as a specialized vertical. Our customers are local to our market and present no significant concentration.
Our credit grading system considers many components that directly correlate to loan quality and likelihood of repayment. Our assessment of a borrower’s credit strength is reflected in our risk ratings for such loans, which are also an integral component of our ALLL methodology. When deterioration in credit strength is noted, a loan becomes subject to Watch Review. The Watch Review process involves senior representatives from the business line portfolio management team, the independent Credit Risk team, and our Citizens Restructuring Management group. As appropriate and consistent with regulatory definitions, the credit may be subject to classification as either Criticized or Classified, which would also trigger a credit rating downgrade. As such, the loan and relationship would be subject to more frequent review.
CITIZENS FINANCIAL GROUP, INC.
MANAGEMENT’S DISCUSSION AND ANALYSIS
Substantially all loans categorized as Classified are managed by Citizens Restructuring Management, a specialized group of credit professionals that handles the day-to-day management of workouts, commercial recoveries, and problem loan sales. Its responsibilities include developing and implementing action plans, assessing risk ratings, determining the appropriateness of specific reserves relating to the loan, accrual status of the loan, and the ultimate collectability of loans in their portfolio.
Market Risk
Market risk refers to potential losses arising from changes in interest rates, foreign exchange rates, equity prices, commodity prices and/or other relevant market rates or prices. Modest market risk arises from trading activities that serve customer needs, including hedging of interest rate and foreign exchange risk. As described below, more material market risk arises from our non-trading banking activities, such as loan origination and deposit-gathering. We have established enterprise-wide policies and methodologies to identify, measure, monitor and report market risk. We actively manage both trading and non-trading market risks.
Non-Trading Risk
We are exposed to market risk as a result of non-trading banking activities. This market risk is composed entirely of interest rate risk, as we have no direct currency or commodity risk and de minimis equity risk. This interest rate risk emerges from the balance sheet after the aggregation of our assets, liabilities and equity. We refer to this non-trading risk embedded in the balance sheet as “structural interest rate risk” or “interest rate risk in the banking book.” Our mortgage servicing rights assets also contain interest rate risk as the value of the fee stream is impacted by the level of long-term interest rates.
A major source of structural interest rate risk is a difference in the repricing of assets, on the one hand, and liabilities and equity, on the other. First, there are differences in the timing of rate changes reflecting the maturity and/or repricing of assets and liabilities. For example, the rate earned on a residential mortgage may be fixed for 30 years; the rate paid on a certificate of deposit may be fixed only for a few months. Due to these timing differences, net interest income is sensitive to changes in the level and shape of the yield curve. Second, there are differences in the drivers of rate changes of various assets and liabilities. For example, commercial loans may reprice based on one-month LIBOR or prime; the rate paid on retail money market demand accounts may be only loosely correlated with LIBOR and depend on competitive demand for funds. Due to these basis differences, net interest income is sensitive to changes in spreads between certain indices or repricing rates.
Another important source of structural interest rate risk relates to the potential exercise of explicit or embedded options. For example, most consumer loans can be prepaid without penalty; and most consumer deposits can be withdrawn without penalty. The exercise of such options by customers can exacerbate the timing differences discussed above.
A primary source of our structural interest rate risk relates to faster repricing of floating rate loans relative to the retail deposit funding. This source of asset sensitivity is concentrated at the short end of the yield curve. For the past seven years with the Federal Funds rate near zero, this risk has been asymmetrical with significantly more upside benefit than potential exposure. As rates have lifted from near zero given the FOMC’s December 2015 rate hike, exposure to declining rates has increased. The secondary source of our interest rate risk is driven by longer term rates comprising the rollover or reinvestment risk on fixed rate loans as well as the prepayment risk on mortgage related loans and securities funded by non-rate sensitive deposits and equity.
The primary goal of interest rate risk management is to control exposure to interest rate risk within policy limits approved by the Board. These limits and guidelines reflect our tolerance for interest rate risk over both short-term and long-term horizons. To ensure that exposure to interest rate risk is managed within this risk appetite, we must both measure the exposure and, as necessary, hedge it. The Treasury Asset and Liability Management team is responsible for measuring, monitoring and reporting on the structural interest rate risk position. These exposures are reported on a monthly basis to the Asset and Liability Committee (ALCO) and at Board meetings.
We measure structural interest rate risk through a variety of metrics intended to quantify both short-term and long-term exposures. The primary method that we use to quantify interest rate risk is simulation analysis in which we model net interest income from assets, liabilities and hedge derivative positions under various interest rate scenarios over a three-year horizon. Exposure to interest rate risk is reflected in the variation of forecasted net interest income across scenarios.
Key assumptions in this simulation analysis relate to the behavior of interest rates and spreads, the changes in product balances and the behavior of loan and deposit clients in different rate environments. The most material of these behavioral assumptions relate to the repricing characteristics and balance fluctuations of deposits with indeterminate (i.e., non-contractual) maturities as well as the pace of mortgage prepayments. Assessments are periodically made by running sensitivity analysis of the impact of key assumptions. The results of these analyses are reported to ALCO.
As the future path of interest rates cannot be known in advance, we use simulation analysis to project net interest income under various interest rate scenarios including a “most likely” (implied forward) scenario as well as a variety of deliberately extreme and perhaps unlikely scenarios. These scenarios may assume gradual ramping of the overall level of interest rates, immediate shocks to the level of rates and various yield curve twists in which movements in short- or long-term rates predominate. Generally,
CITIZENS FINANCIAL GROUP, INC.
MANAGEMENT’S DISCUSSION AND ANALYSIS
projected net interest income in any interest rate scenario is compared to net interest income in a base case where market forward rates are realized.
The table below reports net interest income exposures against a variety of interest rate scenarios. Exposures are measured as a percentage change in net interest income over the next year due to either instantaneous, or gradual parallel +/- 200 basis point moves in benchmark interest rates. The net interest income simulation analyses do not include possible future actions that management might undertake to mitigate this risk. The current limit is a decrease in net interest income of 10% related to an instantaneous +/- 200 basis point move. As the table illustrates, our balance sheet is asset-sensitive: net interest income would benefit from an increase in interest rates. Exposure to a decline in interest rates is well within limit. It should be noted that the magnitude of any possible decline in interest rates is constrained by the low absolute starting levels of rates. While an instantaneous and severe shift in interest rates was used in this analysis, we believe that any actual shift in interest rates would likely be more gradual and would therefore have a more modest impact.
The table below summarizes our positioning in various parallel yield curve shifts:
|
| | | | | |
| | Estimated % Change in Net Interest Income over 12 Months |
| | December 31, |
| Basis points | 2015 |
| | 2014 |
|
| Instantaneous Change in Interest Rates | | | |
| +200 | 10.6 | % | | 13.4 | % |
| +100 | 5.8 |
| | 7.0 |
|
| -100 | (5.8 | ) | | (3.8 | ) |
| -200 | (6.4 | ) | | (4.3 | ) |
| Gradual Change in Interest Rates | | | |
|
| +200 | 6.1 |
| | 6.8 |
|
| +100 | 3.2 |
| | 3.5 |
|
| -100 | (3.1 | ) | | (2.3 | ) |
| -200 | (4.6 | ) | | (3.0 | ) |
As part of the routine risk management process, a wide variety of similar analysis are reported for each of the next three rolling years.
We also use a valuation measure of exposure to structural interest rate risk, Economic Value of Equity (“EVE”), as a supplement to net interest income simulations. EVE complements net interest income simulation analysis as it estimates risk exposure over a long-term horizon. EVE measures the extent to which the economic value of assets, liabilities and off-balance sheet instruments may change in response to fluctuation in interest rates. This analysis is highly dependent upon assumptions applied to assets and liabilities with non-contractual maturities. The change in value is expressed as a percentage of regulatory capital. The current risk limit is set at a decrease of 20% of regulatory capital given an instantaneous +/- 200 basis point change in interest rates. We are operating within that limit as of December 31, 2015.
We are asset sensitive and as such are positioned to benefit from an increase in interest rates. We have consistently maintained the level of overall asset sensitivity in a tight range of 6.1% to 7.2% over the past year, as defined by the +200 gradual change.
We also had market risk associated with the value of the mortgage servicing right assets, which are impacted by the level of interest rates. As of December 31, 2015 and 2014, our mortgage servicing rights had a book value of $164 million and $166 million, respectively, and were carried at the lower of cost or fair value. As of December 31, 2015, and 2014, the fair value of the mortgage servicing rights was $178 million and $179 million, respectively. Given low interest rates over recent years, there is a valuation allowance of $9 million and $18 million on the asset as of December 31, 2015 and 2014, respectively. Depending on the interest rate environment, hedges may be used to stabilize the market value of the mortgage servicing right asset.
Trading Risk
We are exposed to market risk primarily through client facilitation activities including derivatives and foreign exchange products. Exposure is created as a result of changes in interest rates and related basis spreads and volatility, foreign exchange rates, and credit spreads on a select range of interest rates, foreign exchange and secondary loans instruments. These trading activities are conducted through our two banking subsidiaries, CBNA and CBPA.
CITIZENS FINANCIAL GROUP, INC.
MANAGEMENT’S DISCUSSION AND ANALYSIS
Client facilitation activities consist primarily of interest rate derivatives and foreign exchange contracts where we enter into offsetting trades with a separate counterparty or exchange to manage our market risk exposure. We will occasionally execute hedges against the spread that exists across the client facing trade and its offset in the market to maintain a low risk profile. In addition to the aforementioned activities, we operate a secondary loan trading desk with the objective to meet secondary liquidity needs of our issuing clients’ transactions and investor clients. We do not engage in any trading activities with the intent to benefit from short term price differences.
We record interest rate derivatives and foreign exchange contracts as derivative assets and liabilities on our Consolidated Balance Sheets. Trading assets and liabilities are carried at fair value with income earned related to these activities included in net interest income. Changes in fair value of trading assets and liabilities are reflected in other income, a component of noninterest income on the Consolidated Statements of Operations.
Market Risk Governance
Our market risk framework currently leverages RBS technology platform to aggregate, measure and monitor exposure against market risk limits. As part of our separation from RBS, we have entered into a Transitional Services Agreement pursuant to which RBS will continue to provide us with all necessary VaR and other risk measurements required for regulatory reporting related to interest rate derivatives and foreign exchange trading activities, as well as internal market risk reporting until the end of the Transitional Services Agreement. During the term of the Transitional Services Agreement, we are building out our own market risk organization and framework in order to gradually migrate away from reliance on services provided by RBS.
Given the low level of traded market risk, we have received the support of our U.S. banking regulators for relying on RBS’ market risk technology platform. In managing our market risk, dealing authorities represent a key control in the management of market risk by setting the scope within which the business is permitted to operate. Dealing authorities are established jointly by designated senior business line and senior risk manager, and are reviewed at least annually. Dealing authorities are structured to accommodate the client facing trades, market offset trades and sets of hedges needed to maintain a low risk profile. Primary responsibility for keeping within established tolerances resides with the business. Key risk indicators, including a combined VaR for interest rate and foreign exchange rate risk, are monitored on a daily basis and reported against tolerances consistent with our risk appetite and business strategy to relevant business line management and risk counterparts.
Market Risk Measurement
We use VaR metrics, complemented with sensitivity analysis, market value and stress testing in measuring market risk. During the term of the Transition Services Agreement, we will continue to leverage RBS market risk measurement models for our foreign exchange and interest rate products, which are described further below, that capture correlation effects and allow for aggregation of market risk across risk types, business lines and legal entities. We measure and monitor market risk for both management and regulatory capital purposes.
Value-at-Risk Overview
The market risk measurement model is based on historical simulation. The VaR measure estimates the extent of any fair value losses on trading positions that may occur due to broad market movements (General VaR) such as changes in the level of interest rates, foreign exchange rates, equity prices and commodity prices. It is calculated on the basis that current positions remain broadly unaltered over the course of a given holding period. It is assumed that markets are sufficiently liquid to allow the business to close its positions, if required, within this holding period. VaR’s benefit is that it captures the historic correlations of a portfolio. Based on the composition of our “covered positions,” we also use a standardized add-on approach for the loan trading desk’s Specific Risk capital which estimates the extent of any losses that may occur from factors other than broad market movements. In addition, for our secondary traded loans we calculate the VaR on the general interest rate risk embedded within the loans using a standalone model that replicates The general VaR methodology (the related capital is reflected on the “de minimis” line in the following section). The General VaR approach is expressed in terms of a confidence level over the past 500 trading days. The internal VaR measure (used as the basis of the main VaR trading limits) is a 99% confidence level with a one day holding period, meaning that a loss greater than the VaR is expected to occur, on average, on only one day in 100 trading days (i.e., 1% of the time). Theoretically, there should be a loss event greater than VaR two to three times per year. The regulatory measure of VaR is done at a 99% confidence level with a 10-day holding period. The historical market data applied to calculate the VaR is updated on a 10 business day lag. Refer to “Market Risk Regulatory Capital” below for details of our 10-day VaR metrics for the quarters ended December 31, 2015 and 2014, including high, low, average and period end Value-at-Risk for interest rate and foreign exchange rate risks, as well as total VaR.
Market Risk Regulatory Capital
Effective January 1, 2013, the U.S. banking regulators adopted “Risk-Based Capital Guidelines: Market Risk” as the regulations covering the calculation of market risk capital (the “Market Risk Rule”). The Market Risk Rule, commonly known as
CITIZENS FINANCIAL GROUP, INC.
MANAGEMENT’S DISCUSSION AND ANALYSIS
Basel 2.5, substantially modified the determination of market risk-weighted assets and implemented a more risk sensitive methodology for the risk inherent in certain trading positions categorized as “covered positions.” For the purposes of the market risk rule, all of our client facing trades, market offset trades and sets of hedges needed to maintain a low risk profile to qualify as “covered positions.” The internal VaR measure is calculated based on the same population of trades that is utilized for regulatory VaR. The following table shows the results of our modeled and non-modeled measures for regulatory capital calculations:
|
| | | | | | | | | | | | | | | | | | | | | | | | | | | | | | | | |
| (in millions) | | For the Quarter Ended December 31, 2015 | | For the Quarter Ended December 31, 2014 |
Market Risk Category | | Period End | | Average | | High | | Low | | Period End | | Average | | High | | Low |
| Interest Rate | |
| $— |
| |
| $— |
| |
| $— |
| |
| $— |
| |
| $— |
| |
| $— |
| |
| $— |
| |
| $— |
|
| Foreign Exchange Currency Rate | | — |
| | — |
| | — |
| | — |
| | — |
| | — |
| | 1 |
| | — |
|
| Diversification Benefit | | — |
| | — |
| | NM(1) |
| | NM(1) |
| | — |
| | — |
| | NM(1) |
| | NM(1) |
|
| General VaR | | — |
| | — |
| | — |
| | — |
| | — |
| | — |
| | 1 |
| | — |
|
| Specific Risk VaR | | — |
| | — |
| | — |
| | — |
| | — |
| | — |
| | — |
| | — |
|
| Total VaR | |
| $— |
| |
| $— |
| |
| $— |
| |
| $— |
| |
| $— |
| |
| $— |
| |
| $1 |
| |
| $— |
|
| Stressed General VaR | |
| $2 |
| |
| $2 |
| |
| $2 |
| |
| $1 |
| |
| $2 |
| |
| $2 |
| |
| $3 |
| |
| $1 |
|
| Stressed Specific Risk VaR | | — |
| | — |
| | — |
| | — |
| | — |
| | — |
| | — |
| | — |
|
| Total Stressed VaR | |
| $2 |
| |
| $2 |
| |
| $2 |
| |
| $1 |
| |
| $2 |
| |
| $2 |
| |
| $3 |
| |
| $1 |
|
| Market Risk Regulatory Capital | |
| $7 |
| | |
| | |
| | |
| |
| $6 |
| | | | | | |
| Specific Risk Not Modeled Add-on | | 5 |
| | | | | | | | 3 |
| | | | | | |
| de Minimis Exposure Add-on | | 15 |
| | | | | | | | 6 |
| | | | | | |
| Total Market Risk Regulatory Capital | |
| $27 |
| | | | | | | |
| $15 |
| | | | | | |
| Market Risk-Weighted Assets | |
| $333 |
| | |
| | |
| | |
| |
| $191 |
| | | | | | |
(1) The high and low for the portfolio may have occurred on different trading days than the high and low for the components. Therefore, there is no diversification benefit shown for the high and low columns.
Stressed VaR
SVaR is an extension of VaR, but uses a longer historical look back horizon that is fixed from January 3, 2005. This is done not only to identify headline risks from more volatile periods, but also to provide a counter balance to VaR which may be low during periods of low volatility. The holding period for profit and loss determination is 10 days. SVaR is also a component of market risk regulatory capital. SVaR for us is calculated under its own dynamic window regime as compared to RBS’ static SVaR window. In a dynamic window regime, values of the 10-day, 99% VaR are calculated over all possible 260-day periods that can be obtained from the complete historical data set. Refer to “Market Risk Regulatory Capital” above for details of SVaR metrics, including high, low, average and period end SVaR for the combined portfolio.
Sensitivity Analysis
Sensitivity analysis is the measure of exposure to a single risk factor, such as a one basis point change in rates or credit spread. We conduct and monitor sensitivity on interest rates, basis spreads, foreign exchange exposures and option prices. Whereas VaR is based on previous moves in market risk factors over recent periods, it may not be an accurate predictor of future market moves. Sensitivity analysis complements VaR as it provides an indication of risk relative to each factor irrespective of historical market moves and is an effective tool in evaluating the appropriateness of hedging strategies.
Stress Testing
Conducting a stress test of a portfolio consists of running risk models with the inclusion of key variables that simulate various historical or hypothetical scenarios. For historical stress tests, profit and loss results are simulated for selected time periods corresponding to the most volatile underlying returns while hypothetical stress tests aim to consider concentration risk, illiquidity under stressed market conditions and risk arising from the bank’s trading activities that may not be fully captured by its other models. Hypothetical scenarios also assume that the market moves happen simultaneously and that no repositioning or hedging activity takes place to mitigate losses as events unfold. We generate stress tests of our trading positions on a regular basis. For example, we currently include a stress test that simulates a Lehman-type crisis scenario by taking the worst 10-day peak to trough moves for the various risk factors that go into VaR from that period, and assumes they occurred simultaneously.
VaR Model Review and Validation
Market risk measurement models used are independently reviewed. The models, used under the Transitional Services Agreement, are subject to ongoing and independent review and validation that focuses on the model methodology. Independent
CITIZENS FINANCIAL GROUP, INC.
MANAGEMENT’S DISCUSSION AND ANALYSIS
review of market risk measurement models is the responsibility of RBS Risk Analytics. Aspects covered include challenging the assumptions used, the quantitative techniques employed and the theoretical justification underpinning them, and an assessment of the soundness of the required data over time. Where possible, the quantitative impact of the major underlying modeling assumptions will be estimated (e.g., through developing alternative models). Results of such reviews are shared with U.S. regulators. For the term of the Transitional Services Agreement, we and RBS expect to utilize the same independently validated VaR model for both management and regulatory reporting purposes. RBS market risk teams, including those providing consultative services to us under the Transitional Services Agreement, will conduct internal validation before a new or changed model element is implemented and before a change is made to a market data mapping. For example, RBS market risk teams also perform regular reviews of key risk factors that are used in the market risk measurement models to produce profit and loss vectors used in the VaR calculations. These internal validations are subject to independent re-validation by RBS Risk Analytics and, depending on the results of the impact assessment, notification to the appropriate regulatory authorities for RBS and us may be required.
VaR Backtesting
Backtesting is one form of validation of the VaR model. The Market Risk Rule requires a comparison of our internal VaR measure to the actual net trading revenue (excluding fees, commissions, reserves, intra-day trading and net interest income) for each day over the preceding year (the most recent 250 business days). Any observed loss in excess of the VaR number is taken as an exception. The level of exceptions determines the multiplication factor used to derive the VaR and SVaR-based capital requirement for regulatory reporting purposes. We perform sub-portfolio backtesting as required under the Market Risk Rule, and as approved by our banking regulators, for interest rate and foreign exchange positions. The following table shows our daily net trading revenue and total internal, modeled VaR for the quarters ended December 31, 2015, September 30, 2015, June 30, 2015 and March 31, 2015. Beginning in the quarter ended September 30, 2015, as agreed with our banking regulators, we use a multiplication factor derived from our specific backtesting results and no longer that of RBS.
Daily VaR Backtesting: Sub-portfolio Level Backtesting
CITIZENS FINANCIAL GROUP, INC.
SELECTED STATISTICAL INFORMATION
Selected Statistical Information
The accompanying supplemental information should be read in conjunction with Part II, Item 6 — Selected Financial Data and Part II, Item 8 — Financial Statements and Supplementary Data, included elsewhere in this report.
Distribution of Assets, Liabilities and Stockholders’ Equity; Interest Rates and Interest Differential
The following table provides a summary of our consolidated average balances including major categories of interest earning assets and interest bearing liabilities:
|
| | | | | | | | | | | | | | | | | | | | | | | | | | |
| | Year Ended December 31, |
| | 2015 | | 2014 | | 2013 |
| (dollars in millions) | Average Balances | Income/ Expense | Yields/ Rates | | Average Balances | Income/ Expense | Yields/ Rates | | Average Balances | Income/ Expense | Yields/ Rates |
| Assets | | | | | | | | | | | |
| Interest-bearing cash and due from banks and deposits in banks |
| $1,746 |
|
| $5 |
| 0.29 | % | |
| $2,113 |
|
| $5 |
| 0.22 | % | |
| $2,278 |
|
| $11 |
| 0.46 | % |
| Taxable investment securities | 24,649 |
| 621 |
| 2.52 |
| | 24,319 |
| 619 |
| 2.55 |
| | 19,062 |
| 477 |
| 2.50 |
|
| Non-taxable investment securities | 9 |
| — |
| 2.60 |
| | 11 |
| — |
| 2.60 |
| | 12 |
| — |
| 2.66 |
|
| Total investment securities | 24,658 |
| 621 |
| 2.52 |
| | 24,330 |
| 619 |
| 2.55 |
| | 19,074 |
| 477 |
| 2.50 |
|
| Commercial | 32,673 |
| 951 |
| 2.87 |
| | 29,993 |
| 900 |
| 2.96 |
| | 28,654 |
| 900 |
| 3.10 |
|
| Commercial real estate | 8,231 |
| 211 |
| 2.53 |
| | 7,158 |
| 183 |
| 2.52 |
| | 6,568 |
| 178 |
| 2.67 |
|
| Leases | 3,902 |
| 97 |
| 2.50 |
| | 3,776 |
| 103 |
| 2.73 |
| | 3,463 |
| 105 |
| 3.05 |
|
| Total commercial | 44,806 |
| 1,259 |
| 2.78 |
| | 40,927 |
| 1,186 |
| 2.86 |
| | 38,685 |
| 1,183 |
| 3.02 |
|
| Residential mortgages | 12,338 |
| 465 |
| 3.77 |
| | 10,729 |
| 425 |
| 3.96 |
| | 9,104 |
| 360 |
| 3.96 |
|
| Home equity loans | 3,025 |
| 163 |
| 5.38 |
| | 3,877 |
| 205 |
| 5.29 |
| | 4,606 |
| 246 |
| 5.35 |
|
| Home equity lines of credit | 14,958 |
| 441 |
| 2.95 |
| | 15,552 |
| 450 |
| 2.89 |
| | 16,337 |
| 463 |
| 2.83 |
|
Home equity loans serviced by others (1) | 1,117 |
| 77 |
| 6.94 |
| | 1,352 |
| 91 |
| 6.75 |
| | 1,724 |
| 115 |
| 6.65 |
|
Home equity lines of credit serviced by others (1) | 453 |
| 11 |
| 2.44 |
| | 609 |
| 16 |
| 2.68 |
| | 768 |
| 22 |
| 2.88 |
|
| Automobile | 13,516 |
| 372 |
| 2.75 |
| | 11,011 |
| 282 |
| 2.57 |
| | 8,857 |
| 235 |
| 2.65 |
|
| Student | 3,313 |
| 167 |
| 5.03 |
| | 2,148 |
| 102 |
| 4.74 |
| | 2,202 |
| 95 |
| 4.30 |
|
| Credit cards | 1,621 |
| 178 |
| 10.97 |
| | 1,651 |
| 167 |
| 10.14 |
| | 1,669 |
| 175 |
| 10.46 |
|
| Other retail | 1,003 |
| 78 |
| 7.75 |
| | 1,186 |
| 88 |
| 7.43 |
| | 1,453 |
| 107 |
| 7.36 |
|
| Total retail | 51,344 |
| 1,952 |
| 3.80 |
| | 48,115 |
| 1,826 |
| 3.80 |
| | 46,720 |
| 1,818 |
| 3.89 |
|
Total loans and leases (2) | 96,150 |
| 3,211 |
| 3.32 |
| | 89,042 |
| 3,012 |
| 3.37 |
| | 85,405 |
| 3,001 |
| 3.50 |
|
| Loans held for sale, at fair value | 301 |
| 10 |
| 3.47 |
| | 163 |
| 5 |
| 3.10 |
| | 392 |
| 12 |
| 3.07 |
|
| Other loans held for sale | 95 |
| 7 |
| 7.22 |
| | 539 |
| 23 |
| 4.17 |
| | — |
| — |
| — |
|
| Interest-earning assets | 122,950 |
| 3,854 |
| 3.12 |
| | 116,187 |
| 3,664 |
| 3.14 |
| | 107,149 |
| 3,501 |
| 3.25 |
|
| Allowance for loan and lease losses | (1,196 | ) | | | | (1,230 | ) | | | | (1,219 | ) | | |
| Goodwill | 6,876 |
| | | | 6,876 |
| | | | 9,063 |
| | |
| Other noninterest-earning assets | 6,440 |
| | | | 5,791 |
| | | | 5,873 |
| | |
| Total noninterest-earning assets | 12,120 |
| | | | 11,437 |
| | | | 13,717 |
| | |
| Total assets |
| $135,070 |
| | | |
| $127,624 |
| | | |
| $120,866 |
| | |
(1) Our SBO portfolio consists of home equity loans and lines that were originally serviced by others. We now service a portion of this portfolio internally.
(2) Interest income and rates on loans include loan fees. Additionally, average nonaccrual loans were included in the average loan balances used to determine the average yield on loans in amounts of $1.1 billion, $1.2 billion, and $1.6 billion for December 31, 2015, 2014, and 2013, respectively.
CITIZENS FINANCIAL GROUP, INC.
SELECTED STATISTICAL INFORMATION
|
| | | | | | | | | | | | | | | | | | | | | | | | | | |
| | Year Ended December 31, |
| | 2015 | | 2014 | | 2013 |
| (dollars in millions) | Average Balances | Income/ Expense | Yields/ Rates | | Average Balances | Income/ Expense | Yields/ Rates | | Average Balances | Income/ Expense | Yields/ Rates |
| Liabilities and Stockholders’ Equity | | | | | | | | | | | |
| Checking with interest |
| $16,666 |
|
| $19 |
| 0.11 | % | |
| $14,507 |
|
| $12 |
| 0.08 | % | |
| $14,096 |
|
| $8 |
| 0.06 | % |
| Money market and savings | 43,458 |
| 117 |
| 0.27 |
| | 39,579 |
| 77 |
| 0.19 |
| | 42,575 |
| 105 |
| 0.25 |
|
| Term deposits | 12,424 |
| 101 |
| 0.82 |
| | 10,317 |
| 67 |
| 0.65 |
| | 11,266 |
| 103 |
| 0.91 |
|
| Total interest-bearing deposits | 72,548 |
| 237 |
| 0.33 |
| | 64,403 |
| 156 |
| 0.24 |
| | 67,937 |
| 216 |
| 0.32 |
|
| Interest-bearing deposits held for sale | — |
| — |
| — |
| | 1,960 |
| 4 |
| 0.22 |
| | — |
| — |
| — |
|
Federal funds purchased and securities sold under agreements to repurchase (3) | 3,364 |
| 16 |
| 0.46 |
| | 5,699 |
| 32 |
| 0.55 |
| | 2,400 |
| 192 |
| 7.89 |
|
| Other short-term borrowed funds | 5,865 |
| 67 |
| 1.13 |
| | 5,640 |
| 89 |
| 1.56 |
| | 251 |
| 4 |
| 1.64 |
|
| Long-term borrowed funds | 4,479 |
| 132 |
| 2.95 |
| | 1,907 |
| 82 |
| 4.25 |
| | 778 |
| 31 |
| 3.93 |
|
| Total borrowed funds | 13,708 |
| 215 |
| 1.56 |
| | 13,246 |
| 203 |
| 1.51 |
| | 3,429 |
| 227 |
| 6.53 |
|
| Total interest-bearing liabilities | 86,256 |
| 452 |
| 0.52 |
| | 79,609 |
| 363 |
| 0.45 |
| | 71,366 |
| 443 |
| 0.61 |
|
| Demand deposits | 26,606 |
| | | | 25,739 |
| | | | 25,399 |
| | |
| Demand deposits held for sale | — |
| | | | 462 |
| | | | — |
| | |
| Other liabilities | 2,671 |
| | | | 2,415 |
| | | | 2,267 |
| | |
| Total liabilities | 115,533 |
| | | | 108,225 |
| | | | 99,032 |
| | |
| Stockholders’ equity | 19,537 |
| | | | 19,399 |
| | | | 21,834 |
| | |
| Total liabilities and stockholders’ equity |
| $135,070 |
| | | |
| $127,624 |
| | | |
| $120,866 |
| | |
| Interest rate spread | | | 2.60 |
| | | | 2.69 |
| | | | 2.64 |
|
| Net interest income | |
| $3,402 |
| | | |
| $3,301 |
| | | |
| $3,058 |
| |
| Net interest margin | | | 2.75 | % | | | | 2.83 | % | | | | 2.85 | % |
(3) Balances are net of certain short-term receivables associated with reverse agreements. Interest expense includes the full cost of the repurchase agreements and certain hedging costs. The yield on Federal funds purchased is elevated due to the impact from pay-fixed interest rate swaps that are scheduled to run off by the end of 2016. For further discussion see “Management’s Discussion and Analysis of Financial Condition and Results of Operations — Year ended December 31, 2015 Compared with Year Ended December 31, 2014 — Derivatives.”
CITIZENS FINANCIAL GROUP, INC.
SELECTED STATISTICAL INFORMATION
Change in Net Interest Income–Volume and Rate Analysis
The following table presents the amount of changes in interest income and interest expense due to changes in both average volume and average rate. Average volume and rate changes have been allocated between the average rate and average volume variances on a consistent basis based upon the respective percentage changes in average balances and average rates.
|
| | | | | | | | | | | | | | | | | | | |
| | Year Ended December 31, | | Year Ended December 31, |
| | 2015 Versus 2014 | | 2014 Versus 2013 |
| (in millions) | Average Volume | Average Rate | Net Change | | Average Volume | Average Rate | Net Change |
| Interest Income | | | | | | | |
| Interest-bearing cash and due from banks and deposits in banks |
| ($1 | ) |
| $1 |
|
| $— |
| |
| ($1 | ) |
| ($5 | ) |
| ($6 | ) |
| Taxable investment securities |
| $9 |
|
| ($7 | ) | 2 |
| | 132 |
| 10 |
| 142 |
|
| Non-taxable investment securities | — |
| — |
| — |
| | — |
| — |
| — |
|
| Total investment securities | 9 |
| (7 | ) |
| $2 |
| | 132 |
| 10 |
|
| $142 |
|
| Commercial | 79 |
| (28 | ) |
| $51 |
| | 42 |
| (42 | ) |
| $— |
|
| Commercial real estate | 27 |
| 1 |
| 28 |
| | 16 |
| (11 | ) | 5 |
|
| Leases | 3 |
| (9 | ) | (6 | ) | | 10 |
| (12 | ) | (2 | ) |
| Total commercial | 109 |
| (36 | ) | 73 |
| | 68 |
| (65 | ) | 3 |
|
| Residential mortgages | 63 |
| (23 | ) | 40 |
| | 65 |
| — |
| 65 |
|
| Home equity loans | (44 | ) | 2 |
| (42 | ) | | (39 | ) | (2 | ) | (41 | ) |
| Home equity lines of credit | (18 | ) | 9 |
| (9 | ) | | (22 | ) | 9 |
| (13 | ) |
Home equity loans serviced by others (1) | (17 | ) | 3 |
| (14 | ) | | (25 | ) | 1 |
| (24 | ) |
Home equity lines of credit serviced by others (1) | (4 | ) | (1 | ) | (5 | ) | | (5 | ) | (1 | ) | (6 | ) |
| Automobile | 65 |
| 25 |
| 90 |
| | 57 |
| (10 | ) | 47 |
|
| Student | 55 |
| 10 |
| 65 |
| | (2 | ) | 9 |
| 7 |
|
| Credit cards | (3 | ) | 14 |
| 11 |
| | (2 | ) | (6 | ) | (8 | ) |
| Other retail | (14 | ) | 4 |
| (10 | ) | | (20 | ) | 1 |
| (19 | ) |
| Total retail | 83 |
| 43 |
| 126 |
| | 7 |
| 1 |
| 8 |
|
| Total loans and leases | 192 |
| 7 |
| 199 |
| | 75 |
| (64 | ) | 11 |
|
| Loans held for sale, at fair value | 5 |
| — |
| 5 |
| | (7 | ) | — |
| (7 | ) |
| Other loans held for sale | (18 | ) | 2 |
| (16 | ) | | 44 |
| (21 | ) | 23 |
|
| Total interest income |
| $187 |
|
| $3 |
|
| $190 |
| |
| $243 |
|
| ($80 | ) |
| $163 |
|
| Interest Expense | | | | | | | |
| Checking with interest |
| $— |
|
| $7 |
|
| $7 |
| |
| $— |
|
| $4 |
|
| $4 |
|
| Money market and savings | 8 |
| 32 |
| 40 |
| | (7 | ) | (21 | ) | (28 | ) |
| Term deposits | 14 |
| 20 |
| 34 |
| | (9 | ) | (27 | ) | (36 | ) |
| Total interest-bearing deposits | 22 |
| 59 |
| 81 |
| | (16 | ) | (44 | ) | (60 | ) |
| Interest-bearing deposits held for sale | (4 | ) | — |
| (4 | ) | | — |
| 4 |
| 4 |
|
| Federal funds purchased and securities sold under agreements to repurchase | (13 | ) | (3 | ) | (16 | ) | | 264 |
| (424 | ) | (160 | ) |
| Other short-term borrowed funds | 4 |
| (26 | ) | (22 | ) | | 89 |
| (4 | ) | 85 |
|
| Long-term borrowed funds | 109 |
| (59 | ) | 50 |
| | 45 |
| 6 |
| 51 |
|
| Total borrowed funds | 100 |
| (88 | ) | 12 |
| | 398 |
| (422 | ) | (24 | ) |
| Total interest expense | 118 |
| (29 | ) | 89 |
| | 382 |
| (462 | ) | (80 | ) |
| Net interest income |
| $69 |
|
| $32 |
|
| $101 |
| |
| ($139 | ) |
| $382 |
|
| $243 |
|
(1) Our SBO portfolio consists of home equity loans and lines that were originally serviced by others. We now service a portion of this portfolio internally.
CITIZENS FINANCIAL GROUP, INC.
SELECTED STATISTICAL INFORMATION
Investment Portfolio
The following table presents the book value of the major components of our investments portfolio. For further discussion, see Note 3 “Securities” to our audited Consolidated Financial Statements in Part II, Item 8 — Financial Statements and Supplementary Data, included elsewhere in this report.
|
| | | | | | | | | | | |
| | December 31, |
| (in millions) | 2015 |
| | 2014 |
| | 2013 |
|
| Securities Available for Sale: | | | | | |
| U.S. Treasury and other |
| $16 |
| |
| $15 |
| |
| $15 |
|
| State and political subdivisions | 9 |
| | 10 |
| | 10 |
|
| Mortgage-backed securities: | | | | | |
| Federal agencies and U.S. government sponsored entities | 17,320 |
| | 17,934 |
| | 14,993 |
|
| Other/non-agency | 522 |
| | 672 |
| | 952 |
|
| Total mortgage-backed securities | 17,842 |
| | 18,606 |
| | 15,945 |
|
| Total debt securities available for sale | 17,867 |
| | 18,631 |
| | 15,970 |
|
| Marketable equity securities | 5 |
| | 13 |
| | 13 |
|
| Other equity securities | 12 |
| | 12 |
| | 12 |
|
| Total equity securities available for sale | 17 |
| | 25 |
| | 25 |
|
| Total securities available for sale |
| $17,884 |
| |
| $18,656 |
| |
| $15,995 |
|
| Securities Held to Maturity: | | | | | |
| Mortgage-backed securities: | | | | | |
| Federal Agencies and U.S. government sponsored entities |
| $4,105 |
| |
| $3,728 |
| |
| $2,940 |
|
| Other/non-agency | 1,153 |
| | 1,420 |
| | 1,375 |
|
| Total securities held to maturity |
| $5,258 |
| |
| $5,148 |
| |
| $4,315 |
|
| Other Investment Securities, at Fair Value: | | | | | |
| Money market mutual fund |
| $65 |
| |
| $28 |
| |
| $29 |
|
| Other investments | 5 |
| | 5 |
| | 5 |
|
| Total other investment securities, at fair value |
| $70 |
| |
| $33 |
| |
| $34 |
|
| Other Investment Securities, at Cost: | | | | | |
| Federal Reserve Bank stock |
| $468 |
| |
| $477 |
| |
| $462 |
|
| Federal Home Loan Bank stock | 395 |
| | 390 |
| | 468 |
|
| Total other investment securities, at cost |
| $863 |
| |
| $867 |
| |
| $930 |
|
CITIZENS FINANCIAL GROUP, INC.
SELECTED STATISTICAL INFORMATION
The following table presents an analysis of the amortized cost, remaining contractual maturities, and weighted-average yields by contractual maturity. Expected maturities may differ from contractual maturities because borrowers may have the right to call or prepay obligations with or without call or prepayment penalties.
|
| | | | | | | | | | | | | | | |
| | Distribution of Maturities |
| | As of December 31, 2015 |
| (dollars in millions) | Due in 1 Year or Less | Due After 1
Through 5
Years | Due After 5
Through 10
Years | Due After 10
Years | Total |
|
| Amortized cost: |
|
|
|
|
|
| Debt securities available for sale: |
|
|
|
|
|
| U.S. Treasury and other |
| $15 |
|
| $— |
|
| $1 |
|
| $— |
|
| $16 |
|
| State and political subdivisions | — |
| — |
| — |
| 9 |
| 9 |
|
| Mortgage-backed securities: | | | | | |
| Federal agencies and U.S. government sponsored entities | 4 |
| 52 |
| 1,833 |
| 15,345 |
| 17,234 |
|
| Other/non-agency | — |
| 68 |
| 3 |
| 484 |
| 555 |
|
| Total debt securities available for sale | 19 |
| 120 |
| 1,837 |
| 15,838 |
| 17,814 |
|
| Debt securities held to maturity: | | | | | |
| Mortgage-backed securities: | | | | | |
| Federal agencies and U.S. government sponsored entities | — |
| — |
| — |
| 4,105 |
| 4,105 |
|
| Other/non-agency | — |
| — |
| — |
| 1,153 |
| 1,153 |
|
| Total debt securities held to maturity | — |
| — |
| — |
| 5,258 |
| 5,258 |
|
Total amortized cost of debt securities (1) |
| $19 |
|
| $120 |
|
| $1,837 |
|
| $21,096 |
|
| $23,072 |
|
Weighted-average yield (2) | 1.27 | % | 4.88 | % | 1.90 | % | 2.57 | % | 2.53 | % |
(1) As of December 31, 2015, no investments exceeded 10% of stockholders’ equity.
(2) Yields on tax-exempt securities are not computed on a tax-equivalent basis.
Loan and Lease Portfolio
The following table shows the composition of total loans and leases. For further discussion see Note 4 “Loans and Leases” to our audited Consolidated Financial Statements in Part II, Item 8 — Financial Statements and Supplementary Data, included elsewhere in this report.
|
| | | | | | | | | | | | | | | | | | | |
| | December 31, |
| (in millions) | 2015 |
| | 2014 |
| | 2013 |
| | 2012 |
| | 2011 |
|
| Commercial |
| $33,264 |
| |
| $31,431 |
| |
| $28,667 |
| |
| $28,856 |
| |
| $25,770 |
|
| Commercial real estate | 8,971 |
| | 7,809 |
| | 6,948 |
| | 6,459 |
| | 7,602 |
|
| Leases | 3,979 |
| | 3,986 |
| | 3,780 |
| | 3,415 |
| | 3,164 |
|
| Total commercial | 46,214 |
| | 43,226 |
| | 39,395 |
| | 38,730 |
| | 36,536 |
|
| Residential mortgages | 13,318 |
| | 11,832 |
| | 9,726 |
| | 9,323 |
| | 9,719 |
|
| Home equity loans | 2,557 |
| | 3,424 |
| | 4,301 |
| | 5,106 |
| | 6,766 |
|
| Home equity lines of credit | 14,674 |
| | 15,423 |
| | 15,667 |
| | 16,672 |
| | 16,666 |
|
Home equity loans serviced by others (1) | 986 |
| | 1,228 |
| | 1,492 |
| | 2,024 |
| | 2,535 |
|
Home equity lines of credit serviced by others (1) | 389 |
| | 550 |
| | 679 |
| | 936 |
| | 1,089 |
|
| Automobile | 13,828 |
| | 12,706 |
| | 9,397 |
| | 8,944 |
| | 7,571 |
|
| Student | 4,359 |
| | 2,256 |
| | 2,208 |
| | 2,198 |
| | 2,271 |
|
| Credit cards | 1,634 |
| | 1,693 |
| | 1,691 |
| | 1,691 |
| | 1,637 |
|
| Other retail | 1,083 |
| | 1,072 |
| | 1,303 |
| | 1,624 |
| | 2,005 |
|
| Total retail | 52,828 |
| | 50,184 |
| | 46,464 |
| | 48,518 |
| | 50,259 |
|
| Total loans and leases |
| $99,042 |
| |
| $93,410 |
| |
| $85,859 |
| |
| $87,248 |
| |
| $86,795 |
|
(1) Our SBO portfolio consists of home equity loans and lines that were originally serviced by others. We now service a portion of this portfolio internally.
CITIZENS FINANCIAL GROUP, INC.
SELECTED STATISTICAL INFORMATION
Maturities and Sensitivities of Loans and Leases to Changes in Interest Rates
The following table is a summary of loans and leases by remaining maturity or repricing date:
|
| | | | | | | | | | | | |
| | December 31, 2015 |
| (in millions) | Due in 1 Year or Less | Due After 1 Year Through 5 Years | Due After 5 Years | Total Loans and Leases |
| Commercial |
| $28,293 |
|
| $3,141 |
|
| $1,830 |
|
| $33,264 |
|
| Commercial real estate | 8,626 |
| 155 |
| 190 |
| 8,971 |
|
| Leases | 665 |
| 2,055 |
| 1,259 |
| 3,979 |
|
| Total commercial | 37,584 |
| 5,351 |
| 3,279 |
| 46,214 |
|
| Residential mortgages | 1,485 |
| 1,201 |
| 10,632 |
| 13,318 |
|
| Home equity loans | 542 |
| 388 |
| 1,627 |
| 2,557 |
|
| Home equity lines of credit | 10,772 |
| 2,144 |
| 1,758 |
| 14,674 |
|
Home equity loans serviced by others (1) | — |
| 133 |
| 853 |
| 986 |
|
Home equity lines of credit serviced by others (1) | 389 |
| — |
| — |
| 389 |
|
| Automobile | 131 |
| 7,663 |
| 6,034 |
| 13,828 |
|
| Student | 13 |
| 305 |
| 4,041 |
| 4,359 |
|
| Credit cards | 1,487 |
| 147 |
| — |
| 1,634 |
|
| Other retail | 447 |
| 311 |
| 325 |
| 1,083 |
|
| Total retail | 15,266 |
| 12,292 |
| 25,270 |
| 52,828 |
|
| Total loans and leases |
| $52,850 |
|
| $17,643 |
|
| $28,549 |
|
| $99,042 |
|
| Loans and leases due after one year at fixed interest rates |
| $12,785 |
|
| $20,261 |
|
| $33,046 |
|
| Loans and leases due after one year at variable interest rates | 4,858 |
| 8,288 |
| 13,146 |
|
(1) Our SBO portfolio consists of home equity loans and lines that were originally serviced by others. We now service a portion of this portfolio internally.
Loan and Lease Concentrations
This disclosure presents our exposure to any concentration of loans and leases that exceed 10% of total loans and leases. At December 31, 2015, we did not identify any concentration of loans and leases that exceeded the 10% threshold. For further discussion of how we managed concentration exposures, see Note 5 “Allowance for Credit Losses, Nonperforming Assets, and Concentrations of Credit Risk” to our audited Consolidated Financial Statements in Part II, Item 8 — Financial Statements and Supplementary Data, included elsewhere in this report.
CITIZENS FINANCIAL GROUP, INC.
SELECTED STATISTICAL INFORMATION
Risk Elements
The following table presents a summary of nonperforming loans and leases by class:
|
| | | | | | | | | | | | | | | | | | | |
| | December 31, |
| (in millions) | 2015 |
| | 2014 |
| | 2013 |
| | 2012 |
| | 2011 |
|
| Nonaccrual loans and leases | | | | | | | | | |
| Commercial |
| $70 |
| |
| $113 |
| |
| $96 |
| |
| $119 |
| |
| $176 |
|
| Commercial real estate | 77 |
| | 50 |
| | 169 |
| | 386 |
| | 710 |
|
| Leases | — |
| | — |
| | — |
| | 1 |
| | 1 |
|
| Total commercial | 147 |
| | 163 |
| | 265 |
| | 506 |
| | 887 |
|
| Residential mortgages | 331 |
| | 345 |
| | 382 |
| | 486 |
| | 374 |
|
| Home equity loans | 135 |
| | 203 |
| | 266 |
| | 298 |
| | 207 |
|
| Home equity lines of credit | 272 |
| | 257 |
| | 333 |
| | 259 |
| | 109 |
|
Home equity loans serviced by others (1) | 38 |
| | 47 |
| | 59 |
| | 92 |
| | 68 |
|
Home equity lines of credit serviced by others (1) | 32 |
| | 25 |
| | 30 |
| | 41 |
| | 25 |
|
| Automobile | 42 |
| | 21 |
| | 16 |
| | 16 |
| | 7 |
|
| Student | 35 |
| | 11 |
| | 3 |
| | 3 |
| | 4 |
|
| Credit cards | 16 |
| | 16 |
| | 19 |
| | 20 |
| | 23 |
|
| Other retail | 3 |
| | 5 |
| | 10 |
| | 9 |
| | 8 |
|
| Total retail | 904 |
| | 930 |
| | 1,118 |
| | 1,224 |
| | 825 |
|
| Total nonaccrual loans and leases | 1,051 |
| | 1,093 |
| | 1,383 |
| | 1,730 |
| | 1,712 |
|
| Loans and leases that are accruing and 90 days or more delinquent | | | | | | | | | |
| Commercial | 1 |
| | 1 |
| | — |
| | 71 |
| | 1 |
|
| Commercial real estate | — |
| | — |
| | — |
| | 33 |
| | 4 |
|
| Leases | — |
| | — |
| | — |
| | — |
| | — |
|
| Total commercial | 1 |
| | 1 |
| | — |
| | 104 |
| | 5 |
|
| Residential mortgages | — |
| | — |
| | — |
| | — |
| | 29 |
|
| Home equity loans | — |
| | — |
| | — |
| | — |
| | — |
|
| Home equity lines of credit | — |
| | — |
| | — |
| | — |
| | — |
|
Home equity loans serviced by others (1) | — |
| | — |
| | — |
| | — |
| | — |
|
Home equity lines of credit serviced by others (1) | — |
| | — |
| | — |
| | — |
| | — |
|
| Automobile | — |
| | — |
| | — |
| | — |
| | — |
|
| Student | 6 |
| | 6 |
| | 31 |
| | 33 |
| | 36 |
|
| Credit cards | — |
| | 1 |
| | 2 |
| | 2 |
| | 2 |
|
| Other retail | 2 |
| | — |
| | — |
| | — |
| | — |
|
| Total retail | 8 |
| | 7 |
| | 33 |
| | 35 |
| | 67 |
|
| Total accruing and 90 days or more delinquent | 9 |
| | 8 |
| | 33 |
| | 139 |
| | 72 |
|
| Total nonperforming loans and leases |
| $1,060 |
| |
| $1,101 |
| |
| $1,416 |
| |
| $1,869 |
| |
| $1,784 |
|
Troubled debt restructurings (2) |
| $909 |
| |
| $955 |
| |
| $777 |
| |
| $704 |
| |
| $493 |
|
(1) Our SBO portfolio consists of home equity loans and lines that were originally serviced by others. We now service a portion of this portfolio internally.
(2) TDR balances reported in this line item consist of only those TDRs not reported in the nonaccrual loan or accruing and 90 days or more delinquent loan categories. Thus, only those TDRs that are in compliance with their modified terms and not past due, or those TDRs that are past due 30-89 days and still accruing are included in the TDR balances listed above.
CITIZENS FINANCIAL GROUP, INC.
SELECTED STATISTICAL INFORMATION
Impact of Nonperforming Loans and Leases on Interest Income
The following table presents the gross interest income for both nonaccrual and restructured loans that would have been recognized if such loans had been current in accordance with their original contractual terms, and had been outstanding throughout the year or since origination if held for only part of the year. The table also presents the interest income related to these loans that was actually recognized for the year.
|
| | | |
| (in millions) | For the Year Ended December 31, 2015 |
Gross amount of interest income that would have been recorded in accordance with original contractual terms, and had been outstanding throughout the year or since origination, if held for only part of the year (1) |
| $126 |
|
| Interest income actually recognized | 13 |
|
| Total interest income foregone |
| $113 |
|
(1) Based on the contractual rate that was being charged at the time the loan was restructured or placed on nonaccrual status.
Potential Problem Loans and Leases
This disclosure presents outstanding amounts as well as specific reserves for certain loans and leases where information about possible credit problems of borrowers causes management to have serious doubts as to the ability of such borrowers to comply with the present repayment terms. At December 31, 2015, we did not identify any potential problem loans or leases within the portfolio that were not already included in “—Risk Elements.”
Cross-Border Outstandings
Cross-border outstandings can include loans, receivables, interest-bearing deposits with other banks, other interest-bearing investments and other monetary assets that are denominated in either dollars or other non-local currency.
As of December 31, 2015, 2014 and 2013, there were no aggregate cross-border outstandings from borrowers or counterparties in any country that exceeded 1%, or were between 0.75% and 1% of consolidated total assets.
CITIZENS FINANCIAL GROUP, INC.
SELECTED STATISTICAL INFORMATION
Summary of Loan and Lease Loss Experience
The following table summarizes the changes to our ALLL: |
| | | | | | | | | | | | | | | | | | | |
| | As of and for the Year Ended December 31, |
| (dollars in millions) | 2015 | | 2014 | | 2013 | | 2012 | | 2011 |
Allowance for Loan and Lease Losses — Beginning: | |
| Commercial |
| $388 |
| |
| $361 |
| |
| $379 |
| |
| $394 |
| |
| $399 |
|
| Commercial real estate | 61 |
| | 78 |
| | 111 |
| | 279 |
| | 401 |
|
| Leases | 23 |
| | 24 |
| | 19 |
| | 18 |
| | 28 |
|
Qualitative (1) | 72 |
| | 35 |
| | — |
| | — |
| | — |
|
| Total commercial | 544 |
| | 498 |
| | 509 |
| | 691 |
| | 828 |
|
| Residential mortgages | 63 |
| | 104 |
| | 74 |
| | 105 |
| | 118 |
|
| Home equity loans | 50 |
| | 85 |
| | 82 |
| | 62 |
| | 71 |
|
| Home equity lines of credit | 152 |
| | 159 |
| | 107 |
| | 116 |
| | 112 |
|
Home equity loans serviced by others (2) | 47 |
| | 85 |
| | 146 |
| | 241 |
| | 316 |
|
Home equity lines of credit serviced by others (2) | 11 |
| | 18 |
| | 32 |
| | 52 |
| | 69 |
|
| Automobile | 58 |
| | 23 |
| | 30 |
| | 40 |
| | 41 |
|
| Student | 93 |
| | 83 |
| | 75 |
| | 73 |
| | 98 |
|
| Credit cards | 68 |
| | 72 |
| | 65 |
| | 72 |
| | 119 |
|
| Other retail | 32 |
| | 34 |
| | 46 |
| | 55 |
| | 77 |
|
Qualitative (1) | 77 |
| | 60 |
| | — |
| | — |
| | — |
|
| Total retail | 651 |
| | 723 |
| | 657 |
| | 816 |
| | 1,021 |
|
| Unallocated | — |
| | — |
| | 89 |
| | 191 |
| | 156 |
|
Total allowance for loan and lease losses — beginning |
| $1,195 |
| |
| $1,221 |
| |
| $1,255 |
| |
| $1,698 |
| |
| $2,005 |
|
| Gross Charge-offs: | | | | | | | | | |
| Commercial |
| ($30 | ) | |
| ($31 | ) | |
| ($72 | ) | |
| ($127 | ) | |
| ($170 | ) |
| Commercial real estate | (6 | ) | | (12 | ) | | (36 | ) | | (129 | ) | | (208 | ) |
| Leases | — |
| | — |
| | — |
| | (1 | ) | | — |
|
| Total commercial | (36 | ) | | (43 | ) | | (108 | ) | | (257 | ) | | (378 | ) |
| Residential mortgages | (22 | ) | | (36 | ) | | (54 | ) | | (85 | ) | | (98 | ) |
| Home equity loans | (34 | ) | | (55 | ) | | (77 | ) | | (121 | ) | | (124 | ) |
| Home equity lines of credit | (59 | ) | | (80 | ) | | (102 | ) | | (118 | ) | | (106 | ) |
Home equity loans serviced by others (2) | (32 | ) | | (55 | ) | | (119 | ) | | (220 | ) | | (300 | ) |
Home equity lines of credit serviced by others (2) | (14 | ) | | (12 | ) | | (27 | ) | | (48 | ) | | (66 | ) |
| Automobile | (117 | ) | | (41 | ) | | (19 | ) | | (29 | ) | | (47 | ) |
| Student | (51 | ) | | (54 | ) | | (74 | ) | | (88 | ) | | (97 | ) |
| Credit cards | (59 | ) | | (64 | ) | | (68 | ) | | (68 | ) | | (85 | ) |
| Other retail | (56 | ) | | (53 | ) | | (55 | ) | | (76 | ) | | (85 | ) |
| Total retail | (444 | ) | | (450 | ) | | (595 | ) | | (853 | ) | | (1,008 | ) |
| Total gross charge-offs |
| ($480 | ) | |
| ($493 | ) | |
| ($703 | ) | |
| ($1,110 | ) | |
| ($1,386 | ) |
| Gross Recoveries: | | | | | | | | | |
| Commercial |
| $18 |
| |
| $35 |
| |
| $46 |
| |
| $64 |
| |
| $42 |
|
| Commercial real estate | 31 |
| | 23 |
| | 40 |
| | 47 |
| | 47 |
|
| Leases | — |
| | — |
| | 1 |
| | 2 |
| | 3 |
|
| Total commercial | 49 |
| | 58 |
| | 87 |
| | 113 |
| | 92 |
|
| Residential mortgages | 12 |
| | 11 |
| | 10 |
| | 16 |
| | 15 |
|
| Home equity loans | 11 |
| | 24 |
| | 26 |
| | 27 |
| | 27 |
|
| Home equity lines of credit | 18 |
| | 15 |
| | 19 |
| | 9 |
| | 9 |
|
Home equity loans serviced by others (2) | 17 |
| | 21 |
| | 23 |
| | 22 |
| | 18 |
|
Home equity lines of credit serviced by others (2) | 8 |
| | 5 |
| | 5 |
| | 5 |
| | 4 |
|
| Automobile | 49 |
| | 20 |
| | 12 |
| | 21 |
| | 35 |
|
| Student | 12 |
| | 9 |
| | 13 |
| | 14 |
| | 12 |
|
| Credit cards | 8 |
| | 7 |
| | 7 |
| | 8 |
| | 9 |
|
| Other retail | 12 |
| | — |
| | — |
| | — |
| | — |
|
| Total retail | 147 |
| | 112 |
| | 115 |
| | 122 |
| | 129 |
|
| Total gross recoveries |
| $196 |
| |
| $170 |
| |
| $202 |
| |
| $235 |
| |
| $221 |
|
CITIZENS FINANCIAL GROUP, INC.
SELECTED STATISTICAL INFORMATION
|
| | | | | | | | | | | | | | | | | | | |
| | As of and for the Year Ended December 31, |
| (dollars in millions) | 2015 | | 2014 | | 2013 | | 2012 | | 2011 |
| Net (Charge-offs)/Recoveries: | | | | | | | | | |
| Commercial |
| ($12 | ) | |
| $4 |
| |
| ($26 | ) | |
| ($63 | ) | |
| ($128 | ) |
| Commercial real estate | 25 |
| | 11 |
| | 4 |
| | (82 | ) | | (161 | ) |
| Leases | — |
| | — |
| | 1 |
| | 1 |
| | 3 |
|
| Total commercial | 13 |
| | 15 |
| | (21 | ) | | (144 | ) | | (286 | ) |
| Residential mortgages | (10 | ) | | (25 | ) | | (44 | ) | | (69 | ) | | (83 | ) |
| Home equity loans | (23 | ) | | (31 | ) | | (51 | ) | | (94 | ) | | (97 | ) |
| Home equity lines of credit | (41 | ) | | (65 | ) | | (83 | ) | | (109 | ) | | (97 | ) |
Home equity loans serviced by others (2) | (15 | ) | | (34 | ) | | (96 | ) | | (198 | ) | | (282 | ) |
Home equity lines of credit serviced by others (2) | (6 | ) | | (7 | ) | | (22 | ) | | (43 | ) | | (62 | ) |
| Automobile | (68 | ) | | (21 | ) | | (7 | ) | | (8 | ) | | (12 | ) |
| Student | (39 | ) | | (45 | ) | | (61 | ) | | (74 | ) | | (85 | ) |
| Credit cards | (51 | ) | | (57 | ) | | (61 | ) | | (60 | ) | | (76 | ) |
| Other retail | (44 | ) | | (53 | ) | | (55 | ) | | (76 | ) | | (85 | ) |
| Total retail | (297 | ) | | (338 | ) | | (480 | ) | | (731 | ) | | (879 | ) |
| Total net (charge-offs)/recoveries |
| ($284 | ) | |
| ($323 | ) | |
| ($501 | ) | |
| ($875 | ) | |
| ($1,165 | ) |
| Ratio of net charge-offs to average loans and leases | 0.30 | % | | (0.36 | %) | | (0.59 | %) | | (1.01 | %) | | (1.35 | %) |
| Provision for Loan and Lease Losses: | | | | | | | | | |
| Commercial |
| $— |
| |
| $23 |
| |
| $13 |
| |
| $48 |
| |
| $123 |
|
| Commercial real estate | 25 |
| | (28 | ) | | (36 | ) | | (84 | ) | | 39 |
|
| Leases | — |
| | (1 | ) | | 4 |
| | — |
| | (13 | ) |
Qualitative (1) | 14 |
| | 37 |
| | — |
| | — |
| | — |
|
| Total commercial | 39 |
| | 31 |
| | (19 | ) | | (36 | ) | | 149 |
|
| Residential mortgages | (7 | ) | | (16 | ) | | 53 |
| | 38 |
| | 70 |
|
| Home equity loans | 12 |
| | (4 | ) | | 32 |
| | 114 |
| | 88 |
|
| Home equity lines of credit | 21 |
| | 58 |
| | 85 |
| | 100 |
| | 101 |
|
Home equity loans serviced by others (2) | (3 | ) | | (4 | ) | | 35 |
| | 103 |
| | 207 |
|
Home equity lines of credit serviced by others (2) | (2 | ) | | — |
| | 8 |
| | 23 |
| | 45 |
|
| Automobile | 116 |
| | 56 |
| | — |
| | (2 | ) | | 11 |
|
| Student | 42 |
| | 55 |
| | 69 |
| | 76 |
| | 60 |
|
| Credit cards | 43 |
| | 53 |
| | 71 |
| | 53 |
| | 29 |
|
| Other retail | 40 |
| | 51 |
| | 43 |
| | 67 |
| | 63 |
|
Qualitative (1) | 4 |
| | 17 |
| | — |
| | — |
| | — |
|
| Total retail | 266 |
| | 266 |
| | 396 |
| | 572 |
| | 674 |
|
| Unallocated | — |
| | — |
| | 103 |
| | (102 | ) | | 68 |
|
| Total provision for loan and lease losses |
| $305 |
| |
| $297 |
| |
| $480 |
| |
| $434 |
| |
| $891 |
|
Transfers - General Allowance to Qualitative Allowance: (1) | | | | | | | | | |
| Commercial |
| $— |
| |
| $— |
| |
| $35 |
| |
| $— |
| |
| $— |
|
| Retail | — |
| | — |
| | 60 |
| | — |
| | — |
|
| Unallocated | — |
| | — |
| | (95 | ) | | — |
| | — |
|
| Total Transfers |
| $— |
| |
| $— |
| |
| $— |
| |
| $— |
| |
| $— |
|
Retail Emergence Period Change: (3) | | | | | | | | | |
| Residential mortgages |
| $— |
| |
| $— |
| |
| $21 |
| |
| $— |
| |
| $— |
|
| Home equity loans | — |
| | — |
| | 22 |
| | — |
| | — |
|
| Home equity lines of credit | — |
| | — |
| | 53 |
| | — |
| | — |
|
| Total retail | — |
| | — |
| | 96 |
| | — |
| | — |
|
| Unallocated | — |
| | — |
| | (96 | ) | | — |
| | — |
|
| Total emergence period change |
| $— |
| |
| $— |
| |
| $— |
| |
| $— |
| |
| $— |
|
CITIZENS FINANCIAL GROUP, INC.
SELECTED STATISTICAL INFORMATION
|
| | | | | | | | | | | | | | | | | | | |
| | As of and for the Year Ended December 31, |
| (dollars in millions) | 2015 | | 2014 | | 2013 | | 2012 | | 2011 |
| Sale/Other: | | | | | | | | | |
| Commercial |
| $— |
| |
| $— |
| |
| ($5 | ) | |
| $— |
| |
| $— |
|
| Commercial real estate | — |
| | — |
| | (1 | ) | | (2 | ) | | — |
|
| Total commercial | — |
| | — |
| | (6 | ) | | (2 | ) | | — |
|
| Residential mortgages | — |
| | — |
| | — |
| | — |
| | — |
|
| Home equity loans | — |
| | — |
| | — |
| | — |
| | — |
|
| Home equity lines of credit | — |
| | — |
| | (3 | ) | | — |
| | — |
|
Home equity loans serviced by others (2) | — |
| | — |
| | — |
| | — |
| | — |
|
Home equity lines of credit serviced by others (2) | — |
| | — |
| | — |
| | — |
| | — |
|
| Automobile | — |
| | — |
| | — |
| | — |
| | — |
|
| Student | — |
| | — |
| | — |
| | — |
| | — |
|
| Credit cards | — |
| | — |
| | (3 | ) | | — |
| | — |
|
| Other retail | — |
| | — |
| | — |
| | — |
| | — |
|
| Total retail | — |
| | — |
| | (6 | ) | | — |
| | — |
|
| Unallocated | — |
| | — |
| | (1 | ) | | — |
| | (33 | ) |
| Total sale/other |
| $— |
| |
| $— |
| |
| ($13 | ) | |
| ($2 | ) | |
| ($33 | ) |
Total Allowance for Loan and Lease Losses — Ending: | | | | | | | | | |
| Commercial |
| $376 |
| |
| $388 |
| |
| $361 |
| |
| $379 |
| |
| $394 |
|
| Commercial real estate | 111 |
| | 61 |
| | 78 |
| | 111 |
| | 279 |
|
| Leases | 23 |
| | 23 |
| | 24 |
| | 19 |
| | 18 |
|
Qualitative (1) | 86 |
| | 72 |
| | 35 |
| | — |
| | — |
|
| Total commercial | 596 |
| | 544 |
| | 498 |
| | 509 |
| | 691 |
|
| Residential mortgages | 46 |
| | 63 |
| | 104 |
| | 74 |
| | 105 |
|
| Home equity loans | 39 |
| | 50 |
| | 85 |
| | 82 |
| | 62 |
|
| Home equity lines of credit | 132 |
| | 152 |
| | 159 |
| | 107 |
| | 116 |
|
Home equity loans serviced by others (2) | 29 |
| | 47 |
| | 85 |
| | 146 |
| | 241 |
|
Home equity lines of credit serviced by others (2) | 3 |
| | 11 |
| | 18 |
| | 32 |
| | 52 |
|
| Automobile | 106 |
| | 58 |
| | 23 |
| | 30 |
| | 40 |
|
| Student | 96 |
| | 93 |
| | 83 |
| | 75 |
| | 73 |
|
| Credit cards | 60 |
| | 68 |
| | 72 |
| | 65 |
| | 72 |
|
| Other retail | 28 |
| | 32 |
| | 34 |
| | 46 |
| | 55 |
|
Qualitative (1) | 81 |
| | 77 |
| | 60 |
| | — |
| | — |
|
| Total retail | 620 |
| | 651 |
| | 723 |
| | 657 |
| | 816 |
|
| Unallocated | — |
| | — |
| | — |
| | 89 |
| | 191 |
|
Total allowance for loan and lease losses — ending |
| $1,216 |
| |
| $1,195 |
| |
| $1,221 |
| |
| $1,255 |
| |
| $1,698 |
|
Reserve for Unfunded Lending Commitments — Beginning |
| $61 |
| |
| $39 |
| |
| $40 |
| |
| $61 |
| |
| $70 |
|
| Provision (Credit) for unfunded lending commitments | (3 | ) | | 22 |
| | (1 | ) | | (21 | ) | | (9 | ) |
Reserve for unfunded lending commitments — ending |
| $58 |
| |
| $61 |
| |
| $39 |
| |
| $40 |
| |
| $61 |
|
Total Allowance for Credit Losses — Ending |
| $1,274 |
| |
| $1,256 |
| |
| $1,260 |
| |
| $1,295 |
| |
| $1,759 |
|
(1) As discussed in Note 1 “Significant Accounting Policies” to our audited Consolidated Financial Statements in Part II, Item 8 — Financial Statements and Supplementary Data, included elsewhere in this report, the ALLL is reviewed separately for commercial and retail loans, and the ALLL for each includes an adjustment for qualitative allowance that includes certain risks, factors and events that might not be measured in the statistical analysis. As a result of this adjustment, the unallocated allowance was absorbed into the separately measured commercial and retail qualitative allowance during 2013.
(2) Our SBO portfolio consists of home equity loans and lines that were originally serviced by others. We now service a portion of this portfolio internally.
(3) During December 2013, we updated our estimate of the incurred loss period for certain residential mortgages. This change reflected an analysis of defaulted borrowers and aligned to management’s view that incurred but unrealized losses emerge differently during various points of an economic/business cycle. For further discussion, see Note 5 “Allowance for Credit Losses, Nonperforming Assets, and Concentrations of Credit Risk” to our audited Consolidated Financial Statements in Part II, Item 8 — Financial Statements and Supplementary Data, included elsewhere in this report.
CITIZENS FINANCIAL GROUP, INC.
SELECTED STATISTICAL INFORMATION
Allocation of the Allowance for Loan and Lease Losses
The following table presents an allocation of the ALLL by class and the percent of each class of loans and leases to the total loans and leases:
|
| | | | | | | | | | | | | | | | | | | | | | | | | | | | | |
| | December 31, |
| (dollars in millions) | 2015 | | 2014 | | 2013 | | 2012 | | 2011 |
| Commercial |
| $376 |
| 34 | % | |
| $388 |
| 34 | % | |
| $361 |
| 33 | % | |
| $379 |
| 33 | % | |
| $394 |
| 30 | % |
| Commercial real estate | 111 |
| 9 |
| | 61 |
| 8 |
| | 78 |
| 8 |
| | 111 |
| 7 |
| | 279 |
| 9 |
|
| Leases | 23 |
| 4 |
| | 23 |
| 4 |
| | 24 |
| 5 |
| | 19 |
| 4 |
| | 18 |
| 3 |
|
| Qualitative | 86 |
| N/A |
| | 72 |
| N/A |
| | 35 |
| N/A |
| | — |
| N/A |
| | — |
| N/A |
|
| Total commercial | 596 |
| 47 |
| | 544 |
| 46 |
| | 498 |
| 46 |
| | 509 |
| 44 |
| | 691 |
| 42 |
|
| Residential mortgages | 46 |
| 13 |
| | 63 |
| 13 |
| | 104 |
| 11 |
| | 74 |
| 11 |
| | 105 |
| 11 |
|
| Home equity loans | 39 |
| 3 |
| | 50 |
| 4 |
| | 85 |
| 5 |
| | 82 |
| 6 |
| | 62 |
| 8 |
|
| Home equity lines of credit | 132 |
| 15 |
| | 152 |
| 16 |
| | 159 |
| 18 |
| | 107 |
| 19 |
| | 116 |
| 19 |
|
Home equity loans serviced by others (1) | 29 |
| 1 |
| | 47 |
| 1 |
| | 85 |
| 2 |
| | 146 |
| 2 |
| | 241 |
| 3 |
|
Home equity lines of credit serviced by others (1) | 3 |
| — |
| | 11 |
| 1 |
| | 18 |
| 1 |
| | 32 |
| 1 |
| | 52 |
| 1 |
|
| Automobile | 106 |
| 14 |
| | 58 |
| 14 |
| | 23 |
| 11 |
| | 30 |
| 10 |
| | 40 |
| 9 |
|
| Student | 96 |
| 4 |
| | 93 |
| 2 |
| | 83 |
| 3 |
| | 75 |
| 3 |
| | 73 |
| 3 |
|
| Credit cards | 60 |
| 2 |
| | 68 |
| 2 |
| | 72 |
| 2 |
| | 65 |
| 2 |
| | 72 |
| 2 |
|
| Other retail | 28 |
| 1 |
| | 32 |
| 1 |
| | 34 |
| 1 |
| | 46 |
| 2 |
| | 55 |
| 2 |
|
| Qualitative | 81 |
| N/A |
| | 77 |
| N/A |
| | 60 |
| N/A |
| | — |
| N/A |
| | — |
| N/A |
|
| Total retail | 620 |
| 53 |
| | 651 |
| 54 |
| | 723 |
| 54 |
| | 657 |
| 56 |
| | 816 |
| 58 |
|
| Unallocated | N/A |
| N/A |
| | N/A |
| N/A |
| | N/A |
| N/A |
| | 89 |
| N/A |
| | 191 |
| N/A |
|
| Total loans and leases |
| $1,216 |
| 100 | % | |
| $1,195 |
| 100 | % | |
| $1,221 |
| 100 | % | |
| $1,255 |
| 100 | % | |
| $1,698 |
| 100 | % |
(1) Our SBO portfolio consists of home equity loans and lines that were originally serviced by others. We now service a portion of this portfolio internally.
Deposits
The following table presents the average balances and average interest rates paid for deposits. For further discussion, see Note 11 “Deposits” to our audited Consolidated Financial Statements in Part II, Item 8 — Financial Statements and Supplementary Data, included elsewhere in this report.
|
| | | | | | | | | | | | | | | | | |
| | For the Year Ended December 31, |
| (dollars in millions) | 2015 | | 2014 | | 2013 |
| | Average Balances |
| | | Average Balances |
| | | Average Balances |
| |
Noninterest-bearing demand deposits (1) (2) |
| $26,606 |
| | |
| $25,739 |
| | |
| $25,399 |
| |
| | Average Balances |
| Yields/ Rates |
| | Average Balances |
| Yields/ Rates |
| | Average Balances |
| Yields/ Rates |
|
| Checking with interest |
| $16,666 |
| 0.11 | % | |
| $14,507 |
| 0.08 | % | |
| $14,096 |
| 0.06 | % |
| Money market and savings | 43,458 |
| 0.27 |
| | 39,579 |
| 0.19 |
| | 42,575 |
| 0.25 |
|
| Term deposits | 12,424 |
| 0.82 |
| | 10,317 |
| 0.65 |
| | 11,266 |
| 0.80 |
|
Total interest-bearing deposits (1) (2) |
| $72,548 |
| 0.33 | % | |
| $64,403 |
| 0.24 | % | |
| $67,937 |
| 0.30 | % |
(1) The aggregate amount of deposits by foreign depositors in domestic offices was approximately $1.1 billion as of December 31, 2015, 2014 and 2013.
(2) Excludes deposits held for sale.
CITIZENS FINANCIAL GROUP, INC.
SELECTED STATISTICAL INFORMATION
Time Certificates of Deposit of $100,000 or More
The following table presents the amount of time certificates of deposit of $100,000 or more, segregated by time remaining until maturity:
|
| | | |
| (in millions) | December 31, 2015 |
| Three months or less |
| $3,136 |
|
| After three months through six months | 1,145 |
|
| After six months through twelve months | 1,329 |
|
| After twelve months | 675 |
|
| Total term deposits |
| $6,285 |
|
Return on Equity and Assets
The following table presents our return on average total assets, return on average common equity, dividend payout ratio and average equity to average assets ratio:
|
| | | | | | | | |
| | December 31, |
| | 2015 | | 2014 | | 2013 |
| Return on average total assets | 0.62 | % | | 0.68 | % | | (2.83 | )% |
| Return on average common equity | 4.30 |
| | 4.46 |
| | (15.69 | ) |
| Dividend payout ratio | 25.73 |
| | 92.05 |
| | (34.58 | ) |
| Average equity to average assets ratio | 14.46 |
| | 15.20 |
| | 18.06 |
|
Short-Term Borrowed FundsQuarterly Results of Operations
Short-term borrowed fundsThe following table presents unaudited quarterly Consolidated Statements of $10.5Operations data and Consolidated Balance Sheet data as of and for the four quarters of 2015 and 2014, respectively. We have prepared the Consolidated Statement of Operations data and Balance Sheet data on the same basis as our audited Consolidated Financial Statements in Part II, Item 8 — Financial Statements and Supplementary Data, included elsewhere in this report and, in the opinion of management, each Consolidated Statement of Operations and Balance Sheet includes all adjustments, consisting solely of normal recurring adjustments, necessary for the fair statement of the results of operations and balance sheet data as of and for these periods. This information should be read in conjunction with our audited Consolidated Financial Statements and the related notes, included elsewhere in this report.
Supplementary Summary Consolidated Financial and Other Data (unaudited) |
| | | | | | | | | | | | | | | | | | | | | | | | | | | | | | | |
| | For the Three Months Ended |
| (dollars in millions, except per share amounts) | December 31, 2015 | | September 30, 2015 | | June 30, 2015 | | March 31, 2015 | | December 31, 2014 | | September 30, 2014 | | June 30, 2014 | | March 31, 2014 |
| Operating Data: | | | | | | | | | | | | | | | |
| Net interest income |
| $870 |
| |
| $856 |
| |
| $840 |
| |
| $836 |
| |
| $840 |
| |
| $820 |
| |
| $833 |
| |
| $808 |
|
| Noninterest income | 362 |
| | 353 |
| | 360 |
| | 347 |
| | 339 |
| | 341 |
| | 640 |
| | 358 |
|
| Total revenue | 1,232 |
| | 1,209 |
| | 1,200 |
| | 1,183 |
| | 1,179 |
| | 1,161 |
| | 1,473 |
| | 1,166 |
|
| Provision for credit losses | 91 |
| | 76 |
| | 77 |
| | 58 |
| | 72 |
| | 77 |
| | 49 |
| | 121 |
|
| Noninterest expense | 810 |
| | 798 |
| | 841 |
| | 810 |
| | 824 |
| | 810 |
| | 948 |
| | 810 |
|
| Income before income tax expense | 331 |
| | 335 |
| | 282 |
| | 315 |
| | 283 |
| | 274 |
| | 476 |
| | 235 |
|
| Income tax expense | 110 |
| | 115 |
| | 92 |
| | 106 |
| | 86 |
| | 85 |
| | 163 |
| | 69 |
|
| Net income |
| $221 |
| |
| $220 |
| |
| $190 |
| |
| $209 |
| |
| $197 |
| |
| $189 |
| |
| $313 |
| |
| $166 |
|
| Net income available to common stockholders |
| $221 |
| |
| $213 |
| |
| $190 |
| |
| $209 |
| |
| $197 |
| |
| $189 |
| |
| $313 |
| |
| $166 |
|
Net income per average common share- basic (1) |
| $0.42 |
| |
| $0.40 |
| |
| $0.35 |
| |
| $0.38 |
| |
| $0.36 |
| |
| $0.34 |
| |
| $0.56 |
| |
| $0.30 |
|
Net income per average common share- diluted (1) |
| $0.42 |
| |
| $0.40 |
| |
| $0.35 |
| |
| $0.38 |
| |
| $0.36 |
| |
| $0.34 |
| |
| $0.56 |
| |
| $0.30 |
|
| Other Operating Data: | | | | | |
| | |
| | |
| | | | |
| | |
|
Return on average common equity (2) (3) | 4.51 | % | | 4.40 | % | | 3.94 | % | | 4.36 | % | | 4.06 | % | | 3.87 | % | | 6.41 | % | | 3.48 | % |
Return on average total assets (3) (4) | 0.64 |
| | 0.65 |
| | 0.56 |
| | 0.63 |
| | 0.60 |
| | 0.58 |
| | 0.99 |
| | 0.54 |
|
Net interest margin (3) (5) | 2.77 |
| | 2.76 |
| | 2.72 |
| | 2.77 |
| | 2.80 |
| | 2.77 |
| | 2.87 |
| | 2.89 |
|
| Stock Activity: | | | | | | | | | | | | | | | |
| Share Price: | | | | | | | | | | | | | | | |
| High |
| $27.17 |
| |
| $28.18 |
| |
| $28.71 |
| |
| $25.84 |
| |
| $25.60 |
| |
| $23.57 |
| |
| $— |
| |
| $— |
|
| Low | 22.48 |
| | 21.14 |
| | 24.03 |
| | 22.67 |
| | 21.47 |
| | 21.35 |
| | — |
| | — |
|
| Share Data: | | | | | | | | | | | | | | | |
| Cash dividends declared and paid per common share |
| $0.10 |
| |
| $0.10 |
| |
| $0.10 |
| |
| $0.10 |
| |
| $0.10 |
| |
| $0.68 |
| |
| $0.61 |
| |
| $0.04 |
|
| Dividend payout ratio | 24 | % | | 25 | % | | 28 | % | | 26 | % | | 28 | % | | 203 | % | | 110 | % | | 15 | % |
CITIZENS FINANCIAL GROUP, INC.
MANAGEMENT’S DISCUSSION AND ANALYSIS
|
| | | | | | | | | | | | | | | | | | | | | | | | | | | | | | | |
| | As of |
| (dollars in millions) | December 31, 2015 | | September 30, 2015 | | June 30, 2015 | | March 31, 2015 | | December 31, 2014 | | September 30, 2014 | | June 30, 2014 | | March 31, 2014 |
| Balance Sheet Data: | | | | | |
| | |
| | |
| | |
| | |
| | |
|
| Total assets |
| $138,208 |
| |
| $135,447 |
| |
| $137,251 |
| |
| $136,535 |
| |
| $132,857 |
| |
| $131,341 |
| |
| $130,279 |
| |
| $126,892 |
|
Loans and leases (6) | 99,042 |
| | 97,431 |
| | 96,538 |
| | 94,494 |
| | 93,410 |
| | 90,749 |
| | 88,829 |
| | 87,083 |
|
| Allowance for loan and lease losses | 1,216 |
| | 1,201 |
| | 1,201 |
| | 1,202 |
| | 1,195 |
| | 1,201 |
| | 1,210 |
| | 1,259 |
|
| Total securities | 24,075 |
| | 24,354 |
| | 25,134 |
| | 25,121 |
| | 24,704 |
| | 24,885 |
| | 24,854 |
| | 24,828 |
|
| Goodwill | 6,876 |
| | 6,876 |
| | 6,876 |
| | 6,876 |
| | 6,876 |
| | 6,876 |
| | 6,876 |
| | 6,876 |
|
| Total liabilities | 118,562 |
| | 115,847 |
| | 117,665 |
| | 116,971 |
| | 113,589 |
| | 111,958 |
| | 110,682 |
| | 107,450 |
|
Deposits(7) | 102,539 |
| | 101,866 |
| | 100,615 |
| | 98,990 |
| | 95,707 |
| | 93,463 |
| | 91,656 |
| | 87,462 |
|
| Federal funds purchased and securities sold under agreements to repurchase | 802 |
| | 1,293 |
| | 3,784 |
| | 4,421 |
| | 4,276 |
| | 5,184 |
| | 6,807 |
| | 6,080 |
|
| Other short-term borrowed funds | 2,630 |
| | 5,861 |
| | 6,762 |
| | 7,004 |
| | 6,253 |
| | 6,715 |
| | 7,702 |
| | 4,950 |
|
| Long-term borrowed funds | 9,886 |
| | 4,153 |
| | 3,890 |
| | 3,904 |
| | 4,642 |
| | 2,062 |
| | 1,732 |
| | 1,403 |
|
| Total stockholders’ equity | 19,646 |
| | 19,600 |
| | 19,586 |
| | 19,564 |
| | 19,268 |
| | 19,383 |
| | 19,597 |
| | 19,442 |
|
| Other Balance Sheet Data: | | | | | |
| | |
| | |
| | |
| | |
| | |
|
| Asset Quality Ratios: | | | | | |
| | |
| | |
| | |
| | |
| | |
|
| Allowance for loan and lease losses as a percentage of total loans and leases | 1.23 | % | | 1.23 | % | | 1.24 | % | | 1.27 | % | | 1.28 | % | | 1.32 | % | | 1.36 | % | | 1.45 | % |
| Allowance for loan and lease losses as a percentage of nonperforming loans and leases | 115 |
| | 116 |
| | 114 |
| | 106 |
| | 109 |
| | 111 |
| | 101 |
| | 92 |
|
| Nonperforming loans and leases as a percentage of total loans and leases | 1.07 |
| | 1.06 |
| | 1.09 |
| | 1.20 |
| | 1.18 |
| | 1.19 |
| | 1.35 |
| | 1.57 |
|
Capital ratios:(8) | | | | | |
| | |
| | |
| | |
| | |
| | |
|
CET1 capital ratio (9) | 11.7 |
| | 11.8 |
| | 11.8 |
| | 12.2 |
| | 12.4 |
| | 12.9 |
| | 13.3 |
| | 13.4 |
|
Tier1 capital ratio (10) | 12.0 |
| | 12.0 |
| | 12.1 |
| | 12.2 |
| | 12.4 |
| | 12.9 |
| | 13.3 |
| | 13.4 |
|
Total capital ratio (11) | 15.3 |
| | 15.4 |
| | 15.3 |
| | 15.5 |
| | 15.8 |
| | 16.1 |
| | 16.2 |
| | 16.0 |
|
Tier 1 leverage ratio (12) | 10.5 |
| | 10.4 |
| | 10.4 |
| | 10.5 |
| | 10.6 |
| | 10.9 |
| | 11.1 |
| | 11.4 |
|
(1) Earnings per share information reflects a 165,582-for-1 forward stock split effective on August 22, 2014.
(2) “Return on average common equity” is defined as net income available to common stockholders divided by average common equity.
(3) Ratios for the periods above are presented on an annualized basis.
(4) “Return on average total assets” is defined as net income divided by average total assets.
(5) “Net interest margin” is defined as net interest income divided by average total interest-earning assets.
(6) Excludes loans held for sale of $365 million, $420 million, $697 million, $376 million, $281 million, $208 million, $262 million, and $1.4 billion as of December 31, 2015, September 30, 2015, June 30, 2015, March 31, 2015, December 31, 2014, increased $3.5September 30, 2014, June 30, 2014 and March 31, 2014, respectively.
(7) Excludes deposits held for sale of $5.2 billion from $7.0 billionas of March 31, 2014.
(8) Basel III transitional rules for institutions applying the Standardized approach to calculating risk-weighted assets became effective January 1, 2015. The capital ratios and associated components for periods December 31, 2014 and prior are prepared under the Basel I general risk-based capital rule.
(9) CET1 under Basel III replaced the concept of tier 1 common capital that existed under Basel I effective January 1, 2015. “Common equity tier 1 capital ratio” as of December 31, , 2015 represents CET1 divided by total risk-weighted assets as defined under Basel III Standardized approach. The “tier 1 common capital ratio” reported prior to January 1, 2015, represented tier 1 common equity divided by total risk-weighted assets as defined under the Basel I general risk-based capital rule .
(10) “Tier 1 capital ratio” is tier 1 capital, which includes CET1 capital plus non-cumulative perpetual preferred equity that qualifies as additional tier 1 capital, divided by total risk-weighted assets as defined under Basel III Standardized approach. The “tier 1 capital ratio” reported prior to January 1, 2015, represented tier 1 capital divided by total risk-weighted assets as defined under the Basel I general risk-based capital rule.
(11) “Total capital ratio” is total capital divided by total risk-weighted assets as defined under Basel III Standardized approach. The “Total capital ratio” reported prior to January 1, 2015, represented total capital divided by total risk-weighted assets as defined under the Basel I general risk-based capital rule.
(12) “Tier 1 leverage ratio” is tier 1 capital divided by quarterly average total assets as defined under Basel III Standardized approach. The “tier 1 leverage ratio” reported prior to January 1, 2015, represented tier 1 capital divided by quarterly average total assets as defined under the Basel I general risk-based capital rule.
CITIZENS FINANCIAL GROUP, INC.
MANAGEMENT’S DISCUSSION AND ANALYSIS
Capital
As a bank holding company and a financial holding company, we are subject to regulation and supervision by the FRBG. Our primary subsidiaries are our two insured depository institutions, CBNA, a national banking association whose primary federal regulator is the OCC, and CBPA, a Pennsylvania-charted savings bank regulated by the Department of Banking of the Commonwealth of Pennsylvania and supervised by the FDIC as its primary federal regulator.
In July 2013, the FRB, OCC and FDIC issued the U.S. Basel III final rules. The rules implement the Basel Committee on Banking Supervision’s Basel III capital framework and certain provisions of the Dodd-Frank Act, including the Collins Amendment. The U.S. Basel III final rules substantially revised the risk-based capital and leverage requirements applicable to bank holding companies and their insured depository institution subsidiaries, including CBNA and CBPA. The U.S. Basel III final rules became effective for CFG and its depository institution subsidiaries, including CBNA and CBPA, on January 1, 2015 (subject to a phase-in period for certain provisions).
The U.S. Basel III final rules, among other things, (i) introduced a new capital measure called CET1, (ii) specified that Tier 1 capital consists of CET1 and “Additional Tier 1 capital” instruments meeting certain revised requirements, (iii) defined CET1 narrowly by requiring that most deductions/adjustments to regulatory capital measures be made to CET1 and not to the other components of capital, and (iv) expanded the scope of the deductions/ adjustments to capital as compared to existing regulations. Under the U.S. Basel III final rules, the minimum capital ratios effective as of January 1, 2015 are:
4.5% CET1 to risk-weighted assets;
6.0% Tier 1 capital (CET1 plus Additional Tier 1 capital) to risk-weighted assets;
8.0% Total capital (Tier 1 capital plus Tier 2 capital) to risk-weighted assets; and
4.0% Tier 1 capital to average consolidated assets as reported on consolidated financial statements (known as the “leverage ratio”).
The U.S. Basel III final rules also introduced a new “capital conservation buffer”, composed entirely of CET1, on top of these minimum risk-weighted asset ratios. The implementation of the capital conservation buffer began on January 1, 2016 at the 0.625% level and will increase by 0.625% on each subsequent January 1, until it reaches 2.5% on January 1, 2019. Banking institutions with a ratio of CET1 to risk-weighted assets below the effective minimum (4.5% plus the capital conservation buffer and, if applicable, the countercyclical capital buffer) will face constraints on dividends, equity repurchases and compensation based on the amount of the shortfall.
When fully phased in on January 1, 2019, the U.S. Basel III final rules will require CFG, CBNA and CBPA to maintain an additional capital conservation buffer of 2.5% of CET1, effectively resulting in minimum ratios of (i) CET1 to risk-weighted assets of at least 7%, (ii) Tier 1 capital to risk-weighted assets of at least 8.5%, (iii) a minimum ratio of Total capital to risk-weighted assets of at least 10.5%, and (iv) a minimum leverage ratio of 4%.
The U.S. Basel III final rules also provide for a number of deductions from and adjustments to CET1. These include, for example, the requirement that certain deferred tax assets and significant investments in non-consolidated financial entities be deducted from CET1 to the extent that any one such category exceeds 10% of CET1 or all such items, in the aggregate, exceed 15% of CET1. Implementation of the deductions and other adjustments to CET1 began on January 1, 2015 and will be phased-in over a 4-year period (beginning at 40% on January 1, 2015 and an additional 20% per year thereafter).
The U.S. Basel III final rules prescribe a standardized approach for risk weightings that expanded the risk-weighting categories from the general risk-based capital rules to a much larger and more risk-sensitive number of categories, depending on the nature of the assets, generally ranging from 0% for U.S. government and agency securities, to 600% for certain equity exposures, and resulting in higher risk weights for a variety of asset categories.
With respect to CBNA and CBPA, the U.S. Basel III final rules also revise the “prompt corrective action” regulations pursuant to Section 38 of the Federal Deposit Insurance Act, as discussed above in “Federal Deposit Insurance Act.”
CITIZENS FINANCIAL GROUP, INC.
MANAGEMENT’S DISCUSSION AND ANALYSIS
The table below presents our actual regulatory capital ratios as of December 31, 2015 under Basel III Transitional rules and as of December 31, 2014 under Basel I rules. In addition, the table includes pro forma Basel III ratios as of December 31, 2015, after full phase-in of all requirements to which we will be subject by January 1, 2019. Based on both current and fully phased-in Basel III requirements, all ratios remain well above current and future Basel III minima:
|
| | | | | | | | | | | | | | | | |
| | | Transitional Basel III | | Pro Forma Basel III Assuming Full Phase-in |
| | Actual Amount | Actual Ratio | Required Minimum | Well-Capitalized Minimum for Purposes of Prompt Corrective Action | | Actual Ratio(1) | Required Minimum + Required Capital Conservation Buffer for Non-Leverage Ratios | FDIA Required Well-Capitalized Minimum for Purposes of Prompt Corrective Action |
| Basel III Transitional as of December 31, 2015 | | | | |
Common equity tier 1 capital(2) |
| $13,389 |
| 11.7 | % | 4.5 | % | 6.5 | % | | 11.7 | % | 7.0 | % | 6.5 | % |
Tier 1 capital(3) | 13,636 |
| 12.0 |
| 6.0 |
| 8.0 |
| | 11.9 |
| 8.5 |
| 8.0 |
|
Total capital(4) | 17,505 |
| 15.3 |
| 8.0 |
| 10.0 |
| | 15.3 |
| 10.5 |
| 10.0 |
|
Tier 1 leverage(5) | 13,636 |
| 10.5 |
| 4.0 |
| 5.0 |
| | 10.5 |
| 4.0 |
| 5.0 |
|
| Basel I as of December 31, 2014 | | | | |
Tier 1 common equity(2) |
| $13,173 |
| 12.4 | % | Not Applicable | Not Applicable | | | | |
Tier 1 capital(3) | 13,173 |
| 12.4 |
| 4.0 | % | 6.0 | % | | | | |
Total capital(4) | 16,781 |
| 15.8 |
| 8.0 |
| 10.0 |
| | | | |
Tier 1 leverage(5) | 13,173 |
| 10.6 |
| 4.0 |
| 5.0 |
| | | | |
(1) These are non-GAAP financial measures. For more information on the computation of these non-GAAP financial measures, see “-Principal Components of Operations and Key Performance Metrics Used By Management - Key Performance Metrics and Non-GAAP Financial Measures.”
(2) CET1 under Basel III replaced the concept of tier 1 common capital that existed under Basel I effective January 1, 2015. “Common equity tier 1 capital ratio” as of December 31, 2015 represents CET1 divided by total risk-weighted assets as defined under Basel III Standardized approach. The “tier 1 common capital ratio” reported prior to January 1, 2015, represented tier 1 common equity divided by total risk-weighted assets as defined under the Basel I general risk-based capital rule.
(3) “Tier 1 capital ratio” is tier 1 capital, which includes CET1 capital plus non-cumulative perpetual preferred equity that qualifies as additional tier 1 capital, divided by total risk-weighted assets as defined under Basel III Standardized approach. The “tier 1 capital ratio” reported prior to January 1, 2015, represented tier 1 capital divided by total risk-weighted assets as defined under the Basel I general risk-based capital rule.
(4) “Total capital ratio” is total capital divided by total risk-weighted assets as defined under Basel III Standardized approach. The “Total capital ratio” reported prior to January 1, 2015, represented total capital divided by total risk-weighted assets as defined under the Basel I general risk-based capital rule.
(5) “Tier 1 leverage ratio” is tier 1 capital divided by quarterly average total assets as defined under Basel III Standardized approach. The “tier 1 leverage ratio” reported prior to January 1, 2015, represented tier 1 capital divided by quarterly average total assets as defined under the Basel I general risk-based capital rule.
Standardized Approach
The Basel III Standardized approach measures risk-weighted assets primarily for market risk and credit risk exposures. Exposures subject to market risk are measured on a basis generally consistent with how market risk-weighted assets were measured using the market risk rules as defined under the Basel 2.5. Refer to “—Market Risk — Market Risk Regulatory Capital,” for further information. CFG applies the Basel III standardized approach, as defined by the U.S. regulators, for determining the assignment of risk-weighted assets. Under the Standardized approach, which is the risk-weight methodology applicable to CFG, no distinction is made for variations in credit quality for corporate exposures. Additionally, the economic benefit of collateral is restricted to a limited list of eligible securities and cash. We estimate our common equity tier 1 capital ratio under the Basel III Standardized approach, on a fully phased-in basis, to be 11.7% at December 31, 2015. As of December 31, 2015, we estimated that our Basel III Standardized common equity tier 1 capital would be $13.4 billion and total risk-weighted assets would be $114.3 billion, on a fully-phased in basis. Our estimates under the Basel III Standardized approach may be refined over time because of further rulemaking or clarification by U.S. banking regulators or as our understanding and interpretation of the rules evolve. Actual results could differ from those estimates and assumptions.
CITIZENS FINANCIAL GROUP, INC.
MANAGEMENT’S DISCUSSION AND ANALYSIS
A reconciliation of Basel III Standardized Transitional approach to Basel III Standardized estimates on a fully-phased in basis for common equity tier 1 capital and risk-weighted assets, see the following table.
|
| | | |
| (dollars in millions) | December 31, 2015 |
| Common equity tier 1 capital |
| $13,389 |
|
| Impact of intangibles at 100% | (2 | ) |
Fully phased-in common equity tier 1 capital(1) |
| $13,387 |
|
| Total capital |
| $17,505 |
|
| Impact of intangibles at 100% | (2 | ) |
Fully phased in common total capital(1) |
| $17,503 |
|
| Risk-weighted assets |
| $114,084 |
|
| Impact of intangibles - 100% capital deduction | (2 | ) |
| Impact of mortgage servicing assets at 250% risk weight | 246 |
|
Fully phased-in risk-weighted assets(1) |
| $114,328 |
|
Transitional common equity tier 1 ratio(2) | 11.7 | % |
Fully phased-in common equity tier 1 ratio(1)(2) | 11.7 |
|
Transitional total capital ratio(3) | 15.3 |
|
Fully phased-in total capital ratio(1)(3) | 15.3 |
|
(1) These are non-GAAP financial measures.
(2) CET1 under Basel III replaced the concept of tier 1 common capital that existed under Basel I effective January 1, 2015. “Common equity tier 1 capital ratio” as of December 31, 2015 represents CET1 divided by total risk-weighted assets as defined under Basel III Standardized approach.
(3) “Total capital ratio” is total capital divided by total risk-weighted assets as defined under Basel III Standardized approach.
Regulatory Capital Ratios and Capital Composition
The following table presents capital and capital ratio information evidencing our transition from Basel I as of December 31, 2014 to Basel III Standardized as of December 31, 2015:
|
| | | | | | | | | | | | | | | | | |
| | | | | | | | FDIA Requirements |
| | Actual | | Minimum Capital Adequacy | | Classification as “Well Capitalized” |
| (dollars in millions) | Amount | Ratio | | Amount | Ratio | | Amount | Ratio |
| Basel III Transitional as of December 31, 2015 | | | | | | | | |
Common equity tier 1 capital(1) |
| $13,389 |
| 11.7 | % | |
| $5,134 |
| 4.5 | % | |
| $7,415 |
| 6.5 | % |
Tier 1 capital(2) | 13,636 |
| 12.0 |
| | 6,845 |
| 6.0 |
| | 9,127 |
| 8.0 |
|
Total capital(3) | 17,505 |
| 15.3 |
| | 9,127 |
| 8.0 |
| | 11,408 |
| 10.0 |
|
Tier 1 leverage(4) | 13,636 |
| 10.5 |
| | 5,218 |
| 4.0 |
| | 6,523 |
| 5.0 |
|
| Risk-weighted assets | 114,084 |
| | | | | | | |
| Quarterly adjusted average assets | 130,455 |
| | | | | | | |
| Basel I as of December 31, 2014 | | | | | | | | |
Tier 1 common equity(1) |
| $13,173 |
| 12.4 | % | | Not Applicable | Not Applicable | | Not Applicable | Not Applicable |
Tier 1 capital(2) | 13,173 |
| 12.4 |
| |
| $4,239 |
| 4.0 | % | |
| $6,358 |
| 6.0 | % |
Total capital(3) | 16,781 |
| 15.8 |
| | 8,477 |
| 8.0 |
| | 10,596 |
| 10.0 |
|
Tier 1 leverage(4) | 13,173 |
| 10.6 |
| | 4,982 |
| 4.0 |
| | 6,227 |
| 5.0 |
|
| Risk-weighted assets | 105,964 |
| | | | | | | |
| Quarterly adjusted average assets | 124,539 |
| | | | | | | |
(1) CET1 under Basel III replaced the concept of tier 1 common capital that existed under Basel I effective January 1, 2015. “Common equity tier 1 capital ratio” as of December 31, 2015 represents CET1 divided by total risk-weighted assets as defined under Basel III Standardized approach. The “tier 1 common capital ratio” reported prior to January 1, 2015, represented tier 1 common equity divided by total risk-weighted assets as defined under the Basel I general risk-based capital rule.
(2) “Tier 1 capital ratio” is tier 1 capital, which includes CET1 capital plus non-cumulative perpetual preferred equity that qualifies as additional tier 1 capital, divided by total risk-weighted assets as defined under Basel III Standardized approach. The “tier 1 capital ratio” reported prior to January 1, 2015, represented tier 1 capital divided by total risk-weighted assets as defined under the Basel I general risk-based capital rule.
(3) “Total capital ratio” is total capital divided by total risk-weighted assets as defined under Basel III Standardized approach. The “Total capital ratio” reported prior to January 1, 2015, represented total capital divided by total risk-weighted assets as defined under the Basel I general risk-based capital rule.
(4) “Tier 1 leverage ratio” is tier 1 capital divided by quarterly average total assets as defined under Basel III Standardized approach. The “tier 1 leverage ratio” reported prior to January 1, 2015, represented tier 1 capital divided by quarterly average total assets as defined under the Basel I general risk-based capital rule.
CITIZENS FINANCIAL GROUP, INC.
MANAGEMENT’S DISCUSSION AND ANALYSIS
CET1 capital under Basel III Standardized Transitional rules was $13.4 billion at December 31, 2015, an increase of $216 million from tier 1 common equity under Basel I at December 31, 2014. The increase was primarily attributable to net income for year ended December 31, 2015, net of dividends paid to stockholders, $500 million in aggregate repurchases of common shares executed on April 7, 2015 and August 3, 2015, and amortization of deferred tax related to goodwill. At December 31, 2015, there was approximately $247 million of additional tier 1 capital, reflecting the capital value after issuance costs of the 5.500% Fixed-to-Floating Non-Cumulative Perpetual Preferred Stock, Series A, issued on April 6, 2015. Tier 1 capital at December 31, 2015 was $13.6 billion, an increase of $463 million over the year, as approximately half of the repurchase of common shares was offset by the issuance of preferred shares. Total capital was $17.5 billion at December 31, 2015, an increase of $724 million from December 31, 2014 driven primarily by net income, net of dividends paid to stockholders, as the combined impact of the repurchase of common shares, issuance of preferred shares and issuance of $250 million in subordinated debt on July 31, 2015 was generally neutral to total capital.
On January 1, 2015, we began reporting risk-weighted assets based on Basel III Standardized Transitional rules. The conversion from Basel I rules resulted in a $4.0$2.7 billion increase in other short-term borrowed funds,RWAs as of December 31, 2014. This increase was primarily secured FHLB advances,driven by risk weight changes for securitization, off-balance sheet commitments with original maturity one year or less, past due and nonaccruals and the removal of the cap on OTC derivatives.
Risk-weighted assets based on Basel III Standardized Transitional rules at December 31, 2015 were $114.1 billion, an increase of $8.1 billion as compared to December 31, 2014. The primary drivers for this change were the adoption of the Basel III Standardized approach, as well as growth in commercial, consumer auto and student loan exposures.
As of December 31, 2015, the tier 1 leverage ratio decreased approximately 13 basis points. This decline reflected the net impact of a $5.9 billion increase in adjusted quarterly average total assets, which drove a 49 basis point decline in the ratio, and the previously noted increase in tier 1 capital, which added 36 basis points to the ratio.
The following table presents our capital composition under the Basel III capital framework in effect for us at December 31, 2015 and under the Basel I capital framework in effect for us at December 31, 2014:
|
| | | | | | | |
| | Transitional Basel III | | Basel I |
| (dollars in millions) | December 31, 2015 | | December 31, 2014 |
| Total common stockholders’ equity |
| $19,399 |
| |
| $19,268 |
|
Exclusions(1): | | | |
| Net unrealized (gains) losses recorded in accumulated other comprehensive income, net of tax: | | | |
| Debt and marketable equity securities available for sale | 28 |
| | (74 | ) |
| Derivatives | (10 | ) | | 69 |
|
| Unamortized net periodic benefit costs | 369 |
| | 377 |
|
| Deductions: | | | |
| Goodwill | (6,876 | ) | | (6,876 | ) |
| Deferred tax liability associated with goodwill | 480 |
| | 420 |
|
| Other intangible assets | (1 | ) | | (6 | ) |
| | | | |
| Disallowed mortgage servicing | — |
| | (5 | ) |
Total Common Equity Tier 1(2) | 13,389 |
| | 13,173 |
|
| Qualifying preferred stock | 247 |
| | — |
|
| Total Tier 1 Capital | 13,636 |
| | 13,173 |
|
| | | | |
| Qualifying long-term debt securities as tier 2 | 2,595 |
| | 2,350 |
|
| Allowance for loan and lease losses | 1,216 |
| | 1,195 |
|
| Allowance for credit losses for off-balance sheet exposure | 58 |
| | 61 |
|
| Unrealized gains on equity securities | — |
| | 2 |
|
| Total capital |
| $17,505 |
| |
| $16,781 |
|
(1) As a Basel III Standardized approach institution, we selected the one-time election to opt out of the requirements to include all the components of AOCI.
(2) CET1 under Basel III replaced the concept of tier 1 common capital that existed under Basel I effective January 1, 2015.
Capital Adequacy Process
Our assessment of capital adequacy begins with our risk appetite and risk management framework. This framework provides for the identification, measurement and management of material risks. Capital requirements are determined for actual
CITIZENS FINANCIAL GROUP, INC.
MANAGEMENT’S DISCUSSION AND ANALYSIS
and forecasted risk portfolios using applicable regulatory capital methodologies. The assessment also considers the possible impacts of approved and proposed regulatory changes that will or may apply to future periods. Key analytical frameworks, which enable the comprehensive assessment of capital adequacy versus unexpected loss, supplement our base case forecast. These supplemental frameworks include integrated stress testing, as well as an internal capital adequacy requirement that builds on internally assessed economic capital requirements. A robust governance framework supports our capital planning process. This process includes capital management policies and procedures that document capital adequacy metrics and limits, as well as our comprehensive capital contingency plan and the active engagement of both the legal-entity boards and senior management in oversight and decision-making.
Forward-looking assessments of capital adequacy for us and for our banking subsidiaries feed development of capital plans that are submitted to the FRBG and other bank regulators. We prepare these plans in full compliance with the FRBG’s Capital Plan Rule and we participate annually in the FRBG’s extensive CCAR review process. In addition to the stress test requirements under CCAR, we also participate in semiannual stress tests required by the Dodd-Frank Act.
In March 2015, the FRBG assessed our current capital plan in response to the CCAR process and issued a notice of non-objection. Unless we choose to file an amended capital plan prior to April 2016, the maximum levels at which we may declare dividends and repurchase shares of our common stock through June 30, 2016 are governed by the proposed capital actions and, are subject to actual financial performance, as well as ongoing compliance with internal governance and all other regulatory requirements.
Capital Transactions
During the year ended December 31, 2015, we completed the following capital actions:
Declared and paid common dividends of $0.10 per share, aggregating to dividend payments of approximately $55 million, $53 million, $53 million and $53 million, respectively, in the first, second, third and fourth quarters of 2015;
Issued 250,000 shares of the 5.500% Fixed-To-Floating Non-cumulative Perpetual Preferred Stock, Series A, on April 6, 2015, with aggregate liquidation value of $250 million and approximately $247 million of net capital value after deduction of fixed issuance costs;
Repurchased 10,473,397 of our outstanding common shares from RBS, on April 7, 2015, at a price of $23.87 per share reducing market and regulatory capital by approximately $250 million;
Issued $250 million aggregate principal amount 4.350% Subordinated Notes due 2025 on July 31, 2015;
Repurchased 9,615,384 of our outstanding common shares from RBS on August 3, 2015, at a price of $26.00 per share reducing market and regulatory capital by approximately $250 million;
Declared a semi-annual dividend of $27.50 per share on the 5.500% fixed-to-floating rate non-cumulative perpetual Series A Preferred Stock, aggregating to approximately $7 million, and paid on October 6, 2015;
Issued $750 million aggregate principal amount 4.300% Subordinated Notes due 2025 on December 3, 2015;
Repurchased $333 million aggregate principal amount of our 4.771% Subordinated Notes due 2023 from RBS, on December 3, 2015;
Repurchased $334 million aggregate principal amount of our 4.691% Subordinated Notes due 2024 from RBS, on December 3, 2015; and
Repurchased $83 million aggregate principal amount of our 4.153% Subordinated Notes due 2024 from RBS, on December 3, 2015.
The direct repurchase of subordinated debt from RBS and the public issuance of subordinated debt during the fourth quarter of 2015 were generally neutral to our total capital level and ratios. The repurchase of common shares and the issuance of subordinated debt during the third quarter of 2015 were neutral to our total capital level and ratios but reduced common equity by $250 million, and the CET1 and tier 1 risk-based ratios by 22 basis points. The repurchase of common shares and the issuance of preferred shares during the second quarter of 2015 were generally neutral to our tier 1 and total capital levels and ratios but reduced common equity by $250 million and the CET1 ratio by approximately 23 basis points.
We intend to continue to repurchase common stock and subordinated debt, as appropriate, subject to regulatory approval and market conditions.
At December 31, 2015, all regulatory ratios remained well above their respective fully phased-in Basel III minimum, which includes the capital conservation buffer for the risk-based ratios. Fully phased-in regulatory ratios are non-GAAP financial measures. For more information on computation of these non-GAAP financial measures, see “—Principal Components of
CITIZENS FINANCIAL GROUP, INC.
MANAGEMENT’S DISCUSSION AND ANALYSIS
Operations and Key Performance Metrics Used By Management — Key Performance Metrics and Non-GAAP Financial Measures,”
Banking Subsidiaries’ Capital
The following table presents our banking subsidiaries’ capital ratios under Basel I as of December 31, 2014 and Basel III Standardized Transitional rules as of December 31, 2015:
|
| | | | | | | | | | | |
| | Transitional Basel III | | Basel I |
| | December 31, 2015 | | December 31, 2014 |
| (dollars in millions) | Amount |
| Ratio | | Amount |
| Ratio |
| Citizens Bank, N.A. | | | | | |
Common equity tier 1 capital (1) |
| $10,754 |
| 11.7 | % | | Not Applicable | Not Applicable |
Tier 1 capital(2) | 10,754 |
| 11.7 |
| |
| $10,406 |
| 12.2 | % |
Total capital(3) | 13,132 |
| 14.3 |
| | 12,584 |
| 14.8 |
|
Tier 1 leverage(4) | 10,754 |
| 10.7 |
| | 10,406 |
| 10.9 |
|
| Risk-weighted assets | 91,625 |
| | | | |
| Quarterly adjusted average assets | 100,504 |
| | | | |
| Citizens Bank of Pennsylvania | | | | | |
Common equity tier 1 capital(1) |
| $3,017 |
| 13.0 | % | | Not Applicable | Not Applicable |
Tier 1 capital(2) | 3,017 |
| 13.0 |
| |
| $2,967 |
| 14.1 | % |
Total capital(3) | 3,559 |
| 15.4 |
| | 3,494 |
| 16.6 |
|
Tier 1 leverage(4) | 3,017 |
| 9.1 |
| | 2,967 |
| 9.5 |
|
| Risk-weighted assets | 23,179 |
| | | | |
| Quarterly adjusted average assets | 33,045 |
| | | | |
(1) Basel III introduced the concept of CET I effective January 1, 2015. “Common equity tier 1 capital ratio” as of December 31, 2015 represents CET1 divided by total risk-weighted assets as defined under Basel III Standardized approach.
(2) “Tier 1 capital ratio” is tier 1 capital, which includes CET1 capital plus non-cumulative perpetual preferred equity that qualifies as additional tier 1 capital, divided by total risk-weighted assets as defined under Basel III Standardized approach. The “tier 1 capital ratio” reported prior to January 1, 2015, represented tier 1 capital divided by total risk-weighted assets as defined under the Basel I general risk-based capital rule.
(3) “Total capital ratio” is total capital divided by total risk-weighted assets as defined under Basel III Standardized approach. The “Total capital ratio” reported prior to January 1, 2015, represented total capital divided by total risk-weighted assets as defined under the Basel I general risk-based capital rule.
(4) “Tier 1 leverage ratio” is tier 1 capital divided by quarterly average total assets as defined under Basel III Standardized approach. The “tier 1 leverage ratio” reported prior to January 1, 2015, represented tier 1 capital divided by quarterly average total assets as defined under the Basel I general risk-based capital rule.
CBNA CET1 capital under Basel III Standardized Transitional rules was $10.8 billion at December 31, 2015, an increase of $348 million from tier 1 common equity under Basel I at December 31, 2014. The increase was primarily attributable to net income for the year ended December 31, 2015, net of dividends paid to CFG. At December 31, 2015, CBNA held minimal additional tier 1 capital. Total capital was $13.1 billion at December 31, 2015, an increase of $548 million driven primarily by the increase in CET1 capital.
On January 1, 2015, CBNA began reporting risk-weighted assets based on Basel III Standardized Transitional rules. The conversion from Basel I rules resulted in a $2.0 billion increase in RWAs as of December 31, 2014. This increase was primarily driven by risk weight changes for securitizations, commercial past due and nonaccruals, off-balance sheet commitments with an original maturity one year or less and the removal of the cap on OTC derivatives.
CBNA risk-weighted assets based on Basel III Standardized Transitional rules at December 31, 2015 were $91.6 billion, an increase of $6.3 billion as compared to December 31, 2014. The primary drivers for this change were the adoption of the Basel III Standardized approach, as well as growth in commercial, student and consumer auto loan exposures. These increases were partially offset by run off in home lending exposures.
As of December 31, 2015, the CBNA tier 1 leverage ratio decreased approximately 18 basis points, driven by an increase in adjusted quarterly average total assets of $4.9 billion resulting in a 54 basis point decline in the ratio, partially offset by a 36 basis point increase for higher CET1 capital described above.
CBPA CET1 capital under Basel III Standardized Transitional rules was $3.0 billion at December 31, 2015, an increase of $50 million from tier 1 common equity under Basel I at December 31, 2014. The increase was primarily attributable to amortization of deferred tax related to goodwill, as net income for the year ended December 31, 2015, net of dividends paid to CFG, was flat compared to 2014. At December 31, 2015, there was no additional tier 1 capital. Total capital was $3.6 billion at December 31, 2015, an increase of $65 million driven primarily by the increase in CET1 capital and a slight increase in allowance for credit losses.
CITIZENS FINANCIAL GROUP, INC.
MANAGEMENT’S DISCUSSION AND ANALYSIS
On January 1, 2015, CBPA began reporting risk-weighted assets based on Basel III Standardized Transitional rules. The conversion from Basel I rules resulted in a $705 million increase in RWAs as of December 31, 2014. This increase was primarily driven by risk-weight changes for off-balance sheet commitments with an original maturity one year or less, securitizations and the removal of the cap on OTC derivatives.
CBPA risk-weighted assets based on Basel III Standardized Transitional rules at December 31, 2015 were $23.2 billion, an increase of $2.1 billion as compared to December 31, 2014. The primary drivers for this change were the adoption of the Basel III Standardized approach, as well as growth in commercial, student loans and purchased auto loan exposures.
As of December 31, 2015, the CBPA tier 1 leverage ratio decreased approximately 37 basis points, driven by an increase in adjusted quarterly average total assets of $1.8 billion resulting in a 52 basis point decline in the ratio, partially offset by a 15 basis point increase resulting from higher CET1 capital described above.
Liquidity
We define liquidity as an institution’s ability to meet its cash-flow and collateral obligations in a timely manner, at a reasonable cost. An institution must maintain current liquidity to fund its daily operations and forecasted cash-flow needs as well as contingent liquidity to deliver funding in a stress scenario. We consider the effective and prudent management of liquidity to be fundamental to our health and strength.
We manage liquidity at the consolidated enterprise level and at each material legal entity, including us, CBNA and CBPA.
CFG Liquidity
Our primary sources of cash are (i) dividends and interest received from our banking subsidiaries as a result of investing in bank equity and subordinated debt and (ii) externally issued subordinated debt. Our uses of liquidity include the following: (i) routine cash flow requirements as a bank holding company, including payments of dividends, interest and expenses; (ii) needs of subsidiaries, including our banking subsidiaries, for additional equity and, as required, their needs for debt financing; and (iii) extraordinary requirements for cash.
On July 31, 2015, we issued $250 million aggregate principal amount 4.350% Subordinated Notes due 2025 in a public underwritten offering. We used the net proceeds of this offering to repurchase 9,615,384 shares of our outstanding common stock directly from RBS at $26.00 per share.
Our cash and cash equivalents represent a source of liquidity that can be used to meet various needs. As of December 31, 2015, we held cash and cash equivalents of approximately $400 million, which should be viewed as a liquidity reserve.
Our liquidity risk is low for the following reasons: (i) we have no material non-banking subsidiaries, and our banking subsidiaries are self-funding; (ii) we have no outstanding senior debt at the CFG level; (iii) the capital structures of our banking subsidiaries are similar to our capital structure. As of December 31, 2015, our double leverage ratio (the combined equity of our subsidiaries divided by our equity) was 101.4%; and, (iv) our other cash flow requirements, such as operating expenses, are relatively small.
Banking Subsidiaries’ Liquidity
In the ordinary course of business, the liquidity of CBNA and CBPA is managed by matching sources and uses of cash. The primary sources of bank liquidity include (i) deposits from our consumer and commercial franchise customers; (ii) payments of principal and interest on loans and debt securities; and (iii) wholesale borrowings, as needed, and as described under “—Liquidity Risk Management and Governance.” The primary uses of bank liquidity include (i) withdrawals and maturities of deposits; (ii) payment of interest on deposits; (iii) funding of loan commitments; and (iv) funding of securities purchases. To the extent that the banks have relied on wholesale borrowings, uses also include payments of related principal and interest.
Our banking subsidiaries’ major businesses involve taking deposits and making loans. Hence, a key role of liquidity management is to ensure that customers have timely access to funds from deposits and loans. Liquidity management also involves maintaining sufficient liquidity to repay wholesale borrowings, pay operating expenses and support extraordinary funding requirements when necessary.
From an external issuance perspective, during 2014, we created a $3.0 billion Global Note Program for CBNA. On December 3, 2015, CBNA issued $750 million in three-year fixed-rate senior notes under this program. This debt represents a key source of unsecured, term, and stable funding, further diversifies the funding sources of CBNA, and creates a more peer-like funding structure for the consolidated enterprise. Additionally, on December 1, 2014, CBNA issued $1.5 billion in senior notes under this program, consisting of $750 million of three-year fixed-rate notes and $750 million in five-year fixed-rate notes.
CITIZENS FINANCIAL GROUP, INC.
MANAGEMENT'SMANAGEMENT’S DISCUSSION AND ANALYSIS
Liquidity Risk
We define liquidity risk as the risk that an entity will be unable to meet our payment obligations in a timely manner. We manage liquidity risk at the consolidated enterprise level, and for each material legal entity including us, CBNA and CBPA. Liquidity risk can arise due to contingent liquidity risk and/or funding liquidity risk.
Contingent liquidity risk is the risk that market conditions may reduce an entity’s ability to liquidate, pledge and/or finance certain assets and thereby substantially reduce the liquidity value of such assets. Drivers of contingent liquidity risk include general market disruptions as well as specific issues regarding the credit quality and/or valuation of a security or loan, issuer or borrower and/or asset class.
Funding liquidity risk is the risk that market conditions and/or entity-specific events may reduce an entity’s ability to raise funds from depositors and/or wholesale market counterparties. Drivers of funding liquidity risk may be idiosyncratic or systemic, reflecting impediments to operations and/or undermining of market confidence.
Factors Affecting Liquidity
Given the impactcomposition of their assets and borrowing sources, contingent liquidity at both CBNA and CBPA would be materially affected by such events as deterioration of financing markets for high-quality securities (e.g., mortgage-backed securities and other instruments issued by the GNMA, FNMA and the FHLMC), by any inability of the FHLBs to provide collateralized advances and/or by a refusal of the FRB to act as lender of last resort in systemic stress. Given the quality of our unencumbered securities, the positive track record of the FHLBs in stress and the commitment of the FRB to continue as lender of last resort in systemic stress scenarios, we view contingent liquidity risk at our banking subsidiaries, both CBNA and CBPA, to be relatively modest, given the size and configuration of their respective balance sheets.
Given the structure of their balance sheets, funding liquidity of CBNA and CBPA would be materially affected by an adverse idiosyncratic event (e.g., a major loss, causing a perceived or actual deterioration in its financial condition), an adverse systemic event (e.g., default or bankruptcy of a significant capital markets participant), or a combination of both growth(e.g., the financial crisis of 2008-2010). However, during the financial crisis, our banking subsidiaries reduced their dependence on unsecured wholesale funding to virtually zero. Consequently, and despite ongoing exposure to a variety of idiosyncratic and systemic events, we view our funding liquidity risk to be relatively modest.
An additional variable affecting our access, and the access of our banking subsidiaries, to unsecured wholesale market funds and to large denomination (i.e., uninsured) customer deposits is the credit ratings assigned by such agencies as Moody’s, Standard & Poor’s and Fitch. The following table presents our credit ratings:
|
| | | | | | |
| | December 31, 2015 |
| | Moody’s | | Standard and Poor’s | | Fitch |
|
| Citizens Financial Group, Inc.: | | | | | |
| Long-term issuer | NR | | BBB+ | | BBB+ |
| Short-term issuer | NR | | A-2 | | F2 |
| Subordinated debt | NR | | BBB | | BBB |
| Preferred Stock | NR | | BB+ | | BB- |
| Citizens Bank, N.A.: | | | | | |
| Long-term issuer | Baa1 | | A- | | BBB+ |
| Short-term issuer | NR | | A-2 | | F2 |
| Long-term deposits | A1 | | NR | | A- |
| Short-term deposits | P-1 | | NR | | F2 |
| Citizens Bank of Pennsylvania: | | | | | |
| Long-term issuer | Baa1 | | A- | | BBB+ |
| Short-term issuer | NR | | A-2 | | F2 |
| Long-term deposits | A1 | | NR | | A- |
| Short-term deposits | P-1 | | NR | | F2 |
| NR = Not rated | | | | | |
Changes in interest-earningour public credit ratings could affect both the cost and availability of our wholesale funding. As a result and in order to maintain a conservative funding profile, our banking subsidiaries continue to minimize reliance on unsecured wholesale funding. At December 31, 2015, the majority of wholesale funding consisted of secured borrowings primarily FHLB advances secured primarily by high-quality residential loan collateral. Our dependence on short-term, unsecured and credit-sensitive funding continues to be relatively low.
CITIZENS FINANCIAL GROUP, INC.
MANAGEMENT’S DISCUSSION AND ANALYSIS
Existing and evolving regulatory liquidity requirements represent another key driver of systemic liquidity conditions and liquidity management practices. The FRBG evaluates our liquidity as part of the supervisory process, and the Federal Reserve Board recently issued regulations that will require us to conduct regular liquidity stress testing over various time horizons and to maintain a buffer of highly liquid assets sufficient to cover expected net cash outflows and projected loss or impairment of funding sources for a short-term liquidity stress scenario. In addition, the Basel Committee has developed a set of internationally-agreed upon quantitative liquidity metrics: the LCR and the NSFR.
The LCR was developed to ensure banks have sufficient high-quality liquid assets to cover expected net cash outflows over a 30-day liquidity stress period. In September 2014, the U.S. federal banking regulators published the final rule to implement the LCR. This rule also introduced a modified version of the LCR in the United States, which generally applies to BHCs not active internationally (institutions with less than $10 billion of on-balance sheet foreign exposure), with total assets of greater than $50 billion but less than $250 billion. Under this definition, we are designated as a modified LCR company. As compared to the Basel Committee’s version of the LCR, the version of the LCR issued by the U.S. federal banking regulators includes a narrower definition of high-quality liquid assets, different prescribed cash inflow and outflow assumptions for certain types of instruments and transactions and a shorter phase-in schedule that began on January 1, 2015 and ends on January 1, 2017. Notably, as a modified LCR company, we were required to be 90% compliant beginning in January 2016, and 100% compliant beginning in January 2017. Achieving sustainable LCR compliance may require changes in the size and/or composition of our investment portfolio, the configuration of our discretionary wholesale funding portfolio, and our average cash position. We were compliant with the LCR as of December 31, 2015, and we were fully compliant with the LCR as of the required implementation date of January 2016.
The NSFR was developed to provide a sustainable maturity structure of assets and liabilities and has a $5.3 billion decreasetime horizon of one year. The Basel Committee contemplates that the NSFR, including any revisions, will be implemented as a minimum standard by January 1, 2018; however, the U.S. federal banking regulators have not yet published a proposed rule to implement the NSFR in the United States.
We continue to review and monitor these liquidity requirements to develop appropriate implementation plans and liquidity strategies. We expect to be fully compliant with the final rules on or prior to the applicable effective date.
Liquidity Risk Management and Governance
Liquidity risk is measured and managed by the Funding and Liquidity Unit within our Treasury unit in accordance with policy guidelines promulgated by our Board and the Asset and Liability Management Committee. In managing liquidity risk, the Funding and Liquidity Unit delivers regular and comprehensive reporting, including current levels versus threshold limits for a broad set of liquidity metrics, explanatory commentary relating to emerging risk trends and, as appropriate, recommended remedial strategies.
The mission of our Funding and Liquidity Unit is to deliver prudent levels of current, projected and contingent liquidity from stable sources, in a timely manner and at a reasonable cost, without significant adverse consequences.
We seek to accomplish this mission by funding loans with stable deposits; by prudently controlling dependence on wholesale funding, particularly short-term unsecured funding; and by maintaining ample available liquidity, including a contingent liquidity buffer of unencumbered high-quality loans and securities.
As of December 31, 2015:
Core deposits, including loans and deposits held for sale, relatedcontinued to the Chicago Divestiture.be our primary source of funding and our consolidated year-end loan-to-deposit ratio was 96.9%;
As of December 31, 2014,Short-term unsecured wholesale funding was $527 million, substantially offset by our total contingent liquidity was $19.5 billion, consisting of net cash at the Federal Reserveovernight position (which is defined as total excess cash balances held at the Federal Reserve Banks plus federal funds sold minus federal funds purchased) of $1.5 billion,$2.0 billion;
Contingent liquidity was $23.1 billion; net overnight position (defined above), totaled $2.0 billion; unencumbered high-qualityliquid securities totaling $14.5 billiontotaled $17.0 billion; and unusedavailable FHLB capacity primarily secured by mortgage loans totaled $4.1 billion; and
Available discount window capacity, defined as available total borrowing capacity from the Federal Reserve based on identified collateral, is secured by non-mortgage commercial and consumer loans and totaled $11.0 billion. Use of approximately $3.5 billion. Additionally, unencumbered loans pledgedthis borrowing capacity would likely be considered only during exigent circumstances.
CITIZENS FINANCIAL GROUP, INC.
MANAGEMENT’S DISCUSSION AND ANALYSIS
The Funding and Liquidity Unit monitors a variety of liquidity and funding metrics, including specific risk threshold limits. The metrics are broadly classified as follows:
Current liquidity sources and capacities, including excess cash at the Federal Reserve Banks, free and liquid securities and available and secured FHLB borrowing capacity;
Contingent stressed liquidity, including idiosyncratic, systemic and combined stress scenarios, in addition to evolving regulatory requirements such as the LCR and the NSFR; and
Current and prospective exposures, including secured and unsecured wholesale funding and spot and cumulative cash-flow gaps across a variety of $8.3horizons.
Further, certain of these metrics are monitored for each of us, our banking subsidiaries, and for our consolidated enterprise on a daily basis, including net overnight position, unencumbered securities, internal liquidity, available FHLB borrowing capacity and total contingent liquidity. In order to identify emerging trends and risks and inform funding decisions, specific metrics are also forecasted over a one-year horizon.
Cash flows from operating activities contributed $1.2 billion created totalin 2015. Net cash used by investing activities was $5.9 billion, primarily reflecting net securities available liquidityfor sale portfolio purchases of approximately $27.8$6.8 billion and a net increase in loans and leases of $6.0 billion, partially offset by proceeds from maturities, paydowns and sales of securities available for sale of $7.3 billion.
Long-Term Borrowed Funds
Long-term Cash provided by financing activities was $4.5 billion, driven by a net increase in deposits of $6.8 billion and proceeds from long-term borrowed funds of $4.6$6.8 billion, partially offset by a decrease in federal funds purchased and securities sold under agreement to repurchase of $3.5 billion, a decrease in other short-term borrowed funds of $4.4 billion and repayments of long-term borrowed funds of $766 million. These activities represented a cumulative decrease in cash and cash equivalents of $191 million, which, when added to the cash and cash equivalents balance of $3.3 billion at the beginning of the year, resulted in an ending balance of cash and cash equivalents of $3.1 billion as of December 31, 2015.
For the year ended December 31, 2014, increased $3.2our operating activities contributed $1.4 billion in net cash, including an increase in other liabilities, which added $239 million, and an increase in depreciation, amortization and accretion, which added $386 million, partially offset by an increase in other assets of $295 million and a gain on sale of deposits of $286 million. For the year ended December 31, 2014, net cash used by investing activities was $10.3 billion, primarily reflecting net securities available for sale portfolio purchases of $8.3 billion, a net increase in loans and leases of $6.9 billion and securities held to maturity portfolio purchases of $1.2 billion, partially offset by proceeds from $1.4maturities, paydowns and sales of securities available for sale of $6.3 billion. Cash provided by financing activities was $9.4 billion, including a net increase in other short-term borrowed funds of $4.0 billion and a net increase in deposits of $3.8 billion. These activities represented a cumulative increase in cash and cash equivalents of $519 million, which, when added to the cash and cash equivalents balance of $2.8 billion at the beginning of the year, resulted in an ending balance of cash and cash equivalents of $3.3 billion as of December 31, 2013 driven by a $1.5 billion increase related to our issuance of senior unsecured debt and a $1.0 billion issuance of subordinated debt in connection with our capital exchange transactions with RBS Group. In 2014, CBNA established a $3.0 billion Global Bank Note Program (“Program”) and on December 1, 2014, issued $1.5 billion in senior notes, consisting of $750 million of three-year fixed-rate notes, and $750 million of five-year fixed-rate notes. This Program represents a key source of unsecured, stable funding, and further diversified funding sources for CBNA, as we continue to migrate to a more peer-like funding structure for the consolidated enterprise.
Access to additional funding through repurchase agreements, collateralized borrowed funds or asset sales is available. Additionally, there is capacity to grow deposits. While access to short-term wholesale markets is limited, we have been able to meet our funding needs for the medium term with deposits and collateralized borrowed funds.
2014.
DerivativesContractual Obligations
We use derivatives to manage interest-rate risk which are grouped into three categories according to hedged item and strategy.
Historically, we used pay-fixed swaps to synthetically lengthen liabilities and offset duration in fixed-rate assets. Since 2008, we elected to terminate or runoff the existing pay-fixed swap notional balances which totaled $1.0 billionThe following table presents our outstanding contractual obligations as of December 31, 2015:
|
| | | | | | | | | | | | | | | |
| (in millions) | Total |
| Less than 1 year |
| 1 to 3 years |
| 3 to 5 years |
| After 5 years |
|
Long-term borrowed funds (1) |
| $9,886 |
|
| $— |
|
| $6,517 |
|
| $755 |
|
| $2,614 |
|
| Operating lease obligations | 817 |
| 190 |
| 298 |
| 149 |
| 180 |
|
Term deposits (1) | 12,024 |
| 9,994 |
| 1,737 |
| 287 |
| 6 |
|
Purchase obligations (2) | 675 |
| 491 |
| 79 |
| 48 |
| 57 |
|
| Total outstanding contractual obligations |
| $23,402 |
|
| $10,675 |
|
| $8,631 |
|
| $1,239 |
|
| $2,857 |
|
(1) Deposits and borrowed funds exclude interest.
(2) Includes purchase obligations for goods and services covered by non-cancelable contracts and contracts including cancellation fees.
CITIZENS FINANCIAL GROUP, INC.
MANAGEMENT’S DISCUSSION AND ANALYSIS
Off-Balance Sheet Commitments
The following table presents our outstanding off-balance sheet commitments. See Note 17 “Commitments and Contingencies” to our audited Consolidated Financial Statements in Part II, Item 8 — Financial Statements and Supplementary Data, included elsewhere in this report:
|
| | | | | | | | | | | | | | |
| | December 31, | | | | |
| (dollars in millions) | 2015 |
| | 2014 |
| | Change |
| | Percent |
|
| Commitment amount: | | | | | | | |
| Undrawn commitments to extend credit |
| $56,524 |
| |
| $55,899 |
| |
| $625 |
| | 1 | % |
| Financial standby letters of credit | 2,010 |
| | 2,315 |
| | (305 | ) | | (13 | ) |
| Performance letters of credit | 42 |
| | 65 |
| | (23 | ) | | (35 | ) |
| Commercial letters of credit | 87 |
| | 75 |
| | 12 |
| | 16 |
|
| Marketing rights | 47 |
| | 51 |
| | (4 | ) | | (8 | ) |
| Risk participation agreements | 26 |
| | 19 |
| | 7 |
| | 37 |
|
| Residential mortgage loans sold with recourse | 10 |
| | 11 |
| | (1 | ) | | (9 | ) |
| Total |
| $58,746 |
| |
| $58,435 |
| |
| $311 |
| | 1 | % |
In November 2015, the Company entered into an agreement with RBS to purchase $500 million of its subordinated notes held by RBS by July 30, 2016, subject to regulatory approval and rating agency considerations. See Note 19 “Related Party Transactions and Significant Transactions with RBS,” to our audited Consolidated Financial Statements in Part II, Item 8 — Financial Statements and Supplementary Data, included elsewhere in this report.
In June 2015, we amended our agreement originally entered into in May 2014, to purchase automobile loans on a quarterly basis in future periods. Commencing on the effective date and through July 31, 2015, the amended agreement requires the purchase of a minimum of $250 million of outstanding balances to a maximum of $600 million per quarterly period. For quarterly periods on or after August 1, 2015, the minimum and maximum purchases are $50 million and $200 million, respectively. The agreement automatically renews until terminated by either party. We may cancel the agreement at will with payment of a variable termination fee. After three years, there is no termination fee.
On January 7, 2016, the Company entered into an agreement to purchase student loans on a quarterly basis beginning with the first calendar quarter in 2016 and ending with the fourth calendar quarter in 2016. Under the terms of the agreement, the Company committed to purchase a minimum of $125 million of loans per quarter. The minimum and maximum amount of the aggregate purchase principal balance of loans under the terms of the agreement are $500 million and $1 billion, respectively. The agreement will terminate immediately if at any time during its term the aggregate purchase principal balance of loans equals the maximum amount. The agreement may be extended by written agreement of the parties for an additional four quarters. The Company may terminate the agreement at will with payment of a termination fee equal to the product of $1 million times the number of calendar quarters remaining in the term.
Critical Accounting Estimates
Our audited Consolidated Financial Statements, which are included elsewhere in this report, are prepared in accordance with GAAP. The preparation of financial statements in conformity with GAAP requires us to establish accounting policies and make estimates that affect amounts reported in our audited Consolidated Financial Statements.
An accounting estimate requires assumptions and judgments about uncertain matters that could have a material effect on our audited Consolidated Financial Statements. Estimates are made using facts and circumstances known at a point in time. Changes in those facts and circumstances could produce results substantially different from those estimates. The most significant accounting policies and estimates and their related application are discussed below.
See Note 1 “Significant Accounting Policies” to our audited Consolidated Financial Statements in Part II, Item 8 — Financial Statements and Supplementary Data, included elsewhere in this report, for further discussion of our significant accounting policies.
CITIZENS FINANCIAL GROUP, INC.
MANAGEMENT’S DISCUSSION AND ANALYSIS
Allowance for Credit Losses
Management’s estimate of probable losses in our loan and lease portfolios including unfunded lending commitments is recorded in the ALLL and the reserve for unfunded lending commitments, at levels that we believe to be appropriate as of the balance sheet date. Our determination of such estimates is based on a periodic evaluation of the loan and lease portfolios and unfunded credit facilities, as well as other relevant factors. This evaluation is inherently subjective and requires significant estimates and judgments of underlying factors, all of which are susceptible to change.
The ALLL and reserve for unfunded lending commitments could be affected by a variety of internal and external factors. Internal factors include portfolio performance such as delinquency levels, assigned risk ratings, the mix and level of loan balances, differing economic risks associated with each loan category and the financial condition of specific borrowers. External factors include fluctuations in the general economy, unemployment rates, bankruptcy filings, developments within a particular industry, changes in collateral values and factors particular to a specific commercial credit such as competition, business and management performance. The ALLL may be adjusted to reflect our current assessment of various qualitative risks, factors and events that may not be measured in our statistical procedures. There is no certainty that the ALLL and reserve for unfunded lending commitments will be appropriate over time to cover losses because of unanticipated adverse changes in any of these internal, external or qualitative factors.
The evaluation of the adequacy of the commercial, commercial real estate, and lease ALLL and reserve for unfunded lending commitments is primarily based on risk rating models that assess probability of default, loss given default and exposure at default on an individual loan basis. The models are primarily driven by individual customer financial characteristics and are validated against historical experience. Additionally, qualitative factors may be included in the risk rating models. After the aggregation of individual borrower incurred loss, additional overlays can be made based on back-testing against historical losses and forward loss curve ratios.
For nonaccruing commercial and commercial real estate loans with an outstanding balance of $3 million or greater and for all commercial and commercial real estate TDRs (regardless of size), we conduct specific analysis on a loan level basis to determine the probable amount of credit loss. If appropriate, a specific ALLL is established for the loan through a charge to the provision for credit losses. For all classes of impaired loans, individual loan measures of impairment may result in a charge-off to the ALLL, if deemed appropriate. In such cases, the provision for credit losses is not affected when a specific reserve for at least that amount already exists. Techniques utilized include comparing the loan’s carrying amount to the estimated present value of its future cash flows, the fair value of its underlying collateral, or the loan’s observable market price. The technique applied to each impaired loan is based on the workout officer’s opinion of the most probable workout scenario. Historically, this has generally led to the use of the estimated present value of future cash flows approach. The fair value of underlying collateral will be used if the loan is deemed collateral dependent. For loans that use the fair value of underlying collateral approach, a charge-off assessment is performed quarterly to write the loans down to fair value.
For most non-impaired retail loan portfolio types, the ALLL is based upon the incurred loss model utilizing the PD, LGD and exposure at default on an individual loan basis. When developing these factors, we may consider the loan product and collateral type, LTV ratio, lien position, borrower’s credit, time outstanding, geographic location, delinquency status and incurred loss period. Incurred loss periods are reviewed and updated at least annually, and potentially more frequently when economic situations change rapidly, as they tend to fluctuate with economic cycles. Incurred loss periods are generally longer in good economic times and shorter in bad times. Certain retail portfolios, including SBO home equity loans, student loans, and credit card receivables utilize roll rate models to estimate the ALLL. For the portfolios measured using the incurred loss model, roll rate models are also used to support management overlays if deemed necessary.
For home equity lines and loans, a number of factors impact the PD. Specifically, the borrower’s current FICO score, the utilization rate, delinquency statistics, borrower income, current CLTV ratio and months on books are all used to assess the borrower’s creditworthiness. Similarly, the loss severity is also impacted by various factors, including the utilization rate, the CLTV ratio, the lien position, the Housing Price Index change for the location (as measured by the Case-Shiller index), months on books and current loan balance.
When we are not in a first lien position, we use delinquency information on the first lien exposures obtained from third-party credit information providers in the credit assessment. For all first liens, whether owned by a third party or by us, an additional assessment is performed on a quarterly basis. In this assessment, the most recent three months’ performance of the senior liens is reviewed for delinquency (90 days or more past due), modification, foreclosure and/or bankruptcy statuses. If any derogatory status is present, the junior lien will be placed on nonaccrual status regardless of its delinquency status on our books. This subsequent change to nonaccrual status will alter the treatment in the PD model, thus affecting the reserve calculation.
In addition, the first lien exposure is combined with the second lien exposure to generate a CLTV. The CLTV is a more accurate reflection of the leverage of the borrower against the property value, as compared to the LTV from just the junior lien(s). The CLTV is used for modeling both the junior lien PD and LGD. This also impacts the ALLL rates for the junior lien HELOCs.
CITIZENS FINANCIAL GROUP, INC.
MANAGEMENT’S DISCUSSION AND ANALYSIS
The above measures are all used to assess the PD and LGD for HELOC borrowers for whom we originated the loans. There is also a portfolio of home equity products that were originated and serviced by others; however, we currently service some of the loans in this portfolio. The SBO portfolio is modeled as a separate class and the reserves for this class are generated by using the delinquency roll rate models as described below.
For retail TDRs that are not collateral-dependent, allowances are developed using the present value of expected future cash flows, compared to the recorded investment in the loans. Expected re-default factors are considered in this analysis. Retail TDRs that are deemed collateral-dependent are written down to the fair market value of the collateral less costs to sell. The fair value of collateral is periodically monitored subsequent to the modification.
Changes in the levels of estimated losses, even if minor, can significantly affect management’s determination of an appropriate ALLL. For consumer loans, losses are affected by such factors as loss severity, collateral values, economic conditions, and other factors. A 1% and 5% increase in the estimated loss rate for consumer loans at December 31, 2015 would have increased the ALLL by $5 million and $26 million, respectively. The ALLL for our Commercial Banking segment is sensitive to assigned credit risk ratings and inherent loss rates. If 10% and 20% of the December 31, 2015 year end loan balances (including unfunded commitments) within each risk rating category of our Commercial Banking segment had experienced downgrades of two risk categories, the ALLL would have increased by $36 million and $72 million, respectively.
Commercial loans and leases are charged off to the ALLL when there is little prospect of collecting either principal or interest. Charge-offs of commercial loans and leases usually involve receipt of borrower-specific adverse information. For commercial collateral-dependent loans, an appraisal or other valuation is used to quantify a shortfall between the fair value of the collateral less costs to sell and the recorded investment in the commercial loan. Retail loan charge-offs are generally based on established delinquency thresholds rather than borrower-specific adverse information. When a loan is collateral-dependent, any shortfalls between the fair value of the collateral less costs to sell and the recorded investment is promptly charged off. Placing any loan or lease on nonaccrual status does not by itself require a partial or total charge-off; however, any identified losses are charged off at that time.
For additional information regarding the ALLL and reserve for unfunded lending commitments, see Note 1 “Significant Accounting Policies” and Note 5 “Allowance for Credit Losses, Nonperforming Assets and Concentrations of Credit Risk” to our audited Consolidated Financial Statements in Part II, Item 8 — Financial Statements and Supplementary Data, included elsewhere in this report.
Fair Value
We measure fair value using the price that would be received to sell an asset or paid to transfer a liability in an orderly transaction between market participants at the measurement date. Fair value is based upon quoted market prices in an active market, where available. If quoted prices are not available, observable market-based inputs or independently sourced parameters are used to develop fair value, whenever possible. Such inputs may include prices of similar assets or liabilities, yield curves, interest rates, prepayment speeds and foreign exchange rates.
We classify our assets and liabilities that are carried at fair value in accordance with $1.5the three-level valuation hierarchy:
Level 1. Quoted prices (unadjusted) in active markets for identical assets or liabilities;
Level 2. Observable inputs other than Level 1 prices, such as quoted prices for similar instruments; quoted prices in markets that are not active; or other inputs that are observable or can be corroborated by market data for substantially the full term of the asset or liability; and
Level 3. Unobservable inputs that are supported by little or no market information and that are significant to the fair value measurement.
Classification in the hierarchy is based upon the lowest level input that is significant to the fair value measurement of the asset or liability. For instruments classified in Level 1 and 2 where inputs are primarily based upon observable market data, there is less judgment applied in arriving at the fair value. For instruments classified in Level 3, management judgment is more significant due to the lack of observable market data.
Significant assets measured at fair value on a recurring basis include our mortgage-backed securities available for sale. These instruments are priced using an external pricing service and are classified as Level 2 within the fair value hierarchy. The service’s pricing models use predominantly observable valuation inputs to measure the fair value of these securities under both the market and income approaches. The pricing service utilizes a matrix pricing methodology to price our U.S. agency pass-through securities, which involves making adjustments to to-be-announced security prices based on a matrix of various mortgage-backed securities characteristics such as weighted-average maturities, indices and other pool-level information. Other agency and non-agency mortgage-backed securities are priced using a discounted cash flow methodology. This methodology includes estimating the cash flows expected to be received for each security using projected prepayment speeds and default rates based on historical
CITIZENS FINANCIAL GROUP, INC.
MANAGEMENT’S DISCUSSION AND ANALYSIS
statistics of the underlying collateral and current market conventions. These estimated cash flows are then discounted using market-based discount rates that incorporate characteristics such as average life, volatility, ratings, performance of the underlying collateral, and prevailing market conditions.
We review and update the fair value hierarchy classifications on a quarterly basis. Changes from one quarter to the next related to the observability of inputs in fair value measurements may result in a reclassification between the fair value hierarchy levels and are recognized based on year-end balances. We also verify the accuracy of the pricing provided by our primary external pricing service on a quarterly basis. This process involves using a secondary external vendor to provide valuations for our securities portfolio for comparison purposes. Any securities with discrepancies beyond a certain threshold are researched and, if necessary, valued by an independent outside broker.
Fair value is also used on a nonrecurring basis to evaluate certain assets for impairment or for disclosure purposes. Examples of nonrecurring uses of fair value include mortgage servicing rights accounted for by the amortization method, loan impairments for certain loans and goodwill.
For additional information regarding our fair value measurements, see Note 1 “Significant Accounting Policies,” Note 3 “Securities,” Note 10 “Mortgage Banking,” and Note 16 “Derivatives” to our audited Consolidated Financial Statements in Part II, Item 8 — Financial Statements and Supplementary Data, included elsewhere in this report.
Goodwill
Goodwill is an asset that represents the future economic benefits arising from other assets acquired in a business combination that are not individually identified and separately recognized. Goodwill is not amortized, but is subject to annual impairment tests. Goodwill is assigned to reporting units at the date the goodwill is initially recorded. A reporting unit is a business operating segment or a component of a business operating segment. Once goodwill has been assigned to reporting units, it no longer retains its association with a particular acquisition, and all of the activities within a reporting unit, whether acquired or organically grown, are available to support the value of the goodwill.
The goodwill impairment analysis is a two-step test. The first step, used to identify potential impairment, involves comparing each reporting unit’s fair value to its carrying value including goodwill. If the fair value of a reporting unit exceeds its carrying value, applicable goodwill is deemed to be not impaired. If the carrying value exceeds fair value, there is an indication of impairment and the second step is performed to measure the amount of impairment.
The second step involves calculating an implied fair value of goodwill for each reporting unit for which the first step indicated impairment. The implied fair value of goodwill is determined in the same manner as the amount of goodwill recognized in a business combination, which is the excess of the fair value of the reporting unit, as determined in the first step, over the aggregate fair values of the individual assets, liabilities and identifiable intangible assets as if the reporting unit were being acquired in a business combination. If the implied fair value of goodwill exceeds the carrying value of goodwill assigned to the reporting unit, there is no impairment. If the carrying value of goodwill assigned to a reporting unit exceeds the implied fair value of the goodwill, an impairment charge is recorded for the excess. An impairment loss recognized cannot exceed the amount of goodwill assigned to a reporting unit, and the loss establishes a new basis in the goodwill. Subsequent reversal of goodwill impairment losses is not permitted.
We review goodwill for impairment annually as of October 31 or more often if events or circumstances indicate that it is more likely than not that the fair value of one or more reporting units is below its carrying value. We rely on the income approach (discounted cash flow method) as the primary method for determining fair value. Market-based methods are used as benchmarks to corroborate the value determined by the discounted cash flow method.
We rely on several assumptions when estimating the fair value of our reporting units using the discounted cash flow method. These assumptions include the current discount rate, as well as projected loan losses, income taxes and capital retention rates. Discount rates are estimated based on the Capital Asset Pricing Model, which considers the risk-free interest rate, market risk premium, beta and unsystematic risk and size premium adjustments specific to a particular reporting unit. The discount rates are also calibrated on the assessment of the risks related to the projected cash flows of each reporting unit. Multi-year financial forecasts are developed for each reporting unit by considering several key business drivers such as new business initiatives, customer retention standards, market share changes, anticipated loan and deposit growth, forward interest rates, historical performance and industry and economic trends, among other considerations. The long-term growth rate used in determining the terminal value of each reporting unit was estimated based on management’s assessment of the minimum expected terminal growth rate of each reporting unit, as well as broader economic considerations such as gross domestic product and inflation.
We corroborate the fair value of our reporting units determined by the discounted cash flow method using market-based methods: a comparable company method and a comparable transaction method. The comparable company method measures fair value of a business by comparing it to publicly traded companies in similar lines of business. This involves identifying and selecting the comparable companies based on a number of factors (i.e., size, growth, profitability, risk and return on investment), calculating
CITIZENS FINANCIAL GROUP, INC.
MANAGEMENT’S DISCUSSION AND ANALYSIS
the market multiples (i.e., price-to-tangible book value, price-to-cash earnings and price-to-net income) of these comparable companies and then applying these multiples to our operating results to estimate the value of the reporting unit’s equity on a marketable, minority basis. A control premium is then applied to this value to estimate the fair value of the reporting unit on a marketable, controlling basis. The comparable transaction method measures fair value of a business based on exchange prices in actual transactions and on asking prices for controlling interests in public or private companies currently offered for sale. The process involves comparison and correlation of us with other similar companies. Adjustments for differences in factors described earlier (i.e., size, growth, profitability, risk and return on investment) are also considered.
As a best practice, we also corroborate the fair value of our reporting units determined by the discounted cash flow method by adding the aggregated sum of these fair value measurements to the fair value of our non-segment operations and comparing this total to our observed market capitalization. As part of this process, we analyze the implied control premium to evaluate its reasonableness. All facts and circumstances are considered when completing this analysis, including observed transaction data and any additional external evidence supporting the implied control premium. Since none of our reporting units are publicly traded, individual reporting unit fair value determinations cannot be directly correlated to CFG’s common stock price. The sum of the fair values of the reporting units at October 31, 2015 exceeded the overall market capitalization of CFG as of October 31, 2015. Although we believe it is reasonable to conclude that market capitalization could be an indicator of fair value over time, we do not believe that our current market capitalization reflects the aggregate fair value of our individual reporting units.
The valuation of goodwill is dependent on forward-looking expectations related to the performance of the U.S. economy and our associated financial performance. The prolonged delay in the full recovery of the U.S. economy, and the impact of that delay on earnings expectations, prompted a goodwill impairment test as of June 30, 2013. Although the U.S. economy has demonstrated signs of recovery, notably improvements in unemployment and housing, the pace and extent of recovery in these indicators, as well as in overall gross domestic product, have lagged previous expectations. The impact of the slow recovery is most evident in our Consumer Banking reporting unit. Accordingly, the percentage by which the estimated fair value of our Consumer Banking reporting unit exceeded its carrying value declined from 7% at December 31, 2011 to 5% at December 31, 2012.
During the first half of 2013, we observed further deceleration of expected growth for our Consumer Banking reporting unit’s future profits based on forecasted economic growth for the U.S. economy and the continuing impact of the new regulatory framework in the financial industry. This deceleration was incorporated into our revised earnings forecast in the second quarter of 2013, and we subsequently concluded that there was a likelihood of greater than 50% that goodwill impairment had occurred as of June 30, 2013.
An interim goodwill impairment test was subsequently performed for our Consumer Banking and Commercial Banking reporting units. Step One of these tests indicated that (1) the fair value of our Consumer Banking reporting unit was less than its carrying value by 19% and (2) the fair value of our Commercial Banking reporting unit exceeded its carrying value by 27%. Step Two of the goodwill impairment test was subsequently performed for our Consumer Banking reporting unit, which resulted in the recognition of a pre-tax $4.4 billion impairment charge in our Consolidated Statement of Operations for the period ending June 30, 2013. The impairment charge, which was a non-cash item, had minimal impact on our tier 1 risk-based and total risk-based capital ratios. The impairment charge had no impact on our liquidity position or tangible common equity.
We performed an annual test for impairment of goodwill for both reporting units as of October 31, 2015. As of this testing date, the percentage by which the fair value of our Consumer Banking reporting unit exceeded its carrying value was 6%, and the percentage by which the fair value of our Commercial Banking reporting unit exceeded its carrying value was 8%.
We based the fair value estimates used in our annual goodwill impairment testing on assumptions we believe to be representative of assumptions that a market participant would use in valuing the reporting units but that are unpredictable and inherently uncertain, including estimates of future growth rates and operating margins and assumptions about the overall economic climate and the competitive environment for our reporting units. There can be no assurances that future estimates and assumptions made for purposes of goodwill testing will prove accurate predictions of the future. If the assumptions regarding business plans, competitive environments, market conditions or anticipated growth rates are not achieved, or a market participant view of our total fair value declines, we may be required to record goodwill impairment charges in future periods.
For additional information regarding our goodwill impairment testing, see Note 1 “Significant Accounting Policies,” and Note 9 “Goodwill” to our audited Consolidated Financial Statements in Part II, Item 8 — Financial Statements and Supplementary Data, included elsewhere in this report.
CITIZENS FINANCIAL GROUP, INC.
MANAGEMENT’S DISCUSSION AND ANALYSIS
Income Taxes
Accrued income taxes are reported as a component of either other assets or other liabilities, as appropriate, in the Consolidated Balance Sheets and reflect our estimate of income taxes to be paid or that effectively have been prepaid. Deferred income tax assets and liabilities represent the amount of future income taxes to be paid or that effectively have been prepaid, and the net balance is reported as an asset or liability in the Consolidated Balance Sheets. We determine the realization of the deferred tax asset based upon an evaluation of the four possible sources of taxable income: (1) the future reversals of taxable temporary differences; (2) future taxable income exclusive of reversing temporary differences and carryforwards; (3) taxable income in prior carryback years; and (4) tax planning strategies. In projecting future taxable income, we utilize forecasted pre-tax earnings, adjust for the estimated book tax differences and incorporate assumptions, including the amount of income allocable to taxing jurisdictions. These assumptions require significant judgment and are consistent with the plans and estimates that we use to manage the underlying businesses. The realization of the deferred tax assets could be reduced in the future if these estimates are significantly different than forecasted.
We are subject to income tax in the United States and multiple state and local jurisdictions. The tax laws and regulations in each jurisdiction may be interpreted differently in certain situations, which could result in a range of outcomes. Thus, we are required to exercise judgment regarding the application of these tax laws and regulations. We evaluate and recognize tax liabilities related to any tax uncertainties. Due to the complexity of some of these uncertainties, the ultimate resolution may differ from the current estimate of tax liabilities or refunds.
Our estimate of accrued income taxes, deferred income taxes and income tax expense can also change in any period as a result of new legislative or judicial guidance impacting tax positions, as well as changes in income tax rates. Any changes, if they occur, can be significant to our consolidated financial position, results of operations or cash flows.
For additional information regarding income taxes, see Note 1 “Significant Accounting Policies,” and Note 15 “Income Taxes” to our audited Consolidated Financial Statements in Part II, Item 8 — Financial Statements and Supplementary Data, included elsewhere in this report.
Risk Governance
We are committed to maintaining a strong, integrated and proactive approach to the management of all risks to which we are exposed in pursuit of our business objectives. A key aspect of our Board’s responsibility as the main decision making body is setting our risk appetite to ensure that the levels of risk that we are willing to accept in the attainment of our strategic business and financial objectives are clearly understood.
To enable the Board to carry out its objectives, it has delegated authority for risk management activities, as well as governance and oversight of those activities, to a number of Board and executive management level risk committees. The key committees that specifically consider risk across the enterprise are set out in the diagram below.
CITIZENS FINANCIAL GROUP, INC.
MANAGEMENT’S DISCUSSION AND ANALYSIS
Chief Risk Officer
The CRO directs our overall risk management function overseeing the credit, interest rate , market, liquidity, operational, compliance, strategic and reputational risk management. The CRO reports to our CEO and to the Board Risk Committee.
Risk Framework
Our risk management framework is embedded in our business through a “Three Lines of Defense” model which defines responsibilities and accountabilities.
First Line of Defense
The business lines (including their associated support functions) are the First Line of Defense and are accountable for owning and managing, within our defined risk appetite, the risks which exist in their respective business areas. The business lines are responsible for performing regular risk assessments to identify and assess the material risks that arise in their area of responsibility, complying with relevant risk policies, testing and certifying the adequacy and effectiveness of their controls on a regular basis, establishing and documenting operating procedures and establishing and owning a governance structure for identifying and managing risk.
Second Line of Defense
The Second Line of Defense includes independent monitoring and control functions accountable for developing and ensuring implementation of risk and control frameworks and related policies. This centralized risk function is appropriately independent from the business and is accountable for overseeing and challenging our business lines on the effective management of their risks. This risk function utilizes training, communications and awareness to provide expert support and advice to the business lines. This includes interpreting the risk policy standards and risk management framework, overseeing compliance by the businesses with policies and responsibilities, including providing relevant management information and escalating concerns where appropriate.
The Executive Risk Committee, chaired by the CRO, actively considers our inherent material risks, analyzes our overall risk profile and seeks confirmation that the risks are being appropriately identified, assessed and mitigated.
Third Line of Defense
Our Internal Audit function is the Third Line of Defense providing independent assurance with a view of the effectiveness of Citizens’ internal controls, governance practices, and culture so that risk is managed appropriately for the size, complexity, and risk profile of the organization. Internal Audit has complete and unrestricted access to any and all Bank records, physical properties, and personnel. Internal Audit issues a report following each internal review and provides an audit opinion to Citizens’ Audit Committees on a quarterly basis.
Credit Quality Assurance also reports to the Chief Audit Executive and also provides the Boards, senior management and other stakeholders with independent assurance on the quality of credit portfolios and adherence to agreed Credit Risk Appetite and Credit Policies and processes. In line with its procedures and regulatory expectations, the Credit Quality Assurance function undertakes a program of portfolio testing, assessing and reporting through four Risk Pillars of Asset Quality, Rating and Data Integrity, Risk Management and Credit Risk Appetite.
Risk Appetite
Risk appetite is a strategic business and risk management tool. We define our risk appetite as the maximum limit of acceptable risk beyond which we would either be unable to achieve our strategic objectives and capital adequacy obligations or would assume an unacceptable amount of risk to do so. The Board Risk Committee advises our Board of Directors in relation to current and potential future risk strategies, including determination of risk appetite and tolerance.
The principal non-market risks to which we are subject are: credit risk, operational risk, liquidity risk, strategic risk and reputational risk. We are also subject to market risks. Market risk refers to potential losses arising from changes in interest rates, foreign exchange rates, equity prices, commodity prices and/or other relevant market rates or prices. Modest market risk arises from trading activities that serve customer needs, including hedging of interest rate and foreign exchange risk. As described below, more material market risk arises from our non-trading banking activities, such as loan origination and deposit gathering. We have established enterprise-wide policies and methodologies to identify, measure, monitor and report market risk. We actively manage both trading and non-trading market risks. We are also subject to liquidity risk, discussed under “—Liquidity.”
Our risk appetite framework and risk limit structure establishes guidelines to determine the balance between existing and desired levels of risk and supports the implementation, measurement and management of our risk appetite.
CITIZENS FINANCIAL GROUP, INC.
MANAGEMENT’S DISCUSSION AND ANALYSIS
Credit Risk
Overview
Credit risk represents the potential for loss arising from a customer, counterparty, or issuer failing to perform in accordance with the contractual terms of the obligation. While the majority of our credit risk is associated with lending activities, we do engage with other financial counterparties for a variety of purposes including investing, asset and liability management, and trading activities. Given the financial impact of credit risk on our earnings and balance sheet, the assessment, approval, and management of credit risk represents a major part of our overall risk-management responsibility.
Objective
The credit risk management organization is responsible for approving credit transactions, monitoring portfolio performance, identifying problem loans, and ensuring remedial management.
Organizational Structure
Management and oversight of credit risk is the responsibility of both the line of business and the second line of defense. The second line of defense, the independent Credit Risk Function, is led by the Chief Credit Officer who oversees all of our credit risk. The CCO reports to the Chief Risk Officer. The CCO, acting in a manner consistent with Board policies, has responsibility for, among other things, the governance process around policies, procedures, risk acceptance criteria, credit risk appetite, limits, and authority delegation. The CCO and his team also have responsibility for credit approvals for larger or more risky transactions and oversight of line of business credit risk activities. Reporting to the CCO are the heads of the second line of defense credit functions specializing in: Consumer Banking; Business Banking; Commercial Banking; Citizens Restructuring Management; Portfolio Analytics and Reporting; and Credit Policy and Administration. Each team under these leaders is composed of highly experienced credit professionals.
The credit risk teams operate independently from the business lines to ensure decisions are not influenced by unbalanced objectives.
Governance
The primary mechanisms used to govern our credit risk function are our consumer and commercial credit policies. These policies outline the minimum acceptable lending standards that align with our desired risk appetite. Material issues or changes are identified by the individual committees and presented to the Credit Policy Committee, Executive Risk Committee and the Board Risk Committee for approval as appropriate.
Key Management Processes
To ensure credit risks are managed within our risk appetite and business and risk strategies are achieved, we employ a comprehensive and integrated control program. The program’s objective is to proactively (1) identify, (2) measure, (3) monitor, and (4) mitigate existing and emerging credit risks across the credit lifecycle (origination, account management/portfolio management, and loss mitigation and recovery).
Consumer
On the consumer banking side of credit risk, our teams use models to evaluate consumer loans across the lifecycle of the loan. Starting at origination, credit scoring models are used to forecast the probability of default of an applicant. These models are embedded in the loan origination system, which allows for real-time scoring and automated decisions for many of our products. Periodic validations are performed on our purchased and proprietary scores to ensure fit for purpose. When approving customers for a new loan or extension of an existing credit line, credit scores are used in conjunction with other credit risk variables such as affordability, length of term, collateral value, collateral type, and lien subordination.
The origination process is supported by dedicated underwriting teams that reside in the business line. The size of each team depends on the intensity of the approval process as the number of handoffs, documentation, and verification requirements differ substantially depending on the loan product.
To ensure proper oversight of the underwriting teams, lending authority is granted by the second line of defense credit risk function to each underwriter. The amount of delegated authority depends on the experience of the individual. We periodically evaluate the performance of each underwriter and annually reauthorize their delegated authority. Only senior members of the second line of defense credit risk team are authorized to approve significant exceptions to credit policies. It is not uncommon to make exceptions to established policies when compensating factors are present. There are exception limits which, when reached, trigger a comprehensive analysis.
CITIZENS FINANCIAL GROUP, INC.
MANAGEMENT’S DISCUSSION AND ANALYSIS
Once an account is established, credit scores and collateral values are refreshed at regular intervals to allow for proactive identification of increasing or decreasing levels of credit risk. For accounts with contingent liability (revolving feature), credit policies have been developed that leverage the refreshed customer data to determine if a credit line should be increased, decreased, frozen, or closed. Lastly, behavioral modeling, segmentation, and loan modifications are used to cure delinquency, reduce the severity of loss, and maximize recoveries. Our approach to managing credit risk is highly analytical and, where appropriate, is automated, to ensure consistency and efficiency.
The credit risk team is constantly evaluating current and projected economic conditions, internal credit performance in relation to budget and predefined risk tolerances, and current and expected regulatory guidance to determine the optimal balance of expansion and contraction policies. All policy change proposals receive intense scrutiny and discussion prior to approval and implementation. This process ensures decisions are made based on risk-based analytics with full adherence to regulatory requirements.
Commercial
On the commercial banking side of credit risk, the structure is broken into C&I loans and leases and CRE. Within C&I there are separate verticals established for certain specialty products (e.g., asset-based lending, leasing, franchise finance, health care, technology, mid-corporate). A “specialty vertical” is a stand-alone team of industry or product specialists. Substantially all activity that falls under the ambit of the defined industry or product is managed through a specialty vertical when one exists. CRE also operates as a specialty vertical.
Commercial credit risk management begins with defined credit products and policies.
Commercial transactions are subject to individual analysis and approval at origination and, with few exceptions, are subject to a formal annual review requirement. The underwriting process includes the establishment and approval of Credit Grades that confirm the Probability of Default (“PD”) and Loss Given Default (“LGD”). Approval then requires both a business line approver and an independent Credit Approver with the requisite level of delegated authority. The approval level of a particular credit facility is determined by the size of the credit relationship as well as the PD. The checks and balances in the credit process and the independence of the credit approver function are designed to appropriately assess and sanction the level of credit risk being accepted, facilitate the early recognition of credit problems when they occur, and to provide for effective problem asset management and resolution. All authority to grant credit is delegated through the independent Credit Risk function and is closely monitored and regularly updated.
The primary factors considered in commercial credit approvals are the financial strength of the borrower, assessment of the borrower’s management capabilities, cash flows from operations, industry sector trends, type and sufficiency of collateral, type of exposure, transaction structure, and the general economic outlook. While these are the primary factors considered, there are a number of other factors that may be considered in the decision process. In addition to the credit analysis conducted during the approval process at origination and annual review, our Credit Quality Assurance group performs testing to provide an independent review and assessment of the quality of the portfolio and new originations. This group conducts portfolio reviews on a risk-based cycle to evaluate individual loans, validate risk ratings, as well as test the consistency of the credit processes and the effectiveness of credit risk management.
The maximum level of credit exposure to individual credit borrowers is limited by policy guidelines based on the perceived risk of each borrower or related group of borrowers. Concentration risk is managed through limits on industry (sector), loan type (asset class), and loan quality factors. We focus predominantly on extending credit to commercial customers with existing or expandable relationships within our primary markets (for this purpose defined as our 11 state footprint plus contiguous states), although we do engage in lending opportunities outside our primary markets if we believe that the associated risks are acceptable and aligned with strategic initiatives.
Apart from Industrials and CRE (which together make up 30% of the commercial outstandings as of December 31, 2013. Pay-fixed-rates on the swaps ranged from 4.18% to 4.30% in 2014 compared with 4.18% to 5.47% in 2013. We received the daily Federal Funds effective rate on these swaps.
We use receive-fixed swaps to minimize the exposure to variability in the interest cash flows on our floating rate assets.2015), there are no material sector concentrations. As of December 31, 2014, receive-fixed swap hedges2015, our CRE outstandings amounted to 9% of floating-ratetotal loans totaled $4.0 billion, unchangedand leases. The Industrial sector includes basic C&I lending focused on general manufacturing. The sector is diversified and not managed as a specialized vertical. Our customers are local to our market and present no significant concentration.
Our credit grading system considers many components that directly correlate to loan quality and likelihood of repayment. Our assessment of a borrower’s credit strength is reflected in our risk ratings for such loans, which are also an integral component of our ALLL methodology. When deterioration in credit strength is noted, a loan becomes subject to Watch Review. The Watch Review process involves senior representatives from December 31, 2013. At December 31, 2014, the fixed rate range was 1.78%business line portfolio management team, the independent Credit Risk team, and our Citizens Restructuring Management group. As appropriate and consistent with regulatory definitions, the credit may be subject to 2.04% unchangedclassification as either Criticized or Classified, which would also trigger a credit rating downgrade. As such, the loan and relationship would be subject to more frequent review.
CITIZENS FINANCIAL GROUP, INC.
MANAGEMENT’S DISCUSSION AND ANALYSIS
Substantially all loans categorized as Classified are managed by Citizens Restructuring Management, a specialized group of credit professionals that handles the day-to-day management of workouts, commercial recoveries, and problem loan sales. Its responsibilities include developing and implementing action plans, assessing risk ratings, determining the appropriateness of specific reserves relating to the loan, accrual status of the loan, and the ultimate collectability of loans in their portfolio.
Market Risk
Market risk refers to potential losses arising from December 31, 2013, and we paid one-month London Interbank Offered Rate (“LIBOR”) on these swaps.
In December 2014, we entered into a $750 million receive-fixed interest-rate swap agreement to manage thechanges in interest rates, foreign exchange rates, equity prices, commodity prices and/or other relevant market rates or prices. Modest market risk arises from trading activities that serve customer needs, including hedging of interest rate exposure on our five-year medium term fixed-rate debt issued in December 2014. This agreement converts the 2.45% fixed-rate debt coupon to three-month LIBOR plus 79 basis points. We receive fixed rate at 1.66% on the swap agreement and pay three-month LIBOR.
We also sell interest rate swaps and foreign exchange forwards to commercial customers. Offsetting swap and forward agreements are simultaneously transacted to minimize ourrisk. As described below, more material market risk associatedarises from our non-trading banking activities, such as loan origination and deposit-gathering. We have established enterprise-wide policies and methodologies to identify, measure, monitor and report market risk. We actively manage both trading and non-trading market risks.
Non-Trading Risk
We are exposed to market risk as a result of non-trading banking activities. This market risk is composed entirely of interest rate risk, as we have no direct currency or commodity risk and de minimis equity risk. This interest rate risk emerges from the balance sheet after the aggregation of our assets, liabilities and equity. We refer to this non-trading risk embedded in the balance sheet as “structural interest rate risk” or “interest rate risk in the banking book.” Our mortgage servicing rights assets also contain interest rate risk as the value of the fee stream is impacted by the level of long-term interest rates.
A major source of structural interest rate risk is a difference in the repricing of assets, on the one hand, and liabilities and equity, on the other. First, there are differences in the timing of rate changes reflecting the maturity and/or repricing of assets and liabilities. For example, the rate earned on a residential mortgage may be fixed for 30 years; the rate paid on a certificate of deposit may be fixed only for a few months. Due to these timing differences, net interest income is sensitive to changes in the level and shape of the yield curve. Second, there are differences in the drivers of rate changes of various assets and liabilities. For example, commercial loans may reprice based on one-month LIBOR or prime; the rate paid on retail money market demand accounts may be only loosely correlated with LIBOR and depend on competitive demand for funds. Due to these basis differences, net interest income is sensitive to changes in spreads between certain indices or repricing rates.
Another important source of structural interest rate risk relates to the potential exercise of explicit or embedded options. For example, most consumer loans can be prepaid without penalty; and most consumer deposits can be withdrawn without penalty. The exercise of such options by customers can exacerbate the timing differences discussed above.
A primary source of our structural interest rate risk relates to faster repricing of floating rate loans relative to the retail deposit funding. This source of asset sensitivity is concentrated at the short end of the yield curve. For the past seven years with the customerFederal Funds rate near zero, this risk has been asymmetrical with significantly more upside benefit than potential exposure. As rates have lifted from near zero given the FOMC’s December 2015 rate hike, exposure to declining rates has increased. The secondary source of our interest rate risk is driven by longer term rates comprising the rollover or reinvestment risk on fixed rate loans as well as the prepayment risk on mortgage related loans and securities funded by non-rate sensitive deposits and equity.
The primary goal of interest rate risk management is to control exposure to interest rate risk within policy limits approved by the Board. These limits and guidelines reflect our tolerance for interest rate risk over both short-term and long-term horizons. To ensure that exposure to interest rate risk is managed within this risk appetite, we must both measure the exposure and, as necessary, hedge it. The Treasury Asset and Liability Management team is responsible for measuring, monitoring and reporting on the structural interest rate risk position. These exposures are reported on a monthly basis to the Asset and Liability Committee (ALCO) and at Board meetings.
We measure structural interest rate risk through a variety of metrics intended to quantify both short-term and long-term exposures. The primary method that we use to quantify interest rate risk is simulation analysis in which we model net interest income from assets, liabilities and hedge derivative products.positions under various interest rate scenarios over a three-year horizon. Exposure to interest rate risk is reflected in the variation of forecasted net interest income across scenarios.
Key assumptions in this simulation analysis relate to the behavior of interest rates and spreads, the changes in product balances and the behavior of loan and deposit clients in different rate environments. The assets and liabilities recorded for derivatives not designated as hedges reflect the market valuemost material of these transactions.behavioral assumptions relate to the repricing characteristics and balance fluctuations of deposits with indeterminate (i.e., non-contractual) maturities as well as the pace of mortgage prepayments. Assessments are periodically made by running sensitivity analysis of the impact of key assumptions. The results of these analyses are reported to ALCO.
As the future path of interest rates cannot be known in advance, we use simulation analysis to project net interest income under various interest rate scenarios including a “most likely” (implied forward) scenario as well as a variety of deliberately extreme and perhaps unlikely scenarios. These scenarios may assume gradual ramping of the overall level of interest rates, immediate shocks to the level of rates and various yield curve twists in which movements in short- or long-term rates predominate. Generally,
CITIZENS FINANCIAL GROUP, INC.
MANAGEMENT'SMANAGEMENT’S DISCUSSION AND ANALYSIS
projected net interest income in any interest rate scenario is compared to net interest income in a base case where market forward rates are realized.
The table below presentsreports net interest income exposures against a variety of interest rate scenarios. Exposures are measured as a percentage change in net interest income over the next year due to either instantaneous, or gradual parallel +/- 200 basis point moves in benchmark interest rates. The net interest income simulation analyses do not include possible future actions that management might undertake to mitigate this risk. The current limit is a decrease in net interest income of 10% related to an instantaneous +/- 200 basis point move. As the table illustrates, our balance sheet is asset-sensitive: net interest income would benefit from an increase in interest rates. Exposure to a decline in interest rates is well within limit. It should be noted that the magnitude of any possible decline in interest rates is constrained by the low absolute starting levels of rates. While an instantaneous and severe shift in interest rates was used in this analysis, we believe that any actual shift in interest rates would likely be more gradual and would therefore have a more modest impact.
The table below summarizes our positioning in various parallel yield curve shifts:
|
| | | | | |
| | Estimated % Change in Net Interest Income over 12 Months |
| | December 31, |
| Basis points | 2015 |
| | 2014 |
|
| Instantaneous Change in Interest Rates | | | |
| +200 | 10.6 | % | | 13.4 | % |
| +100 | 5.8 |
| | 7.0 |
|
| -100 | (5.8 | ) | | (3.8 | ) |
| -200 | (6.4 | ) | | (4.3 | ) |
| Gradual Change in Interest Rates | | | |
|
| +200 | 6.1 |
| | 6.8 |
|
| +100 | 3.2 |
| | 3.5 |
|
| -100 | (3.1 | ) | | (2.3 | ) |
| -200 | (4.6 | ) | | (3.0 | ) |
As part of the routine risk management process, a wide variety of similar analysis are reported for each of the next three rolling years.
We also use a valuation measure of exposure to structural interest rate risk, Economic Value of Equity (“EVE”), as a supplement to net interest income simulations. EVE complements net interest income simulation analysis as it estimates risk exposure over a long-term horizon. EVE measures the extent to which the economic value of assets, liabilities and off-balance sheet instruments may change in response to fluctuation in interest rates. This analysis is highly dependent upon assumptions applied to assets and liabilities with non-contractual maturities. The change in value is expressed as a percentage of regulatory capital. The current risk limit is set at a decrease of 20% of regulatory capital given an instantaneous +/- 200 basis point change in interest rates. We are operating within that limit as of December 31, 2015.
We are asset sensitive and as such are positioned to benefit from an increase in interest rates. We have consistently maintained the level of overall asset sensitivity in a tight range of 6.1% to 7.2% over the past year, as defined by the +200 gradual change.
We also had market risk associated with the value of the mortgage servicing right assets, which are impacted by the level of interest rates. As of December 31, 2015 and 2014, our mortgage servicing rights had a book value of $164 million and $166 million, respectively, and were carried at the lower of cost or fair value. As of December 31, 2015, and 2014, the fair value of the mortgage servicing rights was $178 million and $179 million, respectively. Given low interest rates over recent years, there is a valuation allowance of $9 million and $18 million on the asset as of December 31, 2015 and 2014, respectively. Depending on the interest rate environment, hedges may be used to stabilize the market value of the mortgage servicing right asset.
Trading Risk
We are exposed to market risk primarily through client facilitation activities including derivatives and foreign exchange products. Exposure is created as a result of changes in interest rates and related basis spreads and volatility, foreign exchange rates, and credit spreads on a select range of interest rates, foreign exchange and secondary loans instruments. These trading activities are conducted through our two banking subsidiaries, CBNA and CBPA.
CITIZENS FINANCIAL GROUP, INC.
MANAGEMENT’S DISCUSSION AND ANALYSIS
Client facilitation activities consist primarily of interest rate derivatives and foreign exchange contracts where we enter into offsetting trades with a separate counterparty or exchange to manage our market risk exposure. We will occasionally execute hedges against the spread that exists across the client facing trade and its offset in the market to maintain a low risk profile. In addition to the aforementioned activities, we operate a secondary loan trading desk with the objective to meet secondary liquidity needs of our issuing clients’ transactions and investor clients. We do not engage in any trading activities with the intent to benefit from short term price differences.
We record interest rate derivatives and foreign exchange contracts as derivative assets and liabilities.liabilities on our Consolidated Balance Sheets. Trading assets and liabilities are carried at fair value with income earned related to these activities included in net interest income. Changes in fair value of trading assets and liabilities are reflected in other income, a component of noninterest income on the Consolidated Statements of Operations.
Market Risk Governance
Our market risk framework currently leverages RBS technology platform to aggregate, measure and monitor exposure against market risk limits. As part of our separation from RBS, we have entered into a Transitional Services Agreement pursuant to which RBS will continue to provide us with all necessary VaR and other risk measurements required for regulatory reporting related to interest rate derivatives and foreign exchange trading activities, as well as internal market risk reporting until the end of the Transitional Services Agreement. During the term of the Transitional Services Agreement, we are building out our own market risk organization and framework in order to gradually migrate away from reliance on services provided by RBS.
Given the low level of traded market risk, we have received the support of our U.S. banking regulators for relying on RBS’ market risk technology platform. In managing our market risk, dealing authorities represent a key control in the management of market risk by setting the scope within which the business is permitted to operate. Dealing authorities are established jointly by designated senior business line and senior risk manager, and are reviewed at least annually. Dealing authorities are structured to accommodate the client facing trades, market offset trades and sets of hedges needed to maintain a low risk profile. Primary responsibility for keeping within established tolerances resides with the business. Key risk indicators, including a combined VaR for interest rate and foreign exchange rate risk, are monitored on a daily basis and reported against tolerances consistent with our risk appetite and business strategy to relevant business line management and risk counterparts.
Market Risk Measurement
We use VaR metrics, complemented with sensitivity analysis, market value and stress testing in measuring market risk. During the term of the Transition Services Agreement, we will continue to leverage RBS market risk measurement models for our foreign exchange and interest rate products, which are described further below, that capture correlation effects and allow for aggregation of market risk across risk types, business lines and legal entities. We measure and monitor market risk for both management and regulatory capital purposes.
Value-at-Risk Overview
The market risk measurement model is based on historical simulation. The VaR measure estimates the extent of any fair value losses on trading positions that may occur due to broad market movements (General VaR) such as changes in the level of interest rates, foreign exchange rates, equity prices and commodity prices. It is calculated on the basis that current positions remain broadly unaltered over the course of a given holding period. It is assumed that markets are sufficiently liquid to allow the business to close its positions, if required, within this holding period. VaR’s benefit is that it captures the historic correlations of a portfolio. Based on the composition of our “covered positions,” we also use a standardized add-on approach for the loan trading desk’s Specific Risk capital which estimates the extent of any losses that may occur from factors other than broad market movements. In addition, for our secondary traded loans we calculate the VaR on the general interest rate risk embedded within the loans using a standalone model that replicates The general VaR methodology (the related capital is reflected on the “de minimis” line in the following section). The General VaR approach is expressed in terms of a confidence level over the past 500 trading days. The internal VaR measure (used as the basis of the main VaR trading limits) is a 99% confidence level with a one day holding period, meaning that a loss greater than the VaR is expected to occur, on average, on only one day in 100 trading days (i.e., 1% of the time). Theoretically, there should be a loss event greater than VaR two to three times per year. The regulatory measure of VaR is done at a 99% confidence level with a 10-day holding period. The historical market data applied to calculate the VaR is updated on a 10 business day lag. Refer to “Market Risk Regulatory Capital” below for details of our 10-day VaR metrics for the quarters ended December 31, 2015 and 2014, including high, low, average and period end Value-at-Risk for interest rate and foreign exchange rate risks, as well as total VaR.
Market Risk Regulatory Capital
Effective January 1, 2013, the U.S. banking regulators adopted “Risk-Based Capital Guidelines: Market Risk” as the regulations covering the calculation of market risk capital (the “Market Risk Rule”). The Market Risk Rule, commonly known as
CITIZENS FINANCIAL GROUP, INC.
MANAGEMENT’S DISCUSSION AND ANALYSIS
Basel 2.5, substantially modified the determination of market risk-weighted assets and implemented a more risk sensitive methodology for the risk inherent in certain trading positions categorized as “covered positions.” For additionalthe purposes of the market risk rule, all of our client facing trades, market offset trades and sets of hedges needed to maintain a low risk profile to qualify as “covered positions.” The internal VaR measure is calculated based on the same population of trades that is utilized for regulatory VaR. The following table shows the results of our modeled and non-modeled measures for regulatory capital calculations:
|
| | | | | | | | | | | | | | | | | | | | | | | | | | | | | | | | |
| (in millions) | | For the Quarter Ended December 31, 2015 | | For the Quarter Ended December 31, 2014 |
Market Risk Category | | Period End | | Average | | High | | Low | | Period End | | Average | | High | | Low |
| Interest Rate | |
| $— |
| |
| $— |
| |
| $— |
| |
| $— |
| |
| $— |
| |
| $— |
| |
| $— |
| |
| $— |
|
| Foreign Exchange Currency Rate | | — |
| | — |
| | — |
| | — |
| | — |
| | — |
| | 1 |
| | — |
|
| Diversification Benefit | | — |
| | — |
| | NM(1) |
| | NM(1) |
| | — |
| | — |
| | NM(1) |
| | NM(1) |
|
| General VaR | | — |
| | — |
| | — |
| | — |
| | — |
| | — |
| | 1 |
| | — |
|
| Specific Risk VaR | | — |
| | — |
| | — |
| | — |
| | — |
| | — |
| | — |
| | — |
|
| Total VaR | |
| $— |
| |
| $— |
| |
| $— |
| |
| $— |
| |
| $— |
| |
| $— |
| |
| $1 |
| |
| $— |
|
| Stressed General VaR | |
| $2 |
| |
| $2 |
| |
| $2 |
| |
| $1 |
| |
| $2 |
| |
| $2 |
| |
| $3 |
| |
| $1 |
|
| Stressed Specific Risk VaR | | — |
| | — |
| | — |
| | — |
| | — |
| | — |
| | — |
| | — |
|
| Total Stressed VaR | |
| $2 |
| |
| $2 |
| |
| $2 |
| |
| $1 |
| |
| $2 |
| |
| $2 |
| |
| $3 |
| |
| $1 |
|
| Market Risk Regulatory Capital | |
| $7 |
| | |
| | |
| | |
| |
| $6 |
| | | | | | |
| Specific Risk Not Modeled Add-on | | 5 |
| | | | | | | | 3 |
| | | | | | |
| de Minimis Exposure Add-on | | 15 |
| | | | | | | | 6 |
| | | | | | |
| Total Market Risk Regulatory Capital | |
| $27 |
| | | | | | | |
| $15 |
| | | | | | |
| Market Risk-Weighted Assets | |
| $333 |
| | |
| | |
| | |
| |
| $191 |
| | | | | | |
(1) The high and low for the portfolio may have occurred on different trading days than the high and low for the components. Therefore, there is no diversification benefit shown for the high and low columns.
Stressed VaR
SVaR is an extension of VaR, but uses a longer historical look back horizon that is fixed from January 3, 2005. This is done not only to identify headline risks from more volatile periods, but also to provide a counter balance to VaR which may be low during periods of low volatility. The holding period for profit and loss determination is 10 days. SVaR is also a component of market risk regulatory capital. SVaR for us is calculated under its own dynamic window regime as compared to RBS’ static SVaR window. In a dynamic window regime, values of the 10-day, 99% VaR are calculated over all possible 260-day periods that can be obtained from the complete historical data set. Refer to “Market Risk Regulatory Capital” above for details of SVaR metrics, including high, low, average and period end SVaR for the combined portfolio.
Sensitivity Analysis
Sensitivity analysis is the measure of exposure to a single risk factor, such as a one basis point change in rates or credit spread. We conduct and monitor sensitivity on interest rates, basis spreads, foreign exchange exposures and option prices. Whereas VaR is based on previous moves in market risk factors over recent periods, it may not be an accurate predictor of future market moves. Sensitivity analysis complements VaR as it provides an indication of risk relative to each factor irrespective of historical market moves and is an effective tool in evaluating the appropriateness of hedging strategies.
Stress Testing
Conducting a stress test of a portfolio consists of running risk models with the inclusion of key variables that simulate various historical or hypothetical scenarios. For historical stress tests, profit and loss results are simulated for selected time periods corresponding to the most volatile underlying returns while hypothetical stress tests aim to consider concentration risk, illiquidity under stressed market conditions and risk arising from the bank’s trading activities that may not be fully captured by its other models. Hypothetical scenarios also assume that the market moves happen simultaneously and that no repositioning or hedging activity takes place to mitigate losses as events unfold. We generate stress tests of our trading positions on a regular basis. For example, we currently include a stress test that simulates a Lehman-type crisis scenario by taking the worst 10-day peak to trough moves for the various risk factors that go into VaR from that period, and assumes they occurred simultaneously.
VaR Model Review and Validation
Market risk measurement models used are independently reviewed. The models, used under the Transitional Services Agreement, are subject to ongoing and independent review and validation that focuses on the model methodology. Independent
CITIZENS FINANCIAL GROUP, INC.
MANAGEMENT’S DISCUSSION AND ANALYSIS
review of market risk measurement models is the responsibility of RBS Risk Analytics. Aspects covered include challenging the assumptions used, the quantitative techniques employed and the theoretical justification underpinning them, and an assessment of the soundness of the required data over time. Where possible, the quantitative impact of the major underlying modeling assumptions will be estimated (e.g., through developing alternative models). Results of such reviews are shared with U.S. regulators. For the term of the Transitional Services Agreement, we and RBS expect to utilize the same independently validated VaR model for both management and regulatory reporting purposes. RBS market risk teams, including those providing consultative services to us under the Transitional Services Agreement, will conduct internal validation before a new or changed model element is implemented and before a change is made to a market data mapping. For example, RBS market risk teams also perform regular reviews of key risk factors that are used in the market risk measurement models to produce profit and loss vectors used in the VaR calculations. These internal validations are subject to independent re-validation by RBS Risk Analytics and, depending on the results of the impact assessment, notification to the appropriate regulatory authorities for RBS and us may be required.
VaR Backtesting
Backtesting is one form of validation of the VaR model. The Market Risk Rule requires a comparison of our internal VaR measure to the actual net trading revenue (excluding fees, commissions, reserves, intra-day trading and net interest income) for each day over the preceding year (the most recent 250 business days). Any observed loss in excess of the VaR number is taken as an exception. The level of exceptions determines the multiplication factor used to derive the VaR and SVaR-based capital requirement for regulatory reporting purposes. We perform sub-portfolio backtesting as required under the Market Risk Rule, and as approved by our banking regulators, for interest rate and foreign exchange positions. The following table shows our daily net trading revenue and total internal, modeled VaR for the quarters ended December 31, 2015, September 30, 2015, June 30, 2015 and March 31, 2015. Beginning in the quarter ended September 30, 2015, as agreed with our banking regulators, we use a multiplication factor derived from our specific backtesting results and no longer that of RBS.
Daily VaR Backtesting: Sub-portfolio Level Backtesting
CITIZENS FINANCIAL GROUP, INC.
SELECTED STATISTICAL INFORMATION
Selected Statistical Information
The accompanying supplemental information regardingshould be read in conjunction with Part II, Item 6 — Selected Financial Data and Part II, Item 8 — Financial Statements and Supplementary Data, included elsewhere in this report.
Distribution of Assets, Liabilities and Stockholders’ Equity; Interest Rates and Interest Differential
The following table provides a summary of our derivative instruments,consolidated average balances including major categories of interest earning assets and interest bearing liabilities:
|
| | | | | | | | | | | | | | | | | | | | | | | | | | |
| | Year Ended December 31, |
| | 2015 | | 2014 | | 2013 |
| (dollars in millions) | Average Balances | Income/ Expense | Yields/ Rates | | Average Balances | Income/ Expense | Yields/ Rates | | Average Balances | Income/ Expense | Yields/ Rates |
| Assets | | | | | | | | | | | |
| Interest-bearing cash and due from banks and deposits in banks |
| $1,746 |
|
| $5 |
| 0.29 | % | |
| $2,113 |
|
| $5 |
| 0.22 | % | |
| $2,278 |
|
| $11 |
| 0.46 | % |
| Taxable investment securities | 24,649 |
| 621 |
| 2.52 |
| | 24,319 |
| 619 |
| 2.55 |
| | 19,062 |
| 477 |
| 2.50 |
|
| Non-taxable investment securities | 9 |
| — |
| 2.60 |
| | 11 |
| — |
| 2.60 |
| | 12 |
| — |
| 2.66 |
|
| Total investment securities | 24,658 |
| 621 |
| 2.52 |
| | 24,330 |
| 619 |
| 2.55 |
| | 19,074 |
| 477 |
| 2.50 |
|
| Commercial | 32,673 |
| 951 |
| 2.87 |
| | 29,993 |
| 900 |
| 2.96 |
| | 28,654 |
| 900 |
| 3.10 |
|
| Commercial real estate | 8,231 |
| 211 |
| 2.53 |
| | 7,158 |
| 183 |
| 2.52 |
| | 6,568 |
| 178 |
| 2.67 |
|
| Leases | 3,902 |
| 97 |
| 2.50 |
| | 3,776 |
| 103 |
| 2.73 |
| | 3,463 |
| 105 |
| 3.05 |
|
| Total commercial | 44,806 |
| 1,259 |
| 2.78 |
| | 40,927 |
| 1,186 |
| 2.86 |
| | 38,685 |
| 1,183 |
| 3.02 |
|
| Residential mortgages | 12,338 |
| 465 |
| 3.77 |
| | 10,729 |
| 425 |
| 3.96 |
| | 9,104 |
| 360 |
| 3.96 |
|
| Home equity loans | 3,025 |
| 163 |
| 5.38 |
| | 3,877 |
| 205 |
| 5.29 |
| | 4,606 |
| 246 |
| 5.35 |
|
| Home equity lines of credit | 14,958 |
| 441 |
| 2.95 |
| | 15,552 |
| 450 |
| 2.89 |
| | 16,337 |
| 463 |
| 2.83 |
|
Home equity loans serviced by others (1) | 1,117 |
| 77 |
| 6.94 |
| | 1,352 |
| 91 |
| 6.75 |
| | 1,724 |
| 115 |
| 6.65 |
|
Home equity lines of credit serviced by others (1) | 453 |
| 11 |
| 2.44 |
| | 609 |
| 16 |
| 2.68 |
| | 768 |
| 22 |
| 2.88 |
|
| Automobile | 13,516 |
| 372 |
| 2.75 |
| | 11,011 |
| 282 |
| 2.57 |
| | 8,857 |
| 235 |
| 2.65 |
|
| Student | 3,313 |
| 167 |
| 5.03 |
| | 2,148 |
| 102 |
| 4.74 |
| | 2,202 |
| 95 |
| 4.30 |
|
| Credit cards | 1,621 |
| 178 |
| 10.97 |
| | 1,651 |
| 167 |
| 10.14 |
| | 1,669 |
| 175 |
| 10.46 |
|
| Other retail | 1,003 |
| 78 |
| 7.75 |
| | 1,186 |
| 88 |
| 7.43 |
| | 1,453 |
| 107 |
| 7.36 |
|
| Total retail | 51,344 |
| 1,952 |
| 3.80 |
| | 48,115 |
| 1,826 |
| 3.80 |
| | 46,720 |
| 1,818 |
| 3.89 |
|
Total loans and leases (2) | 96,150 |
| 3,211 |
| 3.32 |
| | 89,042 |
| 3,012 |
| 3.37 |
| | 85,405 |
| 3,001 |
| 3.50 |
|
| Loans held for sale, at fair value | 301 |
| 10 |
| 3.47 |
| | 163 |
| 5 |
| 3.10 |
| | 392 |
| 12 |
| 3.07 |
|
| Other loans held for sale | 95 |
| 7 |
| 7.22 |
| | 539 |
| 23 |
| 4.17 |
| | — |
| — |
| — |
|
| Interest-earning assets | 122,950 |
| 3,854 |
| 3.12 |
| | 116,187 |
| 3,664 |
| 3.14 |
| | 107,149 |
| 3,501 |
| 3.25 |
|
| Allowance for loan and lease losses | (1,196 | ) | | | | (1,230 | ) | | | | (1,219 | ) | | |
| Goodwill | 6,876 |
| | | | 6,876 |
| | | | 9,063 |
| | |
| Other noninterest-earning assets | 6,440 |
| | | | 5,791 |
| | | | 5,873 |
| | |
| Total noninterest-earning assets | 12,120 |
| | | | 11,437 |
| | | | 13,717 |
| | |
| Total assets |
| $135,070 |
| | | |
| $127,624 |
| | | |
| $120,866 |
| | |
(1) Our SBO portfolio consists of home equity loans and lines that were originally serviced by others. We now service a portion of this portfolio internally.
(2) Interest income and rates on loans include loan fees. Additionally, average nonaccrual loans were included in the average loan balances used to determine the average yield on loans in amounts of $1.1 billion, $1.2 billion, and $1.6 billion for December 31, 2015, 2014, and 2013, respectively.
CITIZENS FINANCIAL GROUP, INC.
SELECTED STATISTICAL INFORMATION
|
| | | | | | | | | | | | | | | | | | | | | | | | | | |
| | Year Ended December 31, |
| | 2015 | | 2014 | | 2013 |
| (dollars in millions) | Average Balances | Income/ Expense | Yields/ Rates | | Average Balances | Income/ Expense | Yields/ Rates | | Average Balances | Income/ Expense | Yields/ Rates |
| Liabilities and Stockholders’ Equity | | | | | | | | | | | |
| Checking with interest |
| $16,666 |
|
| $19 |
| 0.11 | % | |
| $14,507 |
|
| $12 |
| 0.08 | % | |
| $14,096 |
|
| $8 |
| 0.06 | % |
| Money market and savings | 43,458 |
| 117 |
| 0.27 |
| | 39,579 |
| 77 |
| 0.19 |
| | 42,575 |
| 105 |
| 0.25 |
|
| Term deposits | 12,424 |
| 101 |
| 0.82 |
| | 10,317 |
| 67 |
| 0.65 |
| | 11,266 |
| 103 |
| 0.91 |
|
| Total interest-bearing deposits | 72,548 |
| 237 |
| 0.33 |
| | 64,403 |
| 156 |
| 0.24 |
| | 67,937 |
| 216 |
| 0.32 |
|
| Interest-bearing deposits held for sale | — |
| — |
| — |
| | 1,960 |
| 4 |
| 0.22 |
| | — |
| — |
| — |
|
Federal funds purchased and securities sold under agreements to repurchase (3) | 3,364 |
| 16 |
| 0.46 |
| | 5,699 |
| 32 |
| 0.55 |
| | 2,400 |
| 192 |
| 7.89 |
|
| Other short-term borrowed funds | 5,865 |
| 67 |
| 1.13 |
| | 5,640 |
| 89 |
| 1.56 |
| | 251 |
| 4 |
| 1.64 |
|
| Long-term borrowed funds | 4,479 |
| 132 |
| 2.95 |
| | 1,907 |
| 82 |
| 4.25 |
| | 778 |
| 31 |
| 3.93 |
|
| Total borrowed funds | 13,708 |
| 215 |
| 1.56 |
| | 13,246 |
| 203 |
| 1.51 |
| | 3,429 |
| 227 |
| 6.53 |
|
| Total interest-bearing liabilities | 86,256 |
| 452 |
| 0.52 |
| | 79,609 |
| 363 |
| 0.45 |
| | 71,366 |
| 443 |
| 0.61 |
|
| Demand deposits | 26,606 |
| | | | 25,739 |
| | | | 25,399 |
| | |
| Demand deposits held for sale | — |
| | | | 462 |
| | | | — |
| | |
| Other liabilities | 2,671 |
| | | | 2,415 |
| | | | 2,267 |
| | |
| Total liabilities | 115,533 |
| | | | 108,225 |
| | | | 99,032 |
| | |
| Stockholders’ equity | 19,537 |
| | | | 19,399 |
| | | | 21,834 |
| | |
| Total liabilities and stockholders’ equity |
| $135,070 |
| | | |
| $127,624 |
| | | |
| $120,866 |
| | |
| Interest rate spread | | | 2.60 |
| | | | 2.69 |
| | | | 2.64 |
|
| Net interest income | |
| $3,402 |
| | | |
| $3,301 |
| | | |
| $3,058 |
| |
| Net interest margin | | | 2.75 | % | | | | 2.83 | % | | | | 2.85 | % |
(3) Balances are net of certain short-term receivables associated with reverse agreements. Interest expense includes the full cost of the repurchase agreements and certain hedging costs. The yield on Federal funds purchased is elevated due to the impact from pay-fixed interest rate swaps that are scheduled to run off by the end of 2016. For further discussion see “Management’s Discussion and Analysis of Financial Condition and Results of Operations — Year ended December 31, 2015 Compared with Year Ended December 31, 2014 — Derivatives.”
CITIZENS FINANCIAL GROUP, INC.
SELECTED STATISTICAL INFORMATION
Change in Net Interest Income–Volume and Rate Analysis
The following table presents the amount of changes in interest income and interest expense due to changes in both average volume and average rate. Average volume and rate changes have been allocated between the average rate and average volume variances on a consistent basis based upon the respective percentage changes in average balances and average rates.
|
| | | | | | | | | | | | | | | | | | | |
| | Year Ended December 31, | | Year Ended December 31, |
| | 2015 Versus 2014 | | 2014 Versus 2013 |
| (in millions) | Average Volume | Average Rate | Net Change | | Average Volume | Average Rate | Net Change |
| Interest Income | | | | | | | |
| Interest-bearing cash and due from banks and deposits in banks |
| ($1 | ) |
| $1 |
|
| $— |
| |
| ($1 | ) |
| ($5 | ) |
| ($6 | ) |
| Taxable investment securities |
| $9 |
|
| ($7 | ) | 2 |
| | 132 |
| 10 |
| 142 |
|
| Non-taxable investment securities | — |
| — |
| — |
| | — |
| — |
| — |
|
| Total investment securities | 9 |
| (7 | ) |
| $2 |
| | 132 |
| 10 |
|
| $142 |
|
| Commercial | 79 |
| (28 | ) |
| $51 |
| | 42 |
| (42 | ) |
| $— |
|
| Commercial real estate | 27 |
| 1 |
| 28 |
| | 16 |
| (11 | ) | 5 |
|
| Leases | 3 |
| (9 | ) | (6 | ) | | 10 |
| (12 | ) | (2 | ) |
| Total commercial | 109 |
| (36 | ) | 73 |
| | 68 |
| (65 | ) | 3 |
|
| Residential mortgages | 63 |
| (23 | ) | 40 |
| | 65 |
| — |
| 65 |
|
| Home equity loans | (44 | ) | 2 |
| (42 | ) | | (39 | ) | (2 | ) | (41 | ) |
| Home equity lines of credit | (18 | ) | 9 |
| (9 | ) | | (22 | ) | 9 |
| (13 | ) |
Home equity loans serviced by others (1) | (17 | ) | 3 |
| (14 | ) | | (25 | ) | 1 |
| (24 | ) |
Home equity lines of credit serviced by others (1) | (4 | ) | (1 | ) | (5 | ) | | (5 | ) | (1 | ) | (6 | ) |
| Automobile | 65 |
| 25 |
| 90 |
| | 57 |
| (10 | ) | 47 |
|
| Student | 55 |
| 10 |
| 65 |
| | (2 | ) | 9 |
| 7 |
|
| Credit cards | (3 | ) | 14 |
| 11 |
| | (2 | ) | (6 | ) | (8 | ) |
| Other retail | (14 | ) | 4 |
| (10 | ) | | (20 | ) | 1 |
| (19 | ) |
| Total retail | 83 |
| 43 |
| 126 |
| | 7 |
| 1 |
| 8 |
|
| Total loans and leases | 192 |
| 7 |
| 199 |
| | 75 |
| (64 | ) | 11 |
|
| Loans held for sale, at fair value | 5 |
| — |
| 5 |
| | (7 | ) | — |
| (7 | ) |
| Other loans held for sale | (18 | ) | 2 |
| (16 | ) | | 44 |
| (21 | ) | 23 |
|
| Total interest income |
| $187 |
|
| $3 |
|
| $190 |
| |
| $243 |
|
| ($80 | ) |
| $163 |
|
| Interest Expense | | | | | | | |
| Checking with interest |
| $— |
|
| $7 |
|
| $7 |
| |
| $— |
|
| $4 |
|
| $4 |
|
| Money market and savings | 8 |
| 32 |
| 40 |
| | (7 | ) | (21 | ) | (28 | ) |
| Term deposits | 14 |
| 20 |
| 34 |
| | (9 | ) | (27 | ) | (36 | ) |
| Total interest-bearing deposits | 22 |
| 59 |
| 81 |
| | (16 | ) | (44 | ) | (60 | ) |
| Interest-bearing deposits held for sale | (4 | ) | — |
| (4 | ) | | — |
| 4 |
| 4 |
|
| Federal funds purchased and securities sold under agreements to repurchase | (13 | ) | (3 | ) | (16 | ) | | 264 |
| (424 | ) | (160 | ) |
| Other short-term borrowed funds | 4 |
| (26 | ) | (22 | ) | | 89 |
| (4 | ) | 85 |
|
| Long-term borrowed funds | 109 |
| (59 | ) | 50 |
| | 45 |
| 6 |
| 51 |
|
| Total borrowed funds | 100 |
| (88 | ) | 12 |
| | 398 |
| (422 | ) | (24 | ) |
| Total interest expense | 118 |
| (29 | ) | 89 |
| | 382 |
| (462 | ) | (80 | ) |
| Net interest income |
| $69 |
|
| $32 |
|
| $101 |
| |
| ($139 | ) |
| $382 |
|
| $243 |
|
(1) Our SBO portfolio consists of home equity loans and lines that were originally serviced by others. We now service a portion of this portfolio internally.
CITIZENS FINANCIAL GROUP, INC.
SELECTED STATISTICAL INFORMATION
Investment Portfolio
The following table presents the book value of the major components of our investments portfolio. For further discussion, see Note 15 “Derivatives”3 “Securities” to our audited Consolidated Financial Statements in Part II, Item 8 — Financial Statements and Supplementary Data, included elsewhere in this report.
|
| | | | | | | | | | | |
| | December 31, |
| (in millions) | 2015 |
| | 2014 |
| | 2013 |
|
| Securities Available for Sale: | | | | | |
| U.S. Treasury and other |
| $16 |
| |
| $15 |
| |
| $15 |
|
| State and political subdivisions | 9 |
| | 10 |
| | 10 |
|
| Mortgage-backed securities: | | | | | |
| Federal agencies and U.S. government sponsored entities | 17,320 |
| | 17,934 |
| | 14,993 |
|
| Other/non-agency | 522 |
| | 672 |
| | 952 |
|
| Total mortgage-backed securities | 17,842 |
| | 18,606 |
| | 15,945 |
|
| Total debt securities available for sale | 17,867 |
| | 18,631 |
| | 15,970 |
|
| Marketable equity securities | 5 |
| | 13 |
| | 13 |
|
| Other equity securities | 12 |
| | 12 |
| | 12 |
|
| Total equity securities available for sale | 17 |
| | 25 |
| | 25 |
|
| Total securities available for sale |
| $17,884 |
| |
| $18,656 |
| |
| $15,995 |
|
| Securities Held to Maturity: | | | | | |
| Mortgage-backed securities: | | | | | |
| Federal Agencies and U.S. government sponsored entities |
| $4,105 |
| |
| $3,728 |
| |
| $2,940 |
|
| Other/non-agency | 1,153 |
| | 1,420 |
| | 1,375 |
|
| Total securities held to maturity |
| $5,258 |
| |
| $5,148 |
| |
| $4,315 |
|
| Other Investment Securities, at Fair Value: | | | | | |
| Money market mutual fund |
| $65 |
| |
| $28 |
| |
| $29 |
|
| Other investments | 5 |
| | 5 |
| | 5 |
|
| Total other investment securities, at fair value |
| $70 |
| |
| $33 |
| |
| $34 |
|
| Other Investment Securities, at Cost: | | | | | |
| Federal Reserve Bank stock |
| $468 |
| |
| $477 |
| |
| $462 |
|
| Federal Home Loan Bank stock | 395 |
| | 390 |
| | 468 |
|
| Total other investment securities, at cost |
| $863 |
| |
| $867 |
| |
| $930 |
|
CITIZENS FINANCIAL GROUP, INC.
SELECTED STATISTICAL INFORMATION
The following table presents an analysis of the amortized cost, remaining contractual maturities, and weighted-average yields by contractual maturity. Expected maturities may differ from contractual maturities because borrowers may have the right to call or prepay obligations with or without call or prepayment penalties.
|
| | | | | | | | | | | | | | | |
| | Distribution of Maturities |
| | As of December 31, 2015 |
| (dollars in millions) | Due in 1 Year or Less | Due After 1
Through 5
Years | Due After 5
Through 10
Years | Due After 10
Years | Total |
|
| Amortized cost: |
|
|
|
|
|
| Debt securities available for sale: |
|
|
|
|
|
| U.S. Treasury and other |
| $15 |
|
| $— |
|
| $1 |
|
| $— |
|
| $16 |
|
| State and political subdivisions | — |
| — |
| — |
| 9 |
| 9 |
|
| Mortgage-backed securities: | | | | | |
| Federal agencies and U.S. government sponsored entities | 4 |
| 52 |
| 1,833 |
| 15,345 |
| 17,234 |
|
| Other/non-agency | — |
| 68 |
| 3 |
| 484 |
| 555 |
|
| Total debt securities available for sale | 19 |
| 120 |
| 1,837 |
| 15,838 |
| 17,814 |
|
| Debt securities held to maturity: | | | | | |
| Mortgage-backed securities: | | | | | |
| Federal agencies and U.S. government sponsored entities | — |
| — |
| — |
| 4,105 |
| 4,105 |
|
| Other/non-agency | — |
| — |
| — |
| 1,153 |
| 1,153 |
|
| Total debt securities held to maturity | — |
| — |
| — |
| 5,258 |
| 5,258 |
|
Total amortized cost of debt securities (1) |
| $19 |
|
| $120 |
|
| $1,837 |
|
| $21,096 |
|
| $23,072 |
|
Weighted-average yield (2) | 1.27 | % | 4.88 | % | 1.90 | % | 2.57 | % | 2.53 | % |
(1) As of December 31, 2015, no investments exceeded 10% of stockholders’ equity.
(2) Yields on tax-exempt securities are not computed on a tax-equivalent basis.
Loan and Lease Portfolio
The following table shows the composition of total loans and leases. For further discussion see Note 4 “Loans and Leases” to our audited Consolidated Financial Statements in Part II, Item 8 — Financial Statements and Supplementary Data, included elsewhere in this report.
|
| | | | | | | | | | | | | | | | | | | | | | |
| | December 31, 2014 | | December 31, 2013 | | Changes in Net Assets/ Liabilities |
| (dollars in millions) | Notional Amount (1) | Derivative Assets | Derivative Liabilities | | Notional Amount (1) | Derivative Assets | Derivative Liabilities | |
| Derivatives designated as hedging instruments: | | | | | | | | | |
| Interest rate swaps |
| $5,750 |
|
| $24 |
|
| $99 |
| |
| $5,500 |
|
| $23 |
|
| $412 |
| | (81 | %) |
| Derivatives not designated as hedging instruments: | | | | | | | | | |
| Interest rate swaps | 31,848 |
| 589 |
| 501 |
| | 29,355 |
| 654 |
| 558 |
| | (8 | ) |
| Foreign exchange contracts | 8,359 |
| 170 |
| 164 |
| | 7,771 |
| 94 |
| 87 |
| | (14 | ) |
| Other contracts | 730 |
| 7 |
| 9 |
| | 569 |
| 7 |
| 10 |
| | (33 | ) |
| Total derivatives not designated as hedging instruments | | 766 |
| 674 |
| | | 755 |
| 655 |
| | (8 | ) |
| Gross derivative fair values | | 790 |
| 773 |
| | | 778 |
| 1,067 |
| | (106 | ) |
Less: Gross amounts offset in the Consolidated Balance Sheets (2) | | (161 | ) | (161 | ) | | | (128 | ) | (128 | ) | | |
Total net derivative fair values presented in the Consolidated Balance Sheets (3) | |
| $629 |
|
| $612 |
| | |
| $650 |
|
| $939 |
| | |
|
| | | | | | | | | | | | | | | | | | | |
| | December 31, |
| (in millions) | 2015 |
| | 2014 |
| | 2013 |
| | 2012 |
| | 2011 |
|
| Commercial |
| $33,264 |
| |
| $31,431 |
| |
| $28,667 |
| |
| $28,856 |
| |
| $25,770 |
|
| Commercial real estate | 8,971 |
| | 7,809 |
| | 6,948 |
| | 6,459 |
| | 7,602 |
|
| Leases | 3,979 |
| | 3,986 |
| | 3,780 |
| | 3,415 |
| | 3,164 |
|
| Total commercial | 46,214 |
| | 43,226 |
| | 39,395 |
| | 38,730 |
| | 36,536 |
|
| Residential mortgages | 13,318 |
| | 11,832 |
| | 9,726 |
| | 9,323 |
| | 9,719 |
|
| Home equity loans | 2,557 |
| | 3,424 |
| | 4,301 |
| | 5,106 |
| | 6,766 |
|
| Home equity lines of credit | 14,674 |
| | 15,423 |
| | 15,667 |
| | 16,672 |
| | 16,666 |
|
Home equity loans serviced by others (1) | 986 |
| | 1,228 |
| | 1,492 |
| | 2,024 |
| | 2,535 |
|
Home equity lines of credit serviced by others (1) | 389 |
| | 550 |
| | 679 |
| | 936 |
| | 1,089 |
|
| Automobile | 13,828 |
| | 12,706 |
| | 9,397 |
| | 8,944 |
| | 7,571 |
|
| Student | 4,359 |
| | 2,256 |
| | 2,208 |
| | 2,198 |
| | 2,271 |
|
| Credit cards | 1,634 |
| | 1,693 |
| | 1,691 |
| | 1,691 |
| | 1,637 |
|
| Other retail | 1,083 |
| | 1,072 |
| | 1,303 |
| | 1,624 |
| | 2,005 |
|
| Total retail | 52,828 |
| | 50,184 |
| | 46,464 |
| | 48,518 |
| | 50,259 |
|
| Total loans and leases |
| $99,042 |
| |
| $93,410 |
| |
| $85,859 |
| |
| $87,248 |
| |
| $86,795 |
|
(1) Our SBO portfolio consists of home equity loans and lines that were originally serviced by others. We now service a portion of this portfolio internally.
CITIZENS FINANCIAL GROUP, INC.
SELECTED STATISTICAL INFORMATION
Maturities and Sensitivities of Loans and Leases to Changes in Interest Rates
The following table is a summary of loans and leases by remaining maturity or repricing date:
|
| | | | | | | | | | | | |
| | December 31, 2015 |
| (in millions) | Due in 1 Year or Less | Due After 1 Year Through 5 Years | Due After 5 Years | Total Loans and Leases |
| Commercial |
| $28,293 |
|
| $3,141 |
|
| $1,830 |
|
| $33,264 |
|
| Commercial real estate | 8,626 |
| 155 |
| 190 |
| 8,971 |
|
| Leases | 665 |
| 2,055 |
| 1,259 |
| 3,979 |
|
| Total commercial | 37,584 |
| 5,351 |
| 3,279 |
| 46,214 |
|
| Residential mortgages | 1,485 |
| 1,201 |
| 10,632 |
| 13,318 |
|
| Home equity loans | 542 |
| 388 |
| 1,627 |
| 2,557 |
|
| Home equity lines of credit | 10,772 |
| 2,144 |
| 1,758 |
| 14,674 |
|
Home equity loans serviced by others (1) | — |
| 133 |
| 853 |
| 986 |
|
Home equity lines of credit serviced by others (1) | 389 |
| — |
| — |
| 389 |
|
| Automobile | 131 |
| 7,663 |
| 6,034 |
| 13,828 |
|
| Student | 13 |
| 305 |
| 4,041 |
| 4,359 |
|
| Credit cards | 1,487 |
| 147 |
| — |
| 1,634 |
|
| Other retail | 447 |
| 311 |
| 325 |
| 1,083 |
|
| Total retail | 15,266 |
| 12,292 |
| 25,270 |
| 52,828 |
|
| Total loans and leases |
| $52,850 |
|
| $17,643 |
|
| $28,549 |
|
| $99,042 |
|
| Loans and leases due after one year at fixed interest rates |
| $12,785 |
|
| $20,261 |
|
| $33,046 |
|
| Loans and leases due after one year at variable interest rates | 4,858 |
| 8,288 |
| 13,146 |
|
(1) Our SBO portfolio consists of home equity loans and lines that were originally serviced by others. We now service a portion of this portfolio internally.
Loan and Lease Concentrations
This disclosure presents our exposure to any concentration of loans and leases that exceed 10% of total loans and leases. At December 31, 2015, we did not identify any concentration of loans and leases that exceeded the 10% threshold. For further discussion of how we managed concentration exposures, see Note 5 “Allowance for Credit Losses, Nonperforming Assets, and Concentrations of Credit Risk” to our audited Consolidated Financial Statements in Part II, Item 8 — Financial Statements and Supplementary Data, included elsewhere in this report.
CITIZENS FINANCIAL GROUP, INC.
SELECTED STATISTICAL INFORMATION
Risk Elements
The following table presents a summary of nonperforming loans and leases by class:
|
| | | | | | | | | | | | | | | | | | | |
| | December 31, |
| (in millions) | 2015 |
| | 2014 |
| | 2013 |
| | 2012 |
| | 2011 |
|
| Nonaccrual loans and leases | | | | | | | | | |
| Commercial |
| $70 |
| |
| $113 |
| |
| $96 |
| |
| $119 |
| |
| $176 |
|
| Commercial real estate | 77 |
| | 50 |
| | 169 |
| | 386 |
| | 710 |
|
| Leases | — |
| | — |
| | — |
| | 1 |
| | 1 |
|
| Total commercial | 147 |
| | 163 |
| | 265 |
| | 506 |
| | 887 |
|
| Residential mortgages | 331 |
| | 345 |
| | 382 |
| | 486 |
| | 374 |
|
| Home equity loans | 135 |
| | 203 |
| | 266 |
| | 298 |
| | 207 |
|
| Home equity lines of credit | 272 |
| | 257 |
| | 333 |
| | 259 |
| | 109 |
|
Home equity loans serviced by others (1) | 38 |
| | 47 |
| | 59 |
| | 92 |
| | 68 |
|
Home equity lines of credit serviced by others (1) | 32 |
| | 25 |
| | 30 |
| | 41 |
| | 25 |
|
| Automobile | 42 |
| | 21 |
| | 16 |
| | 16 |
| | 7 |
|
| Student | 35 |
| | 11 |
| | 3 |
| | 3 |
| | 4 |
|
| Credit cards | 16 |
| | 16 |
| | 19 |
| | 20 |
| | 23 |
|
| Other retail | 3 |
| | 5 |
| | 10 |
| | 9 |
| | 8 |
|
| Total retail | 904 |
| | 930 |
| | 1,118 |
| | 1,224 |
| | 825 |
|
| Total nonaccrual loans and leases | 1,051 |
| | 1,093 |
| | 1,383 |
| | 1,730 |
| | 1,712 |
|
| Loans and leases that are accruing and 90 days or more delinquent | | | | | | | | | |
| Commercial | 1 |
| | 1 |
| | — |
| | 71 |
| | 1 |
|
| Commercial real estate | — |
| | — |
| | — |
| | 33 |
| | 4 |
|
| Leases | — |
| | — |
| | — |
| | — |
| | — |
|
| Total commercial | 1 |
| | 1 |
| | — |
| | 104 |
| | 5 |
|
| Residential mortgages | — |
| | — |
| | — |
| | — |
| | 29 |
|
| Home equity loans | — |
| | — |
| | — |
| | — |
| | — |
|
| Home equity lines of credit | — |
| | — |
| | — |
| | — |
| | — |
|
Home equity loans serviced by others (1) | — |
| | — |
| | — |
| | — |
| | — |
|
Home equity lines of credit serviced by others (1) | — |
| | — |
| | — |
| | — |
| | — |
|
| Automobile | — |
| | — |
| | — |
| | — |
| | — |
|
| Student | 6 |
| | 6 |
| | 31 |
| | 33 |
| | 36 |
|
| Credit cards | — |
| | 1 |
| | 2 |
| | 2 |
| | 2 |
|
| Other retail | 2 |
| | — |
| | — |
| | — |
| | — |
|
| Total retail | 8 |
| | 7 |
| | 33 |
| | 35 |
| | 67 |
|
| Total accruing and 90 days or more delinquent | 9 |
| | 8 |
| | 33 |
| | 139 |
| | 72 |
|
| Total nonperforming loans and leases |
| $1,060 |
| |
| $1,101 |
| |
| $1,416 |
| |
| $1,869 |
| |
| $1,784 |
|
Troubled debt restructurings (2) |
| $909 |
| |
| $955 |
| |
| $777 |
| |
| $704 |
| |
| $493 |
|
(1) Our SBO portfolio consists of home equity loans and lines that were originally serviced by others. We now service a portion of this portfolio internally.
(2) TDR balances reported in this line item consist of only those TDRs not reported in the nonaccrual loan or accruing and 90 days or more delinquent loan categories. Thus, only those TDRs that are in compliance with their modified terms and not past due, or those TDRs that are past due 30-89 days and still accruing are included in the TDR balances listed above.
CITIZENS FINANCIAL GROUP, INC.
SELECTED STATISTICAL INFORMATION
Impact of Nonperforming Loans and Leases on Interest Income
The following table presents the gross interest income for both nonaccrual and restructured loans that would have been recognized if such loans had been current in accordance with their original contractual terms, and had been outstanding throughout the year or since origination if held for only part of the year. The table also presents the interest income related to these loans that was actually recognized for the year.
|
| | | |
| (in millions) | For the Year Ended December 31, 2015 |
Gross amount of interest income that would have been recorded in accordance with original contractual terms, and had been outstanding throughout the year or since origination, if held for only part of the year (1) |
| $126 |
|
| Interest income actually recognized | 13 |
|
| Total interest income foregone |
| $113 |
|
(1) The notionalBased on the contractual rate that was being charged at the time the loan was restructured or contractual amountplaced on nonaccrual status.
Potential Problem Loans and Leases
This disclosure presents outstanding amounts as well as specific reserves for certain loans and leases where information about possible credit problems of interest rate derivatives and foreign exchange contracts isborrowers causes management to have serious doubts as to the amount upon which interestability of such borrowers to comply with the present repayment terms. At December 31, 2015, we did not identify any potential problem loans or leases within the portfolio that were not already included in “—Risk Elements.”
Cross-Border Outstandings
Cross-border outstandings can include loans, receivables, interest-bearing deposits with other banks, other interest-bearing investments and other payments undermonetary assets that are denominated in either dollars or other non-local currency.
As of December 31, 2015, 2014 and 2013, there were no aggregate cross-border outstandings from borrowers or counterparties in any country that exceeded 1%, or were between 0.75% and 1% of consolidated total assets.
CITIZENS FINANCIAL GROUP, INC.
SELECTED STATISTICAL INFORMATION
Summary of Loan and Lease Loss Experience
The following table summarizes the contract are based. For interest rate derivatives,changes to our ALLL: |
| | | | | | | | | | | | | | | | | | | |
| | As of and for the Year Ended December 31, |
| (dollars in millions) | 2015 | | 2014 | | 2013 | | 2012 | | 2011 |
Allowance for Loan and Lease Losses — Beginning: | |
| Commercial |
| $388 |
| |
| $361 |
| |
| $379 |
| |
| $394 |
| |
| $399 |
|
| Commercial real estate | 61 |
| | 78 |
| | 111 |
| | 279 |
| | 401 |
|
| Leases | 23 |
| | 24 |
| | 19 |
| | 18 |
| | 28 |
|
Qualitative (1) | 72 |
| | 35 |
| | — |
| | — |
| | — |
|
| Total commercial | 544 |
| | 498 |
| | 509 |
| | 691 |
| | 828 |
|
| Residential mortgages | 63 |
| | 104 |
| | 74 |
| | 105 |
| | 118 |
|
| Home equity loans | 50 |
| | 85 |
| | 82 |
| | 62 |
| | 71 |
|
| Home equity lines of credit | 152 |
| | 159 |
| | 107 |
| | 116 |
| | 112 |
|
Home equity loans serviced by others (2) | 47 |
| | 85 |
| | 146 |
| | 241 |
| | 316 |
|
Home equity lines of credit serviced by others (2) | 11 |
| | 18 |
| | 32 |
| | 52 |
| | 69 |
|
| Automobile | 58 |
| | 23 |
| | 30 |
| | 40 |
| | 41 |
|
| Student | 93 |
| | 83 |
| | 75 |
| | 73 |
| | 98 |
|
| Credit cards | 68 |
| | 72 |
| | 65 |
| | 72 |
| | 119 |
|
| Other retail | 32 |
| | 34 |
| | 46 |
| | 55 |
| | 77 |
|
Qualitative (1) | 77 |
| | 60 |
| | — |
| | — |
| | — |
|
| Total retail | 651 |
| | 723 |
| | 657 |
| | 816 |
| | 1,021 |
|
| Unallocated | — |
| | — |
| | 89 |
| | 191 |
| | 156 |
|
Total allowance for loan and lease losses — beginning |
| $1,195 |
| |
| $1,221 |
| |
| $1,255 |
| |
| $1,698 |
| |
| $2,005 |
|
| Gross Charge-offs: | | | | | | | | | |
| Commercial |
| ($30 | ) | |
| ($31 | ) | |
| ($72 | ) | |
| ($127 | ) | |
| ($170 | ) |
| Commercial real estate | (6 | ) | | (12 | ) | | (36 | ) | | (129 | ) | | (208 | ) |
| Leases | — |
| | — |
| | — |
| | (1 | ) | | — |
|
| Total commercial | (36 | ) | | (43 | ) | | (108 | ) | | (257 | ) | | (378 | ) |
| Residential mortgages | (22 | ) | | (36 | ) | | (54 | ) | | (85 | ) | | (98 | ) |
| Home equity loans | (34 | ) | | (55 | ) | | (77 | ) | | (121 | ) | | (124 | ) |
| Home equity lines of credit | (59 | ) | | (80 | ) | | (102 | ) | | (118 | ) | | (106 | ) |
Home equity loans serviced by others (2) | (32 | ) | | (55 | ) | | (119 | ) | | (220 | ) | | (300 | ) |
Home equity lines of credit serviced by others (2) | (14 | ) | | (12 | ) | | (27 | ) | | (48 | ) | | (66 | ) |
| Automobile | (117 | ) | | (41 | ) | | (19 | ) | | (29 | ) | | (47 | ) |
| Student | (51 | ) | | (54 | ) | | (74 | ) | | (88 | ) | | (97 | ) |
| Credit cards | (59 | ) | | (64 | ) | | (68 | ) | | (68 | ) | | (85 | ) |
| Other retail | (56 | ) | | (53 | ) | | (55 | ) | | (76 | ) | | (85 | ) |
| Total retail | (444 | ) | | (450 | ) | | (595 | ) | | (853 | ) | | (1,008 | ) |
| Total gross charge-offs |
| ($480 | ) | |
| ($493 | ) | |
| ($703 | ) | |
| ($1,110 | ) | |
| ($1,386 | ) |
| Gross Recoveries: | | | | | | | | | |
| Commercial |
| $18 |
| |
| $35 |
| |
| $46 |
| |
| $64 |
| |
| $42 |
|
| Commercial real estate | 31 |
| | 23 |
| | 40 |
| | 47 |
| | 47 |
|
| Leases | — |
| | — |
| | 1 |
| | 2 |
| | 3 |
|
| Total commercial | 49 |
| | 58 |
| | 87 |
| | 113 |
| | 92 |
|
| Residential mortgages | 12 |
| | 11 |
| | 10 |
| | 16 |
| | 15 |
|
| Home equity loans | 11 |
| | 24 |
| | 26 |
| | 27 |
| | 27 |
|
| Home equity lines of credit | 18 |
| | 15 |
| | 19 |
| | 9 |
| | 9 |
|
Home equity loans serviced by others (2) | 17 |
| | 21 |
| | 23 |
| | 22 |
| | 18 |
|
Home equity lines of credit serviced by others (2) | 8 |
| | 5 |
| | 5 |
| | 5 |
| | 4 |
|
| Automobile | 49 |
| | 20 |
| | 12 |
| | 21 |
| | 35 |
|
| Student | 12 |
| | 9 |
| | 13 |
| | 14 |
| | 12 |
|
| Credit cards | 8 |
| | 7 |
| | 7 |
| | 8 |
| | 9 |
|
| Other retail | 12 |
| | — |
| | — |
| | — |
| | — |
|
| Total retail | 147 |
| | 112 |
| | 115 |
| | 122 |
| | 129 |
|
| Total gross recoveries |
| $196 |
| |
| $170 |
| |
| $202 |
| |
| $235 |
| |
| $221 |
|
CITIZENS FINANCIAL GROUP, INC.
SELECTED STATISTICAL INFORMATION
|
| | | | | | | | | | | | | | | | | | | |
| | As of and for the Year Ended December 31, |
| (dollars in millions) | 2015 | | 2014 | | 2013 | | 2012 | | 2011 |
| Net (Charge-offs)/Recoveries: | | | | | | | | | |
| Commercial |
| ($12 | ) | |
| $4 |
| |
| ($26 | ) | |
| ($63 | ) | |
| ($128 | ) |
| Commercial real estate | 25 |
| | 11 |
| | 4 |
| | (82 | ) | | (161 | ) |
| Leases | — |
| | — |
| | 1 |
| | 1 |
| | 3 |
|
| Total commercial | 13 |
| | 15 |
| | (21 | ) | | (144 | ) | | (286 | ) |
| Residential mortgages | (10 | ) | | (25 | ) | | (44 | ) | | (69 | ) | | (83 | ) |
| Home equity loans | (23 | ) | | (31 | ) | | (51 | ) | | (94 | ) | | (97 | ) |
| Home equity lines of credit | (41 | ) | | (65 | ) | | (83 | ) | | (109 | ) | | (97 | ) |
Home equity loans serviced by others (2) | (15 | ) | | (34 | ) | | (96 | ) | | (198 | ) | | (282 | ) |
Home equity lines of credit serviced by others (2) | (6 | ) | | (7 | ) | | (22 | ) | | (43 | ) | | (62 | ) |
| Automobile | (68 | ) | | (21 | ) | | (7 | ) | | (8 | ) | | (12 | ) |
| Student | (39 | ) | | (45 | ) | | (61 | ) | | (74 | ) | | (85 | ) |
| Credit cards | (51 | ) | | (57 | ) | | (61 | ) | | (60 | ) | | (76 | ) |
| Other retail | (44 | ) | | (53 | ) | | (55 | ) | | (76 | ) | | (85 | ) |
| Total retail | (297 | ) | | (338 | ) | | (480 | ) | | (731 | ) | | (879 | ) |
| Total net (charge-offs)/recoveries |
| ($284 | ) | |
| ($323 | ) | |
| ($501 | ) | |
| ($875 | ) | |
| ($1,165 | ) |
| Ratio of net charge-offs to average loans and leases | 0.30 | % | | (0.36 | %) | | (0.59 | %) | | (1.01 | %) | | (1.35 | %) |
| Provision for Loan and Lease Losses: | | | | | | | | | |
| Commercial |
| $— |
| |
| $23 |
| |
| $13 |
| |
| $48 |
| |
| $123 |
|
| Commercial real estate | 25 |
| | (28 | ) | | (36 | ) | | (84 | ) | | 39 |
|
| Leases | — |
| | (1 | ) | | 4 |
| | — |
| | (13 | ) |
Qualitative (1) | 14 |
| | 37 |
| | — |
| | — |
| | — |
|
| Total commercial | 39 |
| | 31 |
| | (19 | ) | | (36 | ) | | 149 |
|
| Residential mortgages | (7 | ) | | (16 | ) | | 53 |
| | 38 |
| | 70 |
|
| Home equity loans | 12 |
| | (4 | ) | | 32 |
| | 114 |
| | 88 |
|
| Home equity lines of credit | 21 |
| | 58 |
| | 85 |
| | 100 |
| | 101 |
|
Home equity loans serviced by others (2) | (3 | ) | | (4 | ) | | 35 |
| | 103 |
| | 207 |
|
Home equity lines of credit serviced by others (2) | (2 | ) | | — |
| | 8 |
| | 23 |
| | 45 |
|
| Automobile | 116 |
| | 56 |
| | — |
| | (2 | ) | | 11 |
|
| Student | 42 |
| | 55 |
| | 69 |
| | 76 |
| | 60 |
|
| Credit cards | 43 |
| | 53 |
| | 71 |
| | 53 |
| | 29 |
|
| Other retail | 40 |
| | 51 |
| | 43 |
| | 67 |
| | 63 |
|
Qualitative (1) | 4 |
| | 17 |
| | — |
| | — |
| | — |
|
| Total retail | 266 |
| | 266 |
| | 396 |
| | 572 |
| | 674 |
|
| Unallocated | — |
| | — |
| | 103 |
| | (102 | ) | | 68 |
|
| Total provision for loan and lease losses |
| $305 |
| |
| $297 |
| |
| $480 |
| |
| $434 |
| |
| $891 |
|
Transfers - General Allowance to Qualitative Allowance: (1) | | | | | | | | | |
| Commercial |
| $— |
| |
| $— |
| |
| $35 |
| |
| $— |
| |
| $— |
|
| Retail | — |
| | — |
| | 60 |
| | — |
| | — |
|
| Unallocated | — |
| | — |
| | (95 | ) | | — |
| | — |
|
| Total Transfers |
| $— |
| |
| $— |
| |
| $— |
| |
| $— |
| |
| $— |
|
Retail Emergence Period Change: (3) | | | | | | | | | |
| Residential mortgages |
| $— |
| |
| $— |
| |
| $21 |
| |
| $— |
| |
| $— |
|
| Home equity loans | — |
| | — |
| | 22 |
| | — |
| | — |
|
| Home equity lines of credit | — |
| | — |
| | 53 |
| | — |
| | — |
|
| Total retail | — |
| | — |
| | 96 |
| | — |
| | — |
|
| Unallocated | — |
| | — |
| | (96 | ) | | — |
| | — |
|
| Total emergence period change |
| $— |
| |
| $— |
| |
| $— |
| |
| $— |
| |
| $— |
|
CITIZENS FINANCIAL GROUP, INC.
SELECTED STATISTICAL INFORMATION
|
| | | | | | | | | | | | | | | | | | | |
| | As of and for the Year Ended December 31, |
| (dollars in millions) | 2015 | | 2014 | | 2013 | | 2012 | | 2011 |
| Sale/Other: | | | | | | | | | |
| Commercial |
| $— |
| |
| $— |
| |
| ($5 | ) | |
| $— |
| |
| $— |
|
| Commercial real estate | — |
| | — |
| | (1 | ) | | (2 | ) | | — |
|
| Total commercial | — |
| | — |
| | (6 | ) | | (2 | ) | | — |
|
| Residential mortgages | — |
| | — |
| | — |
| | — |
| | — |
|
| Home equity loans | — |
| | — |
| | — |
| | — |
| | — |
|
| Home equity lines of credit | — |
| | — |
| | (3 | ) | | — |
| | — |
|
Home equity loans serviced by others (2) | — |
| | — |
| | — |
| | — |
| | — |
|
Home equity lines of credit serviced by others (2) | — |
| | — |
| | — |
| | — |
| | — |
|
| Automobile | — |
| | — |
| | — |
| | — |
| | — |
|
| Student | — |
| | — |
| | — |
| | — |
| | — |
|
| Credit cards | — |
| | — |
| | (3 | ) | | — |
| | — |
|
| Other retail | — |
| | — |
| | — |
| | — |
| | — |
|
| Total retail | — |
| | — |
| | (6 | ) | | — |
| | — |
|
| Unallocated | — |
| | — |
| | (1 | ) | | — |
| | (33 | ) |
| Total sale/other |
| $— |
| |
| $— |
| |
| ($13 | ) | |
| ($2 | ) | |
| ($33 | ) |
Total Allowance for Loan and Lease Losses — Ending: | | | | | | | | | |
| Commercial |
| $376 |
| |
| $388 |
| |
| $361 |
| |
| $379 |
| |
| $394 |
|
| Commercial real estate | 111 |
| | 61 |
| | 78 |
| | 111 |
| | 279 |
|
| Leases | 23 |
| | 23 |
| | 24 |
| | 19 |
| | 18 |
|
Qualitative (1) | 86 |
| | 72 |
| | 35 |
| | — |
| | — |
|
| Total commercial | 596 |
| | 544 |
| | 498 |
| | 509 |
| | 691 |
|
| Residential mortgages | 46 |
| | 63 |
| | 104 |
| | 74 |
| | 105 |
|
| Home equity loans | 39 |
| | 50 |
| | 85 |
| | 82 |
| | 62 |
|
| Home equity lines of credit | 132 |
| | 152 |
| | 159 |
| | 107 |
| | 116 |
|
Home equity loans serviced by others (2) | 29 |
| | 47 |
| | 85 |
| | 146 |
| | 241 |
|
Home equity lines of credit serviced by others (2) | 3 |
| | 11 |
| | 18 |
| | 32 |
| | 52 |
|
| Automobile | 106 |
| | 58 |
| | 23 |
| | 30 |
| | 40 |
|
| Student | 96 |
| | 93 |
| | 83 |
| | 75 |
| | 73 |
|
| Credit cards | 60 |
| | 68 |
| | 72 |
| | 65 |
| | 72 |
|
| Other retail | 28 |
| | 32 |
| | 34 |
| | 46 |
| | 55 |
|
Qualitative (1) | 81 |
| | 77 |
| | 60 |
| | — |
| | — |
|
| Total retail | 620 |
| | 651 |
| | 723 |
| | 657 |
| | 816 |
|
| Unallocated | — |
| | — |
| | — |
| | 89 |
| | 191 |
|
Total allowance for loan and lease losses — ending |
| $1,216 |
| |
| $1,195 |
| |
| $1,221 |
| |
| $1,255 |
| |
| $1,698 |
|
Reserve for Unfunded Lending Commitments — Beginning |
| $61 |
| |
| $39 |
| |
| $40 |
| |
| $61 |
| |
| $70 |
|
| Provision (Credit) for unfunded lending commitments | (3 | ) | | 22 |
| | (1 | ) | | (21 | ) | | (9 | ) |
Reserve for unfunded lending commitments — ending |
| $58 |
| |
| $61 |
| |
| $39 |
| |
| $40 |
| |
| $61 |
|
Total Allowance for Credit Losses — Ending |
| $1,274 |
| |
| $1,256 |
| |
| $1,260 |
| |
| $1,295 |
| |
| $1,759 |
|
(1) As discussed in Note 1 “Significant Accounting Policies” to our audited Consolidated Financial Statements in Part II, Item 8 — Financial Statements and Supplementary Data, included elsewhere in this report, the notional amountALLL is typically not exchanged. Therefore, notional amounts shouldreviewed separately for commercial and retail loans, and the ALLL for each includes an adjustment for qualitative allowance that includes certain risks, factors and events that might not be taken asmeasured in the measurestatistical analysis. As a result of credit or market risk as they tend to greatly overstatethis adjustment, the true economic risk of these contracts.unallocated allowance was absorbed into the separately measured commercial and retail qualitative allowance during 2013.
(2) Amounts represent the impactOur SBO portfolio consists of legally enforceable master netting agreementshome equity loans and lines that allow us to settle positive and negative positions.were originally serviced by others. We now service a portion of this portfolio internally.
(3) We also offset assetsDuring December 2013, we updated our estimate of the incurred loss period for certain residential mortgages. This change reflected an analysis of defaulted borrowers and liabilities associated with repurchase agreements on our Consolidated Balance Sheets. Seealigned to management’s view that incurred but unrealized losses emerge differently during various points of an economic/business cycle. For further discussion, see Note 3, “Securities,” in5 “Allowance for Credit Losses, Nonperforming Assets, and Concentrations of Credit Risk” to our audited Consolidated Financial Statements in Part II, Item 8 — Financial Statements and Supplementary Data, included elsewhere in this report.
CITIZENS FINANCIAL GROUP, INC.
MANAGEMENT'S DISCUSSION AND ANALYSISSELECTED STATISTICAL INFORMATION
Allocation of the Allowance for Loan and Lease Losses
The following table presents an allocation of the ALLL by class and the percent of each class of loans and leases to the total loans and leases:
|
| | | | | | | | | | | | | | | | | | | | | | | | | | | | | |
| | December 31, |
| (dollars in millions) | 2015 | | 2014 | | 2013 | | 2012 | | 2011 |
| Commercial |
| $376 |
| 34 | % | |
| $388 |
| 34 | % | |
| $361 |
| 33 | % | |
| $379 |
| 33 | % | |
| $394 |
| 30 | % |
| Commercial real estate | 111 |
| 9 |
| | 61 |
| 8 |
| | 78 |
| 8 |
| | 111 |
| 7 |
| | 279 |
| 9 |
|
| Leases | 23 |
| 4 |
| | 23 |
| 4 |
| | 24 |
| 5 |
| | 19 |
| 4 |
| | 18 |
| 3 |
|
| Qualitative | 86 |
| N/A |
| | 72 |
| N/A |
| | 35 |
| N/A |
| | — |
| N/A |
| | — |
| N/A |
|
| Total commercial | 596 |
| 47 |
| | 544 |
| 46 |
| | 498 |
| 46 |
| | 509 |
| 44 |
| | 691 |
| 42 |
|
| Residential mortgages | 46 |
| 13 |
| | 63 |
| 13 |
| | 104 |
| 11 |
| | 74 |
| 11 |
| | 105 |
| 11 |
|
| Home equity loans | 39 |
| 3 |
| | 50 |
| 4 |
| | 85 |
| 5 |
| | 82 |
| 6 |
| | 62 |
| 8 |
|
| Home equity lines of credit | 132 |
| 15 |
| | 152 |
| 16 |
| | 159 |
| 18 |
| | 107 |
| 19 |
| | 116 |
| 19 |
|
Home equity loans serviced by others (1) | 29 |
| 1 |
| | 47 |
| 1 |
| | 85 |
| 2 |
| | 146 |
| 2 |
| | 241 |
| 3 |
|
Home equity lines of credit serviced by others (1) | 3 |
| — |
| | 11 |
| 1 |
| | 18 |
| 1 |
| | 32 |
| 1 |
| | 52 |
| 1 |
|
| Automobile | 106 |
| 14 |
| | 58 |
| 14 |
| | 23 |
| 11 |
| | 30 |
| 10 |
| | 40 |
| 9 |
|
| Student | 96 |
| 4 |
| | 93 |
| 2 |
| | 83 |
| 3 |
| | 75 |
| 3 |
| | 73 |
| 3 |
|
| Credit cards | 60 |
| 2 |
| | 68 |
| 2 |
| | 72 |
| 2 |
| | 65 |
| 2 |
| | 72 |
| 2 |
|
| Other retail | 28 |
| 1 |
| | 32 |
| 1 |
| | 34 |
| 1 |
| | 46 |
| 2 |
| | 55 |
| 2 |
|
| Qualitative | 81 |
| N/A |
| | 77 |
| N/A |
| | 60 |
| N/A |
| | — |
| N/A |
| | — |
| N/A |
|
| Total retail | 620 |
| 53 |
| | 651 |
| 54 |
| | 723 |
| 54 |
| | 657 |
| 56 |
| | 816 |
| 58 |
|
| Unallocated | N/A |
| N/A |
| | N/A |
| N/A |
| | N/A |
| N/A |
| | 89 |
| N/A |
| | 191 |
| N/A |
|
| Total loans and leases |
| $1,216 |
| 100 | % | |
| $1,195 |
| 100 | % | |
| $1,221 |
| 100 | % | |
| $1,255 |
| 100 | % | |
| $1,698 |
| 100 | % |
(1) Our SBO portfolio consists of home equity loans and lines that were originally serviced by others. We now service a portion of this portfolio internally.
Deposits
The following table presents the average balances and average interest rates paid for deposits. For further discussion, see Note 11 “Deposits” to our audited Consolidated Financial Statements in Part II, Item 8 — Financial Statements and Supplementary Data, included elsewhere in this report.
|
| | | | | | | | | | | | | | | | | |
| | For the Year Ended December 31, |
| (dollars in millions) | 2015 | | 2014 | | 2013 |
| | Average Balances |
| | | Average Balances |
| | | Average Balances |
| |
Noninterest-bearing demand deposits (1) (2) |
| $26,606 |
| | |
| $25,739 |
| | |
| $25,399 |
| |
| | Average Balances |
| Yields/ Rates |
| | Average Balances |
| Yields/ Rates |
| | Average Balances |
| Yields/ Rates |
|
| Checking with interest |
| $16,666 |
| 0.11 | % | |
| $14,507 |
| 0.08 | % | |
| $14,096 |
| 0.06 | % |
| Money market and savings | 43,458 |
| 0.27 |
| | 39,579 |
| 0.19 |
| | 42,575 |
| 0.25 |
|
| Term deposits | 12,424 |
| 0.82 |
| | 10,317 |
| 0.65 |
| | 11,266 |
| 0.80 |
|
Total interest-bearing deposits (1) (2) |
| $72,548 |
| 0.33 | % | |
| $64,403 |
| 0.24 | % | |
| $67,937 |
| 0.30 | % |
(1) The aggregate amount of deposits by foreign depositors in domestic offices was approximately $1.1 billion as of December 31, 2015, 2014 and 2013.
(2) Excludes deposits held for sale.
CITIZENS FINANCIAL GROUP, INC.
SELECTED STATISTICAL INFORMATION
Time Certificates of Deposit of $100,000 or More
The following table presents the amount of time certificates of deposit of $100,000 or more, segregated by time remaining until maturity:
|
| | | |
| (in millions) | December 31, 2015 |
| Three months or less |
| $3,136 |
|
| After three months through six months | 1,145 |
|
| After six months through twelve months | 1,329 |
|
| After twelve months | 675 |
|
| Total term deposits |
| $6,285 |
|
Return on Equity and Assets
The following table presents our return on average total assets, return on average common equity, dividend payout ratio and average equity to average assets ratio:
|
| | | | | | | | |
| | December 31, |
| | 2015 | | 2014 | | 2013 |
| Return on average total assets | 0.62 | % | | 0.68 | % | | (2.83 | )% |
| Return on average common equity | 4.30 |
| | 4.46 |
| | (15.69 | ) |
| Dividend payout ratio | 25.73 |
| | 92.05 |
| | (34.58 | ) |
| Average equity to average assets ratio | 14.46 |
| | 15.20 |
| | 18.06 |
|
Quarterly Results of Operations
The following table presents unaudited quarterly Consolidated Statements of Operations data and Consolidated Balance Sheet data as of and for the four quarters of 20142015 and 2013,2014, respectively. We have prepared the Consolidated Statement of Operations data and Balance Sheet data on the same basis as our audited Consolidated Financial Statements in Part II, Item 8 — Financial Statements and Supplementary Data, included elsewhere in this report and, in the opinion of management, each Consolidated Statement of Operations and Balance Sheet includes all adjustments, consisting solely of normal recurring adjustments, necessary for the fair statement of the results of operations and balance sheet data as of and for these periods. This information should be read in conjunction with our audited Consolidated Financial Statements and the related notes, included elsewhere in this report.
Supplementary Summary Consolidated Financial and Other Data (unaudited) | | | | For the Three Months Ended | For the Three Months Ended |
| (dollars in millions, except per share amounts) | December 31, 2014 | | September 30, 2014 | | June 30, 2014 | | March 31, 2014 | | December 31, 2013 | | September 30, 2013 | | June 30, 2013 | | March 31, 2013 | December 31, 2015 | | September 30, 2015 | | June 30, 2015 | | March 31, 2015 | | December 31, 2014 | | September 30, 2014 | | June 30, 2014 | | March 31, 2014 |
| Operating Data: | | | | | | | | | | | | | | | | | | | | | | | | | | | | | | |
| Net interest income |
| $840 |
|
|
| $820 |
| |
| $833 |
|
|
| $808 |
|
|
| $779 |
|
|
| $770 |
|
|
| $749 |
| |
| $760 |
|
| $870 |
| |
| $856 |
| |
| $840 |
| |
| $836 |
| |
| $840 |
| |
| $820 |
| |
| $833 |
| |
| $808 |
|
| Noninterest income | 339 |
|
| 341 |
| | 640 |
|
| 358 |
|
| 379 |
|
| 383 |
|
| 437 |
| | 433 |
| 362 |
| | 353 |
| | 360 |
| | 347 |
| | 339 |
| | 341 |
| | 640 |
| | 358 |
|
| Total revenue | 1,179 |
| | 1,161 |
| | 1,473 |
| | 1,166 |
| | 1,158 |
| | 1,153 |
| | 1,186 |
| | 1,193 |
| 1,232 |
| | 1,209 |
| | 1,200 |
| | 1,183 |
| | 1,179 |
| | 1,161 |
| | 1,473 |
| | 1,166 |
|
| Provision for credit losses | 72 |
| | 77 |
| | 49 |
| | 121 |
| | 132 |
| | 145 |
| | 112 |
| | 90 |
| 91 |
| | 76 |
| | 77 |
| | 58 |
| | 72 |
| | 77 |
| | 49 |
| | 121 |
|
| Noninterest expense | 824 |
| | 810 |
|
| 948 |
| | 810 |
| | 818 |
| | 788 |
| | 5,252 |
|
| 821 |
| 810 |
| | 798 |
| | 841 |
| | 810 |
| | 824 |
| | 810 |
| | 948 |
| | 810 |
|
| Income (loss) before income tax expense (benefit) | 283 |
| | 274 |
| | 476 |
| | 235 |
| | 208 |
| | 220 |
| | (4,178 | ) | | 282 |
| |
| Income tax expense (benefit) | 86 |
| | 85 |
|
| 163 |
| | 69 |
| | 56 |
| | 76 |
| | (273 | ) |
| 99 |
| |
| Net income (loss) |
| $197 |
| |
| $189 |
| |
| $313 |
| |
| $166 |
| |
| $152 |
| |
| $144 |
| |
| ($3,905 | ) | |
| $183 |
| |
Net income (loss) per average common share- basic (1) |
| $0.36 |
| |
| $0.34 |
| |
| $0.56 |
| |
| $0.30 |
| |
| $0.27 |
| |
| $0.26 |
| |
| ($6.97 | ) | |
| $0.33 |
| |
Net income (loss) per average common share- diluted (1) |
| $0.36 |
| |
| $0.34 |
| |
| $0.56 |
| |
| $0.30 |
| |
| $0.27 |
| |
| $0.26 |
| |
| ($6.97 | ) | |
| $0.33 |
| |
| Income before income tax expense | | 331 |
| | 335 |
| | 282 |
| | 315 |
| | 283 |
| | 274 |
| | 476 |
| | 235 |
|
| Income tax expense | | 110 |
| | 115 |
| | 92 |
| | 106 |
| | 86 |
| | 85 |
| | 163 |
| | 69 |
|
| Net income | |
| $221 |
| |
| $220 |
| |
| $190 |
| |
| $209 |
| |
| $197 |
| |
| $189 |
| |
| $313 |
| |
| $166 |
|
| Net income available to common stockholders | |
| $221 |
| |
| $213 |
| |
| $190 |
| |
| $209 |
| |
| $197 |
| |
| $189 |
| |
| $313 |
| |
| $166 |
|
Net income per average common share- basic (1) | |
| $0.42 |
| |
| $0.40 |
| |
| $0.35 |
| |
| $0.38 |
| |
| $0.36 |
| |
| $0.34 |
| |
| $0.56 |
| |
| $0.30 |
|
Net income per average common share- diluted (1) | |
| $0.42 |
| |
| $0.40 |
| |
| $0.35 |
| |
| $0.38 |
| |
| $0.36 |
| |
| $0.34 |
| |
| $0.56 |
| |
| $0.30 |
|
| Other Operating Data: | | | | | |
| | |
| | |
| | | | |
| | |
| | | | | |
| | |
| | |
| | | | |
| | |
|
Return on average common equity (2) (3) | 4.06 | % | | 3.87 | % | | 6.41 | % | | 3.48 | % | | 3.12 | % | | 2.91 | % | | (13.94 | %) | | 3.07 | % | 4.51 | % | | 4.40 | % | | 3.94 | % | | 4.36 | % | | 4.06 | % | | 3.87 | % | | 6.41 | % | | 3.48 | % |
Return on average total assets (3) (4) | 0.60 |
| | 0.58 |
| | 0.99 |
| | 0.54 |
| | 0.50 |
| | 0.49 |
| | (2.77 | ) | | 0.60 |
| 0.64 |
| | 0.65 |
| | 0.56 |
| | 0.63 |
| | 0.60 |
| | 0.58 |
| | 0.99 |
| | 0.54 |
|
Net interest margin (3) (5) | 2.80 |
| | 2.77 |
| | 2.87 |
| | 2.89 |
| | 2.83 |
| | 2.88 |
| | 2.82 |
| | 2.84 |
| 2.77 |
| | 2.76 |
| | 2.72 |
| | 2.77 |
| | 2.80 |
| | 2.77 |
| | 2.87 |
| | 2.89 |
|
| Stock Activity: | | | | | | | | | | | | | | | | | | | | | | | | | | | | | | |
| Share Price: | | | | | | | | | | | | | | | | | | | | | | | | | | | | | | |
| High |
| $25.60 |
| |
| $23.57 |
| |
| $— |
| |
| $— |
| |
| $— |
| |
| $— |
| |
| $— |
| |
| $— |
|
| $27.17 |
| |
| $28.18 |
| |
| $28.71 |
| |
| $25.84 |
| |
| $25.60 |
| |
| $23.57 |
| |
| $— |
| |
| $— |
|
| Low | 21.47 |
| | 21.35 |
| | — |
| | — |
| | — |
| | — |
| | — |
| | — |
| 22.48 |
| | 21.14 |
| | 24.03 |
| | 22.67 |
| | 21.47 |
| | 21.35 |
| | — |
| | — |
|
| Share Data: | | | | | | | | | | | | | | | | | | | | | | | | | | | | | | |
| Cash dividends declared and paid per common share |
| $0.10 |
| |
| $0.68 |
| |
| $0.61 |
| |
| $0.04 |
| |
| $0.67 |
| |
| $0.68 |
| |
| $0.69 |
| |
| $0.07 |
|
| $0.10 |
| |
| $0.10 |
| |
| $0.10 |
| |
| $0.10 |
| |
| $0.10 |
| |
| $0.68 |
| |
| $0.61 |
| |
| $0.04 |
|
| Dividend payout ratio | 28 | % | | 203 | % | | 110 | % | | 15 | % | | 246 | % | | 268 | % | | (10 | %) | | 22 | % | 24 | % | | 25 | % | | 28 | % | | 26 | % | | 28 | % | | 203 | % | | 110 | % | | 15 | % |
CITIZENS FINANCIAL GROUP, INC.
MANAGEMENT'SMANAGEMENT’S DISCUSSION AND ANALYSIS
| | | | As of | As of |
| (dollars in millions) | December 31, 2014 | | September 30, 2014 | | June 30, 2014 | | March 31, 2014 | | December 31, 2013 | | September 30, 2013 | | June 30, 2013 | | March 31, 2013 | December 31, 2015 | | September 30, 2015 | | June 30, 2015 | | March 31, 2015 | | December 31, 2014 | | September 30, 2014 | | June 30, 2014 | | March 31, 2014 |
| Balance Sheet Data: | | | | | |
| | |
| | |
| | |
| | |
| | |
| | | | | |
| | |
| | |
| | |
| | |
| | |
|
| Total assets |
| $132,857 |
| |
| $131,341 |
| |
| $130,279 |
| |
| $126,892 |
| |
| $122,154 |
| |
| $120,074 |
| |
| $117,833 |
| |
| $126,044 |
|
| $138,208 |
| |
| $135,447 |
| |
| $137,251 |
| |
| $136,535 |
| |
| $132,857 |
| |
| $131,341 |
| |
| $130,279 |
| |
| $126,892 |
|
Loans and leases (6) | 93,410 |
| | 90,749 |
| | 88,829 |
| | 87,083 |
| | 85,859 |
| | 85,493 |
| | 85,006 |
| | 85,782 |
| 99,042 |
| | 97,431 |
| | 96,538 |
| | 94,494 |
| | 93,410 |
| | 90,749 |
| | 88,829 |
| | 87,083 |
|
| Allowance for loan and lease losses | 1,195 |
| | 1,201 |
| | 1,210 |
| | 1,259 |
| | 1,221 |
| | 1,219 |
| | 1,200 |
| | 1,219 |
| 1,216 |
| | 1,201 |
| | 1,201 |
| | 1,202 |
| | 1,195 |
| | 1,201 |
| | 1,210 |
| | 1,259 |
|
| Total securities | 24,676 |
| | 24,848 |
| | 24,823 |
| | 24,804 |
| | 21,245 |
| | 20,852 |
| | 17,408 |
| | 18,066 |
| 24,075 |
| | 24,354 |
| | 25,134 |
| | 25,121 |
| | 24,704 |
| | 24,885 |
| | 24,854 |
| | 24,828 |
|
| Goodwill | 6,876 |
| | 6,876 |
| | 6,876 |
| | 6,876 |
| | 6,876 |
| | 6,876 |
| | 6,876 |
| | 11,311 |
| 6,876 |
| | 6,876 |
| | 6,876 |
| | 6,876 |
| | 6,876 |
| | 6,876 |
| | 6,876 |
| | 6,876 |
|
| Total liabilities | 113,589 |
| | 111,958 |
| | 110,682 |
| | 107,450 |
| | 102,958 |
| | 100,661 |
| | 98,223 |
| | 101,837 |
| 118,562 |
| | 115,847 |
| | 117,665 |
| | 116,971 |
| | 113,589 |
| | 111,958 |
| | 110,682 |
| | 107,450 |
|
Deposits(7) | 95,707 |
| | 93,463 |
| | 91,656 |
| | 87,462 |
| | 86,903 |
| | 93,930 |
| | 91,361 |
| | 94,628 |
| 102,539 |
| | 101,866 |
| | 100,615 |
| | 98,990 |
| | 95,707 |
| | 93,463 |
| | 91,656 |
| | 87,462 |
|
| Federal funds purchased and securities sold under agreements to repurchase | 4,276 |
| | 5,184 |
| | 6,807 |
| | 6,080 |
| | 4,791 |
| | 3,424 |
| | 3,371 |
| | 3,709 |
| 802 |
| | 1,293 |
| | 3,784 |
| | 4,421 |
| | 4,276 |
| | 5,184 |
| | 6,807 |
| | 6,080 |
|
| Other short-term borrowed funds | 6,253 |
| | 6,715 |
| | 7,702 |
| | 4,950 |
| | 2,251 |
| | 2 |
| | 2 |
| | 11 |
| 2,630 |
| | 5,861 |
| | 6,762 |
| | 7,004 |
| | 6,253 |
| | 6,715 |
| | 7,702 |
| | 4,950 |
|
| Long-term borrowed funds | 4,642 |
| | 2,062 |
| | 1,732 |
| | 1,403 |
| | 1,405 |
| | 1,064 |
| | 732 |
| | 692 |
| 9,886 |
| | 4,153 |
| | 3,890 |
| | 3,904 |
| | 4,642 |
| | 2,062 |
| | 1,732 |
| | 1,403 |
|
| Total stockholders’ equity | 19,268 |
| | 19,383 |
| | 19,597 |
| | 19,442 |
| | 19,196 |
| | 19,413 |
| | 19,610 |
| | 24,207 |
| 19,646 |
| | 19,600 |
| | 19,586 |
| | 19,564 |
| | 19,268 |
| | 19,383 |
| | 19,597 |
| | 19,442 |
|
| Other Balance Sheet Data: | | | | | |
| | |
| | |
| | |
| | |
| | |
| | | | | |
| | |
| | |
| | |
| | |
| | |
|
| Asset Quality Ratios: | | | | | |
| | |
| | |
| | |
| | |
| | |
| | | | | |
| | |
| | |
| | |
| | |
| | |
|
| Allowance for loan and lease losses as a percentage of total loans and leases | 1.28 | % | | 1.32 | % | | 1.36 | % | | 1.45 | % | | 1.42 | % | | 1.43 | % | | 1.41 | % | | 1.42 | % | 1.23 | % | | 1.23 | % | | 1.24 | % | | 1.27 | % | | 1.28 | % | | 1.32 | % | | 1.36 | % | | 1.45 | % |
| Allowance for loan and lease losses as a percentage of nonperforming loans and leases | 109 |
| | 111 |
| | 101 |
| | 92 |
| | 86 |
| | 72 |
| | 69 |
| | 67 |
| 115 |
| | 116 |
| | 114 |
| | 106 |
| | 109 |
| | 111 |
| | 101 |
| | 92 |
|
| Nonperforming loans and leases as a percentage of total loans and leases | 1.18 |
| | 1.19 |
| | 1.35 |
| | 1.57 |
| | 1.65 |
| | 1.98 |
| | 2.06 |
| | 2.14 |
| 1.07 |
| | 1.06 |
| | 1.09 |
| | 1.20 |
| | 1.18 |
| | 1.19 |
| | 1.35 |
| | 1.57 |
|
Capital ratios: | | | | | |
| | |
| | |
| | |
| | |
| | |
| | | | | |
| | |
| | |
| | |
| | |
| | |
|
Tier 1 risk-based capital ratio (8) | 12.4 |
| | 12.9 |
| | 13.3 |
| | 13.4 |
| | 13.5 |
| | 14.0 |
| | 14.3 |
| | 14.5 |
| |
Total risk-based capital ratio (9) | 15.8 |
| | 16.1 |
| | 16.2 |
| | 16.0 |
| | 16.1 |
| | 16.3 |
| | 16.3 |
| | 16.2 |
| |
Tier 1 common equity ratio (10) | 12.4 |
| | 12.9 |
| | 13.3 |
| | 13.4 |
| | 13.5 |
| | 13.9 |
| | 14.3 |
| | 14.2 |
| |
Tier 1 leverage ratio (11) | 10.6 |
| | 10.9 |
| | 11.1 |
| | 11.4 |
| | 11.6 |
| | 12.1 |
| | 11.8 |
| | 12.5 |
| |
CET1 capital ratio (9) | | 11.7 |
| | 11.8 |
| | 11.8 |
| | 12.2 |
| | 12.4 |
| | 12.9 |
| | 13.3 |
| | 13.4 |
|
Tier1 capital ratio (10) | | 12.0 |
| | 12.0 |
| | 12.1 |
| | 12.2 |
| | 12.4 |
| | 12.9 |
| | 13.3 |
| | 13.4 |
|
Total capital ratio (11) | | 15.3 |
| | 15.4 |
| | 15.3 |
| | 15.5 |
| | 15.8 |
| | 16.1 |
| | 16.2 |
| | 16.0 |
|
Tier 1 leverage ratio (12) | | 10.5 |
| | 10.4 |
| | 10.4 |
| | 10.5 |
| | 10.6 |
| | 10.9 |
| | 11.1 |
| | 11.4 |
|
(1) Earnings per share information reflects a 165,582-for-1 forward stock split effective on August 22, 2014.
(2) We define “Return on average common equity” is defined as net income (loss)available to common stockholders divided by average common equity.
(3) Ratios for the periods above are presented on an annualized basis.
(4) We define “Return on average total assets” is defined as net income (loss) divided by average total assets.
(5) We define “Net interest margin” is defined as net interest income divided by average total interest-earning assets.
(6) Excludes loans held for sale of $365 million, $420 million, $697 million, $376 million, $281 million, $208 million, $262 million, and $1.4 billion $1.3 billion, $307 million, $429 million, $550 million as of December 31, 2015, September 30, 2015, June 30, 2015, March 31, 2015, December 31, 2014, September 30, 2014, June 30, 2014 and March 31, 2014, December 31, 2013, September 30, 2013, June 30, 2013, March 31, 2013, respectively.
(7) Excludes deposits held for sale of $5.2 billion and $5.3 billion as of March 31, 2014 and December 31, 2013, respectively.2014.
(8) We define “TierBasel III transitional rules for institutions applying the Standardized approach to calculating risk-weighted assets became effective January 1, 2015. The capital ratios and associated components for periods December 31, 2014 and prior are prepared under the Basel I general risk-based capital rule.
(9) CET1 under Basel III replaced the concept of tier 1 common capital that existed under Basel I effective January 1, 2015. “Common equity tier 1 capital ratio” as Tier 1 capital balanceof December 31, , 2015 represents CET1 divided by total risk-weighted assets as defined under Basel I.III Standardized approach. The “tier 1 common capital ratio” reported prior to January 1, 2015, represented tier 1 common equity divided by total risk-weighted assets as defined under the Basel I general risk-based capital rule .
(9)(10) We define “Total risk-based“Tier 1 capital ratio” is tier 1 capital, which includes CET1 capital plus non-cumulative perpetual preferred equity that qualifies as totaladditional tier 1 capital, balance divided by total risk-weighted assets as defined under Basel I.III Standardized approach. The “tier 1 capital ratio” reported prior to January 1, 2015, represented tier 1 capital divided by total risk-weighted assets as defined under the Basel I general risk-based capital rule.
(10)(11) We define “Tier 1 common equity“Total capital ratio” as Tier 1is total capital balance, minus preferred stock, divided by total risk-weighted assets as defined under Basel I.III Standardized approach. The “Total capital ratio” reported prior to January 1, 2015, represented total capital divided by total risk-weighted assets as defined under the Basel I general risk-based capital rule.
(11)(12) We define “Tier“Tier 1 leverage ratio” as Tieris tier 1 capital balance divided by quarterly average total assets as defined under Basel I.III Standardized approach. The “tier 1 leverage ratio” reported prior to January 1, 2015, represented tier 1 capital divided by quarterly average total assets as defined under the Basel I general risk-based capital rule.
CITIZENS FINANCIAL GROUP, INC.
MANAGEMENT’S DISCUSSION AND ANALYSIS
Capital
As a bank holding company and a financial holding company, we are subject to regulation and supervision by the Federal Reserve Board.FRBG. Our primary subsidiaries are our two insured depository institutions, Citizens Bank, National Association, (“CBNA”)CBNA, a national banking association whose primary federal regulator is the OCC, and Citizens Bank of Pennsylvania (“CBPA”),CBPA, a Pennsylvania-charted savings bank regulated by the Department of Banking of the Commonwealth of Pennsylvania and supervised by the FDIC as its primary federal regulator.
Under the Basel I capital framework in effect for us at December 31, 2014, the Federal Reserve Board required us to maintain minimum levels with respect to our total risk-based capital, Tier 1 risk-based capital and Tier 1 leverage ratios. The minimum standards for the total risk-based capital ratio (the ratio of our total risk-based capital, which is the sum of our Tier 1 and Tier 2 capital, as defined by Federal Reserve Board regulation, to total risk-weighted assets) and the Tier 1 risk-based capital ratio (the ratio of our Tier 1 capital to total risk-weighted assets) were 8.0% and 4.0%, respectively. The minimum Tier 1 leverage ratio (the ratio of a banking organization’s Tier 1 capital to total adjusted quarterly average total assets, as defined for regulatory purposes) was 3.0% for bank holding companies that either had the highest supervisory rating or have implemented the Federal
CITIZENS FINANCIAL GROUP, INC.
MANAGEMENT'S DISCUSSION AND ANALYSIS
Reserve Board’s risk-adjusted measure for market risk. The minimum Tier 1 leverage ratio for all other bank holding companies, including our Company, was 4.0%, unless a different minimum was specified by the Federal Reserve Board.
In July 2013, the FRB, OCC and FDIC issued the U.S. bank regulatory agencies approvedBasel III final regulatory capitalrules. The rules that implementedimplement the Basel Committee on Banking Supervision’s Basel III capital framework and certain provisions of the Dodd-Frank Act.Act, including the Collins Amendment. The U.S. Basel III changesfinal rules substantially revised the risk-based capital and leverage requirements applicable to bank holding companies and their insured depository institution subsidiaries, including CBNA and CBPA. The U.S. Basel III final rules became effective for CFG and its depository institution subsidiaries, including CBNA and CBPA, on January 1, 2015 (subject to a phase-in period for certain provisions).
The U.S. Basel III final rules, among other things, (i) introduced a new capital measure called CET1, (ii) specified that Tier 1 capital consists of CET1 and Total“Additional Tier 1 capital” instruments meeting certain revised requirements, (iii) defined CET1 narrowly by requiring that most deductions/adjustments to regulatory capital calculationsmeasures be made to CET1 and formally established a CET1not to the other components of capital, ratio.and (iv) expanded the scope of the deductions/ adjustments to capital as compared to existing regulations. Under the U.S. Basel III also introduced newfinal rules, the minimum capital ratios effective as of January 1, 2015 are:
4.5% CET1 to risk-weighted assets;
6.0% Tier 1 capital (CET1 plus Additional Tier 1 capital) to risk-weighted assets;
8.0% Total capital (Tier 1 capital plus Tier 2 capital) to risk-weighted assets; and
4.0% Tier 1 capital to average consolidated assets as reported on consolidated financial statements (known as the “leverage ratio”).
The U.S. Basel III final rules also introduced a new “capital conservation buffer”, composed entirely of CET1, on top of these minimum risk-weighted asset ratios. The implementation of the capital conservation buffer began on January 1, 2016 at the 0.625% level and buffer requirements andwill increase by 0.625% on each subsequent January 1, until it reaches 2.5% on January 1, 2019. Banking institutions with a supplementary leverage ratio; changed the compositionratio of regulatory capital; revised the adequately capitalized minimum requirements under the Prompt Corrective Action framework; expanded and modified the risk-sensitive calculation ofCET1 to risk-weighted assets below the effective minimum (4.5% plus the capital conservation buffer and, if applicable, the countercyclical capital buffer) will face constraints on dividends, equity repurchases and compensation based on the amount of the shortfall.
When fully phased in on January 1, 2019, the U.S. Basel III final rules will require CFG, CBNA and CBPA to maintain an additional capital conservation buffer of 2.5% of CET1, effectively resulting in minimum ratios of (i) CET1 to risk-weighted assets of at least 7%, (ii) Tier 1 capital to risk-weighted assets of at least 8.5%, (iii) a minimum ratio of Total capital to risk-weighted assets of at least 10.5%, and (iv) a minimum leverage ratio of 4%.
The U.S. Basel III final rules also provide for credita number of deductions from and market risk;adjustments to CET1. These include, for example, the requirement that certain deferred tax assets and introducedsignificant investments in non-consolidated financial entities be deducted from CET1 to the extent that any one such category exceeds 10% of CET1 or all such items, in the aggregate, exceed 15% of CET1. Implementation of the deductions and other adjustments to CET1 began on January 1, 2015 and will be phased-in over a 4-year period (beginning at 40% on January 1, 2015 and an additional 20% per year thereafter).
The U.S. Basel III final rules prescribe a standardized approach for risk weightings that expanded the calculation of risk-weighted assets. We were required to comply with these rules beginning on January 1, 2015, with certain aspects ofrisk-weighting categories from the rules phasing in through 2018. Under Basel III, the minimum standards, including the capital conservation buffer, for the totalgeneral risk-based capital ratio, the CET1 ratio and the Tier 1 risk-based capital ratio are 10.5%, 7.0% and 8.5%, respectively, and the minimum Tier 1 leverage ratio is 4.0%. For further discussion of the capital rules to which we are subject, see “Regulationa much larger and Supervision”more risk-sensitive number of categories, depending on the nature of the assets, generally ranging from 0% for U.S. government and agency securities, to 600% for certain equity exposures, and resulting in Part I, Item 1 — Business, included elsewherehigher risk weights for a variety of asset categories.
With respect to CBNA and CBPA, the U.S. Basel III final rules also revise the “prompt corrective action” regulations pursuant to Section 38 of the Federal Deposit Insurance Act, as discussed above in this report.“Federal Deposit Insurance Act.”
CITIZENS FINANCIAL GROUP, INC.
MANAGEMENT’S DISCUSSION AND ANALYSIS
The table below presents our actual regulatory capital ratios as of December 31, 2015 under Basel III Transitional rules and as of December 31, 2014 and 2013, respectively. Actualunder Basel I ratios andrules. In addition, the table includes pro forma Basel III ratios as of December 31, 2015, after full phase-in of all requirements to which include estimated impacts ofwe will be subject by January 1, 2019. Based on both current and fully phased-in Basel III and standardized approach risk-weighted assets requirements, all ratios remain well above the then applicable Basel Icurrent and future Basel III minima:
|
| | | | | | | |
| | Basel I | | Pro Forma Basel III Standardized Approach |
| | Actual | Required Minimum | Well-Capitalized Minimum for Purposes of Prompt Corrective Action | | Actual (1) | Required Minimum + Required Capital Conservation Buffer for Non-Leverage Ratios | Well-Capitalized Minimum for Purposes of Prompt Corrective Action |
| December 31, 2014 | | | | | | | |
| Tier 1 common equity ratio | 12.4% | Not Applicable | Not
Applicable | | Not Applicable | Not
Applicable | Not
Applicable |
| Tier 1 risk-based capital ratio | 12.4% | 4.0% | 6.0% | | 12.1% | 8.5% | 8.0% |
| Total risk-based capital ratio | 15.8% | 8.0% | 10.0% | | 15.4% | 10.5% | 10.0% |
| Tier 1 leverage ratio | 10.6% | 4.0% | 5.0% | | 10.6% | 4.0% | 5.0% |
| Common equity Tier 1 capital ratio | Not Applicable | Not Applicable | Not
Applicable | | 12.1% | 7.0% | 6.5% |
| | | | | | | | |
| December 31, 2013 | | | | | | | |
| Tier 1 common equity ratio | 13.5% | Not Applicable | Not
Applicable | | Not Applicable | Not
Applicable | Not
Applicable |
| Tier 1 risk-based capital ratio | 13.5% | 4.0% | 6.0% | | 13.1% | 8.5% | 8.0% |
| Total risk-based capital ratio | 16.1% | 8.0% | 10.0% | | 15.7% | 10.5% | 10.0% |
| Tier 1 leverage ratio | 11.6% | 4.0% | 5.0% | | 11.6% | 4.0% | 5.0% |
| Common equity Tier 1 capital ratio | Not Applicable | Not Applicable | Not
Applicable | | 13.1% | 7.0% | 6.5% |
|
| | | | | | | | | | | | | | | | |
| | | Transitional Basel III | | Pro Forma Basel III Assuming Full Phase-in |
| | Actual Amount | Actual Ratio | Required Minimum | Well-Capitalized Minimum for Purposes of Prompt Corrective Action | | Actual Ratio(1) | Required Minimum + Required Capital Conservation Buffer for Non-Leverage Ratios | FDIA Required Well-Capitalized Minimum for Purposes of Prompt Corrective Action |
| Basel III Transitional as of December 31, 2015 | | | | |
Common equity tier 1 capital(2) |
| $13,389 |
| 11.7 | % | 4.5 | % | 6.5 | % | | 11.7 | % | 7.0 | % | 6.5 | % |
Tier 1 capital(3) | 13,636 |
| 12.0 |
| 6.0 |
| 8.0 |
| | 11.9 |
| 8.5 |
| 8.0 |
|
Total capital(4) | 17,505 |
| 15.3 |
| 8.0 |
| 10.0 |
| | 15.3 |
| 10.5 |
| 10.0 |
|
Tier 1 leverage(5) | 13,636 |
| 10.5 |
| 4.0 |
| 5.0 |
| | 10.5 |
| 4.0 |
| 5.0 |
|
| Basel I as of December 31, 2014 | | | | |
Tier 1 common equity(2) |
| $13,173 |
| 12.4 | % | Not Applicable | Not Applicable | | | | |
Tier 1 capital(3) | 13,173 |
| 12.4 |
| 4.0 | % | 6.0 | % | | | | |
Total capital(4) | 16,781 |
| 15.8 |
| 8.0 |
| 10.0 |
| | | | |
Tier 1 leverage(5) | 13,173 |
| 10.6 |
| 4.0 |
| 5.0 |
| | | | |
(1) These are non-GAAP financial measures. For more information on the computation of these non-GAAP financial measures, see “—Principal“-Principal Components of Operations and Key Performance Metrics Used By Management —- Key Performance Metrics and Non-GAAP Financial Measures.”
At(2) CET1 under Basel III replaced the concept of tier 1 common capital that existed under Basel I effective January 1, 2015. “Common equity tier 1 capital ratio” as of December 31, 2014, an increase or decrease in our regulatory2015 represents CET1 divided by total risk-weighted assets as defined under Basel III Standardized approach. The “tier 1 common capital ratios by one basis point would require a change of $10 million in Tierratio” reported prior to January 1, 2015, represented tier 1 common equity divided by total risk-weighted assets as defined under the Basel I general risk-based capital rule.
(3) “Tier 1 Capital or capital ratio” is tier 1 capital, which includes CET1 capital plus non-cumulative perpetual preferred equity that qualifies as additional tier 1 capital, divided by total risk-weighted assets as defined under Basel III Standardized approach. The “tier 1 capital ratio” reported prior to January 1, 2015, represented tier 1 capital divided by total risk-weighted assets as defined under the Basel I general risk-based capital rule.
(4) “Total Capital.capital ratio” is total capital divided by total risk-weighted assets as defined under Basel III Standardized approach. The “Total capital ratio” reported prior to January 1, 2015, represented total capital divided by total risk-weighted assets as defined under the Basel I general risk-based capital rule.
(5) “Tier 1 leverage ratio” is tier 1 capital divided by quarterly average total assets as defined under Basel III Standardized approach. The “tier 1 leverage ratio” reported prior to January 1, 2015, represented tier 1 capital divided by quarterly average total assets as defined under the Basel I general risk-based capital rule.
Standardized Approach
The Basel III Standardized approach measures risk-weighted assets primarily for market risk and credit risk exposures. Exposures subject to market risk are measured on a basis generally consistent with how market risk-weighted assets were measured using the market risk rules as defined under the Basel 2.5. Refer to “—Market Risk — Market Risk Regulatory Capital,” for further information. CFG applies the Basel III standardized approach, as defined by the U.S. regulators, for determining the assignment of risk-weighted assets. Under the Standardized approach, which is the risk-weight methodology applicable to CFG, no distinction is made for variations in credit quality for corporate exposures. Additionally, the economic benefit of collateral is restricted to a limited list of eligible securities and cash. We could also increaseestimate our Tier 1 common equity or Tiertier 1 risk-based capital ratios by oneratio under the Basel III Standardized approach, on a fully phased-in basis, point with a reduction into be 11.7% at December 31, 2015. As of December 31, 2015, we estimated that our Basel III Standardized common equity tier 1 capital would be $13.4 billion and total risk-weighted assets would be $114.3 billion, on a fully-phased in basis. Our estimates under the Basel III Standardized approach may be refined over time because of $76 million,further rulemaking or increaseclarification by U.S. banking regulators or as our Total Capital ratio by one basis point with a reduction in risk-weighted assetsunderstanding and interpretation of $63 million.the rules evolve. Actual results could differ from those estimates and assumptions.
CITIZENS FINANCIAL GROUP, INC.
MANAGEMENT'SMANAGEMENT’S DISCUSSION AND ANALYSIS
A reconciliation of Basel III Standardized Transitional approach to Basel III Standardized estimates on a fully-phased in basis for common equity tier 1 capital and risk-weighted assets, see the following table.
|
| | | |
| (dollars in millions) | December 31, 2015 |
| Common equity tier 1 capital |
| $13,389 |
|
| Impact of intangibles at 100% | (2 | ) |
Fully phased-in common equity tier 1 capital(1) |
| $13,387 |
|
| Total capital |
| $17,505 |
|
| Impact of intangibles at 100% | (2 | ) |
Fully phased in common total capital(1) |
| $17,503 |
|
| Risk-weighted assets |
| $114,084 |
|
| Impact of intangibles - 100% capital deduction | (2 | ) |
| Impact of mortgage servicing assets at 250% risk weight | 246 |
|
Fully phased-in risk-weighted assets(1) |
| $114,328 |
|
Transitional common equity tier 1 ratio(2) | 11.7 | % |
Fully phased-in common equity tier 1 ratio(1)(2) | 11.7 |
|
Transitional total capital ratio(3) | 15.3 |
|
Fully phased-in total capital ratio(1)(3) | 15.3 |
|
(1) These are non-GAAP financial measures.
(2) CET1 under Basel III replaced the concept of tier 1 common capital that existed under Basel I effective January 1, 2015. “Common equity tier 1 capital ratio” as of December 31, 2015 represents CET1 divided by total risk-weighted assets as defined under Basel III Standardized approach.
(3) “Total capital ratio” is total capital divided by total risk-weighted assets as defined under Basel III Standardized approach.
Regulatory Capital Ratios and Capital Composition
The following table presents capital and capital ratio information evidencing our transition from Basel I as of December 31, 2014 to Basel III Standardized as of December 31, 2015:
|
| | | | | | | | | | | | | | | | | |
| | | | | | | | FDIA Requirements |
| | Actual | | Minimum Capital Adequacy | | Classification as “Well Capitalized” |
| (dollars in millions) | Amount | Ratio | | Amount | Ratio | | Amount | Ratio |
| Basel III Transitional as of December 31, 2015 | | | | | | | | |
Common equity tier 1 capital(1) |
| $13,389 |
| 11.7 | % | |
| $5,134 |
| 4.5 | % | |
| $7,415 |
| 6.5 | % |
Tier 1 capital(2) | 13,636 |
| 12.0 |
| | 6,845 |
| 6.0 |
| | 9,127 |
| 8.0 |
|
Total capital(3) | 17,505 |
| 15.3 |
| | 9,127 |
| 8.0 |
| | 11,408 |
| 10.0 |
|
Tier 1 leverage(4) | 13,636 |
| 10.5 |
| | 5,218 |
| 4.0 |
| | 6,523 |
| 5.0 |
|
| Risk-weighted assets | 114,084 |
| | | | | | | |
| Quarterly adjusted average assets | 130,455 |
| | | | | | | |
| Basel I as of December 31, 2014 | | | | | | | | |
Tier 1 common equity(1) |
| $13,173 |
| 12.4 | % | | Not Applicable | Not Applicable | | Not Applicable | Not Applicable |
Tier 1 capital(2) | 13,173 |
| 12.4 |
| |
| $4,239 |
| 4.0 | % | |
| $6,358 |
| 6.0 | % |
Total capital(3) | 16,781 |
| 15.8 |
| | 8,477 |
| 8.0 |
| | 10,596 |
| 10.0 |
|
Tier 1 leverage(4) | 13,173 |
| 10.6 |
| | 4,982 |
| 4.0 |
| | 6,227 |
| 5.0 |
|
| Risk-weighted assets | 105,964 |
| | | | | | | |
| Quarterly adjusted average assets | 124,539 |
| | | | | | | |
(1) CET1 under Basel III replaced the concept of tier 1 common capital that existed under Basel I effective January 1, 2015. “Common equity tier 1 capital ratio” as of December 31, 2015 represents CET1 divided by total risk-weighted assets as defined under Basel III Standardized approach. The “tier 1 common capital ratio” reported prior to January 1, 2015, represented tier 1 common equity divided by total risk-weighted assets as defined under the Basel I general risk-based capital rule.
(2) “Tier 1 capital ratio” is tier 1 capital, which includes CET1 capital plus non-cumulative perpetual preferred equity that qualifies as additional tier 1 capital, divided by total risk-weighted assets as defined under Basel III Standardized approach. The “tier 1 capital ratio” reported prior to January 1, 2015, represented tier 1 capital divided by total risk-weighted assets as defined under the Basel I general risk-based capital rule.
(3) “Total capital ratio” is total capital divided by total risk-weighted assets as defined under Basel III Standardized approach. The “Total capital ratio” reported prior to January 1, 2015, represented total capital divided by total risk-weighted assets as defined under the Basel I general risk-based capital rule.
(4) “Tier 1 leverage ratio” is tier 1 capital divided by quarterly average total assets as defined under Basel III Standardized approach. The “tier 1 leverage ratio” reported prior to January 1, 2015, represented tier 1 capital divided by quarterly average total assets as defined under the Basel I general risk-based capital rule.
CITIZENS FINANCIAL GROUP, INC.
MANAGEMENT’S DISCUSSION AND ANALYSIS
CET1 capital under Basel III Standardized Transitional rules was $13.4 billion at December 31, 2015, an increase of $216 million from tier 1 common equity under Basel I at December 31, 2014. The increase was primarily attributable to net income for year ended December 31, 2015, net of dividends paid to stockholders, $500 million in aggregate repurchases of common shares executed on April 7, 2015 and August 3, 2015, and amortization of deferred tax related to goodwill. At December 31, 2015, there was approximately $247 million of additional tier 1 capital, reflecting the capital value after issuance costs of the 5.500% Fixed-to-Floating Non-Cumulative Perpetual Preferred Stock, Series A, issued on April 6, 2015. Tier 1 capital at December 31, 2015 was $13.6 billion, an increase of $463 million over the year, as approximately half of the repurchase of common shares was offset by the issuance of preferred shares. Total capital was $17.5 billion at December 31, 2015, an increase of $724 million from December 31, 2014 driven primarily by net income, net of dividends paid to stockholders, as the combined impact of the repurchase of common shares, issuance of preferred shares and issuance of $250 million in subordinated debt on July 31, 2015 was generally neutral to total capital.
On January 1, 2015, we began reporting risk-weighted assets based on Basel III Standardized Transitional rules. The conversion from Basel I rules resulted in a $2.7 billion increase in RWAs as of December 31, 2014. This increase was primarily driven by risk weight changes for securitization, off-balance sheet commitments with original maturity one year or less, past due and nonaccruals and the removal of the cap on OTC derivatives.
Risk-weighted assets based on Basel III Standardized Transitional rules at December 31, 2015 were $114.1 billion, an increase of $8.1 billion as compared to December 31, 2014. The primary drivers for this change were the adoption of the Basel III Standardized approach, as well as growth in commercial, consumer auto and student loan exposures.
As of December 31, 2015, the tier 1 leverage ratio decreased approximately 13 basis points. This decline reflected the net impact of a $5.9 billion increase in adjusted quarterly average total assets, which drove a 49 basis point decline in the ratio, and the previously noted increase in tier 1 capital, which added 36 basis points to the ratio.
The following table presents our capital ratioscomposition under the Basel III capital framework in effect for us at December 31, 2015 and under the Basel I capital framework in effect for us at December 31, 2014:
|
| | | | | | | | | | | | | | | | | |
| | Actual | | Minimum Capital Adequacy | | Classification as “Well Capitalized” |
| (dollars in millions) | Amount | Ratio | | Amount | Ratio | | Amount | Ratio |
| December 31, 2014 | | | | | | | | |
| Tier 1 risk-based capital |
| $13,173 |
| 12.4 | % | |
| $4,239 |
| 4.0 | % | |
| $6,358 |
| 6.0 | % |
| Total risk-based capital | 16,781 |
| 15.8 | % | | 8,477 |
| 8.0 | % | | 10,596 |
| 10.0 | % |
| Tier 1 leverage | 13,173 |
| 10.6 | % | | 4,982 |
| 4.0 | % | | 6,227 |
| 5.0 | % |
| Risk-weighted assets | 105,964 |
| | | | | | | |
| Quarterly adjusted average assets | 124,539 |
| | | | | | | |
| | | | | | | | | |
| December 31, 2013 | | | | | | | | |
| Tier 1 risk-based capital |
| $13,301 |
| 13.5 | % | |
| $3,945 |
| 4.0 | % | |
| $5,918 |
| 6.0 | % |
| Total risk-based capital | 15,885 |
| 16.1 | % | | 7,891 |
| 8.0 | % | | 9,863 |
| 10.0 | % |
| Tier 1 leverage | 13,301 |
| 11.6 | % | | 4,577 |
| 4.0 | % | | 5,721 |
| 5.0 | % |
| Risk-weighted assets | 98,634 |
| | | | | | | |
| Quarterly adjusted average assets | 114,422 |
| | | | | | | |
|
| | | | | | | |
| | Transitional Basel III | | Basel I |
| (dollars in millions) | December 31, 2015 | | December 31, 2014 |
| Total common stockholders’ equity |
| $19,399 |
| |
| $19,268 |
|
Exclusions(1): | | | |
| Net unrealized (gains) losses recorded in accumulated other comprehensive income, net of tax: | | | |
| Debt and marketable equity securities available for sale | 28 |
| | (74 | ) |
| Derivatives | (10 | ) | | 69 |
|
| Unamortized net periodic benefit costs | 369 |
| | 377 |
|
| Deductions: | | | |
| Goodwill | (6,876 | ) | | (6,876 | ) |
| Deferred tax liability associated with goodwill | 480 |
| | 420 |
|
| Other intangible assets | (1 | ) | | (6 | ) |
| | | | |
| Disallowed mortgage servicing | — |
| | (5 | ) |
Total Common Equity Tier 1(2) | 13,389 |
| | 13,173 |
|
| Qualifying preferred stock | 247 |
| | — |
|
| Total Tier 1 Capital | 13,636 |
| | 13,173 |
|
| | | | |
| Qualifying long-term debt securities as tier 2 | 2,595 |
| | 2,350 |
|
| Allowance for loan and lease losses | 1,216 |
| | 1,195 |
|
| Allowance for credit losses for off-balance sheet exposure | 58 |
| | 61 |
|
| Unrealized gains on equity securities | — |
| | 2 |
|
| Total capital |
| $17,505 |
| |
| $16,781 |
|
Tier 1 risk-based capital was $13.2 billion at December 31, 2014,(1) As a decrease of $128 million comparedBasel III Standardized approach institution, we selected the one-time election to December 31, 2013. The decrease was primarily due to our continuing effort to bring the mix in capital in line with peer banks. In 2014, we made special dividend payments of $666 million to RBS and repurchased common shares of $334 million from RBS. The issuance of Tier 2 subordinated debt to RBS funded both of these transactions. We paid quarterly common dividends of $140 million supported by net income of $865 million. Amortizationopt out of the deferred tax liability for goodwillrequirements to include all the components of $70 million, aAOCI.
(2) CET1 under Basel III replaced the concept of tier 1 common capital surplus increase of $67 million due to share-based compensation transactions and disallowed servicing assets of $5 million factored into the year over year difference.
For the year ended December 31, 2014, total risk-based capital increased $896 million to $16.8 billion primarily due to the issuance of Tier 2 subordinated debt to fund the special dividend payments and repurchase of common shares mentioned above, along with the aforementioned Tier 1 impacts and an elimination of the deduction for excess reserves, resulting in an increase in capital of $27 million.
The Tier 1 leverage ratio decreased approximately 100 basis points in 2014, driven by an increase in adjusted quarterly average total assets resulting from a 60 basis point increase in commercial and a 50 basis point increase in retail automobile loan exposures, offset by a 10 basis point decrease in securities.
CITIZENS FINANCIAL GROUP, INC.
MANAGEMENT'S DISCUSSION AND ANALYSIS
The following table presents our capital compositionthat existed under the Basel I capital framework in effect for us at December 31, 2014, as of:effective January 1, 2015. |
| | | | | | | |
| | December 31, |
| (dollars in millions) | 2014 |
| | 2013 |
|
| Total common stockholders' equity |
| $19,268 |
| |
| $19,196 |
|
| Goodwill | (6,876 | ) | | (6,876 | ) |
| Deferred tax liability associated with goodwill | 420 |
| | 350 |
|
| Other intangible assets | (6 | ) | | (8 | ) |
| Net unrealized (gains) losses recorded in accumulated other comprehensive income, net of tax: | | | |
| Debt and marketable equity securities available for sale | (74 | ) | | 91 |
|
| Derivatives | 69 |
| | 298 |
|
| Unamortized net periodic benefit costs | 377 |
| | 259 |
|
| Disallowed deferred tax assets | — |
| | — |
|
| Disallowed mortgage servicing | (5 | ) | | (9 | ) |
| Total Tier 1 common equity | 13,173 |
| | 13,301 |
|
| | | | |
| Qualifying preferred stock | — |
| | — |
|
| Trust preferred securities | — |
| | — |
|
| Total Tier 1 capital | 13,173 |
| | 13,301 |
|
| | | | |
| Qualifying long-term debt securities as Tier 2 | 2,350 |
| | 1,350 |
|
| Allowance for loan and lease losses | 1,195 |
| | 1,221 |
|
| Allowance for credit losses for off-balance sheet exposure | 61 |
| | 39 |
|
| Excess allowance for loan and lease losses | — |
| | (27 | ) |
| Unrealized gains on equity securities | 2 |
| | 1 |
|
| Total risk-based capital |
| $16,781 |
| |
| $15,885 |
|
Risk-weighted assets at December 31, 2014 were $106.0 billion, an increase of $7.3 billion as compared to December 31, 2013. The primary drivers for this change were increases in commercial and consumer auto loan exposures, which increased risk-weighted assets by $3.8 billion and $3.5 billion, respectively.
Capital Adequacy Process
Our assessment of capital adequacy begins with our risk appetite and risk management framework. This framework which provides for the identification, measurement and management of material risks. Required capital isCapital requirements are determined for actual/actual
CITIZENS FINANCIAL GROUP, INC.
MANAGEMENT’S DISCUSSION AND ANALYSIS
and forecasted risk portfolios using applicable regulatory capital methodologies, including estimatedmethodologies. The assessment also considers the possible impacts of approved and proposed regulatory changes that will or may apply to future periods. Key analytical frameworks, which enable the comprehensive assessment of capital adequacy versus unexpected loss, supplement our base case forecast. These supplemental frameworks include Integrated Stress Testing,integrated stress testing, as well as an Internal Capital Adequacy Requirementinternal capital adequacy requirement that builds on internally assessed Economic Capitaleconomic capital requirements. A robust governance framework supports our capital planning process. This process includes capital management policies and procedures that document capital adequacy metrics and limits, as well as our comprehensive capital contingency plan and the active engagement of both the legal-entity boards and senior management in oversight and decision-making.
Forward-looking assessments of capital adequacy for us and for our banking subsidiaries feed development of capital plans that are submitted to the Federal Reserve BoardFRBG and other bank regulators. We prepare these plans in full compliance with the Federal Reserve Board’sFRBG’s Capital Plan Rule and we participate annually in the Federal Reserve Board’s annualFRBG’s extensive CCAR stress-testingreview process. Both our banking subsidiaries andIn addition to the stress test requirements under CCAR, we also participate in semiannual stress tests required by the Dodd-Frank Act. The Federal Reserve Board may either object to
In March 2015, the FRBG assessed our current capital plan in whole or in part, or provideresponse to the CCAR process and issued a notice of non-objection. If the Federal Reserve Board objectsUnless we choose to ourfile an amended capital plan prior to April 2016, the maximum levels at which we may not make any capital distribution other than those with respect to which the Federal Reserve Board has indicated its non-objection.
Beginning with 2013, our annual capital plans have included special transactions intended to optimize the leveldeclare dividends and mixrepurchase shares of our regulatory capital to improve overall shareholder return and better align with the capital profiles of our peers. From the
CITIZENS FINANCIAL GROUP, INC.
MANAGEMENT'S DISCUSSION AND ANALYSIS
second quarter of 2013 through the fourth quarter of 2014, these special transactions reduced common equity by $2.0 billion and increased Tier 2 subordinated debt by $2.0 billion, with no impact on either the level of total regulatory capital or the total risk-based capital ratio. The last of these transactions was executed on October 8, 2014, when we repurchased $334 million of common shares from RBS and issued $334 million of Tier 2 subordinated debt to RBSG. We anticipate that our strategy of capital optimization will continue. Subject to regulatory approval and market conditions, we intend to purchase an additional $500 million to $750 million of our shares of common stock in 2015 andthrough June 30, 2016 which may include purchases from RBSG, and we may continue to pair these repurchases with issuances of preferred stock, subordinated debt, or senior debt.
In March 2014,are governed by the Federal Reserve Board objected on qualitative grounds to our capital plan submitted as part of the CCAR process. Although we were permitted to continueproposed capital actions at a level consistentand, are subject to actual financial performance, as well as ongoing compliance with those executed in 2013, we are not permitted to increase our capital distributions above 2013 levels until the Federal Reserve Board approves a new capital plan. Consistent with the Federal Reserve Board's annual CCAR requirement, we submitted a new capital plan on January 5, 2015internal governance and expect to receive the Federal Reserve Board's decision on future actions by March 11, 2015.all other regulatory requirements.
Capital Transactions
During 2014,the year ended December 31, 2015, we completed the following capital actions:
Declared and paid common dividends aggregating $25 million, $10 million, $50 million and $55 million ($0.10 per share) in the first, second, third and fourth quarter of 2014, respectively;
paid a special common dividend of $333 million to RBS and issued $333 million of 10-year subordinated debt (4.153% fixed rate subordinated debt due July 1, 2024) to RBSG in the second quarter of 2014;
paid a special common dividend of $333 million to RBS and issued $333 million of 10-year subordinated debt (4.023% fixed rate subordinated debt due October 1, 2024) to RBSG in the third quarter of 2014; and
repurchased 14,297,761 shares of our common equity from RBS at a price of $23.36$0.10 per share, aggregating to $334dividend payments of approximately $55 million, $53 million, $53 million and issued $334$53 million, of 10-year subordinated debt (4.082% fixed subordinated debt due January 31, 2025) to RBSG in the fourth quarter of 2014.
During 2013, we completed the following capital actions:
paid common dividends of $40 million, $55 million, $50 million and $40 millionrespectively, in the first, second, third and fourth quarters of 2013, respectively;2015;
redeemed $289Issued 250,000 shares of the 5.500% Fixed-To-Floating Non-cumulative Perpetual Preferred Stock, Series A, on April 6, 2015, with aggregate liquidation value of $250 million and approximately $247 million of floating rate junior subordinated deferrable interest debentures due March 4, 2034 from our special purpose subsidiary, which caused the redemptionnet capital value after deduction of $280 millionfixed issuance costs;
Repurchased 10,473,397 of our trustoutstanding common shares from RBS, on April 7, 2015, at a price of $23.87 per share reducing market and regulatory capital by approximately $250 million;
Issued $250 million aggregate principal amount 4.350% Subordinated Notes due 2025 on July 31, 2015;
Repurchased 9,615,384 of our outstanding common shares from RBS on August 3, 2015, at a price of $26.00 per share reducing market and regulatory capital by approximately $250 million;
Declared a semi-annual dividend of $27.50 per share on the 5.500% fixed-to-floating rate non-cumulative perpetual Series A Preferred Stock, aggregating to approximately $7 million, and paid on October 6, 2015;
Issued $750 million aggregate principal amount 4.300% Subordinated Notes due 2025 on December 3, 2015;
Repurchased $333 million aggregate principal amount of our 4.771% Subordinated Notes due 2023 from RBS, on December 3, 2015;
Repurchased $334 million aggregate principal amount of our 4.691% Subordinated Notes due 2024 from RBS, on December 3, 2015; and
Repurchased $83 million aggregate principal amount of our 4.153% Subordinated Notes due 2024 from RBS, on December 3, 2015.
The direct repurchase of subordinated debt from RBS and the public issuance of subordinated debt during the fourth quarter of 2015 were generally neutral to our total capital level and ratios. The repurchase of common shares and the issuance of subordinated debt during the third quarter of 2015 were neutral to our total capital level and ratios but reduced common equity by $250 million, and the CET1 and tier 1 risk-based ratios by 22 basis points. The repurchase of common shares and the issuance of preferred securities from RBSG inshares during the second quarter of 2013;
through Citizens Bank of Pennsylvania, we redeemed $10 million of floating rate junior subordinated deferrable interest debentures due April 22, 2032, which caused redemption of $10 million of2015 were generally neutral to our trust preferred securities from third parties in the fourth quarter of 2013;
paid a specialtier 1 and total capital levels and ratios but reduced common dividend of $333equity by $250 million and issued $333 million of 10-yearthe CET1 ratio by approximately 23 basis points.
We intend to continue to repurchase common stock and subordinated debt, (5.158% fixed-to-floating rate callable subordinated debt due June 29, 2023)as appropriate, subject to RBS in the second quarter of 2013;regulatory approval and market conditions.
paid a special common dividend of $333 million to RBS and issued $333 million of 10-year subordinated debt (4.771% fixed rate subordinated debt due October 1, 2023) to RBSG in the third quarter of 2013; and
paid a special common dividend of $334 million to RBS and issued $334 million of 10-year subordinated debt (4.691% fixed rate subordinated debt due January 2, 2024) to RBSG in the fourth quarter of 2013.
After execution of these actions, both common equity Tier 1 and Tier 1 capital, calculated usingAt December 31, 2015, all regulatory ratios remained well above their respective fully phased-in Basel III definitions, were 12.1% as of December 31, 2014, well above their respective Basel III minima, includingminimum, which includes the capital conservation buffer of 7.0% and 8.5%, respectively. Our pro forma Basel III totalfor the risk-based capital ratio after giving effect to all Basel III impacts also remained strong at 15.4% versus the Basel III minimum, including the capital conservation buffer, of 10.5%. These pro forma Basel IIIratios. Fully phased-in regulatory ratios are non-GAAP financial measures. For more information on computation of these non-GAAP financial measures, see “—Principal Components of
CITIZENS FINANCIAL GROUP, INC.
MANAGEMENT’S DISCUSSION AND ANALYSIS
Operations and Key Performance Metrics Used By Management — Key Performance Metrics and Non-GAAP Financial Measures.Measures,”
CITIZENS FINANCIAL GROUP, INC.
MANAGEMENT'S DISCUSSION AND ANALYSIS
Banking Subsidiaries'Subsidiaries’ Capital
The following table presents our banking subsidiaries'subsidiaries’ capital ratios under Basel I as of December 31, 2014 and Basel III Standardized Transitional rules as of December 31, 2015:
|
| | | | | | | | | | | |
| | Transitional Basel III | | Basel I |
| | December 31, 2015 | | December 31, 2014 |
| (dollars in millions) | Amount |
| Ratio | | Amount |
| Ratio |
| Citizens Bank, N.A. | | | | | |
Common equity tier 1 capital (1) |
| $10,754 |
| 11.7 | % | | Not Applicable | Not Applicable |
Tier 1 capital(2) | 10,754 |
| 11.7 |
| |
| $10,406 |
| 12.2 | % |
Total capital(3) | 13,132 |
| 14.3 |
| | 12,584 |
| 14.8 |
|
Tier 1 leverage(4) | 10,754 |
| 10.7 |
| | 10,406 |
| 10.9 |
|
| Risk-weighted assets | 91,625 |
| | | | |
| Quarterly adjusted average assets | 100,504 |
| | | | |
| Citizens Bank of Pennsylvania | | | | | |
Common equity tier 1 capital(1) |
| $3,017 |
| 13.0 | % | | Not Applicable | Not Applicable |
Tier 1 capital(2) | 3,017 |
| 13.0 |
| |
| $2,967 |
| 14.1 | % |
Total capital(3) | 3,559 |
| 15.4 |
| | 3,494 |
| 16.6 |
|
Tier 1 leverage(4) | 3,017 |
| 9.1 |
| | 2,967 |
| 9.5 |
|
| Risk-weighted assets | 23,179 |
| | | | |
| Quarterly adjusted average assets | 33,045 |
| | | | |
(1) Basel III introduced the concept of CET I effective January 1, 2015. “Common equity tier 1 capital ratio” as of December 31, 2015 represents CET1 divided by total risk-weighted assets as defined under Basel III Standardized approach.
(2) “Tier 1 capital ratio” is tier 1 capital, which includes CET1 capital plus non-cumulative perpetual preferred equity that qualifies as additional tier 1 capital, divided by total risk-weighted assets as defined under Basel III Standardized approach. The “tier 1 capital ratio” reported prior to January 1, 2015, represented tier 1 capital divided by total risk-weighted assets as defined under the Basel I general risk-based capital framework in effect for usrule.
(3) “Total capital ratio” is total capital divided by total risk-weighted assets as defined under Basel III Standardized approach. The “Total capital ratio” reported prior to January 1, 2015, represented total capital divided by total risk-weighted assets as defined under the Basel I general risk-based capital rule.
(4) “Tier 1 leverage ratio” is tier 1 capital divided by quarterly average total assets as defined under Basel III Standardized approach. The “tier 1 leverage ratio” reported prior to January 1, 2015, represented tier 1 capital divided by quarterly average total assets as defined under the Basel I general risk-based capital rule.
CBNA CET1 capital under Basel III Standardized Transitional rules was $10.8 billion at December 31, 2014:
|
| | | | | | | | | | | |
| | December 31, 2014 | | December 31, 2013 |
| (dollars in millions) | Amount |
| Ratio | | Amount |
| Ratio |
| Citizens Bank, N.A. | | | | | |
| Tier 1 risk-based capital |
| $10,406 |
| 12.2 | % | |
| $10,401 |
| 12.9 | % |
| Total risk-based capital | 12,584 |
| 14.8 | % | | 11,666 |
| 14.5 | % |
| Tier 1 leverage | 10,406 |
| 10.9 | % | | 10,401 |
| 11.7 | % |
| | | | | | |
| Citizens Bank of Pennsylvania | | | | | |
| Tier 1 risk-based capital |
| $2,967 |
| 14.1 | % | |
| $3,195 |
| 17.1 | % |
| Total risk-based capital | 3,494 |
| 16.6 | % | | 3,400 |
| 18.2 | % |
| Tier 1 leverage | 2,967 |
| 9.5 | % | | 3,195 |
| 11.6 | % |
CBNA Tier 1 risk-based capital ratio declined 70 basis points to 12.2% and the total risk-based capital ratio increased 30 basis points to 14.8% as compared to December 31, 2013. The decline in the Tier 1 risk-based capital ratio reflected2015, an increase of $5.0 billion in risk-weighted assets$348 million from tier 1 common equity under Basel I at December 31, 2014. The increase was primarily attributable to net income for the year ended December 31, 2014, attributable2015, net of dividends paid to growthCFG. At December 31, 2015, CBNA held minimal additional tier 1 capital. Total capital was $13.1 billion at December 31, 2015, an increase of $548 million driven primarily by the increase in CET1 capital.
On January 1, 2015, CBNA began reporting risk-weighted assets based on Basel III Standardized Transitional rules. The conversion from Basel I rules resulted in a $2.0 billion increase in RWAs as of December 31, 2014. This increase was primarily driven by risk weight changes for securitizations, commercial past due and nonaccruals, off-balance sheet commitments with an original maturity one year or less and the consumer auto and commercial business linesremoval of $2.3 billion and $3.4 billion, respectively, partially offset by runoff in consumer home equity products.the cap on OTC derivatives.
CBNA Tier 1 capital,risk-weighted assets based on Basel III Standardized Transitional rules at $10.4 billion, was flat compared with December 31, 2013, reflecting increases due to net income2015 were $91.6 billion, an increase of $820 million, the amortization of the deferred tax liability for goodwill of $23 million, and a minor movement in disallowed servicing assets of $4 million. These increases were largely offset by decreases due to return of permanent capital of $660 million, which was part of an exchange of permanent capital for Tier 2 subordinated debt now held by us, the payment of quarterly common dividends/returns of $160 million, and other deductions from Tier 1 capital of $21 million.
CBNA Total capital increased $918 million$6.3 billion as compared to December 31, 2013, due to2014. The primary drivers for this change were the issuance of $250 million of new Tier 2 subordinated debt, which was not associated with an exchange of permanent capital, and the neutrality to total capitaladoption of the return of $660 million of permanent capital that was offset by the issuance of Tier 2 subordinated debt. Other than these factors, the increase in total capital reflected the same factors as Tier 1 capitalBasel III Standardized approach, as well as growth in commercial, student and consumer auto loan exposures. These increases were partially offset by run off in home lending exposures.
As of December 31, 2015, the CBNA tier 1 leverage ratio decreased approximately 18 basis points, driven by an increase in adjusted quarterly average total assets of $4.9 billion resulting in a decrease54 basis point decline in the allowanceratio, partially offset by a 36 basis point increase for credit losses of $25 million and other deductions from Tier 2higher CET1 capital of $21 million.described above.
CBPA Tier 1 risk-basedCET1 capital ratio declined 300 basis points to 14.1%under Basel III Standardized Transitional rules was $3.0 billion at December 31, 2014 and the total risk-based capital ratio declined 160 basis points to 16.6%, as compared to December 31, 2013. The decline in the Tier 1 risk-based capital ratio reflected2015, an increase of $2.4 billion in risk-weighted assets$50 million from tier 1 common equity under Basel I at December 31, 2014. The increase was primarily attributable to amortization of deferred tax related to goodwill, as net income for the year ended December 31, 2014, attributable2015, net of dividends paid to growth in retail automobile, residential mortgage and commercial loans and leases of $1.2 billion, $884 million and $378 million, respectively.
CBPA Tier 1 capital, at $3.0 billion, decreased $228 million asCFG, was flat compared to 2014. At December 31, 2013, reflecting increases due to net income2015, there was no additional tier 1 capital. Total capital was $3.6 billion at December 31, 2015, an increase of $178$65 million and the amortization of the deferred tax liability for goodwill of $47 million. These increases were more than offsetdriven primarily by the return to us of permanent capital of $300 million, which was part of an exchange of permanent capital for Tier 2 subordinated debt now held by us, and the payment of quarterly common dividends of $155 million.
CBPA Total capital increased $94 million, as compared to December 31, 2013, due to the same factors impacting Tier 1 capital, with two exceptions: the special dividends of $300 million that were offset by issuance of Tier 2 subordinated debt was neutral to total capital, while total capital increased due to an increase in theCET1 capital and a slight increase in allowance for credit losses of $22 million.
Because of the goodwill impairment recognized by CBNA in the second quarter of 2013, CBNA must request specific approval from the OCC before executing capital distributions. This requirement will remain in place through the fourth quarter of 2015. However, as of December 31, 2014, irrespective of the ability of our subsidiary banks to pay dividends, on a non-consolidated basis we had liquid assets in excess of $340 million compared to an annual interest burden on existing subordinated debt of approximately $104 million.
losses.
CITIZENS FINANCIAL GROUP, INC.
MANAGEMENT'SMANAGEMENT’S DISCUSSION AND ANALYSIS
On January 1, 2015, CBPA began reporting risk-weighted assets based on Basel III Standardized Transitional rules. The conversion from Basel I rules resulted in a $705 million increase in RWAs as of December 31, 2014. This increase was primarily driven by risk-weight changes for off-balance sheet commitments with an original maturity one year or less, securitizations and the removal of the cap on OTC derivatives.
CBPA risk-weighted assets based on Basel III Standardized Transitional rules at December 31, 2015 were $23.2 billion, an increase of $2.1 billion as compared to December 31, 2014. The primary drivers for this change were the adoption of the Basel III Standardized approach, as well as growth in commercial, student loans and purchased auto loan exposures.
As of December 31, 2015, the CBPA tier 1 leverage ratio decreased approximately 37 basis points, driven by an increase in adjusted quarterly average total assets of $1.8 billion resulting in a 52 basis point decline in the ratio, partially offset by a 15 basis point increase resulting from higher CET1 capital described above.
Liquidity
We define liquidity as an institution’s ability to meet its cash-flow and collateral obligations in a timely manner, at a reasonable cost. An institution must maintain current liquidity to fund its daily operations and forecasted cash-flow needs as well as contingent liquidity to deliver funding in a stress scenario. We consider the effective and prudent management of liquidity to be fundamental to our health and strength.
We manage liquidity at the consolidated enterprise level and at each material legal entity, including us, CBNA and CBPA.
CFG Liquidity
Our primary sources of cash are (i) dividends and interest received from our banking subsidiaries as a result of investing in bank equity and subordinated debt and (ii) externally issued subordinated debt ($350 million).debt. Our uses of liquidity include the following: (i) routine cash flow requirements as a bank holding company, including payments of dividends, interest and expenses; (ii) needs of subsidiaries, including our banking subsidiaries, for additional equity and, as required, their needs for debt financing; and (iii) extraordinary requirements for cash, such as acquisitions.cash.
During 2014On July 31, 2015, we exchanged Tier 1 common equity for Tier 2 subordinated debt,issued $250 million aggregate principal amount 4.350% Subordinated Notes due 2025 in a public underwritten offering. We used the amountnet proceeds of $1.0 billion. We will continue our strategythis offering to optimize capital, which could include additional purchasesrepurchase 9,615,384 shares of our outstanding common stock and/or issuances of preferred stock, subordinated debt, or senior debt. As we increase subordinated debt in exchange for common equity, our funding costs will increase to reflect the incremental debt service. Any issuance of preferred equity would reduce net income available to common stockholders but improve ROTCE.directly from RBS at $26.00 per share.
Our cash and cash equivalents represent a source of liquidity that can be used to meet various needs. As of December 31, 2014 and 2013,2015, we held cash and cash equivalents of $340approximately $400 million, and $494 million, respectively. Thiswhich should be viewed as a liquidity reserve.
Our liquidity risk is low for four reasons. First,the following reasons: (i) we have no material non-banking subsidiaries, and our banking subsidiaries are self-funding. Second,self-funding; (ii) we have no outstanding senior debt at the CFG level. Third,level; (iii) the capital structures of our banking subsidiaries are similar to our capital structure. As of December 31, 2014,2015, our double leverage ratio (the combined equity of our subsidiaries divided by our equity) was 101.7%. Fourth,101.4%; and, (iv) our other cash flow requirements, such as operating expenses, are relatively small.
Banking Subsidiaries’ Liquidity
In the ordinary course of business, the liquidity of CBNA and CBPA is managed by matching sources and uses of cash. The primary sources of bank liquidity include (i) deposits from our consumer and commercial franchise customers; (ii) payments of principal and interest on loans and debt securities; and (iii) wholesale borrowings, as needed, and as described under “—Liquidity Risk Management and Governance,Governance.” wholesale borrowings. The primary uses of bank liquidity include (i) withdrawals and maturities of deposits; (ii) payment of interest on deposits; (iii) funding of loan commitments; and (iv) funding of securities purchases. To the extent that the banks have relied on wholesale borrowings, uses also include payments of related principal and interest.
Our banking subsidiaries’ major businesses involve taking deposits and making loans. Hence, a key role of liquidity management is to ensure that customers have timely access to funds from deposits and loans. Liquidity management also involves maintaining sufficient liquidity to repay wholesale borrowings, pay operating expenses and support extraordinary funding requirements when necessary.
During 2014, CBNA and CBPA issued $910 million and $300 million in subordinated debt to us in exchange for common equity held by us, respectively. The increased proportion of subordinated debt versus common equity in the capital structure of CBNA and CBPA, will increase funding costs to reflect the incremental debt service costs.
From an external issuance perspective, during 2014, we created a $3.0 billion Global Note Program for ourCBNA. On December 3, 2015, CBNA bank subsidiary. Under this program, on December 1, 2014, CBNA issued $1.5 billion in senior notes, consisting of $750 million of three-year fixed-rate notes and $750 million in five-yearthree-year fixed-rate notes.senior notes under this program. This debt represents a key source of unsecured, term, and stable funding, further diversifies the funding sources of CBNA, and creates a more peer-like funding structure for the consolidated enterprise. Additionally, on December 1, 2014, CBNA issued $1.5 billion in senior notes under this program, consisting of $750 million of three-year fixed-rate notes and $750 million in five-year fixed-rate notes.
CITIZENS FINANCIAL GROUP, INC.
MANAGEMENT’S DISCUSSION AND ANALYSIS
Liquidity Risk
We define liquidity risk as the risk that we or either of our banking subsidiariesan entity will be unable to meet our payment obligations in a timely manner. We manage liquidity risk at the consolidated enterprise level, and for each material legal entity including us, CBNA and CBPA. Liquidity risk can arise due to contingent liquidity risk and/or funding liquidity risk.
CITIZENS FINANCIAL GROUP, INC.
MANAGEMENT'S DISCUSSION AND ANALYSIS
AssetContingent liquidity risk is the risk that market conditions may reduce an entity’s ability to liquidate, pledge and/or finance certain assets and thereby substantially reduce the liquidity value of such assets. Drivers of contingent liquidity risk include general market disruptions as well as specific issues regarding the credit quality and/or valuation of a security or loan, issuer or borrower and/or asset class.
Funding liquidity risk is the risk that market conditions and/or entity-specific events may reduce an entity’s ability to raise funds from depositors and/or wholesale market counterparties. Drivers of funding liquidity risk may be idiosyncratic or systemic, reflecting impediments to operations and/or undermining of market confidence.
Factors Affecting Liquidity
Given the composition of their assets and borrowing sources, contingent liquidity at both CBNA and CBPA would be materially affected by such events as deterioration of financing markets for high-quality securities (e.g., mortgage-backed securities and other instruments issued by the Government National Mortgage Association (“GNMA”), Federal National Mortgage Association (“FNMA”)GNMA, FNMA and the Federal Home Loan Mortgage Corporation (“FHLMC”))FHLMC), by any incapacitationinability of the Federal Home Loan Banks (“FHLBs”)FHLBs to provide collateralized advances and/or by a refusal of the Federal Reserve BoardFRB to act as lender of last resort in systemic stress. Given the quality of our freeunencumbered securities, the positive track record of the FHLBs in stress and the commitment of the Federal Reserve BoardFRB to continue as lender of last resort in systemic stress scenarios, we view contingent liquidity risk at our banking subsidiaries, both CBNA and CBPA, to be relatively modest.modest, given the size and configuration of their respective balance sheets.
Given the structure of their balance sheets, funding liquidity of CBNA and CBPA would be materially affected by an adverse idiosyncratic event (e.g., a major loss, causing a perceived or actual deterioration in its financial condition), an adverse systemic event (e.g., default or bankruptcy of a significant capital markets participant), or a combination of both (e.g., the financial crisis of 2008-2010). However, during the financial crisis, our banking subsidiaries reduced their dependence on unsecured wholesale funding to virtually zero. Consequently, and despite ongoing exposure to a variety of idiosyncratic and systemic events, we view our funding liquidity risk to be relatively modest.
An additional variable affecting our access, and the access of our banking subsidiaries, to unsecured wholesale market funds and to large denomination (i.e., uninsured) customer deposits is the credit ratings assigned by such agencies as Moody’s, Standard & Poor’s and Fitch. The following table presents our credit ratings:
|
| | | | | | |
| | | December 31, 20142015 |
| | | Moody’s | | Standard and Poor’s | | Fitch |
| |
| | Citizens Financial Group, Inc.: | | | | | |
| | Long-term issuer | NR | | BBB+ | | BBB+ |
| | Short-term issuer | NR | | A-2 | | F2 |
| | Subordinated debt | NR | | BBB | | BBB |
| | Preferred Stock | NR | | BB+ | | BB- |
| Citizens Bank, N.A.: | | | | | |
| | Long-term issuer | A3Baa1 | | A- | | BBB+ |
| | Short-term issuer | P-2NR | | A-2 | | F2 |
| Long-term deposits | A1 | | NR | | A- |
| Short-term deposits | P-1 | | NR | | F2 |
| | Citizens Bank of Pennsylvania: | | | | | |
| | Long-term issuer | A3Baa1 | | A- | | BBB+ |
| | Short-term issuer | P-2NR | | A-2 | | F2 |
| Long-term deposits | A1 | | NR | | A- |
| Short-term deposits | P-1 | | NR | | F2 |
| NR = Not rated | | | | | |
Changes in our public credit ratings could affect both the cost and availability of our wholesale funding. As a result and in order to maintain a conservative funding profile, our banking subsidiaries continue to minimize reliance on unsecured wholesale funding. At December 31, 2014,2015, the majority of wholesale funding consisted of secured borrowings using high-quality liquid securities sold under agreements to repurchase (repurchase agreements) andprimarily FHLB advances secured primarily by high-quality residential loan collateral. Our dependence on short-term, unsecured and credit-sensitive funding continues to be relatively low.
CITIZENS FINANCIAL GROUP, INC.
MANAGEMENT’S DISCUSSION AND ANALYSIS
Existing and evolving regulatory liquidity requirements represent another key driver of systemic liquidity conditions and liquidity management practices. The Federal Reserve BoardFRBG evaluates our liquidity as part of the supervisory process, and the Federal Reserve Board recently issued regulations that will require us to conduct regular liquidity stress testing over various time horizons and to maintain a buffer of highly liquid assets sufficient to cover expected net cash outflows and projected loss or
CITIZENS FINANCIAL GROUP, INC.
MANAGEMENT'S DISCUSSION AND ANALYSIS
impairment of funding sources for a short-term liquidity stress scenario. In addition, the Basel Committee has developed a set of internationally-agreed upon quantitative liquidity metrics: the LCR and the NSFR.
The LCR was developed to ensure banks have sufficient high-quality liquid assets to cover expected net cash outflows over a 30-day liquidity stress period. In September 2014, the U.S. federal banking regulators published the final rule to implement the LCR. This rule also introduced a modified version of the LCR in the United States, which generally applies to bank holding companiesBHCs not active internationally (institutions with less than $10 billion of on-balance sheet foreign exposure), with total assets of greater than $50 billion but less than $250 billion. Under this definition, we are designated as a modified LCR company. As compared to the Basel Committee’s version of the LCR, the version of the LCR issued by the U.S. federal banking regulators includes a narrower definition of high-quality liquid assets, different prescribed cash inflow and outflow assumptions for certain types of instruments and transactions and a shorter phase-in schedule that beginsbegan on January 1, 2015 and ends on January 1, 2017. Notably, as a modified LCR company, we arewere required to be 90% compliant beginning in January 2016, and 100% compliant beginning in January 2017. Achieving sustainable LCR compliance may require changes in the size and/or composition of our investment portfolio, the configuration of our discretionary wholesale funding portfolio, and our average cash position. We were compliant with the LCR as of December 31, 2014,2015, and we expect to bewere fully compliant with the LCR as of the required implementation date of January 2016.
The NSFR was developed to provide a sustainable maturity structure of assets and liabilities and has a time horizon of one year. The Basel Committee contemplates that the NSFR, including any revisions, will be implemented as a minimum standard by January 1, 2018; however, the U.S. federal banking regulators have not yet published a finalproposed rule to implement the NSFR in the United States.
We continue to review and monitor these liquidity requirements and to develop appropriate implementation plans and liquidity strategies. We expect to be fully compliant with the final rules on or prior to the applicable effective date.
Liquidity Risk Management and Governance
Liquidity risk is measured and managed by the Wholesale Funding and Liquidity unitUnit within our Treasury unit in accordance with policy guidelines promulgated by our Board and the Asset and Liability Management Committee. In managing liquidity risk, the Wholesale Funding and Liquidity unitUnit delivers regular and comprehensive reporting, including current levels vs.versus threshold limits for a broad set of liquidity metrics, explanatory commentary relating to emerging risk trends and, as appropriate, recommended remedial strategies.
The mission of our Wholesale Funding and Liquidity unitUnit is to deliver prudent levels of current, projected and contingent liquidity from stable sources, in a timely manner and at a reasonable cost, without significant adverse consequences.
We seek to accomplish this mission by funding loans with stable deposits; by prudently controlling dependence on wholesale funding, particularly short-term unsecured funding; and by maintaining ample available liquidity, including a contingent liquidity buffer of unencumbered high-quality loans and securities.
As of December 31, 2014:2015:
Core deposits, including loans and deposits held for sale, continued to be our primary source of funding and our consolidated year-end loan-to-deposit ratio was 97.9% and includes loans and deposits held for sale;96.9%;
Short-term unsecured wholesale funding was relatively low, at $1.0 billion,$527 million, substantially offset by our net overnight position (which is defined as excess cash balances held at the Federal Reserve Banks plus federal funds sold minus federal funds purchased) of $2.1$2.0 billion;
Contingent liquidity remained robust at $19.5was $23.1 billion; net overnight position (defined above), totaled $1.5$2.0 billion; unencumbered liquid securities totaled $14.5$17.0 billion; and available FHLB capacity primarily secured by mortgage loans totaled $3.5$4.1 billion; and
Available discount window capacity, defined as available total borrowing capacity from the Federal Reserve based on identified collateral, is secured by non-mortgage commercial and consumer loans and totaled $8.3$11.0 billion. Use of this borrowing capacity would likely be considered only during exigent circumstances.
CITIZENS FINANCIAL GROUP, INC.
MANAGEMENT’S DISCUSSION AND ANALYSIS
The Wholesale Funding and Liquidity unitUnit monitors a variety of liquidity and funding metrics, including specific risk threshold limits. The metrics are broadly classified as follows:
Current liquidity sources and capacities, including excess cash at the Federal Reserve Banks, free and liquid securities and available and secured FHLB borrowing capacity;
Contingent stressed liquidity, including idiosyncratic, systemic and combined stress scenarios, in addition to evolving regulatory requirements such as the LCR and the NSFR; and
CITIZENS FINANCIAL GROUP, INC.
MANAGEMENT'S DISCUSSION AND ANALYSIS
Current and prospective exposures, including secured and unsecured wholesale funding and spot and cumulative cash-flow gaps across a variety of horizons.
Further, certain of these metrics are monitored for each of us, our banking subsidiaries, and for our consolidated enterprise on a daily basis, including net overnight position, freeunencumbered securities, internal liquidity, available FHLB borrowing capacity and total contingent liquidity. In order to identify emerging trends and risks and inform funding decisions, specific metrics are also forecasted over a one-year horizon.
Cash flows from operating activities contributed $1.2 billion in 2015. Net cash used by investing activities was $5.9 billion, primarily reflecting net securities available for sale portfolio purchases of $6.8 billion and a net increase in loans and leases of $6.0 billion, partially offset by proceeds from maturities, paydowns and sales of securities available for sale of $7.3 billion. Cash provided by financing activities was $4.5 billion, driven by a net increase in deposits of $6.8 billion and proceeds from long-term borrowed funds of $6.8 billion, partially offset by a decrease in federal funds purchased and securities sold under agreement to repurchase of $3.5 billion, a decrease in other short-term borrowed funds of $4.4 billion and repayments of long-term borrowed funds of $766 million. These activities represented a cumulative decrease in cash and cash equivalents of $191 million, which, when added to the cash and cash equivalents balance of $3.3 billion at the beginning of the year, resulted in an ending balance of cash and cash equivalents of $3.1 billion as of December 31, 2015.
For the year ended December 31, 2014, our operating activities contributed $1.4 billion in net cash, including an increase in other liabilities, which added $239 million, and an increase in depreciation, amortization and accretion, which added $386 million, partially offset by an increase in other assets of $295 million and a gain on sale of deposits of $286 million. For the year ended December 31, 2014, net cash used by investing activities was $10.3 billion, primarily reflecting net securities available for sale portfolio purchases of $8.3 billion, a net increase in loans and leases of $6.9 billion and securities held to maturity portfolio purchases of $1.2 billion, partially offset by proceeds from maturities, paydowns and sales of securities available for sale of $6.3 billion. Cash provided by financing activities was $9.4 billion, including a net increase in other short-term borrowed funds of $4.0 billion and a net increase in deposits of $3.8 billion. These activities represented a cumulative increase in cash and cash equivalents of $519 million, which, when added to the cash and cash equivalents balance of $2.8 billion at the beginning of the year, resulted in an ending balance of cash and cash equivalents of $3.3 billion as of December 31, 2014.
For the year ended December 31, 2013, our operating activities contributed $2.6 billion in net cash, including sales of mortgage loans net of originations which, added $448 million, and a decrease in other assets, which added $827 million. For the year ended December 31, 2013, net cash contributed by investing activities decreased by $2.5 billion, primarily reflecting net securities available for sale portfolio purchases of $11.0 billion, partially offset by proceeds from maturities, paydowns and sales of securities available for sale of $8.4 billion. Finally, for the year ended December 31, 2013, cash used in financing activities was $502 million, including a net decrease in deposits of $3.0 billion, and $1.2 billion in dividends paid to RBS. These activities represented a cumulative decrease in cash and cash equivalents of $306 million, which, when added to cash and cash equivalents of $3.1 billion at the beginning of the year, resulted in an ending balance of cash and cash equivalents of $2.8 billion as of December 31, 2013.
Contractual Obligations
The following table presents our outstanding contractual obligations as of December 31, 2014:
2015:
| | | (in millions) | Total |
| | Less than 1 year |
| | 1 to 3 years |
| | 3 to 5 years |
| | After 5 years |
| Total |
| Less than 1 year |
| 1 to 3 years |
| 3 to 5 years |
| After 5 years |
|
Long-term borrowed funds (1) |
| $4,642 |
| |
| $— |
| |
| $1,517 |
| |
| $758 |
| |
| $2,367 |
|
| $9,886 |
|
| $— |
|
| $6,517 |
|
| $755 |
|
| $2,614 |
|
| Operating lease obligations | 752 |
| | 162 |
| | 272 |
| | 151 |
| | 167 |
| 817 |
| 190 |
| 298 |
| 149 |
| 180 |
|
Term deposits (1) | 12,058 |
| | 8,278 |
| | 3,221 |
| | 552 |
| | 7 |
| 12,024 |
| 9,994 |
| 1,737 |
| 287 |
| 6 |
|
Purchase obligations (2) | 691 |
| | 501 |
| | 107 |
| | 56 |
| | 27 |
| 675 |
| 491 |
| 79 |
| 48 |
| 57 |
|
| Total outstanding contractual obligations |
| $18,143 |
| |
| $8,941 |
| |
| $5,117 |
| |
| $1,517 |
| |
| $2,568 |
|
| $23,402 |
|
| $10,675 |
|
| $8,631 |
|
| $1,239 |
|
| $2,857 |
|
(1) Deposits and borrowed funds exclude interest.
(2) Includes purchase obligations for goods and services covered by non-cancelable contracts and contracts including cancellation fees.
CITIZENS FINANCIAL GROUP, INC.
MANAGEMENT'SMANAGEMENT’S DISCUSSION AND ANALYSIS
Off-Balance Sheet Commitments
The following table presents our outstanding off-balance sheet commitments. See Note 1617 “Commitments and Contingencies” to our audited Consolidated Financial Statements in Part II, Item 8 — Financial Statements and Supplementary Data, included elsewhere in this report, for further discussion:report:
| | | | As of December 31, | | | | | December 31, | | | | |
| (dollars in millions) | 2014 |
| | 2013 |
| | Change |
| | Percent |
| 2015 |
| | 2014 |
| | Change |
| | Percent |
|
| Commitment amount: | | | | | | | | | | | | | | |
| Undrawn commitments to extend credit |
| $55,899 |
| |
| $53,987 |
| |
| $1,912 |
| | 4 | % |
| $56,524 |
| |
| $55,899 |
| |
| $625 |
| | 1 | % |
| Financial standby letters of credit | 2,315 |
| | 2,556 |
| | (241 | ) | | (9 | ) | 2,010 |
| | 2,315 |
| | (305 | ) | | (13 | ) |
| Performance letters of credit | 65 |
| | 149 |
| | (84 | ) | | (56 | ) | 42 |
| | 65 |
| | (23 | ) | | (35 | ) |
| Commercial letters of credit | 75 |
| | 64 |
| | 11 |
| | 17 |
| 87 |
| | 75 |
| | 12 |
| | 16 |
|
| Marketing rights | 51 |
| | 54 |
| | (3 | ) | | (6 | ) | 47 |
| | 51 |
| | (4 | ) | | (8 | ) |
| Risk participation agreements | 19 |
| | 17 |
| | 2 |
| | 12 |
| 26 |
| | 19 |
| | 7 |
| | 37 |
|
| Residential mortgage loans sold with recourse | 11 |
| | 13 |
| | (2 | ) | | (15 | ) | 10 |
| | 11 |
| | (1 | ) | | (9 | ) |
| Total |
| $58,435 |
| |
| $56,840 |
| |
| $1,595 |
| | 3 | % |
| $58,746 |
| |
| $58,435 |
| |
| $311 |
| | 1 | % |
In December 2014, we committed to purchasing pools of performing student loans with principal balances outstanding of approximately $260 million. The specific loans to be purchased were identified in JanuaryNovember 2015, and the transactions were settled in January and February 2015.
In May 2014, weCompany entered into an agreement with RBS to purchase auto$500 million of its subordinated notes held by RBS by July 30, 2016, subject to regulatory approval and rating agency considerations. See Note 19 “Related Party Transactions and Significant Transactions with RBS,” to our audited Consolidated Financial Statements in Part II, Item 8 — Financial Statements and Supplementary Data, included elsewhere in this report.
In June 2015, we amended our agreement originally entered into in May 2014, to purchase automobile loans on a quarterly basis in future periods. ForCommencing on the first year,effective date and through July 31, 2015, the amended agreement requires the purchase of a minimum of $250 million of outstanding balances to a maximum of $600 million per quarterly period. For quarterly periods on or after the first year,August 1, 2015, the minimum and maximum purchases are $400$50 million and $600$200 million, respectively. The agreement automatically renews until terminated by either party. We may cancel the agreement at will with payment of a variable termination fee. After three years, there is no termination fee. For more information regarding this
On January 7, 2016, the Company entered into an agreement see “—Recent Events.”to purchase student loans on a quarterly basis beginning with the first calendar quarter in 2016 and ending with the fourth calendar quarter in 2016. Under the terms of the agreement, the Company committed to purchase a minimum of $125 million of loans per quarter. The minimum and maximum amount of the aggregate purchase principal balance of loans under the terms of the agreement are $500 million and $1 billion, respectively. The agreement will terminate immediately if at any time during its term the aggregate purchase principal balance of loans equals the maximum amount. The agreement may be extended by written agreement of the parties for an additional four quarters. The Company may terminate the agreement at will with payment of a termination fee equal to the product of $1 million times the number of calendar quarters remaining in the term.
Critical Accounting Estimates
Our audited Consolidated Financial Statements, which are included elsewhere in this report, are prepared in accordance with GAAP. The preparation of financial statements in conformity with GAAP requires us to establish accounting policies and make estimates that affect amounts reported in our audited Consolidated Financial Statements.
An accounting estimate requires assumptions and judgments about uncertain matters that could have a material effect on our audited Consolidated Financial Statements. Estimates are made using facts and circumstances known at a point in time. Changes in those facts and circumstances could produce results substantially different from those estimates. The most significant accounting policies and estimates and their related application are discussed below.
See Note 1 “Significant Accounting Policies” to our audited Consolidated Financial Statements in Part II, Item 8 — Financial Statements and Supplementary Data, included elsewhere in this report, for further discussion of our significant accounting policies.
CITIZENS FINANCIAL GROUP, INC.
MANAGEMENT’S DISCUSSION AND ANALYSIS
Allowance for Credit Losses
Management’s estimate of probable losses in our loan and lease portfolios including unfunded lending commitments is recorded in the allowance for loan and lease lossesALLL and the reserve for unfunded lending commitments, at levels that we believe to be appropriate as of the balance sheet date. Our determination of such estimates is based on a periodic evaluation of the loan and lease portfolios and unfunded credit facilities, as well as other relevant factors. This evaluation is inherently subjective and requires significant estimates and judgments of underlying factors, all of which are susceptible to change.
The allowance for loan and lease lossesALLL and reserve for unfunded lending commitments could be affected by a variety of internal and external factors. Internal factors include portfolio performance such as delinquency levels, assigned risk ratings, the mix and level of loan balances, differing economic risks associated with each loan category and the financial condition of specific borrowers. External factors include fluctuations in the general economy, unemployment rates, bankruptcy filings, developments within a particular industry, changes in collateral values and factors particular to a specific commercial credit such as competition, business and management performance. The allowance for loan and lease lossesALLL may be adjusted to reflect our current assessment
CITIZENS FINANCIAL GROUP, INC.
MANAGEMENT'S DISCUSSION AND ANALYSIS
of various qualitative risks, factors and events that may not be measured in our statistical procedures. There is no certainty that the allowance for loan and lease lossesALLL and reserve for unfunded lending commitments will be appropriate over time to cover losses because of unanticipated adverse changes in any of these internal, external or qualitative factors.
The evaluation of the adequacy of the commercial, commercial real estate, and lease allowance for loan and lease lossesALLL and reserve for unfunded lending commitments is primarily based on risk rating models that assess probability of default, loss given default and exposure at default on an individual loan basis. The models are primarily driven by individual customer financial characteristics and are validated against historical experience. Additionally, qualitative factors may be included in the risk rating models. After the aggregation of individual borrower incurred loss, additional overlays can be made based on back-testing against historical losses and forward loss curve ratios.
For nonaccruing commercial and commercial real estate loans with an outstanding balance of $3 million or greater and for all commercial and commercial real estate TDRs (regardless of size), we conduct specific analysis on a loan level basis to determine the probable amount of credit loss. If appropriate, a specific allowanceALLL is established for the loan through a charge to the provision for credit losses. For all classes of impaired loans, individual loan measures of impairment may result in a charge-off to the allowance for loan and lease losses,ALLL, if deemed appropriate. In such cases, the provision for credit losses is not affected when a specific reserve for at least that amount already exists. Techniques utilized include comparing the loan’s carrying amount to the estimated present value of its future cash flows, the fair value of its underlying collateral, or the loan’s observable market price. The technique applied to each impaired loan is based on the workout officer’s opinion of the most probable workout scenario. Historically, this has generally led to the use of the estimated present value of future cash flows approach. The fair value of underlying collateral will be used if the loan is deemed collateral dependent. For loans that use the fair value of underlying collateral approach, a charge-off assessment is performed quarterly to write the loans down to fair value.
For most non-impaired retail loan portfolio types, the allowance for loan and lease lossesALLL is based upon the incurred loss model utilizing the probability of default (“PD”), loss given default (“LGD”)PD, LGD and exposure at default on an individual loan basis. When developing these factors, we may consider the loan product and collateral type, loan-to-value (“LTV”)LTV ratio, lien position, borrower’s credit, time outstanding, geographic location, delinquency status and incurred loss period. Incurred loss periods are reviewed and updated at least annually, and potentially more frequently when economic situations change rapidly, as they tend to fluctuate with economic cycles. Incurred loss periods are generally longer in good economic times and shorter in bad times. Certain retail portfolios, including SBO home equity loans, student loans, and commercial credit card receivables utilize roll rate models to estimate the ALLL. For the portfolios measured using the incurred loss model, roll rate models are also run as challenger models and can used to support management overlays if deemed necessary.
For home equity lines and loans, a number of factors impact the PD. Specifically, the borrower’s current FICO score, the utilization rate, delinquency statistics, borrower income, current combined loan-to-valueCLTV ratio and months on books are all used to assess the borrower’s creditworthiness. Similarly, the loss severity is also impacted by various factors, including the utilization rate, the combined loan-to-valueCLTV ratio, the lien position, the Housing Price Index change for the location (as measured by the Case-Shiller index), months on books and current loan balance.
When we are not in a first lien position, we use delinquency information on the first lien exposures obtained from third-party credit information providers in the credit assessment. For all first liens, whether owned by a third party or by us, an additional assessment is performed on a quarterly basis. In this assessment, the most recent three months’ performance of the senior liens is reviewed for delinquency (90 days or more past due), modification, foreclosure and/or bankruptcy statuses. If any derogatory status is present, the junior lien will be placed on nonaccrual status regardless of its delinquency status on our books. This subsequent change to nonaccrual status will alter the treatment in the PD model, thus affecting the reserve calculation.
In addition, the first lien exposure is combined with the second lien exposure to generate a combined loan-to-value (“CLTV”).CLTV. The CLTV is a more accurate reflection of the leverage of the borrower against the property value, as compared to the LTV from just the junior lien(s). The CLTV is used for modeling both the junior lien PD and LGD. This also impacts the Allowance for Loan LossALLL rates for the junior lien HELOCs.
CITIZENS FINANCIAL GROUP, INC.
MANAGEMENT’S DISCUSSION AND ANALYSIS
The above measures are all used to assess the PD and LGD for HELOC borrowers for whom we originated the loans. There is also a portfolio of home equity products that were originated and serviced by others; however, we currently service some of the loans in this portfolio. The SBO portfolio is modeled as a separate class and the reserves for this class are generated by using the delinquency roll rate models as described below.
For retail TDRs that are not collateral-dependent, allowances are developed using the present value of expected future cash flows, compared to the recorded investment in the loans. Expected re-default factors are considered in this analysis. Retail TDRs that are deemed collateral-dependent are written down to the fair market value of the collateral less costs to sell. The fair value of collateral is periodically monitored subsequent to the modification.
CITIZENS FINANCIAL GROUP, INC.
MANAGEMENT'S DISCUSSION AND ANALYSIS
Changes in the levels of estimated losses, even if minor, can significantly affect management’s determination of an appropriate allowance for loan and lease losses.ALLL. For consumer loans, losses are affected by such factors as loss severity, collateral values, economic conditions, and other factors. A 1% and 5% increase in the estimated loss rate for consumer loans at December 31, 20142015 would have increased the allowanceALLL by $5 million and $27$26 million, respectively. The allowance for loan and lease lossesALLL for our Commercial Banking segment is sensitive to assigned credit risk ratings and inherent loss rates. If 10% and 20% of the December 31, 20142015 year endingend loan balances (including unfunded commitments) within each risk rating category of our Commercial Banking segment had experienced downgrades of two risk categories, the allowance for loan and lease lossesALLL would have increased by $30$36 million and $59$72 million, respectively.
Commercial loans and leases are charged off to the allowanceALLL when there is little prospect of collecting either principal or interest. Charge-offs of commercial loans and leases usually involve receipt of borrower-specific adverse information. For commercial collateral dependentcollateral-dependent loans, an appraisal or other valuation is used to quantify a shortfall between the fair value of the collateral less costs to sell and the recorded investment in the commercial loan. Retail loan charge-offs are generally based on established delinquency thresholds rather than borrower-specific adverse information. When a loan is collateral-dependent, any shortfalls between the fair value of the collateral less costs to sell and the recorded investment is promptly charged off. Placing any loan or lease on nonaccrual status does not by itself require a partial or total charge-off; however, any identified losses are charged off at that time.
For additional information regarding the allowance for loan and lease lossesALLL and reserve for unfunded lending commitments, see Note 1 “Significant Accounting Policies,”Policies” and Note 5 “Allowance for Credit Losses, Nonperforming Assets and Concentrations of Credit Risk,”Risk” to our audited Consolidated Financial Statements in Part II, Item 8 — Financial Statements and Supplementary Data, included elsewhere in this report.
Fair Value
We measure fair value using the price that would be received to sell an asset or paid to transfer a liability in an orderly transaction between market participants at the measurement date. Fair value is based upon quoted market prices in an active market, where available. If quoted prices are not available, observable market-based inputs or independently sourced parameters are used to develop fair value, whenever possible. Such inputs may include prices of similar assets or liabilities, yield curves, interest rates, prepayment speeds and foreign exchange rates.
We classify our assets and liabilities that are carried at fair value in accordance with the three-level valuation hierarchy:
Level 1. Quoted prices (unadjusted) in active markets for identical assets or liabilities;
Level 2. Observable inputs other than Level 1 prices, such as quoted prices for similar instruments; quoted prices in markets that are not active; or other inputs that are observable or can be corroborated by market data for substantially the full term of the asset or liability; and
Level 3. Unobservable inputs that are supported by little or no market information and that are significant to the fair value measurement.
Classification in the hierarchy is based upon the lowest level input that is significant to the fair value measurement of the asset or liability. For instruments classified in Level 1 and 2 where inputs are primarily based upon observable market data, there is less judgment applied in arriving at the fair value. For instruments classified in Level 3, management judgment is more significant due to the lack of observable market data.
Significant assets measured at fair value on a recurring basis include our mortgage-backed securities available for sale. These instruments are priced using an external pricing service and are classified as Level 2 within the fair value hierarchy. The service’s pricing models use predominantly observable valuation inputs to measure the fair value of these securities under both the market and income approaches. The pricing service utilizes a matrix pricing methodology to price our U.S. agency pass-through securities, which involves making adjustments to to-be-announced security prices based on a matrix of various mortgage-backed securities characteristics such as weighted-average maturities, indices and other pool-level information. Other agency and non-agency mortgage-backed securities are priced using a discounted cash flow methodology. This methodology includes estimating the cash flows expected to be received for each security using projected prepayment speeds and default rates based on historical
CITIZENS FINANCIAL GROUP, INC.
MANAGEMENT’S DISCUSSION AND ANALYSIS
statistics of the underlying collateral and current market conventions. These estimated cash flows are then discounted using market-based discount rates that incorporate characteristics such as average life, volatility, ratings, performance of the underlying collateral, and prevailing market conditions.
We review and update the fair value hierarchy classifications on a quarterly basis. Changes from one quarter to the next related to the observability of inputs in fair value measurements may result in a reclassification between the fair value hierarchy levels and are recognized based on year-end balances. We also verify the accuracy of the pricing provided by our primary external pricing service on a quarterly basis. This process involves using a secondary external vendor to provide valuations for our securities
CITIZENS FINANCIAL GROUP, INC.
MANAGEMENT'S DISCUSSION AND ANALYSIS
portfolio for comparison purposes. Any securities with discrepancies beyond a certain threshold are researched and, if necessary, valued by an independent outside broker.
Fair value is also used on a nonrecurring basis to evaluate certain assets for impairment or for disclosure purposes. Examples of nonrecurring uses of fair value include mortgage servicing rights accounted for by the amortization method, loan impairments for certain loans and goodwill.
For additional information regarding our fair value measurements, see Note 1 “Significant Accounting Policies,” Note 3 “Securities,” Note 910 “Mortgage Banking,” and Note 1516 “Derivatives” to our audited Consolidated Financial Statements in Part II, Item 8 — Financial Statements and Supplementary Data, included elsewhere in this report.
Goodwill
Goodwill is an asset that represents the future economic benefits arising from other assets acquired in a business combination that are not individually identified and separately recognized. Goodwill is not amortized, but is subject to annual impairment tests. Goodwill is assigned to reporting units at the date the goodwill is initially recorded. A reporting unit is a business operating segment or a component of a business operating segment. Once goodwill has been assigned to reporting units, it no longer retains its association with a particular acquisition, and all of the activities within a reporting unit, whether acquired or organically grown, are available to support the value of the goodwill.
The goodwill impairment analysis is a two-step test. The first step, used to identify potential impairment, involves comparing each reporting unit’s fair value to its carrying value including goodwill. If the fair value of a reporting unit exceeds its carrying value, applicable goodwill is deemed to be not impaired. If the carrying value exceeds fair value, there is an indication of impairment and the second step is performed to measure the amount of impairment.
The second step involves calculating an implied fair value of goodwill for each reporting unit for which the first step indicated impairment. The implied fair value of goodwill is determined in the same manner as the amount of goodwill recognized in a business combination, which is the excess of the fair value of the reporting unit, as determined in the first step, over the aggregate fair values of the individual assets, liabilities and identifiable intangible assets as if the reporting unit were being acquired in a business combination. If the implied fair value of goodwill exceeds the carrying value of goodwill assigned to the reporting unit, there is no impairment. If the carrying value of goodwill assigned to a reporting unit exceeds the implied fair value of the goodwill, an impairment charge is recorded for the excess. An impairment loss recognized cannot exceed the amount of goodwill assigned to a reporting unit, and the loss establishes a new basis in the goodwill. Subsequent reversal of goodwill impairment losses is not permitted.
We review goodwill for impairment annually as of October 31 or more often if events or circumstances indicate that it is more likely than not that the fair value of one or more reporting units is below its carrying value. We rely on the income approach (discounted cash flow method) as the primary method for determining fair value. Market-based methods are used as benchmarks to corroborate the value determined by the discounted cash flow method.
We rely on several assumptions when estimating the fair value of our reporting units using the discounted cash flow method. These assumptions include the current discount rate, as well as projected loan losses, income taxes and capital retention rates. Discount rates are estimated based on the Capital Asset Pricing Model, which considers the risk-free interest rate, market risk premium, beta and unsystematic risk and size premium adjustments specific to a particular reporting unit. The discount rates are also calibrated on the assessment of the risks related to the projected cash flows of each reporting unit. Multi-year financial forecasts are developed for each reporting unit by considering several key business drivers such as new business initiatives, customer retention standards, market share changes, anticipated loan and deposit growth, forward interest rates, historical performance and industry and economic trends, among other considerations. The long-term growth rate used in determining the terminal value of each reporting unit was estimated based on management’s assessment of the minimum expected terminal growth rate of each reporting unit, as well as broader economic considerations such as gross domestic product and inflation.
We corroborate the fair value of our reporting units determined by the discounted cash flow method using market-based methods: a comparable company method and a comparable transaction method. The comparable company method measures fair value of a business by comparing it to publicly traded companies in similar lines of business. This involves identifying and selecting the comparable companies based on a number of factors (i.e., size, growth, profitability, risk and return on investment), calculating
CITIZENS FINANCIAL GROUP, INC.
MANAGEMENT’S DISCUSSION AND ANALYSIS
the market multiples (i.e., price-to-tangible book value, price-to-cash earnings and price-to-net income) of these comparable companies and then applying these multiples to our operating results to estimate the value of the reporting unit’s equity on a marketable, minority basis. A control premium is then applied to this value to estimate the fair value of the reporting unit on a marketable, controlling basis. The comparable transaction method measures fair value of a business based on exchange prices in actual transactions and on asking prices for controlling interests in public or private companies currently offered for sale. The process involves comparison and correlation of us with other similar companies. Adjustments for differences in factors described earlier (i.e., size, growth, profitability, risk and return on investment) are also considered.
CITIZENS FINANCIAL GROUP, INC.
MANAGEMENT'S DISCUSSION AND ANALYSIS
As a best practice, we also corroborate the fair value of our reporting units determined by the discounted cash flow method by adding the aggregated sum of these fair value measurements to the fair value of our non-segment operations and comparing this total to our observed market capitalization. As part of this process, we analyze the implied control premium to evaluate its reasonableness. All facts and circumstances are considered when completing this analysis, including observed transaction data and any additional external evidence supporting the implied control premium. Since none of our reporting units are publicly traded, individual reporting unit fair value determinations cannot be directly correlated to CFG’s common stock price. The sum of the fair values of the reporting units at October 31, 2015 exceeded the overall market capitalization of CFG as of October 31, 2015. Although we believe it is reasonable to conclude that market capitalization could be an indicator of fair value over time, we do not believe that our current market capitalization reflects the aggregate fair value of our individual reporting units.
The valuation of goodwill is dependent on forward-looking expectations related to the performance of the U.S. economy and our associated financial performance. The prolonged delay in the full recovery of the U.S. economy, and the impact of that delay on earnings expectations, prompted a goodwill impairment test as of June 30, 2013. Although the U.S. economy has demonstrated signs of recovery, notably improvements in unemployment and housing, the pace and extent of recovery in these indicators, as well as in overall gross domestic product, have lagged previous expectations. The impact of the slow recovery is most evident in our Consumer Banking reporting unit. Accordingly, the percentage by which the estimated fair value of our Consumer Banking reporting unit exceeded its carrying value declined from 7% at December 31, 2011 to 5% at December 31, 2012.
During the first half of 2013, we observed further deceleration of expected growth for our Consumer Banking reporting unit’s future profits based on forecasted economic growth for the U.S. economy and the continuing impact of the new regulatory framework in the financial industry. This deceleration was incorporated into our revised earnings forecast in the second quarter of 2013, and we subsequently concluded that there was a likelihood of greater than 50% that goodwill impairment had occurred as of June 30, 2013.
An interim goodwill impairment test was subsequently performed for our Consumer Banking and Commercial Banking reporting units. Step One of these tests indicated that (1) the fair value of our Consumer Banking reporting unit was less than its carrying value by 19% and (2) the fair value of our Commercial Banking reporting unit exceeded its carrying value by 27%. Step Two of the goodwill impairment test was subsequently performed for our Consumer Banking reporting unit, which resulted in the recognition of a pre-tax $4.4 billion impairment charge in our Consolidated Statement of Operations for the period ending June 30, 2013. The impairment charge, which was a non-cash item, had minimal impact on our Tiertier 1 risk-based and total risk-based capital ratios. The impairment charge had no impact on our liquidity position or tangible common equity.
We performed an annual test for impairment of goodwill for both reporting units as of October 31, 2014.2015. As of this testing date, the percentage by which the fair value of our Consumer Banking reporting unit exceeded its carrying value was 12%6%, and the percentage by which the fair value of our Commercial Banking reporting unit exceeded its carrying value was 9%8%.
We based the fair value estimates used in our annual goodwill impairment testing on assumptions we believe to be representative of assumptions that a market participant would use in valuing the reporting units but that are unpredictable and inherently uncertain, including estimates of future growth rates and operating margins and assumptions about the overall economic climate and the competitive environment for our reporting units. There can be no assurances that future estimates and assumptions made for purposes of goodwill testing will prove accurate predictions of the future. If the assumptions regarding business plans, competitive environments, market conditions or anticipated growth rates are not achieved, or a market participant view of our total fair value declines, we may be required to record goodwill impairment charges in future periods.
For additional information regarding our goodwill impairment testing, see Note 1 “Significant Accounting Policies,” and Note 89 “Goodwill” to our audited Consolidated Financial Statements in Part II, Item 8 — Financial Statements and Supplementary Data, included elsewhere in this report.
CITIZENS FINANCIAL GROUP, INC.
MANAGEMENT’S DISCUSSION AND ANALYSIS
Income Taxes
Accrued income taxes are reported as a component of either other assets or other liabilities, as appropriate, in the Consolidated Balance Sheets and reflect our estimate of income taxes to be paid or that effectively have been prepaid. Deferred income tax assets and liabilities represent the amount of future income taxes to be paid or that effectively have been prepaid, and the net balance is reported as an asset or liability in the Consolidated Balance Sheets. We determine the realization of the deferred tax asset based upon an evaluation of the four possible sources of taxable income: (1) the future reversals of taxable temporary differences; (2) future taxable income exclusive of reversing temporary differences and carryforwards; (3) taxable income in prior carryback years; and (4) tax planning strategies. In projecting future taxable income, we utilize forecasted pre-tax earnings, adjust for the estimated book tax differences and incorporate assumptions, including the amount of income allocable to taxing jurisdictions. These assumptions require significant judgment and are consistent with the plans and estimates that we use to manage the underlying businesses. The realization of the deferred tax assets could be reduced in the future if these estimates are significantly different than forecasted.
We are subject to income tax in the United States and multiple state and local jurisdictions. The tax laws and regulations in each jurisdiction may be interpreted differently in certain situations, which could result in a range of outcomes. Thus, we are required to exercise judgment regarding the application of these tax laws and regulations. We evaluate and recognize tax liabilities
CITIZENS FINANCIAL GROUP, INC.
MANAGEMENT'S DISCUSSION AND ANALYSIS
related to any tax uncertainties. Due to the complexity of some of these uncertainties, the ultimate resolution may differ from the current estimate of tax liabilities or refunds.
Our estimate of accrued income taxes, deferred income taxes and income tax expense can also change in any period as a result of new legislative or judicial guidance impacting tax positions, as well as changes in income tax rates. Any changes, if they occur, can be significant to our consolidated financial position, results of operations or cash flows.
For additional information regarding income taxes, see Note 1 “Significant Accounting Policies,” and Note 1415 “Income Taxes” to our audited Consolidated Financial Statements in Part II, Item 8 — Financial Statements and Supplementary Data, included elsewhere in this report.
Risk Governance
We are committed to maintaining a strong, integrated and proactive approach to the management of all risks to which we are exposed in pursuit of our business objectives. A key aspect of our Board’s responsibility as the main decision making body is setting our risk appetite to ensure that the levels of risk that we are willing to accept in the attainment of our strategic business and financial objectives are clearly understood.
To enable the Board to carry out its objectives, it has delegated authority for risk management activities, as well as governance and oversight of those activities, to a number of Board and executive management level risk committees. The key committees that specifically consider risk across the enterprise are set out in the diagram below.
CITIZENS FINANCIAL GROUP, INC.
MANAGEMENT’S DISCUSSION AND ANALYSIS
Chief Risk Officer
The Chief Risk Officer (“CRO”)CRO directs our overall risk management function overseeing the credit, interest rate , market, liquidity, operational, compliance, regulatory, operationalstrategic and creditreputational risk management. In addition, the CRO has oversight of the management of market, liquidity and strategic risks. The CRO reports to our CEO and to the Board Risk Committee.
Risk Framework
Our risk management framework is embedded in our business through a “Three Lines of Defense” model which defines responsibilities and accountabilities.
CITIZENS FINANCIAL GROUP, INC.
MANAGEMENT'S DISCUSSION AND ANALYSIS
First Line of Defense
The business lines (including their associated support functions) are the First Line of Defense and are accountable for owning and managing, within our defined risk appetite, the risks which exist in their respective business areas. The business lines are responsible for performing regular risk assessments to identify and assess the material risks that arise in their area of responsibility, complying with relevant risk policies, testing and certifying the adequacy and effectiveness of their controls on a regular basis, establishing and documenting operating procedures and establishing and owning a governance structure for identifying and managing risk.
Second Line of Defense
The Second Line of Defense includes independent monitoring and control functions accountable for developing and ensuring implementation of risk and control frameworks oversight of risk, financial management and valuation, and regulatory compliance.related policies. This centralized risk function is appropriately independent from the business and is accountable for overseeing and challenging our business lines on the effective management of their risks. This risk function utilizes training, communications and awareness to provide expert support and advice to the business lines. This includes interpreting the risk policy standards and risk management framework, overseeing compliance by the businesses with policies and responsibilities, including providing relevant management information and escalating concerns where appropriate.
The Executive Risk Committee, chaired by the CRO, actively considers our inherent material risks, analyzes our overall risk profile and seeks confirmation that the risks are being appropriately identified, assessed and mitigated.
Third Line of Defense
Our internal auditInternal Audit function is the Third Line of Defense acting as an independent appraisal and assurance function. As anproviding independent assurance function,with a view of the effectiveness of Citizens’ internal controls, governance practices, and culture so that risk is managed appropriately for the size, complexity, and risk profile of the organization. Internal Audit has complete and unrestricted access to any and all Bank records, physical properties, and personnel. Internal Audit issues a report following each internal review and provides an audit ensuresopinion to Citizens’ Audit Committees on a quarterly basis.
Credit Quality Assurance also reports to the key business risks are being managed to an acceptable levelChief Audit Executive and thatalso provides the riskBoards, senior management and internal control framework is operating effectively. Independent assessments are providedother stakeholders with independent assurance on the quality of credit portfolios and adherence to our Audit Committee onagreed Credit Risk Appetite and Credit Policies and processes. In line with its procedures and regulatory expectations, the Credit Quality Assurance function undertakes a monthly basisprogram of portfolio testing, assessing and to the Boardreporting through four Risk Pillars of Asset Quality, Rating and executive management in the form of quarterly opinions.Data Integrity, Risk Management and Credit Risk Appetite.
Risk Appetite
Risk Appetiteappetite is a strategic business and risk management tool. We define our risk appetite as the maximum limit of acceptable risk beyond which we would either be unable to achieve our strategic objectives and capital adequacy obligations or would assume an unacceptable amount of risk to do so. The Board Risk Committee advises our Board of Directors in relation to current and potential future risk strategies, including determination of risk appetite and tolerance.
The principal non-market risks to which we are subject are: credit risk, operational risk, liquidity risk, strategic risk and reputational risk. We are also subject to market risks. Market risk refers to potential losses arising from changes in interest rates, foreign exchange rates, equity prices, commodity prices and/or other relevant market rates or prices. Market risk does not result from proprietary trading, which we prohibit. Rather, modestModest market risk arises from trading activities that serve customer needs, including hedging of interest rate and foreign exchange risk. As described below, more material market risk arises from our non-trading banking activities, such as loan origination and deposit gathering. We have established enterprise-wide policies and methodologies to identify, measure, monitor and report market risk. We actively manage both trading and non-trading market risks. We are also subject to liquidity risk, discussed under “—Liquidity.”
Our risk appetite framework and risk limit structure establishes guidelines to determine the balance between existing and desired levels of risk and supports the implementation, measurement and management of our risk appetite policy.appetite.
CITIZENS FINANCIAL GROUP, INC.
MANAGEMENT'SMANAGEMENT’S DISCUSSION AND ANALYSIS
Credit Risk
Overview
Credit risk represents the potential for loss arising from a customer, counterparty, or issuer failing to perform in accordance with the contractual terms of the obligation. While the majority of our credit risk is associated with lending activities, we do engage with other financial counterparties for a variety of purposes including investing, asset and liability management, and trading activities. Given the financial impact of credit risk on our earnings and balance sheet, the assessment, approval, and management of credit risk represents a major part of our overall risk-management responsibility.
Objective
The credit risk management organization is responsible for approving credit transactions, monitoring portfolio performance, identifying problem loans, and ensuring remedial management.
Organizational Structure
Management and oversight of credit risk is the responsibility of both the line of business and the second line of defense. The second line of defense, the independent Credit Risk Function, is led by the Chief Credit Officer (“CCO”) who oversees all of our credit risk. The CCO reports to the Chief Risk Officer. The CCO, acting in a manner consistent with Board policies, has responsibility for, among other things, the governance process around policies, procedures, risk acceptance criteria, credit risk appetite, limits, and authority delegation. The CCO and his team also have responsibility for credit approvals for larger or more risky transactions and oversight of line of business credit risk activities. Reporting to the CCO are the heads of the second line of defense credit functions specializing inin: Consumer Banking,Banking; Business Banking andBanking; Commercial Banking, as well as the head ofBanking; Citizens Restructuring Management.Management; Portfolio Analytics and Reporting; and Credit Policy and Administration. Each team under these leaders is comprisedcomposed of highly experienced credit professionals.
The credit risk teams operate independently from the business lines to ensure decisions are not influenced by unbalanced objectives. Each team is comprised of senior credit officers who possess extensive experience structuring and approving loans.
Governance
The primary mechanisms used to govern our credit risk function are our consumer and commercial credit policies. These policies outline the minimum acceptable lending standards that align with our desired risk appetite. Material issues or changes are identified by the individual committees and presented to the Combined Credit RiskPolicy Committee, Executive Risk Committee and the Board Risk Committee for approval as required.appropriate.
Key Management Processes
To ensure credit risks are managed within our risk appetite and business and risk strategies are achieved, we employ a comprehensive and integrated control program. The program’s objective is to proactively (1) identify, (2) measure, (3) monitor, and (4) mitigate existing and emerging credit risks across the credit lifecycle (origination, account management/portfolio management, and loss mitigation and recovery).
Consumer
On the consumer banking side of credit risk, our teams use models to evaluate consumer loans across the lifecycle of the loan. Starting at origination, credit scoring models are used to forecast the probability of default of an applicant. These models are embedded in the loan origination system, which allows for real-time scoring and automated decisions for many of our products. Periodic validations are performed on our purchased and proprietary scores to ensure fit for purpose. When approving customers for a new loan or extension of an existing credit line, credit scores are used in conjunction with other credit risk variables such as affordability, length of term, collateral value, collateral type, and lien subordination.
The origination process is supported by dedicated underwriting teams that reside in the business line. The size of each team depends on the intensity of the approval process as the number of handoffs, documentation, and verification requirements differ substantially depending on the loan product.
To ensure proper oversight of the underwriting teams, lending authority is granted by the second line of defense credit risk function to each underwriter. The amount of delegated authority depends on the experience of the individual. We periodically evaluate the performance of each underwriter and annually reauthorize their delegated authority. Only senior members of the second line of defense credit risk team are authorized to grantapprove significant exceptions to credit policies. It is not uncommon to make exceptions to established policies when compensating factors are present. These exceptionsThere are capped at 5% of origination volume and tracked separately to ensure performance expectations are achieved.exception limits which, when reached, trigger a comprehensive analysis.
CITIZENS FINANCIAL GROUP, INC.
MANAGEMENT’S DISCUSSION AND ANALYSIS
Once an account is established, credit scores and collateral values are refreshed at regular intervals to allow for proactive identification of increasing or decreasing levels of credit risk. For accounts with contingent liability (revolving feature), credit
CITIZENS FINANCIAL GROUP, INC.
MANAGEMENT'S DISCUSSION AND ANALYSIS
policies have been developed that leverage the refreshed customer data to determine if a credit line should be increased, decreased, frozen, or closed. Lastly, behavioral modeling, segmentation, and loan modifications are used to cure delinquency, reduce the severity of loss, and maximize recoveries. Our approach to managing credit risk is highly analytical and, where appropriate, is automated, to ensure consistency and efficiency.
One of the central tools used to manage credit risk is the Consumer and Small Business Credit Risk Dashboard. This dashboard is refreshed monthly and evaluates key dimensions of credit risk against defined control parameters, commonly referred to as inner and outer limits. Inner limits are designed to alert senior management of unfavorable trends with sufficient lead time to address and implement corrective actions before the risks increase in materiality. Outer limits represent the maximum risk tolerance, which if breached, would necessitate immediate escalation and corrective action. All limits are recalibrated annually and aligned with pro forma budget expectations and desired risk profile.
The credit risk team is constantly evaluating current and projected economic conditions, internal credit performance in relation to budget and predefined risk tolerances, and current and expected regulatory guidance to determine the optimal balance of expansion and contraction policies. All policy change proposals receive intense scrutiny and syndicationdiscussion prior to approval and implementation. This process ensures decisions are made based on profit basedrisk-based analytics with full considerationadherence to operational and regulatory risks.requirements.
Commercial
On the commercial banking side of credit risk, the structure is broken into Commercial & IndustrialC&I loans and leases and Commercial Real Estate.CRE. Within Commercial & IndustrialC&I there are separate verticals established for certain specialty products (e.g., asset-based lending, leasing, franchise finance, health care, technology, mid-corporate). A “specialty vertical” is a stand-alone team of industry or product specialists. Substantially all activity that falls under the ambit of the defined industry or product is managed through a specialty vertical when one exists. Commercial Real EstateCRE also operates as a specialty vertical.
Commercial credit risk management begins with defined credit products and policies. New credit products and material changes to existing credit products require multiple levels of review and approval. The initial level of review involves the engagement of risk disciplines from across the enterprise for a New Product Risk Assessment. This assessment process reviews the product description, strategic rationale and financial impact and considers the risk impact from multiple perspectives (Reputation, Operational, Regulatory, Market, Legal as well as Credit).
Commercial transactions are subject to individual analysis and approval at origination and, with few exceptions, are subject to a formal annual review requirement. The underwriting process includes the establishment and approval of Credit Grades that confirm the Probability of Default (“PD”) and Loss Given Default (“LGD”). Approval then requires both a business line approver and an independent Credit Approver.Approver with the requisite level of delegated authority. The approval level of a particular credit facility is determined by the size of the credit relationship as well as the PD with larger relationships and weaker PD’s requiring the approval of more senior individuals.PD. The checks and balances in the credit process and the independence of the credit approver function are designed to appropriately assess and sanction the level of credit risk being accepted, facilitate the early recognition of credit problems when they occur, and to provide for effective problem asset management and resolution. All authority to grant credit is delegated through the independent Credit Risk function and is closely monitored and regularly updated.
The primary factors considered in commercial credit approvals are the financial strength of the borrower, assessment of the borrower’s management capabilities, cash flows from operations, industry sector trends, type and sufficiency of collateral, type of exposure, transaction structure, and the general economic outlook. While these are the primary factors considered, there are a number of other factors that may be considered in the decision process. In addition to the credit analysis conducted during the approval process at origination and annual review, our Credit Quality Assurance group performs testing to provide an independent review and assessment of the quality of the portfolio and new originations. This group conducts portfolio reviews on a risk-based cycle to evaluate individual loans, validate risk ratings, as well as test the consistency of the credit processes.processes and the effectiveness of credit risk management.
The maximum level of credit exposure to individual credit borrowers is limited by policy guidelines based on the perceived risk of each borrower or related group of borrowers. Concentration risk is managed through limits on industry (sector), loan type (asset class), and loan quality factors. We focus predominantly on extending credit to commercial customers with existing or expandable relationships within our primary banking markets (for this purpose defined as our 11 state footprint plus contiguous states), although we will considerdo engage in lending opportunities outside our primary markets if we believe that the associated risks are acceptable and aligned with strategic initiatives. Geographic considerations occur at both the transactional level as well as the product level, as certain specialties operate on a national basis.
Our management of risk concentrations includes the establishment of sector and asset class limits. We have identified 32 sectors and established limits for 16 that we have deemed meaningful by virtue of size or inherent risk. These sector limits are reviewed and approved annually. Exposure against these limits is tracked on a monthly basis. The two largest sector concentrations are Industrials and CRE.
Apart from Industrials and CRE (which together make up 29%30% of the commercial utilizationoutstandings as of December 31, 2014)2015), we do not have any majorthere are no material sector concentrations. As of December 31, 2015, our CRE outstandings amounted to 9% of total loans and leases. The Industrial sector includes basic commercial and industrial (“C&I”)&I lending
CITIZENS FINANCIAL GROUP, INC.
MANAGEMENT'S DISCUSSION AND ANALYSIS
focused on general manufacturing. The sector is diversified and not managed as a specialized vertical. Our customers are local to our market and present no significant concentration. We have a smaller concentration in CRE than our peer banks based on industry data obtained from SNL Financial. As of September 30, 2014, our CRE outstandings amounted to 11% of total outstanding loans. According to SNL Financial, the corresponding ratio for peer banks was 18%.
Our credit grading system considers many components that directly correlate to loan quality and likelihood of repayment. Our assessment of a borrower’s credit strength is reflected in our risk ratings for such loans, which are also an integral component of our allowance for loan and lease lossesALLL methodology. When deterioration in credit strength is noted, a loan becomes subject to Watch Review. The Watch Review process involves senior representatives from the business line portfolio management team, the independent Credit Risk team, and our Citizens Restructuring Management group. As appropriate and consistent with regulatory definitions, the credit may be subject to classification as either Criticized or Classified, which would also trigger a credit rating downgrade. As such, the loan and relationship would be subject to more frequent review.
CITIZENS FINANCIAL GROUP, INC.
MANAGEMENT’S DISCUSSION AND ANALYSIS
Substantially all loans categorized as Classified are managed by Citizens Restructuring Management. Citizens Restructuring Management, is a specialized group of credit professionals that handles the day-to-day management of workouts, commercial recoveries, and problem loan sales. Its responsibilities include developing and implementing action plans, assessing risk ratings, determining the appropriateness of specific reserves relating to the loan, accrual status of the loan, and the ultimate collectability of loans in their portfolio.
Market Risk
Market risk refers to potential losses arising from changes in interest rates, foreign exchange rates, equity prices, commodity prices and/or other relevant market rates or prices. Market risk does not result from proprietary trading, which we prohibit. Rather, modestModest market risk arises from trading activities that serve customer needs, including hedging of interest rate and foreign exchange risk. As described below, more material market risk arises from our non-trading banking activities, such as loan origination and deposit-gathering. We have established enterprise-wide policies and methodologies to identify, measure, monitor and report market risk. We actively manage both trading and non-trading market risks.
Non-Trading Risk
We are exposed to market risk as a result of non-trading banking activities. This market risk is comprisedcomposed entirely of interest rate risk, as we have no direct currency equity or commodity risk and de minimis equity risk. This interest rate risk emerges from the balance sheet after the aggregation of our assets, liabilities and equity. We refer to this non-trading risk embedded in the balance sheet as “structural interest rate risk” or “interest rate risk in the banking book.” Our mortgage servicing rights assets also contain interest rate risk as the value of the fee stream is impacted by the level of long-term interest rates.
A major source of structural interest rate risk is a difference in the repricing of assets, on the one hand, and liabilities and equity, on the other. First, there are differences in the timing of rate changes reflecting the maturity and/or repricing of assets and liabilities. For example, the rate earned on a residential mortgage may be fixed for 30 years; the rate paid on a certificate of deposit may be fixed only for a few months. Due to these timing differences, net interest income is sensitive to changes in the level and shape of the yield curve. Second, there are differences in the drivers of rate changes of various assets and liabilities. For example, commercial loans may reprice based on one-month LIBOR or prime; the rate paid on retail money market demand accounts may be only loosely correlated with LIBOR and depend on competitive demand for funds. Due to these basis differences, net interest income is sensitive to changes in spreads between certain indices or repricing rates.
Another important source of structural interest rate risk relates to the potential exercise of explicit or embedded options. For example, most consumer loans can be prepaid without penalty; and most consumer deposits can be withdrawn without penalty. The exercise of such options by customers can exacerbate the timing differences discussed above.
A primary source of our structural interest rate risk relates to faster repricing of floating rate loans relative to the retail deposit funding. This source of asset sensitivity is concentrated at the short end of the yield curve. GivenFor the very low level of short-term interest rates,past seven years with the Federal Funds rate near zero, this risk ishas been asymmetrical with significantly more upside benefit than potential exposure. As rates have lifted from near zero given the FOMC’s December 2015 rate hike, exposure to declining rates has increased. The secondary source of our interest rate risk is driven by longer term rates comprising the rollover or reinvestment risk on fixed rate loans as well as the prepayment risk on mortgage related loans and securities funded by non-rate sensitive deposits and equity.
The primary goal of interest rate risk management is to control exposure to interest rate risk within policy limits approved by the Board. These limits and guidelines reflect our tolerance for interest rate risk over both short-term and long-term horizons. To ensure that exposure to interest rate risk is managed within this risk appetite, we must both measure the exposure and, as
CITIZENS FINANCIAL GROUP, INC.
MANAGEMENT'S DISCUSSION AND ANALYSIS
necessary, hedge it. The Treasury Asset and Liability Management team is responsible for measuring, monitoring and reporting on the structural interest rate risk position. These exposures are reported on a monthly basis to the Asset and Liability Committee (ALCO) and at Board meetings.
We measure structural interest rate risk through a variety of metrics intended to quantify both short-term and long-term exposures. The primary method that we use to quantify interest rate risk is simulation analysis in which we model net interest income from assets, liabilities and hedge derivative positions under various interest rate scenarios over a three-year horizon. Exposure to interest rate risk is reflected in the variation of forecasted net interest income across scenarios.
Key assumptions in this simulation analysis relate to the behavior of interest rates and spreads, the changes in product balances and the behavior of loan and deposit clients in different rate environments. The most material of these behavioral assumptions relate to the repricing characteristics and balance fluctuations of deposits with indeterminate (i.e., non-contractual) maturities as well as the pace of mortgage prepayments. Assessments are periodically made by running sensitivity analysis of the impact of key assumptions. The results of these analyses are reported to ALCO.
As the future path of interest rates cannot be known in advance, we use simulation analysis to project net interest income under various interest rate scenarios including a “most likely” (implied forward) scenario as well as a variety of deliberately extreme and perhaps unlikely scenarios. These scenarios may assume gradual ramping of the overall level of interest rates, immediate shocks to the level of rates and various yield curve twists in which movements in short- or long-term rates predominate. Generally,
CITIZENS FINANCIAL GROUP, INC.
MANAGEMENT’S DISCUSSION AND ANALYSIS
projected net interest income in any interest rate scenariosscenario is compared to net interest income in a base case where market forward rates are realized.
The table below reports net interest income exposures against a variety of interest rate scenarios. Exposures are measured as a percentage change in net interest income over the next year due to either instantaneous, or gradual parallel +/- 200 basis point moves in benchmark interest rates. The net interest income simulation analyses do not include possible future actions that management might undertake to mitigate this risk. The current limit is an adverse changea decrease in net interest income of 10% related to an instantaneous +/- 200 basis point move. As the table illustrates, our balance sheet is asset-sensitive: net interest income would benefit from an increase in interest rates. Exposure to a decline in interest rates is well within limit. It should be noted that the magnitude of any possible decline in interest rates is constrained by the low absolute starting levels of rates. While an instantaneous and severe shift in interest rates was used in this analysis, we believe that any actual shift in interest rates would likely be more gradual and would therefore have a more modest impact.
The table below summarizes our positioning in various parallel yield curve shifts:
| | | | | | | Estimated % Change in Net Interest Income over 12 Months |
| | Estimated % Change in Net Interest Income over 12 Months | December 31, |
| Basis points | Tolerance Level | | December 31, 2014 | | December 31, 2013 | 2015 |
| | 2014 |
|
| Instantaneous Change in Interest Rates | | | | | | | | |
| +200 | (10%) | | 13.4% | | 16.1% | 10.6 | % | | 13.4 | % |
| +100 | | | 7.0 | | 8.0 | 5.8 |
| | 7.0 |
|
| -100 | | | (3.8) | | (3.7) | (5.8 | ) | | (3.8 | ) |
| -200 | (10) | | (4.3) | | (5.7) | (6.4 | ) | | (4.3 | ) |
| Gradual Change in Interest Rates | | | | | | |
|
| +200 | | | 6.8 | | 6.8 | 6.1 |
| | 6.8 |
|
| +100 | | | 3.5 | | 3.2 | 3.2 |
| | 3.5 |
|
| -100 | | | (2.3) | | (2.0) | (3.1 | ) | | (2.3 | ) |
| -200 | | | (3.0) | | (3.0) | (4.6 | ) | | (3.0 | ) |
As part of the routine risk management process, a wide variety of similar analysesanalysis are reported for each of the next three rolling years.
As recommended by bank regulators, CBPAWe also usesuse a valuation measure of exposure to structural interest rate risk, Economic Value of Equity (“EVE”), as a supplement to net interest income simulations. Nevertheless, multi-yearEVE complements net interest income simulation analysis as it estimates risk exposure over a long-term horizon. EVE measures the extent to which the economic value of assets, liabilities and off-balance sheet instruments may change in response to fluctuation in interest rates. This analysis is the main tool for managing structuralhighly dependent upon assumptions applied to assets and liabilities with non-contractual maturities. The change in value is expressed as a percentage of regulatory capital. The current risk limit is set at a decrease of 20% of regulatory capital given an instantaneous +/- 200 basis point change in interest rate risk.
CITIZENS FINANCIAL GROUP, INC.rates. We are operating within that limit as of December 31, 2015.
MANAGEMENT'S DISCUSSION AND ANALYSIS
As noted, the balance sheet is asset-sensitive,We are asset sensitive and as such are positioned to benefit from an increase in interest rates. The magnitudeWe have consistently maintained the level of this asset-sensitivity has been reduced from more elevated levels atoverall asset sensitivity in a tight range of 6.1% to 7.2% over the end of 2012 and early 2013. At that time,past year, as defined by the extremely low levels of medium- to long-term interest rates presented a poor risk-to-reward trade-off for transactions that would add asset duration. As a result, the investment portfolio was reduced in size, increasing asset-sensitivity. Subsequently, intermediate- and long-term interest rates have risen and we resumed portfolio investment, moderating the aggregate asset-sensitivity of the balance sheet.+200 gradual change.
We also had market risk associated with the value of the mortgage servicing right assets, which are impacted by the level of interest rates. As of December 31, 20142015 and December 31, 2013,2014, our mortgage servicing rights had a book value of $166$164 million and $185$166 million, respectively, and were carried at the lower of cost or fair value. As of December 31, 2014,2015, and December 31, 2013,2014, the fair value of the mortgage servicing rights was $179$178 million and $195$179 million, respectively. Given low interest rates over recent years, there is a valuation allowance of $18$9 million and $23$18 million on the asset as of December 31, 20142015 and December 31, 2013,2014, respectively. Depending on the interest rate environment, hedges may be used to stabilize the market value of the mortgage servicing right asset.
Trading Risk
We are exposed to market risk primarily through client facilitation activities including derivatives and foreign exchange products. Exposure is created as a result of the impliedchanges in interest rates and related basis spreads and volatility, foreign exchange rates, and credit spreads ofon a select range of interest rates, foreign exchange rates and secondary loans.loans instruments. These trading activities are conducted through our two banking subsidiaries, CBNA and CBPA.
CITIZENS FINANCIAL GROUP, INC.
MANAGEMENT’S DISCUSSION AND ANALYSIS
Client facilitation activities consist primarily of interest rate derivatives and foreign exchange contracts where we enter into offsetting trades with a separate counterparty or exchange to manage our exposure to the customer. Historically, the majority of these offsetting trades have been with RBS.market risk exposure. We will occasionally execute hedges against the spread that exists across the client facing trade and its offset in the market to maintain a low risk profile. In 2014,addition to the aforementioned activities, we commencedoperate a secondary loan trading desk with the objective to meet secondary liquidity needs of our issuing clients’ transactions and investor clients. We do not engage in any proprietary trading activities with the intent to benefit from short term price differences between financial instruments and markets.differences.
We record interest rate derivatives and foreign exchange contracts as derivative assets and liabilities on our Consolidated Balance Sheets. Trading assets and liabilities are carried at fair value with income earned related to these activities included in net interest income. Changes in fair value of trading assets and liabilities are reflected in other income, a component of noninterest income on the Consolidated Statements of Operations.
Market Risk Governance
Our market risk framework currently leverages RBSGRBS technology platform to aggregate, measure and monitor exposure against market risk limits. As part of our separation from RBS, Group, we have entered into a Transitional Services Agreement pursuant to which RBSGRBS will continue to provide us with all necessary Value-at-Risk (“VaR”)VaR and other risk measurements required for regulatory reporting related to interest rate derivatives and foreign exchange trading activities, as well as internal market risk reporting and general consultative services related to our market risk framework until the end of the Transitional Services Agreement. During the term of the Transitional Services Agreement, we intend to buildare building out our own market risk organization and framework in order to gradually migrate away from reliance on services provided by RBSG. As part of this process, we hired a new head of market risk management to begin building out our stand-alone capabilities with respect to market risk management.RBS.
Given the low level of traded market risk, and substantial market risk expertise at our parent, we have received the support of our U.S. banking regulators for relying on RBS Group’sRBS’ market risk expertise.technology platform. In managing our market risk, dealing authorities represent a key control in the management of market risk by setting the scope within which the business is permitted to operate. Dealing authorities are established jointly by designated senior business line and senior risk manager, and are reviewed at least annually. Dealing authorities are structured to accommodate the client facing trades, market offset trades and sets of hedges needed to maintain a low risk profile. Primary responsibility for keeping within established tolerances resides with the business. Key risk indicators, including a combined VaR for interest rate and foreign exchange rate risk, are monitored on a daily basis and reported against tolerances consistent with our risk appetite and business strategy to relevant business line management and risk counterparts.
Market Risk Measurement
We use VaR metrics, complemented with sensitivity analysis, market value and stress testing in measuring market risk. During the term of the Transition Services Agreement, we will continue to leverage RBSGRBS market risk measurement models for our foreign exchange and interest rate products, which are described further below, that capture correlation effects and allow for
CITIZENS FINANCIAL GROUP, INC.
MANAGEMENT'S DISCUSSION AND ANALYSIS
aggregation of market risk across risk types, business lines and legal entities. We measure and monitor market risk for both management and regulatory capital purposes.
Value-at-Risk Overview
RBSGThe market risk measurement model is based on historical simulation. The VaR measure estimates the extent of any fair value losses on trading positions that may occur due to broad market movements (General VaR) such as changes in the level of interest rates, foreign exchange rates, equity prices and commodity prices. It is calculated on the basis that current positions remain broadly unaltered over the course of a given holding period. It is assumed that markets are sufficiently liquid to allow the business to close its positions, if required, within this holding period. VaR’s benefit is that it captures the historic correlations of a portfolio. Based on the composition of our “covered positions,” we also use a standardized add-on approach for the loan trading desk’s Specific Risk capital which estimates the extent of any losses that may occur from factors other than broad market movements. In addition, for our secondary traded loans we calculate the VaR on the general interest rate risk embedded within the loans using a standalone model that replicates RBS GroupThe general VaR methodology (the related capital is reflected on the “de minimis” line in the following section). RBSGThe General VaR approach is expressed in terms of a confidence level over the past 500 trading days. The internalVaRinternal VaR measure (used as the basis of the main VaR trading limits) is a 99% confidence level with a one day holding period, meaning that a loss greater than the VaR is expected to occur, on average, on only one day in 100 trading days (i.e., 1% of the time). Theoretically, there should be a loss event greater than VaR two to three times per year. The regulatory measure of VaR is done at a 99% confidence level with a 10-day holding period. The historical market data applied to calculate the VaR is updated on a 10 business day lag. Refer to “Market Risk Regulatory Capital” below for details of our 10-day VaR metrics for the quarters ended December 31, 20142015 and December 31, 2013,2014, including high, low, average and period end Value-at-Risk for interest rate and foreign exchange rate risks, as well as total VaR. We began measuring the high, low, and average Value-at-Risk for interest rate and foreign exchange currency rate risk during the fourth quarter of 2013, in conjunction with incorporating trade-level detail for foreign exchange risk in our market risk measurement models. Prior to that time, VaR for foreign exchange exposure was calculated using a manual process that did not capture potential interest rate risk from any forward transactions.
Market Risk Regulatory Capital
Effective January 1, 2013, the U.S. banking regulators adopted “Risk-Based Capital Guidelines: Market Risk” as the regulations covering the calculation of market risk capital (the “Market Risk Rule”). The Market Risk Rule, commonly known as
CITIZENS FINANCIAL GROUP, INC.
MANAGEMENT’S DISCUSSION AND ANALYSIS
Basel 2.5, substantially modified the determination of market risk-weighted assets and implemented a more risk sensitive methodology for the risk inherent in certain trading positions categorized as “covered positions.” For the purposes of the market risk rule, all of our client facing trades, market offset trades and sets of hedges needed to maintain a low risk profile to qualify as “covered positions.” The internal VaR measure is calculated based on the same population of trades that is utilized for regulatory VaR. The following table shows the results of our modeled and non-modeled measures for regulatory capital calculations:
| | | (in millions) | | For the Quarter Ended December 31, 2014 | | For the Quarter Ended December 31, 2013 | | For the Quarter Ended December 31, 2015 | | For the Quarter Ended December 31, 2014 |
Market Risk Category | | Period End | | Average | | High | | Low | | Period End | | Average | | High | | Low | | Period End | | Average | | High | | Low | | Period End | | Average | | High | | Low |
| Interest Rate | |
| $— |
| |
| $— |
| |
| $— |
| |
| $— |
| |
| $1 |
| |
| $— |
| |
| $1 |
| |
| $— |
| |
| $— |
| |
| $— |
| |
| $— |
| |
| $— |
| |
| $— |
| |
| $— |
| |
| $— |
| |
| $— |
|
| Foreign Exchange Currency Rate | | — |
| | — |
| | 1 |
| | — |
| | — |
| | 1 |
| | 3 |
| | — |
| | — |
| | — |
| | — |
| | — |
| | — |
| | — |
| | 1 |
| | — |
|
| Diversification Benefit | | — |
| | — |
| | NM(1) |
| | NM(1) |
| | — |
| | — |
| | NM(1) |
| | NM(1) |
| | — |
| | — |
| | NM(1) |
| | NM(1) |
| | — |
| | — |
| | NM(1) |
| | NM(1) |
|
| General VaR | | — |
| | — |
| | 1 |
| | — |
| | 1 |
| | 1 |
| | 3 |
| | — |
| | — |
| | — |
| | — |
| | — |
| | — |
| | — |
| | 1 |
| | — |
|
| Specific Risk VaR | | — |
| | — |
| | — |
| | — |
| | — |
| | — |
| | — |
| | — |
| | — |
| | — |
| | — |
| | — |
| | — |
| | — |
| | — |
| | — |
|
| Total VaR | |
| $— |
| |
| $— |
| |
| $1 |
| |
| $— |
| |
| $1 |
| |
| $1 |
| |
| $3 |
| |
| $— |
| |
| $— |
| |
| $— |
| |
| $— |
| |
| $— |
| |
| $— |
| |
| $— |
| |
| $1 |
| |
| $— |
|
| Stressed General VaR | |
| $2 |
| |
| $2 |
| |
| $3 |
| |
| $1 |
| |
| $2 |
| |
| $3 |
| |
| $7 |
| |
| $— |
| |
| $2 |
| |
| $2 |
| |
| $2 |
| |
| $1 |
| |
| $2 |
| |
| $2 |
| |
| $3 |
| |
| $1 |
|
| Stressed Specific Risk VaR | | — |
| | — |
| | — |
| | — |
| | — |
| | — |
| | — |
| | — |
| | — |
| | — |
| | — |
| | — |
| | — |
| | — |
| | — |
| | — |
|
| Total Stressed VaR | |
| $2 |
| |
| $2 |
| |
| $3 |
| |
| $1 |
| |
| $2 |
| |
| $3 |
| |
| $7 |
| |
| $— |
| |
| $2 |
| |
| $2 |
| |
| $2 |
| |
| $1 |
| |
| $2 |
| |
| $2 |
| |
| $3 |
| |
| $1 |
|
| CFG Market Risk Regulatory Capital | |
| $6 |
| | |
| | |
| | |
| |
| $12 |
| | | | | | | |
| CFG Specific Risk Not Modeled Add-on | | 3 |
| | | | | | | | — |
| | | | | | | |
| CFG de Minimis Exposure Add-on | | 6 |
| | | | | | | | — |
| | | | | | | |
| CFG Total Market Risk Regulatory Capital | |
| $15 |
| | | | | | | |
| $12 |
| | | | | | | |
| CFG Market Risk-Weighted Assets | |
| $191 |
| | |
| | |
| | |
| |
| $146 |
| | | | | | | |
| Market Risk Regulatory Capital | | |
| $7 |
| | |
| | |
| | |
| |
| $6 |
| | | | | | |
| Specific Risk Not Modeled Add-on | | | 5 |
| | | | | | | | 3 |
| | | | | | |
| de Minimis Exposure Add-on | | | 15 |
| | | | | | | | 6 |
| | | | | | |
| Total Market Risk Regulatory Capital | | |
| $27 |
| | | | | | | |
| $15 |
| | | | | | |
| Market Risk-Weighted Assets | | |
| $333 |
| | |
| | |
| | |
| |
| $191 |
| | | | | | |
(1) The high and low for the portfolio may have occurred on different trading days than the high and low for the components. Therefore, there is no diversification benefit shown for the high and low columns.
CITIZENS FINANCIAL GROUP, INC.
MANAGEMENT'S DISCUSSION AND ANALYSIS
StressStressed VaR
Stress VaR (“SVaR”)SVaR is an extension of VaR, but uses a longer historical look back horizon that is fixed from January 1,3, 2005. This is done not only to identify headline risks from more volatile periods, but also to provide a counter balance to VaR which may be low during periods of low volatility. The holding period for profit and loss determination is 10 days. SVaR is also a component of market risk regulatory capital. SVaR for us is calculated under its own dynamic window regime as compared to RBSG’sRBS’ static SVaR window. In a dynamic window regime, values of the 10-day, 99% VaR are calculated over all possible 260-day periods that can be obtained from the complete historical data set. Refer to “Market Risk Regulatory Capital” above for details of SVaR metrics, including high, low, average and period end SVaR for the combined portfolio. We began measuring the high, low, and average SVaR for our combined portfolio during the fourth quarter of 2013 in conjunction with the incorporation of trade-level detail for foreign exchange risk, in our market risk measurement models. Prior to that time, our SVaR measure did not include foreign exchange risk given low levels of materiality.
Sensitivity Analysis
Sensitivity analysis is the measure of exposure to a single risk factor, such as a one basis point change in rates or credit spread. We conduct and monitor sensitivity on interest rates, basis spreads, foreign exchange exposures and option prices. Whereas VaR is based on previous moves in market risk factors over recent periods, it may not be an accurate predictor of future market moves. Sensitivity analysis complements VaR as it provides an indication of risk relative to each factor irrespective of historical market moves and is an effective tool in evaluating the appropriateness of hedging strategies.
Stress Testing
Conducting a stress test of a portfolio consists of running risk models with the inclusion of key variables that simulate various historical or hypothetical scenarios. For historical stress tests, profit and loss results are simulated for selected time periods corresponding to the most volatile underlying returns while hypothetical stress tests aim to consider concentration risk, illiquidity under stressed market conditions and risk arising from the bank’s trading activities that may not be fully captured by its other models. Hypothetical scenarios also assume that the market moves happen simultaneously and that no repositioning or hedging activity takes place to mitigate losses as events unfold. We generate stress tests of our trading positions on a regular basis. For example, we currently include a stress test that simulates a Lehman-type crisis scenario by taking the worst 10-day peak to trough moves for the various risk factors that go into VaR from that period, and assumingassumes they occurred simultaneously.
VaR Model Review and Validation
Market risk measurement models used are independently reviewed. RBSGThe models, used under the Transitional Services Agreement, are subject to ongoing and independent review and validation that focuses on the model methodology. Independent
CITIZENS FINANCIAL GROUP, INC.
MANAGEMENT’S DISCUSSION AND ANALYSIS
review of market risk measurement models is the responsibility of RBS Group Risk Analytics (“GRA”).Analytics. Aspects covered include challenging the assumptions used, the quantitative techniques employed and the theoretical justification underpinning them, and an assessment of the soundness of the required data over time. Where possible, the quantitative impact of the major underlying modeling assumptions will be estimated (e.g., through developing alternative models). Results of such reviews are shared with U.S. regulators. For the term of the Transitional Services Agreement, we and RBSGRBS expect to utilize the same independently validated VaR model for both management and regulatory reporting purposes. RBS market risk teams, including those providing consultative services to us under the Transitional Services Agreement, will conduct internal validation before a new or changed model element is implemented and before a change is made to a market data mapping. For example, RBS market risk teams also perform regular reviews of key risk factors that are used in the market risk measurement models to produce profit and loss vectors used in the VaR calculations. These internal validations are subject to independent re-validation by GroupRBS Risk Analytics and, depending on the results of the impact assessment, notification to the appropriate regulatory authorities for RBSGRBS and us may be required.
CITIZENS FINANCIAL GROUP, INC.
MANAGEMENT'S DISCUSSION AND ANALYSIS
VaR Backtesting
Backtesting is one form of validation of the VaR model. The Market Risk Rule requires a comparison of our internal VaR measure to the actual net trading revenue (excluding fees, commissions, reserves, intra-day trading and net interest income) for each day over the preceding year (the most recent 250 business days). Any observed loss in excess of the VaR number is taken as an exception. The level of exceptions determines the multiplication factor used to derive the VaR and SVaR-based capital requirement for regulatory reporting purposes. We perform sub-portfolio backtesting as required under the Market Risk Rule, and as approved by our banking regulators, for interest rate and foreign exchange positions. The following table shows our daily net trading revenue and total internal, modeled VaR for the quarters endingended December 31, 2014,2015, September 30, 2014,2015, June 30, 20142015 and March 31, 2014. We continue to utilize2015. Beginning in the quarter ended September 30, 2015, as agreed with our banking regulators, we use a multiplication factor derived from RBSour specific backtesting results as agreed with our banking regulators. In the following table, the March 11, 2014 VaR spikeand no longer that of $588 thousand is primarily due to a timing issue on the reflection of one foreign currency time deposit maturity into our demand deposit account in our market risk feed.RBS.
Daily VaR Backtesting: Sub-portfolio Level Backtesting 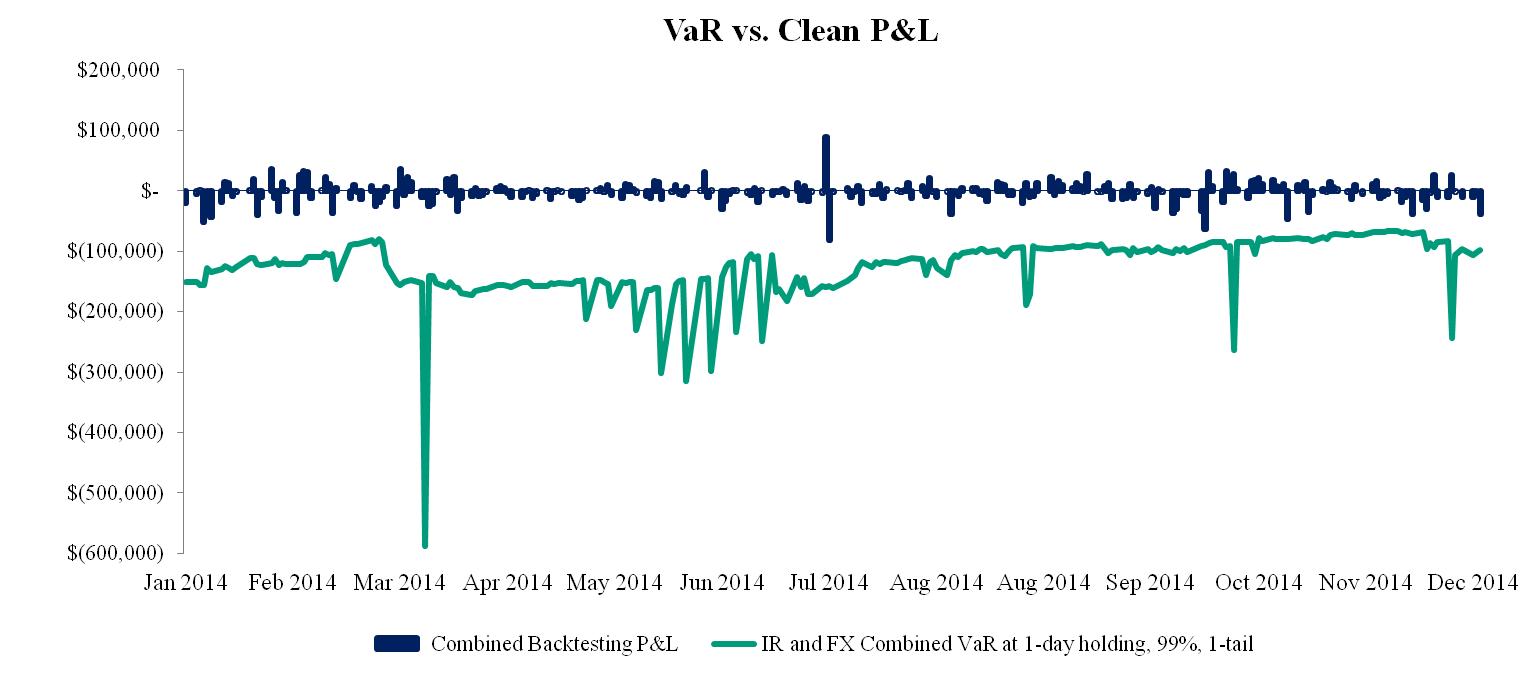
CITIZENS FINANCIAL GROUP, INC.
SELECTED STATISTICAL INFORMATION
Selected Statistical Information
The accompanying supplemental information should be read in conjunction with Part II, Item 6 — Selected Financial Data and Part II, Item 8 — Financial Statements and Supplementary Data, included elsewhere in this report.
Distribution of Assets, Liabilities and Stockholders'Stockholders’ Equity; Interest Rates and Interest Differential
The following table provides a summary of our consolidated average balances including major categories of interest earning assets and interest bearing liabilities:
|
| | | | | | | | | | | | | | | | | | | | | | | | | | |
| | Year Ended December 31, |
| | 2014 | | 2013 | | 2012 |
| (dollars in millions) | Average Balances | Income/ Expense | Yields/ Rates | | Average Balances | Income/ Expense | Yields/ Rates | | Average Balances | Income/ Expense | Yields/ Rates |
| Assets | | | | | | | | | | | |
| Interest-bearing cash and due from banks and deposits in banks |
| $2,113 |
|
| $5 |
| 0.22 | % | |
| $2,278 |
|
| $11 |
| 0.46 | % | |
| $1,562 |
|
| $4 |
| 0.46 | % |
| Taxable investment securities | 24,319 |
| 619 |
| 2.55 |
| | 19,062 |
| 477 |
| 2.50 |
| | 22,030 |
| 618 |
| 2.79 |
|
| Non-taxable investment securities | 11 |
| — |
| 2.60 |
| | 12 |
| — |
| 2.66 |
| | 40 |
| 2 |
| 4.32 |
|
| Total investment securities | 24,330 |
| 619 |
| 2.55 |
| | 19,074 |
| 477 |
| 2.50 |
| | 22,070 |
| 620 |
| 2.79 |
|
| Commercial | 29,993 |
| 900 |
| 2.96 |
| | 28,654 |
| 900 |
| 3.10 |
| | 27,273 |
| 849 |
| 3.07 |
|
| Commercial real estate | 7,158 |
| 183 |
| 2.52 |
| | 6,568 |
| 178 |
| 2.67 |
| | 7,063 |
| 196 |
| 2.72 |
|
| Leases | 3,776 |
| 103 |
| 2.73 |
| | 3,463 |
| 105 |
| 3.05 |
| | 3,216 |
| 112 |
| 3.48 |
|
| Total commercial | 40,927 |
| 1,186 |
| 2.86 |
| | 38,685 |
| 1,183 |
| 3.02 |
| | 37,552 |
| 1,157 |
| 3.04 |
|
| Residential mortgages | 10,729 |
| 425 |
| 3.96 |
| | 9,104 |
| 360 |
| 3.96 |
| | 9,551 |
| 413 |
| 4.32 |
|
| Home equity loans | 3,877 |
| 205 |
| 5.29 |
| | 4,606 |
| 246 |
| 5.35 |
| | 5,932 |
| 332 |
| 5.57 |
|
| Home equity lines of credit | 15,552 |
| 450 |
| 2.89 |
| | 16,337 |
| 463 |
| 2.83 |
| | 16,783 |
| 470 |
| 2.79 |
|
Home equity loans serviced by others (1) | 1,352 |
| 91 |
| 6.75 |
| | 1,724 |
| 115 |
| 6.65 |
| | 2,244 |
| 149 |
| 6.63 |
|
Home equity lines of credit serviced by others (1) | 609 |
| 16 |
| 2.68 |
| | 768 |
| 22 |
| 2.88 |
| | 962 |
| 27 |
| 2.80 |
|
| Automobile | 11,011 |
| 282 |
| 2.57 |
| | 8,857 |
| 235 |
| 2.65 |
| | 8,276 |
| 273 |
| 3.30 |
|
| Student | 2,148 |
| 102 |
| 4.74 |
| | 2,202 |
| 95 |
| 4.30 |
| | 2,240 |
| 91 |
| 4.06 |
|
| Credit cards | 1,651 |
| 167 |
| 10.14 |
| | 1,669 |
| 175 |
| 10.46 |
| | 1,634 |
| 166 |
| 10.15 |
|
| Other retail | 1,186 |
| 88 |
| 7.43 |
| | 1,453 |
| 107 |
| 7.36 |
| | 1,800 |
| 127 |
| 7.03 |
|
| Total retail | 48,115 |
| 1,826 |
| 3.80 |
| | 46,720 |
| 1,818 |
| 3.89 |
| | 49,422 |
| 2,048 |
| 4.14 |
|
Total loans and leases (2) | 89,042 |
| 3,012 |
| 3.37 |
| | 85,405 |
| 3,001 |
| 3.50 |
| | 86,974 |
| 3,205 |
| 3.67 |
|
| Loans held for sale | 163 |
| 5 |
| 3.10 |
| | 392 |
| 12 |
| 3.07 |
| | 538 |
| 17 |
| 3.10 |
|
| Other loans held for sale | 539 |
| 23 |
| 4.17 |
| | — |
| — |
| — |
| | — |
| — |
| — |
|
| Interest-earning assets | 116,187 |
| 3,664 |
| 3.14 |
| | 107,149 |
| 3,501 |
| 3.25 |
| | 111,144 |
| 3,846 |
| 3.45 |
|
| Allowance for loan and lease losses | (1,230 | ) | | | | (1,219 | ) | | | | (1,506 | ) | | |
| Goodwill | 6,876 |
| | | | 9,063 |
| | | | 11,311 |
| | |
| Other noninterest-earning assets | 5,791 |
| | | | 5,873 |
| | | | 6,717 |
| | |
| Total noninterest-earning assets | 11,437 |
| | | | 13,717 |
| | | | 16,522 |
| | |
| Total assets |
| $127,624 |
| | | |
| $120,866 |
| | | |
| $127,666 |
| | |
| Liabilities and Stockholders' Equity | | | | | | | | | | | |
| Checking with interest |
| $14,507 |
|
| $12 |
| 0.08 | % | |
| $14,096 |
|
| $8 |
| 0.06 | % | |
| $13,522 |
|
| $10 |
| 0.08 | % |
| Money market and savings | 39,579 |
| 77 |
| 0.19 |
| | 42,575 |
| 105 |
| 0.25 |
| | 41,249 |
| 121 |
| 0.29 |
|
| Term deposits | 10,317 |
| 67 |
| 0.65 |
| | 11,266 |
| 103 |
| 0.91 |
| | 13,534 |
| 244 |
| 1.80 |
|
| Total interest-bearing deposits | 64,403 |
| 156 |
| 0.24 |
| | 67,937 |
| 216 |
| 0.32 |
| | 68,305 |
| 375 |
| 0.55 |
|
| Interest-bearing deposits held for sale | 1,960 |
| 4 |
| 0.22 |
| | — |
| — |
| — |
| | — |
| — |
| — |
|
CITIZENS FINANCIAL GROUP, INC.
SELECTED STATISTICAL INFORMATION
|
| | | | | | | | | | | | | | | | | | | | | | | | | | |
Federal funds purchased and securities sold under agreements to repurchase (3) | 5,699 |
| 32 |
| 0.55 |
| | 2,400 |
| 192 |
| 7.89 |
| | 2,716 |
| 119 |
| 4.31 |
|
| Other short-term borrowed funds | 5,640 |
| 89 |
| 1.56 |
| | 251 |
| 4 |
| 1.64 |
| | 3,026 |
| 101 |
| 3.27 |
|
| Long-term borrowed funds | 1,907 |
| 82 |
| 4.25 |
| | 778 |
| 31 |
| 3.93 |
| | 1,976 |
| 24 |
| 1.20 |
|
| Total borrowed funds | 13,246 |
| 203 |
| 1.51 |
| | 3,429 |
| 227 |
| 6.53 |
| | 7,718 |
| 244 |
| 3.11 |
|
| Total interest-bearing liabilities | 79,609 |
| 363 |
| 0.45 |
| | 71,366 |
| 443 |
| 0.61 |
| | 76,023 |
| 619 |
| 0.80 |
|
| Demand deposits | 25,739 |
| | | | 25,399 |
| | | | 25,053 |
| | |
| Demand deposits held for sale | 462 |
| | | | — |
| | | | — |
| | |
| Other liabilities | 2,415 |
| | | | 2,267 |
| | | | 2,652 |
| | |
| Total liabilities | 108,225 |
| | | | 99,032 |
| | | | 103,728 |
| | |
| Stockholders' equity | 19,399 |
| | | | 21,834 |
| | | | 23,938 |
| | |
| Total liabilities and stockholders' equity |
| $127,624 |
| | | |
| $120,866 |
| | | |
| $127,666 |
| | |
| Interest rate spread | | | 2.69 |
| | | | 2.64 |
| | | | 2.65 |
|
| Net interest income | |
| $3,301 |
| | | |
| $3,058 |
| | | |
| $3,227 |
| |
| Net interest margin | | | 2.83 | % | | | | 2.85 | % | | | | 2.89 | % |
|
| | | | | | | | | | | | | | | | | | | | | | | | | | |
| | Year Ended December 31, |
| | 2015 | | 2014 | | 2013 |
| (dollars in millions) | Average Balances | Income/ Expense | Yields/ Rates | | Average Balances | Income/ Expense | Yields/ Rates | | Average Balances | Income/ Expense | Yields/ Rates |
| Assets | | | | | | | | | | | |
| Interest-bearing cash and due from banks and deposits in banks |
| $1,746 |
|
| $5 |
| 0.29 | % | |
| $2,113 |
|
| $5 |
| 0.22 | % | |
| $2,278 |
|
| $11 |
| 0.46 | % |
| Taxable investment securities | 24,649 |
| 621 |
| 2.52 |
| | 24,319 |
| 619 |
| 2.55 |
| | 19,062 |
| 477 |
| 2.50 |
|
| Non-taxable investment securities | 9 |
| — |
| 2.60 |
| | 11 |
| — |
| 2.60 |
| | 12 |
| — |
| 2.66 |
|
| Total investment securities | 24,658 |
| 621 |
| 2.52 |
| | 24,330 |
| 619 |
| 2.55 |
| | 19,074 |
| 477 |
| 2.50 |
|
| Commercial | 32,673 |
| 951 |
| 2.87 |
| | 29,993 |
| 900 |
| 2.96 |
| | 28,654 |
| 900 |
| 3.10 |
|
| Commercial real estate | 8,231 |
| 211 |
| 2.53 |
| | 7,158 |
| 183 |
| 2.52 |
| | 6,568 |
| 178 |
| 2.67 |
|
| Leases | 3,902 |
| 97 |
| 2.50 |
| | 3,776 |
| 103 |
| 2.73 |
| | 3,463 |
| 105 |
| 3.05 |
|
| Total commercial | 44,806 |
| 1,259 |
| 2.78 |
| | 40,927 |
| 1,186 |
| 2.86 |
| | 38,685 |
| 1,183 |
| 3.02 |
|
| Residential mortgages | 12,338 |
| 465 |
| 3.77 |
| | 10,729 |
| 425 |
| 3.96 |
| | 9,104 |
| 360 |
| 3.96 |
|
| Home equity loans | 3,025 |
| 163 |
| 5.38 |
| | 3,877 |
| 205 |
| 5.29 |
| | 4,606 |
| 246 |
| 5.35 |
|
| Home equity lines of credit | 14,958 |
| 441 |
| 2.95 |
| | 15,552 |
| 450 |
| 2.89 |
| | 16,337 |
| 463 |
| 2.83 |
|
Home equity loans serviced by others (1) | 1,117 |
| 77 |
| 6.94 |
| | 1,352 |
| 91 |
| 6.75 |
| | 1,724 |
| 115 |
| 6.65 |
|
Home equity lines of credit serviced by others (1) | 453 |
| 11 |
| 2.44 |
| | 609 |
| 16 |
| 2.68 |
| | 768 |
| 22 |
| 2.88 |
|
| Automobile | 13,516 |
| 372 |
| 2.75 |
| | 11,011 |
| 282 |
| 2.57 |
| | 8,857 |
| 235 |
| 2.65 |
|
| Student | 3,313 |
| 167 |
| 5.03 |
| | 2,148 |
| 102 |
| 4.74 |
| | 2,202 |
| 95 |
| 4.30 |
|
| Credit cards | 1,621 |
| 178 |
| 10.97 |
| | 1,651 |
| 167 |
| 10.14 |
| | 1,669 |
| 175 |
| 10.46 |
|
| Other retail | 1,003 |
| 78 |
| 7.75 |
| | 1,186 |
| 88 |
| 7.43 |
| | 1,453 |
| 107 |
| 7.36 |
|
| Total retail | 51,344 |
| 1,952 |
| 3.80 |
| | 48,115 |
| 1,826 |
| 3.80 |
| | 46,720 |
| 1,818 |
| 3.89 |
|
Total loans and leases (2) | 96,150 |
| 3,211 |
| 3.32 |
| | 89,042 |
| 3,012 |
| 3.37 |
| | 85,405 |
| 3,001 |
| 3.50 |
|
| Loans held for sale, at fair value | 301 |
| 10 |
| 3.47 |
| | 163 |
| 5 |
| 3.10 |
| | 392 |
| 12 |
| 3.07 |
|
| Other loans held for sale | 95 |
| 7 |
| 7.22 |
| | 539 |
| 23 |
| 4.17 |
| | — |
| — |
| — |
|
| Interest-earning assets | 122,950 |
| 3,854 |
| 3.12 |
| | 116,187 |
| 3,664 |
| 3.14 |
| | 107,149 |
| 3,501 |
| 3.25 |
|
| Allowance for loan and lease losses | (1,196 | ) | | | | (1,230 | ) | | | | (1,219 | ) | | |
| Goodwill | 6,876 |
| | | | 6,876 |
| | | | 9,063 |
| | |
| Other noninterest-earning assets | 6,440 |
| | | | 5,791 |
| | | | 5,873 |
| | |
| Total noninterest-earning assets | 12,120 |
| | | | 11,437 |
| | | | 13,717 |
| | |
| Total assets |
| $135,070 |
| | | |
| $127,624 |
| | | |
| $120,866 |
| | |
(1) Our SBO portfolio consists of home equity loans and lines that were originally serviced by others. We now service a portion of this portfolio internally.
(2) Interest income and rates on loans include loan fees. Additionally, average nonaccrual loans were included in the average loan balances used to determine the average yield on loans in amounts of $1.1 billion, $1.2 billion, $1.6 billion, $1.7 billion and $1.9$1.6 billion for December 31, 2015, 2014, 2013, 2012 and 2011,2013, respectively.
CITIZENS FINANCIAL GROUP, INC.
SELECTED STATISTICAL INFORMATION
|
| | | | | | | | | | | | | | | | | | | | | | | | | | |
| | Year Ended December 31, |
| | 2015 | | 2014 | | 2013 |
| (dollars in millions) | Average Balances | Income/ Expense | Yields/ Rates | | Average Balances | Income/ Expense | Yields/ Rates | | Average Balances | Income/ Expense | Yields/ Rates |
| Liabilities and Stockholders’ Equity | | | | | | | | | | | |
| Checking with interest |
| $16,666 |
|
| $19 |
| 0.11 | % | |
| $14,507 |
|
| $12 |
| 0.08 | % | |
| $14,096 |
|
| $8 |
| 0.06 | % |
| Money market and savings | 43,458 |
| 117 |
| 0.27 |
| | 39,579 |
| 77 |
| 0.19 |
| | 42,575 |
| 105 |
| 0.25 |
|
| Term deposits | 12,424 |
| 101 |
| 0.82 |
| | 10,317 |
| 67 |
| 0.65 |
| | 11,266 |
| 103 |
| 0.91 |
|
| Total interest-bearing deposits | 72,548 |
| 237 |
| 0.33 |
| | 64,403 |
| 156 |
| 0.24 |
| | 67,937 |
| 216 |
| 0.32 |
|
| Interest-bearing deposits held for sale | — |
| — |
| — |
| | 1,960 |
| 4 |
| 0.22 |
| | — |
| — |
| — |
|
Federal funds purchased and securities sold under agreements to repurchase (3) | 3,364 |
| 16 |
| 0.46 |
| | 5,699 |
| 32 |
| 0.55 |
| | 2,400 |
| 192 |
| 7.89 |
|
| Other short-term borrowed funds | 5,865 |
| 67 |
| 1.13 |
| | 5,640 |
| 89 |
| 1.56 |
| | 251 |
| 4 |
| 1.64 |
|
| Long-term borrowed funds | 4,479 |
| 132 |
| 2.95 |
| | 1,907 |
| 82 |
| 4.25 |
| | 778 |
| 31 |
| 3.93 |
|
| Total borrowed funds | 13,708 |
| 215 |
| 1.56 |
| | 13,246 |
| 203 |
| 1.51 |
| | 3,429 |
| 227 |
| 6.53 |
|
| Total interest-bearing liabilities | 86,256 |
| 452 |
| 0.52 |
| | 79,609 |
| 363 |
| 0.45 |
| | 71,366 |
| 443 |
| 0.61 |
|
| Demand deposits | 26,606 |
| | | | 25,739 |
| | | | 25,399 |
| | |
| Demand deposits held for sale | — |
| | | | 462 |
| | | | — |
| | |
| Other liabilities | 2,671 |
| | | | 2,415 |
| | | | 2,267 |
| | |
| Total liabilities | 115,533 |
| | | | 108,225 |
| | | | 99,032 |
| | |
| Stockholders’ equity | 19,537 |
| | | | 19,399 |
| | | | 21,834 |
| | |
| Total liabilities and stockholders’ equity |
| $135,070 |
| | | |
| $127,624 |
| | | |
| $120,866 |
| | |
| Interest rate spread | | | 2.60 |
| | | | 2.69 |
| | | | 2.64 |
|
| Net interest income | |
| $3,402 |
| | | |
| $3,301 |
| | | |
| $3,058 |
| |
| Net interest margin | | | 2.75 | % | | | | 2.83 | % | | | | 2.85 | % |
(3) Balances are net of certain short-term receivables associated with reverse agreements. Interest expense includes the full cost of the repurchase agreements and certain hedging costs. The yield on Federal funds purchased is elevated due to the impact from pay-fixed interest rate swaps that are scheduled to runoffrun off by the end of 2016. For further discussion see “Management's“Management’s Discussion and Analysis of Financial Condition and Results of Operations — Year ended December 31, 20142015 Compared with Year Ended December 31, 20132014 — Derivatives.”
CITIZENS FINANCIAL GROUP, INC.
SELECTED STATISTICAL INFORMATION
Change in Net Interest Income–Volume and Rate Analysis
The following table presents the amount of changes in interest income and interest expense due to changes in both average volume and average rate. Average volume and rate changes have been allocated between the average rate and average volume variances on a consistent basis based upon the respective percentage changes in average balances and average rates.
| | | | Year Ended December 31, | | Year Ended December 31, | Year Ended December 31, | | Year Ended December 31, |
| | 2014 Versus 2013 | | 2013 Versus 2012 | 2015 Versus 2014 | | 2014 Versus 2013 |
| (in millions) | Average Volume | Average Rate | Net Change | | Average Volume | Average Rate | Net Change | Average Volume | Average Rate | Net Change | | Average Volume | Average Rate | Net Change |
| Interest Income | | | | | | |
| Interest-bearing cash and due from banks and deposits in banks |
| ($1 | ) |
| ($5 | ) |
| ($6 | ) | |
| $7 |
|
| $— |
|
| $7 |
|
| ($1 | ) |
| $1 |
|
| $— |
| |
| ($1 | ) |
| ($5 | ) |
| ($6 | ) |
| Taxable investment securities | 132 |
| 10 |
| 142 |
| | (83 | ) | (58 | ) | (141 | ) |
| $9 |
|
| ($7 | ) | 2 |
| | 132 |
| 10 |
| 142 |
|
| Non-taxable investment securities | — |
| — |
| — |
| | (2 | ) | — |
| (2 | ) | — |
| — |
| — |
| | — |
| — |
| — |
|
| Total investment securities | 132 |
| 10 |
| 142 |
| | (85 | ) | (58 | ) | (143 | ) | 9 |
| (7 | ) |
| $2 |
| | 132 |
| 10 |
|
| $142 |
|
| Commercial | 42 |
| (42 | ) | — |
| | 43 |
| 8 |
| 51 |
| 79 |
| (28 | ) |
| $51 |
| | 42 |
| (42 | ) |
| $— |
|
| Commercial real estate | 16 |
| (11 | ) | 5 |
| | (14 | ) | (4 | ) | (18 | ) | 27 |
| 1 |
| 28 |
| | 16 |
| (11 | ) | 5 |
|
| Leases | 10 |
| (12 | ) | (2 | ) | | 9 |
| (16 | ) | (7 | ) | 3 |
| (9 | ) | (6 | ) | | 10 |
| (12 | ) | (2 | ) |
| Total commercial | 68 |
| (65 | ) | 3 |
| | 38 |
| (12 | ) | 26 |
| 109 |
| (36 | ) | 73 |
| | 68 |
| (65 | ) | 3 |
|
| Residential mortgages | 65 |
| — |
| 65 |
| | (19 | ) | (34 | ) | (53 | ) | 63 |
| (23 | ) | 40 |
| | 65 |
| — |
| 65 |
|
| Home equity loans | (39 | ) | (2 | ) | (41 | ) | | (74 | ) | (12 | ) | (86 | ) | (44 | ) | 2 |
| (42 | ) | | (39 | ) | (2 | ) | (41 | ) |
| Home equity lines of credit | (22 | ) | 9 |
| (13 | ) | | (12 | ) | 5 |
| (7 | ) | (18 | ) | 9 |
| (9 | ) | | (22 | ) | 9 |
| (13 | ) |
Home equity loans serviced by others (1) | (25 | ) | 1 |
| (24 | ) | | (34 | ) | — |
| (34 | ) | (17 | ) | 3 |
| (14 | ) | | (25 | ) | 1 |
| (24 | ) |
Home equity lines of credit serviced by others (1) | (5 | ) | (1 | ) | (6 | ) | | (6 | ) | 1 |
| (5 | ) | (4 | ) | (1 | ) | (5 | ) | | (5 | ) | (1 | ) | (6 | ) |
| Automobile | 57 |
| (10 | ) | 47 |
| | 19 |
| (57 | ) | (38 | ) | 65 |
| 25 |
| 90 |
| | 57 |
| (10 | ) | 47 |
|
| Student | (2 | ) | 9 |
| 7 |
| | (1 | ) | 5 |
| 4 |
| 55 |
| 10 |
| 65 |
| | (2 | ) | 9 |
| 7 |
|
| Credit cards | (2 | ) | (6 | ) | (8 | ) | | 3 |
| 6 |
| 9 |
| (3 | ) | 14 |
| 11 |
| | (2 | ) | (6 | ) | (8 | ) |
| Other retail | (20 | ) | 1 |
| (19 | ) | | (25 | ) | 5 |
| (20 | ) | (14 | ) | 4 |
| (10 | ) | | (20 | ) | 1 |
| (19 | ) |
| Total retail | 7 |
| 1 |
| 8 |
| | (149 | ) | (81 | ) | (230 | ) | 83 |
| 43 |
| 126 |
| | 7 |
| 1 |
| 8 |
|
| Total loans and leases | 75 |
| (64 | ) | 11 |
| | (111 | ) | (93 | ) | (204 | ) | 192 |
| 7 |
| 199 |
| | 75 |
| (64 | ) | 11 |
|
| Loans held for sale | (7 | ) | — |
| (7 | ) | | (5 | ) | — |
| (5 | ) | |
| Loans held for sale, at fair value | | 5 |
| — |
| 5 |
| | (7 | ) | — |
| (7 | ) |
| Other loans held for sale | 44 |
| (21 | ) | 23 |
| | — |
| — |
| — |
| (18 | ) | 2 |
| (16 | ) | | 44 |
| (21 | ) | 23 |
|
| Total interest income |
| $243 |
|
| ($80 | ) |
| $163 |
| |
| ($194 | ) |
| ($151 | ) |
| ($345 | ) |
| $187 |
|
| $3 |
|
| $190 |
| |
| $243 |
|
| ($80 | ) |
| $163 |
|
| Interest Expense | | | | | | |
| Checking with interest |
| $— |
|
| $4 |
|
| $4 |
| |
| $— |
|
| ($2 | ) |
| ($2 | ) |
| $— |
|
| $7 |
|
| $7 |
| |
| $— |
|
| $4 |
|
| $4 |
|
| Money market and savings | (7 | ) | (21 | ) | (28 | ) | | 4 |
| (20 | ) | (16 | ) | 8 |
| 32 |
| 40 |
| | (7 | ) | (21 | ) | (28 | ) |
| Term deposits | (9 | ) | (27 | ) | (36 | ) | | (41 | ) | (100 | ) | (141 | ) | 14 |
| 20 |
| 34 |
| | (9 | ) | (27 | ) | (36 | ) |
| Total interest-bearing deposits | (16 | ) | (44 | ) | (60 | ) | | (37 | ) | (122 | ) | (159 | ) | 22 |
| 59 |
| 81 |
| | (16 | ) | (44 | ) | (60 | ) |
| Interest-bearing deposits held for sale | — |
| 4 |
| 4 |
| | — |
| — |
| — |
| (4 | ) | — |
| (4 | ) | | — |
| 4 |
| 4 |
|
| Federal funds purchased and securities sold under agreements to repurchase | 264 |
| (424 | ) | (160 | ) | | (14 | ) | 87 |
| 73 |
| (13 | ) | (3 | ) | (16 | ) | | 264 |
| (424 | ) | (160 | ) |
| Other short-term borrowed funds | 89 |
| (4 | ) | 85 |
| | (92 | ) | (5 | ) | (97 | ) | 4 |
| (26 | ) | (22 | ) | | 89 |
| (4 | ) | 85 |
|
| Long-term borrowed funds | 45 |
| 6 |
| 51 |
| | (15 | ) | 22 |
| 7 |
| 109 |
| (59 | ) | 50 |
| | 45 |
| 6 |
| 51 |
|
| Total borrowed funds | 398 |
| (422 | ) | (24 | ) | | (121 | ) | 104 |
| (17 | ) | 100 |
| (88 | ) | 12 |
| | 398 |
| (422 | ) | (24 | ) |
| Total interest expense | 382 |
| (462 | ) | (80 | ) | | (158 | ) | (18 | ) | (176 | ) | 118 |
| (29 | ) | 89 |
| | 382 |
| (462 | ) | (80 | ) |
| Net interest income |
| ($139 | ) |
| $382 |
|
| $243 |
| |
| ($36 | ) |
| ($133 | ) |
| ($169 | ) |
| $69 |
|
| $32 |
|
| $101 |
| |
| ($139 | ) |
| $382 |
|
| $243 |
|
(1) Our SBO portfolio consists of home equity loans and lines that were originally serviced by others. We now service a portion of this portfolio internally.
CITIZENS FINANCIAL GROUP, INC.
SELECTED STATISTICAL INFORMATION
Investment Portfolio
The following table presents the book value of the major components of our investments portfolio. For further discussion, see Note 3 “Securities” to our audited Consolidated Financial Statements in Part II, Item 8 — Financial Statements and Supplementary Data, included elsewhere in this report.
| | | | December 31, | December 31, |
| (in millions) | 2014 |
| | 2013 |
| | 2012 |
| 2015 |
| | 2014 |
| | 2013 |
|
| Securities available for sale: | | | | | | |
| U.S. Treasury |
| $15 |
| |
| $15 |
| |
| $15 |
| |
| Securities Available for Sale: | | | | | | |
| U.S. Treasury and other | |
| $16 |
| |
| $15 |
| |
| $15 |
|
| State and political subdivisions | 10 |
| | 10 |
| | 21 |
| 9 |
| | 10 |
| | 10 |
|
| Other bonds, notes and debentures | — |
| | — |
| | — |
| |
| Mortgage-backed securities: | | | | | | | | | | |
| Federal agencies and U.S. government sponsored entities | 17,934 |
| | 14,993 |
| | 16,904 |
| 17,320 |
| | 17,934 |
| | 14,993 |
|
| Other/non-agency | 672 |
| | 952 |
| | 1,397 |
| 522 |
| | 672 |
| | 952 |
|
| Total mortgage-backed securities | 18,606 |
| | 15,945 |
| | 18,301 |
| 17,842 |
| | 18,606 |
| | 15,945 |
|
| Total debt securities available for sale | 18,631 |
| | 15,970 |
| | 18,337 |
| 17,867 |
| | 18,631 |
| | 15,970 |
|
| Marketable equity securities | 13 |
| | 13 |
| | 7 |
| 5 |
| | 13 |
| | 13 |
|
| Other equity securities | 12 |
| | 12 |
| | 12 |
| 12 |
| | 12 |
| | 12 |
|
| Total equity securities available for sale | 25 |
| | 25 |
| | 19 |
| 17 |
| | 25 |
| | 25 |
|
| Total securities available for sale |
| $18,656 |
| |
| $15,995 |
| |
| $18,356 |
|
| $17,884 |
| |
| $18,656 |
| |
| $15,995 |
|
| Securities held to maturity: | | | | | | |
| Securities Held to Maturity: | | | | | | |
| Mortgage-backed securities: | | | | | | | | | | |
| Federal Agencies and U.S. government sponsored entities |
| $3,728 |
| |
| $2,940 |
| |
| $— |
|
| $4,105 |
| |
| $3,728 |
| |
| $2,940 |
|
| Other/non-agency | 1,420 |
| | 1,375 |
| | — |
| 1,153 |
| | 1,420 |
| | 1,375 |
|
| Total securities held to maturity |
| $5,148 |
| |
| $4,315 |
| |
| $— |
|
| $5,258 |
| |
| $5,148 |
| |
| $4,315 |
|
| Other investment securities: | | | | | | |
| Other Investment Securities, at Fair Value: | | | | | | |
| Money market mutual fund | |
| $65 |
| |
| $28 |
| |
| $29 |
|
| Other investments | | 5 |
| | 5 |
| | 5 |
|
| Total other investment securities, at fair value | |
| $70 |
| |
| $33 |
| |
| $34 |
|
| Other Investment Securities, at Cost: | | | | | | |
| Federal Reserve Bank stock |
| $477 |
| |
| $462 |
| |
| $490 |
|
| $468 |
| |
| $477 |
| |
| $462 |
|
| Federal Home Loan Bank stock | 390 |
| | 468 |
| | 565 |
| 395 |
| | 390 |
| | 468 |
|
| Venture capital and other investments | 5 |
| | 5 |
| | 6 |
| |
| Total other investment securities |
| $872 |
| |
| $935 |
| |
| $1,061 |
| |
| Total other investment securities, at cost | |
| $863 |
| |
| $867 |
| |
| $930 |
|
CITIZENS FINANCIAL GROUP, INC.
SELECTED STATISTICAL INFORMATION
The following table presents an analysis of the amortized cost, remaining contractual maturities, and weighted-average yields by contractual maturity. Expected maturities may differ from contractual maturities because borrowers may have the right to call or prepay obligations with or without call or prepayment penalties.
| | | | Distribution of Maturities | Distribution of Maturities |
| | As of December 31, 2014 | As of December 31, 2015 |
| (dollars in millions) | Due in 1 Year or Less | | Due After 1
Through 5
Years | | Due After 5
Through 10
Years | | Due After 10
Years | | Total |
| Due in 1 Year or Less | Due After 1
Through 5
Years | Due After 5
Through 10
Years | Due After 10
Years | Total |
|
| Amortized cost: |
| |
| |
| |
| |
|
|
| Debt securities available for sale: |
| |
| |
| |
| |
|
|
| U.S. Treasury |
| $15 |
| |
| $— |
| |
| $— |
| |
| $— |
| |
| $15 |
| |
| U.S. Treasury and other | |
| $15 |
|
| $— |
|
| $1 |
|
| $— |
|
| $16 |
|
| State and political subdivisions | — |
| | — |
| | — |
| | 10 |
| | 10 |
| — |
| — |
| — |
| 9 |
| 9 |
|
| Mortgage-backed securities: |
|
| |
|
| |
|
| |
|
| |
|
| |
| Federal agencies and U.S. government sponsored entities | 2 |
| | 53 |
| | 2,318 |
| | 15,310 |
| | 17,683 |
| 4 |
| 52 |
| 1,833 |
| 15,345 |
| 17,234 |
|
| Other/non-agency | — |
| | 51 |
| | 57 |
| | 595 |
| | 703 |
| — |
| 68 |
| 3 |
| 484 |
| 555 |
|
| Total debt securities available for sale | 17 |
| | 104 |
| | 2,375 |
| | 15,915 |
| | 18,411 |
| 19 |
| 120 |
| 1,837 |
| 15,838 |
| 17,814 |
|
| Debt securities held to maturity: |
|
| |
|
| |
|
| |
|
| |
|
| |
| Mortgage-backed securities: |
|
| |
|
| |
|
| |
|
| |
|
| |
| Federal agencies and U.S. government sponsored entities | — |
| | — |
| | — |
| | 3,728 |
| | 3,728 |
| — |
| — |
| — |
| 4,105 |
| 4,105 |
|
| Other/non-agency | — |
| | — |
| | — |
| | 1,420 |
| | 1,420 |
| — |
| — |
| — |
| 1,153 |
| 1,153 |
|
| Total debt securities held to maturity | — |
| | — |
| | — |
| | 5,148 |
| | 5,148 |
| — |
| — |
| — |
| 5,258 |
| 5,258 |
|
Total amortized cost of debt securities (1) |
| $17 |
| |
| $104 |
| |
| $2,375 |
| |
| $21,063 |
| |
| $23,559 |
|
| $19 |
|
| $120 |
|
| $1,837 |
|
| $21,096 |
|
| $23,072 |
|
Weighted-average yield (2) | 0.72 | % | | 4.77 | % | | 1.76 | % | | 2.74 | % | | 2.65 | % | 1.27 | % | 4.88 | % | 1.90 | % | 2.57 | % | 2.53 | % |
(1) As of December 31, 2014,2015, no investments exceeded 10% of stockholders'stockholders’ equity.
(2) Yields on tax-exempt securities are not computed on a tax-equivalent basis.
CITIZENS FINANCIAL GROUP, INC.
SELECTED STATISTICAL INFORMATION
Loan and Lease Portfolio
The following table shows the composition of total loans and leases. For further discussion see Note 4 “Loans and Leases” to our audited Consolidated Financial Statements in Part II, Item 8 — Financial Statements and Supplementary Data, included elsewhere in this report.
| | | | December 31, | December 31, |
| (in millions) | 2014 |
| | 2013 |
| | 2012 |
| | 2011 |
| | 2010 |
| 2015 |
| | 2014 |
| | 2013 |
| | 2012 |
| | 2011 |
|
| Commercial |
| $31,431 |
| |
| $28,667 |
| |
| $28,856 |
| |
| $25,770 |
| |
| $21,877 |
|
| $33,264 |
| |
| $31,431 |
| |
| $28,667 |
| |
| $28,856 |
| |
| $25,770 |
|
| Commercial real estate | 7,809 |
| | 6,948 |
| | 6,459 |
| | 7,602 |
| | 8,920 |
| 8,971 |
| | 7,809 |
| | 6,948 |
| | 6,459 |
| | 7,602 |
|
| Leases | 3,986 |
| | 3,780 |
| | 3,415 |
| | 3,164 |
| | 3,016 |
| 3,979 |
| | 3,986 |
| | 3,780 |
| | 3,415 |
| | 3,164 |
|
| Total commercial | 43,226 |
| | 39,395 |
| | 38,730 |
| | 36,536 |
| | 33,813 |
| 46,214 |
| | 43,226 |
| | 39,395 |
| | 38,730 |
| | 36,536 |
|
| Residential mortgages | 11,832 |
| | 9,726 |
| | 9,323 |
| | 9,719 |
| | 9,703 |
| 13,318 |
| | 11,832 |
| | 9,726 |
| | 9,323 |
| | 9,719 |
|
| Home equity loans | 3,424 |
| | 4,301 |
| | 5,106 |
| | 6,766 |
| | 8,942 |
| 2,557 |
| | 3,424 |
| | 4,301 |
| | 5,106 |
| | 6,766 |
|
| Home equity lines of credit | 15,423 |
| | 15,667 |
| | 16,672 |
| | 16,666 |
| | 15,093 |
| 14,674 |
| | 15,423 |
| | 15,667 |
| | 16,672 |
| | 16,666 |
|
Home equity loans serviced by others (1) | 1,228 |
| | 1,492 |
| | 2,024 |
| | 2,535 |
| | 3,148 |
| 986 |
| | 1,228 |
| | 1,492 |
| | 2,024 |
| | 2,535 |
|
Home equity lines of credit serviced by others (1) | 550 |
| | 679 |
| | 936 |
| | 1,089 |
| | 1,264 |
| 389 |
| | 550 |
| | 679 |
| | 936 |
| | 1,089 |
|
| Automobile | 12,706 |
| | 9,397 |
| | 8,944 |
| | 7,571 |
| | 8,077 |
| 13,828 |
| | 12,706 |
| | 9,397 |
| | 8,944 |
| | 7,571 |
|
| Student | 2,256 |
| | 2,208 |
| | 2,198 |
| | 2,271 |
| | 2,429 |
| 4,359 |
| | 2,256 |
| | 2,208 |
| | 2,198 |
| | 2,271 |
|
| Credit cards | 1,693 |
| | 1,691 |
| | 1,691 |
| | 1,637 |
| | 1,649 |
| 1,634 |
| | 1,693 |
| | 1,691 |
| | 1,691 |
| | 1,637 |
|
| Other retail | 1,072 |
| | 1,303 |
| | 1,624 |
| | 2,005 |
| | 2,904 |
| 1,083 |
| | 1,072 |
| | 1,303 |
| | 1,624 |
| | 2,005 |
|
| Total retail | 50,184 |
| | 46,464 |
| | 48,518 |
| | 50,259 |
| | 53,209 |
| 52,828 |
| | 50,184 |
| | 46,464 |
| | 48,518 |
| | 50,259 |
|
| Total loans and leases |
| $93,410 |
| |
| $85,859 |
| |
| $87,248 |
| |
| $86,795 |
| |
| $87,022 |
|
| $99,042 |
| |
| $93,410 |
| |
| $85,859 |
| |
| $87,248 |
| |
| $86,795 |
|
(1) Our SBO portfolio consists of home equity loans and lines that were originally serviced by others. We now service a portion of this portfolio internally.
CITIZENS FINANCIAL GROUP, INC.
SELECTED STATISTICAL INFORMATION
Maturities and Sensitivities of Loans and Leases to Changes in Interest Rates
The following table is a summary of loans and leases by remaining maturity or repricing date:
| | | | December 31, 2014 | December 31, 2015 |
| (in millions) | Due in 1 Year or Less | Due After 1 Year Through 5 Years | Due After 5 Years | Total Loans and Leases | Due in 1 Year or Less | Due After 1 Year Through 5 Years | Due After 5 Years | Total Loans and Leases |
| Commercial |
| $26,983 |
|
| $2,738 |
|
| $1,710 |
|
| $31,431 |
|
| $28,293 |
|
| $3,141 |
|
| $1,830 |
|
| $33,264 |
|
| Commercial real estate | 7,469 |
| 173 |
| 167 |
| 7,809 |
| 8,626 |
| 155 |
| 190 |
| 8,971 |
|
| Leases | 609 |
| 1,948 |
| 1,429 |
| 3,986 |
| 665 |
| 2,055 |
| 1,259 |
| 3,979 |
|
| Total commercial | 35,061 |
| 4,859 |
| 3,306 |
| 43,226 |
| 37,584 |
| 5,351 |
| 3,279 |
| 46,214 |
|
| Residential mortgages | 1,313 |
| 1,119 |
| 9,400 |
| 11,832 |
| 1,485 |
| 1,201 |
| 10,632 |
| 13,318 |
|
| Home equity loans | 713 |
| 576 |
| 2,135 |
| 3,424 |
| 542 |
| 388 |
| 1,627 |
| 2,557 |
|
| Home equity lines of credit | 10,749 |
| 3,196 |
| 1,478 |
| 15,423 |
| 10,772 |
| 2,144 |
| 1,758 |
| 14,674 |
|
Home equity loans serviced by others (1) | — |
| 6 |
| 1,222 |
| 1,228 |
| — |
| 133 |
| 853 |
| 986 |
|
Home equity lines of credit serviced by others (1) | 550 |
| — |
| — |
| 550 |
| 389 |
| — |
| — |
| 389 |
|
| Automobile | 109 |
| 6,220 |
| 6,377 |
| 12,706 |
| 131 |
| 7,663 |
| 6,034 |
| 13,828 |
|
| Student | 5 |
| 69 |
| 2,182 |
| 2,256 |
| 13 |
| 305 |
| 4,041 |
| 4,359 |
|
| Credit cards | 1,545 |
| 148 |
| — |
| 1,693 |
| 1,487 |
| 147 |
| — |
| 1,634 |
|
| Other retail | 507 |
| 144 |
| 421 |
| 1,072 |
| 447 |
| 311 |
| 325 |
| 1,083 |
|
| Total retail | 15,491 |
| 11,478 |
| 23,215 |
| 50,184 |
| 15,266 |
| 12,292 |
| 25,270 |
| 52,828 |
|
| Total loans and leases |
| $50,552 |
|
| $16,337 |
|
| $26,521 |
|
| $93,410 |
|
| $52,850 |
|
| $17,643 |
|
| $28,549 |
|
| $99,042 |
|
| Loans and leases due after one year at fixed interest rates | Loans and leases due after one year at fixed interest rates |
| $10,750 |
|
| $20,081 |
|
| $30,831 |
| Loans and leases due after one year at fixed interest rates |
| $12,785 |
|
| $20,261 |
|
| $33,046 |
|
| Loans and leases due after one year at variable interest rates | Loans and leases due after one year at variable interest rates | 5,587 |
| 6,440 |
| 12,027 |
| Loans and leases due after one year at variable interest rates | 4,858 |
| 8,288 |
| 13,146 |
|
(1) Our SBO portfolio consists of home equity loans and lines that were originally serviced by others. We now service a portion of this portfolio internally.
Loan and Lease Concentrations
This disclosure presents our exposure to any concentration of loans and leases that exceed 10% of total loans and leases. At December 31, 2014,2015, we did not identify any concentration of loans and leases that exceeded the 10% threshold. For further discussion of how we managed concentration exposures, see Note 5 “Allowance for Credit Losses, Nonperforming Assets, and Concentrations of Credit Risk” to our audited Consolidated Financial Statements in Part II, Item 8 — Financial Statements and Supplementary Data, included elsewhere in this report.
CITIZENS FINANCIAL GROUP, INC.
SELECTED STATISTICAL INFORMATION
Risk Elements
The following table presents a summary of nonperforming loans and leases by class:
| | | | December 31, | December 31, |
| (in millions) | 2014 |
| | 2013 |
| | 2012 |
| | 2011 |
| | 2010 |
| 2015 |
| | 2014 |
| | 2013 |
| | 2012 |
| | 2011 |
|
| Nonaccrual loans and leases | | | | | | | | | | | | | | | | | | |
| Commercial |
| $113 |
| |
| $96 |
| |
| $119 |
| |
| $176 |
| |
| $283 |
|
| $70 |
| |
| $113 |
| |
| $96 |
| |
| $119 |
| |
| $176 |
|
| Commercial real estate | 50 |
| | 169 |
| | 386 |
| | 710 |
| | 927 |
| 77 |
| | 50 |
| | 169 |
| | 386 |
| | 710 |
|
| Leases | — |
| | — |
| | 1 |
| | 1 |
| | 13 |
| — |
| | — |
| | — |
| | 1 |
| | 1 |
|
| Total commercial | 163 |
| | 265 |
| | 506 |
| | 887 |
| | 1,223 |
| 147 |
| | 163 |
| | 265 |
| | 506 |
| | 887 |
|
| Residential mortgages | 345 |
| | 382 |
| | 486 |
| | 374 |
| | 429 |
| 331 |
| | 345 |
| | 382 |
| | 486 |
| | 374 |
|
| Home equity loans | 203 |
| | 266 |
| | 298 |
| | 207 |
| | 234 |
| 135 |
| | 203 |
| | 266 |
| | 298 |
| | 207 |
|
| Home equity lines of credit | 257 |
| | 333 |
| | 259 |
| | 109 |
| | 101 |
| 272 |
| | 257 |
| | 333 |
| | 259 |
| | 109 |
|
Home equity loans serviced by others (1) | 47 |
| | 59 |
| | 92 |
| | 68 |
| | 129 |
| 38 |
| | 47 |
| | 59 |
| | 92 |
| | 68 |
|
Home equity lines of credit serviced by others (1) | 25 |
| | 30 |
| | 41 |
| | 25 |
| | 40 |
| 32 |
| | 25 |
| | 30 |
| | 41 |
| | 25 |
|
| Automobile | 21 |
| | 16 |
| | 16 |
| | 7 |
| | 13 |
| 42 |
| | 21 |
| | 16 |
| | 16 |
| | 7 |
|
| Student | 11 |
| | 3 |
| | 3 |
| | 4 |
| | 4 |
| 35 |
| | 11 |
| | 3 |
| | 3 |
| | 4 |
|
| Credit cards | 16 |
| | 19 |
| | 20 |
| | 23 |
| | 37 |
| 16 |
| | 16 |
| | 19 |
| | 20 |
| | 23 |
|
| Other retail | 5 |
| | 10 |
| | 9 |
| | 8 |
| | 10 |
| 3 |
| | 5 |
| | 10 |
| | 9 |
| | 8 |
|
| Total retail | 930 |
| | 1,118 |
| | 1,224 |
| | 825 |
| | 997 |
| 904 |
| | 930 |
| | 1,118 |
| | 1,224 |
| | 825 |
|
| Total nonaccrual loans and leases | 1,093 |
| | 1,383 |
| | 1,730 |
| | 1,712 |
| | 2,220 |
| 1,051 |
| | 1,093 |
| | 1,383 |
| | 1,730 |
| | 1,712 |
|
| Loans and leases that are accruing and 90 days or more delinquent | | | | | | | | | | | | | | | | | | |
| Commercial | 1 |
| | — |
| | 71 |
| | 1 |
| | 87 |
| 1 |
| | 1 |
| | — |
| | 71 |
| | 1 |
|
| Commercial real estate | — |
| | — |
| | 33 |
| | 4 |
| | 2 |
| — |
| | — |
| | — |
| | 33 |
| | 4 |
|
| Leases | — |
| | — |
| | — |
| | — |
| | — |
| — |
| | — |
| | — |
| | — |
| | — |
|
| Total commercial | 1 |
| | — |
| | 104 |
| | 5 |
| | 89 |
| 1 |
| | 1 |
| | — |
| | 104 |
| | 5 |
|
| Residential mortgages | — |
| | — |
| | — |
| | 29 |
| | 15 |
| — |
| | — |
| | — |
| | — |
| | 29 |
|
| Home equity loans | — |
| | — |
| | — |
| | — |
| | — |
| — |
| | — |
| | — |
| | — |
| | — |
|
| Home equity lines of credit | — |
| | — |
| | — |
| | — |
| | — |
| — |
| | — |
| | — |
| | — |
| | — |
|
Home equity loans serviced by others (1) | — |
| | — |
| | — |
| | — |
| | — |
| — |
| | — |
| | — |
| | — |
| | — |
|
Home equity lines of credit serviced by others (1) | — |
| | — |
| | — |
| | — |
| | — |
| — |
| | — |
| | — |
| | — |
| | — |
|
| Automobile | — |
| | — |
| | — |
| | — |
| | — |
| — |
| | — |
| | — |
| | — |
| | — |
|
| Student | 6 |
| | 31 |
| | 33 |
| | 36 |
| | 29 |
| 6 |
| | 6 |
| | 31 |
| | 33 |
| | 36 |
|
| Credit cards | 1 |
| | 2 |
| | 2 |
| | 2 |
| | 2 |
| — |
| | 1 |
| | 2 |
| | 2 |
| | 2 |
|
| Other retail | — |
| | — |
| | — |
| | — |
| | — |
| 2 |
| | — |
| | — |
| | — |
| | — |
|
| Total retail | 7 |
| | 33 |
| | 35 |
| | 67 |
| | 46 |
| 8 |
| | 7 |
| | 33 |
| | 35 |
| | 67 |
|
| Total accruing and 90 days or more delinquent | 8 |
| | 33 |
| | 139 |
| | 72 |
| | 135 |
| 9 |
| | 8 |
| | 33 |
| | 139 |
| | 72 |
|
| Total nonperforming loans and leases |
| $1,101 |
| |
| $1,416 |
| |
| $1,869 |
| |
| $1,784 |
| |
| $2,355 |
|
| $1,060 |
| |
| $1,101 |
| |
| $1,416 |
| |
| $1,869 |
| |
| $1,784 |
|
Troubled debt restructurings (2) |
| $955 |
| |
| $777 |
| |
| $704 |
| |
| $493 |
| |
| $346 |
|
| $909 |
| |
| $955 |
| |
| $777 |
| |
| $704 |
| |
| $493 |
|
(1) Our SBO portfolio consists of home equity loans and lines that were originally serviced by others. We now service a portion of this portfolio internally.
(2) TDR balances reported in this line item consist of only those TDRs not reported in the nonaccrual loan or accruing and 90 days or more delinquent loan categories. Thus, only those TDRs that are in compliance with their modified terms and not past due, or those TDRs that are past due 30-89 days and still accruing are included in the TDR balances listed above.
CITIZENS FINANCIAL GROUP, INC.
SELECTED STATISTICAL INFORMATION
Impact of Nonperforming Loans and Leases on Interest Income
The following table presents the gross interest income for both nonaccrual and restructured loans that would have been recognized if such loans had been current in accordance with their original contractual terms, and had been outstanding throughout the year or since origination if held for only part of the year. The table also presents the interest income related to these loans that was actually recognized for the year.
|
| | | |
| (in millions) | For the Year Ended December 31, 2014 2015 |
Gross amount of interest income that would have been recorded in accordance with original contractual terms, and had been outstanding throughout the year or since origination, if held for only part of the year (1) |
| $137126 |
|
| Interest income actually recognized | 1013 |
|
| Total interest income foregone |
| $127113 |
|
(1) Based on the contractual rate that was being charged at the time the loan was restructured or placed on nonaccrual status.
Potential Problem Loans and Leases
This disclosure presents outstanding amounts as well as specific reserves for certain loans and leases where information about possible credit problems of borrowers causes management to have serious doubts as to the ability of such borrowers to comply with the present repayment terms. At December 31, 2014,2015, we did not identify any potential problem loans or leases within the portfolio that were not already included in “—Risk Elements.”
Cross-Border Outstandings
Cross-border outstandings can include loans, receivables, interest-bearing deposits with other banks, other interest-bearing investments and other monetary assets that are denominated in either dollars or other non-local currency.
As of December 31, 2015, 2014 2013 and 2012,2013, there were no aggregate cross-border outstandings from borrowers or counterparties in any country that exceeded 1%, or were between 0.75% and 1% of consolidated total assets.
CITIZENS FINANCIAL GROUP, INC.
SELECTED STATISTICAL INFORMATION
Summary of Loan and Lease Loss Experience
The following table summarizes the changes to our allowance for loan and lease losses:
| | | | As of and for the Year Ended December 31, | As of and for the Year Ended December 31, |
| (dollars in millions) | 2014 | | 2013 | | 2012 | | 2011 | | 2010 | 2015 | | 2014 | | 2013 | | 2012 | | 2011 |
Allowance for Loan and Lease Losses — Beginning: | | |
| Commercial |
| $361 |
| |
| $379 |
| |
| $394 |
| |
| $399 |
| |
| $451 |
|
| $388 |
| |
| $361 |
| |
| $379 |
| |
| $394 |
| |
| $399 |
|
| Commercial real estate | 78 |
| | 111 |
| | 279 |
| | 401 |
| | 317 |
| 61 |
| | 78 |
| | 111 |
| | 279 |
| | 401 |
|
| Leases | 24 |
| | 19 |
| | 18 |
| | 28 |
| | 79 |
| 23 |
| | 24 |
| | 19 |
| | 18 |
| | 28 |
|
Qualitative (1) | 35 |
| | — |
| | — |
| | — |
| | — |
| 72 |
| | 35 |
| | — |
| | — |
| | — |
|
| Total commercial | 498 |
| | 509 |
| | 691 |
| | 828 |
| | 847 |
| 544 |
| | 498 |
| | 509 |
| | 691 |
| | 828 |
|
| Residential mortgages | 104 |
| | 74 |
| | 105 |
| | 118 |
| | 146 |
| 63 |
| | 104 |
| | 74 |
| | 105 |
| | 118 |
|
| Home equity loans | 85 |
| | 82 |
| | 62 |
| | 71 |
| | 67 |
| 50 |
| | 85 |
| | 82 |
| | 62 |
| | 71 |
|
| Home equity lines of credit | 159 |
| | 107 |
| | 116 |
| | 112 |
| | 153 |
| 152 |
| | 159 |
| | 107 |
| | 116 |
| | 112 |
|
Home equity loans serviced by others (2) | 85 |
| | 146 |
| | 241 |
| | 316 |
| | 406 |
| 47 |
| | 85 |
| | 146 |
| | 241 |
| | 316 |
|
Home equity lines of credit serviced by others (2) | 18 |
| | 32 |
| | 52 |
| | 69 |
| | 89 |
| 11 |
| | 18 |
| | 32 |
| | 52 |
| | 69 |
|
| Automobile | 23 |
| | 30 |
| | 40 |
| | 41 |
| | 100 |
| 58 |
| | 23 |
| | 30 |
| | 40 |
| | 41 |
|
| Student | 83 |
| | 75 |
| | 73 |
| | 98 |
| | 79 |
| 93 |
| | 83 |
| | 75 |
| | 73 |
| | 98 |
|
| Credit cards | 72 |
| | 65 |
| | 72 |
| | 119 |
| | 172 |
| 68 |
| | 72 |
| | 65 |
| | 72 |
| | 119 |
|
| Other retail | 34 |
| | 46 |
| | 55 |
| | 77 |
| | 119 |
| 32 |
| | 34 |
| | 46 |
| | 55 |
| | 77 |
|
Qualitative (1) | 60 |
| | — |
| | — |
| | — |
| | — |
| 77 |
| | 60 |
| | — |
| | — |
| | — |
|
| Total retail | 723 |
| | 657 |
| | 816 |
| | 1,021 |
| | 1,331 |
| 651 |
| | 723 |
| | 657 |
| | 816 |
| | 1,021 |
|
| Unallocated | — |
| | 89 |
| | 191 |
| | 156 |
| | 31 |
| — |
| | — |
| | 89 |
| | 191 |
| | 156 |
|
Total allowance for loan and lease losses — beginning |
| $1,221 |
| |
| $1,255 |
| |
| $1,698 |
| |
| $2,005 |
| |
| $2,209 |
|
| $1,195 |
| |
| $1,221 |
| |
| $1,255 |
| |
| $1,698 |
| |
| $2,005 |
|
| Gross Charge-offs: | | | | | | | | | | |
| Commercial | |
| ($30 | ) | |
| ($31 | ) | |
| ($72 | ) | |
| ($127 | ) | |
| ($170 | ) |
| Commercial real estate | | (6 | ) | | (12 | ) | | (36 | ) | | (129 | ) | | (208 | ) |
| Leases | | — |
| | — |
| | — |
| | (1 | ) | | — |
|
| Total commercial | | (36 | ) | | (43 | ) | | (108 | ) | | (257 | ) | | (378 | ) |
| Residential mortgages | | (22 | ) | | (36 | ) | | (54 | ) | | (85 | ) | | (98 | ) |
| Home equity loans | | (34 | ) | | (55 | ) | | (77 | ) | | (121 | ) | | (124 | ) |
| Home equity lines of credit | | (59 | ) | | (80 | ) | | (102 | ) | | (118 | ) | | (106 | ) |
Home equity loans serviced by others (2) | | (32 | ) | | (55 | ) | | (119 | ) | | (220 | ) | | (300 | ) |
Home equity lines of credit serviced by others (2) | | (14 | ) | | (12 | ) | | (27 | ) | | (48 | ) | | (66 | ) |
| Automobile | | (117 | ) | | (41 | ) | | (19 | ) | | (29 | ) | | (47 | ) |
| Student | | (51 | ) | | (54 | ) | | (74 | ) | | (88 | ) | | (97 | ) |
| Credit cards | | (59 | ) | | (64 | ) | | (68 | ) | | (68 | ) | | (85 | ) |
| Other retail | | (56 | ) | | (53 | ) | | (55 | ) | | (76 | ) | | (85 | ) |
| Total retail | | (444 | ) | | (450 | ) | | (595 | ) | | (853 | ) | | (1,008 | ) |
| Total gross charge-offs | |
| ($480 | ) | |
| ($493 | ) | |
| ($703 | ) | |
| ($1,110 | ) | |
| ($1,386 | ) |
| Gross Recoveries: | | | | | | | | | | |
| Commercial | |
| $18 |
| |
| $35 |
| |
| $46 |
| |
| $64 |
| |
| $42 |
|
| Commercial real estate | | 31 |
| | 23 |
| | 40 |
| | 47 |
| | 47 |
|
| Leases | | — |
| | — |
| | 1 |
| | 2 |
| | 3 |
|
| Total commercial | | 49 |
| | 58 |
| | 87 |
| | 113 |
| | 92 |
|
| Residential mortgages | | 12 |
| | 11 |
| | 10 |
| | 16 |
| | 15 |
|
| Home equity loans | | 11 |
| | 24 |
| | 26 |
| | 27 |
| | 27 |
|
| Home equity lines of credit | | 18 |
| | 15 |
| | 19 |
| | 9 |
| | 9 |
|
Home equity loans serviced by others (2) | | 17 |
| | 21 |
| | 23 |
| | 22 |
| | 18 |
|
Home equity lines of credit serviced by others (2) | | 8 |
| | 5 |
| | 5 |
| | 5 |
| | 4 |
|
| Automobile | | 49 |
| | 20 |
| | 12 |
| | 21 |
| | 35 |
|
| Student | | 12 |
| | 9 |
| | 13 |
| | 14 |
| | 12 |
|
| Credit cards | | 8 |
| | 7 |
| | 7 |
| | 8 |
| | 9 |
|
| Other retail | | 12 |
| | — |
| | — |
| | — |
| | — |
|
| Total retail | | 147 |
| | 112 |
| | 115 |
| | 122 |
| | 129 |
|
| Total gross recoveries | |
| $196 |
| |
| $170 |
| |
| $202 |
| |
| $235 |
| |
| $221 |
|
CITIZENS FINANCIAL GROUP, INC.
SELECTED STATISTICAL INFORMATION
|
| | | | | | | | | | | | | | | | | | | |
| | As of and for the Year Ended December 31, |
| (dollars in millions) | 2014 | | 2013 | | 2012 | | 2011 | | 2010 |
| Gross Charge-offs: | | | | | | | | | |
| Commercial |
| ($31 | ) | |
| ($72 | ) | |
| ($127 | ) | |
| ($170 | ) | |
| ($267 | ) |
| Commercial real estate | (12 | ) | | (36 | ) | | (129 | ) | | (208 | ) | | (420 | ) |
| Leases | — |
| | — |
| | (1 | ) | | — |
| | (1 | ) |
| Total commercial | (43 | ) | | (108 | ) | | (257 | ) | | (378 | ) | | (688 | ) |
| Residential mortgages | (36 | ) | | (54 | ) | | (85 | ) | | (98 | ) | | (121 | ) |
| Home equity loans | (55 | ) | | (77 | ) | | (121 | ) | | (124 | ) | | (131 | ) |
| Home equity lines of credit | (80 | ) | | (102 | ) | | (118 | ) | | (106 | ) | | (112 | ) |
Home equity loans serviced by others (2) | (55 | ) | | (119 | ) | | (220 | ) | | (300 | ) | | (443 | ) |
Home equity lines of credit serviced by others (2) | (12 | ) | | (27 | ) | | (48 | ) | | (66 | ) | | (97 | ) |
| Automobile | (41 | ) | | (19 | ) | | (29 | ) | | (47 | ) | | (94 | ) |
| Student | (54 | ) | | (74 | ) | | (88 | ) | | (97 | ) | | (118 | ) |
| Credit cards | (64 | ) | | (68 | ) | | (68 | ) | | (85 | ) | | (176 | ) |
| Other retail | (53 | ) | | (55 | ) | | (76 | ) | | (85 | ) | | (111 | ) |
| Total retail | (450 | ) | | (595 | ) | | (853 | ) | | (1,008 | ) | | (1,403 | ) |
| Total gross charge-offs |
| ($493 | ) | |
| ($703 | ) | |
| ($1,110 | ) | |
| ($1,386 | ) | |
| ($2,091 | ) |
| Gross Recoveries: | | | | | | | | | |
| Commercial |
| $35 |
| |
| $46 |
| |
| $64 |
| |
| $42 |
| |
| $33 |
|
| Commercial real estate | 23 |
| | 40 |
| | 47 |
| | 47 |
| | 23 |
|
| Leases | — |
| | 1 |
| | 2 |
| | 3 |
| | 1 |
|
| Total commercial | 58 |
| | 87 |
| | 113 |
| | 92 |
| | 57 |
|
| Residential mortgages | 11 |
| | 10 |
| | 16 |
| | 15 |
| | 11 |
|
| Home equity loans | 24 |
| | 26 |
| | 27 |
| | 27 |
| | 32 |
|
| Home equity lines of credit | 15 |
| | 19 |
| | 9 |
| | 9 |
| | 5 |
|
Home equity loans serviced by others (2) | 21 |
| | 23 |
| | 22 |
| | 18 |
| | 16 |
|
Home equity lines of credit serviced by others (2) | 5 |
| | 5 |
| | 5 |
| | 4 |
| | 4 |
|
| Automobile | 20 |
| | 12 |
| | 21 |
| | 35 |
| | 46 |
|
| Student | 9 |
| | 13 |
| | 14 |
| | 12 |
| | 57 |
|
| Credit cards | 7 |
| | 7 |
| | 8 |
| | 9 |
| | 14 |
|
| Other retail | — |
| | — |
| | — |
| | — |
| | — |
|
| Total retail | 112 |
| | 115 |
| | 122 |
| | 129 |
| | 185 |
|
| Total gross recoveries |
| $170 |
| |
| $202 |
| |
| $235 |
| |
| $221 |
| |
| $242 |
|
| Net (Charge-offs)/Recoveries: | | | | | | | | | |
| Commercial |
| $4 |
| |
| ($26 | ) | |
| ($63 | ) | |
| ($128 | ) | |
| ($234 | ) |
| Commercial real estate | 11 |
| | 4 |
| | (82 | ) | | (161 | ) | | (397 | ) |
| Leases | — |
| | 1 |
| | 1 |
| | 3 |
| | — |
|
| Total commercial | 15 |
| | (21 | ) | | (144 | ) | | (286 | ) | | (631 | ) |
| Residential mortgages | (25 | ) | | (44 | ) | | (69 | ) | | (83 | ) | | (110 | ) |
| Home equity loans | (31 | ) | | (51 | ) | | (94 | ) | | (97 | ) | | (99 | ) |
| Home equity lines of credit | (65 | ) | | (83 | ) | | (109 | ) | | (97 | ) | | (107 | ) |
Home equity loans serviced by others (2) | (34 | ) | | (96 | ) | | (198 | ) | | (282 | ) | | (427 | ) |
Home equity lines of credit serviced by others (2) | (7 | ) | | (22 | ) | | (43 | ) | | (62 | ) | | (93 | ) |
| Automobile | (21 | ) | | (7 | ) | | (8 | ) | | (12 | ) | | (48 | ) |
| Student | (45 | ) | | (61 | ) | | (74 | ) | | (85 | ) | | (61 | ) |
| Credit cards | (57 | ) | | (61 | ) | | (60 | ) | | (76 | ) | | (162 | ) |
| Other retail | (53 | ) | | (55 | ) | | (76 | ) | | (85 | ) | | (111 | ) |
| Total retail | (338 | ) | | (480 | ) | | (731 | ) | | (879 | ) | | (1,218 | ) |
| Total net (charge-offs)/recoveries |
| ($323 | ) | |
| ($501 | ) | |
| ($875 | ) | |
| ($1,165 | ) | |
| ($1,849 | ) |
| Ratio of net charge-offs to average loans and leases | (0.36 | %) | | (0.59 | %) | | (1.01 | %) | | (1.35 | %) | | (2.04 | %) |
|
| | | | | | | | | | | | | | | | | | | |
| | As of and for the Year Ended December 31, |
| (dollars in millions) | 2015 | | 2014 | | 2013 | | 2012 | | 2011 |
| Net (Charge-offs)/Recoveries: | | | | | | | | | |
| Commercial |
| ($12 | ) | |
| $4 |
| |
| ($26 | ) | |
| ($63 | ) | |
| ($128 | ) |
| Commercial real estate | 25 |
| | 11 |
| | 4 |
| | (82 | ) | | (161 | ) |
| Leases | — |
| | — |
| | 1 |
| | 1 |
| | 3 |
|
| Total commercial | 13 |
| | 15 |
| | (21 | ) | | (144 | ) | | (286 | ) |
| Residential mortgages | (10 | ) | | (25 | ) | | (44 | ) | | (69 | ) | | (83 | ) |
| Home equity loans | (23 | ) | | (31 | ) | | (51 | ) | | (94 | ) | | (97 | ) |
| Home equity lines of credit | (41 | ) | | (65 | ) | | (83 | ) | | (109 | ) | | (97 | ) |
Home equity loans serviced by others (2) | (15 | ) | | (34 | ) | | (96 | ) | | (198 | ) | | (282 | ) |
Home equity lines of credit serviced by others (2) | (6 | ) | | (7 | ) | | (22 | ) | | (43 | ) | | (62 | ) |
| Automobile | (68 | ) | | (21 | ) | | (7 | ) | | (8 | ) | | (12 | ) |
| Student | (39 | ) | | (45 | ) | | (61 | ) | | (74 | ) | | (85 | ) |
| Credit cards | (51 | ) | | (57 | ) | | (61 | ) | | (60 | ) | | (76 | ) |
| Other retail | (44 | ) | | (53 | ) | | (55 | ) | | (76 | ) | | (85 | ) |
| Total retail | (297 | ) | | (338 | ) | | (480 | ) | | (731 | ) | | (879 | ) |
| Total net (charge-offs)/recoveries |
| ($284 | ) | |
| ($323 | ) | |
| ($501 | ) | |
| ($875 | ) | |
| ($1,165 | ) |
| Ratio of net charge-offs to average loans and leases | 0.30 | % | | (0.36 | %) | | (0.59 | %) | | (1.01 | %) | | (1.35 | %) |
| Provision for Loan and Lease Losses: | | | | | | | | | |
| Commercial |
| $— |
| |
| $23 |
| |
| $13 |
| |
| $48 |
| |
| $123 |
|
| Commercial real estate | 25 |
| | (28 | ) | | (36 | ) | | (84 | ) | | 39 |
|
| Leases | — |
| | (1 | ) | | 4 |
| | — |
| | (13 | ) |
Qualitative (1) | 14 |
| | 37 |
| | — |
| | — |
| | — |
|
| Total commercial | 39 |
| | 31 |
| | (19 | ) | | (36 | ) | | 149 |
|
| Residential mortgages | (7 | ) | | (16 | ) | | 53 |
| | 38 |
| | 70 |
|
| Home equity loans | 12 |
| | (4 | ) | | 32 |
| | 114 |
| | 88 |
|
| Home equity lines of credit | 21 |
| | 58 |
| | 85 |
| | 100 |
| | 101 |
|
Home equity loans serviced by others (2) | (3 | ) | | (4 | ) | | 35 |
| | 103 |
| | 207 |
|
Home equity lines of credit serviced by others (2) | (2 | ) | | — |
| | 8 |
| | 23 |
| | 45 |
|
| Automobile | 116 |
| | 56 |
| | — |
| | (2 | ) | | 11 |
|
| Student | 42 |
| | 55 |
| | 69 |
| | 76 |
| | 60 |
|
| Credit cards | 43 |
| | 53 |
| | 71 |
| | 53 |
| | 29 |
|
| Other retail | 40 |
| | 51 |
| | 43 |
| | 67 |
| | 63 |
|
Qualitative (1) | 4 |
| | 17 |
| | — |
| | — |
| | — |
|
| Total retail | 266 |
| | 266 |
| | 396 |
| | 572 |
| | 674 |
|
| Unallocated | — |
| | — |
| | 103 |
| | (102 | ) | | 68 |
|
| Total provision for loan and lease losses |
| $305 |
| |
| $297 |
| |
| $480 |
| |
| $434 |
| |
| $891 |
|
Transfers - General Allowance to Qualitative Allowance: (1) | | | | | | | | | |
| Commercial |
| $— |
| |
| $— |
| |
| $35 |
| |
| $— |
| |
| $— |
|
| Retail | — |
| | — |
| | 60 |
| | — |
| | — |
|
| Unallocated | — |
| | — |
| | (95 | ) | | — |
| | — |
|
| Total Transfers |
| $— |
| |
| $— |
| |
| $— |
| |
| $— |
| |
| $— |
|
Retail Emergence Period Change: (3) | | | | | | | | | |
| Residential mortgages |
| $— |
| |
| $— |
| |
| $21 |
| |
| $— |
| |
| $— |
|
| Home equity loans | — |
| | — |
| | 22 |
| | — |
| | — |
|
| Home equity lines of credit | — |
| | — |
| | 53 |
| | — |
| | — |
|
| Total retail | — |
| | — |
| | 96 |
| | — |
| | — |
|
| Unallocated | — |
| | — |
| | (96 | ) | | — |
| | — |
|
| Total emergence period change |
| $— |
| |
| $— |
| |
| $— |
| |
| $— |
| |
| $— |
|
CITIZENS FINANCIAL GROUP, INC.
SELECTED STATISTICAL INFORMATION
|
| | | | | | | | | | | | | | | | | | | |
| | As of and for the Year Ended December 31, |
| (dollars in millions) | 2014 | | 2013 | | 2012 | | 2011 | | 2010 |
| Provision for Loan and Lease Losses: | | | | | | | | | |
| Commercial |
| $23 |
| |
| $13 |
| |
| $48 |
| |
| $123 |
| |
| $182 |
|
| Commercial real estate | (28 | ) | | (36 | ) | | (84 | ) | | 39 |
| | 481 |
|
| Leases | (1 | ) | | 4 |
| | — |
| | (13 | ) | | (51 | ) |
Qualitative (1) | 37 |
| | — |
| | — |
| | — |
| | — |
|
| Total commercial | 31 |
| | (19 | ) | | (36 | ) | | 149 |
| | 612 |
|
| Residential mortgages | (16 | ) | | 53 |
| | 38 |
| | 70 |
| | 82 |
|
| Home equity loans | (4 | ) | | 32 |
| | 114 |
| | 88 |
| | 103 |
|
| Home equity lines of credit | 58 |
| | 85 |
| | 100 |
| | 101 |
| | 66 |
|
Home equity loans serviced by others (2) | (4 | ) | | 35 |
| | 103 |
| | 207 |
| | 337 |
|
Home equity lines of credit serviced by others (2) | — |
| | 8 |
| | 23 |
| | 45 |
| | 73 |
|
| Automobile | 56 |
| | — |
| | (2 | ) | | 11 |
| | (11 | ) |
| Student | 55 |
| | 69 |
| | 76 |
| | 60 |
| | 80 |
|
| Credit cards | 53 |
| | 71 |
| | 53 |
| | 29 |
| | 109 |
|
| Other retail | 51 |
| | 43 |
| | 67 |
| | 63 |
| | 69 |
|
Qualitative (1) | 17 |
| | — |
| | — |
| | — |
| | — |
|
| Total retail | 266 |
| | 396 |
| | 572 |
| | 674 |
| | 908 |
|
| Unallocated | — |
| | 103 |
| | (102 | ) | | 68 |
| | 125 |
|
| Total provision for loan and lease losses |
| $297 |
| |
| $480 |
| |
| $434 |
| |
| $891 |
| |
| $1,645 |
|
Transfers - General Allowance to Qualitative Allowance: (1) | | | | | | | | | |
| Commercial |
| $— |
| |
| $35 |
| | | | | | |
| Retail | — |
| | 60 |
| | | | | | |
| Unallocated | — |
| | (95 | ) | | | | | | |
| Total Transfers |
| $— |
| |
| $— |
| | | | | | |
Retail Emergence Period Change: (3) | | | | | | | | | |
| Residential mortgages |
| $— |
| |
| $21 |
| | | | | | |
| Home equity loans | — |
| | 22 |
| | | | | | |
| Home equity lines of credit | — |
| | 53 |
| | | | | | |
| Total Retail | — |
| | 96 |
| | | | | | |
| Unallocated | — |
| | (96 | ) | | | | | | |
| Total emergence period change |
| $— |
| |
| $— |
| | | | | | |
| Sale/Other: | | | | | | | | | |
| Commercial |
| $— |
| |
| ($5 | ) | |
| $— |
| |
| $— |
| |
| $— |
|
| Commercial real estate | — |
| | (1 | ) | | (2 | ) | | — |
| | — |
|
| Total commercial | — |
| | (6 | ) | | (2 | ) | | — |
| | — |
|
| Residential mortgages | — |
| | — |
| | — |
| | — |
| | — |
|
| Home equity loans | — |
| | — |
| | — |
| | — |
| | — |
|
| Home equity lines of credit | — |
| | (3 | ) | | — |
| | — |
| | — |
|
Home equity loans serviced by others (2) | — |
| | — |
| | — |
| | — |
| | — |
|
Home equity lines of credit serviced by others (2) | — |
| | — |
| | — |
| | — |
| | — |
|
| Automobile | — |
| | — |
| | — |
| | — |
| | — |
|
| Student | — |
| | — |
| | — |
| | — |
| | — |
|
| Credit cards | — |
| | (3 | ) | | — |
| | — |
| | — |
|
| Other retail | — |
| | — |
| | — |
| | — |
| | — |
|
| Total retail | — |
| | (6 | ) | | — |
| | — |
| | — |
|
| Unallocated | — |
| | (1 | ) | | — |
| | (33 | ) | | — |
|
| Total sale/other |
| $— |
| |
| ($13 | ) | |
| ($2 | ) | |
| ($33 | ) | |
| $— |
|
CITIZENS FINANCIAL GROUP, INC.
SELECTED STATISTICAL INFORMATION
| | | | As of and for the Year Ended December 31, | As of and for the Year Ended December 31, |
| (dollars in millions) | 2014 | | 2013 | | 2012 | | 2011 | | 2010 | 2015 | | 2014 | | 2013 | | 2012 | | 2011 |
| Sale/Other: | | | | | | | | | | |
| Commercial | |
| $— |
| |
| $— |
| |
| ($5 | ) | |
| $— |
| |
| $— |
|
| Commercial real estate | | — |
| | — |
| | (1 | ) | | (2 | ) | | — |
|
| Total commercial | | — |
| | — |
| | (6 | ) | | (2 | ) | | — |
|
| Residential mortgages | | — |
| | — |
| | — |
| | — |
| | — |
|
| Home equity loans | | — |
| | — |
| | — |
| | — |
| | — |
|
| Home equity lines of credit | | — |
| | — |
| | (3 | ) | | — |
| | — |
|
Home equity loans serviced by others (2) | | — |
| | — |
| | — |
| | — |
| | — |
|
Home equity lines of credit serviced by others (2) | | — |
| | — |
| | — |
| | — |
| | — |
|
| Automobile | | — |
| | — |
| | — |
| | — |
| | — |
|
| Student | | — |
| | — |
| | — |
| | — |
| | — |
|
| Credit cards | | — |
| | — |
| | (3 | ) | | — |
| | — |
|
| Other retail | | — |
| | — |
| | — |
| | — |
| | — |
|
| Total retail | | — |
| | — |
| | (6 | ) | | — |
| | — |
|
| Unallocated | | — |
| | — |
| | (1 | ) | | — |
| | (33 | ) |
| Total sale/other | |
| $— |
| |
| $— |
| |
| ($13 | ) | |
| ($2 | ) | |
| ($33 | ) |
Total Allowance for Loan and Lease Losses — Ending: | | | | | | | | | | | | | | | | | | |
| Commercial |
| $388 |
| |
| $361 |
| |
| $379 |
| |
| $394 |
| |
| $399 |
|
| $376 |
| |
| $388 |
| |
| $361 |
| |
| $379 |
| |
| $394 |
|
| Commercial real estate | 61 |
| | 78 |
| | 111 |
| | 279 |
| | 401 |
| 111 |
| | 61 |
| | 78 |
| | 111 |
| | 279 |
|
| Leases | 23 |
| | 24 |
| | 19 |
| | 18 |
| | 28 |
| 23 |
| | 23 |
| | 24 |
| | 19 |
| | 18 |
|
Qualitative (1) | 72 |
| | 35 |
| | — |
| | — |
| | — |
| 86 |
| | 72 |
| | 35 |
| | — |
| | — |
|
| Total commercial | 544 |
| | 498 |
| | 509 |
| | 691 |
| | 828 |
| 596 |
| | 544 |
| | 498 |
| | 509 |
| | 691 |
|
| Residential mortgages | 63 |
| | 104 |
| | 74 |
| | 105 |
| | 118 |
| 46 |
| | 63 |
| | 104 |
| | 74 |
| | 105 |
|
| Home equity loans | 50 |
| | 85 |
| | 82 |
| | 62 |
| | 71 |
| 39 |
| | 50 |
| | 85 |
| | 82 |
| | 62 |
|
| Home equity lines of credit | 152 |
| | 159 |
| | 107 |
| | 116 |
| | 112 |
| 132 |
| | 152 |
| | 159 |
| | 107 |
| | 116 |
|
Home equity loans serviced by others (2) | 47 |
| | 85 |
| | 146 |
| | 241 |
| | 316 |
| 29 |
| | 47 |
| | 85 |
| | 146 |
| | 241 |
|
Home equity lines of credit serviced by others (2) | 11 |
| | 18 |
| | 32 |
| | 52 |
| | 69 |
| 3 |
| | 11 |
| | 18 |
| | 32 |
| | 52 |
|
| Automobile | 58 |
| | 23 |
| | 30 |
| | 40 |
| | 41 |
| 106 |
| | 58 |
| | 23 |
| | 30 |
| | 40 |
|
| Student | 93 |
| | 83 |
| | 75 |
| | 73 |
| | 98 |
| 96 |
| | 93 |
| | 83 |
| | 75 |
| | 73 |
|
| Credit cards | 68 |
| | 72 |
| | 65 |
| | 72 |
| | 119 |
| 60 |
| | 68 |
| | 72 |
| | 65 |
| | 72 |
|
| Other retail | 32 |
| | 34 |
| | 46 |
| | 55 |
| | 77 |
| 28 |
| | 32 |
| | 34 |
| | 46 |
| | 55 |
|
Qualitative (1) | 77 |
| | 60 |
| | — |
| | — |
| | — |
| 81 |
| | 77 |
| | 60 |
| | — |
| | — |
|
| Total Retail | 651 |
| | 723 |
| | 657 |
| | 816 |
| | 1,021 |
| |
| Total retail | | 620 |
| | 651 |
| | 723 |
| | 657 |
| | 816 |
|
| Unallocated | — |
| | — |
| | 89 |
| | 191 |
| | 156 |
| — |
| | — |
| | — |
| | 89 |
| | 191 |
|
Total allowance for loan and lease losses — ending |
| $1,195 |
| |
| $1,221 |
| |
| $1,255 |
| |
| $1,698 |
| |
| $2,005 |
|
| $1,216 |
| |
| $1,195 |
| |
| $1,221 |
| |
| $1,255 |
| |
| $1,698 |
|
Reserve for Unfunded Lending Commitments — Beginning |
| $39 |
| |
| $40 |
| |
| $61 |
| |
| $70 |
| |
| $71 |
|
| $61 |
| |
| $39 |
| |
| $40 |
| |
| $61 |
| |
| $70 |
|
| Provision (Credit) for unfunded lending commitments | 22 |
| | (1 | ) | | (21 | ) | | (9 | ) | | (1 | ) | (3 | ) | | 22 |
| | (1 | ) | | (21 | ) | | (9 | ) |
Reserve for unfunded lending commitments — ending |
| $61 |
| |
| $39 |
| |
| $40 |
| |
| $61 |
| |
| $70 |
|
| $58 |
| |
| $61 |
| |
| $39 |
| |
| $40 |
| |
| $61 |
|
Total Allowance for Credit Losses — Ending |
| $1,256 |
| |
| $1,260 |
| |
| $1,295 |
| |
| $1,759 |
| |
| $2,075 |
|
| $1,274 |
| |
| $1,256 |
| |
| $1,260 |
| |
| $1,295 |
| |
| $1,759 |
|
(1) As discussed in Note 1 “Significant Accounting Policies” to our audited Consolidated Financial Statements in Part II, Item 8 — Financial Statements and Supplementary Data, included elsewhere in this report, the allowance for loan and lease lossesALLL is reviewed separately for commercial and retail loans, and the allowance for loan and lease lossesALLL for each includes an adjustment for qualitative allowance that includes certain risks, factors and events that might not be measured in the statistical analysis. As a result of this adjustment, the unallocated allowance was absorbed into the separately measured commercial and retail qualitative allowance during 2013.
(2) Our SBO portfolio consists of home equity loans and lines that were originally serviced by others. We now service a portion of this portfolio internally.
(3) During December 2013, we updated our estimate of the incurred loss period for certain residential mortgages. This change reflected an analysis of defaulted borrowers and aligned to management’s view that incurred but unrealized losses emerge differently during various points of an economic/business cycle. For further discussion, see Note 5 “Allowance for Credit Losses, Nonperforming Assets, and Concentrations of Credit Risk” to our audited Consolidated Financial Statements in Part II, Item 8 — Financial Statements and Supplementary Data, included elsewhere in this report.
CITIZENS FINANCIAL GROUP, INC.
SELECTED STATISTICAL INFORMATION
Allocation of the Allowance for Loan and Lease Losses
The following table presents an allocation of the allowance for loan and lease lossesALLL by class and the percent of each class of loans and leases to the total loans and leases:
| | | | December 31, | December 31, |
| (dollars in millions) | 2014 | | 2013 | | 2012 | | 2011 | | 2010 | 2015 | | 2014 | | 2013 | | 2012 | | 2011 |
| Commercial |
| $388 |
| 34 | % | |
| $361 |
| 33 | % | |
| $379 |
| 33 | % | |
| $394 |
| 30 | % | |
| $399 |
| 25 | % |
| $376 |
| 34 | % | |
| $388 |
| 34 | % | |
| $361 |
| 33 | % | |
| $379 |
| 33 | % | |
| $394 |
| 30 | % |
| Commercial real estate | 61 |
| 8 |
| | 78 |
| 8 |
| | 111 |
| 7 |
| | 279 |
| 9 |
| | 401 |
| 10 |
| 111 |
| 9 |
| | 61 |
| 8 |
| | 78 |
| 8 |
| | 111 |
| 7 |
| | 279 |
| 9 |
|
| Leases | 23 |
| 4 |
| | 24 |
| 5 |
| | 19 |
| 4 |
| | 18 |
| 3 |
| | 28 |
| 4 |
| 23 |
| 4 |
| | 23 |
| 4 |
| | 24 |
| 5 |
| | 19 |
| 4 |
| | 18 |
| 3 |
|
| Qualitative | 72 |
| N/A |
| | 35 |
| N/A |
| | — |
| N/A |
| | — |
| N/A |
| | — |
| N/A |
| 86 |
| N/A |
| | 72 |
| N/A |
| | 35 |
| N/A |
| | — |
| N/A |
| | — |
| N/A |
|
| Total commercial | 544 |
| 46 |
| | 498 |
| 46 |
| | 509 |
| 44 |
| | 691 |
| 42 |
| | 828 |
| 39 |
| 596 |
| 47 |
| | 544 |
| 46 |
| | 498 |
| 46 |
| | 509 |
| 44 |
| | 691 |
| 42 |
|
| Residential mortgages | 63 |
| 13 |
| | 104 |
| 11 |
| | 74 |
| 11 |
| | 105 |
| 11 |
| | 118 |
| 11 |
| 46 |
| 13 |
| | 63 |
| 13 |
| | 104 |
| 11 |
| | 74 |
| 11 |
| | 105 |
| 11 |
|
| Home equity loans | 50 |
| 4 |
| | 85 |
| 5 |
| | 82 |
| 6 |
| | 62 |
| 8 |
| | 71 |
| 10 |
| 39 |
| 3 |
| | 50 |
| 4 |
| | 85 |
| 5 |
| | 82 |
| 6 |
| | 62 |
| 8 |
|
| Home equity lines of credit | 152 |
| 16 |
| | 159 |
| 18 |
| | 107 |
| 19 |
| | 116 |
| 19 |
| | 112 |
| 17 |
| 132 |
| 15 |
| | 152 |
| 16 |
| | 159 |
| 18 |
| | 107 |
| 19 |
| | 116 |
| 19 |
|
Home equity loans serviced by others (1) | 47 |
| 1 |
| | 85 |
| 2 |
| | 146 |
| 2 |
| | 241 |
| 3 |
| | 316 |
| 4 |
| 29 |
| 1 |
| | 47 |
| 1 |
| | 85 |
| 2 |
| | 146 |
| 2 |
| | 241 |
| 3 |
|
Home equity lines of credit serviced by others (1) | 11 |
| 1 |
| | 18 |
| 1 |
| | 32 |
| 1 |
| | 52 |
| 1 |
| | 69 |
| 2 |
| 3 |
| — |
| | 11 |
| 1 |
| | 18 |
| 1 |
| | 32 |
| 1 |
| | 52 |
| 1 |
|
| Automobile | 58 |
| 14 |
| | 23 |
| 11 |
| | 30 |
| 10 |
| | 40 |
| 9 |
| | 41 |
| 9 |
| 106 |
| 14 |
| | 58 |
| 14 |
| | 23 |
| 11 |
| | 30 |
| 10 |
| | 40 |
| 9 |
|
| Student | 93 |
| 2 |
| | 83 |
| 3 |
| | 75 |
| 3 |
| | 73 |
| 3 |
| | 98 |
| 3 |
| 96 |
| 4 |
| | 93 |
| 2 |
| | 83 |
| 3 |
| | 75 |
| 3 |
| | 73 |
| 3 |
|
| Credit cards | 68 |
| 2 |
| | 72 |
| 2 |
| | 65 |
| 2 |
| | 72 |
| 2 |
| | 119 |
| 2 |
| 60 |
| 2 |
| | 68 |
| 2 |
| | 72 |
| 2 |
| | 65 |
| 2 |
| | 72 |
| 2 |
|
| Other retail | 32 |
| 1 |
| | 34 |
| 1 |
| | 46 |
| 2 |
| | 55 |
| 2 |
| | 77 |
| 3 |
| 28 |
| 1 |
| | 32 |
| 1 |
| | 34 |
| 1 |
| | 46 |
| 2 |
| | 55 |
| 2 |
|
| Qualitative | 77 |
| N/A |
| | 60 |
| N/A |
| | — |
| N/A |
| | — |
| N/A |
| | — |
| N/A |
| 81 |
| N/A |
| | 77 |
| N/A |
| | 60 |
| N/A |
| | — |
| N/A |
| | — |
| N/A |
|
| Total retail | 651 |
| 54 |
| | 723 |
| 54 |
| | 657 |
| 56 |
| | 816 |
| 58 |
| | 1,021 |
| 61 |
| 620 |
| 53 |
| | 651 |
| 54 |
| | 723 |
| 54 |
| | 657 |
| 56 |
| | 816 |
| 58 |
|
| Unallocated | N/A |
| N/A |
| | N/A |
| N/A |
| | 89 |
| N/A |
| | 191 |
| N/A |
| | 156 |
| N/A |
| N/A |
| N/A |
| | N/A |
| N/A |
| | N/A |
| N/A |
| | 89 |
| N/A |
| | 191 |
| N/A |
|
| Total loans and leases |
| $1,195 |
| 100 | % | |
| $1,221 |
| 100 | % | |
| $1,255 |
| 100 | % | |
| $1,698 |
| 100 | % | |
| $2,005 |
| 100 | % |
| $1,216 |
| 100 | % | |
| $1,195 |
| 100 | % | |
| $1,221 |
| 100 | % | |
| $1,255 |
| 100 | % | |
| $1,698 |
| 100 | % |
(1) Our SBO portfolio consists of home equity loans and lines that were originally serviced by others. We now service a portion of this portfolio internally.
Deposits
The following table presents the average balances and average interest rates paid for deposits. For further discussion, see Note 1011 “Deposits” to our audited Consolidated Financial Statements in Part II, Item 8 — Financial Statements and Supplementary Data, included elsewhere in this report.
| | | | For the Year Ended December 31, | For the Year Ended December 31, |
| (dollars in millions) | 2014 | | 2013 | | 2012 | 2015 | | 2014 | | 2013 |
| | Average Balances |
| | | Average Balances |
| | | Average Balances |
| | Average Balances |
| | | Average Balances |
| | | Average Balances |
| |
Noninterest-bearing demand deposits (1) (2) |
| $25,739 |
| | |
| $25,399 |
| | |
| $25,053 |
| |
| $26,606 |
| | |
| $25,739 |
| | |
| $25,399 |
| |
| | Average Balances |
| Yields/ Rates |
| | Average Balances |
| Yields/ Rates |
| | Average Balances |
| Yields/ Rates |
| Average Balances |
| Yields/ Rates |
| | Average Balances |
| Yields/ Rates |
| | Average Balances |
| Yields/ Rates |
|
| Checking with interest |
| $14,507 |
| 0.08 | % | |
| $14,096 |
| 0.06 | % | |
| $13,522 |
| 0.08 | % |
| $16,666 |
| 0.11 | % | |
| $14,507 |
| 0.08 | % | |
| $14,096 |
| 0.06 | % |
| Money market and savings | 39,579 |
| 0.19 |
| | 42,575 |
| 0.25 |
| | 41,249 |
| 0.29 |
| 43,458 |
| 0.27 |
| | 39,579 |
| 0.19 |
| | 42,575 |
| 0.25 |
|
| Term deposits | 10,317 |
| 0.65 |
| | 11,266 |
| 0.80 |
| | 13,534 |
| 1.20 |
| 12,424 |
| 0.82 |
| | 10,317 |
| 0.65 |
| | 11,266 |
| 0.80 |
|
Total interest-bearing deposits (1) (2) |
| $64,403 |
| 0.24 | % | |
| $67,937 |
| 0.30 | % | |
| $68,305 |
| 0.43 | % |
| $72,548 |
| 0.33 | % | |
| $64,403 |
| 0.24 | % | |
| $67,937 |
| 0.30 | % |
(1) The aggregate amount of deposits by foreign depositors in domestic offices was approximately $1$1.1 billion as of December 31, 2015, 2014 2013 and 2012.2013.
(2) Excludes deposits held for sale.
CITIZENS FINANCIAL GROUP, INC.
SELECTED STATISTICAL INFORMATION
Time Certificates of Deposit of $100,000 or More
The following table presents the amount of time certificates of deposit of $100,000 or more, segregated by time remaining until maturity:
|
| | | |
| (in millions) | December 31, 20142015 |
| Three months or less |
| $3,2443,136 |
|
| After three months through six months | 4541,145 |
|
| After six months through twelve months | 1,0911,329 |
|
| After twelve months | 1,572675 |
|
| Total term deposits |
| $6,3616,285 |
|
Return on Equity and Assets
The following table presents our return on average total assets, return on average common equity, dividend payout ratio and average equity to average assets ratio:
| | | | December 31, | December 31, |
| | 2014 | | 2013 | | 2012 | 2015 | | 2014 | | 2013 |
| Return on average total assets | 0.68 | % | | (2.83 | %) | | 0.50 | % | 0.62 | % | | 0.68 | % | | (2.83 | )% |
| Return on average common equity | 4.46 |
| | (15.69 | ) | | 2.69 |
| 4.30 |
| | 4.46 |
| | (15.69 | ) |
| Dividend payout ratio | 92.05 |
| | (34.58 | ) | | 23.31 |
| 25.73 |
| | 92.05 |
| | (34.58 | ) |
| Average equity to average assets ratio | 15.20 |
| | 18.06 |
| | 18.75 |
| 14.46 |
| | 15.20 |
| | 18.06 |
|
Short-Term Borrowed Funds
The following table presentstables present amounts and weighted-average rates for categories of short-term borrowed funds. For further discussion, see Note 1112 “Borrowed Funds” to our audited Consolidated Financial Statements in Part II, Item 8 — Financial Statements and Supplementary Data, included elsewhere in this report.
|
| | | | | | | |
| | December 31, |
| (in millions) | 2015 |
| | 2014 |
|
| Federal funds purchased |
| $— |
| |
| $574 |
|
| Securities sold under agreements to repurchase | 802 |
| | 3,702 |
|
| Other short-term borrowed funds (primarily current portion of FHLB advances) | 2,630 |
| | 6,253 |
|
| Total short-term borrowed funds |
| $3,432 |
| |
| $10,529 |
|
|
| | | | | | | |
| | December 31, |
| (in millions) | 2014 |
| | 2013 |
|
| Federal funds purchased |
| $574 |
| |
| $689 |
|
| Securities sold under agreements to repurchase | 3,702 |
| | 4,102 |
|
| Other short-term borrowed funds | 6,253 |
| | 2,251 |
|
| Total short-term borrowed funds |
| $10,529 |
| |
| $7,042 |
|
|
| | | | | | | | | | | |
| | December 31, |
| (dollars in millions) | 2015 | | 2014 | | 2013 |
| Weighted-average interest rate at year-end: | | | | | |
| Federal funds purchased and securities sold under agreements to repurchase | 0.15 | % | | 0.14 | % | | 0.09 | % |
| Other short-term borrowed funds (primarily current portion of FHLB advances) | 0.44 |
| | 0.26 |
| | 0.20 |
|
| Maximum amount outstanding at month-end during the year: | | | | | |
| Federal funds purchased and securities sold under agreements to repurchase |
| $5,375 |
| |
| $7,022 |
| |
| $5,114 |
|
| Other short-term borrowed funds (primarily current portion of FHLB advances) | 7,004 |
| | 7,702 |
| | 2,251 |
|
| Average amount outstanding during the year: | | | | | |
| Federal funds purchased and securities sold under agreements to repurchase |
| $3,364 |
| |
| $5,699 |
| |
| $2,400 |
|
| Other short-term borrowed funds (primarily current portion of FHLB advances) | 5,865 |
| | 5,640 |
| | 251 |
|
| Weighted-average interest rate during the year: | | | | | |
| Federal funds purchased and securities sold under agreements to repurchase | 0.22 | % | | 0.12 | % | | 0.31 | % |
| Other short-term borrowed funds (primarily current portion of FHLB advances) | 0.28 |
| | 0.25 |
| | 0.44 |
|
CITIZENS FINANCIAL GROUP, INC.
SELECTED STATISTICAL INFORMATION
|
| | | | | | | | | | | |
| | December 31, |
| (dollars in millions) | 2014 | | 2013 | | 2012 |
| Weighted-average interest rate at year-end: | | | | | |
| Federal funds purchased and securities sold under agreements to repurchase | 0.14 | % | | 0.09 | % | | 0.10 | % |
| Other short-term borrowed funds | 0.26 |
| | 0.20 |
| | 0.29 |
|
| Maximum amount outstanding at month-end during the year: | | | | | |
| Federal funds purchased and securities sold under agreements to repurchase |
| $7,022 |
| |
| $5,114 |
| |
| $4,393 |
|
| Other short-term borrowed funds | 7,702 |
| | 2,251 |
| | 5,050 |
|
| Average amount outstanding during the year: | | | | | |
| Federal funds purchased and securities sold under agreements to repurchase |
| $5,699 |
| |
| $2,400 |
| |
| $2,716 |
|
| Other short-term borrowed funds | 5,640 |
| | 251 |
| | 3,026 |
|
| Weighted-average interest rate during the year: | | | | | |
| Federal funds purchased and securities sold under agreements to repurchase | 0.12 | % | | 0.31 | % | | 0.22 | % |
| Other short-term borrowed funds | 0.25 |
| | 0.44 |
| | 0.33 |
|
CITIZENS FINANCIAL GROUP, INC.
ITEM 7A. QUANTITATIVE AND QUALITATIVE DISCLOSURES ABOUT MARKET RISK
The information presented in the “Market Risk” section of Part II, Item 7 — Management’s Discussion and Analysis of Financial Condition and Results of Operations and is incorporated herein by reference.
CITIZENS FINANCIAL GROUP, INC.
GLOSSARY OF ACRONYMS AND TERMS
The following listing provides a comprehensive reference of common acronyms and terms used throughout the document:
|
| | |
AFS | | Available For Sale |
ALLL | | Allowance for Loan and Lease Losses |
AOCI | | Accumulated Other Comprehensive Income |
ATM | | Automatic Teller Machine |
BHC | | Bank Holding Company |
CBNA | | Citizens Bank, National Association |
CBPA | | Citizens Bank of Pennsylvania |
CEO | | Chief Executive Officer |
Citizens or CFG or the Company | | Citizens Financial Group, Inc. and its Subsidiaries |
CMO | | Collateralized Mortgage Obligation |
CSA | | Credit Support Annex |
EPS | | Earnings Per Share |
ESPP | | Employee Stock Purchase Program |
ERISA | | Employee Retirement Income Security Act of 1974 |
Fannie Mae (FNMA) | | Federal National Mortgage Association
|
FASB | | Financial Accounting Standards Board |
FDIC | | Federal Deposit Insurance Corporation |
FHLB | | Federal Home Loan Bank |
FRB | | Federal Reserve Bank |
Freddie Mac (FHLMC) | | Federal Home Loan Mortgage Corporation |
FTP | | Funds Transfer Pricing |
GAAP | | Accounting Principles Generally Accepted in the United States of America |
GDP | | Gross Domestic Product |
HTM | | Held To Maturity |
ILP | | Incurred Loss Period |
IPO | | Initial Public Offering |
IT | | Information Technology |
LIBOR | | London Interbank Offered Rate |
LTV | | Loan-to-Value |
MBS | | Mortgage-Backed Securities |
MSR | | Mortgage Servicing Right |
OCC | | Office of the Comptroller of the Currency |
OCI | | Other Comprehensive Income |
OIS | | Overnight Index Swap |
peer | | BB&T, Comerica, Fifth Third, KeyCorp, M&T, PNC, Regions, SunTrust and U.S. Bancorp |
RBS | | The Royal Bank of Scotland plc |
RBS Group | | The Royal Bank of Scotland Group plc and its subsidiaries |
RBSG | | The Royal Bank of Scotland Group plc |
RPA | | Risk Participation Agreement |
SBO | | Serviced by Others loan portfolio |
SEC | | United States Securities and Exchange Commission |
TDR | | Troubled Debt Restructuring |
CITIZENS FINANCIAL GROUP, INC.
FINANCIAL STATEMENTS AND SUPPLEMENTARY DATA
ITEM 8. FINANCIAL STATEMENTS AND SUPPLEMENTARY DATA
CITIZENS FINANCIAL GROUP, INC.
EXPLANATORY NOTEREPORT OF MANAGEMENT ON INTERNAL CONTROL OVER FINANCIAL REPORTING
This annual report does not include a report
Management is responsible for establishing and maintaining an adequate system of management’s assessment regarding internal control over financial reporting or an attestation reportas defined in Rule 13a-15(f) of the Securities Exchange Act of 1934. The Company’s system of internal control over financial reporting is designed, under the supervision of the Chief Executive Officer and the Chief Financial Officer, to provide reasonable assurance regarding the reliability of financial reporting and the preparation of financial statements for external purposes in accordance with accounting principles generally accepted in the United States of America.
Because of its inherent limitations, internal control over financial reporting may not prevent or detect all misstatements. Also, projections of any evaluation of effectiveness to future periods are subject to the risk that controls may become inadequate because of changes in conditions or that the degree of compliance with the policies or procedures may deteriorate.
Management assessed the effectiveness of the Company’s system of internal control over financial reporting as of December 31, 2015 based on the framework set forth by the Committee of Sponsoring Organizations of the Treadway Commission in Internal Control — Integrated Framework (2013). Based on that assessment, management concluded that, as of December 31, 2015, the Company’s internal control over financial reporting is effective.
The Company’s internal control over financial reporting as of December 31, 2015 has been audited by Deloitte & Touche LLP, an independent registered public accounting firm, due to a transition period established by rulesas stated in their accompanying report, appearing on page 124, which expresses an unqualified opinion on the effectiveness of the Securities and Exchange Commission for newly public companies.
Company’s internal control over financial reporting.
CITIZENS FINANCIAL GROUP, INC.
REPORT OF INDEPENDENT REGISTERED PUBLIC ACCOUNTING FIRM ON THE CONSOLIDATED FINANCIAL STATEMENTS
To the Board of Directors and Stockholders of
Citizens Financial Group, Inc.
Providence, Rhode Island
We have audited the accompanying consolidated financial statementsbalance sheets of Citizens Financial Group, Inc. and its subsidiaries (the “Company”), which comprise the consolidated balance sheets as of December 31, 2015 and 2014, and 2013, and the related consolidated statements of operations, other comprehensive income, (loss), changes in stockholders’ equity, and cash flows for each of the three years in the period ended December 31, 2014, and the related notes to the consolidated financial statements.2015. These financial statements are the responsibility of the Company’s management. Our responsibility is to express an opinion on these financial statements based on our audits.
We conducted our audits in accordance with the standards of the Public Company Accounting Oversight Board (United States). Those standards require that we plan and perform the audit to obtain reasonable assurance about whether the financial statements are free from material misstatement. An audit includes examining, on a test basis, evidence supporting the amounts and disclosures in the financial statements. An audit also includes assessing the accounting principles used and significant estimates made by management, as well as evaluating the overall financial statement presentation. We believe that our audits provide a reasonable basis for our opinion.
In our opinion, such financial statements present fairly, in all material respects, the financial position of the Company, at December 31, 20142015 and 2013,2014, and the results of its operations and its cash flows for each of the three years in the period ended December 31, 2014,2015, in conformity with accounting principles generally accepted in the United States of America.
We have also audited, in accordance with the standards of the Public Company Accounting Oversight Board (United States), the Company’s internal control over financial reporting as of December 31, 2015, based on the criteria established in Internal Control— Integrated Framework (2013) issued by the Committee of Sponsoring Organizations of the Treadway Commission and our report dated February 26, 2016 expressed an unqualified opinion on the Company’s internal control over financial reporting.
/s/ Deloitte & Touche LLP
Boston, Massachusetts
March 2, 2015
February 26, 2016
CITIZENS FINANCIAL GROUP, INC.
REPORT OF INDEPENDENT REGISTERED PUBLIC ACCOUNTING FIRM ON INTERNAL CONTROL OVER FINANCIAL REPORTING
To the Board of Directors and Stockholders of
Citizens Financial Group, Inc.
Providence, Rhode Island
We have audited the internal control over financial reporting of Citizens Financial Group, Inc. and its subsidiaries (the “Company”), as of December 31, 2015, based on criteria established in Internal Control — Integrated Framework (2013) issued by the Committee of Sponsoring Organizations of the Treadway Commission. The Company’s management is responsible for maintaining effective internal control over financial reporting and for its assessment of the effectiveness of internal control over financial reporting, included in the accompanying Management’s Assessment of Internal Control over Financial Reporting. Our responsibility is to express an opinion on the Company’s internal control over financial reporting based on our audit.
We conducted our audit in accordance with the standards of the Public Company Accounting Oversight Board (United States). Those standards require that we plan and perform the audit to obtain reasonable assurance about whether effective internal control over financial reporting was maintained in all material respects. Our audit included obtaining an understanding of internal control over financial reporting, assessing the risk that a material weakness exists, testing and evaluating the design and operating effectiveness of internal control based on the assessed risk, and performing such other procedures as we considered necessary in the circumstances. We believe that our audit provides a reasonable basis for our opinion.
A company’s internal control over financial reporting is a process designed, or under the supervision of, the company’s principal executive and principal financial officers, or persons performing similar functions, and effected by the company’s board of directors, management, and other personnel to provide reasonable assurance regarding the reliability of financial reporting and the preparation of financial statements for external purposes in accordance with generally accepted accounting principles. A company’s internal control over financial reporting includes those policies and procedures that (1) pertain to the maintenance of records that, in reasonable detail, accurately and fairly reflect the transactions and dispositions of the assets of the company; (2) provide reasonable assurance that transactions are recorded as necessary to permit preparation of financial statements in accordance with generally accepted accounting principles, and that receipts and expenditures of the company are being made only in accordance with authorizations of management and directors of the company; and (3) provide reasonable assurance regarding prevention or timely detection of unauthorized acquisition, use, or disposition of the company’s assets that could have a material effect on the financial statements.
Because of its inherent limitations of internal control over financial reporting, including the possibility of collusion or improper management override of controls, material misstatements due to error or fraud may not be prevented or detected on a timely basis. Also, projections of any evaluation of effectiveness of the internal control over financial reporting to future periods are subject to the risk that the controls may become inadequate because of changes in conditions, or that the degree of compliance with the policies or procedures may deteriorate.
In our opinion, the Company maintained, in all material respects, effective internal control over financial reporting as of December 31, 2015, based on the criteria established in Internal Control - Integrated Framework (2013) issued by the Committee of Sponsoring Organizations of the Treadway Commission.
We also have audited, in accordance with the standards of the Public Company Accounting Oversight Board (United States), the financial statements as of and for the year ended December 31, 2015 of the Company and our report dated February 26, 2016 expressed an unqualified opinion on those financial statements.
/s/ Deloitte & Touche LLP
Boston, Massachusetts
February 26, 2016
CITIZENS FINANCIAL GROUP, INC.
CONSOLIDATED BALANCE SHEETS
| | | (in millions, except share data) | December 31, 2014 | | December 31, 2013 | December 31, 2015 | | December 31, 2014 |
| ASSETS: | | | | | | |
| Cash and due from banks |
| $1,171 |
| |
| $1,406 |
|
| $1,099 |
| |
| $1,171 |
|
| Interest-bearing cash and due from banks | 2,105 |
| | 1,351 |
| 1,986 |
| | 2,105 |
|
| Interest-bearing deposits in banks | 370 |
| | 233 |
| 356 |
| | 370 |
|
| Securities available for sale, at fair value | 18,656 |
| | 15,995 |
| |
| Securities held to maturity (fair value of $5,193 and $4,257, respectively) | 5,148 |
| | 4,315 |
| |
| Other investment securities | 872 |
| | 935 |
| |
| Securities available for sale, at fair value (including $4,283 and $7,181 pledged to creditors, respectively) (a) | | 17,884 |
| | 18,656 |
|
| Securities held to maturity (including $135 and $40 pledged to creditors, respectively, and fair value of $5,297 and $5,193, respectively) (a) | | 5,258 |
| | 5,148 |
|
| Other investment securities, at fair value | | 70 |
| | 33 |
|
| Other investment securities, at cost | | 863 |
| | 867 |
|
| Loans held for sale, at fair value | 256 |
| | 176 |
| 325 |
| | 256 |
|
| Other loans held for sale | 25 |
| | 1,078 |
| 40 |
| | 25 |
|
| Loans and leases | 93,410 |
| | 85,859 |
| 99,042 |
| | 93,410 |
|
| Less: Allowance for loan and lease losses | 1,195 |
| | 1,221 |
| 1,216 |
| | 1,195 |
|
| Net loans and leases | 92,215 |
| | 84,638 |
| 97,826 |
| | 92,215 |
|
| Derivative assets (related party balances of $1 and $0, respectively) | 629 |
| | 650 |
| |
| Derivative assets (related party balances of $52 and $1, respectively) | | 625 |
| | 629 |
|
| Premises and equipment, net | 595 |
| | 592 |
| 595 |
| | 595 |
|
| Bank-owned life insurance | 1,527 |
| | 1,339 |
| 1,564 |
| | 1,527 |
|
| Goodwill | 6,876 |
| | 6,876 |
| 6,876 |
| | 6,876 |
|
| Due from broker | — |
| | 446 |
| |
| Other branch assets held for sale | — |
| | 46 |
| |
| Other assets (related party balances of $7 and $63, respectively) | 2,412 |
| | 2,078 |
| |
| Other assets (related party balances of $7 and $7, respectively) | | 2,841 |
| | 2,384 |
|
| TOTAL ASSETS |
| $132,857 |
| |
| $122,154 |
|
| $138,208 |
| |
| $132,857 |
|
| LIABILITIES AND STOCKHOLDERS' EQUITY: | | | | |
| LIABILITIES AND STOCKHOLDERS’ EQUITY: | | | | |
| LIABILITIES: | | | | | | |
| Deposits: | | | | | | |
| Noninterest-bearing |
| $26,086 |
| |
| $24,931 |
|
| $27,649 |
| |
| $26,086 |
|
| Interest-bearing (related party balances of $5 and $5, respectively) | 69,621 |
| | 61,972 |
| |
| Interest-bearing (related party balances of $2 and $5, respectively) | | 74,890 |
| | 69,621 |
|
| Total deposits | 95,707 |
| | 86,903 |
| 102,539 |
| | 95,707 |
|
| Deposits held for sale | — |
| | 5,277 |
| |
| Federal funds purchased and securities sold under agreements to repurchase | 4,276 |
| | 4,791 |
| 802 |
| | 4,276 |
|
| Other short-term borrowed funds | 6,253 |
| | 2,251 |
| 2,630 |
| | 6,253 |
|
| Derivative liabilities (related party balances of $387 and $835, respectively) | 612 |
| | 939 |
| |
| Derivative liabilities (related party balances of $212 and $387, respectively) | | 485 |
| | 612 |
|
| Deferred taxes, net | 493 |
| | 199 |
| 730 |
| | 493 |
|
| Long-term borrowed funds (related party balances of $2,000 and $1,000, respectively) | 4,642 |
| | 1,405 |
| |
| Other liabilities (related party balances of $30 and $27, respectively) | 1,606 |
| | 1,193 |
| |
| Long-term borrowed funds (related party balances of $1,250 and $2,000, respectively) | | 9,886 |
| | 4,642 |
|
| Other liabilities (related party balances of $15 and $30, respectively) | | 1,490 |
| | 1,606 |
|
| TOTAL LIABILITIES |
| $113,589 |
| |
| $102,958 |
|
| $118,562 |
| |
| $113,589 |
|
Contingencies (refer to Note 16)
|
| |
| |
| STOCKHOLDERS' EQUITY: | | | | |
| Preferred stock: | | | | |
| $25.00 par value, 100,000,000 shares authorized, no shares outstanding at December 31, 2014, and $1.00 par value, 30,000 shares authorized, no shares outstanding at December 31, 2013 |
| $— |
| |
| $— |
| |
| Contingencies (refer to Note 17) | |
| |
|
| STOCKHOLDERS’ EQUITY: | | | | |
| Preferred stock, $25.00 par value, authorized 100,000,000 shares: | | | | |
Series A, non-cumulative perpetual, $25.00 par value (liquidation preference $1,000), 250,000 shares authorized and issued net of issuance costs and related premium at December 31, 2015, and no shares outstanding at December 31, 2014
| |
| $247 |
| |
| $— |
|
| Common stock: | | | | | | |
| $0.01 par value, 1,000,000,000 shares authorized, 560,262,638 shares issued and 545,884,519 shares outstanding at December 31, 2014, and 559,998,324 shares issued and outstanding at December 31, 2013 | 6 |
| | 6 |
| |
| $0.01 par value, 1,000,000,000 shares authorized, 563,117,415 shares issued and 527,774,428 shares outstanding at December 31, 2015 and 1,000,000,000 shares authorized, 560,262,638 shares issued and 545,884,519 shares outstanding at December 31, 2014 | | 6 |
| | 6 |
|
| Additional paid-in capital | 18,676 |
| | 18,603 |
| 18,725 |
| | 18,676 |
|
| Retained earnings | 1,294 |
| | 1,235 |
| 1,913 |
| | 1,294 |
|
| Treasury stock, at cost, 14,378,119 and 0 shares at December 31, 2014 and 2013, respectively | (336 | ) | | — |
| |
| Treasury Stock, at cost, 35,342,987 and 14,378,119 shares at December 31, 2015 and December 31, 2014, respectively | | (858 | ) | | (336 | ) |
| Accumulated other comprehensive loss | (372 | ) | | (648 | ) | (387 | ) | | (372 | ) |
| TOTAL STOCKHOLDERS' EQUITY |
| $19,268 |
| |
| $19,196 |
| |
| TOTAL LIABILITIES AND STOCKHOLDERS' EQUITY |
| $132,857 |
| |
| $122,154 |
| |
| TOTAL STOCKHOLDERS’ EQUITY | |
| $19,646 |
| |
| $19,268 |
|
| TOTAL LIABILITIES AND STOCKHOLDERS’ EQUITY | |
| $138,208 |
| |
| $132,857 |
|
(a) Includes only collateral pledged by the Company where counterparties have the right to sell or pledge the collateral.
The accompanying Notes to Consolidated Financial Statements are an integral part of these statements.
CITIZENS FINANCIAL GROUP, INC.
CONSOLIDATED STATEMENTS OF OPERATIONS
| | | | Year Ended December 31, | Year Ended December 31, |
| (in millions, except share and per-share data) | 2014 |
| | 2013 |
| | 2012 |
| 2015 | 2014 | 2013 |
| INTEREST INCOME: | | | | | | |
| Interest and fees on loans and leases (related party balances of $72, $56 and $0, respectively) |
| $3,012 |
| |
| $3,001 |
| |
| $3,205 |
| |
| Interest and fees on loans held for sale | 5 |
| | 12 |
| | 17 |
| |
| Interest and fees on loans and leases (related party balances of $70, $72 and $56, respectively) | |
| $3,211 |
|
| $3,012 |
|
| $3,001 |
|
| Interest and fees on loans held for sale, at fair value | | 10 |
| 5 |
| 12 |
|
| Interest and fees on other loans held for sale | 23 |
| | — |
| | — |
| 7 |
| 23 |
| — |
|
| Investment securities | 619 |
| | 477 |
| | 620 |
| 621 |
| 619 |
| 477 |
|
| Interest-bearing deposits in banks | 5 |
| | 11 |
| | 4 |
| 5 |
| 5 |
| 11 |
|
| Total interest income | 3,664 |
| | 3,501 |
| | 3,846 |
| 3,854 |
| 3,664 |
| 3,501 |
|
| INTEREST EXPENSE: | | | | | | |
| Deposits (related party balances of $0, $15 and $104, respectively) | 156 |
| | 216 |
| | 375 |
| |
| Deposits (related party balances of $0, $0 and $15, respectively) | | 237 |
| 156 |
| 216 |
|
| Deposits held for sale | 4 |
| | — |
| | — |
| — |
| 4 |
| — |
|
| Federal funds purchased and securities sold under agreements to repurchase (related party balances of $24, $184, and $117, respectively) | 32 |
| | 192 |
| | 119 |
| |
| Other short-term borrowed funds (related party balances of $75, $3, and $90, respectively) | 89 |
| | 4 |
| | 101 |
| |
| Long-term borrowed funds (related party balances of $64, $16 and $9, respectively) | 82 |
| | 31 |
| | 24 |
| |
| Federal funds purchased and securities sold under agreements to repurchase (related party balances of $7, $24 and $184, respectively) | | 16 |
| 32 |
| 192 |
|
| Other short-term borrowed funds (related party balances of $51, $75 and $3, respectively) | | 67 |
| 89 |
| 4 |
|
| Long-term borrowed funds (related party balances of $76, $64 and $16, respectively) | | 132 |
| 82 |
| 31 |
|
| Total interest expense | 363 |
| | 443 |
| | 619 |
| 452 |
| 363 |
| 443 |
|
| Net interest income | 3,301 |
| | 3,058 |
| | 3,227 |
| 3,402 |
| 3,301 |
| 3,058 |
|
| Provision for credit losses | 319 |
| | 479 |
| | 413 |
| 302 |
| 319 |
| 479 |
|
| Net interest income after provision for credit losses | 2,982 |
| | 2,579 |
| | 2,814 |
| 3,100 |
| 2,982 |
| 2,579 |
|
| NONINTEREST INCOME: | | | | | | |
| Service charges and fees (related party balances of $6, $15 and $23, respectively) | 574 |
| | 640 |
| | 704 |
| |
| Service charges and fees (related party balances of $3, $6 and $15, respectively) | | 575 |
| 574 |
| 640 |
|
| Card fees | 233 |
| | 234 |
| | 249 |
| 232 |
| 233 |
| 234 |
|
| Trust and investment services fees | 158 |
| | 149 |
| | 131 |
| 157 |
| 158 |
| 149 |
|
| Foreign exchange and trade finance fees (related party balances of $58, ($15) and ($9), respectively) | 95 |
| | 97 |
| | 105 |
| |
| Capital markets fees (related party balances of $11, $14 and $7, respectively) | 91 |
| | 53 |
| | 52 |
| |
| Mortgage banking fees | 71 |
| | 153 |
| | 189 |
| 101 |
| 71 |
| 153 |
|
| Capital markets fees (related party balances of $9, $11 and $14, respectively) | | 88 |
| 91 |
| 53 |
|
| Foreign exchange and trade finance fees (related party balances of $19, $58 and ($15), respectively) | | 90 |
| 95 |
| 97 |
|
| Bank-owned life insurance income | 49 |
| | 50 |
| | 51 |
| 56 |
| 49 |
| 50 |
|
| Securities gains, net | 28 |
| | 144 |
| | 95 |
| 29 |
| 28 |
| 144 |
|
| Other-than-temporary impairment: | | | | | | |
| Total other-than-temporary impairment losses | (45 | ) | | (49 | ) | | (84 | ) | |
| Portions of loss recognized in other comprehensive income (before taxes) | 35 |
| | 41 |
| | 60 |
| |
| Net impairment losses recognized in earnings | (10 | ) | | (8 | ) | | (24 | ) | |
| Other income (related party balances of ($209), ($32) and ($285), respectively) | 389 |
| | 120 |
| | 115 |
| |
| Net securities impairment losses recognized in earnings | | (7 | ) | (10 | ) | (8 | ) |
| Other income (related party balances of ($105), ($209), and ($32), respectively) | | 101 |
| 389 |
| 120 |
|
| Total noninterest income | 1,678 |
|
| 1,632 |
| | 1,667 |
| 1,422 |
| 1,678 |
| 1,632 |
|
| NONINTEREST EXPENSE: | | | | | | |
| Salaries and employee benefits | 1,678 |
| | 1,652 |
| | 1,743 |
| 1,636 |
| 1,678 |
| 1,652 |
|
| Outside services (related party balances of $22, $20 and $21, respectively) | 420 |
| | 360 |
| | 339 |
| |
| Occupancy (related party balances of $1, $3 and $2, respectively) | 326 |
| | 327 |
| | 310 |
| |
| Outside services (related party balances of $11, $22 and $20, respectively) | | 371 |
| 420 |
| 360 |
|
| Occupancy (related party balances of $2, $1 and $3, respectively) | | 319 |
| 326 |
| 327 |
|
| Equipment expense | 250 |
| | 275 |
| | 279 |
| 257 |
| 250 |
| 275 |
|
| Amortization of software | 145 |
| | 102 |
| | 77 |
| 146 |
| 145 |
| 102 |
|
| Goodwill impairment | — |
| | 4,435 |
| | — |
| — |
| — |
| 4,435 |
|
| Other operating expense | 573 |
| | 528 |
| | 709 |
| 530 |
| 573 |
| 528 |
|
| Total noninterest expense | 3,392 |
| | 7,679 |
| | 3,457 |
| 3,259 |
| 3,392 |
| 7,679 |
|
| Income (loss) before income tax expense (benefit) | 1,268 |
| | (3,468 | ) | | 1,024 |
| 1,263 |
| 1,268 |
| (3,468 | ) |
| Income tax expense (benefit) | 403 |
| | (42 | ) | | 381 |
| 423 |
| 403 |
| (42 | ) |
| NET INCOME (LOSS) |
| $865 |
| |
| ($3,426 | ) | |
| $643 |
|
| $840 |
|
| $865 |
|
| ($3,426 | ) |
| Weighted-average number of shares outstanding: | | | | | | |
| Net income (loss) available to common stockholders | | $833 | $865 |
| ($3,426 | ) |
| Weighted-average common shares outstanding: | | |
| Basic | 556,674,146 |
| | 559,998,324 |
| | 559,998,324 |
| 535,599,731 |
| 556,674,146 |
| 559,998,324 |
|
| Diluted | 557,724,936 |
| | 559,998,324 |
| | 559,998,324 |
| 538,220,898 |
| 557,724,936 |
| 559,998,324 |
|
| Per common share information: | | | | | | |
| Basic earnings (loss) |
| $1.55 |
| |
| ($6.12 | ) | |
| $1.15 |
|
| $1.55 |
|
| $1.55 |
|
| ($6.12 | ) |
| Diluted earnings (loss) | 1.55 |
| | (6.12 | ) | | 1.15 |
| 1.55 |
| 1.55 |
| (6.12 | ) |
| Dividends declared and paid | 1.43 |
| | 2.12 |
| | 0.27 |
| 0.40 |
| 1.43 |
| 2.12 |
|
The accompanying Notes to Consolidated Financial Statements are an integral part of these statements.
CITIZENS FINANCIAL GROUP, INC.
CONSOLIDATED STATEMENTS OF COMPREHENSIVE INCOME (LOSS)
|
| | | | | | | | | | | | |
| | | Year Ended December 31, |
| (in millions) | | 2014 |
| | 2013 |
| | 2012 |
|
| Net income (loss) | |
| $865 |
| |
| ($3,426 | ) | |
| $643 |
|
| Other comprehensive income (loss): | | | | | | |
| Net unrealized derivative instrument gains (losses) arising during the periods, net of income taxes of $122, ($100) and ($15), respectively | | 212 |
| | (172 | ) | | (26 | ) |
| Reclassification adjustment for net derivative losses included in net income, net of income taxes of $10, $66 and $123, respectively | | 17 |
| | 114 |
| | 212 |
|
| Net unrealized securities gains (losses) arising during the periods, net of income taxes of $116, ($165) and $80, respectively | | 198 |
| | (285 | ) | | 138 |
|
| Other-than-temporary impairment not recognized in earnings on securities, net of income taxes of ($13), ($15) and ($22), respectively | | (22 | ) | | (26 | ) | | (38 | ) |
| Reclassification of net securities gains to net income, net of income taxes of ($7), ($50) and ($26), respectively | | (11 | ) | | (86 | ) | | (45 | ) |
| Defined benefit pension plans: | | | | | | |
| Actuarial (loss) gain, net of income taxes of ($92), $66 and ($63), respectively | | (148 | ) | | 110 |
| | (107 | ) |
| Net prior service credit, net of income taxes of $3, $0 and $0, respectively | | 4 |
| | — |
| | — |
|
| Amortization of actuarial gain, net of income taxes $3, $5 and $14, respectively | | 7 |
| | 9 |
| | 24 |
|
| Amortization of net prior service credit, net of income taxes $0, $0 and $0, respectively | | (1 | ) | | — |
| | — |
|
| Divestitures to parent effective September 1, 2014, net of income taxes of $12, $0 and $0, respectively | | 20 |
| | — |
| | — |
|
| Settlement, net of income taxes of $0, $0 and $34, respectively | | — |
| | — |
| | 58 |
|
| Total other comprehensive income (loss), net of income taxes | | 276 |
| | (336 | ) | | 216 |
|
| Total comprehensive income (loss) | |
| $1,141 |
| |
| ($3,762 | ) | |
| $859 |
|
|
| | | | | | | | | |
| | Year Ended December 31, |
| (in millions) | 2015 | 2014 | 2013 |
| Net income (loss) |
| $840 |
|
| $865 |
|
| ($3,426 | ) |
| Other comprehensive income (loss): | | | |
| Net unrealized derivative instrument gains (losses) arising during the periods, net of income taxes of $57, $122 and ($100), respectively | 93 |
| 212 |
| (172 | ) |
| Reclassification adjustment for net derivative losses (gains) included in net income, net of income taxes of ($9), $10, and $66, respectively | (14 | ) | 17 |
| 114 |
|
| Net unrealized securities available for sale (losses) gains arising during the periods, net of income taxes of ($38), $116, and ($165), respectively | (66 | ) | 198 |
| (285 | ) |
| Other-than-temporary impairment not recognized in earnings on securities, net of income taxes of ($14), ($13), and ($15), respectively | (22 | ) | (22 | ) | (26 | ) |
| Reclassification of net securities gains to net income, net of income taxes of ($8), ($7), and ($50), respectively | (14 | ) | (11 | ) | (86 | ) |
| Defined benefit pension plans: | | | |
| Actuarial (loss) gain, net of income taxes of ($3), ($92), and $66, respectively | (3 | ) | (148 | ) | 110 |
|
| Net prior service credit, net of income taxes of $0, $3 and $0, respectively | — |
| 4 |
| — |
|
| Amortization of actuarial loss, net of income taxes $3, $3 and $5, respectively | 12 |
| 7 |
| 9 |
|
| Amortization of net prior service credit, net of income taxes $0, $0 and $0, respectively | (1 | ) | (1 | ) | — |
|
| Divestitures to RBS effective September 1, 2014, net of income taxes of $0, $12 and $0, respectively | — |
| 20 |
| — |
|
| Total other comprehensive (loss) income, net of income taxes | (15 | ) | 276 |
| (336 | ) |
| Total comprehensive income (loss) |
| $825 |
|
| $1,141 |
|
| ($3,762 | ) |
The accompanying Notes to Consolidated Financial Statements are an integral part of these statements.
CITIZENS FINANCIAL GROUP, INC.
CONSOLIDATED STATEMENTS OF CHANGES IN STOCKHOLDERS'STOCKHOLDERS’ EQUITY
| | | | Preferred Stock | Common Stock | Additional Paid-in Capital | Treasury Stock, at Cost | Retained Earnings | Accumulated Other Comprehensive Income (Loss) | Total |
| Preferred Stock | Common Stock | Additional Paid-in Capital | Retained Earnings | Treasury Stock, at Cost | Accumulated Other Comprehensive Income (Loss) | Total |
|
| (in millions) | Shares | Amount | Shares | Amount | Shares | Amount |
| Balance at January 1, 2012 |
| $— |
| 560 |
|
| $6 |
|
| $18,562 |
|
| $— |
|
| $5,353 |
|
| ($528 | ) |
| $23,393 |
| |
| Dividend to parent | — |
| — |
| — |
| — |
| — |
| (150 | ) | — |
| (150 | ) | |
| Capital contribution | — |
| — |
| — |
| 27 |
| — |
| — |
| — |
| 27 |
| |
| Total comprehensive income: | | | | |
| Net income | — |
| — |
| — |
| — |
| — |
| 643 |
| — |
| 643 |
| |
| Other comprehensive income | — |
| — |
| — |
| — |
| — |
| — |
| 216 |
| 216 |
| |
| Total comprehensive income | — |
| — |
| — |
| — |
| — |
| 643 |
| 216 |
| 859 |
| |
| Balance at December 31, 2012 |
| $— |
| 560 |
|
| $6 |
|
| $18,589 |
|
| $— |
|
| $5,846 |
|
| ($312 | ) |
| $24,129 |
| |
| Dividend to parent | — |
| — |
| — |
| — |
| — |
| (185 | ) | — |
| (185 | ) | |
| Dividends to parent — exchange transactions | — |
| — |
| — |
| — |
| — |
| (1,000 | ) | — |
| (1,000 | ) | |
| Balance at January 1, 2013 | | — |
|
| $— |
| 560 |
|
| $6 |
|
| $18,589 |
|
| $5,846 |
|
| $— |
|
| ($312 | ) |
| $24,129 |
|
| Dividend to RBS | | — |
| — |
| — |
| — |
| — |
| (185 | ) | — |
| — |
| (185 | ) |
| Dividends to RBS - exchange transactions | | — |
| — |
| — |
| — |
| — |
| (1,000 | ) | — |
| — |
| (1,000 | ) |
| Capital contribution | — |
| — |
| — |
| 14 |
| — |
| — |
| — |
| 14 |
| — |
| — |
| — |
| — |
| 14 |
| — |
| — |
| — |
| 14 |
|
| Total comprehensive loss: | | | | | | | |
| Net loss | — |
| — |
| — |
| — |
| — |
| (3,426 | ) | — |
| (3,426 | ) | — |
| — |
| — |
| — |
| — |
| (3,426 | ) | — |
| — |
| (3,426 | ) |
| Other comprehensive loss | — |
| — |
| — |
| — |
| — |
| — |
| (336 | ) | (336 | ) | — |
| — |
| — |
| — |
| — |
| — |
| — |
| (336 | ) | (336 | ) |
| Total comprehensive loss | — |
| — |
| — |
| — |
| — |
| (3,426 | ) | (336 | ) | (3,762 | ) | — |
| — |
| — |
| — |
| — |
| (3,426 | ) | — |
| (336 | ) | (3,762 | ) |
| Balance at December 31, 2013 |
| $— |
| 560 |
|
| $6 |
|
| $18,603 |
|
| $— |
|
| $1,235 |
|
| ($648 | ) |
| $19,196 |
| — |
|
| $— |
| 560 |
|
| $6 |
|
| $18,603 |
|
| $1,235 |
|
| $— |
|
| ($648 | ) |
| $19,196 |
|
| Dividend to common stockholders | — |
| — |
| — |
| — |
| — |
| (16 | ) | — |
| (16 | ) | |
| Dividend to parent | — |
| — |
| — |
| — |
| — |
| (124 | ) | — |
| (124 | ) | |
| Dividends to parent — exchange transactions | — |
| — |
| — |
| — |
| — |
| (666 | ) | — |
| (666 | ) | |
| Dividends to common stockholders | | — |
| — |
| — |
| — |
| — |
| (16 | ) | — |
| — |
| (16 | ) |
| Dividends to RBS | | — |
| — |
| — |
| — |
| — |
| (124 | ) | — |
| — |
| (124 | ) |
| Dividends to RBS — exchange transactions | | — |
| — |
| — |
| — |
| — |
| (666 | ) | — |
| — |
| (666 | ) |
| Common shares repurchased from RBS | | — |
| — |
| (14 | ) | — |
| — |
| — |
| (334 | ) | — |
| (334 | ) |
| Share-based compensation plans | — |
| — |
| — |
| 71 |
| (2 | ) | — |
| — |
| 69 |
| — |
| — |
| — |
| — |
| 71 |
| — |
| (2 | ) | — |
| 69 |
|
| Employee stock purchase plan shares purchased | — |
| — |
| — |
| 2 |
| — |
| — |
| — |
| 2 |
| — |
| — |
| — |
| — |
| 2 |
| — |
| — |
| — |
| 2 |
|
| Common shares repurchased from parent | — |
| (14 | ) | — |
| — |
| (334 | ) | — |
| — |
| (334 | ) | |
| Total comprehensive income: | | | | | | | |
| Net income | — |
| — |
| — |
| — |
| — |
| 865 |
| — |
| 865 |
| — |
| — |
| — |
| — |
| — |
| 865 |
| — |
| — |
| 865 |
|
| Other comprehensive income | — |
| — |
| — |
| — |
| — |
| — |
| 276 |
| 276 |
| — |
| — |
| — |
| — |
| — |
| — |
| — |
| 276 |
| 276 |
|
| Total comprehensive income | — |
| — |
| — |
| — |
| — |
| 865 |
| 276 |
| 1,141 |
| — |
| — |
| — |
| — |
| — |
| 865 |
| — |
| 276 |
| 1,141 |
|
| Balance at December 31, 2014 |
| $— |
| 546 |
|
| $6 |
|
| $18,676 |
|
| ($336 | ) |
| $1,294 |
|
| ($372 | ) |
| $19,268 |
| — |
|
| $— |
| 546 |
|
| $6 |
|
| $18,676 |
|
| $1,294 |
|
| ($336 | ) |
| ($372 | ) |
| $19,268 |
|
| Dividends to common stockholders | | — |
| — |
| — |
| — |
| — |
| (143 | ) | — |
| — |
| (143 | ) |
| Dividends to RBS | | — |
| — |
| — |
| — |
| — |
| (71 | ) | — |
| — |
| (71 | ) |
| Dividend to preferred stockholders | | — |
| — |
| — |
| — |
| — |
| (7 | ) | — |
| — |
| (7 | ) |
| Issuance of preferred stock | | — |
| 247 |
| — |
| — |
| — |
| — |
| — |
| — |
| 247 |
|
| Treasury stock purchased | | — |
| — |
| (20 | ) | — |
| — |
| — |
| (500 | ) | — |
| (500 | ) |
| Share-based compensation plans | | — |
| — |
| 2 |
| — |
| 40 |
| — |
| (22 | ) | — |
| 18 |
|
| Employee stock purchase plan shares purchased | | — |
| — |
| — |
| — |
| 9 |
| — |
| — |
| — |
| 9 |
|
| Total comprehensive income: | | | | | |
| Net income | | — |
| — |
| — |
| — |
| — |
| 840 |
| — |
| — |
| 840 |
|
| Other comprehensive loss | | — |
| — |
| — |
| — |
| — |
| — |
| — |
| (15 | ) | (15 | ) |
| Total comprehensive income | | — |
| — |
| — |
| — |
| — |
| 840 |
| — |
| (15 | ) | 825 |
|
| Balance at December 31, 2015 | | — |
|
| $247 |
| 528 |
|
| $6 |
|
| $18,725 |
|
| $1,913 |
|
| ($858 | ) |
| ($387 | ) |
| $19,646 |
|
The accompanying Notes to Consolidated Financial Statements are an integral part of these statements.
CITIZENS FINANCIAL GROUP, INC.
CONSOLIDATED STATEMENTS OF CASH FLOWS
| | | | Year Ended December 31, | Year Ended December 31, |
| (in millions) | 2014 |
| | 2013 |
| | 2012 |
| 2015 | 2014 | 2013 |
| OPERATING ACTIVITIES | | | | | | |
| Net income (loss) |
| $865 |
| |
| ($3,426 | ) | |
| $643 |
|
| $840 |
|
| $865 |
|
| ($3,426 | ) |
| Adjustments to reconcile net income (loss) to net cash provided by operating activities: | | | | | | |
| Provision for credit losses | 319 |
| | 479 |
| | 413 |
| 302 |
| 319 |
| 479 |
|
| Originations of mortgage loans held for sale | (1,615 | ) | | (3,781 | ) | | (5,496 | ) | (2,363 | ) | (1,615 | ) | (3,781 | ) |
| Proceeds from sales of mortgage loans held for sale | 1,578 |
| | 4,229 |
| | 5,436 |
| 2,381 |
| 1,578 |
| 4,229 |
|
| Purchases of commercial loans held for sale | (312 | ) | | — |
| | — |
| (1,176 | ) | (312 | ) | — |
|
| Proceeds from sales of commercial loans held for sale | 269 |
| | — |
| | — |
| 1,158 |
| 269 |
| — |
|
| Amortization of terminated cash flow hedges (related party balances of $45, $69 and $74, respectively) | 46 |
| | 73 |
| | 97 |
| |
| Amortization of terminated cash flow hedges (related party balances of $17, $45 and $69, respectively) | | 17 |
| 46 |
| 73 |
|
| Depreciation, amortization and accretion | 386 |
| | 404 |
| | 467 |
| 471 |
| 386 |
| 404 |
|
| (Recovery) impairment of mortgage servicing rights | (5 | ) | | (47 | ) | | 12 |
| |
| Mortgage servicing rights valuation recovery | | (9 | ) | (5 | ) | (47 | ) |
| Securities impairment | 10 |
| | 8 |
| | 24 |
| 7 |
| 10 |
| 8 |
|
| Goodwill impairment | — |
| | 4,435 |
| | — |
| — |
| — |
| 4,435 |
|
| Gain on other investment securities | — |
| | — |
| | (3 | ) | |
| Deferred income taxes | 141 |
| | (53 | ) | | 306 |
| 249 |
| 141 |
| (53 | ) |
| Share-based compensation | 53 |
| | 27 |
| | 29 |
| 24 |
| 53 |
| 27 |
|
| Loss on disposal/impairment of premises and equipment | 27 |
| | 16 |
| | 11 |
| — |
| 27 |
| 16 |
|
| Loss on sale of other branch assets held for sale | 9 |
| | — |
| | — |
| — |
| 9 |
| — |
|
| (Gain) loss on sales of: | | | | | | |
| Securities available for sale | (28 | ) | | (144 | ) | | (93 | ) | |
| Other investment securities | — |
| | — |
| | (63 | ) | |
| Gain on sales of: | | |
| Debt securities | | (29 | ) | (28 | ) | (144 | ) |
| Marketable equity securities available for sale | | (3 | ) | — |
| — |
|
| Premises and equipment | | (9 | ) | — |
| — |
|
| Extinguishment of debt | | (3 | ) | — |
| — |
|
| Other loans held for sale | (11 | ) | | — |
| | — |
| — |
| (11 | ) | — |
|
| Deposits held for sale | (286 | ) | | — |
| | — |
| — |
| (286 | ) | — |
|
| Other assets | — |
| | — |
| | 24 |
| |
| (Increase) decrease in other assets (related party balances of $55, ($35) and ($24), respectively) | (295 | ) | | 827 |
| | 76 |
| |
| Increase (decrease) in other liabilities (related party balances of ($445), ($452) and ($323), respectively) | 239 |
| | (398 | ) | | (169 | ) | |
| (Increase) decrease in other assets (related party balances of ($51), $55 and ($35), respectively) | | (467 | ) | (295 | ) | 827 |
|
| (Decrease) increase in other liabilities (related party balances of ($190), ($445) and ($452), respectively) | | (161 | ) | 239 |
| (398 | ) |
| Net cash provided by operating activities | 1,390 |
| | 2,649 |
| | 1,714 |
| 1,229 |
| 1,390 |
| 2,649 |
|
| INVESTING ACTIVITIES | | | | | | |
| Investment securities: | | | | | | |
| Purchases of securities available for sale | (8,315 | ) | | (10,999 | ) | | (5,532 | ) | (6,783 | ) | (8,315 | ) | (10,999 | ) |
| Proceeds from maturities and paydowns of securities available for sale | 2,999 |
| | 4,708 |
| | 6,667 |
| 3,420 |
| 2,999 |
| 4,708 |
|
| Proceeds from sales of securities available for sale | 3,325 |
| | 3,645 |
| | 2,724 |
| 3,916 |
| 3,325 |
| 3,645 |
|
| Purchases of other investment securities | (84 | ) | | (1 | ) | | (1 | ) | |
| Proceeds from sales of other investment securities | 146 |
| | 127 |
| | 204 |
| |
| Purchases of securities held to maturity | (1,174 | ) | | (224 | ) | | — |
| (932 | ) | (1,174 | ) | (224 | ) |
| Proceeds from maturities and paydowns of securities held to maturity | 362 |
| | 22 |
| | — |
| 761 |
| 362 |
| 22 |
|
| Net (decrease) increase in interest-bearing deposits in banks | (137 | ) | | 993 |
| | (995 | ) | |
| Net increase in loans and leases (related party balances of ($413), $0 and $0, respectively) | (6,900 | ) | | (341 | ) | | (1,432 | ) | |
| Proceeds from sales of securities held to maturity | | 72 |
| — |
| — |
|
| Purchases of other investment securities, at fair value | | (157 | ) | — |
| — |
|
| Proceeds from sales of other investment securities, at fair value | | 120 |
| — |
| — |
|
| Purchases of other investment securities, at cost | | (91 | ) | (84 | ) | (1 | ) |
| Proceeds from sales of other investment securities, at cost | | 95 |
| 146 |
| 127 |
|
| Net decrease (increase) in interest-bearing deposits in banks | | 14 |
| (137 | ) | 993 |
|
| Net increase in loans and leases (related party balances of $0, ($413) and $0, respectively) | | (6,019 | ) | (6,900 | ) | (341 | ) |
| Net increase in bank-owned life insurance | (188 | ) | | (40 | ) | | (42 | ) | (37 | ) | (188 | ) | (40 | ) |
| Net cash payments for divestiture activities | — |
| | — |
| | (309 | ) | |
| Premises and equipment: | | | | | | |
| Purchases | (141 | ) | | (160 | ) | | (178 | ) | (121 | ) | (141 | ) | (160 | ) |
| Proceeds from sales | 3 |
| | 25 |
| | 6 |
| 15 |
| 3 |
| 25 |
|
| Capitalization of software | (170 | ) | | (208 | ) | | (193 | ) | (178 | ) | (170 | ) | (208 | ) |
| Net cash (used in) provided by investing activities | (10,274 | ) | | (2,453 | ) | | 919 |
| |
| FINANCING ACTIVITIES | | | | | | |
| Net increase (decrease) in deposits | 3,813 |
| | (2,968 | ) | | 2,584 |
| |
| Net (decrease) increase in federal funds purchased and securities sold under agreements to repurchase | (515 | ) | | 1,190 |
| | (551 | ) | |
| Net increase (decrease) in other short-term borrowed funds | 4,002 |
| | 1,750 |
| | (2,599 | ) | |
| Proceeds from issuance of long-term borrowed funds (related party balances of $1,000, $1,000 and $0, respectively) | 3,249 |
| | 1,002 |
| | 337 |
| |
| Repayments of long-term borrowed funds (related party balances of $0, $280 and $216, respectively) | (6 | ) | | (291 | ) | | (2,885 | ) | |
| Repurchase of common stock | (334 | ) | | — |
| | — |
| |
Dividends declared and paid to common stockholders
| (16 | ) | | — |
| | — |
| |
| Dividends declared and paid to parent | (790 | ) | | (1,185 | ) | | (150 | ) | |
| Net cash provided by (used in) financing activities | 9,403 |
| | (502 | ) | | (3,264 | ) | |
| Increase (decrease) in cash and cash equivalents | 519 |
| | (306 | ) | | (631 | ) | |
| Cash and cash equivalents at beginning of period | 2,757 |
| | 3,063 |
| | 3,694 |
| |
| Cash and cash equivalents at end of period |
| $3,276 |
| |
| $2,757 |
| |
| $3,063 |
| |
| Net cash used in investing activities | | (5,905 | ) | (10,274 | ) | (2,453 | ) |
The accompanying Notes to Consolidated Financial Statements are an integral part of these statements.
CITIZENS FINANCIAL GROUP, INC.
CONSOLIDATED STATEMENTS OF CASH FLOWS (Continued)
| | | | Year Ended December 31, | Year Ended December 31, |
| (in millions) | 2014 |
| | 2013 |
| | 2012 |
| 2015 |
| 2014 |
| 2013 |
|
| FINANCING ACTIVITIES | | |
| Net increase (decrease) in deposits | | 6,832 |
| 3,813 |
| (2,968 | ) |
| Net (decrease) increase in federal funds purchased and securities sold under agreements to repurchase | | (3,474 | ) | (515 | ) | 1,190 |
|
| Net (decrease) increase in other short-term borrowed funds | | (4,383 | ) | 4,002 |
| 1,750 |
|
| Proceeds from issuance of long-term borrowed funds (related party balances of $0, $1,000 and $1,000, respectively) | | 6,750 |
| 3,249 |
| 1,002 |
|
| Repayments of long-term borrowed funds (related party balances of $750, $0 and $280, respectively) | | (766 | ) | (6 | ) | (291 | ) |
| Treasury stock purchased | | (500 | ) | (334 | ) | — |
|
| Net proceeds from issuance of preferred stock | | 247 |
| — |
| — |
|
| Dividends declared and paid to RBS | | (71 | ) | (790 | ) | (1,185 | ) |
Dividends declared and paid to other common stockholders
| | (143 | ) | (16 | ) | — |
|
| Dividends declared and paid to preferred stockholders | | (7 | ) | — |
| — |
|
| Net cash provided by (used in) financing activities | | 4,485 |
| 9,403 |
| (502 | ) |
| (Decrease) increase in cash and cash equivalents | | (191 | ) | 519 |
| (306 | ) |
| Cash and cash equivalents at beginning of period | | 3,276 |
| 2,757 |
| 3,063 |
|
| Cash and cash equivalents at end of period | |
| $3,085 |
|
| $3,276 |
|
| $2,757 |
|
| | | |
| Supplemental disclosures: | | | | | | |
| Interest paid |
| $338 |
| |
| $452 |
| |
| $644 |
|
| $454 |
|
| $338 |
|
| $452 |
|
| Income taxes paid | 391 |
| | 20 |
| | 201 |
| 157 |
| 391 |
| 20 |
|
| Non-cash items: | | | | | | |
| Transfer of securities available for sale to held to maturity |
| $— |
| |
| $4,240 |
| |
| $— |
| |
| Transfer of securities from available for sale to held to maturity | |
| $— |
|
| $— |
|
| $4,240 |
|
| Transfer of loans and leases to other loans held for sale | — |
| | 1,078 |
| | 22 |
| — |
| — |
| 1,078 |
|
| Loans securitized and transferred to securities available for sale | 18 |
| | 106 |
| | 21 |
| 3 |
| 18 |
| 106 |
|
| Income tax withholding on stock purchased for share based compensation | | 22 |
| 2 |
| — |
|
| Stock purchased for share-based compensation plans | 71 |
| | — |
| | — |
| 40 |
| 71 |
| — |
|
| Capital contribution | — |
| | 14 |
| | 27 |
| — |
| — |
| 14 |
|
| Employee Stock Purchase Plan shares purchased | 2 |
| | — |
| | — |
| 9 |
| 2 |
| — |
|
Income tax withholding on stock purchased for share-based compensation
| 2 |
| | — |
| | — |
| |
| Due from broker for securities sold but not settled | — |
| | (442 | ) | | (4 | ) | — |
| — |
| (442 | ) |
| Due to broker for securities purchased but not settled | — |
| | — |
| | 2 |
| |
The accompanying Notes to Consolidated Financial Statements are an integral part of these statements.
CITIZENS FINANCIAL GROUP, INC.
NOTES TO CONSOLIDATED FINANCIAL STATEMENTS
NOTE 1 - SIGNIFICANT ACCOUNTING POLICIES
The accounting and reporting policies of Citizens Financial Group, Inc. (formerly RBS Citizens Financial Group, Inc., effective April 16, 2014) conform to GAAP. The Company is a majority-owned subsidiary of The Royal Bank of Scotland Group plc. On December 1, 2008, the UK Government became the ultimate controlling party of RBSG. The UK Government’s shareholding is managed by UK Financial Investments Limited, a company wholly owned by the UK Government. The Company’s principal business activity is banking, conducted through its subsidiaries Citizens Bank, N.A. (formerly RBS Citizens, N.A., effective April 16, 2014) and Citizens Bank of Pennsylvania.
Following is a summary of the significant accounting policies of the Company:
Basis of Presentation
The Consolidated Financial Statements include the accounts of the Company. All intercompany transactions and balances have been eliminated. The Company has evaluated its unconsolidated entities and does not believe that any entity in which it has an interest, but does not currently consolidate, meets the requirements for a variable interest entity to be consolidated.
The preparation of financial statements in conformity with GAAP requires management to make estimates and assumptions that affect the reported amounts of assets and liabilities at the date of the financial statements and the reported amounts of revenues and expenses during the reporting period. Actual results could differ from those estimates. Material estimates that are particularly susceptible to significant change in the near term relate to the determination of the provisionallowance for credit losses, evaluation and measurement of impairment of goodwill, evaluation of unrealized losses on securities for other-than-temporary impairment, accounting for income taxes, the valuation of AFS and HTM securities, and derivatives.
On August 22, 2014, the Company’s Board of Directors declared a 165,582-for-1 stock split. Except for the amount of authorized shares and par value, all references to share and per share amounts in the Consolidated Financial Statements and accompanying Notes have been restated to reflect the stock split.
Certain prior period amounts have been reclassified to conform to current period presentation. These reclassifications had no effect on net income, total comprehensive income, total assets or total stockholders’ equity as previously reported.
Cash and Cash Equivalents
For the purposes of reporting cash flows, cash and cash equivalents have original maturities of three months or less and include cash and due from banks and interest-bearing cash and due from banks, primarily at the FRB.
Interest-Bearing Deposits in Banks
Interest-bearing deposits in banks are carried at cost and include deposits that mature within one year.
Securities
Investments in debt and equity securities are carried in four portfolios: AFS, HTM, trading, account assets and other investment securities. Management determines the appropriate classification at the time of purchase.
Securities in the AFS portfolio will be held for indefinite periods of time and may be sold in response to changes in interest rates, changes in prepayment risk, or other factors considered in managing the Company’s asset/liability strategy. Gains and losses on the sales of securities are recognized in earnings and are computed using the specific identification method. Security impairments (i.e., declines in the fair value of securities below cost) that are considered by management to be other-than-temporary are recognized in earnings as realized losses. However, the determination of the impairment amount is dependent on the Company’s intent to sell (or not sell) the security. If the Company intends to sell the impaired security, the impairment loss recognized in current period earnings equals the difference between the instrument’s fair value and amortized cost. If the Company does not intend to sell the impaired security, and it is not likely that the Company will be required to sell the impaired security, only the credit-related impairment loss is recognized in current period earnings and this amount equals the difference between the amortized cost of the security and the present value of the expected cash flows that have currently been projected.
Securities AFS are carried at fair value, with unrealized gains and losses reported in OCI as a separate component of stockholders’ equity, net of taxes. Premiums and discounts on debt securities are amortized or accreted using a level-yieldthe interest method over the estimated lives of the individual securities. The Company uses actual prepayment experience and estimates of future prepayments to determine the constant effective yield necessary to apply the interest method of income recognition. Estimates of future prepayments are based on the underlying collateral characteristics of each security and are derived from market sources. Judgment is involved in making determinations about prepayment expectations and in changing those expectations in response to
CITIZENS FINANCIAL GROUP, INC.
NOTES TO CONSOLIDATED FINANCIAL STATEMENTS
changes in interest rates and macroeconomic conditions. The amortization of premiums and discounts associated with mortgage-backed securities may be significantly impacted by changes in prepayment assumptions.
Securities are classified as HTM because the Company has the ability and intent to hold the securities to maturity. Transfers of debt securities into the HTM category from the AFS category are made at fair value at the date of transfer. The unrealized
CITIZENS FINANCIAL GROUP, INC.
NOTES TO CONSOLIDATED FINANCIAL STATEMENTS
holding gain or loss at the date of transfer is retained in OCI and in the carrying value of the HTM securities. Such amounts are amortized over the remaining life of the security. The securities are reported at cost and adjusted for amortization of premium and accretion of discount. Interest income is recorded on the accrual basis adjusted for the amortization of premium and the accretion of discount.
Trading account assetsSecurities that are comprised of debt and equity securities thatclassified as trading are bought and held principally for the purpose of selling them in the near term and are carried at fair value. RealizedWhen applicable, realized and unrealized gains and losses on such assets are reported in noninterest income in the Consolidated Statements of Operations.
Other investment securities are comprisedcomposed mainly of FHLB stock and FRB stock (which are carried at cost) and venture capitalmoney market mutual fund investments held by the Company’s broker-dealer (which are carried at fair value, with changes in fair value recognized in noninterest income). For securities that are not publicly traded, estimates of fair value are made based upon review of the investee’s financial results, condition and prospects. Other investment securities whichthat are carried at cost are reviewed at least annually for impairment, with valuation adjustments recognized in noninterest income.
Loans and Leases
Loans are reported at the amount of their outstanding principal, net of charge-offs, unearned income, deferred loan origination fees and costs, and unamortized premiums or discounts (on purchased loans). Deferred loan origination fees and costs and purchase discounts and premiums are amortized as an adjustment of yield over the life of the loan, using the level-yield interest method. Unamortized amounts remaining upon prepayment or sale are recorded as interest income or gain (loss) on sale, respectively. Credit card receivables include billed and uncollected interest and fees.
Leases are classified at the inception of the lease. Lease receivables, including leveraged leases, are reported at the aggregate of lease payments receivable and estimated residual values, net of unearned and deferred income, including unamortized investment credits. Lease residual values are reviewed at least annually for other-than-temporary impairment, with valuation adjustments recognized currently against noninterest income. Leveraged leases are reported net of non-recourse debt. Unearned income is recognized to yield a level rate of return on the net investment in the leases.
Loans and leases are disclosed in portfolio segments and classes. The Company’s loan and lease portfolio segments are commercial and retail. The classes of loans and leases are: commercial, commercial real estate, leases, residential mortgages, home equity loans, home equity lines of credit, home equity loans serviced by others, home equity lines of credit serviced by others, automobile, student, credit cards and other retail.
Loans held for sale (including those loans associated with the Chicago Divestiture) are carried at the lower of cost or fair value. Loans held for sale accounted for under the fair value option (including those loans associated with our mortgage banking business and secondary loan trading desk) are carried at fair value.
Allowance for Credit Losses
Management’s estimate of probable losses in the Company’s loan and lease portfolios is recorded in the ALLL and the reserve for unfunded lending commitments. The Company evaluates the adequacy of the ALLL by performing reviews of certain individual loans and leases, analyzing changes in the composition, size and delinquency of the portfolio, reviewing previous loss experience, and considering current and anticipated economic factors. The ALLL is established in accordance with the Company’s credit reserve policies, as approved by the Audit Committee of the Board of Directors. The Chief Financial Officer and Chief Risk Officer review the adequacy of the ALLL each quarter, together with risk management. The ALLL is maintained at a level that management considers to be reflective of probable losses, and is established through charges to earnings in the form of a provision for credit losses. Amounts determined to be uncollectible are deducted from the ALLL and subsequent recoveries, if any, are added to the allowance.ALLL. While management uses available information to estimate loan and lease losses, future additions to the allowanceALLL may be necessary based on changes in economic conditions. In addition, various regulatory agencies, as an integral part of their examination process, periodically review the Company’s allowance for credit losses.
CITIZENS FINANCIAL GROUP, INC.
NOTES TO CONSOLIDATED FINANCIAL STATEMENTS
The evaluation of the adequacy of the commercial, commercial real estate, and lease allowance for loan and lease lossesALLL and reserve for unfunded lending commitments is primarily based on risk rating models that assess probability of default, loss given default and exposure at default on an individual loan basis. The models are primarily driven by individual customer financial characteristics and are validated against historical experience. Additionally, qualitative factors may be included in the risk rating models. After the aggregation of individual borrower incurred loss, additional overlays can be made based on back-testing against historical losses and forward loss curve ratios.
losses.
For non-impaired retail loans, the ALLL is based upon an incurred loss model utilizing the probability of default, loss given default, and exposure at default on an individual loan basis. When developing these factors, the Company may consider the loan product and collateral type, LTV ratio, lien position, borrower’s credit, time outstanding, geographic location, delinquency status, and incurred loss period. Certain retail portfolios, including SBO home equity loans, student loans, and commercial credit card receivables utilize roll rate models to estimate the ALLL. For the portfolios measured using the incurred loss model, roll rate models are also run as challenger models and can used to support management overlays if deemed necessary.
CITIZENS FINANCIAL GROUP, INC.
NOTES TO CONSOLIDATED FINANCIAL STATEMENTS
For nonaccruing commercial and commercial real estate loans with an outstanding balance of $3 million or greater and for all commercial and commercial real estate TDRs (regardless of size), the Company conducts further analysis to determine the probable amount of loss and establishes a specific allowance for the loan, if appropriate. The Company estimates the impairment amount by comparing the loan’s carrying amount to the estimated present value of its future cash flows, the fair value of its underlying collateral, or the loan’s observable market price. For collateral-dependent impaired commercial and commercial real estate loans, the excess of the Company’s recorded investment in the loan over the fair value of the collateral, less cost to sell, is charged off to the ALLL.
For retail TDRs that are not collateral-dependent, allowances are developed using the present value of expected future cash flows, compared to the recorded investment in the loans. Expected re-default factors are considered in this analysis. Retail TDRs that are deemed collateral-dependent are written down to fair market value less cost to sell. The fair value of collateral is periodically monitored subsequent to the modification.
The ALLL may be adjusted to reflect the Company’s current assessment of various qualitative risks, factors and events that may not be measured in the statistical analysis. Such factors include trends in economic conditions, loan growth, back testing results, base versus stress losses, credit underwriting policy exceptions, regulatory and audit findings, and peer comparisons.
In addition to the ALLL, the Company also estimates probable credit losses associated with off balance sheet financial instruments such as standby letters of credit, financial guarantees and binding unfunded loan commitments. Off balance sheet financial instruments are subject to individual reviews and are analyzed and segregated by risk according to the Company’s internal risk rating scale. These risk classifications, in conjunction with historical loss experience, economic conditions and performance trends within specific portfolio segments, result in the estimate of the reserve for unfunded lending commitments.
The ALLL and the reserve for unfunded lending commitments are reported on the Consolidated Balance Sheets in the ALLLallowance for loan and lease losses and in other liabilities, respectively. Provision for credit losses related to the loans and leases portfolio and the unfunded lending commitments are reported in the Consolidated Statements of Operations as provision for credit losses.
Commercial loans and leases are charged off to the allowanceALLL when there is little prospect of collecting either principal or interest. Charge-offs of commercial loans and leases usually involve receipt of borrower-specific adverse information. For commercial collateral-dependent loans, an appraisal or other valuation is used to quantify a shortfall between the fair value of the collateral less costs to sell and the recorded investment in the commercial loan. Retail loan charge-offs are generally based on established delinquency thresholds rather than borrower-specific adverse information. When a loan is collateral-dependent, any shortfalls between the fair value of the collateral less costs to sell and the recorded investment is promptly charged off. Placing any loan or lease on nonaccrual status does not by itself require a partial or total charge-off; however, any identified losses are charged off at that time.
Nonperforming Loans and Leases
Commercial loans, commercial real estate loans, and leases are generally placed on nonaccrual status when contractually past due 90 days or more, or earlier if management believes that the probability of collection is insufficient to warrant further accrual. Some of these loans and leases may remain on accrual status when contractually past due 90 days or more if management considers the loan collectible. A loan may be returned to accrual status if (1) principal and interest payments have been brought current, and the Company expects repayment of the remaining contractual principal and interest, (2) the loan or lease has otherwise
CITIZENS FINANCIAL GROUP, INC.
NOTES TO CONSOLIDATED FINANCIAL STATEMENTS
become well-secured and in the process of collection, or (3) the borrower has been making regularly scheduled payments in full for the prior six months and it’s reasonably assured that the loan or lease will be brought fully current within a reasonable period. Cash receipts on nonaccruing loans and leases are generally applied to reduce the unpaid principal balance.
Residential mortgages are generally placed on nonaccrual status when past due 120 days, or sooner if determined to be collateral-dependent. Residential mortgages are returned to accrual status when principal and interest payments become less than 120 days past due and when future payments are reasonably assured. Credit card balances are placed on nonaccrual status when past due 90 days or more. Credit card balances are restored to accruing status if they subsequently become less than 90 days past due. Guaranteed student loans are not placed on nonaccrual status.
Cash receipts on nonaccruing loans and leases are generally applied to reduce the unpaid principal balance.
All other retail loans are generally placed on nonaccrual status when past due 90 days or more, or earlier if management believes that the probability of collection is insufficient to warrant further accrual. Loans less than 90 days past due may be placed on nonaccrual status upon the death of the borrower, surrender or repossession of collateral, fraud or bankruptcy. Loans are generally returned to accrual status if the loan becomes less than 15 days past due. Cash receipts on nonaccruing loans and leases are generally applied to reduce the unpaid principal balance. Certain TDRs that are current in payment status are classified as nonaccrual in accordance with regulatory guidance. Income on these loans is generally recognized on a cash basis if management believes that the remaining book value of the loan is realizable. Nonaccruing TDRs that meet the guidelines above for accrual status can be
CITIZENS FINANCIAL GROUP, INC.
NOTES TO CONSOLIDATED FINANCIAL STATEMENTS
returned to accruing if supported by a well documented evaluation of the borrowers’ financial condition, and if they have been current for at least six months.
Impaired Loans
A loan is considered to be impaired when it is probable that the Company will be unable to collect all of the contractual interest and principal payments as scheduled in the loan agreement. Impaired loans include nonaccruing larger balance (greater than $3 million carrying value), non-homogenous commercial and commercial real estate loans, and restructured loans that are deemed TDRs. A loan modification is identified as a TDR when the Company or bankruptcy court grants the borrower a concession the Company would not otherwise make, in response to the borrower’s financial difficulties. Concessions granted in TDRs for all classes of loans may include lowering the interest rate, forgiving a portion of principal, extending the loan term, lowering scheduled payments for a specified period of time, principal forbearance, or capitalizing past due amounts. A rate increase can be a concession if the increased rate is lower than a market rate for loans with risk similar to that of the restructured loan. Additionally, TDRs for commercial loans may also involve creating a multiple note structure, accepting non-cash assets, accepting an equity interest, or receiving a performance-based fee. In some cases a TDR may involve multiple concessions. The financial effects of TDRs for all loan classes may include lower income (either due to a lower interest rate or a delay in the timing of cash flows), larger loan loss provisions, and accelerated charge-offs if the modification renders the loan collateral-dependent. In some cases interest income throughout the term of the loan may increase if, for example, the loan is extended or the interest rate is increased as a result of the restructuring. Loans are classified as TDRs until paid off, sold, or refinanced at market terms.
Impairment evaluations are performed at the individual loan level, and consider expected future cash flows from the loan, including, if appropriate, the realizable value of collateral. Impaired loans which are not TDRs are nonaccruing, and loans involved in TDRs may be accruing or nonaccruing. Retail loans that were discharged in bankruptcy and not reaffirmed by the borrower are deemed to be collateral-dependent TDRs and are generally charged off to the fair value of the collateral, less cost to sell, and less amounts recoverable under a government guarantee (if any). Cash receipts on nonaccruing impaired loans, including nonaccruing loans involved in TDRs, are generally applied to reduce the unpaid principal balance. Certain TDRs that are current in payment status are classified as nonaccrual in accordance with regulatory guidance. Income on the loans is generally recognized on a cash basis if management believes that the remaining book value of the loan is realizable.
Loans are generally restored to accrual status when principal and interest payments are brought current and when future payments are reasonably assured, following a sustained period of repayment performance by the borrower in accordance with the loan’s contractual terms.
Premises and Equipment
Premises and equipment are stated at cost, less accumulated depreciation and amortization. Depreciation and amortization have been computed using the straight-line method over the estimated useful lives of the assets. Leasehold improvements are amortized over the life of the lease (including renewal options if exercise of those options is reasonably assured) or their estimated useful life, whichever is shorter.
CITIZENS FINANCIAL GROUP, INC.
NOTES TO CONSOLIDATED FINANCIAL STATEMENTS
Additions to property, plant and equipment are recorded at cost. The cost of major additions, improvements and betterments is capitalized. Normal repairs and maintenance and other costs that do not improve the property, extend the useful life or otherwise do not meet capitalization criteria are charged to expense as incurred. The Company evaluates premises and equipment for impairment when events or changes in circumstances indicate that the carrying value of such assets may not be recoverable.
Software
Costs related to computer software developed or obtained for internal use are capitalized if the projects improve functionality and provide long-term future operational benefits. Capitalized costs are amortized using the straight-line method over the asset’s expected useful life, based upon the basic pattern of consumption and economic benefits provided by the asset. The Company begins to amortize the software when the asset (or identifiable component of the asset) is substantially complete and ready for its intended use. All other costs incurred in connection with an internal-use software project are expensed as incurred. Capitalized software is included in other assets on the Consolidated Balance Sheets.
Fair Value
The Company measures fair value using the price that would be received to sell an asset or paid to transfer a liability in an orderly transaction between market participants at the measurement date. Fair value is based upon quoted market prices in an active market, where available. If quoted prices are not available, observable market-based inputs or independently sourced parameters are used to develop fair value, whenever possible. Such inputs may include prices of similar assets or liabilities, yield curves, interest rates, prepayment speeds, and foreign exchange rates.
CITIZENS FINANCIAL GROUP, INC.
NOTES TO CONSOLIDATED FINANCIAL STATEMENTS
A portion of the Company’s assets and liabilities is carried at fair value, including AFS securities, private equity investments,derivative instruments, and derivative instruments.other investment securities. In addition, the Company elects to account for its residential mortgages held for sale at fair value. The Company classifies its assets and liabilities that are carried at fair value in accordance with the three-level valuation hierarchy:
Level 1. Quoted prices (unadjusted) in active markets for identical assets or liabilities.
Level 2. Observable inputs other than Level 1 prices, such as quoted prices for similar instruments;instruments, quoted prices in markets that are not active;active, or other inputs that are observable or can be corroborated by market data for substantially the full term of the asset or liability.
Level 3. Unobservable inputs that are supported by little or no market information and that are significant to the fair value measurement.
Classification in the hierarchy is based upon the lowest level input that is significant to the fair value measurement of the asset or liability. For instruments classified in LevelLevels 1 and 2 where inputs are primarily based upon observable market data, there is less judgment applied in arriving at the fair value. For instruments classified in Level 3, management judgment is more significant due to the lack of observable market data.
The Company reviews and updates the fair value hierarchy classifications on a quarterly basis. Changes from one quarter to the next related to the observability of inputs in fair value measurements may result in a reclassification between the fair value hierarchy levels and are recognized based on period-end balances.
Fair value is also used on a nonrecurring basis to evaluate certain assets for impairment or for disclosure purposes. Examples of nonrecurring uses of fair value include MSRs accounted for by the amortization method, loan impairments for certain loans, and goodwill.
Goodwill
Goodwill is the purchase premium associated with the acquisition of a business. It is assigned to reporting units at the date the goodwill is initially recorded. A reporting unit is a business operating segment or a component of a business operating segment. Once goodwill has been assigned to reporting units, it no longer retains its association with a particular acquisition, and all of the activities within a reporting unit, whether acquired or organically grown, are available to support the value of the goodwill.
CITIZENS FINANCIAL GROUP, INC.
NOTES TO CONSOLIDATED FINANCIAL STATEMENTS
Goodwill is not amortized, but is subject to annual impairment tests. The goodwill impairment analysis is a two-step test. The first step, used to identify potential impairment, involves comparing each reporting unit’s fair value to its carrying value, including goodwill. If the fair value of a reporting unit exceeds its carrying value, applicable goodwill is deemed to be not impaired. If the carrying value exceeds fair value, there is an indication of impairment and the second step is performed to measure the amount of impairment.
The second step involves calculating an implied fair value of goodwill for each reporting unit for which the first step indicated impairment. The implied fair value of goodwill is determined in the same manner as the amount of goodwill recognized in a business combination, which is the excess of the fair value of the reporting unit, as determined in the first step, over the aggregate fair values of the individual assets, liabilities and identifiable intangible assets as if the reporting unit were being acquired in a business combination. If the implied fair value of goodwill exceeds the carrying value of goodwill assigned to the reporting unit, there is no impairment. If the carrying value of goodwill assigned to a reporting unit exceeds the implied fair value of the goodwill, an impairment charge is recorded for the excess. An impairment loss that is recognized cannot exceed the amount of goodwill assigned to a reporting unit, and the loss establishes a new basis in the goodwill. Subsequent reversal of goodwill impairment losses is not permitted.
The Company reviews goodwill for impairment annually as of October 31, or more often if events or circumstances indicate that it is more likely than not that the fair value of one or more reporting units is below its carrying value. The fair values of the Company’s reporting units are determined using a combination of income and market-based approaches. The Company relies on the income approach (discounted cash flow method) for determining fair value. Market and transaction approaches are used as benchmarks only to corroborate the value determined by the discounted cash flow method. The Company relies on several assumptions when estimating the fair value of its reporting units using the discounted cash flow method. These assumptions include the current discount rate, as well as projected loan loss, income tax and capital retention rates.
Discount rates are estimated based on the Capital Asset Pricing Model, which considers the risk-free interest rate, market risk premium, beta, and unsystematic risk and size premium adjustments specific to a particular reporting unit. The discount rates are also calibrated on the assessment of the risks related to the projected cash flows of each reporting unit. Cash flow projections include estimates for projected loan loss, income tax and capital retention rates. Multi-year financial forecasts are developed for each reporting unit by considering several key business drivers such as new business initiatives, customer retention standards, market share changes, anticipated loan and deposit growth, forward interest rates, historical performance, and industry and economic trends, among other considerations. The long-term growth rate used in determining the terminal value of each reporting unit is
CITIZENS FINANCIAL GROUP, INC.
NOTES TO CONSOLIDATED FINANCIAL STATEMENTS
estimated based on management’s assessment of the minimum expected terminal growth rate of each reporting unit, as well as broader economic considerations such as GDP and inflation.
The Company bases its fair value estimates on assumptions it believes to be representative of assumptions that a market participant would use in valuing the reporting unit but that are unpredictable and inherently uncertain, including estimates of future growth rates and operating margins and assumptions about the overall economic climate and the competitive environment for its reporting units. There can be no assurances that future estimates and assumptions made for purposes of goodwill testing will prove accurate predictions of the future. If the assumptions regarding business plans, competitive environments or anticipated growth rates are not achieved, the Company may be required to record goodwill impairment charges in future periods.
Bank-Owned Life Insurance
Bank-owned life insurance is stated at its cash surrender value. The Company is the beneficiary of life insurance policies on current and former officers and selected employees of the Company.
Employee Benefits
Pension costs under defined benefit plans are actuarially computed and include current service costs and amortization of prior service costs over the participants’ average future working lifetime. The actuarial cost method used in determining the net periodic pension cost is the projected unit method. The cost of postretirement and postemployment benefits other than pensions is recognized on an accrual basis during the periods employees provide services to earn those benefits.
Share-Based Compensation
The Company sponsors variousadopted the Citizens Financial Group, Inc. 2014 Omnibus Incentive Plan (the “Omnibus Plan”), pursuant to which stock award plans under which restricted stock unitsawards are granted periodically to employees. The Company recognizes compensation expense related to stock awards based upon the fair value of the awards which is the
CITIZENS FINANCIAL GROUP, INC.
NOTES TO CONSOLIDATED FINANCIAL STATEMENTS
closing price of CFG common stock on the date of the grant, adjusted for expected forfeiting.forfeitures. The related expense is charged to earnings over the requisite service period (e.g., vesting period). Additionally, the Company estimates the number of awards for which it is probable that service will be rendered based upon historical data to estimate employee attrition and adjusts compensation cost accordingly. Estimated forfeitures are subsequently adjusted to reflect actual shares that have vested.
Derivatives
The Company is party to a variety of derivative transactions, including interest rate swap contracts, interest rate options, foreign exchange contracts, residential loan commitment rate locks, forward sale contracts, warrants and purchase options. The Company enters into contracts in order to meet the financing needs of its customers. The Company also enters into contracts as a means of reducing its interest rate and foreign currency risks, and these contracts are designated as hedges when acquired, based on management’s intent. The Company monitors the results of each transaction to ensure that management’s intent is satisfied.
All derivatives, whether designated for hedging relationships or not, are recognized in the Consolidated Balance Sheets at fair value. If a derivative is designated as a cash flow hedge, the effective portions of changes in the fair value of the derivative are recorded in AOCI, a component of stockholders’ equity. The ineffective portions of cash flow hedges are immediately recognized as an adjustment to income or expense. For cash flow hedging relationships that have been discontinued, balances in OCI are reclassified to interest expense in the periods during which the hedged item affects income. If it is probable that the hedged forecasted transaction will not occur, balances in OCI are reclassified immediately to income.
If a derivative is designated as a fair value hedge, gains or losses attributable to the change in fair value of the derivative instrument, as well as the gains and losses attributable to the change in fair value of the hedged item, are recognized in other noninterest income in the period in which the change in fair value occurs. Hedge ineffectiveness is recognized as other noninterest income to the extent the changes in fair value of the derivative do not offset the changes in fair value of the hedged item. Changes in the fair value of derivatives that do not qualify as hedges are recognized immediately in earnings.
Derivative assets and derivative liabilities governed by master netting agreements are netted by counterparty on the balance sheet, and this netted derivative asset or liability position is also netted against the fair value of any cash collateral that has been pledged or received in accordance with a CSA.
Transfers and Servicing of Financial Assets
A transfer of financial assets is accounted for as a sale when control over the assets transferred is surrendered. Assets transferred that satisfy the conditions of a sale are derecognized, and all assets obtained and liabilities incurred in a purchase are recognized and measured at fair value. Servicing rights retained in the transfer of financial assets are initially recognized at fair value. Subsequent to the initial recognition date, the Company recognizes periodic amortization expense of servicing rights and assesses servicing rights for impairment.
CITIZENS FINANCIAL GROUP, INC.
NOTES TO CONSOLIDATED FINANCIAL STATEMENTS
Mortgage Banking
Mortgage loans held for sale are accounted for at fair value on an individual loan basis. Changes in the fair value, and realized gains and losses on the sales of mortgage loans, are reported in mortgage banking fees.
MSRs are presented in the Consolidated Balance Sheets net of accumulated amortization, which is recorded in proportion to, and over the period of, net servicing income. The Company’s identification of MSRs in a single class is determined based on the availability of market inputs and the Company’s method of managing MSR risks. For the purpose of evaluating impairment, MSRs are stratified based on predominant risk characteristics (such as interest rate, loan size, origination date, term, or geographic location) of the underlying loans. An allowance is then established in the event the recorded value of an individual stratum exceeds fair value.
The Company accounts for derivatives in its mortgage banking operations at fair value on the balance sheet as derivative assets or derivative liabilities, depending on whether the derivative had a positive (asset) or negative (liability) fair value as of the balance sheet date. The Company’s mortgage banking derivatives include commitments to originate mortgages held for sale, certain loan sale agreements, and other financial instruments that meet the definition of a derivative.
CITIZENS FINANCIAL GROUP, INC.
NOTES TO CONSOLIDATED FINANCIAL STATEMENTS
Income Taxes
The Company uses an asset and liability (balance sheet) approach for financial accounting and reporting of income taxes. This results in two components of income tax expense: current and deferred. Current income tax expense approximates taxes to be paid or refunded for the current period. Deferred income tax expense results from changes in deferred tax assets and liabilities between periods. These gross deferred tax assets and liabilities represent decreases or increases in taxes expected to be paid in the future because of future reversals of temporary differences in the bases of assets and liabilities, as measured by tax laws, and their bases, as reported in the Consolidated Financial Statements.
Deferred tax assets are recognized for net operating loss carryforwards and tax credit carryforwards. Valuation allowances are recorded as necessary to reduce deferred tax assets to the amounts that management concludes are more likely than not to be realized.
The Company also assesses the probability that the positions taken, or expected to be taken, in its income tax returns will be sustained by taxing authorities. A “more likely than not” (more than 50 percent) recognition threshold must be met before a tax benefit can be recognized. Tax positions that are more likely than not to be sustained are reflected in the Company’s Consolidated Financial Statements.
Tax positions are measured as the largest amount of tax benefit that is greater than 50 percent likely of being realized upon settlement with a taxing authority that has full knowledge of all relevant information. The difference between the benefit recognized for a position and the tax benefit claimed on a tax return is referred to as an unrecognized tax benefit.
Treasury Stock
The purchase of the Company’s common stock is recorded at cost. At the date of retirement or subsequent reissuance, treasury stock is reduced by the cost of such stock on the first-in, first-out basis with differences recorded in additional paid-in capital or retained earnings, as applicable.
Revenue Recognition
Revenue is recognized to the extent that it is probable that the economic benefits will flow to the Company and the revenue can be reliably measured.
Interest income on loans and securities classified as AFS or HTM is determined using the effective interest method. This method calculates periodic interest income at a constant effective yield on the net investment in the loan or security, to provide a constant rate of return over the terms of the financial assets. Securities classified as trading account assets, and other financial assets accounted for using the fair value option, are measured at fair value with corresponding changes recognized in noninterest income.
Loan commitment fees for loans that are likely to be drawn down, and other credit related fees, are deferred (together with any incremental costs) and recognized as an adjustment to the effective interest rate on the loan. When it is unlikely that a loan will be drawn down, the loan commitment fees are recognized over the commitment period on a straight-line basis.
Other types of noninterest revenues, such as service charges on deposits, interchange income on credit cards and trust revenues, are accrued and recognized into income as services are provided and the amount of fees earned are reasonably determinable.
CITIZENS FINANCIAL GROUP, INC.
NOTES TO CONSOLIDATED FINANCIAL STATEMENTS
Earnings Per Share
Basic EPS is computed by dividing net income/(loss) available to common stockholders by the weighted-average number of common shares outstanding during each period. Net income/(loss) available to common stockholders represents net income after preferred stock dividends, accretion of the discount on preferred stock issuances, and gains or losses from any repurchases of preferred stock. Diluted EPS is computed by dividing net income/(loss) available to common stockholders by the weighted-average number of common shares outstanding during each period, plus potential dilutive shares such as call options, share-based payment awards, and warrants using the treasury stock method.
CITIZENS FINANCIAL GROUP, INC.
NOTES TO CONSOLIDATED FINANCIAL STATEMENTS
Recent Accounting Pronouncements
In November 2014,February 2016, the FASB issued Accounting Standards UpdateASU 2016-02 “Leases”. The ASU generally requires lessees to recognize a right-of-use asset and corresponding lease liability for all leases with a lease term of greater than one year. The ASU is effective for the Company beginning on January 1, 2019. The Company is currently assessing the impact of this guidance on the Company’s Consolidated Financial Statements.
In January 2016, the FASB issued ASU No. 2014-17, “Pushdown Accounting (a consensus2016-01 “Recognition and Measurement of Financial Assets and Financial Liabilities.” The ASU requires equity investments (except for those accounted for under the equity method of accounting or those that result in consolidation of the FASB Emerging Issues Task Force)”.investee) to be measured at fair value with changes in the fair value recognized through net income. The amendments in this Update applyASU also requires separate presentation of financial assets and financial liabilities by measurement category and form of financial assets on the balance sheet or the notes to the separate financial statementsstatements. In addition, the ASU makes several other targeted amendments to the existing accounting and disclosure requirements for financial instruments, including revised guidance related to valuation allowance assessments when recognizing deferred tax assets on unrealized losses on available-for-sale debt securities. The ASU is effective for the Company beginning on January 1, 2018. The Company is currently assessing the impact of an acquired entitythis guidance on the Company’s Consolidated Financial Statements.
In August 2015, the FASB issued ASU No. 2015-15 “Interest - Imputation of Interest: Presentation and its subsidiaries uponSubsequent Measurement of Debt Issuance Costs Associated with Line-Of-Credit Arrangements.” The ASU incorporates guidance from the occurrenceSEC on deferral of an event in which an acquirer (an individual or an entity) obtains controldebt issuance costs associated with line-of-credit arrangements, consistent with ASU 2015-03, regardless of whether there are any outstanding borrowings on the line-of-credit arrangement. This new guidance will not have a material impact on the Company’s Consolidated Financial Statements.
In August 2015, the FASB issued ASU No. 2015-14 “Revenue from Contracts with Customers (Topic 606): Deferral of the acquired entity. An acquired entity may electEffective Date” which defers the optioneffective date of the new revenue standard by one year. As a result of this deferral, the new revenue standard is effective for the Company beginning on January 1, 2018. The Company is currently assessing the impact of this guidance on the Consolidated Financial Statements.
In April 2015, the FASB issued ASU No. 2015-05 “Intangibles - Goodwill and Other - Internal Use Software” which will assist entities in evaluating the accounting for fees paid by a customer in a cloud computing arrangement. The ASU, which allows for early adoption, is effective for the Company beginning on January 1, 2016. Adoption of this guidance is not expected to apply pushdown accountinghave a material impact on the Company’s Consolidated Financial Statements.
In April 2015, the FASB issued ASU No. 2015-03 “Interest - Imputation of Interest: Simplifying the Presentation of Debt Issuance Costs”. This standard requires debt issuance costs to be presented in the consolidated balance sheet as a direct deduction from the carrying value of the associated debt liability, consistent with the presentation of a debt discount. The ASU, which allows for early adoption, is effective for the Company beginning on January 1, 2016. Adoption of this guidance is not expected to have a material impact on the Company’s Consolidated Financial Statements.
In February 2015, the FASB issued ASU No. 2015-02 “Consolidation (Topic 810): Amendments to the Consolidation Analysis”. This standard focuses on the consolidation evaluation for reporting periodorganizations that are required to evaluate whether they should consolidate certain legal entities such as limited partnerships, limited liability corporations, and securitization structures (e.g., collateralized debt obligations, collateralized loan obligations, and mortgage-backed security transactions). This new standard simplifies consolidation accounting by reducing the number of consolidation models. The ASU will be effective for the Company beginning on January 1, 2016. Early adoption is permitted, including adoption in which the change-in-control event occurs. The amendments, which were effective on November 18, 2014 didan interim period. Adoption of this guidance will not have a material impact on the Company’s Consolidated Financial Statements.
In November 2014,January 2015, the FASB issued ASU No. 2015-01 “Income Statement: Extraordinary and Unusual Items.” This ASU eliminates from GAAP the concept of extraordinary items. Accounting Standards Update No. 2014-16, “DerivativesCodification Subtopic 225-20 required that an entity separately classify, present, and Hedging: Determining Whether the Host Contractdisclose extraordinary events and transactions that were unusual in a Hybrid Financial Instrument Issuednature and infrequent in the Form of a Share is More Akin to Debt or to Equity”. Theoccurrence. This ASU, applies to certain classes of shares that include features that entitle the holders to preferences and rights (such as conversion rights, redemption rights, voting powers, and liquidation and dividend payment preferences) over the other shareholders. The amendments require all reporting entities that are issuers of (or investors in) such hybrid financial instruments to determine the nature of the host contract by considering all stated and implied substantive terms and features of the hybrid financial instrument, weighing each term and feature on the basis of the relevant facts and circumstances. The amendmentwhich allows for early adoption, is effective for annual periodsthe Company beginning after December 15, 2015, and interim periods thereafter, andon January 1, 2016. The adoption of this guidance is not expected to have a material impact on the Company’s Consolidated Financial Statements.
In August 2014, the FASB issued Accounting Standards Update No. 2014-15, “Disclosure of Uncertainties about an Entity’s Ability to Continue as a Going Concern.” The new standard provides guidance on determining when and how to disclose going-concern uncertainties in the financial statements. The new standard requires management to perform interim and annual assessments of an entity’s ability to continue as a going concern within one year of the date the financial statements are issued. An entity must provide certain disclosures if “conditions or events raise substantial doubt about the entity’s ability to continue as a going concern.” The amendment is effective for annual periods ending after December 15, 2016, and interim periods thereafter, with early adoption permitted. It is not expected to have a material impact on the Company’s Consolidated Financial Statements.
In August 2014, the FASB issued Accounting Standards Update No. 2014-14, “Classification of Certain Government-Guaranteed Mortgage Loans upon Foreclosure.” This update amends the guidance in Accounting Standards Codification 310 and requires that a mortgage loan be derecognized and that a separate other receivable be recognized upon foreclosure if the following conditions are met: (1) the loan has a government guarantee that is not separable from the loan before foreclosure; (2) at the time of foreclosure, the creditor has the intent to convey the real estate property to the guarantor and make a claim on the guarantee, and the creditor has the ability to recover under that claim; and (3) at the time of foreclosure, any amount of the claim that is determined on the basis of the fair value of the real estate is fixed. Upon foreclosure, the separate other receivable should be measured based on the amount of the loan balance (principal and interest) expected to be recovered from the guarantor. The amendment is effective for annual reporting periods, including interim reporting periods within those periods, beginning after December 15, 2014 and is not expected to have a material impact on the Company’s Consolidated Financial Statements.
In August 2014, the FASB issued Accounting Standards Update No. 2014-13, “Measuring the Financial Assets and the Financial Liabilities of a Consolidated Collateralized Financing Entity.” This update amends the guidance in Accounting Standards Codification 820 and clarifies that a reporting entity that consolidates a collateralized financing entity within the scope of this update may elect to measure the financial assets and the financial liabilities of that collateralized financing entity using either the measurement alternative included in this update or Topic 820 on fair value measurement. When the measurement alternative is not elected for a consolidated collateralized financing entity within the scope of this update, the amendments clarify that (1) the fair value of the financial assets and the fair value of the financial liabilities of the consolidated collateralized financing entity should be measured using the requirements of Topic 820 and (2) any differences in the fair value of the financial assets and the fair value of the financial liabilities of that consolidated collateralized financing entity should be reflected in earnings and attributed to the reporting entity in the consolidated statement of income (loss). The amendment is effective for annual reporting periods, including interim reporting periods within those periods, beginning after December 15, 2015 and is not expected to have a material impact on the Company’s Consolidated Financial Statements.
In June 2014, the FASB issued Accounting Standards Update No. 2014-12, “Accounting for Share-Based Payments When the Terms of an Award Provide That a Performance Target Could Be Achieved after the Requisite Service Period.” This update amends the guidance on stock compensation and clarifies that entities should treat performance targets that can be met after the requisite service period of a share-based payment award as performance conditions that affect vesting. Accordingly, an entity should not record compensation expense (measured as of the grant date without taking into account the effect of the performance target) related to an award for which a transfer to the employee is contingent on the entity’s satisfaction of a performance target until it becomes probable that the performance target will be met. The amendment is effective for annual reporting periods, including
CITIZENS FINANCIAL GROUP, INC.
NOTES TO CONSOLIDATED FINANCIAL STATEMENTS
interim reporting periods within those periods, beginning after December 15, 2015, and is not expected to have a material impact on the Company’s Consolidated Financial Statements.
In June 2014, the FASB issued Accounting Standards Update No. 2014-11, “Repurchase-to-Maturity Transactions, Repurchase Financings, and Disclosures,” which makes limited amendments to the guidance on accounting for certain repurchase agreements. This update requires entities to account for repurchase-to maturity transactions as secured borrowings (rather than as sales with forward repurchase agreements); eliminates accounting guidance on linked repurchase financing transactions; and expands disclosure requirements related to certain transfers of financial assets that are accounted for as sales and certain transfers accounted for as secured borrowings. This update also amends the existing guidance to clarify that repos and securities lending transactions that do not meet all of the de-recognition criteria in the existing guidance should be accounted for as secured borrowings. This amendment is effective for annual reporting periods, including interim reporting periods within those periods, beginning after December 15, 2014, and is not expected to have a material impact on the Company’s Consolidated Financial Statements.
In May 2014, the FASB issued Accounting Standards Update No. 2014-09, “Revenue From Contracts With Customers.” This amendment outlines a single comprehensive model for entities to use in accounting for revenue arising from contracts with customers and supersedes most current revenue recognition guidance, including industry-specific guidance. The core principle of the revenue model is that “an entity recognizes revenue to depict the transfer of promised goods or services to customers in an amount that reflects the consideration to which the entity expects to be entitled in exchange for those goods or services.” The new guidance applies to all contracts with customers except those that are within the scope of other topics in GAAP. This amendment is effective for annual reporting periods, including interim reporting periods within those periods, beginning after December 15, 2016, and is not expected to have a material impact on the Company’s Consolidated Financial Statements.
In April 2014, the FASB issued Accounting Standards Update No. 2014-08, “Reporting Discontinued Operations and Disclosures of Disposals of Components of an Entity.” This amendment modifies the requirements for reporting a discontinued operation. The amended definition of “discontinued operations” includes only disposals, held-for-sale classifications of components, or groups of components of an entity that represent “strategic shift” that either has or will have a major effect on the entity’s operations and financial results, such as geographic area, line of business, equity method investment or other parts of an entity. This amendment also provides disclosure guidance for situations where an entity has continuing involvement with a discontinued operation or retains an equity method investment in a component after disposal. This amendment is effective for all disposals or classifications as held for sale (including businesses or nonprofit activities that, on acquisition, are classified as held for sale) that occur in annual periods, and in interim periods within those annual periods, beginning after December 15, 2014. It is not expected to have a material impact on the Company’s Consolidated Financial Statements.
In January 2014, the FASB issued Accounting Standards Update No. 2014-04, “Reclassification of Residential Real Estate Collateralized Consumer Mortgage Loans upon Foreclosure.” This amendment clarifies that an in-substance repossession or foreclosure occurs, and a creditor is considered to have received physical possession of residential real estate property collateralizing a consumer mortgage loan, upon either (1) the creditor obtaining legal title to the residential real estate property upon completion of a foreclosure or (2) the borrower conveying all interest in the residential real estate property to the creditor to satisfy that loan through completion of a deed in lieu of foreclosure or through a similar legal agreement. The amendment requires disclosure of both (1) the amount of foreclosed residential real estate property held by the creditor and (2) the recorded investment in consumer mortgage loans collateralized by residential real estate property that are in the process of foreclosure according to local requirements of the applicable jurisdiction. This amendment is effective for annual periods, and interim periods within those annual periods, beginning after December 15, 2014, and is not expected to have a material impact on the Company’s Consolidated Financial Statements.
In January 2014, the FASB issued Accounting Standards Update No. 2014-01, “Accounting for Investments in Qualified Affordable Housing Projects.” This amendment permits reporting entities to make an accounting policy election to account for their investments in qualified affordable housing projects using the proportional amortization method if certain conditions are met. Under the proportional amortization method, an entity amortizes the initial cost of the investment in proportion to the tax credits and other tax benefits received and recognizes the net investment performance in the income statement as a component of income tax expense (benefit). Qualified affordable housing project investments that are not accounted for using the proportional amortization method must be accounted for as an equity method or cost method investment. This amendment is effective for annual periods and interim reporting periods within those annual periods, beginning after December 15, 2014. Management expects this amendment to unfavorably impact the 2015 effective income tax rate by approximately 2.4%, however this is not expected to have a material impact on the Company’s Consolidated Financial Statements. See Note 14 “Income Taxes” for further information.
CITIZENS FINANCIAL GROUP, INC.
NOTES TO CONSOLIDATED FINANCIAL STATEMENTS
NOTE 2 - CASH AND DUE FROM BANKS
The Company’s subsidiary banks maintain certain average reserve balances and compensating balances for check clearing and other services with the FRB. At December 31, 20142015 and 2013,2014, the balance of deposits at the FRB amounted to $2.1$2.0 billion and $1.4$2.1 billion, respectively. Average balances maintained with the FRB during the years ended December 31, 2015, 2014, 2013, and 20122013 exceeded amounts required by law for the FRB’s requirements. All amounts, both required and excess reserves, held at the FRB currently earn interest at a fixed rate of 2550 basis points. As a result, the Company recorded, in interest-bearing deposits in banks, interest income on FRB deposits of $5$4 million, $5 million, and $3$5 million for the years ended December 31, 2015, 2014, 2013, and 2012,2013, respectively.
NOTE 3 - SECURITIES
The following table provides the major components of securities at amortized cost and fair value:
| | | | December 31, 2014 | | December 31, 2013 | December 31, 2015 | | December 31, 2014 |
| (in millions) | Amortized Cost | Gross Unrealized Gains | Gross Unrealized Losses | Fair Value | | Amortized Cost | Gross Unrealized Gains | Gross Unrealized Losses | Fair Value | Amortized Cost | Gross Unrealized Gains | Gross Unrealized Losses | Fair Value | | Amortized Cost | Gross Unrealized Gains | Gross Unrealized Losses | Fair Value |
| Securities Available for Sale | | |
| | |
|
| U.S. Treasury |
| $15 |
|
| $— |
|
| $— |
|
| $15 |
| |
| $15 |
|
| $— |
|
| $— |
|
| $15 |
| |
| U.S. Treasury and other | |
| $16 |
|
| $— |
|
| $— |
|
| $16 |
| |
| $15 |
|
| $— |
|
| $— |
|
| $15 |
|
| State and political subdivisions | 10 |
| — |
| — |
| 10 |
| | 11 |
| — |
| (1 | ) | 10 |
| 9 |
| — |
| — |
| 9 |
| | 10 |
| — |
| — |
| 10 |
|
| Mortgage-backed securities: | | | | | | |
| Federal agencies and U.S. government sponsored entities | 17,683 |
| 301 |
| (50 | ) | 17,934 |
| | 14,970 |
| 151 |
| (128 | ) | 14,993 |
| 17,234 |
| 153 |
| (67 | ) | 17,320 |
| | 17,683 |
| 301 |
| (50 | ) | 17,934 |
|
| Other/non-agency | 703 |
| 4 |
| (35 | ) | 672 |
| | 992 |
| 5 |
| (45 | ) | 952 |
| 555 |
| 4 |
| (37 | ) | 522 |
| | 703 |
| 4 |
| (35 | ) | 672 |
|
| Total mortgage-backed securities | 18,386 |
| 305 |
| (85 | ) | 18,606 |
| | 15,962 |
| 156 |
| (173 | ) | 15,945 |
| 17,789 |
| 157 |
| (104 | ) | 17,842 |
| | 18,386 |
| 305 |
| (85 | ) | 18,606 |
|
| Total debt securities available for sale | 18,411 |
| 305 |
| (85 | ) | 18,631 |
| | 15,988 |
| 156 |
| (174 | ) | 15,970 |
| 17,814 |
| 157 |
| (104 | ) | 17,867 |
| | 18,411 |
| 305 |
| (85 | ) | 18,631 |
|
| Marketable equity securities | 10 |
| 3 |
| — |
| 13 |
| | 10 |
| 3 |
| — |
| 13 |
| 5 |
| — |
| — |
| 5 |
| | 10 |
| 3 |
| — |
| 13 |
|
| Other equity securities | 12 |
| — |
| — |
| 12 |
| | 12 |
| — |
| — |
| 12 |
| 12 |
| — |
| — |
| 12 |
| | 12 |
| — |
| — |
| 12 |
|
| Total equity securities available for sale | 22 |
| 3 |
| — |
| 25 |
| | 22 |
| 3 |
| — |
| 25 |
| 17 |
| — |
| — |
| 17 |
| | 22 |
| 3 |
| — |
| 25 |
|
| Total securities available for sale |
| $18,433 |
|
| $308 |
|
| ($85 | ) |
| $18,656 |
| |
| $16,010 |
|
| $159 |
|
| ($174 | ) |
| $15,995 |
|
| $17,831 |
|
| $157 |
|
| ($104 | ) |
| $17,884 |
| |
| $18,433 |
|
| $308 |
|
| ($85 | ) |
| $18,656 |
|
| Securities Held to Maturity | | | | | | |
| Mortgage-backed securities: | | | | | | |
| Federal agencies and U.S. government sponsored entities |
| $3,728 |
|
| $22 |
|
| ($31 | ) |
| $3,719 |
| |
| $2,940 |
|
| $— |
|
| ($33 | ) |
| $2,907 |
|
| $4,105 |
|
| $27 |
|
| ($11 | ) |
| $4,121 |
| |
| $3,728 |
|
| $22 |
|
| ($31 | ) |
| $3,719 |
|
| Other/non-agency | 1,420 |
| 54 |
| — |
| 1,474 |
| | 1,375 |
| — |
| (25 | ) | 1,350 |
| 1,153 |
| 23 |
| — |
| 1,176 |
| | 1,420 |
| 54 |
| — |
| 1,474 |
|
| Total securities held to maturity |
| $5,148 |
|
| $76 |
|
| ($31 | ) |
| $5,193 |
| |
| $4,315 |
|
| $— |
|
| ($58 | ) |
| $4,257 |
|
| $5,258 |
|
| $50 |
|
| ($11 | ) |
| $5,297 |
| |
| $5,148 |
|
| $76 |
|
| ($31 | ) |
| $5,193 |
|
| Other Investment Securities | | | | |
| Other Investment Securities, at Fair Value | | | | |
| Money market mutual fund | |
| $65 |
|
| $— |
|
| $— |
|
| $65 |
| |
| $28 |
|
| $— |
|
| $— |
|
| $28 |
|
| Other investments | | 5 |
| — |
| — |
| 5 |
| | 5 |
| — |
| — |
| 5 |
|
| Total other investment securities, at fair value | |
| $70 |
|
| $— |
|
| $— |
|
| $70 |
| |
| $33 |
|
| $— |
|
| $— |
|
| $33 |
|
| Other Investment Securities, at Cost | | | | |
| Federal Reserve Bank stock |
| $477 |
|
| $— |
|
| $— |
|
| $477 |
| |
| $462 |
|
| $— |
|
| $— |
|
| $462 |
|
| $468 |
|
| $— |
|
| $— |
|
| $468 |
| |
| $477 |
|
| $— |
|
| $— |
|
| $477 |
|
| Federal Home Loan Bank stock | 390 |
| — |
| — |
| 390 |
| | 468 |
| — |
| — |
| 468 |
| 395 |
| — |
| — |
| 395 |
| | 390 |
| — |
| — |
| 390 |
|
| Venture capital and other investments | 5 |
| — |
| — |
| 5 |
| | 5 |
| — |
| — |
| 5 |
| |
| Total other investment securities |
| $872 |
|
| $— |
|
| $— |
|
| $872 |
| |
| $935 |
|
| $— |
|
| $— |
|
| $935 |
| |
| Total other investment securities, at cost | |
| $863 |
|
| $— |
|
| $— |
|
| $863 |
| |
| $867 |
|
| $— |
|
| $— |
|
| $867 |
|
CITIZENS FINANCIAL GROUP, INC.
NOTES TO CONSOLIDATED FINANCIAL STATEMENTS
The Company has reviewed its securities portfolio for other-than-temporary impairments. The following table presents the net securities impairment losses recognized in earnings:
|
| | | | | | | | | | | |
| | Year Ended December 31, |
| (in millions) | 2015 |
| | 2014 |
| | 2013 |
|
| Other-than-temporary impairment: | | | | | |
| Total other-than-temporary impairment losses |
| ($43 | ) | |
| ($45 | ) | |
| ($49 | ) |
| Portions of loss recognized in other comprehensive income (before taxes) | 36 |
| | 35 |
| | 41 |
|
| Net securities impairment losses recognized in earnings |
| ($7 | ) | |
| ($10 | ) | |
| ($8 | ) |
The following tables summarize those securities whose fair values are below carrying values, segregated by those that have been in a continuous unrealized loss position for less than twelve months and those that have been in a continuous unrealized loss position for twelve months or longer:
| | | | December 31, 2014 | December 31, 2015 |
| | Less than 12 Months | | 12 Months or Longer | | Total | Less than 12 Months | | 12 Months or Longer | | Total |
| (dollars in millions) | Number of Issues | Fair Value | Gross Unrealized Losses | | Number of Issues | Fair Value | Gross Unrealized Losses | | Number of Issues | Fair Value | Gross Unrealized Losses | Number of Issues | Fair Value | Gross Unrealized Losses | | Number of Issues | Fair Value | Gross Unrealized Losses | | Number of Issues | Fair Value | Gross Unrealized Losses |
| State and political subdivisions | — |
|
| $— |
|
| $— |
| | 1 |
|
| $10 |
|
| $— |
| | 1 |
|
| $10 |
|
| $— |
| 1 |
|
| $9 |
|
| $— |
| | — |
|
| $— |
|
| $— |
| | 1 |
|
| $9 |
|
| $— |
|
| US Treasury and other | | 1 |
| 15 |
| — |
| | — |
| — |
| — |
| | 1 |
| 15 |
|
| $— |
|
| Mortgage-backed securities: | | | | | | | | | | | | | | | | |
| Federal agencies and U.S. government sponsored entities | 75 |
| 3,282 |
| (24 | ) | | 52 |
| 1,766 |
| (57 | ) | | 127 |
| 5,048 |
| (81 | ) | 162 |
| 7,423 |
| (51 | ) | | 36 |
| 819 |
| (27 | ) | | 198 |
| 8,242 |
| (78 | ) |
| Other/non-agency | 6 |
| 80 |
| (2 | ) | | 17 |
| 397 |
| (33 | ) | | 23 |
| 477 |
| (35 | ) | 2 |
| 9 |
| — |
| | 20 |
| 361 |
| (37 | ) | | 22 |
| 370 |
| (37 | ) |
| Total mortgage-backed securities | 81 |
| 3,362 |
| (26 | ) | | 69 |
| 2,163 |
| (90 | ) | | 150 |
| 5,525 |
| (116 | ) | 164 |
| 7,432 |
| (51 | ) | | 56 |
| 1,180 |
| (64 | ) | | 220 |
| 8,612 |
| (115 | ) |
| Total | 81 |
|
| $3,362 |
|
| ($26 | ) | | 70 |
|
| $2,173 |
|
| ($90 | ) | | 151 |
|
| $5,535 |
|
| ($116 | ) | 166 |
|
| $7,456 |
|
| ($51 | ) | | 56 |
|
| $1,180 |
|
| ($64 | ) | | 222 |
|
| $8,636 |
|
| ($115 | ) |
| | | | December 31, 2013 | December 31, 2014 |
| | Less than 12 Months | | 12 Months or Longer | | Total | Less than 12 Months | | 12 Months or Longer | | Total |
| (dollars in millions) | Number of Issues | Fair Value | Gross Unrealized Losses | | Number of Issues | Fair Value | Gross Unrealized Losses | | Number of Issues | Fair Value | Gross Unrealized Losses | Number of Issues | Fair Value | Gross Unrealized Losses | | Number of Issues | Fair Value | Gross Unrealized Losses | | Number of Issues | Fair Value | Gross Unrealized Losses |
| State and political subdivisions | 1 |
|
| $10 |
|
| ($1 | ) | | — |
|
| $— |
|
| $— |
| | 1 |
|
| $10 |
|
| ($1 | ) | — |
|
| $— |
|
| $— |
| | 1 |
|
| $10 |
|
| $— |
| | 1 |
|
| $10 |
|
| $— |
|
| Mortgage-backed securities: |
|
|
|
|
|
| |
|
|
|
|
|
| |
|
|
|
|
|
|
|
|
|
|
|
| |
|
|
|
|
|
| |
|
|
|
|
|
|
| Federal agencies and U.S. government sponsored entities | 263 |
| 12,067 |
| (158 | ) | | 7 |
| 20 |
| (2 | ) | | 270 |
| 12,087 |
| (160 | ) | 75 |
| 3,282 |
| (24 | ) | | 52 |
| 1,766 |
| (57 | ) | | 127 |
| 5,048 |
| (81 | ) |
| Other/non-agency | 22 |
| 1,452 |
| (34 | ) | | 19 |
| 490 |
| (37 | ) | | 41 |
| 1,942 |
| (71 | ) | 6 |
| 80 |
| (2 | ) | | 17 |
| 397 |
| (33 | ) | | 23 |
| 477 |
| (35 | ) |
| Total mortgage-backed securities | 285 |
| 13,519 |
| (192 | ) | | 26 |
| 510 |
| (39 | ) | | 311 |
| 14,029 |
| (231 | ) | 81 |
| 3,362 |
| (26 | ) | | 69 |
| 2,163 |
| (90 | ) | | 150 |
| 5,525 |
| (116 | ) |
| Total | 286 |
|
| $13,529 |
|
| ($193 | ) | | 26 |
|
| $510 |
|
| ($39 | ) | | 312 |
|
| $14,039 |
|
| ($232 | ) | 81 |
|
| $3,362 |
|
| ($26 | ) | | 70 |
|
| $2,173 |
|
| ($90 | ) | | 151 |
|
| $5,535 |
|
| ($116 | ) |
For each debt security identified with an unrealized loss, the Company reviews the expected cash flows to determine if the impairment in value is temporary or other-than-temporary. If the Company has determined that the present value of the debt security’s expected cash flows is less than its amortized cost basis, an other-than-temporary impairment is deemed to have occurred. The amount of impairment loss that is recognized in current period earnings is dependent on the Company’s intent to sell (or not sell) the debt security.
CITIZENS FINANCIAL GROUP, INC.
NOTES TO CONSOLIDATED FINANCIAL STATEMENTS
If the Company intends to sell the impaired debt security, the impairment loss recognized in current period earnings equals the difference between the debt security’s fair value and its amortized cost. If the Company does not intend to sell the impaired debt security, and it is not likely that the Company will be required to sell the impaired security, the credit-related impairment loss is recognized in current period earnings and equals the difference between the amortized cost of the debt security and the present value of the expected cash flows that have currently been projected.
In addition to these cash flow projections, several other characteristics of each debt security are reviewed when determining whether a credit loss exists and the period over which the debt security is expected to recover. These characteristics include: (1) the type of investment, (2) various market factors affecting the fair value of the security (e.g., interest rates, spread levels, liquidity in the sector, etc.), (3) the length and severity of impairment, and (4) the public credit rating of the instrument.
The Company estimates the portion of loss attributable to credit using a cash flow model. The inputs to this model include prepayment, default and loss severity assumptions that are based on industry research and observed data. The loss projections generated by the model are reviewed on a quarterly basis by a cross-functional governance committee. This governance committee determines whether security impairments are other-than-temporary based on this review.
CITIZENS FINANCIAL GROUP, INC.
NOTES TO CONSOLIDATED FINANCIAL STATEMENTS
The following table presents the cumulative credit related losses recognized in earnings on debt securities held by the Company as of:
Company:
| | | | Year Ended December 31, | Year Ended December 31, |
| (in millions) | 2014 |
| | 2013 |
| | 2012 |
| 2015 |
| | 2014 |
| | 2013 |
|
| Cumulative balance at beginning of period |
| $56 |
| |
| $55 |
| |
| $38 |
|
| $62 |
| |
| $56 |
| |
| $55 |
|
| Credit impairments recognized in earnings on securities not previously impaired | — |
| | — |
| | 1 |
| |
| Credit impairments recognized in earnings on securities that have been previously impaired | 10 |
| | 8 |
| | 23 |
| 7 |
| | 10 |
| | 8 |
|
| Reductions due to increases in cash flow expectations on impaired securities | (4 | ) | | (7 | ) | | (7 | ) | (3 | ) | | (4 | ) | | (7 | ) |
| Cumulative balance at end of period |
| $62 |
| |
| $56 |
| |
| $55 |
|
| $66 |
| |
| $62 |
| |
| $56 |
|
Cumulative credit losses recognized in earnings for impaired AFS debt securities held as of December 31, 2015, 2014 and 2013 and 2012 were $66 million, $62 million and $56 million, $55 million, respectively. There were no credit losses recognized in earnings for the Company'sCompany’s HTM portfolio for the years endedas of December 31, 2015, 2014 and 2013. For the years ended December 31, 2015, 2014 2013 and 2012,2013, the Company recognized credit related other-than-temporary impairment losses in earnings of $7 million, $10 million $8 million and $24$8 million, respectively, related to non-agency MBS in the AFS portfolio. The Company soldThere were no credit impaired debt securities sold during the years ended December 31, 2015, 2014 2013 and 2012,2013, respectively. Reductions in credit losses due to increases in cash flow expectations were $4$3 million, $7$4 million and $7 million for the years ended December 31, 2015, 2014 2013, and 2012,2013, respectively, and were presented in interest income from investment securities interest income on the Consolidated Statements of Operations. The Company does not currently have the intent to sell these debt securities, and it is not likely that the Company will be required to sell these debt securities prior to the recovery of their amortized cost bases. As of December 31, 2014, 2013, and 2012, $35 million, $41 million, and $60 million, respectively, of pre-tax non-credit related losses were deferred in OCI.
The Company has determined that credit losses are not expected to be incurred on the remaining agency and non-agency MBS identified with unrealized losses as of the current reporting date. The unrealized losses on these debt securities reflect the reduced liquidity in the MBS market and the increased risk spreads due to the uncertainty of the U.S. macroeconomic environment. Therefore, the Company has determined that these debt securities are not other-than-temporarily impaired because the Company does not currently have the intent to sell these debt securities, and it is not likely that the Company will be required to sell these debt securities prior to the recovery of their amortized cost bases. Additionally, anyAny subsequent increases in the valuation of impaired debt securities do not impact their recorded cost bases. Additionally, as of December 31, 2015, 2014 and 2013, $36 million, $35 million and $41 million respectively, of pre-tax non-credit related losses were deferred in OCI.
CITIZENS FINANCIAL GROUP, INC.
NOTES TO CONSOLIDATED FINANCIAL STATEMENTS
The amortized cost and fair value of debt securities at December 31, 20142015 by contractual maturity are shown below. Expected maturities may differ from contractual maturities because issuers may have the right to call or prepay obligations with or without call or prepaymentincurring penalties.
| | | | Distribution of Maturities | Distribution of Maturities |
| (in millions) | 1 Year or Less | 1-5 Years | 5-10 Years | After 10 Years | Total |
| 1 Year or Less | 1-5 Years | 5-10 Years | After 10 Years | Total |
|
| Amortized Cost: | | | | |
| Debt securities available for sale | | |
| U.S. Treasury |
| $15 |
|
| $— |
|
| $— |
|
| $— |
|
| $15 |
| |
| U.S. Treasury and other | |
| $15 |
|
| $— |
|
| $1 |
|
| $— |
|
| $16 |
|
| State and political subdivisions | — |
| — |
| — |
| 10 |
| 10 |
| — |
| — |
| — |
| 9 |
| 9 |
|
| Mortgage-backed securities: | | |
| Federal agencies and U.S. government sponsored entities | 2 |
| 53 |
| 2,318 |
| 15,310 |
| 17,683 |
| 4 |
| 52 |
| 1,833 |
| 15,345 |
| 17,234 |
|
| Other/non-agency | — |
| 51 |
| 57 |
| 595 |
| 703 |
| — |
| 68 |
| 3 |
| 484 |
| 555 |
|
| Total debt securities available for sale | 17 |
| 104 |
| 2,375 |
| 15,915 |
| 18,411 |
| 19 |
| 120 |
| 1,837 |
| 15,838 |
| 17,814 |
|
| Debt securities held to maturity | | |
| Mortgage-backed securities: | | |
| Federal agencies and U.S. government sponsored entities | — |
| — |
| — |
| 3,728 |
| 3,728 |
| — |
| — |
| — |
| 4,105 |
| 4,105 |
|
| Other/non-agency | — |
| — |
| — |
| 1,420 |
| 1,420 |
| — |
| — |
| — |
| 1,153 |
| 1,153 |
|
| Total debt securities held to maturity | — |
| — |
| — |
| 5,148 |
| 5,148 |
| — |
| — |
| — |
| 5,258 |
| 5,258 |
|
| Total amortized cost of debt securities |
| $17 |
|
| $104 |
|
| $2,375 |
|
| $21,063 |
|
| $23,559 |
|
| $19 |
|
| $120 |
|
| $1,837 |
|
| $21,096 |
|
| $23,072 |
|
| | | |
| Fair Value: | | |
| Debt securities available for sale | | |
| U.S. Treasury |
| $15 |
|
| $— |
|
| $— |
|
| $— |
|
| $15 |
| |
| U.S. Treasury and other | |
| $15 |
|
| $— |
|
| $1 |
|
| $— |
|
| $16 |
|
| State and political subdivisions | — |
| — |
| — |
| 10 |
| 10 |
| — |
| — |
| — |
| 9 |
| 9 |
|
| Mortgage-backed securities: | | |
| Federal agencies and U.S. government sponsored entities | 2 |
| 56 |
| 2,333 |
| 15,543 |
| 17,934 |
| 4 |
| 54 |
| 1,845 |
| 15,417 |
| 17,320 |
|
| Other/non-agency | — |
| 52 |
| 58 |
| 562 |
| 672 |
| — |
| 70 |
| 3 |
| 449 |
| 522 |
|
| Total debt securities available for sale | 17 |
| 108 |
| 2,391 |
| 16,115 |
| 18,631 |
| 19 |
| 124 |
| 1,849 |
| 15,875 |
| 17,867 |
|
| Debt securities held to maturity | | |
| Mortgage-backed securities: | | |
| Federal agencies and U.S. government sponsored entities | — |
| — |
| — |
| 3,719 |
| 3,719 |
| — |
| — |
| — |
| 4,121 |
| 4,121 |
|
| Other/non-agency | — |
| — |
| — |
| 1,474 |
| 1,474 |
| — |
| — |
| — |
| 1,176 |
| 1,176 |
|
| Total debt securities held to maturity | — |
| — |
| — |
| 5,193 |
| 5,193 |
| — |
| — |
| — |
| 5,297 |
| 5,297 |
|
| Total fair value of debt securities |
| $17 |
|
| $108 |
|
| $2,391 |
|
| $21,308 |
|
| $23,824 |
|
| $19 |
|
| $124 |
|
| $1,849 |
|
| $21,172 |
|
| $23,164 |
|
The following table reports the amounts recognized in interest income from investment securities and interest-bearing deposits in banks on the Consolidated StatementStatements of Operations:
| | | | Year Ended December 31, | Year Ended December 31, |
| (in millions) | 2014 |
| | 2013 |
| | 2012 |
| 2015 |
| 2014 |
| 2013 |
|
| Taxable |
| $619 |
| |
| $477 |
| |
| $618 |
|
| $621 |
|
| $619 |
|
| $477 |
|
| Non-taxable | — |
| | — |
| | 2 |
| — |
| — |
| — |
|
Interest-bearing cash and due from banks and deposits in banks
| 5 |
| | 11 |
| | 4 |
|
| $5 |
|
| $5 |
|
| $11 |
|
| Total interest income from investment securities |
| $624 |
| |
| $488 |
| |
| $624 |
| |
| Total interest income from investment securities and interest-bearing deposits in banks | |
| $626 |
|
| $624 |
|
| $488 |
|
CITIZENS FINANCIAL GROUP, INC.
NOTES TO CONSOLIDATED FINANCIAL STATEMENTS
Realized gains and losses on AFS securities are shown below:
| | | | Year Ended December 31, | Year Ended December 31, |
| (in millions) | 2014 |
| | 2013 |
| | 2012 |
| 2015 |
| | 2014 |
| | 2013 |
|
| Gains on sale of debt securities |
| $33 |
| |
| $144 |
| |
| $93 |
|
| $41 |
| |
| $33 |
| |
| $144 |
|
| Losses on sale of debt securities | (5 | ) | | — |
| | — |
| (12 | ) | | (5 | ) | | — |
|
| Gains on sale of marketable equity securities | — |
| | — |
| | 2 |
| |
| Total |
| $28 |
| |
| $144 |
| |
| $95 |
| |
| Debt securities gains, net | |
| $29 |
| |
| $28 |
| |
| $144 |
|
| Equity securities gains | |
| $3 |
| |
| $— |
| |
| $— |
|
Included in the table above is a $2 million gain recognized on the sale of a $73 million mortgage-backed security that was classified as HTM. The HTM security was sold because the holding would have been prohibited under the Volcker Rule beginning in July 2017.
The amortized cost and fair value of securities pledged are shown below:
|
| | | | | | | | | | | | | |
| | December 31, 2014 | | December 31, 2013 |
| (in millions) | Amortized Cost | Fair Value | | Amortized Cost | Fair Value |
| Pledged against repurchase agreements |
| $3,650 |
|
| $3,701 |
| |
| $5,016 |
|
| $4,998 |
|
| Pledged against FHLB borrowed funds | 1,355 |
| 1,407 |
| | 1 |
| 1 |
|
| Pledged against derivatives, to qualify for fiduciary powers, and to secure public and other deposits as required by law | 3,453 |
| 3,520 |
| | 2,818 |
| 2,853 |
|
Securitizations of mortgage loans retained in the investment portfolio for the years ended December 31, 2014, 2013, and 2012 were $18 million, $106 million, and $21 million, respectively. These securitizations included a substantive guarantee by a third party. In 2014 and 2013, the guarantors were Fannie Mae, Ginnie Mae, and Freddie Mac. In 2012, the guarantors were Fannie Mae and Freddie Mac. These securitizations were accounted for as a sale of the transferred loans and as a purchase of securities. The securities received from the guarantors are classified as AFS. |
| | | | | | | | | | | | | |
| | December 31, 2015 | | December 31, 2014 |
| (in millions) | Amortized Cost | Fair Value |
| | Amortized Cost | Fair Value |
|
| Pledged against repurchase agreements |
| $805 |
|
| $808 |
| |
| $3,650 |
|
| $3,701 |
|
| Pledged against FHLB borrowed funds | 1,163 |
| 1,186 |
| | 1,355 |
| 1,407 |
|
| Pledged against derivatives, to qualify for fiduciary powers, and to secure public and other deposits as required by law | 3,579 |
| 3,610 |
| | 3,453 |
| 3,520 |
|
The Company regularly enters into security repurchase agreements with unrelated counterparties. Repurchase agreements are financial transactions that involve the transfer of a security from one party to another and a subsequent transfer of the same (or “substantially the same”) security back to the original party. The Company’s repurchase agreements are typically short-term transactions, (e.g., overnight), but they may be extended to longer terms to maturity. Such transactions are accounted for as secured borrowed funds on the Company’s financial statements. When permitted by GAAP, the Company offsets the short-term receivables associated with its reverse repurchase agreements with the short-term payables associated with its repurchase agreements.
The effects of this offsetting on the Consolidated Balance Sheets are presented in the following table:
| | | | December 31, 2014 | | December 31, 2013 | December 31, 2015 | | December 31, 2014 |
| (in millions) | Gross Assets (Liabilities) | Gross Assets (Liabilities) Offset | Net Amounts of Assets (Liabilities) | | Gross Assets (Liabilities) | Gross Assets (Liabilities) Offset | Net Amounts of Assets (Liabilities) | Gross Assets (Liabilities) | Gross Assets (Liabilities) Offset | Net Amounts of Assets (Liabilities) | | Gross Assets (Liabilities) | Gross Assets (Liabilities) Offset | Net Amounts of Assets (Liabilities) |
| Securities purchased under agreements to resell |
| $— |
|
| $— |
|
| $— |
| |
| $— |
|
| $— |
|
| $— |
|
| $500 |
|
| ($500 | ) |
| $— |
| |
| $— |
|
| $— |
|
| $— |
|
| Securities sold under agreements to repurchase | (2,600 | ) | — |
| (2,600 | ) | | (3,000 | ) | — |
| (3,000 | ) | (500 | ) | 500 |
| — |
| | (2,600 | ) | — |
| (2,600 | ) |
Note: The Company also offsets certain derivative assets and derivative liabilities on the Consolidated Balance Sheets. For further information see Note 1516 “Derivatives.”
Securitizations of mortgage loans retained in the investment portfolio for the years ended December 31, 2015, 2014 and 2013, were $3 million, $18 million and $106 million, respectively. These securitizations included a substantive guarantee by a third party. In 2015, the guarantor was Freddie Mac. In 2014 and 2013, the guarantors were Fannie Mae, Ginnie Mae, and Freddie Mac. These securitizations were accounted for as a sale of the transferred loans and as a purchase of securities. The securities received from the guarantors are classified as AFS.
CITIZENS FINANCIAL GROUP, INC.
NOTES TO CONSOLIDATED FINANCIAL STATEMENTS
Securities under the agreements to repurchase or resell are accounted for as secured borrowings. The following table presents the Company's related activity, by collateral type and remaining contractual maturity, at December 31, 2015:
|
| | | | | | | | | | | | | | | |
| | Remaining Contractual Maturity of the Agreements |
| (in millions) | Overnight and Continuous | Up to 30 Days | 30-90 Days | Greater Than 90 Days | Total |
|
| Securities purchased under agreements to resell | | | | | |
| Mortgage-backed securities - Agency |
| $— |
|
| $500 |
|
| $— |
|
| $— |
|
| $500 |
|
| Total securities purchased under agreements to resell |
| $— |
|
| $500 |
|
| $— |
|
| $— |
|
| $500 |
|
| Securities sold under agreements to repurchase | | | | | |
| Mortgage-backed securities - Agency |
| $— |
|
| ($500 | ) |
| $— |
|
| $— |
|
| ($500 | ) |
| Total securities sold under agreement to repurchase |
| $— |
|
| ($500 | ) |
| $— |
|
| $— |
|
| ($500 | ) |
For these securities sold under the agreements to repurchase, the Company would be obligated to provide additional collateral in the event of a significant decline in fair value of the collateral pledged. The Company manages the risk by monitoring the liquidity and credit quality of the collateral, as well as the maturity profile of the transactions.
NOTE 4 - LOANS AND LEASES
A summary of the loans and leases portfolio follows:
| | | | December 31, | December 31, |
| (in millions) | 2014 |
| | 2013 |
| 2015 |
| | 2014 |
|
| Commercial |
| $31,431 |
| |
| $28,667 |
|
| $33,264 |
| |
| $31,431 |
|
| Commercial real estate | 7,809 |
| | 6,948 |
| 8,971 |
| | 7,809 |
|
| Leases | 3,986 |
| | 3,780 |
| 3,979 |
| | 3,986 |
|
| Total commercial | 43,226 |
| | 39,395 |
| 46,214 |
| | 43,226 |
|
| Residential mortgages | 11,832 |
| | 9,726 |
| 13,318 |
| | 11,832 |
|
| Home equity loans | 3,424 |
| | 4,301 |
| 2,557 |
| | 3,424 |
|
| Home equity lines of credit | 15,423 |
| | 15,667 |
| 14,674 |
| | 15,423 |
|
Home equity loans serviced by others (1) | 1,228 |
| | 1,492 |
| 986 |
| | 1,228 |
|
Home equity lines of credit serviced by others (1) | 550 |
| | 679 |
| 389 |
| | 550 |
|
| Automobile | 12,706 |
| | 9,397 |
| 13,828 |
| | 12,706 |
|
| Student | 2,256 |
| | 2,208 |
| 4,359 |
| | 2,256 |
|
| Credit cards | 1,693 |
| | 1,691 |
| 1,634 |
| | 1,693 |
|
| Other retail | 1,072 |
| | 1,303 |
| 1,083 |
| | 1,072 |
|
| Total retail | 50,184 |
| | 46,464 |
| 52,828 |
| | 50,184 |
|
Total loans and leases (2) (3) |
| $93,410 |
| |
| $85,859 |
|
| $99,042 |
| |
| $93,410 |
|
(1) The Company'sCompany’s SBO portfolio consists of purchased home equity loans and lines that were originally serviced by others. The Company now services a portion of this portfolio internally.
(2) Excluded from the table above are loans held for sale totaling $365 million and $281 million as of December 31, 2015 and 2014, and $1.3 billion as of December 31, 2013. The December 31, 2013 loans held for sale balance primarily related to the Chicago Divestiture. For further discussion, see Note 17 “Divestitures and Branch Assets and Liabilities Held for Sale.”respectively.
(3) Mortgage loans serviced for others by the Company'sCompany’s subsidiaries are not included above, and amounted to $17.9$17.6 billion and $18.7$17.9 billion at December 31, 2015 and 2014, and 2013, respectively.
Loans held for sale at fair value totaled $256$325 million and $176$256 million at December 31, 20142015 and 2013,2014, respectively, and consisted primarily of residential mortgages originated for sale.sale of $268 million and the commercial trading portfolio of $57 million as of December 31, 2015. As of December 31, 2014, residential mortgages originated for sale were $213 million, and commercial trading portfolio totaled $43 million. Other loans held for sale totaled $40 million and $25 million and $1.1 billion atas of December 31, 2015 and 2014, respectively, and 2013, respectively. The other loans held for sale balance at December 31, 2013 primarily related to the Company's saleconsisted of certain assets and liabilities associated with its Chicago-area retail branches (the “Chicago Divestiture”). See Note 17 “Divestitures and Branch Assets and Liabilities Held for Sale.”
commercial loan syndications.
Loans pledged as collateral for FHLB borrowed funds totaled $22.0$23.2 billion and $19.0$22.0 billion at December 31, 20142015 and 2013,2014, respectively. This collateral consists primarily of residential mortgages and home equity loans. Loans pledged as collateral
CITIZENS FINANCIAL GROUP, INC.
NOTES TO CONSOLIDATED FINANCIAL STATEMENTS
to support the contingent ability to borrow at the FRB discount window, if necessary, totaled $11.8$15.9 billion and $13.9$11.8 billion at December 31, 20142015 and 2013,2014, respectively.
During the year ended December 31, 2015, the Company purchased automobile loans with an outstanding principal balance of $1.3 billion, a portfolio of residential mortgages with an outstanding principal balance of $1.1 billion, and a portfolio of student loans with an outstanding principal balance of $957 million. During the year ended December 31, 2014, the Company purchased a portfolio of residential loans with an outstanding principal balance of $1.9 billion, a portfolio of auto loans with an outstanding principal balance of $1.7 billion and a portfolio of student loans with an outstanding principal balance of $59 million. Additionally, the Company purchased a portfolio of performing commercial loans to customers in the oil and gas industry from RBS with an outstanding principal balance of $417 million.
During the year ended December 31, 2013,2015, the Company purchasedsold a portfolio of residentialcommercial loans with an outstanding principal balance of $912 million.
In$401 million as part of the Company’s loan syndication project, residential mortgages with an outstanding principal balance of $273 million, and $41 million of credit card balances associated with a terminated agent credit card servicing agreement. During the year ended December 31, 2014, in addition to the $1.0 billion loans sold as part of the Chicago Divestiture,Company's sale of its Chicago-area retail branches, the Company sold portfolios of residential mortgage loans with outstanding principal balances of $126 million and student loans of $357 million, as well as commercial loans with an outstanding principal balance of $301 million during the year ended December 31, 2014. The Company had no sale transactions during the year ended December 31, 2013.
CITIZENS FINANCIAL GROUP, INC.
NOTES TO CONSOLIDATED FINANCIAL STATEMENTS
In December 2014, the Company committed to purchasing pools of performing student loans with principal balances outstanding of approximately $260 million. The specific loans to be purchased were identified in January 2015 and the transactions were settled in January and February 2015.
The Company is engaged in the leasing of equipment for commercial use, with primary lease concentrations to Fortune 1000 companies for large capital equipment acquisitions. A lessee is evaluated from a credit perspective using the same underwriting standards and procedures as for a loan borrower. A lessee is expected to make rental payments based on its cash flows and the viability of its balance sheet. Leases are usually not evaluated as collateral-based transactions, and therefore the lessee’s overall financial strength is the most important credit evaluation factor.
A summary of the investment in leases, before the allowance for lease losses,ALLL, is as follows:
| | | | December 31, | December 31, |
| (in millions) | 2014 |
| | 2013 |
| 2015 |
| | 2014 |
|
| Direct financing leases |
| $3,873 |
| |
| $3,668 |
|
| $3,898 |
| |
| $3,873 |
|
| Leveraged leases | 113 |
| | 112 |
| 81 |
| | 113 |
|
| Total leases |
| $3,986 |
| |
| $3,780 |
|
| $3,979 |
| |
| $3,986 |
|
The components of the investment in leases, before the allowance for lease losses,ALLL, are as follows:
| | | | December 31, | December 31, |
| (in millions) | 2014 |
| | 2013 |
| 2015 |
| | 2014 |
|
| Total future minimum lease rentals |
| $3,324 |
| |
| $3,252 |
|
| $3,195 |
| |
| $3,324 |
|
| Estimated residual value of leased equipment (non-guaranteed) | 1,059 |
| | 968 |
| 1,157 |
| | 1,059 |
|
| Initial direct costs | 22 |
| | 20 |
| 22 |
| | 22 |
|
| Unearned income on minimum lease rentals and estimated residual value of leased equipment | (419 | ) | | (460 | ) | (395 | ) | | (419 | ) |
| Total leases |
| $3,986 |
| |
| $3,780 |
|
| $3,979 |
| |
| $3,986 |
|
At December 31, 2014,2015, the future minimum lease rentals on direct financing and leveraged leases are as follows:
| | | Year Ended December 31, | (in millions) |
| (in millions) |
|
| 2015 |
| $699 |
| |
| 2016 | 615 |
|
| $707 |
|
| 2017 | 497 |
| 588 |
|
| 2018 | 444 |
| 528 |
|
| 2019 | 347 |
| 445 |
|
| 2020 | | 327 |
|
| Thereafter | 722 |
| 600 |
|
| Total |
| $3,324 |
|
| $3,195 |
|
Pre-tax income on leveraged leases was $2 million, for the year ended December 31, 2014$2 million and $3 million for the years ended December 31, 2015, 2014 and 2013, and 2012.respectively. The income tax expense on this income was $1 million for the years ended December 31, 2015, 2014 2013 and 2012.2013. There was no investment credit recognized in income during these years.
CITIZENS FINANCIAL GROUP, INC.
NOTES TO CONSOLIDATED FINANCIAL STATEMENTS
NOTE 5 - ALLOWANCE FOR CREDIT LOSSES, NONPERFORMING ASSETS, AND CONCENTRATIONS OF CREDIT RISK
The allowance for credit losses consists of the ALLL and the reserve for unfunded commitments. It is increased through a provision for credit losses that is charged to earnings, based on the Company’s quarterly evaluation of the loan portfolio, and is reduced by net charge-offs and the ALLL associated with sold loans. See Note 1 “Significant Accounting Policies” for a detailed discussion of ALLL reserve methodologies and estimation techniques.
On a quarterly basis, the Company reviews and refines its estimate of the allowance for credit losses, taking into consideration changes in portfolio size and composition, historical loss experience, internal risk ratings, current economic conditions, industry performance trends and other pertinent information.
CITIZENS FINANCIAL GROUP, INC.
NOTES TO CONSOLIDATED FINANCIAL STATEMENTS
During 2013, the Company modified the way that it establishes the ALLL. The ALLL is reviewed separately for commercial and retail loan portfolios, and the ALLL for each includes an adjustment for qualitative reserves that includes certain risks, factors and events that might not be measured in the statistical analysis. As a result of this change, the unallocated reserve was absorbed into the separately measured commercial and retail qualitative reserves.
Additionally, during December 2013, the Company revised and extended its incurred loss period for certain residential mortgages. This change reflects management's recognition that incurred but unrealized losses emerge differently during various points of an economic/business cycle. Incurred Loss Periods (“ILPs”) are not static and move over time based on several factors. As economies expand and contract, access to credit, jobs, and liquidity moves directionally with the economy. ILPs will be longer in stronger economic times, when borrowers have the financial ability to withstand adversity and the ILPs will be shorter in an adverse economic environment, when the borrower has less financial flexibility. Since the current economy has not been as strong as the economy during the 2002-2006 time period, we believe that ILPs will not be as long, but rather directional to our history. Since overall Company reserves are deemed adequate, there was no need to increase the reserve but rather reallocate some of the general reserves to cover the $96 million incurred loss period increase.
There were no other material changes in assumptions or estimation techniques compared with prior periodsyears that impacted the determination of the current period’syear’s ALLL and the reserve for unfunded lending commitments.
The following is a summary of changes in the allowance for credit losses:
|
| | | | | | | | | |
| Year Ended December 31, 2014 |
| (in millions) | Commercial |
| Retail |
| Total |
|
| Allowance for loan and lease losses as of January 1, 2014 |
| $498 |
|
| $723 |
|
| $1,221 |
|
| Charge-offs | (43 | ) | (450 | ) | (493 | ) |
| Recoveries | 58 |
| 112 |
| 170 |
|
| Net recoveries (charge-offs) | 15 |
| (338 | ) | (323 | ) |
| Provision charged to income | 31 |
| 266 |
| 297 |
|
| Allowance for loan and lease losses as of December 31, 2014 | 544 |
| 651 |
| 1,195 |
|
| Reserve for unfunded lending commitments as of January 1, 2014 | 39 |
| — |
| 39 |
|
| Provision for unfunded lending commitments | 22 |
| — |
| 22 |
|
| Reserve for unfunded lending commitments as of December 31, 2014 | 61 |
| — |
| 61 |
|
| Total allowance for credit losses as of December 31, 2014 |
| $605 |
|
| $651 |
|
| $1,256 |
|
|
| | | | | | | | | | | | |
| | Year Ended December 31, 2013 |
| (in millions) | Commercial |
| Retail |
| Unallocated |
| Total |
|
| Allowance for loan and lease losses as of January 1, 2013 |
| $509 |
|
| $657 |
|
| $89 |
|
| $1,255 |
|
| Charge-offs | (108 | ) | (595 | ) | — |
| (703 | ) |
| Recoveries | 87 |
| 115 |
| — |
| 202 |
|
| Net charge-offs | (21 | ) | (480 | ) | — |
| (501 | ) |
| Sales/Other | (6 | ) | (6 | ) | (1 | ) | (13 | ) |
| Provision charged to income | (19 | ) | 396 |
| 103 |
| 480 |
|
| Transfer of unallocated reserve to qualitative reserve | 35 |
| 60 |
| (95 | ) | — |
|
| Loss emergence period change | — |
| 96 |
| (96 | ) | — |
|
| Allowance for loan and lease losses as of December 31, 2013 | 498 |
| 723 |
| — |
| 1,221 |
|
| Reserve for unfunded lending commitments as of January 1, 2013 | 40 |
| — |
| — |
| 40 |
|
| Credit for unfunded lending commitments | (1 | ) | — |
| — |
| (1 | ) |
| Reserve for unfunded lending commitments as of December 31, 2013 | 39 |
| — |
| — |
| 39 |
|
| Total allowance for credit losses as of December 31, 2013 |
| $537 |
|
| $723 |
|
| $— |
|
| $1,260 |
|
|
| | | | | | | | | |
| | Year Ended December 31, 2015 |
| (in millions) | Commercial |
| Retail |
| Total |
|
| Allowance for loan and lease losses as of January 1, 2015 |
| $544 |
|
| $651 |
|
| $1,195 |
|
| Charge-offs | (36 | ) | (444 | ) | (480 | ) |
| Recoveries | 49 |
| 147 |
| 196 |
|
| Net recoveries (charge-offs) | 13 |
| (297 | ) | (284 | ) |
| Provision charged to income | 39 |
| 266 |
| 305 |
|
| Allowance for loan and lease losses as of December 31, 2015 | 596 |
| 620 |
| 1,216 |
|
| Reserve for unfunded lending commitments as of January 1, 2015 | 61 |
| — |
| 61 |
|
| Credit for unfunded lending commitments | (3 | ) | — |
| (3 | ) |
| Reserve for unfunded lending commitments as of December 31, 2015 | 58 |
| — |
| 58 |
|
| Total allowance for credit losses as of December 31, 2015 |
| $654 |
|
| $620 |
|
| $1,274 |
|
CITIZENS FINANCIAL GROUP, INC.
NOTES TO CONSOLIDATED FINANCIAL STATEMENTS
|
| | | | | | | | | | | | |
| | Year Ended December 31, 2012 |
| (in millions) | Commercial |
| Retail |
| Unallocated |
| Total |
|
| Allowance for loan and lease losses as of January 1, 2012 |
| $691 |
|
| $816 |
|
| $191 |
|
| $1,698 |
|
| Charge-offs | (257 | ) | (853 | ) | — |
| (1,110 | ) |
| Recoveries | 113 |
| 122 |
| — |
| 235 |
|
| Net charge-offs | (144 | ) | (731 | ) | — |
| (875 | ) |
| Sales/Other | (2 | ) | — |
| — |
| (2 | ) |
| Provision charged to income | (36 | ) | 572 |
| (102 | ) | 434 |
|
| Allowance for loan and lease losses as of December 31, 2012 | 509 |
| 657 |
| 89 |
| 1,255 |
|
| Reserve for unfunded lending commitments as of January 1, 2012 | 61 |
| — |
| — |
| 61 |
|
| Credit for unfunded lending commitments | (21 | ) | — |
| — |
| (21 | ) |
| Reserve for unfunded lending commitments as of December 31, 2012 | 40 |
| — |
| — |
| 40 |
|
| Total allowance for credit losses as of December 31, 2012 |
| $549 |
|
| $657 |
|
| $89 |
|
| $1,295 |
|
|
| | | | | | | | | |
| | Year Ended December 31, 2014 |
| (in millions) | Commercial |
| Retail |
| Total |
|
| Allowance for loan and lease losses as of January 1, 2014 |
| $498 |
|
| $723 |
|
| $1,221 |
|
| Charge-offs | (43 | ) | (450 | ) | (493 | ) |
| Recoveries | 58 |
| 112 |
| 170 |
|
| Net (charge-offs) recoveries | 15 |
| (338 | ) | (323 | ) |
| Provision charged to income | 31 |
| 266 |
| 297 |
|
| Allowance for loan and lease losses as of December 31, 2014 | 544 |
| 651 |
| 1,195 |
|
| Reserve for unfunded lending commitments as of January 1, 2014 | 39 |
| — |
| 39 |
|
| Provision for unfunded lending commitments | 22 |
| — |
| 22 |
|
| Reserve for unfunded lending commitments as of December 31, 2014 | 61 |
| — |
| 61 |
|
| Total allowance for credit losses as of December 31, 2014 |
| $605 |
|
| $651 |
|
| $1,256 |
|
|
| | | | | | | | | | | | |
| | Year Ended December 31, 2013 |
| (in millions) | Commercial |
| Retail |
| Unallocated |
| Total |
|
| Allowance for loan and lease losses as of January 1, 2013 |
| $509 |
|
| $657 |
|
| $89 |
|
| $1,255 |
|
| Charge-offs | (108 | ) | (595 | ) | — |
| (703 | ) |
| Recoveries | 87 |
| 115 |
| — |
| 202 |
|
| Net charge-offs | (21 | ) | (480 | ) | — |
| (501 | ) |
| Sales/Other | (6 | ) | (6 | ) | (1 | ) | (13 | ) |
| Provision charged to income | (19 | ) | 396 |
| 103 |
| 480 |
|
| Transfer of unallocated reserve to qualitative reserve | 35 |
| 60 |
| (95 | ) | — |
|
| Loss emergence period change | — |
| 96 |
| (96 | ) | — |
|
| Allowance for loan and lease losses as of December 31, 2013 | 498 |
| 723 |
| — |
| 1,221 |
|
| Reserve for unfunded lending commitments as of January 1, 2013 | 40 |
| — |
| — |
| 40 |
|
| Credit for unfunded lending commitments | (1 | ) | — |
| — |
| (1 | ) |
| Reserve for unfunded lending commitments as of December 31, 2013 | 39 |
| — |
| — |
| 39 |
|
| Total allowance for credit losses as of December 31, 2013 |
| $537 |
|
| $723 |
|
| $— |
|
| $1,260 |
|
The recorded investment in loans and leases based on the Company’s evaluation methodology is as follows:
| | | | December 31, 2014 | | December 31, 2013 | December 31, 2015 | | December 31, 2014 |
| (in millions) | Commercial |
| Retail |
| Total |
| | Commercial |
| Retail |
| Total |
| Commercial |
| Retail |
| Total |
| | Commercial |
| Retail |
| Total |
|
| Individually evaluated |
| $205 |
|
| $1,208 |
|
| $1,413 |
| |
| $239 |
|
| $1,200 |
|
| $1,439 |
|
| $218 |
|
| $1,165 |
|
| $1,383 |
| |
| $205 |
|
| $1,208 |
|
| $1,413 |
|
| Formula-based evaluation | 43,021 |
| 48,976 |
| 91,997 |
| | 39,156 |
| 45,264 |
| 84,420 |
| 45,996 |
| 51,663 |
| 97,659 |
| | 43,021 |
| 48,976 |
| 91,997 |
|
| Total |
| $43,226 |
|
| $50,184 |
|
| $93,410 |
| |
| $39,395 |
|
| $46,464 |
|
| $85,859 |
|
| $46,214 |
|
| $52,828 |
|
| $99,042 |
| |
| $43,226 |
|
| $50,184 |
|
| $93,410 |
|
The following is a summary of the allowance for credit losses by evaluation method:
| | | | December 31, 2014 | | December 31, 2013 | December 31, 2015 | | December 31, 2014 |
| (in millions) | Commercial |
| Retail |
| Total |
| | Commercial |
| Retail |
| Total |
| Commercial |
| Retail |
| Total |
| | Commercial |
| Retail |
| Total |
|
| Individually evaluated |
| $20 |
|
| $109 |
|
| $129 |
| |
| $23 |
|
| $108 |
|
| $131 |
|
| $36 |
|
| $101 |
|
| $137 |
| |
| $20 |
|
| $109 |
|
| $129 |
|
| Formula-based evaluation | 585 |
| 542 |
| 1,127 |
| | 514 |
| 615 |
| 1,129 |
| 618 |
| 519 |
| 1,137 |
| | 585 |
| 542 |
| 1,127 |
|
| Allowance for credit losses |
| $605 |
|
| $651 |
|
| $1,256 |
| |
| $537 |
|
| $723 |
|
| $1,260 |
|
| $654 |
|
| $620 |
|
| $1,274 |
| |
| $605 |
|
| $651 |
|
| $1,256 |
|
CITIZENS FINANCIAL GROUP, INC.
NOTES TO CONSOLIDATED FINANCIAL STATEMENTS
For commercial loans and leases, the Company utilizes regulatory classification ratings to monitor credit quality. Loans with a “pass” rating are those that the Company believes will be fully repaid in accordance with the contractual loan terms. Commercial loans and leases that are “criticized” are those that have some weakness that indicates an increased probability of future loss. For retail loans, the Company primarily uses the loan’s payment and delinquency status to monitor credit quality. The further a loan is past due, the greater the likelihood of future credit loss. These credit quality indicators for both commercial and retail loans are continually updated and monitored.
The recorded investment in classes of commercial loans and leases based on regulatory classification ratings is as follows:
| | | | December 31, 2014 | December 31, 2015 |
| | | Criticized | | | Criticized | |
| (in millions) | Pass |
| Special Mention |
| Substandard |
| Doubtful |
| Total |
| Pass |
| Special Mention |
| Substandard |
| Doubtful |
| Total |
|
| Commercial |
| $30,022 |
|
| $876 |
|
| $427 |
|
| $106 |
|
| $31,431 |
|
| $31,276 |
|
| $911 |
|
| $1,002 |
|
| $75 |
|
| $33,264 |
|
| Commercial real estate | 7,354 |
| 329 |
| 61 |
| 65 |
| 7,809 |
| 8,450 |
| 272 |
| 171 |
| 78 |
| 8,971 |
|
| Leases | 3,924 |
| 12 |
| 50 |
| — |
| 3,986 |
| 3,880 |
| 55 |
| 44 |
| — |
| 3,979 |
|
| Total |
| $41,300 |
|
| $1,217 |
|
| $538 |
|
| $171 |
|
| $43,226 |
|
| $43,606 |
|
| $1,238 |
|
| $1,217 |
|
| $153 |
|
| $46,214 |
|
CITIZENS FINANCIAL GROUP, INC.
NOTES TO CONSOLIDATED FINANCIAL STATEMENTS
| | | | December 31, 2013 | December 31, 2014 |
| | | Criticized | | | Criticized | |
| (in millions) | Pass |
| Special Mention |
| Substandard |
| Doubtful |
| Total |
| Pass |
| Special Mention |
| Substandard |
| Doubtful |
| Total |
|
| Commercial |
| $27,433 |
|
| $588 |
|
| $541 |
|
| $105 |
|
| $28,667 |
|
| $30,022 |
|
| $876 |
|
| $427 |
|
| $106 |
|
| $31,431 |
|
| Commercial real estate | 6,366 |
| 339 |
| 116 |
| 127 |
| 6,948 |
| 7,354 |
| 329 |
| 61 |
| 65 |
| 7,809 |
|
| Leases | 3,679 |
| 40 |
| 61 |
| — |
| 3,780 |
| 3,924 |
| 12 |
| 50 |
| — |
| 3,986 |
|
| Total |
| $37,478 |
|
| $967 |
|
| $718 |
|
| $232 |
|
| $39,395 |
|
| $41,300 |
|
| $1,217 |
|
| $538 |
|
| $171 |
|
| $43,226 |
|
The recorded investment in classes of retail loans, categorized by delinquency status is as follows:
| | | | December 31, 2014 | December 31, 2015 |
| (in millions) | Current |
| 1-29 Days Past Due | 30-89 Days Past Due | 90 Days or More Past Due | Total |
| Current |
| 1-29 Days Past Due | 30-89 Days Past Due | 90 Days or More Past Due | Total |
|
| Residential mortgages |
| $11,352 |
|
| $114 |
|
| $97 |
|
| $269 |
|
| $11,832 |
|
| $12,905 |
|
| $97 |
|
| $70 |
|
| $246 |
|
| $13,318 |
|
| Home equity loans | 2,997 |
| 222 |
| 60 |
| 145 |
| 3,424 |
| 2,245 |
| 164 |
| 44 |
| 104 |
| 2,557 |
|
| Home equity lines of credit | 14,705 |
| 447 |
| 73 |
| 198 |
| 15,423 |
| 13,982 |
| 407 |
| 80 |
| 205 |
| 14,674 |
|
Home equity loans serviced by others (1) | 1,101 |
| 78 |
| 26 |
| 23 |
| 1,228 |
| 886 |
| 60 |
| 20 |
| 20 |
| 986 |
|
Home equity lines of credit serviced by others (1) | 455 |
| 66 |
| 10 |
| 19 |
| 550 |
| 296 |
| 48 |
| 16 |
| 29 |
| 389 |
|
| Automobile | 11,839 |
| 758 |
| 93 |
| 16 |
| 12,706 |
| 12,670 |
| 964 |
| 159 |
| 35 |
| 13,828 |
|
| Student | 2,106 |
| 108 |
| 25 |
| 17 |
| 2,256 |
| 4,175 |
| 113 |
| 30 |
| 41 |
| 4,359 |
|
| Credit cards | 1,615 |
| 39 |
| 22 |
| 17 |
| 1,693 |
| 1,554 |
| 44 |
| 20 |
| 16 |
| 1,634 |
|
| Other retail | 985 |
| 65 |
| 18 |
| 4 |
| 1,072 |
| 1,013 |
| 53 |
| 12 |
| 5 |
| 1,083 |
|
| Total |
| $47,155 |
|
| $1,897 |
|
| $424 |
|
| $708 |
|
| $50,184 |
|
| $49,726 |
|
| $1,950 |
|
| $451 |
|
| $701 |
|
| $52,828 |
|
(1) The Company'sCompany’s SBO portfolio consists of home equity loans and lines that were originally serviced by others. The Company now services a portion of this portfolio internally.
|
| | | | | | | | | | | | | | | |
| | December 31, 2013 |
| (in millions) | Current |
| 1-29 Days Past Due | 30-89 Days Past Due | 90 Days or More Past Due | Total |
|
| Residential mortgages |
| $9,236 |
|
| $114 |
|
| $115 |
|
| $261 |
|
| $9,726 |
|
| Home equity loans | 3,808 |
| 257 |
| 68 |
| 168 |
| 4,301 |
|
| Home equity lines of credit | 14,868 |
| 490 |
| 76 |
| 233 |
| 15,667 |
|
Home equity loans serviced by others (1) | 1,340 |
| 84 |
| 32 |
| 36 |
| 1,492 |
|
Home equity lines of credit serviced by others (1) | 561 |
| 83 |
| 11 |
| 24 |
| 679 |
|
| Automobile | 8,863 |
| 481 |
| 44 |
| 9 |
| 9,397 |
|
| Student | 2,012 |
| 118 |
| 45 |
| 33 |
| 2,208 |
|
| Credit cards | 1,581 |
| 67 |
| 22 |
| 21 |
| 1,691 |
|
| Other retail | 1,205 |
| 69 |
| 22 |
| 7 |
| 1,303 |
|
| Total |
| $43,474 |
|
| $1,763 |
|
| $435 |
|
| $792 |
|
| $46,464 |
|
(1) The Company's SBO portfolio consists ofpurchased home equity loans and lines that were originally serviced by others. The Company now services a portion of this portfolio internally.
CITIZENS FINANCIAL GROUP, INC.
NOTES TO CONSOLIDATED FINANCIAL STATEMENTS
|
| | | | | | | | | | | | | | | |
| | December 31, 2014 |
| (in millions) | Current |
| 1-29 Days Past Due | 30-89 Days Past Due | 90 Days or More Past Due | Total |
|
| Residential mortgages |
| $11,352 |
|
| $114 |
|
| $97 |
|
| $269 |
|
| $11,832 |
|
| Home equity loans | 2,997 |
| 222 |
| 60 |
| 145 |
| 3,424 |
|
| Home equity lines of credit | 14,705 |
| 447 |
| 73 |
| 198 |
| 15,423 |
|
Home equity loans serviced by others (1) | 1,101 |
| 78 |
| 26 |
| 23 |
| 1,228 |
|
Home equity lines of credit serviced by others (1) | 455 |
| 66 |
| 10 |
| 19 |
| 550 |
|
| Automobile | 11,839 |
| 758 |
| 93 |
| 16 |
| 12,706 |
|
| Student | 2,106 |
| 108 |
| 25 |
| 17 |
| 2,256 |
|
| Credit cards | 1,615 |
| 39 |
| 22 |
| 17 |
| 1,693 |
|
| Other retail | 985 |
| 65 |
| 18 |
| 4 |
| 1,072 |
|
| Total |
| $47,155 |
|
| $1,897 |
|
| $424 |
|
| $708 |
|
| $50,184 |
|
(1) The Company’s SBO portfolio consists of purchased home equity loans and lines that were originally serviced by others. The Company now services a portion of this portfolio internally.
Nonperforming Assets
A summary of nonperforming loans and leases by class is as follows:
| | | | December 31, 2014 | | December 31, 2013 | December 31, 2015 | | December 31, 2014 |
| (in millions) | Nonaccruing | Accruing and 90 Days or More Delinquent | Total Nonperforming Loans and Leases | | Nonaccruing | Accruing and 90 Days or More Delinquent | Total Nonperforming Loans and Leases | Nonaccruing | Accruing and 90 Days or More Delinquent | Total Nonperforming Loans and Leases | | Nonaccruing | Accruing and 90 Days or More Delinquent | Total Nonperforming Loans and Leases |
| Commercial |
| $113 |
|
| $1 |
|
| $114 |
| |
| $96 |
|
| $— |
|
| $96 |
|
| $70 |
|
| $1 |
|
| $71 |
| |
| $113 |
|
| $1 |
|
| $114 |
|
| Commercial real estate | 50 |
| — |
| 50 |
| | 169 |
| — |
| 169 |
| 77 |
| — |
| 77 |
| | 50 |
| — |
| 50 |
|
| Leases | — |
| — |
| — |
| | — |
| — |
| — |
| — |
| — |
| — |
| | — |
| — |
| — |
|
| Total commercial | 163 |
| 1 |
| 164 |
| | 265 |
| — |
| 265 |
| 147 |
| 1 |
| 148 |
| | 163 |
| 1 |
| 164 |
|
| Residential mortgages | 345 |
| — |
| 345 |
| | 382 |
| — |
| 382 |
| 331 |
| — |
| 331 |
| | 345 |
| — |
| 345 |
|
| Home equity loans | 203 |
| — |
| 203 |
| | 266 |
| — |
| 266 |
| 135 |
| — |
| 135 |
| | 203 |
| — |
| 203 |
|
| Home equity lines of credit | 257 |
| — |
| 257 |
| | 333 |
| — |
| 333 |
| 272 |
| — |
| 272 |
| | 257 |
| — |
| 257 |
|
Home equity loans serviced by others (1) | 47 |
| — |
| 47 |
| | 59 |
| — |
| 59 |
| 38 |
| — |
| 38 |
| | 47 |
| — |
| 47 |
|
Home equity lines of credit serviced by others (1) | 25 |
| — |
| 25 |
| | 30 |
| — |
| 30 |
| 32 |
| — |
| 32 |
| | 25 |
| — |
| 25 |
|
| Automobile | 21 |
| — |
| 21 |
| | 16 |
| — |
| 16 |
| 42 |
| — |
| 42 |
| | 21 |
| — |
| 21 |
|
| Student | 11 |
| 6 |
| 17 |
| | 3 |
| 31 |
| 34 |
| 35 |
| 6 |
| 41 |
| | 11 |
| 6 |
| 17 |
|
| Credit cards | 16 |
| 1 |
| 17 |
| | 19 |
| 2 |
| 21 |
| 16 |
| — |
| 16 |
| | 16 |
| 1 |
| 17 |
|
| Other retail | 5 |
| — |
| 5 |
| | 10 |
| — |
| 10 |
| 3 |
| 2 |
| 5 |
| | 5 |
| — |
| 5 |
|
| Total retail | 930 |
| 7 |
| 937 |
| | 1,118 |
| 33 |
| 1,151 |
| 904 |
| 8 |
| 912 |
| | 930 |
| 7 |
| 937 |
|
| Total |
| $1,093 |
|
| $8 |
|
| $1,101 |
| |
| $1,383 |
|
| $33 |
|
| $1,416 |
|
| $1,051 |
|
| $9 |
|
| $1,060 |
| |
| $1,093 |
|
| $8 |
|
| $1,101 |
|
(1) The Company'sCompany’s SBO portfolio consists of purchased home equity loans and lines that were originally serviced by others. The Company now services a portion of this portfolio internally.
The recorded investment in mortgage loans collateralized by residential real estate property for which formal foreclosure proceedings are in process was $257 million as of December 31, 2015.
CITIZENS FINANCIAL GROUP, INC.
NOTES TO CONSOLIDATED FINANCIAL STATEMENTS
A summary of other nonperforming assets is as follows:
|
| | | | | | | |
| | December 31, |
| (in millions) | 2015 |
| | 2014 |
|
| Nonperforming assets, net of valuation allowance: | | | |
| Commercial |
| $1 |
| |
| $3 |
|
| Retail | 45 |
| | 39 |
|
| Nonperforming assets, net of valuation allowance |
| $46 |
| |
| $42 |
|
Nonperforming assets consist primarily of other real estate owned and are presented in other assets on the Consolidated Balance Sheets.
A summary of key performance indicators is as follows:
|
| | | | | |
| | December 31, |
| | 2015 |
| | 2014 |
|
| Nonperforming commercial loans and leases as a percentage of total loans and leases | 0.15 | % | | 0.18 | % |
| Nonperforming retail loans as a percentage of total loans and leases | 0.92 |
| | 1.00 |
|
| Total nonperforming loans and leases as a percentage of total loans and leases | 1.07 | % | | 1.18 | % |
| | | | |
| Nonperforming commercial assets as a percentage of total assets | 0.11 | % | | 0.13 | % |
| Nonperforming retail assets as a percentage of total assets | 0.69 |
| | 0.73 |
|
| Total nonperforming assets as a percentage of total assets | 0.80 | % | | 0.86 | % |
The following is an analysis of the age of the past due amounts (accruing and nonaccruing):
|
| | | | | | | | | | | | | | | | | | | |
| | December 31, 2015 | | December 31, 2014 |
| (in millions) | 30-89 Days Past Due | 90 Days or More Past Due | Total Past Due | | 30-89 Days Past Due | 90 Days or More Past Due | Total Past Due |
| Commercial |
| $13 |
|
| $71 |
|
| $84 |
| |
| $57 |
|
| $114 |
|
| $171 |
|
| Commercial real estate | 33 |
| 77 |
| 110 |
| | 26 |
| 50 |
| 76 |
|
| Leases | 10 |
| — |
| 10 |
| | 3 |
| — |
| 3 |
|
| Total commercial | 56 |
| 148 |
| 204 |
| | 86 |
| 164 |
| 250 |
|
| Residential mortgages | 70 |
| 246 |
| 316 |
| | 97 |
| 269 |
| 366 |
|
| Home equity loans | 44 |
| 104 |
| 148 |
| | 60 |
| 145 |
| 205 |
|
| Home equity lines of credit | 80 |
| 205 |
| 285 |
| | 73 |
| 198 |
| 271 |
|
Home equity loans serviced by others (1) | 20 |
| 20 |
| 40 |
| | 26 |
| 23 |
| 49 |
|
Home equity lines of credit serviced by others (1) | 16 |
| 29 |
| 45 |
| | 10 |
| 19 |
| 29 |
|
| Automobile | 159 |
| 35 |
| 194 |
| | 93 |
| 16 |
| 109 |
|
| Student | 30 |
| 41 |
| 71 |
| | 25 |
| 17 |
| 42 |
|
| Credit cards | 20 |
| 16 |
| 36 |
| | 22 |
| 17 |
| 39 |
|
| Other retail | 12 |
| 5 |
| 17 |
| | 18 |
| 4 |
| 22 |
|
| Total retail | 451 |
| 701 |
| 1,152 |
| | 424 |
| 708 |
| 1,132 |
|
| Total |
| $507 |
|
| $849 |
|
| $1,356 |
| |
| $510 |
|
| $872 |
|
| $1,382 |
|
(1) The Company’s SBO portfolio consists of purchased home equity loans and lines that were originally serviced by others. The Company now services a portion of this portfolio internally.
A summary of other nonperforming assets is as follows:
|
| | | | | | | |
| | December 31, |
| (in millions) | 2014 |
| | 2013 |
|
| Nonperforming assets, net of valuation allowance: | | | |
| Commercial |
| $3 |
| |
| $10 |
|
| Retail | 39 |
| | 40 |
|
| Nonperforming assets, net of valuation allowance |
| $42 |
| |
| $50 |
|
Nonperforming assets consists primarily of other real estate owned and is presented in other assets on the Consolidated Balance Sheets.
A summary of key performance indicators is as follows:
|
| | | | | |
| | December 31, |
| 2014 |
| | 2013 |
|
| Nonperforming commercial loans and leases as a percentage of total loans and leases | 0.18 | % | | 0.31 | % |
| Nonperforming retail loans as a percentage of total loans and leases | 1.00 |
| | 1.34 |
|
| Total nonperforming loans and leases as a percentage of total loans and leases | 1.18 |
| | 1.65 |
|
| | | | |
| Nonperforming commercial assets as a percentage of total assets | 0.13 |
| | 0.23 |
|
| Nonperforming retail assets as a percentage of total assets | 0.73 |
| | 0.97 |
|
| Total nonperforming assets as a percentage of total assets | 0.86 | % | | 1.20 | % |
CITIZENS FINANCIAL GROUP, INC.
NOTES TO CONSOLIDATED FINANCIAL STATEMENTS
The following is an analysis of the age of the past due amounts (accruing and nonaccruing):
|
| | | | | | | | | | | | | | | | | | | |
| | December 31, 2014 | | December 31, 2013 |
| (in millions) | 30-89 Days Past Due | 90 Days or More Past Due | Total Past Due | | 30-89 Days Past Due | 90 Days or More Past Due | Total Past Due |
| Commercial |
| $57 |
|
| $114 |
|
| $171 |
| |
| $61 |
|
| $96 |
|
| $157 |
|
| Commercial real estate | 26 |
| 50 |
| 76 |
| | 34 |
| 169 |
| 203 |
|
| Leases | 3 |
| — |
| 3 |
| | 24 |
| — |
| 24 |
|
| Total commercial | 86 |
| 164 |
| 250 |
| | 119 |
| 265 |
| 384 |
|
| Residential mortgages | 97 |
| 269 |
| 366 |
| | 115 |
| 261 |
| 376 |
|
| Home equity loans | 60 |
| 145 |
| 205 |
| | 68 |
| 168 |
| 236 |
|
| Home equity lines of credit | 73 |
| 198 |
| 271 |
| | 76 |
| 233 |
| 309 |
|
Home equity loans serviced by others (1) | 26 |
| 23 |
| 49 |
| | 32 |
| 36 |
| 68 |
|
Home equity lines of credit serviced by others (1) | 10 |
| 19 |
| 29 |
| | 11 |
| 24 |
| 35 |
|
| Automobile | 93 |
| 16 |
| 109 |
| | 44 |
| 9 |
| 53 |
|
| Student | 25 |
| 17 |
| 42 |
| | 45 |
| 33 |
| 78 |
|
| Credit cards | 22 |
| 17 |
| 39 |
| | 22 |
| 21 |
| 43 |
|
| Other retail | 18 |
| 4 |
| 22 |
| | 22 |
| 7 |
| 29 |
|
| Total retail | 424 |
| 708 |
| 1,132 |
| | 435 |
| 792 |
| 1,227 |
|
| Total |
| $510 |
|
| $872 |
|
| $1,382 |
| |
| $554 |
|
| $1,057 |
|
| $1,611 |
|
(1) The Company's SBO portfolio consists of home equity loans and lines that were originally serviced by others. The Company now services a portion of this portfolio internally.
Impaired loans include: (1) nonaccruing larger balance commercial loans (greater than $3 million carrying value); and (2) commercial and retail TDRs. The following is a summary of impaired loan information by class:
| |
| December 31, 2014 | December 31, 2015 |
| (in millions) | Impaired Loans With a Related Allowance | Allowance on Impaired Loans | Impaired Loans Without a Related Allowance | Unpaid Contractual Balance | Total Recorded Investment in Impaired Loans | Impaired Loans With a Related Allowance | Allowance on Impaired Loans | Impaired Loans Without a Related Allowance | Unpaid Contractual Balance | Total Recorded Investment in Impaired Loans |
| Commercial |
| $124 |
|
| $19 |
|
| $36 |
|
| $178 |
|
| $160 |
|
| $92 |
|
| $23 |
|
| $58 |
|
| $144 |
|
| $150 |
|
| Commercial real estate | 7 |
| 1 |
| 38 |
| 62 |
| 45 |
| 56 |
| 13 |
| 12 |
| 70 |
| 68 |
|
| Total commercial | 131 |
| 20 |
| 74 |
| 240 |
| 205 |
| 148 |
| 36 |
| 70 |
| 214 |
| 218 |
|
| Residential mortgages | 157 |
| 18 |
| 288 |
| 605 |
| 445 |
| 121 |
| 16 |
| 320 |
| 608 |
| 441 |
|
| Home equity loans | 129 |
| 11 |
| 141 |
| 335 |
| 270 |
| 85 |
| 11 |
| 139 |
| 283 |
| 224 |
|
| Home equity lines of credit | 75 |
| 3 |
| 86 |
| 193 |
| 161 |
| 27 |
| 2 |
| 167 |
| 234 |
| 194 |
|
Home equity loans serviced by others (1) | 75 |
| 9 |
| 16 |
| 102 |
| 91 |
| 50 |
| 8 |
| 24 |
| 88 |
| 74 |
|
Home equity lines of credit serviced by others (1) | 4 |
| 1 |
| 7 |
| 14 |
| 11 |
| 3 |
| 1 |
| 7 |
| 14 |
| 10 |
|
| Automobile | 2 |
| 1 |
| 9 |
| 16 |
| 11 |
| 3 |
| — |
| 11 |
| 19 |
| 14 |
|
| Student | 167 |
| 48 |
| — |
| 167 |
| 167 |
| 163 |
| 48 |
| 2 |
| 165 |
| 165 |
|
| Credit cards | 32 |
| 13 |
| — |
| 32 |
| 32 |
| 28 |
| 11 |
| — |
| 28 |
| 28 |
|
| Other retail | 17 |
| 5 |
| 3 |
| 23 |
| 20 |
| 13 |
| 4 |
| 2 |
| 18 |
| 15 |
|
| Total retail | 658 |
| 109 |
| 550 |
| 1,487 |
| 1,208 |
| 493 |
| 101 |
| 672 |
| 1,457 |
| 1,165 |
|
| Total |
| $789 |
|
| $129 |
|
| $624 |
|
| $1,727 |
|
| $1,413 |
|
| $641 |
|
| $137 |
|
| $742 |
|
| $1,671 |
|
| $1,383 |
|
(1) The Company'sCompany’s SBO portfolio consists of purchased home equity loans and lines that were originally serviced by others. The Company now services a portion of this portfolio internally.
|
| | | | | | | | | | | | | | | |
| | December 31, 2014 |
| (in millions) | Impaired Loans With a Related Allowance | Allowance on Impaired Loans | Impaired Loans Without a Related Allowance | Unpaid Contractual Balance | Total Recorded Investment in Impaired Loans |
| Commercial |
| $124 |
|
| $19 |
|
| $36 |
|
| $178 |
|
| $160 |
|
| Commercial real estate | 7 |
| 1 |
| 38 |
| 62 |
| 45 |
|
| Total commercial | 131 |
| 20 |
| 74 |
| 240 |
| 205 |
|
| Residential mortgages | 157 |
| 18 |
| 288 |
| 605 |
| 445 |
|
| Home equity loans | 129 |
| 11 |
| 141 |
| 335 |
| 270 |
|
| Home equity lines of credit | 75 |
| 3 |
| 86 |
| 193 |
| 161 |
|
Home equity loans serviced by others (1) | 75 |
| 9 |
| 16 |
| 102 |
| 91 |
|
Home equity lines of credit serviced by others (1) | 4 |
| 1 |
| 7 |
| 14 |
| 11 |
|
| Automobile | 2 |
| 1 |
| 9 |
| 16 |
| 11 |
|
| Student | 167 |
| 48 |
| — |
| 167 |
| 167 |
|
| Credit cards | 32 |
| 13 |
| — |
| 32 |
| 32 |
|
| Other retail | 17 |
| 5 |
| 3 |
| 23 |
| 20 |
|
| Total retail | 658 |
| 109 |
| 550 |
| 1,487 |
| 1,208 |
|
| Total |
| $789 |
|
| $129 |
|
| $624 |
|
| $1,727 |
|
| $1,413 |
|
(1) The Company’s SBO portfolio consists of purchased home equity loans and lines that were originally serviced by others. The Company now services a portion of this portfolio internally.
CITIZENS FINANCIAL GROUP, INC.
NOTES TO CONSOLIDATED FINANCIAL STATEMENTS
Additional information on impaired loans is as follows:
| | | | | | | | | | | | | | | | | | Year Ended December 31, |
| | December 31, 2013 | 2015 | | 2014 | | 2013 |
| (in millions) | Impaired Loans With a Related Allowance | Allowance on Impaired Loans | Impaired Loans Without a Related Allowance | Unpaid Contractual Balance | Total Recorded Investment in Impaired Loans | Interest Income Recognized | Average Recorded Investment | | Interest Income Recognized | Average Recorded Investment | | Interest Income Recognized | Average Recorded Investment |
| Commercial |
| $86 |
|
| $15 |
|
| $33 |
|
| $214 |
|
| $119 |
|
| $4 |
|
| $135 |
| |
| $9 |
|
| $198 |
| |
| $1 |
|
| $157 |
|
| Commercial real estate | 76 |
| 8 |
| 44 |
| 221 |
| 120 |
| 1 |
| 44 |
| | 2 |
| 98 |
| | 1 |
| 149 |
|
| Total commercial | 162 |
| 23 |
| 77 |
| 435 |
| 239 |
| 5 |
| 179 |
| | 11 |
| 296 |
| | 2 |
| 306 |
|
| Residential mortgages | 174 |
| 42 |
| 267 |
| 588 |
| 441 |
| 15 |
| 415 |
| | 14 |
| 429 |
| | 7 |
| 419 |
|
| Home equity loans | 104 |
| 17 |
| 143 |
| 301 |
| 247 |
| 9 |
| 222 |
| | 8 |
| 246 |
| | 5 |
| 228 |
|
| Home equity lines of credit | 77 |
| — |
| 87 |
| 192 |
| 164 |
| 4 |
| 173 |
| | 4 |
| 149 |
| | 2 |
| 90 |
|
Home equity loans serviced by others (1) | 86 |
| 10 |
| 14 |
| 110 |
| 100 |
| 4 |
| 75 |
| | 5 |
| 91 |
| | 5 |
| 102 |
|
Home equity lines of credit serviced by others (1) | 5 |
| 1 |
| 7 |
| 15 |
| 12 |
| — |
| 9 |
| | — |
| 11 |
| | — |
| 12 |
|
| Automobile | 2 |
| — |
| 8 |
| 15 |
| 10 |
| — |
| 11 |
| | — |
| 7 |
| | — |
| 8 |
|
| Student | 159 |
| 21 |
| — |
| 159 |
| 159 |
| 7 |
| 157 |
| | 8 |
| 153 |
| | 7 |
| 140 |
|
| Credit cards | 42 |
| 14 |
| — |
| 42 |
| 42 |
| 2 |
| 26 |
| | 2 |
| 31 |
| | 3 |
| 41 |
|
| Other retail | 21 |
| 3 |
| 4 |
| 28 |
| 25 |
| 1 |
| 16 |
| | 1 |
| 21 |
| | 1 |
| 25 |
|
| Total retail | 670 |
| 108 |
| 530 |
| 1,450 |
| 1,200 |
| 42 |
| 1,104 |
| | 42 |
| 1,138 |
| | 30 |
| 1,065 |
|
| Total |
| $832 |
|
| $131 |
|
| $607 |
|
| $1,885 |
|
| $1,439 |
|
| $47 |
|
| $1,283 |
| |
| $53 |
|
| $1,434 |
| |
| $32 |
|
| $1,371 |
|
(1)The Company'sCompany’s SBO portfolio consists of purchased home equity loans and lines that were originally serviced by others. The Company now services a portion of this portfolio internally.
Additional information on impaired loans is as follows:
|
| | | | | | | | | | | | | | | | | | | | |
| | For the Year Ended December 31, |
| | 2014 | | 2013 | | 2012 |
| (in millions) | Interest Income Recognized | Average Recorded Investment | | Interest Income Recognized | Average Recorded Investment | | Interest Income Recognized | Average Recorded Investment |
| Commercial |
| $9 |
|
| $198 |
| |
| $1 |
|
| $157 |
| |
| $1 |
|
| $276 |
|
| Commercial real estate | 2 |
| 98 |
| | 1 |
| 149 |
| | 1 |
| 310 |
|
| Total commercial | 11 |
| 296 |
| | 2 |
| 306 |
| | 2 |
| 586 |
|
| Residential mortgages | 14 |
| 429 |
| | 7 |
| 419 |
| | 4 |
| 236 |
|
| Home equity loans | 8 |
| 246 |
| | 5 |
| 228 |
| | 2 |
| 200 |
|
| Home equity lines of credit | 4 |
| 149 |
| | 2 |
| 90 |
| | — |
| 38 |
|
Home equity loans serviced by others (1) | 5 |
| 91 |
| | 5 |
| 102 |
| | 6 |
| 118 |
|
Home equity lines of credit serviced by others (1) | — |
| 11 |
| | — |
| 12 |
| | — |
| 9 |
|
| Automobile | — |
| 7 |
| | — |
| 8 |
| | — |
| 5 |
|
| Student | 8 |
| 153 |
| | 7 |
| 140 |
| | — |
| 11 |
|
| Credit cards | 2 |
| 31 |
| | 3 |
| 41 |
| | — |
| — |
|
| Other retail | 1 |
| 21 |
| | 1 |
| 25 |
| | 1 |
| 28 |
|
| Total retail | 42 |
| 1,138 |
| | 30 |
| 1,065 |
| | 13 |
| 645 |
|
| Total |
| $53 |
|
| $1,434 |
| |
| $32 |
|
| $1,371 |
| |
| $15 |
|
| $1,231 |
|
(1) The Company's SBO portfolio consists of home equity loans and lines that were originally serviced by others. The Company now services a portion of this portfolio internally.
CITIZENS FINANCIAL GROUP, INC.
NOTES TO CONSOLIDATED FINANCIAL STATEMENTS
Troubled Debt RestructuringsTreasury Stock
A loan modificationThe purchase of the Company’s common stock is identifiedrecorded at cost. At the date of retirement or subsequent reissuance, treasury stock is reduced by the cost of such stock on the first-in, first-out basis with differences recorded in additional paid-in capital or retained earnings, as a TDR whenapplicable.
Revenue Recognition
Revenue is recognized to the extent that it is probable that the economic benefits will flow to the Company and the revenue can be reliably measured.
Interest income on loans and securities classified as AFS or HTM is determined using the effective interest method. This method calculates periodic interest income at a bankruptcy court grantsconstant effective yield on the borrowernet investment in the loan or security, to provide a concessionconstant rate of return over the Company would not otherwise make in response to the borrower’s financial difficulties. TDRs typically result from the Company's loss mitigation efforts and are undertaken in order to improve the likelihood of recovery and continuityterms of the relationship. The Company's loan modifications are handled on a case-by-case basisfinancial assets. Securities classified as trading account assets, and are negotiated to achieve mutually agreeable terms that maximize loan collectability and meet the borrower'sother financial needs. Concessions granted in TDRsassets accounted for all classes of loans may include lowering the interest rate, forgiving a portion of principal, extending the loan term, lowering scheduled payments for a specified period of time, principal forbearance, or capitalizing past due amounts. A rate increase can be a concession if the increased rate is lower than a market rate for debt with risk similar to that of the restructured loan. TDRs for commercial loans and leases may also involve creating a multiple note structure, accepting non-cash assets, accepting an equity interest, or receiving a performance-based fee. In some cases a TDR may involve multiple concessions. The financial effects of TDRs for all loan classes may include lower income (either due to a lower interest rate or a delay in the timing of cash flows), larger loan loss provisions, and accelerated charge-offs if the modification renders the loan collateral-dependent. In some cases interest income throughout the term of the loan may increase if, for example, the loan is extended or the interest rate is increased as a result of the restructuring.
Because TDRs are impaired loans, the Company measures impairment by comparing the present value of expected future cash flows, or when appropriate,using the fair value of collateral,option, are measured at fair value with corresponding changes recognized in noninterest income.
Loan commitment fees for loans that are likely to be drawn down, and other credit related fees, are deferred (together with any incremental costs) and recognized as an adjustment to the loan’s recorded investment. Any excess of recorded investmenteffective interest rate on the loan. When it is unlikely that a loan will be drawn down, the loan commitment fees are recognized over the present valuecommitment period on a straight-line basis.
Other types of expected future cash flows or collateral value isnoninterest revenues, such as service charges on deposits, interchange income on credit cards and trust revenues, are accrued and recognized by creating a valuation allowance or increasing an existing valuation allowance. Any portion of the loan’s recorded investment the Company does not expect to collectinto income as a result of the modification is charged off at the time of modification.
Commercial TDRs were $176 million and $167 million on December 31, 2014 and 2013, respectively. Retail TDRs totaled $1.2 billion on December 31, 2014 and 2013. Commitments to lend additional funds to debtors owing receivables which were TDRs were $53 million and $52 million on December 31, 2014 and 2013, respectively.
The following table summarizes how loans were modified during the year ended December 31, 2014, the charge-offs related to the modifications,services are provided and the impact on the ALLL. The reported balances include loans that became TDRs during 2014, and were paid off in full, charged off, or sold prior to December 31, 2014.
|
| | | | | | | | | | | | | | | | | |
| | Primary Modification Types |
| | Interest Rate Reduction (1) | | Maturity Extension (2) |
| (dollars in millions) | Number of Contracts | Pre-Modification Outstanding Recorded Investment | Post-Modification Outstanding Recorded Investment | | Number of Contracts | Pre-Modification Outstanding Recorded Investment | Post-Modification Outstanding Recorded Investment |
| Commercial | 25 |
|
| $8 |
|
| $7 |
| | 131 |
|
| $21 |
|
| $22 |
|
| Commercial real estate | 9 |
| 1 |
| 2 |
| | 15 |
| 3 |
| 2 |
|
| Total commercial | 34 |
| 9 |
| 9 |
| | 146 |
| 24 |
| 24 |
|
| Residential mortgages | 126 |
| 17 |
| 17 |
| | 40 |
| 6 |
| 5 |
|
| Home equity loans | 125 |
| 8 |
| 9 |
| | 85 |
| 5 |
| 6 |
|
| Home equity lines of credit | 7 |
| — |
| — |
| | 276 |
| 17 |
| 16 |
|
Home equity loans serviced by others (3) | 42 |
| 2 |
| 2 |
| | — |
| — |
| — |
|
Home equity lines of credit serviced by others (3) | 4 |
| — |
| — |
| | 1 |
| — |
| — |
|
| Automobile | 75 |
| 1 |
| 1 |
| | 18 |
| — |
| — |
|
| Credit cards | 2,165 |
| 12 |
| 12 |
| | — |
| — |
| — |
|
| Other retail | 3 |
| — |
| — |
| | — |
| — |
| — |
|
| Total retail | 2,547 |
| 40 |
| 41 |
| | 420 |
| 28 |
| 27 |
|
| Total | 2,581 |
|
| $49 |
|
| $50 |
| | 566 |
|
| $52 |
|
| $51 |
|
amount of fees earned are reasonably determinable.
CITIZENS FINANCIAL GROUP, INC.
NOTES TO CONSOLIDATED FINANCIAL STATEMENTS
Earnings Per Share
Basic EPS is computed by dividing net income/(loss) available to common stockholders by the weighted-average number of common shares outstanding during each period. Net income/(loss) available to common stockholders represents net income after preferred stock dividends, accretion of the discount on preferred stock issuances, and gains or losses from any repurchases of preferred stock. Diluted EPS is computed by dividing net income/(loss) available to common stockholders by the weighted-average number of common shares outstanding during each period, plus potential dilutive shares such as call options, share-based payment awards, and warrants using the treasury stock method.
Recent Accounting Pronouncements
In February 2016, the FASB issued ASU 2016-02 “Leases”. The ASU generally requires lessees to recognize a right-of-use asset and corresponding lease liability for all leases with a lease term of greater than one year. The ASU is effective for the Company beginning on January 1, 2019. The Company is currently assessing the impact of this guidance on the Company’s Consolidated Financial Statements.
In January 2016, the FASB issued ASU No. 2016-01 “Recognition and Measurement of Financial Assets and Financial Liabilities.” The ASU requires equity investments (except for those accounted for under the equity method of accounting or those that result in consolidation of the investee) to be measured at fair value with changes in the fair value recognized through net income. The ASU also requires separate presentation of financial assets and financial liabilities by measurement category and form of financial assets on the balance sheet or the notes to the financial statements. In addition, the ASU makes several other targeted amendments to the existing accounting and disclosure requirements for financial instruments, including revised guidance related to valuation allowance assessments when recognizing deferred tax assets on unrealized losses on available-for-sale debt securities. The ASU is effective for the Company beginning on January 1, 2018. The Company is currently assessing the impact of this guidance on the Company’s Consolidated Financial Statements.
In August 2015, the FASB issued ASU No. 2015-15 “Interest - Imputation of Interest: Presentation and Subsequent Measurement of Debt Issuance Costs Associated with Line-Of-Credit Arrangements.” The ASU incorporates guidance from the SEC on deferral of debt issuance costs associated with line-of-credit arrangements, consistent with ASU 2015-03, regardless of whether there are any outstanding borrowings on the line-of-credit arrangement. This new guidance will not have a material impact on the Company’s Consolidated Financial Statements.
In August 2015, the FASB issued ASU No. 2015-14 “Revenue from Contracts with Customers (Topic 606): Deferral of the Effective Date” which defers the effective date of the new revenue standard by one year. As a result of this deferral, the new revenue standard is effective for the Company beginning on January 1, 2018. The Company is currently assessing the impact of this guidance on the Consolidated Financial Statements.
In April 2015, the FASB issued ASU No. 2015-05 “Intangibles - Goodwill and Other - Internal Use Software” which will assist entities in evaluating the accounting for fees paid by a customer in a cloud computing arrangement. The ASU, which allows for early adoption, is effective for the Company beginning on January 1, 2016. Adoption of this guidance is not expected to have a material impact on the Company’s Consolidated Financial Statements.
In April 2015, the FASB issued ASU No. 2015-03 “Interest - Imputation of Interest: Simplifying the Presentation of Debt Issuance Costs”. This standard requires debt issuance costs to be presented in the consolidated balance sheet as a direct deduction from the carrying value of the associated debt liability, consistent with the presentation of a debt discount. The ASU, which allows for early adoption, is effective for the Company beginning on January 1, 2016. Adoption of this guidance is not expected to have a material impact on the Company’s Consolidated Financial Statements.
In February 2015, the FASB issued ASU No. 2015-02 “Consolidation (Topic 810): Amendments to the Consolidation Analysis”. This standard focuses on the consolidation evaluation for reporting organizations that are required to evaluate whether they should consolidate certain legal entities such as limited partnerships, limited liability corporations, and securitization structures (e.g., collateralized debt obligations, collateralized loan obligations, and mortgage-backed security transactions). This new standard simplifies consolidation accounting by reducing the number of consolidation models. The ASU will be effective for the Company beginning on January 1, 2016. Early adoption is permitted, including adoption in an interim period. Adoption of this guidance will not have a material impact on the Company’s Consolidated Financial Statements.
In January 2015, the FASB issued ASU No. 2015-01 “Income Statement: Extraordinary and Unusual Items.” This ASU eliminates from GAAP the concept of extraordinary items. Accounting Standards Codification Subtopic 225-20 required that an entity separately classify, present, and disclose extraordinary events and transactions that were unusual in nature and infrequent in occurrence. This ASU, which allows for early adoption, is effective for the Company beginning on January 1, 2016. The adoption of this guidance is not expected to have a material impact on the Company’s Consolidated Financial Statements.
CITIZENS FINANCIAL GROUP, INC.
NOTE 2 - CASH AND DUE FROM BANKS
The Company’s subsidiary banks maintain certain average reserve balances and compensating balances for check clearing and other services with the FRB. At December 31, 2015 and 2014, the balance of deposits at the FRB amounted to $2.0 billion and $2.1 billion, respectively. Average balances maintained with the FRB during the years ended December 31, 2015, 2014, and 2013 exceeded amounts required by law for the FRB’s requirements. All amounts, both required and excess reserves, held at the FRB currently earn interest at a fixed rate of 50 basis points. As a result, the Company recorded, in interest-bearing deposits in banks, interest income on FRB deposits of $4 million, $5 million, and $5 million for the years ended December 31, 2015, 2014, and 2013, respectively.
NOTE 3 - SECURITIES
The following table provides the major components of securities at amortized cost and fair value:
|
| | | | | | | | | | | | | | | |
| | Primary Modification Types | | | |
| | Other (4) | | | |
| (dollars in millions) | Number of Contracts | Pre-Modification Outstanding Recorded Investment | Post-Modification Outstanding Recorded Investment | | Net Change to ALLL Resulting from Modification | Charge-offs Resulting from Modification |
| Commercial | 27 |
|
| $52 |
|
| $74 |
| |
| $3 |
|
| $— |
|
| Commercial real estate | 1 |
| 7 |
| 7 |
| | — |
| 3 |
|
| Total commercial | 28 |
| 59 |
| 81 |
| | 3 |
| 3 |
|
| Residential mortgages | 393 |
| 47 |
| 46 |
| | (4 | ) | 1 |
|
| Home equity loans | 1,046 |
| 63 |
| 62 |
| | (1 | ) | 2 |
|
| Home equity lines of credit | 356 |
| 25 |
| 21 |
| | — |
| 5 |
|
Home equity loans serviced by others (3) | 138 |
| 5 |
| 5 |
| | (1 | ) | — |
|
Home equity lines of credit serviced by others (3) | 39 |
| 2 |
| 2 |
| | — |
| — |
|
| Automobile | 1,039 |
| 17 |
| 13 |
| | — |
| 5 |
|
| Student | 1,675 |
| 31 |
| 31 |
| | 5 |
| — |
|
| Other retail | 57 |
| 2 |
| 1 |
| | (1 | ) | — |
|
| Total retail | 4,743 |
| 192 |
| 181 |
| | (2 | ) | 13 |
|
| Total | 4,771 |
|
| $251 |
|
| $262 |
| |
| $1 |
|
| $16 |
|
|
| | | | | | | | | | | | | | | | | | | | | | | | | |
| | December 31, 2015 | | December 31, 2014 |
| (in millions) | Amortized Cost | Gross Unrealized Gains | Gross Unrealized Losses | Fair Value | | Amortized Cost | Gross Unrealized Gains | Gross Unrealized Losses | Fair Value |
| Securities Available for Sale | | | | | |
|
|
|
|
| U.S. Treasury and other |
| $16 |
|
| $— |
|
| $— |
|
| $16 |
| |
| $15 |
|
| $— |
|
| $— |
|
| $15 |
|
| State and political subdivisions | 9 |
| — |
| — |
| 9 |
| | 10 |
| — |
| — |
| 10 |
|
| Mortgage-backed securities: | | | | | | | | | |
| Federal agencies and U.S. government sponsored entities | 17,234 |
| 153 |
| (67 | ) | 17,320 |
| | 17,683 |
| 301 |
| (50 | ) | 17,934 |
|
| Other/non-agency | 555 |
| 4 |
| (37 | ) | 522 |
| | 703 |
| 4 |
| (35 | ) | 672 |
|
| Total mortgage-backed securities | 17,789 |
| 157 |
| (104 | ) | 17,842 |
| | 18,386 |
| 305 |
| (85 | ) | 18,606 |
|
| Total debt securities available for sale | 17,814 |
| 157 |
| (104 | ) | 17,867 |
| | 18,411 |
| 305 |
| (85 | ) | 18,631 |
|
| Marketable equity securities | 5 |
| — |
| — |
| 5 |
| | 10 |
| 3 |
| — |
| 13 |
|
| Other equity securities | 12 |
| — |
| — |
| 12 |
| | 12 |
| — |
| — |
| 12 |
|
| Total equity securities available for sale | 17 |
| — |
| — |
| 17 |
| | 22 |
| 3 |
| — |
| 25 |
|
| Total securities available for sale |
| $17,831 |
|
| $157 |
|
| ($104 | ) |
| $17,884 |
| |
| $18,433 |
|
| $308 |
|
| ($85 | ) |
| $18,656 |
|
| Securities Held to Maturity | | | | | | | | | |
| Mortgage-backed securities: | | | | | | | | | |
| Federal agencies and U.S. government sponsored entities |
| $4,105 |
|
| $27 |
|
| ($11 | ) |
| $4,121 |
| |
| $3,728 |
|
| $22 |
|
| ($31 | ) |
| $3,719 |
|
| Other/non-agency | 1,153 |
| 23 |
| — |
| 1,176 |
| | 1,420 |
| 54 |
| — |
| 1,474 |
|
| Total securities held to maturity |
| $5,258 |
|
| $50 |
|
| ($11 | ) |
| $5,297 |
| |
| $5,148 |
|
| $76 |
|
| ($31 | ) |
| $5,193 |
|
| Other Investment Securities, at Fair Value | | | | | | | | | |
| Money market mutual fund |
| $65 |
|
| $— |
|
| $— |
|
| $65 |
| |
| $28 |
|
| $— |
|
| $— |
|
| $28 |
|
| Other investments | 5 |
| — |
| — |
| 5 |
| | 5 |
| — |
| — |
| 5 |
|
| Total other investment securities, at fair value |
| $70 |
|
| $— |
|
| $— |
|
| $70 |
| |
| $33 |
|
| $— |
|
| $— |
|
| $33 |
|
| Other Investment Securities, at Cost | | | | | | | | | |
| Federal Reserve Bank stock |
| $468 |
|
| $— |
|
| $— |
|
| $468 |
| |
| $477 |
|
| $— |
|
| $— |
|
| $477 |
|
| Federal Home Loan Bank stock | 395 |
| — |
| — |
| 395 |
| | 390 |
| — |
| — |
| 390 |
|
| Total other investment securities, at cost |
| $863 |
|
| $— |
|
| $— |
|
| $863 |
| |
| $867 |
|
| $— |
|
| $— |
|
| $867 |
|
CITIZENS FINANCIAL GROUP, INC.
NOTES TO CONSOLIDATED FINANCIAL STATEMENTS
The Company has reviewed its securities portfolio for other-than-temporary impairments. The following table presents the net securities impairment losses recognized in earnings:
|
| | | | | | | | | | | |
| | Year Ended December 31, |
| (in millions) | 2015 |
| | 2014 |
| | 2013 |
|
| Other-than-temporary impairment: | | | | | |
| Total other-than-temporary impairment losses |
| ($43 | ) | |
| ($45 | ) | |
| ($49 | ) |
| Portions of loss recognized in other comprehensive income (before taxes) | 36 |
| | 35 |
| | 41 |
|
| Net securities impairment losses recognized in earnings |
| ($7 | ) | |
| ($10 | ) | |
| ($8 | ) |
The following tables summarize those securities whose fair values are below carrying values, segregated by those that have been in a continuous unrealized loss position for less than twelve months and those that have been in a continuous unrealized loss position for twelve months or longer:
|
| | | | | | | | | | | | | | | | | | | | | | | | | | |
| | December 31, 2015 |
| | Less than 12 Months | | 12 Months or Longer | | Total |
| (dollars in millions) | Number of Issues | Fair Value | Gross Unrealized Losses | | Number of Issues | Fair Value | Gross Unrealized Losses | | Number of Issues | Fair Value | Gross Unrealized Losses |
| State and political subdivisions | 1 |
|
| $9 |
|
| $— |
| | — |
|
| $— |
|
| $— |
| | 1 |
|
| $9 |
|
| $— |
|
| US Treasury and other | 1 |
| 15 |
| — |
| | — |
| — |
| — |
| | 1 |
| 15 |
|
| $— |
|
| Mortgage-backed securities: | | | | | | | | | | | |
| Federal agencies and U.S. government sponsored entities | 162 |
| 7,423 |
| (51 | ) | | 36 |
| 819 |
| (27 | ) | | 198 |
| 8,242 |
| (78 | ) |
| Other/non-agency | 2 |
| 9 |
| — |
| | 20 |
| 361 |
| (37 | ) | | 22 |
| 370 |
| (37 | ) |
| Total mortgage-backed securities | 164 |
| 7,432 |
| (51 | ) | | 56 |
| 1,180 |
| (64 | ) | | 220 |
| 8,612 |
| (115 | ) |
| Total | 166 |
|
| $7,456 |
|
| ($51 | ) | | 56 |
|
| $1,180 |
|
| ($64 | ) | | 222 |
|
| $8,636 |
|
| ($115 | ) |
|
| | | | | | | | | | | | | | | | | | | | | | | | | | |
| | December 31, 2014 |
| | Less than 12 Months | | 12 Months or Longer | | Total |
| (dollars in millions) | Number of Issues | Fair Value | Gross Unrealized Losses | | Number of Issues | Fair Value | Gross Unrealized Losses | | Number of Issues | Fair Value | Gross Unrealized Losses |
| State and political subdivisions | — |
|
| $— |
|
| $— |
| | 1 |
|
| $10 |
|
| $— |
| | 1 |
|
| $10 |
|
| $— |
|
| Mortgage-backed securities: |
|
|
|
|
|
| |
|
|
|
|
|
| |
|
|
|
|
|
|
| Federal agencies and U.S. government sponsored entities | 75 |
| 3,282 |
| (24 | ) | | 52 |
| 1,766 |
| (57 | ) | | 127 |
| 5,048 |
| (81 | ) |
| Other/non-agency | 6 |
| 80 |
| (2 | ) | | 17 |
| 397 |
| (33 | ) | | 23 |
| 477 |
| (35 | ) |
| Total mortgage-backed securities | 81 |
| 3,362 |
| (26 | ) | | 69 |
| 2,163 |
| (90 | ) | | 150 |
| 5,525 |
| (116 | ) |
| Total | 81 |
|
| $3,362 |
|
| ($26 | ) | | 70 |
|
| $2,173 |
|
| ($90 | ) | | 151 |
|
| $5,535 |
|
| ($116 | ) |
For each debt security identified with an unrealized loss, the Company reviews the expected cash flows to determine if the impairment in value is temporary or other-than-temporary. If the Company has determined that the present value of the debt security’s expected cash flows is less than its amortized cost basis, an other-than-temporary impairment is deemed to have occurred. The amount of impairment loss that is recognized in current period earnings is dependent on the Company’s intent to sell (or not sell) the debt security.
CITIZENS FINANCIAL GROUP, INC.
NOTES TO CONSOLIDATED FINANCIAL STATEMENTS
If the Company intends to sell the impaired debt security, the impairment loss recognized in current period earnings equals the difference between the debt security’s fair value and its amortized cost. If the Company does not intend to sell the impaired debt security, and it is not likely that the Company will be required to sell the impaired security, the credit-related impairment loss is recognized in current period earnings and equals the difference between the amortized cost of the debt security and the present value of the expected cash flows that have currently been projected.
In addition to these cash flow projections, several other characteristics of each debt security are reviewed when determining whether a credit loss exists and the period over which the debt security is expected to recover. These characteristics include: (1) the type of investment, (2) various market factors affecting the fair value of the security (e.g., interest rates, spread levels, liquidity in the sector, etc.), (3) the length and severity of impairment, and (4) the public credit rating of the instrument.
The Company estimates the portion of loss attributable to credit using a cash flow model. The inputs to this model include prepayment, default and loss severity assumptions that are based on industry research and observed data. The loss projections generated by the model are reviewed on a quarterly basis by a cross-functional governance committee. This governance committee determines whether security impairments are other-than-temporary based on this review.
The following table presents the cumulative credit related losses recognized in earnings on debt securities held by the Company:
|
| | | | | | | | | | | |
| | Year Ended December 31, |
| (in millions) | 2015 |
| | 2014 |
| | 2013 |
|
| Cumulative balance at beginning of period |
| $62 |
| |
| $56 |
| |
| $55 |
|
| Credit impairments recognized in earnings on securities that have been previously impaired | 7 |
| | 10 |
| | 8 |
|
| Reductions due to increases in cash flow expectations on impaired securities | (3 | ) | | (4 | ) | | (7 | ) |
| Cumulative balance at end of period |
| $66 |
| |
| $62 |
| |
| $56 |
|
Cumulative credit losses recognized in earnings for impaired AFS debt securities held as of December 31, 2015, 2014 and 2013 were $66 million, $62 million and $56 million, respectively. There were no credit losses recognized in earnings for the Company’s HTM portfolio as of December 31, 2015, 2014 and 2013. For the years ended December 31, 2015, 2014 and 2013, the Company recognized credit related other-than-temporary impairment losses in earnings of $7 million, $10 million and $8 million, respectively, related to non-agency MBS in the AFS portfolio. There were no credit impaired debt securities sold during the years ended December 31, 2015, 2014 and 2013, respectively. Reductions in credit losses due to increases in cash flow expectations were $3 million, $4 million and $7 million for the years ended December 31, 2015, 2014 and 2013, respectively, and were presented in interest income from investment securities on the Consolidated Statements of Operations. The Company does not currently have the intent to sell these debt securities, and it is not likely that the Company will be required to sell these debt securities prior to the recovery of their amortized cost bases.
The Company has determined that credit losses are not expected to be incurred on the remaining agency and non-agency MBS identified with unrealized losses as of the current reporting date. The unrealized losses on these debt securities reflect the reduced liquidity in the MBS market and the increased risk spreads due to the uncertainty of the U.S. macroeconomic environment. Therefore, the Company has determined that these debt securities are not other-than-temporarily impaired because the Company does not currently have the intent to sell these debt securities, and it is not likely that the Company will be required to sell these debt securities prior to the recovery of their amortized cost bases. Any subsequent increases in the valuation of impaired debt securities do not impact their recorded cost bases. Additionally, as of December 31, 2015, 2014 and 2013, $36 million, $35 million and $41 million respectively, of pre-tax non-credit related losses were deferred in OCI.
CITIZENS FINANCIAL GROUP, INC.
NOTES TO CONSOLIDATED FINANCIAL STATEMENTS
The amortized cost and fair value of debt securities at December 31, 2015 by contractual maturity are shown below. Expected maturities may differ from contractual maturities because issuers may have the right to call or prepay obligations with or without incurring penalties.
|
| | | | | | | | | | | | | | | |
| | Distribution of Maturities |
| (in millions) | 1 Year or Less | 1-5 Years | 5-10 Years | After 10 Years | Total |
|
| Amortized Cost: | | | | | |
| Debt securities available for sale | | | | | |
| U.S. Treasury and other |
| $15 |
|
| $— |
|
| $1 |
|
| $— |
|
| $16 |
|
| State and political subdivisions | — |
| — |
| — |
| 9 |
| 9 |
|
| Mortgage-backed securities: | | | | | |
| Federal agencies and U.S. government sponsored entities | 4 |
| 52 |
| 1,833 |
| 15,345 |
| 17,234 |
|
| Other/non-agency | — |
| 68 |
| 3 |
| 484 |
| 555 |
|
| Total debt securities available for sale | 19 |
| 120 |
| 1,837 |
| 15,838 |
| 17,814 |
|
| Debt securities held to maturity | | | | | |
| Mortgage-backed securities: | | | | | |
| Federal agencies and U.S. government sponsored entities | — |
| — |
| — |
| 4,105 |
| 4,105 |
|
| Other/non-agency | — |
| — |
| — |
| 1,153 |
| 1,153 |
|
| Total debt securities held to maturity | — |
| — |
| — |
| 5,258 |
| 5,258 |
|
| Total amortized cost of debt securities |
| $19 |
|
| $120 |
|
| $1,837 |
|
| $21,096 |
|
| $23,072 |
|
| | | | | | |
| Fair Value: | | | | | |
| Debt securities available for sale | | | | | |
| U.S. Treasury and other |
| $15 |
|
| $— |
|
| $1 |
|
| $— |
|
| $16 |
|
| State and political subdivisions | — |
| — |
| — |
| 9 |
| 9 |
|
| Mortgage-backed securities: | | | | | |
| Federal agencies and U.S. government sponsored entities | 4 |
| 54 |
| 1,845 |
| 15,417 |
| 17,320 |
|
| Other/non-agency | — |
| 70 |
| 3 |
| 449 |
| 522 |
|
| Total debt securities available for sale | 19 |
| 124 |
| 1,849 |
| 15,875 |
| 17,867 |
|
| Debt securities held to maturity | | | | | |
| Mortgage-backed securities: | | | | | |
| Federal agencies and U.S. government sponsored entities | — |
| — |
| — |
| 4,121 |
| 4,121 |
|
| Other/non-agency | — |
| — |
| — |
| 1,176 |
| 1,176 |
|
| Total debt securities held to maturity | — |
| — |
| — |
| 5,297 |
| 5,297 |
|
| Total fair value of debt securities |
| $19 |
|
| $124 |
|
| $1,849 |
|
| $21,172 |
|
| $23,164 |
|
The following table reports the amounts recognized in interest income from investment securities and interest-bearing deposits in banks on the Consolidated Statements of Operations:
|
| | | | | | | | | |
| | Year Ended December 31, |
| (in millions) | 2015 |
| 2014 |
| 2013 |
|
| Taxable |
| $621 |
|
| $619 |
|
| $477 |
|
| Non-taxable | — |
| — |
| — |
|
| Interest-bearing cash and due from banks and deposits in banks |
| $5 |
|
| $5 |
|
| $11 |
|
| Total interest income from investment securities and interest-bearing deposits in banks |
| $626 |
|
| $624 |
|
| $488 |
|
CITIZENS FINANCIAL GROUP, INC.
NOTES TO CONSOLIDATED FINANCIAL STATEMENTS
Realized gains and losses on securities are shown below:
|
| | | | | | | | | | | |
| | Year Ended December 31, |
| (in millions) | 2015 |
| | 2014 |
| | 2013 |
|
| Gains on sale of debt securities |
| $41 |
| |
| $33 |
| |
| $144 |
|
| Losses on sale of debt securities | (12 | ) | | (5 | ) | | — |
|
| Debt securities gains, net |
| $29 |
| |
| $28 |
| |
| $144 |
|
| Equity securities gains |
| $3 |
| |
| $— |
| |
| $— |
|
Included in the table above is a $2 million gain recognized on the sale of a $73 million mortgage-backed security that was classified as HTM. The HTM security was sold because the holding would have been prohibited under the Volcker Rule beginning in July 2017.
The amortized cost and fair value of securities pledged are shown below:
|
| | | | | | | | | | | | | |
| | December 31, 2015 | | December 31, 2014 |
| (in millions) | Amortized Cost | Fair Value |
| | Amortized Cost | Fair Value |
|
| Pledged against repurchase agreements |
| $805 |
|
| $808 |
| |
| $3,650 |
|
| $3,701 |
|
| Pledged against FHLB borrowed funds | 1,163 |
| 1,186 |
| | 1,355 |
| 1,407 |
|
| Pledged against derivatives, to qualify for fiduciary powers, and to secure public and other deposits as required by law | 3,579 |
| 3,610 |
| | 3,453 |
| 3,520 |
|
The Company regularly enters into security repurchase agreements with unrelated counterparties. Repurchase agreements are financial transactions that involve the transfer of a security from one party to another and a subsequent transfer of the same (or “substantially the same”) security back to the original party. The Company’s repurchase agreements are typically short-term transactions, but they may be extended to longer terms to maturity. Such transactions are accounted for as secured borrowed funds on the Company’s financial statements. When permitted by GAAP, the Company offsets the short-term receivables associated with its reverse repurchase agreements with the short-term payables associated with its repurchase agreements.
The effects of this offsetting on the Consolidated Balance Sheets are presented in the following table:
|
| | | | | | | | | | | | | | | | | | | |
| | December 31, 2015 | | December 31, 2014 |
| (in millions) | Gross Assets (Liabilities) | Gross Assets (Liabilities) Offset | Net Amounts of Assets (Liabilities) | | Gross Assets (Liabilities) | Gross Assets (Liabilities) Offset | Net Amounts of Assets (Liabilities) |
| Securities purchased under agreements to resell |
| $500 |
|
| ($500 | ) |
| $— |
| |
| $— |
|
| $— |
|
| $— |
|
| Securities sold under agreements to repurchase | (500 | ) | 500 |
| — |
| | (2,600 | ) | — |
| (2,600 | ) |
Note: The Company also offsets certain derivative assets and derivative liabilities on the Consolidated Balance Sheets. For further information see Note 16 “Derivatives.”
Securitizations of mortgage loans retained in the investment portfolio for the years ended December 31, 2015, 2014 and 2013, were $3 million, $18 million and $106 million, respectively. These securitizations included a substantive guarantee by a third party. In 2015, the guarantor was Freddie Mac. In 2014 and 2013, the guarantors were Fannie Mae, Ginnie Mae, and Freddie Mac. These securitizations were accounted for as a sale of the transferred loans and as a purchase of securities. The securities received from the guarantors are classified as AFS.
CITIZENS FINANCIAL GROUP, INC.
NOTES TO CONSOLIDATED FINANCIAL STATEMENTS
Securities under the agreements to repurchase or resell are accounted for as secured borrowings. The following table presents the Company's related activity, by collateral type and remaining contractual maturity, at December 31, 2015:
|
| | | | | | | | | | | | | | | |
| | Remaining Contractual Maturity of the Agreements |
| (in millions) | Overnight and Continuous | Up to 30 Days | 30-90 Days | Greater Than 90 Days | Total |
|
| Securities purchased under agreements to resell | | | | | |
| Mortgage-backed securities - Agency |
| $— |
|
| $500 |
|
| $— |
|
| $— |
|
| $500 |
|
| Total securities purchased under agreements to resell |
| $— |
|
| $500 |
|
| $— |
|
| $— |
|
| $500 |
|
| Securities sold under agreements to repurchase | | | | | |
| Mortgage-backed securities - Agency |
| $— |
|
| ($500 | ) |
| $— |
|
| $— |
|
| ($500 | ) |
| Total securities sold under agreement to repurchase |
| $— |
|
| ($500 | ) |
| $— |
|
| $— |
|
| ($500 | ) |
For these securities sold under the agreements to repurchase, the Company would be obligated to provide additional collateral in the event of a significant decline in fair value of the collateral pledged. The Company manages the risk by monitoring the liquidity and credit quality of the collateral, as well as the maturity profile of the transactions.
NOTE 4 - LOANS AND LEASES
A summary of the loans and leases portfolio follows:
|
| | | | | | | |
| | December 31, |
| (in millions) | 2015 |
| | 2014 |
|
| Commercial |
| $33,264 |
| |
| $31,431 |
|
| Commercial real estate | 8,971 |
| | 7,809 |
|
| Leases | 3,979 |
| | 3,986 |
|
| Total commercial | 46,214 |
| | 43,226 |
|
| Residential mortgages | 13,318 |
| | 11,832 |
|
| Home equity loans | 2,557 |
| | 3,424 |
|
| Home equity lines of credit | 14,674 |
| | 15,423 |
|
Home equity loans serviced by others (1) | 986 |
| | 1,228 |
|
Home equity lines of credit serviced by others (1) | 389 |
| | 550 |
|
| Automobile | 13,828 |
| | 12,706 |
|
| Student | 4,359 |
| | 2,256 |
|
| Credit cards | 1,634 |
| | 1,693 |
|
| Other retail | 1,083 |
| | 1,072 |
|
| Total retail | 52,828 |
| | 50,184 |
|
Total loans and leases (2) (3) |
| $99,042 |
| |
| $93,410 |
|
(1) Includes modifications that consist of multiple concessions, one of which is an interest rate reduction.
(2) Includes modifications that consist of multiple concessions, one of which is a maturity extension (unless one of the other concessions was an interest rate reduction).
(3)The Company'sCompany’s SBO portfolio consists of purchased home equity loans and lines that were originally serviced by others. The Company now services a portion of this portfolio internally.
(4)(2) Includes modifications other than interest rate reductions or maturity extensions, suchExcluded from the table above are loans held for sale totaling $365 million and $281 million as lowering scheduled paymentsof December 31, 2015 and 2014, respectively.
(3) Mortgage loans serviced for a specified periodothers by the Company’s subsidiaries are not included above, and amounted to $17.6 billion and $17.9 billion at December 31, 2015 and 2014, respectively.
Loans held for sale at fair value totaled $325 million and $256 million at December 31, 2015 and 2014, respectively, and consisted of time, principal forbearance, capitalizing arrearages,residential mortgages originated for sale of $268 million and principal forgiveness. Also included are the following: deferrals, trial modifications, certain bankruptcies,commercial trading portfolio of $57 million as of December 31, 2015. As of December 31, 2014, residential mortgages originated for sale were $213 million, and commercial trading portfolio totaled $43 million. Other loans in forbearanceheld for sale totaled $40 million and prepayment plans. Modifications can include the deferral$25 million as of accrued interest resulting in post modification balances being higher than pre-modification.December 31, 2015 and 2014, respectively, and consisted of commercial loan syndications.
Loans pledged as collateral for FHLB borrowed funds totaled $23.2 billion and $22.0 billion at December 31, 2015 and 2014, respectively. This collateral consists primarily of residential mortgages and home equity loans. Loans pledged as collateral
CITIZENS FINANCIAL GROUP, INC.
NOTES TO CONSOLIDATED FINANCIAL STATEMENTS
The following table summarizes how loans were modified duringto support the contingent ability to borrow at the FRB discount window, if necessary, totaled $15.9 billion and $11.8 billion at December 31, 2015 and 2014, respectively.
During the year ended December 31, 2015, the Company purchased automobile loans with an outstanding principal balance of $1.3 billion, a portfolio of residential mortgages with an outstanding principal balance of $1.1 billion, and a portfolio of student loans with an outstanding principal balance of $957 million. During the year ended December 31, 2014, the Company purchased a portfolio of residential loans with an outstanding principal balance of $1.9 billion, a portfolio of auto loans with an outstanding principal balance of $1.7 billion and a portfolio of student loans with an outstanding principal balance of $59 million.
During the year ended December 31, 2015, the Company sold a portfolio of commercial loans with an outstanding principal balance of $401 million as part of the Company’s loan syndication project, residential mortgages with an outstanding principal balance of $273 million, and $41 million of credit card balances associated with a terminated agent credit card servicing agreement. During the year ended December 31, 2014, in addition to the $1.0 billion loans sold as part of the Company's sale of its Chicago-area retail branches, the Company sold portfolios of residential mortgage loans with outstanding principal balances of $126 million and student loans of $357 million, as well as commercial loans with an outstanding principal balance of $301 million.
The Company is engaged in the leasing of equipment for commercial use, with primary lease concentrations to Fortune 1000 companies for large capital equipment acquisitions. A lessee is evaluated from a credit perspective using the same underwriting standards and procedures as for a loan borrower. A lessee is expected to make rental payments based on its cash flows and the viability of its balance sheet. Leases are usually not evaluated as collateral-based transactions, and therefore the lessee’s overall financial strength is the most important credit evaluation factor.
A summary of the investment in leases, before the ALLL, is as follows:
|
| | | | | | | |
| | December 31, |
| (in millions) | 2015 |
| | 2014 |
|
| Direct financing leases |
| $3,898 |
| |
| $3,873 |
|
| Leveraged leases | 81 |
| | 113 |
|
| Total leases |
| $3,979 |
| |
| $3,986 |
|
The components of the investment in leases, before the ALLL, are as follows:
|
| | | | | | | |
| | December 31, |
| (in millions) | 2015 |
| | 2014 |
|
| Total future minimum lease rentals |
| $3,195 |
| |
| $3,324 |
|
| Estimated residual value of leased equipment (non-guaranteed) | 1,157 |
| | 1,059 |
|
| Initial direct costs | 22 |
| | 22 |
|
| Unearned income on minimum lease rentals and estimated residual value of leased equipment | (395 | ) | | (419 | ) |
| Total leases |
| $3,979 |
| |
| $3,986 |
|
At December 31, 2015, the future minimum lease rentals on direct financing and leveraged leases are as follows:
|
| | | |
| Year Ended December 31, | (in millions) |
|
| 2016 |
| $707 |
|
| 2017 | 588 |
|
| 2018 | 528 |
|
| 2019 | 445 |
|
| 2020 | 327 |
|
| Thereafter | 600 |
|
| Total |
| $3,195 |
|
Pre-tax income on leveraged leases was $2 million, $2 million and $3 million for the years ended December 31, 2015, 2014 and 2013, respectively. The income tax expense on this income was $1 million for the years ended December 31, 2015, 2014 and 2013. There was no investment credit recognized in income during these years.
CITIZENS FINANCIAL GROUP, INC.
NOTES TO CONSOLIDATED FINANCIAL STATEMENTS
NOTE 5 - ALLOWANCE FOR CREDIT LOSSES, NONPERFORMING ASSETS, AND CONCENTRATIONS OF CREDIT RISK
The allowance for credit losses consists of the ALLL and the reserve for unfunded commitments. It is increased through a provision for credit losses that is charged to earnings, based on the Company’s quarterly evaluation of the loan portfolio, and is reduced by net charge-offs and the ALLL associated with sold loans. See Note 1 “Significant Accounting Policies” for a detailed discussion of ALLL reserve methodologies and estimation techniques.
On a quarterly basis, the Company reviews and refines its estimate of the allowance for credit losses, taking into consideration changes in portfolio size and composition, historical loss experience, internal risk ratings, current economic conditions, industry performance trends and other pertinent information.
During 2013, the charge-offs related toCompany modified the modifications, and the impact onway that it establishes the ALLL. The reported balances include loansALLL is reviewed separately for commercial and retail loan portfolios, and the ALLL for each includes an adjustment for qualitative reserves that became TDRsincludes certain risks, factors and events that might not be measured in the statistical analysis. As a result of this change, the unallocated reserve was absorbed into the separately measured commercial and retail qualitative reserves.
Additionally, during December 2013, the Company revised and extended its incurred loss period for certain residential mortgages. This change reflects management's recognition that incurred but unrealized losses emerge differently during various points of an economic/business cycle. Incurred Loss Periods (“ILPs”) are not static and move over time based on several factors. As economies expand and contract, access to credit, jobs, and liquidity moves directionally with the economy. ILPs will be longer in stronger economic times, when borrowers have the financial ability to withstand adversity and the ILPs will be shorter in an adverse economic environment, when the borrower has less financial flexibility. Since the current economy has not been as strong as the economy during the 2002-2006 time period, we believe that ILPs will not be as long, but rather directional to our history. Since overall Company reserves are deemed adequate, there was no need to increase the reserve but rather reallocate some of the general reserves to cover the $96 million incurred loss period increase.
There were paid offno other material changes in full, charged off,assumptions or soldestimation techniques compared with prior to December 31, 2013.years that impacted the determination of the current year’s ALLL and the reserve for unfunded lending commitments.
The following is a summary of changes in the allowance for credit losses:
|
| | | | | | | | | | | | | | | | | |
| | Primary Modification Types |
| | Interest Rate Reduction (1) | | Maturity Extension (2) |
| (dollars in millions) | Number of Contracts | Pre-Modification Outstanding Recorded Investment | Post-Modification Outstanding Recorded Investment | | Number of Contracts | Pre-Modification Outstanding Recorded Investment | Post-Modification Outstanding Recorded Investment |
| Commercial | 126 |
|
| $13 |
|
| $13 |
| | 134 |
|
| $18 |
|
| $18 |
|
| Commercial real estate | 11 |
| 7 |
| 7 |
| | 3 |
| 1 |
| 1 |
|
| Total commercial | 137 |
| 20 |
| 20 |
| | 137 |
| 19 |
| 19 |
|
| Residential mortgages | 200 |
| 32 |
| 33 |
| | 46 |
| 5 |
| 6 |
|
| Home equity loans | 196 |
| 15 |
| 16 |
| | 94 |
| 6 |
| 6 |
|
| Home equity lines of credit | 18 |
| 1 |
| 1 |
| | 2,081 |
| 80 |
| 70 |
|
Home equity loans serviced by others (3) | 31 |
| 2 |
| 2 |
| | 5 |
| — |
| — |
|
Home equity lines of credit serviced by others (3) | 3 |
| — |
| — |
| | 1 |
| — |
| — |
|
| Automobile | 238 |
| 2 |
| 2 |
| | 2 |
| — |
| — |
|
| Credit cards | 2,729 |
| 15 |
| 15 |
| | — |
| — |
| — |
|
| Other retail | 21 |
| — |
| — |
| | — |
| — |
| — |
|
| Total retail | 3,436 |
| 67 |
| 69 |
| | 2,229 |
| 91 |
| 82 |
|
| Total | 3,573 |
|
| $87 |
|
| $89 |
| | 2,366 |
|
| $110 |
|
| $101 |
|
|
| | | | | | | | | |
| | Year Ended December 31, 2015 |
| (in millions) | Commercial |
| Retail |
| Total |
|
| Allowance for loan and lease losses as of January 1, 2015 |
| $544 |
|
| $651 |
|
| $1,195 |
|
| Charge-offs | (36 | ) | (444 | ) | (480 | ) |
| Recoveries | 49 |
| 147 |
| 196 |
|
| Net recoveries (charge-offs) | 13 |
| (297 | ) | (284 | ) |
| Provision charged to income | 39 |
| 266 |
| 305 |
|
| Allowance for loan and lease losses as of December 31, 2015 | 596 |
| 620 |
| 1,216 |
|
| Reserve for unfunded lending commitments as of January 1, 2015 | 61 |
| — |
| 61 |
|
| Credit for unfunded lending commitments | (3 | ) | — |
| (3 | ) |
| Reserve for unfunded lending commitments as of December 31, 2015 | 58 |
| — |
| 58 |
|
| Total allowance for credit losses as of December 31, 2015 |
| $654 |
|
| $620 |
|
| $1,274 |
|
CITIZENS FINANCIAL GROUP, INC.
NOTES TO CONSOLIDATED FINANCIAL STATEMENTS
|
| | | | | | | | | |
| | Year Ended December 31, 2014 |
| (in millions) | Commercial |
| Retail |
| Total |
|
| Allowance for loan and lease losses as of January 1, 2014 |
| $498 |
|
| $723 |
|
| $1,221 |
|
| Charge-offs | (43 | ) | (450 | ) | (493 | ) |
| Recoveries | 58 |
| 112 |
| 170 |
|
| Net (charge-offs) recoveries | 15 |
| (338 | ) | (323 | ) |
| Provision charged to income | 31 |
| 266 |
| 297 |
|
| Allowance for loan and lease losses as of December 31, 2014 | 544 |
| 651 |
| 1,195 |
|
| Reserve for unfunded lending commitments as of January 1, 2014 | 39 |
| — |
| 39 |
|
| Provision for unfunded lending commitments | 22 |
| — |
| 22 |
|
| Reserve for unfunded lending commitments as of December 31, 2014 | 61 |
| — |
| 61 |
|
| Total allowance for credit losses as of December 31, 2014 |
| $605 |
|
| $651 |
|
| $1,256 |
|
|
| | | | | | | | | | | | | | | |
| | Primary Modification Types | | | |
| | Other (4) | | | |
| (dollars in millions) | Number of Contracts | Pre-Modification Outstanding Recorded Investment | Post-Modification Outstanding Recorded Investment | | Net Change to ALLL Resulting from Modification | Charge-offs Resulting from Modification |
| Commercial | 6 |
|
| $1 |
|
| $1 |
| |
| $— |
|
| $1 |
|
| Commercial real estate | 1 |
| — |
| — |
| | (2 | ) | — |
|
| Total commercial | 7 |
| 1 |
| 1 |
| | (2 | ) | 1 |
|
| Residential mortgages | 430 |
| 64 |
| 63 |
| | 5 |
| 2 |
|
| Home equity loans | 995 |
| 57 |
| 51 |
| | 2 |
| 5 |
|
| Home equity lines of credit | 771 |
| 53 |
| 46 |
| | — |
| 16 |
|
Home equity loans serviced by others (3) | 269 |
| 12 |
| 10 |
| | — |
| 3 |
|
Home equity lines of credit serviced by others (3) | 43 |
| 2 |
| 1 |
| | — |
| 1 |
|
| Automobile | 1,323 |
| 13 |
| 10 |
| | — |
| 3 |
|
| Student | 2,620 |
| 48 |
| 47 |
| | — |
| — |
|
| Other retail | 148 |
| 3 |
| 3 |
| | — |
| 1 |
|
| Total retail | 6,599 |
| 252 |
| 231 |
| | 7 |
| 31 |
|
| Total | 6,606 |
|
| $253 |
|
| $232 |
| |
| $5 |
|
| $32 |
|
|
| | | | | | | | | | | | |
| | Year Ended December 31, 2013 |
| (in millions) | Commercial |
| Retail |
| Unallocated |
| Total |
|
| Allowance for loan and lease losses as of January 1, 2013 |
| $509 |
|
| $657 |
|
| $89 |
|
| $1,255 |
|
| Charge-offs | (108 | ) | (595 | ) | — |
| (703 | ) |
| Recoveries | 87 |
| 115 |
| — |
| 202 |
|
| Net charge-offs | (21 | ) | (480 | ) | — |
| (501 | ) |
| Sales/Other | (6 | ) | (6 | ) | (1 | ) | (13 | ) |
| Provision charged to income | (19 | ) | 396 |
| 103 |
| 480 |
|
| Transfer of unallocated reserve to qualitative reserve | 35 |
| 60 |
| (95 | ) | — |
|
| Loss emergence period change | — |
| 96 |
| (96 | ) | — |
|
| Allowance for loan and lease losses as of December 31, 2013 | 498 |
| 723 |
| — |
| 1,221 |
|
| Reserve for unfunded lending commitments as of January 1, 2013 | 40 |
| — |
| — |
| 40 |
|
| Credit for unfunded lending commitments | (1 | ) | — |
| — |
| (1 | ) |
| Reserve for unfunded lending commitments as of December 31, 2013 | 39 |
| — |
| — |
| 39 |
|
| Total allowance for credit losses as of December 31, 2013 |
| $537 |
|
| $723 |
|
| $— |
|
| $1,260 |
|
The recorded investment in loans and leases based on the Company’s evaluation methodology is as follows:
|
| | | | | | | | | | | | | | | | | | | |
| | December 31, 2015 | | December 31, 2014 |
| (in millions) | Commercial |
| Retail |
| Total |
| | Commercial |
| Retail |
| Total |
|
| Individually evaluated |
| $218 |
|
| $1,165 |
|
| $1,383 |
| |
| $205 |
|
| $1,208 |
|
| $1,413 |
|
| Formula-based evaluation | 45,996 |
| 51,663 |
| 97,659 |
| | 43,021 |
| 48,976 |
| 91,997 |
|
| Total |
| $46,214 |
|
| $52,828 |
|
| $99,042 |
| |
| $43,226 |
|
| $50,184 |
|
| $93,410 |
|
The following is a summary of the allowance for credit losses by evaluation method:
|
| | | | | | | | | | | | | | | | | | | |
| | December 31, 2015 | | December 31, 2014 |
| (in millions) | Commercial |
| Retail |
| Total |
| | Commercial |
| Retail |
| Total |
|
| Individually evaluated |
| $36 |
|
| $101 |
|
| $137 |
| |
| $20 |
|
| $109 |
|
| $129 |
|
| Formula-based evaluation | 618 |
| 519 |
| 1,137 |
| | 585 |
| 542 |
| 1,127 |
|
| Allowance for credit losses |
| $654 |
|
| $620 |
|
| $1,274 |
| |
| $605 |
|
| $651 |
|
| $1,256 |
|
CITIZENS FINANCIAL GROUP, INC.
NOTES TO CONSOLIDATED FINANCIAL STATEMENTS
For commercial loans and leases, the Company utilizes regulatory classification ratings to monitor credit quality. Loans with a “pass” rating are those that the Company believes will be fully repaid in accordance with the contractual loan terms. Commercial loans and leases that are “criticized” are those that have some weakness that indicates an increased probability of future loss. For retail loans, the Company primarily uses the loan’s payment and delinquency status to monitor credit quality. The further a loan is past due, the greater the likelihood of future credit loss. These credit quality indicators for both commercial and retail loans are continually updated and monitored.
The recorded investment in classes of commercial loans and leases based on regulatory classification ratings is as follows:
|
| | | | | | | | | | | | | | | |
| | December 31, 2015 |
| | | Criticized | |
| (in millions) | Pass |
| Special Mention |
| Substandard |
| Doubtful |
| Total |
|
| Commercial |
| $31,276 |
|
| $911 |
|
| $1,002 |
|
| $75 |
|
| $33,264 |
|
| Commercial real estate | 8,450 |
| 272 |
| 171 |
| 78 |
| 8,971 |
|
| Leases | 3,880 |
| 55 |
| 44 |
| — |
| 3,979 |
|
| Total |
| $43,606 |
|
| $1,238 |
|
| $1,217 |
|
| $153 |
|
| $46,214 |
|
|
| | | | | | | | | | | | | | | |
| | December 31, 2014 |
| | | Criticized | |
| (in millions) | Pass |
| Special Mention |
| Substandard |
| Doubtful |
| Total |
|
| Commercial |
| $30,022 |
|
| $876 |
|
| $427 |
|
| $106 |
|
| $31,431 |
|
| Commercial real estate | 7,354 |
| 329 |
| 61 |
| 65 |
| 7,809 |
|
| Leases | 3,924 |
| 12 |
| 50 |
| — |
| 3,986 |
|
| Total |
| $41,300 |
|
| $1,217 |
|
| $538 |
|
| $171 |
|
| $43,226 |
|
The recorded investment in classes of retail loans, categorized by delinquency status is as follows:
|
| | | | | | | | | | | | | | | |
| | December 31, 2015 |
| (in millions) | Current |
| 1-29 Days Past Due | 30-89 Days Past Due | 90 Days or More Past Due | Total |
|
| Residential mortgages |
| $12,905 |
|
| $97 |
|
| $70 |
|
| $246 |
|
| $13,318 |
|
| Home equity loans | 2,245 |
| 164 |
| 44 |
| 104 |
| 2,557 |
|
| Home equity lines of credit | 13,982 |
| 407 |
| 80 |
| 205 |
| 14,674 |
|
Home equity loans serviced by others (1) | 886 |
| 60 |
| 20 |
| 20 |
| 986 |
|
Home equity lines of credit serviced by others (1) | 296 |
| 48 |
| 16 |
| 29 |
| 389 |
|
| Automobile | 12,670 |
| 964 |
| 159 |
| 35 |
| 13,828 |
|
| Student | 4,175 |
| 113 |
| 30 |
| 41 |
| 4,359 |
|
| Credit cards | 1,554 |
| 44 |
| 20 |
| 16 |
| 1,634 |
|
| Other retail | 1,013 |
| 53 |
| 12 |
| 5 |
| 1,083 |
|
| Total |
| $49,726 |
|
| $1,950 |
|
| $451 |
|
| $701 |
|
| $52,828 |
|
(1) Includes modifications that consist of multiple concessions, one of which is an interest rate reduction.
(2) Includes modifications that consist of multiple concessions, one of which is a maturity extension (unless one of the other concessions was an interest rate reduction).
(3)The Company'sCompany’s SBO portfolio consists of purchased home equity loans and lines that were originally serviced by others. The Company now services a portion of this portfolio internally.
(4) Includes modifications other than interest rate reductions or maturity extensions, such as lowering scheduled payments for a specified period of time, principal forbearance, capitalizing arrearages, and principal forgiveness. Also included are the following: deferrals, trial modifications, certain bankruptcies, loans in forbearance and prepayment plans. Modifications can include the deferral of accrued interest resulting in post modification balances being higher than pre-modification.
CITIZENS FINANCIAL GROUP, INC.
NOTES TO CONSOLIDATED FINANCIAL STATEMENTS
The following table summarizes how loans were modified during the year ended December 31, 2012, the charge-offs related to the modifications, and the impact on the ALLL. The reported balances include loans that became TDRs during 2012, and were paid off in full, charged off, or sold prior to December 31, 2012.
|
| | | | | | | | | | | | | | | | | |
| | Primary Modification Types |
| | Interest Rate Reduction (1) | | Maturity Extension (2) |
| (dollars in millions) | Number of Contracts | Pre-Modification Outstanding Recorded Investment | Post-Modification Outstanding Recorded Investment | | Number of Contracts | Pre-Modification Outstanding Recorded Investment | Post-Modification Outstanding Recorded Investment |
| Commercial | 18 |
|
| $13 |
|
| $13 |
| | 108 |
|
| $25 |
|
| $24 |
|
| Commercial real estate | 4 |
| 9 |
| 9 |
| | 6 |
| 14 |
| 13 |
|
| Total commercial | 22 |
| 22 |
| 22 |
| | 114 |
| 39 |
| 37 |
|
| Residential mortgages | 346 |
| 77 |
| 80 |
| | 36 |
| 4 |
| 5 |
|
| Home equity loans | 218 |
| 18 |
| 19 |
| | 48 |
| 4 |
| 5 |
|
| Home equity lines of credit | 1 |
| — |
| — |
| | 109 |
| 6 |
| 6 |
|
Home equity loans serviced by others (3) | 41 |
| 2 |
| 2 |
| | 7 |
| 1 |
| — |
|
Home equity lines of credit serviced by others(3) | 3 |
| — |
| — |
| | — |
| — |
| — |
|
| Credit cards | 2,965 |
| 17 |
| 16 |
| | — |
| — |
| — |
|
| Total retail | 3,574 |
| 114 |
| 117 |
| | 200 |
| 15 |
| 16 |
|
| Total | 3,596 |
|
| $136 |
|
| $139 |
| | 314 |
|
| $54 |
|
| $53 |
|
| | | | Primary Modification Types | | | December 31, 2014 |
| | Other (4) | | | |
| (dollars in millions) | Number of Contracts | Pre-Modification Outstanding Recorded Investment | Post-Modification Outstanding Recorded Investment | | Net Change(5) to ALLL Resulting from Modification | Charge-offs Resulting from Modification | |
| Commercial | 180 |
|
| $43 |
|
| $46 |
| |
| ($29 | ) |
| $14 |
| |
| Commercial real estate | 16 |
| 72 |
| 74 |
| | (26 | ) | 2 |
| |
| Total commercial | 196 |
| 115 |
| 120 |
| | (55 | ) | 16 |
| |
| (in millions) | | Current |
| 1-29 Days Past Due | 30-89 Days Past Due | 90 Days or More Past Due | Total |
|
| Residential mortgages | 2,331 |
| 203 |
| 195 |
| | (4 | ) | 9 |
|
| $11,352 |
|
| $114 |
|
| $97 |
|
| $269 |
|
| $11,832 |
|
| Home equity loans | 2,336 |
| 130 |
| 117 |
| | (2 | ) | 14 |
| 2,997 |
| 222 |
| 60 |
| 145 |
| 3,424 |
|
| Home equity lines of credit | 1,554 |
| 92 |
| 72 |
| | — |
| 20 |
| 14,705 |
| 447 |
| 73 |
| 198 |
| 15,423 |
|
Home equity loans serviced by others (3) | 1,192 |
| 50 |
| 37 |
| | (8 | ) | 13 |
| |
Home equity lines of credit serviced by others (3) | 322 |
| 17 |
| 13 |
| | — |
| 4 |
| |
Home equity loans serviced by others (1) | | 1,101 |
| 78 |
| 26 |
| 23 |
| 1,228 |
|
Home equity lines of credit serviced by others (1) | | 455 |
| 66 |
| 10 |
| 19 |
| 550 |
|
| Automobile | 2,938 |
| 19 |
| 14 |
| | (4 | ) | 4 |
| 11,839 |
| 758 |
| 93 |
| 16 |
| 12,706 |
|
| Student | 7,557 |
| 139 |
| 138 |
| | 3 |
| — |
| 2,106 |
| 108 |
| 25 |
| 17 |
| 2,256 |
|
| Credit cards | — |
| — |
| — |
| | 2 |
| — |
| 1,615 |
| 39 |
| 22 |
| 17 |
| 1,693 |
|
| Other retail | 263 |
| 6 |
| 3 |
| | — |
| 4 |
| 985 |
| 65 |
| 18 |
| 4 |
| 1,072 |
|
| Total retail | 18,493 |
| 656 |
| 589 |
| | (13 | ) | 68 |
| |
| Total | 18,689 |
|
| $771 |
|
| $709 |
| |
| ($68 | ) |
| $84 |
|
| $47,155 |
|
| $1,897 |
|
| $424 |
|
| $708 |
|
| $50,184 |
|
(1) Includes modifications that consist of multiple concessions, one of which is an interest rate reduction.
(2) Includes modifications that consist of multiple concessions, one of which is a maturity extension (unless one of the other concessions was an interest rate reduction).
(3)The Company'sCompany’s SBO portfolio consists of purchased home equity loans and lines that were originally serviced by others. The Company now services a portion of this portfolio internally.
(4) Includes modifications other than interest rate reductions or maturity extensions, suchNonperforming Assets
A summary of nonperforming loans and leases by class is as lowering scheduled payments for a specified period of time, principal forbearance, capitalizing arrearages, and principal forgiveness. Also included are the following: deferrals, trial modifications, certain bankruptcies, loans in forbearance and prepayment plans. Modifications can include the deferral of accrued interest resulting in post modification balances being higher than pre-modification.
(5) Retail data is estimated for certain loan classes.
CITIZENS FINANCIAL GROUP, INC.
NOTES TO CONSOLIDATED FINANCIAL STATEMENTS
The table below summarizes TDRs that defaulted during the years ended December 31, 2014, 2013 and 2012 within 12 months of their modification date. For purposes of this table, a payment default is defined as being past due 90 days or more under the modified terms. Amounts represent the loan's recorded investment at the time of payment default. Loan data includes loans meeting the criteria that were paid off in full, charged off, or sold prior to December 31, 2014 and 2013. If a TDR of any loan type becomes 90 days past due after being modified, the loan is written down to the fair value of collateral less cost to sell. The amount written off is charged to the ALLL.follows:
| | | | For the Year Ended December 31, | December 31, 2015 | | December 31, 2014 |
| | 2014 | | 2013 | | 2012 | |
| (dollars in millions) | Number of Contracts | Balance Defaulted | | Number of Contracts | Balance Defaulted | | Number of Contracts | Balance Defaulted | |
| (in millions) | | Nonaccruing | Accruing and 90 Days or More Delinquent | Total Nonperforming Loans and Leases | | Nonaccruing | Accruing and 90 Days or More Delinquent | Total Nonperforming Loans and Leases |
| Commercial | 37 |
|
| $12 |
| | 18 |
|
| $1 |
| | 4 |
|
| $3 |
|
| $70 |
|
| $1 |
|
| $71 |
| |
| $113 |
|
| $1 |
|
| $114 |
|
| Commercial real estate | 3 |
| 1 |
| | 3 |
| 1 |
| | 1 |
| 5 |
| 77 |
| — |
| 77 |
| | 50 |
| — |
| 50 |
|
| Leases | | — |
| — |
| — |
| | — |
| — |
| — |
|
| Total commercial | 40 |
| 13 |
| | 21 |
| 2 |
| | 5 |
| 8 |
| 147 |
| 1 |
| 148 |
| | 163 |
| 1 |
| 164 |
|
| Residential mortgages | 301 |
| 35 |
| | 526 |
| 60 |
| | 208 |
| 35 |
| 331 |
| — |
| 331 |
| | 345 |
| — |
| 345 |
|
| Home equity loans | 329 |
| 24 |
| | 740 |
| 43 |
| | 318 |
| 31 |
| 135 |
| — |
| 135 |
| | 203 |
| — |
| 203 |
|
| Home equity lines of credit | 229 |
| 12 |
| | 394 |
| 21 |
| | 187 |
| 15 |
| 272 |
| — |
| 272 |
| | 257 |
| — |
| 257 |
|
Home equity loans serviced by others (1) | 60 |
| 2 |
| | 187 |
| 3 |
| | 194 |
| 14 |
| 38 |
| — |
| 38 |
| | 47 |
| — |
| 47 |
|
Home equity lines of credit serviced by others (1) | 20 |
| — |
| | 42 |
| 2 |
| | 14 |
| 1 |
| 32 |
| — |
| 32 |
| | 25 |
| — |
| 25 |
|
| Automobile | 112 |
| 1 |
| | 208 |
| 1 |
| | 143 |
| 1 |
| 42 |
| — |
| 42 |
| | 21 |
| — |
| 21 |
|
| Student | 355 |
| 7 |
| | 885 |
| 17 |
| | — |
| — |
| 35 |
| 6 |
| 41 |
| | 11 |
| 6 |
| 17 |
|
| Credit cards | 579 |
| 3 |
| | 548 |
| 3 |
| | 628 |
| 4 |
| 16 |
| — |
| 16 |
| | 16 |
| 1 |
| 17 |
|
| Other retail | 12 |
| — |
| | 33 |
| 1 |
| | 8 |
| — |
| 3 |
| 2 |
| 5 |
| | 5 |
| — |
| 5 |
|
| Total retail | 1,997 |
| 84 |
| | 3,563 |
| 151 |
| | 1,700 |
| 101 |
| 904 |
| 8 |
| 912 |
| | 930 |
| 7 |
| 937 |
|
| Total | 2,037 |
|
| $97 |
| | 3,584 |
|
| $153 |
| | 1,705 |
|
| $109 |
|
| $1,051 |
|
| $9 |
|
| $1,060 |
| |
| $1,093 |
|
| $8 |
|
| $1,101 |
|
(1) The Company'sCompany’s SBO portfolio consists of purchased home equity loans and lines that were originally serviced by others. The Company now services a portion of this portfolio internally.
Concentrations of Credit Risk
Most of the Company's business activity is with customers locatedThe recorded investment in the New England, Mid-Atlantic and Midwest regions. Generally, loans are collateralized by assets including real estate, inventory, accounts receivable, other personal property and investment securities. As of December 31, 2014 and 2013, the Company had a significant amount ofmortgage loans collateralized by residential and commercial real estate. Thereestate property for which formal foreclosure proceedings are no significant concentrations in particular industries within the commercial loan portfolio. Exposure to credit losses arising from lending transactions may fluctuate with fair valuesprocess was $257 million as of collateral supporting loans, which may not perform according to contractual agreements. The Company's policy is to collateralize loans to the extent necessary; however, unsecured loans are also granted on the basis of the financial strength of the applicant and the facts surrounding the transaction.
Certain loan products, including residential mortgages, home equity loans and lines of credit, and credit cards, have contractual features that may increase credit exposure to the Company in the event of an increase in interest rates or a decline in housing values. These products include loans that exceed 90% of the value of the underlying collateral (high LTV loans), interest-only and negative amortization residential mortgages, and loans with low introductory rates. Certain loans have more than one of these characteristics.December 31, 2015.
CITIZENS FINANCIAL GROUP, INC.
NOTES TO CONSOLIDATED FINANCIAL STATEMENTS
The following table presents balances of loans with these characteristics:
|
| | | | | | | | | | | | | | | |
| | December 31, 2014 |
| (in millions) | Residential Mortgages |
| Home Equity Loans and Lines of Credit | Home Equity Products serviced by others | Credit Cards |
| Total |
|
| High loan-to-value |
| $773 |
|
| $1,743 |
|
| $1,025 |
|
| $— |
|
| $3,541 |
|
| Interest only/negative amortization | 894 |
| — |
| — |
| — |
| 894 |
|
| Low introductory rate | — |
| — |
| — |
| 98 |
| 98 |
|
| Multiple characteristics and other | 24 |
| — |
| — |
| — |
| 24 |
|
| Total |
| $1,691 |
|
| $1,743 |
|
| $1,025 |
|
| $98 |
|
| $4,557 |
|
|
| | | | | | | | | | | | | | | |
| | December 31, 2013 |
| (in millions) | Residential Mortgages |
| Home Equity Loans and Lines of Credit | Home Equity Products serviced by others | Credit Cards |
| Total |
|
| High loan-to-value |
| $1,054 |
|
| $2,798 |
|
| $1,581 |
|
| $— |
|
| $5,433 |
|
| Interest only/negative amortization | 882 |
| — |
| — |
| — |
| 882 |
|
| Low introductory rate | — |
| — |
| — |
| 119 |
| 119 |
|
| Multiple characteristics and other | 96 |
| — |
| — |
| — |
| 96 |
|
| Total |
| $2,032 |
|
| $2,798 |
|
| $1,581 |
|
| $119 |
|
| $6,530 |
|
NOTE 6 - PREMISES, EQUIPMENT AND SOFTWARE
A summary of the carrying value of premises and equipmentother nonperforming assets is as follows:
|
| | | | | | | | | |
| | | | December 31, |
| (dollars in millions) | Useful Lives | | 2014 |
| | 2013 |
|
| Land and land improvements | 15 years | |
| $26 |
| |
| $33 |
|
| Buildings and leasehold improvements | 7-40 years | | 607 |
| | 636 |
|
| Furniture, fixtures and equipment | 5-15 years | | 1,613 |
| | 1,598 |
|
| Total premises and equipment, gross | | | 2,246 |
| | 2,267 |
|
| Less: accumulated depreciation | | | 1,651 |
| | 1,675 |
|
| Total premises and equipment, net | | |
| $595 |
| |
| $592 |
|
|
| | | | | | | |
| | December 31, |
| (in millions) | 2015 |
| | 2014 |
|
| Nonperforming assets, net of valuation allowance: | | | |
| Commercial |
| $1 |
| |
| $3 |
|
| Retail | 45 |
| | 39 |
|
| Nonperforming assets, net of valuation allowance |
| $46 |
| |
| $42 |
|
The above table includes capital leases with book valuesNonperforming assets consist primarily of $46 millionother real estate owned and $45 million and related accumulated depreciation of $22 million and $17 million as of December 31, 2014 and 2013, respectively. Depreciation charged to noninterest expense was $117 million, $138 million, and $163 million for the years ended December 31, 2014, 2013, and 2012, respectively, and isare presented in the Consolidated Statements of Operations in occupancy and equipment expense.
The Company entered into a sale-leaseback transaction during 2013, which includes an operating lease for a period of 10 years. There was a $15 million gain recorded in 2013 of which $14 million was deferred. There were no sale-leaseback transactions during 2014 and 2012.
The Company had capitalized software assets, net of amortization, of $754 million and $729 million as of December 31, 2014 and 2013, respectively. Amortization expense was $145 million, $102 million, and $77 million for the years ended December 31, 2014, 2013, and 2012, respectively. Capitalized software assets are reported as a component of other assets inon the Consolidated Balance Sheets.
A summary of key performance indicators is as follows:
|
| | | | | |
| | December 31, |
| | 2015 |
| | 2014 |
|
| Nonperforming commercial loans and leases as a percentage of total loans and leases | 0.15 | % | | 0.18 | % |
| Nonperforming retail loans as a percentage of total loans and leases | 0.92 |
| | 1.00 |
|
| Total nonperforming loans and leases as a percentage of total loans and leases | 1.07 | % | | 1.18 | % |
| | | | |
| Nonperforming commercial assets as a percentage of total assets | 0.11 | % | | 0.13 | % |
| Nonperforming retail assets as a percentage of total assets | 0.69 |
| | 0.73 |
|
| Total nonperforming assets as a percentage of total assets | 0.80 | % | | 0.86 | % |
The following is an analysis of the age of the past due amounts (accruing and nonaccruing):
|
| | | | | | | | | | | | | | | | | | | |
| | December 31, 2015 | | December 31, 2014 |
| (in millions) | 30-89 Days Past Due | 90 Days or More Past Due | Total Past Due | | 30-89 Days Past Due | 90 Days or More Past Due | Total Past Due |
| Commercial |
| $13 |
|
| $71 |
|
| $84 |
| |
| $57 |
|
| $114 |
|
| $171 |
|
| Commercial real estate | 33 |
| 77 |
| 110 |
| | 26 |
| 50 |
| 76 |
|
| Leases | 10 |
| — |
| 10 |
| | 3 |
| — |
| 3 |
|
| Total commercial | 56 |
| 148 |
| 204 |
| | 86 |
| 164 |
| 250 |
|
| Residential mortgages | 70 |
| 246 |
| 316 |
| | 97 |
| 269 |
| 366 |
|
| Home equity loans | 44 |
| 104 |
| 148 |
| | 60 |
| 145 |
| 205 |
|
| Home equity lines of credit | 80 |
| 205 |
| 285 |
| | 73 |
| 198 |
| 271 |
|
Home equity loans serviced by others (1) | 20 |
| 20 |
| 40 |
| | 26 |
| 23 |
| 49 |
|
Home equity lines of credit serviced by others (1) | 16 |
| 29 |
| 45 |
| | 10 |
| 19 |
| 29 |
|
| Automobile | 159 |
| 35 |
| 194 |
| | 93 |
| 16 |
| 109 |
|
| Student | 30 |
| 41 |
| 71 |
| | 25 |
| 17 |
| 42 |
|
| Credit cards | 20 |
| 16 |
| 36 |
| | 22 |
| 17 |
| 39 |
|
| Other retail | 12 |
| 5 |
| 17 |
| | 18 |
| 4 |
| 22 |
|
| Total retail | 451 |
| 701 |
| 1,152 |
| | 424 |
| 708 |
| 1,132 |
|
| Total |
| $507 |
|
| $849 |
|
| $1,356 |
| |
| $510 |
|
| $872 |
|
| $1,382 |
|
(1) The Company’s SBO portfolio consists of purchased home equity loans and lines that were originally serviced by others. The Company now services a portion of this portfolio internally.
CITIZENS FINANCIAL GROUP, INC.
NOTES TO CONSOLIDATED FINANCIAL STATEMENTS
Impaired loans include: (1) nonaccruing larger balance commercial loans (greater than $3 million carrying value); and (2) commercial and retail TDRs. The estimated future amortization expense for capitalized software assetsfollowing is as follows:a summary of impaired loan information by class:
|
| | | |
| Year | (in millions) |
|
| 2015 |
| $127 |
|
| 2016 | 110 |
|
| 2017 | 93 |
|
| 2018 | 72 |
|
| 2019 | 41 |
|
| Thereafter | 130 |
|
Total (1) |
| $573 |
|
|
| | | | | | | | | | | | | | | |
| December 31, 2015 |
| (in millions) | Impaired Loans With a Related Allowance | Allowance on Impaired Loans | Impaired Loans Without a Related Allowance | Unpaid Contractual Balance | Total Recorded Investment in Impaired Loans |
| Commercial |
| $92 |
|
| $23 |
|
| $58 |
|
| $144 |
|
| $150 |
|
| Commercial real estate | 56 |
| 13 |
| 12 |
| 70 |
| 68 |
|
| Total commercial | 148 |
| 36 |
| 70 |
| 214 |
| 218 |
|
| Residential mortgages | 121 |
| 16 |
| 320 |
| 608 |
| 441 |
|
| Home equity loans | 85 |
| 11 |
| 139 |
| 283 |
| 224 |
|
| Home equity lines of credit | 27 |
| 2 |
| 167 |
| 234 |
| 194 |
|
Home equity loans serviced by others (1) | 50 |
| 8 |
| 24 |
| 88 |
| 74 |
|
Home equity lines of credit serviced by others (1) | 3 |
| 1 |
| 7 |
| 14 |
| 10 |
|
| Automobile | 3 |
| — |
| 11 |
| 19 |
| 14 |
|
| Student | 163 |
| 48 |
| 2 |
| 165 |
| 165 |
|
| Credit cards | 28 |
| 11 |
| — |
| 28 |
| 28 |
|
| Other retail | 13 |
| 4 |
| 2 |
| 18 |
| 15 |
|
| Total retail | 493 |
| 101 |
| 672 |
| 1,457 |
| 1,165 |
|
| Total |
| $641 |
|
| $137 |
|
| $742 |
|
| $1,671 |
|
| $1,383 |
|
(1) Excluded from this balance is $181 millionThe Company’s SBO portfolio consists of in-process software at December 31, 2014.
NOTE 7 - LEASE COMMITMENTS
purchased home equity loans and lines that were originally serviced by others. The Company is committed under long-term leases for the rentalnow services a portion of premises and equipment. These leases have varying renewal options and require, in certain instances, the payment of insurance, real estate taxes and other operating expenses.
At December 31, 2014, the aggregate minimum rental commitments under these non-cancelable operating leases and capital leases, exclusive of renewals, are as follows for the years ended December 31:this portfolio internally.
|
| | | | | | | |
| (in millions) | Operating Leases | | Capital Leases |
| 2015 |
| $162 |
| |
| $8 |
|
| 2016 | 148 |
| | 7 |
|
| 2017 | 124 |
| | 6 |
|
| 2018 | 92 |
| | 2 |
|
| 2019 | 59 |
| | 1 |
|
| Thereafter | 167 |
| | 9 |
|
| Total minimum lease payments |
| $752 |
| |
| $33 |
|
| Amounts representing interest | N/A |
| | (9 | ) |
| Present value of net minimum lease payments | N/A |
| |
| $24 |
|
|
| | | | | | | | | | | | | | | |
| | December 31, 2014 |
| (in millions) | Impaired Loans With a Related Allowance | Allowance on Impaired Loans | Impaired Loans Without a Related Allowance | Unpaid Contractual Balance | Total Recorded Investment in Impaired Loans |
| Commercial |
| $124 |
|
| $19 |
|
| $36 |
|
| $178 |
|
| $160 |
|
| Commercial real estate | 7 |
| 1 |
| 38 |
| 62 |
| 45 |
|
| Total commercial | 131 |
| 20 |
| 74 |
| 240 |
| 205 |
|
| Residential mortgages | 157 |
| 18 |
| 288 |
| 605 |
| 445 |
|
| Home equity loans | 129 |
| 11 |
| 141 |
| 335 |
| 270 |
|
| Home equity lines of credit | 75 |
| 3 |
| 86 |
| 193 |
| 161 |
|
Home equity loans serviced by others (1) | 75 |
| 9 |
| 16 |
| 102 |
| 91 |
|
Home equity lines of credit serviced by others (1) | 4 |
| 1 |
| 7 |
| 14 |
| 11 |
|
| Automobile | 2 |
| 1 |
| 9 |
| 16 |
| 11 |
|
| Student | 167 |
| 48 |
| — |
| 167 |
| 167 |
|
| Credit cards | 32 |
| 13 |
| — |
| 32 |
| 32 |
|
| Other retail | 17 |
| 5 |
| 3 |
| 23 |
| 20 |
|
| Total retail | 658 |
| 109 |
| 550 |
| 1,487 |
| 1,208 |
|
| Total |
| $789 |
|
| $129 |
|
| $624 |
|
| $1,727 |
|
| $1,413 |
|
Rental expense for such leases for the years ended December 31, 2014, 2013, and 2012 totaled $214 million, $224 million, and $203 million, respectively, and is presented in the Consolidated Statements of Operations in occupancy and equipment expense.
NOTE 8 - GOODWILL
Goodwill represents the excess of fair value(1) The Company’s SBO portfolio consists of purchased assets over the purchase price. Since 1988, thehome equity loans and lines that were originally serviced by others. The Company has completed more than 25 acquisitionsnow services a portion of banks or assets of banks. The changes in the carrying value of goodwill for the years ended December 31, 2014 and 2013 were:
|
| | | | | | | | | | | |
| (in millions) | Consumer Banking | | Commercial Banking | | Total |
|
| Balance at December 31, 2012 |
| $6,393 |
| |
| $4,918 |
| |
| $11,311 |
|
| Impairment losses based on results of interim impairment testing | (4,435 | ) | | — |
| | (4,435 | ) |
| Transfers | 178 |
| | (178 | ) | | — |
|
| Balance at December 31, 2013 |
| $2,136 |
| |
| $4,740 |
| |
| $6,876 |
|
| Adjustments | — |
| | — |
| | — |
|
| Balance at December 31, 2014 |
| $2,136 |
| |
| $4,740 |
| |
| $6,876 |
|
CITIZENS FINANCIAL GROUP, INC.
NOTES TO CONSOLIDATED FINANCIAL STATEMENTS
Accumulated impairment losses related to the Consumer Banking reporting unit totaled $5.9 billion at December 31, 2014 and 2013. The accumulated impairment losses related to the Commercial Banking unit totaled $50 million at December 31, 2014 and 2013.
The Company performs an annual test for impairment of goodwill at a level of reporting referred to as a reporting unit. The Company has identified and allocated goodwill to the following reporting units based upon reviews of the structure of the Company's executive team and supporting functions, resource allocations and financial reporting processes:
Consumer Banking
Commercial Banking
The Company tested the value of goodwill as of June 30, 2013, and recorded an impairment charge of $4.4 billion relating to the Consumer Banking reporting unit. The impairment charge, which was a non-cash item, had minimal impactAdditional information on the Company's regulatory capital ratios and liquidity, and for segment reporting purposes was included in Other. Refer to Note 23 “Business Segments” for further information regarding segment reporting. No impairment was recorded in 2014 and 2012.
The valuation of goodwill is dependent on forward-looking expectations related to the performance of the U.S. economy and the associated financial performance of the Company. The prolonged delay in the full recovery of the U.S. economy, and the impact of that delay on earnings expectations, prompted a goodwill impairment test as of June 30, 2013. Although the U.S. economy had demonstrated signs of recovery, notably improvements in unemployment and housing, the pace and extent of these indicators, as well as in overall GDP, lagged previous expectations. The impact of the slow recovery was most evident in the Company's Consumer Banking reporting unit. Forecasted economic growth for the U.S., coupled with the continuing impact of the new regulatory framework in the financial industry, resulted in a deceleration of expected growth for the Consumer Banking reporting unit's future profits and an associated goodwill impairment. Refer to Note 1 “Significant Accounting Policies” for further information regarding the impairment test.
NOTE 9 - MORTGAGE BANKING
In its mortgage banking business, the Company sells residential mortgages to government-sponsored entities and other parties, who may issue securities backed by pools of such loans. The Company retains no beneficial interests in these sales, but may retain the servicing rights of theimpaired loans sold. The Company is obligated to subsequently repurchase a loan if the purchaser discovers a standard representation or warranty violation such as noncompliance with eligibility requirements, customer fraud, or servicing violations. This primarily occurs during a loan file review.
The Company received $1.6 billion, $4.2 billion, and $5.4 billion of proceeds from the sale of residential mortgages for the years ended December 31, 2014, 2013 and 2012, respectively, and recognized gains on such sales of $36 million, $66 million, and $123 million for the years ended December 31, 2014, 2013 and 2012, respectively. Pursuant to the standard representations and warranties obligations discussed in the preceding paragraph, the Company repurchased mortgage loans totaling $25 million, $35 million, and $13 million for the years ended December 31, 2014, 2013 and 2012, respectively.
Mortgage servicing fees, a component of mortgage banking income, were $59 million, $61 million, and $60 million for the years ended December 31, 2014, 2013 and 2012, respectively. The Company recorded valuation recoveries of $5 million and $47 million and an impairment of $12 million for its MSRs for the years ended December 31, 2014, 2013 and 2012, respectively.
CITIZENS FINANCIAL GROUP, INC.
NOTES TO CONSOLIDATED FINANCIAL STATEMENTS
Changes related to MSRs were as follows:
|
| | | | | | | | | | | |
| | Year Ended December 31, |
| (in millions) | 2014 |
| | 2013 |
| | 2012 |
|
| MSRs: | | | | | |
| Balance as of January 1 |
| $208 |
| |
| $215 |
| |
| $215 |
|
| Amount capitalized | 17 |
| | 45 |
| | 67 |
|
| Amortization | (41 | ) | | (52 | ) | | (67 | ) |
| Carrying amount before valuation allowance | 184 |
| | 208 |
| | 215 |
|
| Valuation allowance for servicing assets: | | | | | |
| Balance as of January 1 | 23 |
| | 70 |
| | 58 |
|
| Valuation (recovery) impairment | (5 | ) | | (47 | ) | | 12 |
|
| Balance at end of period | 18 |
| | 23 |
| | 70 |
|
| Net carrying value of MSRs |
| $166 |
| |
| $185 |
| |
| $145 |
|
MSRs are presented in other assets on the Consolidated Balance Sheets.
The fair value of MSRs is estimated using a valuation model that calculates the present value of estimated future net servicing cash flows, taking into consideration actual and expected mortgage loan prepayment rates, discount rates, contractual servicing fee income, servicing costs, default rates, ancillary income, and other economic factors, which are determined based on current market conditions. The valuation model uses a static discounted cash flow methodology incorporating current market interest rates. A static model does not attempt to forecast or predict the future direction of interest rates; rather it estimates the amount and timing of future servicing cash flows using current market interest rates. The current mortgage interest rate influences the expected prepayment rate and therefore, the length of the cash flows associated with the servicing asset, while the discount rate determines the present value of those cash flows. Expected mortgage loan prepayment assumptions are obtained using the QRM Multi Component prepayment model. The Company periodically obtains third-party valuations of its MSRs to assess the reasonableness of the fair value calculated by the valuation model.
The key economic assumptions used to estimate the value of MSRs are presented in the following table:
|
| | | | | | | |
| | Year Ended December 31, |
| (dollars in millions) | 2014 | | 2013 |
| Fair value |
| $179 |
| |
| $195 |
|
| Weighted average life (in years) | 5.2 | | 5.4 |
| Weighted average constant prepayment rate | 12.4 | % | | 13.0 | % |
| Weighted average discount rate | 9.8 | % | | 10.8 | % |
The key economic assumptions used in estimating the fair value of MSRs capitalized during the period were as follows:
|
| | | | | | | | |
| | Year Ended December 31, |
| | 2014 | | 2013 | | 2012 |
| Weighted average life (in years) | 5.8 | | 6.0 | | 4.0 |
| Weighted average constant prepayment rate | 11.7 | % | | 12.4 | % | | 20.7 | % |
| Weighted average discount rate | 10.3 | % | | 10.5 | % | | 10.5 | % |
CITIZENS FINANCIAL GROUP, INC.
NOTES TO CONSOLIDATED FINANCIAL STATEMENTS
The sensitivity analysis below as of December 31, 2014 and 2013, presents the impact to current fair value of an immediate 50 basis points and 100 basis points adverse change in the key economic assumptions and presents the decline in fair value that would occur if the adverse change were realized. These sensitivities are hypothetical. The effect of a variation in a particular assumption on the fair value of the mortgage servicing rights is calculated independently without changing any other assumption. In reality, changes in one factor may result in changes in another (for example, changes in interest rates, which drive changes in prepayment speeds, could result in changes in the discount rates), which might amplify or counteract the sensitivities. The primary risk inherent in the Company’s MSRs is an increase in prepayments of the underlying mortgage loans serviced, which is dependent upon market movements of interest rates.
|
| | | | | | | | | | | |
| | Year Ended December 31, |
| (in millions) | 2014 |
| | 2013 |
| | 2012 |
|
| Prepayment rate: | | | | | |
| Decline in fair value from 50 basis points adverse change in interest rates |
| $9 |
| |
| $9 |
| |
| $11 |
|
| Decline in fair value from 100 basis points adverse change in interest rates |
| $15 |
| |
| $18 |
| |
| $18 |
|
| Weighted average discount rate: | | | | | |
| Decline in fair value from 50 basis points adverse change |
| $3 |
| |
| $3 |
| |
| $2 |
|
| Decline in fair value from 100 basis points adverse change |
| $6 |
| |
| $6 |
| |
| $4 |
|
NOTE 10 - DEPOSITS
The major components of deposits are as follows:
|
| | | | | | | |
| | December 31, |
| (in millions) | 2014 |
| | 2013 |
|
| Demand |
| $26,086 |
| |
| $24,931 |
|
| Checking with interest | 16,394 |
| | 13,630 |
|
| Regular savings | 7,824 |
| | 7,509 |
|
| Money market accounts | 33,345 |
| | 31,245 |
|
| Term deposits | 12,058 |
| | 9,588 |
|
| Total deposits |
| $95,707 |
| |
| $86,903 |
|
Excluded from the table above are deposits totaling $5.3 billion, that were reclassified to deposits held for sale at December 31, 2013. For further discussion, see Note 17 “Divestitures and Branch Assets and Liabilities Held for Sale.”
The maturity distribution of term deposits as of December 31, 2014 is as follows:
|
| | | |
| Year | (in millions) |
|
| 2015 |
| $8,278 |
|
| 2016 | 2,796 |
|
| 2017 | 425 |
|
| 2018 | 427 |
|
| 2019 | 125 |
|
| 2020 and thereafter | 7 |
|
| Total |
| $12,058 |
|
CITIZENS FINANCIAL GROUP, INC.
NOTES TO CONSOLIDATED FINANCIAL STATEMENTS
Of these deposits, the amount of term deposits with a denomination of $100,000 or more was $6.4 billion at December 31, 2014. The remaining maturities of these deposits are as follows:
|
| | | |
| (in millions) |
|
Three months or less |
| $3,244 |
|
After three months through six months | 454 |
|
After six months through twelve months | 1,091 |
|
After twelve months | 1,572 |
|
Total term deposits |
| $6,361 |
|
NOTE 11 - BORROWED FUNDS
The following is a summary of the Company’s short-term borrowed funds: |
| | | | | | | |
| | December 31, |
| (in millions) | 2014 |
| | 2013 |
|
| Federal funds purchased |
| $574 |
| |
| $689 |
|
| Securities sold under agreements to repurchase | 3,702 |
| | 4,102 |
|
| Other short-term borrowed funds | 6,253 |
| | 2,251 |
|
| Total short-term borrowed funds |
| $10,529 |
| |
| $7,042 |
|
Key data related to short-term borrowed funds is presented in the following table:
|
| | | | | | | | | | | |
| | As of and for the Year Ended December 31, |
| (dollars in millions) | 2014 | | 2013 | | 2012 |
| Weighted-average interest rate at year-end: | | | | | |
| Federal funds purchased and securities sold under agreements to repurchase | 0.14 | % | | 0.09 | % | | 0.10 | % |
| Other short-term borrowed funds | 0.26 |
| | 0.20 |
| | 0.29 |
|
| Maximum amount outstanding at month-end during the year: | | | | | |
| Federal funds purchased and securities sold under agreements to repurchase |
| $7,022 |
| |
| $5,114 |
| |
| $4,393 |
|
| Other short-term borrowed funds | 7,702 |
| | 2,251 |
| | 5,050 |
|
| Average amount outstanding during the year: | | | | | |
| Federal funds purchased and securities sold under agreements to repurchase |
| $5,699 |
| |
| $2,400 |
| |
| $2,716 |
|
| Other short-term borrowed funds | 5,640 |
| | 251 |
| | 3,026 |
|
| Weighted-average interest rate during the year: | | | | | |
| Federal funds purchased and securities sold under agreements to repurchase | 0.12 | % | | 0.31 | % | | 0.22 | % |
| Other short-term borrowed funds | 0.25 |
| | 0.44 |
| | 0.33 |
|
CITIZENS FINANCIAL GROUP, INC.
NOTES TO CONSOLIDATED FINANCIAL STATEMENTS
The following is a summary of the Company’s long-term borrowed funds:
|
| | | | | | | |
| | December 31, |
| (in millions) | 2014 |
| | 2013 |
|
| Citizens Financial Group, Inc.: | | | |
| 4.150% fixed rate subordinated debt, due 2022 |
| $350 |
| |
| $350 |
|
5.158% fixed-to-floating rate subordinated debt, (LIBOR + 3.56%) callable, due 2023 (1) | 333 |
| | 333 |
|
4.771% fixed rate subordinated debt, due 2023 (1) | 333 |
| | 333 |
|
4.691% fixed rate subordinated debt, due 2024 (1) | 334 |
| | 334 |
|
4.153% fixed rate subordinated debt, due 2024 (1) | 333 |
| | — |
|
4.023% fixed rate subordinated debt, due 2024 (1) | 333 |
| | — |
|
4.082% fixed rate subordinated debt, due 2025 (1) | 334 |
| | — |
|
| Banking Subsidiaries: | | | |
1.600% senior unsecured notes, due 2017 (2) | 750 |
| | — |
|
2.450% senior unsecured notes, due 2019 (2) (3) | 746 |
| | — |
|
| Federal Home Loan advances due through 2033 | 772 |
| | 25 |
|
| Other | 24 |
| | 30 |
|
| Total long-term borrowed funds |
| $4,642 |
| |
| $1,405 |
|
|
| | | | | | | | | | | | | | | | | | | | |
| | Year Ended December 31, |
| | 2015 | | 2014 | | 2013 |
| (in millions) | Interest Income Recognized | Average Recorded Investment | | Interest Income Recognized | Average Recorded Investment | | Interest Income Recognized | Average Recorded Investment |
| Commercial |
| $4 |
|
| $135 |
| |
| $9 |
|
| $198 |
| |
| $1 |
|
| $157 |
|
| Commercial real estate | 1 |
| 44 |
| | 2 |
| 98 |
| | 1 |
| 149 |
|
| Total commercial | 5 |
| 179 |
| | 11 |
| 296 |
| | 2 |
| 306 |
|
| Residential mortgages | 15 |
| 415 |
| | 14 |
| 429 |
| | 7 |
| 419 |
|
| Home equity loans | 9 |
| 222 |
| | 8 |
| 246 |
| | 5 |
| 228 |
|
| Home equity lines of credit | 4 |
| 173 |
| | 4 |
| 149 |
| | 2 |
| 90 |
|
Home equity loans serviced by others (1) | 4 |
| 75 |
| | 5 |
| 91 |
| | 5 |
| 102 |
|
Home equity lines of credit serviced by others (1) | — |
| 9 |
| | — |
| 11 |
| | — |
| 12 |
|
| Automobile | — |
| 11 |
| | — |
| 7 |
| | — |
| 8 |
|
| Student | 7 |
| 157 |
| | 8 |
| 153 |
| | 7 |
| 140 |
|
| Credit cards | 2 |
| 26 |
| | 2 |
| 31 |
| | 3 |
| 41 |
|
| Other retail | 1 |
| 16 |
| | 1 |
| 21 |
| | 1 |
| 25 |
|
| Total retail | 42 |
| 1,104 |
| | 42 |
| 1,138 |
| | 30 |
| 1,065 |
|
| Total |
| $47 |
|
| $1,283 |
| |
| $53 |
|
| $1,434 |
| |
| $32 |
|
| $1,371 |
|
(1)Intercompany borrowed funds with RBS Group. See Note 18 “Related Party Transactions” for further information.
(2) These securities were offered under CBNA's Global Bank Note Program dated December 1, 2014.
(3) $750 million principal balance of unsecured notes presented net of $4 million hedge of interest rate risk on medium term debt using interest rate swaps. See Note 15 “Derivatives” for further information.
Advances, lines of credit, and letters of credit from the FHLB are collateralized by pledged mortgages and pledged securities at least sufficient to satisfy the collateral maintenance level established by the FHLB. The utilized borrowing capacity for FHLB advances and letters of credit was $11.3 billionand $4.2 billion at December 31, 2014 and 2013, respectively. The Company’s available FHLB borrowing capacity was $3.5 billionSBO portfolio consists of purchased home equity loans and $8.2 billion at December 31, 2014 and 2013, respectively.lines that were originally serviced by others. The Company can also borrow from the FRB discount window to meet short-term liquidity requirements. Collateral, such as investment securities and loans, is pledged to provide borrowing capacity at the FRB. At December 31, 2014, the Company’s unused secured borrowing capacity was approximately $26.3 billion, which includes free securities, FHLB borrowing capacity, and FRB discount window capacity.now services a portion of this portfolio internally.
The following is a summary of maturities for the Company’s long-term borrowed funds at December 31, 2014:
|
| | | |
| Year | (in millions) |
|
| 2015 or on demand |
| $— |
|
| 2016 | 755 |
|
| 2017 | 762 |
|
| 2018 | 11 |
|
| 2019 | 747 |
|
| 2020 and thereafter | 2,367 |
|
| Total |
| $4,642 |
|
NOTE 12 - STOCKHOLDERS' EQUITY
Preferred Stock
As of December 31, 2014, the Company had authorized 100,000,000 shares of $25.00 par value undesignated preferred stock. These undesignated shares were authorized on April 9, 2014, by resolution of the Company's Board of Directors (the “Board of Directors”). The Board of Directors or any authorized committee thereof are authorized to provide for the issuance of these
CITIZENS FINANCIAL GROUP, INC.
NOTES TO CONSOLIDATED FINANCIAL STATEMENTS
shares in one or more series, and by filing a certificate pursuant to applicable law of the State of Delaware, to establish or change from time to time the number of shares of each such series, and to fix the designations, powers, including voting powers, full or limited, or no voting powers, preferences and the relative, participating, optional or other special rights of the shares of each series and any qualifications, limitations and restrictions thereof.
Prior to April 9, 2014, the Company had authorized 30,000 shares of $1.00 par value non-cumulative, non-voting perpetual preferred stock. That preferred stock ranked senior to the common stock of the Company with respect to dividend rights upon liquidation or dissolution of the Company. The stock was not convertible into any other property of the Company, nor was it redeemable by either the Company or the holder thereof. Dividends were non-cumulative and were payable quarterly at LIBOR plus 180 basis points, if and when declared by the Board of Directors. In the event of any liquidation, dissolution or winding up of the Company, holders of each share of the preferred stock outstanding were entitled to be paid, out of the assets of the Company available for distribution to stockholders, before any payment was made to the holders of common stock, an amount equal to $100,000 per share of preferred stock then issued and outstanding.
There were no shares of preferred stock issued and outstanding during 2014 or 2013.
Treasury Stock
The purchase of the Company’s common stock is recorded at cost. At the date of retirement or subsequent reissuance, treasury stock is reduced by the cost of such stock on the first-in, first-out basis with differences recorded in additional paid-in capital or retained earnings, as applicable.
Revenue Recognition
Revenue is recognized to the extent that it is probable that the economic benefits will flow to the Company and the revenue can be reliably measured.
Interest income on loans and securities classified as AFS or HTM is determined using the effective interest method. This method calculates periodic interest income at a constant effective yield on the net investment in the loan or security, to provide a constant rate of return over the terms of the financial assets. Securities classified as trading account assets, and other financial assets accounted for using the fair value option, are measured at fair value with corresponding changes recognized in noninterest income.
Loan commitment fees for loans that are likely to be drawn down, and other credit related fees, are deferred (together with any incremental costs) and recognized as an adjustment to the effective interest rate on the loan. When it is unlikely that a loan will be drawn down, the loan commitment fees are recognized over the commitment period on a straight-line basis.
Other types of noninterest revenues, such as service charges on deposits, interchange income on credit cards and trust revenues, are accrued and recognized into income as services are provided and the amount of fees earned are reasonably determinable.
CITIZENS FINANCIAL GROUP, INC.
NOTES TO CONSOLIDATED FINANCIAL STATEMENTS
Earnings Per Share
Basic EPS is computed by dividing net income/(loss) available to common stockholders by the weighted-average number of common shares outstanding during each period. Net income/(loss) available to common stockholders represents net income after preferred stock dividends, accretion of the discount on preferred stock issuances, and gains or losses from any repurchases of preferred stock. Diluted EPS is computed by dividing net income/(loss) available to common stockholders by the weighted-average number of common shares outstanding during each period, plus potential dilutive shares such as call options, share-based payment awards, and warrants using the treasury stock method.
Recent Accounting Pronouncements
In February 2016, the FASB issued ASU 2016-02 “Leases”. The ASU generally requires lessees to recognize a right-of-use asset and corresponding lease liability for all leases with a lease term of greater than one year. The ASU is effective for the Company beginning on January 1, 2019. The Company is currently assessing the impact of this guidance on the Company’s Consolidated Financial Statements.
In January 2016, the FASB issued ASU No. 2016-01 “Recognition and Measurement of Financial Assets and Financial Liabilities.” The ASU requires equity investments (except for those accounted for under the equity method of accounting or those that result in consolidation of the investee) to be measured at fair value with changes in the fair value recognized through net income. The ASU also requires separate presentation of financial assets and financial liabilities by measurement category and form of financial assets on the balance sheet or the notes to the financial statements. In addition, the ASU makes several other targeted amendments to the existing accounting and disclosure requirements for financial instruments, including revised guidance related to valuation allowance assessments when recognizing deferred tax assets on unrealized losses on available-for-sale debt securities. The ASU is effective for the Company beginning on January 1, 2018. The Company is currently assessing the impact of this guidance on the Company’s Consolidated Financial Statements.
In August 2015, the FASB issued ASU No. 2015-15 “Interest - Imputation of Interest: Presentation and Subsequent Measurement of Debt Issuance Costs Associated with Line-Of-Credit Arrangements.” The ASU incorporates guidance from the SEC on deferral of debt issuance costs associated with line-of-credit arrangements, consistent with ASU 2015-03, regardless of whether there are any outstanding borrowings on the line-of-credit arrangement. This new guidance will not have a material impact on the Company’s Consolidated Financial Statements.
In August 2015, the FASB issued ASU No. 2015-14 “Revenue from Contracts with Customers (Topic 606): Deferral of the Effective Date” which defers the effective date of the new revenue standard by one year. As a result of this deferral, the new revenue standard is effective for the Company beginning on January 1, 2018. The Company is currently assessing the impact of this guidance on the Consolidated Financial Statements.
In April 2015, the FASB issued ASU No. 2015-05 “Intangibles - Goodwill and Other - Internal Use Software” which will assist entities in evaluating the accounting for fees paid by a customer in a cloud computing arrangement. The ASU, which allows for early adoption, is effective for the Company beginning on January 1, 2016. Adoption of this guidance is not expected to have a material impact on the Company’s Consolidated Financial Statements.
In April 2015, the FASB issued ASU No. 2015-03 “Interest - Imputation of Interest: Simplifying the Presentation of Debt Issuance Costs”. This standard requires debt issuance costs to be presented in the consolidated balance sheet as a direct deduction from the carrying value of the associated debt liability, consistent with the presentation of a debt discount. The ASU, which allows for early adoption, is effective for the Company beginning on January 1, 2016. Adoption of this guidance is not expected to have a material impact on the Company’s Consolidated Financial Statements.
In February 2015, the FASB issued ASU No. 2015-02 “Consolidation (Topic 810): Amendments to the Consolidation Analysis”. This standard focuses on the consolidation evaluation for reporting organizations that are required to evaluate whether they should consolidate certain legal entities such as limited partnerships, limited liability corporations, and securitization structures (e.g., collateralized debt obligations, collateralized loan obligations, and mortgage-backed security transactions). This new standard simplifies consolidation accounting by reducing the number of consolidation models. The ASU will be effective for the Company beginning on January 1, 2016. Early adoption is permitted, including adoption in an interim period. Adoption of this guidance will not have a material impact on the Company’s Consolidated Financial Statements.
In January 2015, the FASB issued ASU No. 2015-01 “Income Statement: Extraordinary and Unusual Items.” This ASU eliminates from GAAP the concept of extraordinary items. Accounting Standards Codification Subtopic 225-20 required that an entity separately classify, present, and disclose extraordinary events and transactions that were unusual in nature and infrequent in occurrence. This ASU, which allows for early adoption, is effective for the Company beginning on January 1, 2016. The adoption of this guidance is not expected to have a material impact on the Company’s Consolidated Financial Statements.
CITIZENS FINANCIAL GROUP, INC.
NOTE 2 - CASH AND DUE FROM BANKS
The Company’s subsidiary banks maintain certain average reserve balances and compensating balances for check clearing and other services with the FRB. At December 31, 2015 and 2014, the balance of deposits at the FRB amounted to $2.0 billion and $2.1 billion, respectively. Average balances maintained with the FRB during the years ended December 31, 2015, 2014, and 2013 exceeded amounts required by law for the FRB’s requirements. All amounts, both required and excess reserves, held at the FRB currently earn interest at a fixed rate of 50 basis points. As a result, the Company recorded, in interest-bearing deposits in banks, interest income on FRB deposits of $4 million, $5 million, and $5 million for the years ended December 31, 2015, 2014, and 2013, respectively.
NOTE 3 - SECURITIES
The following table provides the major components of securities at amortized cost and fair value:
|
| | | | | | | | | | | | | | | | | | | | | | | | | |
| | December 31, 2015 | | December 31, 2014 |
| (in millions) | Amortized Cost | Gross Unrealized Gains | Gross Unrealized Losses | Fair Value | | Amortized Cost | Gross Unrealized Gains | Gross Unrealized Losses | Fair Value |
| Securities Available for Sale | | | | | |
|
|
|
|
| U.S. Treasury and other |
| $16 |
|
| $— |
|
| $— |
|
| $16 |
| |
| $15 |
|
| $— |
|
| $— |
|
| $15 |
|
| State and political subdivisions | 9 |
| — |
| — |
| 9 |
| | 10 |
| — |
| — |
| 10 |
|
| Mortgage-backed securities: | | | | | | | | | |
| Federal agencies and U.S. government sponsored entities | 17,234 |
| 153 |
| (67 | ) | 17,320 |
| | 17,683 |
| 301 |
| (50 | ) | 17,934 |
|
| Other/non-agency | 555 |
| 4 |
| (37 | ) | 522 |
| | 703 |
| 4 |
| (35 | ) | 672 |
|
| Total mortgage-backed securities | 17,789 |
| 157 |
| (104 | ) | 17,842 |
| | 18,386 |
| 305 |
| (85 | ) | 18,606 |
|
| Total debt securities available for sale | 17,814 |
| 157 |
| (104 | ) | 17,867 |
| | 18,411 |
| 305 |
| (85 | ) | 18,631 |
|
| Marketable equity securities | 5 |
| — |
| — |
| 5 |
| | 10 |
| 3 |
| — |
| 13 |
|
| Other equity securities | 12 |
| — |
| — |
| 12 |
| | 12 |
| — |
| — |
| 12 |
|
| Total equity securities available for sale | 17 |
| — |
| — |
| 17 |
| | 22 |
| 3 |
| — |
| 25 |
|
| Total securities available for sale |
| $17,831 |
|
| $157 |
|
| ($104 | ) |
| $17,884 |
| |
| $18,433 |
|
| $308 |
|
| ($85 | ) |
| $18,656 |
|
| Securities Held to Maturity | | | | | | | | | |
| Mortgage-backed securities: | | | | | | | | | |
| Federal agencies and U.S. government sponsored entities |
| $4,105 |
|
| $27 |
|
| ($11 | ) |
| $4,121 |
| |
| $3,728 |
|
| $22 |
|
| ($31 | ) |
| $3,719 |
|
| Other/non-agency | 1,153 |
| 23 |
| — |
| 1,176 |
| | 1,420 |
| 54 |
| — |
| 1,474 |
|
| Total securities held to maturity |
| $5,258 |
|
| $50 |
|
| ($11 | ) |
| $5,297 |
| |
| $5,148 |
|
| $76 |
|
| ($31 | ) |
| $5,193 |
|
| Other Investment Securities, at Fair Value | | | | | | | | | |
| Money market mutual fund |
| $65 |
|
| $— |
|
| $— |
|
| $65 |
| |
| $28 |
|
| $— |
|
| $— |
|
| $28 |
|
| Other investments | 5 |
| — |
| — |
| 5 |
| | 5 |
| — |
| — |
| 5 |
|
| Total other investment securities, at fair value |
| $70 |
|
| $— |
|
| $— |
|
| $70 |
| |
| $33 |
|
| $— |
|
| $— |
|
| $33 |
|
| Other Investment Securities, at Cost | | | | | | | | | |
| Federal Reserve Bank stock |
| $468 |
|
| $— |
|
| $— |
|
| $468 |
| |
| $477 |
|
| $— |
|
| $— |
|
| $477 |
|
| Federal Home Loan Bank stock | 395 |
| — |
| — |
| 395 |
| | 390 |
| — |
| — |
| 390 |
|
| Total other investment securities, at cost |
| $863 |
|
| $— |
|
| $— |
|
| $863 |
| |
| $867 |
|
| $— |
|
| $— |
|
| $867 |
|
CITIZENS FINANCIAL GROUP, INC.
NOTES TO CONSOLIDATED FINANCIAL STATEMENTS
The Company has reviewed its securities portfolio for other-than-temporary impairments. The following table presents the net securities impairment losses recognized in earnings:
|
| | | | | | | | | | | |
| | Year Ended December 31, |
| (in millions) | 2015 |
| | 2014 |
| | 2013 |
|
| Other-than-temporary impairment: | | | | | |
| Total other-than-temporary impairment losses |
| ($43 | ) | |
| ($45 | ) | |
| ($49 | ) |
| Portions of loss recognized in other comprehensive income (before taxes) | 36 |
| | 35 |
| | 41 |
|
| Net securities impairment losses recognized in earnings |
| ($7 | ) | |
| ($10 | ) | |
| ($8 | ) |
The following tables summarize those securities whose fair values are below carrying values, segregated by those that have been in a continuous unrealized loss position for less than twelve months and those that have been in a continuous unrealized loss position for twelve months or longer:
|
| | | | | | | | | | | | | | | | | | | | | | | | | | |
| | December 31, 2015 |
| | Less than 12 Months | | 12 Months or Longer | | Total |
| (dollars in millions) | Number of Issues | Fair Value | Gross Unrealized Losses | | Number of Issues | Fair Value | Gross Unrealized Losses | | Number of Issues | Fair Value | Gross Unrealized Losses |
| State and political subdivisions | 1 |
|
| $9 |
|
| $— |
| | — |
|
| $— |
|
| $— |
| | 1 |
|
| $9 |
|
| $— |
|
| US Treasury and other | 1 |
| 15 |
| — |
| | — |
| — |
| — |
| | 1 |
| 15 |
|
| $— |
|
| Mortgage-backed securities: | | | | | | | | | | | |
| Federal agencies and U.S. government sponsored entities | 162 |
| 7,423 |
| (51 | ) | | 36 |
| 819 |
| (27 | ) | | 198 |
| 8,242 |
| (78 | ) |
| Other/non-agency | 2 |
| 9 |
| — |
| | 20 |
| 361 |
| (37 | ) | | 22 |
| 370 |
| (37 | ) |
| Total mortgage-backed securities | 164 |
| 7,432 |
| (51 | ) | | 56 |
| 1,180 |
| (64 | ) | | 220 |
| 8,612 |
| (115 | ) |
| Total | 166 |
|
| $7,456 |
|
| ($51 | ) | | 56 |
|
| $1,180 |
|
| ($64 | ) | | 222 |
|
| $8,636 |
|
| ($115 | ) |
|
| | | | | | | | | | | | | | | | | | | | | | | | | | |
| | December 31, 2014 |
| | Less than 12 Months | | 12 Months or Longer | | Total |
| (dollars in millions) | Number of Issues | Fair Value | Gross Unrealized Losses | | Number of Issues | Fair Value | Gross Unrealized Losses | | Number of Issues | Fair Value | Gross Unrealized Losses |
| State and political subdivisions | — |
|
| $— |
|
| $— |
| | 1 |
|
| $10 |
|
| $— |
| | 1 |
|
| $10 |
|
| $— |
|
| Mortgage-backed securities: |
|
|
|
|
|
| |
|
|
|
|
|
| |
|
|
|
|
|
|
| Federal agencies and U.S. government sponsored entities | 75 |
| 3,282 |
| (24 | ) | | 52 |
| 1,766 |
| (57 | ) | | 127 |
| 5,048 |
| (81 | ) |
| Other/non-agency | 6 |
| 80 |
| (2 | ) | | 17 |
| 397 |
| (33 | ) | | 23 |
| 477 |
| (35 | ) |
| Total mortgage-backed securities | 81 |
| 3,362 |
| (26 | ) | | 69 |
| 2,163 |
| (90 | ) | | 150 |
| 5,525 |
| (116 | ) |
| Total | 81 |
|
| $3,362 |
|
| ($26 | ) | | 70 |
|
| $2,173 |
|
| ($90 | ) | | 151 |
|
| $5,535 |
|
| ($116 | ) |
For each debt security identified with an unrealized loss, the Company reviews the expected cash flows to determine if the impairment in value is temporary or other-than-temporary. If the Company has determined that the present value of the debt security’s expected cash flows is less than its amortized cost basis, an other-than-temporary impairment is deemed to have occurred. The amount of impairment loss that is recognized in current period earnings is dependent on the Company’s intent to sell (or not sell) the debt security.
CITIZENS FINANCIAL GROUP, INC.
NOTES TO CONSOLIDATED FINANCIAL STATEMENTS
If the Company intends to sell the impaired debt security, the impairment loss recognized in current period earnings equals the difference between the debt security’s fair value and its amortized cost. If the Company does not intend to sell the impaired debt security, and it is not likely that the Company will be required to sell the impaired security, the credit-related impairment loss is recognized in current period earnings and equals the difference between the amortized cost of the debt security and the present value of the expected cash flows that have currently been projected.
In addition to these cash flow projections, several other characteristics of each debt security are reviewed when determining whether a credit loss exists and the period over which the debt security is expected to recover. These characteristics include: (1) the type of investment, (2) various market factors affecting the fair value of the security (e.g., interest rates, spread levels, liquidity in the sector, etc.), (3) the length and severity of impairment, and (4) the public credit rating of the instrument.
The Company estimates the portion of loss attributable to credit using a cash flow model. The inputs to this model include prepayment, default and loss severity assumptions that are based on industry research and observed data. The loss projections generated by the model are reviewed on a quarterly basis by a cross-functional governance committee. This governance committee determines whether security impairments are other-than-temporary based on this review.
The following table presents the cumulative credit related losses recognized in earnings on debt securities held by the Company:
|
| | | | | | | | | | | |
| | Year Ended December 31, |
| (in millions) | 2015 |
| | 2014 |
| | 2013 |
|
| Cumulative balance at beginning of period |
| $62 |
| |
| $56 |
| |
| $55 |
|
| Credit impairments recognized in earnings on securities that have been previously impaired | 7 |
| | 10 |
| | 8 |
|
| Reductions due to increases in cash flow expectations on impaired securities | (3 | ) | | (4 | ) | | (7 | ) |
| Cumulative balance at end of period |
| $66 |
| |
| $62 |
| |
| $56 |
|
Cumulative credit losses recognized in earnings for impaired AFS debt securities held as of December 31, 2015, 2014 and 2013 were $66 million, $62 million and $56 million, respectively. There were no credit losses recognized in earnings for the Company’s HTM portfolio as of December 31, 2015, 2014 and 2013. For the years ended December 31, 2015, 2014 and 2013, the Company recognized credit related other-than-temporary impairment losses in earnings of $7 million, $10 million and $8 million, respectively, related to non-agency MBS in the AFS portfolio. There were no credit impaired debt securities sold during the years ended December 31, 2015, 2014 and 2013, respectively. Reductions in credit losses due to increases in cash flow expectations were $3 million, $4 million and $7 million for the years ended December 31, 2015, 2014 and 2013, respectively, and were presented in interest income from investment securities on the Consolidated Statements of Operations. The Company does not currently have the intent to sell these debt securities, and it is not likely that the Company will be required to sell these debt securities prior to the recovery of their amortized cost bases.
The Company has determined that credit losses are not expected to be incurred on the remaining agency and non-agency MBS identified with unrealized losses as of the current reporting date. The unrealized losses on these debt securities reflect the reduced liquidity in the MBS market and the increased risk spreads due to the uncertainty of the U.S. macroeconomic environment. Therefore, the Company has determined that these debt securities are not other-than-temporarily impaired because the Company does not currently have the intent to sell these debt securities, and it is not likely that the Company will be required to sell these debt securities prior to the recovery of their amortized cost bases. Any subsequent increases in the valuation of impaired debt securities do not impact their recorded cost bases. Additionally, as of December 31, 2015, 2014 and 2013, $36 million, $35 million and $41 million respectively, of pre-tax non-credit related losses were deferred in OCI.
CITIZENS FINANCIAL GROUP, INC.
NOTES TO CONSOLIDATED FINANCIAL STATEMENTS
The amortized cost and fair value of debt securities at December 31, 2015 by contractual maturity are shown below. Expected maturities may differ from contractual maturities because issuers may have the right to call or prepay obligations with or without incurring penalties.
|
| | | | | | | | | | | | | | | |
| | Distribution of Maturities |
| (in millions) | 1 Year or Less | 1-5 Years | 5-10 Years | After 10 Years | Total |
|
| Amortized Cost: | | | | | |
| Debt securities available for sale | | | | | |
| U.S. Treasury and other |
| $15 |
|
| $— |
|
| $1 |
|
| $— |
|
| $16 |
|
| State and political subdivisions | — |
| — |
| — |
| 9 |
| 9 |
|
| Mortgage-backed securities: | | | | | |
| Federal agencies and U.S. government sponsored entities | 4 |
| 52 |
| 1,833 |
| 15,345 |
| 17,234 |
|
| Other/non-agency | — |
| 68 |
| 3 |
| 484 |
| 555 |
|
| Total debt securities available for sale | 19 |
| 120 |
| 1,837 |
| 15,838 |
| 17,814 |
|
| Debt securities held to maturity | | | | | |
| Mortgage-backed securities: | | | | | |
| Federal agencies and U.S. government sponsored entities | — |
| — |
| — |
| 4,105 |
| 4,105 |
|
| Other/non-agency | — |
| — |
| — |
| 1,153 |
| 1,153 |
|
| Total debt securities held to maturity | — |
| — |
| — |
| 5,258 |
| 5,258 |
|
| Total amortized cost of debt securities |
| $19 |
|
| $120 |
|
| $1,837 |
|
| $21,096 |
|
| $23,072 |
|
| | | | | | |
| Fair Value: | | | | | |
| Debt securities available for sale | | | | | |
| U.S. Treasury and other |
| $15 |
|
| $— |
|
| $1 |
|
| $— |
|
| $16 |
|
| State and political subdivisions | — |
| — |
| — |
| 9 |
| 9 |
|
| Mortgage-backed securities: | | | | | |
| Federal agencies and U.S. government sponsored entities | 4 |
| 54 |
| 1,845 |
| 15,417 |
| 17,320 |
|
| Other/non-agency | — |
| 70 |
| 3 |
| 449 |
| 522 |
|
| Total debt securities available for sale | 19 |
| 124 |
| 1,849 |
| 15,875 |
| 17,867 |
|
| Debt securities held to maturity | | | | | |
| Mortgage-backed securities: | | | | | |
| Federal agencies and U.S. government sponsored entities | — |
| — |
| — |
| 4,121 |
| 4,121 |
|
| Other/non-agency | — |
| — |
| — |
| 1,176 |
| 1,176 |
|
| Total debt securities held to maturity | — |
| — |
| — |
| 5,297 |
| 5,297 |
|
| Total fair value of debt securities |
| $19 |
|
| $124 |
|
| $1,849 |
|
| $21,172 |
|
| $23,164 |
|
The following table reports the amounts recognized in interest income from investment securities and interest-bearing deposits in banks on the Consolidated Statements of Operations:
|
| | | | | | | | | |
| | Year Ended December 31, |
| (in millions) | 2015 |
| 2014 |
| 2013 |
|
| Taxable |
| $621 |
|
| $619 |
|
| $477 |
|
| Non-taxable | — |
| — |
| — |
|
| Interest-bearing cash and due from banks and deposits in banks |
| $5 |
|
| $5 |
|
| $11 |
|
| Total interest income from investment securities and interest-bearing deposits in banks |
| $626 |
|
| $624 |
|
| $488 |
|
CITIZENS FINANCIAL GROUP, INC.
NOTES TO CONSOLIDATED FINANCIAL STATEMENTS
Realized gains and losses on securities are shown below:
|
| | | | | | | | | | | |
| | Year Ended December 31, |
| (in millions) | 2015 |
| | 2014 |
| | 2013 |
|
| Gains on sale of debt securities |
| $41 |
| |
| $33 |
| |
| $144 |
|
| Losses on sale of debt securities | (12 | ) | | (5 | ) | | — |
|
| Debt securities gains, net |
| $29 |
| |
| $28 |
| |
| $144 |
|
| Equity securities gains |
| $3 |
| |
| $— |
| |
| $— |
|
Included in the table above is a $2 million gain recognized on the sale of a $73 million mortgage-backed security that was classified as HTM. The HTM security was sold because the holding would have been prohibited under the Volcker Rule beginning in July 2017.
The amortized cost and fair value of securities pledged are shown below:
|
| | | | | | | | | | | | | |
| | December 31, 2015 | | December 31, 2014 |
| (in millions) | Amortized Cost | Fair Value |
| | Amortized Cost | Fair Value |
|
| Pledged against repurchase agreements |
| $805 |
|
| $808 |
| |
| $3,650 |
|
| $3,701 |
|
| Pledged against FHLB borrowed funds | 1,163 |
| 1,186 |
| | 1,355 |
| 1,407 |
|
| Pledged against derivatives, to qualify for fiduciary powers, and to secure public and other deposits as required by law | 3,579 |
| 3,610 |
| | 3,453 |
| 3,520 |
|
The Company regularly enters into security repurchase agreements with unrelated counterparties. Repurchase agreements are financial transactions that involve the transfer of a security from one party to another and a subsequent transfer of the same (or “substantially the same”) security back to the original party. The Company’s repurchase agreements are typically short-term transactions, but they may be extended to longer terms to maturity. Such transactions are accounted for as secured borrowed funds on the Company’s financial statements. When permitted by GAAP, the Company offsets the short-term receivables associated with its reverse repurchase agreements with the short-term payables associated with its repurchase agreements.
The effects of this offsetting on the Consolidated Balance Sheets are presented in the following table:
|
| | | | | | | | | | | | | | | | | | | |
| | December 31, 2015 | | December 31, 2014 |
| (in millions) | Gross Assets (Liabilities) | Gross Assets (Liabilities) Offset | Net Amounts of Assets (Liabilities) | | Gross Assets (Liabilities) | Gross Assets (Liabilities) Offset | Net Amounts of Assets (Liabilities) |
| Securities purchased under agreements to resell |
| $500 |
|
| ($500 | ) |
| $— |
| |
| $— |
|
| $— |
|
| $— |
|
| Securities sold under agreements to repurchase | (500 | ) | 500 |
| — |
| | (2,600 | ) | — |
| (2,600 | ) |
Note: The Company also offsets certain derivative assets and derivative liabilities on the Consolidated Balance Sheets. For further information see Note 16 “Derivatives.”
Securitizations of mortgage loans retained in the investment portfolio for the years ended December 31, 2015, 2014 and 2013, were $3 million, $18 million and $106 million, respectively. These securitizations included a substantive guarantee by a third party. In 2015, the guarantor was Freddie Mac. In 2014 and 2013, the guarantors were Fannie Mae, Ginnie Mae, and Freddie Mac. These securitizations were accounted for as a sale of the transferred loans and as a purchase of securities. The securities received from the guarantors are classified as AFS.
CITIZENS FINANCIAL GROUP, INC.
NOTES TO CONSOLIDATED FINANCIAL STATEMENTS
Securities under the agreements to repurchase or resell are accounted for as secured borrowings. The following table presents the Company's related activity, by collateral type and remaining contractual maturity, at December 31, 2015:
|
| | | | | | | | | | | | | | | |
| | Remaining Contractual Maturity of the Agreements |
| (in millions) | Overnight and Continuous | Up to 30 Days | 30-90 Days | Greater Than 90 Days | Total |
|
| Securities purchased under agreements to resell | | | | | |
| Mortgage-backed securities - Agency |
| $— |
|
| $500 |
|
| $— |
|
| $— |
|
| $500 |
|
| Total securities purchased under agreements to resell |
| $— |
|
| $500 |
|
| $— |
|
| $— |
|
| $500 |
|
| Securities sold under agreements to repurchase | | | | | |
| Mortgage-backed securities - Agency |
| $— |
|
| ($500 | ) |
| $— |
|
| $— |
|
| ($500 | ) |
| Total securities sold under agreement to repurchase |
| $— |
|
| ($500 | ) |
| $— |
|
| $— |
|
| ($500 | ) |
For these securities sold under the agreements to repurchase, the Company would be obligated to provide additional collateral in the event of a significant decline in fair value of the collateral pledged. The Company manages the risk by monitoring the liquidity and credit quality of the collateral, as well as the maturity profile of the transactions.
NOTE 4 - LOANS AND LEASES
A summary of the loans and leases portfolio follows:
|
| | | | | | | |
| | December 31, |
| (in millions) | 2015 |
| | 2014 |
|
| Commercial |
| $33,264 |
| |
| $31,431 |
|
| Commercial real estate | 8,971 |
| | 7,809 |
|
| Leases | 3,979 |
| | 3,986 |
|
| Total commercial | 46,214 |
| | 43,226 |
|
| Residential mortgages | 13,318 |
| | 11,832 |
|
| Home equity loans | 2,557 |
| | 3,424 |
|
| Home equity lines of credit | 14,674 |
| | 15,423 |
|
Home equity loans serviced by others (1) | 986 |
| | 1,228 |
|
Home equity lines of credit serviced by others (1) | 389 |
| | 550 |
|
| Automobile | 13,828 |
| | 12,706 |
|
| Student | 4,359 |
| | 2,256 |
|
| Credit cards | 1,634 |
| | 1,693 |
|
| Other retail | 1,083 |
| | 1,072 |
|
| Total retail | 52,828 |
| | 50,184 |
|
Total loans and leases (2) (3) |
| $99,042 |
| |
| $93,410 |
|
(1) The Company’s SBO portfolio consists of purchased home equity loans and lines that were originally serviced by others. The Company now services a portion of this portfolio internally.
(2) Excluded from the table above are loans held for sale totaling $365 million and $281 million as of December 31, 2015 and 2014, respectively.
(3) Mortgage loans serviced for others by the Company’s subsidiaries are not included above, and amounted to $17.6 billion and $17.9 billion at December 31, 2015 and 2014, respectively.
Loans held for sale at fair value totaled $325 million and $256 million at December 31, 2015 and 2014, respectively, and consisted of residential mortgages originated for sale of $268 million and the commercial trading portfolio of $57 million as of December 31, 2015. As of December 31, 2014, residential mortgages originated for sale were $213 million, and commercial trading portfolio totaled $43 million. Other loans held for sale totaled $40 million and $25 million as of December 31, 2015 and 2014, respectively, and consisted of commercial loan syndications.
Loans pledged as collateral for FHLB borrowed funds totaled $23.2 billion and $22.0 billion at December 31, 2015 and 2014, respectively. This collateral consists primarily of residential mortgages and home equity loans. Loans pledged as collateral
CITIZENS FINANCIAL GROUP, INC.
NOTES TO CONSOLIDATED FINANCIAL STATEMENTS
to support the contingent ability to borrow at the FRB discount window, if necessary, totaled $15.9 billion and $11.8 billion at December 31, 2015 and 2014, respectively.
During the year ended December 31, 2015, the Company purchased automobile loans with an outstanding principal balance of $1.3 billion, a portfolio of residential mortgages with an outstanding principal balance of $1.1 billion, and a portfolio of student loans with an outstanding principal balance of $957 million. During the year ended December 31, 2014, the Company purchased a portfolio of residential loans with an outstanding principal balance of $1.9 billion, a portfolio of auto loans with an outstanding principal balance of $1.7 billion and a portfolio of student loans with an outstanding principal balance of $59 million.
During the year ended December 31, 2015, the Company sold a portfolio of commercial loans with an outstanding principal balance of $401 million as part of the Company’s loan syndication project, residential mortgages with an outstanding principal balance of $273 million, and $41 million of credit card balances associated with a terminated agent credit card servicing agreement. During the year ended December 31, 2014, in addition to the $1.0 billion loans sold as part of the Company's sale of its Chicago-area retail branches, the Company sold portfolios of residential mortgage loans with outstanding principal balances of $126 million and student loans of $357 million, as well as commercial loans with an outstanding principal balance of $301 million.
The Company is engaged in the leasing of equipment for commercial use, with primary lease concentrations to Fortune 1000 companies for large capital equipment acquisitions. A lessee is evaluated from a credit perspective using the same underwriting standards and procedures as for a loan borrower. A lessee is expected to make rental payments based on its cash flows and the viability of its balance sheet. Leases are usually not evaluated as collateral-based transactions, and therefore the lessee’s overall financial strength is the most important credit evaluation factor.
A summary of the investment in leases, before the ALLL, is as follows:
|
| | | | | | | |
| | December 31, |
| (in millions) | 2015 |
| | 2014 |
|
| Direct financing leases |
| $3,898 |
| |
| $3,873 |
|
| Leveraged leases | 81 |
| | 113 |
|
| Total leases |
| $3,979 |
| |
| $3,986 |
|
The components of the investment in leases, before the ALLL, are as follows:
|
| | | | | | | |
| | December 31, |
| (in millions) | 2015 |
| | 2014 |
|
| Total future minimum lease rentals |
| $3,195 |
| |
| $3,324 |
|
| Estimated residual value of leased equipment (non-guaranteed) | 1,157 |
| | 1,059 |
|
| Initial direct costs | 22 |
| | 22 |
|
| Unearned income on minimum lease rentals and estimated residual value of leased equipment | (395 | ) | | (419 | ) |
| Total leases |
| $3,979 |
| |
| $3,986 |
|
At December 31, 2015, the future minimum lease rentals on direct financing and leveraged leases are as follows:
|
| | | |
| Year Ended December 31, | (in millions) |
|
| 2016 |
| $707 |
|
| 2017 | 588 |
|
| 2018 | 528 |
|
| 2019 | 445 |
|
| 2020 | 327 |
|
| Thereafter | 600 |
|
| Total |
| $3,195 |
|
Pre-tax income on leveraged leases was $2 million, $2 million and $3 million for the years ended December 31, 2015, 2014 and 2013, respectively. The income tax expense on this income was $1 million for the years ended December 31, 2015, 2014 and 2013. There was no investment credit recognized in income during these years.
CITIZENS FINANCIAL GROUP, INC.
NOTES TO CONSOLIDATED FINANCIAL STATEMENTS
NOTE 5 - ALLOWANCE FOR CREDIT LOSSES, NONPERFORMING ASSETS, AND CONCENTRATIONS OF CREDIT RISK
The allowance for credit losses consists of the ALLL and the reserve for unfunded commitments. It is increased through a provision for credit losses that is charged to earnings, based on the Company’s quarterly evaluation of the loan portfolio, and is reduced by net charge-offs and the ALLL associated with sold loans. See Note 1 “Significant Accounting Policies” for a detailed discussion of ALLL reserve methodologies and estimation techniques.
On a quarterly basis, the Company reviews and refines its estimate of the allowance for credit losses, taking into consideration changes in portfolio size and composition, historical loss experience, internal risk ratings, current economic conditions, industry performance trends and other pertinent information.
During 2013, the Company modified the way that it establishes the ALLL. The ALLL is reviewed separately for commercial and retail loan portfolios, and the ALLL for each includes an adjustment for qualitative reserves that includes certain risks, factors and events that might not be measured in the statistical analysis. As a result of this change, the unallocated reserve was absorbed into the separately measured commercial and retail qualitative reserves.
Additionally, during December 2013, the Company revised and extended its incurred loss period for certain residential mortgages. This change reflects management's recognition that incurred but unrealized losses emerge differently during various points of an economic/business cycle. Incurred Loss Periods (“ILPs”) are not static and move over time based on several factors. As economies expand and contract, access to credit, jobs, and liquidity moves directionally with the economy. ILPs will be longer in stronger economic times, when borrowers have the financial ability to withstand adversity and the ILPs will be shorter in an adverse economic environment, when the borrower has less financial flexibility. Since the current economy has not been as strong as the economy during the 2002-2006 time period, we believe that ILPs will not be as long, but rather directional to our history. Since overall Company reserves are deemed adequate, there was no need to increase the reserve but rather reallocate some of the general reserves to cover the $96 million incurred loss period increase.
There were no other material changes in assumptions or estimation techniques compared with prior years that impacted the determination of the current year’s ALLL and the reserve for unfunded lending commitments.
The following is a summary of changes in the allowance for credit losses:
|
| | | | | | | | | |
| | Year Ended December 31, 2015 |
| (in millions) | Commercial |
| Retail |
| Total |
|
| Allowance for loan and lease losses as of January 1, 2015 |
| $544 |
|
| $651 |
|
| $1,195 |
|
| Charge-offs | (36 | ) | (444 | ) | (480 | ) |
| Recoveries | 49 |
| 147 |
| 196 |
|
| Net recoveries (charge-offs) | 13 |
| (297 | ) | (284 | ) |
| Provision charged to income | 39 |
| 266 |
| 305 |
|
| Allowance for loan and lease losses as of December 31, 2015 | 596 |
| 620 |
| 1,216 |
|
| Reserve for unfunded lending commitments as of January 1, 2015 | 61 |
| — |
| 61 |
|
| Credit for unfunded lending commitments | (3 | ) | — |
| (3 | ) |
| Reserve for unfunded lending commitments as of December 31, 2015 | 58 |
| — |
| 58 |
|
| Total allowance for credit losses as of December 31, 2015 |
| $654 |
|
| $620 |
|
| $1,274 |
|
CITIZENS FINANCIAL GROUP, INC.
NOTES TO CONSOLIDATED FINANCIAL STATEMENTS
|
| | | | | | | | | |
| | Year Ended December 31, 2014 |
| (in millions) | Commercial |
| Retail |
| Total |
|
| Allowance for loan and lease losses as of January 1, 2014 |
| $498 |
|
| $723 |
|
| $1,221 |
|
| Charge-offs | (43 | ) | (450 | ) | (493 | ) |
| Recoveries | 58 |
| 112 |
| 170 |
|
| Net (charge-offs) recoveries | 15 |
| (338 | ) | (323 | ) |
| Provision charged to income | 31 |
| 266 |
| 297 |
|
| Allowance for loan and lease losses as of December 31, 2014 | 544 |
| 651 |
| 1,195 |
|
| Reserve for unfunded lending commitments as of January 1, 2014 | 39 |
| — |
| 39 |
|
| Provision for unfunded lending commitments | 22 |
| — |
| 22 |
|
| Reserve for unfunded lending commitments as of December 31, 2014 | 61 |
| — |
| 61 |
|
| Total allowance for credit losses as of December 31, 2014 |
| $605 |
|
| $651 |
|
| $1,256 |
|
|
| | | | | | | | | | | | |
| | Year Ended December 31, 2013 |
| (in millions) | Commercial |
| Retail |
| Unallocated |
| Total |
|
| Allowance for loan and lease losses as of January 1, 2013 |
| $509 |
|
| $657 |
|
| $89 |
|
| $1,255 |
|
| Charge-offs | (108 | ) | (595 | ) | — |
| (703 | ) |
| Recoveries | 87 |
| 115 |
| — |
| 202 |
|
| Net charge-offs | (21 | ) | (480 | ) | — |
| (501 | ) |
| Sales/Other | (6 | ) | (6 | ) | (1 | ) | (13 | ) |
| Provision charged to income | (19 | ) | 396 |
| 103 |
| 480 |
|
| Transfer of unallocated reserve to qualitative reserve | 35 |
| 60 |
| (95 | ) | — |
|
| Loss emergence period change | — |
| 96 |
| (96 | ) | — |
|
| Allowance for loan and lease losses as of December 31, 2013 | 498 |
| 723 |
| — |
| 1,221 |
|
| Reserve for unfunded lending commitments as of January 1, 2013 | 40 |
| — |
| — |
| 40 |
|
| Credit for unfunded lending commitments | (1 | ) | — |
| — |
| (1 | ) |
| Reserve for unfunded lending commitments as of December 31, 2013 | 39 |
| — |
| — |
| 39 |
|
| Total allowance for credit losses as of December 31, 2013 |
| $537 |
|
| $723 |
|
| $— |
|
| $1,260 |
|
The recorded investment in loans and leases based on the Company’s evaluation methodology is as follows:
|
| | | | | | | | | | | | | | | | | | | |
| | December 31, 2015 | | December 31, 2014 |
| (in millions) | Commercial |
| Retail |
| Total |
| | Commercial |
| Retail |
| Total |
|
| Individually evaluated |
| $218 |
|
| $1,165 |
|
| $1,383 |
| |
| $205 |
|
| $1,208 |
|
| $1,413 |
|
| Formula-based evaluation | 45,996 |
| 51,663 |
| 97,659 |
| | 43,021 |
| 48,976 |
| 91,997 |
|
| Total |
| $46,214 |
|
| $52,828 |
|
| $99,042 |
| |
| $43,226 |
|
| $50,184 |
|
| $93,410 |
|
The following is a summary of the allowance for credit losses by evaluation method:
|
| | | | | | | | | | | | | | | | | | | |
| | December 31, 2015 | | December 31, 2014 |
| (in millions) | Commercial |
| Retail |
| Total |
| | Commercial |
| Retail |
| Total |
|
| Individually evaluated |
| $36 |
|
| $101 |
|
| $137 |
| |
| $20 |
|
| $109 |
|
| $129 |
|
| Formula-based evaluation | 618 |
| 519 |
| 1,137 |
| | 585 |
| 542 |
| 1,127 |
|
| Allowance for credit losses |
| $654 |
|
| $620 |
|
| $1,274 |
| |
| $605 |
|
| $651 |
|
| $1,256 |
|
CITIZENS FINANCIAL GROUP, INC.
NOTES TO CONSOLIDATED FINANCIAL STATEMENTS
For commercial loans and leases, the Company utilizes regulatory classification ratings to monitor credit quality. Loans with a “pass” rating are those that the Company believes will be fully repaid in accordance with the contractual loan terms. Commercial loans and leases that are “criticized” are those that have some weakness that indicates an increased probability of future loss. For retail loans, the Company primarily uses the loan’s payment and delinquency status to monitor credit quality. The further a loan is past due, the greater the likelihood of future credit loss. These credit quality indicators for both commercial and retail loans are continually updated and monitored.
The recorded investment in classes of commercial loans and leases based on regulatory classification ratings is as follows:
|
| | | | | | | | | | | | | | | |
| | December 31, 2015 |
| | | Criticized | |
| (in millions) | Pass |
| Special Mention |
| Substandard |
| Doubtful |
| Total |
|
| Commercial |
| $31,276 |
|
| $911 |
|
| $1,002 |
|
| $75 |
|
| $33,264 |
|
| Commercial real estate | 8,450 |
| 272 |
| 171 |
| 78 |
| 8,971 |
|
| Leases | 3,880 |
| 55 |
| 44 |
| — |
| 3,979 |
|
| Total |
| $43,606 |
|
| $1,238 |
|
| $1,217 |
|
| $153 |
|
| $46,214 |
|
|
| | | | | | | | | | | | | | | |
| | December 31, 2014 |
| | | Criticized | |
| (in millions) | Pass |
| Special Mention |
| Substandard |
| Doubtful |
| Total |
|
| Commercial |
| $30,022 |
|
| $876 |
|
| $427 |
|
| $106 |
|
| $31,431 |
|
| Commercial real estate | 7,354 |
| 329 |
| 61 |
| 65 |
| 7,809 |
|
| Leases | 3,924 |
| 12 |
| 50 |
| — |
| 3,986 |
|
| Total |
| $41,300 |
|
| $1,217 |
|
| $538 |
|
| $171 |
|
| $43,226 |
|
The recorded investment in classes of retail loans, categorized by delinquency status is as follows:
|
| | | | | | | | | | | | | | | |
| | December 31, 2015 |
| (in millions) | Current |
| 1-29 Days Past Due | 30-89 Days Past Due | 90 Days or More Past Due | Total |
|
| Residential mortgages |
| $12,905 |
|
| $97 |
|
| $70 |
|
| $246 |
|
| $13,318 |
|
| Home equity loans | 2,245 |
| 164 |
| 44 |
| 104 |
| 2,557 |
|
| Home equity lines of credit | 13,982 |
| 407 |
| 80 |
| 205 |
| 14,674 |
|
Home equity loans serviced by others (1) | 886 |
| 60 |
| 20 |
| 20 |
| 986 |
|
Home equity lines of credit serviced by others (1) | 296 |
| 48 |
| 16 |
| 29 |
| 389 |
|
| Automobile | 12,670 |
| 964 |
| 159 |
| 35 |
| 13,828 |
|
| Student | 4,175 |
| 113 |
| 30 |
| 41 |
| 4,359 |
|
| Credit cards | 1,554 |
| 44 |
| 20 |
| 16 |
| 1,634 |
|
| Other retail | 1,013 |
| 53 |
| 12 |
| 5 |
| 1,083 |
|
| Total |
| $49,726 |
|
| $1,950 |
|
| $451 |
|
| $701 |
|
| $52,828 |
|
(1) The Company’s SBO portfolio consists of purchased home equity loans and lines that were originally serviced by others. The Company now services a portion of this portfolio internally.
CITIZENS FINANCIAL GROUP, INC.
NOTES TO CONSOLIDATED FINANCIAL STATEMENTS
|
| | | | | | | | | | | | | | | |
| | December 31, 2014 |
| (in millions) | Current |
| 1-29 Days Past Due | 30-89 Days Past Due | 90 Days or More Past Due | Total |
|
| Residential mortgages |
| $11,352 |
|
| $114 |
|
| $97 |
|
| $269 |
|
| $11,832 |
|
| Home equity loans | 2,997 |
| 222 |
| 60 |
| 145 |
| 3,424 |
|
| Home equity lines of credit | 14,705 |
| 447 |
| 73 |
| 198 |
| 15,423 |
|
Home equity loans serviced by others (1) | 1,101 |
| 78 |
| 26 |
| 23 |
| 1,228 |
|
Home equity lines of credit serviced by others (1) | 455 |
| 66 |
| 10 |
| 19 |
| 550 |
|
| Automobile | 11,839 |
| 758 |
| 93 |
| 16 |
| 12,706 |
|
| Student | 2,106 |
| 108 |
| 25 |
| 17 |
| 2,256 |
|
| Credit cards | 1,615 |
| 39 |
| 22 |
| 17 |
| 1,693 |
|
| Other retail | 985 |
| 65 |
| 18 |
| 4 |
| 1,072 |
|
| Total |
| $47,155 |
|
| $1,897 |
|
| $424 |
|
| $708 |
|
| $50,184 |
|
(1) The Company’s SBO portfolio consists of purchased home equity loans and lines that were originally serviced by others. The Company now services a portion of this portfolio internally.
Nonperforming Assets
A summary of nonperforming loans and leases by class is as follows:
|
| | | | | | | | | | | | | | | | | | | |
| | December 31, 2015 | | December 31, 2014 |
| (in millions) | Nonaccruing | Accruing and 90 Days or More Delinquent | Total Nonperforming Loans and Leases | | Nonaccruing | Accruing and 90 Days or More Delinquent | Total Nonperforming Loans and Leases |
| Commercial |
| $70 |
|
| $1 |
|
| $71 |
| |
| $113 |
|
| $1 |
|
| $114 |
|
| Commercial real estate | 77 |
| — |
| 77 |
| | 50 |
| — |
| 50 |
|
| Leases | — |
| — |
| — |
| | — |
| — |
| — |
|
| Total commercial | 147 |
| 1 |
| 148 |
| | 163 |
| 1 |
| 164 |
|
| Residential mortgages | 331 |
| — |
| 331 |
| | 345 |
| — |
| 345 |
|
| Home equity loans | 135 |
| — |
| 135 |
| | 203 |
| — |
| 203 |
|
| Home equity lines of credit | 272 |
| — |
| 272 |
| | 257 |
| — |
| 257 |
|
Home equity loans serviced by others (1) | 38 |
| — |
| 38 |
| | 47 |
| — |
| 47 |
|
Home equity lines of credit serviced by others (1) | 32 |
| — |
| 32 |
| | 25 |
| — |
| 25 |
|
| Automobile | 42 |
| — |
| 42 |
| | 21 |
| — |
| 21 |
|
| Student | 35 |
| 6 |
| 41 |
| | 11 |
| 6 |
| 17 |
|
| Credit cards | 16 |
| — |
| 16 |
| | 16 |
| 1 |
| 17 |
|
| Other retail | 3 |
| 2 |
| 5 |
| | 5 |
| — |
| 5 |
|
| Total retail | 904 |
| 8 |
| 912 |
| | 930 |
| 7 |
| 937 |
|
| Total |
| $1,051 |
|
| $9 |
|
| $1,060 |
| |
| $1,093 |
|
| $8 |
|
| $1,101 |
|
(1) The Company’s SBO portfolio consists of purchased home equity loans and lines that were originally serviced by others. The Company now services a portion of this portfolio internally.
The recorded investment in mortgage loans collateralized by residential real estate property for which formal foreclosure proceedings are in process was $257 million as of December 31, 2015.
CITIZENS FINANCIAL GROUP, INC.
NOTES TO CONSOLIDATED FINANCIAL STATEMENTS
A summary of other nonperforming assets is as follows:
|
| | | | | | | |
| | December 31, |
| (in millions) | 2015 |
| | 2014 |
|
| Nonperforming assets, net of valuation allowance: | | | |
| Commercial |
| $1 |
| |
| $3 |
|
| Retail | 45 |
| | 39 |
|
| Nonperforming assets, net of valuation allowance |
| $46 |
| |
| $42 |
|
Nonperforming assets consist primarily of other real estate owned and are presented in other assets on the Consolidated Balance Sheets.
A summary of key performance indicators is as follows:
|
| | | | | |
| | December 31, |
| | 2015 |
| | 2014 |
|
| Nonperforming commercial loans and leases as a percentage of total loans and leases | 0.15 | % | | 0.18 | % |
| Nonperforming retail loans as a percentage of total loans and leases | 0.92 |
| | 1.00 |
|
| Total nonperforming loans and leases as a percentage of total loans and leases | 1.07 | % | | 1.18 | % |
| | | | |
| Nonperforming commercial assets as a percentage of total assets | 0.11 | % | | 0.13 | % |
| Nonperforming retail assets as a percentage of total assets | 0.69 |
| | 0.73 |
|
| Total nonperforming assets as a percentage of total assets | 0.80 | % | | 0.86 | % |
The following is an analysis of the age of the past due amounts (accruing and nonaccruing):
|
| | | | | | | | | | | | | | | | | | | |
| | December 31, 2015 | | December 31, 2014 |
| (in millions) | 30-89 Days Past Due | 90 Days or More Past Due | Total Past Due | | 30-89 Days Past Due | 90 Days or More Past Due | Total Past Due |
| Commercial |
| $13 |
|
| $71 |
|
| $84 |
| |
| $57 |
|
| $114 |
|
| $171 |
|
| Commercial real estate | 33 |
| 77 |
| 110 |
| | 26 |
| 50 |
| 76 |
|
| Leases | 10 |
| — |
| 10 |
| | 3 |
| — |
| 3 |
|
| Total commercial | 56 |
| 148 |
| 204 |
| | 86 |
| 164 |
| 250 |
|
| Residential mortgages | 70 |
| 246 |
| 316 |
| | 97 |
| 269 |
| 366 |
|
| Home equity loans | 44 |
| 104 |
| 148 |
| | 60 |
| 145 |
| 205 |
|
| Home equity lines of credit | 80 |
| 205 |
| 285 |
| | 73 |
| 198 |
| 271 |
|
Home equity loans serviced by others (1) | 20 |
| 20 |
| 40 |
| | 26 |
| 23 |
| 49 |
|
Home equity lines of credit serviced by others (1) | 16 |
| 29 |
| 45 |
| | 10 |
| 19 |
| 29 |
|
| Automobile | 159 |
| 35 |
| 194 |
| | 93 |
| 16 |
| 109 |
|
| Student | 30 |
| 41 |
| 71 |
| | 25 |
| 17 |
| 42 |
|
| Credit cards | 20 |
| 16 |
| 36 |
| | 22 |
| 17 |
| 39 |
|
| Other retail | 12 |
| 5 |
| 17 |
| | 18 |
| 4 |
| 22 |
|
| Total retail | 451 |
| 701 |
| 1,152 |
| | 424 |
| 708 |
| 1,132 |
|
| Total |
| $507 |
|
| $849 |
|
| $1,356 |
| |
| $510 |
|
| $872 |
|
| $1,382 |
|
(1) The Company’s SBO portfolio consists of purchased home equity loans and lines that were originally serviced by others. The Company now services a portion of this portfolio internally.
CITIZENS FINANCIAL GROUP, INC.
NOTES TO CONSOLIDATED FINANCIAL STATEMENTS
Impaired loans include: (1) nonaccruing larger balance commercial loans (greater than $3 million carrying value); and (2) commercial and retail TDRs. The following is a summary of impaired loan information by class:
|
| | | | | | | | | | | | | | | |
| December 31, 2015 |
| (in millions) | Impaired Loans With a Related Allowance | Allowance on Impaired Loans | Impaired Loans Without a Related Allowance | Unpaid Contractual Balance | Total Recorded Investment in Impaired Loans |
| Commercial |
| $92 |
|
| $23 |
|
| $58 |
|
| $144 |
|
| $150 |
|
| Commercial real estate | 56 |
| 13 |
| 12 |
| 70 |
| 68 |
|
| Total commercial | 148 |
| 36 |
| 70 |
| 214 |
| 218 |
|
| Residential mortgages | 121 |
| 16 |
| 320 |
| 608 |
| 441 |
|
| Home equity loans | 85 |
| 11 |
| 139 |
| 283 |
| 224 |
|
| Home equity lines of credit | 27 |
| 2 |
| 167 |
| 234 |
| 194 |
|
Home equity loans serviced by others (1) | 50 |
| 8 |
| 24 |
| 88 |
| 74 |
|
Home equity lines of credit serviced by others (1) | 3 |
| 1 |
| 7 |
| 14 |
| 10 |
|
| Automobile | 3 |
| — |
| 11 |
| 19 |
| 14 |
|
| Student | 163 |
| 48 |
| 2 |
| 165 |
| 165 |
|
| Credit cards | 28 |
| 11 |
| — |
| 28 |
| 28 |
|
| Other retail | 13 |
| 4 |
| 2 |
| 18 |
| 15 |
|
| Total retail | 493 |
| 101 |
| 672 |
| 1,457 |
| 1,165 |
|
| Total |
| $641 |
|
| $137 |
|
| $742 |
|
| $1,671 |
|
| $1,383 |
|
(1) The Company’s SBO portfolio consists of purchased home equity loans and lines that were originally serviced by others. The Company now services a portion of this portfolio internally.
|
| | | | | | | | | | | | | | | |
| | December 31, 2014 |
| (in millions) | Impaired Loans With a Related Allowance | Allowance on Impaired Loans | Impaired Loans Without a Related Allowance | Unpaid Contractual Balance | Total Recorded Investment in Impaired Loans |
| Commercial |
| $124 |
|
| $19 |
|
| $36 |
|
| $178 |
|
| $160 |
|
| Commercial real estate | 7 |
| 1 |
| 38 |
| 62 |
| 45 |
|
| Total commercial | 131 |
| 20 |
| 74 |
| 240 |
| 205 |
|
| Residential mortgages | 157 |
| 18 |
| 288 |
| 605 |
| 445 |
|
| Home equity loans | 129 |
| 11 |
| 141 |
| 335 |
| 270 |
|
| Home equity lines of credit | 75 |
| 3 |
| 86 |
| 193 |
| 161 |
|
Home equity loans serviced by others (1) | 75 |
| 9 |
| 16 |
| 102 |
| 91 |
|
Home equity lines of credit serviced by others (1) | 4 |
| 1 |
| 7 |
| 14 |
| 11 |
|
| Automobile | 2 |
| 1 |
| 9 |
| 16 |
| 11 |
|
| Student | 167 |
| 48 |
| — |
| 167 |
| 167 |
|
| Credit cards | 32 |
| 13 |
| — |
| 32 |
| 32 |
|
| Other retail | 17 |
| 5 |
| 3 |
| 23 |
| 20 |
|
| Total retail | 658 |
| 109 |
| 550 |
| 1,487 |
| 1,208 |
|
| Total |
| $789 |
|
| $129 |
|
| $624 |
|
| $1,727 |
|
| $1,413 |
|
(1) The Company’s SBO portfolio consists of purchased home equity loans and lines that were originally serviced by others. The Company now services a portion of this portfolio internally.
CITIZENS FINANCIAL GROUP, INC.
NOTES TO CONSOLIDATED FINANCIAL STATEMENTS
Additional information on impaired loans is as follows:
|
| | | | | | | | | | | | | | | | | | | | |
| | Year Ended December 31, |
| | 2015 | | 2014 | | 2013 |
| (in millions) | Interest Income Recognized | Average Recorded Investment | | Interest Income Recognized | Average Recorded Investment | | Interest Income Recognized | Average Recorded Investment |
| Commercial |
| $4 |
|
| $135 |
| |
| $9 |
|
| $198 |
| |
| $1 |
|
| $157 |
|
| Commercial real estate | 1 |
| 44 |
| | 2 |
| 98 |
| | 1 |
| 149 |
|
| Total commercial | 5 |
| 179 |
| | 11 |
| 296 |
| | 2 |
| 306 |
|
| Residential mortgages | 15 |
| 415 |
| | 14 |
| 429 |
| | 7 |
| 419 |
|
| Home equity loans | 9 |
| 222 |
| | 8 |
| 246 |
| | 5 |
| 228 |
|
| Home equity lines of credit | 4 |
| 173 |
| | 4 |
| 149 |
| | 2 |
| 90 |
|
Home equity loans serviced by others (1) | 4 |
| 75 |
| | 5 |
| 91 |
| | 5 |
| 102 |
|
Home equity lines of credit serviced by others (1) | — |
| 9 |
| | — |
| 11 |
| | — |
| 12 |
|
| Automobile | — |
| 11 |
| | — |
| 7 |
| | — |
| 8 |
|
| Student | 7 |
| 157 |
| | 8 |
| 153 |
| | 7 |
| 140 |
|
| Credit cards | 2 |
| 26 |
| | 2 |
| 31 |
| | 3 |
| 41 |
|
| Other retail | 1 |
| 16 |
| | 1 |
| 21 |
| | 1 |
| 25 |
|
| Total retail | 42 |
| 1,104 |
| | 42 |
| 1,138 |
| | 30 |
| 1,065 |
|
| Total |
| $47 |
|
| $1,283 |
| |
| $53 |
|
| $1,434 |
| |
| $32 |
|
| $1,371 |
|
(1) The Company’s SBO portfolio consists of purchased home equity loans and lines that were originally serviced by others. The Company now services a portion of this portfolio internally.
Troubled Debt Restructurings
A loan modification is identified as a TDR when the Company or a bankruptcy court grants the borrower a concession the Company would not otherwise make in response to the borrower’s financial difficulties. TDRs typically result from the Company’s loss mitigation efforts and are undertaken in order to improve the likelihood of recovery and continuity of the relationship. The Company’s loan modifications are handled on a case-by-case basis and are negotiated to achieve mutually agreeable terms that maximize loan collectability and meet the borrower’s financial needs. Concessions granted in TDRs for all classes of loans may include lowering the interest rate, forgiving a portion of principal, extending the loan term, lowering scheduled payments for a specified period of time, principal forbearance, or capitalizing past due amounts. A rate increase can be a concession if the increased rate is lower than a market rate for debt with risk similar to that of the restructured loan. TDRs for commercial loans and leases may also involve creating a multiple note structure, accepting non-cash assets, accepting an equity interest, or receiving a performance-based fee. In some cases, a TDR may involve multiple concessions. The financial effects of TDRs for all loan classes may include lower income (either due to a lower interest rate or a delay in the timing of cash flows), larger loan loss provisions, and accelerated charge-offs if the modification renders the loan collateral-dependent. In some cases, interest income throughout the term of the loan may increase if, for example, the loan is extended or the interest rate is increased as a result of the restructuring.
Because TDRs are impaired loans, the Company measures impairment by comparing the present value of expected future cash flows, or when appropriate, the fair value of collateral, to the loan’s recorded investment. Any excess of recorded investment over the present value of expected future cash flows or collateral value is recognized by creating a valuation allowance or increasing an existing valuation allowance. Any portion of the loan’s recorded investment the Company does not expect to collect as a result of the modification is charged off at the time of modification.
Commercial TDRs were $155 million and $176 million on December 31, 2015 and 2014, respectively. Retail TDRs totaled $1.2 billion on December 31, 2015 and 2014, respectively. Commitments to lend additional funds to debtors owing receivables which were TDRs were $15 million and $53 million on December 31, 2015 and 2014, respectively.
CITIZENS FINANCIAL GROUP, INC.
NOTES TO CONSOLIDATED FINANCIAL STATEMENTS
The following table summarizes how loans were modified during the year ended December 31, 2015, the charge-offs related to the modifications, and the impact on the ALLL. The reported balances include loans that became TDRs during 2015 and were paid off in full, charged off, or sold prior to December 31, 2015.
|
| | | | | | | | | | | | | | | | | |
| | Primary Modification Types |
| | Interest Rate Reduction (1) | | Maturity Extension (2) |
| (dollars in millions) | Number of Contracts | Pre-Modification Outstanding Recorded Investment | Post-Modification Outstanding Recorded Investment | | Number of Contracts | Pre-Modification Outstanding Recorded Investment | Post-Modification Outstanding Recorded Investment |
| Commercial | 25 |
|
| $19 |
|
| $19 |
| | 160 |
|
| $22 |
|
| $22 |
|
| Commercial real estate | 1 |
| — |
| — |
| | 1 |
| — |
| — |
|
| Total commercial | 26 |
| 19 |
| 19 |
| | 161 |
| 22 |
| 22 |
|
| Residential mortgages | 153 |
| 31 |
| 31 |
| | 40 |
| 7 |
| 6 |
|
| Home equity loans | 96 |
| 5 |
| 5 |
| | 191 |
| 35 |
| 35 |
|
| Home equity lines of credit | 4 |
| 1 |
| 1 |
| | 23 |
| 2 |
| 2 |
|
Home equity loans serviced by others (3) | 29 |
| 2 |
| 2 |
| | — |
| — |
| — |
|
Home equity lines of credit serviced by others (3) | 2 |
| — |
| — |
| | 1 |
| — |
| — |
|
| Automobile | 108 |
| 2 |
| 2 |
| | 5 |
| — |
| — |
|
| Student | — |
| — |
| — |
| | — |
| — |
| — |
|
| Credit cards | 2,413 |
| 13 |
| 13 |
| | — |
| — |
| — |
|
| Other retail | 3 |
| — |
| — |
| | — |
| — |
| — |
|
| Total retail | 2,808 |
| 54 |
| 54 |
| | 260 |
| 44 |
| 43 |
|
| Total | 2,834 |
|
| $73 |
|
| $73 |
| | 421 |
|
| $66 |
|
| $65 |
|
|
| | | | | | | | | | | | | | | |
| | Primary Modification Types | | | |
| | Other (4) | | | |
| (dollars in millions) | Number of Contracts | Pre-Modification Outstanding Recorded Investment | Post-Modification Outstanding Recorded Investment | | Net Change to ALLL Resulting from Modification | Charge-offs Resulting from Modification |
| Commercial | 16 |
|
| $34 |
|
| $34 |
| |
| ($1 | ) |
| $1 |
|
| Commercial real estate | 1 |
| 4 |
| 4 |
| | — |
| — |
|
| Total commercial | 17 |
| 38 |
| 38 |
| | (1 | ) | 1 |
|
| Residential mortgages | 275 |
| 33 |
| 33 |
| | (1 | ) | — |
|
| Home equity loans | 448 |
| 28 |
| 28 |
| | — |
| 1 |
|
| Home equity lines of credit | 320 |
| 21 |
| 19 |
| | — |
| 2 |
|
Home equity loans serviced by others (3) | 124 |
| 6 |
| 5 |
| | — |
| 1 |
|
Home equity lines of credit serviced by others (3) | 41 |
| 3 |
| 2 |
| | — |
| — |
|
| Automobile | 812 |
| 14 |
| 12 |
| | — |
| 2 |
|
| Student | 1,204 |
| 22 |
| 22 |
| | 4 |
| — |
|
| Credit cards | — |
| — |
| — |
| | 2 |
| — |
|
| Other retail | 20 |
| — |
| — |
| | — |
| — |
|
| Total retail | 3,244 |
| 127 |
| 121 |
| | 5 |
| 6 |
|
| Total | 3,261 |
|
| $165 |
|
| $159 |
| |
| $4 |
|
| $7 |
|
(1) Includes modifications that consist of multiple concessions, one of which is an interest rate reduction.
(2) Includes modifications that consist of multiple concessions, one of which is a maturity extension (unless one of the other concessions was an interest rate reduction).
(3) The Company’s SBO portfolio consists of purchased home equity loans and lines that were originally serviced by others. The Company now services a portion of this portfolio internally.
(4) Includes modifications other than interest rate reductions or maturity extensions, such as lowering scheduled payments for a specified period of time, principal forbearance, capitalizing arrearages, and principal forgiveness. Also included are the following: deferrals, trial modifications, certain bankruptcies, loans in forbearance and prepayment plans. Modifications can include the deferral of accrued interest resulting in post modification balances being higher than pre-modification.
CITIZENS FINANCIAL GROUP, INC.
NOTES TO CONSOLIDATED FINANCIAL STATEMENTS
The following table summarizes how loans were modified during the year ended December 31, 2014, the charge-offs related to the modifications, and the impact on the ALLL. The reported balances include loans that became TDRs during 2014 and were paid off in full, charged off, or sold prior to December 31, 2014.
|
| | | | | | | | | | | | | | | | | |
| | Primary Modification Types |
| | Interest Rate Reduction (1) | | Maturity Extension (2) |
| (dollars in millions) | Number of Contracts | Pre-Modification Outstanding Recorded Investment | Post-Modification Outstanding Recorded Investment | | Number of Contracts | Pre-Modification Outstanding Recorded Investment | Post-Modification Outstanding Recorded Investment |
| Commercial | 25 |
|
| $8 |
|
| $7 |
| | 131 |
|
| $21 |
|
| $22 |
|
| Commercial real estate | 9 |
| 1 |
| 2 |
| | 15 |
| 3 |
| 2 |
|
| Total commercial | 34 |
| 9 |
| 9 |
| | 146 |
| 24 |
| 24 |
|
| Residential mortgages | 126 |
| 17 |
| 17 |
| | 40 |
| 6 |
| 5 |
|
| Home equity loans | 125 |
| 8 |
| 9 |
| | 85 |
| 5 |
| 6 |
|
| Home equity lines of credit | 7 |
| — |
| — |
| | 276 |
| 17 |
| 16 |
|
Home equity loans serviced by others (3) | 42 |
| 2 |
| 2 |
| | — |
| — |
| — |
|
Home equity lines of credit serviced by others (3) | 4 |
| — |
| — |
| | 1 |
| — |
| — |
|
| Automobile | 75 |
| 1 |
| 1 |
| | 18 |
| — |
| — |
|
| Student | — |
| — |
| — |
| | — |
| — |
| — |
|
| Credit cards | 2,165 |
| 12 |
| 12 |
| | — |
| — |
| — |
|
| Other retail | 3 |
| — |
| — |
| | — |
| — |
| — |
|
| Total retail | 2,547 |
| 40 |
| 41 |
| | 420 |
| 28 |
| 27 |
|
| Total | 2,581 |
|
| $49 |
|
| $50 |
| | 566 |
|
| $52 |
|
| $51 |
|
|
| | | | | | | | | | | | | | | |
| | Primary Modification Types | | | |
| | Other (4) | | | |
| (dollars in millions) | Number of Contracts | Pre-Modification Outstanding Recorded Investment | Post-Modification Outstanding Recorded Investment | | Net Change to ALLL Resulting from Modification | Charge-offs Resulting from Modification |
| Commercial | 27 |
|
| $52 |
|
| $74 |
| |
| $3 |
|
| $— |
|
| Commercial real estate | 1 |
| 7 |
| 7 |
| | — |
| 3 |
|
| Total commercial | 28 |
| 59 |
| 81 |
| | 3 |
| 3 |
|
| Residential mortgages | 393 |
| 47 |
| 46 |
| | (4 | ) | 1 |
|
| Home equity loans | 1,046 |
| 63 |
| 62 |
| | (1 | ) | 2 |
|
| Home equity lines of credit | 356 |
| 25 |
| 21 |
| | — |
| 5 |
|
Home equity loans serviced by others (3) | 138 |
| 5 |
| 5 |
| | (1 | ) | — |
|
Home equity lines of credit serviced by others (3) | 39 |
| 2 |
| 2 |
| | — |
| — |
|
| Automobile | 1,039 |
| 17 |
| 13 |
| | — |
| 5 |
|
| Student | 1,675 |
| 31 |
| 31 |
| | 5 |
| — |
|
| Credit cards | — |
| — |
| — |
| | — |
| — |
|
| Other retail | 57 |
| 2 |
| 1 |
| | (1 | ) | — |
|
| Total retail | 4,743 |
| 192 |
| 181 |
| | (2 | ) | 13 |
|
| Total | 4,771 |
|
| $251 |
|
| $262 |
| |
| $1 |
|
| $16 |
|
(1) Includes modifications that consist of multiple concessions, one of which is an interest rate reduction.
(2) Includes modifications that consist of multiple concessions, one of which is a maturity extension (unless one of the other concessions was an interest rate reduction).
(3) The Company’s SBO portfolio consists of purchased home equity loans and lines that were originally serviced by others. The Company now services a portion of this portfolio internally.
(4) Includes modifications other than interest rate reductions or maturity extensions, such as lowering scheduled payments for a specified period of time, principal forbearance, capitalizing arrearages, and principal forgiveness. Also included are the following: deferrals, trial modifications, certain bankruptcies, loans in forbearance and prepayment plans. Modifications can include the deferral of accrued interest resulting in post modification balances being higher than pre-modification.
CITIZENS FINANCIAL GROUP, INC.
NOTES TO CONSOLIDATED FINANCIAL STATEMENTS
The following table summarizes how loans were modified during the year ended December 31, 2013, the charge-offs related to the modifications, and the impact on the ALLL. The reported balances include loans that became TDRs during 2013 and were paid off in full, charged off, or sold prior to December 31, 2013.
|
| | | | | | | | | | | | | | | | | |
| | Primary Modification Types |
| | Interest Rate Reduction (1) | | Maturity Extension (2) |
| (dollars in millions) | Number of Contracts | Pre-Modification Outstanding Recorded Investment | Post-Modification Outstanding Recorded Investment | | Number of Contracts | Pre-Modification Outstanding Recorded Investment | Post-Modification Outstanding Recorded Investment |
| Commercial | 126 |
|
| $13 |
|
| $13 |
| | 134 |
|
| $18 |
|
| $18 |
|
| Commercial real estate | 11 |
| 7 |
| 7 |
| | 3 |
| 1 |
| 1 |
|
| Total commercial | 137 |
| 20 |
| 20 |
| | 137 |
| 19 |
| 19 |
|
| Residential mortgages | 200 |
| 32 |
| 33 |
| | 46 |
| 5 |
| 6 |
|
| Home equity loans | 196 |
| 15 |
| 16 |
| | 94 |
| 6 |
| 6 |
|
| Home equity lines of credit | 18 |
| 1 |
| 1 |
| | 2,081 |
| 80 |
| 70 |
|
Home equity loans serviced by others (3) | 31 |
| 2 |
| 2 |
| | 5 |
| — |
| — |
|
Home equity lines of credit serviced by others (3) | 3 |
| — |
| — |
| | 1 |
| — |
| — |
|
| Automobile | 238 |
| 2 |
| 2 |
| | 2 |
| — |
| — |
|
| Student | — |
| — |
| — |
| | — |
| — |
| — |
|
| Credit cards | 2,729 |
| 15 |
| 15 |
| | — |
| — |
| — |
|
| Other retail | 21 |
| — |
| — |
| | — |
| — |
| — |
|
| Total retail | 3,436 |
| 67 |
| 69 |
| | 2,229 |
| 91 |
| 82 |
|
| Total | 3,573 |
|
| $87 |
|
| $89 |
| | 2,366 |
|
| $110 |
|
| $101 |
|
|
| | | | | | | | | | | | | | | |
| | Primary Modification Types | | | |
| | Other (4) | | | |
| (dollars in millions) | Number of Contracts | Pre-Modification Outstanding Recorded Investment | Post-Modification Outstanding Recorded Investment | | Net Change to ALLL Resulting from Modification | Charge-offs Resulting from Modification |
| Commercial | 6 |
|
| $1 |
|
| $1 |
| |
| $— |
|
| $1 |
|
| Commercial real estate | 1 |
| — |
| — |
| | (2 | ) | — |
|
| Total commercial | 7 |
| 1 |
| 1 |
| | (2 | ) | 1 |
|
| Residential mortgages | 430 |
| 64 |
| 63 |
| | 5 |
| 2 |
|
| Home equity loans | 995 |
| 57 |
| 51 |
| | 2 |
| 5 |
|
| Home equity lines of credit | 771 |
| 53 |
| 46 |
| | — |
| 16 |
|
Home equity loans serviced by others (3) | 269 |
| 12 |
| 10 |
| | — |
| 3 |
|
Home equity lines of credit serviced by others (3) | 43 |
| 2 |
| 1 |
| | — |
| 1 |
|
| Automobile | 1,323 |
| 13 |
| 10 |
| | — |
| 3 |
|
| Student | 2,620 |
| 48 |
| 47 |
| | — |
| — |
|
| Credit cards | — |
| — |
| — |
| | — |
| — |
|
| Other retail | 148 |
| 3 |
| 3 |
| | — |
| 1 |
|
| Total retail | 6,599 |
| 252 |
| 231 |
| | 7 |
| 31 |
|
| Total | 6,606 |
|
| $253 |
|
| $232 |
| |
| $5 |
|
| $32 |
|
(1) Includes modifications that consist of multiple concessions, one of which is an interest rate reduction.
(2) Includes modifications that consist of multiple concessions, one of which is a maturity extension (unless one of the other concessions was an interest rate reduction).
(3) The Company’s SBO portfolio consists of purchased home equity loans and lines that were originally serviced by others. The Company now services a portion of this portfolio internally.
(4) Includes modifications other than interest rate reductions or maturity extensions, such as lowering scheduled payments for a specified period of time, principal forbearance, capitalizing arrearages, and principal forgiveness. Also included are the following: deferrals, trial modifications, certain bankruptcies, loans in forbearance and prepayment plans. Modifications can include the deferral of accrued interest resulting in post-modification balances being higher than pre-modification.
CITIZENS FINANCIAL GROUP, INC.
NOTES TO CONSOLIDATED FINANCIAL STATEMENTS
The table below summarizes TDRs that defaulted during the year ended December 31, 2015, 2014 and 2013 within 12 months of their modification date. For purposes of this table, a payment default is defined as being past due 90 days or more under the modified terms. Amounts represent the loan’s recorded investment at the time of payment default. Loan data includes loans meeting the criteria that were paid off in full, charged off, or sold prior to December 31, 2015 and 2014. If a TDR of any loan type becomes 90 days past due after being modified, the loan is written down to the fair value of collateral less cost to sell. The amount written off is charged to the ALLL.
|
| | | | | | | | | | | | | | | | | |
| | Year Ended December 31, |
| | 2015 | | 2014 | | 2013 |
| (dollars in millions) | Number of Contracts | Balance Defaulted | | Number of Contracts | Balance Defaulted | | Number of Contracts | Balance Defaulted |
| Commercial | 23 |
|
| $2 |
| | 37 |
|
| $12 |
| | 18 |
|
| $1 |
|
| Commercial real estate | — |
| — |
| | 3 |
| 1 |
| | 3 |
| 1 |
|
| Total commercial | 23 |
| 2 |
| | 40 |
| 13 |
| | 21 |
| 2 |
|
| Residential mortgages | 168 |
| 21 |
| | 301 |
| 35 |
| | 526 |
| 60 |
|
| Home equity loans | 184 |
| 13 |
| | 329 |
| 24 |
| | 740 |
| 43 |
|
| Home equity lines of credit | 131 |
| 7 |
| | 229 |
| 12 |
| | 394 |
| 21 |
|
Home equity loans serviced by others (1) | 43 |
| 1 |
| | 60 |
| 2 |
| | 187 |
| 3 |
|
Home equity lines of credit serviced by others (1) | 22 |
| 1 |
| | 20 |
| — |
| | 42 |
| 2 |
|
| Automobile | 87 |
| 1 |
| | 112 |
| 1 |
| | 208 |
| 1 |
|
| Student | 171 |
| 3 |
| | 355 |
| 7 |
| | 885 |
| 17 |
|
| Credit cards | 455 |
| 3 |
| | 579 |
| 3 |
| | 548 |
| 3 |
|
| Other retail | 4 |
| — |
| | 12 |
| — |
| | 33 |
| 1 |
|
| Total retail | 1,265 |
| 50 |
| | 1,997 |
| 84 |
| | 3,563 |
| 151 |
|
| Total | 1,288 |
|
| $52 |
| | 2,037 |
|
| $97 |
| | 3,584 |
|
| $153 |
|
(1) The Company’s SBO portfolio consists of purchased home equity loans and lines that were originally serviced by others. The Company now services a portion of this portfolio internally.
Concentrations of Credit Risk
Most of the Company’s business activity is with customers located in the New England, Mid-Atlantic and Midwest regions. Generally, loans are collateralized by assets including real estate, inventory, accounts receivable, other personal property and investment securities. As of December 31, 2015 and 2014, the Company had a significant amount of loans collateralized by residential and commercial real estate. There are no significant concentrations within the commercial loan or retail loan portfolios. Exposure to credit losses arising from lending transactions may fluctuate with fair values of collateral supporting loans, which may not perform according to contractual agreements. The Company’s policy is to collateralize loans to the extent necessary; however, unsecured loans are also granted on the basis of the financial strength of the applicant and the facts surrounding the transaction.
Certain loan products, including residential mortgages, home equity loans and lines of credit, and credit cards, have contractual features that may increase credit exposure to the Company in the event of an increase in interest rates or a decline in housing values. These products include loans that exceed 90% of the value of the underlying collateral (high LTV loans), interest-only and negative amortization residential mortgages, and loans with low introductory rates. Certain loans have more than one of these characteristics.
CITIZENS FINANCIAL GROUP, INC.
NOTES TO CONSOLIDATED FINANCIAL STATEMENTS
The following table presents balances of loans with these characteristics:
|
| | | | | | | | | | | | | | | |
| | December 31, 2015 |
| (in millions) | Residential Mortgages | Home Equity Loans and Lines of Credit | Home Equity Products serviced by others | Credit Cards | Total |
|
| High loan-to-value |
| $649 |
|
| $1,038 |
|
| $785 |
|
| $— |
|
| $2,472 |
|
| Interest only/negative amortization | 1,110 |
| — |
| — |
| — |
| 1,110 |
|
| Low introductory rate | — |
| 3 |
| — |
| 96 |
| 99 |
|
| Multiple characteristics and other | 14 |
| — |
| — |
| — |
| 14 |
|
| Total |
| $1,773 |
|
| $1,041 |
|
| $785 |
|
| $96 |
|
| $3,695 |
|
|
| | | | | | | | | | | | | | | |
| | December 31, 2014 |
| (in millions) | Residential Mortgages | Home Equity Loans and Lines of Credit | Home Equity Products serviced by others | Credit Cards | Total |
|
| High loan-to-value |
| $773 |
|
| $1,743 |
|
| $1,025 |
|
| $— |
|
| $3,541 |
|
| Interest only/negative amortization | 894 |
| — |
| — |
| — |
| 894 |
|
| Low introductory rate | — |
| — |
| — |
| 98 |
| 98 |
|
| Multiple characteristics and other | 24 |
| — |
| — |
| — |
| 24 |
|
| Total |
| $1,691 |
|
| $1,743 |
|
| $1,025 |
|
| $98 |
|
| $4,557 |
|
NOTE 6 - VARIABLE INTEREST ENTITIES
Low Income Housing Tax Credit Partnerships
The Company makes equity investments in various limited partnerships that sponsor affordable housing projects utilizing the LIHTC pursuant to Section 42 of the Internal Revenue Code. The purpose of these investments is to assist in achieving goals of the Community Reinvestment Act and to earn an adequate return on capital. Each LIHTC partnership is managed by a general partner who exercises full and exclusive control over the affairs of the limited partnership, including: selecting and investing in specific properties, company expenditures and use of working capital funds, borrowing funds, disposition of fund property, contract authority, employment of agents, and litigation resolution. The limited partner(s) may not participate in the management, control, conduct or operation of the limited partnership’s business and the general partner may only be removed by the limited partner(s) if the general partner fails to comply with the terms of the partnership agreement or is negligent in performing its duties. In addition, Citizens, as a limited partner, is only liable for capital contributions up to a maximum amount specified in the investment agreement. For all of these reasons, the Company believes that the general partner of each limited partnership has the power to direct the activities which most significantly affect the performance of each partnership and that the Company is therefore not the primary beneficiary of any LIHTC partnership. Accordingly, the Company does not consolidate any of its LIHTC partnership investments.
Effective January 1, 2015, the Company adopted ASU 2014-01, “Accounting for Investments in Qualified Affordable Housing Projects” and uses the proportional amortization method to account for all of its investments in its LIHTC partnership investments. The retrospective adoption of ASU 2014-01 would have had an immaterial effect on the Company’s financial statements; therefore, the Company applied ASU 2014-01 prospectively. Under the proportional amortization method, the Company recognizes the net investment performance in the Consolidated Statements of Operations as a component of income tax expense. LIHTC investment balances are reported in other assets in the Company’s Consolidated Balance Sheets, with unfunded commitments reported in other liabilities.
At December 31, 2015, the Company’s balance of LIHTC investments was $598 million and unfunded commitments totaled $365 million. For the year ended December 31, 2015, the Company recognized $45 million of amortization expense, $45 million of tax credits and $17 million of other tax benefits associated with these investments in the provision for income taxes. No LIHTC investment impairment losses were recognized during the year ended December 31, 2015.
CITIZENS FINANCIAL GROUP, INC.
NOTES TO CONSOLIDATED FINANCIAL STATEMENTS
NOTE 7 - PREMISES, EQUIPMENT AND SOFTWARE
A summary of the carrying value of premises and equipment follows:
|
| | | | | | | | | |
| | | | December 31, |
| (dollars in millions) | Useful Lives | | 2015 |
| | 2014 |
|
| Land and land improvements | 15 years | |
| $25 |
| |
| $26 |
|
| Buildings and leasehold improvements | 7-40 years | | 634 |
| | 607 |
|
| Furniture, fixtures and equipment | 5-15 years | | 1,667 |
| | 1,613 |
|
| Total premises and equipment, gross | | | 2,326 |
| | 2,246 |
|
| Less: accumulated depreciation | | | 1,731 |
| | 1,651 |
|
| Total premises and equipment, net | | |
| $595 |
| |
| $595 |
|
The above table includes capital leases with book values of $47 million and $46 million and related accumulated depreciation of $25 million and $22 million as of December 31, 2015 and 2014, respectively. Depreciation charged to noninterest expense was $116 million, $117 million, and $138 million for the years ended December 31, 2015, 2014, and 2013, respectively, and is presented in the Consolidated Statements of Operations in occupancy and equipment expense.
The Company entered into two sale-leaseback transactions during 2015, one of which included an operating lease for a period of 10 years. There were $9 million of gains recorded of which $1 million was deferred. There were no sale-leaseback transactions during 2014. The Company entered into a sale-leaseback transaction during 2013, which includes an operating lease for a period of 10 years. There was a $15 million gain recorded in 2013 of which $14 million was deferred.
The Company had capitalized software assets of $1.3 billion and $1.1 billion and related accumulated amortization of $532 million and $387 million as of December 31, 2015 and 2014, respectively. Amortization expense was $146 million, $145 million, and $102 million for the years ended December 31, 2015, 2014, and 2013, respectively. Capitalized software assets are reported as a component of other assets in the Consolidated Balance Sheets.
The estimated future amortization expense for capitalized software assets is as follows:
|
| | | |
| Year | (in millions) |
|
| 2016 |
| $142 |
|
| 2017 | 125 |
|
| 2018 | 104 |
|
| 2019 | 72 |
|
| 2020 | 43 |
|
| Thereafter | 129 |
|
Total (1) |
| $615 |
|
(1) Excluded from this balance is $171 million of in-process software at December 31, 2015.
CITIZENS FINANCIAL GROUP, INC.
NOTES TO CONSOLIDATED FINANCIAL STATEMENTS
NOTE 8 - LEASE COMMITMENTS
The Company is committed under long-term leases for the rental of premises and equipment. These leases have varying renewal options and require, in certain instances, the payment of insurance, real estate taxes and other operating expenses.
At December 31, 2015, the aggregate minimum rental commitments under these non-cancelable operating leases and capital leases, exclusive of renewals, are as follows for the years ended December 31:
|
| | | | | | | |
| (in millions) | Operating Leases | | Capital Leases |
| 2016 |
| $190 |
| |
| $8 |
|
| 2017 | 167 |
| | 7 |
|
| 2018 | 131 |
| | 3 |
|
| 2019 | 85 |
| | 2 |
|
| 2020 | 64 |
| | 2 |
|
| Thereafter | 180 |
| | 10 |
|
| Total minimum lease payments |
| $817 |
| |
| $32 |
|
| Amounts representing interest | N/A |
| | (9 | ) |
| Present value of net minimum lease payments | N/A |
| |
| $23 |
|
Rental expense for such leases for the years ended December 31, 2015, 2014, and 2013 totaled $205 million, $214 million, and $224 million, respectively, and is presented in the Consolidated Statements of Operations in occupancy and equipment expense.
NOTE 9 - GOODWILL
Goodwill represents the excess of fair value of purchased assets over the purchase price. Since 1988, the Company has completed more than 25 acquisitions of banks or assets of banks. The changes in the carrying value of goodwill for the year ended December 31, 2015 and 2014 were:
|
| | | | | | | | | | | |
| (in millions) | Consumer Banking | | Commercial Banking | | Total |
|
| Balance at December 31, 2013 |
| $2,136 |
| |
| $4,740 |
| |
| $6,876 |
|
| Adjustments | — |
| | — |
| | — |
|
| Balance at December 31, 2014 |
| $2,136 |
| |
| $4,740 |
| |
| $6,876 |
|
| Adjustments | — |
| | — |
| | — |
|
| Balance at December 31, 2015 |
| $2,136 |
| |
| $4,740 |
| |
| $6,876 |
|
Accumulated impairment losses related to the Consumer Banking reporting unit totaled $5.9 billion at December 31, 2015 and 2014. The accumulated impairment losses related to the Commercial Banking reporting unit totaled $50 million at December 31, 2015 and 2014.
The Company performs an annual test for impairment of goodwill at a level of reporting referred to as a reporting unit. The Company has identified and allocated goodwill to two reporting units — Consumer Banking and Commercial Banking — based upon reviews of the structure of the Company’s executive team and supporting functions, resource allocations and financial reporting processes.
No impairment was recorded for the years ended December 31, 2015 and 2014. The Company tested the value of goodwill as of June 30, 2013, and recorded an impairment charge of $4.4 billion relating to the Consumer Banking reporting unit. The impairment charge, which was a non-cash item, had minimal impact on the Company's regulatory capital ratios and liquidity, and for segment reporting purposes was included in Other. Refer to Note 24 “Business Segments” for further information regarding segment reporting.
The valuation of goodwill is dependent on forward-looking expectations related to the performance of the U.S. economy and the associated financial performance of the Company. The prolonged delay in the full recovery of the U.S. economy, and the impact of that delay on earnings expectations, prompted a goodwill impairment test as of June 30, 2013. Although the U.S. economy had demonstrated signs of recovery, notably improvements in unemployment and housing, the pace and extent of these indicators,
CITIZENS FINANCIAL GROUP, INC.
NOTES TO CONSOLIDATED FINANCIAL STATEMENTS
as well as in overall GDP, lagged previous expectations. The impact of the slow recovery was most evident in the Company's Consumer Banking reporting unit. Forecasted economic growth for the U.S., coupled with the continuing impact of the new regulatory framework in the financial industry, resulted in a deceleration of expected growth for the Consumer Banking reporting unit's future profits and an associated goodwill impairment. Refer to Note 1 “Significant Accounting Policies” for further information regarding the impairment test.
NOTE 10 - MORTGAGE BANKING
In its mortgage banking business, the Company sells residential mortgages to government-sponsored entities and other parties, who may issue securities backed by pools of such loans. The Company retains no beneficial interests in these sales, but may retain the servicing rights of the loans sold. The Company is obligated to subsequently repurchase a loan if the purchaser discovers a standard representation or warranty violation such as noncompliance with eligibility requirements, customer fraud, or servicing violations. This primarily occurs during a loan file review.
The Company received $2.7 billion, $1.6 billion, and $4.2 billion of proceeds from the sale of residential mortgages for the years ended December 31, 2015, 2014 and 2013, respectively, and recognized gains on such sales of $51 million, $36 million, and $66 million for the years ended December 31, 2015, 2014 and 2013, respectively. Pursuant to the standard representations and warranties obligations discussed in the preceding paragraph, the Company repurchased residential mortgage loans totaling $10 million, $25 million, and $35 million for the years ended December 31, 2015, 2014 and 2013, respectively.
Mortgage servicing fees, a component of mortgage banking income, were $55 million, $59 million, and $61 million for the years ended December 31, 2015, 2014 and 2013, respectively. The Company recorded valuation recoveries of $9 million, $5 million, and $47 million for its MSRs for the years ended December 31, 2015, 2014 and 2013, respectively.
Changes related to MSRs were as follows:
|
| | | | | | | |
| | As of and for the Year Ended
December 31, |
| (in millions) | 2015 |
| | 2014 |
|
| MSRs: | | | |
| Balance as of January 1 |
| $184 |
| |
| $208 |
|
| Amount capitalized | 26 |
| | 17 |
|
| Amortization | (37 | ) | | (41 | ) |
| Carrying amount before valuation allowance | 173 |
| | 184 |
|
| Valuation allowance for servicing assets: | | | |
| Balance as of January 1 | 18 |
| | 23 |
|
| Valuation recovery | (9 | ) | | (5 | ) |
| Balance at end of period | 9 |
| | 18 |
|
| Net carrying value of MSRs |
| $164 |
| |
| $166 |
|
MSRs are presented in other assets on the Consolidated Balance Sheets.
The fair value of MSRs is estimated using a valuation model that calculates the present value of estimated future net servicing cash flows, taking into consideration actual and expected mortgage loan prepayment rates, discount rates, contractual servicing fee income, servicing costs, default rates, ancillary income, and other economic factors, which are determined based on current market conditions. The valuation model uses a static discounted cash flow methodology incorporating current market interest rates. A static model does not attempt to forecast or predict the future direction of interest rates; rather it estimates the amount and timing of future servicing cash flows using current market interest rates. The current mortgage interest rate influences the expected prepayment rate and therefore, the length of the cash flows associated with the servicing asset, while the discount rate determines the present value of those cash flows. Expected mortgage loan prepayment assumptions are obtained using the QRM Multi Component prepayment model. The Company periodically obtains third-party valuations of its MSRs to assess the reasonableness of the fair value calculated by the valuation model.
CITIZENS FINANCIAL GROUP, INC.
NOTES TO CONSOLIDATED FINANCIAL STATEMENTS
The key economic assumptions used to estimate the value of MSRs are presented in the following table:
|
| | | |
| | December 31, |
| (dollars in millions) | 2015 | | 2014 |
| Fair value | $178 | | $179 |
| Weighted average life (in years) | 5.4 | | 5.2 |
| Weighted average constant prepayment rate | 11.6% | | 12.4% |
| Weighted average discount rate | 9.7% | | 9.8% |
The key economic assumptions used in estimating the fair value of MSRs capitalized during the period were as follows:
|
| | | | | |
| | Year Ended December 31, |
| | 2015 | | 2014 | | 2013 |
| Weighted average life (in years) | 5.9 | | 5.8 | | 6.0 |
| Weighted average constant prepayment rate | 10.7% | | 11.7% | | 12.4% |
| Weighted average discount rate | 9.7% | | 10.3% | | 10.5% |
The sensitivity analysis below as of December 31, 2015 and 2014 presents the impact to current fair value of an immediate 50 basis points and 100 basis points adverse change in the key economic assumptions and presents the decline in fair value that would occur if the adverse change were realized. These sensitivities are hypothetical. The effect of a variation in a particular assumption on the fair value of the mortgage servicing rights is calculated independently without changing any other assumption. In reality, changes in one factor may result in changes in another (e.g., changes in interest rates, which drive changes in prepayment speeds, could result in changes in the discount rates), which might amplify or counteract the sensitivities. The primary risk inherent in the Company’s MSRs is an increase in prepayments of the underlying mortgage loans serviced, which is dependent upon market movements of interest rates.
|
| | | | | | | |
| | December 31, |
| (in millions) | 2015 | | 2014 |
| Prepayment rate: | | | |
| Decline in fair value from a 50 basis point decrease in interest rates |
| $5 |
| |
| $9 |
|
| Decline in fair value from a 100 basis point decrease in interest rates |
| $11 |
| |
| $15 |
|
| Weighted average discount rate: | | | |
| Decline in fair value from a 50 basis point increase in weighted average discount rate |
| $3 |
| |
| $3 |
|
| Decline in fair value from a 100 basis point increase in weighted average discount rate |
| $6 |
| |
| $6 |
|
NOTE 11 - DEPOSITS
The major components of deposits are as follows:
|
| | | | | | | |
| | December 31, |
| (in millions) | 2015 |
| | 2014 |
|
| Demand |
| $27,649 |
| |
| $26,086 |
|
| Checking with interest | 17,921 |
| | 16,394 |
|
| Regular savings | 8,218 |
| | 7,824 |
|
| Money market accounts | 36,727 |
| | 33,345 |
|
| Term deposits | 12,024 |
| | 12,058 |
|
| Total deposits |
| $102,539 |
| |
| $95,707 |
|
CITIZENS FINANCIAL GROUP, INC.
NOTES TO CONSOLIDATED FINANCIAL STATEMENTS
The maturity distribution of term deposits as of December 31, 2015 is as follows:
|
| | | |
| Year | (in millions) |
|
| 2016 |
| $9,994 |
|
| 2017 | 1,309 |
|
| 2018 | 428 |
|
| 2019 | 183 |
|
| 2020 | 104 |
|
| 2021 and thereafter | 6 |
|
| Total |
| $12,024 |
|
Of these deposits, the amount of term deposits with a denomination of $100,000 or more was $6.3 billion at December 31, 2015. The remaining maturities of these deposits are as follows:
|
| | | |
| (in millions) |
|
| Three months or less |
| $3,136 |
|
| After three months through six months | 1,145 |
|
| After six months through twelve months | 1,329 |
|
| After twelve months | 675 |
|
| Total term deposits |
| $6,285 |
|
NOTE 12 - BORROWED FUNDS
The following is a summary of the Company’s short-term borrowed funds: |
| | | | | | | |
| | December 31, |
| (in millions) | 2015 |
| | 2014 |
|
| Federal funds purchased |
| $— |
| |
| $574 |
|
| Securities sold under agreements to repurchase | 802 |
| | 3,702 |
|
| Other short-term borrowed funds (primarily current portion of FHLB advances) | 2,630 |
| | 6,253 |
|
| Total short-term borrowed funds |
| $3,432 |
| |
| $10,529 |
|
Key data related to short-term borrowed funds is presented in the following table:
|
| | | | | | | | | | | |
| | As of and for the Year Ended December 31, |
| (dollars in millions) | 2015 |
| | 2014 | | 2013 |
| Weighted-average interest rate at year-end: | | | | | |
| Federal funds purchased and securities sold under agreements to repurchase | 0.15 | % | | 0.14 | % | | 0.09 | % |
| Other short-term borrowed funds (primarily current portion of FHLB advances) | 0.44 |
| | 0.26 |
| | 0.20 |
|
| Maximum amount outstanding at month-end during the year: | | | | | |
| Federal funds purchased and securities sold under agreements to repurchase |
| $5,375 |
| |
| $7,022 |
| |
| $5,114 |
|
| Other short-term borrowed funds (primarily current portion of FHLB advances) | 7,004 |
| | 7,702 |
| | 2,251 |
|
| Average amount outstanding during the year: | | | | | |
| Federal funds purchased and securities sold under agreements to repurchase |
| $3,364 |
| |
| $5,699 |
| |
| $2,400 |
|
| Other short-term borrowed funds (primarily current portion of FHLB advances) | 5,865 |
| | 5,640 |
| | 251 |
|
| Weighted-average interest rate during the year: | | | | | |
| Federal funds purchased and securities sold under agreements to repurchase | 0.22 | % | | 0.12 | % | | 0.31 | % |
| Other short-term borrowed funds (primarily current portion of FHLB advances) | 0.28 |
| | 0.25 |
| | 0.44 |
|
CITIZENS FINANCIAL GROUP, INC.
NOTES TO CONSOLIDATED FINANCIAL STATEMENTS
The following is a summary of the Company’s long-term borrowed funds:
|
| | | | | | | |
| | December 31, |
| (in millions) | 2015 |
| | 2014 |
|
| Citizens Financial Group, Inc.: | | | |
| 4.150% fixed rate subordinated debt, due 2022 |
| $350 |
| |
| $350 |
|
5.158% fixed-to-floating rate subordinated debt, (LIBOR + 3.56%) callable, due 2023 (1) | 333 |
| | 333 |
|
4.771% fixed rate subordinated debt, due 2023 (1) | — |
| | 333 |
|
4.691% fixed rate subordinated debt, due 2024 (1) | — |
| | 334 |
|
4.153% fixed rate subordinated debt, due 2024 (1) (2) | 250 |
| | 333 |
|
4.023% fixed rate subordinated debt, due 2024 (1) (3) | 331 |
| | 333 |
|
4.082% fixed rate subordinated debt, due 2025 (1) (4) | 331 |
| | 334 |
|
| 4.350% fixed rate subordinated debt, due 2025 | 250 |
| | — |
|
| 4.300% fixed rate subordinated debt, due 2025 | 750 |
| | — |
|
| Banking Subsidiaries: | | | |
1.600% senior unsecured notes, due 2017 (5) (6) | 749 |
| | 750 |
|
2.300% senior unsecured notes, due 2018 (5) (7) | 747 |
| | — |
|
2.450% senior unsecured notes, due 2019 (5) (8) | 752 |
| | 746 |
|
| Federal Home Loan advances due through 2033 | 5,018 |
| | 772 |
|
| Other | 25 |
| | 24 |
|
| Total long-term borrowed funds |
| $9,886 |
| |
| $4,642 |
|
(1) Borrowed funds with RBS. See Note 19 “Related Party Transactions and Significant Transactions with RBS” for further information.
(2) Interest is payable until January 1, 2016 at a fixed rate per annum of 4.153% and at a fixed rate per annum of 3.750% thereafter.
(3) $333 million principal balance of subordinated debt reflects the impact of $2 million hedge of interest rate risk on medium term debt using interest rate swaps at December 31, 2015. See Note 16 “Derivatives” for further information.
(4) $334 million principal balance of subordinated debt reflects the impact of $3 million hedge of interest rate risk on medium term debt using interest rate swaps at December 31, 2015. See Note 16 “Derivatives” for further information.
(5) These securities were offered under CBNA’s Global Bank Note Program dated December 1, 2014.
(6) $750 million principal balance of unsecured notes reflects the impact of $1 million hedge of interest rate risk on medium term debt using interest rate swaps at December 31, 2015. See Note 16 “Derivatives” for further information.
(7) $750 million principal balance of unsecured notes reflects the impact of $3 million hedge of interest rate risk on medium term debt using interest rate swaps at December 31, 2015. See Note 16 “Derivatives” for further information.
(8) $750 million principal balance of unsecured notes reflects the impact of $2 million hedge of interest rate risk on medium term debt using interest rate swaps at December 31, 2015. See Note 16 “Derivatives” for further information.
On December 3, 2015, the Company repurchased $750 million of outstanding subordinated debt instruments held by RBS. The $3 million difference between the repurchase price and the net carrying amount of the repurchased debt was recognized as a gain on extinguishment of the debt. To fund the repurchase, the Company issued $750 million of new subordinated debt with a 4.300% fixed rate and a ten-year maturity.
Advances, lines of credit, and letters of credit from the FHLB are collateralized by pledged mortgages and pledged securities at least sufficient to satisfy the collateral maintenance level established by the FHLB. The utilized borrowing capacity for FHLB advances and letters of credit was $11.3 billion at December 31, 2015 and 2014. The Company’s available FHLB borrowing capacity was $4.1 billionand $3.5 billion at December 31, 2015 and 2014, respectively. The Company can also borrow from the FRB discount window to meet short-term liquidity requirements. Collateral, such as investment securities and loans, was pledged to provide borrowing capacity at the FRB. At December 31, 2015, the Company’s unused secured borrowing capacity was approximately $32.1 billion, which includes unencumbered securities, FHLB borrowing capacity, and FRB discount window capacity.
CITIZENS FINANCIAL GROUP, INC.
NOTES TO CONSOLIDATED FINANCIAL STATEMENTS
The following is a summary of maturities for the Company’s long-term borrowed funds at December 31, 2015:
|
| | | | | | | | | |
| Year (in millions) | CFG Parent Company | Banking Subsidiaries | Consolidated |
|
| 2016 or on demand |
| $— |
|
| $— |
|
| $— |
|
| 2017 | — |
| 5,764 |
| 5,764 |
|
| 2018 | — |
| 753 |
| 753 |
|
| 2019 | — |
| 753 |
| 753 |
|
| 2020 | — |
| 2 |
| 2 |
|
| 2021 and thereafter | 2,595 |
| 19 |
| 2,614 |
|
| Total |
| $2,595 |
|
| $7,291 |
|
| $9,886 |
|
NOTE 13 - STOCKHOLDERS’ EQUITY
Preferred Stock
As of December 31, 2015, the Company had 100,000,000 shares authorized and 250,000 shares outstanding of $25.00 par value undesignated preferred stock. The Board of Directors or any authorized committee thereof are authorized to provide for the issuance of these shares in one or more series, and by filing a certificate pursuant to applicable law of the State of Delaware, to establish or change from time to time the number of shares of each such series, and to fix the designations, powers, including voting powers, full or limited, or no voting powers, preferences and the relative, participating, optional or other special rights of the shares of each series and any qualifications, limitations and restrictions thereof. There were no shares of preferred stock issued and outstanding as of December 31, 2014.
On April 6, 2015, the Company issued $250 million, or 250,000 shares, of 5.500% fixed-to-floating rate non-cumulative perpetual Series A Preferred Stock, par value of $25.00 per share with a liquidation preference $1,000 per share (the “Series A Preferred Stock”) to the initial purchasers in reliance on the exemption from registration provided by Section (4)(a)(2) of the Securities Act of 1933, as amended, for resale pursuant to Rule 144A and Regulation S under the Securities Act of 1933, as amended. As a result of this issuance, the Company received net proceeds of $247 million after underwriting discount.
The Series A Preferred Stock has no stated maturity and is not subject to any sinking fund or other obligation of the Company. Holders of the Series A Preferred Stock will be entitled to receive dividend payments when, and if, declared by the Company’s Board of Directors or a duly authorized committee thereof. Any such dividends will be payable on a semi-annual basis at an annual rate equal to 5.500%. On April 6, 2020, the Series A Preferred Stock converts to a quarterly floating-rate basis equal to three-month U.S. dollar LIBOR on the related dividend determination date plus 3.960%.
Citizens may redeem the Series A Preferred Stock, in whole or in part on any dividend payment date, on or after April 6, 2020 or, in whole but not in part, at any time within 90 days following a regulatory capital treatment event at a redemption price equal to $1,000 per share, plus any declared and unpaid dividends, without accumulation of any undeclared dividends. Citizens may not redeem shares of the Series A Preferred Stock without obtaining the prior approval of the FRBG if then required under applicable capital guidelines.
Shares of the Series A Preferred Stock have priority over the Company's common stock with regard to the payment of dividends and, as such, the Company may not pay dividends on or repurchase, redeem, or otherwise acquire for consideration shares of its common stock unless dividends for the Series A Preferred Stock have been declared for that period and sufficient funds have been set aside to make payment.
Except in certain limited circumstances, the Series A Preferred Stock does not have any voting rights.
Treasury Stock
On August 3, 2015, CFG used the net proceeds of its public offering of $250 million aggregate principal amount 4.350% Subordinated Notes due 2025 issued on July 31, 2015, to repurchase 9,615,384 shares of its outstanding common stock directly from RBS at a public offering price of $26.00 per share. The repurchased shares are held in treasury.
On April 7, 2015, the Company used the net proceeds of the Series A Preferred Stock offering to repurchase 10,473,397 shares of its common stock from RBS at a total cost of approximately $250 million and a price per share of $23.87, which equaled the volume-weighted average price of the Company’s common stock for all traded volume over the five trading days preceding the repurchase agreement date of April 1, 2015. The repurchased shares are held in treasury.
CITIZENS FINANCIAL GROUP, INC.
NOTES TO CONSOLIDATED FINANCIAL STATEMENTS
During the year ended December 31, 2015, the Company recorded an additional 876,087 shares of treasury stock associated with share-based compensation plan activity for a total cost of $22 million at a weighted-average price per share of $25.50.
During the year ended December 31, 2014, the Company recorded an additional 80,358 shares of common stock associated with share-based compensation plan activity for a total cost of $2 million at an average price per share of $25.03.
On October 8, 2014, Citizens executed a capital exchange transaction which involved the issuance of $334 million of 10-year subordinated notesSubordinated Notes to RBSGRBS at a rate of 4.082% and the simultaneous repurchase of 14,297,761 shares of common stock owned by RBS Group for a total cost of $334 million and an average price per share of $23.36. The purchase price per share was the average of the daily volume-weighted average price of a share of our common stock as reported by the New York Stock Exchange over the five trading days preceding the purchase date.
As of December 31, 2014, the Company repurchased in the open market an additional 80,358 shares of common stock associated with share-based compensation plan activity for a total cost of $2 million at an average price per share of $25.03.
NOTE 1314 - EMPLOYEE BENEFITS
Pension Plans
The Company maintains a non-contributory pension plan (the “Plan” or “qualified plan”) that was closed to new hires and re-hires effective January 1, 2009, and frozen to all participants effective December 31, 2012. Benefits under the Plan are based on employees'employees’ years of service and highest five-year average of eligible compensation. The Plan is funded on a current basis, in compliance with the requirements of ERISA. The Company also provides an unfunded, non-qualified supplemental retirement plan (the “non-qualified plan”), which was closed and frozen consistent with the qualified plan.effective December 31, 2012.
RBS Group restructured the administration of employee benefit plans during 2008. As a result, the qualified and non-qualified pension plans of certain RBS Group subsidiaries referred to as the Company'sCompany’s “Affiliates” merged with the Company'sCompany’s pension plans.
In September 2014, in preparation for the IPO, the Company divested portions of the qualified and non-qualified plans to newly established plans sponsored by the Affiliates. Citizens remains the sponsor of the original plans, which provides benefits for its current and former employees.plans. RBS is the plan sponsor of the newly established plans, which provide benefits for current and former employees of the Affiliates. As a result of this divestiture,Citizens remains the Company transferred $129 million of plan assets and $148 million of plan liabilities from the qualified plan to the new plan for Affiliates. The Company also transferred liabilities of $7 million related to the non-qualified plan to the new plan established for Affiliates. The Company made a $1 million cash payment to RBS as a result of divesting the portionsponsor of the pensionoriginal plans, which provide benefits for the Company’s current and other benefit plans associated with the Affiliates.
During 2012, the Company offered to vested former employees who had not yet retired a one-time opportunity to receive the value of future defined benefit pension payments as a single lump sum payment. In December 2012, the Company made lump sum payments of $196 million to former employees who accepted the offer, which resulted in a $240 million reduction of the defined benefit obligation and a $92 million settlement charge.employees.
CITIZENS FINANCIAL GROUP, INC.
NOTES TO CONSOLIDATED FINANCIAL STATEMENTS
The qualified plan'splan’s allocation by asset category is as follows:
| | | | | Target Asset Allocation | | Actual Asset Allocation | | Target Asset Allocation | | Actual Asset Allocation |
| Asset Category | | 2015 | | 2014 | | 2013 | | 2015 | | 2015 | | 2014 |
| Equity securities | | 45-55% | | 49.0 | % | | 52.6 | % | | 45-55% | | 47.1 | % | | 49.0 | % |
| Debt securities | | 40-50% | | 44.7 | % | | 42.9 | % | | 40-50% | | 47.3 | % | | 44.7 | % |
| Other | | 0-10% | | 6.3 | % | | 4.5 | % | | 0-10% | | 5.6 | % | | 6.3 | % |
| Total | | | 100.0 | % | | 100.0 | % | | | 100.0 | % | | 100.0 | % |
The written Pension Plan Investment Policy, set forth by the CFG Retirement Committee, formulates those investment principles and guidelines that are appropriate to the needs and objectives of the Plan, and defines the management, structure, and monitoring procedures adopted for the ongoing operation of the aggregate funds of the Plan. Stated goals and objectives are:
Total return, consistent with prudent investment management, is the primary goal of the Plan. The nominal rate of return objective should meet or exceed the actuarial rate return target. In addition, assets of the Plan shall be invested to ensure that principal is preserved and enhanced over time;
The total return for the overall Plan shall meet or exceed the Plan’s Policy Index;
Total portfolio risk exposure should generally rank in the mid-range of comparable funds. Risk-adjusted returns are expected to consistently rank in the top-half of comparable funds; and
Investment managers shall exceed the return of the designated benchmark index and rank in the top-half of the appropriate asset class and style universe.
The CFG Retirement Committee reviews, at least annually, the assets and net cash flow of the Plan, discusses the current economic outlook and the Plan’s investment strategy with the investment managers, reviews the current asset mix and its compliance with the Policy, and receives and considers statistics on the investment performance of the Plan.
The equity investment mandates follows a global equity approach. Investments are made in broadly diversified portfolios that contain investments in U.S. and non-U.S. developed and developing economies. The fixed income investment mandates are
CITIZENS FINANCIAL GROUP, INC.
NOTES TO CONSOLIDATED FINANCIAL STATEMENTS
US investment grade mandates and follow a long duration investment approach. Investment in high-yield bonds are not allowed unless an investment grade bond is downgraded to a non-investment grade category.
The assets of the qualified plan may be invested in any or all of the following asset categories:
a) Equity-oriented investments:
domestic and foreign common and preferred stocks, and related rights, warrants, convertible debentures, and other common share equivalents
b) Fixed income-oriented investments:
domestic and foreign bonds, debentures and notes
mortgages
mortgage-backed securities
asset-backed securities
money market securities or cash
financial futures and options on financial futures
forward contracts
In addition, derivatives may be employed under the guidelines established for individual managers in order to manage risk exposures and/or to increase the efficiency of strategies. The extent to which derivatives will be utilized will be specified in the investment guidelines for each manager. The Plan will not be exposed to losses through derivatives that exceed the capital invested.
In selecting the expected long-term rate of return on assets, the Company considers the average rate of earnings expected on the funds invested or to be invested to provide for the benefits of this Plan. This includes considering the trust’s asset allocation and the expected returns likely to be earned over the life of the Plan. This basis is consistent with the prior year.
CITIZENS FINANCIAL GROUP, INC.
NOTES TO CONSOLIDATED FINANCIAL STATEMENTS
Changes in the fair value of defined benefit pension plan assets, projected benefit obligation, funded status, and accumulated benefit obligation are summarized as follows:
| | | | Year Ended December 31, | Year Ended December 31, |
| | Qualified Plan | | Non-Qualified Plan | Qualified Plan | | Non-Qualified Plan |
| (in millions) | 2014 |
| (1) | 2013 |
| | 2012 |
| | 2014 |
| (1) | 2013 |
| | 2012 |
| 2015 |
| | 2014 |
| (1) | 2013 |
| | 2015 |
| | 2014 |
| (1) | 2013 |
|
| Fair value of plan assets as of January 1 |
| $1,031 |
| |
| $998 |
| |
| $1,106 |
| |
| $— |
| |
| $— |
| |
| $— |
|
| $923 |
| |
| $1,031 |
| |
| $998 |
| |
| $— |
| |
| $— |
| |
| $— |
|
| Actual return (loss) on plan assets | 98 |
| | 111 |
| | 142 |
| | — |
| | — |
| | — |
| (41 | ) | | 98 |
| | 111 |
| | — |
| | — |
| | — |
|
| Employer contributions | — |
| | — |
| | — |
| | 9 |
| | 8 |
| | 8 |
| 100 |
| | — |
| | — |
| | 9 |
| | 9 |
| | 8 |
|
| Settlements | — |
| | — |
| | (196 | ) | | — |
| | — |
| | — |
| |
| Divestitures | (129 | ) | | — |
| | — |
| | — |
| | — |
| | — |
| — |
| | (129 | ) | | — |
| | — |
| | — |
| | — |
|
| Benefits and administrative expenses paid | (77 | ) | | (78 | ) | | (54 | ) | | (9 | ) | | (8 | ) | | (8 | ) | (65 | ) | | (77 | ) | | (78 | ) | | (9 | ) | | (9 | ) | | (8 | ) |
| Fair value of plan assets as of December 31 | 923 |
| | 1,031 |
| | 998 |
| | — |
| | — |
| | — |
| 917 |
| | 923 |
| | 1,031 |
| | — |
| | — |
| | — |
|
| Projected benefit obligation | 1,093 |
| | 1,026 |
| | 1,185 |
| | 117 |
| | 107 |
| | 116 |
| 977 |
| | 1,093 |
| | 1,026 |
| | 103 |
| | 117 |
| | 107 |
|
| Pension asset (obligation) |
| ($170 | ) | |
| $5 |
| |
| ($187 | ) | |
| ($117 | ) | |
| ($107 | ) | |
| ($116 | ) |
| ($60 | ) | |
| ($170 | ) | |
| $5 |
| |
| ($103 | ) | |
| ($117 | ) | |
| ($107 | ) |
| Accumulated benefit obligation |
| $1,093 |
| |
| $1,026 |
| |
| $1,185 |
| |
| $117 |
| |
| $107 |
| |
| $116 |
|
| $977 |
| |
| $1,093 |
| |
| $1,026 |
| |
| $103 |
| |
| $117 |
| |
| $107 |
|
(1) December 31, 2014 amounts excluded $129 million in qualified plan assets, $148 million in qualified plan liabilities and $7 million in non-qualified plan liabilities transferred to Affiliates on September 1, 2014.
The Company’s share of the 2012 single lump sum payments to vested former employees described earlier in this Note for the qualified plan was $146 million as of December 31, 2012.
The pre-tax amounts recognized (for the qualified and non-qualified plans) in AOCI are as follows:
| | | | Year Ended December 31, | Year Ended December 31, | |
(in millions)
| 2014 |
| (1) | 2013 |
| 2015 |
| | 2014 |
| (1) |
| Net prior service credit |
| $— |
| |
| $— |
|
| $— |
| |
| $— |
| |
| Net actuarial loss | 606 |
| | 414 |
| 599 |
| | 606 |
| |
| Total loss recognized in accumulated other comprehensive income |
| $606 |
| |
| $414 |
|
| $599 |
| |
| $606 |
| |
(1) December 31, 2014 amount excluded $35 million transferred to Affiliates on September 1, 2014.
CITIZENS FINANCIAL GROUP, INC.
NOTES TO CONSOLIDATED FINANCIAL STATEMENTS
Approximately $15$16 million of net actuarial loss recorded in AOCI as of December 31, 20142015 is expected to be recognized as a component of net periodic benefit costs during 2015.2016.
Other changes in plan assets and benefit obligations (for the qualified and non-qualified plans) recognized in OCI include the following:
|
| | | | | | | | | | | |
| | Year Ended December 31, |
| (in millions) | 2014 |
| (1) | 2013 |
| | 2012 |
|
| Net periodic pension (income) cost |
| ($8 | ) | |
| ($3 | ) | |
| $150 |
|
| Net actuarial (gain) loss | 237 |
| | (174 | ) | | 169 |
|
| Amortization of prior service credit | — |
| | — |
| | 1 |
|
| Amortization of net actuarial loss | (10 | ) | | (14 | ) | | (38 | ) |
| Settlement | — |
| | — |
| | (92 | ) |
| Divestiture | (35 | ) | | — |
| | — |
|
| Total recognized in other comprehensive income | 192 |
| | (188 | ) | | 40 |
|
| Total recognized in net periodic pension cost and other comprehensive income |
| $184 |
| |
| ($191 | ) | |
| $190 |
|
(1) Results for the period September 1, 2014 through December 31, 2014 excluded $129 million in qualified plan assets, $148 million in qualified plan liabilities and $7 million in non-qualified plan liabilities transferred to Affiliates on September 1, 2014.
CITIZENS FINANCIAL GROUP, INC.
NOTES TO CONSOLIDATED FINANCIAL STATEMENTS
There were no settlements for the years ended December 31, 2014 and December 31, 2013. The Company’s share of the $92 million settlement was $77 million for the year ended December 31, 2012. |
| | | | | | | | | | | |
| | Year Ended December 31, |
| (in millions) | 2015 |
| | 2014 |
| | 2013 |
|
| Net periodic pension income |
| ($7 | ) | |
| ($8 | ) | |
| ($3 | ) |
| Net actuarial (gain) loss | 7 |
| | 237 |
| | (174 | ) |
| Amortization of net actuarial loss | (15 | ) | | (10 | ) | | (14 | ) |
| Divestiture | — |
| | (35 | ) | | — |
|
| Total recognized in other comprehensive income | (8 | ) | | 192 |
| | (188 | ) |
| Total recognized in net periodic pension cost and other comprehensive income |
| ($15 | ) | |
| $184 |
| |
| ($191 | ) |
The following table presents the components of net periodic pension (income) cost for the Company's qualified and non-qualified plans:
|
| | | | | | | | | | | | | | | | | | | | | | | | | | | | | | | | | | | |
| | Year Ended December 31 |
| | Qualified Plan | | Non-Qualified Plan | | Total |
| (in millions) | 2014 |
| (1) | 2013 |
| | 2012 |
| | 2014 |
| (1) | 2013 |
| | 2012 |
| | 2014 |
| (1) | 2013 |
| | 2012 |
|
| Service cost |
| $3 |
| |
| $3 |
| |
| $42 |
| |
| $— |
| |
| $— |
| |
| $— |
| |
| $3 |
| |
| $3 |
| |
| $42 |
|
| Interest cost | 47 |
| | 48 |
| | 58 |
| | 5 |
| | 5 |
| | 5 |
| | 52 |
| | 53 |
| | 63 |
|
| Expected return on plan assets | (73 | ) | | (73 | ) | | (84 | ) | | — |
| | — |
| | — |
| | (73 | ) | | (73 | ) | | (84 | ) |
| Amortization of actuarial loss | 9 |
| | 13 |
| | 35 |
| | 1 |
| | 1 |
| | 3 |
| | 10 |
| | 14 |
| | 38 |
|
| Amortization of prior service cost | — |
| | — |
| | (1 | ) | | — |
| | — |
| | — |
| | — |
| | — |
| | (1 | ) |
| Settlement |
| $— |
| |
| $— |
| |
| $92 |
| |
| $— |
| |
| $— |
| |
| $— |
| |
| $— |
| |
| $— |
| |
| $92 |
|
| Net periodic pension (income) cost |
| ($14 | ) | |
| ($9 | ) | |
| $142 |
| |
| $6 |
| |
| $6 |
| |
| $8 |
| |
| ($8 | ) | |
| ($3 | ) | |
| $150 |
|
(1) Results for the period September 1, 2014 through December 31, 2014 excluded $129 million in qualified plan assets, $148 million in qualified plan liabilities and $7 million in non-qualified plan liabilities transferred to Affiliates on September 1, 2014. |
| | | | | | | | | | | | | | | | | | | | | | | | | | | | | | | | | | | |
| | Year Ended December 31 |
| | Qualified Plan | | Non-Qualified Plan | | Total |
| (in millions) | 2015 |
| | 2014 |
| | 2013 |
| | 2015 |
| | 2014 |
| | 2013 |
| | 2015 |
| | 2014 |
| | 2013 |
|
| Service cost |
| $3 |
| |
| $3 |
| |
| $3 |
| | $ | — |
| |
| $— |
| |
| $— |
| |
| $3 |
| |
| $3 |
| |
| $3 |
|
| Interest cost | 44 |
| | 47 |
| | 48 |
| | 4 |
| | 5 |
| | 5 |
| | 48 |
| | 52 |
| | 53 |
|
| Expected return on plan assets | (74 | ) | | (73 | ) | | (73 | ) | | — |
| | — |
| | — |
| | (74 | ) | | (73 | ) | | (73 | ) |
| Amortization of actuarial loss | 13 |
| | 9 |
| | 13 |
| | 2 |
| | 1 |
| | 1 |
| | 15 |
| | 10 |
| | 14 |
|
| Net periodic pension (income) cost |
| ($14 | ) | |
| ($14 | ) | |
| ($9 | ) | |
| $6 |
| |
| $6 |
| |
| $6 |
| |
| ($8 | ) | |
| ($8 | ) | |
| ($3 | ) |
Weighted-average rates assumed in determining the actuarial present value of benefit obligations and net periodic benefit cost are as follows:
| | | | As of and for the Year Ended December 31, | As of and for the Year Ended December 31, |
| | 2014 |
| | 2013 |
| | 2012 |
| 2015 |
| | 2014 |
| | 2013 |
|
| Assumptions for benefit obligations | | | | | | | | | | |
| Discount rate--qualified plan | 4.125 | % | | 5.00 | % | | 4.125 | % | 4.640 | % | | 4.125 | % | | 5.00 | % |
| Discount rate--non-qualified plan | 3.875 | % | | 4.75 | % | | 4.00 | % | 4.540 | % | | 3.875 | % | | 4.75 | % |
| Compensation increase rate | N/A |
| | N/A |
| | N/A |
| |
| Expected long-term rate of return on plan assets | 7.50 | % | | 7.50 | % | | 7.75 | % | 7.500 | % | | 7.50 | % | | 7.50 | % |
| Assumptions for net periodic pension cost | | | | | | | | | | |
| Discount rate--qualified plan | 5.00/4.25% |
| (1) | 4.125 | % | | 5.25 | % | 4.125 | % | | 5.00/4.25% |
| (1) | 4.125 | % |
| Discount rate--non-qualified plan | 4.75/4.00% |
| (2) | 4.00 | % | | 5.00 | % | 3.875 | % | | 4.75/4.00% |
| (2) | 4.00 | % |
| Compensation increases--qualified and non-qualified plans | N/A |
| | N/A |
| | 4.75 | % | |
| Expected long-term rate of return on plan assets | 7.50 | % | | 7.50 | % | | 7.75 | % | 7.500 | % | | 7.50 | % | | 7.50 | % |
(1) 5.00% for January 1 - August 31, 2014 period; 4.25% for September 1 - December 31, 2014 period.
(2) 4.75% for January 1 - August 31, 2014 period; 4.00% for September 1 - December 31, 2014 period.
The Company expects to contribute approximately $100 million to the qualified pension plan and $8 million to the non-qualified plan in 2015.2016. No contribution to the qualified plan is expected in 2016.
CITIZENS FINANCIAL GROUP, INC.
NOTES TO CONSOLIDATED FINANCIAL STATEMENTS
The followingExpected future benefit payments for the qualified and non-qualified plans reflect expected future service, as appropriate, that are expected to be paid, are as follows:
|
| | | |
| | (in millions)
|
|
| Expected benefit payments by fiscal year ended | |
December 31, 20152016 |
| $61 |
|
| December 31, 2017 | 62 |
|
| December 31, 2018 | 62 |
|
| December 31, 2019 | 63 |
|
December 31, 20162020 | 64 |
|
December 31, 20172021 - 2025 | 64 |
|
December 31, 2018 | 65 |
|
December 31, 2019 | 66 |
|
December 31, 2020 - 2024 | 345337 |
|
Fair Value Measurements
The following valuation techniques are used to measure the qualified pension plan assets at fair value:
Cash and money market funds:
Cash and money market funds represent instruments that generally mature in one year or less and are valued at cost, which approximates fair value. Cash and money market funds are classified as Level 2.
Mutual funds:
Where observable quoted prices are available in an active market, mutual funds are classified as Level 1 in the fair value hierarchy. If quoted market prices are not available, mutual funds are classified as Level 2 because they currently trade in active markets and the Company expects all future purchases and sales to be valued at current net asset value.
Corporate bonds, municipal obligations, U.S. government obligationsCommon and Non-U.S. government obligations:collective funds
Corporate bonds, municipal obligations, The fair value is estimated using the net asset value of units of a bank collective trust, the net asset value is used as a practical expedient to estimate fair value. The net asset value is based on the fair value of the underlying investments held by the fund less its liabilities. This practical expedient is not used when it is determined to be probable that the fund will sell the investment for an amount different than the reported net asset value. These instruments are classified as Level 2 because the Company expects all future purchases and sales to be valued at current net asset value.
U.S. government obligations and Non-U.S. government obligations, municipal obligations, corporate bonds, asset-backed securities and mortgage-backed securities-Managed portfolio:
U.S. government obligations, municipal obligations, corporate bonds, asset-backed securities and mortgage-backed securities are valued at the quoted market prices determined in the active markets in which the bondssecurities are traded. If quoted market prices are not available, the fair value of the security is estimated by using pricing models, quoted prices of securities with similar characteristics or discounted cash flows. These investments are classified as Level 2, because they currently trade in active markets for similar securities and the inputs to the valuations are observable.
Derivatives-Managed portfolio:
The managed portfolio invests in certain derivatives that are valued at the settlement price determined by the relevant exchange and are classified as Level 2 in the fair value hierarchy.
Limited partnerships:
Limited partnerships are valued at estimated fair value based on their proportionate share of the limited partnerships’ fair value as recorded in the limited partnerships’ audited financial statements. The limited partnerships invest primarily in readily marketable securities. The limited partnerships allocate gains, losses and expenses to the partners based on ownership percentage as described in the partnership agreements. The instruments that can be transacted at the investment net asset value are classified as Level 2 because the Company expects all future purchases and sales to be valued at current net asset value. The instruments that cannot be transacted at the investment net asset value are classified as Level 3 investments.
Common collective funds:
The fair value is estimated using the net asset value received from the investment companies. The instruments that can be transacted at the investment net asset value are classified as Level 2 because the Company expects all future purchases to be valued at current net asset value. Instruments that cannot be transacted at the investment net asset value are classified as Level 3 investments.
Derivatives-Managed portfolio:
The managed portfolio invests in certain derivatives that are valued at the settlement price determined by the relevant exchange and are classified as Level 2 in the fair value hierarchy.
CITIZENS FINANCIAL GROUP, INC.
NOTES TO CONSOLIDATED FINANCIAL STATEMENTS
The following tables present thetable presents qualified pension plan assets and liabilities measured at fair value (including gross derivative assets and liabilities, within the fair value hierarchy:hierarchy):
| | | | Fair Value Measurements as of December 31, 2014 | Fair Value Measurements as of December 31, 2015 |
| (in millions) | Total |
| Level 1 |
| Level 2 |
| Level 3 |
| Total |
| Level 1 |
| Level 2 |
| Level 3 |
|
| Assets: | | |
| Cash and money market funds |
| $18 |
|
| $— |
|
| $18 |
|
| $— |
|
| $4 |
|
| $— |
|
| $4 |
|
| $— |
|
| Mutual funds | | |
| International equity funds | 24 |
| 24 |
| — |
| — |
| 47 |
| 47 |
| — |
| — |
|
| Income funds | 39 |
| — |
| 39 |
| — |
| |
| Equity funds | | 9 |
| — |
| 9 |
| — |
|
| Common and collective funds | | |
| Global equities common and collective funds | 241 |
| — |
| 241 |
| — |
| |
| Fixed income common and collective funds | 305 |
| — |
| 305 |
| — |
| |
| Managed portfolio | | |
| Global equities common and collective fund | | 220 |
| — |
| 220 |
| — |
|
| Balanced common and collective funds | | 196 |
| — |
| 196 |
| — |
|
| Fixed income common and collective fund | | 120 |
| — |
| 120 |
| — |
|
| Managed portfolio assets | | |
| Cash and money market funds | (6 | ) | — |
| (6 | ) | — |
| 4 |
| — |
| 4 |
| — |
|
| Corporate bonds | 85 |
| — |
| 85 |
| — |
| |
| Municipal obligations | 2 |
| — |
| 2 |
| — |
| |
| Fixed income mutual fund | | 20 |
| — |
| 20 |
| — |
|
| U.S. government obligations | 17 |
| — |
| 17 |
| — |
| 35 |
| — |
| 35 |
| — |
|
| Non-U.S. government obligations | 2 |
| — |
| 2 |
| — |
| — |
| — |
| — |
| — |
|
| Derivative assets - credit default swaps | 1 |
| — |
| 1 |
| — |
| |
| Derivative liabilities - interest rate swaps | (1 | ) | — |
| (1 | ) | — |
| |
| Derivative liabilities - foreign currency futures | (1 | ) | — |
| (1 | ) | — |
| |
| Other | 14 |
| — |
| 14 |
| — |
| |
| Municipal obligations | | 1 |
| — |
| 1 |
| — |
|
| Corporate bonds | | 84 |
| — |
| 84 |
| — |
|
| Asset-backed securities | | 5 |
| — |
| 5 |
| — |
|
| Mortgage-backed securities | | 1 |
| — |
| 1 |
| — |
|
| Derivative assets - interest rate forwards | | 1 |
| — |
| 1 |
| — |
|
| Limited partnerships | 183 |
| — |
| 183 |
| — |
| |
| International equity fund | | 107 |
| — |
| 107 |
| — |
|
| International equity | | 95 |
| — |
| 95 |
| — |
|
| Total assets measured at fair value |
| $923 |
|
| $24 |
|
| $899 |
|
| $— |
|
| $949 |
|
| $47 |
|
| $902 |
|
| $— |
|
| Liabilities | | |
| Derivative liabilities - interest rate forwards | | 1 |
| — |
| 1 |
| — |
|
| Derivative liabilities - credit default swaps | | 1 |
| — |
| 1 |
| — |
|
| Total liabilities measured at fair value | |
| $2 |
|
| $— |
|
| $2 |
|
| $— |
|
CITIZENS FINANCIAL GROUP, INC.
NOTES TO CONSOLIDATED FINANCIAL STATEMENTS
The following table presents qualified pension plan assets and liabilities measured at fair value (including net derivative assets and liabilities, within the fair value hierarchy): |
| | | | | | | | | | | | |
| | Fair Value Measurements as of December 31, 2013 |
| (in millions) | Total |
| Level 1 |
| Level 2 |
| Level 3 |
|
| Cash and money market funds |
| $8 |
|
| $— |
|
| $8 |
|
| $— |
|
| Mutual funds | | | | |
| International equity funds | 28 |
| 28 |
| — |
| — |
|
| Income funds | 43 |
| — |
| 43 |
| — |
|
| Common and collective funds | | | | |
| International equity common and collective funds | 115 |
| — |
| 115 |
| — |
|
| Balanced common and collective funds | 474 |
| — |
| 474 |
| — |
|
| Fixed income common and collective funds | 117 |
| — |
| 117 |
| — |
|
| Managed portfolio | | | | |
| Cash and money market funds | 1 |
| — |
| 1 |
| — |
|
| Corporate bonds | 105 |
| — |
| 105 |
| — |
|
| Municipal obligations | 2 |
| — |
| 2 |
| — |
|
| U.S. government obligations | 9 |
| — |
| 9 |
| — |
|
| Non-U.S. government obligations | 3 |
| — |
| 3 |
| — |
|
| Limited partnerships | 126 |
| — |
| 126 |
| — |
|
| Total assets measured at fair value |
| $1,031 |
|
| $28 |
|
| $1,003 |
|
| $— |
|
In keeping with the Plan’s fixed income strategic objectives, the December 31, 2013 holdings of the managed fund included exchange traded Eurodollar futures contracts with a notional value of $324 million and an unrealized gain (fair value) of under $1 million. |
| | | | | | | | | | | | |
| | Fair Value Measurements as of December 31, 2014 |
| (in millions) | Total |
| Level 1 |
| Level 2 |
| Level 3 |
|
| Cash and money market funds |
| $18 |
|
| $— |
|
| $18 |
|
| $— |
|
| Mutual funds | | | | |
| International equity funds | 24 |
| 24 |
| — |
| — |
|
| Income funds | 39 |
| — |
| 39 |
| — |
|
| Common and collective funds | | | | |
| Global equities common and collective funds | 241 |
| — |
| 241 |
| — |
|
| Fixed income common and collective funds | 305 |
| — |
| 305 |
| — |
|
| Managed portfolio | | | | |
| Cash and money market funds | (6 | ) | — |
| (6 | ) | — |
|
| Corporate bonds | 85 |
| — |
| 85 |
| — |
|
| Municipal obligations | 2 |
| — |
| 2 |
| — |
|
| U.S. government obligations | 17 |
| — |
| 17 |
| — |
|
| Non-U.S. government obligations | 2 |
| — |
| 2 |
| — |
|
| Derivative assets - credit default swaps | 1 |
| — |
| 1 |
| — |
|
| Derivative liabilities - interest rate swaps | (1 | ) | — |
| (1 | ) | — |
|
| Derivative liabilities - foreign currency futures | (1 | ) | — |
| (1 | ) | — |
|
| Other | 14 |
| — |
| 14 |
| — |
|
| Limited partnerships | 183 |
| — |
| 183 |
| — |
|
| Total assets measured at fair value |
| $923 |
|
| $24 |
|
| $899 |
|
| $— |
|
CITIZENS FINANCIAL GROUP, INC.
NOTES TO CONSOLIDATED FINANCIAL STATEMENTS
There were no transfers among Levels 1, 2 or 3 during the years ended December 31, 2015, 2014, 2013, and 2012.2013. The fair values of participation units in the common and collective trusts are based on net asset value after adjustments to reflect all fund investments at fair value. The unfunded commitments, redemption frequency, and redemption notice period for those Plan investments that utilize net asset value to determine the fair value as of December 31, 20142015 and 2013,2014, are as follows:
| | | | Fair Value Estimated Using Net Asset Value per Share December 31, | Fair Value Estimated Using Net Asset Value per Share December 31, |
| | | | | | Unfunded | | Redemption | | Redemption | | Redemption | | | | | Unfunded | | Redemption | | Redemption | | Redemption |
| Investment (dollars in millions) | 2014 |
| | 2013 |
| | Commitment | | Frequency | | Restrictions | | Notice Period | 2015 |
| | 2014 |
| | Commitment | | Frequency | | Restrictions | | Notice Period |
Equity Mutual Fund(1) |
| $39 |
| |
| $43 |
| | $— | | Daily | | None | | 1-7 days |
| $9 |
| |
| $39 |
| |
| $— |
| | Daily | | None | | 1-7 days |
| Common and Collective Funds: | | | | | | | | | | |
International equity fund(2) | — |
| | 115 |
| | — | | Monthly | | None | | 3 days | |
Global equities funds(3) | 241 |
| | — |
| | — | | Daily | | None | | 2-3 days | |
Balanced funds(4) | — |
| | 474 |
| | — | | Daily | | None | | 2-3 days | |
Fixed income fund(5) | 305 |
| | 117 |
| | — | | Daily | | None | | 3 days | |
Global equities funds(2) | | 220 |
| | 241 |
| | — |
| | Daily | | None | | 2-3 days |
Balanced funds(3) | | 196 |
| | — |
| | — |
| | Daily | | None | | 2-3 days |
Fixed income fund(4) | | 120 |
| | 305 |
| | — |
| | Daily | | None | | 3 days |
Managed Portfolio - Fixed Income Mutual fund(5) | | 20 |
| | — |
| | — |
| | Daily | | None | | 1 days |
| Limited Partnerships: | | | | | | | | | | |
International equity fund(2)(6) | 90 |
| | — |
| | — | | Monthly | | None | | 3 days | 107 |
| | 90 |
| | — |
| | Monthly | | None | | 3 days |
International equity(6)(7) | 84 |
| | 116 |
| | — | | Daily | | None | | 10 days | 95 |
| | 84 |
| | — |
| | Daily | | None | | 10 days |
Offshore feeder fund(7)(8) | 9 |
| | 10 |
| | — | | Daily | | None | | 1-14 days | — |
| | 9 |
| | — |
| | Daily | | None | | 1-14 days |
| Total |
| $768 |
| |
| $875 |
| | $— | |
| $767 |
| |
| $768 |
| |
| $— |
| |
(1) The equity mutual fund seeks to offer participants capital appreciation by primarily investing in common stocks via investments in several underlying funds of the same fund family. The principle investment objective is to generate positive total return.
(2) The international equity fund seeks medium to long-term capital appreciation principally through global investments in readily marketable high-quality equity securities of companies with improving fundamentals and attractive valuations.
(3) The global equities funds objective is to track the MSCI All Country World Index.
(4)(3) The balanced funds seek to maximize total return by investing in global equities and fixed income transferable securities which may include some high yield income transferable securities. The funds may invest in securities denominated in currencies other than U.S. dollars.
(5)(4) The fixed income fund seeks to outperform the BarclaysBarclay’s Capital US Long Corporate Bond Index or similar benchmark.
(5) The managed portfolio fixed income mutual fund seeks to outperform the Barclay’s U.S. Long Credit Index or similar benchmark.
| |
(6) | The international equity fund seeks to medium to long-term capital appreciation principally through global investments in readily marketable high-quality equity securities of companies with improving fundamentals and attractive valuations. |
(7) The international equity limited partnership seeks to outperform the MSCI World Index by investing primarily in the common stock of Non-U.S. issuers.
(7)(8) The offshore feeder fund operates under a “master/feeder” structure whereby it invests substantially all of its assets in GMO Multi-Strategy Fund (Onshore) (the “master fund”). The investment objective of the master fund is capital appreciation with a target performance of the Citigroup Three-Month Treasury Bill plus 8% with a standard deviation of 5%. The investment adviser plans to pursue the master fund’s objective through a combination of investments in other pooled vehicles.
Postretirement Benefits
The Company and Affiliates merged their postretirement plans into a single postretirement plan in 2008 and continue to provide health care insurance benefits for certain retired employees and their spouses. In preparation for the IPO, the Company divested the portion of the postretirement plan associated with the Affiliates in September 2014. As a result, in September 2014, the Company transferred liabilities of approximately $7 million to the Affiliates.
Employees enrolled in medical coverage immediately prior to retirement and meeting eligibility requirements can elect retiree medical coverage. Employees and covered spouses can continue coverage at the full cost, except for a small group described below. However, coverage must be elected at the time of retirement and cannot be elected at a future date. Spouses may be covered only if the spouse is covered at the time of the employee’s retirement.
The Company reviews coverage on an annual basis and reserves the right to modify or cancel coverage at any renewal date. The Company’s cost sharing for certain full-time employees, who were hired prior to August 1, 1993 with 25 years of service who reach retirement age (under age 65) while employed by the Company is 70%; for those with 15-24 years of service, the Company’s share is 50%. Also, the Company shares in the cost for retiree medical benefits for a closed group of grandfathered arrangements from acquisitions. A small, closed group of retirees receive life insurance coverage. Effective July 1, 2014, the Company utilizes a private health care exchange to provide medical and dental benefits to current and future Medicare-eligible plan participants. The Company provides a fixed subsidy to a small, closed group of retirees and spouses based on the subsidy levels prior to July 1, 2014; retirees and spouses pay the cost of benefits in excess of the fixed subsidy.
The accumulated postretirement benefit obligation was $14 million and $27 million at December 31, 2014 and 2013, respectively. The funded status was a liability of $14 million and $27 million at December 31, 2014 and 2013, respectively, and is reported in other liabilities in the accompanying Consolidated Balance Sheets. The total gain recognized in OCI was $1 million
CITIZENS FINANCIAL GROUP, INC.
NOTES TO CONSOLIDATED FINANCIAL STATEMENTS
and $367 thousand at December 31, 2014 and 2013, respectively. The Company contributed and paid benefits of $3 million, $3 million, and $2 million during 2014, 2013, and 2012, respectively.
The followingExpected future benefit payments for the postretirement benefit plan reflect expected future service, as appropriate, that are expected to be paid, are as follows:
|
| | | |
| | (in millions) |
|
| Expected benefit payments by fiscal year ended | |
December 31, 20152016 |
| $1 |
|
December 31, 2016 | 1 |
|
| December 31, 2017 | 1 |
|
| December 31, 2018 | 1 |
|
| December 31, 2019 | 1 |
|
| December 31, 2020 | 1 |
|
December 31, 2021 - 20242025 | 5 |
|
The Company expects to contribute approximately $1 million to the plan during 2015.2016.
The weighted-average discount rate assumed in determining the actuarial present value of benefit obligations was 3.50%3.93% and 4.625%3.50% as of December 31, 20142015 and 2013,2014, respectively.
For measurement purposes, a 7.0% and 7.5% assumed annual rate of increase in the per capita cost of covered health care benefits was used for the years ended December 31, 20142015 and 2013, respectively.2014. This is expected to decrease gradually down to a 5%5.0% ultimate rate over the next several years.years (2022 and 2019 for years ended December 31, 2015 and 2014, respectively).
Weighted-average rates assumed in determining the net periodic benefit cost of the postretirement benefits plan are as follows:
| | | | For the Year Ended December 31, | For the Year Ended December 31, | |
(dollars in millions)
| 2014 |
| | 2013 |
| 2015 |
| | 2014 |
| |
| Discount rate | 4.625/3.875/3.75% |
| (1) | 3.875 | % | 3.500 | % | | 4.625/3.875/3.75% | (1) |
| Rate of compensation increase | — | % | | — | % | N/A |
| | — | % | |
| Ultimate health care cost trend rate | 5.00 | % | | 5.00 | % | 5.000 | % | | 5.00 | % | |
| Effect on accumulated postretirement benefit obligation | | | | | | | |
| One percent increase |
| $— |
| |
| $2 |
|
| $— |
| |
| $— |
| |
| One percent decrease | — |
| | (2 | ) | — |
| | — |
| |
(1) 4.625% for January 1 - May 31, 2014 period; 3.875% for June 1 - August 31, 2014 period; and, 3.75%3.750% for September 1 - December 31, 2014 period.
Postemployment Benefits
The Company provides postemployment benefits to certain former and inactive employees, primarily the Company’s long-term disability plan. Effective January 1, 2013, the Company required claimants receiving long-term disability benefits for 24 months to apply for Medicare approval so that Medicare is the primary payer of medical benefits. Benefit recorded for the years ended December 31, 2015, 2014, and 2013 and 2012 were none, $1 million, $3 million, and $1$3 million, respectively.
401(k) Plan
The Company sponsors an employee tax-deferreda 401(k) plan under which individual employee tax-deferred/Roth after-tax contributions to the plan are matched by the Company. Employees hired or rehired on orCompany after January 1, 2009 receive an additional 3%completion of earnings, subject to limits set by the Internal Revenue Service.one year of service. Effective January 1, 2013, contributions arewere matched at 100% up to an overall limitation of 5% on a pay period basis. Subsequently, effective January 1, 2015, 100% of matching contributions was reduced from 5% to 4% on a pay period basis. Substantially all employees will receive an additional 2% of earnings after completion of one year of service, subject to limits set by the Internal Revenue Service. Effective January 1, 2015, the match was reduced from 5% to 4%. Amounts contributed by the Company for the years ended December 31, 2015, 2014, and 2013 and 2012 were $52 million, $60 million, and $70 million, and $60 million, respectively.
CITIZENS FINANCIAL GROUP, INC.
NOTES TO CONSOLIDATED FINANCIAL STATEMENTS
NOTE 1415 - INCOME TAXES
Total income tax expense (benefit) was as follows:
| | | | Year Ended December 31, | Year Ended December 31, |
| (in millions) | 2014 |
| | 2013 |
| | 2012 |
| 2015 |
| | 2014 |
| | 2013 |
|
| Income tax expense (benefit) |
| $403 |
| |
| ($42 | ) | |
| $381 |
|
| $423 |
| |
| $403 |
| |
| ($42 | ) |
| Tax effect of changes in OCI | 154 |
| | (194 | ) | | 125 |
| (12 | ) | | 154 |
| | (194 | ) |
| Total comprehensive income tax expense (benefit) |
| $557 |
| |
| ($236 | ) | |
| $506 |
|
| $411 |
| |
| $557 |
| |
| ($236 | ) |
Components of income tax expense (benefit) are as follows:
| | | (in millions) | Current |
| Deferred |
| Total |
| Current |
| Deferred |
| Total |
|
| Year Ended December 31, 2015 | | |
| U.S. federal | |
| $162 |
|
| $225 |
|
| $387 |
|
| State and local | | 12 |
| 24 |
| 36 |
|
| Total | |
| $174 |
|
| $249 |
|
| $423 |
|
| Year Ended December 31, 2014 | | |
| U.S. federal |
| $224 |
|
| $145 |
|
| $369 |
|
| $224 |
|
| $145 |
|
| $369 |
|
| State and local | 38 |
| (4 | ) | 34 |
| 38 |
| (4 | ) | 34 |
|
| Total |
| $262 |
|
| $141 |
|
| $403 |
|
| $262 |
|
| $141 |
|
| $403 |
|
| Year Ended December 31, 2013 | | |
| U.S. federal |
| $3 |
|
| ($47 | ) |
| ($44 | ) |
| $3 |
|
| ($47 | ) |
| ($44 | ) |
| State and local | 8 |
| (6 | ) | 2 |
| 8 |
| (6 | ) | 2 |
|
| Total |
| $11 |
|
| ($53 | ) |
| ($42 | ) |
| $11 |
|
| ($53 | ) |
| ($42 | ) |
| Year Ended December 31, 2012 | | |
| U.S. federal |
| $19 |
|
| $269 |
|
| $288 |
| |
| State and local | 56 |
| 37 |
| 93 |
| |
| Total |
| $75 |
|
| $306 |
|
| $381 |
| |
The effective income tax rate differed from the U.S. federal income tax rate of 35% in 2015, 2014 2013 and 20122013 as follows:
| | | | Year Ended December 31, | Year Ended December 31, |
| | 2014 | | 2013 | | 2012 | 2015 | | 2014 | | 2013 |
| (dollars in millions) | Amount |
| Rate | | Amount |
| Rate | | Amount |
| Rate | Amount |
| Rate | | Amount |
| Rate | | Amount |
| Rate |
| U.S. Federal income tax expense (benefit) and tax rate |
| $444 |
| 35.0 | % | |
| ($1,214 | ) | 35.0 | % | |
| $359 |
| 35.0 | % |
| $442 |
| 35.0 | % | |
| $444 |
| 35.0 | % | |
| ($1,214 | ) | 35.0 | % |
| Increase (decrease) resulting from: | | | | | | | | | | | | | | | | |
| Goodwill impairment | — |
| — |
| | 1,217 |
| (35.1 | ) | | — |
| — |
| — |
| — |
| | — |
| — |
| | 1,217 |
| (35.1 | ) |
| State and local income taxes (net of federal benefit) | 22 |
| 1.7 |
| | 1 |
| — |
| | 61 |
| 5.9 |
| 27 |
| 2.1 |
| | 22 |
| 1.7 |
| | 1 |
| — |
|
| Bank-owned life insurance | (17 | ) | (1.3 | ) | | (17 | ) | 0.5 |
| | (18 | ) | (1.8 | ) | (20 | ) | (1.6 | ) | | (17 | ) | (1.3 | ) | | (17 | ) | 0.5 |
|
| Tax-exempt interest | (15 | ) | (1.2 | ) | | (13 | ) | 0.4 |
| | (12 | ) | (1.1 | ) | (17 | ) | (1.3 | ) | | (15 | ) | (1.2 | ) | | (13 | ) | 0.4 |
|
| Tax credits | (27 | ) | (2.1 | ) | | (11 | ) | 0.3 |
| | (8 | ) | (0.7 | ) | (16 | ) | (1.2 | ) | | (27 | ) | (2.1 | ) | | (11 | ) | 0.3 |
|
| Non-deductible expenses | | 8 |
| 0.6 |
|
| — |
| — |
|
| — |
| — |
|
| Other | (4 | ) | (0.3 | ) | | (5 | ) | 0.1 |
| | (1 | ) | (0.1 | ) | (1 | ) | (0.1 | ) | | (4 | ) | (0.3 | ) | | (5 | ) | 0.1 |
|
| Total income tax expense (benefit) and tax rate |
| $403 |
| 31.8 | % | |
| ($42 | ) | 1.2 | % | |
| $381 |
| 37.2 | % |
| $423 |
| 33.5 | % | |
| $403 |
| 31.8 | % | |
| ($42 | ) | 1.2 | % |
The effective income tax ratesrate for the yearsyear ended December 31, 2013 and 20122015 reflected the adoption of ASU No. 2014-01, “Accounting for Investments in Qualified Affordable Housing Projects.” The application of this guidance resulted in the table above have been restated with one decimal placereclassification of the amortization of these investments to conform to the Company's current yearincome tax rate presentation.expense from noninterest income. See Note 6 “Variable Interest Entities,” for further information.
CITIZENS FINANCIAL GROUP, INC.
NOTES TO CONSOLIDATED FINANCIAL STATEMENTS
The increase in the effective tax rate from 2014 to 2015 is primarily attributable to the Company’s adoption of ASU 2014-01 effective January 1, 2015. Additionally, the 2015 effective tax rate was affected by the impact of non-deductible permanent expense items incurred by the Company in 2015.
The effective tax rate in 2013 to 2014 was mainlyprimarily due to the tax rate impact of the goodwill impairment charge taken in 2013. Goodwill not deductible for tax purposes accounted for 78.4% of the total goodwill impairment charge and generated a reduction of 35.1% in our effective tax rate for the year ended December 31, 2013.
Additionally, the effective income tax rate will be affected in future periods by the impact of the adoption of Accounting Standard Update No. 2014-01, “Accounting for Investments in Qualified Affordable Housing Projects.” We expect this change in accounting method to increase the 2015 effective income tax rate by approximately 2.4 percentage points; however this is not expected to have a material impact on the Company’s Consolidated Financial Statements. For further information, see Recent Accounting Pronouncements in Note 1 “Significant Accounting Policies.”
The decrease in the effective tax rate from 2012 to 2013 represents the tax rate impact of the 2013 goodwill impairment in addition to the tax rate impact of a 2012 tax settlement. The state tax settlement represents 2.5% of the total tax rate for 2012 and is included in the rate reconciliation as a component of state and local income taxes (net of federal benefit).
The tax effects of temporary differences that give rise to significant portions of the deferred tax assets and liabilities are presented below:
|
| | | | | | | |
| | December 31, |
| (in millions) | 2014 |
| | 2013 |
|
| Deferred tax assets: | | | |
| Other comprehensive income |
| $232 |
| |
| $397 |
|
| Allowance for credit losses | 456 |
| | 475 |
|
| Net operating loss carryforwards | 155 |
| | 185 |
|
| Accrued expenses not currently deductible | 170 |
| | 149 |
|
| Investment and other tax credit carryforwards | — |
| | 62 |
|
| Deferred income | 45 |
| | 35 |
|
| Fair value marks | 34 |
| | 30 |
|
| Other | 1 |
| | — |
|
| Total deferred tax assets | 1,093 |
| | 1,333 |
|
| Valuation allowance | (157 | ) | | (193 | ) |
| Deferred tax assets, net of valuation allowance | 936 |
| | 1,140 |
|
| Deferred tax liabilities: | | | |
| Leasing transactions | 825 |
| | 811 |
|
| Amortization of intangibles | 380 |
| | 296 |
|
| Depreciation | 164 |
| | 124 |
|
| Pension and other employee compensation plans | 14 |
| | 56 |
|
| MSRs | 46 |
| | 50 |
|
| Other | — |
| | 2 |
|
| Total deferred tax liabilities | 1,429 |
| | 1,339 |
|
| Net deferred tax liability |
| $493 |
| |
| $199 |
|
Certain of the December 31, 2013 balances reflected in the table above were restated to conform to the current year presentation. The portion of the state net operating losses that management has determined will not be recognized, along with the associated valuation allowance, is now presented without any federal tax impact. |
| | | | | | | |
| | December 31, |
| (in millions) | 2015 |
| | 2014 |
|
| Deferred tax assets: | | | |
| Other comprehensive income |
| $241 |
| |
| $232 |
|
| Allowance for credit losses | 465 |
| | 456 |
|
| Net operating loss carryforwards | 137 |
| | 155 |
|
| Accrued expenses not currently deductible | 135 |
| | 170 |
|
| Deferred income | 40 |
| | 45 |
|
| Fair value marks | 36 |
| | 34 |
|
| Other | 5 |
| | 1 |
|
| Total deferred tax assets | 1,059 |
| | 1,093 |
|
| Valuation allowance | (123 | ) | | (157 | ) |
| Deferred tax assets, net of valuation allowance | 936 |
| | 936 |
|
| Deferred tax liabilities: | | | |
| Leasing transactions | 882 |
| | 825 |
|
| Amortization of intangibles | 455 |
| | 380 |
|
| Depreciation | 213 |
| | 164 |
|
| Pension and other employee compensation plans | 69 |
| | 14 |
|
| MSRs | 47 |
| | 46 |
|
| Total deferred tax liabilities | 1,666 |
| | 1,429 |
|
| Net deferred tax liability |
| $730 |
| |
| $493 |
|
At December 31, 2014,2015, the Company had state tax net operating loss carryforwards of $2.0$1.9 billion. Limitations on the ability to realize these carryforwards are reflected in the associated valuation allowance. Additionally, it is planned that RBS Group will divestdivested its remaining ownership interest in CFG by December 31, 2016.in 2015. The change in ownership resulting from this divestiture will generategenerated an annual limitation on the amount of carryforwards that can be utilized. These net operating losses will expire, if not utilized, in the years 20152016 - 2034.2035.
At December 31, 2014,2015, the Company had a valuation allowance of $157$123 million against the deferred tax assets related to certain state temporary differences and net operating losses, as it is management’s current assessment that it is more likely than
CITIZENS FINANCIAL GROUP, INC.
NOTES TO CONSOLIDATED FINANCIAL STATEMENTS
not that the Company will not recognize a portion of the deferred tax asset related to these items. The valuation allowance decreased $36$34 million during the year ended December 31, 2014.2015.
Effective with the fiscal year ended September 30, 1997, the reserve method for bad debts was no longer permitted for tax purposes. The repeal of the reserve method required the recapture of the reserve balance in excess of certain base year reserve amounts attributable to years ended prior to 1988. At December 31, 2014,2015, the Company’s base year loan loss reserves attributable to years ended prior to 1988, for which no deferred income taxes have been provided, was $557 million. This base year reserve may become taxable if certain distributions are made with respect to the stock of the Company or if the Company ceases to qualify as a bank for tax purposes. No actions are planned that would cause this reserve to become wholly or partially taxable.
The Company files income tax returns in the U.S. federal jurisdiction and various state and local jurisdictions. With few exceptions, the Company is no longer subject to U.S. federal or state and local income tax examinations by major tax authorities for years before 2010.2011.
CITIZENS FINANCIAL GROUP, INC.
NOTES TO CONSOLIDATED FINANCIAL STATEMENTS
A reconciliation of the beginning and ending amount of unrecognized tax benefits is as follows:
| | | | December 31, | December 31, |
| (in millions) | 2014 |
| | 2013 |
| | 2012 |
| 2015 |
| | 2014 |
| | 2013 |
|
| Balance at the beginning of the year, January 1 |
| $33 |
| |
| $34 |
| |
| $136 |
|
| $72 |
| |
| $33 |
| |
| $34 |
|
| Gross increases for tax positions related to prior years | 60 |
| | — |
| | 29 |
| |
| Decreases for tax positions as a result of the lapse of the statute of limitations | (1 | ) | | — |
| | — |
| |
| Gross (decrease) increase for tax positions related to prior years | | (6 | ) | | 60 |
| | — |
|
| Decreases for tax positions as a result of the lapse of the statutes of limitations | | (3 | ) | | (1 | ) | | — |
|
| Decreases for tax positions related to settlements with taxing authorities | (20 | ) | | (1 | ) | | (134 | ) | (1 | ) | | (20 | ) | | (1 | ) |
| Gross increases for tax positions related to the current year | — |
| | — |
| | 3 |
| |
| Balance at end of year |
| $72 |
| |
| $33 |
| |
| $34 |
|
| $62 |
| |
| $72 |
| |
| $33 |
|
Included in the total amount of unrecognized tax benefits at December 31, 2014,2015, are potential benefits of $49$43 million that, if recognized, would impact the effective tax rate.
The Company classifies interest and penalties related to unrecognized tax benefits as a component of income taxes. The Company accrued less than $1 million, $2$1 million, and $14$2 million of interest expense through December 31, 2015, 2014, 2013, and 2012,2013, respectively. The Company had approximately $14 million, $15 million, $14 million, and $12$14 million accrued for the payment of interest at December 31, 2015, 2014, 2013, and 2012,2013, respectively. There were no amounts accrued for penalties as of December 31, 2015, 2014, 2013, and 2012,2013, and there were no penalties recognized during 2015, 2014, 2013, and 2012.2013.
It is anticipated that during 2015 theThe Company willexpects to enter into settlement agreements with certain state taxing authorities regarding its passive investment companies. Settlement of these uncertainties would reduce the unrecognized tax benefit by $61$55 million. During 2014,2015, the Company settled nexus issues with various state taxing authorities for the years 2004 through 2013. Settlement of these uncertainties combined with the lapse of statutes of limitations reduced the unrecognized tax benefit by $20$4 million.
CITIZENS FINANCIAL GROUP, INC.
NOTES TO CONSOLIDATED FINANCIAL STATEMENTS
NOTE 1516 - DERIVATIVES
In the normal course of business, the Company enters into a variety of derivative transactions in order to meet the financing needs of its customers and to reduce its own exposure to fluctuations in interest rates and foreign currency exchange rates. The Company does not use derivatives for speculative purposes.
The Company’s derivative instruments are recognized on the Consolidated Balance Sheets at fair value. Information regarding the valuation methodology and inputs used to estimate the fair value of the Company’s derivative instruments is described in Note 1920 “Fair Value Measurements.”
CITIZENS FINANCIAL GROUP, INC.
NOTES TO CONSOLIDATED FINANCIAL STATEMENTS
The following table identifies derivative instruments included on the Consolidated Balance Sheets in derivative assets and derivative liabilities:
| | | | December 31, 2014 | | December 31, 2013 | December 31, 2015 | | December 31, 2014 |
| (in millions) | Notional Amount (1) | Derivative Assets | Derivative Liabilities | | Notional Amount (1) | Derivative Assets | Derivative Liabilities | Notional Amount (1) | Derivative Assets | Derivative Liabilities | | Notional Amount (1) | Derivative Assets | Derivative Liabilities |
| Derivatives designated as hedging instruments: | | | | | | |
| Interest rate swaps |
| $5,750 |
|
| $24 |
|
| $99 |
| |
| $5,500 |
|
| $23 |
|
| $412 |
|
| $16,750 |
|
| $96 |
|
| $50 |
| |
| $5,750 |
|
| $24 |
|
| $99 |
|
| Derivatives not designated as hedging instruments: | | | | | | |
| Interest rate swaps | 31,848 |
| 589 |
| 501 |
| | 29,355 |
| 654 |
| 558 |
| 33,719 |
| 540 |
| 455 |
| | 31,848 |
| 589 |
| 501 |
|
| Foreign exchange contracts | 8,359 |
| 170 |
| 164 |
| | 7,771 |
| 94 |
| 87 |
| 8,366 |
| 163 |
| 156 |
| | 8,359 |
| 170 |
| 164 |
|
| Other contracts | 730 |
| 7 |
| 9 |
| | 569 |
| 7 |
| 10 |
| 981 |
| 8 |
| 5 |
| | 730 |
| 7 |
| 9 |
|
| Total derivatives not designated as hedging instruments | | 766 |
| 674 |
| | | 755 |
| 655 |
| | 711 |
| 616 |
| | | 766 |
| 674 |
|
| Gross derivative fair values | | 790 |
| 773 |
| | | 778 |
| 1,067 |
| | 807 |
| 666 |
| | | 790 |
| 773 |
|
Less: Gross amounts offset in the Consolidated Balance Sheets (2) | | (161 | ) | (161 | ) | | | (128 | ) | (128 | ) | | (178 | ) | (178 | ) | | | (161 | ) | (161 | ) |
Less: Cash collateral applied (2) | | | (4 | ) | (3 | ) | | | — |
| — |
|
Total net derivative fair values presented in the Consolidated Balance Sheets (3) | |
| $629 |
|
| $612 |
| | |
| $650 |
|
| $939 |
| |
| $625 |
|
| $485 |
| | |
| $629 |
|
| $612 |
|
(1) The notional or contractual amount of interest rate derivatives and foreign exchange contracts is the amount upon which interest and other payments under the contract are based. For interest rate derivatives, the notional amount isNotional amounts are typically not exchanged. Therefore, notional amounts should not be taken as the measure of credit or market risk, as they tend to greatly overstate the true economic risk of these contracts.
(2) Amounts represent the impact of legally enforceable master netting agreements that allow the Company to settle positive and negative positions.
(3) The Company also offsets assets and liabilities associated with repurchase agreements on the Consolidated Balance Sheets. See Note 3 “Securities” for further information.
The Company’s derivative transactions are internally divided into three sub-groups: institutional, customer and residential loan.
Institutional derivatives
The institutional derivatives portfolio primarily consists of interest rate swap agreements that are used to hedge the interest rate risk associated with the Company’s loans and financing liabilities (i.e., borrowed funds, deposits, etc.). The goal of the Company’s interest rate hedging activities is to manage interest rate sensitivity so that movements in interest rates do not significantly adversely affect net interest income.
The Company enters into certain interest rate swap agreements to hedge the risk associated with floating rate loans. By entering into pay-floating/receive-fixed interest rate swaps, the Company was able to minimize the variability in the cash flows of these assets due to changes in interest rates. The Company has outstanding interest rate swap agreements designed to hedge a portion of the Company’s borrowed funds and deposits. By entering into a pay-fixed/receive-floating interest rate swap, a portion of these liabilities has been effectively converted to a fixed rate liability for the term of the interest rate swap agreement. The Company has also entered into a forward-starting interest rate swap to minimize the exposure to variability in the interest cash flows on a forecasted fixed rate debt issuance.
The Company also uses receive-fixed/pay-floating interest rate swaps to manage the interest rate exposure on our medium term borrowings.
Customer derivatives
The customer derivatives portfolio consists of interest rate swap agreements and option contracts that are transacted to meet the financing needs of the Company’s customers. Offsetting swap and cap agreements are simultaneously transacted to
CITIZENS FINANCIAL GROUP, INC.
NOTES TO CONSOLIDATED FINANCIAL STATEMENTS
effectively eliminate the Company’s market risk associated with the customer derivative products. The customer derivatives portfolio also includes foreign exchange contracts that are entered into on behalf of customers for the purpose of hedging exposure related to cash orders and loans and deposits denominated in foreign currency. The primary risks associated with these transactions arise from exposure to changes in foreign currency exchange rates and the ability of the counterparties to meet the terms of the contract. To manage this market risk, the Company simultaneously enters into offsetting foreign exchange contracts.
CITIZENS FINANCIAL GROUP, INC.
NOTES TO CONSOLIDATED FINANCIAL STATEMENTS
Residential loan derivatives
The Company enters into residential loan commitments that allow residential mortgage customers to lock in the interest rate on a residential mortgage while the loan undergoes the underwriting process. The Company also uses forward sales contracts to protect the value of residential mortgage loans and loan commitments that are being underwritten for future sale to investors in the secondary market.
The Company has certain derivative transactions that are designated as hedging instruments described as follows:
Derivatives designated as hedging instruments
The Company’s totalentire institutional hedging portfolio qualifies for hedge accounting. This includes interest rate swaps that are designated in highly effective fair value and cash flow hedging relationships. The Company formally documents at inception all hedging relationships, as well as risk management objectives and strategies for undertaking various accounting hedges. Additionally, the Company uses dollar offset or regression analysis at the hedge’s inception, and monthly thereafter to assess whether the derivatives are expected to be, or have been, highly effective in offsetting changes in the hedged item’s expected cash flows. The Company discontinues hedge accounting when it is determined that a derivative is not expected to be or has ceased to be effective as a hedge, and then reflects changes in fair value in earnings after termination of the hedge relationship.
Fair value hedges
The Company has entered into an interest rate swap agreementagreements to manage the interest rate exposure on its medium term fixed-rate borrowing. This agreement involves the receipt of fixed-rate amounts in exchange for floating-rate interest payments over the life of the agreement.borrowings. The changes in fair value of the fair value hedges, to the extent that the hedging relationship is effective, are recorded through earnings and offset against changes in the fair value of the hedged item.
The following table summarizes certain information related to the Company’s fair value hedges:
| | | | | | | The Effect of Fair Value Hedges on Net Income |
| | The Effect of Fair Value Hedges on Net Income | Amounts Recognized in Other Income for the |
| | Amounts Recognized in Other Income for the Year Ended December 31, 2014 | | Amounts Recognized in Other Income for the Year Ended December 31, 2013 | Year Ended December 31, 2015 | | Year Ended December 31, 2014 |
| (in millions) | Derivative | Hedged Item | Hedge Ineffectiveness | | Derivative | Hedged Item | Hedge Ineffectiveness | Derivative | Hedged Item | Hedge Ineffectiveness | | Derivative | Hedged Item | Hedge Ineffectiveness |
| Hedges of interest rate risk on borrowing using interest rate swaps | ($4) | $4 | $— | | $— | |
| Hedges of interest rate risk on borrowings using interest rate swaps | |
| ($2 | ) |
| $2 |
|
| $— |
| |
| ($4 | ) |
| $4 |
|
| $— |
|
Cash flow hedges
The Company has outstanding interest rate swap agreements designed to hedge a portion of the Company’s floating rate assets, and financing liabilities (including its borrowed fundsfunds), and deposits).a forecasted debt issuance. All of these swaps have been deemed as highly effective cash flow hedges. The effective portion of the hedging gains and losses associated with these hedges are recorded in OCI; the ineffective portion of the hedging gains and losses is recorded in earnings (other income). Hedging gains and losses on derivative contracts reclassified from OCI to current period earnings are included in the line item in the accompanying Consolidated Statements of Operations in which the hedged item is recorded and in the same period that the hedged item affects earnings. During the next 12 months, approximately $17$9 million of net loss (pre-tax) on derivative instruments included in OCI is expected to be reclassified to net interest expense in the Consolidated Statements of Operations.
Hedging gains and losses associated with the Company’s cash flow hedges are immediately reclassified from OCI to current period earnings (other income) if it becomes probable that the hedged forecasted transactions will not occur during the originally specified time period.
CITIZENS FINANCIAL GROUP, INC.
NOTES TO CONSOLIDATED FINANCIAL STATEMENTS
The following table summarizes certain information related to the Company’s cash flow hedges:
| | The Effect of Cash Flow Hedges on Net Income and Stockholders' Equity | | | Amounts Recognized for the Year Ended December 31, | Amounts Recognized for the Year Ended December 31, |
| (in millions) | 2014 |
| | 2013 |
| | 2012 |
| 2015 |
| | 2014 |
| | 2013 |
|
Effective portion of gain (loss) recognized in OCI (1) |
| $334 |
| |
| ($59 | ) | |
| ($42 | ) |
| $150 |
| |
| $334 |
| |
| ($59 | ) |
Amounts reclassified from OCI to interest income (2) | 72 |
| | 56 |
| | — |
| 82 |
| | 72 |
| | 56 |
|
Amounts reclassified from OCI to interest expense (2) | (99 | ) | | (235 | ) | | (335 | ) | (59 | ) | | (99 | ) | | (235 | ) |
Amounts reclassified from OCI to net gains (3) | — |
| | (1 | ) | | (1 | ) | |
Ineffective portion of gain recognized in other income (4) | — |
| | — |
| | 1 |
| |
Amounts reclassified from OCI to net gain (3) | | — |
| | — |
| | (1 | ) |
(1) The cumulative effective gains and losses on the Company'sCompany’s cash flow hedging activities are included on the accumulated other comprehensive loss line item on the Consolidated Balance Sheets.
(2) This amount includes both (a) the amortization of effective gains and losses associated with the Company'sCompany’s terminated cash flow hedges and (b) the current reporting period'speriod’s interest settlements realized on the Company'sCompany’s active cash flow hedges. Both (a) and (b) were previously included on the accumulated other comprehensive loss line item on the Consolidated Balance Sheets and were subsequently recorded as adjustments to the interest expense of the underlying hedged item.
(3) This amount represents hedging gains and losses that have been immediately reclassified from accumulated other comprehensive loss based on the probability that the hedged forecasted transactions would not occur by the originally specified time period. This amount is reflected in the other net gains (losses) line item on the Consolidated Statements of Operations.
(4) This amount represents the net ineffectiveness recorded during the reporting periods presented plus any amounts excluded from effectiveness testing. These amounts are reflected in the other income line item on the Consolidated Statements of Operations.
Economic hedges
The Company’s customer derivatives are recorded on the Consolidated Balance Sheets at fair value. These include interest rate and foreign exchange derivative contracts that are transacted to meet the hedging and financing needs of the Company’s customers. Mark-to-market adjustments to the fair value of customer related interest rate contracts are included in other income in the accompanying Consolidated Statements of Operations. Mark-to-market adjustments to the fair value of foreign exchange contracts relating to foreign currency loans are included in interest and fees on loans and leases in the accompanying Consolidated Statements of Operations, while all other foreign currency contract fair value changes are included in foreign exchange and trade finance fees. In both cases, the mark-to-market gains and losses associated with the customer derivatives are mitigated by the mark-to-market gains and losses on the offsetting interest rate and foreign exchange derivative contracts transacted.
The Company’s residential loan derivatives (including residential loan commitments and forward sales contracts) are recorded on the Consolidated Balance Sheets at fair value. Mark-to-market adjustments to the fair value of residential loan commitments and forward sale contracts are included in noninterest income under mortgage banking fees.
The following table summarizes certain information related to the Company’s customer derivatives and economic hedges:
| | The Effect of Customer Derivatives and Economic Hedges on Net Income | | | Amounts Recognized in Noninterest Income for the Year Ended December 31, | Amounts Recognized in Noninterest Income for the Year Ended December 31, |
| (in millions) | 2014 |
| | 2013 |
| | 2012 |
| 2015 |
| | 2014 |
| | 2013 |
|
| Customer derivative contracts | | | | | | | | | | |
Customer interest rate contracts (1) |
| $240 |
| |
| $79 |
| |
| $292 |
|
| $140 |
| |
| $240 |
| |
| $79 |
|
Customer foreign exchange contracts (1) | (59 | ) | | 18 |
| | 10 |
| (18 | ) | | (59 | ) | | 18 |
|
Residential loan commitments (3)(2) | 6 |
| | (7 | ) | | 11 |
| (4 | ) | | 6 |
| | (7 | ) |
| | | | | | | |
| Economic hedges | | | | | | | | | | |
Offsetting derivatives transactions to hedge interest rate risk on customer interest rate contracts (1) | (209 | ) | | (30 | ) | | (285 | ) | (106 | ) | | (209 | ) | | (30 | ) |
Offsetting derivatives transactions to hedge foreign exchange risk on customer foreign exchange contracts (2) | 58 |
| | (15 | ) | | (10 | ) | |
Forward sale contracts (3) | (3 | ) | | 25 |
| | 8 |
| |
Offsetting derivatives transactions to hedge foreign exchange risk on customer foreign exchange contracts (3) | | 19 |
| | 58 |
| | (15 | ) |
Forward sale contracts (2) | | 1 |
| | (3 | ) | | 25 |
|
| Total |
| $33 |
| |
| $70 |
| |
| $26 |
|
| $32 |
| |
| $33 |
| |
| $70 |
|
(1) Reported in other income on the Consolidated Statements of Operations.
(2) Reported in foreign exchange and trade financemortgage banking fees on the Consolidated Statements of Operations.
(3) Reported in mortgage bankingforeign exchange and trade finance fees on the Consolidated Statements of Operations.
CITIZENS FINANCIAL GROUP, INC.
NOTES TO CONSOLIDATED FINANCIAL STATEMENTS
NOTE 1617 - COMMITMENTS AND CONTINGENCIES
The following is a summary of outstanding off-balance sheet arrangements:
|
| | | | | | | |
| | December 31, |
| (in millions) | 2015 |
| | 2014 |
|
| Commitment amount: | | | |
| Undrawn commitments to extend credit |
| $56,524 |
| |
| $55,899 |
|
| Financial standby letters of credit | 2,010 |
| | 2,315 |
|
| Performance letters of credit | 42 |
| | 65 |
|
| Commercial letters of credit | 87 |
| | 75 |
|
| Marketing rights | 47 |
| | 51 |
|
| Risk participation agreements | 26 |
| | 19 |
|
| Residential mortgage loans sold with recourse | 10 |
| | 11 |
|
| Total |
| $58,746 |
| |
| $58,435 |
|
Commitments to Extend Credit
Commitments to extend credit are agreements to lend to customers in accordance with conditions contractually agreed upon in advance. Generally, the commitments have fixed expiration dates or termination clauses and may require payment of a fee. Since many of these commitments are expected to expire without being drawn upon, the contract amounts are not necessarily indicative of future cash requirements.
When-issued securities are agreements to purchase securities that have been authorized for issuance but not yet issued. The fair value of when-issued securities is reflected in the Consolidated Balance Sheets at trade date.
In December 2014, the Company committed to purchasing pools of performing student loans with principal balances outstanding of approximately $260 million. The specific loans to be purchased were identified in January 2015 and the transactions were settled in January and February 2015.
In July 2014, the Company created a commercial loan trading desk to provide ongoing secondary market support and liquidity to its clients. Unsettled loan trades (i.e., loan purchase contracts) represent firm commitments to purchase loans from a third party at an agreed-upon price. Principal amounts associated with unsettled commercial loan trades will remain off-balance sheet, as delivery of the loans has not taken place. However fair value adjustments associated with each unsettled loan trade will be recognized on the Consolidated Balance Sheets and classified within other assets or other liabilities, depending on whether the fair value of the unsettled trade represents an unrealized gain or unrealized loss. The principal balance of unsettled commercial loan trades was $40 million at December 31, 2014. Settled loans purchased by the trading desk are classified as commercial loans held for sale on the Consolidated Balance Sheets. Refer to Note 19 “Fair Value Measurements” for further information.
In May 2014, the Company entered into an agreement to purchase automobile loans on a quarterly basis in future periods. For the first year, the agreement requires the purchase of a minimum of $250 million of outstanding balances to a maximum of $600 million per quarterly period. For quarterly periods after the first year, the minimum and maximum purchases are $400 million and $600 million, respectively. The agreement automatically renews until terminated by either party. The Company may cancel the agreement at will with payment of a variable termination fee. After three years, there is no termination fee.
During 2003, the Company entered into a 25-year agreement to acquire the naming and marketing rights of a baseball stadium in Pennsylvania. The Company has paid $3 million on this contract for the year ended December 31, 2014 and $3 million for the year ended December 31, 2013 and is obligated to pay $51 million over the remainder of the contract.
Letters of Credit
Standby letters of credit, both financial and performance, are issued by the Company for its customers. They are used as conditional guarantees of payment to a third party in the event the customer either fails to make specific payments (financial) or fails to complete a specific project (performance). Commercial letters of credit are used to facilitate the import of goods. The commercial letter of credit is used as the method of payment to the Company’s customers’ suppliers. The Company’s exposure to credit loss in the event of counterparty nonperformance in connection with the above instruments is represented by the contractual amount of those instruments, net of the value of collateral held. Standby letters of credit and commercial letters of credit are issued for terms of up to ten years and one year, respectively.
Generally, letters of credit are collateralized by cash, accounts receivable, inventory or investment securities. Credit risk associated with letters of credit is considered in determining the appropriate amounts of reserves for unfunded commitments.
The Company recognizes a liability on the Consolidated Balance Sheets representing its obligation to stand ready to perform over the term of the standby letters of credit in the event that the specified triggering events occur. The liability for these guarantees was $3 million at December 31, 2015 and 2014.
Marketing Rights
During 2003, the Company entered into a 25-year agreement to acquire the naming and marketing rights of a baseball stadium in Pennsylvania. The Company paid approximately $3 million for the years ended December 31, 2015 and 2014, and 2013 was $3 million.
is obligated to pay $47 million over the remainder of the contract.
Risk Participation Agreements
RPAs are guarantees issued by the Company to other parties for a fee, whereby the Company agrees to participate in the credit risk of a derivative customer of the other party. Under the terms of these agreements, the “participating bank” receives a fee from the “lead bank” in exchange for the guarantee of reimbursement if the customer defaults on an interest rate swap. The interest rate swap is transacted such that any and all exchanges of interest payments (favorable and unfavorable) are made between the lead bank and the customer. In the event that an early termination of the swap occurs and the customer is unable to make a required close out payment, the participating bank assumes that obligation and is required to make this payment.
CITIZENS FINANCIAL GROUP, INC.
NOTES TO CONSOLIDATED FINANCIAL STATEMENTS
RPAs where the Company acts as the lead bank are referred to as “participations-out,” in reference to the credit risk associated with the customer derivatives being transferred out of the Company. Participations-out generally occur concurrently with the sale of new customer derivatives. RPAs where the Company acts as the participating bank are referred to as “participations-in,” in reference to the credit risk associated with the counterparty’s derivatives being assumed by the Company. The Company’s maximum credit exposure is based on its proportionate share of the settlement amount of the referenced interest rate swap. Settlement amounts are generally calculated based on the fair value of the swap plus outstanding accrued interest receivables from the customer.
CITIZENS FINANCIAL GROUP, INC.
NOTES TO CONSOLIDATED FINANCIAL STATEMENTS
The Company’s estimate of the credit exposure associated with its risk participations-in as of December 31, 2015 and 2014 and 2013 is $19$26 million and $17$19 million, respectively. The current amount of credit exposure is spread out over 7184 counterparties. RPAs generally have terms ranging from 1-5 years; however, certain outstanding agreements have terms as long as 1110 years.
Other Commitments
Other GuaranteesIn November 2015, the Company entered into an agreement with RBS to purchase $500 million of its subordinated notes held by RBS by July 30, 2016, subject to regulatory approval and rating agency considerations. See Note 19 “Related Party Transactions and Significant Transactions with RBS,” for more information.
In June 2015, the Company amended its agreement originally entered into in May 2014, to purchase automobile loans on a quarterly basis in future periods. Commencing on the effective date of June 25, 2015 and through July 31, 2015, the amended agreement required the purchase of a minimum of $250 million of outstanding balances to a maximum of $600 million per quarterly period. For quarterly periods on or after August 1, 2015, the minimum and maximum purchases are $50 million and $200 million, respectively. The agreement automatically renews until terminated by either party. The Company has issuedmay cancel the agreement at will with payment of a guarantee to RBS, for avariable termination fee. There is no termination fee wherebyafter three years from the original agreement.
In July 2014, the Company will absorb credit losses relatedcreated a commercial loan trading desk to the sale of option contracts by RBSprovide ongoing secondary market support and liquidity to customersits clients. Unsettled loan trades (i.e., loan purchase contracts) represent firm commitments to purchase loans from a third party at an agreed-upon price. Principal amounts associated with unsettled commercial loan trades are off-balance sheet commitments until delivery of the Company. There were outstanding option contractsloans has taken place. Fair value adjustments associated with a notionaleach unsettled loan trade are recognized on the Consolidated Balance Sheets and classified within other assets or other liabilities, depending on whether the fair value of $2the unsettled trade represents an unrealized gain or unrealized loss. The principal balance of unsettled commercial loan trade purchases and sales were $69 million and none$75 million, respectively, at December 31, 20132015. Settled loans purchased by the trading desk are classified as loans held for sale, at fair value on the Consolidated Balance Sheets. Refer to Note 20 “Fair Value Measurements” for further information.
On January 7, 2016, the Company entered into an agreement to purchase student loans on a quarterly basis beginning with the first calendar quarter in 2016 and 2014,ending with the fourth calendar quarter in 2016. Under the terms of the agreement, the Company committed to purchase a minimum of $125 million of loans per quarter. The minimum and maximum amount of the aggregate purchase principal balance of loans under the terms of the agreement are $500 million and $1 billion, respectively.
The following isagreement will terminate immediately if at any time during its term the aggregate purchase principal balance of loans equals the maximum amount. The agreement may be extended by written agreement of the parties for an additional four quarters. The Company may terminate the agreement at will with payment of a summarytermination fee equal to the product of outstanding off-balance sheet arrangements:
|
| | | | | | | |
| | December 31, |
| (in millions) | 2014 |
| | 2013 |
|
| Commitment amount: | | | |
| Undrawn commitments to extend credit |
| $55,899 |
| |
| $53,987 |
|
| Financial standby letters of credit | 2,315 |
| | 2,556 |
|
| Performance letters of credit | 65 |
| | 149 |
|
| Commercial letters of credit | 75 |
| | 64 |
|
| Marketing rights | 51 |
| | 54 |
|
| Risk participation agreements | 19 |
| | 17 |
|
| Residential mortgage loans sold with recourse | 11 |
| | 13 |
|
| Total |
| $58,435 |
| |
| $56,840 |
|
Contingencies
The Company operates in a legal and regulatory environment that exposes it to potentially significant risks. A certain amount of litigation ordinarily results from the nature of the Company’s banking and other businesses. The Company is a party to legal proceedings, including class actions. ItThe Company is also the subject of investigations, reviews, subpoenas, and regulatory matters arising out of its normal business operations, which, in some instances, relate to concerns about fair lending, unfair and/or deceptive practices, mortgage-related issues, and mis-selling of certain products. In addition, the Company engages in discussions with relevant governmental and regulatory authorities on a regular and ongoing basis regarding various issues, and any issues discussed or identified may result in investigatory or other action being taken. Litigation and regulatory matters may result in settlements, damages, fines, penalties, public or private censure, increased costs, required remediation, restrictions on business activities, or other impacts on the Company.
In these disputes and proceedings, the Company contests liability and the amount of damages as appropriate. Given their complex nature, it may be years before some of these matters are finally resolved. Moreover, before liability can be reasonably estimated for a claim, numerous legal and factual issues may need to be examined, including through potentially lengthy discovery and determination of important factual matters, and by addressing novel or unsettled legal issues relevant to the proceedings in question.
The Company cannot predict with certainty if, how, or when such claims will be resolved or what the eventual settlement, fine, penalty or other relief, if any, may be, particularly for claims that are at an early stage in their development or where claimants seek substantial or indeterminate damages. The Company recognizes a provision for a claim when, in the opinion of management after seeking legal advice, it is probable that a liability exists and the amount of loss can be reasonably estimated. In many proceedings, however, it is not possible to determine whether any loss is probable or to estimate the amount of any loss. In each of the matters described below, the Company is unable to estimate the liability in excess of any provision accrued, if any, that
CITIZENS FINANCIAL GROUP, INC.
NOTES TO CONSOLIDATED FINANCIAL STATEMENTS
might arise or its effects on the Company’s Consolidated Statements of Operations or Consolidated Statements of Cash Flows in any particular period.
Set out below are descriptions of significant legal matters involving the Company and its banking subsidiaries. Based on information currently available, the advice of legal counsel and other advisers, and established reserves, management believes that the aggregate
CITIZENS FINANCIAL GROUP, INC.
NOTES TO CONSOLIDATED FINANCIAL STATEMENTS
liabilities, if any, potentially arising from these proceedings will not have a materially adverse effect on the Company’s unaudited interim Consolidated Financial Statements.
Consumer Products Matters
The activities of the Company’s bankbanking subsidiaries are subject to extensive laws and regulations concerning unfair or deceptive acts or practices in connection with customer products. Certain of the bankbanking subsidiaries’ past practices with respect to overdraft protection and other consumer products have not met applicable standards. The bank subsidiariesstandards, and they have implemented and are continuing to implement changes to improve and bring their practices in accordance with regulatory guidance. The Company and its banking subsidiaries have actively pursued resolution of the legacy regulatory enforcement matters set forth below.
In AprilAs previously reported, CBNA is currently subject to a consent order issued in 2013 by the bankOCC in connection with its findings of deceptive marketing and implementation of some of our checking account and funds transfer products and services. Among other things, the consent order requires us to remedy deficiencies and develop stronger compliance controls, policies and procedures. The Company and its banking subsidiaries consentedare also currently subject to consent orders issued in August 2015 by the issuance of orders byCFPB, the OCC and the FDIC (the Consent Orders). In the Consent Orders (which are publicly availablein connection with past deposit reconciliation practices, and will remainCBNA is subject to a consent order issued in effect until terminatedNovember 2015 by the regulators), the bank subsidiaries neither admitted nor denied the regulators’ findings that they had engagedOCC in deceptive marketingconnection with past billing and implementation of the bank’s overdraft protection program, checking rewards programs, and stop-payment process for pre-authorized recurring electronic fund transfers. Under the Consent Orders, the bank subsidiaries paid a total of $10 million in civil monetary penalties and $8 million in restitutionsales practices pertaining to affected customers, agreed to cease and desist any operations in violation of Section 5 of the Federal Trade Commission Act, and submit to the regulators periodic written progress reports regarding compliance with the Consent Orders. In addition, CBNA agreed to take certain remedial actions to improve its compliance risk management systems and to create a comprehensive action plan designed to achieve compliance with the Consent Orders. Restitution plans have been prepared and submitted for approval, and CBNA has submitted for approval, and is in the process of implementing, its action plan for compliance with the Consent Orders, as well as updated policies, procedures, and programs related to its compliance risk management systems.
The Company's banking subsidiaries have engaged in discussions with regulators regarding, among other things, certain identity theft and debt cancellation products, signature debit transactions and certain overdraft fees, identifying and correcting errors in customer deposits, andunder which the charging of cost-based credit card late payment fees. The banking subsidiariesapplicable regulators will have paidto provide non-objections to, among other things, restitution regarding some ofplans for affected customers.
Accordingly, all financial penalties associated with these practices and it is probable that there will be additional restitution to certain affected customers in connection with certain of these practices. In addition, the banking subsidiaries could face formal administrativelegacy regulatory enforcement actions from their federal supervisory agencies, including the assessment of civil monetary penalties and restitution, relating to the past practices and policies identified above and other consumer products, as well as potential civil litigation.
Telephone Consumer Protection Act Litigation
The Company is a defendant in a purported class action complaint filed in December 2013 in the United States District Court for the Southern District of California pursuant to the Telephone Consumer Protection Act. The named plaintiff purports to represent a “national class” of customers who allegedly received automated calls to their cell phones from the bank or its agents, without customer consent, in violation of the Telephone Consumer Protection Act. The Company is vigorously defending this matter, but is unable to predict the outcome of this matter.
LIBOR Litigation
The Company is a defendant in lawsuits in which allegationsmatters have been made that its parent company, RBS Group, manipulated U.S. dollar LIBORpaid, and substantially all remediation related to the detriment of the Company's customers. The lawsuits include a purported class action on behalf of borrowers of the Company whose interest rates were tiedsuch legacy matters is expected to U.S. dollar LIBOR. The plaintiffs in these cases assert various theories of liability, including fraud, negligent misrepresentation, breach of contract, and unjust enrichment. The Company is vigorously defending these matters, but is unable to predict the outcome of these matters.
Foreclosure-Related Expenses
In May 2013, the civil division of the U.S. Attorney's Office for the Southern District of New York served a subpoena pursuant to the Financial Institutions Reform, Recovery and Enforcement Act of 1989 seeking information regarding home mortgage foreclosure expenses submitted for reimbursement to the United States Department of Housing and Urban Development, FNMA, or FHLMC. The Company is cooperating with the investigation.
Mortgage Repurchase Demands
The Company is an originator and servicer of residential mortgages and routinely sells such mortgage loans in the secondary market and to government-sponsored entities. In the context of such sales, the Company makes certain representations and warranties regarding the characteristics of the underlying loans and, as a result, may be contractually required to repurchase such loans or indemnify certain parties against losses for certain breaches of those representations and warranties. Between the start of January 2009 and December 31, 2014, the Company received approximately $158 million in repurchase demands and $99 million
CITIZENS FINANCIAL GROUP, INC.
NOTES TO CONSOLIDATED FINANCIAL STATEMENTS
in indemnification payment requests in respect of loans originated, for the most part, since 2003. Of those claims presented, $88 million was paid to repurchase residential mortgage loans, and $33 million was incurred for indemnification costs to make investors whole. The Company repurchased mortgage loans totaling $25 million and $35 million for the years ended December 31, 2014 and 2013, respectively. The Company incurred indemnification costs of $8 million and $12 million for the years ended December 31, 2014 and 2013, respectively. The Company cannot estimate what the future level of repurchase demands will be or the Company’s ultimate exposure, and cannot give any assurance that its historical experience will continue in the future. The volume of repurchase demands may increase. In addition to the above, the Company responded to subpoenas issuedresolved by the Officeend of the Inspector General for the Federal Housing Finance Agency in December 2013 which requested information about loans sold to FNMA and the FHLMC from 2003 through 2011. The Company is cooperating with the investigation.
2016.
NOTE 1718 - DIVESTITURES AND BRANCH ASSETS AND LIABILITIES HELD FOR SALE
There were no branch-related divestitures of assets and liabilities during 2015.
On June 20, 2014, wethe Company completed the sale of certain assets and liabilities associated with ourthe Chicago-area retail branches, small business relationships and select middle market relationships to U.S. Bancorp. The agreement to sell these assets and liabilities to U.S. Bancorp had previously been announced in January 2014. This sale included 103 retail branches located in Illinois, including certain customer deposits of $4.8 billion and selected loans of $1.0 billion (primarily middle market, small business, home equity and credit card balances). As a result of this transaction, the Company recorded a gain on sale of $288 million consisting of $286 million related to the deposits, a gain on sale of $11 million related to the loans and a $9 million loss on sale of other branch assets. For the year ended December 31, 2014, the corresponding interest and fees on these loans was $20 million and interest expense on deposits was $4 million. AsThere was no impact on the Consolidated Statements of Operations for the year ended December 31, 2015 as a result of this transaction, the related assets and liabilities were classified as held for sale as of December 31, 2013.transaction.
The following table presents the assets and liabilities held for sale related to this transaction as of December 31, 2013:
|
| | | |
(in millions) | |
Loans held for sale: | |
Commercial |
| $551 |
|
Commercial real estate | 49 |
|
Total commercial | 600 |
|
Home equity loans | 50 |
|
Home equity lines of credit | 339 |
|
Credit cards | 82 |
|
Other retail | 7 |
|
Total retail | 478 |
|
Total loans held for sale | 1,078 |
|
Other branch assets held for sale: | |
Properties and equipment, net | 46 |
|
Total other branch assets held for sale | 46 |
|
Total branch assets held for sale |
| $1,124 |
|
Deposits held for sale: | |
Demand |
| $1,020 |
|
Checking with interest | 849 |
|
Regular savings | 504 |
|
Money market accounts | 2,013 |
|
Term Deposits | 891 |
|
Total deposits held for sale | 5,277 |
|
Total branch liabilities held for sale |
| $5,277 |
|
CITIZENS FINANCIAL GROUP, INC.
NOTES TO CONSOLIDATED FINANCIAL STATEMENTS
NOTE 1819 - RELATED PARTY TRANSACTIONS AND SIGNIFICANT TRANSACTIONS WITH RBS
On November 3, 2015, RBS completed the sale of all of its remaining shares of CFG’s common stock. The Company is an indirect subsidiaryparenthetical disclosures on the Consolidated Balance Sheets, Consolidated Statements of RBSG. Operations, and Consolidated Statements of Cash Flows as well as the tables and discussions below include significant related party transactions with RBS prior to the Company’s separation from RBS and significant transactions subsequent to the separation.
In September 2014, the Company entered into certain agreements with RBS Group that will provideestablished a framework for its ongoing relationship with RBS Group.RBS. Specifically, the Company entered into the following agreements with RBSG or other affiliates of RBS Group:RBS: Separation and Shareholder Agreement, Registration Rights Agreement, Trade Mark License Agreement, Amended and Restated Master Services Agreement, and Transitional Services Agreements. These agreementsIn connection with RBS’s exit of its ownership in our common stock in 2015, the Separation and Shareholder Agreement and the Registration Rights Agreement were filed as exhibits in Part II, Item 6 — Exhibits toterminated and the Company's Quarterly Report on Form 10-Q/A filed November 14, 2014.Trademark License Agreement was partially terminated.
CITIZENS FINANCIAL GROUP, INC.
NOTES TO CONSOLIDATED FINANCIAL STATEMENTS
The following is a summary of inter-company borrowed funds:funds from RBS:
| | | | | December 31, | Interest | | Maturity | | December 31, |
| (dollars in millions) | Related Party | | Interest Rate | | Maturity Date | | 2014 |
| | 2013 |
| Rate | | Date | | 2015 |
| | 2014 |
|
| Subordinated debt | RBSG | | 4.082% | | January 2025 | | $334 | |
| $— |
| 5.158 | % | | June 2023 | | $333 | |
| $333 |
|
| | RBSG | | 4.023% | | October 2024 | | 333 |
| | — |
| 4.771 | % | | October 2023 | | — |
| | 333 |
|
| | RBSG | | 4.153% | | July 2024 | | 333 |
| | — |
| 4.691 | % | | January 2024 | | — |
| | 334 |
|
| | RBSG | | 4.691% | | January 2024 | | 334 |
| | 334 |
| 4.153 | % | (1) | July 2024 | | 250 |
| | 333 |
|
| | RBSG | | 4.771% | | October 2023 | | 333 |
| | 333 |
| 4.023 | % | | October 2024 | | 333 |
| | 333 |
|
| | RBS | | 5.158% | | June 2023 | | 333 |
| | 333 |
| 4.082 | % | | January 2025 | | 334 |
| | 334 |
|
Total(1) Interest is payable until January 1, 2016 at a fixed rate per annum of 4.153% and at a fixed rate per annum of 3.750% thereafter.
The following table presents total interest expense recorded on inter-company subordinated debt was $64 million, $16 million and $9 million for the years endedwith RBS:
|
| | | | | | | | | | | |
| | Year Ended December 31, |
| (in millions) | 2015 |
| | 2014 |
| | 2013 |
|
| Interest expense on subordinated debt |
| $76 |
| |
| $64 |
| |
| $16 |
|
On December 31, 2014, 2013 and 2012, respectively.
During the fourth quarter of 2014,3, 2015, the Company purchasedrepurchased $750 million of outstanding subordinated debt instruments held by RBS. The $3 million difference between the reacquisition price and the net carrying amount of the repurchased debt was recognized as a portfoliogain on extinguishment of performing commercial loans to customersthe debt and is presented in other income in the oil and gas industry from RBS. The Company paid $413 million, which was the estimated fair value corroborated by an independent appraiser, asConsolidated Statement of the purchase dates, to purchase 17 customer relationships with outstanding principal balances of $417 million and unfunded commitments totaling $458 million. Also related to these loans,Operations. In November 2015, the Company entered into offsetting customer derivative contractsan agreement with RBS to purchase an aggregate notional amountadditional $500 million of $946 million,its subordinated notes held by RBS by July 30, 2016, subject to regulatory approval and an aggregate fair value of ($17) thousand on the purchase dates.
The Company maintained a $50 million revolving line of credit at December 31, 2013 with RBS. This line of credit was not drawn upon at December 31, 2013, expired on January 31, 2014, and was not renewed. No interest expense was incurred on this revolving line of credit for the year ended December 31, 2013.ratings agency considerations.
The Company enters into interest rate swap agreements with RBS for the purpose of reducing the Company’s exposure to interest rate fluctuations. AsThe following table presents a summary of December 31, 2014, the total notional amount of swaps outstanding was $5.8 billion with fixed rates ranging from 1.66% to 4.30%. Included in this balance were $4.0 billion of receive-fixed swaps with rates ranging from 1.78% to 2.04% maturing in 2023 and $1.0 billion of pay fixed swaps with fixed rates ranging from 4.18% to 4.30% maturing in 2016. these swap agreements:
|
| | | | | | | | | | | |
| | December 31, 2015 | | December 31, 2014 |
| (dollars in millions) | Notional | Fixed Rates | Maturity Date | | Notional | Fixed Rates | Maturity Date |
| Receive-fixed swaps |
| $6,700 |
| 0.77% to 2.04% | 2017 - 2023 | |
| $4,750 |
| 1.66% to 2.04% | 2019 - 2023 |
| Pay-fixed swaps | 3,500 |
| 1.96% to 4.30% | 2016 - 2023 | | 1,000 |
| 4.18% to 4.30% | 2016 |
| Total |
| $10,200 |
| | | |
| $5,750 |
| | |
The company also has a medium term swap agreement with a notional of $750 million and a receive-fixed rate of 1.66% that had been executed as of December 31, 2014. As of December 31, 2013, the total notional amount of swaps outstanding was $5.5 billion, with fixed rates ranging from 1.78% to 5.47%. Included in this balance were $1.5 billion of pay-fixed swaps with fixed rates ranging from 4.18% to 5.47% with maturities from 2014 through 2016 and $4.0 billion of receive-fixed swaps with fixed rates ranging from 1.78% to 2.04% maturing in 2023. The Company recordedfollowing table presents net interest expense of $27 million, $146 million, and $311 million forincome (expense) recorded by the years ended December 31, 2014, 2013, and 2012, respectively. The lower pay-fixed swaps expense and higherCompany in relation to interest income on the receive-fixed swaps resulted in lower expense in 2014 and 2013 compared to 2012.rate swap agreements with RBS:
|
| | | | | | | | | | | |
| | Year Ended December 31, |
| (in millions) | 2015 |
| | 2014 |
| | 2013 |
|
| The effect of related party interest rate swap agreements on net interest income |
| $12 |
| |
| ($27 | ) | |
| ($146 | ) |
In order to meet the financing needs of its customers, the Company enters into interest rate swap and cap agreements with its customers and simultaneously enters into offsetting swap and cap agreements with RBS. The Company earns a spread equal to the difference between rates charged to the customer and rates charged by RBS. The notional amount of these interest rate swap and cap agreements outstanding with RBS was $9.8$6.5 billion and $13.4$9.8 billion at December 31, 20142015 and 2013, respectively. The Company recorded expense of $209 million, $32 million, and $285 million within other income for the years ended December 31, 2014, 2013, and 2012, respectively.
Also to meet the financing needs of its customers, the Company enters into a variety of foreign currency denominated products, such as loans, deposits and foreign exchange contracts. To manage the foreign exchange risk associated with these products, the Company simultaneously enters into offsetting foreign exchange contracts with RBS. The Company earns a spread equal to the difference between rates charged to the customer and rates charged by RBS. The notional amount of foreign exchange contracts outstanding with RBS was $4.7$3.6 billion and $4.6$4.7 billion at December 31, 20142015 and 2013, respectively. Within foreign exchange and trade finance fees, the Company recorded income of $58 million for the year ended December 31, 2014, and expense of $15 million and $9 million for the years ended December 31, 2013 and 2012, respectively.
CITIZENS FINANCIAL GROUP, INC.
NOTES TO CONSOLIDATED FINANCIAL STATEMENTS
The following table presents the income (expense) recorded by the Company in relation to the interest rate swap and cap agreements and foreign exchange contracts with RBS:
|
| | | | | | | | | | | |
| | Year Ended December 31, |
| (in millions) | 2015 |
| | 2014 |
| | 2013 |
|
| The effect of related party interest rate swap and cap agreements on other income |
| ($105 | ) | |
| ($209 | ) | |
| ($32 | ) |
| The effect of related party foreign exchange contracts on foreign exchange and trade finance fees | 19 |
| | 58 |
| | (15 | ) |
The Company receives income for providing services and referring customers to RBS. The Company also shares office space with certain RBS entities for which rent expense and/or income is recorded in occupancy expense. The total fee income, net of occupancy expense, was $16 million, $26 million, and $28 million for the years ended December 31, 2014, 2013, and 2012, respectively. Also, the Company receives certain services provided by RBS and by certain RBS entities, the fees for which were recorded in outside services expense. Total
The following table presents the effect of the related party fees on total fee income and outside services expense was $22services:
|
| | | | | | | | | | | |
| | Year Ended December 31, |
| (in millions) | 2015 |
| | 2014 |
| | 2013 |
|
| The effect of related party service and referral fees, net of occupancy expense, on total fee income |
| $10 |
| |
| $16 |
| |
| $26 |
|
| The effect of related party service fees on outside services | 11 |
| | 22 |
| | 20 |
|
The Company paid $71 million, $20$124 million and $21$185 million in regular common stock dividends to RBS for the years ended December 31, 2015, 2014 and 2013, and 2012, respectively.
In Additionally, in 2014 and 2013, the Company paid $666 million and $1.0 billion, respectively, of common stock dividends to RBS as part of exchange transactions.
Additionally, the Company paid $124 million, $185 million and $150 millionhas engaged in regularrepurchases of its common stock dividendsdirectly from RBS. Refer to RBSNote 13 “Stockholders’ Equity” for the years ended December 31, 2014, 2013 and 2012, respectively.
On October 8, 2014, Citizens executed a capital exchange transaction which involved the issuance of $334 million of 10-year subordinated notes to RBSG at a rate of 4.082% and the simultaneous repurchase of 14,297,761 shares of common stock owned by RBS Group for a total cost of $334 million and an average price per share of $23.36. The purchase price per share was the average of the daily volume-weighted average price of a share of our common stock as reported by the New York Stock Exchange over the five trading days preceding the purchase date.further information.
The Company, as a matter of policy and during the ordinary course of business with underwriting terms similar to those offered to the public, has made loans toentered into credit facilities with directors and executive officers and their immediate families, as well as their affiliated companies. Such loansExtensions of credit amounted to $126$136 million and $78$126 million at December 31, 2015 and December 31, 2014, and 2013, respectively.
NOTE 1920 - FAIR VALUE MEASUREMENTS
As discussed in Note 1 “Significant Accounting Policies,” the Company measures or monitors many of its assets and liabilities on a fair value basis. Fair value is used on a recurring basis for assets and liabilities for which fair value is the required or elected measurement basis of accounting. Additionally, fair value is used on a nonrecurring basis to evaluate assets for impairment or for disclosure purposes. Nonrecurring fair value adjustments typically involve the application of lower of cost or market accounting or write-downs of individual assets. The Company also applies the fair value measurement guidance to determine amounts reported for certain disclosures in this Note for assets and liabilities not required to be reported at fair value in the financial statements.
Fair Value Option, Residential Mortgage Loans Held for Sale
The Company elected to account for residential mortgage loans held for sale and certain commercial and commercial real estate loans held for sale at fair value. Applying fair value accounting to the residential mortgage loans held for sale better aligns the reported results of the economic changes in the value of these loans and their related hedge instruments. Certain commercial and commercial real estate held for sale loans are managed by a commercial secondary loan desk that provides liquidity to banks, finance companies and institutional investors. Applying fair value accounting to this portfolio is appropriate because the Company holds these loans with the intent to sell within short term periods.
Fair Value Option, Residential Mortgage Loans Held for Sale
The fair value of residential loans held for sale is derived from observable mortgage security prices and includes adjustments for loan servicing value, agency guarantee fees, and other loan level attributes which are mostly observable in the marketplace. Credit risk does not significantly impact the valuation since these loans are sold shortly after origination. Therefore, the Company classifies the residential mortgage loans held for sale in Level 2 of the fair value hierarchy.
The following table summarizes the difference between the aggregate fair value and the aggregate unpaid principal balance for residential mortgage loans held for sale measured at fair value:183
CITIZENS FINANCIAL GROUP, INC.
|
| | | | | | | | | | | | | | | | | | | | | | | |
| | December 31, 2014 | | December 31, 2013 |
| (in millions) | Aggregate Fair Value | | Aggregate Unpaid Principal | | Aggregate Fair Value Less Aggregate Unpaid Principal | | Aggregate Fair Value | | Aggregate Unpaid Principal | | Aggregate Fair Value Less Aggregate Unpaid Principal |
| Residential mortgage loans held for sale, at fair value |
| $213 |
| |
| $206 |
| |
| $7 |
| |
| $176 |
| |
| $173 |
| |
| $3 |
|
The election of the fair value option for financial assets and financial liabilities is optional and irrevocable. The loans accounted for under the fair value option are initially measured at fair value (i.e., acquisition cost) when the financial asset is acquired. Subsequent changes in fair value are recognized in current earnings.mortgage banking fees on the Consolidated Statements of Operations. The Company recognized mortgage banking noninterest income (expense) of ($2) million, $5 million, and ($33) million and $6 million for the years ended December 31, 2015, 2014 and 2013, and 2012, respectively.
Interest income on residential mortgage loans held for sale is calculated based on the contractual interest rate of the loan and is recorded in interest income.
CITIZENS FINANCIAL GROUP, INC.
NOTES TO CONSOLIDATED FINANCIAL STATEMENTS
Fair Value Option, Commercial and Commercial Real Estate Loans Held for Sale
The Company elected to account for certain commercial and commercial real estate loans held for sale at fair value. These loans are managed by a commercial secondary loan desk that provides liquidity to banks, finance companies and institutional investors. Applying fair value accounting to this portfolio is appropriate because the Company holds these loans with the intent to sell within short term periods.
The fair value of commercial and commercial real estate loans held for sale is estimated using observable prices of identical or similar loans that transact in the marketplace. In addition, the Company uses external pricing services that provide estimates of fair values based on quotes from various dealers transacting in the market, sector curves or benchmarking techniques. Therefore, the Company classifies the commercial and commercial real estate loans managed by the commercial secondary loan desk in Level 2 of the fair value hierarchy given the observable market inputs.
The following table summarizes the difference between the aggregate fair value and the aggregate unpaid principal balance for commercial and commercial real estate loans held for sale measured at fair value:
|
| | | | | | | | | | | |
| | December 31, 2014 |
| (in millions) | Aggregate Fair Value | | Aggregate Unpaid Principal | | Aggregate Fair Value Less Aggregate Unpaid Principal |
| Commercial and commercial real estate loans held for sale, at fair value |
| $43 |
| |
| $43 |
| |
| $— |
|
There were no loans in this portfolio that were 90 days or more past due or nonaccruing as of December 31, 2014.2015. The loans accounted for under the fair value option are initially measured at fair value when the financial asset is recognized. Subsequent changes in fair value are recognized in current earnings. Since all loans in the Company'sCompany’s commercial trading portfolio consist of floating rate obligations, all changes in fair value are due to changes in credit risk. Such credit-related fair value changes may include observed changes in overall credit spreads and/or changes to the creditworthiness of an individual borrower. Unsettled trades within the commercial trading portfolio are not recognized on the Consolidated Balance Sheets and represent off-balance sheet commitments. Refer to Note 1617 “Commitments and Contingencies” for further information.
Interest income on commercial and commercial real estate loans held for sale is calculated based on the contractual interest rate of the loan and is recorded in interest income. Additionally, the Company recognized $3 million and $1 million for the yearyears ended December 31, 2015 and 2014, respectively, in other noninterest income related to its commercial trading portfolio. There was no interest income or noninterest income recorded for the year ended December 31, 2013.
The following table summarizes the difference between the aggregate fair value and the aggregate unpaid principal balance loans held for sale measured at fair value:
|
| | | | | | | | | | | | | | | | | | | |
| | December 31, 2015 | | December 31, 2014 |
| (in millions) | Aggregate Fair Value | Aggregate Unpaid Principal | Aggregate Fair Value Less Aggregate Unpaid Principal | | Aggregate Fair Value | Aggregate Unpaid Principal | Aggregate Fair Value Less Aggregate Unpaid Principal |
| Residential mortgage loans held for sale, at fair value |
| $268 |
|
| $263 |
|
| $5 |
| |
| $213 |
|
| $206 |
|
| $7 |
|
| Commercial and commercial real estate loans held for sale, at fair value | 57 |
| 57 |
| — |
| | 43 |
| 43 |
| — |
|
Recurring Fair Value Measurements
The Company utilizes a variety of valuation techniques to measure its assets and liabilities at fair value. Following is a description of valuation methodologies used for significant assets and liabilities carried on the balance sheet at fair value on a recurring basis:
Securities AFSavailable for sale
The fair value of securities classified as AFS is based upon quoted prices, if available. Where observable quoted prices are available in an active market, securities are classified as Level 1 in the fair value hierarchy. Classes of instruments that are valued using this market approach include debt securities issued by the U.S. Treasury. If quoted market prices are not available, the fair value for the security is estimated by using pricing models, quoted prices of securities with similar characteristics or discounted cash flows. These instruments are classified as Level 2 because they currently trade in active markets and the inputs to the valuations are observable. The pricing models used to value securities generally begin with market prices (or rates) for similar instruments and make adjustments based on the unique characteristics of the instrument being valued. These adjustments reflect assumptions made regarding the sensitivity of each security’s value to changes in interest rates and prepayment speeds.
CITIZENS FINANCIAL GROUP, INC.
NOTES TO CONSOLIDATED FINANCIAL STATEMENTS
Classes of instruments that are valued using this market approach include residential and commercial CMOs, specified pool mortgage “pass-through” securities and other debt securities issued by U.S. government-sponsored entities and state and political subdivisions.
A significant majority of the Company’s Level 1 and 2 securities are priced using an external pricing service. The Company verifies the accuracy of the pricing provided by its primary outside pricing service on a quarterly basis. This process involves using a secondary external vendor to provide valuations for the Company’s securities portfolio for comparison purposes. Any securities with discrepancies beyond a certain threshold are researched and, if necessary, valued by an independent outside broker.
CITIZENS FINANCIAL GROUP, INC.
NOTES TO CONSOLIDATED FINANCIAL STATEMENTS
In certain cases where there is limited activity or less transparency around inputs to the valuation model, securities are classified as Level 3.
Residential loans held for sale
See the “Fair Value Option, Residential Mortgage Loans Held for Sale” discussion above.
Commercial loans held for sale
See the “Fair Value Option, Commercial and Commercial Real Estate Loans Held for Sale” discussion above.
Derivatives
The vast majority of the Company’s derivatives portfolio is comprisedcomposed of “plain vanilla” interest rate swaps, which are traded in over-the-counter markets where quoted market prices are not readily available. For these interest rate derivatives, fair value is determined utilizing models that use primarily market observable inputs, such as swap rates and yield curves. The pricing models used to value interest rate swaps calculate the sum of each instrument’s fixed and variable cash flows, which are then discounted using an appropriate yield curve (i.e., LIBOR or OIS curve) to arrive at the fair value of each swap. The pricing models do not contain a high level of subjectivity as the methodologies used do not require significant judgment. The Company also considers certain adjustments to the modeled price which market participants would make when pricing each instrument, including a credit valuation adjustment that reflects the credit quality of the swap counterparty. The Company incorporates the effect of exposure to a particular counterparty’s credit by netting its derivative contracts with the collateral available and calculating a credit valuation adjustment on the basis of the net position with the counterparty where permitted. The determination of this adjustment requires judgment on behalf of Company management; however, the total amount of this portfolio-level adjustment is not material to the total fair value of the interest rate swaps in their entirety. Therefore, interest rate swaps are classified as Level 2 in the valuation hierarchy.
The Company’s other derivatives include foreign exchange contracts. Fair value of foreign exchange derivatives uses the mid-point of daily quoted currency spot prices. A valuation model estimates fair value based on the quoted spot rates together with interest rate yield curves and forward currency rates. Since all of these inputs are observable in the market, foreign exchange derivatives are classified as Level 2 in the fair value hierarchy.
Venture capitalMoney Market Mutual Fund
Fair value is determined based upon unadjusted quoted market prices and is considered a Level 1 fair value measurement.
Other investments
The Companyfair values its venture capital private equity fundof the Company’s other investments are based on its capital invested in each fund, which is adjusted by management each quarter, if necessary, to arrive at its estimate of fair value. Adjustments for a fund’s underlying investments may be based upon comparisons to public companies, industry benchmarks, current financing round pricing, earnings multiples of comparable companies, current operating performance and future expectations, or third-party valuations. Since the inputs to the valuation are difficult to independently corroboratesecurity prices in the marketplace, and involve a significant degree of management judgment, venture capitalmarket that are not active; therefore, these investments are classified as Level 32 in the fair value hierarchy.
CITIZENS FINANCIAL GROUP, INC.
NOTES TO CONSOLIDATED FINANCIAL STATEMENTS
The following table presents assets and liabilities measured at fair value, including gross derivative assets and liabilities on a recurring basis at December 31, 2014:2015:
| | | (in millions) | Total |
| Level 1 |
| Level 2 |
| Level 3 |
| Total |
| Level 1 |
| Level 2 |
| Level 3 |
|
| Securities available for sale: | | |
| Mortgage-backed securities |
| $18,606 |
|
| $— |
|
| $18,606 |
|
| $— |
|
| $17,842 |
|
| $— |
|
| $17,842 |
|
| $— |
|
| State and political subdivisions | 10 |
| — |
| 10 |
| — |
| 9 |
| — |
| 9 |
| — |
|
| Equity securities | 25 |
| 8 |
| 17 |
| — |
| 17 |
| — |
| 17 |
| — |
|
| U.S. Treasury | 15 |
| 15 |
| — |
| — |
| |
| U.S. Treasury and other | | 16 |
| 15 |
| 1 |
| — |
|
| Total securities available for sale | 18,656 |
| 23 |
| 18,633 |
| — |
| 17,884 |
| 15 |
| 17,869 |
| — |
|
| Loans held for sale, at fair value: | | |
| Residential loans held for sale | 213 |
| — |
| 213 |
| — |
| 268 |
| — |
| 268 |
| — |
|
| Commercial and commercial real estate loans held for sale | 43 |
| — |
| 43 |
| — |
| |
| Total loans held for sale | 256 |
| — |
| 256 |
| — |
| |
| Commercial loans held for sale | | 57 |
| — |
| 57 |
| — |
|
| Total loans held for sale, at fair value | | 325 |
| — |
| 325 |
| — |
|
| Derivative assets: | | |
| Interest rate swaps | 613 |
| — |
| 613 |
| — |
| 636 |
| — |
| 636 |
| — |
|
| Foreign exchange contracts | 170 |
| — |
| 170 |
| — |
| 163 |
| — |
| 163 |
| — |
|
| Other contracts | 7 |
| — |
| 7 |
| — |
| 8 |
| — |
| 8 |
| — |
|
| Total derivative assets | 790 |
| — |
| 790 |
| — |
| 807 |
| — |
| 807 |
| — |
|
| Venture capital investments and other investments | 5 |
| — |
| — |
| 5 |
| |
| Other investment securities, at fair value: | | |
| Money market mutual fund | | 65 |
| 65 |
| — |
| — |
|
| Other investments | | 5 |
| — |
| 5 |
| — |
|
| Total other investment securities, at fair value | | 70 |
| 65 |
| 5 |
| — |
|
| Total assets |
| $19,707 |
|
| $23 |
|
| $19,679 |
|
| $5 |
|
| $19,086 |
|
| $80 |
|
| $19,006 |
|
| $— |
|
| Derivative liabilities: | | |
| Interest rate swaps |
| $600 |
|
| $— |
|
| $600 |
|
| $— |
|
| $505 |
|
| $— |
|
| $505 |
|
| $— |
|
| Foreign exchange contracts | 164 |
| — |
| 164 |
| — |
| 156 |
| — |
| 156 |
| — |
|
| Other contracts | 9 |
| — |
| 9 |
| — |
| 5 |
| — |
| 5 |
| — |
|
| Total derivative liabilities | 773 |
| — |
| 773 |
| — |
| 666 |
| — |
| 666 |
| — |
|
| Total liabilities |
| $773 |
|
| $— |
|
| $773 |
|
| $— |
|
| $666 |
|
| $— |
|
| $666 |
|
| $— |
|
CITIZENS FINANCIAL GROUP, INC.
NOTES TO CONSOLIDATED FINANCIAL STATEMENTS
The following table presents assets and liabilities measured at fair value including gross derivative assets and liabilities on a recurring basis at December 31, 2013:2014: | | | (in millions) | Total |
| Level 1 |
| Level 2 |
| Level 3 |
| Total |
| Level 1 |
| Level 2 |
| Level 3 |
|
| Securities available for sale: | | |
| Mortgage-backed securities |
| $15,945 |
|
| $— |
|
| $15,945 |
|
| $— |
|
| $18,606 |
|
| $— |
|
| $18,606 |
|
| $— |
|
| State and political subdivisions | 10 |
| — |
| 10 |
| — |
| 10 |
| — |
| 10 |
| — |
|
| Equity securities | 25 |
| 8 |
| 17 |
| — |
| 25 |
| 8 |
| 17 |
| — |
|
| U.S. Treasury | 15 |
| 15 |
| — |
| — |
| 15 |
| 15 |
| — |
| — |
|
| Total securities available for sale | 15,995 |
| 23 |
| 15,972 |
| — |
| 18,656 |
| 23 |
| 18,633 |
| — |
|
| Loans held for sale, at fair value: | | |
| Residential loans held for sale | 176 |
| — |
| 176 |
| — |
| 213 |
| — |
| 213 |
| — |
|
| Commercial loans held for sale | | 43 |
| — |
| 43 |
| — |
|
| Total loans held for sale, at fair value | | 256 |
| — |
| 256 |
| — |
|
| Derivative assets: |
|
|
| Interest rate swaps | 677 |
| — |
| 677 |
| — |
| 613 |
| — |
| 613 |
| — |
|
| Foreign exchange contracts | 94 |
| — |
| 94 |
| — |
| 170 |
| — |
| 170 |
| — |
|
| Other contracts | 7 |
| — |
| 7 |
| — |
| 7 |
| — |
| 7 |
| — |
|
| Total derivative assets | 778 |
| — |
| 778 |
| — |
| 790 |
| — |
| 790 |
| — |
|
| Venture capital investments and investments | 5 |
| — |
| — |
| 5 |
| |
| Other investment securities, at fair value: | | |
| Money market mutual fund | | 28 |
| 28 |
| — |
| — |
|
| Venture capital investments and other investments | | 5 |
| — |
| — |
| 5 |
|
| Total other investment securities, at fair value | | 33 |
| 28 |
| — |
| 5 |
|
| Total assets |
| $16,954 |
|
| $23 |
|
| $16,926 |
|
| $5 |
|
| $19,735 |
|
| $51 |
|
| $19,679 |
|
| $5 |
|
| Derivative liabilities: |
|
|
| Interest rate swaps |
| $970 |
|
| $— |
|
| $970 |
|
| $— |
|
| $600 |
|
| $— |
|
| $600 |
|
| $— |
|
| Foreign exchange contracts | 87 |
| — |
| 87 |
| — |
| 164 |
| — |
| 164 |
| — |
|
| Other contracts | 10 |
| — |
| 10 |
| — |
| 9 |
| — |
| 9 |
| — |
|
| Total derivative liabilities | 1,067 |
| — |
| 1,067 |
| — |
| 773 |
| — |
| 773 |
| — |
|
| Total liabilities |
| $1,067 |
|
| $— |
|
| $1,067 |
|
| $— |
|
| $773 |
|
| $— |
|
| $773 |
|
| $— |
|
The changes in Level 3 assets measured at fair value on a recurring basis are summarized as follows:
| | | | Year Ended December 31, | Year Ended December 31, |
| (in millions) | 2014 |
| | 2013 |
| | 2012 |
| 2015 |
| | 2014 |
| | 2013 |
|
| Balance as of January 1 |
| $5 |
| |
| $6 |
| |
| $57 |
| |
| Beginning as of January 1 | |
| $5 |
| |
| $5 |
| |
| $6 |
|
| Purchases, issuances, sales and settlements: | | | | | | | | | | |
| Purchases | — |
| | — |
| | 1 |
| — |
| | — |
| | — |
|
| Sales | — |
| | (4 | ) | | (45 | ) | — |
| | — |
| | (4 | ) |
| Settlements | — |
| | 3 |
| | 23 |
| — |
| | — |
| | 3 |
|
| Other net gains (losses) | — |
| | — |
| | (30 | ) | |
| Net (losses) gains | | — |
| | — |
| | — |
|
| Transfers from Level 3 to Level 2 | | (5 | ) | | — |
| | — |
|
| Balance as of December 31 |
| $5 |
| |
| $5 |
| |
| $6 |
|
| $— |
| |
| $5 |
| |
| $5 |
|
| Net unrealized gain (loss) included in net income for the year relating to assets held at December 31 |
| $— |
| |
| $— |
| |
| ($11 | ) |
| $— |
| |
| $— |
| |
| $— |
|
There were no transfers among Levels 1, 2 orIn March 2015, the Company transferred $5 million of securities from Level 3 duringto Level 2. The fair values of these securities are based on security prices in the year ended December 31, 2014, 2013 and 2012.market that are not active.
CITIZENS FINANCIAL GROUP, INC.
NOTES TO CONSOLIDATED FINANCIAL STATEMENTS
Nonrecurring Fair Value Measurements
The following valuation techniques are utilized to measure significant assets for which the Company utilizes fair value on a nonrecurring basis:
Impaired Loans
The carrying amount of collateral-dependent impaired loans is compared to the appraised value of the collateral less costs to dispose and is classified as Level 2. Any excess of carrying amount over the appraised value is charged to the ALLL.
MSRsMortgage Servicing Rights
MSRs do not trade in an active market with readily observable prices. MSRs are classified as Level 3 since the valuation methodology utilizes significant unobservable inputs. At December 31, 2015, the fair value was calculated using a discounted cash flow model, which used assumptions, including weighted-average life of 5.4 years (range of 2.8 - 6.2 years), weighted-average constant prepayment rate of 11.6% (range of 10.7% - 22.2%) and weighted-average discount rate of 9.7% (range of 9.1% - 12.1%). At December 31, 2014, the fair value was calculated using a discounted cash
CITIZENS FINANCIAL GROUP, INC.
NOTES TO CONSOLIDATED FINANCIAL STATEMENTS
flow model, which used assumptions, including weighted-average life of 5.2 years (range of 2.8 - 6.6 years), weighted-average constant prepayment rate of 12.4% (range of 10.4% - 22.6%) and weighted-average discount rate of 9.8% (range of 9.1% - 12.1%). At December 31, 2013, the fair value was calculated using a discounted cash flow model, which used assumptions, including weighted-average life of 5.4 years (range of 1.8 - 7.4 years), weighted-average constant prepayment rate of 13% (range of 9.4% - 41.5%) and weighted-average discount rate of 10.8% (range of 10.2% - 13.1%). Refer to Note 1 “Significant Accounting Policies” and Note 910 “Mortgage Banking” for more information.
Foreclosed assets
Foreclosed assets consist primarily of residential properties. Foreclosed assets are carried at the lower of carrying value or fair value less costs to dispose. Fair value is based upon independent market prices or appraised values of the collateral and is classified as Level 2.
Goodwill
Goodwill is valued using unobservable inputs and is classified as Level 3. Fair value is calculated using the present value of estimated future earnings (discounted cash flow method). On a quarterly basis, the Company assesses whether or not impairment indicators are present.
For information on the Company’s goodwill impairment testing and the most recent goodwill impairment test, see Note 1 “Significant Accounting Policies” and Note 89 “Goodwill” for a description of the Company's goodwill valuation methodology.
The following table presents gains (losses) on assets and liabilities measured at fair value on a nonrecurring basis and recorded in earnings:
|
| | | | | | | | | | | |
| | Year Ended December 31, |
| (in millions) | 2014 |
| | 2013 |
| | 2012 |
|
| Impaired collateral-dependent loans |
| ($101 | ) | |
| ($83 | ) | |
| ($101 | ) |
| MSRs | 5 |
| | 47 |
| | (12 | ) |
| Foreclosed assets | (3 | ) | | (4 | ) | | (6 | ) |
Goodwill impairment (1) | — |
| | (4,435 | ) | | — |
|
The following tables present assets and liabilities measured at fair value on a nonrecurring basis:
|
| | | | | | | | | | | | |
| | December 31, 2014 |
| (in millions) | Total |
| Level 1 |
| Level 2 |
| Level 3 |
|
| Impaired collateral-dependent loans |
| $102 |
|
| $— |
|
| $102 |
|
| $— |
|
| MSRs | 166 |
| — |
| — |
| 166 |
|
| Foreclosed assets | 40 |
| — |
| 40 |
| — |
|
| | | | December 31, 2013 | Year Ended December 31, |
| (in millions) | Total |
| Level 1 |
| Level 2 |
| Level 3 |
| 2015 |
| | 2014 |
| | 2013 |
|
| Impaired collateral-dependent loans |
| $74 |
|
| $— |
|
| $74 |
|
| $— |
|
| ($32 | ) | |
| ($101 | ) | |
| ($83 | ) |
| MSRs | 185 |
| — |
| — |
| 185 |
| 9 |
| | 5 |
| | 47 |
|
| Foreclosed assets | 49 |
| — |
| 49 |
| — |
| (3 | ) | | (3 | ) | | (4 | ) |
Goodwill (1) | 6,876 |
| — |
| — |
| 6,876 |
| |
Goodwill impairment (1) | | — |
| | — |
| | (4,435 | ) |
(1)In the year ended December 31, 2013, Goodwill totaling $11.3 billion was written down to its implied fair value of $6.9 billion, resulting in an impairment charge of $4.4 billion.billion.
The following table present assets and liabilities measured at fair value on a nonrecurring basis:
|
| | | | | | | | | | | | | | | | | | | | | | | | | |
| | December 31, 2015 | | December 31, 2014 |
| (in millions) | Total |
| Level 1 |
| Level 2 |
| Level 3 |
| | Total |
| Level 1 |
| Level 2 |
| Level 3 |
|
| Impaired collateral-dependent loans |
| $60 |
|
| $— |
|
| $60 |
|
| $— |
| |
| $102 |
|
| $— |
|
| $102 |
|
| $— |
|
| MSRs | 178 |
| — |
| — |
| 178 |
| | 166 |
| — |
| — |
| 166 |
|
| Foreclosed assets | 42 |
| — |
| 42 |
| — |
| | 40 |
| — |
| 40 |
| — |
|
CITIZENS FINANCIAL GROUP, INC.
NOTES TO CONSOLIDATED FINANCIAL STATEMENTS
Disclosures about Fair Value of Financial Instruments
Following is a description of valuation methodologies used to estimate the fair value of financial instruments for disclosure purposes (these instruments are not recorded in the financial statements at fair value):
Loans and leases
For loans and leases not recorded at fair value on a recurring basis that are not accounted for as collateral-dependent impaired loans, fair value is estimated by using one of two methods: a discounted cash flow method or a securitization method. The discounted cash flow method involves discounting the expected future cash flows using current rates which a market participant would likely use to value similar pools of loans. Inputs used in this method include observable information such as contractual cash flows (net of servicing cost) and unobservable information such as estimated prepayment speeds, credit loss exposures, and discount rates. The securitization method involves utilizing market securitization data to value the assets as if a securitization transaction had been executed. Inputs used include observable market-based MBS data and pricing adjustments based on unobservable data reflecting the liquidity risk, credit loss exposure and other characteristics of the underlying loans. The internal risk-weighted balances of loans are grouped by product type for purposes of these estimated valuations. For nonaccruing loans, fair value is estimated by discounting management’s estimate of future cash flows with a discount rate commensurate with the risk associated with such assets. Fair value of collateral-dependent loans is primarily based on the appraised value of the collateral.
LoansOther loans held for sale
Balances are loans that were transferred to loans held for sale that are reported at book value.
Securities HTMheld to maturity
The fair value of securities classified as HTM is estimated using pricing models, quoted prices of securities with similar characteristics or discounted cash flow. The pricing models used to value these securities generally begin with market prices (or rates) for similar instruments and make adjustments based on the unique characteristics of the instrument being valued. These adjustments reflect assumptions made regarding the sensitivity of each security’s value to changes in interest rates and prepayment speeds.
Other investment securities, at cost
The fair value of other investment securities, at cost, such as FHLB stock and FRB stock, is assumed to approximate the cost basis of the securities. As a member of the FHLB and FRB, the Company is required to hold FHLB and FRB stock. The stock can be sold only to the FHLB and FRB upon termination of membership, or redeemed at the FHLB’s or FRB’s sole discretion.
Deposits
The fair value of demand deposits, checking with interest accounts, regular savings and money market accounts is the amount payable on demand at the balance sheet date. The fair value of term deposits is estimated by discounting the expected future cash flows using rates currently offered for deposits of similar remaining maturities.
Deposits held for sale
Balances are deposits that were transferred to held for sale that are reported at book value.
Federal funds purchased and securities sold under agreements to repurchase, other short-term borrowed funds, and long-term borrowed funds
Rates currently available to the Company for debt of similar terms and remaining maturities are used to discount the expected cash flows of existing debt.
CITIZENS FINANCIAL GROUP, INC.
NOTES TO CONSOLIDATED FINANCIAL STATEMENTS
The following table is a summary of fair value for financial instruments not recorded at fair value in the Consolidated Financial Statements. The carrying amounts in the following table are recorded in the Consolidated Balance Sheets under the indicated captions:
| | | | December 31, 2014 | December 31, 2015 |
| | Total | | Level 1 | | Level 2 | | Level 3 | Total | | Level 1 | | Level 2 | | Level 3 |
| (in millions) | Carrying Value | Fair Value | | Carrying Value | Fair Value | | Carrying Value | Fair Value | | Carrying Value | Fair Value | Carrying Value | Fair Value | | Carrying Value | Fair Value | | Carrying Value | Fair Value | | Carrying Value | Fair Value |
| Financial Assets: | | | | | | | | | | | | | | |
| Securities held to maturity | |
| $5,258 |
|
| $5,297 |
| |
| $— |
|
| $— |
| |
| $5,258 |
|
| $5,297 |
| |
| $— |
|
| $— |
|
| Other investment securities, at cost | | 863 |
| 863 |
| | — |
| — |
| | 863 |
| 863 |
| | — |
| — |
|
| Other loans held for sale | | 40 |
| 40 |
| | — |
| — |
| | — |
| — |
| | 40 |
| 40 |
|
| Loans and leases |
| $93,410 |
|
| $93,674 |
| |
| $— |
|
| $— |
| |
| $102 |
|
| $102 |
| |
| $93,308 |
|
| $93,572 |
| 99,042 |
| 99,026 |
| | — |
| — |
| | 60 |
| 60 |
| | 98,982 |
| 98,966 |
|
| Other loans held for sale | 25 |
| 25 |
| | — |
| — |
| | — |
| — |
| | 25 |
| 25 |
| |
| Securities held to maturity | 5,148 |
| 5,193 |
| | — |
| — |
| | 5,148 |
| 5,193 |
| | — |
| — |
| |
| Other investment securities | 872 |
| 872 |
| | — |
| — |
| | 872 |
| 872 |
| | — |
| — |
| |
| Financial Liabilities: | | | | | | | | | | | | | | |
| Deposits | 95,707 |
| 95,710 |
| | — |
| — |
| | 95,707 |
| 95,710 |
| | — |
| — |
| 102,539 |
| 102,528 |
| | — |
| — |
| | 102,539 |
| 102,528 |
| | — |
| — |
|
| Federal funds purchased and securities sold under agreements to repurchase | 4,276 |
| 4,276 |
| | — |
| — |
| | 4,276 |
| 4,276 |
| | — |
| — |
| 802 |
| 802 |
| | — |
| — |
| | 802 |
| 802 |
| | — |
| — |
|
| Other short-term borrowed funds | 6,253 |
| 6,253 |
| | — |
| — |
| | 6,253 |
| 6,253 |
| | — |
| — |
| 2,630 |
| 2,630 |
| | — |
| — |
| | 2,630 |
| 2,630 |
| | — |
| — |
|
| Long-term borrowed funds | 4,642 |
| 4,706 |
| | — |
| — |
| | 4,642 |
| 4,706 |
| | — |
| — |
| 9,886 |
| 9,837 |
| | — |
| — |
| | 9,886 |
| 9,837 |
| | — |
| — |
|
| | | | December 31, 2013 | December 31, 2014 |
| | Total | | Level 1 | | Level 2 | | Level 3 | Total | | Level 1 | | Level 2 | | Level 3 |
| (in millions) | Carrying Value | Fair Value | | Carrying Value | Fair Value | | Carrying Value | Fair Value | | Carrying Value | Fair Value | Carrying Value | Fair Value | | Carrying Value | Fair Value | | Carrying Value | Fair Value | | Carrying Value | Fair Value |
| Financial Assets: | | | | | | | | | | | | | | |
| Securities held to maturity | |
| $5,148 |
|
| $5,193 |
| |
| $— |
|
| $— |
| |
| $5,148 |
|
| $5,193 |
| |
| $— |
|
| $— |
|
| Other investment securities, at cost | | 867 |
| 867 |
| | — |
| — |
| | 867 |
| 867 |
| | — |
| — |
|
| Other loans held for sale | | 25 |
| 25 |
| | — |
| — |
| | — |
| — |
| | 25 |
| 25 |
|
| Loans and leases |
| $85,859 |
|
| $85,724 |
| |
| $— |
|
| $— |
| |
| $74 |
|
| $74 |
| |
| $85,785 |
|
| $85,650 |
| 93,410 |
| 93,674 |
| | — |
| — |
| | 102 |
| 102 |
| | 93,308 |
| 93,572 |
|
| Other loans held for sale | 1,078 |
| 1,078 |
| | — |
| — |
| | — |
| — |
| | 1,078 |
| 1,078 |
| |
| Securities held to maturity | 4,315 |
| 4,257 |
| | — |
| — |
| | 4,315 |
| 4,257 |
| | — |
| — |
| |
| Other investment securities | 935 |
| 935 |
| | — |
| — |
| | 935 |
| 935 |
| | — |
| — |
| |
| Financial Liabilities: | | | | | | | | | | | | | | |
| Deposits | 86,903 |
| 86,907 |
| | — |
| — |
| | 86,903 |
| 86,907 |
| | — |
| — |
| 95,707 |
| 95,710 |
| | — |
| — |
| | 95,707 |
| 95,710 |
| | — |
| — |
|
| Deposits held for sale | 5,277 |
| 5,277 |
| | — |
| — |
| | 5,277 |
| 5,277 |
| | — |
| — |
| |
| Federal funds purchased and securities sold under agreements to repurchase | 4,791 |
| 4,791 |
| | — |
| — |
| | 4,791 |
| 4,791 |
| | — |
| — |
| 4,276 |
| 4,276 |
| | — |
| — |
| | 4,276 |
| 4,276 |
| | — |
| — |
|
| Other short-term borrowed funds | 2,251 |
| 2,249 |
| | — |
| — |
| | 2,251 |
| 2,249 |
| | — |
| — |
| 6,253 |
| 6,253 |
| | — |
| — |
| | 6,253 |
| 6,253 |
| | — |
| — |
|
| Long-term borrowed funds | 1,405 |
| 1,404 |
| | — |
| — |
| | 1,405 |
| 1,404 |
| | — |
| — |
| 4,642 |
| 4,706 |
| | — |
| — |
| | 4,642 |
| 4,706 |
| | — |
| — |
|
NOTE 2021 - REGULATORY MATTERS
As a BHC, the Company is subject to regulation and supervision by the FRB. The primary subsidiaries of the Company are its two insured depository institutions CBNA, a national banking association whose primary federal regulator is the OCC, and CBPA, a Pennsylvania-chartered savings bank regulated by the Department of Banking of the Commonwealth of Pennsylvania and supervised by the FDIC as its primary federal regulator. Under the Basel III capital framework effectivethat took effect on January 1, 2015, the Company and its banking subsidiaries must meet specific capital requirements. TheseBasel III requirements are expressed in terms of the following ratios: (1) common equity tier 1 capital (common equity tier 1 capital/risk-weighted on- and off-balance sheet assets); (2) tier 1 capital (tier 1 capital/risk-weighted on- and off-balance sheet assets); (3) total risk-based capital (total capital/risk-weighted on- and off-balance sheet assets); (2) Tier 1 risk-based capital (Tier 1 capital/risk-weighted on- and off-balance sheet assets); (3) common equity Tier 1 risk-based capital (common equity Tier 1 capital/risk-weighted on- and off-balance sheet assets); and Tier(4) tier 1 leverage (Tier(tier 1 capital/adjusted average quarterly assets). To meet the regulatory capital requirements, the Company and its banking subsidiaries must maintain minimum total risk-based capital, Tier 1 risk-based capital, and Tier 1 leverage ratios.regulatory levels for each ratio. In addition, the Company must not be subject to a written agreement, order or capital directive with any of its regulators. Failure to meet minimum capital requirements can result in the initiation of certain actions that, if undertaken, could have a material effect on the Company’s Consolidated Financial Statements.
CITIZENS FINANCIAL GROUP, INC.
NOTES TO CONSOLIDATED FINANCIAL STATEMENTS
The following table presents capital and capital ratio information evidencing the Company’s transition from Basel I regulatory accounting as of December 31, 2014 to Basel III regulatory accounting as of December 31, 2015. Basel I requirements did not include the common equity tier I capital ratio. Certain Basel III requirements are subject to phase-in through 2019, and these phase-in rules are used in this report of actual regulatory ratios. In addition, the Company has declared itself as an “AOCI opt-out” institution, which means that the Company will not be required to change its methodology for recognizing in regulatory capital only a subset of unrealized gains and losses that are classified as AOCI. As an AOCI opt-out institution, the Company is not required to recognize within regulatory capital the impacts of net unrealized gains and losses on securities AFS, accumulated net gains and losses on cash-flow hedges included in AOCI, net gains and losses on certain defined benefit pension plan assets, and net unrealized gains and losses on securities held to maturity that are included in AOCI.
|
| | | | | | | | | | | | | | | | | | |
| | Transitional Basel III |
| | | | | | | | | FDIA Requirements |
| | | Actual | | Minimum Capital Adequacy | | Classification as Well-capitalized |
| (dollars in millions) | | Amount |
| Ratio |
| | Amount |
| Ratio |
| | Amount |
| Ratio |
|
| As of December 31, 2015 | Basel III | | | | | | | | |
Common equity tier 1 capital(1) | |
| $13,389 |
| 11.7 | % | |
| $5,134 |
| 4.5 | % | |
| $7,415 |
| 6.5 | % |
Tier 1 capital(2) | | 13,636 |
| 12.0 |
| | 6,845 |
| 6.0 |
| | 9,127 |
| 8.0 |
|
Total capital(3) | | 17,505 |
| 15.3 |
| | 9,127 |
| 8.0 |
| | 11,408 |
| 10.0 |
|
Tier 1 leverage(4) | | 13,636 |
| 10.5 |
| | 5,218 |
| 4.0 |
| | 6,523 |
| 5.0 |
|
| As of December 31, 2014 | Basel I | | | | | | | | |
Tier 1 common equity(1) | |
| $13,173 |
| 12.4 | % | | Not Applicable | Not Applicable | | Not Applicable | Not Applicable |
Tier 1 capital(2) | | 13,173 |
| 12.4 |
| |
| $4,239 |
| 4.0 | % | |
| $6,358 |
| 6.0 | % |
Total capital(3) | | 16,781 |
| 15.8 |
| | 8,477 |
| 8.0 |
| | 10,596 |
| 10.0 |
|
Tier 1 leverage(4) | | 13,173 |
| 10.6 |
| | 4,982 |
| 4.0 |
| | 6,227 |
| 5.0 |
|
(1) CET1 under Basel III replaced the concept of tier 1 common capital that existed under Basel I effective January 1, 2015. “Common equity tier 1 capital ratio” as of December 31, 2015 represents CET1 divided by total risk-weighted assets as defined under Basel III Standardized approach. The “tier 1 common capital ratio” reported prior to January 1, 2015, represented tier 1 common equity divided by total risk-weighted assets as defined under the Basel I general risk-based capital framework effective forrule.
(2) “Tier 1 capital ratio” is tier 1 capital, which includes CET1 capital plus non-cumulative perpetual preferred equity that qualifies as additional tier 1 capital, divided by total risk-weighted assets as defined under Basel III Standardized approach. The “tier 1 capital ratio” reported prior to January 1, 2015, represented tier 1 capital divided by total risk-weighted assets as defined under the Basel I general risk-based capital rule.
(3) “Total capital ratio” is total capital divided by total risk-weighted assets as defined under Basel III Standardized approach. The “Total capital ratio” reported prior to January 1, 2015, represented total capital divided by total risk-weighted assets as defined under the Basel I general risk-based capital rule.
(4) “Tier 1 leverage ratio” is tier 1 capital divided by quarterly average total assets as defined under Basel III Standardized approach. The “tier 1 leverage ratio” reported prior to January 1, 2015, represented tier 1 capital divided by quarterly average total assets as defined under the Basel I general risk-based capital rule.
Under the Capital Plan Rule, the Company asmay only make capital distributions, including payment of dividends, in accordance with a capital plan that has been reviewed by the Federal Reserve and to which the Federal Reserve has not objected. In the year ended December 31, 2014:2015, the Company paid total common dividends of approximately $214 million and repurchased 20,088,781 shares of its common stock. Additionally, in the year ended December 31, 2015, the Company paid total preferred dividends of approximately $7 million.
|
| | | | | | | | | | | | | | | | | |
| | Actual | | Minimum Capital Adequacy | | Classification as Well Capitalized |
| (dollars in millions) | Amount | Ratio | | Amount | Ratio | | Amount | Ratio |
| As of December 31, 2014 | | | | | | | | |
| Total capital to risk-weighted assets |
| $16,781 |
| 15.8 | % | |
| $8,477 |
| 8.0 | % | |
| $10,596 |
| 10.0 | % |
| Tier 1 capital to risk-weighted assets | 13,173 |
| 12.4 |
| | 4,239 |
| 4.0 |
| | 6,358 |
| 6.0 |
|
| Tier 1 capital to average assets (leverage) | 13,173 |
| 10.6 |
| | 4,982 |
| 4.0 |
| | 6,227 |
| 5.0 |
|
| | | | | | | | | |
| As of December 31, 2013 | | | | | | | | |
| Total capital to risk-weighted assets |
| $15,885 |
| 16.1 | % | |
| $7,891 |
| 8.0 | % | |
| $9,863 |
| 10.0 | % |
| Tier 1 capital to risk-weighted assets | 13,301 |
| 13.5 |
| | 3,945 |
| 4.0 |
| | 5,918 |
| 6.0 |
|
| Tier 1 capital to average assets (leverage) | 13,301 |
| 11.6 |
| | 4,577 |
| 4.0 |
| | 5,721 |
| 5.0 |
|
In accordance with federal and state banking regulations, dividends paid by the Company’s banking subsidiaries to the Company itself are generally limited to the retained earnings of the respective banking subsidiaries unless specifically approved by the appropriate bank regulator. The Company declared and paid RBS total common stock dividends of $790 million, $1.2 billion and $150 million as of December 31, 2014, 2013 and 2012, respectively.
The earnings impact of goodwill impairment recognized by CBNA in 2013 has put the bank subsidiary in the position of having to request specific approval from the OCC before executing capital distributions to its parent, CFG. This requirement will behas been in place through the fourth quarter of 2015. As of December 31, 2014, the unconsolidated BHC had liquid assets in excess of $340 million compared to an annual interest burden on existing subordinated debt of approximately $104 million on a non-consolidated basis.
On March 13, 2014, the OCC determined that CBNA no longer meets the condition to own a financial subsidiary — namely that CBNA must be both well capitalized and well managed to own a financial subsidiary.managed. A financial subsidiary is permitted to engage in a broader range of activities, similar to those of a financial holding company, than those permissible for a national bank itself. CBNA has two financial subsidiaries, Citizens Securities, Inc., a registered broker-dealer, and RBS Citizens Insurance Agency, Inc., a dormant entity, although it continues to collect commissions on certain outstanding insurance policies.entity. CBNA has entered into an agreement with the OCC (the “OCC Agreement”) pursuant to which it must develop a remediation plan, which must bethe Company has developed and submitted to the OCC settinga remediation plan, that sets forth the specific actions it will take to bring itself back into compliance with the conditions to own a financial subsidiary andsubsidiary. CBNA has made substantial progress toward completing those actions. However, until the schedule for achieving that objective. Until CBNA addresses the deficienciesplan has been completed to the OCC'sOCC’s satisfaction, CBNA may not consolidate its assets and liabilities with those of the financial subsidiaries for purposes of determining and reporting regulatory capital. In addition, CBNA will be subject to restrictions on its ability to acquire control or hold an interest in any new financial subsidiary and to commence new activities in any existing financial subsidiary without the prior consent of the OCC. The OCC Agreement provides that if CBNA fails to remediate the deficiencies it may have to divest itself of its financial subsidiaries and comply with any additional limitations or conditions on its conduct as the OCC may impose. CBNA has developed a plan to address the deficiencies and has implemented a comprehensive enterprise-wide program.
CITIZENS FINANCIAL GROUP, INC.
NOTES TO CONSOLIDATED FINANCIAL STATEMENTS
NOTE 2122 - EXIT COSTS AND RESTRUCTURING RESERVES
For the year ended December 31, 2015, the Company incurred $26 million of restructuring costs, consisting of $17 million of facilities costs in occupancy, $8 million in outside services, and $1 million in salaries and employee benefits, relating to restructuring initiatives designed to enhance operating efficiencies and reduce expense growth. In 2014, the Company began the implementation of a restructuring initiative designed to achieve operating efficiencies and reduce expense growth. As a result of this program, the Company expects to incur total restructuring costs of approximately $121 million through December 31, 2015, consisting of $41 million of employee compensation, $40 million of facilities costs and $40 million of other costs, primarily consulting and technology services. For the year ended December 31, 2014, the Company incurred $101 million of restructuring costs consisting ofrelated to these initiatives, including $41 million of employee compensation reported in salaries and employee benefits, $18 million of facilities costs (including $6 million of building impairment) in occupancy, $24 million in outside services, $6 million in software expense reported in amortization of software, and $12 million in other operating expenses.
InAlso in 2014, as a result of the sale of retail branches located in Illinois, (see Note 17 “Divestitures and Branch Assets and Liabilities Held for Sale” for further information), the Company incurred total costs of approximately $17 million for the year ended December 31, 2014, consisting of $3 million of employee compensation reported in salaries and employee benefits, $3 million of fixed assetsasset expenses reported in equipment, $4 million in outside services and $7 million in other operating expenses.
CITIZENS FINANCIAL GROUP, INC.
NOTES TO CONSOLIDATED FINANCIAL STATEMENTS
In the year ended December 31, 2013, the Company reversed $5 million and recorded $31 million in noninterest expense for restructuring charges. The reversed restructuring charges consisted primarily of lease termination costs of $4 million and employee termination costs of $1 million. The recorded restructuring charges consisted primarily of employee termination costs of $6 million, lease termination costs of $15 million, fixed asset write-offs of $7 million, and $3 million of other costs.
For segment reporting, all of these restructuring costs are reported within Other. See Note 2324 “Business Segments” for further information.
The following table includes the activity in the exit costs and restructuring reserves:
| | | (in millions) | Salaries & Employee Benefits | Occupancy & Equipment | Other |
| Total |
| Salaries & Employee Benefits | Occupancy & Equipment | Other |
| Total |
|
| Reserve balance as of January 1, 2012 |
| $9 |
|
| $59 |
|
| $— |
|
| $68 |
| |
| Additions | 2 |
| 1 |
| 4 |
| 7 |
| |
| Reversals | (1 | ) | (11 | ) | — |
| (12 | ) | |
| Utilization | (7 | ) | (22 | ) | (4 | ) | (33 | ) | |
| Reserve balance as of December 31, 2012 | 3 |
| 27 |
| — |
| 30 |
| |
| Reserve balance as of January 1, 2013 | |
| $3 |
|
| $27 |
|
| $— |
|
| $30 |
|
| Additions | 6 |
| 22 |
| 3 |
| 31 |
| 6 |
| 22 |
| 3 |
| 31 |
|
| Reversals | (1 | ) | (4 | ) | — |
| (5 | ) | (1 | ) | (4 | ) | — |
| (5 | ) |
| Utilization | (6 | ) | (21 | ) | (3 | ) | (30 | ) | (6 | ) | (21 | ) | (3 | ) | (30 | ) |
| Reserve balance as of December 31, 2013 | 2 |
| 24 |
| — |
| 26 |
| 2 |
| 24 |
| — |
| 26 |
|
| Additions | 43 |
| 24 |
| 57 |
| 124 |
| 43 |
| 24 |
| 57 |
| 124 |
|
| Reversals | (1 | ) | (5 | ) | (4 | ) | (10 | ) | (1 | ) | (5 | ) | (4 | ) | (10 | ) |
| Utilization | (21 | ) | (25 | ) | (50 | ) | (96 | ) | (21 | ) | (25 | ) | (50 | ) | (96 | ) |
| Reserve balance as of December 31, 2014 |
| $23 |
|
| $18 |
|
| $3 |
|
| $44 |
| 23 |
| 18 |
| 3 |
| 44 |
|
| Additions | | 5 |
| 18 |
| 8 |
| 31 |
|
| Reversals | | (4 | ) | (1 | ) | — |
| (5 | ) |
| Utilization | | (12 | ) | (19 | ) | (6 | ) | (37 | ) |
| Reserve balance as of December 31, 2015 | |
| $12 |
|
| $16 |
|
| $5 |
|
| $33 |
|
CITIZENS FINANCIAL GROUP, INC.
NOTES TO CONSOLIDATED FINANCIAL STATEMENTS
NOTE 2223 - RECLASSIFICATIONS OUT OF ACCUMULATED OTHER COMPREHENSIVE INCOME (LOSS)
The following table presents the changes in the balances, net of income taxes, of each component of AOCI:
|
| | | | | | | | | | | | | | | | | |
| (in millions) | | Net Unrealized Gains (Losses) on Derivatives | | Net Unrealized Gains (Losses) on Securities | | Defined Benefit Pension Plans | | Total AOCI |
|
| Balance at January 1, 2012 | |
| ($426 | ) | |
| $251 |
| |
| ($353 | ) | |
| ($528 | ) |
| Other comprehensive (loss) income before reclassifications | | (26 | ) | | 138 |
| | — |
| | 112 |
|
| Other than temporary impairment not recognized in earnings on securities | | — |
| | (38 | ) | | — |
| | (38 | ) |
| Amounts reclassified from other comprehensive income | | 212 |
| | (45 | ) | | (25 | ) | | 142 |
|
| Net other comprehensive income (loss) | | 186 |
| | 55 |
| | (25 | ) | | 216 |
|
| Balance at December 31, 2012 | | (240 | ) | | 306 |
| | (378 | ) | | (312 | ) |
| Other comprehensive loss before reclassifications | | (172 | ) | | (285 | ) | | — |
| | (457 | ) |
| Other than temporary impairment not recognized in earnings on securities | | — |
| | (26 | ) | | — |
| | (26 | ) |
| Amounts reclassified from other comprehensive income | | 114 |
| | (86 | ) | | 119 |
| | 147 |
|
| Net other comprehensive (loss) income | | (58 | ) | | (397 | ) | | 119 |
| | (336 | ) |
| Balance at December 31, 2013 | | (298 | ) | | (91 | ) | | (259 | ) | | (648 | ) |
| Other comprehensive income before reclassifications | | 212 |
| | 198 |
| | — |
| | 410 |
|
| Other than temporary impairment not recognized in earnings on securities | | — |
| | (22 | ) | | — |
| | (22 | ) |
| Amounts reclassified from other comprehensive income | | 17 |
| | (11 | ) | | (118 | ) | | (112 | ) |
| Net other comprehensive income (loss) | | 229 |
| | 165 |
| | (118 | ) | | 276 |
|
| Balance at December 31, 2014 | |
| ($69 | ) | |
| $74 |
| |
| ($377 | ) | |
| ($372 | ) |
CITIZENS FINANCIAL GROUP, INC.
NOTES TO CONSOLIDATED FINANCIAL STATEMENTS
|
| | | | | | | | | | | | | | | | | |
| (in millions) | | Net Unrealized Gains (Losses) on Derivatives | | Net Unrealized Gains (Losses) on Securities | | Defined Benefit Pension Plans | | Total AOCI |
|
| Balance at January 1, 2013 | |
| ($240 | ) | |
| $306 |
| |
| ($378 | ) | |
| ($312 | ) |
| Other comprehensive loss before reclassifications | | (172 | ) | | (285 | ) | | — |
| | (457 | ) |
| Other than temporary impairment not recognized in earnings on securities | | — |
| | (26 | ) | | — |
| | (26 | ) |
| Amounts reclassified from other comprehensive income | | 114 |
| | (86 | ) | | 119 |
| | 147 |
|
| Net other comprehensive (loss) income | | (58 | ) | | (397 | ) | | 119 |
| | (336 | ) |
| Balance at December 31, 2013 | |
| ($298 | ) | |
| ($91 | ) | |
| ($259 | ) | |
| ($648 | ) |
| Other comprehensive income before reclassifications | | 212 |
| | 198 |
| | — |
| | 410 |
|
| Other-than-temporary impairment not recognized in earnings on securities | | — |
| | (22 | ) | | — |
| | (22 | ) |
| Amounts reclassified from other comprehensive income (loss) | | 17 |
| | (11 | ) | | (118 | ) | | (112 | ) |
| Net other comprehensive income | | 229 |
| | 165 |
| | (118 | ) | | 276 |
|
| Balance at December 31, 2014 | |
| ($69 | ) | |
| $74 |
| |
| ($377 | ) | |
| ($372 | ) |
| Other comprehensive income (loss) before reclassifications | | 93 |
| | (66 | ) | | — |
| | 27 |
|
| Other-than-temporary impairment not recognized in earnings on securities | | — |
| | (22 | ) | | — |
| | (22 | ) |
| Amounts reclassified from other comprehensive (loss) income | | (14 | ) | | (14 | ) | | 8 |
| | (20 | ) |
| Net other comprehensive (loss) income | | 79 |
| | (102 | ) | | 8 |
| | (15 | ) |
| Balance at December 31, 2015 | |
| $10 |
| |
| ($28 | ) | |
| ($369 | ) | |
| ($387 | ) |
The following table reports the amounts reclassified out of each component of AOCI and into the Consolidated Statements of Operations:
| | | | | Year Ended December 31, | | Year Ended December 31, | |
| (in millions) | | 2014 |
| | 2013 |
| | 2012 |
| | 2015 |
| | 2014 |
| | 2013 |
| |
| Details about AOCI Components | | | | | | | | Affected Line Item in the Consolidated Statements of Operations | | | | | | | Affected Line Item in the Consolidated Statements of Operations |
| Reclassification adjustment for net derivative gains (losses) included in net income (loss): | |
| $72 |
| |
| $56 |
| |
| $— |
| | Interest income | |
| Reclassification adjustment for net derivative gains (losses) included in net income: | |
| $82 |
| |
| $72 |
| |
| $56 |
| | Interest income |
| | | (99 | ) | | (235 | ) | | (335 | ) | | Interest expense | (59 | ) | | (99 | ) | | (235 | ) | | Interest expense |
| | | — |
| | (1 | ) | | — |
| | Other income | — |
| | — |
| | (1 | ) | | Other income |
| | | (27 | ) | | (180 | ) | | (335 | ) | | Income (loss) before income tax expense (benefit) | 23 |
| | (27 | ) | | (180 | ) | | Income (loss) before income tax expense (benefit) |
| | | (10 | ) | | (66 | ) | | (123 | ) | | Income tax expense (benefit) | 9 |
| | (10 | ) | | (66 | ) | | Income tax expense (benefit) |
| | |
| ($17 | ) | |
| ($114 | ) | |
| ($212 | ) | | Net income (loss) |
| $14 |
| |
| ($17 | ) | |
| ($114 | ) | | Net income (loss) |
| Reclassification of net securities gains (losses) to net income (loss): | |
| $28 |
| |
| $144 |
| |
| $95 |
| | Securities gains, net | |
| Reclassification of net securities gains (losses) to net income: | |
| $29 |
| |
| $28 |
| |
| $144 |
| | Securities gains, net |
| | | (10 | ) | | (8 | ) | | (24 | ) | | Net impairment losses recognized in earnings | (7 | ) | | (10 | ) | | (8 | ) | | Net securities impairment losses recognized in earnings |
| | | 18 |
| | 136 |
| | 71 |
| | Income (loss) before income tax expense (benefit) | 22 |
| | 18 |
| | 136 |
| | Income (loss) before income tax expense (benefit) |
| | | 7 |
| | 50 |
| | 26 |
| | Income tax expense (benefit) | 8 |
| | 7 |
| | 50 |
| | Income tax expense (benefit) |
| | |
| $11 |
| |
| $86 |
| |
| $45 |
| | Net income (loss) |
| $14 |
| |
| $11 |
| |
| $86 |
| | Net income (loss) |
| Reclassification of changes related to defined benefit pension plans: | |
| $192 |
| |
| ($190 | ) | |
| $40 |
| | Salaries and employee benefits |
| ($8 | ) | |
| $192 |
| |
| ($190 | ) | | Salaries and employee benefits |
| | | 192 |
| | (190 | ) | | 40 |
| | Income (loss) before income tax expense (benefit) | (8 | ) | | 192 |
| | (190 | ) | | Income (loss) before income tax expense (benefit) |
| | | 74 |
| | (71 | ) | | 15 |
| | Income tax expense (benefit) | — |
| | 74 |
| | (71 | ) | | Income tax expense (benefit) |
| | |
| $118 |
| |
| ($119 | ) | |
| $25 |
| | Net income (loss) |
| ($8 | ) | |
| $118 |
| |
| ($119 | ) | | Net income (loss) |
| Total reclassification gains (losses) | |
| $112 |
| |
| ($147 | ) | |
| ($142 | ) | | Net income (loss) |
| $20 |
| |
| $112 |
| |
| ($147 | ) | | Net income (loss) |
CITIZENS FINANCIAL GROUP, INC.
NOTES TO CONSOLIDATED FINANCIAL STATEMENTS
The following table presents the effects to net income of the amounts reclassified out of AOCI:
| | | | Year Ended December 31, | Year Ended December 31, |
| (in millions) | 2014 |
| | 2013 |
| | 2012 |
| 2015 |
| | 2014 |
| | 2013 |
|
| Net interest income (includes ($27), ($179) and ($335) of AOCI reclassifications, respectively) |
| $3,301 |
| |
| $3,058 |
| |
| $3,227 |
| |
| Net interest income (includes $23, ($27) and ($179) of AOCI reclassifications, respectively) | |
| $3,402 |
| |
| $3,301 |
| |
| $3,058 |
|
| Provision for credit losses | 319 |
| | 479 |
| | 413 |
| 302 |
| | 319 |
| | 479 |
|
| Noninterest income (includes $18, $135 and $71 of AOCI reclassifications, respectively) | 1,678 |
| | 1,632 |
| | 1,667 |
| |
| Noninterest expense (includes ($192), $190 and ($40) of AOCI reclassifications, respectively) | 3,392 |
| | 7,679 |
| | 3,457 |
| |
| Noninterest income (includes $22, $18 and $135 of AOCI reclassifications, respectively) | | 1,422 |
| | 1,678 |
| | 1,632 |
|
| Noninterest expense (includes $8, ($192) and $190 of AOCI reclassifications, respectively) | | 3,259 |
| | 3,392 |
| | 7,679 |
|
| Income (loss) before income tax expense (benefit) | 1,268 |
| | (3,468 | ) | | 1,024 |
| 1,263 |
| | 1,268 |
| | (3,468 | ) |
| Income tax expense (benefit) (includes $71, ($87) and $82 income tax net expense and (benefit) from reclassification items, respectively) | 403 |
| | (42 | ) | | 381 |
| |
| Income tax expense (benefit) (includes $17, $71 and ($87) income tax net expense (benefit) from reclassification items, respectively) | | 423 |
| | 403 |
| | (42 | ) |
| Net income (loss) |
| $865 |
| |
| ($3,426 | ) | |
| $643 |
|
| $840 |
| |
| $865 |
| |
| ($3,426 | ) |
NOTE 2324 - BUSINESS SEGMENTS
The Company is managed by its CEO on a segment basis. The Company’s two business segments are Consumer Banking and Commercial Banking. The business segments are determined based on the products and services provided, or the type of customer served. Each segment has one or more segment heads who report directly to the CEO. The CEO has final authority over resource allocation decisions and performance assessment. The business segments reflect this management structure and the manner in which financial information is currently evaluated by the CEO. Non-segment operations are classified as Other, which includes corporate functions, the Treasury function, the securities portfolio, wholesale funding activities, intangible assets, community development, non-core assets, and other unallocated assets, liabilities, capital, revenues, provision for credit losses and expenses.
Reportable Segments
Segment results are determined based upon the Company’s management reporting system, which assigns balance sheet and income statement items to each of the business segments. The process is designed around the Company’s organizational and
CITIZENS FINANCIAL GROUP, INC.
NOTES TO CONSOLIDATED FINANCIAL STATEMENTS
management structure and, accordingly, the results derived are not necessarily comparable with similar information published by other financial institutions. A description of each reportable segment and table of financial results is presented below:
Consumer Banking
The Consumer Banking segment focuses on retail customers and small businesses with annual revenues of up to $25 million. It offers traditional banking products and services, including checking, savings, home loans, student loans, credit cards, business loans and financial management services. It also operates an indirect auto financing business, providing financing for both new and used vehicles through auto dealerships. The segment’s distribution channels include a branch network, ATMs and a work force of experienced specialists ranging from financial consultants, mortgage loan officers and business banking officers to private bankers. Our Consumer Banking value proposition is based on providing simple, easy to understand product offerings and a convenient banking experience with a more personalized approach.
Commercial Banking
The Commercial Banking segment primarily targets companies with annual revenues from $25 million to $2.5 billion and provides a full complement of financial products and solutions, including loans, leases, trade financing, deposits, cash management, commercial cards, foreign exchange, interest rate risk management, corporate finance and capital markets advisory capabilities. It focuses on smallmiddle-market companies, large corporations and middle-market companiesinstitutions and has dedicated teams with industry expertise in government banking, not-for-profit, healthcare, technology, professionals, oil & gas, asset finance, franchise finance, asset-based lending, commercial real estate, private equity and sponsor finance. While the segment’s business development efforts are predominantly focused onin the Company'sCompany’s footprint, some of its specialized industry businesses also operate selectively on a national basis (such as healthcare, asset finance and franchise finance). Commercial Banking is organized by teams that target different client industries. A key component of the Commercial Banking'sBanking’s growth strategy is to bring ideas to clients that help their businesses thrive, and in doing so, expand itsthe loan portfolio by originating high-quality commercial loans, which produce revenues consistent with its financial objectives and complies with its credit policies. Commercial underwriting is driven by cash flow analysis supported by collateral analysis and review. The commercial lending teams offer a wide range of commercial loan products, including commercial real estate loans; working capital loans and lines of credit; demand, term and time loans; and equipment, inventory and accounts receivable financing.ancillary product sales.
Non-segment Operations
Other
In addition to non-segment operations, Other includes certain reconciling items in order to translate the segment results that are based on management accounting practices into consolidated results. For example, Other includes goodwill and theany associated pre-tax $4.4 billion goodwill impairment charge recorded in 2013.
|
| | | | | | | | | | | | | | | |
| | As of and for the Year Ended December 31, 2014 |
| (in millions) | Consumer Banking | | Commercial Banking | | Other |
| | Consolidated |
|
| Net interest income |
| $2,151 |
| |
| $1,073 |
| |
| $77 |
| |
| $3,301 |
|
| Noninterest income | 899 |
| | 429 |
| | 350 |
| | 1,678 |
|
| Total revenue | 3,050 |
| | 1,502 |
| | 427 |
| | 4,979 |
|
| Noninterest expense | 2,513 |
| | 652 |
| | 227 |
| | 3,392 |
|
| Profit before provision for credit losses | 537 |
| | 850 |
| | 200 |
| | 1,587 |
|
| Provision for credit losses | 259 |
| | (6 | ) | | 66 |
| | 319 |
|
| Income before income tax expense | 278 |
| | 856 |
| | 134 |
| | 1,268 |
|
| Income tax expense | 96 |
| | 295 |
| | 12 |
| | 403 |
|
| Net income |
| $182 |
| |
| $561 |
| |
| $122 |
| |
| $865 |
|
| Total Average Assets |
| $48,939 |
| |
| $38,483 |
| |
| $40,202 |
| |
| $127,624 |
|
charges.
CITIZENS FINANCIAL GROUP, INC.
NOTES TO CONSOLIDATED FINANCIAL STATEMENTS
| | | | As of and for the Year Ended December 31, 2013 | As of and for the Year Ended December 31, 2015 |
| (in millions) | Consumer Banking | | Commercial Banking | | Other |
| | Consolidated |
| Consumer Banking | | Commercial Banking | | Other |
| | Consolidated |
|
| Net interest income (expense) |
| $2,176 |
| |
| $1,031 |
| |
| ($149 | ) | |
| $3,058 |
| |
| Net interest income | |
| $2,198 |
| |
| $1,162 |
| |
| $42 |
| |
| $3,402 |
|
| Noninterest income | 1,025 |
| | 389 |
| | 218 |
| | 1,632 |
| 910 |
| | 415 |
| | 97 |
| | 1,422 |
|
| Total revenue | 3,201 |
| | 1,420 |
| | 69 |
| | 4,690 |
| 3,108 |
| | 1,577 |
| | 139 |
| | 4,824 |
|
| Noninterest expense | 2,522 |
| | 635 |
| | 4,522 |
| | 7,679 |
| 2,456 |
| | 709 |
| | 94 |
| | 3,259 |
|
| Profit (loss) before provision for credit losses | 679 |
| | 785 |
| | (4,453 | ) | | (2,989 | ) | |
| Profit before provision for credit losses | | 652 |
| | 868 |
| | 45 |
| | 1,565 |
|
| Provision for credit losses | 308 |
| | (7 | ) | | 178 |
| | 479 |
| 252 |
| | (13 | ) | | 63 |
| | 302 |
|
| Income (loss) before income tax expense (benefit) | 371 |
| | 792 |
| | (4,631 | ) | | (3,468 | ) | |
| Income before income tax expense (benefit) | | 400 |
| | 881 |
| | (18 | ) | | 1,263 |
|
| Income tax expense (benefit) | 129 |
| | 278 |
| | (449 | ) | | (42 | ) | 138 |
| | 302 |
| | (17 | ) | | 423 |
|
| Net income (loss) |
| $242 |
| |
| $514 |
| |
| ($4,182 | ) | |
| ($3,426 | ) |
| $262 |
| |
| $579 |
| |
| ($1 | ) | |
| $840 |
|
| Total Average Assets |
| $46,465 |
| |
| $35,229 |
| |
| $39,172 |
| |
| $120,866 |
| |
| Total average assets | |
| $52,848 |
| |
| $42,800 |
| |
| $39,422 |
| |
| $135,070 |
|
| | | | As of and for the Year Ended December 31, 2012 | As of and for the Year Ended December 31, 2014 |
| (in millions) | Consumer Banking | | Commercial Banking | | Other |
| | Consolidated |
| Consumer Banking | | Commercial Banking | | Other |
| | Consolidated |
|
| Net interest income (expense) |
| $2,197 |
| |
| $1,036 |
| |
| ($6 | ) | |
| $3,227 |
| |
| Net interest income | |
| $2,151 |
| |
| $1,073 |
| |
| $77 |
| |
| $3,301 |
|
| Noninterest income | 1,187 |
| | 349 |
| | 131 |
| | 1,667 |
| 899 |
| | 429 |
| | 350 |
| | 1,678 |
|
| Total revenue | 3,384 |
| | 1,385 |
| | 125 |
| | 4,894 |
| 3,050 |
| | 1,502 |
| | 427 |
| | 4,979 |
|
| Noninterest expense | 2,691 |
| | 625 |
| | 141 |
| | 3,457 |
| 2,513 |
| | 652 |
| | 227 |
| | 3,392 |
|
| Profit (loss) before provision for credit losses | 693 |
| | 760 |
| | (16 | ) | | 1,437 |
| |
| Profit before provision for credit losses | | 537 |
| | 850 |
| | 200 |
| | 1,587 |
|
| Provision for credit losses | 408 |
| | 63 |
| | (58 | ) | | 413 |
| 259 |
| | (6 | ) | | 66 |
| | 319 |
|
| Income before income tax expense | 285 |
| | 697 |
| | 42 |
| | 1,024 |
| 278 |
| | 856 |
| | 134 |
| | 1,268 |
|
| Income tax expense | 100 |
| | 244 |
| | 37 |
| | 381 |
| 96 |
| | 295 |
| | 12 |
| | 403 |
|
| Net income |
| $185 |
| |
| $453 |
| |
| $5 |
| |
| $643 |
| 182 |
| | 561 |
| | 122 |
| | 865 |
|
| Total Average Assets |
| $47,824 |
| |
| $33,474 |
| |
| $46,368 |
| |
| $127,666 |
| |
| Total average assets | |
| $48,939 |
| |
| $38,483 |
| |
| $40,202 |
| |
| $127,624 |
|
|
| | | | | | | | | | | | | | | |
| | As of and for the Year Ended December 31, 2013 |
| (in millions) | Consumer Banking | | Commercial Banking | | Other |
| | Consolidated |
|
| Net interest income (expense) |
| $2,176 |
| |
| $1,031 |
| |
| ($149 | ) | |
| $3,058 |
|
| Noninterest income | 1,025 |
| | 389 |
| | 218 |
| | 1,632 |
|
| Total revenue | 3,201 |
| | 1,420 |
| | 69 |
| | 4,690 |
|
| Noninterest expense | 2,522 |
| | 635 |
| | 4,522 |
| | 7,679 |
|
| Profit (loss) before provision for credit losses | 679 |
| | 785 |
| | (4,453 | ) | | (2,989 | ) |
| Provision for credit losses | 308 |
| | (7 | ) | | 178 |
| | 479 |
|
| Income (loss) before income tax expense (benefit) | 371 |
| | 792 |
| | (4,631 | ) | | (3,468 | ) |
| Income tax expense (benefit) | 129 |
| | 278 |
| | (449 | ) | | (42 | ) |
| Net income (loss) | 242 |
| | 514 |
| | (4,182 | ) | | (3,426 | ) |
| Total average assets |
| $46,465 |
| |
| $35,229 |
| |
| $39,172 |
| |
| $120,866 |
|
CITIZENS FINANCIAL GROUP, INC.
NOTES TO CONSOLIDATED FINANCIAL STATEMENTS
Management accounting practices utilized by the Company as the basis for presentation for segment results include the following:
FTP adjustments
The Company utilizes an FTP system to eliminate the effect of interest rate risk from the segments’ net interest income because such risk is centrally managed within the Treasury function. The FTP system credits (or charges) the segments with the economic value of the funds created (or used) by the segments. The FTP system provides a funds credit for sources of funds and a funds charge for the use of funds by each segment. The sum of the interest income/expense and FTP charges/credits for each segment is its designated net interest income. The variance between the Company’s cumulative FTP charges and cumulative FTP credits is offset in Other.
Provision for credit losses allocations
Provision for credit losses is allocated to each business segment based on actual net charge-offs that have been recognized by the business segment. The difference between the consolidated provision for credit losses and the business segments’ net charge-offs is reflected in Other.
Income tax allocations
Income taxes are assessed to each line of business at a standard tax rate with the residual tax expense or benefit to arrive at the consolidated effective tax rate included in Other.
CITIZENS FINANCIAL GROUP, INC.
NOTES TO CONSOLIDATED FINANCIAL STATEMENTS
Expense allocations
Noninterest expenses incurred by centrally managed operations or business lines that directly support another business line’s operations are charged to the applicable business line based on its utilization of those services.
Goodwill
For impairment testing purposes, the Company allocates goodwill to its Consumer Banking and Commercial Banking reporting units. For management reporting purposes, the Company presents the goodwill balance (and any related impairment charges) in Other.
Substantially all revenues generated and long-lived assets held by the Company’s business segments are derived from clients that reside in the United States. Neither business segment earns revenue from a single external customer that represents 10 percent or more of the Company’s total revenues.
NOTE 2425 - SHARE-BASED COMPENSATION
Equity Grants Prior to the IPO
Prior to the Company'sCompany’s IPO, RBS Group granted share-based compensation awards to employees of the Company pursuant to its various long-term incentive plans, which are administered by the RBS Group Performance and Remuneration Committee. Below is a summary of those awards. All share-based compensation awards granted to Company employees have been historically settled in RBSGRBS shares. Effective as of the IPO, no share-based compensation awards in respect of RBSGRBS shares will be granted to Company employees.
Restricted Stock Units
A restricted stock unit is the right to receive shares of stock on a future date, which may be subject to time-based vesting conditions and/or performance-based vesting conditions. Time-based restricted stock units granted historically have generally become vested ratably over a three-year period. Performance-based restricted stock units granted historically have generally become vested at the end of a three-year performance period, depending on the level of performance achieved during such period as compared to specified RBS Group, divisional and/or functional performance guideposts and subject to the further adjustment at the discretion of the RBS Group Performance and Remuneration Committee.period.
The fair value of each award is determined on the grant date. All awards (whether they become vested in one increment or ratable increments) are expensed on a straight-line basis over the requisite service period. With respect to performance-based awards, over the performance and requisite service period (i.e., vesting period) of the award, the compensation expense and the number of shares of stock expected to be issued are adjusted upward or downward based upon the probability of achievement of performance. Once vesting has occurred, the related compensation cost recognized as expense is based on actual performance and the number of shares actually issued.
Special IPO Awards
In March 2014, RBS Group granted special IPO awards to certain Citizens employees. These awards were granted half in the form of restricted stock units in respect of RBSGRBS shares and half as a fixed convertible bond. The special IPO awards are scheduled
CITIZENS FINANCIAL GROUP, INC.
NOTES TO CONSOLIDATED FINANCIAL STATEMENTS
to vest 50% in March 2016 and 50% in March 2017, subject to certain conditions. Pursuant to their terms, upon the closing of the Company'sCompany’s IPO, these awards were converted into Company restricted stock units and the performance condition was met; however, following the IPO, these awards remain subject to the original vesting schedule (50% in March 2016 and 50% in March 2017) and other original terms and conditions.
Equity Award Conversion
In conjunction with the Company's IPO, any restricted stock units granted by RBS Group to Company employees that were unvested at the time of the IPO and the bond portion of special IPO awards, were converted into equity-based awards in respect of CFG common stock. Converted awards are governed by the Citizens Financial Group, Inc.applicable Converted Equity 2010 Deferral Plan and the Citizens Financial Group, Inc. Converted Equity 2010 Long Term Incentive Plan (collectively, the “Converted Equity Plans”) and are generally subject to the same terms and conditions as prior to conversion. However, when the awards become vested and are settled in accordance with their terms, grantees will receive shares of CFG common stock. Following the IPO, no additional awards were granted under the Converted Equity Plans.
CITIZENS FINANCIAL GROUP, INC.
NOTES TO CONSOLIDATED FINANCIAL STATEMENTS
The number of shares of CFG common stock underlying converted awards was determined by dividing (A) the product of (x) the maximum number of RBSGRBS shares underlying the awards outstanding as of the closing of the IPO and (y) the average of the closing prices of RBSGRBS shares on each of the 30 London Stock Exchange dealing days immediately prior to the pricing date of the IPO (such 30-day period, the “Conversion Period”), converted into U.S. Dollars using the average British Pound to U.S. Dollar currency rate over the Conversion Period, by (B) the price per share of CFG common stock on the pricing date of the IPO. The bond portion of the special IPO awards was converted by dividing the bond value by the price per share of CFG common stock on the pricing date of the IPO. During 2014, the Company converted 19,390,752 RBSG RBS share awards to 5,249,721 CFG share awards. The difference between the fair value of RBSGRBS restricted share units immediately preceding the conversion and the fair value of the CFG equity-based awards granted was not material. The bond portions of the Special IPO awards were converted to 524,783 CFG share awards.
Employee Share Plans Following the IPO
Omnibus Incentive Plan
In connection with the IPO, the Company adopted the Citizens Financial Group, Inc. 2014 Omnibus Incentive Plan (the “Omnibus Plan”). This plan permits the Company to grant a variety of awards to employees and service providers. In 2014, certainCertain employees have received share grants under this plan as an element of fixed compensation for service in a “Material Risk Taker” role (as defined by the European Banking Authority). These shares were fully vested at grant, but are subject to a retention period which lapses ratably over three to five years. TheIn addition, the Company has also grantedawarded to certain employees immediately vested shares, time-based restricted stock units under this plan.and performance-based restricted stock units pursuant to the Omnibus Plan. If a dividend is paid on shares underlying the restricted stock unitsOmnibus Plan awards prior to the date such shares are distributed, those dividends will be distributed following vesting in the same form as the dividend that has been paid to stockholders generally.
Director Compensation Plan
In connection with the IPO, the Company adopted the Citizens Financial Group, Inc. 2014 Non-Employee Directors Compensation Plan (the “Directors Plan“”Directors Plan”). Effective upon the closingGrants of the IPO, restricted stock units were granted byhave been made to the Company to itsCompany’s non-employee directors under this plan as compensation for their services pursuant to the Citizens Financial Group, Inc. Directors Plan. These grants are scheduled to vest on the earlier to occur of September 29, 2015 or the date of the 2015 annual stockholders meeting.Compensation Policy. If a dividend is paid on shares underlying the stock units prior to the date such shares are distributed, those dividends will be distributed following vesting in the same form as the dividend that has been paid to stockholders generally. In the event that a director ceases to serve on the Board of Directors prior to the vesting date for any reason other than under circumstances which would constitute cause, the restricted stock units will fully vest on the date of the director'sdirector’s cessation from service.
Employee Stock Purchase Plan
In connection with the IPO, the Company adopted the Citizens Financial Group, Inc. 2014 Employee Stock Purchase Plan(the “ESPP”), which provides eligible employees an opportunity to purchase its common stock at a 10% discount, through accumulated payroll deductions. Beginning in the fourth quarter of 2014 eligibleEligible employees may contribute up to 10% of eligible compensation to the ESPP, except that this limit is increasedup to 50%a maximum purchase of eligible compensation for the first offering period during the fourth quarter$25,000 worth of 2014; in each case, no participant may purchase sharesstock in any year with a value exceeding $25,000.calendar year. Offering periods under the ESPP are quarterly.
Shares of CFG common stock are purchased byfor a participant on the last day of each quarter at a 10% discount from the fair market value (fair market value under the plan is defined as the closing price on the day of purchase). Prior to the date the shares are purchased, participants do not have any rights or privileges as a stockholder with respect to shares to be purchased at the end of the offering period. The first purchase of 103,247 shares under the ESPP was on December 31, 2014.
CITIZENS FINANCIAL GROUP, INC.
NOTES TO CONSOLIDATED FINANCIAL STATEMENTS
Summary of Share-Based Plans Activity
The following tables summarize the activity related to ourthe Company’s share-based plans (excluding the ESPP):
| | | | Year Ended December 31, | Year Ended December 31, |
| | 2014 | | 2013 | | 2012 | 2015 | | 2014 |
| RBS Share Awards | Shares Underlying Awards | | Weighted Average Grant Price | | Shares Underlying Awards | | Weighted Average Grant Price | | Shares Underlying Awards | | Weighted Average Grant Price | |
| CFG Share Awards | | Shares
Underlying Awards | | Weighted Average Grant Price | | Shares
Underlying Awards | | Weighted Average Grant Price |
| Nonvested, January 1 | 19,778,967 |
| |
| $5.31 |
| | 22,865,810 |
| |
| $6.14 |
| | 23,490,759 |
| |
| $6.49 |
| 5,595,882 |
| |
| $21.52 |
| | — |
| |
| $— |
|
| Conversion to CFG Shares | | — |
| | — |
| | 5,774,504 |
| | 21.50 |
|
| Granted | 9,627,635 |
| | 5.48 |
| | 6,363,919 |
| | 4.66 |
| | 9,477,611 |
| | 4.41 |
| 1,315,572 |
| | 25.18 |
| | 209,099 |
| | 24.87 |
|
| Vested | (6,040,806 | ) | | 6.14 |
| | (4,208,789 | ) | | 6.68 |
| | (8,379,848 | ) | | 5.22 |
| (2,496,092 | ) | | 22.15 |
| | (161,067 | ) | | 25.07 |
|
| Forfeited | (3,975,044 | ) | | 6.73 |
| | (5,241,973 | ) | | 7.03 |
| | (1,722,712 | ) | | 5.93 |
| (987,232 | ) | | 21.58 |
| | (226,654 | ) | | 21.50 |
|
| Conversion to CFG Shares | (19,390,752 | ) | | 4.84 |
| | — |
| | — |
| | — |
| | — |
| |
| Nonvested, December 31 | — |
| |
| $— |
| | 19,778,967 |
| |
| $5.31 |
| | 22,865,810 |
| |
| $6.14 |
| 3,428,130 |
| |
| $22.43 |
| | 5,595,882 |
| |
| $21.52 |
|
| | | | Year Ended December 31, 2014 | Year Ended December 31, |
| CFG Share Awards | Shares
Underlying Awards | | Weighted Average Grant Price | |
| | | 2014 | | 2013 |
| RBS Share Awards | | Shares Underlying Awards | | Weighted Average Grant Price | | Shares Underlying Awards | | Weighted Average Grant Price |
| Nonvested, January 1 | — |
| |
| $— |
| 19,778,967 |
| |
| $5.31 |
| | 22,865,810 |
| |
| $6.14 |
|
| Conversion to CFG Shares | 5,774,504 |
| | 21.50 |
| |
| Granted | 209,099 |
| | 24.87 |
| 9,627,635 |
| | 5.48 |
| | 6,363,919 |
| | 4.66 |
|
| Vested | (161,067 | ) | | 25.07 |
| (6,040,806 | ) | | 6.14 |
| | (4,208,789 | ) | | 6.68 |
|
| Forfeited | (226,654 | ) | | 21.50 |
| (3,975,044 | ) | | 6.73 |
| | (5,241,973 | ) | | 7.03 |
|
| Conversion to CFG Shares | | (19,390,752 | ) | | 4.84 |
| | — |
| | — |
|
| Nonvested, December 31 | 5,595,882 |
| |
| $21.52 |
| — |
| |
| $— |
| | 19,778,967 |
| |
| $5.31 |
|
Approximately 61 millionThere are 60,652,066 shares of Company common stock are available for awards to be granted under our employee share plans.plans (including the “ESPP”). Upon vesting, settlement of share-based awards, the Company generally issues new shares, but may also issue shares from treasury stock.
Compensation Expense
Compensation expense related to the above share-basedshare plans (including the ESPP) was $24 million, $53 million, $27 million, and $29$27 million for the yearsyear ended December 31, 2015, 2014, 2013, and 2012,2013, respectively. At December 31, 2014,2015, the total unrecognized compensation expense for nonvested equity awards granted was $31$11 million. This expense is expected to be recognized over a weighted-average period of two years. No share-based compensation costs were capitalized during the years endedend December 31, 2015, 2014 2013 and 2012.2013.
The income tax benefit recognized in earnings based on the compensation expense recognized for all share-based compensation arrangements amounted to $5 million and $17 million in 2014.2015 and 2014, respectively. The excess of actual tax deductions over amounts assumed, which are recognized in stockholders’ equity, werewas insignificant in 2013 and 2012.
2013.
CITIZENS FINANCIAL GROUP, INC.
NOTES TO CONSOLIDATED FINANCIAL STATEMENTS
NOTE 2526 - EARNINGS PER SHARE
| | | | | Year Ended December 31, | Year Ended December 31, |
| (dollars in millions, except share and per-share data) | | 2014 |
| | 2013 |
| | 2012 |
| 2015 |
| | 2014 |
| | 2013 |
|
| Numerator (basic and diluted): | | | | | | | | | | | |
| Net income (loss) | |
| $865 |
| |
| ($3,426 | ) | |
| $643 |
|
| $840 |
| |
| $865 |
| |
| ($3,426 | ) |
| Less: Preferred stock dividends | | — |
| | — |
| | — |
| 7 |
| | — |
| | — |
|
| Net income (loss) available to common stockholders | |
| $865 |
| |
| ($3,426 | ) | |
| $643 |
|
| $833 |
| |
| $865 |
| |
| ($3,426 | ) |
| Denominator: | | | | | | | | | | | |
| Weighted-average common shares outstanding - basic | | 556,674,146 |
| | 559,998,324 |
| | 559,998,324 |
| 535,599,731 |
| | 556,674,146 |
| | 559,998,324 |
|
| Dilutive common shares: share-based awards | | 1,050,790 |
| | — |
| | — |
| 2,621,167 |
| | 1,050,790 |
| | — |
|
| Weighted-average common shares outstanding - diluted | | 557,724,936 |
| | 559,998,324 |
| | 559,998,324 |
| 538,220,898 |
| | 557,724,936 |
| | 559,998,324 |
|
| Earnings (loss) per common share: | | | | | | | | | | | |
| Basic | |
| $1.55 |
| |
| ($6.12 | ) | |
| $1.15 |
|
| $1.55 |
| |
| $1.55 |
| |
| ($6.12 | ) |
| Diluted | | 1.55 |
| | (6.12 | ) | | 1.15 |
| 1.55 |
| | 1.55 |
| | (6.12 | ) |
Basic EPS is computed by dividing net income/(loss)income available to common stockholders by the weighted-average number of common shares outstanding during each period. Diluted EPS is computed by dividing net income/(loss)income available to common stockholders by the weighted-average number of common shares outstanding during each period, plus the effect of potential dilutive common shares such as share-based awards, using the treasury stock method. Potential dilutive common shares are excluded from the computation of diluted EPS in the periods where the effect would be antidilutive.
On August 22, 2014, the Company declared and made effective a 165,582-for-1 forward stock split of common stock. As a result, all share and per share data have been restated to reflect the effect of the split.
CITIZENS FINANCIAL GROUP, INC.
NOTES TO CONSOLIDATED FINANCIAL STATEMENTS
NOTE 2627 - PARENT COMPANY ONLY FINANCIALS
CFG Parent Company
Condensed Statements of Operations
| | | | Year Ended December 31, | Year Ended December 31, |
| (in millions) | 2014 |
| | 2013 |
| | 2012 |
| 2015 |
| | 2014 |
| | 2013 |
|
| OPERATING INCOME: | | | | | | | | | | |
| Income from bank subsidiaries and associated banks, excluding equity in undistributed income: | | | | | | |
| Dividends |
| $595 |
| |
| $210 |
| |
| $175 |
| |
| Income from consolidated bank subsidiaries and associated banks, excluding equity in undistributed income: | | | | | | |
| Dividends from banking subsidiaries | |
| $345 |
| |
| $595 |
| |
| $210 |
|
| Interest | 29 |
| | 13 |
| | 13 |
| 54 |
| | 29 |
| | 13 |
|
| Management and service fees | 21 |
| | 26 |
| | 42 |
| 20 |
| | 21 |
| | 26 |
|
| Securities gains | — |
| | — |
| | 1 |
| 3 |
| | — |
| | — |
|
| All other operating income | 5 |
| | 2 |
| | 4 |
| 4 |
| | 5 |
| | 2 |
|
| Total operating income | 650 |
| | 251 |
| | 235 |
| 426 |
| | 650 |
| | 251 |
|
| OPERATING EXPENSE: | | | | | | | | | | |
| Salaries and employee benefits | 63 |
| | 38 |
| | 52 |
| 15 |
| | 63 |
| | 38 |
|
| Interest expense | 80 |
| | 24 |
| | 4 |
| 108 |
| | 80 |
| | 24 |
|
| All other expenses | 123 |
| | 43 |
| | 39 |
| 38 |
| | 123 |
| | 43 |
|
| Total operating expense | 266 |
| | 105 |
| | 95 |
| 161 |
| | 266 |
| | 105 |
|
| Income before taxes and undistributed income | 384 |
| | 146 |
| | 140 |
| 265 |
| | 384 |
| | 146 |
|
| Applicable income taxes | (77 | ) | | (22 | ) | | (9 | ) | (29 | ) | | (77 | ) | | (22 | ) |
| Income before undistributed income of subsidiaries and associated companies | 461 |
| | 168 |
| | 149 |
| 294 |
| | 461 |
| | 168 |
|
| Equity in undistributed income (losses) of subsidiaries and associated companies: | | | | | | | | | | |
| Bank | 402 |
| | (3,595 | ) | | 501 |
| 543 |
| | 402 |
| | (3,595 | ) |
| Nonbank | 2 |
| | 1 |
| | (7 | ) | 3 |
| | 2 |
| | 1 |
|
| Net income (loss) |
| $865 |
| |
| ($3,426 | ) | |
| $643 |
|
| $840 |
| |
| $865 |
| |
| ($3,426 | ) |
| Other comprehensive income (loss), net of income taxes: | | | | | | | | | | |
| Net pension plan activity arising during the period |
| $8 |
| |
| $17 |
| |
| ($7 | ) |
| $1 |
| |
| $8 |
| |
| $17 |
|
| Net unrealized derivative instrument gains arising during the period | — |
| | 1 |
| | — |
| 2 |
| | — |
| | 1 |
|
| Net unrealized securities gains arising during the period | 1 |
| | — |
| | — |
| |
| Other comprehensive income (loss) activity of the Parent Company Only, net of income taxes | 9 |
| | 18 |
| | (7 | ) | |
| Other comprehensive income (loss) activity of Bank subsidiaries, net of income taxes | 267 |
| | (354 | ) | | 223 |
| |
| Total other comprehensive income (loss), net of income taxes | 276 |
| | (336 | ) | | 216 |
| |
| Net unrealized securities (losses) gains arising during the period | | (2 | ) | | 1 |
| | — |
|
| Other comprehensive income activity of the Parent Company Only, net of income taxes | | 1 |
| | 9 |
| | 18 |
|
| Other comprehensive (loss) income activity of Bank subsidiaries, net of income taxes | | (16 | ) | | 267 |
| | (354 | ) |
| Total other comprehensive (loss) income, net of income taxes | | (15 | ) | | 276 |
| | (336 | ) |
| Total comprehensive income (loss) |
| $1,141 |
| |
| ($3,762 | ) | |
| $859 |
|
| $825 |
| |
| $1,141 |
| |
| ($3,762 | ) |
In accordance with federal and state banking regulations, dividends paid by the Company’s banking subsidiaries to the Company itself are generally limited to the retained earnings of the respective banking subsidiaries unless specifically approved by the appropriate bank regulator. The Company declared and paid total common stock dividends of $214 million in 2015, $806 million in 2014, and $1.2 billion in 2013, and $150 million in 2012.
2013.
CITIZENS FINANCIAL GROUP, INC.
NOTES TO CONSOLIDATED FINANCIAL STATEMENTS
CFG Parent Company
Condensed Balance Sheets
| | | (in millions) | December 31, 2014 | | December 31, 2013 | December 31, 2015 | | December 31, 2014 |
| ASSETS: | | | | | | |
| Cash and due from banks |
| $280 |
| |
| $494 |
|
| $531 |
| |
| $280 |
|
| Loans and advances to: | | | | | | |
| Bank subsidiaries | 1,685 |
| | 459 |
| 1,725 |
| | 1,685 |
|
| Related bank holding companies | — |
| | 1 |
| |
| Investments in subsidiaries: | | | | | | |
| Bank subsidiaries | 19,512 |
| | 19,522 |
| 19,865 |
| | 19,512 |
|
| Nonbank subsidiaries | 72 |
| | 73 |
| 54 |
| | 72 |
|
| Balances due from RBS | | 6 |
| | — |
|
| Other assets | 214 |
| | 178 |
| 154 |
| | 214 |
|
| TOTAL ASSETS |
| $21,763 |
| |
| $20,727 |
|
| $22,335 |
| |
| $21,763 |
|
| LIABILITIES: | | | | | | |
| Long-term debt due to: | | | | | | |
| Unaffiliated companies |
| $350 |
| |
| $350 |
|
| $1,345 |
| |
| $350 |
|
| Related bank holding companies | 2,000 |
| | 1,000 |
| |
| Balances due to related bank holding companies | 2 |
| | — |
| |
| RBS | | 1,250 |
| | 2,000 |
|
| Balances due to RBS | | 3 |
| | 2 |
|
| Balances due to nonbank subsidiaries | | 1 |
| | — |
|
| Other liabilities | 143 |
| | 181 |
| 90 |
| | 143 |
|
| TOTAL LIABILITIES | 2,495 |
| | 1,531 |
| 2,689 |
| | 2,495 |
|
| TOTAL STOCKHOLDERS' EQUITY | 19,268 |
| | 19,196 |
| |
| TOTAL LIABILITIES AND STOCKHOLDERS' EQUITY |
| $21,763 |
| |
| $20,727 |
| |
| TOTAL STOCKHOLDERS’ EQUITY | | 19,646 |
| | 19,268 |
|
| TOTAL LIABILITIES AND STOCKHOLDERS’ EQUITY | |
| $22,335 |
| |
| $21,763 |
|
CITIZENS FINANCIAL GROUP, INC.
NOTES TO CONSOLIDATED FINANCIAL STATEMENTS
CFG Parent Company
Condensed Cash Flow Statements
| | | | Year Ended December 31, | Year Ended December 31, |
| (in millions) | 2014 |
| | 2013 |
| | 2012 |
| 2015 |
| | 2014 |
| | 2013 |
|
| OPERATING ACTIVITIES | | | | | | | | | | |
| Net income (loss) |
| $865 |
| |
| ($3,426 | ) | |
| $643 |
|
| $840 |
| |
| $865 |
| |
| ($3,426 | ) |
| Adjustments to reconcile net income (loss) to net cash provided by operating activities: | | | | | | | | | | |
| Deferred income taxes | 27 |
| | (11 | ) | | (12 | ) | 49 |
| | 27 |
| | (11 | ) |
| Gain on sales of assets | — |
| | — |
| | (1 | ) | (3 | ) | | — |
| | — |
|
| Equity in undistributed (earnings) losses of subsidiaries | (404 | ) | | 3,594 |
| | (494 | ) | (546 | ) | | (404 | ) | | 3,594 |
|
| Net change in other liabilities | 18 |
| | 7 |
| | 47 |
| (48 | ) | | 18 |
| | 7 |
|
| Net change in other assets | (74 | ) | | 15 |
| | (20 | ) | (16 | ) | | (74 | ) | | 15 |
|
| Other operating, net | 17 |
| | 1 |
| | (2 | ) | 3 |
| | 17 |
| | 1 |
|
| Total adjustments | (416 | ) | | 3,606 |
| | (482 | ) | (561 | ) | | (416 | ) | | 3,606 |
|
| Net cash provided by operating activities | 449 |
| | 180 |
| | 161 |
| 279 |
| | 449 |
| | 180 |
|
| INVESTING ACTIVITIES | | | | | | | | | | |
| Proceeds from sales and maturities of securities available for sale | — |
| | — |
| | 3 |
| |
| Proceeds from sales of securities available for sale | | 8 |
| | — |
| | — |
|
| Payments for investments in and advances to subsidiaries | (1,470 | ) | | (220 | ) | | (800 | ) | (215 | ) | | (1,470 | ) | | (220 | ) |
| Sale or repayment of investments in and advances to subsidiaries | 945 |
| | 315 |
| | 1,164 |
| 376 |
| | 945 |
| | 315 |
|
| Other investing, net | (11 | ) | | (1 | ) | | (1 | ) | — |
| | (11 | ) | | (1 | ) |
| Net cash (used) provided by investing activities | (536 | ) | | 94 |
| | 366 |
| 169 |
| | (536 | ) | | 94 |
|
| FINANCING ACTIVITIES | | | | | | | | | | |
| Proceeds from advances from subsidiaries | — |
| | — |
| | 5 |
| |
| Repayment of advances from subsidiaries | — |
| | (289 | ) | | (239 | ) | — |
| | — |
| | (289 | ) |
| Proceeds from issuance of long-term debt | 1,000 |
| | 1,000 |
| | 350 |
| 1,000 |
| | 1,000 |
| | 1,000 |
|
| Repayments of long-term debt | | (750 | ) | | — |
| | — |
|
| Proceeds from issuance of common stock | 13 |
| | — |
| | — |
| 27 |
| | 13 |
| | — |
|
| Repurchase of common stock | (334 | ) | | — |
| | — |
| (500 | ) | | (334 | ) | | — |
|
| Proceeds from issuance of preferred stock | | 247 |
| | — |
| | — |
|
| Dividends paid | (806 | ) | | (1,185 | ) | | (150 | ) | (221 | ) | | (806 | ) | | (1,185 | ) |
| Net cash used by financing activities | (127 | ) | | (474 | ) | | (34 | ) | (197 | ) | | (127 | ) | | (474 | ) |
| Net (decrease) increase in cash and due from banks | (214 | ) | | (200 | ) | | 493 |
| |
| Net increase (decrease) in cash and due from banks | | 251 |
| | (214 | ) | | (200 | ) |
| Cash and due from banks at beginning of year | 494 |
| | 694 |
| | 201 |
| 280 |
| | 494 |
| | 694 |
|
| Cash and due from banks at end of year |
| $280 |
| |
| $494 |
| |
| $694 |
|
| $531 |
| |
| $280 |
| |
| $494 |
|
NOTE 2728 - OTHER OPERATING EXPENSE
The following table presents the details of other operating expense:
| | | | Year Ended December 31, | Year Ended December 31, |
| (in millions) | 2014 |
| | 2013 |
| | 2012 |
| 2015 |
| | 2014 |
| | 2013 |
|
| Deposit insurance |
| $95 |
| |
| $85 |
| |
| $98 |
|
| $115 |
| |
| $95 |
| |
| $85 |
|
| Promotional expense | 86 |
| | 76 |
| | 86 |
| 101 |
| | 86 |
| | 76 |
|
| Settlements and operating losses | 89 |
| | 51 |
| | 58 |
| 43 |
| | 89 |
| | 51 |
|
| Postage and delivery | 48 |
| | 60 |
| | 196 |
| 46 |
| | 48 |
| | 60 |
|
| Other | 255 |
| | 256 |
| | 271 |
| 225 |
| | 255 |
| | 256 |
|
| Other operating expense |
| $573 |
| |
| $528 |
| |
| $709 |
|
| $530 |
| |
| $573 |
| |
| $528 |
|
CITIZENS FINANCIAL GROUP, INC.
NOTES TO CONSOLIDATED FINANCIAL STATEMENTS
NOTE 2829 - SUBSEQUENT EVENTS
The Company has evaluated the impacts of events that have occurred subsequent to December 31, 20142015 through the date the Consolidated Financial Statements were filed with the SEC. Based on this evaluation, the Company has determined none of these events were required to be recognized or disclosed in the Consolidated Financial Statements and related Notes, other than that on February 19, 2015,except as follows:
On January 7, 2016, the Company paidentered into an agreement to purchase student loans on a quarterly basis beginning with the first calendar quarter in 2016 and ending with the fourth calendar quarter in 2016. Under the terms of the agreement, the Company committed to purchase a minimum of $125 million of loans per quarter. The minimum and maximum amount of the aggregate purchase principal balance of loans under the terms of the agreement are $500 million and $1 billion, respectively. The agreement will terminate immediately if at any time during its term the aggregate purchase principal balance of loans equals the maximum amount. The agreement may be extended by written agreement of the parties for an additional four quarters. The Company may terminate the agreement at will with payment of a termination fee equal to the product of $1 million times the number of calendar quarters remaining in the term.
On January 8, 2016, the Company completed a $369 million purchase of student loans pursuant to the agreement described above.
On January 22, 2016, the Company announced a quarterly cash dividend on our common shares of $0.10 per share, or $55$53 million, which was paid on February 18, 2016 to stockholders of record at the close of business on February 5, 2015.4, 2016.
On January 28, 2016, RBS received written notice from the Federal Reserve Board that it is not deemed to control CFG for purposes of the Bank Holding Company Act.
On February 24, 2016, the Company announced the appointment of Malcolm Griggs as Executive Vice President and Chief Risk Officer effective April 1, 2016. Mr. Griggs, who has been with the bank since 2014, will succeed the Company’s current Chief Risk Officer, Nancy Shanik, who is retiring from the Company as of May 31, 2016.
On February 25, 2016, the Company announced that its Board of Directors declared a semi-annual preferred dividend on its 5.500% Series A, Fixed-to-Floating Non-Cumulative Perpetual Preferred Stock. The dividend of $27.50 per share, or $7 million in the aggregate, is payable on April 6, 2016 to the holders of record as of March 22, 2016.
CITIZENS FINANCIAL GROUP, INC.
ITEM 9. CHANGES IN AND DISAGREEMENTS WITH ACCOUNTANTS ON ACCOUNTING AND FINANCIAL DISCLOSURE
None.
ITEM 9A. CONTROLS AND PROCEDURES
The Company maintains a set of disclosure controls and procedures designed to ensure that information required to be disclosed by the Company in reports that it files or submits under the Exchange Act, is recorded, processed, summarized and reported within the time periods specified in SEC rules and forms. The design of any disclosure controls and procedures is based in part upon certain assumptions about the likelihood of future events, and there can be no assurance that any design will succeed in achieving its stated goals under all potential future conditions. Any controls and procedures, no matter how well designed and operated, can provide only reasonable, not absolute, assurance of achieving the desired control objectives. In accordance with Rule 13a-15(b) of the Exchange Act, as of the end of the period covered by this annual report, an evaluation was carried out under the supervision and with the participation of the Company’s management, including its Chief Executive Officer and Chief Financial Officer, of the effectiveness of its disclosure controls and procedures. Based on that evaluation, the Company’s Chief Executive Officer and Chief Financial Officer concluded that the Company’s disclosure controls and procedures, as of the end of the period covered by this annual report, were effective to provide reasonable assurance that information required to be disclosed by the Company in reports that it files or submits under the Exchange Act is recorded, processed, summarized and reported within the time periods specified in SEC rules and forms and is accumulated and communicated to the Company’s management, including the Chief Executive Officer and Chief Financial Officer, as appropriate to allow timely decisions regarding required disclosure.
There were no changes in our internal control over financial reporting identified in management's evaluation pursuant to Rules13a-15(d) or 15d-15(d) of the Exchange Act during the period covered by this annual report on Form 10-K that materially affected, or are reasonably likely to materially affect, our internal control over financial reporting.
This annual report does not include a reportManagement’s Annual Report on Internal Control over Financial Reporting, the Reporting of management’s assessment regarding internal controlIndependent Registered Public Accounting Firm on Internal Control over financial reporting or an attestation reportFinancial Reporting, and the Report of the Company’s registered public accounting firm due to a transition period established by rules of the SecuritiesIndependent Registered Public Accounting Firm are included in Item 8 on pages 122, 123 and Exchange Commission for newly public companies.
124, respectively.
ITEM 9B. OTHER INFORMATION
None.
CITIZENS FINANCIAL GROUP, INC.
PART III
We refer in Part III of this report to relevant sections of our 20152016 Proxy Statement for the 20152016 annual meeting of shareholders, which will be filed with the SEC pursuant to Regulation 14A within 120 days of the close of our 20142015 fiscal year. Portions of our 20152016 Proxy Statement, including the sections we refer to in this report, are incorporated by reference into this report.
ITEM 10. DIRECTORS, EXECUTIVE OFFICERS AND CORPORATE GOVERNANCE
Information required by this item is presented under the captions Election of Directors, Officers, and Corporate Governance, Our Executive Officers, Board Meetings and Committee Information, Report of the Audit Committee, and Section 16(a) Beneficial Ownership Reporting Compliance, and Audit Matters — Audit Committee Report of our 20152016 Proxy Statement, which is incorporated by reference into this item.
ITEM 11. EXECUTIVE COMPENSATION
Information required by this item is presented under the captions Compensation of ExecutivesDiscussion and Analysis, Compensation Committee Report, Executive Compensation, Director Compensation, and Compensation Risk Assessment of our 20152016 Proxy Statement, which is incorporated by reference into this item.
ITEM 12. SECURITY OWNERSHIP OF CERTAIN BENEFICIAL OWNERS AND MANAGEMENT AND RELATED STOCKHOLDER MATTERS
Information required by this item is presented under the captionscaption Security Ownership of Certain Beneficial Owners and Management and Equity Compensation Plan Information of our 20152016 Proxy Statement, which is incorporated by reference into this item.
ITEM 13. CERTAIN RELATIONSHIPS AND RELATED TRANSACTIONS, AND DIRECTOR INDEPENDENCE
Information required by this item is set forth under the captions Indebtedness of Managementcaption Directors, Executive Officers and Certain otherCorporate Governance — Director Independence, Policies and Procedures for Related Party Transactions, and Related Party Transactions of our 20152016 Proxy Statement, which is incorporated by reference into this item.
ITEM 14. PRINCIPAL ACCOUNTANT FEES AND SERVICES
Information required by this item is presented under the caption Proposal to Ratify the AppointmentAudit Matters — Pre-approval of Independent Auditor Services and Independent Registered Public Accounting Firm Fees of our 20152016 Proxy Statement, which is incorporated by reference into this item.
CITIZENS FINANCIAL GROUP, INC.
PART IV
ITEM 15. EXHIBITS AND FINANCIAL STATEMENT SCHEDULES
(a)a)(1) Financial Statements of Citizens Financial Group, Inc. included in this report:
Report of Independent Registered Public Accounting Firm;
Consolidated Balance Sheets as of December 31, 20142015 and 2013;2014;
Consolidated Statements of Operations for the Years Ended December 31, 2015, 2014 2013 and 2012;2013;
Consolidated Statements of Other Comprehensive Income (Loss) for the Years Ended December 31, 2015, 2014 2013 and 2012;2013;
Consolidated Statements of Changes in Stockholders’ Equity for the Years Ended December 31, 2015, 2014 2013 and 2012;2013;
Consolidated Statements of Cash Flows for the Years Ended December 31, 2015, 2014 2013 and 2012;2013; and
Notes to Consolidated Financial Statements.
(a)(2) Financial Statement Schedules
All financial statement schedules for the Registrant have been included in the audited Consolidated Financial Statements or the related footnotes in Part II, Item 8 — Financial Statements and Supplementary Data, included elsewhere in this report, or are either inapplicable or not required.
(a)(3) Exhibits
| |
| 3.1 | Amended and Restated Certificate of Incorporation of the Registrant as in effect on the date hereof (incorporated herein by reference to Exhibit 3.1 of the Quarterly Report on Form 10-Q, filed November 14, 2014) |
| |
| 3.2 | Bylaws of the Registrant (as amended and restated on February 13, 2015) (incorporated herein by reference to Exhibit 3.1 of the Current Report on Form 8-K, filed February 17, 2015) |
| |
| 4.1 | Senior Debt Indenture between the Company and The Bank of New York Mellon dated as of October 28, 2015 (incorporated by reference to Exhibit 4.1 of Registration Statement on Form S-3, filed October 29, 2015) |
| |
| 4.2 | Subordinated Indenture between the Company and The Bank of New York Mellon dated as of September 28, 2012 (incorporated herein by reference to Exhibit 4.2 of the Registration Statement on Form S-1, filed July 28, 2015) |
| |
| 4.3 | Form of Certificate representing the Series A Preferred Stock (incorporated herein by reference to Exhibit 4.1 of the Current Report on Form 8-K, filed on April 6, 2015) |
| |
| 4.4 | Registration and Purchase Agreement between the Registrant and The Royal Bank of Scotland Group plc* |
| |
| 4.5 | Agreement to furnish to the Securities and Exchange Commission upon request a copy of instruments defining the rights of holders of certain long-term debt of the registrant and consolidated subsidiaries* |
| |
| 10.1 | Separation and Shareholder Agreement between the Registrant and The Royal Bank of Scotland Group plc (incorporated herein by reference to Exhibit 10.1 of the Quarterly Report on Form 10-Q, filed November 14, 2014) |
| |
| 10.2 | Transitional Services Agreement between the Registrant and The Royal Bank of Scotland Group plc (incorporated herein by reference to Exhibit 10.2 of the Quarterly Report on Form 10-Q, filed November 14, 2014) |
| |
| 10.3 | Trademark License Agreement between the Registrant and The Royal Bank of Scotland Group plc (incorporated herein by reference to Exhibit 10.3 of the Quarterly Report on Form 10-Q, filed November 14, 2014) |
| |
| 10.4 | Registration Rights Agreement between the Registrant and The Royal Bank of Scotland Group plc (incorporated herein by reference to Exhibit 10.4 of the Quarterly Report on Form 10-Q, filed November 14, 2014) |
| |
| 10.5 | Amended and Restated Master Service Agreement between Citizens Bank, N.A. and RBS Business Services Private LTD (incorporated herein by reference to Exhibit 10.5 of the Quarterly Report on Form 10-Q, filed November 14, 2014) |
CITIZENS FINANCIAL GROUP, INC.
| |
| 10.6 | Transitional Services Agreement between Citizens Bank, N.A. and RBS Global Trade Service Centre Private Limited (incorporated herein by reference to Exhibit 10.6 of the Quarterly Report on Form 10-Q, filed November 14, 2014) |
| |
| 10.7 | Citizens Financial Group, Inc. Converted Equity 2010 Deferral Plan (incorporated herein by reference to Exhibit 10.7 of the Quarterly Report on Form 10-Q, filed November 14, 2014)† |
| |
| 10.8 | Citizens Financial Group, Inc. Converted Equity 2010 Long Term Incentive Plan (incorporated herein by reference to Exhibit 10.8 of the Quarterly Report on Form 10-Q, filed November 14, 2014)† |
| |
| 10.9 | Citizens Financial Group, Inc. 2014 Omnibus Incentive Plan (incorporated herein by reference to Exhibit 10.11 of the Quarterly Report on Form 10-Q, filed November 14, 2014)† |
CITIZENS FINANCIAL GROUP, INC.
| |
| 10.10 | Citizens Financial Group, Inc. 2014 Omnibus Incentive Plan Form of Restricted Stock Unit Agreement†*Agreement (incorporated herein by reference to Exhibit 10.10 of the Annual Report on Form 10-K, filed on March 3, 2015)† |
| |
| 10.11 | Citizens Financial Group, Inc. 2014 Omnibus Incentive Plan Form of Performance ShareRestricted Stock Unit Award Agreement†Agreement for 2016 Awards†* |
| |
| 10.12 | Citizens Financial Group, Inc. 2014 Omnibus Incentive Plan Form of Performance Share Unit Award Agreement (incorporated herein by reference to Exhibit 10.11 of the Annual Report on Form 10-K, filed on March 3, 2015)† |
| |
| 10.13 | Citizens Financial Group, Inc. 2014 Omnibus Incentive Plan Form of Role-Based Allowance - Share Award Agreement†Agreement (incorporated herein by reference to Exhibit 10.12 of the Annual Report on Form 10-K, filed on March 3, 2015)† |
| |
| 10.14 | Citizens Financial Group, Inc. Amendment to Performance Share Unit Award Agreement/Restricted Stock Unit Agreement/Deferred Cash Agreement Terms and Conditions†* |
| |
10.1310.15 | Citizens Financial Group, Inc. 2014 Employee Stock Purchase Plan (incorporated herein by reference to Exhibit 99.3 of the Registration Statement on Form S-8, filed September 26, 2014)† |
| |
10.1410.16 | Citizens Financial Group, Inc. Non-Employee Directors Compensation Policy original adopted as of September 29, 2014 and amended on June 25, 2015 (incorporated herein by reference to Exhibit 10.910.14 of the Quarterly ReportRegistration Statement on Form 10-Q,S-1, filed November 14, 2014) July 21, 2015)† |
| |
10.1510.17 | Citizens Financial Group, Inc. 2014 Non-Employee Directors Compensation Plan (incorporated herein by reference to Exhibit 99.2 of the Registration Statement on Form S-8, filed September 26, 2014)† |
| |
10.1610.18 | Citizens Financial Group, Inc. 2014 Non-Employee Directors Compensation Plan Award Agreement (incorporated herein by reference to Exhibit 10.10 of the Quarterly Report on Form 10-Q, filed November 14, 2014)† |
| |
10.1710.19 | Form of Citizens Financial Group, Inc. 2014 Non-Employee Directors Compensation Plan Award Agreement for 2016 Awards†* |
| |
| 10.20 | Amended and Restated Deferred Compensation Plan for Directors of Citizens Financial Group, Inc., effective January 1, 2009 (incorporated herein by reference to Exhibit 10.19 of Amendment No. 2 to Registration Statement on Form S-1, filed August 15, 2014)† |
| |
10.1810.21 | Form of Indemnification Agreement (incorporated herein by reference to Exhibit 10.5 of Amendment No. 3 to Registration Statement on Form S-1, filed September 8, 2014)† |
| |
10.19 | The Royal Bank of Scotland Group, plc 2007 Executive Share Option Plan (incorporated herein by reference to Exhibit 10.16 of Amendment No. 2 to Registration Statement on Form S-1, filed August 15, 2014) † |
| |
10.20 | Form of The Royal Bank of Scotland Group, plc 2007 Executive Share Option Plan Award Certificate (incorporated herein by reference to Exhibit 10.17 of Amendment No. 2 to Registration Statement on Form S-1, filed |
August 15, 2014) †
| |
10.2110.25 | Amended and Restated CFG Voluntary Executive Deferred Compensation Plan, effective January 1, 2009 and amended and restated on September 1, 2014†*2014 (incorporated herein by reference to Exhibit 10.21 of the Annual Report on Form 10-K, filed on March 3, 2015)† |
| |
10.2210.26 | Amended and Restated Citizens Financial Group, Inc. Deferred Compensation Plan, effective January 1, 2009 (incorporated herein by reference to Exhibit 10.20 of Amendment No. 2 to Registration Statement on Form S-1, filed August 15, 2014)† |
CITIZENS FINANCIAL GROUP, INC.
| |
10.2310.27 | Citizens Financial Group, Inc. Form of Deferred Cash Award Agreement†*Agreement (incorporated herein by reference to Exhibit 10.23 of the Annual Report on Form 10-K, filed on March 3, 2015)† |
| |
10.2410.28 | Citizens Financial Group, Inc. Form of Deferred Cash Award Agreement for 2016 Awards†* |
| |
| 10.29 | Citizens Financial Group, Inc. Executive Severance Practice (incorporated herein by reference to Exhibit 10.21 of Amendment No. 2 to Registration Statement on Form S-1, filed August 15, 2014)† |
| |
10.2510.30 | Form of The Royal Bank of Scotland Group, plc 2010 Deferral Plan Award Certificate (incorporated herein by reference to Exhibit 10.23 of Amendment No. 2 to Registration Statement on Form S-1, filed August 15, 2014)† |
| |
10.2610.31 | Form of The Royal Bank of Scotland Group, plc 2010 Long Term Incentive Plan Award Certificate (incorporated herein by reference to Exhibit 10.25 of Amendment No. 2 to Registration Statement on Form S-1, filed August 15, 2014)† |
| |
10.2710.32 | Form of The Royal Bank of Scotland Group, plc 2010 Long Term Incentive Plan Award Certificate for Bruce Van Saun (incorporated herein by reference to Exhibit 10.26 of Amendment No. 2 to Registration Statement on Form S-1, filed August 15, 2014)† |
| |
10.2810.33 | Citizens Financial Group, Inc. Performance Formula and Incentive Plan†*Plan (incorporated herein by reference to Exhibit 10.28 of Annual Report on Form 10-K, filed on March 3, 2015)† |
CITIZENS FINANCIAL GROUP, INC.
| |
10.2910.34 | Form of The Royal Bank of Scotland Group, plc CFG Special (IPO) Award Certificate (incorporated herein by reference to Exhibit 10.35 of Amendment No. 2 to Registration Statement on Form S-1, filed August 15, 2014)† |
| |
10.3010.35 | Form of Role Based Allowance Letter (incorporated herein by reference to Exhibit 10.36 of Amendment No. 2 to Registration Statement on Form S-1, filed August 15, 2014)† |
| |
10.3110.36 | Employment Agreement, dated October 1, 2013, between the Registrant and Bruce Van Saun (incorporated herein by reference to Exhibit 10.6 of Amendment No. 2 to Registration Statement on Form S-1, filed August 15, 2014)† |
| |
10.3210.37 | Offer Letter, dated November 6, 2013, between The Royal Bank of Scotland Group, plc and Bruce Van Saun (incorporated herein by reference to Exhibit 10.7 of Amendment No. 2 to Registration Statement on Form S-1, filed August 15, 2014)† |
August 15, 2014)†
| |
10.3310.38 | Executive Employment Agreement, dated March 21, 2007,6, 2015, between RBS North America Services, Inc.the Registrant and Ellen AlemanyEric Aboaf (incorporated herein by reference to Exhibit 10.810.43 of Registration Statement on Form S-1, filed March 12, 2015)† |
| |
| 10.39 | Retirement Agreement, dated March 9, 2015, between the Registrant and John Fawcett (incorporated herein by reference to Exhibit 10.44 of Amendment No. 1 to Registration Statement on Form S-1, filed March 23, 2015)† |
| |
| 10.40 | Executive Employment Agreement, dated March 23, 2015, between the Registrant and Donald H. McCree III (incorporated by reference to Exhibit 10.45 of Amendment No. 2 to Registration Statement on Form S-1, filed August 15, 2014)March 25, 2015) † |
| |
10.34 | Side Letter, dated March 21, 2007, between RBS North America Services, Inc. and Ellen Alemany (incorporated herein by reference to Exhibit 10.9 of Amendment No. 2 to Registration Statement on Form S-1, filed August 15, 2014)† |
| |
10.35 | Separation and Release Agreement, dated May 13, 2013, between the Registrant, The Royal Bank of Scotland Group, |
plc and Ellen Alemany (incorporated herein by reference to Exhibit 10.10 of Amendment No. 2 to Registration Statement on Form S-1, filed August 15, 2014)†
| |
10.36 | Offer Letter, dated August 28, 2007, between RBS North America Services, Inc. and Robert D. Matthews, Jr. |
(incorporated herein by reference to Exhibit 10.11 of Amendment No. 2 to Registration Statement on Form S-1, filed August 15, 2014)†
| |
10.37 | Side Letter, dated May 17, 2010, between the Registrant and Robert D. Matthews, Jr. (incorporated herein by reference to Exhibit 10.12 of Amendment No. 2 to Registration Statement on Form S-1, filed August 15, 2014)† |
| |
10.3810.41 | Offer Letter, dated September 18, 2007, as amended on August 14, 2014, between RBS North America Services, Inc. and John Fawcett†*Fawcett (incorporated herein by reference to Exhibit 10.38 of the Annual Report on Form 10-K, filed on March 3, 2015† |
| |
10.3910.42 | Offer Letter, dated May 23, 2008, as amended on August 6, 2014 between the Registrant and Brad Conner†*Conner (incorporated herein by reference to Exhibit 10.39 of the Annual Report on Form 10-K, filed on March 3, 2015† |
| |
10.4010.43 | Offer Letter, dated September 13, 2010, as amended on January 20, 2015, between the Registrant and Nancy Shanik†*Shanik (incorporated herein by reference to Exhibit 10.40 of the Annual Report on Form 10-K, filed on March 3, 2015)† |
| |
10.4110.44 | Executive Employment Agreement dated July 1, 2014 between the Registrant and Stephen Gannon†*Gannon (incorporated herein by reference to Exhibit 10.41 of the Annual Report on Form 10-K, filed on March 3, 2015)† |
| |
10.4210.45 | Supplemental Retirement Agreement, dated October 31, 1995, as amended, between Charter One Financial, Inc. and |
Charles J. Koch (incorporated herein by reference to Exhibit 10.37 of Amendment No. 3 to Registration Statement on Form S-1, filed September 8, 2014)†
CITIZENS FINANCIAL GROUP, INC.
| |
| 11.1 | Statement re computation of earnings per share (filed herewith as Note 25 to the audited Consolidated Financial Statements in Part II, Item 8 —- Financial Statements and Supplementary Data, included elsewhere in this report) |
| |
| 12.1 | Computation of Ratio of Earnings to Fixed Charges* |
| |
| 12.2 | Computation of Ratio of Earnings to Fixed Charges and Preferred Dividends* |
| |
| 21.1 | Subsidiaries of Registrant* |
| |
| 23.1 | Consent of Independent Registered Public Accounting Firm* |
| |
| 24.1 | Power of Attorney*Attorney (contained herein on signature pages) |
| |
| 31.1 | Certification of Chief Executive Officer pursuant to Section 302 of the Sarbanes-Oxley Act of 2002* |
| |
| 31.2 | Certification of Chief Financial Officer pursuant to Section 302 of the Sarbanes-Oxley Act of 2002* |
CITIZENS FINANCIAL GROUP, INC.
| |
| 32.1 | Certification of Chief Executive Officer pursuant to 18 U.S.C. Section 1350, as adopted pursuant to Section 906 of the Sarbanes-Oxley Act of 2002* |
| |
| 32.2 | Certification of Chief Financial Officer pursuant to 18 U.S.C. Section 1350, as adopted pursuant to Section 906 of the Sarbanes-Oxley Act of 2002* |
† Indicates management contract or compensatory plan or arrangement.
* Filed herewith.
CITIZENS FINANCIAL GROUP, INC.
SIGNATURES
Pursuant to the requirements of the Section 13 or 15(d) of the Securities Exchange Act of 1934, the Registrant has duly caused this report to be signed on its behalf by the undersigned, thereunto duly authorized on March 2, 2015.February 26, 2016.
|
| |
| CITIZENS FINANCIAL GROUP, INC. |
| (Registrant) |
| | |
| By: | /s/ Bruce Van SaunEric Aboaf
|
| | Name: Bruce Van SaunEric Aboaf |
| | Title: Chairman of the BoardExecutive Vice President and Chief ExecutiveFinancial Officer |
| | (Principal ExecutiveFinancial Officer)
|
| | |
CITIZENS FINANCIAL GROUP, INC.
SIGNATURES
KNOW ALL PERSONS BY THESE PRESENTS, that each of the undersigned, being a director or officer of Citizens Financial Group, Inc., a Delaware corporation (the "Company"), hereby constitutes and appoints Bruce Van Saun, Eric Aboaf, Stephen T. Gannon, and Ronald S. Ohsberg, and each of them, his or her true and lawful attorney-in-fact and agent, with full power of substitution and resubstitution, for him or her and in his or her name, place and stead in any and all capacities, to sign one or more Annual Reports for the Company's fiscal year ended December 31, 2015 on Form 10-K under the Securities Exchange Act of 1934, as amended, or such other form as any such attorney-in-fact may deem necessary or desirable, any amendments thereto, and all additional amendments thereto, each in such form as they or any one of them may approve, and to file the same with all exhibits thereto and other documents in connection therewith with the Securities and Exchange Commission, granting unto said attorneys-in-fact and agents, and each of them, full power and authority to do and perform each and every act and thing requisite and necessary to be done so that such Annual Report shall comply with the Securities Exchange Act of 1934, as amended, and the applicable Rules and Regulations adopted or issued pursuant thereto, as fully and to all intents and purposes as he or she might or could do in person, hereby ratifying and confirming all that said attorneys-in-fact and agents, or any of them or their substitute or resubstitute, may lawfully do or cause to be done by virtue hereof.
Pursuant to the requirements of the Securities Exchange Act of 1934, this report has been signed below by the following persons on behalf of the Registrant and in the capacities and on the date indicated.
|
| | | | | |
| Signature | | Title | | Date |
| | | | | | |
/s/ Bruce Van Saun
| | | | | |
| Bruce Van Saun | | | Chairman of the Board and Chief Executive Officer | | March 2, 2015February 26, 2016
|
| | | | (Principal Executive Officer and Director) | | |
/s/ John FawcettEric Aboaf | | | | | |
John FawcettEric Aboaf | | | Executive Vice President and Chief Financial Officer | | March 2, 2015February 26, 2016
|
| | | | (Principal Financial Officer) | | |
| /s/ Ronald S. Ohsberg | | | | | |
| Ronald S. Ohsberg | | | Executive Vice President and Controller | | March 2, 2015February 26, 2016
|
| | | | (Principal Accounting Officer and Authorized Officer) | | |
| | | | | | |
| /s/ Mark Casady | * | | | | |
| Mark Casady | | | Director | | March 2, 2015February 26, 2016
|
| | | | | | |
| /s/ Christine M. Cumming | | | | | |
| Christine M. Cumming | | | Director | | February 26, 2016
|
| | | | | |
| /s/ Anthony Di Iorio | * | | | | |
| Anthony Di Iorio | | | Director | | March 2, 2015February 26, 2016
|
| | | | | | |
Robert Gillespie/s/ William P. Hankowsky | * | | | | |
Robert GillespieWilliam P. Hankowsky | | | Director | | March 2, 2015February 26, 2016
|
| | | | | | |
William Hankowsky | */s/ Howard W. Hanna, III | | |
| | |
William HankowskyHoward W. Hanna, III | | | Director
| | March 2, 2015February 26, 2016
|
| | | | | | |
| /s/ Leo I. Higdon, Jr. | * | | | | |
| Leo I. Higdon, Jr. | | | Director | | March 2, 2015February 26, 2016
|
| | | | | | |
| /s/ Charles J. Koch | * | | | | |
| Charles J. Koch | | | Director | | March 2, 2015February 26, 2016
|
| | | | | | |
| /s/ Arthur F. Ryan | * | | | | |
| Arthur F. Ryan | | | Director | | March 2, 2015February 26, 2016
|
| | | | | | |
| /s/ Shivan S. Subramaniam | * | | | | |
| Shivan S. Subramaniam | | | Director | | March 2, 2015February 26, 2016
|
| | | | | | |
| /s/ Wendy A. Watson | * | | | | |
| Wendy A. Watson | | | Director | | March 2, 2015February 26, 2016
|
| | | | | | |
| /s/ Marita Zuraitis | * | | | | |
| Marita Zuraitis | | | Director | | March 2, 2015February 26, 2016
|
|
| |
*By: | /s/ Ronald S. Ohsberg |
| Ronald S. Ohsberg |
| Attorney-in-fact |
| March 2, 2015 |