UNITED STATES
SECURITIES AND EXCHANGE COMMISSION
Washington, D.C. 20549
FORM 10-K
☒ ANNUAL REPORT PURSUANT TO SECTION 13 OR 15(d) OF THE SECURITIES EXCHANGE ACT OF 1934 | | | | | | | | | | | |
| ☒ | ANNUAL REPORT PURSUANT TO SECTION 13 OR 15(d) OF THE SECURITIES EXCHANGE ACT OF 1934 | |
For the fiscal year ended December 31, 20182020
OR
☐ TRANSITION REPORT PURSUANT TO SECTION 13 OR 15(d) OF THE SECURITIES EXCHANGE ACT OF 1934 | | | | | | | | | | | |
| ☐ | TRANSITION REPORT PURSUANT TO SECTION 13 OR 15(d) OF THE SECURITIES EXCHANGE ACT OF 1934 | |
For the transition period from to
Commission File Number: 1-8944
CLEVELAND-CLIFFS INC.
(Exact name of registrant as specified in its charter)
| | | | | | | | | | | | | | | | | | | | |
| Ohio | | 34-1464672 | |
| (State or Other Jurisdiction of
Incorporation or Organization) | | (I.R.S. Employer
Identification No.) | |
| | |
Ohio | | 34-1464672 | |
State or other jurisdiction of
incorporation or organization
| | (I.R.S. Employer
Identification No.)
|
| |
200 Public Square, Suite 3300, Cleveland, Ohio | Cleveland, | Ohio | | 44114-2315 | |
| (Address of principal executive offices)Principal Executive Offices) | | (Zip Code) | |
Registrant’s telephone number, including area code: (216) 694-5700
Securities registered pursuant to Section 12(b) of the Act:
|
| | | | | | | | | | | | | |
| Title of each class | | Trading Symbol(s) | | Name of each exchange on which registered |
| Common Shares, par value $0.125 per share | | CLF | | New York Stock Exchange |
| | |
Securities registered pursuant to section 12(g) of the Act: NONE
Indicate by check mark if the registrant is a well-known seasoned issuer, as defined in Rule 405 of the Securities Act. YES Yes☒NO☐
Indicate by check mark if the registrant is not required to file reports pursuant to Section 13 or Section 15(d) of the Act. YESYes☐NONo☒
Indicate by check mark whether the registrant (1) has filed all reports required to be filed by Section 13 or 15(d) of the Securities Exchange Act of 1934 during the preceding 12 months (or for such shorter period that the registrant was required to file such reports), and (2) has been subject to such filing requirements for the past 90 days. YES Yes☒ NO No☐
Indicate by check mark whether the registrant has submitted electronically every Interactive Data File required to be submitted pursuant to Rule 405 of Regulation S-T (§232.405 of this chapter) during the preceding 12 months (or for such shorter period that the registrant was required to submit such files). YESYes☒ NO No☐
Indicate by check mark if disclosure of delinquent filers pursuant to Item 405 of Regulation S-K (§229.405 of this chapter) is not contained herein, and will not be contained, to the best of registrant’s knowledge, in definitive proxy or information statements incorporated by reference in Part III of this Form 10-K or any amendment to this Form 10-K.☐
Indicate by check mark whether the registrant is a large accelerated filer, an accelerated filer, a non-accelerated filer, a smaller reporting company, or an emerging growth company. See the definitions of “large accelerated filer,” “accelerated filer,” “smaller reporting company,” and "emerging growth company" in Rule 12b-2 of the Exchange Act.
Large accelerated filer ☒ Accelerated filer ☐ Non-accelerated filer ☐ Smaller reporting company ☐ Emerging growth company ☐ | | | | | | | | | | | |
| Large accelerated filer | ☒ | Accelerated filer | ☐ |
| Non-accelerated filer | ☐ | Smaller reporting company | ☐ |
| | Emerging growth company | ☐ |
If an emerging growth company, indicate by check mark if the registrant has elected not to use the extended transition period for complying with any new or revised financial accounting standards provided pursuant to Section 13(a) of the Exchange Act. ☐
Indicate by check mark whether the registrant has filed a report on and attestation to its management’s assessment of the effectiveness of its internal control over financial reporting under Section 404(b) of the Sarbanes-Oxley Act (15 U.S.C. 7262(b)) by the registered public accounting firm that prepared or issued its audit report. ☒
Indicate by check mark whether the registrant is a shell company (as defined in Rule 12b-2 of the Act). YES Yes☐ NO No☒
As of June 29, 2018,30, 2020, the aggregate market value of the voting and non-voting common shares held by non-affiliates of the registrant, based on the closing price of $8.43$5.52 per share as reported on the New York Stock Exchange — Composite Index, was $2,487,099,883$2,171,029,299 (excluded from this figure are the voting shares beneficially owned by the registrant’s officers and directors).
The number of shares outstanding of the registrant’s common shares, par value $0.125 per share, was 292,607,474498,885,558 as of February 5, 2019.24, 2021.
DOCUMENTS INCORPORATED BY REFERENCE
Portions of the registrant’s proxy statement for its 20192021 annual meeting of shareholders are incorporated by reference into Part III.
TABLE OF CONTENTSTABLE OF CONTENTS | | | | | | | | | | | | | | | | | |
| | | | | |
| | | | | Page Number |
| | | Page Number | | |
| DEFINITIONS | | | | | |
DEFINITIONS | | | |
| PART I | | | |
PART I | Item 1. | Business | | | |
| Item 1. | BusinessInformation About Our Executive Officers | | | |
| Item 1A. | Executive Officers of the RegistrantRisk Factors | | | |
| Item 1A. | Risk Factors | | | |
| Item 1B. | Unresolved Staff Comments | | | |
| Item 2. | Properties | | | |
| Item 3. | Legal Proceedings | | | |
| Item 4. | Mine Safety Disclosures | | | |
| | | | | |
| PART II | | | |
| Item 5. | Market for Registrant's Common Equity, Related Stockholder Matters and Issuer Purchases of Equity Securities | | | |
| Item 6. | Selected Financial Data | | | |
| Item 7. | Management's Discussion and Analysis of Financial Condition and Results of Operations | | | |
| Item 7A. | Quantitative and Qualitative Disclosures About Market Risk | | | |
| Item 8. | Financial Statements and Supplementary Data | | | |
| Item 9. | Changes in and Disagreements With Accountants on Accounting and Financial Disclosure | | | |
| Item 9A. | Controls and Procedures | | | |
| Item 9B. | Other Information | | | |
| | | |
| PART III | | | |
| Item 10. | Directors, Executive Officers and Corporate Governance | | | |
| Item 11. | Executive Compensation | | | |
| Item 12. | Security Ownership of Certain Beneficial Owners and Management and Related Stockholder Matters | | | |
| Item 13. | Certain Relationships and Related Transactions, and Director Independence | | | |
| Item 14. | Principal Accountant Fees and Services | | | |
| | | | | |
| PART IV | | | |
| Item 15. | Exhibits and Financial Statement Schedules | | | |
| Item 16. | Form 10-K Summary | | | |
| | | |
| SIGNATURES | | | |
DEFINITIONS
The following abbreviations or acronyms are used in the text. References in this report to the “Company,” “we,” “us,” “our” and “Cliffs” are to Cleveland-Cliffs Inc. and subsidiaries, collectively. References to “A$“$” or “AUD” refer to Australian currency, “C$” to Canadian currency and “$”is to United States currency.
|
| | | | | | | |
| Abbreviation or acronym | | Term |
| 2012 Amended Equity Plan | | Cliffs Natural Resources Inc. 2012 Incentive Equity Plan, as amended or amended and restated from time to time |
| A&R 2015 Equity Plan | | Cliffs Natural Resources Inc. Amended and Restated 2015 Equity and Incentive Compensation Plan |
ABL FacilityAmendment | | AmendedSecond Amendment to Asset-Based Revolving Credit Agreement, dated as of December 9, 2020, among Cleveland-Cliffs Inc., the lenders party thereto from time to time and Restated Syndicated Facility Agreement by and among Bank of America, N.A., as Administrative Agent and Australian Security Trustee, the Lenders that are parties hereto, as the Lenders, Cleveland-Cliffs Inc., as Parent and a Borrower, and the Subsidiaries of Parent party hereto, as Borrowersadministrative agent |
| ABL Facility | | Asset-Based Revolving Credit Agreement, dated as of March 30, 2015,13, 2020, among Cleveland-Cliffs Inc., the lenders party thereto from time to time and Amended and RestatedBank of America, N.A., as administrative agent, as amended as of February 28, 2018March 27, 2020, and December 9, 2020, and as may be further amended from time to time |
| Acquisitions | | The AK Steel Merger and AM USA Transaction, together |
| Adjusted EBITDA | | EBITDA, excluding certain items such as extinguishment/restructuringEBITDA of noncontrolling interests, extinguishment of debt, severance, acquisition-related costs, amortization of inventory step-up, impacts of discontinued operations foreign currency exchange remeasurement, impairment of other long-lived assets and intersegment corporate allocations of SG&Aselling, general and administrative costs |
| AG | | Autogenous Grindinggrinding |
| AHSS | | Advanced high-strength steel |
| AK Coal | | AK Coal Resources, Inc., an indirect, wholly owned subsidiary of AK Steel, and related coal mining assets |
| AK Steel | | AK Steel Holding Corporation (n/k/a Cleveland-Cliffs Steel Holding Corporation) and its consolidated subsidiaries, including AK Steel Corporation (including(n/k/a Cleveland-Cliffs Steel Corporation), its facilities in Ashland, Kentucky, Middletown, Ohio and Dearborn, Michigan)direct, wholly owned subsidiary, collectively, unless stated otherwise or the context indicates otherwise |
AlgomaAK Steel Merger | | AlgomaThe merger of Merger Sub with and into AK Steel, Inc. (previously, Essarwith AK Steel Algomasurviving the merger as a wholly owned subsidiary of Cleveland-Cliffs Inc.), subject to the terms and conditions set forth in the Merger Agreement, consummated on March 13, 2020 |
Amended 2015 EquityAK Steel Merger Agreement | | Agreement and Plan | | Cliffs Natural Resources of Merger, dated as of December 2, 2019, among Cleveland-Cliffs Inc. 2015 Equity, AK Steel and Incentive Compensation Plan, as amendedMerger Sub |
APBOAM USA Transaction | | Accumulated Postretirement Benefit ObligationThe acquisition of ArcelorMittal USA, consummated on December 9, 2020, and the entry into the ABL Amendment, together |
ArcelorMittalAM USA Transaction Agreement | | Transaction Agreement, dated as of September 28, 2020, by and between Cleveland-Cliffs Inc. and ArcelorMittal (asS.A. |
| AMT | | Alternative minimum tax |
| AOCI | | Accumulated other comprehensive income (loss) |
| APBO | | Accumulated postretirement benefit obligation |
| ArcelorMittal | | ArcelorMittal S.A., a company organized under the laws of Luxembourg and the former ultimate parent company of ArcelorMittal Mines Canada, ArcelorMittal USA and ArcelorMittal Dofasco GP, as well as, many other subsidiaries) |
| ArcelorMittal USA | | Substantially all of the operations of the former ArcelorMittal USA LLC, (including many of its United States affiliates, subsidiaries and representatives. References to ArcelorMittal USA comprise all such relationships unless a specific ArcelorMittal USA entity is referenced)certain affiliates, and Kote and Tek, collectively |
ALJASC | | Administrative Law Judge |
AMT | | Alternative Minimum Tax |
ASC | | Accounting Standards Codification |
ASUASTM | | American Society for Testing and Materials |
| ASU | | Accounting Standards UpdatesUpdate |
Atlantic Basin pellet premiumBART | | Platts Atlantic Blast Furnace 65% Fe pellet premiumBest available retrofit technology |
Bloom LakeBNSF | | The Bloom Lake Iron Ore Mine Limited Partnership |
Bloom Lake Group | | Bloom Lake General Partner Limited and certain of its affiliates, including Cliffs Quebec Iron Mining ULC |
BNSF | | Burlington Northern Santa Fe, LLC |
Canadian EntitiesBoard | | Bloom Lake Group, Wabush Group and certain other wholly-owned subsidiariesThe Board of Directors of Cleveland-Cliffs Inc. |
CCAACARES Act | | Companies' Creditors ArrangementCoronavirus Aid, Relief, and Economic Security Act (Canada) |
CERCLACECL | | Current expected credit losses |
| CERCLA | | Comprehensive Environmental Response, Compensation and Liability Act of 1980 |
| CFR | | Cost and freight |
CLCC | | Cliffs Logan County Coal LLC |
| Clean Water Act | | Federal Water Pollution Control Act |
| CN | | Canadian National Railway Company |
CO2
| | Carbon Dioxide |
| Compensation Committee | | Compensation and Organization Committee of the Board of Directors |
CPPCOVID-19 | | Clean Power PlanA novel strain of coronavirus that the World Health Organization declared a global pandemic in March 2020 |
| Directors’ Plan | | Cliffs Natural Resources Inc. Amended and Restated 2014 Nonemployee Directors’ Compensation Plan |
| Dodd-Frank Act | | Dodd-Frank Wall Street Reform and Consumer Protection Act |
DR-gradeDOE | | Direct Reduction-gradeU.S. Department of Energy |
EAFDR-grade | | Electric Arc FurnaceDirect reduction-grade |
EBITDAEAF | | Electric arc furnace |
| EBITDA | | Earnings before interest, taxes, depreciation and amortization |
EmpireEDC Revolving Facility | | Credit Facility Agreement, dated November 9, 2020, among Export Development Canada and Cleveland-Cliffs Inc.'s indirect, wholly owned subsidiaries, Fleetwood Metal Industries Inc. and The Electromac Group Inc. |
| EGLE | | Michigan Department of Environment, Great Lakes and Energy |
| | | | | | | | |
| Abbreviation or acronym | | Term |
| Empire | | Iron ore mining property owned by Empire Iron Mining Partnership, an indirect, wholly owned subsidiary of Cliffs |
| EPA | | U.S. Environmental Protection Agency |
| EPS | | Earnings per share |
ERMERISA | | Enterprise Risk ManagementEmployee Retirement Income Security Act of 1974, as amended |
| Exchange Act | | Securities Exchange Act of 1934, as amended |
| FASB | | Financial Accounting Standards Board |
| Fe | | Iron |
FERCFeT | | Federal Energy Regulatory CommissionTotal iron |
FeTFILO | | Total IronFirst-in, last-out |
| FIP | | Federal Implementation Planimplementation plan |
| FMSH Act | | U.S. Federal Mine Safety and Health Act of 1977, as amended |
|
| Former ABL Facility | | Amended and Restated Syndicated Facility Agreement, dated as of March 30, 2015, among Cleveland-Cliffs Inc., the subsidiary borrowers party thereto, the lenders party thereto and Bank of America, N.A., as administrative agent, as amended and restated as of February 28, 2018, and as further amended, which was terminated on March 13, 2020 in connection with entering into the ABL Facility |
Abbreviation or acronymGAAP | | Term |
GAAP | | Accounting principles generally accepted in the United States |
| GHG | | Greenhouse gas |
HBIGOES | | Hot Briquetted IronGrain oriented electrical steel |
HibbingH/EV | | Hybrid/electric vehicle |
| HBI | | Hot briquetted iron |
| Hibbing | | Iron ore mining property owned by Hibbing Taconite Company, an unincorporated joint venture between subsidiaries of Cliffs and U.S. Steel |
IRCHRC | | Hot-rolled coil steel |
| IRB | | Industrial Revenue Bond |
| IRC | | U.S. Internal Revenue Code of 1986, as amended |
IRSIT | | Internal Revenue ServiceInformation technology |
KoolyanobbingKote and Tek | | Collective term forI/N Kote L.P. (n/k/a Cleveland-Cliffs Kote L.P.) and I/N Tek L.P. (n/k/a Cleveland-Cliffs Tek L.P.), former joint ventures between subsidiaries of the operating deposits at Koolyanobbing, Mount Jacksonformer ArcelorMittal USA LLC and WindarlingNippon Steel Corporation |
| LIBOR | | London Interbank Offered Rate |
| LIFO | | Last-in, first-out |
| Long ton | | 2,240 pounds |
| LS&I | | Lake Superior & Ishpeming Railroad Company |
LTVSMCMerger Sub | | LTVPepper Merger Sub Inc., a direct, wholly owned subsidiary of Cliffs prior to the AK Steel Mining CompanyMerger |
| Metric ton | | 2,205 pounds |
MMBtuMinorca | | Iron ore mining property owned by Cleveland-Cliffs Minorca Mine Inc. (f/k/a ArcelorMittal Minorca Mine Inc.), an
indirect, wholly owned subsidiary of Cliffs acquired in connection with the AM USA Transaction |
| MMBtu | | Million British Thermal Units |
| MPCA | | Minnesota Pollution Control Agency |
MPSCMSHA | | Michigan Public Service Commission |
MPUC | | Minnesota Public Utilities Commission |
MSHA | | U.S. Mine Safety and Health Administration |
MonitorNet ton | | FTI Consulting Canada Inc.2,000 pounds |
NAAQSNOL | | National Ambient Air Quality StandardsNet operating loss |
Net tonNOVs | | 2,000 poundsNotices of violations |
NO2x | | Nitrogen dioxideoxide |
NOx
NOES | | Nitrogen oxideNon-oriented electrical steel |
| Northshore | | Iron ore mining property owned by Northshore Mining Company, a direct, wholly owned subsidiary of Cliffs |
| NPDES | | National Pollutant Discharge Elimination System, authorized by the U.S. Clean Water Act |
| NYSE | | New York Stock Exchange |
| OPEB | | Other postretirement employment benefits |
OPEB capOSHA | | Medical premium maximumsOccupational Safety and Health Administration |
| PBO | | Projected benefit obligation |
PinnaclePHS | | Pinnacle Mining Company, LLCPress-hardened steel |
Platts 62% Priceprice | | Platts IODEX 62% Fe Fines CFR North China |
Preferred SharePPI | | 7.00% Series A Mandatory Convertible Preferred Stock, Class A, without par valueProducer Price Indices |
| Precision Partners | | PPHC Holdings, LLC, an indirect, wholly owned subsidiary of AK Steel, and its subsidiaries, collectively, unless stated otherwise or the context indicates otherwise |
| RCRA | | Resource Conservation and Recovery Act |
| RI/FS | | Remedial Investigation/Feasibility Study |
| | | | | | | | |
| Abbreviation or acronym | | Term |
| ROM | | Run-of-mine coal |
| S&P | | Standard & Poor's Rating Services, a division of Standard & Poor's Financial Services LLC, a subsidiary of The McGraw-Hill Companies, Inc., and its successors |
| SEC | | U.S. Securities and Exchange Commission |
SG&ASection 232 | | Selling, general and administrativeSection 232 of the Trade Expansion Act of 1962 |
| Securities Act | | Securities Act of 1933, as amended |
SenecaSIP | | Seneca Coal Resources, LLC |
Silver Bay Power | | Silver Bay Power Company |
SIP | | State Implementation Plan |
SO2
STRIPS | | Sulfur dioxide |
STRIPS | | Separate Trading of Registered Interest and Principal of Securities |
TildenSunCoke Middletown | | Middletown Coke Company, LLC, a subsidiary of SunCoke Energy, Inc. |
| Tilden | | Iron ore mining property owned by Tilden Mining Company L.C., an indirect, wholly owned subsidiary of Cliffs |
| TMDL | | Total Maximum Daily Loadmaximum daily load |
Topic 606805 | | ASC Topic 606, Revenue from Contracts with Customers805, Business Combinations |
| Topic 815 | | ASC Topic 815, Derivatives and Hedging |
TRIRTSR | | Total Recordable Incident Rateshareholder return |
TSRTubular Components | | Total Shareholder ReturnCleveland-Cliffs Tubular Components LLC (f/k/a AK Tube LLC), an indirect, wholly owned subsidiary of AK Steel |
| United Taconite | | Iron ore mining property owned by United Taconite LLC, an indirect, wholly owned subsidiary of Cliffs |
| U.S. | | United States of America |
| U.S. Steel | | U.S. Steel Corporation and allits subsidiaries, collectively, unless stated otherwise or the context indicates otherwise |
USWUSMCA | | United SteelworkersStates-Mexico-Canada Agreement |
VEBAUSW | | Voluntary Employee Benefit Association trustsUnited Steelworkers |
VWAPVEBA | | Volume Weighted Average PriceVoluntary employee benefit association trusts |
| VIE | | Variable interest entity |
|
| | |
Abbreviation or acronym | | Term |
Wabush | | Wabush Mines Joint Venture |
Wabush Group | | Wabush Iron Co. Limited and Wabush Resources Inc., and certain of their affiliates, including Wabush Mines (an unincorporated joint venture of Wabush Iron Co. Limited and Wabush Resources Inc.), Arnaud Railway Company and Wabush Lake Railway Company |
WEPC | | Wisconsin Electric Power Company |
2012 Equity Plan | | Cliffs Natural Resources Inc. Amended and Restated 2012 Incentive Equity Plan |
2015 Equity Plan | | Cliffs Natural Resources Inc. 2015 Equity and Incentive Compensation Plan |
PART I
Introduction
Cliffs is the largest flat-rolled steel producer in North America. Founded in 1847 Cleveland-Cliffs Inc. isas a mine operator, we are also the largest and oldest independent iron ore mining company in the United States. We are a major supplier of iron ore pellets in North America. In 2020, we acquired two major steelmakers, AK Steel and ArcelorMittal USA, vertically integrating our legacy iron ore business with quality-focused steel production and emphasis on the automotive end market. Our fully integrated portfolio includes custom-made pellets and HBI; flat-rolled carbon steel, stainless, electrical, plate, tinplate and long steel products; as well as carbon and stainless steel tubing, hot and cold stamping and tooling. Headquartered in Cleveland, Ohio, we employ approximately 25,000 people across our mining, steel and downstream manufacturing operations in the United States and Canada.
On March 13, 2020, we completed the acquisition of AK Steel, a leading producer of flat-rolled carbon, stainless and electrical steel products. These operations consist primarily of seven steelmaking and finishing plants, two cokemaking operations, three tube manufacturing plants and ten tooling and stamping operations. The Tubular Components and Precision Partners businesses provide customer solutions with carbon and stainless steel tubing products, die design and tooling, and hot- and cold-stamped components.
On December 9, 2020, we completed the acquisition of ArcelorMittal USA. These operations include six steelmaking facilities, eight finishing facilities, two iron ore mining and pelletizing operations, one coal mining complex and three cokemaking operations. These assets build upon our existing high-end steelmaking and raw material capabilities, and also open up new markets to us. The combination provides us additional scale and technical capabilities necessary in a competitive and increasingly quality-focused marketplace.
Competitive Strengths
As the largest flat-rolled steel producer in North AmericanAmerica, we benefit from having the size and scale necessary in a competitive, capital intensive business. Our sizeable operating footprint provides us with the operational leverage, flexibility and cost performance to achieve competitive margins throughout the business cycle. We also have a unique vertically integrated profile, which begins at the mining stage and goes all the way through the manufacturing of steel industry fromproducts, including stamping, tooling and tubing. This positioning gives us both lower and more predictable costs throughout the supply chain and more control over both our minesmanufacturing inputs and our end product destination.
Our legacy business of producing iron ore pellets, our primary steelmaking raw material input, is another competitive advantage. Mini-mills (producers using EAFs) comprise about 70% of steel production in the U.S. Their primary iron input is scrap metal, which has unpredictable and often volatile pricing. By controlling our iron ore pellet plants locatedsupply, our primary steelmaking raw material feedstock can be secured at a stable and predictable cost, and not subject to factors outside of our control.
We are also the largest supplier of automotive-grade steel in Michiganthe U.S. Compared to other steel end markets, automotive steel is generally higher quality and Minnesota. By 2020,more operationally and technologically intensive to produce. As such, it often generates higher through-the-cycle margins, making it a desirable end market for the steel industry. With our continued technological innovation, as well as leading delivery performance, we expect to beremain the sole producerleader in supplying this industry.
We offer the most comprehensive flat-rolled steel product selection in the industry, along with several complementary products and services. A sampling of this offering includes AHSS, hot-dipped galvanized, aluminized, galvalume, electrogalvanized, galvanneal, HRC, cold-rolled coil, plate, tinplate, GOES, NOES, stainless steels, tool & die, stamped components, rail and slabs. Across the quality spectrum and the supply chain, our customers can frequently find the solutions they need from our product selection.
We are the first and the only supplier of HBI in the Great Lakes region with the developmentregion. Construction of our first productionToledo, Ohio, direct reduction plant in Toledo, Ohio. Driven by the core values of safety, social, environmental and capital stewardship, our employees endeavor to provide all stakeholders with operating and financial transparency.
In alignment with our strategic goals, we have become a North America-centric business and have updated the names of our operating segments. We are now organized according to our differentiated products. We have two reportable segments – the Mining and Pelletizing segment (formerly known as U.S. Iron Ore) and the Metallics segment.
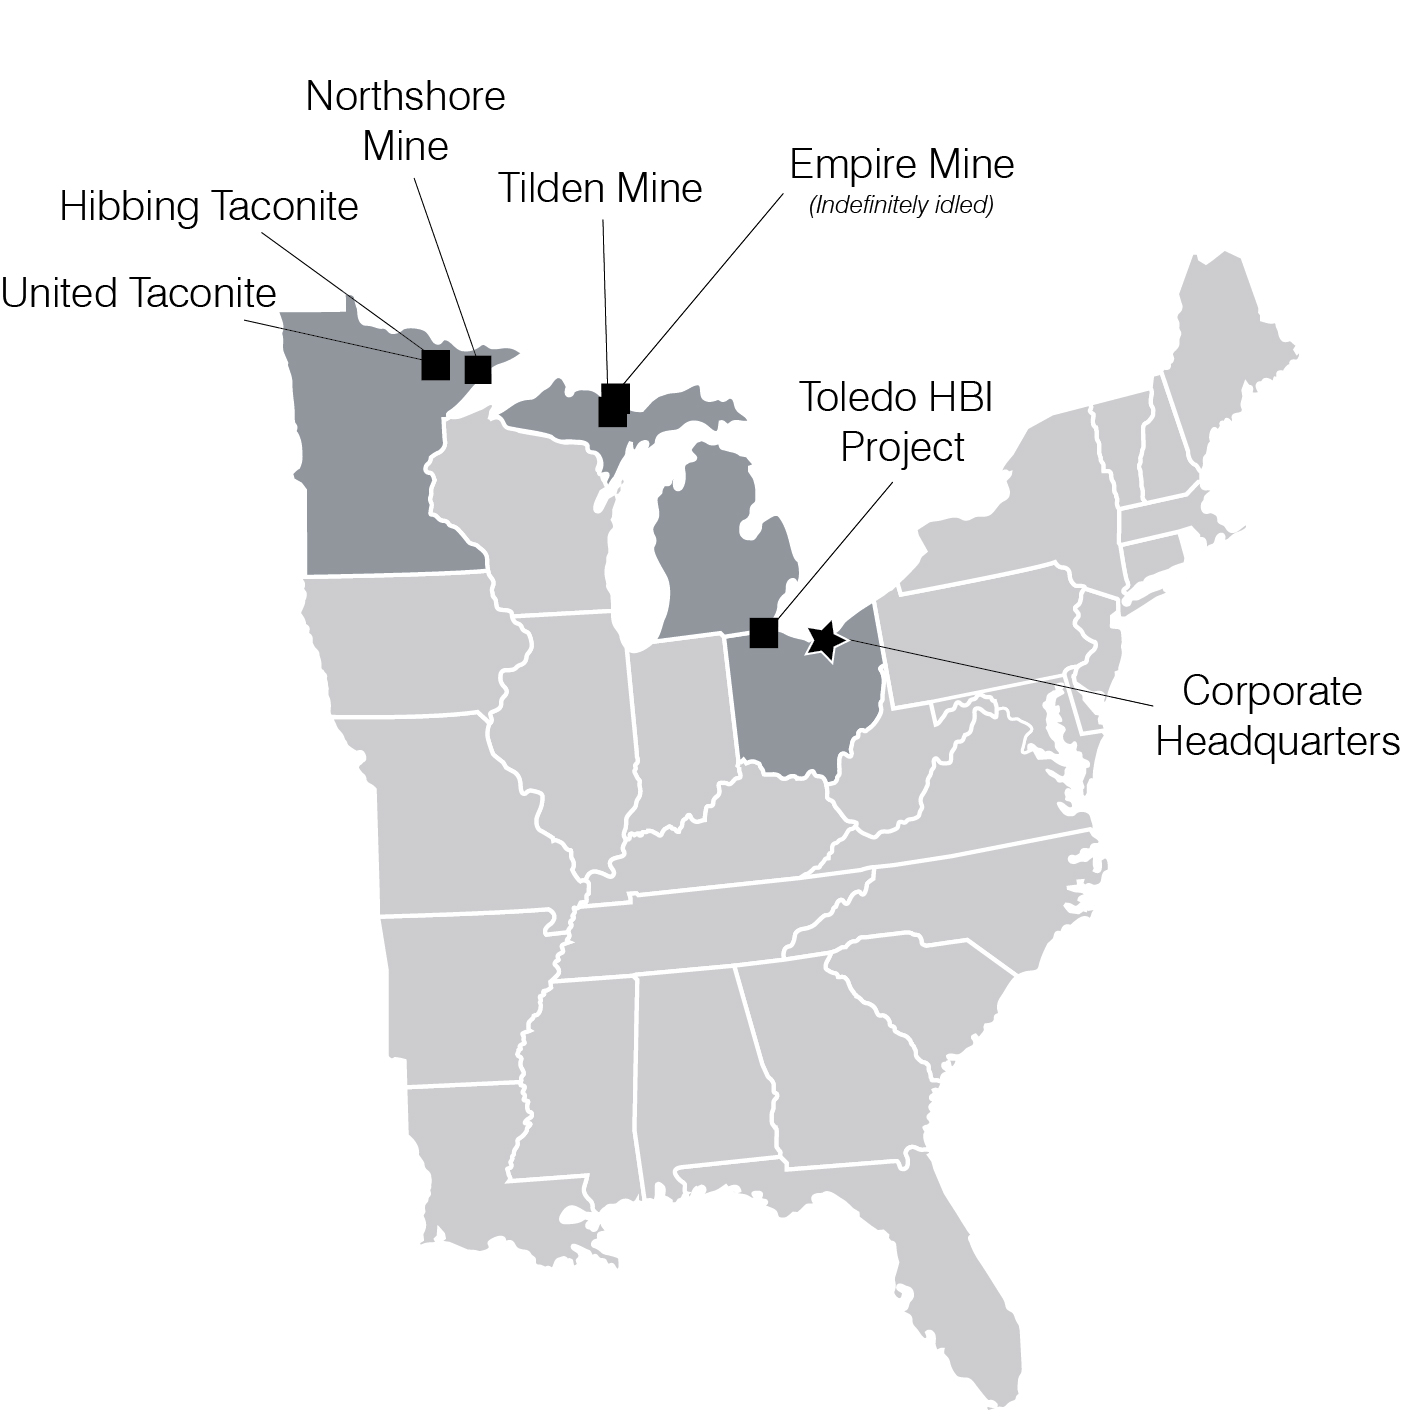
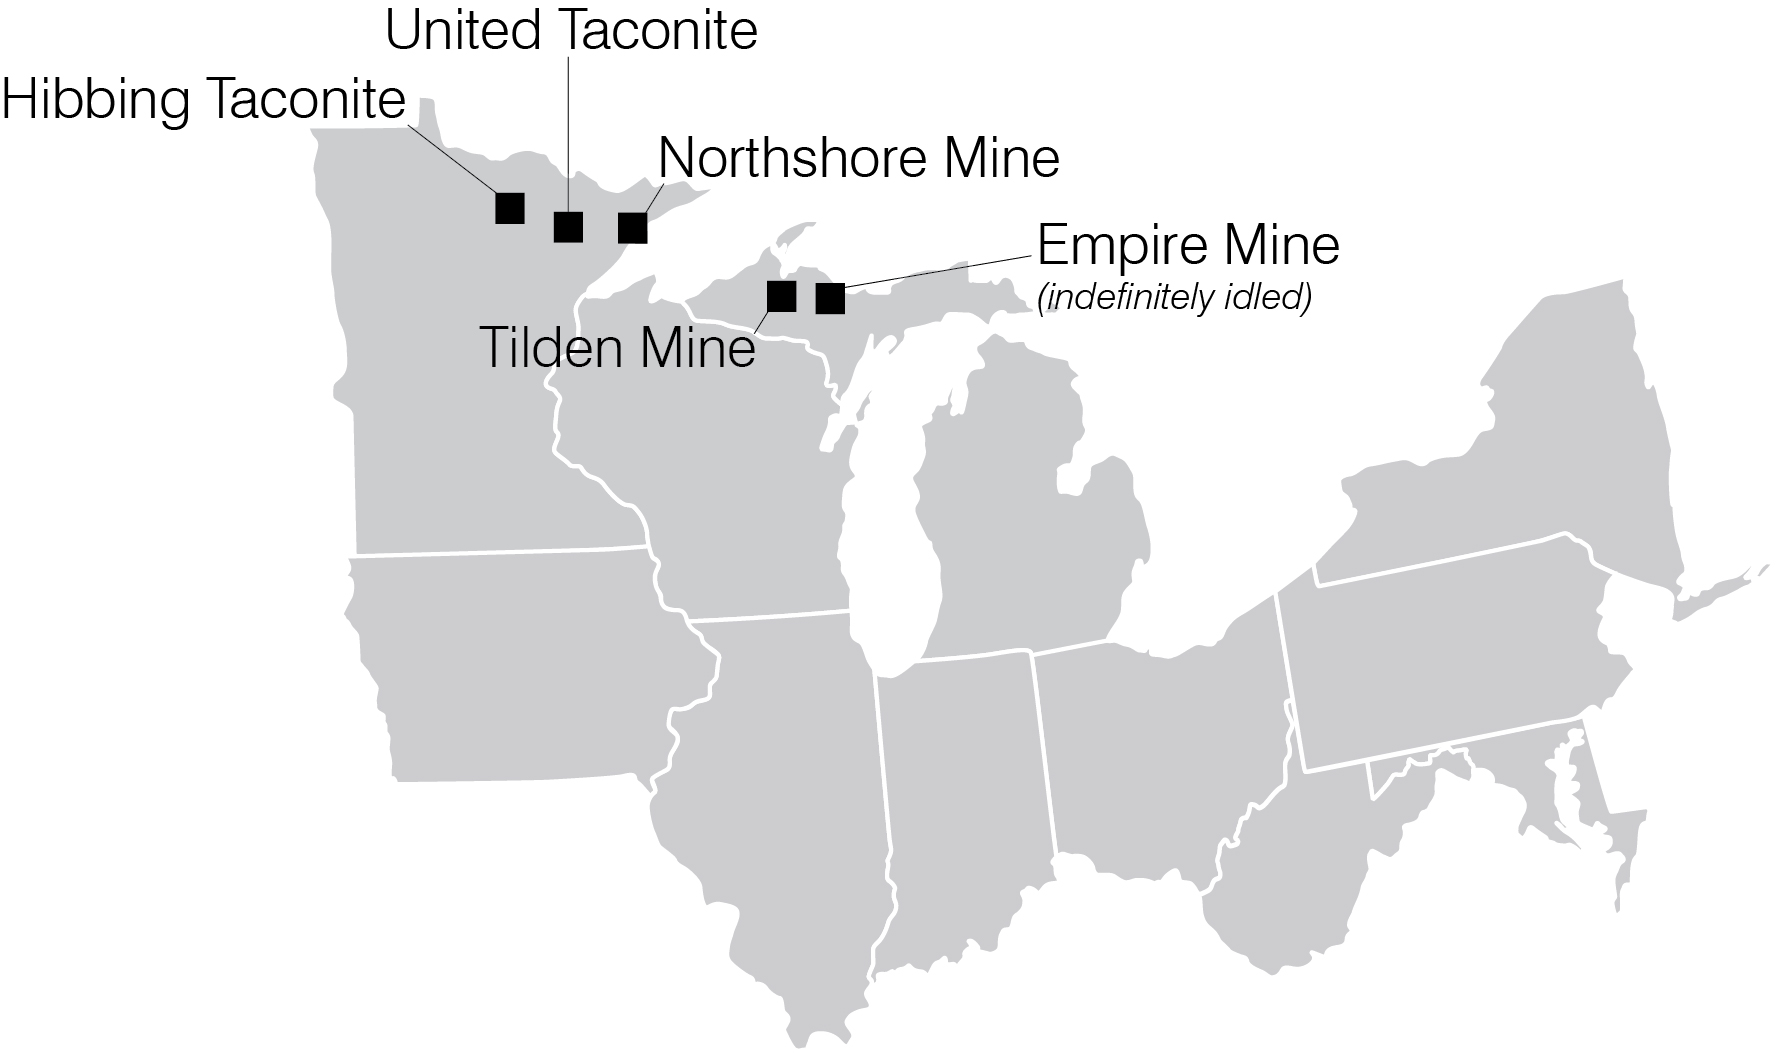
In our Mining and Pelletizing segment, we currently own or co-own four operational iron ore mines plus one indefinitely idled mine. We are currently operating one iron ore mine in Michigan and three iron ore mines in Minnesota, and all four mines are currently operating at or near full capacity. The Empire mine located in Michigan was indefinitely idled beginning in August 2016. In our Metallics segment, we are currently constructing an HBI production plant in Toledo, Ohio. We expect to complete construction and begin production in 2020.
We are Focused on Protecting our Core Mining and Pelletizing Business
We are the market-leading iron ore producercompleted in the U.S., supplying differentiated iron ore pellets under long-term contracts to major North American blast furnace steel producers. We have the unique advantagefourth quarter of being2020. From this modern plant, we offer a low-cost, high-quality iron ore pellet producer with significant transportation and logistics advantages to serve the Great Lakes steel market effectively. The pricing structure and long-term nature of our existing contracts, along with our low-cost operating profile, position our Mining and Pelletizing segment as a strong cash flow generator in most commodity pricing environments. Since instituting our strategy in 2014 of focusing on this core business, we have achieved significant accomplishments, including providing accelerating profitability growth each year since 2015, maximizing commercial leverage in pricing and securing sales volume certainty by signing multiple new supply agreements with steelmakers throughout the Great Lakes region, improving operating reliability by making operational improvements, realizing more predictability in cash flows, embracing the global push toward environmental stewardship and developing new pellet products to meet ever-evolving market demands.
We recognize the importance of our strong position in the North American blast furnace steel industry, and our top priority is to protect and enhance the market position of our Mining and Pelletizing business. This involves continuing to deliver high-quality, custom-made pellets that allow our customers to remain competitive in the quality, production efficiency, and environmental friendliness of their steel products. Protecting the core business also involves continually evaluating opportunities to expand both our production capacity and ore reserve life. In 2017, we achieved key accomplishments toward these goals by acquiring the remaining minority stake in our Tilden and Empire mines as well as additional real estate interests in Minnesota. In 2018, we began supplying pellets under two new customer supply agreements in the Great Lakes region. In addition, we executed the efficient exit of our Asia Pacific Iron Ore business, officially completing the divestiture of the Company's non-core assets.
Expanding our Customer Base and Product Offering
While we hold a strong market position in supplying iron ore to Great Lakes blast furnaces, we cannot ignore the ongoing shift of steelmaking share in the U.S. away from our core blast furnace customers to EAF steelmakers. Over the past 25 years, the market share of EAFs has nearly doubled. However, as EAFs have moved to higher-value steel products, they require more high-quality iron ore-based metallics instead of lower-grade scrap as raw material feedstock. As a result of this trend, one of our top strategic priorities is to become a critical supplier of the EAF market by providing these specialized metallics. HBI is a specialized high-quality iron alternative to scrap and pig iron that, when used as a feedstock, allows the EAF to produce more valuable grades of steel. In June 2017, we announced the planned construction of an HBI production plant in Toledo, Ohio. Over the past 18 months, we have made significant progress on the construction of this plant. Based on current market analysis, greater-than-expected customer demand and expansion opportunities identified during the construction process, we are increasing the expected productive capacity of the Toledo HBI production plant from 1.6 million to 1.9 million metric tons per year. Accordingly, we now estimate the construction cost to be approximately $830 million, exclusive of construction-related contingencies and
capitalized interest, which increase partially relatesalternative to the expanded capacity. We expect thatseveral EAFs in the HBI production plant, once operational, will consume approximately 2.8 million long tons of our DR-grade pellets per year.
We expect our HBI to partially replace the over 3 million metric tons ofregion. Previously, ore-based metallics that arecompete with our HBI had to be imported into the Great Lakes region every year from locations like Russia, Ukraine Brazil and Venezuela,Brazil. With growing EAF capacity in the U.S. and
increasing tightness in the scrap market, we expect our Toledo direct reduction plant to generate healthy margins for us going forward.
Strategy
Optimizing Our Fully-Integrated Steelmaking Footprint
We have transformed into a fully-integrated steel enterprise with the size and scale to achieve improved through-the-cycle margins and are the largest flat-rolled steel producer in North America.
Now that the AM USA Transaction is completed, our focus is on the integration of these facilities within our footprint. These assets build upon our existing high-end steelmaking and raw material capabilities, and also open up new markets to us. The combination provides us the additional scale and technical capabilities necessary in a competitive and increasingly quality-focused marketplace. We have ample opportunities to implement improvements in logistics, procurement, utilization and quality.
We expect the AM USA Transaction to improve our production capabilities, flexibility, and cost performance. We have identified approximately $150 million of potential cost synergies through asset optimization, economies of scale, and duplicative overhead savings. The AM USA Transaction also enhances optionality for future production of merchant pig iron to complement our HBI offering in the metallics space.
Maximizing Our Commercial Strengths
With the Acquisitions completed, we now have enhanced our offering to a full suite of flat steel products encompassing all steps of the steel manufacturing process. We have increased our industry-leading market share in the automotive sector, where our portfolio of high-end products will deliver a broad range of differentiated solutions for this highly sought after customer base.
We believe we have the broadest flat steel product offering in North America, and can meet customer needs from a variety of end markets and quality specifications. We have several finishing and downstream facilities with advanced technological capabilities. We also pride ourselves on our excellent delivery performance, which provides us opportunities to augment our relationships with current customers given our reputation as wella reliable supplier.
We are also proponents of the “value over volume” approach in terms of steel supply. We take our leadership role in the industry very seriously and intend to manage our steel output in a responsible manner.
Expanding to New Markets
Our Toledo direct reduction plant allows us to offer another unique, high-quality product to discerning raw material buyers. EAF steelmakers primarily use scrap for their iron feedstock, and our HBI offers a sophisticated alternative with less impurities, allowing other steelmakers to increase the quality of their respective end-steel products and reduce reliance on imported metallics.
The completed Acquisitions provide other potential outlets for HBI, as the nearly 20 million metric tons of scrapit can also be used in the Great Lakes area every year. The Toledo site is in close proximityour integrated steel operations to over 20 EAFs, giving us a natural competitive freight advantage over import competitors. Not only does this production plant create another outletincrease productivity and help to reduce carbon footprint, allowing for our high-margin pellets, but itmore cost efficient and environmentally friendly steelmaking.
We are also presents an attractive economic opportunity for us. As the only producer of DR-grade pellets in the Great Lakes region and with accessseeking to abundant, low-cost natural gas, we will be in a unique position to serve clients in the area and growexpand our customer base. base with the rapidly growing and desirable electric vehicle market. At this time, we believe the North American automotive industry is approaching a monumental inflection point, with the adoption of electrical motors in passenger vehicles. As this market grows, it will require more advanced steel applications to meet the needs of electric vehicle producers and consumers. With our unique technical capabilities, we believe we are positioned better than any other North American steelmaker to supply the steel and parts necessary to fill these needs.
SegmentsImproving Financial Flexibility
Operating segments are defined as components of an enterprise for which separate financial information is available that is evaluated regularly byGiven the chief operating decision maker, or decision-making group, to decide how to allocate resources and to assess performance. In alignment with our strategic goals, our Company’s continuing operations are organized and managed in two business units according to our differentiated products. The former 'U.S. Iron Ore' segment is now 'Mining and Pelletizing.' In addition, the Toledo HBI business will be categorized under the segment 'Metallics.' Until operational, expenses reported in the Metallics segment will be limited to administrative costs. Eachcyclicality of our business, units qualifiesit is important to us to be in the financial position to easily withstand any negative demand or pricing pressure we may encounter. As such, our top priority for the allocation of our free cash flow is to improve our balance sheet via the reduction of long-term debt. During the COVID-19 pandemic, we were able to issue secured debt to provide insurance capital through the uncertain industry conditions that the pandemic caused. Now that business conditions have improved and we expect to generate healthy free cash flow during 2021, we have the ability to lower our long-term debt balance.
Our stated initial target will be to reduce total debt to less than three times our annual Adjusted EBITDA. We will continue to review the composition of our debt, as an operating segment with its results regularly reviewedwe are interested in both extending our maturity profile and increasing our ratio of unsecured debt to secured debt, which we demonstrated by our chief operating decision maker. Our chief operating decision maker is our Chief Executive Officer. Asexecuting a series of December 31, 2018, the Miningfavorable debt and Pelletizing segment and the Metallics segment are both reportable segments in accordance with ASC Topic 280, Segment Reporting.
Financial information about our segments is included in Management'sequity capital markets transactions during February 2021, as described under Part II – Item 7. Management’s Discussion and Analysis of Financial Condition and Results of Operations. These actions will better prepare us to navigate more easily through potentially volatile industry conditions in the future.
Enhance our Environmental Sustainability
As the Company transforms, our commitment to operating our business in a more environmentally responsible manner remains constant. One of the most important issues impacting our industry, our stakeholders and NOTE 3 - SEGMENT REPORTING.our planet is climate change. As a result, we are continuing Cliffs’ proactive approach by announcing our plan to reduce GHG emissions 25% from 2017 levels by 2030. This goal represents combined Scope 1 (direct) and Scope 2 (indirect) GHG emission reductions across all of our operations.
Prior to setting this goal with our newly acquired steel assets, we exceeded our previous 26% GHG reduction target at our legacy facilities six years ahead of our 2025 goal. In 2019, we reduced our combined Scope 1 and Scope 2 GHG emissions by 42% on a mass basis from 2005 baseline levels. Our goal is to further reduce those emissions in coming years.
Additionally, many of our steel assets have improved plant and energy efficiency through participation in programs like the U.S. Department of Energy’s Better Plants program and the EPA’s Energy Star program. With our longstanding focus on plant and energy efficiency, we aim to build on our previous successes across our newly integrated enterprise.
Our GHG reduction commitment is based on executing the following five strategic priorities:
•Developing domestically sourced, high quality iron ore feedstock and utilizing natural gas in the production of HBI;
•Implementing energy efficiency and clean energy projects;
•Investing in the development of carbon capture technology;
•Enhancing our GHG emissions transparency and sustainability focus; and
•Supporting public policies that facilitate GHG reduction in the domestic steel industry.
Business Operations
We are vertically integrated from the mining of iron ore and coal; to production of metallics and coke; through iron making, steelmaking, rolling and finishing; and to downstream tubular components, stamping and tooling. We have the unique advantage as a steel producer of being fully or partially self-sufficient with our production of raw materials for steel manufacturing, which includes iron ore pellets, HBI and coking coal. As we expand our presence, we believe such vertical integration represents a sustainable business model that is in the best interest of all stakeholders and the surest way to secure a long-term competitive advantage.
We strive to operate responsibly and produce more environmentally friendly iron ore pellets that enable production of clean steel, which is also the most recycled material on the planet. Additionally, our investment in the direct reduction plant in Toledo, Ohio, also helps to support environmental stewardship, as the production of HBI is more environmentally friendly than its substitute, foreign pig iron. From a focus on key environmental processes, such as steel recycling and water reuse, to corporate and social responsibility, sustainability is central to our values and operations.
We have updated our segment structure to coincide with our new business model and are organized into four operating segments based on differentiated products, Steelmaking, Tubular, Tooling and Stamping, and European Operations. Through the third quarter ended September 30, 2020, we had operated through two reportable segments – the Steel and Manufacturing segment and the Mining and Pelletizing Segmentsegment. However, given the recent transformation of the business, beginning with our financial statements as of and for the year ended December 31, 2020, we primarily operate through one reportable segment – the Steelmaking segment.
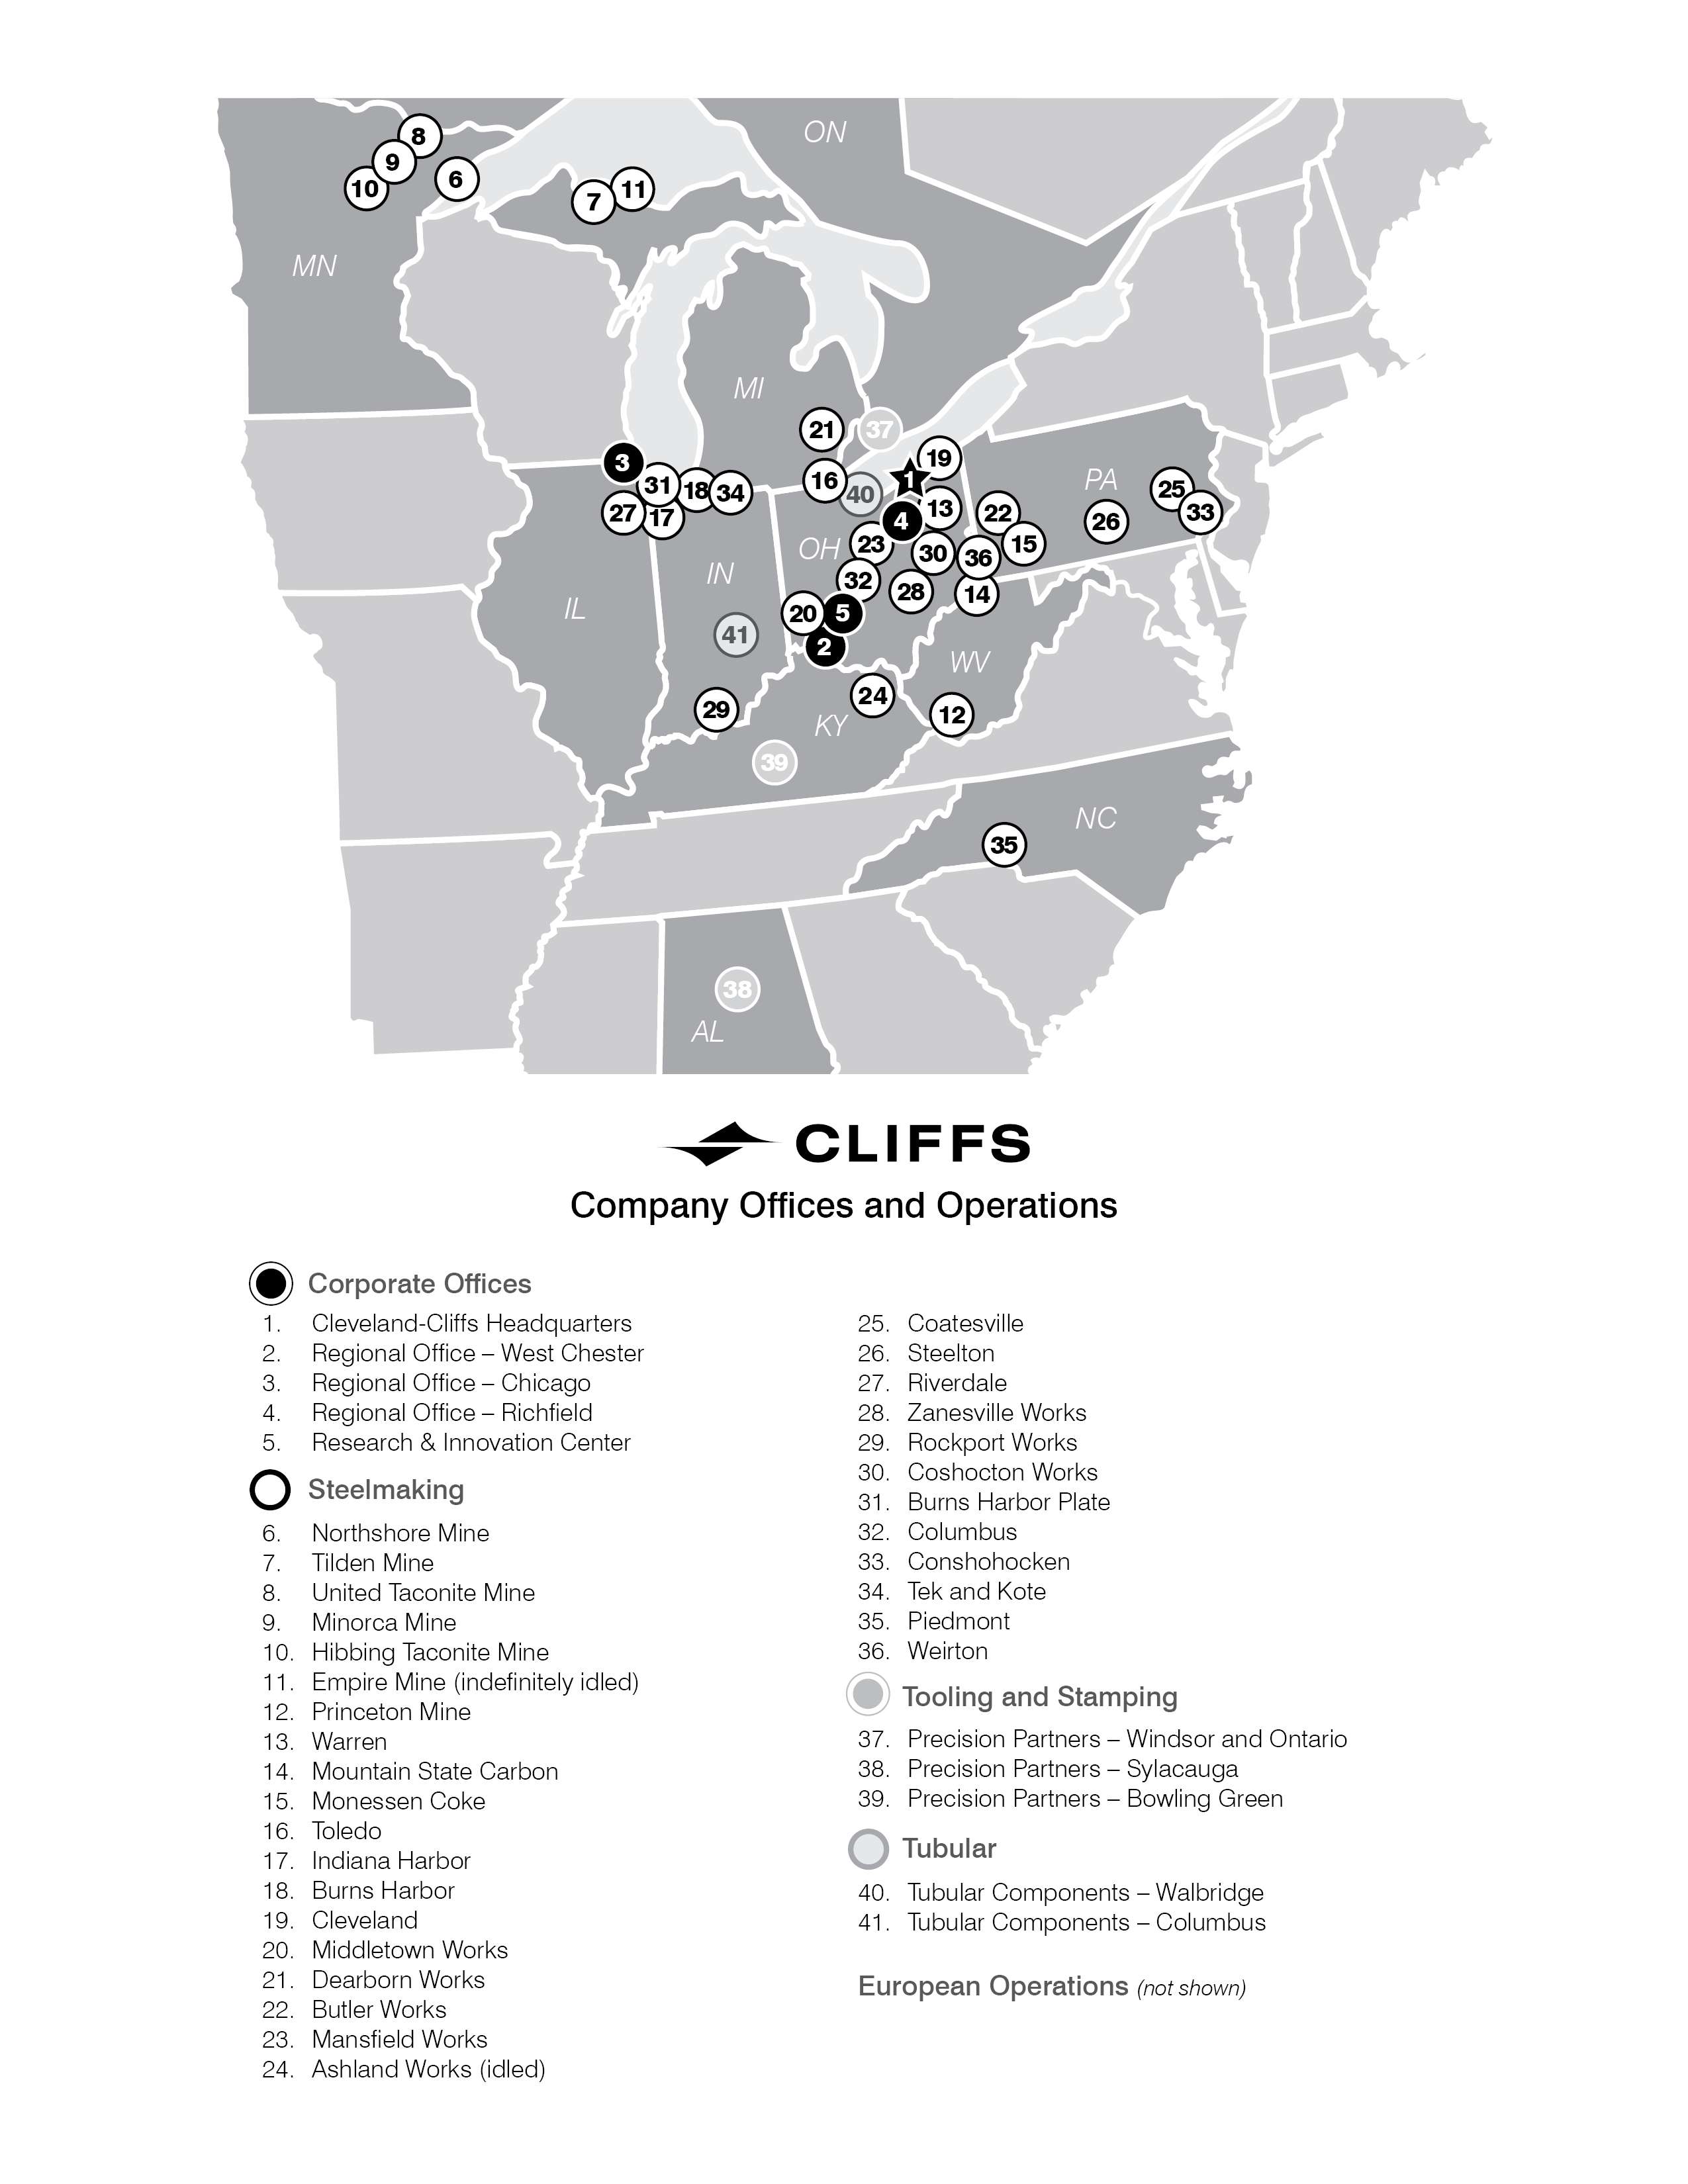
The following table lists our main properties, their location and their products and services:
| | | | | | | | | | | | | | | | | | | | |
| Property | | Segment | | State/ Province | | Products and Services |
| Hibbing (85.3% ownership) | | Steelmaking | | Minnesota | | Iron ore pellets |
| Minorca | | Steelmaking | | Minnesota | | Iron ore pellets |
| Northshore | | Steelmaking | | Minnesota | | Iron ore pellets |
| Tilden | | Steelmaking | | Michigan | | Iron ore pellets |
| United Taconite | | Steelmaking | | Minnesota | | Iron ore pellets |
| Empire (indefinitely idled) | | Steelmaking | | Michigan | | Iron ore pellets |
| Toledo | | Steelmaking | | Ohio | | HBI |
| Princeton | | Steelmaking | | West Virginia | | Coal |
| Mountain State Carbon | | Steelmaking | | West Virginia | | Coke |
| Monessen | | Steelmaking | | Pennsylvania | | Coke |
| Warren | | Steelmaking | | Ohio | | Coke |
| Ashland Works (idled) | | Steelmaking | | Kentucky | | Potential pig iron plant |
| Burns Harbor | | Steelmaking | | Indiana | | Hot-rolled, cold-rolled, and hot-dipped galvanized sheet and coke |
| Burns Harbor Plate and Gary Plate | | Steelmaking | | Indiana | | Carbon steel plate, high-strength low alloy steel plate, ASTM grades steel plate |
| Butler Works | | Steelmaking | | Pennsylvania | | Flat-rolled electrical and stainless steel, stainless and carbon semi-finished slabs |
| Cleveland | | Steelmaking | | Ohio | | Hot-rolled and hot-dipped galvanized sheet |
| Coatesville | | Steelmaking | | Pennsylvania | | Steel plate - carbon, high-strength low-alloy, commercial allow, military alloy, flame-cut |
| Columbus | | Steelmaking | | Ohio | | Hot-dipped galvanized steel |
| Conshohocken | | Steelmaking | | Pennsylvania | | Coiled and discrete plate, military alloy, commercial alloy, heat-treated carbon |
| Coshocton Works | | Steelmaking | | Ohio | | Flat-rolled stainless steel |
| Dearborn Works | | Steelmaking | | Michigan | | Carbon semi-finished slabs, hot-dipped galvanized, AHSS |
| Indiana Harbor | | Steelmaking | | Indiana | | Hot-rolled, cold-rolled and hot-dipped galvanized sheet |
| Kote and Tek | | Steelmaking | | Indiana | | Cold-rolled, hot-dipped galvanized and galvannealed, electrogalvanized coil |
| Mansfield Works | | Steelmaking | | Ohio | | Semi-finished hot bands, high chrome ferritic and martensitic stainless steels |
| Middletown Works | | Steelmaking | | Ohio | | Hot-rolled, cold-rolled, hot-dipped galvanized, aluminized sheet and coke |
| Piedmont | | Steelmaking | | North Carolina | | Plasma-cuts plate steel products into blanks |
| Riverdale | | Steelmaking | | Illinois | | Hot-rolled sheet |
| Rockport Works | | Steelmaking | | Indiana | | Cold-rolled carbon, coated and stainless steels |
| Steelton | | Steelmaking | | Pennsylvania | | Railroad rails, specialty blooms, flat bars |
| Weirton | | Steelmaking | | West Virginia | | Tinplate, cold-rolled sheet |
| Zanesville Works | | Steelmaking | | Ohio | | Electrical steels |
| Tubular Components | | Other Businesses | | Indiana and Ohio | | AHSS tube, electric resistant welded tubing |
| Precision Partners | | Other Businesses | | Ontario, Alabama and Kentucky | | Cold and hot stamp assembly solutions |
Customers and Markets
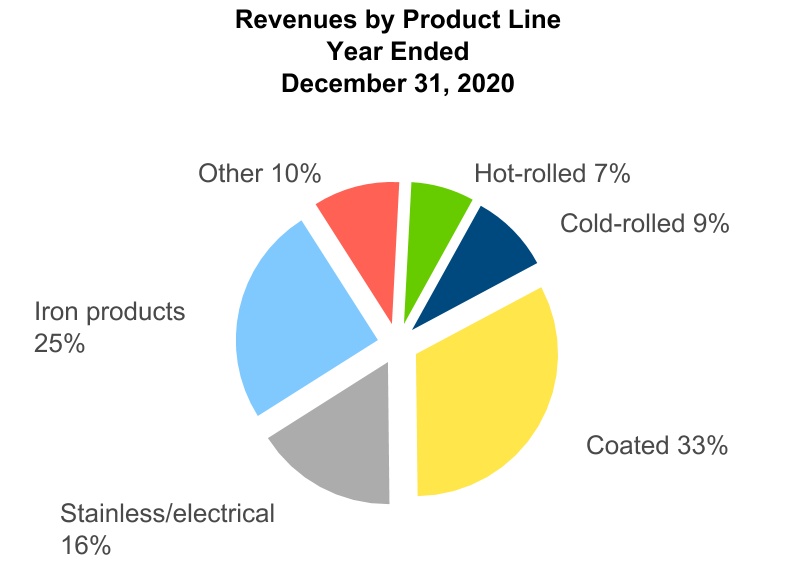
We primarily sell our products to customers in four broad market categories: automotive; infrastructure and manufacturing, which includes electrical power; distributors and converters; and steel producers, which consume iron ore and metallics. The following table presents the percentage of our net sales to each of these markets during the year:
| | | | | | | | |
| Market | | 2020 |
| Automotive | | 45 | % |
| Infrastructure and manufacturing | | 15 | % |
| Distributors and converters | | 13 | % |
| Steel producers | | 27 | % |
Certain of our flat-rolled steel shipments are sold under fixed base price contracts. These contracts are typically one year in duration and expire at various times throughout the year. Some of these contracts have a surcharge mechanism that passes through certain changes in input costs. A certain portion of our flat-rolled steel shipments are sold based on the spot market at prevailing market prices or under contracts that involve variable pricing that is tied to an independently published steel index.
We sell our steel products principally to customers in North America. For the vast majority of international sales, we are not the importer of record and do not bear the responsibility for paying any applicable tariffs.
Automotive Market
The automotive industry is our largest market, and we aim to address the principal needs of major automotive manufacturers and their suppliers. We specialize in manufacturing difficult-to-produce, high-quality steel products, combined with demanding delivery performance, customer technical support and collaborative relationships, to develop breakthrough steel solutions that help our customers meet their product requirements. In addition, many of our competitors do not have the capability to supply the full portfolio of products that we make for our automotive customers, such as steel for exposed automotive applications, the most sophisticated grades of AHSS and value-added stainless steel products. The exacting requirements for servicing the automotive market generally allows for higher selling prices for products sold to that market than for the commodity types of carbon and stainless steels sold to other markets.
In light of the automotive market’s importance to us, North American light vehicle production has a significant impact on our total sales and shipments. North American light vehicle production for 2020 declined 20% to approximately 13 million units from the prior year due to impacts of the COVID-19 pandemic, which forced businesses to begin to shut down at the end of March 2020 until they slowly re-started near the end of the second quarter. During the third quarter of 2020, auto makers saw the pent-up demand bring sales back to more normal levels as buyers and dealers adapted to new procedures and virtual shopping. Fourth quarter 2020 sales were more in line with expected sales for the time of year, but did not quite return to pre-COVID-19 levels. Currently, we are expecting North American light vehicle production in 2021 to significantly increase and return to near 2019 levels, which to an extent depends on continued demand, the level of fiscal stimulus provided under the new Biden Administration, timing of COVID-19 vaccination distribution and how quickly the economy recovers.
Furthermore, during 2020, consumer demand for sport utility vehicles, trucks, crossovers and larger vehicles continued to increase while demand for smaller sedans and compact cars declined. We benefit from intentionally targeting larger vehicle platforms to take advantage of consumer preferences, and we have focused on and have been successful in getting sourced on numerous sport utility vehicles, truck, crossover and larger vehicle platforms. As a result, a significant portion of the carbon automotive steel that we sell is used to produce these popular larger vehicles. In addition to benefiting from our exposure to consumers’ strong demand for larger vehicles, these vehicles also typically contain a higher volume of steel than smaller sedans and compact cars, providing us the opportunity to sell a greater proportion of our steel products to our automotive customers.
Automotive manufacturers are under pressure to achieve heightened federally mandated fuel economy standards (the Corporate Average Fuel Economy, or “CAFE,” standards). The CAFE standards generally require automobile manufacturers to meet an average fuel economy goal across the fleet of vehicles they produce with certain milestone dates. As a result, our automotive customers continue to explore various avenues for achieving the standards, including light weighting components and developing more fuel-efficient engines. Light weighting efforts include the use of alternatives to traditional carbon steels, such as AHSS and other materials. While this could reduce the aggregate volume of steel consumed by the automotive industry, we expect that demand will increase for current
and next-generation AHSS and that our AHSS and other innovative steels will command higher margins. We are a majorcollaborating with our automotive customers and their suppliers to develop innovative solutions using our developments in light weighting, efficiency, and material strength and formability across our extensive product portfolio, in combination with our automotive stamping and tube-making capabilities. We are also working with our customers to develop steels with greater heat resistance for exhaust systems that support new, fuel-efficient engines that run at higher temperatures.
Automotive manufacturers have also been increasing their development of H/EVs and battery electric vehicles in order to meet the CAFE standards and growing customer adoption of H/EVs. Many motors used in H/EVs being sold in the U.S. today are imported from foreign suppliers, but more local sourcing and manufacturing of motors is expected to occur in the future. As the only North American producer of high-efficiency NOES, which is a critical component of H/EV motors, we are positioned to potentially benefit from the growth of H/EVs going forward. We believe our strong foundation in electrical steels and long-standing relationships with automotive manufacturers and their suppliers will provide us with an advantage in this market as it continues to grow and mature. Likewise, the growing customer adoption of H/EVs may also increase demand for improvements in the electric grid to support higher demand for more extensive battery charging, which our GOES could support.
Infrastructure and Manufacturing Market
We sell a variety of our steel products, including plate, carbon, stainless, electrical, tinplate and rail, to the infrastructure and manufacturing market. This market includes sales to manufacturers of heating, ventilation and air conditioning equipment, appliances, power transmission and distribution transformers, storage tanks, ships and railcars, wind towers, machinery parts, heavy equipment, military armor, food preservation, and railway lines. Domestic construction activity and the replacement of aging infrastructure directly affects sales of steel to this market. During 2020, there were nearly 1.4 million new housing starts in the U.S., an increase of approximately 6% from 2019, and home sales reached nearly 6 million, the highest annual mark since 2006, with the supply of existing homes having reached all-time lows. The recent strength in home sales has been due to lower mortgage rates and remote work flexibility and is expected to continue through 2021.
Distributors and Converters Market
Virtually all of the grades of steel we produce are sold to the steel distributors and converters market. This market generally represents downstream steel service centers, who source various types of steel from us and fabricate it according to their customers' needs. Our steel is typically sold to this market on a spot basis or under short-term contracts linked to steel pricing indices. Demand and pricing for this market can be highly dependent on a variety of factors outside our control, including global and domestic commodity steel production capacity, the relative health of countries’ economies and whether they are consuming or exporting excess steel capacity, the provisions of international trade agreements and fluctuations in international currencies and, therefore, are subject to market changes in steel prices.
The price for domestic HRC, which is an important attribute in the profitability of this end market, averaged $588 per net ton for the year ended December 31, 2020, 2% lower than the prior year. The price of HRC was negatively impacted by lower demand related to the COVID-19 pandemic, and hit a low point of $438 per net ton on April 30, 2020. However, as the industry recovered and supply-demand dynamics improved, the price rebounded dramatically, rising to a peak of $1,030 per net ton by December 31, 2020 and reaching all time-highs early in 2021. The improved pricing environment should bolster profitability for this end market during 2021.
Steel Producers Market
The steel producers market represents third-party sales to other steel producers, including those who operate blast furnaces and EAFs. It includes sales of raw materials and semi-finished and finished goods, including iron ore pellets, primarily sellingcoal, coke, HBI and steel products.
The merchant portion of our iron ore pellet production is sold pursuant to long-term supply agreements and through spot contracts. Certain of our supply agreements contain a base price that is adjusted periodically as specified by the contracts, using one or more adjustment factors. Factors that could result in price adjustments under our contracts include changes in the Platts 62% price, published Platts international indexed freight rates and changes in specified PPI, including those for industrial commodities, fuel and steel.
As a result of the Acquisitions, production from our Mining and Pelletizing segment to integrated steel companies in the U.S. and Canada. We operate four iron ore mines: the Tilden mine in Michiganmines is now predominantly consumed by our newly acquired steelmaking operations. On a full-year basis, we would expect between 22 million and the Northshore, United Taconite24 million long tons of our iron ore pellets to be consumed by our steelmaking operations. During 2020, 2019 and Hibbing mines in Minnesota. These mines currently have an annual rated capacity2018, we sold 12
million, 19 million and 21 million long tons of iron ore pellet production, representing 55% of total U.S. pellet production capacity. Based on our equity ownership in these mines,product, respectively, to third parties from our share of the annual rated production capacity is currently 21.2 million long tons, representing 42% of total U.S. annual pellet capacity. The Empire mine located in Michigan, which historically had annual rated capacity of 5.5 million long tons, was indefinitely idled beginning in August 2016. During 2017, we acquired the remaining noncontrolling interest of the Empire and Tilden mines from ArcelorMittal and U.S. Steel, respectively. We are the manager of the Hibbing mine and rely on our joint venture partners to make their required capital contributions and to pay for their share of the iron ore pellets that we produce. In 2018, we tendered our resignation as the mine manager of the Hibbing mine and plan to transition this role to the majority owner in August 2019.
The following chart summarizes the estimated annual pellet production capacity and percentage of total U.S. pellet production capacity for each of the respective iron ore producers as of December 31, 2018:
|
| | | | | | |
| U.S. Pellet |
| Annual Rated Capacity Tonnage |
| | | Current Estimated Capacity (Long Tons in Millions)1 | | Percent of Total U.S. Capacity |
| All Cliffs’ managed mines | | 27.4 |
| | 54.8 | % |
| Other U.S. mines | | | | |
| U.S. Steel’s Minnesota ore operations | | | | |
| Minnesota Taconite | | 14.3 |
| | 28.6 |
|
| Keewatin Taconite | | 5.4 |
| | 10.8 |
|
| Total U.S. Steel | | 19.7 |
| | 39.4 |
|
| ArcelorMittal USA Minorca mine | | 2.9 |
| | 5.8 |
|
| Total other U.S. mines | | 22.6 |
| | 45.2 |
|
| Total U.S. mines | | 50.0 |
| | 100.0 | % |
| | | | | |
1 Empire mine was excluded from the estimated capacity calculation as it is indefinitely idled. |
Our Mining and Pelletizing segment production generally is sold pursuant to long-term supply agreements. For the year ended December 31, 2018, we produced a total of 26.3 million long tons of iron ore pellets. The 2018 production included 20.3 million long tons for our account and 6.0 million long tons on behalf of our steel company partners associated with the Hibbing mine. During 2017 and 2016, we produced a total of 25.5 million and 23.4 million long tons, respectively.mines.
We produce various grades of iron ore pellets, including standard, fluxed and DR-grade, for use in our customers’ operations as part of the steelmaking process. The variation in grade of iron ore pellets results from the specific chemical and metallurgical properties of the ores at each mine, the requirements of end user'susers' steelmaking processprocesses and whether or not fluxstone is added in the process. Although the grade or grades of pellets currently delivered to each customer are based on that customer’s preferences, which depend in part on the characteristics of the customer’s steelmaking operation, in certain cases our iron ore pellets can be used interchangeably. Standard pellets require less processing, are generally the least costly pellets to produce and are called “standard” because no ground fluxstone, such as limestone or dolomite, is added to the iron ore concentrate before turning the concentrate into pellets. In the case of fluxed pellets, fluxstone is added to the concentrate, which produces pellets that can perform at higher productivity levels in the customer’s specific blast furnace and will minimize the amount of fluxstone the customer may be required to add to the blast furnace. DR-grade pellets require additional processing to make a pellet that contains higher iron and lower silica content than a standard pellet. Unlike standard or fluxed pellets, DR-grade pellets are produced to be fed into a direct reduced iron facility, which then are converted into DRI or HBI, a high-quality raw material usedreduction facility.
Beginning in an EAF.
Additionally, as the EAF steel market continues to grow in the U.S., there is an opportunity for our iron ore to serve this market by providing pellets to the alternative metallics market to produceDRI, HBI and/orpig iron. We have produced and shipped industrial trials of low-silica DR-grade pellets, which were successfully processed in two customers' DRI reactors to produce a high-quality DRI product. By 2020,2021, we expect to also sell these low-silica DR-grade pelletsHBI to our own Metallics business unit, which includes the HBI facilitythird-party customers, primarily EAFs with operations in Toledo, Ohio.
Each of our Mining and Pelletizing segment mines is located near the Great Lakes. The majority ofLakes region. We expect our iron ore pellets are transported via railroadsToledo direct reduction plant to loading ports for shipment via vesselbegin shipping saleable product to blast furnace steelmakers in North America.
Upon adoption of ASC 606 on January 1, 2018, the timing and pattern of revenue recognition changed for our Mining and Pelletizing segment. The change in timing of revenue recognition, combined with the normal seasonal closure of the Soo Locks and the Welland Canal during the winter months, influenced our revenues to lower than historical levelsthird-party customers during the first quarter and higher than historical levels during the remaining three quarters in 2018. We expect this pattern to continue in future years. However, we expect the total amount of revenue recognized during the year to remain substantially the same as under historical GAAP. During the first quarter, we continue to produce our products, but we cannot ship most of those products via lake vessel until the conditions on the Great Lakes are navigable, which causes our first and second quarter inventory levels to rise. Our limited practice of shipping product to ports on the lower Great Lakes or to customers’ facilities prior to the transfer of control2021. The Toledo direct reduction plant has somewhat mitigated the seasonal effect on first and second quarter inventories, as shipment from this point to the customers’ operations is not limited by weather-related shipping constraints. As of December 31, 2018, under the new accounting standard, we had
finished goods of 0.8 million long tons in transit or stored at the Port of Toledo to service customers, for which revenue had yet to be recognized. As of December 31, 2017, under the previous accounting standard, we had finished goods of 1.5 million long tons stored at ports and customer facilities on the lower Great Lakes to service customers for which revenue had yet to be recognized. Refer to NOTE 1 - BASIS OF PRESENTATION AND SIGNIFICANT ACCOUNTING POLICIES and NOTE 2 - NEW ACCOUNTING STANDARDS for further discussion on revenue recognition.
Mining and Pelletizing Customers
Our Mining and Pelletizing segment revenues primarily are derived from sales of iron ore pellets to the North American integrated steel industry, consisting primarily of three major customers. Generally, we have multi-year supply agreements with our customers. Sales volume under these agreements largely is dependent on customer requirements, and in certain cases, we are the sole supplier of iron ore to the customer. Most agreements contain a base price that is adjusted annually using one or more adjustment factors. Factors that could result in price adjustments under our contracts include changes in the Platts 62% Price, hot-rolled coil steel price, the Atlantic Basin pellet premium, published Platts international indexed freight rates and changes in specified Producer Price Indices, including those for industrial commodities, fuel and steel.
During 2018, 2017 and 2016, we sold 20.6 million, 18.7 million and 18.2 million long tons of iron ore product, respectively, from our share ofnameplate production from our Mining and Pelletizing segment mines. Refer to Concentration of Customers below for additional information regarding our major customers.
Metallics Segment
In June 2017, we announced the planned construction of an HBI production plant in Toledo, Ohio. HBI is a specialized high-quality iron alternative to scrap that, when used as a feedstock, allows an EAF to produce more valuable grades of steel. We expect our HBI to partially replace the over 3 million metric tons of ore-based metallics that are imported into the Great Lakes region every year from Russia, Ukraine, Brazil and Venezuela, as well as nearly 20 million metric tons of scrap used in the Great Lakes area every year.
Over the past 18 months, we have made significant progress on the construction of this plant. Based on current market analysis, greater-than-expected customer demand and expansion opportunities identified during the construction process, we are increasing the expected productive capacity of the Toledo HBI production plant from 1.6 million to 1.9 million metric tons, per year. Weand we expect that the HBI production plant, once operational, will consume approximately 2.8 million long tons of DR-grade pellets per year from our Mining and Pelletizing segment.
Discontinued Operations
Unless otherwise noted, discussion of our business and results of operations in this Annual Report on Form 10-K refers to our continuing operations.
Asia Pacific Iron Ore Operations
During 2018, we sold all of the assets of our Asia Pacific Iron Ore business through a series of sales to third parties. As a result of our planned exit, management determined that our Asia Pacific Iron Ore operating segment met the criteria to be classified as held for sale and a discontinued operation under ASC Topic 205, Presentation of Financial Statements. As such, all current and historical Asia Pacific Iron Ore operating segment results are classified within discontinued operations.
Historically, the Asia Pacific Iron Ore operations served the Asian iron ore markets with direct-shipped fines and lump ore. During 2018, 2017 and 2016, we produced 2.7 million, 10.1 million and 11.8 million metric tons, respectively, from our Asia Pacific Iron Ore operation. During 2018, 2017 and 2016, we sold 3.9 million, 9.8 million and 11.6 million metric tons of iron ore, respectively, from our Asia Pacific Iron Ore operation.
Refer to NOTE 13 - DISCONTINUED OPERATIONS for further discussion of the Asia Pacific Iron Ore segment.
Canadian Operations
During March 2018, we agreed to terms of a plan of compromise or arrangement in the CCAA proceedings with the Bloom Lake Group, the Wabush Group and the Monitor. By order of the Québec Superior Court of Justice (Commercial Division) (the “Court”) dated April 20, 2018, the Bloom Lake Group and the Wabush Group were authorized to file a joint plan of compromise and arrangement dated April 16, 2018 (the “Original Plan”). Following discussions with various stakeholder groups, the Bloom Lake Group and the Wabush Group were authorizedreach its productive capacity by the Court to amendsecond quarter of 2021.
the Original Plan and to file an amended and restated joint plan of compromise and arrangement dated May 16, 2018 (as same may be further amended from time to time, the “Amended Plan”). The Amended Plan was approved by the required majorities of each unsecured creditor class and was sanctioned by the Court by order dated June 29, 2018 (the “Sanction Order”). Further amendments to address the manner in which certain distributions under the Amended Plan would be effected were presented to the Court on July 30, 2018. Finally, on July 31, 2018, the conditions precedent to the implementation of the Amended Plan were satisfied and the Amended Plan was implemented.
Under the terms of the Amended Plan, we and certain of our wholly-owned subsidiaries made a C$19.0 million cash contribution to the Wabush Group pension plans and agreed to contribute into the CCAA estate any remaining distributions or payments we may be entitled to receive as creditors of the Bloom Lake Group and the Wabush Group for distribution to other creditors. The Original Plan did not resolve certain employee claims asserted against us and certain of our affiliates outside of the CCAA proceedings. The Amended Plan resolved these employee claims, all claims by the Bloom Lake Group, the Wabush Group and their respective creditors against us as well as all of our claims against the Bloom Lake Group and the Wabush Group.
Financial results prior to the respective deconsolidations of the Bloom Lake and Wabush Groups and subsequent expenses directly associated with the Canadian Entities are classified within discontinued operations. Refer to NOTE 13 - DISCONTINUED OPERATIONS for further discussion of the Eastern Canadian Iron Ore segment.
Applied Technology, Research and Development
We have an extensive history of being an innovator dating back more than a century. From upstream research and development, to downstream applications, we have dedicated technical and engineering resources that begin with improving customers' production and manufacturing performance to applications for their end product use.
We have been a leader in iron ore mining and processing technology since inception and have been in operation for over 170 years. We operated some of the first mines on Michigan’s Marquette Iron Range and pioneered early open-pit and underground mining methods. From the first application of electrical power in Michigan’s underground mines to the use of today’s sophisticated computers and global positioning satellite systems, we have been a leader inthrough the application of new technology to the centuries-old business of mineral extraction. Today, our engineering and technical staffs are engaged in full-time technical support of our operations, improvement of existing products and development of new products.
We arehave also been a pioneer in iron ore pelletizing with over 60 years of experience. We are able to produce customized, environmentally friendly pellets to meet each customer’s blast furnace specifications and produce both standard, fluxed and fluxedDR-grade pellets. Using
We now have a world-class research and development team expanding our technical expertisecapabilities to bring new steel products to the marketplace. Rapidly evolving and strong market position inhighly competitive markets for our steel products require our customers to seek new, comprehensive steel solutions, and we believe we are well positioned to deliver the United Statesmost robust solutions through our broad portfolio of offerings. Collaboration across our research groups and operations generates innovative and comprehensive solutions for our customers, which we believe enhances our competitive advantage.
Creating innovative products and breakthrough solutions is a strategic priority, as we believe differentiation through producing higher value steels to increasemeet challenging requirements enables us to maintain and enhance our margins. We conduct a broad range of research and development activities aimed at improving existing products and processes and developing new ones. Our innovation of steel has produced a highly diversified steel product offering,portfolio. As part of our underlying strategy to focus on higher-value materials and minimize exposure to commodity products, we have started producing DR-grade pellets. In recent years, we shipped low silica DR-grade pellets, which were successfully processedinvested in multiple DRI reactorsresearch and innovation totaling $15 million in 2020. Our ongoing efforts at our state-of-the-art Research and Innovation Center in Middletown, Ohio, to produce a high-quality direct reduced iron product.enhance technical collaboration have increased the introduction of new steel solutions to the marketplace.
With our experienced technical professionals and unsurpassed reputation for our pelletizing technology, we continue to deliver a world-class quality product to our customers. HBI
We are a pioneer in the development of emerging reduction technologies, a leader in the extraction of value from challenging resources and a front-runner in the implementation of safe and sustainable technology. Our technical experts are dedicated to excellence and deliver superior technical solutions tailored to our customer base. We are also devoted to promoting environmental sustainability, in our industry, primarily evidenced with the development of our HBI facilitydirect reduction plant in Toledo, Ohio. Similar to the market shift to pellets over 60 years ago, we recognize the need to serve the growing EAF market and the need for less pollutive methods of steelmaking. We expect our introduction of HBI to the Great Lakes EAF market will be notable in the evolution of the steel industry.
Concentration of Customers
In 2018 and 2017, three customers individually accounted for more than 10%We completed construction of our consolidated product revenueToledo direct reduction plant and began production in 2016, two customers individually accounted for more than 10%the fourth quarter of our consolidated product revenue. Product revenue from those customers totaled $2.1 billion, $1.5 billion and $1.1 billion2020. Our Toledo direct reduction plant is expected to produce 1.9 million metric tons of our total consolidated product revenue in 2018, 2017 and 2016, respectively. The following represents sales revenue attributable to each of these customers as a percentage of total product sales for those years:
|
| | | | | | | |
| | | Percentage
Product Revenue |
Customer1 | | 2018 | | 2017 | | 2016 |
| ArcelorMittal | | 57% | | 48% | | 51% |
| AK Steel | | 25% | | 29% | | 27% |
Algoma2 | | 13% | | 11% | | 5% |
| |
1 Includes subsidiaries. |
2 On October 5, 2015, we terminated the long-term agreement with Algoma; however, we entered into certain short-term contracts with Algoma throughout 2016. On May 16, 2016, we reinstated our agreement with Algoma, which took effect in January 2017. |
ArcelorMittal
Historically, and still today, our pellet supply agreements with ArcelorMittal USA were based on customer requirements, except for the Indiana Harbor East facility, which is based on customer contract obligations. The legacy agreements with ArcelorMittal USA expired at the end of December 2016 and January 2017. The parties executed a new long-term agreement, which became effective October 31, 2016, for the sale and delivery of ArcelorMittal USA’s annual tonnage requirements that fall within a specific range of volume. This latest agreement expires at the end of December 2026. Additionally, in 2018 we entered into an agreement with ArcelorMittal Dofasco to sell and deliverHBI per year, replacing a portion of its annual pellet consumption requirements.the over 3 million metric tons of ore-based metallics that are imported into the Great Lakes region every year from Russia, Ukraine, Brazil and Venezuela, as well as approximately 20 million metric tons of scrap used in the Great Lakes area every year.
ArcelorMittal USA is a 62.3% equity participant
Carbon Steel
We focus much of our research and innovation efforts on carbon steel applications for automotive manufacturers and their suppliers. We are particularly focused on AHSS for the automotive market, and we produce virtually every AHSS grade currently used by our customers. Our AHSS grades, such as Dual Phase 590, 780, 980 and 1180, have been adopted by our customers for both stamped and roll-formed parts, and our NEXMET® 1000 and 1200 products have demonstrated enhanced strength, formability and opportunities for automotive light weighting in Hibbing. During 2017, we acquiredcold-stamped applications. We are also pursuing application of NEXMET 440EX and NEXMET 490EX in surface-critical, exposed auto body panels as an alternative to aluminum.
Third Generation Advanced High-Strength Steel
Our third generation NEXMET 1000 and NEXMET 1200 AHSS products enable our customers to achieve significant light weighting in the 21% ownership interestunexposed structural components of ArcelorMittal USA in Empire as part of an agreementtheir vehicles. NEXMET 1200, for example, offers superior formability similar to distributeconventional Dual Phase 600 steel, but at twice the noncontrolling interest net assetsstrength level. We have expanded the application of the mine.NEXMET technology to our tubular products and stamped components businesses. These AHSS products allow automotive engineers to design lightweight parts that meet rigorous service and safety requirements. The NEXMET family of steels helps our customers achieve vehicle weight savings for ambitious fuel efficiency standards while avoiding significant capital costs required to re-design production facilities to use alternative materials.
Both galvanized and cold-rolled NEXMET 1000 and NEXMET 1200 AHSS are progressing through product qualification with several original equipment manufacturer customers. A number of stamping and component assembly trials have been completed successfully, with more planned and underway. Because the timing of automotive design and production cycles spans several years, widespread automotive customer adoption of revolutionary new material such as NEXMET AHSS may also extend over several years. We expect that other automotive vehicle platforms will incorporate NEXMET AHSS in their designs and that NEXMET AHSS will become a strong differentiator for us going forward.
Downstream Steel Applications
Our portfolio of steel solutions includes the operations of Precision Partners, which provides advanced-engineered solutions, tool design and build, hot and cold-stamped components and complex assemblies for the automotive market. In addition to Precision Partners, our downstream operations include Tubular Components, which manufactures advanced tubular products for automotive and other applications using carbon and stainless steels. We believe that collaboration among our steelmaking operations and our downstream businesses can accelerate the adoption of our innovative steel products by automotive manufacturers and their Tier 1 suppliers.
Our research and technical experts have undertaken numerous collaborative projects that are generating robust solutions for our customers. Precision Partners’ expertise in tool design and stamping capabilities has allowed us to create prototype components using AK Steel’s innovative new materials and present customers with new potential steel solutions. This approach has and, we expect, will continue to demonstrate to customers that they can significantly lightweight automotive parts on an accelerated timeline and in a cost-effective manner by using our highly formable grades of AHSS in place of traditional material types.
In 2018, 2017addition, our collaborative projects are enhancing our collective knowledge and 2016,experience in the stamping of new, advanced grades of steel, advanced engineered solutions, and tool design and build. For example, Precision Partners specializes in hot-stamping PHS for automotive applications. AK Steel’s experience as a leader in PHS and Precision Partners’ expertise in hot-stamping has enabled these teams to have greater insight into these high-growth areas and has accelerated product development and customer adoption of these automotive light weighting solutions. Likewise, collaboration with Tubular Components strategically advances our Miningmission to innovate in AHSS for the automotive industry, as Tubular Components has been at the forefront of producing tubular products from third-generation AHSS. We believe the combination of Precision Partners’ stamping and Pelletizing segment pellet salesadvanced die-making capabilities, Tubular Component’s leading tube making capabilities and our breakthrough material introductions will enhance our ability to ArcelorMittal were 10.1 million, 8.4 milliondeliver innovative, steel solutions to our customers.
Precision Partners has recently been awarded contracts with several customers to supply complex assemblies and 9.7 million long tons, respectively.stamped automotive parts. In winning these contracts, Precision Partners has been able to leverage our hot-stamping tooling leadership, in addition to our innovative hot-stamping process, to capture new strategic opportunities and demonstrate that Precision Partners is one of the few businesses in North America that has the technical capabilities to produce a major complex assembly and stamping work of this nature.
In August 2013, we entered into
Competition
We principally compete with domestic and foreign producers of flat-rolled carbon, plate, stainless, rail and electrical steel, carbon and stainless tubular products, aluminum, carbon fiber, concrete and other materials that may be used as a new agreement with AK Steel to provide iron ore pellets to AK Steelsubstitute for useflat-rolled steels in its Middletown, Ohiomanufactured products. Precision Partners and Ashland, Kentucky blast furnace facilities. This contract includes minimumTubular Components both compete against other niche companies in highly fragmented markets.
Price, quality, on-time delivery, customer service and maximum tonnage requirements for each year between 2014product innovation are the primary competitive factors in the steel industry and 2023. In 2018, through contract amendments, we added tonnage with AK Steel above the maximum tonnage requirements specificvary in importance according to the 2018 contract year.product category and customer requirements. Steel producers that sell to the automotive market face competition from aluminum manufacturers (and, to a lesser extent, other materials) as automotive manufacturers attempt to develop vehicles that will enable them to satisfy more stringent, government-imposed fuel efficiency standards. To address automotive manufacturers’ light weighting needs that the aluminum industry is targeting, we and others in the steel industry are developing AHSS grades that we believe provide weight savings similar to aluminum, while being stronger, less costly, more sustainable, easier to repair and more environmentally friendly. Aluminum penetration has been primarily limited to specific automotive applications, such as outer panels and closures, rather than entire body designs. In addition, our automotive customers who continue to use steel, as opposed to aluminum and other alternative materials, are able to avoid the significant capital expenditures required to re-tool their manufacturing processes to accommodate the use of non-steel materials.
In 2015,Mini-mills (producers using EAFs) comprise about 70% of steel production in the U.S. Their primary raw material is scrap metal, which has unpredictable and often volatile pricing. Due to the announced mini-mill capacity additions in the U.S. and increasing demand for scrap from China, we enteredexpect the price of scrap to remain elevated over historical averages, providing our integrated footprint a competitive advantage. Mini-mills also generally offer a narrower range of products than integrated steel mills, but the increasing use of pig iron and direct reduced iron have enabled them to modestly expand their product capabilities in recent years. However, we believe mini-mills often do not have the equipment capabilities to produce the product range that integrated facilities offer, nor do we believe they possess our depth of customer service, technical support, and research and innovation.
Domestic steel producers, including us, face significant competition from foreign producers. For many reasons, these foreign producers often are able to sell products in the U.S. at prices substantially lower than domestic producers. Depending on the country of origin, these reasons may include government subsidies; lower labor, raw material, energy and regulatory costs; less stringent environmental regulations; less stringent safety requirements; the maintenance of artificially low exchange rates against the U.S. dollar; and preferential trade practices in their home countries. Since late 2017, import levels of flat-rolled products into an amendedthe United States have shown a gradual and restated agreement with AK Steel after it acquired Severstal Dearborn, LLC, under which we supply allsteady decline and have recently been more reflective of historical levels before the unprecedented surge that began in 2014. We believe the decline is at least partially attributable to the implementation of certain trade restrictions on imported steel over the past five years, including both targeted trade cases and the more broad Section 232 tariffs. Modifications to these trade restrictions by government officials could directly or indirectly impact import levels in the future. Import levels are also affected to varying degrees by the relative level of steel production in China and other countries, the strength of demand for steel outside the U.S. and the relative strength or weakness of the Dearborn, Michigan facility’s blast furnace pellet requirements through 2022, subject to specified minimum and maximum requirementsU.S. dollar against various foreign currencies. Imports of finished steel into the U.S. accounted for approximately 18% of domestic steel market consumption in certain years.2020.
In 2018, 2017 and 2016, our Mining and Pelletizing segment pellet sales to AK Steel were 5.8 million, 5.6 million and 4.5 million long tons, respectively.
Algoma
Algoma is a Canadian steelmaker whose common shares were owned by Essar Steel Holdings Limited. Essar Steel Algoma Inc. initiated CCAA proceedings in 2016. In November 2018, substantially all of the assets of Essar Steel Algoma Inc. were acquired by the emerging company, Algoma Steel Inc. We had a long-term supply agreement under which we were Algoma’s sole supplier of iron ore pellets through the end of 2016, and would continue to provide significant pension and healthcare benefits to a portiongreat number of its pellet needs through 2024. Under the termsour retirees compared to certain other domestic and foreign steel producers that do not provide such benefits to any or most of their retirees, which increases our overall cost of production relative to certain other steelmakers. However, we have taken a 2016 settlement reinstatement agreement approved by the CCAA court, Algoma agreednumber of actions to assume the long-term supply agreement. Additionally, Algoma entered intoreduce pension and healthcare benefits costs, including negotiating progressive labor agreements with us wherein we sell additional incremental tonnage that equateshave significantly reduced total employment costs at all of our union-represented facilities, transferring all responsibility for healthcare benefits for various groups of retirees to Algoma's 2016 through 2020 annual iron ore pellet consumption.VEBAs, offering voluntary lump-sum settlements to pension plan participants, lowering retiree benefit costs for salaried employees, and transferring pension obligations to highly rated insurance companies. These agreements began in 2016, 2017 and 2018 and run through December 2020. Algoma assumed these contracts in the CCAA proceedings at the completionactions have not only reduced some of the sale of assets forming the new entity.
In 2018, 2017 and 2016,risks associated with our Mining and Pelletizing segment pellet salespension fund obligations, but more importantly have reduced our risk exposure to Algoma were 3.5 million, 2.5 million and 1.2 million long tons, respectively.
Competition
In our Mining and Pelletizing business segment, we primarily sell our product to steel producers with operations in North America. We compete directly with steel companies that own interests in iron ore mines in the United States and/or Canada, including U.S. Steel, and with major iron ore pellet exporters from Eastern Canada and Brazil.
A number of factors beyond our control affect the markets in which we sell our iron ore. Continued demand for our iron ore and the prices obtained by us primarily depend on the consumption patternsperformance of the steel industry in the U.S., Chinafinancial markets, which are a principal driver of pension funding requirements. We continue to actively seek opportunities to reduce pension and elsewhere around the world, as well as the availability, location, costhealthcare benefits costs.
Environment
Our mining, activitiessteel and downstream manufacturing operations are subject to various laws and regulations governing the protection of the environment. We monitor these laws and regulations, which change over time, to assess whether the changes affect our operations. We conduct our operations in a manner that is protective of public health and the environment and believe our operations are in compliance with applicable laws and regulations in all material respects.environment.
Environmental issuesmatters and their management continued to be an important focus at each of our operations throughout 2018.2020, including operations at AK Steel (acquired in March 2020) and ArcelorMittal USA (acquired in December 2020). In the construction and operation of our facilities, substantial costs have been and will continue to be incurred to comply with regulatory requirements and avoid undue effect on the environment. OurIn 2020, 2019, and 2018, our capital expenditures relating to environmental matters totaled approximately $34 million, $9 million, and $10 million, $21 million and $15 million, in 2018, 2017 and 2016, respectively. It is estimated thatOur current estimate for capital expenditures for environmental improvements will totalin 2021 is approximately $10$51 million in 2019, for various water treatment, air quality, dust control, tailings management selenium management and other miscellaneous environmental projectsprojects. Additionally, we expect capital expenditures for environmental improvements for each of 2022 and 2023 to be generally in our Mining and Pelletizing segment.line with 2021's estimated spending.
Regulatory Developments
Various governmental bodies continually promulgate new or amended laws and regulations that affect us, our customers, and our suppliers in many areas, including waste discharge and disposal, the classification of materials and products, air and water discharges and many other environmental, health, and safety matters. Although we believe that our environmental policies and practices are sound and do not expect that the application of any current laws, regulations or permits would reasonably would be expected to result in a material adverse effect on our business or financial condition, we cannot predict the collective potential adverse impact of the expanding body of laws and regulations. Moreover, because all domestic steel and mining producers operate under the same federal environmental regulations, we do not believe that we are more disadvantaged than our domestic competitors by our need to comply with these regulations. Some foreign competitors may benefit from less stringent environmental requirements in the countries where they produce, resulting in lower compliance costs for them and providing those foreign competitors with a cost advantage on their products.
Specifically, there are several notable proposed or potential rulemakings or activities that could have a material adverse impact on our facilities in the future depending on their ultimate outcome: Minnesota's potential revisions to the sulfate wild rice water quality standard; evolving water quality standards for selenium and conductivity; scope of the Clean Water Act and the definition of “Waters of the United States”; Minnesota's Mercury TMDL and associated rules governing mercury air emission reductions; Climate Change and GHG Regulation; the Regional Haze FIP Rule; NO2and SO2 NAAQS; and increased administrative and legislative initiatives relatedthe regulation of discharges to financial assurance obligations for CERCLA, mining and reclamation obligations.groundwater.
Minnesota’s Withdrawal of Proposed Amendments to the Sulfate Wild Rice Water Quality Standard
The Minnesota Legislature provided $1.5 million in 2011 for a study to gather additional information about the effects of sulfate and other substances on the growth of wild rice and to support an update to the sulfate wild rice water
quality standard originally adopted in 1973 by the MPCA. In August 2017, MPCA released proposed amendments of the sulfate water quality standard, which included a proposed sulfate wild rice water quality standard, a proposed list of waters where the standard would apply, and criteria for adding waters to that list. In January 2018, the proposed rule was substantially disapproved by an ALJ. The MPCA filed a request for reconsideration after changes were made to the proposed rule and it was disapproved again in April 2018. That same month the MPCA formally withdrew the proposed rule. Following two vetoed sulfate wild rice water quality standard-related bills, the Minnesota Governor established a Wild Rice Task Force by Executive Order in May 2018 that is charged with providingprovided recommendations to the Governor’s Office on wild rice restoration and regulation. Currently, theThe existing water quality standard thatfor wild rice has not been applied to any of our discharge permits or enforced in decades, remains; and it may be unenforceable because of legislation and because the water bodies to which the existing standard applies have never been identified specifically in rule, nor are there criteria for identifying them. The MPCA is complying with the legislation that prohibits enforcement of the water quality standard until the obsolete standard is updated based on modern science. For these reasons, the impact of the proposed wild rice water quality standard to usour Minnesota iron ore mining and pelletizing operations is not estimable at this time, but it could have an adverse material impact if we are required to significantly reduce sulfate in our discharges.
Conductivity
Conductivity, the measurement of water’s ability to conduct electricity, is a surrogate parameter that generally increases as the amount of dissolved minerals in water increases. In 2011, the EPA issued A Field-Based Aquatic Life Benchmark for Conductivity in Central Appalachian Streams, which established a recommended conductivity benchmark of 300 µS/cm for the region. The issuance of a benchmark outside of the established rulemaking process was subsequently the subject of litigation in 2012 where the court ruled the benchmark is nothing more than a non-binding suggestion. Three years later in Ohio Valley Environmental Coalition, et al. v. Elk Run Coal Co., et al., 3:12-cv-00785 (S.D. W. Va.), a judicial decision held that levels of conductivity higher than the EPA’s benchmark constituted a violation of the state’s narrative water quality standards, and were unsupported by science and contrary to decisions previously made by the West Virginia Department of Environmental Protection and the West Virginia Supreme Court. In 2015, a group filed a petition with EPA Region 5 alleging that Minnesota was failing to implement properly the state NPDES program, and one of the various allegations asserted that MPCA should be assessing compliance with the state’s narrative water quality standard against the EPA’s conductivity benchmark for the Central Appalachian region. In December 2015, the EPA provided MPCA a draft of the Protocol for Responding to Issues Related to Permitting and Enforcement which indicated that EPA staff would review available scientific basis in peer-reviewed literature as well as promulgated standards. In February 2016, EPA's Office of Research and Development endorsed use of the Field-Based Conductivity Benchmark in northeast Minnesota indicating that a value of 320 µS/cm was appropriate to protect aquatic life. In December 2016, EPA issued a notice soliciting public comments on its draft document, Field-Based Methods for Developing Aquatic Life Criteria for Specific Conductivity. According to EPA, once this document is final, states and authorized tribes located in any region of the country may use the methods to develop field-based specific conductivity criteria for adoption into water quality standards. In April 2017, comments were submitted by our trade associations providing objective evidence indicating the draft methodology was scientifically flawed and unfit for promulgation. Adoption of this methodology is not certain due to significant concerns with respect to the scientific validity of the proposed method, which is now under intense review by scientists working for various trade associations. Because the outcome of the Region 5 Petition is uncertain and the proposed Field-Based Methods for Developing Aquatic Life Criteria for Specific Conductivity is only draft guidance at this time, the exact nature and certainty of the potential risk to us cannot be predicted; however, direct application of the 320 µS/cm benchmark to our Minnesota-based assets may have a material adverse impact if the conductivity benchmark is applied to our NPDES permits.
Definition of “Waters of the United States” Under the Clean Water Act
In June 2015, the EPA and Army Corps of Engineers promulgated the rule, “Definition of ‘Waters of the United States’ Under the Clean Water Act,” which attempted to add clarity to which waters are jurisdictional under the federal Clean Water Act; and applied to all Clean Water Act programs, including certain permitting programs, spill prevention programs and a state certification process. It has remained unclear how the federal and state agencies will implement and enforce this final rule, and the rule has been stayed in several states. The regulation may expand EPA’s authority under the Clean Water Act to many traditionally unregulated mine features such as mine pits, pit lakes, on-site ditches, water retention structures, and tailings basins creating a new burden on our facilities. This could be further interpreted to add questionable regulatory authority over the groundwater connections between these features and nearby traditionally navigable waters.
The “Executive Order on Restoring the Rule of Law, Federalism, and Economic Growth by Reviewing the ‘Waters of the United States’ Rule” ("Executive Order") was signed by the President in February 2017. This Executive Order instructs EPA and the Army Corps of Engineers to review the Clean Water Rule and “publish for notice and comment a proposed rule rescinding or revising the rule.” Accordingly, EPA and Army Corps of Engineers signed in December 2018 a proposed Revised Definition of "Waters of the United States" rule. The proposed rule will have a sixty-day comment period after publication in the Federal Register. The rule as proposed is not expected to have a material negative impact to our business. We are actively participating in the rulemaking and will continue assessing the potential impacts to our operations.
Selenium Discharge Regulation
In Michigan, the Empire and Tilden mines have implemented compliance plans to manage selenium according to the permit conditions. Empire and Tilden submitted the first permit-required Selenium Storm Water Management Plan to the Michigan Department of Environmental Quality ("MDEQ") in December 2011 and have updated it annually as required. The Selenium Storm Water Management Plans have outlined the activities that have been undertaken to address selenium in storm water discharges from our Michigan operations including an assessment of potential impacts to surface and groundwater. The remaining infrastructure needed for implementationmanagement of the storm water collection and conveyance systemselenium in stormwater will likely be completed in 2020.2021. A storm water treatment system for both facilities is anticipated sometime before 2028. As of December 31, 2018,2020, included within our Empire asset retirement obligation is a discounted liability of approximately $85$100 million, which includes the estimated costs associated with the construction of Empire's portion of the required infrastructure and expected future operating costs of the treatment facilities. Additionally, included within our Tilden future capital plan is approximately $25$20 million for the construction of Tilden's portion of the required infrastructure. We are continuing to assess and develop cost effective and sustainable treatment technologies.
In July 2016, the EPA published new selenium fish tissue limits and lower lentic and lotic water column concentration criteria, which may someday increase the cost for treatment should MDEQEGLE adopt these new standards in lieu of the existing limits established underrequired by the Great Lakes Water Quality Initiative. Accordingly, we cannot reasonably estimate the timing or long-term impact of the water quality criteria to our business.
Mercury TMDL and Minnesota Taconite Mercury Reduction Strategy
Since the 1990’s the taconite industry has voluntarily reduced and removed mercury products and supported development of mercury emission reduction technology. While TMDL regulations are contained in the Clean Water Act, Minnesota developed in 2007 a Statewide Mercury TMDL which set an objective for 93% mercury air emission reductions from 1990 levels for sources within Minnesota. The State of Minnesota has acknowledged that approximately 90% of the mercury entering the state’s airshed is from other national and international sources.
In September 2014, Minnesota promulgated the Mercury Air Emissions Reporting and Reduction Rules mandating mercury air emissions reporting and reductions from certain sources, including taconite facilities. The rule is applicable to all of our Minnesota iron mining and pelletizing operations and required submittal of a Mercury Reduction Plan to the MPCA by the end of 2018 with plan implementation requirements becoming effective on January 1, 2025. In the Mercury Reduction Plan, facilities must evaluateevaluated if available control technologies can technically achieve a 72% mercury reduction rate. If available control technologies cannot technically achieve a 72% mercury reduction rate, the facilities must propose alternative mercury reduction measures. One of the main tenets agreed upon for evaluating potential mercury reduction technologies during TMDL implementation and 2014 rule development proceedings was that the selected technology must meet the following “Adaptive Management Criteria”: the technology must be technically feasible; must be economically feasible; must not impact pellet quality; and must not cause excessive corrosion in the indurating furnaces or air pollution control equipment.
The Mercury Reduction Plans for Cliffs’our Minnesota facilities were submitted to the MPCA in December 20182018.In 2020, the MPCA provided comments on the plans and are currently being reviewed by the MPCA.
we responded in a timely manner. There is currently no proven technology to cost effectively reduce mercury emissions from taconite furnaces to achieve the target level oftargeted 72% reduction rate, while satisfying all four Adaptive Management Criteria. The Mercury Reduction Plans that were submitted to the MPCA include documentation that describes the results of detailed engineering analysis and research testing on potential technologies to support this determination. The results of this analysis will continue to guide further dialogue with the MPCA. Potential impacts to us are not estimable at this time because the submittedrevised Mercury Reduction Plans and additional technical information are currently being reviewed by the MPCA.
Climate Change and GHG Regulation
With the complexities and uncertainties associated with the U.S. and global navigation of the climate change issue as a whole, one of our potentially significant risks for the future is mandatory carbon pricing obligations. Policymakers are in the design process of carbon regulation at the state, regional, national and international levels. The current regulatory patchwork of carbon compliance schemes presents a challenge for multi-facility entities to identify their near-term risks. Amplifying the uncertainty, the dynamic forward outlook for carbon pricing obligations presents a challenge to large industrial companies to assess the long-term net impacts of carbon compliance costs on their operations. Our exposure on this issue includes both the direct and indirect financial risks associated with the regulation of GHG emissions, as well as potential physical risks associated with climate change adaption.adaptation. We are continuing to review the physical risks related to climate change utilizing our formal ERM process.change. As an energy-intensive business, our GHG emissions inventory includes a broad range of emissions sources, such as iron ore furnaces and kilns, diesel mining equipment, and our wholly owned Silver Bay power generation plant,integrated steelmaking facilities, among others. As such, our most significant regulatory risks are: (1) the costs associated with on-site emissions levels (direct impacts), and (2) indirect costs passed through to us from electrical and fuel suppliers (indirect impacts).
Internationally, mechanisms to reduce emissions are being implemented in various countries, with differing designs and stringency, according to resources, economic structure and politics. We expect that momentumThe Paris Agreement to extend carbon regulation will continuereduce global GHG emissions and limit global temperature increases to 2 degrees Celsius became effective in November 2016 with implementation196 signatory countries. On January 20, 2021, President Biden signed an executive order triggering the 30-day process of rejoining the Paris climate agreement that was adopted in 2015,Agreement, beginning the aimprocess of which isa pledge to keepreduce U.S. GHG emissions.During the increase in global average temperatureObama Administration, the U.S. became a signatory to below two degrees Celsius. the Paris Agreement with a pledge to reduce its GHG emissions by 26-28% from 2005 levels by 2025. Continued political attention to issues concerning climate change, the role of human activity in it and potential mitigation through regulation may have a material impact on our customer base, operations and financial results in the future.
In the U.S., future federal and/or state carbon regulation potentially presents a significantly greater impact to our operations. To date, the U.S. Congress has not legislated carbon constraints. In the absence of comprehensive federal carbon legislation, numerous state, regional and federal regulatory initiatives are under development or are becoming effective, thereby creating a disjointed approach to GHG control and potential carbon pricing impacts. In May 2010, the EPA promulgated the GHG Tailoring Rule establishing a mechanism for regulating GHG emissions from facilities through the Prevention of Significant Deterioration permitting program under the Clean Air Act. Under the GHG Tailoring Rule, as modified by a 2014 U.S. Supreme Court decision upholding some components of the rule, new projects that increase GHG emissions by a significant amount (generally more than 75,000 long tons of CO2 emissions per year) and significantly increase emissions of at least one non-GHG criteria pollutant are subjectWe intend to the Prevention of Significant Deterioration requirements, including the installation of best available control technology. We do not expect the Tailoring Rule provision to have a material adverse effect on our businessremain active in the near termdiscussions related to legislative and we cannot reliably estimateregulatory changes at the long-term impactfederal and state levels.
In June 2013, President Obama issued a memorandum directing EPA to develop carbon emission standards for both new and existing power plants under the Clean Air Act's New Source Performance Standards ("NSPS"). In October 2015, EPA promulgated a CPP which consists of NSPS regulating carbon dioxide from existing power plants at a level of approximately 32% below 2005 levels by 2030. The CPP would not regulate combined heat and power generating facilities such as at Northshore's Silver Bay Power. The CPP directed states to submit SIPs to EPA by September 2016, but during February 2016, the U.S. Supreme Court stayed the CPP immediately halting implementation. In March 2017, President Trump signed the Energy Independence Executive Order which called for, among other things, a review of the CPP and, if appropriate, reconsideration proceedings to suspend, revise, or rescind the rule. On the same day, Administrator Pruitt signed a notice indicating EPA’s intent to review and, if appropriate, to propose to revise or rescind the CPP. The U.S. Court of Appeals for the D.C. Circuit has been holding CPP litigation in abeyance since April 2017. During October 2017, following a review as directed by President Trump’s Energy Independence Executive Order, the EPA proposed a rule to repeal the CPP and accepted comments on the proposed rule until mid-January 2018. The ultimate outcome of these carbon emission standards is not expected in the near term.
Due to the EPA's Tailoring Rule and potential patchwork of federal, state or regional carbon restriction schemes, our business and customer base could suffer negative financial impacts over time as a result of increased energy, environmental and other costs to comply with the limitations that would be imposed on GHG emissions. We believe our exposure can be reduced substantially by numerous factors, including currently contemplated regulatory flexibility mechanisms, such as allowance allocations, fixed process emissions exemptions, offsets and international provisions; emissions reduction opportunities, including energy efficiency, biofuels and fuel flexibility; and business opportunities associated with pursuing combined heat and power partnerships and new products, including DR-grade pellets, HBI, fluxed pellets and other efficiency-improving technologies.
We have worked proactively to develop a comprehensive, enterprise-wide GHG management strategy aimed at considering all significant aspects associated with GHG initiatives to plan effectively for and manage climate change issues, including risks and opportunities as they relate to the environment; stakeholders, including shareholders and the public; legislative and regulatory developments; operations; products and markets.
Regional Haze FIP Rule
In June 2005, the EPA finalized amendments to its regional haze rules. The rules that require states to establish goals and emission reduction strategies for improving visibility in all Class I national parks and wilderness areas to natural background levels by 2064. Among the states with Class I areas are Michigan and Minnesota, in which we currently own mining operations, and manage miningIndiana, in which we own steelmaking operations. The first phase of the regional haze rule required analysis and installation of Best Available Retrofit Technology ("BART")BART on eligible emission sources and incorporation of BART and associated emission limits into SIPs.
EPA disapproved Minnesota's and Michigan's BART SIPs for taconite furnaces and instead promulgated a Taconite Regional Haze FIP in February 2013. We along with other stakeholders, petitioned the Eighth Circuit Court of Appeals for a review of the FIP and in May 2013, we filed a joint motion for stay of the 2013 FIP, which was granted in June 2013. We along with the other stakeholders, reached a settlement agreement with EPA, to resolve certain items in the 2013 FIP. The settlement agreement, which was subsequently published in the Federal Register in January 2015 and fully executed in April 2015, prompted EPA to grant partial reconsideration of the 2013 FIP in July 2015. Subsequently, EPA published a FIP revision final rule to implement components of the settlement agreement in April 2016, with an effective date of May 12, 2016. We believe the 2016 Regional Haze FIP reflects progress toward a more technically and economically feasible regional haze implementation plan. In November 2016, the Eighth Circuit Court of Appeals terminated the June 2013 stay and extended the deadlines in the original 2013 FIP. Cost estimates associated with implementation of the 2013 and 2016 FIPs are reflected in our five-year capital plan.
Due to inconsistencies in language describing the procedures for calculating NOxNOx emission limits between the settlement agreement and the 2016 FIP final rule, we jointly filed a Petition for Reconsideration and Petition for Judicial Review in June 2016. We have been working toward a settlement agreement with EPA to resolve the outstanding issue with the emission limit calculation method and anticipate resolution of the issue in 2019.2021. The outcome of this proceeding is not expected to have a material adverse impact on us.
In 2020, the states began a second decadal review, which examined if additional technological controls are warranted for certain sources. The states are required to submit their updated Regional Haze SIPs by July 2021. At this time, we do not expect any state will require additional emission control requirements on our operations. We will review and comment on SIPs as necessary in the business.states in which we operate.
NO2Conductivity
Conductivity, the measurement of water’s ability to conduct electricity, is a surrogate parameter that generally increases as the amount of dissolved minerals in water increases. In December 2016, EPA issued a notice soliciting public comments on its draft guidance, Field-Based Methods for Developing Aquatic Life Criteria for Specific Conductivity. In April 2017, comments were submitted by our trade associations providing objective evidence indicating the draft methodology was scientifically flawed and SO2 NAAQSunfit for promulgation. EPA confirmed in October 2019 that the 2016 draft guidance was rescinded in accordance with an August 2019 EPA memorandum regarding draft guidance documents and further expressed that EPA must update the science and subject future recommended methods or criteria for conductivity to peer review and public comment. Although the adoption of the previously proposed methodology is unlikely in the states, the Fond du Lac Band in Minnesota adopted certain conductivity criteria in 2020. We are assessing the impact of those criteria on our Minnesota iron ore mining and pelletizing operations and evaluating methods to challenge the criteria as a whole or on a site-by-site basis.
DuringDefinition of “Waters of the United States” Under the Clean Water Act
The EPA and Army Corps of Engineers published a final rule in October 2019 repealing the 2015 rule that was to become effective on December 23, 2019. On April 21, 2020, the EPA and the Department of the Army published the Navigable Waters Protection Rule in the Federal Register to finalize a revised definition of “waters of the United States” under the Clean Water Act. For the first time, the agencies have streamlined the definition so that it includes four simple categories of jurisdictional waters, provides clear exclusions for many water features that traditionally have not been regulated, and defines terms in the regulatory text that have never been defined before. The rule is on
appeal in various jurisdictions. The rule is not expected to have a material adverse effect on us, but we will continue to assess the potential impacts to our operations.
Regulation of Discharges to Groundwater
In general, states traditionally have regulated discharges of pollutants to groundwater through various programs such as wellhead protection programs and regulations related to remediation. In April 2020, the United States Supreme Court held in County of Maui v. Hawaiʻi Wildlife Fund that EPA (and delegated states) have jurisdiction under the NPDES program if the discharge to groundwater is the “functional equivalent” of a discharge to waters of the United States. Until now, the NPDES program has only regulated direct discharges to waters of the United States from point sources. EPA subsequently issued a guidance document on what the term “functional equivalent” means. Although we do not anticipate that broadening EPA jurisdiction over groundwater discharges will materially adversely affect our operations, the impact to our operations is not reasonably estimable at this time.
Raw Materials and Energy
Our steelmaking operations require iron ore, coke, coal, ferrous and carbon and stainless scrap, chrome, nickel and zinc as primary raw materials. We also consume natural gas, electricity, industrial gases and diesel fuel at our steelmaking and mining operations. As a vertically integrated steel company, we are able to internally supply a majority of our raw materials needed for our steelmaking operations. We also attempt to reduce the risk of future supply shortages and price volatility in other ways. If multi-year contracts are available in the marketplace for those raw materials that we cannot supply internally, we may use these contracts to secure sufficient supply to satisfy our key raw material needs. When multi-year contracts are not available, or are not available on acceptable terms, we purchase the remainder of our raw materials needs under annual contracts or conduct spot purchases. We also regularly evaluate alternative sources and substitute materials. Additionally, we may hedge portions of our energy and raw materials purchases to reduce volatility and risk. We believe that we have secured, or will be able to secure, adequate supply to fulfill our raw materials and energy requirements for 2021.
The raw materials needed to produce a ton of steel will fluctuate based upon the specifications of the final steel products, the quality of raw materials and, to a lesser extent, differences among steel production equipment. For example, generally, in our integrated steelmaking facilities, we consume approximately 1.4 net tons of coal to produce one net ton of coke. The process to produce one ton of raw steel generally requires approximately 1.4 net tons of iron ore pellets, 0.4 net tons of coke and 0.3 net tons of steel scrap. At normal operating levels, we also consume approximately 6 MMBtu’s of natural gas per net ton produced. Additionally, on average, our EAF's require 1.1 net tons of ferrous or stainless scrap to produce one net ton of high quality steel. We consume approximately 420 kilowatt-hours of electricity per net ton of steel produced. While these estimated consumption amounts are presented to give a general sense of raw material and energy consumption used in our steel production, substantial variations may occur.
Our investment into HBI production provides us access, when needed, to clean iron units in order to make advanced steel and stainless products. This access to our own production provides us flexibility and allows us to avoid the risks and carbon footprints of imported iron substitutes. Iron substitutes imported into the U.S. are traditionally sourced from regions of the world that have historically experienced greater political turmoil and have lower pollution standards than the U.S. Our investment demonstrates our raw material and company strategy in responsibly managing the risks of pricing, availability and overall carbon footprint of our critical inputs.
We typically purchase ferrous and stainless steel scrap, natural gas, a substantial portion of our electricity and most other raw materials at prevailing market prices, which may fluctuate with market supply and demand.
Iron Ore
We own or co-own five active iron ore mines in Minnesota and Michigan. Based on our ownership in these mines, our share of annual rated iron ore production capacity is approximately 28.0 million long tons, which supplies all of the iron ore needed for our steelmaking operations. Refer to Part I - Item 2. Properties for additional information.
Coke and Coal
We own five cokemaking facilities, including two coke batteries located within our steelmaking facilities. These facilities currently provide over half of 2010, EPA promulgated rulesthe coke requirements for our steelmaking operations and have an annual rated capacity of approximately 3.9 million tons. Additionally, we have coke supply agreements with suppliers that required each stateprovide our remaining requirements. Our purchases of coke are made under annual or multi-year agreements
with periodic price adjustments. We typically purchase most of our metallurgical coal under annual fixed-price agreements. We have annual rated metallurgical coal production capacity of 2.3 million net tons from our Princeton mine, which supplies a portion of our metallurgical coal needs. We believe there are adequate external supplies of coke and coal available at competitive market prices to usemeet our needs. Refer to Part I - Item 2. Properties for additional information.
Steel Scrap and Other Materials
Generally, approximately 43% of our steel scrap requirements are generated internally through normal operations. We believe that supplies of steel scrap, chrome, nickel and zinc adequate to meet the needs of our steelmaking operations are readily available from outside sources at competitive market prices.
Energy
We consume a large amount of natural gas, electricity, industrial gases and diesel fuel, which are significant costs to our operations. The majority of our energy requirements are purchased from outside sources. Access to long-term, low cost sources of energy in various forms is critically important to our operations.
Natural gas is procured for our operations utilizing a combination of air quality monitoringlong-term, annual, quarterly, monthly and computer modelingspot contracts from various suppliers at market-based pricing. We believe access to determine each state's attainment classification status against new one-hour NO2low-cost and SO2 NAAQS. During the third quarterreliable sources of 2011, the EPA issued guidancenatural gas is available to the regulated community on conducting refined air quality dispersion modeling and implementing the new NO2 and SO2 standards. In 2012, Minnesota issued Administrative Orders ("AOs") requiring taconite facilities to conduct modeling to demonstrate compliance with the NO2 and SO2 NAAQS pursuant to the Taconite Regional Haze SIP Long Term Strategy ("LTS"). Compliance with the LTS modeling demonstrations was originally setmeet our operations’ requirements.
We purchase electricity for June 2017, but Minnesota has not advanced work on its 2012 AOs and is expected to remove NAAQS modeling obligations under the LTS in light of reduction in haze emissions associated with implementation of the taconite Regional Haze FIP regulations.
Allall of our operations in Minnesota and Michigan are expectedeither regulated or deregulated markets. Due to be in attainment for NO2 and SO2 NAAQS without incurring additional capital investment. Whilethe distinct nature of these markets, we will continueprocure electricity through either long-term or annual contracts. Some operations also use self-generated coke oven gas and/or blast furnace gas to monitor these developments and assess potential impacts, we do not anticipate further capital investments will be necessaryproduce electricity, which reduces our need to address NO2 and SO2 NAAQS requirements at this time.
CERCLA 108(b)
In December 2016, EPA published a proposed amendment to CERCLA section 108(b) which is focused on developing financial assurance for managing hazardous substances in the hardrock mining industry. EPA had a court-mandated deadline for publication of the final rule by December 1, 2017. The proposed rule would have required hardrock mining facilities to calculate their level of financial responsibility based on a formula included in the rule, secure an instrument or otherwise self-insure for the calculated amount, demonstrate to EPA the proof of the security, and maintain the security until EPA releases facilitiespurchase electricity from the CERCLA 108(b) regulations. The iron mining industry notified EPA of several errors upon which EPA drafted the rule, including a mistaken reliance on reporting data from a wholly different industry sector (iron and steel toxic release inventory reporting).external sources. We also participatedclosely monitor developments at the state and federal levels that could impact electricity availability or cost and incorporate such changes into our electricity supply strategy in developing industry specific and national trade association comments and advocating directly with EPA and the White House Officeorder to maintain reliable, low-cost supply. We believe there is an adequate supply of Management & Budget to address this and other errors with goals of exempting iron ore mining from CERCLA 108(b) applicability and correcting other deficiencies with the proposed rule. On December 1, 2017 EPA signed a federal register notice of EPA's decision not to issue final regulations for financial responsibility requirements for the hardrock mining industry under section 108(b) of CERCLA because EPA determined that the risks associated with these facilities' operations are addressed by existing federal and state programs and regulations and modern industry practices. In 2018, several environmental groups filed a challenge to EPA's decision to not issue a final rule. This challenge is anticipated to be decided by the courts during 2019. Cliffs is participating as part of the industry intervenor party via representation through the American Iron and Steel Institute and will continue to participate in and monitor the challenge as it proceeds.
Energy
Electricity
WEPC is the sole supplier of electric power to our Tilden mine. During April 2015, the Tilden mine executed a special electricity contract with WEPC. The term of the contract is through 2019. WEPC provides 170 megawatts ofcompetitively priced electricity to Tilden at special rates that are regulated by the MPSC. The pricing under this contract is generally fixed except Tilden is subject to frequent changes in WEPC's power supply adjustment factor. During August 2016, Tilden executed a new 20-year special contract with WEPC that is anticipated to start on June 1, 2019 and would replace the previous special contract.
Minnesota Power supplies electric power to the Hibbing and United Taconite mines. During September 2008, Hibbing finalized an agreement with terms from November 2008 through December 2015. The agreement was approved by the MPUC in 2009. The terms of the agreement included an automatic five-year extension that began January 2016. The United Taconite mine executed a new ten-year agreement with Minnesota Power that also included Northshore's Babbitt Mine. This agreement was finalized in May 2016 and was approved by the MPUC in November 2016.
Silver Bay Power, a wholly-owned subsidiary with a 115 megawatt power plant, is able to provide the majority of Northshore’s electrical energyfulfill our requirements. Silver Bay Power has an interconnection agreement with Minnesota Power for backup power when excess generation is necessary. In May 2016, Silver Bay Power entered into an agreement with Minnesota Power to purchase roughly half of Northshore's electricity needs from Minnesota Power through 2019. Beginning January 1, 2020, Silver Bay Power will purchase 100% of the electricity requirements of Northshore from Minnesota Power and Silver Bay Power plans to idle both of its generating units except under certain circumstances.
Process and Diesel Fuel
We purchase industrial gases under long-term contracts with various suppliers. We believe we have a long-term contract providing for the transportaccess to adequate supplies of natural gas on the Northern Natural Gas Pipelineindustrial gases to meet our needs.
We predominantly purchase diesel fuel for our Mining and Pelletizing segment operations. Tilden has the capabilitymining operations under long-term contracts with various suppliers.We believe we have access to adequate supplies of burning natural gas, coal or, to a lesser extent, oil. Hibbing and Northshore have the capability to burn natural gas and oil. United Taconite has the ability to burn coal, natural gas and petroleum coke. Consistent with 2018, we expect that during 2019 our Mining and Pelletizing segment operations will utilize both natural gas and coal to heat furnaces and produce power at our Silver Bay Power facility.
All of our mines utilize diesel fuel mainly for our mobile fleet. Thompson Gas supplies diesel fuel to all ofmeet our Mining and Pelletizing segment locations from various refineries in the Midwest. Our contracts with Thompson Gas expired at the end of 2018, and the parties are negotiating extensions on these supply agreements.needs.
EmployeesHuman Capital
As of December 31, 2018,2020, we hademployed approximately 25,000 people. Approximately 24,000 were employed in the U.S., with the remainder employed in Ontario, Canada. Approximately 24,000 employees were employed at production facilities, with the balance employed in corporate support roles. The vast majority of our approximately 20,000 hourly employees were subject to collective bargaining agreements (approximately 18,500) with various labor unions. Overall, we have good relations with our workforce and the labor unions that represent our hourly employees.
We believe that our future success largely depends upon our continued ability to attract and retain a totalhighly skilled workforce. We provide our employees with competitive salaries, incentive-based bonus programs that provide above-market compensation opportunities when the Company performs well, development programs that enable continued learning and growth, and a robust benefit package that promotes well-being across all aspects of 2,926their lives, including health care, retirement planning and paid time off. In addition to these programs, we have used targeted, equity-based grants with vesting conditions to facilitate retention of key personnel. These tools have enabled us to increase the retention of key personnel, including our corporate and site leadership teams and critical technical talent.
The success of our business is fundamentally connected to the well-being of our people. Accordingly, we are committed to the health, safety and wellness of our employees.
|
| | | | | | | | | |
| | | 2018 | | 2017 | | 2016 |
Mining and Pelletizing segment - Salaried1 | | 514 |
| | 503 |
| | 485 |
|
Mining and Pelletizing segment - Hourly1,3 | | 2,208 |
| | 2,182 |
| | 2,189 |
|
| Metallics segment - Salaried | | 26 |
| | 6 |
| | — |
|
Discontinued Operations - Salaried2 | | 2 |
| | 79 |
| | 86 |
|
| Corporate & Support Services - Salaried | | 176 |
| | 168 |
| | 167 |
|
| Total | | 2,926 |
| | 2,938 |
| | 2,927 |
|
| | | | | | | |
1 Includes our employees and our employees of the joint venture contained within our Mining and Pelletizing segment. |
2 Excludes contracted mining employees. |
3 Excludes employees considered on lay-off status as a result of an indefinite or temporary idle. |
Hourly We provide our employees and their families with access to a variety of innovative, flexible and convenient health and wellness programs, including benefits that provide protection and security so they can have peace of mind concerning events that may require time away from work or that impact their financial well-being; that support their physical and mental health by providing tools and resources to help them improve or maintain their health and encourage engagement in healthy behaviors; and that offer choice where possible so they can customize their benefits to meet their needs and the needs of their families. In response to the COVID-19 pandemic, we implemented significant changes that we determined were in the best interest of our employees, as well as the communities in which we operate, and which comply with government regulations. This includes having all employees who could perform their work remotely work from home, while implementing numerous safety measures for employees continuing critical on-site work at our Michigan and Minnesota iron ore mining operations, excluding Northshore, are represented by the USW and are covered by labor agreements between the USW and our various operating entities. These labor agreements cover approximately 1,800 active USW-represented employees at our Empire and Tilden mines in Michigan, and our United Taconite and Hibbing mines in Minnesota and are valid through September 30, 2022. Employees at our Northshore operations are not represented by a union and are not, therefore, covered by a collective bargaining agreement.operations.
Hourly employees at our LS&I railroads in Michigan are represented by seven unions covering approximately 100 employees. These labor agreements are covered by the Railway Labor Act and are subject to reopening for bargaining in 2020.
Salaried employees at our Mining and Pelletizing segment, Metallics segment, Corporate and Support Services are not represented by a union and are not, therefore, covered by collective bargaining agreements.Safety
SafetySafe production is our primary core value as we continue toward achieving a zero injury culture at all of our facilities. We constantly monitor measure and track our safety performance and make continuous improvements to affect change. Best practices and incident learnings are shared globally to ensure each mine sitefacility can effectively administer ourthe most effective policies and procedures for enhanced workplace safety. Progress toward achieving our objectives is accomplished through a focus on proactive sustainability initiatives, and results are measured against established industry and company benchmarks, including our company-wide Total Reportable Incident Rate ("TRIR").Rate. During 2018,2020, our TRIRTotal Reportable Incident Rate (including contractors) was 1.200.92 per 200,000 man-hourshours worked.
Refer to Exhibit95 Mine Safety Disclosures (filed herewith) for mine safety information required in accordance with Section 1503(a) of the Dodd-Frank Act.
Available Information
Our headquarters are located at 200 Public Square, Suite 3300, Cleveland, Ohio 44114-2315, and our telephone number is (216) 694-5700. We are subject to the reporting requirements of the Exchange Act and its rules and regulations. The Exchange Act requires us to file reports, proxy statements and other information with the SEC.
The SEC maintains a website that contains reports, proxy statements and other information regarding issuers that file electronically with the SEC. These materials may be obtained electronically by accessing the SEC’s home page at www.sec.gov.
We use our website, www.clevelandcliffs.com,, as a channel for routine distribution of important information, including news releases, investor presentations and financial information. We also make available, free of charge on our website, our Annual Report on Form 10-K, Quarterly Reports on Form 10-Q, Current Reports on Form 8-K and amendments to these reports filed or furnished pursuant to Section 13(a) or 15(d) of the Exchange Act, as soon as reasonably practicable after we electronically file these documents with, or furnish them to, the SEC. In addition, our website allows investors and other interested persons to sign up to receive automatic email alerts when we post news releases and financial information on our website.
We also make available, free of charge, on our website, the charters of the Audit Committee, Strategy and Sustainability Committee, Governance and Nominating Committee and Compensation and Organization Committee as well as the Corporate Governance Guidelines and the Code of Business Conduct and Ethics adopted by our Board of Directors. These documents are available through our investor relations page on our website at www.clevelandcliffs.com. The SEC filings are available by selecting “Financial Information” and then “SEC Filings,” and corporate governance materials are available by selecting “Corporate Governance” for the Board Committee Charters, operational governance guidelines and the Code of Business Conduct and Ethics.
References to our website or the SEC’s website do not constitute incorporation by reference of the information contained on such websites, and such information is not part of this Annual Report on Form 10-K.
Copies of the above-referenced information are also available, free of charge, by calling (216) 694-5700 or upon written request to:
Cleveland-Cliffs Inc.
Investor Relations
200 Public Square, Suite 3300
Cleveland, OH 44114-2315
INFORMATION ABOUT OUR EXECUTIVE OFFICERS OF THE REGISTRANT
Following are the names, ages and positions of the executive officers of the Company as of February 8, 2019.26, 2021. Unless otherwise noted, all positions indicated are or were held with Cleveland-Cliffs Inc.
|
| | | | | | | |
| Name | Age | Position(s) Held |
| Lourenco Goncalves | 6163 | Chairman, President and Chief Executive Officer (August 2014 – present); and Chairman, President and Chief Executive Officer of Metals USA Holdings Corp., anAmerican manufacturer and processor of steel and other metals (May 2006 – April2013). |
| Clifford T. Smith | 5961 | Executive Vice President, Chief Operating Officer (January 2019 – present); Executive Vice President, Business Development (April 2015 – December 2018); and January 2019). |
| Keith A. Koci | 56 | Executive Vice President, Seaborne Iron Ore (January 2014Chief Financial Officer (February 2019 – April 2015)present); and Senior Vice President and Chief Financial Officer, Metals USA Holdings Corp. (2013 – February 2019). |
| Terry G. Fedor | 5456 | Executive Vice President, Chief Operating Officer, Steel Mills (March 2020 – present); Executive Vice President, Operations (February 2019 – March 2020); and Executive Vice President, U.S. Iron Ore (January 2014 – present); and VicePresident, U.S. Iron Ore Operations (February 2011 – January 2014)2019). |
Timothy K. FlanaganTraci L. Forrester | 4149 | Executive Vice President, Chief Financial OfficerBusiness Development (May 2019 – present); Vice President (January 2018 – May 2019); Deputy General Counsel & Assistant Secretary (January 2017 – present); Treasurer (March 2016– December 2017)May 2019); and Vice President, Corporate Controller and Chief Accounting Officer (March 2012Assistant General Counsel (August 2013 – December 2016)January 2017). |
| James D. Graham | 5355 | Executive Vice President (November 2014 – present); Chief Legal Officer (March 2013 – present); and Secretary (March 2014 – present); and Vice President (January 2011 – October 2014). |
| Maurice D. Harapiak | 5759 | Executive Vice President, Human Resources (March 2014 – present); and Chief Administration Officer (January 2018 – present); and Regional Director, Human Resources - Barrick Gold of North America, a gold mining company (November2011 – March 2014). |
Terrence R. MeeKimberly A. Floriani | 4938 | Executive Vice President, Global Commercial (October 2014 - present); and Vice President, Global Iron Ore Sales (February 2014 – October 2014). |
R. Christopher Cebula | 48 | Vice President, Corporate Controller & Chief Accounting Officer (February 2017(April 2020 – present); and Senior Director, CorporateAccounting & Reporting (August 2015 – April 2020); Manager, Financial Planning & Analysis (April 2013Reporting (January 2012 – February 2017)August 2015). |
All executive officers serve at the pleasure of the Board. There are no arrangements or understandings between any executive officer and any other person pursuant to which an executive officer was selected to be an officer of the Company. There is no family relationship between any of our executive officers, or between any of our executive officers and any of our directors.
An investment in our common shares or other securities is subject to riskrisks inherent toin our businessbusinesses and our industry.the industries in which we operate. Described below are certain risks and uncertainties, the occurrences of which could have a material adverse effect on us. The risks and uncertainties described below include known material risks that we face currently, but our material risks are constantly evolving and the below descriptions may not include future risks that are not presently known, that are not currently believed to be material or that are common to all businesses. Although we have extensive risk management policies, practices and procedures in place that are aimed to mitigate these risks, the occurrence of these uncertainties may nevertheless impair our business operations and adversely affect the actual outcome of matters as to which forward-looking statements are made. This report is qualified in its entirety by these risk factors. Before making an investment decision, youinvestors should consider carefully all of the risks described below together with the other information included in this report. The risksreport and uncertainties described below include known material risks thatthe other reports we face currently. Although we have extensive risk management policies, practices and procedures aimed to mitigate these risks, uncertainties may nevertheless impair our business operation. This report is qualified in its entirety by these factors.file with the SEC.
Our ERM function provides a framework for management's consideration of risk when making strategic, financial, operational and/or project decisions. The framework is based on ISO 31000, an internationally recognized risk management standard. Management uses a consistent methodology to identify and assess risks, determine and implement risk mitigation actions, and monitor and communicate information about the Company's key risks. Through these processes, we havehas identified sixseveral categories of material risk that we are subject to:to, including: (I) economic and market, (II) regulatory, (III) financial, (IV) operational, (V) development and sustainability and (VI) human capital. The followingAlthough the risks are organized by these headings, and each risk factorsis discussed separately, many are presented according to these key risk categories.interrelated.
| |
I.
| I. ECONOMIC AND MARKET RISKS |
Uncertainty or weaknesses in global economic conditions, reduced economic growth in China and oversupply of iron ore and excess steel or imported products could affect adversely our business.
The world priceongoing COVID-19 pandemic has had, and is expected to continue to have, an adverse impact on our businesses.
The ongoing COVID-19 pandemic is continuing to impact countries, communities, supply chains and markets. Responses by individuals, governments and businesses to the COVID-19 pandemic and efforts to reduce its spread, including quarantines, travel restrictions, business closures, and mandatory stay-at-home or work-from-home orders, have led to significant disruptions to overall business and economic activity. While vaccines are now being manufactured and distributed, it is currently unknown when or whether the economy will return to pre-pandemic levels of iron ore is influenced stronglyconsumer and business activity.
During 2020, the COVID-19 pandemic adversely affected our businesses by global economic conditions, including international demand and supply for iron ore products.temporarily curtailing certain of our end markets. In particular, the current levelautomotive industry, which we rely on directly and indirectly for a significant amount of international demandour sales, was severely disrupted during the first half of 2020. The slowdown in the automotive industry led, in turn, to disruptions to our operations. For example, although our steel and mining operations are considered “essential” by the states in which we operate, certain of our mining and production facilities were idled for raw materials usedvarious periods during 2020 in steelresponse to the decrease in customer demand. While we were able to resume operations at many of these facilities later in 2020, we cannot predict whether any other production is driven largely by industrial growth in China. Uncertaintiesfacilities or weaknesses in global economic conditions, including the slowing economic growth rate in China, has resulted, and couldmines will experience disruptions in the future as a result in decreased demand forof adverse impacts of the COVID-19 pandemic.
In addition, the COVID-19 pandemic has heightened the risk that a significant portion of our productsworkforce and together with oversupplyon-site contractors will suffer illness or otherwise be unable to perform their ordinary work functions. While we instituted remote work policies where practical across our footprint, the safe and responsible operation of imported products, hasour production facilities often requires that workers be on-site. Accordingly, during 2020, we experienced direct and indirect workforce impacts from COVID-19 at many of our operations. We also may continueneed to lead to decreased prices, resultingreduce our workforce as a result of declines in lower revenue levels and decreasing margins, which have in the past and may in the future affect adversely our business caused by the COVID-19 pandemic, and negatively impact our financial results. We are notthere can be no assurance that we will be able to predict whetherrehire our workforce once our business has recovered. We may also experience supply chain disruptions or operational issues with our vendors, as our suppliers and contractors face similar challenges related to the global economic conditions will improve or worsen andCOVID-19 pandemic.
Because the impact of the COVID-19 pandemic continues to evolve, we cannot predict the full extent to which our businesses, results of operations, financial condition or liquidity will ultimately be impacted. To the extent the COVID-19 pandemic adversely affects our businesses, it may also have the effect of exacerbating many of the other risks described in this ‘‘Risk Factors’’ section, any of which could have a material adverse effect on our operations and the industry in general going forward.us.
The volatility of commodity prices, namelyincluding steel and iron ore, and steel, affects our ability to generate revenue, maintain stable cash flowflows and fund our operations, including growth and expansion projects.
As a mining company, ourOur profitability is dependent upon the priceprices of the commoditiessteel and iron ore products that we sell to our customers and the priceprices of the products our customers sell, namelysell. As an integrated producer of steel and iron ore, we experience direct impacts of steel price fluctuations through customer sales, as well as direct and indirect impacts of iron ore price fluctuations through third-party sales and the impacts that fluctuations in iron ore prices have on steel prices. The prices of steel and iron ore and steel have fluctuated significantly in the past and isare affected by factors beyond our control, including: steel inventories; changes in the productive capacity of U.S. domestic steel producers; international demand for raw materials used in steel production; rates of global economic growth, especially
construction and infrastructure activity that requires significant amounts of steel; changes in the levels of economic activity in the U.S., China, India, Europe and other industrialized or developing countries;economies; changes in China'sChina’s emissions policies and environmental compliance enforcement practices; uncertainties or weaknesses in global economic conditions such as the U.S. debt ceiling; changes in the production capacity, production rate and inventory levels of other steel producers and iron ore suppliers, especially as additional supply comes online or where there is a significant increase in imports of steel into the U.S. or Europe;suppliers; changes in trade laws; volumes of unfairly traded imports; imposition or termination of duties, tariffs, import and export controls and other trade barriers impacting the steel and iron ore markets; weather-related disruptions, infectious disease outbreaks, such as the COVID-19 pandemic, or natural disasters that may impact the global supply of steel or iron ore; and the proximity, capacity and cost of infrastructure and transportation.
Our earnings, therefore, may fluctuate with the prices of the commoditiesproducts we sell and of the products our customers sell. To the extent that the prices of steel and iron ore, and steel, including the average iron orehot-rolled coil steel price, coated and other specialty steel prices, the Platts 62% Price, pellet premiums and hot-rolled coil steel price,Platts international indexed freight rates, significantly decline for an extended period of time, whether due to the COVID-19 pandemic or otherwise, we may have to further revise our operating plans, including curtailing production, reducing operating costs and capital expenditures, and discontinuing certain exploration and development programs. We also may have to take impairments on our goodwill, intangible assets, long-lived assets and/or inventory. Sustained lower prices also could cause us to further reduce existing mineral reserves if certain reserves no longer can be economically mined or processed at prevailing prices. We may be unable to decrease our costs in an amount sufficient to offset reductions in revenues and may incur losses. These events could have a material adverse effect on us.
We sell a significant portion of our steel products to the automotive market and fluctuations or changes in the automotive market could adversely affect our business operations and financial performance.
For the full-year 2020, approximately 40% of AK Steel’s and ArcelorMittal USA's combined sales were to the automotive market. Beyond these direct sales to the automotive industry, we make additional sales to distributors and converters, which may ultimately resell some of that volume to the automotive market. In addition to the size of our exposure to the automotive industry, we face risks arising from our relative concentration of sales to certain specific automotive manufacturers, including several significant customers that idled certain automotive production facilities in 2020 in response to the COVID-19 pandemic. In addition, automotive production and sales are cyclical and sensitive to general economic conditions and other factors, including interest rates, consumer credit, and consumer spending and preferences, as well as the current COVID-19 pandemic. If automotive production and sales decline, our sales and shipments to the automotive market are likely to decline in a corresponding manner. Adverse impacts that we may sustain as a result include, without limitation, lower margins because of the need to sell our steel to less profitable customers and markets, higher fixed costs from lower steel production if we are unable to sell the same amount of steel to other customers and markets, and lower sales, shipments, pricing and margins generally as our competitors face similar challenges and compete vigorously in other markets that we serve. These adverse impacts would negatively affect our sales, financial results and cash flows. Additionally, the trend toward light weighting in the automotive industry, which requires lighter gauges of steel at higher strengths, could result in lower steel volumes required by that industry over time.
If steelmakers use methods other than blast furnace production to produceMoreover, despite our newly acquired position as the largest flat-rolled steel or use other inputs, or if their blast furnaces shut down or otherwise reduce production, the demand for our current iron ore products may decrease.
Demand for our iron ore productsproducer in North America, is determined by the operating ratescompetition for the blast furnaces of steel companies. However, not all finished steel is produced by blast furnaces; finished steel also may be produced by other methods that use scrap steel, pig iron, HBI and direct reduced iron. North Americanautomotive business has intensified in recent years, as steel producers also can produceand companies producing alternative materials have focused their efforts on capturing and/or expanding their market share of automotive business because of less favorable conditions in other markets for steel using imported iron ore, semi-finishedand other metals, including commodity products and steel productsfor use in the oil and gas markets. As a result, the potential exists that we may lose market share to existing or other lighter-weight steel alternatives, which eliminatesnew entrants or that automotive manufacturers will take advantage of the need for domestic iron ore. Future environmental restrictions on the use of blast furnacesintense competition among potential suppliers during annual contract renewal negotiations to pressure our pricing and margins in North America also may reduce our customers’ use of their blast furnaces. Maintenance of blast furnaces may require substantial capital expenditures and may cause prolonged outages, which may reduce demand for our pellets. Our customers may choose notorder to maintain or may not have the resources necessary to maintain, their blast furnaces. Ifexpand our customers use methods to produce steel that do not use iron ore pellets or if environmental or maintenance issues occur, demand for our current iron ore products may decrease,market share with them, which could negatively affect adversely our sales, margins, profitability and cash flows, which we anticipate will be somewhat mitigated by our production of HBI.
Due to economic conditions and volatility in commodity prices, or otherwise, our customers could approach us about modification of their supply agreements or fail to perform under such agreements, which could impact adversely our sales, margins, profitabilityfinancial results and cash flows.
Although we have long-term contractual commitments for a majorityGlobal steelmaking overcapacity, steel imports and oversupply of our sales, uncertainty in global economic conditions may impact adversely the ability of our customers to meet their obligations. As a result of such market volatility, our customers could approach us about modifying their supply agreements or fail to perform under such agreements. Considering our limited base of current and potential customers, any modifications to our sales agreements or customers' failures to perform under such agreements could impact adversely our sales, margins, profitability and cash flows. For example, of the potential customers in the North American integrated steel industry, one is in the final stages of reorganization proceedings, and certain others have experienced financial difficulties. A loss of sales to our existing customers could have a substantial negative impact on our sales, margins, profitability and cash flows. Other potential actions by our customers could result in additional contractual disputes and could ultimately require arbitration or litigation, either of which could be time consuming and costly. Any such disputes and/or failure to renew existing contracts on favorable terms could impact adversely our sales, margins, profitability and cash flows.
Capacity expansions and limited rationalization of supply capacity within the mining industryiron ore could lead to lower or more volatile global steel and iron ore prices, impacting our profitability.
Global growthSignificant global steel capacity and new or expanded production capacity in North America in recent years has caused and continues to cause capacity to exceed demand globally, as well as in our primary markets in North America. Although certain of our U.S. competitors temporarily shut down production capacity during the COVID-19 pandemic, a restart of previously idled capacity and the development of new capacity by our U.S. competitors has occurred in recent months and may occur in the future in connection with any economic recovery following the COVID-19 pandemic. In addition, foreign competitors have substantially increased their steel production capacity in the last few years and in some instances appear to have targeted the U.S. market for imports. Also, some foreign economies, such as China, have slowed relative to recent historical norms, resulting in an increased volume of steel
products that cannot be consumed by industries in those foreign steel producers’ own countries. The risk of even greater levels of imports may continue, depending upon foreign market and economic conditions, changes in trade agreements and treaties, laws, regulations or government policies affecting trade, the value of the U.S. dollar relative to other currencies and other variables beyond our control. A significant further increase in domestic steel capacity or foreign imports could adversely affect our sales, financial results and cash flows. In addition, recent increases in the market prices of iron ore demand, particularly from China, resulted inproducts could cause new producers to enter the market or existing producers to expand productive capacity. Excess iron ore suppliers expanding their production capacity over the past few years. The supply of iron ore increased due to these expansions. In the past, increasescombined with reduced global steel demand, including in production capacity along with actual reduced demand resulted in excess supply of iron ore and caused downward pressure on prices. A return to supply capacity expansionsChina, could lead to pricinglower iron ore prices, which would typically contribute to lower steel prices, as iron ore is a principal steelmaking raw material. Downward pressure which canon iron ore and/or steel prices could have an adverse effect on our results of operations, financial condition and profitability.
Severe financial hardship or bankruptcy of one or more of our major customers or key suppliers could adversely affect our business operations and financial performance.
Sales and operations of a majority of our customers are sensitive to general economic conditions, especially, with respect to our steel customers, as they affect the North American automotive, housing, construction, appliance, energy and other industries. Some of our customers are highly leveraged. If there is a significant weakening of current economic conditions, whether because of operational, cyclical or other issues, including the COVID-19 pandemic, it could impact significantly the creditworthiness of our customers and lead to other financial difficulties or even bankruptcy filings by our customers. Failure to receive payment from our customers for products that we have delivered could adversely affect our results of operations, financial condition and liquidity. The concentration of customers in a specific industry, such as the automotive industry, may increase our risk because of the likelihood that circumstances may affect multiple customers at the same time. For example, during the first half of 2020, the automotive industry was significantly disrupted by the COVID-19 pandemic, which concurrently adversely impacted multiple customers. Such events could cause us to experience lost sales or losses associated with the potential inability to collect all outstanding accounts receivable and reduced liquidity. Similarly, if our key suppliers face financial hardship or need to operate in bankruptcy, such suppliers could experience operational disruption or even face liquidation, which could result in our inability to secure replacement raw materials on a timely basis, or at all, or cause us to incur increased costs to do so. Such events could adversely impact our operations, financial results and cash flows.
II. REGULATORY RISKS
U.S. government actions on trade agreements and treaties, laws, regulations or policies affecting trade could lead to lower or more volatile global steel or iron ore prices, impacting our profitability.
In recent years, the U.S. government has altered its approach to international trade policy, both generally and with respect to matters directly and indirectly affecting the steel industry, including by undertaking certain unilateral actions affecting trade, renegotiating existing bilateral or multilateral trade agreements, and entering into new agreements or treaties with foreign countries. For example, in March 2018, the U.S. government issued a proclamation pursuant to Section 232 imposing a 25% tariff on imported steel that was being unfairly traded by certain foreign competitors at artificially low prices. In retaliation against the Section 232 tariffs, the European Union subsequently imposed its own tariffs against certain steel products and other goods imported from the U.S. Moreover, in light of the U.S. government leadership changes resulting from the November 2020 federal congressional and presidential elections, it is currently uncertain what changes, if any, the U.S. government may make to its recent tariff and trade policies and priorities. If, for example, the Section 232 tariffs are removed or substantially lessened, whether through legal challenge, legislation, executive action or otherwise, imports of foreign steel would likely increase and steel prices in the U.S. would likely fall, which could materially adversely affect our sales, financial results and cash flows.
In addition, during 2020, the USMCA was implemented among the U.S., Mexico and Canada in place of the North American Free Trade Agreement. Because all of our steel manufacturing facilities are located in North America and one of our principal markets is automotive manufacturing in North America, we believe that the USMCA has the potential to positively impact our business by incentivizing automakers and other manufacturers to increase manufacturing production in North America and to use North American steel. However, it is difficult to predict the short- and long-term implications of changes in trade policy and, therefore, whether the USMCA or other new or renegotiated trade agreements, treaties, laws, regulations or policies that may be implemented in connection with the recent U.S. government leadership changes, or otherwise, will have a beneficial or detrimental impact on our business and our customers’ and suppliers’ businesses. Adverse effects could occur directly from a disruption to trade and commercial transactions and/or indirectly by adversely affecting the U.S. economy or certain sectors of the economy, impacting demand for our customers’ products and, in turn, negatively affecting demand for our products. Important
links of the supply chain for some of our key customers, including automotive manufacturers, could be negatively impacted by the USMCA or other new or renegotiated trade agreements, treaties, laws, regulations or policies. Any of these actions and their direct and indirect impacts could materially adversely affect our sales, marginsfinancial results and profitability. We do not have control over corporate strategies implemented by other iron ore producers thatcash flows.
Although we may currently benefit from certain antidumping and countervailing duty orders, any such relief is subject to periodic reviews and challenges, which can result in volatilityrevocation of global iron ore prices.the orders or reduction of the duties. In addition, previously granted and future petitions for trade relief may not be successful or fully effective at preventing harm. Even if received, it is uncertain if any relief will be continued in the future or will be adequate to counteract completely the harmful effects of unfairly traded imports.
We are subject to extensive governmental regulation, which imposes, and will continue to impose, potential significant costs and liabilities on us. Future laws and regulations or the manner in which they are interpreted and enforced could increase these costs and liabilities or limit our ability to produce iron oreour raw materials and products.
New laws or regulations, or changes in existing laws or regulations, including the response of federal, state, local and foreign governments to the COVID-19 pandemic or arising out of the changes in U.S. government leadership resulting from the November 2020 elections, or the manner of their interpretation or enforcement, could increase our cost of doing business and restrict our ability to operate our businessbusinesses or execute our strategies. This includes, among other things, changes in the interpretation of MSHA regulations, such as workplace exam rules or safety around mobile equipment, reevaluation of the National Ambient Air Quality Standards, such as revised nitrogen dioxide, sulfur dioxide, lead, ozone and particulate matter criteria, changes in the interpretation of OSHA regulations, such as standards for occupational exposure to noise, certain chemicals or hazardous substances and infectious diseases, and the possible taxation under U.S. law of certain income from discontinued foreign operations, compliance costs and enforcement under the Dodd-Frank Act, and uncertainty surrounding the Patient Protection and Affordable Care Act and costs associated with the Healthcare and Education Reconciliation Act of 2010 and the regulations promulgated under these Acts and any replacement or amendments thereof. operations.
In addition, we and our operations are subject to various international, foreign, federal, state, provincial and local laws and regulations in each jurisdiction in which we have operations forrelating to protection of the environment and human health and safety, including those relating to air quality, water pollution, plant, wetlands, natural resources and wildlife protection (including endangered or threatened species), reclamation, remediation and restoration of mining properties and related surety bonds or other financial assurances, land use, the discharge of materials into the environment, the effects that industrial operations and mining hashave on groundwater quality, conductivity and availability, the management of electrical equipment containing polychlorinated biphenyls, and other related matters. NumerousCompliance with numerous governmental permits and approvals areis required for our operations.
We cannot be certain that we have been or will be at all times in complete compliance with such laws, regulations, permits and approvals. If we violate or fail to comply with these laws, regulations, permits or approvals, we could be fined, required to cease operations, subject to criminal or civil liability, or otherwise sanctioned by regulators. In particular, federal or state regulatory agencies have the authority, under certain circumstances following significant health and safety incidents, such as fatalities, to order a facility to be temporarily or permanently closed. Compliance with the complex and extensive laws and regulations to which we are subject imposes substantial costs on us, which could increase over time because of increasedheightened regulatory oversight, adoption of increasinglymore stringent environmental, health and safety standards and increasedgreater demand for remediation services leading to shortages of equipment, supplies and labor, as well as other factors.
Specifically, there are several notable proposed or recently enacted rulemakings or activities to which we would be subject or that would further regulate and/or tax us and our customers, namely the North American integrated steel producer customers, thatwhich may also require us or our customers to reduce or otherwise change operations significantly or incur significant additional costs, depending on their ultimate outcome. These emerging or recently enacted rules, regulations and policy guidance include, but are not limited to: governmental regulations imposed in response to the COVID-19 pandemic; trade regulations, such as the United States-Mexico-Canada AgreementUSMCA and/or other trade agreements, treaties or policies; Minnesota'spolicies; tariffs, such as the 25% tariff on imported steel imposed under Section 232; Minnesota’s potential revisions to the sulfate wild rice water quality standard; evolving water quality standards for selenium and conductivity; scope of the Clean Water Act and the definition of “Waters of the United States”; Minnesota'sMinnesota’s Mercury TMDL and associated rules governing mercury air emission reductions; Climate Change and GHG Regulation; the Regional Haze FIP Rule; NO2and SO2 NAAQS;the regulation of discharges to water. In addition, the Biden Administration has indicated via executive orders and increased administrative and legislative initiativesin campaign statements that it will propose more stringent environmental regulation, in particular related to financial assurance obligations for CERCLA, mining and reclamation obligations. Suchclimate change. Any new or more stringent legislation, regulations, rules, interpretations or orders, when enacted and enforced, could have a material adverse effect on our business, results of operations, financial condition or profitability.
AlthoughOur operations may be impacted by the numerousrecent enactment, and ongoing consideration, of significant federal and state laws and regulations operating permitsrelating to certain mine-related issues, such as the stability of tailings basins, mine drainage and fill activities, reclamation and safety in underground mines. With respect to underground mines, for
example, these laws and regulations include requirements for constructing and maintaining caches for the storage of additional self-contained self-rescuers throughout underground mines; installing rescue chambers in underground mines; continuous tracking of and communication with personnel in the mines; installing cable lifelines from the mine portal to all sections of the mine to assist in emergency escape; submission and approval of emergency response plans; and additional safety training. Additionally, there are requirements for the prompt reporting of accidents and increased fines and penalties for violations of these and existing regulations. These laws and regulations may cause us to incur substantial additional costs.
Additionally, our operations are subject to the risks of doing business abroad and we must comply with complex foreign and U.S. laws and regulations, which may include, but are not limited to, the Foreign Corrupt Practices Act and other anti-bribery laws, regulations related to import/export and trade controls, the European Union’s General Data Protection Regulation and other U.S. and foreign privacy regulations, and transportation and logistics regulations. These laws and regulations may increase our costs of doing business in international jurisdictions and expose our operations and our management systems mitigate potential impactsemployees to elevated risk. We require our employees, contractors and agents to comply with these and all other applicable laws and regulations, but failure to do so could result in possible administrative, civil or criminal liability and reputational harm to us and our employees. We may also be indirectly affected through regulatory changes that impact our customers, which in turn could reduce the environment,quantity of our products they demand or the prices for our products they are willing to pay. Regulatory changes that impact our suppliers could decrease the supply of products or availability of services they sell to us or could increase the price they demand for products or services they sell to us.
Our operations inadvertently may impact the environment or cause exposure to hazardous substances, which could result in material liabilities to us.
Our operations currently use, and have used in the past used, hazardous materials, and, from time to time, we have generated solid and hazardous waste. We have been, and may in the future be, subject to claims under international, foreign, federal, state, provincial and local laws and regulations for toxic torts, natural resource damages and other damages as well as for the investigation and clean-up of soil, surface water, sediments, groundwater and other natural resources and reclamation of properties. Such claims for damages and reclamation may arise out of current or former conditions at sites that we or our acquired companies currently own, lease or operate, currently, as well as sites that we or our acquired companies haveformerly owned, leased or operated, and at contaminated sites that are or have been owned, leased or operated by our joint venture partners. We may also have liability for contamination at third-party sites where we have sent hazardous wastes. Our liability for these claims may be strict and/or joint and several, such that we may be held responsible for more than our share of the contamination or other damages, or even for the entire shareclaims regardless of fault. We are currently subject to a variety of potential liability exposures arising, or otherwise involved inliabilities relating to investigation and remediation activities at certain sites. In addition to sites currently owned, leased or operated, these include sites where we formerly conducted iron ore and/or coal mining orraw material processing or other operations, inactive sites that we currently own, formerly owned predecessor sites, acquired sites, leased land sites and third-party waste disposal sites. We may be named as a potentially responsible party at other sites in the future and we cannot be certain that the costs associated with these additional sites will not exceed any reserves we have established or otherwise be material.
We also could beare subject to litigation for allegedclaims asserting bodily injuries arising from claimedalleged exposure to hazardous substances allegedly used, released, or disposed of by us. In particular, we andsubstances. For example, certain of our subsidiaries were involvedhave been named in various claims relatinglawsuits claiming exposure to the exposureasbestos, many of asbestos and silica to seamen who sailed until the mid-1980s on the Great Lakes vessels formerly owned and operated by certain of our subsidiaries. While several hundred of these claims against us had been combined in a multidistrict litigation docket andwhich have since been dismissed and/or settled for non-material amounts, there remains a possibilityamounts. It is likely that similar types of claims couldwill continue to be filed in the future.
Environmental impacts as a result of our operations, including exposures to hazardous substances or wastes associated with our operations, could result in costs and liabilities that could materially and adversely affect our margins, cash flow or profitability.
We may be unable to obtain, and/maintain, renew or renewcomply with permits necessary for our operations or be required to provide additional financial assurance,assurances, which could reduce our production, cash flows, profitability and available liquidity. We also could face significant permit and approval requirements that could delay our commencement or continuation of new or existing production operations which, in turn, could affect materially our profitability and available liquidity.
Prior to commencement of mining, we must submit to and obtain approval from the appropriate regulatory authority of plans showing where and how mining and reclamation operations are to occur. These plans must include information such as the location of mining areas, stockpiles, surface waters, haul roads, tailings basins and drainage
from mining operations. All requirements imposed by any such authority may be costly and time-consuming and may delay commencement or continuation of exploration or production operations.
Mining companiesWe must obtain, maintain and comply with numerous permits that require approval of operational plans and impose strict conditions on various environmental, health and safety matters in connection with iron oreour steel production and processing and mining and production. other operations. These include permits issued by various federal, state, provincial, foreign and local agencies and regulatory bodies. The permitting rules are complex and may change over time, making our ability to comply with the applicable requirements more difficult or impractical and costly, possibly precluding the continuance of ongoing operations or the development of future mining operations. Interpretations of rules may also change over time and may lead to requirements, such as additional financial assurance, making it more costlycostlier to comply. TheFor example, heightened levels of regulatory oversight with respect to our coal operations acquired as part of the AM USA Transaction could impact, delay or disrupt our ability to obtain new or renewed permits or modifications to existing permits.
In addition, the public, including special interest groups and individuals, have certain rights under various statutes to comment upon, submit objections to, and otherwise engage in the permitting process, including bringing citizens’ lawsuits to challenge such permits or mining activities. Accordingly, required permits may not be issued or renewed in a timely fashion (or at all), or permits issued or renewed may include conditions that we cannot meet or otherwise be conditioned in a mannerways that may restrict our ability to conduct our miningproduction and productionmining activities efficiently including the requirementor include requirements for additional financial assurances that we may not be able to provide on commercially reasonable terms or(or at all andall), which would further limit ourcould reduce available borrowing basecapacity under our ABL Facility. Such inefficienciesconditions, restrictions or requirements could reduce our production, cash flows, profitability and availableor liquidity.
A substantial majority of our sales are made under supply agreements with specified duration to a low number of customers that contain price-adjustment clauses that could affect adversely the stability and profitability of our operations.
A majority of our Mining and Pelletizing sales are made under supply agreements with specified durations to a limited number of customers. For the year ended December 31, 2018, approximately 97% of our revenues from product sales and services was derived from the North American integrated steel industry and three customers together accounted for 95% of our Mining and Pelletizing product sales revenues. Our average remaining duration of our Mining and Pelletizing contracts as of December 31, 2018 is approximately six years. Pricing under our customer contracts is adjusted by certain factors including the price of hot-rolled coil steel in the U.S. domestic market, benchmark world prices for iron ore, pellets and freight, and general inflation indices. As a result of this and other pricing constructs contained in our customer contracts and those anticipated in future periods, our financial results have increased sensitivity to changes in iron ore and steel prices.
Our existing and future indebtedness may limit cash flow available to invest in the ongoing needs of our business,businesses, which could prevent us from fulfilling our obligations under our senior notes, ABL Facility and ABL Facility.other debt, and we may be forced to take other actions to satisfy our obligations under our debt, which may not be successful.
As of December 31, 2018,2020, we had an$5,595 million aggregate principal amount of $2,212.0 million of long-term debt $400.0outstanding, $2,195 million of which was secured (excluding $55.0$247 million of outstanding letters of credit and $16.4$335 million of capitalfinance leases), and $823.2$112 million of cash on our balance sheet. On December 9, 2020, in connection with the consummation of the AM USA Transaction, we amended our ABL Facility to, among other things, increase the tranche A revolver commitments available under the ABL Facility by an additional $1,500 million. After giving effect to this amendment, the aggregate principal amount of tranche A revolver commitments under our ABL Facility is $3,350 million, and the aggregate principal amount of tranche B revolver commitments under our ABL Facility remains at $150 million. As of December 31, 2018, no loans were drawn2020, $1,510 million was outstanding under theour ABL Facility, and we had total availability of $323.7 million as a result of borrowing base limitations. As of December 31, 2018, the principal amount of letters of credit obligations and other commitments totaled $55.0 million, thereby further reducing$247 million. As of December 31, 2020, the available borrowing capacity on our ABL Facility to $268.7was $1,743 million.
Our existing level of indebtedness requires us toWe dedicate a portion of our cash flow from operations to the payment of debt service, reducing the availability of our cash flow to fund capital expenditures, acquisitions or strategic development initiatives, and other general corporate purposes. Moreover, our level of indebtedness could have further consequences, including, increasing our vulnerability to adverse economic or industry conditions, limiting our ability to obtain additional financing in the future to enable us to react to changes in our business, or placing us at a competitive disadvantage compared to businesses in our industry that have less indebtedness.
Our indebtedness could limit our ability to obtain additional financing on acceptable terms or at all for working capital, capital expenditures, acquisitions or strategic development initiatives, and general corporate purposes. Our liquidity needs could vary significantly and may be affected by general economic conditions, industry trends, performance and many other factors not within our control. If we are unable to generate sufficient cash flow from operations in the future to service our debt, we may be required to refinance all or a portion of our existing debt. Although we were successful in financing our HBI project, we may not be able to obtain any such new or additional debt on favorable terms or at all.
Any failure to comply with covenants in the instruments governing our debt could result in an event of default which, if not cured or waived, would have a material adverse effect on us.
We may not be able to generate sufficient cash to service all of our debt, and may be forced to take other actions to satisfy our obligations under our debt, which may not be successful.
Our ability to make scheduled payments on or to refinance our debt obligations depends on our ability to generate cash in the future and our financial condition and operating performance, which are subject to prevailing economic and competitive conditions and to certain financial, business and other factors beyond our control. We cannot assure youcontrol, including the impact of the COVID-19 pandemic. There can be no assurance that we will maintain a level of cash flows from operating activities sufficient to permit us to pay the principal, premium, if any, and interest on our debt. In addition, any failure to comply with covenants in the instruments governing our debt could result in an event of default that, if not cured or waived, would have a material adverse effect on us.
We alsoOur level of indebtedness could have significant capital requirements,further consequences, including, interest paymentsbut not limited to, serviceincreasing our debt. Ifvulnerability to adverse economic or industry conditions, placing us at a competitive disadvantage compared to other businesses in the industries in which we incur significant losses in future periods, weoperate that are not as leveraged and that may be unablebetter positioned to continue aswithstand economic downturns, limiting our flexibility to plan for, or react to, changes in our businesses and the industries in which we operate, and requiring us to refinance all or a going concern. If we are unableportion of our existing debt. We may not be able to continue as a going concern, we may consider, among other options, restructuring our debt; however, there can be no assurance that these options will be undertakenrefinance on commercially reasonable terms or at all, and if so undertaken, whether these efforts will succeed.
If our cash flows and capital resources are insufficient to fund our debt service obligations, we may be forced to reduce or delay investments and capital expenditures, or to sell assets, seek additional capital, including additional secured or unsecured debt, or restructure or refinance our debt. Anyany refinancing of our debt could be at higher interest rates and may require us to comply with more onerous covenants, making it more difficult to obtain surety bonds, letters of credit or other financing,financial assurances that may be demanded by our vendors or regulatory agencies, particularly during periods in which credit markets are weak; causingweak.
A portion of our borrowing capacity and outstanding indebtedness bears interest at a changevariable rate based on LIBOR. There is considerable uncertainty regarding the publication of LIBOR beyond 2021. The uncertainty regarding the future of LIBOR, as well as the transition from LIBOR to another benchmark rate or rates, could have adverse impacts on our outstanding debt that currently uses LIBOR as a benchmark rate and, in turn, could adversely affect our credit ratings; limiting our ability to compete with companies that are not as leveragedfinancial condition and that may be better positioned to withstand economic downturns; and limiting our flexibility in planning for, or reacting to, and increasing our vulnerability to, changes in our business, the industry in which we compete and general economic and market conditions. These measures may not be successful and may not permit us to meet our scheduled debt service obligations.results of operations.
If our operating results and available cashwe are insufficientunable to meetservice our debt service obligations, we could face substantial liquidity problems and mightwe may be requiredforced to dispose of materialreduce or delay investments and capital expenditures, or to sell assets, seek additional capital, including additional secured or operations to meetunsecured debt, or restructure or refinance our debt, service and other obligations.we may be unable to continue as a going concern. We may not be ableunable to consummate those dispositionsany proposed asset sales or recover the carrying value of these assets, or obtain the proceeds that we could realize from them, and theseany proceeds may not be adequate to meet any debt service obligations then due. Further, we may need to refinance all or a portion of our debt on or before maturity, and we may not be able to refinance any of our debt on commercially reasonable terms or at all. Furthermore, additional or new financial assurances may be demanded by our vendors or regulatory agencies that we may not be able to provide on commercially reasonable terms or at all.
Any of these examples potentially could have a material adverse impact on our results of operations, profitability, shareholders'shareholders’ equity and capital structure.
A court or regulatory body could find that we are responsible, in whole or in part, for liabilities we transferred to third party purchasers.
As partOur ability to collect payments from our customers depends on their creditworthiness.
Our ability to receive payment for products sold and delivered to our customers depends on the creditworthiness of our customers. Generally, we deliver our Mining and Pelletizing products to our customers’ facilities in advance of payment for those products. Under this practice for most of our customers, title and risk of loss with respect to Mining and Pelletizing products does not pass to the customer until payment for the pellets is received; however, there is typically a period of time in which pellets, for which we have reserved title, are within our customers’ control. Where we have identified credit risk with certain customers, we have put in place alternate payment terms from time to time.
Customers outside of the U.S. may be subject to pressures and uncertainties that may affect their ability to pay, including trade barriers, exchange controls, and local, economic and political conditions. Downturns in the economy and disruptions in the global financial markets have affected the creditworthiness of our customers from time to time. Some of our customers are highly leveraged. If economic conditions worsen or prolonged global, national or regional economic recession conditions return, it is likely to impact significantly the creditworthiness of our customers and could, in turn, increase the risk we bear on payment default for the credit we provide to our customers and could limit our ability to collect receivables. Failure to receive payment from our customers for products that we have delivered could affect adversely our results of operations, financial condition and liquidity.
Our operating expenses could increase significantly if the price of electrical power, fuel or other energy sources increases.
Our mining operations require significant use of energy. Energy expenses, which make up approximately 20% to 25% in the aggregate of our operating costs in our Mining and Pelletizing locations, are sensitive to changes in electricity prices and fuel prices, including diesel fuel and natural gas prices. Prices for electricity, natural gas and fuel oils can fluctuate widely with availability and demand levels from other users. During periods of peak usage, supplies of energy may be curtailed and we may not be able to purchase them at historical rates. A disruption in the transmission of energy, inadequate energy transmission infrastructure, or the termination of any of our energy supply contracts could interrupt our energy supply and affect adversely our operations. While we have some long-term contracts with electrical suppliers, we are exposed to fluctuations in energy costs that can affect our production costs. As an example, our mines in Minnesota are subject to changes in Minnesota Power’s rates, such as periodic rate changes that are reviewed and approved by the state public utilities commission in response to an application filed by Minnesota Power. We also enter into market-based pricing supply contracts for natural gas and diesel fuel for use in our operations. Those contracts expose us to price increases in energy costs, which could cause our profitability to decrease significantly. In addition, U.S. public utilities may pass through additional capital and operating cost increases to their customers related to new or pending U.S. environmental regulations that may require significant capital investment and use of cleaner fuels in the future and which may impact U.S. coal-fired generation capacity.
We are subject to a variety of financial market risks.
Financial market risks include those caused by changes in the value of investments, changes in commodity prices, interest rates and foreign currency exchange rates. We have established policies and procedures to manage such risks; however, certain risks are beyond our control and our efforts to mitigate such risks may not be effective. These factors could have a material adverse effect on our results of operations.
Changes in credit ratings issued by nationally recognized statistical rating organizations could adversely affect our cost of financing and the market price of our securities.
Credit rating agencies could downgrade our ratings either due to various developments, including matters arising out of the AK Steel Merger or the AM USA Transaction, incurring additional indebtedness and other factors specific to our business,businesses, a prolonged cyclical downturn in the steel and mining industries, whether due to the COVID-19 pandemic or steel industry,otherwise, or macroeconomic trends (such as global or regional recessions), and trends in credit and capital markets more generally. Any decline in our credit ratings may result in an increase to our cost of future financing andor limit our access to the capital markets, which wouldcould harm our financial condition, and results of operations, hinder our ability to refinance existing indebtedness on acceptable terms, or have an adverse effect on the market price of our securities and may affect adversely the terms under which we purchase goods and services.
Our actual operating results may differ significantly from our guidance.
From time to time, we release guidance, including that set forth under “Management’s Discussion and Analysis of Financial Condition and Results of Operations-Outlook”Operations–Outlook” in our Annual Reports on Form 10-K and our Quarterly Reports on Form 10-Q, regarding our future performance. This guidance, which consists of forward-looking statements, is prepared by our management and is qualified by, and subject to, the assumptions and the other information included in our Annual Reports on Form 10-K and our Quarterly Reports on Form 10-Q. Our guidance is not prepared with a view toward compliance with published guidelines of the American Institute of Certified Public Accountants, and neither our independent registered public accounting firm nor any other independent or outside party compiles or examines the guidance and, accordingly, no such person expresses any opinion or any other form of assurance with respect thereto.
Guidance is based upon a number of assumptions and estimates that, while presented with numerical specificity, are inherently subject to business, economic and competitive uncertainties and contingencies, many of which are beyond our control and are based upon specific assumptions with respect to future business decisions, some of which will change. The principal reason that we release such data is to provide a basis for our management to discuss our business outlook with analysts and investors. We do not accept any responsibility for any projections or reports published by any such persons.
third parties.
Guidance is necessarily speculative in nature, and it can be expected that some or all of the assumptions of the guidance furnished by us will not materialize or will vary significantly from actual results. Accordingly, our guidance is only an estimate of what management believes is realizable as of the date of release. Actual results will vary from the guidance. Investors should also recognize that the reliability of any forecasted financial data diminishes the further in the future that the data are forecast. In light of the foregoing, investors are urged to put the guidance in context and not to place undue reliance on it.
Any failure to successfully implement our operating strategy or the occurrence of any of the events or circumstances set forthrisks described in our Annual Reports on Form 10-K or our Quarterly Reports on Form 10-Q could result in actual operating results being different than the guidance, and such differences may be adverse and material.
We rely on our joint venture partners to meet their payment obligations and we are subject to risks involving the acts or omissions of our joint venture partners.
We co-own and manage one of our four operating Mining and Pelletizing mines with ArcelorMittal and U.S. Steel. We rely on our joint venture partners to make their required capital contributions and to pay for their share of the iron ore produced. One of our Mining and Pelletizing joint venture partners is also our customer. If one or both of our joint venture partners fail to perform their obligations, the remaining joint venture partners, including ourselves, may be required to assume additional material obligations, including significant capital contribution, costs of environmental remediation, pension and postretirement health and life insurance benefit obligations. For example, a premature closure of a mine due to the failure of a joint venture partner to perform its obligations could result in significant fixed mine-closure costs, including severance, employment legacy costs and other employment costs; reclamation and other environmental costs; and the costs of terminating long-term obligations, including energy and transportation contracts and equipment leases.
We cannot control the actions of our joint venture partners because we have a minority interest in such joint venture. Further, in spite of performing customary due diligence prior to entering into a joint venture, we cannot guarantee full disclosure of prior acts or omissions of the sellers or those with whom we may in the future enter into joint ventures. Such risks could have a material adverse effect on the business, results of operations or financial condition of our existing or future joint venture interests.
Our assets as of December 31, 20182020 include a deferred tax asset, the full value of which we may not be able to realize.
We recognize deferred tax assets and liabilities based on differences between the financial statement carrying amounts and the tax basis of assets and liabilities. At December 31, 2018,2020, the net deferred tax asset was approximately $464.8$492 million, primarily related to U.S. net operating loss carryforwards.NOLs. We regularly review our deferred tax assets for recoverability based on our history of earnings, expectations for future earnings and expected timing of reversals of temporary differences. Realization of deferred tax assets ultimately depends on the existence of sufficient taxable income. We believe the recorded net deferred tax asset at December 31, 20182020, is fully realizable based on our expected future earnings. However, our assumptions and estimates are inherently subject to business, economic and competitive uncertainties and contingencies, many of which are beyond our control and some of which may change. As a result, we could ultimately lose a portion of our deferred tax asset related to net operating loss carryforwardsNOLs due to expiration, which could have a material adverse effect on our results of operations and cash flows.
The ability to use our NOLs and certain other tax attributes to offset future taxable income may be subject to certain limitations.
If a corporation undergoes an “ownership change” within the meaning of Section 382 of the IRC, the corporation’s NOLs and certain other tax attributes arising before the “ownership change” are subject to limitations after the “ownership change.” An “ownership change” under Section 382 of the IRC generally occurs if one or more
shareholders or groups of shareholders who own at least 5% of the corporation’s equity increase their ownership in the aggregate by more than 50 percentage points over their lowest ownership percentage within a rolling period that begins on the later of three years prior to the testing date and the date of the last “ownership change.” If an “ownership change” were to occur, Section 382 of the IRC would impose an annual limit on the amount of pre-ownership change NOLs and other tax attributes the corporation could use to reduce its taxable income, potentially increasing and accelerating the corporation’s liability for income taxes, and also potentially causing tax attributes to expire unused. The amount of the annual limitation is determined based on a corporation’s value immediately prior to the ownership change.
As of December 31, 2020, after taking into account limitations (or disallowance) on use, we had $2,510 million and $1,009 million of available U.S. federal and state NOLs, respectively, including amounts acquired in the AK Steel Merger. The use of our common shares in the Acquisitions in conjunction with subsequent issuances or sales of our shares (including transactions that are outside of our control) could cause us to experience an “ownership change.” If we experience an “ownership change” under Section 382 of the IRC, further limitations (or disallowances) may apply and similar rules may also apply under state and foreign laws. Consequently, we may not be able to utilize a material portion of our NOLs and other tax attributes, which, in addition to increasing our U.S. federal and state income tax liability, could adversely affect our share price, financial condition, results of operations and cash flows.
Holders of our common shares may not receive dividends on thetheir common shares.
We are not required to declare cash dividends on our common shares and, in April 2020, we announced the suspension of future dividends. Holders of our common shares are entitled to receive only such dividends as our Board of Directors may from time to time declare out of funds legally available for such payments. We are incorporated in Ohio and governed by the Ohio General Corporation Law, which allows a corporation to pay dividends, in general, in an amount that cannot exceed its surplus, as determined under Ohio law. Our ability to pay dividends will be subject to our future earnings, capital requirements and financial condition, as well as our compliance with covenants and financial ratios related to existing or future indebtedness, business prospects and other factors that our Board may deem relevant. Additionally, our ABL Facility contains, and agreements governing any of our future debt may contain, covenants and other restrictions that, in certain circumstances, could limit the level of dividends that we are able to pay on our common shares. Although
IV. OPERATIONAL RISKS
We face significant risks relating to our recent acquisitions of the AK Steel and ArcelorMittal USA businesses.
During 2020, we recently have declaredcompleted both the AK Steel Merger and the AM USA Transaction. These recent transformative acquisitions involve a number of significant risks and uncertainties that may adversely affect us, including the following:
•inability to realize anticipated synergies or other expected benefits or cost savings;
•additional debt incurred or assumed in connection with the acquisitions could limit our financial flexibility, including our ability to acquire additional assets and make further strategic investments in the future;
•diversion of financial resources to the new operations or acquired businesses;
•assumption of substantial additional environmental exposures, commitments, contingencies and remediation and reclamation projects;
•liabilities for acquired pension and OPEB obligations, which could require us to make significant cash dividends onexpenditures and funding contributions in excess of current estimates and contribution rates;
•impairment of recorded tangible and intangible asset values, including goodwill, could result in material non-cash charges to our results of operations in the future;
•failure to successfully integrate acquired systems, business processes, policies and procedures;
•exposure to unknown liabilities and unforeseen costs that were not discovered during due diligence;
•loss of human capital resources and support services historically provided by ArcelorMittal and potential failure of ArcelorMittal or its affiliates to perform under various contracts entered into in connection with the AM USA Transaction, including the intellectual property license agreement, slab supply agreement and
transition services agreement, which could adversely impact our integration of the ArcelorMittal USA operations;
•potential loss of key employees, suppliers or customers; and
•other challenges associated with managing the larger, more complex and integrated combined businesses.
If one or more of these risks and uncertainties were to materialize, we could experience reduced sales, higher costs, lower profitability and other adverse impacts to our operations and businesses.
In addition, in connection with the closing of the AM USA Transaction, we issued approximately 78 million of our common shares we are not required to declare cash dividends onan indirect, wholly owned subsidiary of ArcelorMittal, equating to approximately 16% of our then-outstanding common shares. On February 11, 2021, in connection with our sale of 20 million of our common shares and our Boardin an underwritten public offering, such subsidiary of Directors may reduce, defer or eliminateArcelorMittal, as a selling shareholder in the offering, sold 40 million of our common shares. We believe such subsidiary of ArcelorMittal continues to hold approximately 38 million of our common shares, equating to approximately 8% of our outstanding common shares following completion of such offering. Although ArcelorMittal and its affiliates are subject to certain restrictions and requirements under an Investor Rights Agreement with respect to its and its affiliates' ownership and voting of our common shares, at such a level of beneficial ownership, ArcelorMittal and its affiliates may be able to exert influence over us and actions requiring the approval of our common shareholders. Under the Investor Rights Agreement, ArcelorMittal and its affiliates are permitted to transfer all of our common shares held by them, subject to certain restrictions on transfers to persons whose beneficial ownership of our common shares following any such transfer would exceed 5% or 10% of our then-outstanding common shares. Sales of our shares by ArcelorMittal and its affiliates or other shareholders, coupled with the increase in the outstanding number of our common shares, may affect the market for, and the market price of, our common shares in an adverse manner.
We also issued 583,273 shares of Series B Preferred Stock to an indirect, wholly owned subsidiary of ArcelorMittal in connection with the closing of the AM USA Transaction. Pursuant to the terms of the Series B Preferred Stock, from and after the 24-month anniversary of the issue date of the Series B Preferred Stock (the “24-Month Anniversary”), each holder of a share dividendof Series B Preferred Stock is entitled to receive cash dividends (the “Additional Dividends”) that will accrue and compound at a significant rate. Although the Series B Preferred Stock is redeemable at our option 180 days after the issue date, the agreements governing our debt may restrict us from paying the redemption price at any given time. If we are unable to redeem the Series B Preferred Stock prior to the 24-Month Anniversary and we become obligated to pay the Additional Dividends, we may be required to divert financial resources from our operations or borrow additional debt in order to satisfy such obligations, which could have a material adverse effect on our business, financial condition and results of operations.
We have limited ability to control our joint venture operations, rely on our joint venture partners to meet their payment obligations, and are subject to risks involving the acts or omissions of our joint venture partners.
As part of the AM USA Transaction, we acquired ArcelorMittal USA’s interest in Hibbing and again became the manager of Hibbing, which we co-own with U.S. Steel. In our steel business, we are party to various joint venture arrangements primarily related to downstream steel processing operations. Due to shared ownership, we have limited ability to control our joint venture operations, and we cannot control the actions of our joint venture partners. Accordingly, we rely on our joint venture partners to make their required capital contributions and to pay for their share of joint venture obligations. If our joint venture partners experience financial hardship or fail to perform their obligations, we may be required to assume additional material obligations to minimize operational disruption or as part of a liquidation, including significant capital contributions, costs of environmental remediation, and pension and OPEB obligations.
Our operating expenses could increase significantly if the price of raw materials, electrical power, fuel or other energy sources increases.
Our operations require significant use of energy and raw materials. Energy expenses are sensitive to changes in electricity, energy transportation and fuel prices, including diesel fuel and natural gas. Although we are self-sufficient in iron ore, other raw materials or production inputs where we are wholly or partially dependent on third-party suppliers include industrial gases, graphite electrodes, scrap, chrome, zinc, coke and coal. Prices for electricity, natural gas, fuel oils and raw materials can fluctuate widely with availability and demand levels from other users, including fluctuations caused by the impact of the COVID-19 pandemic. During periods of peak usage, although some operations have contractual arrangements in place whereby they receive certain offsetting payments in exchange for electricity load reduction, supplies of energy and raw materials in general may be curtailed and we may not be able to purchase them at historical rates. A disruption in the transmission of energy, inadequate energy transmission
infrastructure, or the termination of any of our energy supply contracts could interrupt our energy supply and adversely affect our operations. While we have some long-term contracts with electrical, natural gas and raw material suppliers, we are exposed to fluctuations in energy, natural gas and raw material costs that can affect our production costs. As an example, our Toledo direct reduction plant is subject to changes in the market price of natural gas, which is a key input in the direct reduction of iron ore pellets to produce HBI. We enter into many market-based pricing supply contracts for electricity, natural gas and diesel fuel for use in our operations. Those contracts expose us to price increases in energy costs, which could cause our profitability to decrease significantly. In addition, U.S. public utilities may impose rate increases and pass through additional capital and operating cost increases to their customers related to new or pending U.S. environmental regulations or other charges that may require significant capital investment and use of cleaner fuels in the future. In particular, the recent decision of the U.S. Court of Appeals for the District of Columbia vacating and remanding the Affordable Clean Energy Rule, as well as recent executive orders from President Biden regarding the environment and climate change, indicate that new or revised regulations under the Biden Administration could result in rate increases from U.S. utilities.
The majority of our steel shipments are sold under contracts that do not allow us to pass through all increases in raw materials, supplies and energy costs. Some of our steel shipments to contract customers include variable-pricing mechanisms allowing us to adjust the total sales price based on changes in specified raw materials, supplies and energy costs. Those adjustments, however, rarely reflect all of our underlying raw materials, supplies and energy cost changes. The scope of the adjustment may also be limited by the terms of the negotiated language, including limitations on when the adjustment occurs. Our need to consume existing inventories may also delay the impact of a change in prices of raw materials or supplies. Significant changes in raw material costs may also increase the potential for inventory value write-downs in the event of a reduction in selling prices and our inability to realize the cost of the inventory.
MineSteelmaking facility or mine closures entail substantial costs. If our assumptions underlying our accruals for closure costs prove to be inaccurate or we prematurely close one or more of our facilities or mines, our results of operations and financial condition would likely be affected adversely.adversely affected.
If faced with overcapacity in the market or other adverse conditions, including as a result of the COVID-19 pandemic, we may seek to rationalize assets through asset sales, temporary shutdowns, indefinite idles or facility closures. If we prematurelyindefinitely idle or permanently close any of our facilities or mines, our production and revenues would be reduced unless we were able to increase production at our other facilities or mines in an offsetting amount, which may not be possible. possible, and could result in customers responding negatively by taking current or future business away from us if we seek to transition production to a different facility. Alternatively, we could fail to meet customer specifications at the facilities to which products are transitioned, resulting in customer dissatisfaction or claims.
The closure of a steelmaking facility or mining operation involves significant fixed closure costs, including accelerated employment legacy costs, severance-related obligations, reclamation and other environmental costs, and the costs of terminating long-term obligations, including customer, energy and transportation contracts and equipment leases. leases, and certain accounting charges, including asset impairment and accelerated depreciation. In addition, a permanent steelmaking facility or mine closure could accelerate and significantly increase employment legacy costs, including our expense and funding costs for pension and OPEB obligations and multiemployer pension withdrawal liabilities. A number of employees would be eligible for immediate retirement under special eligibility rules that apply upon a steelmaking facility or mine closure. All employees eligible for immediate retirement under the pension plans at the time of the permanent closure also could be eligible for OPEB, thereby accelerating our obligation to provide these benefits. Certain closures would precipitate a pension closure liability significantly greater than an ongoing operation liability and may trigger certain severance liability obligations.
We base our assumptions regarding the life of our mines on detailed studies we perform from time to time, but those studies and assumptions are subject to uncertainties and estimates that may not be accurate. We recognize the costs of reclaiming open pits, stockpiles, tailings ponds, roads and other mining support areas based on the estimated mining life of our property. If our assumptions underlying our accruals for closure costs, including reclamation and other environmental costs, prove to be inaccurate or insufficient, or our liability in any particular year is greater than currently anticipated, our results of operations and financial condition could be adversely affected. In addition, if we were to significantly reduce the estimated life of any of our mines, themine-closure mine closure costs would be applied to a shorter period of production, which would increase costs per ton produced and could significantly and adversely affect our results of operations and financial condition.
A mine permanent closure could accelerate and significantly increase employment legacy costs, including our expense and funding costs for pension and other postretirement benefit obligations. A number
Our sales and competitive position depend on the ability to transport our products to our customers at competitive rates and in a timely manner.
In our Mining and Pelletizing operations, disruptionDisruption of the lake, and rail and/or trucking transportation services because of weather-related problems, including ice and winter weather conditions on the Great Lakes or St. Lawrence Seaway, climate change, strikes, lock-outs, driver shortages and other disruptions in the trucking industry, rail network constraints, global or domestic pandemics or epidemics (such as the COVID-19 pandemic) or other infectious disease outbreaks, in each case causing a business disruption, or other events and lack of alternative transportation options could impair our ability to move products internally among our facilities and to supply iron oreproducts to our customers at competitive rates or in a timely manner and, thus, could adversely affect our sales, margins and profitability. Further, reduced dredging issues and environmental changes, particularly at Great Lakes ports, could impact negativelyadversely our ability to move certain of our iron ore products because lower water levels restrict the tonnage that vessels can haul, resultingor result in higher freight rates. Similarly, we depend on third-party transportation services for delivery of raw materials to us, and failures or delays in delivery would have an adverse effect on our ability to maintain steady-state production operations to meet customer obligations.
Natural or human-caused disasters, weather conditions, disruption of energy, unanticipated geological conditions, equipment failures, infectious disease outbreaks, and other unexpected events may lead our customers, our suppliers or our facilities to curtail production or shut down operations.
Operating levels within our industry and the mining industryindustries of our customers and suppliers are subject to unexpected conditions and events that are beyond the industry’sindustries’ control. Those events, including the occurrence of an infectious disease or illness, such as the COVID-19 pandemic, could cause industry members or their suppliers to curtail production or shut down a portion or all of their operations, which could reduce the demand for our iron ore products and couldadversely affect adversely our sales, margins and profitability. For example, the temporary production shutdowns in the automotive industry during 2020 as a result of the COVID-19 pandemic and associated reduction in demand for our products led to our decision to temporarily idle certain steelmaking facilities and iron ore mines.
Interruptions in production capabilities inevitably will increase our production costs and reduce our profitability. We do not have meaningful excess capacity for current production needs, and we are not able to quickly increase production or restart production at one mine to offset an interruption in production at another mine. Additionally, restart production costs can be even higher if required to be taken during extremely cold weather conditions.
A portion of our production costs are fixed regardless of current operating levels. As noted, ourOur operating levels are subject to conditions beyond our control that can delay deliveries or increase the cost of mining at particular minesproduction for varying lengths of time. TheseFactors that could cause production disruptions could include adverse weather conditions (for example, extreme winter weather, tornadoes, floods, and the lack of availability of process water due to drought) and natural and man-made disasters, lack of adequate raw materials, energy or other supplies, and infectious disease outbreaks, such as the COVID-19 pandemic. In addition, factors that could adversely impact production and operations at our mining operations include tailings dam failures, pit wall failures, unanticipated geological conditions, including variations in the amount of rock and soil overlying the deposits of iron ore and coal, variations in rock and other natural materials, and variations in geologic conditions and ore processing changes.
The manufacturing processes that take place in ourOur mining operations, as well as in our processing facilities, steelmaking and logistics operations depend on critical pieces of equipment. This equipment may, on occasion, be out of service because of unanticipated failures.failures or unplanned outages. In addition, allmost of our mines and production and processing facilities have been in operation for several decades, and the equipment is aged. In the future, we may experience additional material plantlengthy shutdowns or periods of reduced production because of equipment failures. Further, remediation of any interruption in production capability may require us to make
large capital expenditures that could have a negative effectimpact on our profitability and cash flows. Our business interruption insurance would not cover all of the lost revenues associated with equipment failures. Longer-term business disruptions could result in a loss of customers, which could adversely could affect our future sales levels and therefore,revenues.
Many of our profitability.
Regarding the impact of unexpected events happening to our suppliers, many of ourproduction facilities and mines are dependent on one source for electric power, and for natural gas.gas, industrial gases and/or certain other raw materials or supplies. A significant interruption in service from our energy suppliers due to the COVID-19 pandemic, terrorism or sabotage, weather conditions, natural disasters, equipment failure or any other cause cancould result in substantial losses that may not be fully recoverable, either from our business interruption insurance or responsible third parties.
We incur certain costs when production capacity is idled, includingas well as increased costs to resume production at previously idled facilities and costs to idle facilities.
Our decisions concerning which minesfacilities to operate and at what capacityproduction levels are made based in part upon our customers'customers’ orders for products, the quality of and cost to mine and process the remaining ore body, as well as the quality, performance capabilities and cost performance of our mines.operations. During depressed market conditions, we may concentrate production at certain minesfacilities and not operate others in response to customer demand, and as a result we willmay incur idle facility costs. In 2016, twocosts that could offset our anticipated savings from not operating the idled facility. For example, due to reduced demand as a result of the COVID-19 pandemic, certain of our Minnesotasteelmaking facilities and iron ore mines were temporarily idled for a portionduring portions of the year,2020 and we indefinitely idledcontinued to incur
certain fixed costs at those facilities. We cannot predict whether our operations will experience additional disruptions in the Empire mine in Michigan in August 2016.future.
When we restart idled facilities, we incur certain costs to replenish inventories, prepare the previously idled facilities for operation, perform the required repair and maintenance activities, and prepare employees to return to work safely and to resume production responsibilities. The amount of any such costs can be material, depending on a variety of factors, such as the period of idle time, necessary repairs and available employees, and is difficult to project.
If faced with overcapacity in the iron ore market, we may seek to rationalize assets through asset sales, temporary shutdowns, indefinite idles or closures of facilities.
We may not have adequate insurance coverage for some business risks.
As noted above, ourOur operations are generally subject to a number of hazards and risks, which could result in personal injury or damage to, or destruction of, equipment, properties or facilities. The insurance that we maintain to address risks that are typical in our businessbusinesses may not provide adequate coverage. Insurance against some risks, such as liabilities for environmental pollution, tailings basin breaches, or certain hazards or interruption of certain business activities, may not be available at an economically reasonable cost, or at all. Even if available, we may self-insure where we determine it is most cost-effectivecost effective to do so. As a result, despite the insurance coverage that we carry, accidents or other negative developments involving our production, mining, productionprocessing or transportation activities causing losses in excess of policy limits, or losses arising from events not covered under insurance policies, could have a material adverse effect on our operations.financial condition and cash flows.
A disruption in or failure of our information technologyIT systems, including those related to cybersecurity, could adversely affect our business operations and financial performance.
We rely on the accuracy, capacity, integrity and security of our information technology (“IT”)IT systems for the operationsoperation of many of our business processes and to comply with regulatory, legal and tax requirements. While we maintain some of our critical information technologyIT systems, we are also dependent on third parties to provide important IT services relating to, among other things, operational process technology at our facilities, human resources, electronic communications and certain finance functions. Further, in connection with the Acquisitions, we inherited certain legacy hardware and software IT systems that can be supported only by a very limited number of specialists in the market, and our increased reliance on these legacy IT systems may increase the risk of IT system disruption or failure, which could adversely affect our operations.
Despite the security measures that we have implemented, including those related to cybersecurity, our IT systems could be breached or damaged by computer viruses, natural or man-made incidents or disasters, or unauthorized physical or electronic access.access or intrusions. Though we have controls in place, we cannot provide assurance that a cyber-attackcyberattack will not occur. Furthermore, we may have little or no oversight with respect to security measures employed by third-party service providers, which may ultimately prove to be ineffective at countering threats. We may also experience increased risk of IT system failures or cyberattacks as many of our employees continue to work from home as part of our response to the COVID-19 pandemic. In addition, we may experience increased risk of IT system failures or cyberattacks as transitional activities relating to the Acquisitions are in progress, since these activities expose each company to the other’s security vulnerabilities, and because the Acquisitions may attract the attention of potential cyber criminals.
Failures of our IT systems, whether caused maliciously or inadvertently, may result in the disruption of our business processes, or in the unauthorized release of sensitive, confidential, personally identifiable or otherwise protected information, or result in the corruption of data, each of which could adversely affect our businessbusinesses. For example, cybersecurity vulnerabilities could result in an interruption of the functionality of our automated manufacturing operating systems, which, if compromised, could cease, threaten, delay or slow down our ability to produce or process steel or any of our other products for the duration of such interruption, which could result in reputational harm and may adversely affect our results of operations, financial condition and cash flows. In addition, any compromise of the security of our IT systems could result in a loss of confidence in our security measures and subject us to litigation, regulatory investigations and negative publicity that could adversely affect our reputation and financial performance. In addition,condition.Our customers, suppliers and vendors may also access or store certain of our sensitive information on their IT systems, which, if breached, attacked or accessed by unauthorized persons, could likewise expose our sensitive information and adversely impact our businesses. Furthermore, as cybersecurity threats continue to evolve and become more sophisticated, we may be required to incur significant costs and invest additional resources to protect against and, if required, remediate the damage caused by such disruptions or system failures in the future.
Our profitability could be affected adversely by the failure
We rely on outside companies to provide key services, including the design and construction of our HBI facility in Toledo, Ohio. Additionally, we use contractors to help complete certain capital projects, such as upgrades to our existing Mining and Pelletizing facilities. A contractor's or supplier's failure to perform could affect adversely our production, sales, and our ability to fulfill customer requirements. Such failure to perform in a significant way would result in additional costs for us, which also could affect adversely our production rates, sales and results of operations.V. DEVELOPMENT AND SUSTAINABILITY RISKS
| |
V. | DEVELOPMENT AND SUSTAINABILITY RISKS |
The cost and time to implement a strategic capital project may prove to be greater than originally anticipated.
WeFrom time to time, we undertake strategic capital projects, such as the HBI project,our recently-completed Toledo direct reduction plant, in order to enhance, expand or upgrade our minesproduction and productionmining capabilities or diversify our customer base. Our ability to achieve the anticipated production volumes, revenues or otherwise realize acceptable returns on strategic capital projects that we may undertake is subject to a number of risks, many of which are beyond our control, including a variety of market (such as a volatile pricing environment for iron ore)our products), operational, permitting and labor-related factors. Further, the cost to implement any given strategic capital project ultimately may prove to be greater and may take more time than originally anticipated. Inability to achieve the anticipated results from the implementation of our strategic capital projects, the incurring of unanticipated implementation costs or penalties, or the inability to meet contractual obligations could adversely affect adversely our results of operations and future earnings and cash flow generation.
We must continually must replace reserves depleted by production. Exploration activities may not result in additional discoveries.
Our ability to replenish our oremineral reserves is important to our long-term viability. Depleted ore reserves must be replaced by further delineation of existing oremineral bodies or by locating new deposits in order to maintain production levels over the long term. For example, in 2017 we made investments inDecisions to defer mine development activities may adversely impact our Tilden and Empire mines and in land in Minnesotaability to providesubstantially increase future potential ore reserves. Based on the economic reserve analysis performed during 2018, we revised the mine plan for Northshore to add ore reserves and extend mine life.mineral production. Resource exploration and development are highly speculative in nature. Exploration projects involve many risks, require substantial expenditures and may not result in the discovery of sufficient additional mineral deposits that can be mined profitably.economically. Once a site with mineralizationmineral body is discovered, it may take several years from the initial phases of drilling until production is possible, during which time the economic feasibility of production may change. Substantial expenditures are required to establish recoverable proven and probable reserves and to construct mining and processing facilities. As a result, there is no assurance that current or future exploration programs will be successful, and there is a risk that depletion of reserves will not be offset by discoveries or acquisitions.
We rely on estimates of our recoverable reserves, which is complex due to geological characteristics of the properties and the number of assumptions made.
We regularly evaluate our iron ore and coal reserves based on revenues and costs and update them as required in accordance with SEC Industry Guide 7 and will update, to the extent we are not already compliant, to complyregulations. We anticipate further updating our mining properties disclosure in accordance with the SEC'sSEC’s Final Rule 13-10570, Modernization of Property Disclosures for Mining Registrants, which became effective February 25, 2019, and which rescinds SEC Industry Guide 7. 7 following a two-year transition period, which means that we will be required to comply with the new rule no later than our fiscal year beginning January 1, 2021.
Estimates of reserves and future net cash flows necessarily depend upon a number of variable factors and assumptions, some of which are beyond our control, such as production capacity, effects of regulations by governmental agencies, future prices for iron ore and coal, future industry conditions and operating costs, severance and excise taxes, development costs, and costs of extraction and reclamation, all of which may vary considerably from actual results.reclamation. Estimating the quantity and grade of reserves requires us to determine the size, shape and depth of our mineral bodies by analyzing geological data, such as samplings of drill holes. In addition to the geology assumptions regarding our mines, assumptions are also required to determine the economic feasibility of mining these reserves, including estimates of future commodity prices and demand, the mining methods we use, and the related costs incurred to develop and mine our reserves. For these reasons, estimates of the economically recoverable quantities of mineralized deposits attributable to any particular group of properties, classifications of such reserves based on risk of recovery and estimates of future net cash flows prepared by different engineers or by the same engineers at different times may vary substantially as the criteria change. Estimated ore reserves could be affected by future industry conditions, future changes in the SEC'sSEC’s mining property disclosure requirements, geological conditions and ongoing mine planning. Actual volume and grade of reserves recovered, production rates, revenues and expenditures with respect to our reserves will likely vary from estimates, and if such variances are material, our sales and profitability could be affected adversely.adversely affected.
Defects in title or loss of any leasehold interests in our mining properties could limit our ability to mine these properties or result in significant unanticipated costs.
A portionMany of our mining operations are conducted on properties we lease, license or as to which we have easements or other possessory interests, which we refer to as "leased properties." Consistent with industry practice, title to most of these leased properties and mineral rights are not usually verified until we make a commitment to develop a property, which may not occur until after we have obtained necessary permits and completed exploration of the leased property. In some cases, title with respect to leased properties is not verified at all because we instead rely on title information or representations and warranties provided by lessors or grantors.interests. We generally do not maintain title insurance on our owned or leased mining properties. A title defect or the loss of any lease, license, easement or easementother possessory interest for any leased mining property
could adversely affect adversely our ability to mine any associated reserves. In addition, from time to time the rights of third parties for competing uses of adjacent, overlying or underlying lands, such as for roads, easements, and public facilities or other mining activities, may affect our ability to operate as planned if our title is not superior or mutually acceptable arrangements cannot be negotiated.
Any challenge to our title could delay the exploration and development of some reserves, deposits or surface rights, cause us to incur unanticipated costs, and could ultimately result in the loss of some or all of our interest in those reserves or surface rights. properties.
In the event we lose reserves, deposits or surface rights, we may havebe required to shut down or significantly alter the sequence of ourimpacted mining operations, which may affect adversely ourthereby affecting future production, revenues and cash flows. Additionally, if we lose any leasehold interests relating to any of our pellet plants or loadout facilities, we may need to find an alternative location to process our iron ore and load it for delivery to customers, which could result in significant unanticipated costs. Finally, we could incur significant liability if we inadvertently mine on property we do not own or lease.
In order to continue to foster growth in our businessbusinesses and maintain stability of our earnings, we must maintain our social license to operate with our stakeholders.
As a mining company, maintainingMaintaining a strong reputation and consistent operational, environmental and safety historytrack record is vital in order to continue to foster growth and maintain stability in our earnings. As stakeholders’ sustainability expectations increase and regulatory requirements continue to evolve, maintaining our social license to operate becomes increasingly important. We incorporate social license expectations in our ERM program. Our ability to maintain our reputation and strong operating historytrack record could be threatened, including by challenges relating to the integration of the AK Steel and ArcelorMittal USA businesses or by circumstances outside of our control, such as disasters caused or suffered by other companies in the steel and mining companies.industries. If we are not able to respond effectively to these and other challenges to our social license to operate, our reputation could be damaged significantly. Damage to our reputation could adversely affect adversely our operations and ability to foster growth in our company.projects.
Estimates and timelines relating to new development projects are uncertain and we may incur higher costs and lower economic returns than estimated.VI. HUMAN CAPITAL RISKS
Mining industry development projects typically require a number of years and significant expenditures before production is possible. Such projects could experience unexpected problems and delays during development, construction and start-up.
Our decision to develop a project typically is based on the results of feasibility studies, which estimate the anticipated economic returns of a project. The actual project profitability or economic feasibility may differ from such estimates as a result of any of the following factors, among others: changes in tonnage, grades and metallurgical characteristics of ore or other raw materials to be mined and processed; estimated future prices of the relevant product; changes in customer demand; higher construction and infrastructure costs; the quality of the data on which engineering assumptions were made; higher production costs; adverse geotechnical conditions; availability of adequate labor force; availability and cost of water and energy; availability and cost of transportation; fluctuations in inflation and currency exchange rates; availability and terms of financing; delays in obtaining environmental or other government permits or changes in laws and regulations including environmental laws and regulations; weather or severe climate impacts; and potential delays relating to social and community issues.
Our HBI project will require the commitment of substantial resources. Any unanticipated costs or delays associated with our HBI project could have a material adverse effect on our financial condition or results of operations.
Our ongoing efforts with respect to our HBI project require the commitment of substantial capital expenditures. We currently expect to incur capital expenditures through 2020 on the HBI project of approximately $830 million on the development of the HBI production plant in Toledo, Ohio, of which $180 million has already been incurred, and $90 million for upgrades at the Northshore plant to enable it to produce significantly increased levels of DR-grade pellets that could be used as feedstock for the HBI production plant and/or sold commercially. Each of these estimates are exclusive of construction-related contingencies and capitalized interest. Our estimated expenses may increase as personnel and equipment associated with advancing development and commercial production are added. The progress of our HBI project and the amounts and timing of expenditures will depend in part on the following:
•receiving and maintaining required federal, state and local permits;
completing infrastructure and construction work and the completion of commissioning and integration of all of the systems comprising our HBI production plant;
•negotiating sales contracts for our planned production; and
•other factors, many of which are beyond our control.
Most of these activities require significant lead times and must be advanced concurrently.
Any unanticipated costs or delays associated with our HBI project could have a material adverse effect on our financial condition or results of operations and could require us to seek additional capital, which may not be available on commercially acceptable terms or at all.
Our ability to realize the benefits of any potential acquisitions is uncertain.
Should we determine to pursue any acquisitions, the success of the same is subject to risks and uncertainties, including our ability to realize operating efficiencies expected from an acquisition; the size or quality of the mineral potential; delays in realizing the benefits of an acquisition; difficulties in retaining key employees, customers or suppliers of the acquired business; the risks associated with the assumption of contingent or undisclosed liabilities of acquisition targets; the impact of changes to our allocation of purchase price; and the ability to generate future cash flows or the availability of financing.
Moreover, any acquisition opportunities we pursue could affect materially our liquidity and capital resources and may require us to incur indebtedness, seek equity capital or both. Future acquisitions could also result in us assuming more long-term liabilities relative to the value of the acquired assets than we may have assumed in previous acquisitions.
Our profitability could be adversely affected adversely if we fail to maintain satisfactory labor relations.
Production in our minesOur production is dependent upon the efforts of our employees. We are party to labor agreements with various labor unions that represent employees at the majority of our operations. Such labor agreements are negotiated periodically, and, therefore, we are subject to the risk that these agreements may not be able to be renewed on reasonably satisfactory terms. It is difficult to predict what issues may arise as part of the collective bargaining process, and whether negotiations concerning these issues will be successful. Due to union activities or other employee actions, we could experience labor disputes, work stoppages or other disruptions in our production of iron ore that could affect us adversely. The USW represents all labor employees at our Mining and Pelletizing operations owned and/or managed by Cliffs or its subsidiary companies except for Northshore. OurWe have labor agreements with the USWthat will expire at four of our Miningfive locations in 2021 and Pelletizing operations were ratifiedsixteen locations in October 2018 and extended for a four-year term, effective as of October 1, 2018.
2022. If we enter into a new labor agreement with any union that significantly increases our labor costs relative to our competitors or fail to come to an agreement upon expiry, our ability to compete or continuity of production may be materially and adversely affected.
We may encounter labor shortages for critical operational positions, which could adversely affect adversely our ability to produce our products.
We are predicting a long-term shortage of skilled workers for the miningin heavy industry and in certain highly specialized IT roles, and competition for the available workers limits our ability to attract and retain employees as well as engage third-party contractors. As our experienced employees retire, we may have difficulty replacing them at competitive wages.
In addition, the ongoing COVID-19 pandemic has resulted and may continue to result in increased government restrictions and regulation, including quarantines of our personnel and potential inability to access facilities, which has adversely affected and could continue to adversely affect our operations.
Our expenditures for post-retirement benefitpension and pensionOPEB obligations could be materially higher than we have predicted if our underlying assumptions differ from actual outcomes, there are mine closures,regulatory changes or our joint venture partners fail to perform their obligations that relate to employee pension plans.
We provide defined benefit pension plans and OPEB to certain eligible union and non-union employees, including our share of expense and funding obligations with respect to our unconsolidated joint venture.ventures. Our pension and OPEB expenses and our required contributions to our pension and OPEB plans are affected directly by the value of plan assets, the projected and actual rate of return on plan assets, and the actuarial assumptions we use to measure our defined benefit pension plan obligations, including the rate at which future obligations are discounted.
We cannot predict whether changing market or economic conditions, regulatory changes or other factors will increase our pension and OPEB expenses or our funding obligations, diverting funds we would otherwise apply to other uses.
We have calculated our unfunded pension and OPEB obligations based on a number of assumptions, including our joint venture partners satisfying their funding obligations.assumptions. If our assumptions do not materialize as expected, cash expenditures and costs that we incur could be materially higher. Moreover, we cannot be certain that regulatory changes will not increase our obligations to provide these or additional benefits. These obligations also may increase substantially in the event of adverse medical cost trends or unexpected rates of early retirement, particularly for bargaining unit retirees. In addition, changes in the laws governing pensions could also materially adversely affect our costs and ability to meet our pension obligations.
We also contribute to certain multiemployer pension plans, including the Steelworkers’ Pension Trust, for which we are one of the largest contributing employers. If other contributors were to default on their obligations to contribute to any such plans, we could become liable for additional unfunded contributions to the plans.
In addition, some of the transactions in which we previously sold or otherwise disposed of our non-core assets included provisions transferring certain pension and other liabilities to the purchasers or acquirers of those assets. While we believe that all such transfers were completed properly and are legally binding, if the purchaser fails to fulfill its obligations, we may be at risk that a court, arbitrator or regulatory body could disagree and determine that we remain responsible for pension and other liabilities that we intended to and did transfer.
We depend on our senior management team and other key employees, and the loss of these employees could adversely affect our business.businesses.
Our success depends in part on our ability to attract, retain, develop and motivate our senior management and key employees. Achieving this objective may be difficult due to a variety of factors, including fluctuations in the global economic and industry conditions, competitors’ hiring practices, cost reduction activities, and the effectiveness of our compensation programs. Competition for qualified personnel can be intense. We must continue to recruit, retain, develop and motivate our senior management and key personnel in order to maintain our business and support our projects. A loss of senior management and key personnel could prevent us from capitalizing on business opportunities, and our operating results could be adversely affected. We are also subject to the risk that the COVID-19 pandemic may impact the health or effectiveness of members of our senior management team or other key employees.
|
| | | | |
| Item 1B. | Unresolved Staff Comments |
We have no unresolved comments from the SEC.
The following map shows the locations of our operations and offices as of December 31, 2018:2020:
Corporate Offices
We lease our corporate headquarters in Cleveland, Ohio. We also have leased office space in West Chester, Ohio and Chicago, Illinois. We own our office space located in Richfield, Ohio, and our Research and Innovation Center located in Middletown, Ohio.
Steelmaking
Steelmaking and Finishing Facilities
Below is a listing and description of our principal steelmaking and finishing facilities:
Burns Harbor is a fully integrated steelmaking facility located on Lake Michigan in Northwest Indiana, 50 miles southeast of Chicago. The location allows for prime shipping access to the Port of Indiana, as well as excellent highway and railroad transport. Burns Harbor’s major production facilities include coke plant operations, iron producing, steel producing, hot rolling and finishing and plate rolling and heat treating. The plant operates two blast furnaces and is capable of producing hot-rolled sheet, cold-rolled sheet and hot dip galvanized sheet. Burns Harbor is capable of producing nearly 5 million net tons of raw steel annually. Burns Harbor serves key markets including the automotive, appliance, construction, converters, distribution and pipe and tube markets.
Burns Harbor Plate and Gary Plate are located in Burns Harbor and Gary, Indiana, respectively, and are heat treating and finishing operations producing carbon steel plate, high-strength low alloy steel plate and ASTM grades steel plate. These operations serve the construction, distribution, energy, heavy equipment, infrastructure, military, pipe and tube, rail car and shipbuilding markets.
Butler Works is located in Butler, Pennsylvania, and produces stainless, electrical and carbon steel. Melting takes place in an EAF that feeds an argon-oxygen decarburization unit for the specialty steels. A ladle metallurgy furnace feeds two double-strand continuous casters, which are capable of producing 1 million net tons of raw steel annually. Butler Works also includes a hot rolling mill, annealing and pickling units and two tandem cold rolling mills. It also has various intermediate and finishing operations for both stainless and electrical steels. Butler Works primarily serves the power and distribution transformers and stainless and carbon converters markets.
The Cleveland facility is an integrated steelmaking facility strategically located on the Cuyahoga River in Cleveland, Ohio, with access to the Port of Cleveland and Great Lakes shipping, as well as excellent highway and railroad transport. The Cleveland facility is supplied with coke from our cokemaking operations in Warren, Ohio. Cleveland's major production facilities include two blast furnaces, two steel producing facilities, an 84-inch hot strip mill, a pickling line, a five-stand tandem mill, and a hot dip coating line. The plant's two blast furnaces feed the two steelmaking facilities, which are capable of producing more than 3 million net tons of raw steel annually. Products made at this location are hot-rolled, cold-rolled and hot-dipped galvanized sheet and semi-finished slabs. The Cleveland facility serves the automotive, construction, converters and distribution markets.
The Kote and Tek operations are located in New Carlisle, Indiana, and receive substantially all of their feedstock from Indiana Harbor via daily unit trains. Cleveland-Cliffs Tek is a continuous cold-rolling plant that is capable of producing 1.7 million net tons of sheet steel annually through a continuous descale cold mill and 1.0 million net tons of sheet steel annually through a continuous annealing processing line. Cleveland-Cliffs Kote has separate lines producing 0.5 million net tons of hot-dip galvanized and galvannealed and 0.5 million net tons of electrogalvanized sheet annually. The principal customers of Kote and Tek are in the automotive and appliance markets.
Coatesville is a steel plate production facility located in Coatesville, Pennsylvania, about 40 miles west of Philadelphia, Pennsylvania, and has access to highways and railroads. The facility produces steel from scrap in an EAF and is capable of producing approximately 0.8 million net tons of raw steel annually. The facility also operates ingot teeming facilities, a slab caster, two plate mills, heat-treating facilities, quench and temper and flame-cut shape facilities. The Coatesville facility refines more than 450 different steel chemistries and, together with the Conshohocken facility, produces some of the widest, thickest and heaviest steel plates in the industry. Steel plate products made at this location include carbon, high-strength low-alloy, commercial alloy, military alloy and flame-cut steel. Coatesville serves the aircraft and aerospace, construction, distribution, energy, heavy equipment, military, mold and tool and shipbuilding markets.
Our Columbus operationsinclude a hot-dip galvanizing facility in Columbus, Ohio, and a processing facility in nearby Obetz, Ohio. These operations are temporarily idled due to the COVID-19 pandemic. These central Ohio locations are able to utilize highway and rail transport shipping access. Two zinc pots enable the transition between
coatings to be accomplished in a timely manner while allowing for longer exposed runs. The plant produces hot-dip galvanized sheet using cold-rolled coils supplied by other Cliffs facilities and is capable of coating 450,000 net tons annually. The Columbus operations serve the automotive and distribution markets.
Conshohocken is a plate finishing facility located on the Schuylkill River adjacent to Philadelphia, Pennsylvania. The area is surrounded by highway and railroad systems that provide shipping access. Coatesville supplies steel plate to the Conshohocken plant, which operates heat treat, finishing and inspection facilities for steel plate finishing. The Conshohocken plant has a steckel mill that is currently idled, which is capable of producing coil and discrete plates. Conshohocken plate products are used in construction and military applications.
Coshocton Works is located in Coshocton, Ohio, and consists of a stainless steel finishing plant containing two Sendzimer mills and two Z-high mills for cold reduction, four annealing and pickling lines, bell annealing furnaces, two bright annealing lines, two temper mills, and other processing equipment, including temper rolling, slitting and a packaging line. Coshocton Works produces various flat-rolled stainless steel products including austenitic (chrome nickel) stainless steel grades, martensitic (chrome) stainless steel grades and ferritic (chrome) stainless steel grades, serving the automotive, appliance, distribution and medical markets among others.
Dearborn Works is located in Dearborn, Michigan, with carbon steel melting, casting, cold rolling and finishing operations for carbon steel. The major production facilities include a blast furnace, basic oxygen furnaces, two ladle metallurgy furnaces, a vacuum degasser, two slab casters, a pickling line tandem cold mill and a hot-dipped galvanizing line. Dearborn Works is capable of producing between 2 and 3 million net tons of raw steel annually. Products made at this location include carbon slabs, hot dip galvanized ZINCGRIP®, hot dip galvannealed ZINCGRIP GA steel and AHSS. Dearborn Works serves the automotive, heating, ventilation and air conditioning, converters and distribution markets. During 2020, the Dearborn Works hot strip mill, anneal and temper operations were permanently idled as part of our cost reduction efforts.
Indiana Harbor is one of the largest integrated steelmaking facilities in North America and is located in East Chicago, Indiana, just 20 miles southeast of Chicago, Illinois. The major production facilities include three blast furnaces, two of which are currently operating, a recycle plant, four basic oxygen furnaces, ladle metallurgy facilities and vacuum degassing, four continuous casting machines, a slab dimensioning facility, an 80-inch hot strip mill, a pickling line, a five-stand tandem mill, batch and continuous annealing, a temper mill and two hot-dip galvanizing lines. Indiana Harbor currently operates two blast furnaces capable of producing 5.5 million net tons of raw steel annually and has a diverse facility capable of making a full range of flat products, including AHSS, American Petroleum Institute pipe skelp, motor-laminations, automotive exposed and martinsitic grades. Indiana Harbor is a leader in North American development of new automotive products, and is a primary supplier of coils to Kote and Tek. Indiana Harbor serves the automotive, appliance, contractor applications, distribution, strip converters and tubular markets.
Mansfield Works is located in Mansfield, Ohio, and produces high chrome ferritics and martensitic stainless steels and semi-finished hot bands. The major production facilities include a melt shop with two EAFs, an argon oxygen decarburization unit, a ladle metallurgy facility, a thin slab continuous caster, a walking beam slab furnace and a hot rolling mill. The thin slab caster uses an advanced technology production system to meet customer specifications. Mansfield Works is capable of producing approximately 0.6 million net tons of raw steel annually. Mansfield Works serves the automotive and appliance for stainless products markets.
Middletown Works is an integrated steel operation with carbon steel melting, casting, hot and cold rolling, and finishing operations located in Middletown, Ohio. The major production facilities include a coke facility, a blast furnace, basic oxygen furnaces, a Composition Adjustment by Sealed argon bubbling – Oxygen Blowing (CAS-OB), a vacuum degasser and a continuous caster for the production of carbon steel, which is capable of producing nearly 3 million net tons of raw steel annually. Middletown Works also has a hot strip mill, pickling lines, a five-stand cold mill, an electrogalvanizing line, a hot dip carbon and stainless aluminizing line, a hot dip galvanizing line, box annealing furnaces, temper mills and an open coil annealing facility for finishing products. Products made at this location include hot-rolled and cold-rolled carbon steels, enameling steels, electrogalvanized ZINCGRIP ELECTRASMOOTH® steels, hot dip galvanized ZINCGRIP products and aluminized carbon and stainless steels. Middletown Works serves the automotive, appliance, heating, ventilation and air conditioning, culvert and distribution markets.
Piedmont is a finishing facility located in Newton, North Carolina, 50 miles northwest of Charlotte. The facility specializes in plasma cutting plate steel products into blanks for machinery and automotive manufacturers and primarily serves the truck axle blank business. Additionally, it provides services such as part leveling and just-in-time deliveries.
Riverdale is a compact strip mill that produces hot-rolled sheet located in Illinois, 14 miles west of our Indiana Harbor facility. The location allows for close shipping access to Lake Michigan, and is surrounded by highway and railroad systems. The Riverdale facility operates two basic oxygen furnaces, a ladle metallurgy facility, continuous thin slab caster, tunnel furnace and hot strip mill, which are capable of producing approximately 1 million net tons of thin-slab casting and rolling annually. The light gauge capabilities and tight gauge tolerances are desired characteristics for line pipe and structural and mechanical tubing producers. Principal products made at this plant include hot-rolled black bands in a full range of grades, including high carbon and alloy. The Riverdale facility primarily serves cold-rolled strip producers who supply the automotive, saw blade and strapping markets.
Rockport Works is located on the Ohio River in southwest Indiana near Rockport, Indiana. Rockport Works consists of a carbon and stainless steel finishing plant containing a continuous cold rolling mill, a continuous hot-dip galvanizing and galvannealing line, a continuous carbon and stainless steel pickling line, a continuous stainless steel annealing and pickling line, hydrogen annealing facilities and a temper mill. Utilizing innovative manufacturing technologies, the plant incorporates automated guidance vehicles and automated cranes to move the steel through the various finishing operations. Steels from Rockport Works include a full range of cold-rolled carbon, coated and stainless steels in either the annealed and pickled or temper rolled surface condition. Product offerings include a wide variety of AHSS. The Rockport Works hot dip galvanizing and galvannealing line incorporates revolutionary proprietary technologies, including induction transition heating, which provides rapid, accurate annealing temperature control. In addition, the Rockport Works line produces 80-inch sheet steel. Rockport Works serves the automotive, appliance, heating, ventilation and air conditioning and distribution for carbon and stainless markets.
Steelton is one of only three rail producers in North and South America and is located in Steelton, Pennsylvania, about 100 miles west of Philadelphia, Pennsylvania. Steelton consists of a 150 net ton direct current EAF with ladle refining and vacuum degassing, a three-strand continuous jumbo bloom caster and an ingot teeming facility. Steelton has an annual steelmaking capacity of 1 million net tons. Steelton produces railroad rails, specialty blooms and flat bars for use in railroad and forging markets.
Our Weirton facility is a tinplate facility located on the northern panhandle of West Virginia along the Ohio River in the city of Weirton, West Virginia. The location provides shipping access along the Ohio River, as well as highway and railroad shipping. Products made at this location include cold-rolled and tinplate products serving the distribution and packaging markets.
Zanesville Works is located on the Muskingum River in Zanesville, Ohio. The finishing facility's products include regular GOES and cold-rolled NOES. These specialty flat-rolled steels enable customers to create a variety of products, including generators, transformers and a host of other electrical devices. The primary markets Zanesville Works serves are the power and distribution transformers markets.
In the aggregate, we have annual production capacity of approximately 23 million net tons of raw steel. Due to the timing of the Acquisitions and the idling of facilities in response to impacts of the COVID-19 pandemic, our steelmaking facilities produced a total of 4 million net tons of raw steel during the year ended December 31, 2020.
Direct Reduction Plant, Iron Ore Mines and Pellet Plants
Our direct reduction plant is located in Toledo, Ohio, and is near an existing dock, has rail access and heavy haul roads for operation logistics. We are leasing the property on which the plant is located. Our Toledo direct reduction plant, which began production in the fourth quarter of 2020, produces a specialized high quality iron alternative to scrap and pig iron. The Toledo direct reduction plant has annual capacity of 1.9 million metric tons of HBI per year, and we expect to reach full production rate by the second quarter of 2021.
All of our iron ore mining operations are open-pit mines. Additional pit development is underway as required by long-range mine plans. Drilling programs are conducted periodically to collect modeling data and for refining ongoing operations.
Geologic models are developed for all mines to define the major ore and waste rock types. Computerized block models for iron ore are constructed that include all relevant geologic and metallurgical data. These are used to generate grade and tonnage estimates, followed by detailed mine design and life of mine operating schedules.
Mining and Pelletizing
The following map shows the locations of our Mining and Pelletizing segment operations:
We currently own or co-own fourfive operating iron ore mines in Michigan and Minnesota, as well as one indefinitely idled mine in Michigan. Following the AM USA Transaction, we now have an aggregate annual production capacity of approximately 28 million long tons of iron ore pellets, including our 85.3% share of the Hibbing mine production. Historically, our share of production capacity was approximately 21 million long tons of iron ore pellets
annually. We produced 20.317 million, 18.820 million and 16.020 million long tons of iron ore pellets in 2020, 2019 and 2018, 2017 and 2016, respectively, at those mines for our account. We produced 6.0 million, 6.7 million and 7.4 million long tons, respectively, on behalf of current and previous steel company partners of the mines.
respectively.
Our Mining and Pelletizing segmentiron ore mines produce from deposits located within the Biwabik and Negaunee Iron Formation, which are classified as Lake Superior type iron formations that formed under similar sedimentary conditions in shallow marine basins approximately two billion years ago. Magnetite and hematite are the predominant iron oxide ore minerals present, with lesser amounts of goethite and limonite. Quartz is the predominant waste mineral present, with lesser amounts of other chiefly iron bearing silicate and carbonate minerals. The ore minerals liberate from the waste minerals upon fine grinding.
|
| | | | | | | | | | | | | | | | |
| Mine | | Cliffs Ownership | | Infrastructure | | Mineralization | | Operating Since | | Current Annual Capacity1,2 | | 2018 Production1,2 | | Mineral Owned | | Rights Leased |
Empire3,4 | | 100% | | Mine, Concentrator, Pelletizer | | Magnetite | | 1963 | | * | | — | | 53% | | 47% |
Tilden4 | | 100% | | Mine, Concentrator, Pelletizer, Railroad | | Hematite & Magnetite | | 1974 | | 8.0 | | 7.7 | | 100% | | —% |
| Northshore | | 100% | | Mine, Concentrator, Pelletizer, Railroad | | Magnetite | | 1990 | | 6.0 | | 5.6 | | —% | | 100% |
| United Taconite | | 100% | | Mine, Concentrator, Pelletizer | | Magnetite | | 1965 | | 5.4 | | 5.2 | | —% | | 100% |
| Hibbing | | 23% | | Mine,
Concentrator,
Pelletizer | | Magnetite | | 1976 | | 8.0 | | 7.8 | | 3% | | 97% |
| | | | | | | | | | | | | | | | | |
1 Reported on a wet basis in millions of long tons, equivalent to 2,240 pounds. |
2 Figures reported on 100% basis. |
3 Empire was indefinitely idled beginning August 2016. |
4 During 2017, our ownership interest in Tilden and Empire increased to 100%. |
| * Historically, Empire had an annual capacity of 5.5 million long tons; currently indefinitely idled. |
Empire Mine
The EmpireHibbing mine is located onin the Marquettecenter of Minnesota’s Mesabi Iron Range and is approximately ten miles north of Hibbing, Minnesota, and five miles west of Chisholm, Minnesota. We own an 85.3% interest in Michigan’s Upper Peninsula approximately 15 miles southwestthe Hibbing mine, which has been operating since 1976. A subsidiary of Marquette, Michigan. The EmpireU.S. Steel owns the remaining 14.7% of the Hibbing mine. Prior to the AM USA Transaction, we owned 23% of Hibbing, ArcelorMittal USA had a 62.3% interest and U.S. Steel had a 14.7% interest. On December 9, 2020, as a result of the AM USA Transaction, we acquired an additional 62.3% ownership stake in the Hibbing mine has had noand became the majority owner and mine manager. Each partner takes its share of production sincepro rata; however, provisions in the indefinite idle began in August 2016, comparedjoint venture agreement allow additional or reduced production to historically having an annual capacity ofbe delivered under certain circumstances. In 2020, the Hibbing mine produced 5.5 million long tons of iron ore pellets.
During 2017, our ownership interest in Empire increased to 100% as we reached an agreement to distribute the noncontrolling interest net assets to ArcelorMittal, in exchange for its interest in Empire. Prior to the indefinite idle, operations consistedpellets, of an open pit truck and shovel mine, a concentrator that utilizes single stage crushing, AG mills, magnetic separation and floatation to produce a magnetite concentrate that was then supplied to the on-site pellet plant. From the site, pellets were transported by CN rail to a ship loading port at Escanaba, Michigan, operated by CN.
Tilden Mine
The Tilden mine is located on the Marquette Iron Range in Michigan’s Upper Peninsula approximately five miles south of Ishpeming, Michigan. Over the past five years, the Tilden mine has produced between 7.6 million and 7.7which 1.6 million long tons of iron ore pellets annually. During 2017, we acquired the remaining 15% equity interest in Tilden owned by U.S. Steel. With the closing of this transaction, we now have 100% ownership of the mine. We own allwere for our account. Hibbing owns 3% of the ore reserves at the Tilden mine. Operationsand leases 97% via multiple mineral leases having varying expiration dates. Mining leases routinely are renegotiated and renewed as they approach their respective expiration dates. Hibbing operations consist of an open pit truck and shovel mine, a concentrator that utilizes single stage crushing, AG mills magnetiteand magnetic separation and floatation to produce hematite anda magnetite concentrates that areconcentrate, which is then supplieddelivered to thean on-site pellet plant. From the site, pellets are transported by our LS&IBNSF rail to a ship loading port at Marquette, Michigan,Superior, Wisconsin, operated by LS&I.BNSF.
Northshore MineThe Minorca mine is located in the center of Minnesota’s Mesabi Iron Range near Virginia, Minnesota. In 2020, the mine produced 2.8 million long tons of iron ore pellets, of which approximately 0.2 million long tons were produced during the period subsequent to the AM USA Transaction. We own 100% of the Minorca mine, which has been operating since 1977, and lease 100% of the mineral rights. Mining is conducted on multiple mineral leases having varying expiration dates. Mining leases routinely are renegotiated and renewed as they approach their respective expiration dates. This operation includes a concentrating and pelletizing facility, along with two open pit iron ore mines located approximately seven miles from the processing facilities. The processing operations consist of a crushing facility, a three-line concentration facility and a single-line straight grate pelletizing plant. Pellets are transported by CN rail to ports on Lake Superior and shipped to Indiana Harbor located in East Chicago, Indiana.
The Northshore mine is located in northeastern Minnesota, approximately two miles south of Babbitt, Minnesota, on the northeastern end of the Mesabi Iron Range. Northshore’s processing facilities are located in Silver Bay, Minnesota, near Lake Superior. Over the past five years,In 2020, the Northshore mine has produced between 3.2 million and 5.63.8 million long tons of iron ore pellets, annually. The Northshore mine was idled from January through May 2016. The temporary idle was a result of historic levels of steel imports into the U.S.including both standard and reduced demand from our steel-producing customers. In 2018, we began our low silica capital upgrade to produce DR-grade pellets on a commercial scale while maintaining overall production capacity of the Northshore processing facility. We expect to complete the project in 2019. Once complete, we will be able to produce 3.5 million long tons of DR-grade pellets. Throughout 2018 and 2017 the Northshore mine was substantially at full production levels.
The Northshore mine began production under our management and ownership in October 1994. We own 100% of the mine.Northshore mine, which has been operating since 1990, and lease 100% of the mineral rights. Mining is conducted on multiple mineral leases having varying expiration dates. Mining leases routinely are renegotiated and renewed as they approach their respective expiration dates. Northshore operationsOperations consist of an open pit truck and shovel mine where two stages of crushing occur before the ore is transported along a wholly owned 47-mile rail line to the plant site in Silver Bay. At the plant site, two additional stages of crushing occur before the ore is sent to the concentrator. The concentrator utilizes rod mills and magnetic separation to produce a magnetite concentrate, which is delivered to the pellet plant located on-site. The plant site has its own ship loading port located on Lake Superior.
United Taconite MineThe Tilden mine is located on the Marquette Iron Range in Michigan’s Upper Peninsula approximately five miles south of Ishpeming, Michigan. In 2020, the Tilden mine produced 6.3 million long tons of iron ore pellets. We own 100% of the Tilden mine, which has been operating since 1974. We own 91% and lease the remaining 9% of the ore reserves. Operations consist of an open pit truck and shovel mine, a concentrator that utilizes single stage crushing, AG mills, magnetite separation and floatation to produce hematite and magnetite concentrates that are then supplied to the on-site pellet plant. From the site, pellets are transported by our LS&I rail to a ship loading port at Marquette, Michigan, operated by LS&I.
The United Taconite mine is located on Minnesota’s Mesabi Iron Range in and around the city of Eveleth, Minnesota. The United Taconite concentrator and pelletizing facilities are located ten miles south of the mine, near the town of Forbes, Minnesota. Over the past five years,In 2020, the United Taconite mine has produced between 1.5 million and 5.2 million long tons of iron ore pellets annually. The United Taconite mine was temporarily idled from January through August 2016. The temporary idle was a result of historic levels of steel imports into the U.S. and reduced demand from our steel-producing customers. Throughout 2018 and 2017 the United Taconite mine was substantially at full production levels.
pellets. We own 100% of the United Taconite mine.mine, which has been operating since 1965, and lease 100% of the mineral rights. Mining is conducted on multiple mineral leases having varying expiration dates. Mining leases routinely are renegotiated and renewed as they approach their respective expiration dates. United Taconite operations consist of
an open pit truck and shovel mine where two stages of crushing occur before the ore is transported by rail, operated by CN, to the plant site. At the plant site an additional stage of crushing occurs before the ore is sent to the concentrator. The concentrator utilizes rod mills and magnetic separation to produce a magnetite concentrate, which is delivered to the on-site pellet plant. From the plant site, pellets are transported by CN rail to a ship loading port at Duluth, Minnesota, operated by CN.
Hibbing MineThe Empire mine was indefinitely idled in 2016 and had an annual iron ore pellet production capability of 6 million long tons. We own 47% of the ore reserves and lease the remaining 53%.
The Hibbing mineCoal Mining and Cokemaking
Princeton is a coal mining complex located in West Virginia that specializes in surface and underground mining of metallurgical coal to produce coke and pulverized coal injection coal. We have annual rated metallurgical coal production capacity of 2.3 million net tons from our Princeton mine. In 2020, the centermine produced approximately 1.6 million net tons of Minnesota’s Mesabi Iron Range and iscoal, of which approximately ten miles north of Hibbing, Minnesota, and five miles west of Chisholm, Minnesota.0.1 million net tons were produced during the period subsequent to the AM USA Transaction. We are the managerown 100% of the HibbingPrinceton mine, and rely on our joint venture partners to make their required capital contributions and to pay for their sharewhich has been operating since 1995. We own 52% of the iron ore pellets that we produce. In 2018, we tendered our resignation as the mine manager of the Hibbing minecoal reserves and plan to transition this role to the majority owner in August 2019. Over the past five years, the Hibbing mine has produced between 7.7 million and 8.2 million long tons of iron ore pellets annually. We own 23% of Hibbing, a subsidiary of ArcelorMittal has a 62.3% interest and a subsidiary of U.S. Steel has a 14.7% interest. Each partner takes its share of production pro rata; however, provisions in the joint venture agreement allow additional or reduced production to be delivered under certain circumstances. Mining is conducted onlease 48% via multiple mineral leases having varying expiration dates. Mining leases routinely are renegotiated and renewed as they approach their respective expiration dates. HibbingPrinceton's operations consist of an open pit trucktwo open-pit surface mines, two underground mines, a preparation plant and shovel mine, a concentrator that utilizes single stage crushing, AGtwo rail loadouts.
In 2020, our cokemaking facilities produced between 2.0 million and 2.5 million net tons of coke, of which approximately 0.6 million net tons were produced during the period subsequent to the respective date of acquisition for each facility. Mountain State Carbon produces furnace coke and related by-products from its plant in Follansbee, West Virginia, which consists of four batteries. Monessen produces furnace coke and related by-products in Monessen, Pennsylvania, and is temporarily idled due to the COVID-19 pandemic. Warren produces furnace coke and related by-products from its plant in Warren, Ohio, and supplies the Cleveland facility. We also operate cokemaking facilities located within Burns Harbor and Middletown Works.
Other Businesses
Our Tubular operating segment consists of our subsidiary Tubular Components, which has plants in Walbridge, Ohio; Columbus, Indiana; and Queretaro, Mexico. The Walbridge plant operates six electric resistance welded tube mills. The Columbus plant also operates six electric resistance welded tube mills and magnetic separationfour high-speed cold saws on leased property. The plant in Queretaro, Mexico is currently in the process of being shut down and has ceased tube production. The Queretaro plant is located on leased land in a leased building, under a lease that expires in April 2021. The high-speed cold saw that was operating at the Queretaro plant has already been relocated to produce a magnetite concentrate,the Columbus plant and the tube mill will be returned to the U.S. and replace an existing, older tube mill currently in operation.
Our Tooling and Stamping operating segment consists of our subsidiary Precision Partners, which is then delivered to an on-site pellet plant. From the site, pellets are transported by BNSF rail to a ship loading port at Superior, Wisconsin, operated by BNSF.
Asia Pacific Iron Ore
In January 2018, we announced that we would accelerate the time frameprovides advanced-engineered solutions, tool design and build, hot- and cold-stamped steel components and complex assemblies for the planned closureautomotive market across ten plants, of our Asia Pacific Iron Ore mining operationswhich certain of these are under long-term lease agreements, in Australia. In April 2018, we committedOntario, Alabama and Kentucky. Its facilities feature seven large-bed, hot-stamping presses, providing 13 lines of production; 81 cold-stamping presses ranging from 150 net tons to a course of action leading to the permanent closure of our Asia Pacific Iron Ore mining operations and, as planned, completed our final shipment in June 2018. Factors considered in this decision included increasingly discounted prices for lower-iron-content ore and the quality of the remaining iron ore reserves.
During 2018, we sold all of the assets of our Asia Pacific Iron Ore business through a series of sales to third parties. As a result of our planned exit, management determined that our Asia Pacific Iron Ore operating segment met the criteria to be classified as held for sale and a discontinued operation under ASC Topic 205, Presentation of Financial Statements. As such, all current and historical Asia Pacific Iron Ore operating segment results are classified within discontinued operations.
Over the past five years, the Koolyanobbing operation produced between 2.7 million and 11.8 million metric3,000 net tons of iron ore products annually. Ore material was sourced from various separate open pit minespressing capacity; 17 large-bed, high-tonnage tryout presses with prove-out capabilities for new tool builds; and was delivered by typical production trucks or road trains to a crushing and screening facility located at Koolyanobbing. All of the ore from the Koolyanobbing operations was transported by rail to the Port of Esperance, 360 miles to the south, for shipment to Asian customers.
Refer to NOTE 13 - DISCONTINUED OPERATIONS for further discussion of the Asia Pacific Iron Ore segment.
General Information about our HBI Production Plant
The brownfield site selected for our HBI production plant is near the Port of Toledo, in northwestern Ohio, approximately 120 miles from our corporate headquarters in Cleveland, Ohio.144 multi-axis welding assembly cells. We are leasing the property on which the plant is being constructed. Our Toledo plant is expected to produce HBI, a specialized high quality iron alternative to scrap and pig iron, at a rate of 1.9 million metric tons per year when brought to production. Our Toledo site is located in close proximity to future EAF customersalso in the Great Lakes region. In addition, the Toledo site is near an existing dock, has rail access and heavy haul roads forprocess of constructing a new Precision Partners facility in Tennessee. We expect to complete construction and operation logistics.begin production of prototype components in the third quarter of 2021, and expect to reach commercial production in the first quarter of 2022.
Mineral Policy
We have a corporate policy prescribing internal controls and procedures with respect to auditing and estimating of minerals. The procedures contained in the policy include the calculation of mineral estimates at each property by our engineers, geologists and accountants, as well as third-party consultants. Management compiles and reviews the calculations, and once finalized, such information is used to prepare the disclosures for our annual and quarterly reports. The disclosures are reviewed and approved by management, including our chief executive officer and chief financial officer. Additionally, the long-range mine planning and mineral estimates are reviewed annually by our Audit Committee. Furthermore, all changes to mineral estimates, other than those due to production, are adequately documented and submitted to senior operations officers for review and approval. Finally, periodic reviews of long-range mine plans and mineral reserve estimates are conducted at mine staff meetings, senior management meetings and by independent experts.
Reserves are defined by SEC Industry Standard Guide 7 as that part of a mineral deposit that could be economically and legally extracted and produced at the time of the reserve determination. All reserves are classified as proven or probable and are supported by life-of-mine plans.
Reserve estimates are based on pricing that does not exceed the three-year trailing average index price of iron ore and coal adjusted to our realized price. We evaluate and analyze mineral reserve estimates in accordance with our mineral policy and SEC requirements. The table below identifies the year in which the latest reserve estimate was completed.
|
| | | | | | | |
Mining and Pelletizing |
| Property | | Date of Latest Economic
Reserve Analysis
|
TildenIron ore mines: | | 2015 |
NorthshoreHibbing | | 20182015 |
United TaconiteMinorca | | 20162019 |
HibbingNorthshore | | 20152020 |
| Tilden | | 2019 |
| United Taconite | | 2019 |
| Coal mines: | | |
| Princeton | | 2019 |
Ore reserve estimates for our iron ore mines as of December 31, 2018 were estimated from fully designed open pits developed using three-dimensional modeling techniques. These fully designed pits incorporate design slopes, practical mining shapes and access ramps to assure the accuracy of our reserve estimates. All operations' reserves have been adjusted net of production through 2018.2020.
All tonnages reported for our Mining and Pelletizing operating segment are in long tons of 2,240 pounds and are reported on a 100% basis.The following represents iron ore mineral reserves:
| | | | | | | | | | | | | | | | | | | | | | | | | | | | | | | | | | | |
| Iron Ore Mineral Reserves |
| as of December 31, 2020 |
| (In Millions of Long Tons) |
| | Proven | | Probable | | Proven & Probable | | |
| Property | | Tonnage | % Grade | | Tonnage | % Grade | | Tonnage | % Grade3 | | Process Recovery4 |
Hibbing1 | | 76 | | 19.7 | | | 25 | | 19.6 | | | 101 | | 19.7 | | | 27% |
| Minorca | | 113 | | 23.6 | | | 7 | | 25.3 | | | 120 | | 23.7 | | | 31% |
| Northshore | | 318 | | 25.3 | | | 519 | | 24.1 | | | 837 | | 24.6 | | | 29% |
Tilden2 | | 168 | | 35.2 | | | 418 | | 34.8 | | | 586 | | 34.8 | | | 34% |
| United Taconite | | 158 | | 23.1 | | | 631 | | 22.1 | | | 789 | | 22.3 | | | 31% |
| Total | | 833 | | | | 1,600 | | | | 2,433 | | | | |
| | | | | | | | | | | |
1 The Hibbing mine is reported on a 100% basis, of which, our ownership is 85.3%. |
2 Tilden hematite reported grade is percent FeT; all other properties are percent magnetic iron. |
3 Cutoff for Tilden hematite is 25% FeT. Cutoff grades for magnetic ore are 20% for Tilden, 19% for Northshore, 16% for Minorca, 17% for United Taconite and 15% for Hibbing. |
4 Process recovery includes all factors for converting crude ore tonnage, shown above, to a dry saleable product. |
The following represents recoverable coal reserves:
| | | | | | | | | | | | | | | | | | | | | | | | | | | | | | | | | | | | | | |
| Recoverable Coal Reserves |
| as of December 31, 2020 |
| (In Millions of Net Tons) |
| | Proven | | Probable | | Proven & Probable |
| Property | | ROM | Wet Recovery | | ROM | Wet Recovery | | ROM | Wet Recovery | Ash % | Sulfur % | Volatile % |
| Princeton Coal | | 69.5 | | 44.7 | | | 26.5 | | 11.0 | | | 96.0 | | 55.7 | | 5% | 0.7% | 18% |
|
| | | | | | | | | | | | | | | | | | | | | | | | | | |
| Mining and Pelletizing Mineral Reserves |
| as of December 31, 2018 |
| (In Millions of Long Tons) |
| | | | Proven | | Probable | | Proven & Probable | | Saleable Product2,3 | | Previous Year |
| Property | Cliffs Share | | Tonnage | % Grade | | Tonnage | % Grade | | Tonnage | % Grade5 | | Process Recovery4 | Tonnage | | Proven & Probable Crude Ore | Saleable Product |
Tilden1 | 100 | % | | 241.7 |
| 34.6 |
| | 82.7 |
| 33.9 |
| | 324.4 |
| 34.4 |
| | 38% | 122.1 |
| | 346.3 |
| 129.2 |
|
| Northshore | 100 | % | | 299.5 |
| 25.3 |
| | 535.6 |
| 23.7 |
| | 835.1 |
| 24.3 |
| | 32% | 270.1 |
| | 793.2 |
| 255.9 |
|
| United Taconite | 100 | % | | 398.9 |
| 22.5 |
| | 415.5 |
| 21.9 |
| | 814.4 |
| 22.2 |
| | 32% | 259.5 |
| | 829.1 |
| 264.6 |
|
| Hibbing | 23 | % | | 125.1 |
| 19.7 |
| | 24.7 |
| 19.6 |
| | 149.8 |
| 19.7 |
| | 27% | 39.7 |
| | 178.7 |
| 47.2 |
|
| Totals | | | 1,065.2 |
| | | 1,058.5 |
| | | 2,123.7 |
| | | | 691.4 |
| | 2,147.3 |
| 696.9 |
|
| | | | | | | | | | | | | | | | | |
1 Tilden hematite reported grade is percent FeT; all other properties are percent magnetic iron. |
2 Saleable product is a standard pellet containing 60% to 66% Fe calculated from both proven and probable mineral reserves. |
3 Saleable product is reported on a dry basis; shipped products typically contain 1% to 4% moisture. |
4 Process recovery includes all factors for converting crude ore tonnage to saleable product. |
5 Cutoff grades are 15% magnetic iron for Hibbing, 17% for United Taconite, 19% for Northshore and 20% for Tilden. Cutoff for Tilden hematite is 25% FeT. |
41
Bluestone Litigation. On April 7, 2017, the Company was served with an Amended Complaint adding Cliffs, among others, as a defendantLegal Proceedings Relating to a lawsuit brought by Bluestone Coal Corporation and Double-Bonus Mining Company against Pinnacle Mining Company, LLC and Target Drilling, Inc. in the U.S. District Court for the Southern District of West Virginia. The Amended Complaint alleges that the defendants deviated from plans authorized by plaintiffs and MSHA in the drilling of a borehole in 2013 and 2014 at the Pinnacle mine and through an inactive portion of plaintiffs’ mine. Plaintiffs further allege negligence and trespass in the drilling of the borehole and claim compensatory and punitive damages due to flooding. On October 3, 2018, the parties reached a settlement in full. We do not believe that our portion of the agreed-upon amount will have a material adverse impact on our business. The Court entered an order dismissing the case with prejudice subject to reopening on good cause shown within 90 days. However, on October 14, 2018, Mission Coal Company, LLC and ten of its affiliates, including Pinnacle Mining Company, LLC, filed a petition in the U.S. Bankruptcy Court for the Northern District of Alabama for relief under Chapter 11 of Title 11 of the U.S. Bankruptcy Code. We are reviewing this bankruptcy petition but do not believe it will have a material adverse effect on our settlement. In light of the Mission Coal bankruptcy, the Court granted plaintiffs' motion to extend the deadline for potentially reopening the Bluestone case on good cause shown for an additional 120 days.Business
CCAA Proceedings. Refer to NOTE 13 - DISCONTINUED OPERATIONS for a description of the CCAA proceedings with respect to the Bloom Lake Group and the Wabush Group. Such description is incorporated by reference into this Item 3.
Mesabi Metallics Adversary Proceeding. On September 7, 2017, Mesabi Metallics Company LLC (f/k/a Essar Steel Minnesota LLC) ("Mesabi Metallics") filed a complaint against Cleveland-Cliffs Inc. in the Essar Steel Minnesota LLC and ESML Holdings Inc. bankruptcy proceeding that is pending in the United States Bankruptcy Court, District of Delaware. Mesabi Metallics alleges tortious interference with its contractual rights and business relations involving certain vendors, suppliers and contractors, violations of federal and Minnesota antitrust laws through monopolization, attempted monopolization and restraint of trade, violation of the automatic stay, and civil conspiracy with unnamed Doe defendants. Mesabi Metallics amended its complaint to add additional defendants, including, among others, our subsidiary, Cleveland-Cliffs Minnesota Land Development Company LLC ("Cliffs Minnesota Land"), and to add additional claims, including avoidance and recovery of unauthorized post-petition transfers of real estate interests, claims disallowance, civil contempt and declaratory relief. Mesabi Metallics seeks, among other things, unspecified damages and injunctive relief. Cliffs and Cliffs Minnesota Land filed counterclaims against Mesabi Metallics, Chippewa Capital Partners ("Chippewa"), and Thomas M. Clarke ("Clarke") for tortious interference and civil conspiracy, as well as additional claims against Chippewa and Clarke for aiding and abetting tortious interference, for which we seek, among other things, damages and injunctive relief. Our counterclaim against Clarke for libel was dismissed on jurisdictional grounds. The parties filed various dispositive motions on certain of the claims, including a motion for partial summary judgment to settle a dispute over real estate transactions between Cliffs Minnesota Land and Glacier Park Iron Ore Properties LLC ("GPIOP"). A ruling in favor of Cliffs, Cliffs Minnesota Land and GPIOP was issued on July 23, 2018, finding that Mesabi'sMesabi Metallics' leases had terminated and upholding Cliffs' and Cliffs Minnesota Land's purchase and lease of the contested real estate interests. Mesabi Metallics filed a Motion for Leave to File an Interlocutory Appeal, which was denied on September 10, 2019. Discovery is fully briefed. The parties have filed additional motions for partial summary judgment and motions to dismiss with respect to other pending claims and counterclaims.ongoing. We believe the claims asserted against us are unmeritoriouswithout merit, and we intend to continue to vigorously defend against any remaining claims in the lawsuit.
Seneca Coal Resources Litigation. We areMesabi Trust Arbitration. On December 9, 2019, Mesabi Trust filed a plaintiffdemand for arbitration with the American Arbitration Association against Northshore and Cleveland-Cliffs Inc. alleging various breaches of a royalty agreement under which Northshore extracts iron ore from Mesabi Trust lands in a lawsuitreturn for paying royalties to Mesabi Trust. In its demand, Mesabi Trust asserts that we filed against Seneca Coal Resources, LLC and othersimproperly based royalty payments for intercompany sales of DR-grade pellets on December 20, 2016, alleging, among other things, breachartificially low pricing of the Unit Purchase Agreement (“UPA”) dated December 22, 2015, wherein Seneca purchased certainDR-grade pellet sales to one of our coal properties. That dispute, whicharms’ length third-party customers. Mesabi Trust further asserts that we amendedpaid royalties too soon on DR-grade pellets stockpiled at Northshore and destined for shipment to our Toledo direct reduction plant. The allegations also include claims of fraudulent transfersfailure to provide access to information and violations ofindividuals necessary to determine compliance with the Racketeer Influencedroyalty agreement. In addition to seeking damages and Corrupt Organizations provisions ofcosts, Mesabi Trust seeks declarations as to the Organized Crime Control Act of 1970 against individual defendants, including Clarke, is currently being litigated in Delaware Superior Court. On July 2, 2018, Seneca filed suit against us, a subsidiary of ours,methodology and certaintiming for calculating royalties on our intercompany DR-grade pellet sales, and that Mesabi Trust should have full and unfettered access to all of our employees,information and employees. During 2020, the parties appointed a three-member arbitration panel and engaged in the Delaware Chancery Court, alleging that we failed to disclose certain liabilities in connection with the UPA and seeking monetary damages or, alternatively, reformation of the UPA.discovery. The lawsuit filed in Chancery Court asserts identical claims to those that Seneca filed as counterclaims in Delaware Superior Court on the same day, and the two cases will proceed as one consolidated matter in the Superior Court. We have filed motions to dismiss certain claims against us and to dismiss all claims against our employees individually.arbitration hearing is scheduled for May 2021. We believe the claims Seneca has asserted against us are unmeritoriouswithout merit, and we intend to vigorously pursue this lawsuit and defend against the related counterclaims. On October 14, 2018, Mission Coal Company, LLC and ten of its affiliates, including Seneca and certainthem.
Certain Legacy Legal Proceedings Relating to our Steel Operations. Certain of our former coal properties,acquired subsidiaries have been named as defendants, among many other named defendants, in numerous lawsuits filed a petitionsince 1990 claiming injury allegedly resulting from exposure to asbestos. Similar lawsuits seeking monetary relief continue to be filed in various jurisdictions in the U.S. Bankruptcy Court, which cases are vigorously defended. Although predictions about the outcome of pending litigation is subject to uncertainties, based upon present knowledge, we believe it is unlikely that the resolution in the aggregate of these claims will have a materially adverse effect on our consolidated results of operations, cash flows or financial condition.
Legal Proceedings Relating to Environmental Matters
SEC regulations require us to disclose certain information about administrative or judicial proceedings involving the environment and to which a governmental authority is a party if we reasonably believe that such proceedings may result in monetary sanctions above a stated threshold. Pursuant to SEC regulations, we use a threshold of $1 million for purposes of determining whether disclosure of any such proceedings is required. We believe that this threshold is reasonably designed to result in disclosure of any such proceedings that are material to our business or financial condition. Applying this threshold, we are disclosing the following environmental proceedings for the Northern Districtperiod covered by this report:
Dearborn Works Air NOVs. On November 18, 2019, November 26, 2019, and March 16, 2020, EGLE issued NOVs with respect to the basic oxygen furnace electrostatic precipitator at Dearborn Works alleging violations of Alabama for relief under Chapter 11manganese, lead and opacity limits. We are investigating these claims and will work with EGLE to attempt to resolve
them. We intend to vigorously contest any claims that cannot be resolved through a settlement. Until a settlement is reached with EGLE or the claims of the U.S. Bankruptcy Code. On December 4, 2018,NOVs are otherwise resolved, we cannot reasonably estimate the Court entered an order staying allcosts, if any, associated with any potentially required work.
Additional information for this item relating to certain other environmental proceedings may be found under the headings EPA Administrative Order In Re: Ashland Coke and Burns Harbor Water Issues in this litigation dueNOTE 21 - COMMITMENTS AND CONTINGENCIES to Mission Coal Company's bankruptcy filing.the consolidated financial statements in Part II – Item 8. Financial Statements and Supplementary Data, which information is incorporated herein by reference.
Taconite MACT Compliance Review. EPA Region 5 issued Notices of Violation during the first quarter of 2014 to Empire, Tilden and United Taconite related to alleged historical violations of the Taconite MACT rule and certain elements of their respective state-issued Title V operating permits dating back to 2010. EPA proposed, and we agreed to, a tolling agreement which targeted a completion of the enforcement action by March of 2019. Based on current information, we anticipate the final settlement for alleged exceedances at United Taconite to be resolved by consent decree with a civil cash penalty of less than $0.1 million and a supplemental environmental project. We anticipate the final settlement for alleged exceedances at Tilden and Empire to be resolved by consent decree with a total penalty of no more than $0.2 million and $0.1 million, respectively, to be comprised of a combination of cash penalty and a potential supplemental environmental project. This enforcement matter is not anticipated currently to have a material adverse impact on our business.
|
| | | | |
| Item 4. | Mine Safety Disclosures |
We are committed to protecting the occupational health and well-being of each of our employees. Safety is one of our core values, and we strive to ensure that safe production is the first priority for all employees. Our internal objective is to achieve zero injuries and incidents across the Company by focusing on proactively identifying needed prevention activities, establishing standards and evaluating performance to mitigate any potential loss to people, equipment, production and the environment. We have implemented intensive employee training that is geared toward maintaining a high level of awareness and knowledge of safety and health issues in the work environment through the development and coordination of requisite information, skills and attitudes. We believe that through these policies, we have developed an effective safety management system.
Under the Dodd-Frank Act, each operator of a coal or other mine is required to include certain mine safety results within its periodic reports filed with the SEC. As required by the reporting requirements included in §1503(a) of the Dodd-Frank Act and Item 104 of Regulation S-K, the required mine safety results regarding certain mining safety and health matters for each of our mine locations that are covered under the scope of the Dodd-Frank Act are included in Exhibit 95 of Part IV –Item 15. Exhibits and Financial Statement Schedules of this Annual Report on Form 10-K.
PART II
|
| | | | |
| Item 5. | Market for Registrant's Common Equity, Related Stockholder Matters and Issuer Purchases of Equity Securities |
Stock Exchange Information
Our common shares (ticker symbol CLF) are listed on the NYSE.
Holders
At February 5, 2019,24, 2021, we had 1,1532,586 shareholders of record.
Dividends
On October 18, 2018, the Board of Directors declared a quarterly cash dividend on our common shares of $0.05 per share. The cash dividend was paid on January 15, 2019, to shareholders of record as of the close of business on January 4, 2019. The Board of Directors determined that the cash dividend may be paid out of capital surplus. Any determination to pay dividends on our common shares in the future will be at the discretion of our Board of Directors and dependent upon then-existing conditions, including our operating results and financial condition, capital requirements, contractual restrictions, business prospects and other factors that our Board of Directors may deem relevant. Additionally, our ABL Facility contains, and agreements governing any of our future debt may contain, covenants and other restrictions that, in certain circumstances, could limit the level of dividends that we are able to pay on our common shares. There can be no assurance that we will pay a dividend in the future.
Shareholder Return Performance
The following graph shows changes over the past five-year period in the value of $100 invested in: (1) Cliffs' common shares; (2) S&P 500 Stock Index; (3) S&P Total MarketSmall Cap 600 Index; and (4) S&P Metals and Mining Select Industry Index. The values of each investment are based on price change plus reinvestment of all dividends reported to shareholders, based on monthly granularity.
| | | | | | | | | | | | | | | | | | | | | | | | | | | | | | | | | | | | | | | | | |
| | | 2015 | | 2016 | | 2017 | | 2018 | | 2019 | | 2020 |
| Cleveland-Cliffs Inc. | Return % | | — | | | 432.28 | | (14.27) | | 6.66 | | 12.60 | | 77.46 |
| Cum $ | | 100.00 | | 532.28 | | 456.32 | | 486.71 | | 548.04 | | 972.55 |
| S&P 500 Index | Return % | | — | | | 11.93 | | 21.80 | | (4.39) | | 31.48 | | 18.39 |
| Cum $ | | 100.00 | | 111.93 | | 136.33 | | 130.35 | | 171.38 | | 202.90 |
| S&P Small Cap 600 Index | Return % | | — | | | 26.46 | | 13.15 | | (8.52) | | 22.74 | | 11.24 |
| Cum $ | | 100.00 | | 126.46 | | 143.09 | | 130.90 | | 160.66 | | 178.72 |
| S&P Metals and Mining Select Industry Index | Return % | | — | | | 105.09 | | 20.61 | | (26.76) | | 14.70 | | 15.97 |
| Cum $ | | 100.00 | | 205.09 | | 247.36 | | 181.17 | | 207.80 | | 240.98 |
|
| | | | | | | | | | | | | | |
| | | | 2013 | | 2014 | | 2015 | | 2016 | | 2017 | | 2018 |
| Cleveland-Cliffs Inc. | Return % | | — |
| | (71.56) | | (77.87) | | 432.28 | | (14.27) | | 6.66 |
| | Cum $ | | 100.00 |
| | 28.44 | | 6.29 | | 33.50 | | 28.72 | | 30.63 |
| S&P 500 Index - Total Returns | Return % | | — |
| | 13.65 | | 1.38 | | 11.93 | | 21.80 | | (4.39) |
| | Cum $ | | 100.00 |
| | 113.65 | | 115.22 | | 128.96 | | 157.08 | | 150.18 |
| S&P Total Market Index | Return % | | — |
| | (25.63) | | (50.76) | | 105.09 | | 20.61 | | (26.76) |
| | Cum $ | | 100.00 |
| | 74.37 | | 36.62 | | 75.10 | | 90.58 | | 66.34 |
| S&P Metals and Mining | Return % | | — |
| | 12.43 | | 0.46 | | 12.62 | | 21.13 | | (5.30) |
| | Cum $ | | 100.00 |
| | 112.43 | | 112.95 | | 127.20 | | 154.08 | | 145.91 |
Issuer Purchases of Equity Securities
The following table presents information with respect to repurchases by usthe Company of our common shares during the periods indicated:
ISSUER PURCHASES OF EQUITY SECURITIES
| | | | | | | | | | | | | | | | | | | | | | | | | | |
| Period | | Total Number of Shares (or Units) Purchased1 | | Average Price Paid per Share
(or Unit) | | Total Number of Shares (or Units) Purchased as Part of Publicly Announced Plans or Programs | | Maximum Number (or Approximate Dollar Value) of Shares (or Units) that May Yet be Purchased Under the Plans or Programs |
| October 1 - 31, 2020 | | 2,293 | | | $ | 6.69 | | | — | | | $ | — | |
| November 1 - 30, 2020 | | 3,594 | | | 7.23 | | | — | | | — | |
| December 1 - 31, 2020 | | 262 | | | 12.88 | | | — | | | — | |
| Total | | 6,149 | | | $ | 7.27 | | | — | | | $ | — | |
| | | | | | | | |
1 All shares were delivered to us to satisfy tax withholding obligations due upon the vesting or payment of stock awards. |
|
| | | | | | | | | | | | | | |
| Period | | Total Number of Shares (or Units) Purchased1 | | Average Price Paid per Share (or Unit) | | Total Number of Shares (or Units) Purchased as Part of Publicly Announced Plans or Programs | | Maximum Number (or Approximate Dollar Value) of Shares (or Units) that May Yet be Purchased Under the Plans or Programs2 |
| October 1 - 31, 2018 | | 739 |
| | $ | 12.34 |
| | — |
| | $ | — |
|
| November 1 - 30, 2018 | | 500,000 |
| | $ | 8.83 |
| | 500,000 |
| | $ | 195,583,300 |
|
| December 1 - 31, 2018 | | 4,907,210 |
| | $ | 8.75 |
| | 4,907,210 |
| | $ | 152,650,610 |
|
| Total | | 5,407,949 |
| | $ | 8.76 |
| | 5,407,210 |
| | — |
|
| | | | | | | | | |
1 Includes 739 shares that were delivered to us in October 2018 to satisfy tax withholding obligations due upon the vesting or payment of stock awards. |
2 On November 26, 2018, we announced a new share repurchase program which was authorized by the Board of Directors, pursuant to which we may buy back our outstanding common shares in the open market or in private negotiated transactions up to a maximum of $200 million dollars. The program may be executed through open-market purchases, including through Rule 10b5-1 agreements, or privately negotiated transactions. The authorization is effective until December 31, 2019. |
|
| | | | |
| Item 6. | Selected Financial Data |
[Reserved]
|
| | | | | | | | | | | | | | | | | | | |
| Summary of Financial and Other Statistical Data - Cleveland-Cliffs Inc. and Subsidiaries |
| | 2018 (a) | | 2017 (b) | | 2016 (c) | | 2015 (d) | | 2014 (e) |
| Financial data (in millions, except per share amounts) | | | | | | | | | |
| Revenue from product sales and services | $ | 2,332.4 |
| | $ | 1,866.0 |
| | $ | 1,554.5 |
| | $ | 1,525.4 |
| | $ | 2,506.5 |
|
| Income from continuing operations | $ | 1,039.9 |
| | $ | 360.6 |
| | $ | 122.6 |
| | $ | 134.3 |
| | $ | 607.5 |
|
| Income (loss) from discontinued operations, net of tax * | $ | 88.2 |
| | $ | 2.5 |
| | $ | 76.7 |
| | $ | (882.7 | ) | | $ | (8,919.1 | ) |
Earnings (loss) per common share attributable to
Cliffs common shareholders - basic | | | | | | | | | |
| Continuing operations | $ | 3.50 |
| | $ | 1.27 |
| | $ | 0.49 |
| | $ | 0.57 |
| | $ | 3.46 |
|
| Discontinued operations * | 0.30 |
| | 0.01 |
| | 0.39 |
| | (5.71 | ) | | (50.98 | ) |
Earnings (loss) per common share attributable to
Cliffs common shareholders - basic | $ | 3.80 |
| | $ | 1.28 |
| | $ | 0.88 |
| | $ | (5.14 | ) | | $ | (47.52 | ) |
Earnings (loss) per common share attributable to
Cliffs common shareholders - diluted | | | | | | | | | |
| Continuing operations | $ | 3.42 |
| | $ | 1.25 |
| | $ | 0.49 |
| | $ | 0.57 |
| | $ | 3.46 |
|
| Discontinued operations * | 0.29 |
| | 0.01 |
| | 0.38 |
| | (5.70 | ) | | (50.98 | ) |
Earnings (loss) per common share attributable to
Cliffs common shareholders - diluted | $ | 3.71 |
| | $ | 1.26 |
| | $ | 0.87 |
| | $ | (5.13 | ) | | $ | (47.52 | ) |
| | | | | | | | | | |
| Total assets | $ | 3,529.6 |
| | $ | 2,953.4 |
| | $ | 1,923.9 |
| | $ | 2,135.5 |
| | $ | 3,147.2 |
|
| Long-term debt obligations (including capital leases) | $ | 2,104.5 |
| | $ | 2,311.8 |
| | $ | 2,178.6 |
| | $ | 2,704.1 |
| | $ | 2,834.6 |
|
| | | | | | | | | | |
| Cash dividends declared to preferred shareholders | | | | | | | | | |
| - Per depositary share | $ | — |
| | $ | — |
| | $ | — |
| | $ | 1.32 |
| | $ | 1.76 |
|
| - Total | $ | — |
| | $ | — |
| | $ | — |
| | $ | 38.4 |
| | $ | 51.2 |
|
| Cash dividends declared to common shareholders | | | | | | | | | |
| - Per share | $ | 0.05 |
| | $ | — |
| | $ | — |
| | $ | — |
| | $ | 0.60 |
|
| - Total | $ | 15.0 |
| | $ | — |
| | $ | — |
| | $ | — |
| | $ | 92.5 |
|
| Note: This information should be read in conjunction with Management's Discussion and Analysis of Financial Condition and Results of Operations and the Financial Statements and Supplementary Data. |
| (*) Refer to NOTE 13 - DISCONTINUED OPERATIONS, for information regarding discontinued operations. |
(a) On January 1, 2018, we adopted Topic 606 and applied it to all contracts that were not completed using the modified retrospective method. We recognized the cumulative effect of initially applying Topic 606 as an adjustment of $34.0 million to the opening balance of Retained deficit. The comparative period information has not been retrospectively revised and continues to be reported under the accounting standards in effect for those periods. Refer to NOTE 2 - NEW ACCOUNTING STANDARDS for information regarding the adoption of Topic 606. Additionally, refer to NOTE 10 - INCOME TAXES for information regarding the reversal of certain deferred tax valuation allowances. |
| (b) Refer to NOTE 6 - DEBT AND CREDIT FACILITIES for information regarding debt issuances and extinguishments, NOTE 14 - CAPITAL STOCK for information regarding a common share issuance and NOTE 10 - INCOME TAXES for information regarding the financial impact of Public Law 115–97, commonly known as the “Tax Cuts and Jobs Act”. |
| (c) During 2016, we recorded a net gain of $166.3 million related to debt restructuring activities that occurred throughout the year, including the issuance of $218.5 million aggregate principal of 8.00% 2020 1.5 Lien Notes in exchange for $512.2 million of our existing senior notes, the issuance of an aggregate of 8.2 million common shares in exchange for $56.9 million aggregate principal amount of our existing senior notes and a loss on the redemption of the full $283.6 million outstanding of our 3.95% 2018 Senior Notes at a total redemption price of $301.0 million. We also issued 44.4 million common shares in an underwritten public offering. We received net proceeds of $287.6 million at a public offering price of $6.75 per common share. |
(d) During 2015, our Eastern Canada Iron Ore segment commenced restructuring proceedings in Montreal, Quebec under the CCAA. As a result of these proceedings, the Canadian entities were deconsolidated and all financial results were classified within discontinued operations. During 2015, our North American Coal operating segment continued to meet the criteria to be classified as held for sale under ASC Topic 205, Presentation of Financial Statements, until the operations were sold during the fourth quarter, and as a result, all financial results were classified within discontinued operations. Refer to NOTE 13 - DISCONTINUED OPERATIONS, for information regarding discontinued operations. |
| (e) During 2014, we recorded an impairment of other long-lived assets of $11.2 million related to our continuing operations. We also recorded goodwill and other long-lived asset impairment charges related to our discontinued operations of $9,018.7 million. The impairment charges were primarily a result of changes in life-of-mine cash flows due to declining pricing for both global iron ore and low-volatile metallurgical coal, along with changes in strategic focus of the divestiture of the Eastern Canadian Iron Ore, Asia Pacific Iron Ore, North American Coal and Ferroalloys operations. The CLCC assets were sold in the fourth quarter of 2014 on December 31, 2014, resulting in a loss on sale of $419.6 million. Refer to NOTE 13 - DISCONTINUED OPERATIONS, for information regarding discontinued operations. For the year ended December 31, 2014, we had a loss attributable to noncontrolling interest of $1,087.4 million, of which, $1,114.3 million related to discontinued operations. |
|
| | | | |
| Item 7. | Management's Discussion and Analysis of Financial Condition and Results of Operations |
Management's Discussion and Analysis of Financial Condition and Results of Operations ("MD&A") is designed to provide a reader of our financial statements with a narrative from the perspective of management on our financial condition, results of operations, liquidity and other factors that may affect our future results. The following discussion should be read in conjunction with the consolidated financial statements and related notes that appear elsewherein Part II – Item 8. Financial Statements and Supplementary Data of this Annual Report on Form 10-K.
Overview
The year 2020 represented a transformative period in this document.
Industry Overview
The key driverour Company's 173-year history. During the year, we completed the vertical integration of our legacy iron ore pellet business is demand forwith the acquisitions of steelmakers AK Steel and ArcelorMittal USA, becoming the largest flat-rolled steel producer in North America. Our new unique, vertically integrated business model provides a competitive advantage over other steelmakers that procure a larger proportion of their steelmaking raw materials from U.S. steelmakers. During 2018,external sources, and allows us to control our production from upstream mining to downstream stamping and tubing.
We believe the Acquisitions give us a leading position in the highly desirable automotive end market, where we supply best-in-class volumes, quality and delivery performance, and give us the most comprehensive flat steel product offering in the industry. Due to the much larger operational footprint we now have, we anticipate synergies of approximately $310 million from asset optimization, economies of scale and streamlining overhead, over half of which has already been set in motion.
We are now focused on maximizing the value of the iron ore pellets we produce from our legacy and recently acquired mines in Michigan and Minnesota. A majority of the pellets we produce is dedicated to internal consumption, and we do not rely on external sources of pellets. As such, our new Steelmaking segment captures effectively all of the production activity in the steelmaking process, which begins at our mines.
In 2020, we also completed construction of and began production at our state-of-the-art direct reduction plant in Toledo, Ohio. This facility produces high-quality HBI, and is the first of its kind in the Great Lakes region. Our HBI provides a high-quality and environmentally friendly alternative to the scrap and imported pig iron that our potential customers currently utilize. We expect to begin selling this product to third parties during the first quarter of 2021 and reach nameplate capacity at our direct reduction plant during the second quarter of 2021.
Along with these notable accomplishments, we have been able to successfully navigate through the COVID-19 pandemic while preserving the health and safety of both our workforce and our Company for the long term. The COVID-19 pandemic caused its fair share of challenges, as disruptions in demand led to lower sales output and necessitated the unplanned idling of certain production facilities. These production outages, along with the lower
demand and lower prices that came as a result of the pandemic, generated weaker results during the year than what we would normally expect.
As the demand environment began to recover, our results in the second half of the year improved dramatically and operations at temporarily idled facilities resumed. Now, with steel prices and scrap prices in the U.S. produced approximately 87 million metric tonsrecently reaching all-time highs, we believe our decisive actions and accomplishments during 2020 will allow us to deliver strong financial results and free cash flow in 2021. We also believe our new vertically integrated business model is well-equipped to navigate and succeed through future pricing or demand volatility that is common in our industry.
Despite the ongoing pandemic, we also continued our best practices from both a safety and environmental standpoint. During 2020, our safety TRIR (including contractors) was 0.92 per 200,000 hours worked. On environmental matters, we recently made a commitment to reduce GHG emissions 25% by 2030 from 2017 levels, a higher reduction target than our competitors and a demonstration of crudethe newfound leadership role we plan to take in the domestic steel which is up 6% when comparedindustry.
Recent Developments
Acquisition of ArcelorMittal USA
On December 9, 2020, pursuant to 2017, or about 5%the terms of total global crude steel production. U.S. total steel capacity utilization was approximately 78% during 2018, which is an approximate 6%the AM USA Transaction Agreement, we purchased ArcelorMittal USA from ArcelorMittal. In connection with the closing of the AM USA Transaction, as contemplated by the terms of the AM USA Transaction Agreement, ArcelorMittal’s former joint venture partner in Kote and Tek exercised its put right pursuant to the terms of the Kote and Tek joint venture agreements. As a result, we purchased all of such joint venture partner’s interests in Kote and Tek. Following the closing of the AM USA Transaction, we own 100% of the interests in Kote and Tek.
The assets of ArcelorMittal USA acquired by us at the closing of the AM USA Transaction include six steelmaking facilities, eight finishing facilities, three cokemaking operations, two iron ore mining and pelletizing operations and one coal mining complex. Refer to NOTE 3 - ACQUISITIONS for additional information.
Financing Transactions
On December 9, 2020, we entered into the ABL Amendment. The ABL Amendment modified the ABL Facility to, among other things, increase from 2017. Throughout 2018, global crude steel production increased about 5% compared to 2017, driventhe amount of tranche A revolver commitments available thereunder by an approximate 7%additional $1.5 billion and increase certain dollar baskets related to certain negative covenants that apply to the ABL Facility. After giving effect to the ABL Amendment, the aggregate principal amount of tranche A revolver commitments under the ABL Facility is $3.35 billion and the aggregate principal amount of tranche B revolver commitments under the ABL Facility remains at $150 million.
On February 11, 2021, we sold 20 million of our common shares, and the indirect, wholly owned subsidiary of ArcelorMittal to which approximately 78 million common shares were issued as part of the consideration paid by us in Chinese crude steel production.
The Platts 62% Price decreased 3%connection with the closing of the AM USA Transaction sold 40 million common shares, in each case at a price per share to the underwriter of $16.12, in an underwritten public offering. We also granted the underwriter an option to purchase up to an averageadditional 9 million common shares from us at a price per share to the underwriter of $69 per metric ton$16.12. The underwriter has until March 10, 2021 to exercise such option, which it may do in full, in part or not at all. We did not receive any proceeds from the sale of the common shares by the selling shareholder in the offering. We intend to use the net proceeds to us from the offering, plus cash on hand, to redeem up to approximately $334 million aggregate principal amount of our outstanding 9.875% 2025 Senior Secured Notes. We intend to use any remaining net proceeds to us following such redemption to reduce borrowings under our ABL Facility.
On February 17, 2021, we issued $500 million aggregate principal amount of 4.625% 2029 Senior Notes and $500 million aggregate principal amount of 4.875% 2031 Senior Notes in an offering that was exempt from the registration requirements of the Securities Act. We intend to use the net proceeds from the notes offering to redeem all of the outstanding 4.875% 2024 Senior Secured Notes and 6.375% 2025 Senior Notes issued by Cleveland-Cliffs Inc. and all of the outstanding 7.625% 2021 AK Senior Notes, 7.50% 2023 AK Senior Notes and 6.375% 2025 AK Senior Notes issued by AK Steel Corporation (n/k/a Cleveland-Cliffs Steel Corporation), and pay fees and expenses in connection with such redemptions, and reduce borrowings under our ABL Facility.
Company Structure
We have updated our segment structure to coincide with our new business model and are organized into four operating segments based on differentiated products, Steelmaking, Tubular, Tooling and Stamping, and European Operations. Our previous Mining and Pelletizing segment is included within Steelmaking as iron ore pellets are a
primary raw material for our steel products. We have one reportable segment - Steelmaking. Our other operating segments are classified as our Other Businesses.
COVID-19
In December 2019, COVID-19 surfaced in Wuhan, China, and then spread to other countries, including the United States. In March 2020, the World Health Organization characterized COVID-19 as a pandemic. Efforts to contain the spread of COVID-19 intensified throughout 2020, and many countries, including the United States, took steps to restrict travel, temporarily close businesses and issue quarantine orders. It remains unclear how long and to what degree of severity the economic impact of the COVID-19 pandemic will be felt.
On March 27, 2020, the CARES Act was signed into law. The CARES Act, among other things, includes provisions relating to refundable payroll tax credits, deferment of employer-side social security payments, NOL carryback periods, AMT credit refunds, modifications to the net interest deduction limitations and technical corrections to tax depreciation methods for qualified improvement property. During 2020, the CARES Act provided liquidity relief by enabling us to accelerate the receipt of $60 million of AMT credit refunds in July 2020, defer pension contributions until January 2021, and defer employer social security payments until 2021 and 2022.
We continue to utilize stringent social distancing procedures in our operating facilities, including checking employees’ temperatures and symptoms before entering the workplace each day and deep cleaning our operational facilities. Although we continue to utilize these measures, the outbreak of COVID-19 has heightened the risk that a significant portion of our workforce will suffer illness or otherwise be unable to perform their ordinary work functions.
Although steel and iron ore production are considered “essential” by the states in which we operate, certain of our facilities and construction activities were temporarily idled during the second quarter of 2020 due primarily to temporarily reduced product demand. Most of these temporarily idled facilities were restarted during the second quarter of 2020, and the remaining operations were restarted during the third quarter of 2020. Our Columbus and Monessen facilities acquired through the AM USA Transaction are temporarily idled due to the COVID-19 pandemic.
We cannot predict whether our operations will experience additional disruptions in the future. We may also continue to experience supply chain disruptions or operational issues with our vendors, as our suppliers and contractors face similar challenges related to the COVID-19 pandemic. Because the impact of the COVID-19 pandemic continues to evolve, we cannot currently predict the extent to which our business, results of operations, financial condition or liquidity will ultimately be impacted.
To mitigate the impact of the COVID-19 pandemic, we took a number of steps throughout 2020 to solidify our liquidity position, including issuing $520 million aggregate principal amount of secured debt, adding a $150 million FILO tranche to our ABL Facility, idling several facilities both temporarily and permanently, temporarily deferring our Chief Executive Officer’s compensation by 40%, temporarily deferring salaries by up to 20%, temporarily deferring other salaried employee benefits, and temporarily suspending capital expenditures. Lastly, our Board suspended future dividends, which was a typical cash obligation of approximately $100 million on an annualized basis.
Results of Operations
Overview
For the year ended December 31, 2020, we had a Net loss of $81 million. For the years ended December 31, 2019 and 2018, we had Net income of $293 million and $1,128 million, respectively. Our total revenues, diluted EPS and Adjusted EBITDA were as follows:
See "— Results of Operations — Adjusted EBITDA" below for a reconciliation of our Net Income (loss) to Adjusted EBITDA.
Revenues
Revenues from iron products made up 100% of our revenues by product line for the year ended December 31, 2018 compared to 2017. Volatility in the iron ore price impacts our realized revenue rates, but the price2019.
The Atlantic Basin pellet premium, another important pricing factor in our contracts, averaged $59 per metric ton forDuring the year ended December 31, 2018, a 30%2020, our consolidated Revenues were approximately $5.4 billion, an increase of approximately $3.4 billion, or 169%, compared to 2017. We believe2019. The increase was due to the supply-demand dynamicsaddition of this market will continue to be favorable for us. Heightened demand for iron ore pellets is$4.0 billion in revenues as a result of rapidly increasing global demand for the most productive and environmentally friendly feedstock. Iron ore pellets remain scarceAcquisitions, partially offset by a decrease in the international market and new capacity is unlikelyrevenue from iron products of $655 million resulting from lower sales volumes of 6.9 million long tons compared to come online2019. The lower sales volumes of iron products in the near term2020, as compared to 2019, were partially due to the diversion of pellets for internal consumption following the Acquisitions. Overall, we experienced lower customer demand during 2020 as a result of the reduced manufacturing activity caused by the COVID-19 pandemic.
Revenues by Market
The following table represents our consolidated Revenues and percentage of revenues to each of the markets we supply:
| | | | | | | | | | | | | | | | | | | | | | | |
| (In Millions) |
| Year Ended December 31, |
| 2020 | | 2019 |
| Revenue | | % | | Revenue | | % |
| Automotive | $ | 2,391 | | | 45 | % | | $ | — | | | — | % |
| Infrastructure and Manufacturing | 818 | | | 15 | % | | — | | | — | % |
| Distributors and Converters | 722 | | | 13 | % | | — | | | — | % |
Steel producers1 | 1,423 | | | 27 | % | | 1,990 | | | 100 | % |
| Total revenues | $ | 5,354 | | | | | $ | 1,990 | | | |
| | | | | | | |
1 Includes Realization of deferred revenue of $35 million for the year ended December 31, 2020. |
Automotive Market
North American light vehicle production for 2020 declined 20% to approximately 13 million units from the prior year due to the impacts of the COVID-19 pandemic, which forced automotive businesses to shut down from the end of the first quarter of 2020 until near the end of the second quarter of 2020. During the third quarter of 2020, auto makers saw pent-up demand bring sales back to more normal levels as buyers and dealers adapted to new procedures and virtual shopping. Fourth quarter 2020 sales for the automotive industry were more in line with expected sales for the time of year, returning to near pre-COVID-19 levels.
Infrastructure and expense required to do so. We believe this scarcity will supportManufacturing
Domestic construction activity and likely increase these multi-year high premiumsthe replacement of aging infrastructure directly affects sales of our carbon, stainless and electrical steel products, particularly for pellet productsGOES. Additionally, during 2020, there were nearly 1.4 million new housing starts in the foreseeable future.U.S., an increase of approximately 6% from 2019, and home sales reached nearly 6 million, the highest annual mark since 2006, despite the supply of existing homes reaching all-time lows. This provides a positive indication that domestic GOES customers could continue to experience steady demand consistent with the construction and electrical transformer replacement markets.
Distributors and Converters
Steel distributors and converters typically source from the commodity carbon, stainless and electrical spot markets. The price for domestic hot-rolled coil steel,HRC, which is an important attribute in the calculationprofitability of supplemental revenue in a customer's supply agreement,this end market, averaged $827$588 per net ton for the year ended December 31, 2018, 33% higher than last year.2020. The price of HRC was negatively impacted by lower demand related to the COVID-19 pandemic, and hit a low point of $438 per net ton on April 30, 2020. However, after the industry recovered and supply-demand dynamics improved, the price rebounded dramatically, improving to a peak of $1,030 per net ton by December 31, 2020.
Steel Producers Market
The steel producers market represents third-party sales to other steel producers, including those who operate blast furnaces and EAFs. It includes sales of raw materials and semi-finished and finished goods, including iron ore pellets, coal, coke, HBI and steel products. Iron ore product revenues declined during 2020, as compared to 2019, partially as a result of the Acquisitions as our iron ore pellet production was impacted positivelyconsumed internally and the respective intercompany revenue was eliminated in 2018 by healthy U.S.consolidation. Additionally, we experienced lower customer demand during 2020 as a result of the reduced manufacturing activity and inflation on major steel input costs, andcaused by the U.S. government's implementationimpacts of a 25% tariff on steel imports from manythe COVID-19 pandemic.
Operating Costs
Cost of steel in the world, we believe these tariffs not only alleviate some national security concerns, but will also keep the prices for domestic hot-rolled coil steel elevated above historical averages for as long as they remain in place. As such, we remain positive on our outlookgoods sold
Cost of goods sold increased by $3,688 million for the domestic steel market.
Our consolidated revenues were $2.3 billion and $1.9 billion for the yearsyear ended December 31, 2018 and 2017, respectively, with net income from continuing operations per diluted share of $3.42 and $1.25, respectively. Net income from continuing operations for 2018 was positively impacted by an income tax benefit of $475.2 million, primarily due2020, as compared to release of the valuation allowance in the U.S. This compares to an income tax benefit in 2017 of $252.4 million,prior year, primarily due to the enactmentaddition of Public Law 115–97. Sales margin 4 million net tons of steel shipments resulting from the Acquisitions, partially offset by lower sales volumes of iron products. During 2020, Cost of goods sold was unfavorably impacted by temporary idle-related costs of approximately $225 million, resulting from the impacts of the COVID-19 pandemic.
Selling, general and administrative expenses
As a result of the Acquisitions, our Selling, general and administrative expenses increased by $342.0$131 million during 2018 whenthe year ended December 31, 2020, as compared to 2017,2019.
Acquisition-related costs
The Acquisition-related costs of $90 millionfor the year ended December 31, 2020, include severance of $38 million and other various third-party expenses related to the Acquisitions of $52 million. Refer to NOTE 3 - ACQUISITIONS for further information on the Acquisitions.
Miscellaneous – net
Miscellaneous – net increased by $33 million for the year ended December 31, 2020, as compared to the prior year, which was primarily driven by thedue to an increase in revenueexpenses incurred at our Toledo direct reduction plant, primarily related to the hiring and training of employees leading up to the start of production.
Other Income (Expense)
Interest expense, net
Interest expense, net increased by $137 million for the year ended December 31, 2020, as compared to the prior year, primarily due to the incremental debt that we incurred in connection with the AK Steel Merger. The increase was offset partially by an increase in capitalized interest, primarily related to the construction of the Toledo direct reduction plant.
Gain (loss) on extinguishment of debt
The Gain (loss) on extinguishment of debt of $130 million for the year ended December 31, 2020 primarily relates to the repurchase of $748 million aggregate principal amount of our outstanding senior notes of various series using the net proceeds from higher overall average realized product revenue ratesthe issuance of an additional $555 million aggregate principal amount of our 9.875% 2025 Senior Secured Notes on April 24, 2020 and higher sales volumes. During 2018, we hadother sources of cash. This compares to a loss on extinguishment of debt of $6.8 million compared to a loss of $165.4 million during the prior year. In addition, during 2018 we had a gain from discontinued operations, net of tax of $88.2 million, primarily attributable to our exit from Australia compared to a gain of $2.5 million from discontinued operations, net of tax, during 2017.
Strategy
We are Focused on Protecting our Core Mining and Pelletizing Segment Business
We are the market-leading iron ore producer in the U.S., supplying differentiated iron ore pellets under long-term contracts to major North American blast furnace steel producers. We have the unique advantage of being a low-cost, high-quality, iron ore pellet producer with significant transportation and logistics advantages to serve the Great Lakes steel market effectively. The pricing structure and long-term nature of our existing contracts, along with our low-cost operating profile, position our Mining and Pelletizing segment as a strong cash flow generator in most commodity pricing environments. Since instituting our strategy in 2014 of focusing on this core business, we have achieved significant accomplishments, including providing accelerating profitability growth each year since 2015, maximizing commercial leverage in pricing and securing sales volume certainty by signing multiple new supply agreements with steelmakers throughout the Great Lakes region, improving operating reliability by making operational improvements, realizing more predictability in cash flows, embracing the global push toward environmental stewardship and developing new pellet products to meet ever-evolving market demands.
We recognize the importance of our strong position in the North American blast furnace steel industry, and our top priority is to protect and enhance the market position of our Mining and Pelletizing business. This involves continuing to deliver high-quality, custom-made pellets that allow our customers to remain competitive in the quality, production efficiency, and environmental friendliness of their steel products. Protecting the core business also involves continually evaluating opportunities to expand both our production capacity and ore reserve life. In 2017, we achieved key accomplishments toward these goals by acquiring the remaining minority stake in our Tilden and Empire mines as well as additional real estate interests in Minnesota. In 2018, we began supplying pellets under two new customer supply agreements in the Great Lakes region. In addition, we executed the efficient exit of our Asia Pacific Iron Ore business, officially completing the divestiture of the Company's non-core assets.
Expanding our Customer Base
While we hold a strong market position in supplying iron ore to Great Lakes blast furnaces, we cannot ignore the ongoing shift of steelmaking share in the U.S. away from our core blast furnace customers to EAF steelmakers. Over the past 25 years, the market share of EAFs has nearly doubled. However, as EAFs have moved to higher-value steel products, they require more high-quality iron ore-based metallics instead of lower-grade scrap as raw material feedstock. As a result of this trend, one of our top strategic priorities is to become a critical supplier of the EAF market by providing these specialized metallics. HBI is a specialized high-quality iron alternative to scrap and pig iron that, when used as a feedstock, allows the EAF to produce more valuable grades of steel. In June 2017, we announced the planned construction of an HBI production plant in Toledo, Ohio. Over the past 18 months, we have made significant progress on the construction of this plant. Based on current market analysis, greater-than-expected customer demand and expansion opportunities identified during the construction process, we are increasing the expected productive capacity of the Toledo HBI production plant from 1.6 million to 1.9 million metric tons per year. Accordingly, we now estimate the construction cost to be approximately $830 million, exclusive of construction-related contingencies and capitalized interest, which increase partially relates to the expanded capacity. We expect that the HBI production plant, once operational, will consume approximately 2.8 million long tons of our DR-grade pellets per year.
We expect our HBI to partially replace the over 3 million metric tons of ore-based metallics that are imported into the Great Lakes region every year from Russia, Ukraine, Brazil and Venezuela, as well as the nearly 20 million metric tons of scrap used in the Great Lakes area every year. The Toledo site is in close proximity to over 20 EAFs, giving us a natural competitive freight advantage over import competitors. Not only does this production plant create another outlet for our high-margin pellets, but it also presents an attractive economic opportunity for us. As the only producer of DR-grade pellets in the Great Lakes region and with access to abundant, low-cost natural gas, we will be in a unique position to serve clients in the area and grow our customer base.
Maintaining Discipline on Costs and Capital Allocation
We believe our ability to execute our strategy is dependent on maintaining our financial position, balance sheet strength and financial flexibility, which will enable us to manage through the inherent cyclical demand for our products and volatility in commodity prices. Our streamlined organization and support functions are well-aligned with our strategic direction. Our capital allocation plan is focused on strengthening and protecting our core Mining and Pelletizing segment operations and expanding our customer base through our Metallics segment, as well as returning excess capital to shareholders while maintaining manageable leverage through volatile commodity cycles.
As the implementation of our strategy has strengthened the business, we have put additional emphasis on the continued improvement of our balance sheet via continued reduction of long-term debt. Since 2015, we have reduced
our annual interest expense by 46%, or approximately $100 million, by using various liability management strategies consistent with our capital allocation priorities and our stated objective of improving the strength of our balance sheet and simplifying the capital structure. Given the cyclical nature of our business, we will continue to be opportunistic in managing our balance sheet and capital structure, which should put us in an optimal position to manage through any commodity environment, and we continue to seek the best opportunities to accomplish this.
Competitive Strengths
Resilient Mining and Pelletizing Segment Operations
Our Mining and Pelletizing segment is the primary contributor to our consolidated results, generating $2,332.4 million of consolidated revenue, $809.6 million of sales margin and $875.3 million of consolidated Adjusted EBITDA for the year ended December 31, 2018. Our Mining and Pelletizing segment produces differentiated iron ore pellets that are customized for use in customers’ blast furnaces as part of the steelmaking process. The grades of pellets currently delivered to each customer are based on that customer’s preferences, which depend in part on the characteristics of the customer’s blast furnace operations. We believe our long history of supplying customized pellets to the U.S. steel producers has resulted in a co-dependent relationship between us and our customers. This technical and operational co-dependency has enabled us to claim a substantial portion of the total Mining and Pelletizing segment market. Based on our equity ownership in our U.S. mines, our share of the annual rated production capacity is 21.2 million long tons, representing 42% of total U.S. annual pellet capacity. Long-lived assets with an average mine life of approximately 30 years provide the opportunity to maintain our significant market position well into the future.
We believe our Mining and Pelletizing segment is uniquely positioned in the global iron ore market due to its insulated position within the Great Lakes region and balanced exposure to market volatility due to contract pricing structures. Most of our Mining and Pelletizing segment production is sold through long-term contracts that are structured with various formula-based pricing mechanisms that reference spot iron ore pricing, domestic steel prices, and Atlantic Basin pellet premiums, among other items, and mitigate the impact of any one factor's price volatility on our business.
We maintain a freight advantage compared to our competition as a result of our proximity to U.S. steelmaking operations. The Great Lakes market is largely isolated and expensive to enter from the seaborne market. Our costs are lower as a result of inherent transportation advantages associated with our mine locations near the Great Lakes, which allows for transportation via railroads and loading ports.
Recent Developments
Changes to our Board of Directors
On January 28, 2019, we appointed M. Ann Harlan and Janet L. Miller to our Board of Directors. Ms. Harlan will join the Audit Committee and Ms. Miller will join the Governance and Nominating Committee of our Board. With the addition of Ms. Harlan and Ms. Miller, our Board of Directors is now comprised of eleven members, of which ten are independent directors. Also, in order to re-balance responsibilities among its Board members, we announced other changes to the Committee assignments. Susan Green has been appointed to the Strategy Committee; Michael Siegal has stepped down from the Audit Committee; Gabriel Stoliar has stepped down from the Governance and Nominating Committee; and Robert Fisher, Jr. has stepped down from the Strategy Committee.
Executive Leadership Promotion
On December 11, 2018, our Board of Directors elected Clifford T. Smith, as our Executive Vice President, Chief Operating Officer, effective January 1, 2019. Mr. Smith most recently was the Executive Vice President, Business Development, a position he held since April 2015. He previously served as Executive Vice President, Seaborne Iron Ore (October 2014 - April 2015) and Executive Vice President, Global Operations (July 2013 - January 2014).
Share Repurchase Program
On November 26, 2018, we announced that our Board of Directors authorized a program to repurchase outstanding common shares in the open market or in privately negotiated transactions, up to a maximum of $200 million. We are not obligated to make any purchases and the program may be suspended or discontinued at any time. During 2018, we repurchased 5.4 million common shares at a cost of approximately $47.5 million in aggregate, including commissions and fees, or an average price of approximately $8.78 per share. As of December 31, 2018, there was approximately $152.7 million remaining under the authorization. The share repurchase program is effective until December 31, 2019.
Business Segments
In alignment with our strategic goals, our Company’s continuing operations are organized and managed in two business units according to our differentiated products. The former 'U.S. Iron Ore' segment is now 'Mining and Pelletizing.' Our Mining and Pelletizing segment is a major supplier of iron ore pellets to the North American steel industry from our mines and pellet plants located in Michigan and Minnesota. In addition, the Toledo HBI business will be categorized under the segment 'Metallics.' In our Metallics segment, we are currently constructing an HBI production plant in Toledo, Ohio. We expect to complete construction and begin production in 2020. Until the HBI plant is operational, expenses reported in the Metallics segment will be limited to administrative costs.
2018 Compared to 2017
Results of Operations
The following is a summary of the Mining and Pelletizing segment results:
|
| | | | | | | | | | | | | | | | | | | | | | | | |
| | | (In Millions) |
| | | | | Changes due to: | |
|
| | | Year Ended
December 31, | | Revenue and cost rate | | Sales volume | | Freight and reimbursement | | Total change |
| | | 2018 | | 2017 | | | | |
| Revenues from product sales and services | | $ | 2,332.4 |
| | $ | 1,866.0 |
| | $ | 364.3 |
| | $ | 163.5 |
| | $ | (61.4 | ) | | $ | 466.4 |
|
| Cost of goods sold and operating expenses | | (1,522.8 | ) | | (1,398.4 | ) | | (68.4 | ) | | (117.4 | ) | | 61.4 |
| | (124.4 | ) |
| Sales margin | | $ | 809.6 |
| | $ | 467.6 |
| | $ | 295.9 |
| | $ | 46.1 |
| | $ | — |
| | $ | 342.0 |
|
|
| | | | | | | | | | | | | | | |
| | | Year Ended
December 31, | | | | |
| Per Long Sales Ton Information | | 2018 | | 2017 | | Difference | | Percent change |
Realized product revenue rate1 | | $ | 105.64 |
| | $ | 88.03 |
| | $ | 17.61 |
| | 20.0 | % |
Cash cost of goods sold and operating expense rate1,2 | | 62.95 |
| | 59.43 |
| | 3.52 |
| | 5.9 | % |
| Depreciation, depletion & amortization | | 3.32 |
| | 3.56 |
| | (0.24 | ) | | (6.7 | )% |
| Total cost of goods sold and operating expense rate | | 66.27 |
| | 62.99 |
| | 3.28 |
| | 5.2 | % |
| Sales margin | | $ | 39.37 |
| | $ | 25.04 |
| | $ | 14.33 |
| | 57.2 | % |
| | | | | | | | | |
Sales tons3 (In thousands) | | 20,563 |
| | 18,683 |
| | | | |
Production tons3 (In thousands) | | | | | | | | |
| Total | | 26,336 |
| | 25,542 |
| | | | |
| Cliffs’ share of total | | 20,329 |
| | 18,776 |
| | | | |
| | | | | | | | | |
1 Excludes revenues and expenses related to domestic freight, which are offsetting and have no impact on sales margin. Revenues and expenses also exclude venture partner cost reimbursements. |
2 Cash cost of goods sold and operating expense rate is a non-GAAP financial measure. Refer to "Non-GAAP Reconciliation" for reconciliation in dollars back to our consolidated financial statements. |
3 Tons are long tons. |
Sales margin for the Mining and Pelletizing segment was $809.6$18 million for the year ended December 31, 2018, compared with $467.6 million for the year ended December 31, 2017. Sales margin per long ton increased 57.2% to $39.37 per long ton during the year ended December 31, 2018 compared to 2017.
Revenue increased by $527.8 million during the year ended December 31, 2018, compared to 2017, excluding the freight and reimbursements decrease of $61.4 million, predominantly due to:
An increase in the average year-to-date realized product revenue rate of $17.61 per long ton or 20.0% during the year ended December 31, 2018, compared to 2017, which resulted in an increase of $364.3 million. This is predominantly due to:
| |
◦ | An increase in the average annual daily market price for hot-rolled coil steel, which positively affected the realized revenue rate by $10 per long ton or $215 million during 2018; |
| |
◦ | Higher pellet premiums, which positively affected the realized revenue rate by $7 per long ton or $141 million; and |
| |
◦ | Changes in customer and contract mix, which positively affected the realized revenue rate by $3 per long ton or $70 million. |
| |
◦ | These increases were offset partially by: |
| |
▪ | An increase in index freight rates, a component in most of our contract pricing formulas, which negatively affected the realized revenue rate by $3 per long ton or $53 million; and |
| |
▪ | Lower full-year Platts 62% Price, compared to the prior-year, which negatively affected the realized revenue rate by $1 per long ton or $30 million. |
Higher sales volumes of 1.9 million long tons, which resulted in increased revenues of $163.5 million, predominantly due to increased demand from two customers resulting in two additional contracts that started during the current year.
Cost of goods sold and operating expenses increased $185.8 million during the year ended December 31, 2018, compared to 2017, excluding the freight and reimbursements decrease of $61.4 million, predominantly as a result of:
An increase in sales volume of 1.9 million long tons, which resulted in increased costs of $117 million period-over-period; and
Unfavorable change in the full-year cost driven by higher employment-related and profit sharing costs of $35 million or $2 per long ton, increased royalties of $19 million or $1 per long ton and increased maintenance and fuel costs of $19 million or $1 per long ton.
Production
Our share of production increased by 8.3% during the year ended December 31, 2018 when compared to 2017. The increase in production volume2019, primarily is attributable to incremental tonnage of 0.8 million long tons as a result of the increase in Tilden ownership to 100% in the third quarter of 2017, 0.4 million long tons at United Taconite as a result of increased operating time and productivity in 2018 compared to 2017 when the Mustang capital project was underway, and 0.3 million long tons at Northshore due to lower production during the prior-year comparable period as a result of longer scheduled annual maintenance shut-downs and an additional furnace idle to support the production of low silica pellets.
Other Operating Income (Expense)
The following is a summary of Other operating income (expense):
|
| | | | | | | | | | | |
| | (In Millions) |
| | 2018 | | 2017 | | Variance Favorable/ (Unfavorable) |
| Selling, general and administrative expenses | $ | (116.8 | ) | | $ | (102.9 | ) | | $ | (13.9 | ) |
| Miscellaneous - net | (19.6 | ) | | 25.5 |
| | (45.1 | ) |
| | $ | (136.4 | ) | | $ | (77.4 | ) | | $ | (59.0 | ) |
Selling, general and administrative expenses during the year ended December 31, 2018 increased $13.9 million compared to 2017. The unfavorable variance for the year ended December 31, 2018 was primarily driven by an increase in employment-related costs, including approximately $6 million related to signing bonuses that were part of the new USW labor agreement signed in 2018 and higher incentive compensation compared to 2017.
The following is a summary of Miscellaneous - net:
|
| | | | | | | | | | | |
| | (In Millions) |
| | 2018 | | 2017 | | Variance
Favorable/
(Unfavorable) |
| Empire idle costs | $ | (24.1 | ) | | $ | 5.0 |
| | $ | (29.1 | ) |
| Foreign exchange remeasurement | (0.9 | ) | | 13.9 |
| | (14.8 | ) |
| Management and royalty fees | 1.0 |
| | 5.1 |
| | (4.1 | ) |
| Impairment of long-lived assets | (1.1 | ) | | — |
| | (1.1 | ) |
| Other | 5.5 |
| | 1.5 |
| | 4.0 |
|
| | $ | (19.6 | ) | | $ | 25.5 |
| | $ | (45.1 | ) |
Miscellaneous - net during the year ended December 31, 2018 increased $45.1 million compared to 2017. There was a year over year unfavorable impact of $29.1 million in Empire mine idle costs primarily impacted by the reduction to the asset retirement obligation liability during 2017. During 2017, there was a decrease in the obligation of $26.2 million as a result of the refinement of the cash flows required for reclamation, remediation and structural removal. Refer to NOTE 11 - ENVIRONMENTAL AND MINE CLOSURE OBLIGATIONS for further information regarding changes in the asset retirement obligation.
For the year ended December 31, 2017, there was an incrementally favorable impact of $14.8 million driven by the change in foreign exchange remeasurement of short-term intercompany loans that were denominated in currency that was not the functional currency of the entity that holds the loans.
Other Expense
The following is a summary of Other expense:
|
| | | | | | | | | | | |
| | (In Millions) |
| | 2018 | | 2017 | | Variance Favorable/ (Unfavorable) |
| Interest expense, net | $ | (118.9 | ) | | $ | (126.8 | ) | | $ | 7.9 |
|
| Loss on extinguishment of debt | (6.8 | ) | | (165.4 | ) | | 158.6 |
|
| Other non-operating income | | | | | |
| Net periodic benefit costs other than service cost component | 14.0 |
| | 7.0 |
| | 7.0 |
|
| Other | 3.2 |
| | 3.2 |
| | — |
|
| | $ | (108.5 | ) | | $ | (282.0 | ) | | $ | 173.5 |
|
Interest expense, net for the year ended December 31, 2018, was $7.9 million lower than 2017, predominantly due to interest that was capitalized related to the HBI production plant and upgrades at the Northshore plant.
The loss on extinguishment of debt for the year ended December 31, 2018 of $6.8 million was related to the redemption in fullof all of our outstanding 4.80% 2020 Senior Notes and 5.90% 2020then-outstanding 4.875% 2021 Senior Notes and the repurchase of certain$600 million aggregate principal amount of our other senior notes. This compares to a loss of $165.4 million for the year ended December 31, 2017, primarily related to the redemption in full of all of our outstanding First Lien Notes, 1.5 Lien Notes and Second Lien Notes and the repurchase of certain of our other senior notes.
5.75% 2025 Senior Notes. Refer to NOTE 68 - DEBT AND CREDIT FACILITIES for further discussion.details.
Other non-operating income
The increase of $54 million in Other non-operating income primarily relates to an increase in net periodic benefit credits other than service cost component predominantly due to the expected return on assets resulting from the Acquisitions and increased asset values for the plans held in 2019. Refer to NOTE 10 - PENSIONS AND OTHER POSTRETIREMENT BENEFITS for further details.
Income Taxes
Our effective tax rate is affected by permanent items, such as depletion and the relative amount of income we earn in various foreign jurisdictions with tax rates that differ from the U.S. statutory rate.primarily depletion. It also is affected by discrete items that may occur in any given period, but are not consistent from period to period. The following represents a summary of our tax provision and corresponding effective rates:
| | | | | | | | | | | |
| (In Millions) |
| Year Ended December 31, |
| 2020 | | 2019 |
| Income tax benefit (expense) | $ | 111 | | | $ | (18) | |
| Effective tax rate | 57 | % | | 6 | % |
|
| | | | | | | | | | | |
| | (In Millions) |
| | 2018 | | 2017 | | Variance |
| Income tax benefit | $ | 475.2 |
| | $ | 252.4 |
| | $ | 222.8 |
|
| Effective tax rate | (84.1 | )% | | (233.3 | )% | | 149.2 | % |
A reconciliation of our income tax attributable to continuing operations compared to the U.S. federal statutory rate is as follows:
| | | | | | | | | | | | | | | | | | | | | | | | | | | | | | |
| | (In Millions) |
| | Year Ended December 31, | | | | |
| | 2020 | | 2019 | | |
| Tax at U.S. statutory rate | | $ | (41) | | | 21 | % | | $ | 66 | | | 21 | % | | | | |
| Increase (decrease) due to: | | | | | | | | | | | | |
| Percentage depletion in excess of cost depletion | | (42) | | | 22 | | | (49) | | | (16) | | | | | |
| Non-taxable income related to noncontrolling interests | | (9) | | | 4 | | | — | | | — | | | | | |
| Luxembourg legal entity reduction | | — | | | — | | | 846 | | | 271 | | | | | |
| Valuation allowance release: | | | | | | | | | | | | |
| | | | | | | | | | | | |
| | | | | | | | | | | | |
| Luxembourg legal entity reduction | | — | | | — | | | (846) | | | (271) | | | | | |
| State taxes, net | | (11) | | | 6 | | | — | | | — | | | | | |
| Other items, net | | (8) | | | 4 | | | 1 | | | 1 | | | | | |
| Provision for income tax expense (benefit) and effective income tax rate including discrete items | | $ | (111) | | | 57 | % | | $ | 18 | | | 6 | % | | | | |
|
| | | | | | | | | | | | | | |
| | | (In Millions) |
| | | 2018 | | 2017 |
| Tax at U.S. statutory rate | | $ | 118.6 |
| | 21.0 | % | | $ | 37.9 |
| | 35.0 | % |
| Increase (decrease) due to: | | | | | | | | |
| Percentage depletion in excess of cost depletion | | (54.6 | ) | | (9.7 | ) | | (61.6 | ) | | (56.9 | ) |
| Impact of tax law change - remeasurement of deferred taxes | | — |
| | — |
| | 407.5 |
| | 376.6 |
|
| Dissolution of Luxembourg entities | | 161.7 |
| | 28.6 |
| | — |
| | — |
|
| Prior year adjustments in current year | | (1.0 | ) | | (0.2 | ) | | (1.1 | ) | | (1.0 | ) |
| Valuation allowance reversal | | | | | | | | |
| Tax law change - remeasurement of deferred taxes | | — |
| | — |
| | (407.5 | ) | | (376.6 | ) |
| Current year activity | | (80.6 | ) | | (14.3 | ) | | (466.3 | ) | | (431.0 | ) |
| Release of U.S. valuation allowance | | (460.5 | ) | | (81.5 | ) | | — |
| | — |
|
| Repeal of AMT | | — |
| | — |
| | (235.3 | ) | | (217.5 | ) |
| Dissolution of Luxembourg entities | | (161.7 | ) | | (28.6 | ) | | — |
| | — |
|
| Prior year adjustments in current year | | 1.0 |
| | 0.2 |
| | (3.5 | ) | | (3.2 | ) |
| Tax uncertainties | | (1.3 | ) | | (0.2 | ) | | (1.4 | ) | | (1.3 | ) |
| Impact of foreign operations | | 0.1 |
| | — |
| | 477.9 |
| | 441.7 |
|
| Other items, net | | 3.1 |
| | 0.6 |
| | 1.0 |
| | 0.9 |
|
| Provision for income tax benefit and effective income tax rate including discrete items | | $ | (475.2 | ) | | (84.1 | )% | | $ | (252.4 | ) | | (233.3 | )% |
Our tax provision for the year ended December 31, 2018 was a benefit of $475.2 million and an effective tax rate of negative 84.1% compared with a benefit of $252.4 million and an effective tax rate of negative 233.3% for the prior year. The increase in income tax benefit fromin 2020, as compared to the prior year, is primarily duedirectly related to release of the valuation allowanceincrease in the U.S. of $460.5 million in the fourth quarter of 2018. Additionally, during 2018, apre-tax book loss year-over-year. The Luxembourg legal entity reduction initiative was completedrelates to initiatives resulting in the dissolution of two Luxembourg entities bothand settlement of which held net operating lossrelated financial instruments in the year ended December 31, 2019. The 2019 NOL deferred tax assets. This asset reduction resulted in antax expense of $161.7$846 million, which was fully offset by a decrease in the valuation allowance.
See NOTE 12 - INCOME TAXES for further information.
Adjusted EBITDA
We evaluate performance based on Adjusted EBITDA, which is a non-GAAP measure. This measure is used by management, investors, lenders and other external users of our financial statements to assess our operating performance and to compare operating performance to other companies in the steel industry, although it is not necessarily comparable to similarly titled measures used by other companies. In addition, management believes Adjusted EBITDA is a useful measure to assess the earnings power of the business without the impact of capital structure and can be used to assess our ability to service debt and fund future capital expenditures in the business.
The following table provides a reconciliation of our Net income (loss) to Adjusted EBITDA:
| | | | | | | | | | | |
| (In Millions) |
| Year Ended December 31, |
| 2020 | | 2019 |
| Net income (loss) | $ | (81) | | | $ | 293 | |
| Less: | | | |
| Interest expense, net | (238) | | | (101) | |
| Income tax benefit (expense) | 111 | | | (18) | |
| Depreciation, depletion and amortization | (308) | | | (85) | |
| Total EBITDA | $ | 354 | | | $ | 497 | |
| Less: | | | |
EBITDA from noncontrolling interests1 | $ | 56 | | | $ | — | |
| Gain (loss) on extinguishment of debt | 130 | | | (18) | |
| Severance costs | (38) | | | (2) | |
| Acquisition-related costs excluding severance costs | (52) | | | (7) | |
| Amortization of inventory step-up | (96) | | | — | |
| Impact of discontinued operations | 1 | | | (1) | |
| Total Adjusted EBITDA | $ | 353 | | | $ | 525 | |
| | | |
1 EBITDA of noncontrolling interests includes $41 million for income and $15 million for depreciation, depletion and amortization for the year ended December 31, 2020. |
The following table provides a summary of our Adjusted EBITDA by segment:
| | | | | | | | | | | |
| (In Millions) |
| Year Ended December 31, |
| 2020 | | 2019 |
| Adjusted EBITDA: | | | |
| Steelmaking | $ | 433 | | | $ | 636 | |
| Other Businesses | 47 | | | — | |
| Corporate and eliminations | (127) | | | (111) | |
| Total Adjusted EBITDA | $ | 353 | | | $ | 525 | |
The year ended December 31, 2020 results were unfavorably impacted by decreased customer demand resulting from the impacts of 2017 a benefit of $235.3 million was recorded asthe COVID-19 pandemic. As a result of the repealCOVID-19 pandemic, we incurred temporary idle-related costs resulting from production curtailments, excluding idle depreciation, depletion and amortization expense, of AMTapproximately $214 million during 2020.
Adjusted EBITDA from Corporate and eliminations primarily relates to Selling, general and administrative expenses at our Corporate headquarters.
Steelmaking
The following is a summary of our Steelmaking segment results included in the U.S. that decreased the deferred tax assets by $334.1 million and the Luxembourg rate reduction that decreased the deferred tax assets by $73.4 million. Both of these asset reductions were fully offset by a decrease in valuation allowance. The impact of foreign operations relates to income and losses in foreign jurisdictions where the statutory rates, ranging from 0% to 26.01%, differ from the U.S. statutory rate of 21% and 35%our consolidated financial statements for the years ended December 31, 20182020 and 2019. These results include the AK Steel operations subsequent to March 13, 2020, the ArcelorMittal USA operations subsequent to December 31, 2017, respectively.
See NOTE 10 - INCOME TAXES for further information.
Income9, 2020, and our results from discontinued operations netpreviously reported as part of tax
During the year ended December 31, 2018, we recorded income of $88.2 million within Income from discontinued operations, net of tax. For the year ended December 31, 2018, net income attributable to Asia Pacific Iron Ore was $118.3 million. As a result of the liquidation of substantially all of the Australian subsidiaries' net assets, the historical changes in foreign currency translation recorded in Accumulated other comprehensive loss in the Statements of Consolidated Financial Position of $228.1 million was reclassifiedour Mining and recognized as a gain in Income from discontinued operations, net of tax, which was partially offset by operating losses and exit costs at Asia Pacific Iron Ore and the settlement of the CCAA proceedings. We recorded Income from discontinued operations, net of tax of $2.5 million for the year ended December 31, 2017. Refer to NOTE 13 - DISCONTINUED OPERATIONS for further information.
EBITDA and Adjusted EBITDA
We evaluate performance based on EBITDA and Adjusted EBITDA, which are non-GAAP measures. These measures allow management and investors to focus on our ability to service our debt as well as illustrate how the business is performing. Additionally, EBITDA and Adjusted EBITDA assist management and investors in their analysis and forecasting as these measures approximate the cash flows associated with operational earnings.
Pelletizing segment.
|
| | | | | | | |
| | (In Millions) |
| | 2018 | | 2017 |
| | | | |
| Net income | $ | 1,128.1 |
| | $ | 363.1 |
|
| Less: | | | |
| Interest expense, net | (121.3 | ) | | (132.0 | ) |
| Income tax benefit | 460.3 |
| | 252.4 |
|
| Depreciation, depletion and amortization | (89.0 | ) | | (87.7 | ) |
| Total EBITDA | $ | 878.1 |
| | $ | 330.4 |
|
| Less: | | | |
| Loss on extinguishment of debt | $ | (6.8 | ) | | $ | (165.4 | ) |
| Impact of discontinued operations | 120.6 |
| | 22.0 |
|
| Foreign exchange remeasurement | (0.9 | ) | | 13.9 |
|
| Impairment of other long-lived assets | (1.1 | ) | | — |
|
| Total Adjusted EBITDA | $ | 766.3 |
| | $ | 459.9 |
|
| | | | |
| EBITDA: | | | |
| Mining and Pelletizing | $ | 852.9 |
| | $ | 534.9 |
|
| Metallics | (3.3 | ) | | (0.4 | ) |
| Other (including discontinued operations) | 28.5 |
| | (204.1 | ) |
| Total EBITDA | $ | 878.1 |
| | $ | 330.4 |
|
| | | | |
| Adjusted EBITDA: | | | |
| Mining and Pelletizing | $ | 875.3 |
| | $ | 559.4 |
|
| Metallics | (3.3 | ) | | (0.4 | ) |
| Other | (105.7 | ) | | (99.1 | ) |
| Total Adjusted EBITDA | $ | 766.3 |
| | $ | 459.9 |
|
Adjusted EBITDA increased by $306.4 million for the year ended December 31, 2018 from the comparable period in 2017. The increase primarily was attributable to higher consolidated sales margin of $342.0 million for the year ended December 31, 2018, compared to the prior year.
2017 Compared to 2016
Results of Operations
The following is a summary of the MiningSteelmaking segment operating results:
| | | | | | | | | | | |
| Year Ended December 31, |
| 2020 | | 2019 |
| Operating Results - In Millions | | | |
Revenues1 | $ | 4,965 | | | $ | 1,990 | |
| Cost of goods sold | $ | (4,749) | | | $ | (1,414) | |
| Selling Price - Per Ton | | | |
| Average net selling price per net ton of steel products | $ | 947 | | | N/A |
| Average net selling price per long ton of iron products | $ | 114 | | | $ | 107 | |
| | | |
1 Includes Realization of deferred revenue of $35 million for the year ended December 31, 2020. |
The following table represents our segment Revenues by product line:
| | | | | | | | | | | | | | | | | | | | | | | |
| (Dollars In Millions,
Sales Volumes In Thousands) |
| Year Ended December 31, |
| 2020 | | 2019 |
| Revenue | | Volume1 | | Revenue | | Volume1 |
| Hot-rolled steel | $ | 386 | | | 633 | | | $ | — | | | — | |
| Cold-rolled steel | 490 | | | 682 | | | — | | | — | |
| Coated steel | 1,747 | | | 1,911 | | | — | | | — | |
| Stainless and electrical steel | 868 | | | 416 | | | — | | | — | |
| Other steel products | 92 | | | 141 | | | — | | | — | |
Iron products2 | 1,335 | | | 11,707 | | | 1,990 | | | 18,583 | |
| Other | 47 | | | N/A | | — | | | — | |
| Total | $ | 4,965 | | | | | $ | 1,990 | | | |
1 Carbon steel products, stainless and electrical steel and plate steel volumes are stated in net tons. Iron product volumes are stated in long tons. |
2 Includes Realization of deferred revenue of $35 million for the year ended December 31, 2020. |
Operating Results
Despite the downward pressures on markets as a result of the COVID-19 pandemic during 2020, the operating results during the second half of the year showed significant signs of improvement heading into 2021, as we have seen pricing for HRC continue to rise and Pelletizing segment results:sales volumes begin to return to normal. Steelmaking revenues increased by $2,975 million compared to 2019, due to the addition of sales following the Acquisitions. This increase was partially offset by a decrease in revenue from iron products of $655 million resulting from lower sales volumes of 7 million long tons compared to 2019, partially due to the diversion of pellets for internal consumption following the Acquisitions, as well as lower overall demand from customers as a result of the impacts of the COVID-19 pandemic.
Cost of goods sold increased $3,335 million during 2020, compared to 2019, predominantly due to additional sales resulting from the Acquisitions; however, this increase was also unfavorably impacted by idle-related costs of approximately $225 million, driven by the temporary idling of facilities in response to lower customer demand due to the COVID-19 pandemic. |
| | | | | | | | | | | | | | | | | | | | | | | | | | | | |
| | | (In Millions) |
| | | | | Change due to | |
| | | Year Ended
December 31, | | Revenue and cost rate | | Sales volume | | Idle cost/production volume variance | | Freight and reimburse-ment | | Total change |
| | | 2017 | | 2016 | | | | | |
| Revenues from product sales and services | | $ | 1,866.0 |
| | $ | 1,554.5 |
| | $ | 228.2 |
| | $ | 36.7 |
| | $ | — |
| | $ | 46.6 |
| | $ | 311.5 |
|
| Cost of goods sold and operating expenses | | (1,398.4 | ) | | (1,274.4 | ) | | (113.7 | ) | | (18.4 | ) | | 54.7 |
| | (46.6 | ) | | (124.0 | ) |
| Sales margin | | $ | 467.6 |
|
| $ | 280.1 |
| | $ | 114.5 |
| | $ | 18.3 |
| | $ | 54.7 |
| | $ | — |
| | $ | 187.5 |
|
|
| | | | | | | | | | | | | | | |
| | | Year Ended December 31, | | | | |
| Per Long Sales Ton Information | | 2017 | | 2016 | | Difference | | Percent change |
Realized product revenue rate1 | | $ | 88.03 |
| | $ | 75.71 |
| | $ | 12.32 |
| | 16.3 | % |
Cash cost of goods sold and operating expense rate1,2 | | 59.43 |
| | 55.73 |
| | 3.70 |
| | 6.6 | % |
| Depreciation, depletion & amortization | | 3.56 |
| | 4.61 |
| | (1.05 | ) | | (22.8 | )% |
| Total cost of goods sold and operating expenses rate | | 62.99 |
| | 60.34 |
| | 2.65 |
| | 4.4 | % |
| Sales margin | | $ | 25.04 |
| | $ | 15.37 |
| | $ | 9.67 |
| | 62.9 | % |
| | | | | | | | | |
Sales tons3 (In thousands) | | 18,683 |
| | 18,224 |
| | | | |
Production tons3 (In thousands) | | | | | | | | |
| Total | | 25,542 |
| | 23,416 |
| | | | |
| Cliffs’ share of total | | 18,776 |
| | 15,982 |
| | | | |
| | | | | | | | | |
1 Excludes revenues and expenses related to domestic freight, which are offsetting and have no impact on sales margin. Revenues and expenses also exclude venture partner cost reimbursements. |
2 Cash cost of goods sold and operating expense rate is a non-GAAP financial measure. See "Non-GAAP Reconciliation" for reconciliation in dollars back to our consolidated financial statements. |
3 Tons are long tons (2,240 pounds). |
Sales margin for the Mining and Pelletizing segmentAs a result, Adjusted EBITDA was $467.6$433 million for the year ended December 31, 2017,2020, compared with $280.1to $636 million for the year ended December 31, 2016. Sales margin increased 62.9%prior year. Refer to $25.04 per long ton during the year ended December 31, 2017 compared to 2016."— Results of Operations" above for additional information.
Revenue increased by $264.9 million during the year ended December 31, 2017, compared to 2016, excluding the freight and reimbursements increase
An increase in the average year-to-date realized product revenue rate of $12.32 per long ton or 16.3% during the year ended December 31, 2017, compared to 2016, which resulted in an increase of $228.2 million. This is predominantly due to:
| |
◦ | An increase in Platts 62% Price, which positively affected the realized revenue rate by $9 per long ton or $176 million; |
| |
◦ | An increase in the average annual daily market price and customer pricing for hot-rolled coil steel, which positively affected the realized revenue rate by $5 per long ton or $100 million; and |
| |
◦ | Higher pellet premiums, which positively affected the realized revenue rate by $5 per long ton or $94 million. |
| |
◦ | These increases were offset partially by changes in customer and contract mix and carryover pricing impacts, which negatively affected the realized revenue rate by $5 per long ton or $84 million; and |
| |
◦ | Higher index freight rates, a component in some of our contract pricing formulas, which negatively affected the realized revenue rate by $3 per long ton or $63 million. |
Higher sales volumes of 0.5 million long tons during the year ended December 31, 2017, which resulted in increased revenues of $36.7 million due to:
| |
◦ | Increased demand from a customer, providing additional sales volume of 1.8 million long tons, compared to the prior year when the customer had sufficient inventory due to the idle of one of its facilities and additional suppliers; |
| |
◦ | Increased demand from a customer, providing additional sales volume of 1.3 million long tons, resulting from the fourth quarter 2015 termination of its contract causing a nine-month gap in sales to that customer; and |
| |
◦ | An increase in exports to Asia in order to offset a fourth quarter reduction in domestic nomination from a major customer and fewer domestic spot contracts, providing additional sales volume of 0.9 million long tons compared to 2016. |
| |
◦ | These increases were offset partially by 2.8 million long tons that were sold in 2016 on separate spot contracts with two customers and were not renewed; and |
| |
◦ | Decreased sales to a customer due to timing of payments and a lower 2017 nomination, resulting in a decrease in sales volume of 0.8 million long tons. |
Cost of goods sold and operating expenses increased $77.4 million during the year ended December 31, 2017 compared to 2016, excluding the freight and reimbursements increase of $46.6 million, predominantly as a result of:
Higher spending on repairs and maintenance of $44 million or $2 per long ton, higher profit sharing and benefit costs of $35 million or $2 per long ton, and higher energy rates for natural gas, diesel and electricity of $23 million or $1 per long ton; and
Increased sales volumes as discussed above which resulted in increased costs of $18 million period-over-period.
These increases were offset partially by decreased idle costs of $55 million or $3 per long ton due to the idle of the United Taconite and Northshore mines during the prior year.
Production
Our shareDuring 2020, we produced 4 million net tons of production in our Mining and Pelletizing segment increased by 17.5% during the year ended December 31, 2017 when compared to 2016. The increase in production volume primarily is attributable to all active mining facilities fully operating in 2017 compared to the various idled operations during 2016. United Taconite was fully operating during the year ended December 31, 2017, adding an incremental 3.3raw steel, 17 million long tons of production, comparediron ore pellets and 1 million net tons of coke. During 2020, certain of our operations were temporarily idled in response to the previous year'sCOVID-19 pandemic, with most restarting and resuming production levels as a resultin the second quarter of being idled for2020 and the first seven months of 2016. Secondly, Northshore added incremental tonnage of 2.1 million long tons during the year ended December 31, 2017, when it was substantially at full production, compared to its previous year's production tonnage when it was fully idled for the first four months of 2016. These production gains were offset partially by the indefinite idle of the Empire mine in August 2016, lowering production by 2.8 million long tons, compared to the prior year when the mine was operating.
Other Operating Income (Expense)
The following is a summary of Other operating income (expense):
|
| | | | | | | | | | | |
| | (In Millions) |
| | 2017 | | 2016 | | Variance Favorable/ (Unfavorable) |
| Selling, general and administrative expenses | $ | (102.9 | ) | | $ | (115.8 | ) | | $ | 12.9 |
|
| Miscellaneous - net | 25.5 |
| | (33.6 | ) | | 59.1 |
|
| | $ | (77.4 | ) | | $ | (149.4 | ) | | $ | 72.0 |
|
Selling, general and administrative expenses during the year ended December 31, 2017 decreased $12.9 million over 2016. The favorable variance for the year ended December 31, 2017 was driven by a $3.3 million decrease in incentive compensation and $3.5 million of union signing bonuses in 2016, that were not repeated in 2017. In addition, external services costs, excluding costs for early stage HBI project spending, decreased by $5.4 million for the year ended December 31, 2017 compared to the prior year. These favorable variances were offset partially by early-stage HBI project spending of $2.3 million.
The following is a summary of Miscellaneous - net:
|
| | | | | | | | | | | |
| | (In Millions) |
| | 2017 | | 2016 | | Variance
Favorable/
(Unfavorable) |
| Foreign exchange remeasurement | $ | 13.9 |
| | $ | (17.8 | ) | | $ | 31.7 |
|
| Michigan Electricity Matters accrual | 1.3 |
| | (12.4 | ) | | 13.7 |
|
| Management and royalty fees | 5.1 |
| | 9.0 |
| | (3.9 | ) |
| Empire idle costs | 5.0 |
| | (8.2 | ) | | 13.2 |
|
| Gain (loss) on disposal of assets | 0.9 |
| | (4.9 | ) | | 5.8 |
|
| Other | (0.7 | ) | | 0.7 |
| | (1.4 | ) |
| | $ | 25.5 |
| | $ | (33.6 | ) | | $ | 59.1 |
|
For the year ended December 31, 2017, there was an incrementally favorable impact of $31.7 million driven by the change in foreign exchange remeasurement of short-term intercompany loans that are denominated in currency that is not the functional currency of the entity that holds the loans. There was an incrementally favorable impact of $13.7 million related to the FERC ruling on the proceedings regarding cost allocations for continued operation of the Presque Isle power plant in Michigan (referred to above as the Michigan Electricity Matters) that was recordedremainder in the third quarter of 20162020. Dearborn Works' hot strip mill, anneal and adjusted in the fourth quarter of 2017. In addition, there was an incrementally favorable impact of $13.2 million in Empire mine idle costs driven primarily by an asset retirement obligation adjustment.
Other Income (Expense)
The following is a summary of Other expense:
|
| | | | | | | | | | | |
| | (In Millions) |
| | 2017 | | 2016 | | Variance Favorable/ (Unfavorable) |
| Interest expense, net | $ | (126.8 | ) | | $ | (193.9 | ) | | $ | 67.1 |
|
| Gain (loss) on extinguishment/restructuring of debt | (165.4 | ) | | 166.3 |
| | (331.7 | ) |
| Other non-operating income | 10.2 |
| | 7.3 |
| | 2.9 |
|
| | $ | (282.0 | ) | | $ | (20.3 | ) | | $ | (261.7 | ) |
The loss on extinguishment/restructuring of debt for the year endedDecember 31, 2017of$165.4 million was related to the repurchase of certain of our unsecured senior notestemper operations and the redemption in full of our then-outstanding
secured notes. This compares to a gain of $166.3 million for the year ended December 31, 2016, primarily related to the issuance of our 8.00% 2020 1.5 Lien Notes through an exchange offer on March 2, 2016.
Interest expense, net for the year ended December 31, 2017 had a favorable variance of $67.1 million versus the prior year, predominantly as a result of the debt restructuring activities that occurred throughout 2017. These debt restructurings resulted in a reduction of our effective interest rate to 5.8% and extended our debt maturities.
Refer to NOTE 6 - DEBT AND CREDIT FACILITIES for further discussion.
Income Taxes
Our tax rate is affected by permanent items, such as depletion and the relative amount of income we earn in various foreign jurisdictions with tax rates that differ from the U.S. statutory rate. It also is affected by discrete items that may occur in any given period, but are not consistent from period to period. The following represents a summary of our tax provision and corresponding effective rates:
|
| | | | | | | | | | | |
| | (In Millions) |
| | 2017 | | 2016 | | Variance |
| Income tax benefit | $ | 252.4 |
| | $ | 12.2 |
| | $ | 240.2 |
|
| Effective tax rate | (233.3 | )% | | (11.1 | )% | | (222.2 | )% |
A reconciliation of our income tax attributable to continuing operations computed at the U.S. federal statutory rate is as follows:
|
| | | | | | | | | | | | | |
| | (In Millions) |
| | 2017 | | 2016 |
| Tax at U.S. statutory rate | $ | 37.9 |
| | 35.0 | % | | $ | 38.6 |
| | 35.0 | % |
| Increase (decrease) due to: | | | | | | | |
| Impact of tax law change - remeasurement of deferred taxes | 407.5 |
| | 376.6 |
| | 149.1 |
| | 135.1 |
|
| Prior year adjustments in current year | (1.1 | ) | | (1.0 | ) | | (11.8 | ) | | (10.7 | ) |
| Valuation allowance build (reversal): | | | | | | | |
| Tax law change - remeasurement of deferred taxes | (407.5 | ) | | (376.6 | ) | | (149.1 | ) | | (135.1 | ) |
| Current year activity | (466.3 | ) | | (431.0 | ) | | 122.9 |
| | 111.3 |
|
| Repeal of AMT | (235.3 | ) | | (217.5 | ) | | — |
| | — |
|
| Prior year adjustments in current year | (3.5 | ) | | (3.2 | ) | | 9.3 |
| | 8.4 |
|
| Tax uncertainties | (1.4 | ) | | (1.3 | ) | | (11.3 | ) | | (10.2 | ) |
| Worthless stock deduction | — |
| | — |
| | (73.4 | ) | | (66.5 | ) |
| Impact of foreign operations | 477.9 |
| | 441.7 |
| | (40.6 | ) | | (36.8 | ) |
| Percentage depletion in excess of cost depletion | (61.6 | ) | | (56.9 | ) | | (36.1 | ) | | (32.7 | ) |
| Other items, net | 1.0 |
| | 0.9 |
| | (9.8 | ) | | (8.9 | ) |
| Provision for income tax benefit and effective income tax rate including discrete items | $ | (252.4 | ) | | (233.3 | )% | | $ | (12.2 | ) | | (11.1 | )% |
Our tax provision for the year ended December 31, 2017 was a benefit of $252.4 million and a negative 233.3% effective tax rate compared with a benefit of $12.2 million and an effective tax rate of negative 11.1% for the prior year. The increase in income tax benefit from the prior year is primarily due to the repeal of AMT through U.S. income tax reform legislation. The impact of tax law change due to remeasurement of deferred taxes primarily relates to the statutory rate reduction in the U.S. that decreased the deferred tax assets by $334.1 million and the Luxembourg rate reduction that decreased the deferred tax assets by $73.4 million. Both of these asset reductions were fully offset by a decrease in valuation allowance. The impact of foreign operations relates to income and losses in foreign jurisdictions where the statutory rates, ranging from 0% to 30%, differ from the U.S. statutory rate of 35%.
See NOTE 10 - INCOME TAXES for further information.
Income from discontinued operations, net of tax
For the year ended December 31, 2017, we recorded Income from discontinued operations, net of tax of $2.5 million. During 2017, the Wabush Scully Mine was soldAK Coal remain permanently idled as part of the ongoing CCAA proceedings forpermanent cost reduction efforts. Our Columbus and Monessen facilities acquired through the Wabush Group, which resulted in a net gainAM USA Transaction are temporarily idled due to impacts of $31.4 million. The gain was offset by an estimated liabilitythe COVID-19 pandemic. During 2019, we produced 20 million long tons of $55.6 million, which was established based on the probable assertion of a preference claim against the Company and was classified as Contingent claims in the Statements of Consolidated Financial Position. Additionally, for the year ended December 31, 2017, we recorded income of $21.2 million within Income from discontinued operations, net of tax relating to our Asia Pacific Iron Ore operations.iron ore pellets.
For the year ended December 31, 2016 we recorded a gain from discontinued operations of $76.7 million, which was attributable to income generated by our Asia Pacific Iron Ore operations of $96.6 million, offset partially by a loss related to our North American Coal and Eastern Canadian Iron Ore operations.
Refer to NOTE 13 - DISCONTINUED OPERATIONS for further information.
Noncontrolling Interest
During 2017, our ownership interest in Empire increased to 100% as we reached an agreement to distribute the noncontrolling interest net assets of $132.7 million to ArcelorMittal, in exchange for its interest in Empire. The agreement had no direct impact on the Loss (income) attributable to noncontrolling interest in the Statements of Consolidated Operations. However, for the year ended December 31, 2017, the Empire mine was indefinitely idled resulting in a loss attributable to the noncontrolling interest of $3.9 million. In comparison, during the year ended December 31, 2016, the Empire mine was operating and had income of $25.2 million attributable to the noncontrolling interest.
EBITDA and Adjusted EBITDA
We evaluate performance based on EBITDA and Adjusted EBITDA, which are non-GAAP measures. These measures allow management and investors to focus on our ability to service our debt as well as illustrate how the business is performing. Additionally, EBITDA and Adjusted EBITDA assist management and investors in their analysis and forecasting as these measures approximate the cash flows associated with operational earnings.
|
| | | | | | | |
| | (In Millions) |
| | 2017 | | 2016 |
| | | | |
| Net income | $ | 363.1 |
| | $ | 199.3 |
|
| Less: | | | |
| Interest expense, net | (132.0 | ) | | (200.5 | ) |
| Income tax benefit | 252.4 |
| | 12.2 |
|
| Depreciation, depletion and amortization | (87.7 | ) | | (115.4 | ) |
| EBITDA | $ | 330.4 |
| | $ | 503.0 |
|
| Less: | | | |
| Gain (loss) on extinguishment/restructuring of debt | $ | (165.4 | ) | | $ | 166.3 |
|
| Impact of discontinued operations | 22.0 |
| | 108.4 |
|
| Foreign exchange remeasurement | 13.9 |
| | (17.8 | ) |
| Total Adjusted EBITDA | $ | 459.9 |
| | $ | 246.1 |
|
| | | | |
| EBITDA: | | | |
| Mining and Pelletizing | $ | 534.9 |
| | $ | 342.4 |
|
| Metallics | (0.4 | ) | | — |
|
| Corporate and Other (including discontinued operations) | (204.1 | ) | | 160.6 |
|
| Total EBITDA | $ | 330.4 |
| | $ | 503.0 |
|
| | | | |
| Adjusted EBITDA: | | | |
| Mining and Pelletizing | $ | 559.4 |
| | $ | 359.6 |
|
| Metallics | (0.4 | ) | | — |
|
| Corporate and Other | (99.1 | ) | | (113.5 | ) |
| Total Adjusted EBITDA | $ | 459.9 |
| | $ | 246.1 |
|
EBITDA for the year ended December 31, 2017 decreased by $172.6 million on a consolidated basis from 2016. The unfavorable variance in EBITDA for the year ended December 31, 2017 was driven primarily by an incrementally negative impact of $331.7 million related to debt extinguishment/restructuring activities compared to the prior year partially offset by an increase in sales margin of $187.5 million compared to the prior year.
Adjusted EBITDA increased by $213.8 million for the year ended December 31, 2017 from the comparable period in 2016. The increase primarily was attributable to higher consolidated sales margin of $187.5 million for the year ended December 17, 2017, compared to the prior year.
Liquidity, Cash Flows and Capital Resources
Our primary sources of liquidity are Cash and cash equivalents and cash generated from our operatingoperations, availability under the ABL Facility and other financing activities. Our capital allocation decision-making process is focused on returning capital to shareholderspreserving healthy liquidity levels, while maintaining the strength of our balance sheet and creating financial flexibility to manage through the inherent cyclical demand for our products and volatility in commodity prices. We are focused on maximizing the cash generation of our operations, as well as reducing operating costs,debt, and aligning capital investments with our strategic priorities and the requirements of our business plan, including regulatory and permission-to-operate related projects.
During 2018,Since the onset of the COVID-19 pandemic in the U.S., our primary focus has been on maintaining adequate levels of liquidity to manage through a potentially prolonged economic downturn. In alignment with this, we took action consistentmade several operational adjustments, including facility closures, idles and extended maintenance outages. Along with the cost savings achieved through these operational adjustments, during 2020, we reduced planned capital expenditures for the year, reduced overhead costs and suspended our capital allocation prioritiesquarterly dividend payment. Additionally, on April 17, 2020 and April 24, 2020, we issued $400 million aggregate principal amount and an additional $555 million aggregate principal amount, respectively, of returning capital9.875% 2025 Senior Secured Notes to shareholders, maintainingfurther bolster our liquidity position and pay-down existing debt. We also issued an additional $120 million aggregate principal amount of 6.75% 2026 Senior Secured Notes on June 19, 2020, the strengthnet proceeds of which we used to finance construction of our balance sheet, improvingToledo direct reduction plant. Prior to such use, the net proceeds were used to temporarily reduce the outstanding borrowings under our financial flexibility and executing on opportunities that will allowABL Facility. We believe these measures have helped us to increasemaintain healthy liquidity levels during the COVID-19 pandemic.
Now that business conditions have improved and we expect to generate healthy free cash flow during 2021, we believe we have the ability to lower our long-term profitability.debt balance. Our stated initial target will be to reduce total debt to less than three times our annual Adjusted EBITDA. We have remained focused on protectingalso look at the composition of our business based ondebt, as well, as we are interested in both extending our maturity profile and increasing our ratio of unsecured debt to secured debt. These actions will better prepare us to allocate capital to both sustaining our existing operations and our two major capital projects:navigate more easily through potentially volatile industry conditions in the HBI plantfuture. In furtherance of these goals, we consummated certain financing transactions in Toledo, OhioFebruary 2021.
On February 11, 2021, we sold 20 million common shares and the upgradeindirect, wholly owned subsidiary of ArcelorMittal to which approximately 78 million common shares were issued as part of the consideration paid by us in connection with the closing of the AM USA Transaction sold 40 million common shares, in each case at a price per share to the Northshore plantunderwriter of $16.12, in an underwritten public offering. We also granted the underwriter an option to replacepurchase up to 3.5an additional 9 million long tonscommon shares from us at a price per share to the underwriter of blast furnace pellet production with DR-grade pellet production. Additionally, we executed a strategy$16.12. The underwriter has until March 10, 2021 to mitigate our costs as we exited the Asia Pacific Iron Ore operations, includingexercise such option, which it may do in full, in part or not at all. We did not receive any proceeds from the sale of allthe common shares by the selling shareholder in the offering. We intend to use the net proceeds to us from the offering, plus cash on hand, to redeem up to approximately $334 million aggregate principal amount of our outstanding 9.875% 2025 Senior Secured Notes. We intend to use any remaining assetsnet proceeds to us following such redemption to reduce borrowings under our ABL Facility.
On February 17, 2021, we issued $500 million aggregate principal amount of 4.625% 2029 Senior Notes and $500 million aggregate principal amount of 4.875% 2031 Senior Notes in an offering that was exempt from the registration requirements of the operations,Securities Act. We intend to use the net proceeds from the notes offering to redeem all of the outstanding 4.875% 2024 Senior Secured Notes and took additional steps6.375% 2025 Senior Notes issued by Cleveland-Cliffs Inc. and all of the outstanding 7.625% 2021 AK Senior Notes, 7.50% 2023 AK Senior Notes and 6.375% 2025 AK Senior Notes issued by AK Steel Corporation (n/k/a Cleveland-Cliffs Steel Corporation), and pay fees and expenses in connection with such redemptions, and reduce borrowings under our ABL Facility.
In connection with the underwritten public offering, we provided notice to reduceredeem $322.4 million aggregate principal amount of our 9.875% 2025 Senior Secured Notes on March 11, 2021. In connection with the notes offering, we provided notice to redeem all of the outstanding 4.875% 2024 Senior Secured Notes, 6.375% 2025 Senior Notes,
7.625% 2021 AK Senior Notes, 7.50% 2023 AK Senior Notes and 6.375% 2025 AK Senior Notes on March 12, 2021. Refer to NOTE 22 – SUBSEQUENT EVENTS for more information regarding February 2021 financing transactions.
The application of the net proceeds to us from the February 2021 financing transactions will shift our debt horizon, by providing a four-year window in which none of our long-term debt and extend our maturities by extinguishing $227.4 million of our existing debt.
notes are due, clearing the way for us to fully focus on operational integration.
Based on our outlook for the next 12 months, which is subject to continued changing demand from steelmakers that utilize our productscustomers and volatility in iron ore and domestic steel prices, we expect to generatehave ample liquidity through cash generated from operations and availability under our ABL Facility sufficient to meet the needs of our existing operations and service our debt obligations and fund our dividends.
Refer to “Outlook” for additional guidance regarding expected future results, including projections on pricing, sales volume and production.obligations.
The following discussion summarizes the significant activities that impacteditems impacting our cash flows during 20182020 and comparative years as well as those expected impacts to impact our future cash flows over the next 12 months. Refer to the Statements of Consolidated Cash Flows for additional information.
Operating Activities
Net cash providedused by operating activities was $478.5 million and $338.1 million for the years ended December 31, 2018 and 2017, respectively. The incremental increase in cash provided by operating activities during 2018 was primarily due to the improved operating results previously discussed related to our Mining and Pelletizing operating segment, offset partially by year-over-year changes in cash used by our discontinued operations.
Net cash provided by operating activities increased to $338.1$261 million for the year ended December 31, 2017,2020, compared to net cash provided by operating activities of $303.0$563 million for 2016.the year ended December 31, 2019. The increasechange in cash used by operating activities during 2020, compared to cash provided by operating activities during 2017in 2019, was due primarily due to the improvedslowing economy in connection with the COVID-19 pandemic, resulting in reduced customer demand and the need to temporarily idle many of our operations, which had an adverse effect on our operating results previously discussed related to our Mining and Pelletizing operating segment offset partially by cash outflows for working capital. Theresults. Our working capital change in 2017 versus 2016 was primarily driven by the repeal of corporate AMTnegatively impacted as a result of tax reform, which impacted our taxes receivable, and the timing of inventory andArcelorMittal USA's accounts receivable movements.
Drivingfactoring arrangement that was in place prior to the increase in our taxes receivable is Public Law 115–97, commonly known asAM USA Transaction. This negatively impacted working capital by $315 million for the “Tax Cuts and Jobs Act”, which among other things, repealed the corporate AMT and reduced the federal corporate tax rate to 21% for tax years beginning January 1, 2018. Along with the repeal of AMT, Public Law 115–97 provides that existing AMT credit carryovers are refundable beginning with the filing of the calendar year 2018 tax return. As ofended December 31, 2018, we have AMT credit carryovers of $117.3 million in Income tax receivable, current2020 and $117.3 million in Income tax receivable, non-current, which areis expected to be fully refunded betweenimpact the years 2019 and 2022.first quarter of 2021 by approximately $260 million.
Our U.S. cashCash and cash equivalents balance at December 31, 20182020 was $821.6$90 million, or 99.8%84% of our consolidated total cashCash and cash equivalents balance, excluding cash related to our consolidated VIE of $823.2$5 million. Additionally, we had a cash balance at December 31, 20182020 of $12.4$4 million classified as part of CurrentOther current assets of discontinued operations in the Statements of Consolidated Financial Position which will be utilizedrelated to support our exit from Australia.discontinued operations.
Investing Activities
Net cash used by investing activities was $273.1 million for the year ended December 31, 2018, compared to $156.0 million for the year ended December 31, 2017. We had capital expenditures of approximately $296$2,042 million and $152$644 million for the years ended December 31, 20182020 and 2017,2019, respectively. The 2018 capital expenditures include the continued development of our HBI project, sustaining capital spend and the upgrades at Northshore Mine.
Net cash used in investing activities was $156.0 million forDuring the year ended December 31, 2017 compared2020, we had net cash outflows of $658 million related to $57.9the AM USA Transaction, net of cash acquired. Additionally, during the year ended December 31, 2020, we had net cash outflows of $869 million related to the AK Steel Merger, net of cash acquired, which included $590 million used to repay the former AK Steel Corporation revolving credit facility and $324 million used to purchase outstanding 7.50% 2023 AK Senior Notes. Refer to NOTE 3 - ACQUISITIONS for 2016. Weadditional details on the Acquisitions.
Additionally, we had capital expenditures, including capitalized interest, of approximately $152$525 million and $69$656 million for the years ended December 31, 20172020 and 2016,2019, respectively. The 2017 capital expenditures include sustaining capital spend, early-stage work on our HBI projectWe had cash outflows, including deposits and capitalized interest, for the acquisitiondevelopment of certain real estate interests located in Itasca County westthe Toledo direct reduction plant of Nashwauk, Minnesota.
We spent approximately $69 million, $91$348 million and $69$544 million globally on expenditures related to sustaining capital during 2018, 2017for the years ended December 31, 2020 and 2016,2019, respectively. Sustaining capital spend includes infrastructure, mobile equipment, environmental, safety and health, fixed equipment and product quality. Additionally, duringDuring the year ended December 31, 2018,2019, we also had cash outflows, including deposits and capitalized interest, of approximately $180 million on the development of the HBI production plant in Toledo, Ohio and approximately $50$43 million on the upgrades at Northshore Mine.Northshore. Additionally, we spent $177 million and $69 million on sustaining capital expenditures during 2020 and 2019, respectively. Sustaining capital expenditures include capital expenditures related to infrastructure, mobile equipment, fixed equipment, product quality, environment, health and safety.
During 2020, in response to the COVID-19 pandemic, we temporarily limited our cash used for capital expenditures to critical sustaining capital, but have now resumed growth capital spending. During the fourth quarter of 2020, we completed construction of our Toledo direct reduction plant. We anticipate total cash used for capital expenditures excluding amounts attributable to construction-related contingencies and capitalized interest, during the next twelve12 months to be approximately $535between $600 million and $650 million. Included within this estimate is approximately $70 million for sustaining capital, $425 million related to the HBI production plant in Toledo, Ohio and approximately $40 million for upgrades at the Northshore plant to enable it to produce significantly increased levels of DR-grade pellets that could be sold commercially or used as feedstock for the HBI production plant. We expect to spend approximately $830 million on the HBI production plant and $90 million on the Northshore upgrades, exclusive of construction-related contingencies and capitalized interest, through 2020.
Financing Activities
Net cash used by financing activities was $375.2 million for the year ended December 31, 2018, compared with net cash provided by financing activities of $498.9 million for 2017. Uses of cash from financing activities during 2018 included the redemption of various tranches of unsecured debt. We redeemed in full all of our outstanding $400 million 5.90% 2020 Senior Notes and $500 million 4.80% 2020 Senior Notes and purchased certain other outstanding senior notes. The total aggregate principal amount of debt redeemed and purchased, including premiums, during 2018 was $234.5 million.
Additionally, on November 26, 2018, we announced that our Board of Directors authorized a program to repurchase outstanding common shares in the open market or in privately negotiated transactions, up to a maximum of $200 million. We are not obligated to make any purchase and the program may be suspended or discontinued at any time. During 2018, we repurchased 5.4 million common shares at a cost of approximately $47.5 million in aggregate, including commissions and fees, or an average price of approximately $8.78 per share. As of December 31, 2018, there was approximately $152.7 million remaining under the authorization. The share repurchase program is active until December 31, 2019.
Other uses of cash for financing activities during 2018 included cash payments of $44.2 million for the second of three installments related to an agreement to distribute the net assets of the noncontrolling interest in Empire in exchange for the remaining interest in Empire and $44.0 million for repayment of lease liabilities.
Net cash provided by financing activities was $498.9$2,059 million for the year ended December 31, 2017,2020, compared withto net cash used by financing activities of $206.4$394 million for 2016. Sourcesthe year ended December 31, 2019. Cash provided by financing activities for the year ended December 31, 2020 primarily related to the issuances in separate offerings consummated on March 13, 2020 and June 19, 2020 of $845 million combined aggregate principal amount of 6.75% 2026 Senior Secured Notes, the issuances in separate offerings consummated on April 17, 2020 and April 24, 2020 of $955 million combined aggregate principal amount of 9.875% 2025 Senior Secured Notes and borrowings
of $2,060 million under the ABL Facility. The net proceeds from the initial issuance of $725 million aggregate principal amount of the 6.75% 2026 Senior Secured Notes on March 13, 2020, along with cash on hand, were used to purchase $373 million aggregate principal amount of 7.625% 2021 AK Senior Notes and $367 million aggregate principal amount of 7.50% 2023 AK Senior Notes, in each case issued by AK Steel Corporation (n/k/a Cleveland-Cliffs Steel Corporation), that we accepted for purchase pursuant to our tender offers for any and all such notes then-outstanding in connection with the AK Steel Merger and to pay for the $44 million of debt issuance costs in the first quarter of 2020. The net proceeds from the additional issuance of $555 million aggregate principal amount of the 9.875% 2025 Senior Secured Notes on April 24, 2020 were used to repurchase $736 million aggregate principal amount of our outstanding senior notes of various series in private exchanges exempt from the registration requirements of the Securities Act. The net proceeds from the additional issuance of $120 million aggregate principal amount of 6.75% 2026 Senior Secured Notes on June 19, 2020 were used to finance construction of our Toledo direct reduction plant. Prior to such use, the net proceeds were used to temporarily reduce the outstanding borrowings under our ABL Facility. Additionally, during the year ended December 31, 2020, we repaid $550 million under the ABL Facility.
Net cash used by financing activities during 2019 primarily related to the repurchase of 24 million common shares for $253 million in the aggregate under the $300 million share repurchase program, which was active until December 31, 2019. Additionally, we issued $750 million aggregate principal amount of 5.875% 2027 Senior Notes, which provided net proceeds of approximately $714 million. The net proceeds from the notes offering, along with cash on hand, were used to redeem in full all of our then-outstanding 4.875% 2021 Senior Notes and to purchase $600 million aggregate principal amount of our outstanding 5.75% 2025 Senior Notes pursuant to a tender offer. In total, during 2019, we purchased $724 million aggregate principal amount of senior notes for $729 million in cash.
Additional uses of cash from financing activities during 20172019 included payments of regular quarterly cash dividends and a special cash dividend on our common share offering, generating net proceedsshares of $661.3$72 million and a cash payment of $44 million related to the issuancethird and final annual installment of $1.075 billion 5.75% 2025 Senior Notes, which provided further net proceedsthe distribution of $1.046 billion. Empire partnership equity.
We also had an issuancehave temporarily suspended future dividend distributions as a result of $400.0 million 4.875% 2024 Senior Secured Notes and an issuanceimpacts of $316.25 million 1.5% 2025 Convertible Senior Notes, generating net proceedsthe COVID-19 pandemic in order to preserve cash during this time of $697.5 million.
Useseconomic uncertainty. We anticipate future uses of cash fromand cash provided by financing activities during 2017 included the redemption of various tranches of secured and unsecured debt. We redeemed in full allnext 12 months to include opportunistic debt transactions as part of our outstanding $540 million 8.25%liability management strategy, similar to the transactions that occurred during 2020 First Lien Notes, $218.5 million 8.00% 2020 1.5 Lien Notes and $544.2 million 7.75% 2020 Second Lien NotesFebruary 2021, in addition to providing supplemental financing to meet cash requirements for business improvement opportunities.
The discussion of our Liquidity, Cash Flows and purchased certain other outstanding senior notes through tender offersCapital Resources results for 2019 compared to 2018 can be found in Part II, Item 7., "Management's Discussion and redemptions. The total aggregate principal amountAnalysis of debt redeemedFinancial Condition and purchased, including premiums, during 2017 was $1.721 billion. Additionally, we finalized an agreement to distributeResults of Operations", in our Annual Report on Form 10-K for the net assetsyear ended December 31, 2019, filed with the SEC on February 20, 2020.
The following represents our future cash commitments and contractual obligations as of December 31, 2018:2020:
|
| | | | | | | | | | | | | | | | | | | | |
| | | Payments Due by Period (In Millions) |
| | | Total | | Less than 1 Year | | 1 - 3 Years | | 3 - 5 Years | | More than 5 Years |
| Long-term debt | | $ | 2,212.0 |
| | $ | — |
| | $ | 124.0 |
| | $ | — |
| | $ | 2,088.0 |
|
Interest on debt1 | | 964.6 |
| | 110.6 |
| | 218.3 |
| | 209.2 |
| | 426.5 |
|
| Operating lease obligations | | 19.6 |
| | 4.0 |
| | 5.8 |
| | 3.8 |
| | 6.0 |
|
| Capital lease obligations | | 18.5 |
| | 4.2 |
| | 7.8 |
| | 5.4 |
| | 1.1 |
|
| Partnership distribution payable | | 44.2 |
| | 44.2 |
| | — |
| | — |
| | — |
|
| Purchase obligations: | | | | | | | | | | |
| Open purchase orders | | 89.5 |
| | 89.5 |
| | — |
| | — |
| | — |
|
HBI production plant2 | | 650.0 |
| | 425.0 |
| | 225.0 |
| | — |
| | — |
|
Minimum "take or pay" purchase commitments3 | | 711.8 |
| | 85.8 |
| | 152.7 |
| | 108.4 |
| | 364.9 |
|
| Total purchase obligations | | 1,451.3 |
| | 600.3 |
| | 377.7 |
| | 108.4 |
| | 364.9 |
|
| Other long-term liabilities: | | | | | | | | | | |
| Pension funding minimums | | 365.1 |
| | 15.9 |
| | 79.2 |
| | 118.8 |
| | 151.2 |
|
| OPEB claim payments | | 93.3 |
| | 3.5 |
| | 6.8 |
| | 6.6 |
| | 76.4 |
|
| Environmental and mine closure obligations | | 174.9 |
| | 2.9 |
| | 46.9 |
| | 4.3 |
| | 120.8 |
|
| Total other long-term liabilities | | 633.3 |
| | 22.3 |
| | 132.9 |
| | 129.7 |
| | 348.4 |
|
| Total | | $ | 5,343.5 |
|
| $ | 785.6 |
|
| $ | 866.5 |
|
| $ | 456.5 |
|
| $ | 3,234.9 |
|
| | | | | | | | | | | |
1 Refer to NOTE 6 - DEBT AND CREDIT FACILITIES for additional information regarding our debt and related interest rates. |
2 Includes purchase obligations and contracted amounts of approximately $400 million. |
3 Includes minimum railroad transportation obligations, minimum electric power demand charges, minimum coal, diesel and natural gas obligations and minimum port facility obligations. |
The above table does not reflect $4.2 million of unrecognized tax benefits, which we have recorded for uncertain tax positions, as we are unable to determine a reasonable and reliable estimate of the timing of future payments. | | | | | | | | | | | | | | | | | | | | | | | | | | | | | |
| Payments Due by Period (In Millions) |
| Total | | Less than
1 Year | | 1 - 3
Years | | 3 - 5
Years | | More than 5 Years |
Long-term debt1 | $ | 5,595 | | | $ | 34 | | | $ | 13 | | | $ | 2,197 | | | $ | 3,351 | |
Interest on debt1 | 1,772 | | | 303 | | | 601 | | | 507 | | | 361 | |
| Operating lease obligations | 363 | | | 70 | | | 99 | | | 72 | | | 122 | |
| Finance lease obligations | 394 | | | 100 | | | 173 | | | 45 | | | 76 | |
| Purchase obligations: | | | | | | | | | |
| Open purchase orders | 347 | | | 342 | | | 5 | | | — | | | — | |
Minimum "take or pay" purchase commitments2 | 8,853 | | | 2,865 | | | 2,708 | | | 1,607 | | | 1,673 | |
| Total purchase obligations | 9,200 | | | 3,207 | | | 2,713 | | | 1,607 | | | 1,673 | |
| Other long-term liabilities: | | | | | | | | | |
| Pension funding minimums | 887 | | | 202 | | | 178 | | | 238 | | | 269 | |
| OPEB claim payments | 1,777 | | | 144 | | | 280 | | | 269 | | | 1,084 | |
| Environmental and asset retirement obligations | 589 | | | 27 | | | 51 | | | 42 | | | 469 | |
| Other | 272 | | | 71 | | | 99 | | | 31 | | | 71 | |
| Total other long-term liabilities | 3,525 | | | 444 | | | 608 | | | 580 | | | 1,893 | |
| Total | $ | 20,849 | | | $ | 4,158 | | | $ | 4,207 | | | $ | 5,008 | | | $ | 7,476 | |
| | | | | | | | | |
1 Refer to NOTE 8 - DEBT AND CREDIT FACILITIES for additional information regarding our debt and related interest rates. |
2 Includes minimum railroad and vessel transportation obligations, minimum electric power demand charges, minimum diesel and natural gas obligations and minimum port facility obligations. Additionally, includes our coke purchase commitments related to our coke supply agreement with SunCoke Middletown. |
Refer to NOTE 1921 - COMMITMENTS AND CONTINGENCIES for additional information regarding our future commitments and obligations.
Capital Resources
We expect to fund our business obligations from available cash, current and future operations and existing and future borrowing arrangements. We also may pursue other funding strategies in the capital markets to strengthen our liquidity, extend debt maturities and/or fund strategic initiatives. The following represents a summary of key liquidity measures:
| | | | | |
| (In Millions) |
| December 31,
2020 |
| Cash and cash equivalents | $ | 112 | |
Cash and cash equivalents from discontinued operations, included within Other current assets | 4 | |
| Less: Cash and cash equivalents from VIE's | (5) | |
| Total cash and cash equivalents | $ | 111 | |
| |
Available borrowing base on ABL Facility1 | $ | 3,500 | |
| Borrowings | (1,510) | |
| Letter of credit obligations | (247) | |
| Borrowing capacity available | $ | 1,743 | |
| |
| |
1 As of December 31, 2020, the ABL Facility had a maximum borrowing base of $3.5 billion, determined by applying customary advance rates to eligible accounts receivable, inventory and certain mobile equipment. |
|
| | | | | | | |
| | (In Millions) |
| | December 31,
2018 | | December 31, 2017 |
| Cash and cash equivalents | $ | 823.2 |
| | $ | 978.3 |
|
| | | | |
Available borrowing base on ABL Facility1 | $ | 323.7 |
| | $ | 273.2 |
|
| ABL Facility loans drawn | — |
| | — |
|
| Letter of credit obligations and other commitments | (55.0 | ) | | (46.5 | ) |
| Borrowing capacity available | $ | 268.7 |
| | $ | 226.7 |
|
| | | | |
1 The ABL Facility has a maximum borrowing base of $450 million, determined by applying customary advance rates to eligible accounts receivable, inventory and certain mobile equipment. |
Our primary sources of funding are cash and cash equivalents, which totaled $823.2$111 million as of December 31, 2018,2020, cash generated by our business, availability under the ABL Facility and other financing activities. Cash and cash equivalents include cash on hand and on deposit as well as all short-term securities held for the primary purpose of general liquidity.deposit. The combination of cash and availability under the ABL Facility gives us $1,091.9 million$1.9 billion in liquidity entering the first quarter of 2019,2021, which is expected to be adequate to fund operations, letter of credit obligations, sustaining and expansion capital expenditures and other cash commitments for at least the next 12 months.
As of February 24, 2021, we had total liquidity of approximately $2.6 billion, consisting of approximately $200 million in cash and approximately $2.4 billion of availability under its ABL credit facility, of which approximately $850 million is expected to be used to redeem the senior notes for which notice of redemption was provided in connection with the offerings consummated in February 2021.
As of December 31, 2018,2020, we were in compliance with the ABL Facility liquidity requirements and, therefore, the springing financial covenant requiring a minimum Fixed Charge Coverage Ratio of 1.0 to 1.0 was not applicable. We believe that the cash on hand and the ABL Facility provide us sufficient liquidity to support our operating, investing and financing activities. We have the capability to issue additional unsecured notes and, subject to the limitations set forth in our existing debtsenior notes indentures, additional secured indebtedness,debt, if we elect to access the debt capital markets. However, available capacity of theseour ability to issue additional notes could be limited by market conditions.
Consistent with our stated strategy, weWe intend from time to time to seek to retire or purchase our outstanding senior notes with cash on hand, borrowings from existing credit sources or new debt financings and/or exchanges for debt or equity securities, in open market purchases, privately negotiated transactions or otherwise. Such repurchases, if any, will depend on prevailing market conditions, our liquidity requirements, contractual restrictions and other factors, and the amounts involved may be material.
Off-Balance Sheet Arrangements
In the normal course of business, we are a party to certain arrangements that are not reflected on our Statements of Consolidated Financial Position. These arrangements include minimum "take or pay" purchase commitments, such as minimum electric power demand charges, minimum coal, diesel and natural gas purchase commitments, minimum railroad transportation commitments and minimum port facility usage commitments; and financial instruments with off-balance sheet risk, such as bank letters of credit and bank guarantees;guarantees.
Information about our Guarantors and operating leases,the Issuer of our Guaranteed Securities
The accompanying summarized financial information has been prepared and presented pursuant to SEC Regulation S-X, Rule 3-10, “Financial Statements of Guarantors and Issuers of Guaranteed Securities Registered or
Being Registered,” and Rule 13-01 "Financial Disclosures about Guarantors and Issuers of Guaranteed Securities and Affiliates Whose Securities Collateralized a Registrant's Securities." Certain of our subsidiaries (the "Guarantor subsidiaries") have fully and unconditionally, and jointly and severally, guaranteed the obligations under (a) the 5.75% 2025 Senior Notes, the 6.375% 2025 Senior Notes, the 5.875% 2027 Senior Notes and the 7.00% 2027 Senior Notes issued by Cleveland-Cliffs Inc. on a senior unsecured basis and (b) the 4.875% 2024 Senior Secured Notes, the 6.75% 2026 Senior Secured Notes and the 9.875% 2025 Senior Secured Notes on a senior secured basis. See NOTE 7 - DEBT AND CREDIT FACILITIES for further information.
The following presents the summarized financial information on a combined basis for Cleveland-Cliffs Inc. (parent company and issuer of the guaranteed obligations) and the Guarantor subsidiaries, collectively referred to as the obligated group. Transactions between the obligated group have been eliminated. Information for the non-Guarantor subsidiaries was excluded from the combined summarized financial information of the obligated group.
Each Guarantor subsidiary is consolidated by Cleveland-Cliffs Inc. as of December 31, 2020. Refer to Exhibit 22.1, incorporated herein by reference, for the detailed list of entities included within the obligated group as of December 31, 2020 and December 31, 2019.
The guarantee of a Guarantor subsidiary with respect to Cliffs' 5.75% 2025 Senior Notes, 6.375% 2025 Senior Notes, 5.875% 2027 Senior Notes, 7.00% 2027 Senior Notes, 4.875% 2024 Senior Secured Notes, 6.75% 2026 Senior Secured Notes and 9.875% 2025 Senior Secured Notes will be automatically and unconditionally released and discharged, and such Guarantor subsidiary’s obligations under the guarantee and the related indentures (the “Indentures”) will be automatically and unconditionally released and discharged, upon the occurrence of any of the following, along with the delivery to the trustee of an officer’s certificate and an opinion of counsel, each stating that all conditions precedent provided for in the applicable Indenture relating to the release and discharge of such Guarantor subsidiary’s guarantee have been complied with:
(a) any sale, exchange, transfer or disposition of such Guarantor subsidiary (by merger, consolidation, or the sale of) or the capital stock of such Guarantor subsidiary after which primarily relatethe applicable Guarantor subsidiary is no longer a subsidiary of the Company or the sale of all or substantially all of such Guarantor subsidiary’s assets (other than by lease), whether or not such Guarantor subsidiary is the surviving entity in such transaction, to equipmenta person which is not the Company or a subsidiary of the Company; provided that (i) such sale, exchange, transfer or disposition is made in compliance with the applicable Indenture, including the covenants regarding consolidation, merger and office space.sale of assets and, as applicable, dispositions of assets that constitute notes collateral, and (ii) all the obligations of such Guarantor subsidiary under all debt of the Company or its subsidiaries terminate upon consummation of such transaction;
(b) designation of any Guarantor subsidiary as an “excluded subsidiary” (as defined in the Indentures); or (c) defeasance or satisfaction and discharge of the Indentures.
Each entity in the summarized combined financial information follows the same accounting policies as described in the consolidated financial statements. The accompanying summarized combined financial information does not reflect investments of the obligated group in non-Guarantor subsidiaries. The financial information of the obligated group is presented on a combined basis; intercompany balances and transactions within the obligated group have been eliminated. The obligated group's amounts due from, amounts due to, and transactions with, non-Guarantor subsidiaries and related parties have been presented in separate line items.
Summarized Combined Financial Information of the Issuer and Guarantor Subsidiaries:
The following table is summarized combined financial information from the Statements of Condensed Consolidated Financial Position of the obligated group:
| | | | | | | | | | | |
| (In Millions) |
| December 31, 2020 | | December 31, 2019 |
| Current assets | $ | 4,903 | | | $ | 891 | |
| Non-current assets | 10,535 | | | 2,382 | |
| Current liabilities | (2,767) | | | (393) | |
| Non-current liabilities | (10,563) | | | (2,792) | |
| | | |
The following table is summarized combined financial information from the Statements of Condensed Consolidated Operations of the obligated group:
| | | | | |
| (In Millions) |
| Year Ended |
| December 31, 2020 |
Revenues1 | $ | 5,170 | |
| Cost of goods sold | (5,008) | |
| Loss from continuing operations | (120) | |
| Net loss | (118) | |
| Net loss attributable to Cliffs shareholders | (118) | |
1 Includes Realization of deferred revenue of $35 million for the year ended December 31, 2020.
As of December 31, 2020 and 2019, the obligated group had the following balances with non-Guarantor subsidiaries and other related parties:
| | | | | | | | | | | |
| (In Millions) |
| December 31, 2020 | | December 31, 2019 |
| Balances with non-Guarantor subsidiaries: | | | |
| Accounts receivable, net | $ | 69 | | | $ | — | |
| Accounts payable | (17) | | | — | |
| | | |
| Balances with other related parties: | | | |
| Accounts receivable, net | $ | 2 | | | $ | 31 | |
| Other current assets | — | | | 45 | |
| Accounts payable | (6) | | | — | |
| Other current liabilities | — | | | (2) | |
Additionally, for the year ended December 31, 2020, the obligated group had Revenues of $893 million and Cost of goods sold of $602 million, in each case with other related parties.
Market Risks
We are subject to a variety of risks, including those caused by changes in commodity prices foreign currency exchange rates and interest rates. We have established policies and procedures to manage such risks; however, certain risks are beyond our control.
Pricing Risks
Commodity Price Risk
Our consolidated revenues includeIn the ordinary course of business, we are exposed to market risk and price fluctuations related to the sale of a single product, iron ore pellets,our products, which are impacted primarily by market prices for HRC, and the purchase of energy and raw materials used in our operations, which are impacted by market prices for electricity, natural gas, ferrous and stainless steel scrap, chrome, coal, coke, nickel and zinc. Our strategy to address market risk has generally been to obtain competitive prices for our products and services and allow operating results to reflect market price movements dictated by supply and demand; however, we make forward physical purchases and enter into hedge contracts to manage exposure to price risk related to the purchases of certain raw materials and energy used in the North American market. production process.
Our financial results can vary significantlyfor our operations as a result of fluctuations in the market prices of iron ore, hot-rolled coil steelprices. We attempt to mitigate these risks by aligning fixed and iron ore pellet premiums. World market prices for these commodities have fluctuated historically and are affected
by numerous factors beyond our control.The world market price that is most commonly utilizedvariable components in our iron orecustomer pricing contracts, supplier purchasing agreements and derivative financial instruments.
Some customer contracts have fixed-pricing terms, which increase our exposure to fluctuations in raw material and energy costs. To reduce our exposure, we enter into annual, fixed-price agreements for certain raw materials. Some of our existing multi-year raw material supply agreements have required minimum purchase quantities. Under adverse economic conditions, those minimums may exceed our needs. Absent exceptions for force
majeure and other circumstances affecting the legal enforceability of the agreements, these minimum purchase requirements may compel us to purchase quantities of raw materials that could significantly exceed our anticipated needs or pay damages to the supplier for shortfalls. In these circumstances, we would attempt to negotiate agreements for new purchase quantities. There is a risk, however, that we would not be successful in reducing purchase quantities, either through negotiation or litigation. If that occurred, we would likely be required to purchase more of a particular raw material in a particular year than we need, negatively affecting our results of operations and cash flows.
Certain of our customer contracts include variable-pricing mechanisms that adjust selling prices in response to changes in the costs of certain raw materials and energy, while other of our customer contracts exclude such mechanisms. We may enter multi-year purchase agreements for certain raw materials with similar variable-price mechanisms, allowing us to achieve natural hedges between the customer contracts and supplier purchase agreements. Therefore, in some cases, price fluctuations for energy (particularly natural gas and electricity), raw materials (such as scrap, chrome, zinc and nickel) or other commodities may be, in part, passed on to customers rather than absorbed solely by us. There is a risk, however, that the variable-price mechanisms in the sales contracts is the Platts 62% Price, which can fluctuate widely due to numerous factors, such as global economic growth or contraction,may not necessarily change in demand for steel or changestandem with the variable-price mechanisms in availabilityour purchase agreements, negatively affecting our results of supply.
Customer Supply Agreement
A supply agreement with one customer provides for supplemental revenue or refunds based on the average annual daily market price for hot-rolled coil steel at the time the iron ore product is consumed in the customer’s blast furnaces. At December 31, 2018, we had derivative assets of $89.3 million, representing the fair value of the pricing factors, based upon the amount of unconsumed long tonsoperations and an estimated average hot-rolled coil steel price for the period in which the iron ore is expected to be consumed in the customer's blast furnaces, subject to final pricing at a future date. We estimate that a $75 positive or negative change in the average daily market price for hot-rolled coil steel realized from the December 31, 2018 estimated price recorded would cause the fair value of the derivative instrument to increase or decrease by approximately $27 million, respectively, thereby impacting our consolidated revenues by the same amount. We have not entered into any hedging programs to mitigate the risk of adverse price fluctuations.
Volatile Energy and Fuel Costs
The volatile cost of energy is an important factor affecting the production costs at our iron ore operations. Our consolidated Mining and Pelletizing segment operations consumed 15 million MMBtu of natural gas at an average delivered price of $3.77 per MMBtu, excluding the natural gas hedge impact, or $3.65 per MMBtu net of the natural gas hedge impact during 2018. Additionally, our consolidated Mining and Pelletizing segment operations consumed 17 million gallons of diesel fuel at an average delivered price of $2.37 per gallon during 2018.cash flows.
Our strategy to address volatile natural gas rates and dieselelectricity rates includes improving efficiency in energy usage, identifying alternative providers and utilizing the lowest cost alternative fuels. A full-year hedging program was implemented duringIf we are unable to align fixed and variable components between customer contracts and supplier purchase agreements, we use cash-settled commodity price swaps and options to hedge the fourth quartermarket risk associated with the purchase of 2017 in ordercertain of our raw materials and energy requirements. Additionally, we routinely use these derivative instruments to manage the price riskhedge a portion of our natural gas, atelectricity and zinc requirements. Our hedging strategy is designed to protect us from excessive pricing volatility. However, since we do not typically hedge 100% of our Mining and Pelletizing segment mines. Additionally, duringexposure, abnormal price increases in any of these commodity markets might still negatively affect operating costs. The following table summarizes the third quarterimpact of 2018, we began entering into forward hedge contracts to manage our 2019 price of diesel fuel at our Mining and Pelletizing segment mines. We will continue to monitor relevant energy markets for risk mitigation opportunities and may make additional forward purchases or employ other hedging instruments in the future as warranted and deemed appropriate by management. In the near term, a 10% and 25% change in market price from the December 31, 2020 estimated price on our 2018 average natural gas and diesel fuel prices would result in a change of approximately $11 million inderivative instruments, thereby impacting our annual fuel and energy cost based on expected consumption for 2019.pre-tax income by the same amount.
In the ordinary course of business, there may also be increases in prices relative to electricity costs at our mine sites. Specifically, Tilden has entered into large curtailable special contracts with Wisconsin Electric Power Company. Charges under those special contracts are subject to a power supply cost recovery mechanism that is based on variations in the utility's actual fuel and purchase power expenses. | | | | | | | | | | | |
| (In Millions) |
| Positive or Negative Effect on
Pre-tax Income |
| Commodity Derivative | 10% Increase or Decrease | | 25% Increase or Decrease |
| Natural gas | $ | 28 | | | $ | 69 | |
| Electricity | 2 | | | 4 | |
| Zinc | 1 | | | 2 | |
Valuation of Goodwill and Other Long-Lived Assets
We assign goodwill arising from acquired companies to the reporting units that are expected to benefit from the synergies of the acquisition. Goodwill is tested on a qualitative basis for impairment at the reporting unit level on an annual basis (October 1) and between annual tests if an event occurs or circumstances change that would more likely than not reduce the fair value of a reporting unit below its carrying value. These events or circumstances could include a significant change in the business climate, legal factors, operating performance indicators, competition or sale or disposition of a significant portion of a reporting unit. As necessary, should our qualitative test indicate that it is more likely than not that the fair value of a reporting unit is less than its carry amount, we perform a quantitative test to determine the amount of impairment, if any, to the carrying value of the reporting unit and its associated goodwill.
Application of the goodwill impairment test requires judgment, including the identification of reporting units, assignment of assets and liabilities to reporting units, assignment of goodwill to reporting units and if a quantitative assessment is deemed necessary in determination of the fair value of each reporting unit. The fair value of each reporting unit is estimated using a discounted cash flow methodology, which considers forecasted cash flows discounted at an estimated weighted average cost of capital. Assessing the recoverability of our goodwill requires significant assumptions regarding the estimated future cash flows and other factors to determine the fair value of a reporting unit, including, among other things, estimates related to forecasts of future revenues, expected Adjusted EBITDA, expected capital expenditures and working capital requirements, which are based upon our long-range plan estimates. The assumptions used to calculate the fair value of a reporting unit may change from year to year based on operating results, market conditions and other factors. Changes in these assumptions could materially affect the determination of fair value for each reporting unit.
Long-lived assets are reviewed for impairment upon the occurrence of events or changes in circumstances that would indicate that the carrying value of the assets may not be recoverable. Such indicators may include, among others:include: a significant decline in expected future cash flows; a sustained, significant decline in market pricing; a significant adverse change in legal or environmental factors or in the business climate; changes in estimates of our recoverable reserves; and unanticipated competition; and slower growth or production rates.competition. Any adverse change in these factors could have a significant impact on the recoverability of our long-lived assets and could have a material impact on our consolidated statements of operations and statement of financial position.
A comparison of each asset group's carrying value to the estimated undiscounted net future cash flows expected to result from the use of the assets, including cost of disposition, is used to determine if an asset is recoverable. Projected future cash flows reflect management's best estimatesestimate of economic and market conditions over the projected period, including growth rates in revenues and costs, and estimates of future expected changes in operating margins and capital expenditures. If the carrying value of the asset group is higher than its undiscounted net future cash flows, the asset group is measured at fair value and the difference is recorded as a reduction to the long-lived assets. We estimate fair value using a market approach, an income approach or a cost approach. As ofWhile we concluded that an event triggering the need for an impairment assessment did not occur during the year ended December 31, 2018, no impairment factors were present2020, a prolonged COVID-19 pandemic could impact the results of operations due to changes to assumptions that would indicate that the carrying value of our asset groups may not be recoverable; as a result, no impairment assessment was required.
recoverable.
Interest Rate Risk
Interest payable on our senior notes is at fixed rates. Interest payable under our ABL Facility is at a variable rate based upon the applicable base rate plus the applicable base rate margin depending on the excess availability. As of December 31, 2018,2020, we had no amounts drawn on$1,510 million outstanding under the ABL Facility. An increase in prevailing interest rates would increase interest expense and interest paid for any outstanding borrowings under the ABL Facility. For example, a 100 basis point change to interest rates under the ABL Facility at the December 31, 2020 borrowing level would result in a change of $15 million to interest expense on an annual basis.
Supply Concentration Risks
Many of our operations and mines are dependentrely on one source for each of electric power and natural gas. A significant interruption or change in service or rates from our energy suppliers could materially impact materially our production costs, margins and profitability.
Outlook
|
| | |
| 2019 Outlook Summary |
Per Long Ton Information | Mining and Pelletizing |
Cost of goods sold and operating expense rate | $73 - $78 |
Less: | |
Freight expense rate1
| $7 |
Depreciation, depletion & amortization rate | $4 |
Cash cost of goods sold and operating expense rate | $62 - $67 |
| |
Sales volume (million long tons) | 20.0 |
Production volume (million long tons) | 20.0 |
|
1 Freight has an offsetting amount in revenue and has no impact on sales margin.
|
Mining and Pelletizing Outlook (Long Tons)
Based on the assumption that iron ore prices of $76 per metric ton, steel prices of $694 per short ton, and pellet premiums of $67.50 per metric ton will average for the remainder of 2019 their respective January averages, we would realize Mining and Pelletizing revenue rates in the range of $102 to $107 per long ton. Performing the same analysis using spot prices as of February 7, 2019, namely an iron ore price of $90.50 per metric ton, a steel price of $683 per short ton, and a pellet premium of $67.50 per metric ton, we would expect to realize Mining and Pelletizing revenue rates in the range of $111 to $116 per long ton for the full-year 2019.
For 2019, we expect full-year sales and production volumes of our productive capacity of approximately 20 million long tons. Our full-year 2019 Mining and Pelletizing cash cost of goods sold and operating expense expectation is $62 to $67 per long ton.
SG&A Expenses and Other Expectations
Full-year 2019 SG&A expenses are expected to be approximately $120 million. We note that of the $120 million expectation, approximately $20 million is considered non-cash.
Our full-year 2019 interest expense is expected to be approximately $100 million, compared to $119 million recorded in 2018. We expect approximately $20 million in cash interest related to the HBI project to be capitalized, compared to $6 million that was capitalized in 2018.
Our 2019 effective tax rate is expected to be approximately 10%. However, due to our net operating loss position, our cash tax payments are expected to be zero.
Additionally, we also expect to receive approximately $117 million in cash tax refunds during the third quarter of 2019.
Consolidated full-year 2019 depreciation, depletion and amortization is expected to be approximately $85 million, incurred ratably throughout the year.
Capital Expenditures
Our 2019 capital spending expectations are:
Approximately $425 million toward the HBI project in Toledo, OH;
Approximately $70 million in sustaining capital;
Approximately $40 million toward the completion of the upgrade at the Northshore mine; and
Approximately $20 million in capitalized interest.
Based on current market analysis, greater-than-expected customer demand and expansion opportunities explored during the HBI construction process, we are increasing the productive capacity of our Toledo HBI facility from 1.6 million metric tons to 1.9 million metric tons per year.
Recently Issued Accounting Pronouncements
Refer to NOTE 21 - NEWBASIS OF PRESENTATION AND SIGNIFICANT ACCOUNTING STANDARDSPOLICIES of the consolidated financial statements for a description of recent accounting pronouncements, including the respective dates of adoption and effects on results of operations and financial condition.
Critical Accounting Estimates
Management's discussion and analysis of financial condition and results of operations is based on our consolidated financial statements, which have been prepared in accordance with GAAP. Preparation of financial statements requires management to make assumptions, estimates and judgments that affect the reported amounts of assets, liabilities, revenues, costs and expenses, and the related disclosures of contingencies. Management bases its estimates on various assumptions and historical experience, which are believed to be reasonable; however, due to the inherent nature of estimates, actual results may differ significantly due to changed conditions or assumptions. On a regular basis, management reviews the accounting policies, assumptions, estimates and judgments to ensure that our financial statements are fairly presented in accordance with GAAP. However, because future events and their effects cannot be determined with certainty, actual results could differ from our assumptions and estimates, and such differences could be material. Management believes that the following critical accounting estimates and judgments have a significant impact on our financial statements.
Revenue RecognitionBusiness Combinations
Customer Supply Agreement
A supply agreement with one customer provides for supplemental revenue or refunds to the customerAssets acquired and liabilities assumed in a business combination are recognized and measured based on their estimated fair values at the average annual daily steel market price for hot-rolled coil steel inacquisition date, while the year the iron ore product is consumed in the customer’s blast furnace. The supplemental pricing is characterizedacquisition-related costs are expensed as a freestanding derivative and is required to be accounted for separately once control transfers to the customer. The derivative instrument, which is finalized based on a future price, is adjusted to fair value as a revenue adjustment each reporting period until the pellets are consumed and the amounts are settled.
The fair valueincurred. Any excess of the instrument is determined using a market approach based on an estimate of the average annual daily market price for hot-rolled coil steel, and takes intopurchase consideration current market conditions and nonperformance risk. At December 31, 2018, we had a derivative asset of $89.3 million, representingwhen compared to the fair value of the pricing factors, based uponnet tangible and intangible assets acquired, if any, is recorded as goodwill. We engaged independent valuation specialists to assist with the amountdetermination of unconsumed long tonsthe fair value of assets acquired, liabilities assumed, noncontrolling interest, and an estimated average annual daily hot-rolled coil steel price related togoodwill, for the Acquisitions. If the initial accounting for the business combination is incomplete by the end of the reporting period in which the iron ore is expectedacquisition occurs, an estimate will be recorded. Subsequent to the acquisition date, and not later than one
year from the acquisition date, we will record any material adjustments to the initial estimate based on new information obtained that would have existed as of the date of the acquisition. Any adjustment that arises from information obtained that did not exist as of the date of the acquisition will be consumedrecorded in the customer's blast furnace at each respective steelmaking facility, subject to final pricing at a future date. We recognized net derivative revenueperiod the adjustment arises.
Valuation of $425.8 million in Product revenues in the Statements of Consolidated Operations for the year ended December 31, 2018Goodwill and Other Long-Lived Assets
The accuracyvaluation of our estimates typically increases as the year progresses based ongoodwill and other long-lived assets includes various assumptions and are considered critical accounting estimates. Refer to "–Market Risks" above for additional information in the market becoming available. Our estimates for supplemental revenue adjustments have been materially correct related to the Mining and Pelletizing segment's product revenues for the year ended December 31, 2018 and 2017.information.
Mineral Reserves
We regularly evaluate our mineral reserves and update them as required in accordance with SEC Industry Guide 7. We perform an in-depth evaluation of our mineral reserve estimates by mine on a periodic basis, in addition to routine annual assessments. The estimateddetermination of mineral reserves requires us, with the support of our third-party experts, to make significant estimates and assumptions related to key inputs including (1) the determination of the size and scope of the iron ore body through technical modeling, (2) the estimates of future iron ore prices, production costs and capital expenditures, and (3) management’s mine plan for the proven and probable mineral reserves. The significant estimates and assumptions could be affected by future industry conditions, geological conditions and ongoing mine planning. Additional capital and development expenditures may be required to maintain effective production capacity. Generally, as mining operations progress, haul distances increase. Alternatively, changes in economic conditions or the expected quality of mineral reserves could decrease capacity of mineral reserves. Technological progress could alleviate such factors or increase capacity of mineral reserves.
We use our mineral reserve estimates, combined with our estimated annual production levels, to determine the mine closure dates utilized in recording the fair value liability for asset retirement obligations for our active operating mines. Refer to NOTE 1114 - ENVIRONMENTAL AND MINE CLOSUREASSET RETIREMENT OBLIGATIONS, for further information. Since the liability represents the present value of the expected future obligation, a significant change in mineral reserves or mine lives could have a substantial effect on the recorded obligation. We also utilize mineral reserves for evaluating potential impairments of mine asset groups as they are indicative of future cash flows and in determining maximum useful lives utilized to calculate depreciation, depletion and amortization of long-lived mine assets.assets and in determining the estimated fair value of mineral reserves established through the purchase price allocation in a business combination. The consolidated asset retirement obligation balance was $342 million as of December 31, 2020, of which $83 million related to active iron ore mine operations. The total asset balance associated with our Steelmaking reportable segment was $15,849 million as of December 31, 2020, of which $1,661 million related to long-lived assets associated with our combined iron ore mine asset groups, and is inclusive of $235 million related to iron ore mineral reserves acquired through the AM USA Transaction. Depreciation, depletion and amortization expense for the our combined iron ore mine asset groups was $78 million for the year ended December 31, 2020. Increases or decreases in mineral reserves or mine lives could significantly affect these items.
Valuation of Long-Lived Assets
In assessing the recoverability of our long-lived asset groups, significant assumptions regarding the estimated future cash flows and other factors to determine the fair value of the respective assets must be made, as well as the related estimated useful lives. If these estimates or their related assumptions change in the future as a result of changes in strategy or market conditions, we may be required to record impairment charges for these assets in the period such determination was made.
We monitor conditions that indicate that the carrying value of an asset or asset group may be impaired. In order to determine if assets have been impaired, assets are grouped and tested at the lowest level for which identifiable, independent cash flows are available. An impairment loss exists when projected undiscounted net cash flows are less than the carrying value of the asset group. The measurement of the impairment loss to be recognized is based on the difference between the fair value and the carrying value of the asset group. Fair value can be determined using a market approach, income approach or cost approach. The impairment analysis and fair value determination can result in substantially different outcomes based on changes in critical assumptions and estimates, including the quantity and quality of remaining mineral reserves, future iron ore prices and production costs.
During 2018, 2017 and 2016 there were no impairment indicators present at our continuing operations; as a result, no impairment assessments were required.
Refer to NOTE 1 - BASIS OF PRESENTATION AND SIGNIFICANT ACCOUNTING POLICIES for further information regarding our policy on asset impairment.
Asset Retirement Obligations and Environmental Remediation Costs
The accrued mine closure obligations forobligation is predominantly related to our activeindefinitely idled and closed iron ore mining operations provideand provides for contractual and legal obligations associated with the eventual closure of the miningthose operations. We perform an in-depth evaluation of the liability every three years in addition to our routine annual assessments. In 2017,2020, we employed a third-party specialistspecialists to assist in the evaluation. Our obligations are determined based on detailed estimates adjusted for factors that a market participant would consider (e.g., inflation, overhead and profit), which are escalated at an assumed rate of inflation to the estimated closure dates, and then discounted using the current credit-adjusted risk-free interest rate. The estimate also incorporates incremental increases in the closure cost estimates and changes in estimates of mine lives.lives for our active mine sites. The closure date for each locationof our active mine sites is determined based on the exhaustion date of the remaining iron ore reserves, which is dependent on our estimate of mineral reserves. The estimated obligations for our active mine sites are particularly sensitive to the impact of changes in mine lives given the difference between the inflation and discount rates. The closure dates for a majority of our steelmaking facilities are indefinite, and as such, the asset retirement obligations are recorded at present values using estimated ranges of the economic lives of the underlying assets. Changes in the base estimates of legal and contractual closure costs due to changes in legal or contractual requirements, available technology, inflation, overhead or profit rates also could have a significant impact on the recorded obligations. Refer to NOTE 14 - ASSET RETIREMENT OBLIGATIONS, for further information.
Environmental Remediation Costs
We have a formal policy for environmental protection and remediation. Our obligations for known environmental matters at active and closed mining operations and other sites have been recognized based on estimates of the cost of investigation and remediation at each site.facility. If the obligation can only be estimated as a range of possible amounts, with no specific amount being more likely, the minimum of the range is accrued. Management reviews its environmental remediation sites quarterly to determine if additional cost adjustments or disclosures are required. The characteristics
of environmental remediation obligations, where information concerning the nature and extent of clean-up activities is not immediately available and which are subject to changes in regulatory requirements, result in a significant risk of increase to the obligations as they mature. Expected future expenditures are not discounted to present value unless the amount and timing of the cash disbursements can be reasonably estimated. Potential insurance recoveries are not recognized until realized. Refer to NOTE 11 - ENVIRONMENTAL AND MINE CLOSURE OBLIGATIONS, for further information.
Income Taxes
Our income tax expense, deferred tax assets and liabilities and reserves for unrecognized tax benefits reflect management's best assessment of estimated future taxes to be paid. We are subject to income taxes in the U.S. and various foreign jurisdictions. Significant judgments and estimates are required in determining the consolidated income tax expense.
Deferred income taxes arise from temporary differences between tax and financial statement recognition of revenue and expense. In evaluating our ability to recover our deferred tax assets, we consider all available positive and negative evidence, including scheduled reversals of deferred tax liabilities, projected future taxable income, tax planning strategies and recent financial operations. In projecting future taxable income, we begin with historical results adjusted for the results of discontinued operations and changes in accounting policies and incorporate assumptions including the amount of future state, federal and foreign pretax operating income, the reversal of temporary differences, and the implementation of feasible and prudent tax planning strategies. These assumptions require significant judgment about the forecasts of future taxable income and are consistent with the plans and estimates we are using to manage the underlying businesses.
At December 31, 20182020 and 2017,2019, we had a total valuation allowance of $1,287.3$836 million and $1,983.1$441 million, respectively, against our deferred tax assets. Of this amount, $44.1these amounts, $439 million and $593.8$44 million relate to the U.S. deferred tax assets at December 31, 20182020 and 2017,2019, respectively, and $1,243.2$397 million and $1,389.3$397 million relate to foreign deferred tax assets, respectively.
As ofAt December 31, 2018, our U.S. operations emerged from a three-year cumulative loss position. As the significant negative evidence of cumulative losses has been eliminated, we undertook an evaluation of the continuing need for a valuation allowance on the U.S. deferred tax assets, the majority of which relates to the U.S. tax net operating losses.
In completing our evaluation of whether a valuation allowance was still needed, we considered all available positive and negative evidence. Positive evidence considered included the emergence from the three-year cumulative loss position, our long-term customer contracts with minimum tonnage requirements, the global scarcity of iron ore pellets, near term forecasts of strong profitability and the recently revised IRC Section 163(j) interest deduction limitation. Negative evidence included the overall size of the deferred tax asset with limited carryforward and no carryback opportunity, the finite nature of the iron ore resources we mine, the uncertainty of steel tariffs that positively impacted our revenue rates in 2018 and the various market signs that the U.S. economy may be nearing the end of the current expansion.
We also considered that future realization of the deferred tax assets depends on the existence of sufficient taxable income of the appropriate character during the carryforward period. In considering sources of taxable income, we identified that a portion of the deferred tax assets would be utilized by existing taxable temporary differences reversing in the same periods as existing deductible temporary differences. In addition, we determined that carryback opportunities and tax planning strategies do not exist as potential sources of future taxable income. Lastly, forecasting future taxable income was considered, but is challenging in a cyclical industry such as ours as it relies heavily on the accuracy of key assumptions, particularly about key pricing benchmarks.
Because historical information is verifiable and more objective than forecast information and due to the cyclicality of the industry, we developed an estimate of future income based on our historical earnings through the most recent industry cycle. We adjusted historical earnings for certain non-recurring items as well as to be reflective of the current corporate structure by eliminating the impact of discontinued operations and extinguished debt (“core earnings”). Additionally, we adjusted core earnings to reflect the impact of the recently revised IRC Section 163(j) interest deduction limitation as well as permanent tax adjustments. The IRC Section 163(j) limitation will limit our interest deduction, particularly in down years in the industry cycle, resulting in higher taxable income.
Based on the core earnings analysis, the Company’s average annual book taxable income through the business cycle is in excess of the estimated $109.0 million average annual taxable income required to fully utilize the deferred
tax assets within the 19 year carryforward period. We ascribed significant weight in our assessment to the core earnings analysis and the resulting projection of taxable income through the industry cycle. Based on the weight of this positive evidence, and after considering the other available positive and negative evidence, we determined that it was appropriate to release all of the valuation allowance related to U.S. federal deferred tax assets at December 31, 2018 as it is more likely than not that the entire deferred tax asset will be realized before the end of the carryforward period. We also released the state valuation allowance exceptSee NOTE 12 - INCOME TAXES for the valuation allowance recorded on deferred tax assetsfurther information and considerations related to state net operating losses in jurisdictions where we no longer operate and the losses will not be utilized. The valuation allowance related to foreign tax credits will be retained as the credits will expire prior to utilization.release.
Our losses in Luxembourg in recent periods represent sufficient negative evidence to require a full valuation allowance against the deferred tax assets in that jurisdiction. We intend to maintain a valuation allowance against the deferred tax assets related to these operating losses, unless and until sufficient positive evidence exists to support the realization of such assets.
Changes in tax laws and rates also could affect recorded deferred tax assets and liabilities in the future. In 2017, both the U.S. and Luxembourg reduced the statutory rate; this decreased the deferred tax assets and related valuation allowance by $407.5 million. The U.S. tax legislation also repealed the corporate AMT which resulted in a reversal of the valuation allowance related to the AMT credits and an income tax benefit of $234.6 million for the year ended December 31, 2017. At December 31, 2018, we have recorded an Income tax receivable, current of $117.3 million and an Income tax receivable, non-current of $117.3 million, which represents the AMT credits to be refunded in 2019 through 2022. These receivables represent the full amount of refundable AMT credits as the IRS has confirmed they will not be subject to sequestration. We had recorded a $15 million reserve against the AMT credit receivable during the first quarter of 2018, based on preliminary guidance from the IRS. Near year-end, the IRS issued final guidance that AMT credit refunds would not be subject to sequestration and we reversed the previously recorded reserve. There was no net impact on the full year 2018.
The calculation of our tax liabilities involves dealing with uncertainties in the application of complex tax laws and regulations in various jurisdictions across our global operations. The ultimate impact of the U.S. income tax reform legislation may differ from our current estimates due to changes in the interpretations and assumptions made as well as additional regulatory guidance that may be issued.
Accounting for uncertainty in income taxes recognized in the financial statements requires that a tax benefit from an uncertain tax position be recognized when it is more likely than not that the position will be sustained upon examination, including resolutions of any related appeals or litigation processes, based on technical merits.
We recognize tax liabilities in accordance with ASC 740, Income Taxes, and we adjust these liabilities when our judgment changes because of evaluation of new information not previously available. Due to the complexity of some of these uncertainties, the ultimate resolution may result in payment that is materially different from our current estimate of the tax liabilities. These differences will be reflected as increases or decreases to income tax expense in the period in which they are determined. Refer to NOTE 1012 - INCOME TAXES, for further information.
Employee Retirement Benefit Obligations
We offer defined benefit pension plans, defined contribution pension plans and other postretirement benefitOPEB plans, primarily consisting of retiree healthcare benefits, to most employees in North America as part of a total compensation and benefits program.
The defined benefit pension plans largely are noncontributory and benefits generally are based on employees' years of service and average earnings for a defined period prior to retirement, or a minimum formula.
Followingfollowing is a summary of our U.S. defined benefit pension and OPEB funding and expense:
| | | | | | | | | | | | | | | | | | | | | | | | | | |
| | Pension | | OPEB |
| | Funding | | Expense (Benefit) | | Funding | | Expense (Benefit) |
| 2018 | | $ | 28 | | | $ | 13 | | | $ | 4 | | | $ | (6) | |
| 2019 | | 16 | | | 22 | | | 4 | | | (2) | |
| 2020 | | 50 | | | (31) | | | 25 | | | 8 | |
2021 (Estimated)1 | | 202 | | | (168) | | | 144 | | | 86 | |
| | | | | | | | |
1 The estimated 2021 pension funding includes $118 million, which was deferred as a result of the CARES Act. |
|
| | | | | | | | | | | | | | | | |
| | | Pension | | OPEB |
| | | Funding | | Expense | | Funding | | Expense (Benefit) |
| 2016 | | $ | 1.2 |
| | $ | 16.5 |
| | $ | 1.1 |
| | $ | (4.0 | ) |
| 2017 | | $ | 24.4 |
| | $ | 18.0 |
| | $ | 2.1 |
| | $ | (6.1 | ) |
| 2018 | | $ | 27.6 |
| | $ | 12.7 |
| | $ | 3.8 |
| | $ | (5.9 | ) |
| 2019 (Estimated) | | $ | 15.9 |
| | $ | 21.5 |
| | $ | 3.5 |
| | $ | (2.8 | ) |
Assumptions used in determining the benefit obligations and the value of plan assets for defined benefit pension plans and postretirement benefitOPEB plans, (primarilyprimarily consisting of retiree healthcare benefits)benefits, that we offer are evaluated periodically by management. Critical assumptions, such as the discount rate used to measure the benefit obligations, the expected long-term rate of return on plan assets, the medical care cost trend, and the rate of compensation increase are reviewed annually.
AsThe following represents weighted-average assumptions used to determine benefit obligations and net benefit costs:
| | | | | | | | | | | | | | | | | | | | | | | | | | | | | | | | | | | |
| Pension | | Other Benefits |
| December 31, | | December 31, |
| 2020 | | 2019 | | 2020 | | 2019 |
| Discount rate | 2.34 | | % | | 3.27 | | % | | 2.71 | | % | | 2.71 | | % |
| Compensation rate increase | 2.56 | | | | 2.53 | | | | 3.00 | | | | 3.00 | | |
| Expected return on plan assets | 7.69 | | | | 8.25 | | | | 6.82 | | | | 7.00 | | |
The following represents assumed weighted-average health care cost trend rates:
| | | | | | | | | | | | | | | | | |
| December 31, |
| 2020 | | 2019 |
| Health care cost trend rate assumed for next year | 6.05 | | % | | 6.50 | | % |
| Ultimate health care cost trend rate | 4.59 | | | | 5.00 | | |
| Year that the ultimate rate is reached | 2031 | | | | 2026 | | |
The discount rates used to measure plan liabilities as of the December 31 2018 and 2017, we used the following assumptions:
|
| | | | | | | |
| | Pension and Other Benefits |
| | 2018 | | | 2017 |
| |
| Plan discount rates: | | | | | |
| Iron Hourly Pension Plan | 4.31 |
| % | | 3.60 |
| % |
| Salaried Pension Plan | 4.21 |
| | | 3.52 |
| |
| Ore Mining Pension Plan | 4.33 |
| | | 3.61 |
| |
| SERP | 4.22 |
| | | 3.50 |
| |
| Hourly OPEB Plan | 4.29 |
| | | 3.60 |
| |
| Salaried OPEB Plan | 4.27 |
| | | 3.57 |
| |
| Rate of compensation increase - Salaried | 3.00 |
| | | 3.00 |
| |
| Rate of compensation increase - Hourly | 2.00 |
| | | 2.00 |
| |
| Pension plan expected return on plan assets | 8.25 |
| | | 8.25 |
| |
| OPEB plan expected return on plan assets | 7.00 |
| | | 7.00 |
| |
| Health care cost trend rate assumed for next year | 6.75 |
| | | 7.00 |
| |
| Ultimate health care cost trend rate | 5.00 |
| | | 5.00 |
| |
| Year that the ultimate rate is reached | 2026 |
| | | 2026 |
| |
measurement date are determined individually for each plan. The increase in the discount rates in 2018 was drivenare determined by matching the projected cash flows used to determine the plan liabilities to a projected yield curve of high-quality corporate bonds available at the measurement date. Discount rates for expense are calculated using the granular approach for each plan.
Depending on the plan, we use either company-specific base mortality tables or tables issued by the changeSociety of Actuaries. We adopted the Pri-2012 mortality tables from the Society of Actuaries in corporate bond yields, which were up approximately 70 basis points compared to the prior year.
Additionally, on2019. On December 31, 2018,2020, the assumed mortality improvement projection was changedupdated from generational scale MP-2017MP-2019 to generational scale MP-2018. The healthyMP-2020 for the Pri-2012 mortality assumption remains the RP-2014 mortality tables with blue collar and white collar adjustments made for certain hourly and salaried groups to determine the expected lifetables.
Following are sensitivities of potential further changes in these key assumptions on the estimated 20192021 pension and OPEB expense and the pension and OPEB benefit obligations as of December 31, 2018:2020:
| | | | | Increase in Expense | | Increase in Benefit Obligation | | (In Millions) |
| | | (In Millions) | | (In Millions) | | Increase (Decrease) in Expense | | Increase in
Benefit Obligation |
| | | Pension | | OPEB | | Pension | | OPEB | | Pension | | OPEB | | Pension | | OPEB |
| Decrease discount rate 0.25% | | $ | 1.6 |
| | $ | 0.2 |
| | $ | 25.0 |
| | $ | 6.6 |
| Decrease discount rate 0.25% | $ | (4) | | | $ | (2) | | | $ | 164 | | | $ | 131 | |
| Decrease return on assets 1.00% | | $ | 6.6 |
| | $ | 2.4 |
| | N/A |
| | N/A |
| Decrease return on assets 1.00% | 53 | | | 8 | | | N/A | | N/A |
Changes in actuarial assumptions, including discount rates, employee retirement rates, mortality, compensation levels, plan asset investment performance and healthcare costs, are determined based on analyses of actual and expected factors. Changes in actuarial assumptions and/or investment performance of plan assets may have a significant impact on our financial condition due to the magnitude of our retirement obligations.
Refer to NOTE 810 - PENSIONS AND OTHER POSTRETIREMENT BENEFITS for further information.
Forward-Looking Statements
This report contains statements that constitute "forward-looking statements" within the meaning of the federal securities laws. As a general matter, forward-looking statements relate to anticipated trends and expectations rather than historical matters. Forward-looking statements are subject to uncertainties and factors relating to Cliffs’our operations and business environment that are difficult to predict and may be beyond our control. Such uncertainties and factors may cause actual results to differ materially from those expressed or implied by the forward-looking statements. These statements speak only as of the date of this report, and we undertake no ongoing obligation, other than that imposed by law, to update these statements. Uncertainties and risk factors that could affect Cliffs’our future performance and cause results to differ from the forward-looking statements in this report include, but are not limited to:
•disruptions to our operations relating to the COVID-19 pandemic, including the heightened risk that a significant portion of our workforce or on-site contractors may suffer illness or otherwise be unable to perform their ordinary work functions;
uncertainty•continued volatility of steel and iron ore market prices, which directly and indirectly impact the prices of the products that we sell to our customers;
•uncertainties associated with the highly competitive and cyclical steel industry and our reliance on the demand for steel from the automotive industry, which has been experiencing a trend toward light weighting that could result in lower steel volumes being consumed;
•potential weaknesses and uncertainties in global economic conditions, including downward pressure on prices caused byexcess global steelmaking capacity, oversupply or imported products,of iron ore, prevalence of steel imports and reduced market demand, including as a result of the COVID-19 pandemic;
•severe financial hardship, bankruptcy, temporary or permanent shutdowns or operational challenges, due to the COVID-19 pandemic or otherwise, of one or more of our major customers, including customers in the automotive market, key suppliers or contractors, which, among other adverse effects, could lead to reduced demand for our products, increased difficulty collecting receivables, and customers and/or suppliers asserting force majeure or other reasons for not performing their contractual obligations to us;
•risks related to U.S. government actions with respect to Section 232, of the Trade Expansion Act (as amended by the Trade Act of 1974), the United States-Mexico-Canada AgreementUSMCA and/or other trade agreements, tariffs, treaties or policies;
policies, as well as the uncertainty of obtaining and maintaining effective antidumping and countervailing duty orders to counteract the harmful effects of unfairly traded imports;continued volatility of iron ore and steel prices and other trends, which may impact the price-adjustment calculations under our sales contracts;
our ability to successfully diversify our product mix and add new customers beyond our traditional blast furnace clientele;
our ability to cost-effectively achieve planned production rates or levels, including at our HBI plant;
our ability to successfully identify and consummate any strategic investments or development projects, including our HBI plant;
the impact of our customers reducing their steel production due to increased market share of steel produced using other methods or lighter-weight steel alternatives;
our actual economic iron ore reserves or reductions in current mineral estimates, including whether any mineralized material qualifies as a reserve;
the outcome of any contractual disputes with our customers, joint venture partners or significant energy, material or service providers or any other litigation or arbitration;
problems or uncertainties with sales volume or mix, productivity, tons mined, transportation, mine-closure obligations, environmental liabilities, employee-benefit costs and other risks of the mining industry;
•impacts of existing and increasing governmental regulation, including climate change and other environmental regulation that may be proposed under the Biden Administration, and related costs and liabilities, including failure to receive or maintain required operating and environmental permits, approvals, modifications or other authorizationauthorizations of, or from, any governmental or regulatory entityauthority and costs related to implementing improvements to ensure compliance with regulatory changes;changes, including potential financial assurance requirements;
•potential impacts to the environment or exposure to hazardous substances resulting from our operations;
•our ability to maintain adequate liquidity, our level of indebtedness and the availability of capital could limit cash flow availablenecessary to fund working capital, planned capital expenditures, acquisitions, and other general corporate purposes or ongoing needs of our business;
•adverse changes in credit ratings, interest rates, foreign currency rates and tax laws;
•limitations on our ability to continue to pay cash dividends, and the amount and timingrealize some or all of any cash dividends;our deferred tax assets, including our NOLs;
availability of capital and •our ability to maintain adequate liquidity;
realize the anticipated synergies and benefits of the Acquisitions and to successfully integrate the businesses of AK Steel and ArcelorMittal USA into our ability to maintain appropriate relationsexisting businesses, including uncertainties associated with unionsmaintaining relationships with customers, vendors and employees;
•additional debt we assumed, incurred or issued in connection with the Acquisitions, as well as additional debt we incurred in connection with enhancing our liquidity during the COVID-19 pandemic, may negatively impact our credit profile and limit our financial flexibility;
•known and unknown liabilities we assumed in connection with the Acquisitions, including significant environmental, pension and OPEB obligations;
•the ability of our customers, joint venture partners and third partythird-party service providers to meet their obligations to us on a timely basis or at all;
events•supply chain disruptions or circumstances thatchanges in the cost or quality of energy sources or critical raw materials and supplies, including iron ore, industrial gases, graphite electrodes, scrap, chrome, zinc, coke and coal;
•liabilities and costs arising in connection with any business decisions to temporarily idle or permanently close a mine or production facility, which could impair or adversely impact the viability of a mine and the carrying value of associated assets and give rise to impairment charges or closure and reclamation obligations, as well as uncertainties associated with restarting any resulting impairment charges;previously idled mine or production facility;
•problems or disruptions associated with transporting products to our customers, moving products internally among our facilities or suppliers transporting raw materials to us;
•uncertainties associated with natural or human-caused disasters, adverse weather conditions, unanticipated geological conditions, supply or price of energy,critical equipment failures, infectious disease outbreaks, tailings dam failures and other unexpected events;
•our level of self-insurance and our ability to obtain sufficient third-party insurance to adequately cover potential adverse events and business risks;
adverse•disruptions in, or failures of, our information technology systems, including those related to cybersecurity;
•our ability to successfully identify and consummate any strategic investments or development projects, cost-effectively achieve planned production rates or levels, and diversify our product mix and add new customers;
•our actual economic iron ore and coal reserves or reductions in current mineral estimates, including whether we are able to replace depleted reserves with additional mineral bodies to support the long-term viability of our operations;
•the outcome of any contractual disputes with our customers, joint venture partners, lessors, or significant energy, raw material or service providers, or any other litigation or arbitration;
•our ability to maintain our social license to operate with our stakeholders, including by fostering a strong reputation and consistent operational and safety track record;
•our ability to maintain satisfactory labor relations with unions and employees;
•availability of workers to fill critical operational positions and potential labor shortages caused by the COVID-19 pandemic, as well as our ability to attract, hire, develop and retain key personnel, including within the acquired AK Steel and ArcelorMittal USA businesses;
•unanticipated or higher costs associated with pension and OPEB obligations resulting from changes in interest ratesthe value of plan assets or contribution increases required for unfunded obligations; and tax laws; and
the •potential existence of significant deficiencies or material weaknessweaknesses in our internal control over financial reporting.
reporting.For additional factors affecting the business of Cliffs,our businesses, refer to Part I – Item 1A. Risk Factors. You are urged to carefully consider these risk factors.
Non-GAAP Reconciliation
We present cash cost of goods sold and operating expense rate per long ton, which is a non-GAAP financial measure that management uses in evaluating operating performance. We believe our presentation of non-GAAP cash cost of goods sold and operating expenses is useful to investors because it excludes depreciation, depletion and amortization, which are non-cash, and freight and joint venture partners' cost reimbursements, which have no impact on sales margin, thus providing a more accurate view of the cash outflows related to the sale of iron ore. The presentation of this measure is not intended to be considered in isolation from, as a substitute for, or as superior to, the financial information prepared and presented in accordance with GAAP. The presentation of this measure may be different from non-GAAP financial measures used by other companies. Below is a reconciliation in dollars of this non-GAAP financial measure to our consolidated financial statements.
|
| | | | | | | | | | | | |
| | | (In Millions) |
| | | Year Ended December 31, |
| | | 2018 | | 2017 | | 2016 |
| Cost of goods sold and operating expenses | | $ | (1,522.8 | ) | | $ | (1,398.4 | ) | | $ | (1,274.4 | ) |
| Less: | | | | | | |
| Freight and reimbursements | | (160.1 | ) | | (221.4 | ) | | (174.8 | ) |
| Depreciation, depletion & amortization | | (68.2 | ) | | (66.6 | ) | | (84.0 | ) |
| Cash cost of goods sold and operating expenses | | $ | (1,294.5 | ) | | $ | (1,110.4 | ) | | $ | (1,015.6 | ) |
|
| | | | |
| Item 7A. | Quantitative and Qualitative Disclosures About Market Risk |
Information regarding our Market Risk is presented under the caption Market Risks, which is included in Item 7. Management's Discussion and Analysis of Financial Condition and Results of Operations and is incorporated by reference and made a part hereof.
|
| | | | |
| Item 8. | Financial Statements and Supplementary Data |
Statements of Consolidated Financial Position
Cleveland-Cliffs Inc. and Subsidiaries
|
| | | | | | | |
| | (In Millions) |
| | December 31, |
| | 2018 | | 2017 |
| ASSETS | | | |
| CURRENT ASSETS | | | |
| Cash and cash equivalents | $ | 823.2 |
| | $ | 978.3 |
|
| Accounts receivable, net | 226.7 |
| | 106.7 |
|
| Inventories | 87.9 |
| | 138.4 |
|
| Supplies and other inventories | 93.2 |
| | 88.8 |
|
| Derivative assets | 91.5 |
| | 37.9 |
|
| Income tax receivable, current | 117.3 |
| | 13.3 |
|
| Loans to and accounts receivables from the Canadian Entities | — |
| | 51.6 |
|
| Current assets of discontinued operations | 12.4 |
| | 118.5 |
|
| Other current assets | 27.4 |
| | 11.1 |
|
| TOTAL CURRENT ASSETS | 1,479.6 |
| | 1,544.6 |
|
| PROPERTY, PLANT AND EQUIPMENT, NET | 1,286.0 |
| | 1,033.8 |
|
| OTHER ASSETS | | | |
| Deposits for property, plant and equipment | 83.0 |
| | 17.8 |
|
| Income tax receivable, non-current | 121.3 |
| | 235.3 |
|
| Deferred income taxes | 464.8 |
| | — |
|
| Non-current assets of discontinued operations | — |
| | 20.3 |
|
| Other non-current assets | 94.9 |
| | 101.6 |
|
| TOTAL OTHER ASSETS | 764.0 |
| | 375.0 |
|
| TOTAL ASSETS | $ | 3,529.6 |
| | $ | 2,953.4 |
|
(continued)
The accompanying notes are an integral part of these consolidated financial statements.
Statements of Consolidated Financial Position
Cleveland-Cliffs Inc. and Subsidiaries - (Continued)
|
| | | | | | | |
| | (In Millions) |
| | December 31, |
| | 2018 | | 2017 |
| LIABILITIES | | | |
| CURRENT LIABILITIES | | | |
| Accounts payable | $ | 186.8 |
| | $ | 99.5 |
|
| Accrued employment costs | 74.0 |
| | 52.7 |
|
| State and local taxes payable | 35.5 |
| | 30.2 |
|
| Accrued interest | 38.4 |
| | 31.4 |
|
| Contingent claims | — |
| | 55.6 |
|
| Partnership distribution payable | 43.5 |
| | 44.2 |
|
| Current liabilities of discontinued operations | 6.7 |
| | 75.0 |
|
| Other current liabilities | 83.3 |
| | 63.6 |
|
| TOTAL CURRENT LIABILITIES | 468.2 |
| | 452.2 |
|
| POSTEMPLOYMENT BENEFIT LIABILITIES | | | |
| Pensions | 218.4 |
| | 222.8 |
|
| Other postretirement benefits | 30.3 |
| | 34.9 |
|
| TOTAL POSTEMPLOYMENT BENEFIT LIABILITIES | 248.7 |
| | 257.7 |
|
| ENVIRONMENTAL AND MINE CLOSURE OBLIGATIONS | 172.0 |
| | 167.7 |
|
| LONG-TERM DEBT | 2,092.9 |
| | 2,304.2 |
|
| NON-CURRENT LIABILITIES OF DISCONTINUED OPERATIONS | 8.3 |
| | 52.2 |
|
| OTHER LIABILITIES | 115.3 |
| | 163.5 |
|
| TOTAL LIABILITIES | 3,105.4 |
| | 3,397.5 |
|
| COMMITMENTS AND CONTINGENCIES (SEE NOTE 19) |
| |
|
| EQUITY | | | |
| CLIFFS SHAREHOLDERS' EQUITY (DEFICIT) | | | |
| Preferred Stock - no par value | | | |
| Class A - 3,000,000 shares authorized | | | |
| Class B - 4,000,000 shares authorized | | | |
| Common Shares - par value $0.125 per share | | | |
| Authorized - 600,000,000 shares (2017 - 600,000,000 shares); | | | |
| Issued - 301,886,794 shares (2017 - 301,886,794 shares); | | | |
| Outstanding - 292,611,569 shares (2017 - 297,400,968 shares) | 37.7 |
| | 37.7 |
|
| Capital in excess of par value of shares | 3,916.7 |
| | 3,933.9 |
|
| Retained deficit | (3,060.2 | ) | | (4,207.3 | ) |
| Cost of 9,275,225 common shares in treasury (2017 - 4,485,826 shares) | (186.1 | ) | | (169.6 | ) |
| Accumulated other comprehensive loss | (283.9 | ) | | (39.0 | ) |
| TOTAL CLIFFS SHAREHOLDERS' EQUITY (DEFICIT) | 424.2 |
| | (444.3 | ) |
| NONCONTROLLING INTEREST | — |
| | 0.2 |
|
| TOTAL EQUITY (DEFICIT) | 424.2 |
| | (444.1 | ) |
| TOTAL LIABILITIES AND EQUITY (DEFICIT) | $ | 3,529.6 |
| | $ | 2,953.4 |
|
The accompanying notes are an integral part of these consolidated financial statements.
Statements of Consolidated Operations
Cleveland-Cliffs Inc. and Subsidiaries
|
| | | | | | | | | | | |
| | (In Millions, Except Per Share Amounts) |
| | Year Ended December 31, |
| | 2018 | | 2017 | | 2016 |
| REVENUES FROM PRODUCT SALES AND SERVICES | | | | | |
| Product | $ | 2,172.3 |
| | $ | 1,644.6 |
| | $ | 1,379.7 |
|
| Freight and venture partners' cost reimbursements | 160.1 |
| | 221.4 |
| | 174.8 |
|
| 2,332.4 |
| | 1,866.0 |
| | 1,554.5 |
|
| COST OF GOODS SOLD AND OPERATING EXPENSES | (1,522.8 | ) | | (1,398.4 | ) | | (1,274.4 | ) |
| SALES MARGIN | 809.6 |
| | 467.6 |
| | 280.1 |
|
| OTHER OPERATING INCOME (EXPENSE) | | | | | |
| Selling, general and administrative expenses | (116.8 | ) | | (102.9 | ) | | (115.8 | ) |
| Miscellaneous - net | (19.6 | ) | | 25.5 |
| | (33.6 | ) |
| | (136.4 | ) | | (77.4 | ) | | (149.4 | ) |
| OPERATING INCOME | 673.2 |
| | 390.2 |
| | 130.7 |
|
| OTHER INCOME (EXPENSE) | | | | | |
| Interest expense, net | (118.9 | ) | | (126.8 | ) | | (193.9 | ) |
| Gain (loss) on extinguishment/restructuring of debt | (6.8 | ) | | (165.4 | ) | | 166.3 |
|
| Other non-operating income | 17.2 |
| | 10.2 |
| | 7.3 |
|
| | (108.5 | ) | | (282.0 | ) | | (20.3 | ) |
| INCOME FROM CONTINUING OPERATIONS BEFORE INCOME TAXES | 564.7 |
| | 108.2 |
| | 110.4 |
|
| INCOME TAX BENEFIT | 475.2 |
| | 252.4 |
| | 12.2 |
|
| INCOME FROM CONTINUING OPERATIONS | 1,039.9 |
| | 360.6 |
| | 122.6 |
|
| INCOME FROM DISCONTINUED OPERATIONS, net of tax | 88.2 |
| | 2.5 |
| | 76.7 |
|
| NET INCOME | 1,128.1 |
| | 363.1 |
| | 199.3 |
|
| LOSS (INCOME) ATTRIBUTABLE TO NONCONTROLLING INTEREST | — |
| | 3.9 |
| | (25.2 | ) |
| NET INCOME ATTRIBUTABLE TO CLIFFS SHAREHOLDERS | $ | 1,128.1 |
| | $ | 367.0 |
| | $ | 174.1 |
|
| | | | | | |
| EARNINGS PER COMMON SHARE ATTRIBUTABLE TO CLIFFS SHAREHOLDERS - BASIC | | | | | |
| Continuing operations | $ | 3.50 |
| | $ | 1.27 |
| | $ | 0.49 |
|
| Discontinued operations | 0.30 |
| | 0.01 |
| | 0.39 |
|
| $ | 3.80 |
| | $ | 1.28 |
| | $ | 0.88 |
|
| EARNINGS PER COMMON SHARE ATTRIBUTABLE TO CLIFFS SHAREHOLDERS - DILUTED | | | | | |
| Continuing operations | $ | 3.42 |
| | $ | 1.25 |
| | $ | 0.49 |
|
| Discontinued operations | 0.29 |
| | 0.01 |
| | 0.38 |
|
| | $ | 3.71 |
| | $ | 1.26 |
| | $ | 0.87 |
|
| AVERAGE NUMBER OF SHARES (IN THOUSANDS) | | | | | |
| Basic | 297,176 |
| | 288,435 |
| | 197,659 |
|
| Diluted | 304,141 |
| | 292,961 |
| | 200,145 |
|
The accompanying notes are an integral part of these consolidated financial statements.
Statements of Consolidated Comprehensive Income
Cleveland-Cliffs Inc. and Subsidiaries
|
| | | | | | | | | | | |
| | (In Millions) |
| | Year Ended December 31, |
| | 2018 | | 2017 | | 2016 |
| NET INCOME ATTRIBUTABLE TO CLIFFS SHAREHOLDERS | $ | 1,128.1 |
| | $ | 367.0 |
| | $ | 174.1 |
|
| OTHER COMPREHENSIVE INCOME (LOSS) | | | | | |
| Changes in pension and other post-retirement benefits, net of tax | (17.2 | ) | | 11.5 |
| | (19.8 | ) |
| Changes in foreign currency translation | (225.4 | ) | | (13.9 | ) | | 18.6 |
|
| Changes in derivative financial instruments, net of tax | (2.3 | ) | | (0.5 | ) | | (2.6 | ) |
| OTHER COMPREHENSIVE LOSS | (244.9 | ) | | (2.9 | ) | | (3.8 | ) |
| OTHER COMPREHENSIVE LOSS (INCOME) ATTRIBUTABLE TO THE NONCONTROLLING INTEREST | — |
| | (1.1 | ) | | 0.5 |
|
| TOTAL COMPREHENSIVE INCOME ATTRIBUTABLE TO CLIFFS SHAREHOLDERS | $ | 883.2 |
| | $ | 363.0 |
| | $ | 170.8 |
|
The accompanying notes are an integral part of these consolidated financial statements.
Statements of Consolidated Cash Flows
Cleveland-Cliffs Inc. and Subsidiaries
|
| | | | | | | | | | | |
| | (In Millions) |
| | Year Ended December 31, |
| | 2018 | | 2017 | | 2016 |
| OPERATING ACTIVITIES | | | | | |
| Net income | $ | 1,128.1 |
| | $ | 363.1 |
| | $ | 199.3 |
|
| Adjustments to reconcile net income to net cash provided by operating activities: | | | | | |
| Depreciation, depletion and amortization | 89.0 |
| | 87.7 |
| | 115.4 |
|
| Deferred income taxes | (460.5 | ) | | — |
| | — |
|
| Loss (gain) on extinguishment of debt | 6.8 |
| | 165.4 |
| | (166.3 | ) |
| Loss on deconsolidation | — |
| | 20.2 |
| | 17.5 |
|
| Gain on derivatives | (110.2 | ) | | (4.1 | ) | | (30.1 | ) |
| Gain on foreign currency translation | (228.1 | ) | | — |
| | — |
|
| Other | 20.7 |
| | 25.3 |
| | 40.1 |
|
| Changes in operating assets and liabilities: | | | | | |
| Receivables and other assets | 52.3 |
| | (248.7 | ) | | 43.2 |
|
| Inventories | 42.9 |
| | (1.8 | ) | | 157.8 |
|
| Payables, accrued expenses and other liabilities | (62.5 | ) | | (69.0 | ) | | (73.9 | ) |
| Net cash provided by operating activities | 478.5 |
| | 338.1 |
| | 303.0 |
|
| INVESTING ACTIVITIES | | | | | |
| Purchase of property, plant and equipment | (208.6 | ) | | (134.9 | ) | | (61.7 | ) |
| Deposits for property, plant and equipment | (87.5 | ) | | (16.8 | ) | | (7.4 | ) |
| Other investing activities | 23.0 |
| | (4.3 | ) | | 11.2 |
|
| Net cash used by investing activities | (273.1 | ) | | (156.0 | ) | | (57.9 | ) |
| FINANCING ACTIVITIES | | | | | |
| Net proceeds from issuance of common shares | — |
| | 661.3 |
| | 287.4 |
|
| Repurchase of common shares | (47.5 | ) | | — |
| | — |
|
| Proceeds from issuance of debt | — |
| | 1,771.5 |
| | — |
|
| Debt issuance costs | (1.5 | ) | | (28.6 | ) | | (5.2 | ) |
| Borrowings under credit facilities | — |
| | — |
| | 105.0 |
|
| Repayment under credit facilities | — |
| | — |
| | (105.0 | ) |
| Repayments of equipment loans | — |
| | — |
| | (95.6 | ) |
| Repurchase of debt | (234.5 | ) | | (1,720.7 | ) | | (305.4 | ) |
| Acquisition of noncontrolling interest | — |
| | (105.0 | ) | | — |
|
| Distributions of partnership equity | (44.2 | ) | | (52.9 | ) | | (59.9 | ) |
| Other financing activities | (47.5 | ) | | (26.7 | ) | | (27.7 | ) |
| Net cash provided (used) by financing activities | (375.2 | ) | | 498.9 |
| | (206.4 | ) |
| EFFECT OF EXCHANGE RATE CHANGES ON CASH | (2.3 | ) | | 3.3 |
| | (0.5 | ) |
| INCREASE (DECREASE) IN CASH AND CASH EQUIVALENTS, INCLUDING CASH CLASSIFIED WITHIN CURRENT ASSETS OF DISCONTINUED OPERATIONS | (172.1 | ) | | 684.3 |
| | 38.2 |
|
| LESS: INCREASE (DECREASE) IN CASH AND CASH EQUIVALENTS CLASSIFIED WITHIN CURRENT ASSETS OF DISCONTINUED OPERATIONS | (17.0 | ) | | 18.8 |
| | (35.3 | ) |
| NET INCREASE (DECREASE) IN CASH AND CASH EQUIVALENTS | (155.1 | ) | | 665.5 |
| | 73.5 |
|
| CASH AND CASH EQUIVALENTS AT BEGINNING OF YEAR | 978.3 |
| | 312.8 |
| | 239.3 |
|
| CASH AND CASH EQUIVALENTS AT END OF YEAR | $ | 823.2 |
| | $ | 978.3 |
| | $ | 312.8 |
|
The accompanying notes are an integral part of these consolidated financial statements.
See NOTE 16 - CASH FLOW INFORMATION.
Statements of Consolidated Changes in Equity
Cleveland-Cliffs Inc. and Subsidiaries
|
| | | | | | | | | | | | | | | | | | | | | | | | | | | | | | | | | | | | | | |
| | | (In Millions) |
| | | | | | | Cliffs Shareholders | | | | |
| | | Number
of
Depositary Shares | | Depositary
Shares | | Number
of
Common
Shares Outstanding | | Common
Shares | | Capital in
Excess of
Par Value
of Shares | | Retained
Earnings | | Common
Shares
in
Treasury | | Accumulated
Other
Comprehensive
Loss | | Non-
Controlling
Interest | | Total |
| January 1, 2016 | | 29.3 |
| | $ | 731.3 |
| | 153.5 |
| | $ | 19.8 |
| | $ | 2,298.9 |
| | $ | (4,748.4 | ) | | $ | (265.0 | ) | | $ | (18.0 | ) | | $ | 169.8 |
| | $ | (1,811.6 | ) |
| Comprehensive income (loss) | | | | | | | | | | | | | | | | | | | | |
| Net income | | — |
| | — |
| | — |
| | — |
| | — |
| | 174.1 |
| | — |
| | — |
| | 25.2 |
| | 199.3 |
|
| Other comprehensive loss | | — |
| | — |
| | — |
| | — |
| | — |
| | — |
| | — |
| | (3.3 | ) | | (0.5 | ) | | (3.8 | ) |
| Total comprehensive income | | | | | | | | | | | | | | | | | | 24.7 |
| | 195.5 |
|
| Preferred Share conversion | | (29.3 | ) | | (731.3 | ) | | 26.5 |
| | 3.5 |
| | 727.8 |
| | — |
| | — |
| | — |
| | — |
| | — |
|
| Equity offering | | — |
| | — |
| | 44.4 |
| | 5.5 |
| | 281.9 |
| | — |
| | — |
| | — |
| | — |
| | 287.4 |
|
| Debt exchanges | | — |
| | — |
| | 8.2 |
| | 1.0 |
| | 44.2 |
| | — |
| | — |
| | — |
| | — |
| | 45.2 |
|
| Distributions to noncontrolling interest | | — |
| | — |
| | — |
| | — |
| | — |
| | — |
| | — |
| | — |
| | (3.2 | ) | | (3.2 | ) |
| Distributions of partnership equity | | — |
| | — |
| | — |
| | — |
| | — |
| | — |
| | — |
| | — |
| | (57.5 | ) | | (57.5 | ) |
| Stock and other incentive plans | | — |
| | — |
| | 0.5 |
| | — |
| | (5.8 | ) | | — |
| | 19.5 |
| | — |
| | — |
| | 13.7 |
|
| December 31, 2016 | | — |
| | $ | — |
| | 233.1 |
| | $ | 29.8 |
| | $ | 3,347.0 |
| | $ | (4,574.3 | ) | | $ | (245.5 | ) | | $ | (21.3 | ) | | $ | 133.8 |
| | $ | (1,330.5 | ) |
| Comprehensive income (loss) | | | | | | | | | | | | | | | | | | | | |
| Net income (loss) | | — |
| | — |
| | — |
| | — |
| | — |
| | 367.0 |
| | — |
| | — |
| | (3.9 | ) | | 363.1 |
|
| Other comprehensive income (loss) | | — |
| | — |
| | — |
| | — |
| | — |
| | — |
| | — |
| | (4.0 | ) | | 1.1 |
| | (2.9 | ) |
| Total comprehensive income (loss) | | | | | | | | | | | | | | | | | | (2.8 | ) | | 360.2 |
|
| Issuance of convertible debt | | — |
| | — |
| | — |
| | — |
| | 83.4 |
| | — |
| | — |
| | — |
| | — |
| | 83.4 |
|
| Equity offering | | — |
| | — |
| | 63.3 |
| | 7.9 |
| | 653.4 |
| | — |
| | — |
| | — |
| | — |
| | 661.3 |
|
| Acquisition of noncontrolling interest | | — |
| | — |
| | — |
| | — |
| | (70.2 | ) | | — |
| | — |
| | (18.9 | ) | | (15.9 | ) | | (105.0 | ) |
| Distribution of partnership equity | | — |
| | — |
| | — |
| | — |
| | (17.3 | ) | | — |
| | — |
| | 5.2 |
| | (116.7 | ) | | (128.8 | ) |
| Capital contributions by noncontrolling interest to subsidiary | | — |
| | — |
| | — |
| | — |
| | — |
| | — |
| | — |
| | — |
| | 1.8 |
| | 1.8 |
|
| Stock and other incentive plans | | — |
| | — |
| | 1.0 |
| | — |
| | (62.4 | ) | | — |
| | 75.9 |
| | — |
| | — |
| | 13.5 |
|
| December 31, 2017 | | — |
| | $ | — |
| | 297.4 |
| | $ | 37.7 |
| | $ | 3,933.9 |
| | $ | (4,207.3 | ) | | $ | (169.6 | ) | | $ | (39.0 | ) | | $ | 0.2 |
| | $ | (444.1 | ) |
| Adoption of accounting standard | | — |
| | — |
| | — |
| | — |
| | — |
| | 34.0 |
| | — |
| | — |
| | — |
| | 34.0 |
|
| Comprehensive income (loss) | | | | | | | | | | | | | | | | | | | | |
| Net income | | — |
| | — |
| | — |
| | — |
| | — |
| | 1,128.1 |
| | — |
| | — |
| | — |
| | 1,128.1 |
|
| Other comprehensive loss | | — |
| | — |
| | — |
| | — |
| | — |
| | — |
| | — |
| | (244.9 | ) | | — |
| | (244.9 | ) |
| Total comprehensive income | | | | | | | | | | | | | | | | | | — |
| | 883.2 |
|
| Distributions to noncontrolling interest | | — |
| | — |
| | — |
| | — |
| | — |
| | — |
| | — |
| | — |
| | (0.2 | ) | | (0.2 | ) |
| Stock and other incentive plans | | — |
| | — |
| | 0.6 |
| | — |
| | (17.2 | ) | | — |
| | 31.0 |
| | — |
| | — |
| | 13.8 |
|
| Common stock repurchases | | — |
| | — |
| | (5.4 | ) | | — |
| | — |
| | — |
| | (47.5 | ) | | — |
| | — |
| | (47.5 | ) |
Common stock dividends ($0.05 per
share) | | — |
| | — |
| | — |
| | — |
| | — |
| | (15.0 | ) | | — |
| | — |
| | — |
| | (15.0 | ) |
| December 31, 2018 | | — |
| | $ | — |
| | 292.6 |
| | $ | 37.7 |
| | $ | 3,916.7 |
| | $ | (3,060.2 | ) | | $ | (186.1 | ) | | $ | (283.9 | ) | | $ | — |
| | $ | 424.2 |
|
| | | | | | | | | | | |
| (In Millions) |
| December 31, |
| 2020 | | 2019 |
| ASSETS | | | |
| Current assets: | | | |
| Cash and cash equivalents | $ | 112 | | | $ | 353 | |
| Accounts receivable, net | 1,169 | | | 94 | |
| Inventories | 3,828 | | | 317 | |
| Income tax receivable, current | 24 | | | 59 | |
| Other current assets | 165 | | | 75 | |
| Total current assets | 5,298 | | | 898 | |
| Non-current assets: | | | |
| Property, plant and equipment, net | 8,743 | | | 1,929 | |
| Goodwill | 1,406 | | | 2 | |
| Deferred income taxes | 537 | | | 460 | |
| Other non-current assets | 787 | | | 215 | |
| TOTAL ASSETS | $ | 16,771 | | | $ | 3,504 | |
| LIABILITIES AND EQUITY | | | |
| Current liabilities: | | | |
| Accounts payable | $ | 1,575 | | | $ | 193 | |
| Accrued employment costs | 460 | | | 67 | |
| State and local taxes | 147 | | | 38 | |
| Pension and OPEB liabilities, current | 151 | | | 4 | |
| Other current liabilities | 596 | | | 107 | |
| Total current liabilities | 2,929 | | | 409 | |
| Non-current liabilities: | | | |
| Long-term debt | 5,390 | | | 2,114 | |
| Pension and OPEB liabilities, non-current | 4,113 | | | 312 | |
| Other non-current liabilities | 1,260 | | | 311 | |
| TOTAL LIABILITIES | 13,692 | | | 3,146 | |
| Commitments and contingencies (See Note 21) | 0 | | 0 |
| Series B Participating Redeemable Preferred Stock - 0 par value | | | |
| Authorized, Issued and Outstanding - 583,273 shares | 738 | | | 0 | |
| Equity: | | | |
| Common Shares - par value $0.125 per share | | | |
| Authorized - 600,000,000 shares (2019 - 600,000,000 shares); | | | |
| Issued - 506,832,537 shares (2019 - 301,886,794 shares); | | | |
| Outstanding - 477,517,372 shares (2019 - 270,084,005 shares) | 63 | | | 37 | |
| Capital in excess of par value of shares | 5,431 | | | 3,873 | |
| Retained deficit | (2,989) | | | (2,842) | |
| Cost of 29,315,165 common shares in treasury (2019 - 31,802,789 shares) | (354) | | | (391) | |
| Accumulated other comprehensive loss | (133) | | | (319) | |
| Total Cliffs shareholders' equity | 2,018 | | | 358 | |
| Noncontrolling interest | 323 | | | 0 | |
| TOTAL EQUITY | 2,341 | | | 358 | |
| TOTAL LIABILITIES, REDEEMABLE PREFERRED STOCK AND EQUITY | $ | 16,771 | | | $ | 3,504 | |
The accompanying notes are an integral part of these consolidated financial statements.
Statements of Consolidated Operations
Cleveland-Cliffs Inc. and Subsidiaries
| | | | | | | | | | | | | | | | | |
| (In Millions, Except Per Share Amounts) |
| Year Ended December 31, |
| 2020 | | 2019 | | 2018 |
| Revenues | $ | 5,319 | | | $ | 1,990 | | | $ | 2,332 | |
| Realization of deferred revenue | 35 | | | 0 | | | 0 | |
| Operating costs: | | | | | |
| Cost of goods sold | (5,102) | | | (1,414) | | | (1,523) | |
| Selling, general and administrative expenses | (244) | | | (113) | | | (113) | |
| Acquisition-related costs | (90) | | | (7) | | | 0 | |
| Miscellaneous – net | (60) | | | (27) | | | (23) | |
| Total operating costs | (5,496) | | | (1,561) | | | (1,659) | |
| Operating income (loss) | (142) | | | 429 | | | 673 | |
| Other income (expense): | | | | | |
| Interest expense, net | (238) | | | (101) | | | (119) | |
| Gain (loss) on extinguishment of debt | 130 | | | (18) | | | (7) | |
| Other non-operating income | 57 | | | 3 | | | 18 | |
| Total other expense | (51) | | | (116) | | | (108) | |
| Income (loss) from continuing operations before income taxes | (193) | | | 313 | | | 565 | |
| Income tax benefit (expense) | 111 | | | (18) | | | 475 | |
| Income (loss) from continuing operations | (82) | | | 295 | | | 1,040 | |
| Income (loss) from discontinued operations, net of tax | 1 | | | (2) | | | 88 | |
| Net income (loss) | (81) | | | 293 | | | 1,128 | |
| Income attributable to noncontrolling interest | (41) | | | 0 | | | 0 | |
| Net income (loss) attributable to Cliffs shareholders | $ | (122) | | | $ | 293 | | | $ | 1,128 | |
| | | | | |
| Earnings (loss) per common share attributable to Cliffs shareholders - basic | | | | | |
| Continuing operations | $ | (0.32) | | | $ | 1.07 | | | $ | 3.50 | |
| Discontinued operations | 0 | | | (0.01) | | | 0.30 | |
| $ | (0.32) | | | $ | 1.06 | | | $ | 3.80 | |
| Earnings (loss) per common share attributable to Cliffs shareholders - diluted | | | | | |
| Continuing operations | $ | (0.32) | | | $ | 1.04 | | | $ | 3.42 | |
| Discontinued operations | 0 | | | (0.01) | | | 0.29 | |
| $ | (0.32) | | | $ | 1.03 | | | $ | 3.71 | |
The accompanying notes are an integral part of these consolidated financial statements.
Statements of Consolidated Comprehensive Income
Cleveland-Cliffs Inc. and Subsidiaries
| | | | | | | | | | | | | | | | | |
| (In Millions) |
| Year Ended December 31, |
| 2020 | | 2019 | | 2018 |
| Net income (loss) | $ | (81) | | | $ | 293 | | | $ | 1,128 | |
| Other comprehensive income (loss): | | | | | |
| Changes in pension and OPEB, net of tax | 181 | | | (35) | | | (17) | |
| Changes in foreign currency translation | 3 | | | 0 | | | (225) | |
| Changes in derivative financial instruments, net of tax | 2 | | | 0 | | | (3) | |
| Total other comprehensive income (loss) | 186 | | | (35) | | | (245) | |
| Comprehensive income | 105 | | | 258 | | | 883 | |
| Comprehensive income attributable to noncontrolling interests | (41) | | | 0 | | | 0 | |
| Comprehensive income attributable to Cliffs shareholders | $ | 64 | | | $ | 258 | | | $ | 883 | |
The accompanying notes are an integral part of these consolidated financial statements.
Statements of Consolidated Cash Flows
Cleveland-Cliffs Inc. and Subsidiaries
| | | | | | | | | | | | | | | | | |
| (In Millions) |
| Year Ended December 31, |
| 2020 | | 2019 | | 2018 |
| OPERATING ACTIVITIES | | | | | |
| Net income (loss) | $ | (81) | | | $ | 293 | | | $ | 1,128 | |
| Adjustments to reconcile net income (loss) to net cash provided (used) by operating activities: | | | | | |
| Depreciation, depletion and amortization | 308 | | | 85 | | | 89 | |
| Amortization of inventory step-up | 96 | | | 0 | | | 0 | |
| Deferred income taxes | (101) | | | 17 | | | (461) | |
| Loss (gain) on extinguishment of debt | (130) | | | 18 | | | 7 | |
| Loss (gain) on derivatives | (104) | | | 47 | | | (110) | |
| Gain on foreign currency translation | 0 | | | 0 | | | (228) | |
| Other | 11 | | | 66 | | | 21 | |
| Changes in operating assets and liabilities, net of business combination: | | | | | |
| Receivables and other assets | (42) | | | 255 | | | 52 | |
| Inventories | (146) | | | (136) | | | 44 | |
| Pension and OPEB payments and contributions | (75) | | | (20) | | | (32) | |
| Payables, accrued expenses and other liabilities | 3 | | | (62) | | | (31) | |
| Net cash provided (used) by operating activities | (261) | | | 563 | | | 479 | |
| INVESTING ACTIVITIES | | | | | |
| Purchase of property, plant and equipment | (525) | | | (656) | | | (296) | |
| Acquisition of ArcelorMittal USA, net of cash acquired | (658) | | | 0 | | | 0 | |
| Acquisition of AK Steel, net of cash acquired | (869) | | | 0 | | | 0 | |
| Other investing activities | 10 | | | 12 | | | 23 | |
| Net cash used by investing activities | (2,042) | | | (644) | | | (273) | |
| FINANCING ACTIVITIES | | | | | |
| Repurchase of common shares | 0 | | | (253) | | | (48) | |
| Dividends paid | (41) | | | (72) | | | 0 | |
| Proceeds from issuance of debt | 1,763 | | | 721 | | | 0 | |
| Debt issuance costs | (76) | | | (7) | | | (2) | |
| Repurchase of debt | (1,023) | | | (729) | | | (235) | |
| Borrowings under credit facilities | 2,060 | | | 0 | | | 0 | |
| Repayments under credit facilities | (550) | | | 0 | | | 0 | |
| SunCoke Middletown distributions to noncontrolling interest owners | (61) | | | 0 | | | 0 | |
| Other financing activities | (13) | | | (54) | | | (91) | |
| Net cash provided (used) by financing activities | 2,059 | | | (394) | | | (376) | |
| Effect of exchange rate changes on cash | 0 | | | 0 | | | (2) | |
| Decrease in cash and cash equivalents, including cash classified within other current assets related to discontinued operations | (244) | | | (475) | | | (172) | |
| Less: decrease in cash and cash equivalents from discontinued operations, classified within other current assets | (3) | | | (5) | | | (17) | |
| Net decrease in cash and cash equivalents | (241) | | | (470) | | | (155) | |
| Cash and cash equivalents at beginning of year | 353 | | | 823 | | | 978 | |
| Cash and cash equivalents at end of year | $ | 112 | | | $ | 353 | | | $ | 823 | |
The accompanying notes are an integral part of these consolidated financial statements.
Statements of Consolidated Changes in Equity
Cleveland-Cliffs Inc. and Subsidiaries
| | | | | | | | | | | | | | | | | | | | | | | | | | | | | | | | | | | | | | | | | | | | | | | |
| (In Millions) |
| Cliffs Shareholders | | | | |
| Number
of
Common
Shares Outstanding | | Par Value of Common
Shares Issued | | Capital in
Excess of
Par Value
of Shares | | Retained
Deficit | | Common
Shares
in
Treasury | | AOCI
(Loss) | | Non-
controlling
Interest | | Total |
| December 31, 2017 | 297 | | | $ | 37 | | | $ | 3,934 | | | $ | (4,207) | | | $ | (170) | | | $ | (39) | | | $ | 0 | | | $ | (445) | |
| Adoption of accounting standard | — | | | — | | | — | | | 34 | | | — | | | — | | | — | | | 34 | |
| Comprehensive income (loss) | — | | | — | | | — | | | 1,128 | | | — | | | (245) | | | 0 | | | 883 | |
| Stock and other incentive plans | 1 | | | — | | | (17) | | | — | | | 31 | | | — | | | — | | | 14 | |
| Common stock repurchases | (5) | | | — | | | — | | | — | | | (47) | | | — | | | — | | | (47) | |
| Common stock dividends ($0.05 per share) | — | | | — | | | — | | | (15) | | | — | | | — | | | — | | | (15) | |
| December 31, 2018 | 293 | | | $ | 37 | | | $ | 3,917 | | | $ | (3,060) | | | $ | (186) | | | $ | (284) | | | $ | 0 | | | $ | 424 | |
| Comprehensive income (loss) | — | | | — | | | — | | | 293 | | | — | | | (35) | | | 0 | | | 258 | |
| Stock and other incentive plans | 2 | | | — | | | (44) | | | — | | | 48 | | | — | | | — | | | 4 | |
| Common stock repurchases | (24) | | | — | | | — | | | — | | | (253) | | | — | | | — | | | (253) | |
| Common stock dividends ($0.27 per share) | — | | | — | | | — | | | (75) | | | — | | | — | | | — | | | (75) | |
| December 31, 2019 | 271 | | | $ | 37 | | | $ | 3,873 | | | $ | (2,842) | | | $ | (391) | | | $ | (319) | | | $ | 0 | | | $ | 358 | |
| Comprehensive income (loss) | — | | | — | | | — | | | (122) | | | — | | | 186 | | | 41 | | | 105 | |
| Stock and other incentive plans | 2 | | | — | | | (24) | | | — | | | 37 | | | — | | | — | | | 13 | |
| Acquisition of AK Steel | 127 | | | 16 | | | 602 | | | — | | | — | | | — | | | 330 | | | 948 | |
| Acquisition of ArcelorMittal USA | 78 | | | 10 | | | 980 | | | — | | | — | | | — | | | 13 | | | 1,003 | |
| Common stock dividends ($0.06 per share) | — | | | — | | | — | | | (25) | | | — | | | — | | | — | | | (25) | |
| Net distributions to noncontrolling interests | — | | | — | | | — | | | — | | | — | | | — | | | (61) | | | (61) | |
| December 31, 2020 | 478 | | | $ | 63 | | | $ | 5,431 | | | $ | (2,989) | | | $ | (354) | | | $ | (133) | | | $ | 323 | | | $ | 2,341 | |
The accompanying notes are an integral part of these consolidated financial statements.
Notes to Consolidated Financial Statements
Cleveland-Cliffs Inc. and Subsidiaries NOTE 1 - BASIS OF PRESENTATION AND SIGNIFICANT ACCOUNTING POLICIES
Business, Consolidation and Presentation
Nature of Business
Cliffs is the largest flat-rolled steel producer in North America. Founded in 1847 Cleveland-Cliffs Inc. isas a mine operator, we are also the largest and oldest independent iron ore mining company in the United States. We are a major supplierproducer of iron ore pellets to thein North AmericanAmerica. In 2020, we acquired two major steelmakers, AK Steel and ArcelorMittal USA, vertically integrating our legacy iron ore business. Our fully-integrated portfolio includes custom-made pellets and HBI; flat-rolled carbon steel, industry fromstainless, electrical, plate, tinplate and long steel products; as well as carbon and stainless steel tubing, hot and cold stamping and tooling. Headquartered in Cleveland, Ohio, we employ approximately 25,000 people across our minesmining, steel and pellet plants located in Michigan and Minnesota. We are currently constructing an HBI production plant in Toledo, Ohio. We expect to complete construction and begin production in 2020.
In January 2018, we announced that we would accelerate the time frame for the planned closure of our Asia Pacific Iron Ore miningdownstream manufacturing operations in Australia. In April 2018, we committed to a course of action leading to the permanent closure of our Asia Pacific Iron Ore mining operationsUnited States and as planned, completed our final shipment in June 2018. Factors considered in this decision included increasingly discounted prices for lower-iron-content ore and the quality of the remaining iron ore reserves.Canada.
During 2018, we sold all of the assets of our Asia Pacific Iron Ore business through a series of sales to third parties. As a result of our planned exit, management determined that our Asia Pacific Iron Ore operating segment met the criteria to be classified as held for sale and a discontinued operation under ASC Topic 205, Presentation of Financial Statements. As such, all current and historical Asia Pacific Iron Ore operating segment results are classified within discontinued operations. Refer to NOTE 13 - DISCONTINUED OPERATIONS for further information.
In alignment with our strategic goals, we have become a North America-centric business and have updated the names of our operating segments. We are now organized according to our differentiated products. We have two reportable segments – the Mining and Pelletizing segment (formerly known as U.S. Iron Ore) and the Metallics segment. Unless otherwise noted, discussion of our business and results of operations in this Annual Report on Form 10-K refers to our continuing operations.
Acquisition of AK Steel
On March 13, 2020, we consummated the AK Steel Merger, pursuant to which, upon the terms and subject to the conditions set forth in the AK Steel Merger Agreement, Merger Sub was merged with and into AK Steel, with AK Steel surviving the AK Steel Merger as a wholly owned subsidiary of Cleveland-Cliffs Inc. Refer to NOTE 3 - ACQUISITIONS for further information.
AK Steel is a North American producer of flat-rolled carbon, stainless and electrical steel products, primarily for the automotive, infrastructure and manufacturing markets. These operations consist primarily of seven steelmaking and finishing plants, two cokemaking operations, three tube manufacturing plants and ten tooling and stamping operations. The acquisition of AK Steel transformed us into a vertically integrated producer of value-added iron ore and steel products.
Acquisition of ArcelorMittal USA
On December 9, 2020, pursuant to the terms of the AM USA Transaction Agreement, we purchased ArcelorMittal USA from ArcelorMittal. In connection with the closing of the AM USA Transaction, as contemplated by the terms of the AM USA Transaction Agreement, ArcelorMittal’s former joint venture partner in Kote and Tek exercised its put right pursuant to the terms of the Kote and Tek joint venture agreements. As a result, we purchased all of such joint venture partner’s interests in Kote and Tek. Following the closing of the AM USA Transaction, we own 100% of the interests in Kote and Tek.
The assets of ArcelorMittal USA we acquired at the closing of the AM USA Transaction include six steelmaking facilities, eight finishing facilities, three cokemaking operations, two iron ore mining and pelletizing operations and one coal mining complex.
Refer to NOTE 3 - ACQUISITIONS for further information.
Business Operations
We are vertically integrated from the mining of iron ore and coal; to production of metallics and coke; through iron making, steelmaking, rolling and finishing; and to downstream tubular components, stamping and tooling. We have the unique advantage as a steel producer of being fully or partially self-sufficient with our production of raw materials for steel manufacturing, which includes iron ore pellets, HBI and coking coal.
We have updated our segment structure to coincide with our new business model and are organized into four operating segments based on differentiated products, Steelmaking, Tubular, Tooling and Stamping, and European Operations. Through the third quarter ended September 30, 2020, we had operated through two reportable segments – the Steel and Manufacturing segment and the Mining and Pelletizing segment. However, given the recent
transformation of the business, beginning with our financial statements as of and for the year ended December 31, 2020, we primarily operate through one reportable segment – the Steelmaking segment.
COVID-19
In response to the COVID-19 pandemic, we made various operational changes to adjust to the demand for our products. Although steel and iron ore production have been considered “essential” by the states in which we operate, certain of our facilities and construction activities were temporarily idled during the second quarter of 2020. Most of these temporarily idled facilities were restarted during the second quarter, and the remaining operations were restarted during the third quarter. Dearborn Works' hot strip mill, anneal and temper operations and AK Coal remain permanently idled as part of the permanent cost reduction efforts. Our Columbus and Monessen facilities acquired through the AM USA Transaction are temporarily idled due to the COVID-19 pandemic.
Basis of Consolidation
The condensed consolidated financial statements consolidate our accounts and the accounts of our wholly owned subsidiaries, all subsidiaries in which we have a controlling interest and VIEs for which we are the primary beneficiary. All intercompany transactions and balances are eliminated upon consolidation.
Investments in Affiliates
We have investments in several businesses accounted for using the equity method of accounting. These investments are included within our Steelmaking segment. We review an investment for impairment when circumstances indicate that a loss in value below its carrying amount is other than temporary. Investees and equity ownership percentages are presented below:
| | | | | | | | |
| Investee | | Equity Ownership Percentage |
| Combined Metals of Chicago, LLC | | 40.0% |
| Spartan Steel Coating, LLC | | 48.0% |
As of December 31, 2019, our 23% ownership in Hibbing was recorded as an equity method investment. As a result of the acquisition of ArcelorMittal USA, we acquired an additional 62.3% ownership interest in Hibbing. As of December 31, 2020, our ownership in the Hibbing joint venture was 85.3% and was fully consolidated within our operating results with a noncontrolling interest.
We recorded a basis difference for Spartan Steel of $33 million as part of the AK Steel Merger. The basis difference relates to the excess of the fair value over the investee's carrying amount of property, plant and equipment and will be amortized over the remaining useful lives of the underlying assets.
As of December 31, 2020, our investment in affiliates of $105 million was classified in Other non-current assets. As of December 31, 2019, our investment in affiliates of $18 million was classified in Other non-current liabilities.
Significant Accounting Policies
We consider the following policies to be beneficial in understanding the judgments involved in the preparation of our consolidated financial statements and the uncertainties that could impact our financial condition, results of operations and cash flows. Certain prior period amounts have been reclassified to conform with the current year presentation.
Use of Estimates
The preparation of financial statements in conformity with GAAP requires management to make estimates and assumptions that affect the reported amounts of assets and liabilities and disclosure of contingent assets and liabilities at the date of the financial statements and the reported amounts of revenues and expenses during the reporting period. The more significant areas requiring the use of management estimates and assumptions relate toOur mineral reservesreserves; future realizable cash flow; environmental, reclamation and closure obligations; valuation of business combinations, long-lived assets, inventory, tax assets and post-employment, post-retirement and other employee benefit liabilities; reserves for contingencies and litigation;litigation require the use of various management estimates and the fair value of derivative instruments.assumptions. Actual results could differ from estimates. Management reviews its estimates on an ongoing basis. Changes in facts and circumstances may alter such estimates and affect the results of operations and financial position in future periods.
The consolidated financial statements include our accounts and the accounts of our wholly owned subsidiaries, including the following iron ore operations at December 31, 2018:
|
| | | | |
Name | | Location | | Status of Operations |
Northshore | | Minnesota | | Active |
United Taconite | | Minnesota | | Active |
Tilden | | Michigan | | Active |
Empire | | Michigan | | Indefinitely Idled |
Business CombinationsIntercompany transactionsAssets acquired and balancesliabilities assumed in a business combination are eliminated upon consolidation.
Equity Method Investments
Investments in unconsolidated ventures that we haverecognized and measured based on their estimated fair values at the abilityacquisition date, while the acquisition-related costs are expensed as incurred. Any excess of the purchase consideration when compared to exercise significant influence over, but not control, are accounted for under the equity method.
Our 23% ownership interest in Hibbingfair value of the net tangible and intangible assets acquired, if any, is recorded as goodwill. We engaged independent valuation specialists to assist with the determination of the fair value of assets acquired, liabilities assumed, noncontrolling interest, and goodwill, for the Acquisitions. If the initial accounting for the business combination is incomplete by the end of the reporting period in which the acquisition occurs, an equity method investment. Asestimate will be recorded. Subsequent to the acquisition date, and not later than one year from the acquisition date, we will record any material adjustments to the initial estimate based on new information obtained that would have existed as of December 31, 2018 and 2017, our investment in Hibbing was $15.4 million and $11.0 million, respectively, classified in Other liabilitiesthe date of the acquisition. Any adjustment that arises from information obtained that did not exist as of the date of the acquisition will be recorded in the Statements of Consolidated Financial Position.
Our share of equity income (loss) is eliminated against consolidated product inventory upon production, and against Cost of goods sold and operating expenses when sold. This effectively reduces our cost for our share ofperiod the mining ventures' production cost, reflecting the cost-based nature of our participation in unconsolidated ventures.
Noncontrolling Interests
During 2017, our ownership interest in Empire increased to 100% as we reached an agreement to distribute the noncontrolling interest net assets of $132.7 million to ArcelorMittal, in exchange for its interest in Empire. The parties agreed that the net assets were to be distributed in three installments of $44.2 million each, the first of which was paid upon the execution of the agreement, the second of which was paid in August 2018 and the final of which is due August 2019. Upon payment of the first installment, we assumed ArcelorMittal's 21% interest and reflected the ownership percentage change in our consolidated financial statements. During the year ended December 31, 2017, we accounted for the increase in ownership as an equity transaction, which resulted in a net $12.1 million decrease in equity attributable to Cliffs' shareholders and a $116.7 million decrease in Noncontrolling interest. The net loss and income attributable to the noncontrolling interest of the Empire mining venture was $3.9 million and $25.2 million for the years ended December 31, 2017 and 2016, respectively.
During 2017, we also acquired the remaining 15% equity interest in Tilden owned by U.S. Steel for $105.0 million. With the closing of this transaction, we now have 100% ownership of the mine. During the year ended December 31, 2017, we accounted for the increase in ownership as an equity transaction, which resulted in an $89.1 million decrease in equity attributable to Cliffs' shareholders and a $15.9 million decrease in Noncontrolling interest.adjustment arises.
Cash and Cash Equivalents
Cash and cash equivalents include cash on hand and on deposit as well as all short-term securities held for the primary purpose of general liquidity. We consider investments in highly liquid debt instruments with an original maturity of three months or less from the date of acquisition and longer maturities when funds can be withdrawn in three months or less without a significant penalty to be cash equivalents. We routinely monitor and evaluate counterparty credit risk related to the financial institutions in which our short-term investment securities are held.
Trade Accounts Receivable and Allowance for Doubtful AccountsCredit Loss
Trade accounts receivable are recorded at the point control transfers and representsrepresent the amount of consideration we expect to receive in exchange for transferred goods and do not bear interest. The allowance for doubtful accounts is our best estimate of the amount of probable credit losses in our existing accounts receivable. We establish provisions for expected lifetime losses on accounts receivable when itat the time a receivable is probable that all or part of the outstanding balance will not be collected.recorded based on historical experience, customer credit quality and forecasted economic conditions. We regularly review our accounts receivable balances and the allowance for credit loss and establish or adjust the allowance as necessary using the specific identification method. There was no allowance for doubtful accounts at December 31, 2018method in accordance with CECL. We evaluate the aggregation and 2017risk characteristics of receivable pools and no bad debt expense fordevelop loss rates that reflect historical collections, current forecasts of future economic conditions over the years ended December 31, 2018, 2017time horizon we are exposed to credit risk, and 2016.payment terms or conditions that may materially affect future forecasts.
Inventories
The Mining and Pelletizing segment product inventoriesInventories are stated at the lower of cost or market. Cost of iron ore inventories is determined using the LIFO method.
Supplies and Other Inventories
Supply inventories include replacement parts, fuel, chemicals and other general supplies, which are expected to be used or consumed in normal operations. Supply inventories also include critical spares. Critical spares are replacement parts for equipment that is critical for the continued operation of the mine or processing facilities.
Supply inventories aregenerally stated at the lower of cost or net realizable value using average cost, less an allowanceexcluding depreciation and amortization. Certain iron ore inventories are stated at the lower of cost or market using the LIFO method.
Refer to NOTE 2 - SUPPLEMENTARY FINANCIAL STATEMENT INFORMATION for obsolete and surplus items. The allowance for obsolete and surplus items was $12.6 million at December 31, 2018 and 2017.
further information.
Derivative Financial Instruments and Hedging Activities
We are exposed to certain risks related to the ongoing operations of our business, including those caused by changes in commodity prices and energy rates. We have established policies and procedures, including the use of certain derivative instruments, to manage such risks, if deemed necessary.
Derivative financial instruments are recognized as either assets or liabilities in the Statements of Consolidated Financial Position and measured at fair value. On the date a qualifying hedging instrument is executed, we designate the hedging instrument as a hedge of the variability of cash flows to be received or paid related to a forecasted transaction (cash flow hedge). We formally document all relationships between hedging instruments and hedged items, as well as our risk-management objective and strategy for undertaking various hedge transactions. This process includes linking all derivatives that are designated as cash flow hedges to specific firm commitments or forecasted transactions. We also formally assess, both at the hedge's inception and on an ongoing basis, whether the derivatives that are used in hedging transactions are highly effective in offsetting changes in cash flows of the related hedged items. When it is determined that a derivative is not highly effective as a hedge, or that it has ceased to be a highly effective hedge, we discontinue hedge accounting prospectively and record all future changes in fair value in the period of the instrument's earnings or losses.
For derivative instruments that have been designated as cash flow hedges, the changes in fair value are recorded in Accumulated other comprehensive loss. Amounts recorded in Accumulated other comprehensive loss are
reclassified to earnings or losses in the period the underlying hedged transaction affects earnings or when the underlying hedged transaction is no longer reasonably possible of occurring.
For derivative instruments that have not been designated as cash flow hedges, such as provisional pricing arrangements, and supplemental revenue or refunds contained within a customer supply agreement, changes in fair value are recorded in the period of the instrument's earnings or losses.
Refer to Revenue Recognition below for discussion of derivatives recorded as a result of pricing terms in our sales contracts. Additionally, refer to NOTE 1215 - DERIVATIVE INSTRUMENTS AND HEDGING ACTIVITIES for further information.
Property, Plant and Equipment
Our properties are stated at the lower of cost less accumulated depreciation or fair value.depreciation. Depreciation of plant and equipment is computed principally by the straight-line method based on estimated useful lives, not to exceed the mine lives. Depreciation continues to be recognized when operations are idled temporarily. We use the double-declining balance method of depreciation for certain mining equipment. Depreciation and depletion is providedare recorded over the following estimated useful lives:
|
| | | | | | | | | | | | | |
| Asset Class | | Basis | | Life |
OfficeLand, land improvements and information technologymineral rights | | Straight line | | 3 to 15 years |
BuildingsLand and mineral rights | | Straight lineUnits of production | | 45 yearsLife of mine |
Mining equipmentLand improvements | | Straight line/Double declining balance | | 3 to 20 years |
Processing equipment | | Straight line | | 10 to 45 years |
Electric power facilities | | Straight line | | 10 to 45 years |
Land improvements | | Straight line | | 20 to 45 years |
Asset retirement obligationBuildings | | Straight line | | Life of mine20 to 45 years |
Mineral rightsEquipment | | Units of productionStraight line/Double declining balance | | Life of mine3 to 20 years |
Refer to NOTE 56 - PROPERTY, PLANT AND EQUIPMENT for further information.
Capitalized Stripping CostsGoodwill
DuringGoodwill represents the development phase, stripping costs are capitalized as a partexcess purchase price paid over the fair value of the depreciable cost of building, developing and constructing a mine. These capitalized costs arenet assets during an acquisition. Goodwill is not amortized, over the productive life of the mine using the units of production method. The production phase does not commence until the removal ofbut is assessed for impairment on an annual basis on October 1 (or more than a de minimis amount of saleable mineral material occurs in conjunction with the removal of overburden or waste material for purposes of obtaining access to an ore body. The stripping costs incurred in the production phase of a mine are variable production costs included in the costs of the inventory produced (extracted) during the period that the stripping costs are incurred.
Stripping costs related to expansion of a mining asset of proven and probable reserves are variable production costs that are included in the costs of the inventory produced during the period that the stripping costs are incurred.frequently if necessary).
Other Intangible Assets and Liabilities
Our mine permitsIntangible assets and liabilities are subject to periodic amortization on a straight linestraight-line basis over their estimated useful life, which correspondslives as follows:
| | | | | | | | | | | | | | |
| Type | | Basis | | Useful Life |
| Intangible assets: | | | | |
| Customer relationships | | Straight line | | 18 years |
| Developed technology | | Straight line | | 17 years |
| Trade names and trademarks | | Straight line | | 10 years |
| Mining permits | | Straight line | | Life of mine |
| Intangible liabilities: | | | | |
| Above-market supply contracts | | Straight line | | Contract term |
Refer to NOTE 7 - GOODWILL AND INTANGIBLE ASSETS AND LIABILITIES for further information.
Leases
We determine if an arrangement contains a lease at inception. We recognize right-of-use assets and lease liabilities associated with leases based on the lifepresent value of mine.the future minimum lease payments over the lease term at the commencement date. Lease terms reflect options to extend or terminate the lease when it is reasonably certain that the option will be exercised. For short-term leases (leases with an initial lease term of 12 months or less), right-of-use assets and lease liabilities are not recognized in the consolidated balance sheet, and lease expense is recognized on a straight-line basis over the lease term.
Refer to NOTE 13 - LEASE OBLIGATIONS for further information.
Asset Impairment
We monitor conditions that may affect the carrying value of our long-lived tangible and intangible assets when events and circumstances indicate that the carrying value of the asset groups may not be recoverable. In order to determine if assets have been impaired, assets are grouped and tested at the lowest level for which identifiable, independent cash flows are available ("asset group"). An impairment loss exists when projected net undiscounted cash flows are less than the carrying value of the asset group. The measurement of the impairment loss to be recognized is based on the difference between the fair value and the carrying value of the asset group. Fair value can be determined using a market approach, income approach or cost approach.
For the years ended December 31, 2018, 20172020, 2019 and 2016,2018, no impairment factorsindicators were present that would indicate the carrying value of any of our asset groups may not be recoverable; as a result, no impairment assessments were required.
Fair Value Measurements
ASC Topic 820, Fair Value Measurements and Disclosures, establishes a three-level valuation hierarchy for classification of fair value measurements. The valuation hierarchy is based upon the transparency of inputs to the valuation of an asset or liability as of the measurement date. Inputs refer broadly to the assumptions that market participants would use in pricing an asset or liability. Inputs may be observable or unobservable. Observable inputs are inputs that reflect the assumptions market participants would use in pricing the asset or liability developed based on market data obtained from independent sources. Unobservable inputs are inputs that reflect our own views about the assumptions market participants would use in pricing the asset or liability developed based on the best information available in the circumstances. The three-tier hierarchy of inputs is summarized below:
•Level 1 — Valuation is based upon quoted prices (unadjusted) for identical assets or liabilities in active markets.
•Level 2 — Valuation is based upon quoted prices for similar assets and liabilities in active markets, or other inputs that are observable for the asset or liability, either directly or indirectly, for substantially the full term of the financial instrument.
•Level 3 — Valuation is based upon other unobservable inputs that are significant to the fair value measurement.
The classification of assets and liabilities within the valuation hierarchy is based upon the lowest level of input that is significant to the fair value measurement in its entirety.
Refer to NOTE 79 - FAIR VALUE OF FINANCIAL INSTRUMENTS and NOTE 810 - PENSIONS AND OTHER POSTRETIREMENT BENEFITS for further information.
Pensions and Other Postretirement Benefits
We offer defined benefit pension plans, defined contribution pension plans and other postretirement benefitOPEB plans, primarily consisting of retiree healthcare benefits to most employees in the United States as part of aour total compensation and benefits program.programs.
We recognize the funded or unfunded status of our postretirement benefitpension and OPEB obligations on our December 31, 20182020 and 20172019 Statements of Consolidated Financial Position based on the difference between the market value of plan assets and the actuarial present value of our retirement obligations on that date, on a plan-by-plan basis. If the plan assets exceed the postretirement benefitpension and OPEB obligations, the amount of the surplus is recorded as an asset; if the postretirement benefitpension and OPEB obligations exceed the plan assets, the amount of the underfunded obligations is recorded as a liability. Year-end balance sheet adjustments to postretirementpension and OPEB assets and obligations are recorded as Accumulated other comprehensive loss in the Statements of Consolidated Financial Position.
The actuarial estimates of the PBO and APBO incorporate various assumptions including the discount rates, the rates of increases in compensation, healthcare cost trend rates, mortality, retirement timing and employee turnover. The discount rate is determined based on the prevailing year-end rates for high-grade corporate bonds with a duration matching the expected cash flow timing of the benefit payments from the various plans. The remaining assumptions are based on our estimates of future events by incorporating historical trends and future expectations. The amount of net periodic cost that is recorded in the Statements of Consolidated Operations consists of several components including service cost, interest cost, expected return on plan assets, and amortization of previously unrecognized amounts. Service cost represents the value of the benefits earned in the current year by the participants. Interest cost represents the cost associated with the passage of time. Certain items, such as plan amendments, gains and/or losses resulting from differences between actual and assumed results for demographic
and economic factors affecting the obligations and assets of the plans, and changes in other assumptions are subject to deferred recognition for income and expense purposes. The expected return on plan assets is determined utilizing the weighted average of expected returns for plan asset investments in various asset categories based on historical performance, adjusted for current trends. Service costs are classified within Cost of goods sold, and operating expenses, Selling, general and administrative expenses and Miscellaneous -– net while the interest cost, expected return on assets, amortization of prior service costs/credits, net actuarial gain/loss, and other costs are classified within Other non-operating income.
Refer to NOTE 2 - NEW ACCOUNTING STANDARDSand NOTE 810 - PENSIONS AND OTHER POSTRETIREMENT BENEFITS for further information.
Labor Agreements
At December 31, 2020, we employed approximately 25,000 people, of which approximately 18,500 were represented by labor unions under various agreements. We have agreements that will expire at five locations in 2021 and sixteen locations in 2022. Workers at some of our North American facilities are covered by agreements with the USW or other unions that have various expiration dates.
Asset Retirement Obligations
Asset retirement obligations are recognized when incurred and recorded as liabilities at fair value. The fair value of the liability is determined as the discounted value of the expected future cash flows. The asset retirement obligation is accreted over time through periodic charges to earnings. In addition, the asset retirement cost is capitalized and amortized over the life of the related asset. Reclamation costs are adjusted periodically to reflect changes in the estimated present value resulting from the passage of time and revisions to the estimates of either the timing or amount of the reclamation costs. We review, on an annual basis, unless otherwise deemed necessary, the asset retirement obligation atfor each mine siteapplicable operation in accordance with the provisions of ASC Topic 410, Asset Retirement and Environmental Obligations. We perform an in-depth evaluation of the liability every three years in addition to our routine annual assessments.
Future reclamation costs for inactive minesoperations are accrued based on management’s best estimate at the end of each period of the costs expected to be incurred at a site. Such cost estimates include, where applicable, ongoing maintenance and monitoring costs. Changes in estimates at inactive minesoperations are reflected in earnings in the period an estimate is revised. See
Refer to NOTE 1114 - ENVIRONMENTAL AND MINE CLOSUREASSET RETIREMENT OBLIGATIONS for further information.
Environmental Remediation Costs
We have a formal policy for environmental protection and restoration. Our mining and explorationCertain of our operating activities are subject to various laws and regulations governing protection of the environment. We conduct our operations to protect the public health and environment and believe our operations are in compliance with applicable laws and regulations in all material respects. Our environmental liabilities, including obligations for known environmental remediation exposures, at active and closed mining operations and other sites, have been recognized based on the estimated cost of investigation and remediation at each site. If the cost can only be estimated as a range of possible amounts with no point in the range being more likely, the minimum of the range is accrued. Future expenditures are not discounted unless the amount and timing of the cash disbursements cannot be reasonably can be estimated. It is possible that additional environmental obligations could be incurred, the extent of which cannot be assessed. Potential insurance recoveries have not been reflected in the determination of the liabilities. See
Refer to NOTE 1121 - ENVIRONMENTALCOMMITMENTS AND MINE CLOSURE OBLIGATIONSCONTINGENCIES for further information.
Revenue Recognition - Pre-Adoption
Sales are recognized when our performance obligations are satisfied. Generally, our performance obligations are satisfied, control of Topic 606
Priorour products is transferred and revenue is recognized at a single point in time, when title transfers to our customer for product shipped according to shipping terms. Shipping and other transportation costs charged to customers are treated as fulfillment activities and are recorded in both revenue and cost of sales at the adoption of Topic 606, revenue was recognized from a sale when persuasive evidence of an arrangement existed, the price was fixed or determinable, the product was delivered in accordance with shipping terms, title and risk of loss weretime control is transferred to the customer in accordance with the specified provisions of each supply agreement and collection of the sales price reasonably was assured. Our supply agreements provide that title and risk of loss transfer to the customer either upon loading of the vessel, shipment or when payment is received. Under certain supply agreements, we ship the product to ports on the lower Great Lakes or to the customers’ facilities prior to the transfer of title. Our rationale for shipping iron ore products to certain customers and retaining title until payment is received for these products is to minimize credit risk exposure.
Sales were recorded at a sales price specified in the relevant supply agreements resulting in revenue and a receivable at the time of sale. The majority of our contracts have pricing mechanisms that require price estimation at the time of delivery with price finalization at a future period. Upon revenue recognition for provisionally priced sales, a derivative was created for the difference between the sales price used and expected future settlement price. The derivative was adjusted to fair value through Product revenues as a revenue adjustment each reporting period based upon current market data and forward-looking estimates determined by management until the final sales price was determined. The principal risks associated with recognition of sales on a provisional basis include Platts 62% Price, Atlantic Basin pellet premium and index freight fluctuations between the date initially recorded and the date of final settlement. For revenue recognition, we estimated the future settlement rate; however, if significant changes in inputs occurred between the provisional pricing date and the final settlement date, we were required to either return a portion of the sales proceeds received or bill for the additional sales proceeds due based on the provisional sales price.
Revenue Recognition - Post-Adoption of Topic 606
We sell a single product, iron ore pellets, in the North American market. With the adoption of Topic 606 as of January 1, 2018, revenue is recognized generally when iron ore is delivered to our customers. Revenue is measured at the point that control transfers and represents the amount of consideration we expect to receive in exchange for transferring goods. We offer standard payment terms to our customers, generally requiring settlement within 30 days.customer. Refer to NOTE 24 - NEW ACCOUNTING STANDARDSREVENUES for further information.
We enter into supply contracts of varying lengths to provide customers iron ore pellets to use in their blast furnaces. Blast furnaces run continuously with a constant feed of iron ore and once shut down, cannot easily be restarted. As a result, we ship iron ore in large quantities for storage and use by customers at a later date. Customers do not simultaneously receive and consume the benefits of the iron ore. Based on our assessment of the factors that indicate the pattern of satisfaction, we transfer control of the iron ore at a point in time upon shipment or delivery of the product. The customer is able to direct the use of, and obtain substantially all of the benefits from, the product at the time the product is delivered.
Most of our customer supply agreements specify a provisional price, which is used for initial billing and cash collection. Revenue recorded in accordance with Topic 606 is calculated using the expected revenue rate at the point when control transfers. The final settlement includes market inputs for a specified period of time, which may vary by customer, but typically include one or more of the following: Platts 62% Price, Atlantic Basin pellet premiums, Platts international indexed freight rates and changes in specified Producer Price Indices, including industrial commodities, energy and steel. Changes in the expected revenue rate from the date control transfers through final settlement of contract terms is recorded in accordance with Topic 815. Refer to NOTE 12 - DERIVATIVE INSTRUMENTS AND HEDGING ACTIVITIES for further information on how our estimated and final revenue rates are determined.
A supply agreement with a customer provides for supplemental revenue or refunds based on the average annual daily market price for hot-rolled coil steel in the year the iron ore is consumed in the customer’s blast furnaces. As control transfers prior to consumption, the supplemental revenue is recorded in accordance with Topic 815. Refer to NOTE 12 - DERIVATIVE INSTRUMENTS AND HEDGING ACTIVITIES for further information on supplemental revenue or refunds.
Included within Revenues from product sales and services is derivative revenue related to Topic 815 of $422.6 million, $120.6 million and $55.9 million for the years ended December 31, 2018, 2017 and 2016, respectively.
As of December 31, 2018, under the new accounting standard, we had finished goods of 0.8 million long tons in transit or stored at the Port of Toledo to service customers, for which revenue had yet to be recognized. Under the previous accounting standard, we did not recognize revenue and related cost of goods sold until title transferred to the customer, usually when payment was received. As of December 31, 2017, under the previous accounting standard, we had finished goods of 1.5 million long tons stored at ports and customer facilities on the lower Great Lakes to service customers, for which revenue had yet to be recognized.
Practical expedients and exemptions
We have elected to treat all shipping and handling costs as fulfillment costs because a significant portion of these costs are incurred prior to control transfer.
We have various long-term sales contracts with minimum purchase and supply requirement provisions that extend beyond the current reporting period. The portion of our transaction price for these contracts that is allocated entirely to wholly unsatisfied performance obligations is based on market prices that have not yet been determined and therefore is variable in nature. As such, we have not disclosed the value of unsatisfied performance obligations pursuant to the practical expedient.
Deferred Revenue
The table below summarizes our deferred revenue balances:
|
| | | | | | | | | | | | | | | |
| | (In Millions) |
| | Deferred Revenue (Current)1 | | Deferred Revenue (Long-Term) |
| | Year Ended
December 31, | | Year Ended
December 31, |
| | 2018 | | 2017 | | 2018 | | 2017 |
| Opening balance as of January 1 | $ | 23.8 |
| | $ | 16.2 |
| | $ | 51.4 |
| | $ | 64.3 |
|
| Closing balance as of December 31 | 21.0 |
| | 22.4 |
| | 38.5 |
| | 51.4 |
|
| Increase (Decrease) | $ | (2.8 | ) | | $ | 6.2 |
| | $ | (12.9 | ) | | $ | (12.9 | ) |
| | | | | | | | |
1 The opening balance for the year ended December 31, 2018 includes a $1.4 million adjustment from the December 31, 2017 balance due to the adoption of Topic 606. |
The terms of one of our pellet supply agreements required supplemental payments to be paid by the customer during the period 2009 through 2012. Installment amounts received under this arrangement in excess of sales were classified as Other current liabilities and Other liabilities in the Statements of Consolidated Financial Position upon receipt of payment. Revenue is recognized over the life of the supply agreement, which extends until 2022, in equal annual installments. As of December 31, 2018 and December 31, 2017, installment amounts received in excess of sales totaled $51.3 million and $64.2 million, respectively, related to this agreement. As of December 31, 2018, and December 31, 2017, deferred revenue of $12.8 million was recorded in Other current liabilities and $38.5 million and $51.4 million, respectively, was recorded as long-term in Other liabilities in the Statements of Consolidated Financial Position, related to this agreement.
Due to the payment terms and the timing of cash receipts near a period end, cash receipts can exceed deliveries for certain customers. Revenue recognized on these transactions totaling $8.2 million and $9.6 million was deferred and included in Other current liabilities in the Statements of Consolidated Financial Position as of December 31, 2018 and December 31, 2017, respectively.
Cost of Goods Sold
Cost of goods sold and operating expenses represents all direct and indirect costs and expenses applicable to the sales from our mining operations.
In some circumstances, as requested by the customer, we will coordinate and ship our product via vessel directly to the port nearest to the customer's blast furnace. In this type of contract, the customer will pay one amount inclusive of both product and freight. We recognize revenue for both product revenue and the amount reimbursed for the vessel freight to the final port. We separate these revenue types in the Statements of Consolidated Operations. Accordingly, the revenue we record for freight is offset by an equal amount included in Cost of goods sold and operating expenses for costs we incur for that freight, resulting in no impact on sales margin.
Operating expenses represented the portion of the Tilden mining venture costs prior to our 100% ownership; that is, the costs attributable to the share of the mine’s production owned by the other joint venture partner in the Tilden mine until we acquired the remaining 15% noncontrolling interest during 2017. The mining venture functioned as a captive cost company, supplying product only to its owners effectively for the cost of production. Accordingly, the noncontrolling interests’ revenue amounts were stated at cost of production and were offset by an equal amount included in Cost of goods sold and operating expenses resulting in no sales margin reflected for the noncontrolling partner participant. As we were responsible for product fulfillment under the venture, we acted as a principal in the transaction and, accordingly, recorded revenue under these arrangements on a gross basis.
The following table is a summary of reimbursements in our operations:
|
| | | | | | | | | | | | |
| | | (In Millions) |
| | | Year Ended December 31, |
| | | 2018 | | 2017 | | 2016 |
| Reimbursements for: | | | | | | |
| Freight | | $ | 160.1 |
| | $ | 166.7 |
| | $ | 106.8 |
|
| Venture partners’ cost | | — |
| | 54.7 |
| | 68.0 |
|
| Total reimbursements | | $ | 160.1 |
| | $ | 221.4 |
| | $ | 174.8 |
|
Where we have joint ownership of a mine, such as Hibbing and up to the point at which we purchased the remaining interest in Tilden, our contracts entitle us to receive management fees or royalties, which we earn as the pellets are produced.
Repairs and Maintenance
Repairs, maintenance and replacement of components are expensed as incurred. The cost of major equipment overhauls is capitalized and depreciated over the estimated useful life, which is the period until the next scheduled overhaul, generally five years.overhauls. All other planned and unplanned repairs and maintenance costs are expensed when incurred.
Share-Based Compensation
The fair value of each performance share grant is estimated on the date of grant using a Monte Carlo simulation to forecast relative TSR performance. A correlation matrix of historichistorical and projected stock prices was developed for both the Company and its predetermined peer group of mining and metals companies. The fair value assumes that the performance objective will be achieved. The expected term of the grant represents the time from the grant date to the end of the service period. We estimate the volatility of our common shares and that of the peer group of mining and metals companies using daily price intervals for all companies. The risk-free interest rate is the rate at the grant date on zero-coupon government bonds, with a term commensurate with the remaining performance period.
The fair value of the restricted stock units is determined based on the closing price of our common shares on the grant date.
Upon vesting of share-based compensation awards, we issue shares from treasury shares before issuing new shares. Forfeitures are recognized when they occur.
The fair value of stock options is estimated on the date of grant using a Black-Scholes model using the grant date price of our common shares and option exercise price, and assumptions regarding the option’s expected term, the volatility of our common shares, the risk-free interest rate, and the dividend yield over the option’s expected term.
Refer to NOTE 911 - STOCK COMPENSATION PLANS for additional information.
Income Taxes
Income taxes are based on income for financial reporting purposes, calculated using tax rates by jurisdiction, and reflect a current tax liability or asset for the estimated taxes payable or recoverable on the current year tax return and expected annual changes in deferred taxes. Any interest or penalties on income tax are recognized as a component of Income tax benefit (expense).
We account for income taxes under the asset and liability method, which requires the recognition of deferred tax assets and liabilities for the expected future tax consequences of events that have been included in the financial statements. Under this method, deferred tax assets and liabilities are determined based on the differences between the financial statement and tax basis of assets and liabilities using enacted tax rates in effect for the year in which the differences are expected to reverse. The effect of a change in tax rates on deferred tax assets and liabilities is recognized within Net income (loss) in the period that includes the enactment date.
We record net deferred tax assets to the extent we believe these assets will more likely than not be realized. In making such determination, we consider all available positive and negative evidence, including scheduled reversals of deferred tax liabilities, projected future taxable income, tax planning strategies and recent financial results of operations.
Accounting for uncertainty in income taxes recognized in the financial statements requires that a tax benefit from an uncertain tax position be recognized when it is more likely than not that the position will be sustained upon examination, including resolutions of any related appeals or litigation processes, based on technical merits.
See NOTE 1012 - INCOME TAXES for further information.
Discontinued Operations
Asia Pacific Iron Ore Operations
In January 2018, we announced that we would accelerate the time frame for the planned closure of our Asia Pacific Iron Ore mining operations in Australia. In AprilDuring 2018, we committed to a course of action leading to the permanent closure of ourthe Asia Pacific Iron Ore mining operations and as planned, completed our final shipment in June 2018. Factors considered in this decision included increasingly discounted prices for lower-iron-content ore and the qualitysold all of the remaining iron ore reserves.
assets of our Asia Pacific Iron Ore business through a series of sales to third parties. As a result of our planned exit, management determined that our Asia Pacific Iron Ore operating segmentmining operations met the criteria to be classified as held for sale and a discontinued operation under ASC Topic 205, Presentation of Financial
Statements. As such, all current and historical Asia Pacific Iron Ore operating segment results are classified within discontinued operations. Refer to NOTE 13 - DISCONTINUED OPERATIONS for further discussion of the Asia Pacific Iron Ore segment discontinued operations.
Canadian Operations
As more fully described in NOTE 13 - DISCONTINUED OPERATIONS, in January 2015, we announced that the Bloom Lake Group commenced restructuring proceedings in Montreal, Quebec under the CCAA. At that time, we had suspended Bloom Lake operations and for several months had been exploring options to sell certain of our Canadian assets, among other initiatives. Effective January 27, 2015, following the commencement of CCAA proceedings for the Bloom Lake Group, we deconsolidated the Bloom Lake Group and certain other wholly-owned subsidiaries comprising substantially all of our Canadian operations. Additionally, on May 20, 2015, the Wabush Group commenced restructuring proceedings in Montreal, Quebec under the CCAA which resulted in the deconsolidation of the remaining Wabush Group entities that were not previously deconsolidated. The Wabush Group was no longer generating revenues and was not able to meet its obligations as they came due. As a result of this action, the CCAA protection granted to the Bloom Lake Group was extended to include the Wabush Group to facilitate the reorganization of each of their businesses and operations. Our Canadian exit represented a strategic shift in our business. For this reason, all Eastern Canadian Iron Ore and Ferroalloys costs to exit are classified as discontinued operations.
Foreign Currency
Our financial statements are prepared with the U.S. dollar as the reporting currency. Historically,currency and the functional currency of all subsidiaries is the U.S. dollar, except for our Australian subsidiaries wasEuropean Operations for which the Australian dollar. Concurrent withfunctional currency is the sale of assets to Mineral Resources Limited inEuro. In August 2018, management determined that there were significant changes in economic factors related to our Australian subsidiaries. The change in economic factors was a result of the sale and conveyance of substantially all assets and liabilities of our Australian subsidiaries to third parties, representing a significant change in operations. As such, the functional currency for the Australian subsidiaries changed from the Australian dollar to the U.S. dollar and all remaining Australian denominated monetary balances will be remeasured prospectively through the Statements of Consolidated Operations.
In addition, asAs a result of the liquidation of substantially all of the Australian subsidiaries' assets, the historical impact of foreign currency translation recorded in Accumulated other comprehensive loss in the Statements of Consolidated Financial Position of $228.1$228 million was reclassified and recognized as a gain in Income (loss) from discontinued operations, net of tax in the Statements of Consolidated Operations. Refer to NOTE 13 - DISCONTINUED OPERATIONSOperations for further information regarding our Australian subsidiaries.the year ended December 31, 2018.
The functional currency of all other subsidiaries is the U.S. dollar. To the extent that monetary assets and liabilities, including short-term intercompany loans, are recorded in a currency other than the functional currency, these amounts are remeasured each reporting period, with the resulting gain or loss being recorded in the Statements of Consolidated Operations. Transaction gains and losses resulting from remeasurement of intercompany loans are included in Miscellaneous - net in our Statements of Consolidated Operations.
The following represents the net gain (loss) related to impact of transaction gains and losses from continuing operations resulting from remeasurement:
|
| | | | | | | | | | | | |
| | | (In Millions) |
| | | 2018 | | 2017 | | 2016 |
| Remeasurement of intercompany loans | | $ | (0.7 | ) | | $ | 16.6 |
| | $ | (16.6 | ) |
| Other remeasurement | | (0.2 | ) | | (2.7 | ) | | (1.2 | ) |
| Total | | $ | (0.9 | ) | | $ | 13.9 |
| | $ | (17.8 | ) |
Earnings Per Share
We present both basic and diluted earnings per shareEPS amounts for continuing operations and discontinued operations. Total basic earnings per shareEPS amounts are calculated by dividing Net income (loss) attributable to Cliffs shareholders, less the earnings allocated to our Series B Participating Redeemable Preferred Stock, by the weighted average number of common shares outstanding during the period presented.
Total diluted earnings per shareEPS amounts are calculated by dividing Net income (loss) attributable to Cliffs shareholders by the weighted average number of common shares, common share equivalents under stock plans using the treasury-stock method, common share equivalents of the Series B Participating Redeemable Preferred Stock using the if-converted method and the calculated common share equivalents in excess of the conversion rate related to our 1.50% 2025 Convertible Senior Notes using the treasury-stock method. Common share equivalents are excluded from EPS computations in the periods in which they have an anti-dilutive effect.
Holders of the 2025 Convertible Senior Notes may convert their notes during any quarter between April 1, 2018 and July 15, 2024 where our share price exceeds 130% of the conversion price for 20 trading days during a 30 trading day period. Holders of the 2025 Convertible Senior Notes may also convert their notes during any quarter between April 1, 2018 and July 15, 2024 during the five business day period after any five consecutive trading day period in which the trading price per $1,000 principal amount of notes, for each trading day of the measurement period was less than 98% of the product of the last reported sale price of our common shares and the conversion price on each such trading day. If our common shares rise in value above the conversion price, diluted EPS will be calculated based on the treasury-stock method with the number of dilutive shares being calculated based on the difference in the average share price and the conversion price.
See NOTE 188 - DEBT AND CREDIT FACILITIESand NOTE 20 - EARNINGS PER SHARE for further information.
Variable Interest Entities We assess whether we have a variable interest in legal entities in which we have a financial relationship and, if so, whether or not those entities are VIEs. A VIE is an entity with insufficient equity at risk for the entity to finance its activities without additional subordinated financial support or in which equity investors lack the characteristics of a controlling financial interest. If an entity is determined to be a VIE, we evaluate whether we are the primary beneficiary. The primary beneficiary analysis is a qualitative analysis based on power and economics. We conclude that we are the primary beneficiary and consolidate the VIE if we have both (i) the power to direct the activities of the VIE that most significantly influence the VIE's economic performance and (ii) the obligation to absorb losses of, or the right to receive benefits from, the VIE that could potentially be significant to the VIE. Refer to NOTE 219 - NEW ACCOUNTING STANDARDSVARIABLE INTEREST ENTITIES for additional information.
Recent Accounting Pronouncements
Issued and Adopted
ASC Topic 606, Revenue from Contracts with Customers (Topic 606). On January 1, 2018, we adopted Topic 606March 2, 2020, the SEC issued a final rule that amended the disclosure requirements related to certain registered securities under SEC Regulation S-X, Rule 3-10, which required separate financial statements for subsidiary issuers and applied it to all contracts that were not completed using the modified retrospective method. We recognized the cumulative effectguarantors of initially applying Topic 606 as an adjustment of $34.0 million to the opening balance of Retained deficit.registered debt securities unless certain exceptions are met. The comparative period information has not been retrospectively revised and continues to be reported under the accounting standards in effect for those periods. On a prospective basis, we do not expect that the adoption of Topic 606 will have a material impact to our annual net income.
Under Topic 606, revenue is generally recognized upon delivery to our customers, which is earlier than underfinal rule replaces the previous guidance. As an example, for certain iron ore shipments where revenue was previously recognized upon title transfer when payment was received, we will now recognize revenue when control transfers, which is generally upon delivery. While we continuerequirement under Rule 3-10 to retain title until we receive paymentprovide condensed consolidating financial information in many cases, we determined upon review of our customer contracts that the preponderance of control indicators passregistrant’s financial statements with a requirement to our customers' favor when we deliver our products; thus, we generally concluded that control transfers at that point. As a resultprovide alternative financial disclosures (which include summarized financial information of the parent and any issuers and guarantors, as well as other qualitative disclosures) in either the registrant’s Management's Discussion and Analysis of Financial Condition and Results of Operations or its financial statements, in addition to other simplifications. The final rule is effective for filings on or after January 4, 2021, and early adoption of Topic 606 and vessel deliveries not occurring during the winter months because of the closure of the Soo Locks and the Welland Canal, our revenues and net income will be relatively lower than historical levels during the first quarter of each year and relatively higher than historical levels during the remaining three quarters in 2018 and future years. However, the total amount of revenue recognized during the year should remain substantially the same as under previous accounting standards, assuming revenue rates and volumes are consistent between years.
The cumulative effect of the changes made to our consolidated January 1, 2018 balance sheet for the adoption of Topic 606 were as follows:
|
| | | | | | | | | | | | |
| | | (In Millions) |
| | | Balance at December 31, 2017 | | Adjustments due to Topic 606 | | Balance at January 1, 2018 |
| ASSETS | | | | | | |
| CURRENT ASSETS | | | | | | |
| Cash and cash equivalents | | $ | 978.3 |
| | $ | — |
| | $ | 978.3 |
|
| Accounts receivable, net | | 106.7 |
| | 76.6 |
| | 183.3 |
|
| Inventories | | 138.4 |
| | (51.4 | ) | | 87.0 |
|
| Supplies and other inventories | | 88.8 |
| | — |
| | 88.8 |
|
| Derivative assets | | 37.9 |
| | 11.6 |
| | 49.5 |
|
| Income tax receivable, current | | 13.3 |
| | — |
| | 13.3 |
|
| Loans to and accounts receivables from the Canadian Entities | | 51.6 |
| | — |
| | 51.6 |
|
| Current assets of discontinued operations | | 118.5 |
| | — |
| | 118.5 |
|
| Other current assets | | 11.1 |
| | — |
| | 11.1 |
|
| TOTAL CURRENT ASSETS | | 1,544.6 |
| | 36.8 |
| | 1,581.4 |
|
| PROPERTY, PLANT AND EQUIPMENT, NET | | 1,033.8 |
| | — |
| | 1,033.8 |
|
| OTHER ASSETS | | | | | | |
| Deposits for property, plant and equipment | | 17.8 |
| | — |
| | 17.8 |
|
| Income tax receivable, non-current | | 235.3 |
| | — |
| | 235.3 |
|
| Non-current assets of discontinued operations | | 20.3 |
| | — |
| | 20.3 |
|
| Other non-current assets | | 101.6 |
| | — |
| | 101.6 |
|
| TOTAL OTHER ASSETS | | 375.0 |
| | — |
| | 375.0 |
|
| TOTAL ASSETS | | $ | 2,953.4 |
| | $ | 36.8 |
| | $ | 2,990.2 |
|
| | | | | | | |
| LIABILITIES | | | | | | |
| CURRENT LIABILITIES | | | | | | |
| Accounts payable | | $ | 99.5 |
| | $ | 1.4 |
| | $ | 100.9 |
|
| Accrued employment costs | | 52.7 |
| | — |
| | 52.7 |
|
| State and local taxes payable | | 30.2 |
| | — |
| | 30.2 |
|
| Accrued interest | | 31.4 |
| | — |
| | 31.4 |
|
| Contingent claims | | 55.6 |
| | — |
| | 55.6 |
|
| Partnership distribution payable | | 44.2 |
| | — |
| | 44.2 |
|
| Current liabilities of discontinued operations | | 75.0 |
| | — |
| | 75.0 |
|
| Other current liabilities | | 63.6 |
| | 1.4 |
| | 65.0 |
|
| TOTAL CURRENT LIABILITIES | | 452.2 |
| | 2.8 |
| | 455.0 |
|
| PENSION AND POSTEMPLOYMENT BENEFIT LIABILITIES | | 257.7 |
| | — |
| | 257.7 |
|
| ENVIRONMENTAL AND MINE CLOSURE OBLIGATIONS | | 167.7 |
| | — |
| | 167.7 |
|
| LONG-TERM DEBT | | 2,304.2 |
| | — |
| | 2,304.2 |
|
| NON-CURRENT LIABILITIES OF DISCONTINUED OPERATIONS | | 52.2 |
| | — |
| | 52.2 |
|
| OTHER LIABILITIES | | 163.5 |
| | — |
| | 163.5 |
|
| TOTAL LIABILITIES | | 3,397.5 |
| | 2.8 |
| | 3,400.3 |
|
| EQUITY | | | | | | |
| CLIFFS SHAREHOLDERS' EQUITY (DEFICIT) | | (444.3 | ) | | 34.0 |
| | (410.3 | ) |
| NONCONTROLLING INTEREST | | 0.2 |
| | — |
| | 0.2 |
|
| TOTAL EQUITY (DEFICIT) | | (444.1 | ) | | 34.0 |
| | (410.1 | ) |
| TOTAL LIABILITIES AND EQUITY (DEFICIT) | | $ | 2,953.4 |
| | $ | 36.8 |
| | $ | 2,990.2 |
|
The impact of adoption on our Statements of Consolidated Operations and Statements of Consolidated Financial Position is as follows:
|
| | | | | | | | | | | |
| | ($ in Millions) |
| | Year Ended December 31, 2018 |
| | As Reported | | Balances without Adoption of Topic 606 | | Effect of Change |
| REVENUES FROM PRODUCT SALES AND SERVICES | | | | | |
| Product | $ | 2,172.3 |
| | $ | 2,108.1 |
| | $ | 64.2 |
|
| Freight and venture partners' cost reimbursements | 160.1 |
| | 156.2 |
| | 3.9 |
|
| | 2,332.4 |
| | 2,264.3 |
| | 68.1 |
|
| COST OF GOODS SOLD AND OPERATING EXPENSES | (1,522.8 | ) | | (1,513.2 | ) | | (9.6 | ) |
| SALES MARGIN | 809.6 |
| | 751.1 |
| | 58.5 |
|
| OTHER OPERATING INCOME (EXPENSE) | | | | | |
| Selling, general and administrative expenses | (116.8 | ) | | (116.8 | ) | | — |
|
| Miscellaneous - net | (19.6 | ) | | (19.6 | ) | | — |
|
| | (136.4 | ) | | (136.4 | ) | | — |
|
| OPERATING INCOME | 673.2 |
| | 614.7 |
| | 58.5 |
|
| OTHER INCOME (EXPENSE) | | | | | |
| Interest expense, net | (118.9 | ) | | (118.9 | ) | | — |
|
| Loss on extinguishment of debt | (6.8 | ) | | (6.8 | ) | | — |
|
| Other non-operating income | 17.2 |
| | 17.2 |
| | — |
|
| | (108.5 | ) | | (108.5 | ) | | — |
|
| INCOME FROM CONTINUING OPERATIONS BEFORE INCOME TAXES | 564.7 |
| | 506.2 |
| | 58.5 |
|
| INCOME TAX BENEFIT | 475.2 |
| | 487.5 |
| | (12.3 | ) |
| INCOME FROM CONTINUING OPERATIONS | 1,039.9 |
| | 993.7 |
| | 46.2 |
|
| INCOME FROM DISCONTINUED OPERATIONS, net of tax | 88.2 |
| | 88.2 |
| | — |
|
| NET INCOME ATTRIBUTABLE TO CLIFFS SHAREHOLDERS | $ | 1,128.1 |
| | $ | 1,081.9 |
| | $ | 46.2 |
|
| EARNINGS PER COMMON SHARE ATTRIBUTABLE TO CLIFFS SHAREHOLDERS - BASIC | | | | | |
| Continuing operations | $ | 3.50 |
| | $ | 3.34 |
| | $ | 0.16 |
|
| Discontinued operations | 0.30 |
| | 0.30 |
| | — |
|
| | $ | 3.80 |
| | $ | 3.64 |
| | $ | 0.16 |
|
| EARNINGS PER COMMON SHARE ATTRIBUTABLE TO CLIFFS SHAREHOLDERS - DILUTED | | | | | |
| Continuing operations | $ | 3.42 |
| | $ | 3.27 |
| | $ | 0.15 |
|
| Discontinued operations | 0.29 |
| | 0.29 |
| | — |
|
| | $ | 3.71 |
| | $ | 3.56 |
| | $ | 0.15 |
|
| AVERAGE NUMBER OF SHARES (IN THOUSANDS) | | | | | |
| Basic | 297,176 |
| | 297,176 |
| | |
| Diluted | 304,141 |
| | 304,141 |
| | |
The increased revenue recognized under Topic 606 is due to higher tons shipped and a higher realized revenue rate in December 2018 versus December 2017. Under the previous accounting standard, December 2017 shipments would have been recognized as 2018 sales due to the fact that title and risk of loss does not transfer until payment is received from our customers.
|
| | | | | | | | | | | | |
| | | (In Millions) |
| | | December 31, 2018 |
| | | As Reported | | Balances without Adoption of Topic 606 | | Effect of Change |
| ASSETS | | | | | | |
| CURRENT ASSETS | | | | | | |
| Cash and cash equivalents | | $ | 823.2 |
| | $ | 823.2 |
| | $ | — |
|
| Accounts receivable, net | | 226.7 |
| | 108.7 |
| | 118.0 |
|
| Inventories | | 87.9 |
| | 141.3 |
| | (53.4 | ) |
| Supplies and other inventories | | 93.2 |
| | 93.2 |
| | — |
|
| Derivative assets | | 91.5 |
| | 60.7 |
| | 30.8 |
|
| Income tax receivable, current | | 117.3 |
| | 117.3 |
| | — |
|
| Current assets of discontinued operations | | 12.4 |
| | 12.4 |
| | — |
|
| Other current assets | | 27.4 |
| | 27.4 |
| | — |
|
| TOTAL CURRENT ASSETS | | 1,479.6 |
| | 1,384.2 |
| | 95.4 |
|
| PROPERTY, PLANT AND EQUIPMENT, NET | | 1,286.0 |
| | 1,286.0 |
| | — |
|
| OTHER ASSETS | | | | | | |
| Deposits for property, plant and equipment | | 83.0 |
| | 83.0 |
| | — |
|
| Income tax receivable, non-current | | 121.3 |
| | 121.3 |
| | — |
|
| Deferred income taxes | | 464.8 |
| | 477.1 |
| | (12.3 | ) |
| Other non-current assets | | 94.9 |
| | 94.9 |
| | — |
|
| TOTAL OTHER ASSETS | | 764.0 |
| | 776.3 |
| | (12.3 | ) |
| TOTAL ASSETS | | $ | 3,529.6 |
| | $ | 3,446.5 |
| | $ | 83.1 |
|
| | | | | | | |
| LIABILITIES | | | | | | |
| CURRENT LIABILITIES | | | | | | |
| Accounts payable | | $ | 186.8 |
| | $ | 184.9 |
| | $ | 1.9 |
|
| Accrued employment costs | | 74.0 |
| | 74.0 |
| | — |
|
| State and local taxes payable | | 35.5 |
| | 35.5 |
| | — |
|
| Accrued interest | | 38.4 |
| | 38.4 |
| | — |
|
| Partnership distribution payable | | 43.5 |
| | 43.5 |
| | — |
|
| Current liabilities of discontinued operations | | 6.7 |
| | 6.7 |
| | — |
|
| Other current liabilities | | 83.3 |
| | 83.7 |
| | (0.4 | ) |
| TOTAL CURRENT LIABILITIES | | 468.2 |
| | 466.7 |
| | 1.5 |
|
| PENSION AND POSTEMPLOYMENT BENEFIT LIABILITIES | | 248.7 |
| | 248.7 |
| | — |
|
| ENVIRONMENTAL AND MINE CLOSURE OBLIGATIONS | | 172.0 |
| | 172.0 |
| | — |
|
| LONG-TERM DEBT | | 2,092.9 |
| | 2,092.9 |
| | — |
|
| NON-CURRENT LIABILITIES OF DISCONTINUED OPERATIONS | | 8.3 |
| | 8.3 |
| | — |
|
| OTHER LIABILITIES | | 115.3 |
| | 115.3 |
| | — |
|
| TOTAL LIABILITIES | | 3,105.4 |
| | 3,103.9 |
| | 1.5 |
|
| EQUITY | | | | | | |
| CLIFFS SHAREHOLDERS' EQUITY | | 424.2 |
| | 342.6 |
| | 81.6 |
|
| TOTAL LIABILITIES AND EQUITY | | $ | 3,529.6 |
| | $ | 3,446.5 |
| | $ | 83.1 |
|
The adoption of Topic 606 did not have an impact on net cash flows in our Statements of Consolidated Cash Flows.
ASU 2017-07, Retirement Benefits - Improving the Presentation of Net Periodic Pension Cost and Net Periodic Postretirement Benefit Cost. On January 1, 2018, we adopted the amendments to ASC Topic 715, Compensation - Retirement Benefits regarding the presentation of net periodic pension and postretirement benefit costs. We
retrospectively adopted the presentation of service cost separate from the other components of net periodic costs. The interest cost, expected return on assets, amortization of prior service costs, net remeasurement, and other costs have been reclassified from Cost of goods sold and operating expenses,Selling, general and administrative expenses and Miscellaneous - net to Other non-operating income. We elected to apply the practical expedient, which allows us to reclassify amounts disclosed previously in our pension and other postretirement benefits footnote as the basis for applying retrospective presentation for comparative periods. On a prospective basis, only service costs will be included in amounts capitalized in inventory or property, plant, and equipment.
The effect of the retrospective presentation change related to the net periodic cost of our defined benefit pension and other postretirement employee benefits plans on our Statements of Consolidated Operations was as follows:
|
| | | | | | | | | | | | | | | | | | | | | | | |
| | (In Millions) |
| | Year Ended December 31, 2017 | | Year Ended December 31, 2016 |
| | As Adjusted | | Without Adoption of ASU 2017-07 | | Effect of Change | | As Adjusted | | Without Adoption of ASU 2017-07 | | Effect of Change |
| Cost of goods sold and operating expenses | $ | (1,398.4 | ) | | $ | (1,400.7 | ) | | $ | 2.3 |
| | $ | (1,274.4 | ) | | $ | (1,278.7 | ) | | $ | 4.3 |
|
| Selling, general and administrative expenses | $ | (102.9 | ) | | $ | (95.1 | ) | | $ | (7.8 | ) | | $ | (115.8 | ) | | $ | (106.3 | ) | | $ | (9.5 | ) |
| Miscellaneous - net | $ | 25.5 |
| | $ | 27.0 |
| | $ | (1.5 | ) | | $ | (33.6 | ) | | $ | (32.0 | ) | | $ | (1.6 | ) |
| Operating income | $ | 390.2 |
| | $ | 397.2 |
| | $ | (7.0 | ) | | $ | 130.7 |
| | $ | 137.5 |
| | $ | (6.8 | ) |
| Other non-operating income | $ | 10.2 |
| | $ | 3.2 |
| | $ | 7.0 |
| | $ | 7.3 |
| | $ | 0.5 |
| | $ | 6.8 |
|
| Net income | $ | 363.1 |
| | $ | 363.1 |
| | $ | — |
| | $ | 199.3 |
| | $ | 199.3 |
| | $ | — |
|
In August 2018, the FASB issued ASU No. 2018-14, Defined Benefit Plans (Topic 715-20) - Changes to the Disclosure Requirements for Defined Benefit Plans. Certain of the existing required disclosures were modified for clarification or removed and additional disclosures were added.permitted. We elected to early adopt ASU No. 2018-14this disclosure update for the yearperiod ended DecemberMarch 31, 2018. The effect2020. As a result, we have excluded the footnote disclosures required under the previous Rule 3-10, and applied the final rule by including the summarized financial information and qualitative disclosures in Part II -
Item 7. Management's Discussion and Analysis of Financial Condition and Results of Operations of this standard required retrospective adoption, but did not impact prior-period financial results.Annual Report on Form 10-K and Exhibit 22, filed herewith.
In August 2018, the FASB issued ASU No. 2018-13,Fair Value Measurement (Topic 820) - Changes to the Disclosure Requirements for Fair Value Measurement. The new standard removes or modifies certain existing disclosure requirements and adds additional disclosure requirements related to fair value measurement. We elected to early adopt ASU No. 2018-13 for the year ended December 31, 2018. The affect of the adoption is an overall reduction in our quarterly and annual disclosures related to fair value measurement.
Issued and Not Effective
In February 2016, the FASB issued ASU No. 2016-02, Leases (Topic 842). The new standard requires lessees to recognize a right-of-use asset and a lease liability on the balance sheet for all leases except for short-term leases. For lessees, leases will beare classified as either operating or finance leases in the Statements of Consolidated Operations.leases. We adopted this standard on its effective date of January 1, 2019 using the optional alternative approach, which requires application of the new guidance at the beginning of the standard's effective date. We have compiled an inventoryAdoption of our existing leases and have finalized our implementation plan. Based on our analysis, the updated standard willdid not have a material effect on our consolidated financial statements.
In June 2016, the FASB issued ASU No. 2016-13, Financial Instruments-Credit Losses (Topic 326), which introduces a new accounting model, CECL. CECL requires earlier recognition of credit losses, while also providing additional transparency about credit risk. CECL utilizes a lifetime expected credit loss measurement objective for the recognition of credit losses at the time the financial asset is originated or acquired. The expected credit losses are adjusted each period for changes in expected lifetime credit losses. We elected to early adopt this standard on December 31, 2019. Upon adoption, the updated standard did not have a material effect on our consolidated financial statements.
Issued and Not Effective
In August 2020, the FASB issued ASU 2020-06, Debt—Debt with Conversion and Other Options (Subtopic 470-20) and Derivatives and Hedging—Contracts in Entity’s Own Equity (Subtopic 815-40). This update requires certain convertible instruments to be accounted for as a single liability measured at its amortized cost. Additionally, the update requires the use of the "if-converted" method, removing the treasury stock method, when calculating diluted shares. The two methods of adoption are the full and modified retrospective approaches. We expect to utilize the modified retrospective approach. Using this approach, the guidance shall be applied to transactions outstanding as of the beginning of the fiscal year in which the amendment is adopted. The final rule is effective for fiscal years beginning after December 15, 2021. Early adoption is permitted for fiscal years beginning after December 15, 2020, including interim periods within those fiscal years. We are continuing to evaluate the impact of this update to our consolidated financial statements and would expect to adopt at the required adoption date of January 1, 2022.
NOTE 2 - SUPPLEMENTARY FINANCIAL STATEMENT INFORMATION
Allowance for Credit Losses
The following is a roll-forward of our allowance for credit losses associated with Accounts receivable, net:
| | | | | | | | | | | |
| (In Millions) |
| 2020 | | 2019 |
| Allowance for credit losses as of January 1 | $ | 0 | | | $ | 0 | |
| Increase in allowance | (5) | | | 0 | |
| Allowance for credit losses as of December 31 | $ | (5) | | | $ | 0 | |
Inventories
The following table presents the detail of our Inventories in the Statements of Consolidated Financial Position:
| | | | | | | | | | | |
| (In Millions) |
| Year Ended December 31, |
| 2020 | | 2019 |
| Product inventories | | | |
| Finished and semi-finished goods | $ | 2,125 | | | $ | 114 | |
| Work-in-process | 0 | | | 69 | |
| Raw materials | 1,431 | | | 9 | |
| Total product inventories | 3,556 | | | 192 | |
| Manufacturing supplies and critical spares | 272 | | | 125 | |
| Inventories | $ | 3,828 | | | $ | 317 | |
The excess of current cost over LIFO cost of iron ore inventories was $104 million and $101 million at December 31, 2020 and 2019, respectively. As of December 31, 2020, the product inventory balance for iron ore inventories decreased, resulting in the liquidation of a LIFO layer. The effect of the inventory reduction was an increase in Cost of goods sold of $30 million in the Statements of Consolidated Operations for the year ended December 31, 2020. As of December 31, 2019, the product inventory balance for iron ore inventories increased, resulting in a LIFO increment in 2019. The effect of the inventory build was an increase in Inventories of $34 million in the Statements of Consolidated Financial Position for the year ended December 31, 2019.
The allowance for obsolete and surplus items in supplies and other inventories was $13 million at both December 31, 2020 and 2019.
Cash Flow Information
A reconciliation of capital additions to cash paid for capital expenditures is as follows:
| | | | | | | | | | | | | | | | | |
| (In Millions) |
| Year Ended December 31, |
| 2020 | | 2019 | | 2018 |
| Capital additions | $ | 483 | | | $ | 690 | | | $ | 395 | |
| Less: | | | | | |
| Non-cash accruals | (86) | | | 15 | | | 94 | |
| Right-of-use assets - finance leases | 44 | | | 29 | | | 8 | |
| Grants | 0 | | | (10) | | | (3) | |
| Cash paid for capital expenditures including deposits | $ | 525 | | | $ | 656 | | | $ | 296 | |
Cash payments (receipts) for interest and income taxes are as follows:
| | | | | | | | | | | | | | | | | |
| (In Millions) |
| 2020 | | 2019 | | 2018 |
| Taxes paid on income | $ | 5 | | | $ | 0 | | | $ | 3 | |
| Income tax refunds | (120) | | | (118) | | | (11) | |
Interest paid on debt obligations net of capitalized interest1 | 170 | | | 98 | | | 106 | |
| | | | | |
1 Capitalized interest was $53 million, $25 million and $7 million for the years ended December 31, 2020, 2019 and 2018, respectively. |
Non-Cash Investing and Financing Activities
| | | | | | | | | | | | | | | | | |
| (In Millions) |
| 2020 | | 2019 | | 2018 |
| Fair value of common shares issued as part of consideration in connection with AM USA Transaction | $ | 990 | | | $ | 0 | | | $ | 0 | |
| Fair value of Series B Participating Redeemable Preferred Stock issued as part of consideration in connection with AM USA Transaction | 738 | | | 0 | | | 0 | |
| Fair value of settlement of a pre-existing relationship as part of consideration in connection with AM USA Transaction | 237 | | | 0 | | | 0 | |
| Fair value of common shares issued as consideration in connection with AK Steel Merger | 618 | | | 0 | | | 0 | |
| Fair value of equity awards assumed in connection with AK Steel Merger | 4 | | | 0 | | | 0 | |
Discontinued Operations
We had income from discontinued operations, net of tax of $88 million for the year ended December 31, 2018. During 2018, we sold all of the assets of our Asia Pacific Iron Ore mining operations, which had operating losses of $105 million for the year ended December 31, 2018. Additionally, as a result of the liquidation of the net assets of our Australian subsidiaries, the historical changes in foreign currency translation recorded in Accumulated other comprehensive loss totaling $228 million was reclassified and recognized as a gain in Income (loss) from discontinued operations, net of tax.
NOTE 3 - ACQUISITIONS
In 2020, we acquired two major steelmakers, AK Steel and ArcelorMittal USA, vertically integrating our legacy iron ore business with steel production. Our fully-integrated portfolio includes custom-made pellets and HBI; flat-rolled carbon steel, stainless, electrical, plate, tinplate and long steel products; as well as carbon and stainless steel tubing, hot and cold stamping and tooling. The AK Steel Merger combined Cliffs, a producer of iron ore pellets, with AK Steel, a producer of flat-rolled carbon, stainless and electrical steel products, to create a vertically integrated producer of value-added iron ore and steel products. The AM USA Transaction transformed us into a fully-integrated steel enterprise with the size and scale to achieve improved through-the-cycle margins.
We now have a presence across the entire steel manufacturing process, from mining to pelletizing to the development and production of finished high value steel products. The combination is expected to create significant opportunities to generate additional value from market trends across the entire steel value chain and enable more consistent, predictable performance through normal market cycles.
Acquisition of ArcelorMittal USA
Overview
On December 9, 2020, pursuant to the terms of the AM USA Transaction Agreement, we purchased ArcelorMittal USA from ArcelorMittal. In connection with the closing of the AM USA Transaction, as contemplated by the terms of the AM USA Transaction Agreement, ArcelorMittal’s former joint venture partner in Kote and Tek exercised its put right pursuant to the terms of the Kote and Tek joint venture agreements. As a result, we purchased all of such joint venture partner’s interests in Kote and Tek. Following the closing of the AM USA Transaction, we own 100% of the interests in Kote and Tek.
Following the acquisition, the operating results of ArcelorMittal USA are included in our consolidated financial statements. For the period subsequent to the acquisition (December 9, 2020 through December 31, 2020), ArcelorMittal USA generated Revenues of $446 million and a loss of $40 million included within Net income (loss) attributable to Cliffs shareholders, which included $21 million related to amortization of the fair value inventory step-up.
Additionally, we incurred acquisition-related costs excluding severance costs of $26 million for the year endedDecember 31, 2020, which were recorded in Acquisition-related costs on the Statements of Consolidated Operations.
The AM USA Transaction was accounted for under the acquisition method of accounting for business combinations.
The fair value of the total purchase consideration was determined as follows:
| | | | | |
| (In Millions) |
| Fair value of Cliffs common shares issued | $ | 990 | |
| Fair value of Series B Participating Redeemable Preferred Stock issued | 738 | |
| Fair value of settlement of a pre-existing relationship | 237 | |
| Cash consideration (subject to customary working capital adjustments) | 631 | |
| Total purchase consideration | $ | 2,596 | |
The fair value of Cliffs common shares issued is calculated as follows:
| | | | | |
| Number of Cliffs common shares issued | 78,186,671 |
| Closing price of Cliffs common share as of December 9, 2020 | $ | 12.66 | |
| Fair value of Cliffs common shares issued (in millions) | $ | 990 | |
The fair value of Cliffs Series B Participating Redeemable Preferred Stock issued is calculated as follows:
| | | | | |
| Number of Cliffs Series B Participating Redeemable Preferred Stock issued | 583,273 | |
| Redemption price as of December 9, 2020 | $ | 1,266 | |
| Fair value of Cliffs Series B Participating Redeemable Preferred Stock issued (in millions) | $ | 738 | |
The fair value of the estimated cash consideration is comprised of the following:
| | | | | |
| (In Millions) |
| Cash consideration pursuant to the AM USA Transaction Agreement | $ | 505 | |
| Cash consideration for purchase of the remaining JV partners' interest of Kote and Tek | 182 | |
| Estimated total cash consideration receivable | (56) | |
| Total estimated cash consideration | $ | 631 | |
The cash portion of the purchase price is subject to customary working capital adjustments.
The fair value of the settlement of a pre-existing relationship is comprised of the following:
| | | | | |
| (In Millions) |
| Accounts receivable | $ | 97 | |
| Freestanding derivative asset from customer supply agreement | 140 | |
| Total fair value of settlement of a pre-existing relationship | $ | 237 | |
Valuation Assumption and Preliminary Purchase Price Allocation
We estimated fair values at December 9, 2020 for the preliminary allocation of consideration to the net tangible and intangible assets acquired and liabilities assumed in connection with the AM USA Transaction. During the measurement period, we will continue to obtain information to assist in finalizing the fair value of assets acquired and liabilities assumed, which may differ materially from these preliminary estimates. If we determine any measurement period adjustments are material, we will apply those adjustments, including any related impacts to net income, in the reporting period in which the adjustments are determined. We are in the process of conducting a valuation of the assets acquired and liabilities assumed related to the AM USA Transaction, most notably, inventories, personal and real property, mineral reserves, leases, investments, deferred taxes, asset retirement obligations, pension and OPEB liabilities, and the final allocation will be made when completed, including the result of any identified goodwill. Accordingly, the provisional measurements noted below are preliminary and subject to modification in the future.
The preliminary purchase price allocation to assets acquired and liabilities assumed in the AM USA Transaction was:
| | | | | |
| (In Millions) |
| Cash and cash equivalents | $ | 35 | |
| Accounts receivable, net | 349 | |
| Inventories | 2,115 | |
| Income tax receivable, current | 12 | |
| Other current assets | 22 | |
| Property, plant and equipment | 4,017 | |
| Other non-current assets | 158 | |
| Accounts payable | (758) | |
| Accrued employment costs | (271) | |
| State and local taxes | (76) | |
| Pension and OPEB liabilities, current | (109) | |
| Other current liabilities | (322) | |
| Pension and OPEB liabilities, non-current | (3,195) | |
| Other non-current liabilities | (598) | |
| Noncontrolling interest | (13) | |
| Net identifiable assets acquired | 1,366 | |
| Goodwill | 1,230 | |
| Total net assets acquired | $ | 2,596 | |
The goodwill resulting from the acquisition of ArcelorMittal USA primarily represents the growth opportunities in the automotive, construction, appliances, infrastructure and machinery and equipment markets, as well as any synergistic benefits to be realized from the AM USA Transaction and was assigned to our flat steel operations within our Steelmaking segment. Goodwill is expected to be deductible for U.S. federal income tax purposes.
Acquisition of AK Steel
Overview
On March 13, 2020, pursuant to the AK Steel Merger Agreement, we completed the acquisition of AK Steel, in which we were the acquirer. As a result of the AK Steel Merger, each share of AK Steel common stock issued and outstanding immediately prior to the effective time of the AK Steel Merger (other than excluded shares) was converted into the right to receive 0.400 Cliffs common shares and, if applicable, cash in lieu of any fractional Cliffs common shares.
Following the acquisition, the operating results of AK Steel are included in our consolidated financial statements. For the period subsequent to the acquisition (March 13, 2020 through December 31, 2020), AK Steel generated Revenues of $3,573 million and a loss of $302 million included within Net income (loss) attributable to Cliffs shareholders, which included $74 million and $35 million related to amortization of the fair value inventory step-up and severance costs, respectively.
Additionally, we incurred acquisition-related costs excluding severance costs of $26 million for the year endedDecember 31, 2020, which were recorded in Acquisition-related costs on the Statements of Consolidated Operations.
Refer to NOTE 8 - DEBT AND CREDIT FACILITIES for information regarding debt transactions executed in connection with the AK Steel Merger.
The AK Steel Merger was accounted for under the acquisition method of accounting for business combinations. The acquisition date fair value of the consideration transferred totaled $1,535 million. The following tables summarize the consideration paid for AK Steel and the estimated fair values of the assets acquired and liabilities assumed at the acquisition date.
The fair value of the total purchase consideration was determined as follows:
| | | | | |
| (In Millions) |
| Fair value of AK Steel debt | $ | 914 | |
| Fair value of Cliffs common shares issued for AK Steel outstanding common stock | 618 | |
| Other | 3 | |
| Total purchase consideration | $ | 1,535 | |
The fair value of Cliffs common shares issued for outstanding shares of AK Steel common stock and with respect to Cliffs common shares underlying converted AK Steel equity awards that vested upon completion of the AK Steel Merger is calculated as follows:
| | | | | |
| (In Millions, Except Per Share Amounts) |
| Number of shares of AK Steel common stock issued and outstanding | 317 | |
| Exchange ratio | 0.400 | |
| Shares of Cliffs common shares issued to AK Steel stockholders | 127 | |
| Price per share of Cliffs common shares | $ | 4.87 | |
| Fair value of Cliffs common shares issued for outstanding AK Steel common stock | $ | 618 | |
The fair value of AK Steel's debt included in the consideration is calculated as follows:
| | | | | |
| (In Millions) |
| Credit Facility | $ | 590 | |
| 7.50% Senior Secured Notes due July 2023 | 324 | |
| Fair value of debt included in consideration | $ | 914 | |
Valuation Assumption and Preliminary Purchase Price Allocation
We estimated fair values at March 13, 2020 for the preliminary allocation of consideration to the net tangible and intangible assets acquired and liabilities assumed in connection with the AK Steel Merger. During the measurement period, we will continue to obtain information to assist in finalizing the fair value of assets acquired and liabilities assumed, which may differ materially from these preliminary estimates. If we determine any measurement period adjustments are material, we will apply those adjustments, including any related impacts to net income, in the reporting period in which the adjustments are determined. We are in the process of conducting a valuation of the assets acquired and liabilities assumed related to the AK Steel Merger, most notably, personal and real property, leases, deferred taxes, asset retirement obligations and intangible assets and liabilities, and the final allocation will be made when completed, including the result of any identified goodwill. Accordingly, the provisional measurements noted below are preliminary and subject to modification in the future.
The preliminary purchase price allocation to assets acquired and liabilities assumed in the AK Steel Merger was:
| | | | | | | | | | | | | | | | | |
| (In Millions) |
| Initial Allocation of Consideration | | Measurement Period Adjustments | | Updated Allocation |
| Cash and cash equivalents | $ | 38 | | | $ | 1 | | | $ | 39 | |
| Accounts receivable, net | 666 | | | (2) | | | 664 | |
| Inventories | 1,563 | | | (243) | | | 1,320 | |
| Income tax receivable, current | 3 | | | 0 | | | 3 | |
| Other current assets | 65 | | | (16) | | | 49 | |
| Property, plant and equipment | 2,184 | | | 128 | | | 2,312 | |
| Deferred income taxes | 0 | | | 30 | | | 30 | |
| Other non-current assets | 475 | | | (3) | | | 472 | |
| Accounts payable | (636) | | | (8) | | | (644) | |
| Accrued employment costs | (94) | | | 1 | | | (93) | |
| State and local taxes | (35) | | | 4 | | | (31) | |
| Pension and OPEB liabilities, current | (75) | | | (3) | | | (78) | |
| Other current liabilities | (201) | | | 5 | | | (196) | |
| Long-term debt | (1,179) | | | 0 | | | (1,179) | |
| Pension and OPEB liabilities, non-current | (873) | | | 2 | | | (871) | |
| Other non-current liabilities | (507) | | | 72 | | | (435) | |
| Noncontrolling interest | 0 | | | (1) | | | (1) | |
| Net identifiable assets acquired | 1,394 | | | (33) | | | 1,361 | |
| Goodwill | 141 | | | 33 | | | 174 | |
| Total net assets acquired | $ | 1,535 | | | $ | 0 | | | $ | 1,535 | |
During the period subsequent to the AK Steel Merger, we made certain measurement period adjustments to the acquired assets and liabilities assumed due to clarification of information utilized to determine fair value during the measurement period. The Inventories measurement period adjustments of $243 million resulted in a favorable impact of $8 million to Cost of goods sold for the year ended December 31, 2020.
The goodwill resulting from the acquisition of AK Steel was assigned to our downstream Tubular and Tooling and Stamping operating segments. Goodwill is calculated as the excess of the purchase price over the net identifiable assets recognized and primarily represents the growth opportunities in light weighting solutions to automotive customers, as well as any synergistic benefits to be realized. Goodwill from the AK Steel Merger is not expected be deductible for income tax purposes.
The preliminary purchase price allocated to identifiable intangible assets and liabilities acquired was:
| | | | | | | | | | | |
| (In Millions) | | Weighted Average Life (In Years) |
| Intangible assets: | | | |
| Customer relationships | $ | 77 | | | 18 |
| Developed technology | 60 | | | 17 |
| Trade names and trademarks | 11 | | | 10 |
| Total identifiable intangible assets | $ | 148 | | | 17 |
| Intangible liabilities: | | | |
| Above-market supply contracts | $ | (71) | | | 12 |
The above-market supply contracts relate to the long-term coke and energy supply agreements with SunCoke Energy, which includes SunCoke Middletown, a consolidated VIE. Refer to NOTE 19 - VARIABLE INTEREST ENTITIES for further information.
Pro Forma Results
The following table provides unaudited pro forma financial information, prepared in accordance with Topic 805, for the years ended December 31, 2020 and 2019, as if ArcelorMittal USA and AK Steel had been acquired as of January 1, 2019:
| | | | | | | | | | | |
| (In Millions) |
| Year Ended December 31, |
| 2020 | | 2019 |
| Revenues | $ | 12,837 | | | $ | 17,163 | |
| Net income (loss) attributable to Cliffs shareholders | (520) | | | (11) | |
The unaudited pro forma financial information has been calculated after applying our accounting policies and adjusting the historical results with pro forma adjustments, net of tax, that assume the Acquisitions occurred on January 1, 2019. Significant pro forma adjustments include the following:
1.The elimination of intercompany revenues between Cliffs and ArcelorMittal USA and AK Steel of $844 million and $1,499 million for the years ended December 31, 2020 and 2019, respectively.
2.The 2020 pro forma net loss was adjusted to exclude $96 million of non-recurring inventory acquisition accounting adjustments incurred during the year ended December 31, 2020. The 2019 pro forma net loss was adjusted to include $362 million of non-recurring inventory acquisition accounting adjustments for the year ended December 31, 2019.
3.The elimination of non-recurring transaction costs incurred by Cliffs, AK Steel and ArcelorMittal USA in connection with the Acquisitions were $93 million for the year ended December 31, 2020. The 2019 pro forma net loss was adjusted to include $93 million of non-recurring transaction cost adjustments for the year ended December 31, 2019.
4.The 2020 pro forma net loss was adjusted to exclude restructuring costs of $1,820 million of non-recurring costs incurred by ArcelorMittal USA prior to the AM USA Transaction.
5.The 2020 and 2019 pro forma net losses were adjusted to exclude $140 million and $129 million for the years ended December 31, 2020 and 2019, respectively, for the impact of reversal of the fees charged for management, financial and legal services under the Industrial Franchise Agreement with the former parent.
6.Total other pro forma adjustments included reduced expenses of $32 million for the year ended December 31, 2020, primarily due to decreased depreciation expense and pension and OPEB expense, offset partially by increased interest and amortization expense.
7.Total other pro forma adjustments included an expense of $76 million for the year ended December 31, 2019, primarily due to increased interest, amortization and pension and OPEB expense, offset partially by decreased depreciation expense.
8.The income tax impact of pro forma transaction adjustments that affect Net income (loss) attributable to Cliffs shareholders at a statutory rate of 24.3% resulted in an increased benefit to Income tax benefit (expense) of $170 million and $117 million for the years ended December 31, 2020 and 2019, respectively.
The unaudited pro forma financial information does not reflect the potential realization of synergies or cost savings, nor does it reflect other costs relating to the integration of the acquired companies. This unaudited pro forma financial information should not be considered indicative of the results that would have actually occurred if the Acquisitions had been consummated on January 1, 2019, nor are they indicative of future results.
NOTE 4 - REVENUES
We generate our revenue through product sales, in which shipping terms generally indicate when we have fulfilled our performance obligations and transferred control of products to our customer. Our revenue transactions consist of a single performance obligation to transfer promised goods. Our contracts with customers usually define the mechanism for determining the sales price, which is generally fixed upon transfer of control, but the contracts generally do not impose a specific quantity on either party. Quantities to be delivered to the customer are generally determined at a point near the date of delivery through purchase orders or other written instructions we receive from the customer. Spot market sales are made through purchase orders or other written instructions. We consider our performance obligation to be complete and recognize revenue when control transfers in accordance with shipping terms.
Revenue is measured as the amount of consideration we expect to receive in exchange for transferring product. We reduce the amount of revenue recognized for estimated returns and other customer credits, such as discounts and volume rebates, based on the expected value to be realized. Payment terms are consistent with terms standard to the markets we serve. Sales taxes collected from customers are excluded from revenues.
Prior to the AM USA Transaction, we had a supply agreement with ArcelorMittal USA, which included supplemental revenue or refunds based on the HRC price in the year the iron ore was consumed in ArcelorMittal USA's blast furnaces. As control transferred prior to consumption, the supplemental revenue was recorded in accordance with Topic 815. All sales occurring subsequent to the AM USA Transaction are intercompany and eliminated in consolidation. Included within Revenues related to Topic 815 for the supplemental revenue portion of the supply agreement is derivative revenue of $122 million, $78 million and $426 million for the years ended December 31, 2020, 2019 and 2018, respectively.
The following table represents our Revenues by market:
| | | | | | | | | | | | | | | | | |
| (In Millions) |
| Year Ended December 31, |
| 2020 | | 2019 | | 2018 |
| Steelmaking: | | | | | |
| Automotive | $ | 2,062 | | | $ | 0 | | | $ | 0 | |
| Infrastructure and manufacturing | 784 | | | 0 | | | 0 | |
| Distributors and converters | 696 | | | 0 | | | 0 | |
Steel producers1 | 1,423 | | 1,990 | | | 2,332 | |
| Total steelmaking | 4,965 | | | 1,990 | | | 2,332 | |
| Other Businesses: | | | | | |
| Automotive | 329 | | | 0 | | | 0 | |
| Infrastructure and manufacturing | 34 | | | 0 | | | 0 | |
| Distributors and converters | 26 | | | 0 | | | 0 | |
| Total Other Businesses | 389 | | | 0 | | | 0 | |
| Total revenues | $ | 5,354 | | | $ | 1,990 | | | $ | 2,332 | |
| | | | | |
1 Includes Realization of deferred revenue of $35 million for the year ended December 31, 2020. |
The following table represents our consolidated Revenues by product line:
| | | | | | | | | | | | | | | | | | | | | | | | | | | | | | | | | | | |
| (Dollars In Millions, Sales Volumes in Thousands) |
| Year Ended December 31, |
| 2020 | | 2019 | | 2018 |
| Revenue | | Volume1 | | Revenue | | Volume1 | | Revenue | | Volume1 |
| Steelmaking: | | | | | | | | | | | |
| Hot-rolled steel | $ | 386 | | | 633 | | | $ | 0 | | | 0 | | | $ | 0 | | | 0 | |
| Cold-rolled steel | 490 | | | 682 | | | 0 | | | 0 | | | 0 | | | 0 | |
| Coated steel | 1,747 | | | 1,911 | | | 0 | | | 0 | | | 0 | | | 0 | |
| Stainless and electrical steel | 868 | | | 416 | | | 0 | | | 0 | | | 0 | | | 0 | |
| Other steel products | 92 | | | 141 | | | 0 | | | 0 | | | 0 | | | 0 | |
Iron products2 | 1,335 | | | 11,707 | | | 1,990 | | | 18,583 | | | 2,332 | | | 20,563 | |
| Other | 47 | | | N/A | | 0 | | | — | | | 0 | | | — | |
| Total steelmaking | 4,965 | | | | | 1,990 | | | | | 2,332 | | | |
| Other Businesses: | | | | | | | | | | | |
| Other | 389 | | | N/A | | 0 | | | N/A | | 0 | | | N/A |
| Total revenues | $ | 5,354 | | | | | $ | 1,990 | | | | | $ | 2,332 | | | |
| | | | | | | | | | | |
1 Carbon steel products, stainless and electrical steel and plate steel volumes are stated in net tons. Iron product volumes are stated in long tons. |
2 Includes Realization of deferred revenue of $35 million for the year ended December 31, 2020. |
Deferred Revenue
The table below summarizes our deferred revenue balances:
| | | | | | | | | | | | | | | | | | | | | | | |
| (In Millions) |
| Deferred Revenue (Current) | | Deferred Revenue (Long-Term) |
| 2020 | | 2019 | | 2020 | | 2019 |
| Opening balance as of January 1 | $ | 22 | | | $ | 21 | | | $ | 26 | | | $ | 39 | |
| Net increase (decrease) | (15) | | | 1 | | | (26) | | | (13) | |
| Closing balance as of December 31 | $ | 7 | | | $ | 22 | | | $ | 0 | | | $ | 26 | |
Prior to the AK Steel Merger, our iron ore pellet sales agreement with Severstal Dearborn, LLC, subsequently assumed by AK Steel, required supplemental payments to be paid by the customer during the period from 2009 through 2013. Installment amounts received under this arrangement in excess of sales were classified as deferred revenue in the Statements of Consolidated Financial Position upon receipt of payment and the revenue was recognized over the term of the supply agreement, which had extended until 2022, in equal annual installments. As a result of the termination of that iron ore pellet sales agreement, we realized $35 million of deferred revenue, which was recognized within Realization of deferred revenue in the Statements of Consolidated Operations during the year ended December 31, 2020.
We have certain other sales agreements that require customers to pay in advance. Payments received pursuant to these agreements prior to revenue being recognized are recorded as deferred revenue in Other current liabilities.
NOTE 35 - SEGMENT REPORTING
In alignment with our strategic goals, our Company’s continuing operationsWe are vertically integrated from the mining of iron ore and coal; to production of metallics and coke; through iron making, steelmaking, rolling, finishing; and to downstream tubing, stamping and tooling. We are organized and managed in two business units according tointo 4 operating segments based on our differentiated products. The former 'U.S. Iron Ore' segment is now 'Miningproducts - Steelmaking, Tubular, Tooling and Pelletizing.'Stamping, and European Operations. Our previous Mining and Pelletizing segment is a major supplier ofincluded within the Steelmaking operating segment as iron ore pellets toare a primary raw material for our steel products. We have 1 reportable segment - Steelmaking. The operating segment results of our Tubular, Tooling and Stamping, and European Operations that do not constitute reportable segments are combined and disclosed in the Other Businesses category. Our Steelmaking
segment is the largest flat-rolled steel producer supported by being the largest iron ore pellet producer in North AmericanAmerica, primarily serving the automotive, infrastructure and manufacturing, and distributors and converters markets. Our Other Businesses primarily include the operating segments that provide customer solutions with carbon and stainless steel industry from our minestubing products, advanced-engineered solutions, tool design and pellet plants locatedbuild, hot- and cold-stamped steel components, and complex assemblies. All intersegment transactions were eliminated in Michigan and Minnesota. In addition, the Toledo HBI business will be categorized under the segment 'Metallics.' In our Metallics segment, we are currently constructing an HBI production plant in Toledo, Ohio. We expect to complete construction and begin production in 2020.consolidation.
We evaluate performance based on sales margin, defined as revenues less cost of goods sold andan operating expenses identifiable to each segment. Additionally, we evaluate performance on a segment basis, as well as a consolidated basis, based on Adjusted EBITDA, which is a non-GAAP measure. This measure is used by management, investors, lenders and other external users of our financial statements to assess our operating performance and to compare operating performance to other companies in the steel industry. In addition, management believes Adjusted EBITDA. These measures allow managementEBITDA is a useful measure to assess the earnings power of the business without the impact of capital structure and investorscan be used to
focus on assess our ability to service our debt and fund future capital expenditures in the business.
Our results by segment are as well as illustrate how the business is performing. Additionally, EBITDA and Adjusted EBITDA assist management and investors in their analysis and forecasting as these measures approximate the cash flows associated with operational earnings.follows:
| | | | | | | | | | | | | | | | | |
| (In Millions) |
| Year Ended December 31, |
| 2020 | | 2019 | | 2018 |
| Revenues: | | | | | |
Steelmaking1 | $ | 4,965 | | | $ | 1,990 | | | $ | 2,332 | |
| Other Businesses | 389 | | | 0 | | | 0 | |
| Total revenues | $ | 5,354 | | | $ | 1,990 | | | $ | 2,332 | |
| | | | | |
| Adjusted EBITDA: | | | | | |
| Steelmaking | $ | 433 | | | $ | 636 | | | $ | 872 | |
| Other Businesses | 47 | | | 0 | | | 0 | |
| Corporate and eliminations | (127) | | | (111) | | | (106) | |
| Total Adjusted EBITDA | $ | 353 | | | $ | 525 | | | $ | 766 | |
| | | | | |
1 Includes Realization of deferred revenue of $35 million for the year ended December 31, 2020. |
The following tables present a summary of our reportable segments, includingtable provides a reconciliation of segment sales marginour consolidated Net income (loss) to Income from continuing operations before income taxestotal Adjusted EBITDA:
| | | | | | | | | | | | | | | | | |
| (In Millions) |
| Year Ended December 31, |
| 2020 | | 2019 | | 2018 |
| Net income (loss) | $ | (81) | | | $ | 293 | | | $ | 1,128 | |
| Less: | | | | | |
| Interest expense, net | (238) | | | (101) | | | (121) | |
| Income tax benefit (expense) | 111 | | | (18) | | | 460 | |
| Depreciation, depletion and amortization | (308) | | | (85) | | | (89) | |
| 354 | | | 497 | | | 878 | |
| Less: | | | | | |
EBITDA from noncontrolling interests1 | 56 | | | 0 | | | 0 | |
| Gain (loss) on extinguishment of debt | 130 | | | (18) | | | (7) | |
| Severance costs | (38) | | | (2) | | | 0 | |
| Acquisition-related costs excluding severance costs | (52) | | | (7) | | | 0 | |
| Amortization of inventory step-up | (96) | | | 0 | | | 0 | |
| Impact of discontinued operations | 1 | | | (1) | | | 121 | |
| Foreign exchange remeasurement | 0 | | | 0 | | | (1) | |
| Impairment of other long-lived assets | 0 | | | 0 | | | (1) | |
| Total Adjusted EBITDA | $ | 353 | | | $ | 525 | | | $ | 766 | |
| | | | | |
1 EBITDA of noncontrolling interests includes $41 million for income and $15 million for depreciation, depletion and amortization for the year ended December 31, 2020. |
The following table summarizes our depreciation, depletion and a reconciliationamortization and capital additions by segment:
| | | | | | | | | | | | | | | | | |
| (In Millions) |
| Year Ended December 31, |
| 2020 | | 2019 | | 2018 |
| Depreciation, depletion and amortization: | | | | | |
| Steelmaking | $ | 276 | | | $ | 80 | | | $ | 68 | |
| Other Businesses | 27 | | | 0 | | | 0 | |
| Corporate | 5 | | | 5 | | | 6 | |
| Total depreciation, depletion and amortization | $ | 308 | | | $ | 85 | | | $ | 74 | |
| | | | | |
Capital additions1: | | | | | |
| Steelmaking | $ | 436 | | | $ | 687 | | | $ | 393 | |
| Other Businesses | 45 | | | 0 | | | 0 | |
| Corporate | 2 | | | 3 | | | 2 | |
| Total capital additions | $ | 483 | | | $ | 690 | | | $ | 395 | |
| | | | | |
1 Refer to NOTE 2 - SUPPLEMENTARY FINANCIAL STATEMENT INFORMATION for additional information. |
|
| | | | | | | | | | | |
| | |
| | 2018 | | 2017 | 2016 |
| Revenues from product sales and services: | | | | | |
| Mining and Pelletizing | $ | 2,332.4 |
| | $ | 1,866.0 |
| | $ | 1,554.5 |
|
| | | | | | |
| Sales margin: | | | | | |
| Mining and Pelletizing | $ | 809.6 |
| | $ | 467.6 |
| | $ | 280.1 |
|
| Other operating expense | (136.4 | ) | | (77.4 | ) | | (149.4 | ) |
| Other expense | (108.5 | ) | | (282.0 | ) | | (20.3 | ) |
| Income from continuing operations before income taxes | $ | 564.7 |
| | $ | 108.2 |
| | $ | 110.4 |
|
|
| | | | | | | | | | | |
| | (In Millions) |
| | 2018 | | 2017 | | 2016 |
| Net income | $ | 1,128.1 |
| | $ | 363.1 |
| | $ | 199.3 |
|
| Less: | | | | | |
| Interest expense, net | (121.3 | ) |
| (132.0 | ) |
| (200.5 | ) |
| Income tax benefit | 460.3 |
|
| 252.4 |
|
| 12.2 |
|
| Depreciation, depletion and amortization | (89.0 | ) |
| (87.7 | ) |
| (115.4 | ) |
| Total EBITDA | $ | 878.1 |
| | $ | 330.4 |
| | $ | 503.0 |
|
| Less: | | | | | |
| Gain (loss) on extinguishment/restructuring of debt | $ | (6.8 | ) | | $ | (165.4 | ) | | $ | 166.3 |
|
| Impact of discontinued operations | 120.6 |
| | 22.0 |
| | 108.4 |
|
| Foreign exchange remeasurement | (0.9 | ) | | 13.9 |
| | (17.8 | ) |
| Impairment of long-lived assets | (1.1 | ) |
| — |
|
| — |
|
| Total Adjusted EBITDA | $ | 766.3 |
| | $ | 459.9 |
| | $ | 246.1 |
|
| | | | | | |
| EBITDA: | | | | | |
| Mining and Pelletizing | $ | 852.9 |
|
| $ | 534.9 |
|
| $ | 342.4 |
|
| Metallics | (3.3 | ) | | (0.4 | ) | | — |
|
Corporate and Other1 | 28.5 |
|
| (204.1 | ) |
| 160.6 |
|
| Total EBITDA | $ | 878.1 |
| | $ | 330.4 |
| | $ | 503.0 |
|
| | | | | | |
| Adjusted EBITDA: | | | | | |
| Mining and Pelletizing | $ | 875.3 |
| | $ | 559.4 |
| | $ | 359.6 |
|
| Metallics | (3.3 | ) | | (0.4 | ) | | — |
|
| Corporate | (105.7 | ) | | (99.1 | ) | | (113.5 | ) |
| Total Adjusted EBITDA | $ | 766.3 |
| | $ | 459.9 |
| | $ | 246.1 |
|
| | | | | | |
1 Corporate and Other includes activity from discontinued operations. |
|
| | | | | | | | | | | |
| | (In Millions) |
| | 2018 | | 2017 | | 2016 |
| Depreciation, depletion and amortization: | | | | | |
| Mining and Pelletizing | $ | 68.2 |
| | $ | 66.6 |
| | $ | 84.0 |
|
| Corporate | 5.6 |
| | 6.8 |
| | 6.3 |
|
| Total depreciation, depletion and amortization | $ | 73.8 |
| | $ | 73.4 |
| | $ | 90.3 |
|
| | | | | | |
Capital additions1: | | | | | |
| Mining and Pelletizing | $ | 145.0 |
| | $ | 136.8 |
| | $ | 62.2 |
|
| Metallics | 248.1 |
| | 13.7 |
| | — |
|
| Corporate and Other | 1.6 |
| | 2.7 |
| | 6.1 |
|
| Total capital additions | $ | 394.7 |
| | $ | 153.2 |
| | $ | 68.3 |
|
| | | | | | |
1 Includes capital lease additions and non-cash accruals. Refer to NOTE 16 - CASH FLOW INFORMATION. |
A summary ofThe following summarizes our assets by segment is as follows:segment:
| | | | | | | | | | (In Millions) |
| | (In Millions) | | December 31, |
| | December 31,
2018 | | December 31, 2017 | | December 31, 2016 | | 2020 | | 2019 |
| Assets: | | | | | | Assets: | | | |
| Mining and Pelletizing | $ | 1,694.1 |
| | $ | 1,500.6 |
| | $ | 1,372.5 |
| |
| Metallics | 265.9 |
| | 13.4 |
| | — |
| |
| Steelmaking | | Steelmaking | $ | 15,849 | | | $ | 2,557 | |
| Other Businesses | | Other Businesses | 239 | | | 0 | |
| Total segment assets | 1,960.0 |
| | 1,514.0 |
| | 1,372.5 |
| Total segment assets | 16,088 | | | 2,557 | |
| Corporate | 1,557.2 |
| | 1,300.6 |
| | 396.3 |
| Corporate | 683 | | | 947 | |
| Assets of discontinued operations | 12.4 |
| | 138.8 |
| | 155.1 |
| |
| Total assets | $ | 3,529.6 |
| | $ | 2,953.4 |
| | $ | 1,923.9 |
| Total assets | $ | 16,771 | | | $ | 3,504 | |
Included in the consolidated financial statements are the following amounts relating to geographic location:location based on product destination:
| | | | | | | | | | | | | | | | | |
| (In Millions) |
| 2020 | | 2019 | | 2018 |
| Revenues: | | | | | |
| United States | $ | 4,580 | | | $ | 1,505 | | | $ | 1,847 | |
| Canada | 602 | | | 448 | | | 395 | |
| Other countries | 172 | | | 37 | | | 90 | |
| Total revenues | $ | 5,354 | | | $ | 1,990 | | | $ | 2,332 | |
| Property, plant and equipment, net: | | | | | |
| United States | $ | 8,647 | | | $ | 1,929 | | | $ | 1,286 | |
| Canada | 91 | | | 0 | | | 0 | |
| Other countries | 5 | | | 0 | | | 0 | |
| Total property, plant and equipment, net | $ | 8,743 | | | $ | 1,929 | | | $ | 1,286 | |
|
| | | | | | | | | | | |
| | (In Millions) |
| | 2018 | | 2017 | | 2016 |
| Revenues from product sales and services: | | | | | |
| United States | $ | 1,847.3 |
| | $ | 1,504.5 |
| | $ | 1,236.2 |
|
| Canada | 395.1 |
| | 206.2 |
| | 267.1 |
|
| Other countries | 90.0 |
| | 155.3 |
| | 51.2 |
|
| Total revenues from product sales and services | $ | 2,332.4 |
| | $ | 1,866.0 |
| | $ | 1,554.5 |
|
| Property, plant and equipment, net: | | | | | |
| United States | $ | 1,286.0 |
| | $ | 1,033.8 |
| | $ | 961.0 |
|
Concentrations in Revenue
In 2018 and 2017, threecustomers individually accounted for more than 10% of our consolidated product revenue and in 2016, two customers individually accounted for more than 10% of our consolidated product revenue. Total product revenue from those customers represents $2.1 billion, $1.5 billion and $1.1 billion of our total consolidated product revenue in 2018, 2017 and 2016, respectively.
The following table represents the percentage of our total Revenues from product sales and services contributed by each category of products and services:
|
| | | | | | | | | |
| | | 2018 | | 2017 | | 2016 |
| Revenue category: | | | | | | |
| Product | | 93 | % | | 88 | % | | 89 | % |
| Freight and venture partners’ cost reimbursements | | 7 | % | | 12 | % | | 11 | % |
| Total revenues from product sales and services | | 100 | % | | 100 | % | | 100 | % |
NOTE 4 - INVENTORIES
The following table presents the detail of our Inventories in the Statements of Consolidated Financial Position:
|
| | | | | | | | |
| | | (In Millions) |
| | | December 31, |
| | | 2018 | | 2017 |
| Finished Goods | | $ | 77.8 |
| | $ | 127.1 |
|
| Work-in-Process | | 10.1 |
| | 11.3 |
|
| Total Inventories | | $ | 87.9 |
| | $ | 138.4 |
|
The excess of current cost over LIFO cost of iron ore inventories was $95.6 million and $96.2 million at December 31, 2018 and 2017, respectively. As of December 31, 2018, the product inventory balance for the Mining and Pelletizing segment declined, resulting in the liquidation of a LIFO layer in 2018. The effect of the inventory reduction was a decrease in Cost of goods sold and operating expenses of $0.2 million in the Statements of Consolidated Operations for the year ended December 31, 2018. As of December 31, 2017, the product inventory balance for the Mining and Pelletizing segment increased, resulting in a LIFO increment in 2017. The effect of the inventory build was an increase in Inventories of $6.2 million in the Statements of Consolidated Financial Position for the year ended December 31, 2017.
NOTE 56 - PROPERTY, PLANT AND EQUIPMENT
The following table indicates the carrying value of each of the major classes of our consolidated depreciable assets:
|
| | | | | | | |
| | (In Millions) |
| | December 31, |
| | 2018 | | 2017 |
| Land rights and mineral rights | $ | 549.6 |
| | $ | 549.6 |
|
| Office and information technology | 70.0 |
| | 65.8 |
|
| Buildings | 87.2 |
| | 85.2 |
|
| Mining equipment | 548.5 |
| | 533.9 |
|
| Processing equipment | 645.8 |
| | 610.9 |
|
| Electric power facilities | 58.7 |
| | 56.9 |
|
| Land improvements | 23.8 |
| | 23.7 |
|
| Asset retirement obligation | 14.8 |
| | 16.9 |
|
| Other | 25.2 |
| | 25.2 |
|
| Construction-in-progress | 284.8 |
| | 32.6 |
|
| | 2,308.4 |
| | 2,000.7 |
|
| Allowance for depreciation and depletion | (1,022.4 | ) | | (966.9 | ) |
| | $ | 1,286.0 |
| | $ | 1,033.8 |
|
| | | | | | | | | | | |
| (In Millions) |
| December 31, |
| 2020 | | 2019 |
| Land, land improvements, and mineral rights | $ | 1,213 | | | $ | 582 | |
| Buildings | 703 | | | 158 | |
| Equipment | 6,786 | | | 1,456 | |
| Other | 151 | | | 101 | |
| Construction in progress | 1,364 | | | 730 | |
Total property, plant and equipment1 | 10,217 | | | 3,027 | |
| Allowance for depreciation and depletion | (1,474) | | | (1,098) | |
| Property, plant, and equipment, net | $ | 8,743 | | | $ | 1,929 | |
| | | |
1 Includes right-of-use assets related to finance leases of $361 million and $49 million as of December 31, 2020 and 2019, respectively. |
We recorded depreciation expense of $65.6$298 million, $65.8$77 million and $84.0$66 million in the Statements of Consolidated Operations for the years ended December 31, 2020, 2019 and 2018, 2017 and 2016, respectively.
We recorded capitalized interest into property, plant and equipment of $6.5$53 million, into construction-in-progress$25 million and $7 million during the yearyears ended December 31, 2018.2020, 2019 and 2018, respectively.
The net book value of the mineral and land rights and mineral rights isare as follows:follows:
| | | | | | | | | | | |
| (In Millions) |
| December 31, |
| 2020 | | 2019 |
| Mineral rights: | | | |
| Cost | $ | 773 | | | $ | 537 | |
| Depletion | (142) | | | (134) | |
| Net mineral rights | $ | 631 | | | $ | 403 | |
| | | |
| Land rights | $ | 361 | | | $ | 12 | |
|
| | | | | | | |
| | (In Millions) |
| | December 31, |
| | 2018 | | 2017 |
| Land rights | $ | 12.4 |
| | $ | 12.4 |
|
| Mineral rights: |
| |
|
| Cost | $ | 537.2 |
| | $ | 537.2 |
|
| Depletion | (126.5 | ) | | (119.1 | ) |
| Net mineral rights | $ | 410.7 |
| | $ | 418.1 |
|
We recorded depletion expense of $7.4$8 million,, $6.8 $8 million and $3.8$7 million in the Statements of Consolidated Operations for the years ended December 31, 2020, 2019, and 2018, 2017respectively.
NOTE 7 - GOODWILL AND INTANGIBLE ASSETS AND LIABILITIES
Goodwill
The following is a summary of goodwill by segment:
| | | | | | | | | | | |
| (In Millions) |
| December 31, |
| 2020 | | 2019 |
| Steelmaking | $ | 1,232 | | | $ | 2 | |
| Other Businesses | 174 | | | 0 | |
| Total goodwill | $ | 1,406 | | | $ | 2 | |
The increase in the balance of goodwill in our Steelmaking segment as of December 31, 2020, compared to December 31, 2019, is due to the preliminary assignment of $1,230 million to Goodwill in 2020 based on the preliminary purchase price allocation for the acquisition of ArcelorMittal USA. The increase in the balance of goodwill for our Other Businesses as of December 31, 2020, compared to December 31, 2019, is due to the preliminary assignment of $174 million to Goodwill in 2020 based on the preliminary purchase price allocation for the acquisition of AK Steel, which was attributable to our Tubular and 2016,Tooling and Stamping operating segments.
Intangible Assets and Liabilities
The following is a summary of our intangible assets and liabilities:
| | | | | | | | | | | | | | | | | | | | | | | |
| | | (In Millions) |
| Classification1 | | Gross Amount | | Accumulated Amortization | | Net Amount |
| As of December 31, 2020 | | | | | | | |
| Intangible assets: | | | | | | | |
| Customer relationships | Other non-current assets | | $ | 77 | | | $ | (3) | | | $ | 74 | |
| Technology | Other non-current assets | | 60 | | | (3) | | | 57 | |
| Trade names and trademarks | Other non-current assets | | 11 | | | (1) | | | 10 | |
| Mining permits | Other non-current assets | | 72 | | | (25) | | | 47 | |
| Total intangible assets | | | $ | 220 | | | $ | (32) | | | $ | 188 | |
| Intangible liabilities: | | | | | | | |
| Above-market supply contracts | Other non-current liabilities | | $ | (71) | | | $ | 7 | | | $ | (64) | |
| | | | | | | |
| As of December 31, 2019 | | | | | | | |
| Intangible assets: | | | | | | | |
| Mining permits | Other non-current assets | | $ | 72 | | | $ | (24) | | | $ | 48 | |
1 Amortization of intangible liabilities related to above-market supply contracts and intangible assets related to mining permits is recognized in Cost of goods sold. Amortization of all other intangible assets is recognized in Selling, general and administrative expenses. |
Amortization expense related to intangible assets was $8 million and $1 million for the years ended December 31, 2020 and 2019, respectively. Estimated future amortization expense related to intangible assets is $10 million annually for the years 2021 through 2025.
Income from amortization related to the intangible liabilities was $7 million for the year ended December 31, 2020. Estimated future amortization income related to the intangible liabilities is $8 million annually for the years 2021 through 2025.
NOTE 68 - DEBT AND CREDIT FACILITIES
The following represents a summary of our long-term debt:
| | | | | | | | | | | | | | | | | | | | | | | | | | | | | | | | | | | | | | |
| (In Millions) |
| December 31, 2020 |
| Debt Instrument | | Issuer1 | | Annual Effective Interest Rate | | Total Principal Amount | | Unamortized Debt Issuance Costs | | Unamortized Premiums (Discounts) | | Total Debt |
| Senior Secured Notes: | | | | | | | | | | | | |
| 4.875% 2024 Senior Secured Notes | | Cliffs | | 5.00% | | $ | 395 | | | $ | (3) | | | $ | (1) | | | $ | 391 | |
| 9.875% 2025 Senior Secured Notes | | Cliffs | | 10.57% | | 955 | | | (8) | | | (25) | | | 922 | |
| 6.75% 2026 Senior Secured Notes | | Cliffs | | 6.99% | | 845 | | | (20) | | | (9) | | | 816 | |
| Senior Unsecured Notes: | | | | | | | | | | | | |
| 7.625% 2021 AK Senior Notes | | AK Steel | | 7.33% | | 34 | | | 0 | | | 0 | | | 34 | |
| 7.50% 2023 AK Senior Notes | | AK Steel | | 6.17% | | 13 | | | 0 | | | 0 | | | 13 | |
| 6.375% 2025 Senior Notes | | Cliffs | | 8.11% | | 64 | | | 0 | | | (4) | | | 60 | |
| 6.375% 2025 AK Senior Notes | | AK Steel | | 8.11% | | 29 | | | 0 | | | (2) | | | 27 | |
| 1.50% 2025 Convertible Senior Notes | | Cliffs | | 6.26% | | 296 | | | (4) | | | (49) | | | 243 | |
| 5.75% 2025 Senior Notes | | Cliffs | | 6.01% | | 396 | | | (3) | | | (4) | | | 389 | |
| 7.00% 2027 Senior Notes | | Cliffs | | 9.24% | | 73 | | | 0 | | | (8) | | | 65 | |
| 7.00% 2027 AK Senior Notes | | AK Steel | | 9.24% | | 56 | | | 0 | | | (6) | | | 50 | |
| 5.875% 2027 Senior Notes | | Cliffs | | 6.49% | | 556 | | | (4) | | | (18) | | | 534 | |
| 6.25% 2040 Senior Notes | | Cliffs | | 6.34% | | 263 | | | (2) | | | (3) | | | 258 | |
| IRBs due 2024 to 2028 | | AK Steel | | Various | | 92 | | | 0 | | | 2 | | | 94 | |
EDC Revolving Facility3 | | * | | 3.25% | | 40 | | | — | | | — | | | 18 | |
ABL Facility3 | | Cliffs2 | | 2.15% | | 3,500 | | | — | | | — | | | 1,510 | |
| Total debt | | | | | | | | | | | | 5,424 | |
| Less: current debt | | | | | | | | | | | | 34 | |
| Total long-term debt | | | | | | | | | | | | $ | 5,390 | |
| | | | | | | | | | | | |
| * Our subsidiaries, Fleetwood Metal Industries Inc. and The Electromac Group Inc., are the borrowers under the EDC Revolving Facility. |
1 Unless otherwise noted, references in this column and throughout this Note 8 - DEBT AND CREDIT FACILITIES to "Cliffs" are to Cleveland-Cliffs Inc., and references to "AK Steel" are to AK Steel Corporation (n/k/a Cleveland-Cliffs Steel Corporation). |
2 Refers to Cleveland-Cliffs Inc. as borrower under our ABL Facility. |
3 The total principal amounts for the indicated credit facilities are stated at their respective maximum borrowing capacities. |
|
| | | | | | | | | | | | | | | | | | |
| (In Millions) |
| December 31, 2018 |
| Debt Instrument | | Annual Effective Interest Rate | | Total Principal Amount | | Debt Issuance Costs | | Unamortized Discounts | | Total Debt |
| Senior Secured Notes: | | | | | | | | | | |
| $400 Million 4.875% 2024 Senior Notes | | 5.00% | | $ | 400.0 |
| | $ | (5.7 | ) | | $ | (2.2 | ) | | $ | 392.1 |
|
| Unsecured Notes: | | | | | | | | | | |
| $700 Million 4.875% 2021 Senior Notes | | 4.89% | | 124.0 |
| | (0.2 | ) | | — |
| | 123.8 |
|
| $316.25 Million 1.50% 2025 Convertible Senior Notes | | 6.26% | | 316.3 |
| | (5.5 | ) | | (75.6 | ) | | 235.2 |
|
| $1.075 Billion 5.75% 2025 Senior Notes | | 6.01% | | 1,073.3 |
| | (9.9 | ) | | (14.6 | ) | | 1,048.8 |
|
| $800 Million 6.25% 2040 Senior Notes | | 6.34% | | 298.4 |
| | (2.3 | ) | | (3.3 | ) | | 292.8 |
|
| ABL Facility | | N/A | | 450.0 |
| | N/A |
| | N/A |
| | — |
|
| Fair Value Adjustment to Interest Rate Hedge | | | | | | | | | | 0.2 |
|
| Long-term debt | | | | | | | | | | $ | 2,092.9 |
|
|
| | | | | | | | | | | | | | | | | | |
| (In Millions) |
| December 31, 2017 |
| Debt Instrument | | Annual Effective Interest Rate | | Total Principal Amount | | Debt Issuance Costs | | Unamortized Discounts | | Total Debt |
| Senior Secured Notes: | | | | | | | | | | |
| $400 Million 4.875% 2024 Senior Notes | | 5.00% | | $ | 400.0 |
| | $ | (7.1 | ) | | $ | (2.6 | ) | | $ | 390.3 |
|
| Unsecured Notes: | | | | | | | | | | |
| $400 Million 5.90% 2020 Senior Notes | | 5.98% | | 88.9 |
| | (0.2 | ) | | (0.1 | ) | | 88.6 |
|
| $500 Million 4.80% 2020 Senior Notes | | 4.83% | | 122.4 |
| | (0.3 | ) | | (0.1 | ) | | 122.0 |
|
| $700 Million 4.875% 2021 Senior Notes | | 4.89% | | 138.4 |
| | (0.3 | ) | | (0.1 | ) | | 138.0 |
|
| $316.25 Million 1.50% 2025 Convertible Senior Notes | | 6.26% | | 316.3 |
| | (6.6 | ) | | (85.6 | ) | | 224.1 |
|
| $1.075 Billion 5.75% 2025 Senior Notes | | 6.01% | | 1,075.0 |
| | (11.3 | ) | | (16.5 | ) | | 1,047.2 |
|
| $800 Million 6.25% 2040 Senior Notes | | 6.34% | | 298.4 |
| | (2.4 | ) | | (3.4 | ) | | 292.6 |
|
| ABL Facility | | N/A | | 550.0 |
| | N/A |
| | N/A |
| | — |
|
| Fair Value Adjustment to Interest Rate Hedge | | | | | | | | | | 1.4 |
|
| Long-term debt | | | |
|
| | | | | | $ | 2,304.2 |
|
| | | | | | | | | | | | | | | | | | | | | | | | | | | | | | | | | | | | | | |
| (In Millions) |
| December 31, 2019 |
| Debt Instrument | | Issuer1 | | Annual Effective Interest Rate | | Total Principal Amount | | Debt Issuance Costs | | Unamortized Discounts | | Total Debt |
| Senior Secured Notes: | | | | | | | | | | | | |
| 4.875% 2024 Senior Notes | | Cliffs | | 5.00% | | $ | 400 | | | $ | (5) | | | $ | (2) | | | $ | 393 | |
| Senior Unsecured Notes: | | | | | | | | | | | | |
| 1.50% 2025 Convertible Senior Notes | | Cliffs | | 6.26% | | 316 | | | (4) | | | (65) | | | 247 | |
| 5.75% 2025 Senior Notes | | Cliffs | | 6.01% | | 473 | | | (3) | | | (6) | | | 464 | |
| 5.875% 2027 Senior Notes | | Cliffs | | 6.49% | | 750 | | | (6) | | | (27) | | | 717 | |
| 6.25% 2040 Senior Notes | | Cliffs | | 6.34% | | 298 | | | (2) | | | (3) | | | 293 | |
| Former ABL Facility | | Cliffs2 | | N/A | | 450 | | | N/A | | N/A | | 0 | |
| Total long-term debt | | | | | | | | | | | | $ | 2,114 | |
| | | | | | | | | | | | |
1 Unless otherwise noted, references in this column to "Cliffs" are to Cleveland-Cliffs Inc. |
2 Refers to Cleveland-Cliffs Inc. and certain of its subsidiaries as borrowers under our Former ABL Facility. |
Outstanding Senior Secured Notes
Our9.875% 2025 Senior Secured Notes
On April 17, 2020, we entered into an indenture among Cliffs, the guarantors party thereto and U.S. Bank National Association, as trustee and notes collateral agent, relating to the issuance by Cliffs of $400 million aggregate principal amount of 9.875% 2025 Senior Secured Notes issued at 94.5% of face value.
On April 24, 2020, we issued an additional $555 million aggregate principal amount of 9.875% 2025 Senior Secured Notes issued at 99.0% of face value. These additional notes are of the same class and series as, and otherwise identical to, the 9.875% 2025 Senior Secured Notes issued on April 17, 2020, other than with respect to the date of issuance and issue price.
The 9.875% 2025 Senior Secured Notes were issued in private placement transactions exempt from the registration requirements of the Securities Act. The 9.875% 2025 Senior Secured Notes bear interest at a rate of 4.875%9.875% per annum, which is payable semi-annually in arrears on January 15April 17 and July 15October 17 of each year.year, commencing on October 17, 2020. The 9.875% 2025 Senior Secured Notes will mature on January 15, 2024October 17, 2025 and are secured senior obligations of the Company.Cliffs.
OurThe 9.875% 2025 Senior Secured Notes are jointly and severally and fully and unconditionally guaranteed on a senior secured basis by substantially all of our material domestic subsidiaries and are secured (subject in each case to certain exceptions and permitted liens) by (i) a first-priority lien, on a pari passu basis with the 6.75% 2026 Senior Secured Notes and 4.875% 2024 Senior Secured Notes, on substantially all of our assets and the assets of the guarantors, other than the ABL Collateral (as defined below), and (ii) a second-priority lien on the ABL Collateral, (aswhich is junior to a first-priority lien for the benefit of the lenders under our ABL Facility.
The 9.875% 2025 Senior Secured Notes may be redeemed, in whole or in part, at any time at our option upon not less than 30, and not more than 60, days' prior notice sent to the holders of the 9.875% 2025 Senior Secured Notes. The following is a summary of redemption prices for our 9.875% 2025 Senior Secured Notes:
| | | | | | | | | | | | | | | | | |
| Redemption Period | | Redemption Price1 | | Restricted Amount |
| Prior to October 17, 2022 - using proceeds of equity issuance | | 109.875 | | % | | Up to 35% of original aggregate principal |
Prior to October 17, 20222 | | 100.000 | | | | |
| Beginning on October 17, 2022 | | 107.406 | | | | |
| Beginning on April 17, 2023 | | 104.938 | | | | |
| Beginning on April 17, 2024 | | 102.469 | | | | |
| Beginning on April 17, 2025 and thereafter | | 100.000 | | | | |
| | | | | |
1 Plus accrued and unpaid interest, if any, up to, but excluding, the redemption date. |
2 Plus a "make-whole" premium. |
In addition, if a change in control triggering event, as defined below),in the indenture, occurs with respect to the 9.875% 2025 Senior Secured Notes, we will be required to offer to purchase the notes at a purchase price equal to 101% of their principal amount, plus accrued and unpaid interest, if any, to, but not including, the date of purchase.
The terms of the 9.875% 2025 Senior Secured Notes contain certain customary covenants; however, there are no financial covenants.
6.75% 2026 Senior Secured Notes
On March 13, 2020, we entered into an indenture among Cliffs, the guarantors party thereto and U.S. Bank National Association, as trustee and notes collateral agent, relating to the issuance of $725 million aggregate principal amount of 6.75% 2026 Senior Secured Notes issued at 98.783% of face value.
On June 19, 2020, we issued an additional $120 million aggregate principal amount of 6.75% 2026 Senior Secured Notes issued at 99.25% of face value. These additional notes are of the same class and series as, and otherwise identical to, the 6.75% 2026 Senior Secured Notes issued on March 13, 2020, other than with respect to the date of issuance and issue price.
The 6.75% 2026 Senior Secured Notes were issued in private placement transactions exempt from the registration requirements of the Securities Act. The 6.75% 2026 Senior Secured Notes bear interest at a rate of 6.75% per annum, payable semi-annually in arrears on March 15 and September 15 of each year, commencing on September 15, 2020. The 6.75% 2026 Senior Secured Notes mature on March 15, 2026 and are secured senior obligations of Cliffs.
The 6.75% 2026 Senior Secured Notes are jointly and severally and fully and unconditionally guaranteed on a senior secured basis by substantially all of our material domestic subsidiaries and are secured (subject in each case to certain exceptions and permitted liens) by (i) a first-priority lien, on a pari passu basis with the 4.875% 2024 Senior Secured Notes and 9.875% 2025 Senior Secured Notes, on substantially all of our assets and the assets of the guarantors, other than the ABL Collateral, and (ii) a second-priority lien on the ABL Collateral, which is junior to a first-priority lien for the benefit of the lenders under our ABL Facility.
The 6.75% 2026 Senior Secured Notes may be redeemed, in whole or in part, at any time at our option upon not less than 30, and not more than 60, days' prior notice sent to the holders of the 6.75% 2026 Senior Secured Notes. The following is a summary of redemption prices (expressed as a percentage of the principal amount to be redeemed) for our 6.75% 2026 Senior Secured Notes:
| | | | | | | | | | | | | | | | | |
| Redemption Period | | Redemption Price1 | | Restricted Amount |
| Prior to March 15, 2022 - using proceeds of equity issuance | | 106.750 | | % | | Up to 35% of original aggregate principal |
Prior to March 15, 20222 | | 100.000 | | | | |
| Beginning on March 15, 2022 | | 105.063 | | | | |
| Beginning on March 15, 2023 | | 103.375 | | | | |
| Beginning on March 15, 2024 | | 101.688 | | | | |
| Beginning on March 15, 2025 and thereafter | | 100.000 | | | | |
| | | | | |
1 Plus accrued and unpaid interest, if any, up to, but excluding, the redemption date. |
2 Plus a "make-whole" premium. |
| | | | | |
| | | | | |
In addition, if a change in control triggering event, as defined in the indenture, occurs with respect to the 6.75% 2026 Senior Secured Notes, we will be required to offer to purchase the notes at a purchase price equal to 101% of their principal amount, plus accrued and unpaid interest, if any, to, but not including, the date of purchase.
The terms of the 6.75% 2026 Senior Secured Notes contain certain customary covenants; however, there are no financial covenants.
4.875% 2024 Senior Secured Notes
Our 4.875% 2024 Senior Secured Notes bear interest at a rate of 4.875% per annum, which is payable semi-annually in arrears on January 15 and July 15 of each year. The 4.875% 2024 Senior Secured Notes mature on January 15, 2024 and are secured senior obligations of Cliffs.
Our 4.875% 2024 Senior Secured Notes are jointly and severally and fully and unconditionally guaranteed on a senior secured basis by substantially all of our material domestic subsidiaries and are secured (subject in each case to certain exceptions and permitted liens) by (i) a first-priority lien, on a pari passu basis with the 9.875% 2025 Senior Secured Notes and 6.75% 2026 Senior Secured Notes, on substantially all of our assets and the assets of the guarantors, other than the ABL Collateral, and (ii) a second-priority lien on the ABL Collateral, which is junior to a first-priority lien for the benefit of the lenders under our ABL Facility.
The terms of the4.875% 2024 Senior Secured Notes contain certain covenants; however, there are no financial covenants. Uponmay be redeemed, in whole or in part, at any time at our option upon not less than 30, and not more than 60, days' prior notice sent to the occurrenceholders of the 4.875% 2024 Senior Secured Notes. The following is a summary of redemption prices (expressed as a percentage of the principal amount to be redeemed) for our 4.875% 2024 Senior Secured Notes:
| | | | | | | | | | | |
| Redemption Period | | Redemption Price1 |
| Beginning on January 15, 2021 | | 102.438 | | % |
| Beginning on January 15, 2022 | | 101.219 | | |
| Beginning on January 15, 2023 and thereafter | | 100.000 | | |
| | | |
1 Plus accrued and unpaid interest, if any, up to but excluding the redemption date. |
In addition, if a change ofin control triggering event, as defined in the indenture, occurs with respect to the 4.875% 2024 Senior Secured Notes, we will be required to offer to purchase the notes of the applicable series at a purchase price equal to 101% of thetheir principal amount, plus accrued and unpaid interest, if any, to, but not including, the date of purchase.
The following is a summaryterms of redemption prices for ourthe 4.875% 2024 Senior Secured Notes:Notes contain certain covenants; however, there are no financial covenants.
|
| | | | | |
| | Redemption Price | | Restricted Amount |
Prior to January 15, 2021 - using proceeds of equity issuance2
| | 104.875 | % | | Up to 35% of original aggregate principal |
Prior to January 15, 20212
| | 100.000 | | | |
Prior to January 15, 2021 | | 103.000 | | | Up to 10% of original aggregate principal |
Beginning on January 15, 2021 | | 102.438 | | | |
Beginning on January 15, 2022 | | 101.219 | | | |
Beginning on January 15, 2023 | | 100.000 | | | |
| | | | | |
1 Plus accrued and unpaid interest, if any, up to but excluding the redemption date.
|
2 Plus a "make-whole" premium.
|
Outstanding Senior Unsecured Notes
Cliffs Senior Notes exchanged for AK Steel Corporation Senior Notes
On March 16, 2020, we entered into indentures, in each case among Cliffs, the guarantors party thereto and U.S. Bank National Association, as trustee, relating to the issuance by Cliffs of $232 million aggregate principal amount of 6.375% 2025 Senior Notes and $335 million aggregate principal amount of 7.00% 2027 Senior Notes. The following represents a summarynew notes were issued in exchange for equal aggregate principal amounts of our unsecured senior notes' maturity6.375% 2025 AK Senior Notes and interest payable due dates:7.00% 2027 AK Senior Notes, respectively, issued by AK Steel Corporation. The 6.375% 2025 Senior Notes and 7.00% 2027 Senior Notes were issued in connection with the AK Steel Merger pursuant to private exchange offers exempt from the registration requirements of the Securities Act made by Cliffs. Pursuant to the registration rights agreements executed in connection with the issuance of the new notes, we agreed to file registration statements with the SEC with respect to registered offers to exchange the 6.375% 2025 Senior Notes and 7.00% 2027 Senior Notes for publicly registered notes within 365 days of the closing date, with all significant terms and conditions remaining the same.
|
| | | | |
Debt Instrument | | Maturity | | Interest Payable
(until maturity)
|
$700 Million 4.875% 2021The 6.375% 2025 Senior Notes and 7.00% 2027 Senior Notes | | April 1, 2021 | | April 1 and October 1 |
$1.075 Billion 5.75% 2025 Senior Notes | | March 1, 2025 | | March 1 and September 1 |
$800 Million 6.25% 2040 Senior Notes | | October 1, 2040 | | April 1 and October 1 |
The senior notes are unsecured obligations and rank equally in right of payment with all of our other existing and future unsecured and unsubordinated indebtedness. There are no subsidiary guarantees of the interest and principal amounts for the 2021 Senior Notes and the 2040 Senior Notes. The 2025 Senior Notesnotes are guaranteed on a senior unsecured basis by our material direct and indirect wholly-ownedwholly owned domestic subsidiaries and, therefore, are structurally senior to any of our existing and future indebtedness that is not guaranteed by such guarantors and are structurally subordinated to all existing and future indebtedness and other liabilities of our subsidiaries that do not guarantee the 2025 Senior Notes.
The 2021 Senior Notes and the 2040 Senior Notes may be redeemed any time at our option not less than 30 days nor more than 60 days after prior notice is sent to the holders of the applicable series of notes. The 2021 Senior Notes and the 2040 Senior Notes are redeemable at a redemption price equal to the greater of (1) 100% of the principal amount of the notes to be redeemed or (2) the sum of the present values of the remaining scheduled payments of principal and interest on the notes to be redeemed, discounted to the redemption date on a semi-annual basis at the treasury rate plus 25 basis points with respect to the 2021 Senior Notes and 40 basis points with respect to the 2040 Senior Notes, plus, in each case, accrued and unpaid interest to, but not including, the date of redemption. However, if the 2021 Senior Notes are redeemed on or after the date that is three months prior to their maturity date, the 2021 Senior Notes will be redeemed at a redemption price equal to 100% of the principal amount of the notes to be redeemed plus accrued and unpaid interest to, but not including, the date of redemption.
We may redeem the 2025 Senior Notes, in whole or in part, on or after March 1, 2020, at the redemption prices set forth in the indenture, plus accrued and unpaid interest, if any, to, but not including, the date of redemption, and prior to March 1, 2020, at a redemption price equal to 100% of the principal amount thereof plus a “make-whole” premium set forth in the indenture, plus accrued and unpaid interest, if any, to, but not including, the date of redemption. We may also redeem up to 35% of the aggregate principal amount of the 2025 Senior Notes on or prior to March 1, 2020 at a redemption price equal to 105.75% of the principal amount thereof, plus accrued and unpaid interest, if any, to, but not including, the date of redemption with the net cash proceeds of one or more equity offerings.
In addition, if a change ofin control triggering event, as defined in the applicable indenture,indentures, occurs with respect to the unsecured notes,6.375% 2025 Senior Notes or 7.00% 2027 Senior Notes, we will be required to offer to purchase the notes of the applicable series at a purchase price equal to 101% of thetheir principal amount, plus accrued and unpaid interest, if any, to, but not including, the date of purchase.
The terms of the unsecured notes6.375% 2025 Senior Notes and 7.00% 2027 Senior Notes contain certain customary covenants; however, there are no financial covenants.
$316.25 Million 6.375% 2025 Senior Notes
The 6.375% 2025 Senior Notes bear interest at a rate of 6.375% per annum, payable semi-annually in arrears on April 15 and October 15 of each year, commencing on April 15, 2020. The 6.375% 2025 Senior Notes mature on October 15, 2025.
The 6.375% 2025 Senior Notes may be redeemed, in whole or in part, at any time at our option upon not less than 30, and not more than 60, days' prior notice sent to the holders of the 6.375% 2025 Senior Notes. The following is a summary of redemption prices (expressed as a percentage of the principal amount to be redeemed) for our 6.375% 2025 Senior Notes:
| | | | | | | | | | | |
| Redemption Period | | Redemption Price1 |
| Beginning on October 15, 2020 | | 103.188 | | % |
| Beginning on October 15, 2021 | | 101.594 | | |
| Beginning on October 15, 2022 and thereafter | | 100.000 | | |
| | | |
1 Plus accrued and unpaid interest, if any, up to but excluding the redemption date. |
7.00% 2027 Senior Notes
The 7.00% 2027 Senior Notes bear interest at a rate of 7.00% per annum, payable semi-annually in arrears on March 15 and September 15 of each year, commencing on September 15, 2020. The 7.00% 2027 Senior Notes mature on March 15, 2027.
The 7.00% 2027 Senior Notes may be redeemed, in whole or in part, at any time at our option upon not less than 30, and not more than 60, days' prior notice sent to the holders of the 7.00% 2027 Senior Notes. The following is a summary of redemption prices (expressed as a percentage of the principal amount to be redeemed) for our 7.00% 2027 Senior Notes:
| | | | | | | | | | | |
| Redemption Period | | Redemption Price1 |
Prior to March 15, 20222 | | 100.000 | | % |
| Beginning on March 15, 2022 | | 103.500 | | |
| Beginning on March 15, 2023 | | 102.333 | | |
| Beginning on March 15, 2024 | | 101.167 | | |
| Beginning on March 15, 2025 and thereafter | | 100.000 | | |
| | | |
1 Plus accrued and unpaid interest, if any, up to but excluding the redemption date. |
2 Plus a "make-whole" premium. |
AK Steel Corporation Unsecured Senior Notes
As of December 31, 2020, AK Steel Corporation had outstanding a total of $132 million aggregate principal amount of 7.625% 2021 AK Senior Notes, 7.50% 2023 AK Senior Notes, 6.375% 2025 AK Senior Notes and 7.00% 2027 AK Senior Notes. These senior notes are unsecured obligations and rank equally in right of payment with AK Steel Corporation's guarantees of Cliffs' unsecured and unsubordinated indebtedness. These notes contain no financial covenants.
The 7.625% 2021 AK Senior Notes, 7.50% 2023 AK Senior Notes, 6.375% 2025 AK Senior Notes and 7.00% 2027 AK Senior Notes may be redeemed, in whole or in part, at any time at our option upon not less than 30, and not more than 60, days' prior notice sent to the respective holders of such notes.
We may redeem the 7.625% 2021 AK Senior Notes at 100.000% of their principal amount, together with all accrued and unpaid interest to the date of redemption.
The following is a summary of redemption prices (expressed as a percentage of the principal amount to be redeemed) for the 7.50% 2023 AK Senior Notes:
| | | | | | | | | | | |
| Redemption Period | | Redemption Price1 |
| Beginning on July 15, 2020 | | 101.875 | | % |
| Beginning on July 15, 2021 and thereafter | | 100.000 | | |
| | | |
1 Plus accrued and unpaid interest, if any, up to but excluding the redemption date. |
The following is a summary of redemption prices (expressed as a percentage of the principal amount to be redeemed) for the 6.375% 2025 AK Senior Notes:
| | | | | | | | | | | |
| Redemption Period | | Redemption Price1 |
| Beginning on October 15, 2020 | | 103.188 | | % |
| Beginning on October 15, 2021 | | 101.594 | | |
| Beginning on October 15, 2022 and thereafter | | 100.000 | | |
| | | |
1 Plus accrued and unpaid interest, if any, up to but excluding the redemption date. |
The following is a summary of redemption prices (expressed as a percentage of the principal amount to be redeemed) for the 7.00% 2027 AK Senior Notes:
| | | | | | | | | | | |
| Redemption Period | | Redemption Price1 |
Prior to March 15, 20222 | | 100.000 | | % |
| Beginning on March 15, 2022 | | 103.500 | | |
| Beginning on March 15, 2023 | | 102.333 | | |
| Beginning on March 15, 2024 | | 101.167 | | |
| Beginning on March 15, 2025 and thereafter | | 100.000 | | |
| | | |
1 Plus accrued and unpaid interest, if any, up to but excluding the redemption date. |
2 Plus a "make-whole" premium. |
1.50% 2025 Convertible Senior Notes
The 1.50% 2025 Convertible Senior Notes bear interest at a rate of 1.50% per year, payable semiannually in arrears on January 15 and July 15 of each year. The 1.50% 2025 Convertible Senior Notes mature on January 15, 2025. The 1.50% 2025 Convertible Senior Notes are senior unsecured obligations and rank senior in right of payment to any of our indebtedness that is expressly subordinated in right of payment to the 1.50% 2025 Convertible Senior Notes; equal in right of payment to any of our unsecured indebtedness that is not so subordinated; effectively junior in right of payment to any of our secured indebtedness to the extent of the value of the assets securing such indebtedness; and structurally junior to all indebtedness and other liabilities (including trade payables) of our subsidiaries. The terms of the 1.50% 2025 Convertible Senior Notes contain certain customary covenants; however, there are no financial covenants.
Holders may convert their 1.50% 2025 Convertible Senior Notes at their option at any time prior to the close of business on the business day immediately preceding July 15, 2024, only under the following circumstances: (1) during any calendar quarter commencing after the calendar quarter ending on March 31, 2018, if the last reported sale price of our common shares, par value $0.125 per share, for at least 20 trading days (whether or not consecutive) during a period of 30 consecutive trading days ending on the last trading day of the immediately preceding calendar quarter is greater than or equal to 130% of the conversion price on each applicable trading day; (2) during the five-business day period after
any five-consecutive trading day period (the “measurement period”) in which the trading price per $1,000 principal amount of 1.50% 2025 Convertible Senior Notes for each trading day of the measurement period was less than 98% of the product of the last reported sale price of our common shares and the conversion rate on each such trading day; (3) if we call the notes for redemption, at any time prior to the close of business on the scheduled trading day immediately preceding the redemption date; or (4) upon the occurrence of specified corporate events. On or after July 15, 2024 until the close of business on the second scheduled trading day immediately preceding the maturity date, holders may convert their 1.50% 2025 Convertible Senior Notes at any time, regardless of the foregoing circumstances. Upon conversion, we will pay or deliver, as the case may be, cash, common shares or a combination of cash and common shares, at our election.
TheUpon the issuance of the 1.50% 2025 Convertible Senior Notes the initial conversion rate iswas 122.4365 common shares per $1,000 principal, amount of 2025 Convertible Notes (equivalent to an initialwith a conversion price of $8.17 per common share).share. The conversion rate will beis subject to adjustment in some circumstances, including the payment of dividends on common shares, but will not be adjusted for any accrued and unpaid interest. In addition, following certain corporate events that occur prior to the maturity date, or if we deliver a notice of redemption, we will, in certain circumstances, increase the conversion rate for a holder who elects to convert its 1.50% 2025 Convertible Senior Notes in connection with such a corporate event or notice of redemption, as the case may be. As of December 31, 2020, the conversion rate was 129.2985 common shares per $1,000 principal amount of 1.50% 2025 Convertible Senior Notes.
We may not redeem the 1.50% 2025 Convertible Senior Notes prior to January 15, 2022. We may redeem all or any portion of the 1.50% 2025 Convertible Senior Notes, for cash at our option on or after January 15, 2022 if the last reported sale price of our common shares has been at least 130% of the conversion price then in effect for at least 20 trading days (whether or not consecutive) during any 30-consecutive trading day period (including the last trading day of such period) ending on, and including, the trading day immediately preceding the date on which we provide notice of redemption at a redemption price equal to 100% of the principal amount of the 1.50% 2025 Convertible Senior Notes to be redeemed, plus accrued and unpaid interest to, but excluding, the redemption date.
It is our current intent to settle conversions through combination settlement.settlement or fully in cash. Our ability to settle conversions through combination settlement and cash settlement will be subject to restrictions in the agreement governing our ABL Facility and may be subject to restrictions in agreements governing our future debt.
If we undergo a fundamental change as defined in the indenture, holders may require us to repurchase for cash all or any portion of their 1.50% 2025 Convertible Senior Notes at a fundamental change repurchase price equal to 100% of the principal amount of the 1.50% 2025 Convertible Senior Notes to be repurchased, plus accrued and unpaid interest to, but excluding, the fundamental change repurchase date.
In accounting for the issuance of the notes, we separated the 1.50% 2025 Convertible Senior Notes into liability and equity components. The carrying amount of the liability component was calculated by measuring the fair value of similar liabilities that did not have associated convertible features. The carrying amount of the equity component of $85.9$86 million representing the conversion option was determined by deducting the fair value of the liability component from the par value of the notes. The difference represents the debt discount that is amortized to interest expense over the term of the notes. The equity component is not remeasured as long as it continues to qualify for equity classification.
Debt Extinguishment - 2018
During the year ended December 31, 2018, we redeemed in full all of our outstanding 5.90% 2020Other Outstanding Unsecured Senior Notes and 4.80% 2020 Senior Notes with cash on hand. Additionally, we purchased certain of our 4.875% 2021 Senior Notes and 2025 Senior Notes.
The following is a summary of the debt extinguished and the respective gain (loss) on extinguishment:
|
| | | | | | | | |
| (In Millions) |
| | | Year Ended
December 31, 2018 |
| | | Debt Extinguished | | Gain (Loss) on Extinguishment1 |
| Unsecured Notes: | | | | |
| $400 Million 5.90% 2020 Senior Notes | | $ | 88.9 |
| | $ | (3.3 | ) |
| $500 Million 4.80% 2020 Senior Notes | | 122.4 |
| | (3.7 | ) |
| $700 Million 4.875% 2021 Senior Notes | | 14.4 |
| | 0.1 |
|
| $1.075 Billion 5.75% 2025 Senior Notes | | 1.7 |
| | 0.1 |
|
| | | $ | 227.4 |
| | $ | (6.8 | ) |
| | | | | |
1 This includes premiums paid related to the redemption of our notes of $7.1 million. |
Debt Extinguishment - 2017
During the year ended December 31, 2017, we issued 63.25 million common shares in an underwritten public offering. We received net proceeds of $661.3 million at a public offering price of $10.75 per common share. The net proceeds from the issuance of our common shares and the net proceeds from the issuance of $1.075 billion 2025 Senior Notes were used to redeem in full all of our outstanding 8.25% 2020 First Lien Notes, 8.00% 2020 1.5 Lien Notes and 7.75% 2020 Second Lien Notes. Additionally, through tender offers, we purchased certain of our 5.90% 2020 Senior Notes, our 4.80% 2020 Senior Notes and our 4.875% 2021 Senior Notes.
The following is a summary of the debt extinguished and the respective gain (loss) on extinguishment:
|
| | | | | | | | |
| (In Millions) |
| | | Year Ended
December 31, 2017 |
| | | Debt Extinguished | | Gain (Loss) on Extinguishment1 |
| Secured Notes: | | | | |
| $540 Million 8.25% 2020 First Lien Notes | | $ | 540.0 |
| | $ | (93.5 | ) |
| $218.5 Million 8.00% 2020 1.5 Lien Notes | | 218.5 |
| | 45.1 |
|
| $544.2 Million 7.75% 2020 Second Lien Notes | | 430.1 |
| | (104.5 | ) |
| Unsecured Notes: | | | | |
| $400 Million 5.90% 2020 Senior Notes | | 136.7 |
| | (7.8 | ) |
| $500 Million 4.80% 2020 Senior Notes | | 114.4 |
| | (1.9 | ) |
| $700 Million 4.875% 2021 Senior Notes | | 171.0 |
| | (2.8 | ) |
| | | $ | 1,610.7 |
| | $ | (165.4 | ) |
| | | | | |
1 This includes premiums paid related to the redemption of our notes of $110.0 million. |
Debt Extinguishment/Restructuring - 2016
8.00% 2020 1.5 Lien Notes Exchange
On March 2, 2016, we entered into an indenture among the Company, the guarantors party thereto and U.S. Bank National Association, as trustee and notes collateral agent, relating to our issuance of $218.5 million aggregate principal amount of 8.00% 2020 1.5 Lien Notes. The 8.00% 2020 1.5 Lien Notes were issued in exchange offers for certain of our existing senior notes.
We accounted for the 8.00% 2020 1.5 Lien Notes exchange as a troubled debt restructuring. For an exchange classified as a troubled debt restructuring, if the future undiscounted cash flows of the newly issued debt are less than the net carrying value of the original debt, the carrying value of the newly issued debt is adjusted to the future undiscounted
cash flow amount, a gain is recorded for the difference and no future interest expense is recorded. All future interest payments on the newly issued debt reduce the carrying value. Accordingly, we recognized a gain of $174.3 million in the Gain (loss) on extinguishment/restructuring of debt in the Statements of Consolidated Operations for the year ended December 31, 2016.
The following is a summary of the debt exchanged for our $218.5 million 8.00% 2020 1.5 Lien Notes:
|
| | | | | | | | | | | | | | | | |
| (In Millions) |
| | | Debt Extinguished | | 1.5 Lien Amount Issued | | Carrying Value1 | | Gain on Restructuring2 |
| $544.2 Million 7.75% 2020 Second Lien Notes | | $ | 114.1 |
| | $ | 57.0 |
| | $ | 77.5 |
| | $ | 6.9 |
|
| $500 Million 3.95% 2018 Senior Notes | | 17.6 |
| | 11.4 |
| | 15.5 |
| | 1.8 |
|
| $400 Million 5.90% 2020 Senior Notes | | 65.1 |
| | 26.0 |
| | 35.4 |
| | 28.3 |
|
| $500 Million 4.80% 2020 Senior Notes | | 44.7 |
| | 17.9 |
| | 24.4 |
| | 19.5 |
|
| $700 Million 4.875% 2021 Senior Notes | | 76.3 |
| | 30.5 |
| | 41.5 |
| | 33.3 |
|
| $800 Million 6.25% 2040 Senior Notes | | 194.4 |
| | 75.7 |
| | 103.0 |
| | 84.5 |
|
| | | $ | 512.2 |
| | $ | 218.5 |
| | $ | 297.3 |
| | $ | 174.3 |
|
| | | | | | | | | |
1 Includes undiscounted interest payments |
2 Net of amounts expensed for unamortized original issue discount and deferred origination fees |
Debt-for-Equity Exchanges
During the year ended December 31, 2016, we entered into a series of privately negotiated exchange agreements whereby we issued an aggregate of 8.2 million common shares in exchange for $10.0 million aggregate principal amount of our 3.95% 2018 Senior Notes, $20.1 million aggregate principal amount of our 4.80% 2020 Senior Notes and $26.8 million aggregate principal amount of our 4.875% 2021 Senior Notes. There were no exchanges that represented more than 1% of our outstanding common shares during any quarter. Accordingly, we recognized a gain of $11.3 million in Gain (loss) on extinguishment/restructuring of debt in the Statements of Consolidated Operations for the year ended December 31, 2016.
Other Debt Repurchases
Our 3.95% 2018 Senior Notes were redeemed in whole on September 16, 2016 at a total redemption price of $301.0 million, which included $283.6 million outstanding aggregate principal. As a result, we recorded a $19.9 million pre-tax loss on full retirement of long-term debt in the third quarter of 2016, which consisted of debt redemption premiums of $17.4 million and expenses of $2.5 million related to the write-off of unamortized debt issuance costs, unamortized bond discount and deferred losses on interest rate swaps. The loss was recorded against the Gain (loss) on extinguishment/restructuring of debt in the Statements of Consolidated Operations for the year ended December 31, 2016.
During the year ended December 31, 2016, we purchased with cash $5.0 million of our outstanding 4.80% 2020 Senior Notes, which resulted in a gain on extinguishment of $0.6 million.
Debt Maturities
The following represents a summary of our debt instrument maturities basedother unsecured senior notes' maturity and interest payable due dates:
| | | | | | | | | | | | | | |
| Debt Instrument | | Maturity | | Interest Payable
(until maturity) |
| 5.75% 2025 Senior Notes | | March 1, 2025 | | March 1 and September 1 |
| 5.875% 2027 Senior Notes | | June 1, 2027 | | June 1 and December 1 |
| 6.25% 2040 Senior Notes | | October 1, 2040 | | April 1 and October 1 |
The senior notes are unsecured obligations and rank equally in right of payment with all our other existing and future unsecured and unsubordinated indebtedness. There are no subsidiary guarantees of the interest and principal amounts for the 6.25% 2040 Senior Notes. The 5.75% 2025 Senior Notes and 5.875% 2027 Senior Notes are guaranteed on a senior unsecured basis by our material direct and indirect wholly owned domestic subsidiaries and, therefore, are structurally senior to any of our existing and future indebtedness that is not guaranteed by such guarantors and are structurally subordinated to all existing and future indebtedness and other liabilities of our subsidiaries that do not guarantee the 5.75% 2025 Senior Notes and 5.875% 2027 Senior Notes.
We may redeem the 5.75% 2025 Senior Notes, in whole or in part, on or after March 1, 2020, at the redemption prices set forth in the indenture, plus accrued and unpaid interest, if any, to, but not including, the date of redemption.
We may redeem the 5.875% 2027 Senior Notes, in whole or in part, on or after June 1, 2022, at the redemption prices set forth in the indenture, plus accrued and unpaid interest, if any, to, but not including, the date of redemption, and prior to June 1, 2022, at a redemption price equal to 100% of the principal amount thereof plus a “make-whole” premium set forth in the indenture, plus accrued and unpaid interest, if any, to, but not including, the date of redemption. We may also redeem up to 35% of the aggregate principal amount of the 5.875% 2027 Senior Notes on or prior to June 1, 2022 at a redemption price equal to 105.875% of the principal amount thereof, plus accrued and unpaid interest, if any, to, but not including, the date of redemption with the net cash proceeds of one or more equity offerings.
The 6.25% 2040 Senior Notes may be redeemed any time at our option upon not less than 30, nor more than 60, days' prior notice is sent to the holders. The 6.25% 2040 Senior Notes are redeemable at a redemption price equal to the greater of (1) 100% of the principal amount of the notes to be redeemed or (2) the sum of the present values of the remaining scheduled payments of principal and interest on the notes to be redeemed, discounted to the redemption date on a semi-annual basis at the treasury rate plus 40 basis points, plus accrued and unpaid interest, if any, to, but not including, the date of redemption.
In addition, if a change of control triggering event, as defined in the applicable indenture, occurs with respect to the unsecured notes, we will be required to offer to purchase the notes of the applicable series at a purchase price equal to 101% of the principal amounts outstanding at December 31, 2018:amount, plus accrued and unpaid interest, if any, to, but not including, the date of purchase.
|
| | | |
| | (In Millions) |
| | Maturities of Debt |
| 2019 | $ | — |
|
| 2020 | — |
|
| 2021 | 124.0 |
|
| 2022 | — |
|
| 2023 | — |
|
| 2024 and thereafter | 2,088.0 |
|
| Total maturities of debt | $ | 2,212.0 |
|
ABL Facility
On February 28, 2018,March 13, 2020, in connection with the AK Steel Merger, we entered into an amended and restated senior secured asset-based revolving credit facilitya new ABL Facility with various financial institutions. Theinstitutions to replace and refinance Cliffs’ Former ABL Facility amends and restates our prior $550.0 million Syndicated Facility Agreement, dated as of March 30, 2015.AK Steel Corporation’s former revolving credit facility. The ABL Facility will mature upon the earlier of February 28, 2023March 13, 2025 or 6091 days prior to the maturity of certain other material debt and providesprovided for up to $450.0 million$2 billion in borrowings, comprised of (i) a $400.0 million U.S. tranche, including a $248.8$555 million sublimit for the issuance of letters of credit and a $100.0 million sublimit for U.S. swingline loans, and (ii) at the time of closing, a $50.0 million Australian tranche, including a $24.4 million sublimit for the issuance of letters of credit and a $20.0 million sublimit for Australian swingline loans. On June 19, 2018, the Australian tranche was terminated and reallocated to the U.S. tranche, resulting in a $450.0 million allocation to the U.S. tranche, including a $273.2 million sublimit for the issuance of letters of credit and a $120.0$125 million sublimit for swingline loans. Availability under the U.S. tranche of the ABL Facility is limited to an eligible U.S. borrowing base, as applicable, determined by applying customary advance rates to eligible accounts receivable, inventory and certain mobile equipment.
On March 27, 2020, the ABL Facility was amended, by and among Cliffs, the lenders and the administrative agent. The amendment modified the ABL Facility to, among other things, provide for a new FILO tranche B of commitments in the aggregate amount of $150 million by exchanging existing commitments under the ABL Facility. The total commitments under the ABL Facility after giving effect to the amendment remained at $2 billion. The terms and conditions (other than the pricing) that apply to the FILO tranche are substantially the same as the terms and conditions that apply to the tranche A facility of the ABL Facility immediately prior to the amendment.
On December 9, 2020, we entered into the ABL Amendment with various financial institutions. The ABL Amendment modified the ABL Facility to, among other things, increase the amount of tranche A revolver commitments available thereunder by an additional $1.5 billion and increase certain dollar baskets related to certain negative covenants that apply to the ABL Facility. After giving effect to the ABL Amendment, the aggregate principal amount of tranche A revolver commitments under the ABL Facility is $3.35 billion and the aggregate principal amount of FILO tranche B revolver commitments under the ABL Facility remains at $150 million.
The ABL Facility and certain bank products and hedge obligations are guaranteed by us and certain of our existing wholly-ownedwholly owned U.S. subsidiaries and are required to be guaranteed by certain of our future U.S. subsidiaries. Amounts outstanding under the ABL Facility are secured by (i) a first-priority security interest in the accounts receivable and other rights to payment, inventory, as-extracted collateral, certain investment property, deposit accounts, securities accounts, certain general intangibles and commercial tort claims, certain mobile equipment, commodities accounts, deposit accounts, securities accounts and other related assets of ours, the other borrowers and the guarantors, and proceeds and products of each of the foregoing (collectively, the “ABL Collateral”) and (ii) a second-priority security interest in substantially all of our assets and the assets of the other borrowers and the guarantors other than the ABL Collateral.
Borrowings under the ABL Facility bear interest, at our option, at a base rate or, if certain conditions are met, a LIBOR rate, in each case plus an applicable margin. The base rate is equalWe may amend our ABL Facility to the greater of the federal funds rate plus 0.5%,replace the LIBOR rate with one or more secured overnight financing based on a one-month interest period plus 1% and the floatingrates or an alternative benchmark rate, announced by Bank of America Merrill Lynch as its “prime rate" and 1%. The LIBOR rate is a per annum fixed rate equalgiving consideration to LIBOR with respect to the applicable interest period and amount of LIBOR rate loan requested.any evolving or then-existing convention for similar dollar denominated syndicated credit facilities for such alternative benchmarks.
The ABL Facility contains customary representations and warranties and affirmative and negative covenants including, among others, covenants regarding the maintenance of certain financial ratios if certain conditions are triggered, covenants relating to financial reporting, covenants relating to the payment of dividends on, or purchase or redemption of, our capital stock, covenants relating to the incurrence or prepayment of certain debt, covenants relating to the incurrence of liens or encumbrances, covenants relating to compliance with laws, covenants relating to transactions with affiliates, covenants relating to mergers and sales of all or substantially all of our assets and limitations on changes in the nature of our business.
The ABL Facility provides for customary events of default, including, among other things, the event of nonpayment of principal, interest, fees or other amounts, a representation or warranty proving to have been materially incorrect when made, failure to perform or observe certain covenants within a specified period of time, a cross-default to certain material indebtedness, the bankruptcy or insolvency of the Company and certain of its subsidiaries, monetary judgment defaults of a specified amount, invalidity of any loan documentation, a change of control of the Company, and ERISA defaults
resulting in liability of a specified amount. If an event of default exists (beyond any applicable grace or cure period, if any)period), the administrative agent may, and at the direction of the requisite number of lenders shall, declare all amounts owing under the ABL Facility immediately due and payable, terminate such lenders’ commitments to make loans under the ABL Facility and/or exercise any and all remedies and other rights under the ABL Facility. For certain events of default related to insolvency and receivership, the commitments of the lenders will be automatically terminated and all outstanding loans and other amounts will become immediately due and payable.
As of December 31, 20182020 and 2017,2019, we were in compliance with the ABL Facility liquidity requirements and, therefore, the springing financial covenant requiring a minimum fixed charge coverage ratio of 1.0 to 1.0 was not applicable.
The following represents a summary of our borrowing capacity under the ABL Facility:
| | | | | |
| (In Millions) |
| December 31,
2020 |
Available borrowing base on ABL Facility1 | $ | 3,500 | |
| Borrowings | (1,510) | |
Letter of credit obligations2 | (247) | |
| Borrowing capacity available | $ | 1,743 | |
| |
1 As of December 31, 2020, the ABL Facility has a maximum borrowing base of $3.5 billion. The available borrowing base is determined by applying customary advance rates to eligible accounts receivable, inventory and certain mobile equipment. |
2 We issued standby letters of credit with certain financial institutions in order to support business obligations including, but not limited to, workers' compensation, employee severance, insurance, operating agreements, IRBs and environmental obligations. |
Other Financing Arrangements
Industrial Revenue Bonds
AK Steel Corporation had outstanding $66 million aggregate principal amount of fixed-rate, tax-exempt IRBs as of December 31, 2020. The weighted-average fixed rate of these IRBs is 6.86%. These IRBs are unsecured senior debt obligations that are equal in ranking with AK Steel Corporation's senior notes and AK Steel Corporation's guarantees of Cliffs' unsubordinated indebtedness. These IRBs are effectively subordinated to AK Steel Corporation’s guarantees of Cliffs’ secured indebtedness to the extent of the value of AK Steel Corporation’s assets securing such guarantees. In addition, AK Steel Corporation had outstanding $26 million aggregate principal amount of variable-rate IRBs as of December 31, 2020 that are backed by a letter of credit. These IRBs contain certain customary covenants; however, there are no financial covenants.
EDC Revolving Facility
On November 9, 2020, our Canadian subsidiaries Fleetwood Metal Industries Inc. and The Electromac Group Inc. entered into a new revolving facility with Export Development Canada. The EDC Revolving Facility enables our Tooling and Stamping business to finance the purchase of tooling and related equipment to manufacture and process long lead-time parts for our automotive customers. The EDC Revolving Facility provides for up to $40 million in borrowings and expires in November 2022. Borrowings under the EDC Revolving Facility bear interest at a LIBOR rate plus a base rate. The EDC Revolving Facility is secured by the assets of Fleetwood Metal Industries Inc. and The Electromac Group Inc. and fully guaranteed by Cliffs. As of December 31, 2020, we had outstanding borrowings on the EDC Revolving Facility of $18 million.
Debt Extinguishment - 2020
During the year ended December 31, 2020, we used the net proceeds from the offering of the additional 9.875% 2025 Senior Secured Notes to repurchase $736 million aggregate principal amount of our outstanding senior notes of various series, which resulted in a net debt reduction of $181 million. We also repurchased an additional $35 million aggregate principal amount of our outstanding senior notes of various series and we redeemed $7 million aggregate principal amount of our outstanding 2020 IRBs, with cash on hand.
Additionally, in connection with the AK Steel Merger, we purchased $364 million aggregate principal amount of 7.625% 2021 AK Senior Notes and $311 million aggregate principal amount of 7.50% 2023 AK Senior Notes upon early settlement of tender offers made by Cliffs. The net proceeds from the offering of 6.75% 2026 Senior Secured Notes, along with a portion of the ABL Facility borrowings, were used to fund such purchases. As the 7.625% 2021 AK Senior Notes and 7.50% 2023 AK Senior Notes were recorded at fair value just prior to being purchased, there was no gain or loss on extinguishment. Additionally, in connection with the final settlement of the tender offers, we purchased $9 million aggregate principal amount of the 7.625% 2021 AK Senior Notes and $56 million aggregate principal amount of the 7.50% 2023 AK Senior Notes with cash on hand.
|
| | | | | | | |
| | (In Millions) |
| | December 31, 2018 | | December 31, 2017 |
Available borrowing base on ABL Facility1 | $ | 323.7 |
| | $ | 273.2 |
|
Letter of credit obligations and other commitments2 | (55.0 | ) | | (46.5 | ) |
Borrowing capacity available3 | $ | 268.7 |
| | $ | 226.7 |
|
| | | | |
1 The ABL Facility has a maximum borrowing base of $450 million, determined by applying customary advance rates to eligible accounts receivable, inventory and certain mobile equipment. |
2 We issued standby letters of credit with certain financial institutions in order to support business obligations including, but not limited to, workers compensation, environmental obligations and a Metallics energy supply agreement. |
3 As of December 31, 2018 and 2017 we had no loans drawn under the ABL Facility. |
| | | | | | | | | | | |
| (In Millions) |
| Year Ended
December 31, 2020 |
| Debt Extinguished | | Gain (Loss) on Extinguishment |
| 7.625% 2021 AK Senior Notes | $ | 373 | | | $ | 0 | |
| 7.50% 2023 AK Senior Notes | 367 | | | 3 | |
| 4.875% 2024 Senior Secured Notes | 6 | | | 1 | |
| 6.375% 2025 Senior Notes | 168 | | | 21 | |
| 1.50% 2025 Convertible Senior Notes | 20 | | | 1 | |
| 5.75% 2025 Senior Notes | 77 | | | 16 | |
| 7.00% 2027 Senior Notes | 262 | | | 27 | |
| 5.875% 2027 Senior Notes | 195 | | | 49 | |
| 6.25% 2040 Senior Notes | 36 | | | 13 | |
| 6.375% 2025 AK Senior Notes | 9 | | | (1) | |
| Total | $ | 1,513 | | | $ | 130 | |
Subsequent to the year ended December 31, 2020, we consummated an underwritten public offering of our common shares and a private offering of new senior unsecured notes. We intend to use the net proceeds to us from the underwritten public offering of our common shares, plus cash on hand, to redeem up to approximately $334 million aggregate principal amount of our outstanding 9.875% 2025 Senior Secured Notes. We intend to use any remaining net proceeds from the underwritten public offering of our common shares following such redemption to reduce borrowings under our ABL Facility. We intend to use the net proceeds from the private notes offering to redeem all of our outstanding 4.875% 2024 Senior Secured Notes, 7.625% 2021 AK Senior Notes, 7.50% 2023 AK Senior Notes, 6.375% 2025 Senior Notes and 6.375% 2025 AK Senior Notes, and pay fees and expenses in connection with such redemptions, and reduce borrowings under our ABL Facility. Refer to NOTE 22 - SUBSEQUENT EVENTS for further information regarding the offerings consummated subsequent to the year ended December 31, 2020.
Debt Extinguishment - 2019
During the year ended December 31, 2019, we used the net proceeds from the issuance of $750 million aggregate principal amount of 5.875% 2027 Senior Notes, along with cash on hand, to redeem in full all of our outstanding 4.875% 2021 Senior Notes and to fund the repurchase of $600 million aggregate principal amount of our outstanding 5.75% 2025 Senior Notes in a tender offer.
The following is a summary of the debt extinguished and the respective impact on extinguishment:
| | | | | | | | | | | |
| (In Millions) |
| Year Ended
December 31, 2019 |
| Debt Extinguished | | (Loss) on Extinguishment |
| 4.875% 2021 Senior Notes | $ | 124 | | | $ | (5) | |
| 5.75% 2025 Senior Notes | 600 | | | (13) | |
| Total | $ | 724 | | | $ | (18) | |
Debt Extinguishment - 2018
During the year ended December 31, 2018, we redeemed in full all of our outstanding 5.90% 2020 Senior Notes and 4.80% 2020 Senior Notes with cash on hand. Additionally, we purchased certain of our 4.875% 2021 Senior Notes and 5.75% 2025 Senior Notes.
The following is a summary of the debt extinguished and the respective impact on extinguishment:
| | | | | | | | | | | |
| (In Millions) |
| Year Ended
December 31, 2018 |
| Debt Extinguished | | (Loss) on Extinguishment |
| 5.90% 2020 Senior Notes | $ | 89 | | | $ | (3) | |
| 4.80% 2020 Senior Notes | 122 | | | (4) | |
| 4.875% 2021 Senior Notes | 14 | | | 0 | |
| 5.75% 2025 Senior Notes | 2 | | | 0 | |
| Total | $ | 227 | | | $ | (7) | |
Debt Maturities
The following represents a summary of our debt instrument maturities based on the principal amounts outstanding at December 31, 2020:
| | | | | |
| (In Millions) |
| Maturities of Debt |
| 2021 | $ | 34 | |
| 2022 | 0 | |
| 2023 | 13 | |
| 2024 | 457 | |
| 2025 | 1,740 | |
| Thereafter | 3,351 | |
| Total maturities of debt | $ | 5,595 | |
NOTE 79 - FAIR VALUE OF FINANCIAL INSTRUMENTS
There were no significant assets or liabilities measured at fair value as of December 31, 2020. The following represents the assets and liabilities measured at fair value:
|
| | | | | | | | | | | | | | | |
| | (In Millions) |
| | December 31, 2018 |
| | Quoted Prices in Active Markets for Identical Assets/Liabilities (Level 1) | | Significant Other Observable Inputs (Level 2) | | Significant Unobservable Inputs (Level 3) | | Total |
| Assets: | | | | | | | |
| Cash equivalents | $ | 0.8 |
| | $ | 542.6 |
| | $ | — |
| | $ | 543.4 |
|
| Derivative assets | — |
| | 0.1 |
| | 91.4 |
| | 91.5 |
|
| Total | $ | 0.8 |
| | $ | 542.7 |
| | $ | 91.4 |
| | $ | 634.9 |
|
| Liabilities: | | | | | | | |
| Derivative liabilities | $ | — |
| | $ | 3.7 |
| | $ | — |
| | $ | 3.7 |
|
| Total | $ | — |
| | $ | 3.7 |
| | $ | — |
| | $ | 3.7 |
|
|
| | | | | | | | | | | | | | | |
| | (In Millions) |
| | December 31, 2017 |
| | Quoted Prices in Active Markets for Identical Assets/Liabilities (Level 1) | | Significant Other Observable Inputs (Level 2) | | Significant Unobservable Inputs (Level 3) | | Total |
| Assets: | | | | | | | |
| Cash equivalents | $ | 66.3 |
| | $ | 550.6 |
| | $ | — |
| | $ | 616.9 |
|
| Derivative assets | — |
| | — |
| | 37.9 |
| | 37.9 |
|
| Total | $ | 66.3 |
| | $ | 550.6 |
| | $ | 37.9 |
| | $ | 654.8 |
|
| Liabilities: | | | | | | | |
| Derivative liabilities | $ | — |
| | $ | 0.3 |
| | $ | 1.7 |
| | $ | 2.0 |
|
| Total | $ | — |
| | $ | 0.3 |
| | $ | 1.7 |
| | $ | 2.0 |
|
Financial assets classified in Level 1 included money market funds atvalue as of December 31, 2018 and money market funds and treasury bonds at December 31, 2017. The valuation2019:
| | | | | | | | | | | | | | | | | | | | | | | |
| (In Millions) |
| December 31, 2019 |
| Quoted Prices in Active
Markets for Identical
Assets/Liabilities (Level 1) | | Significant Other Observable Inputs
(Level 2) | | Significant Unobservable Inputs
(Level 3) | | Total |
| Assets: | | | | | | | |
| Cash equivalents - Commercial paper | $ | 0 | | | $ | 188 | | | $ | 0 | | | $ | 188 | |
| Other current assets: | | | | | | | |
| Customer supply agreement | 0 | | | 0 | | | 45 | | | 45 | |
| Total | $ | 0 | | | $ | 188 | | | $ | 45 | | | $ | 233 | |
The valuation of financial assets and liabilities classified in Level 2 iswas determined using a market approach based upon quoted prices for similar assets and liabilities in active markets, or other inputs that arewere observable. Level 2 assets included commercial paper, certificates of deposit and commodity hedge contracts at December 31, 2018 and commercial paper and certificates of deposits at December 31, 2017. Level 2 liabilities included commodity hedge contracts at December 31, 2018 and 2017.
The Level 3 assets and liabilities include derivative assets that consist of freestanding derivative instruments related to a certainOur supply agreement and derivative assets and liabilities related to certain provisional pricing arrangements with our customers.
The supply agreement included in our Level 3 assets containArcelorMittal USA contained provisions for supplemental revenue or refunds based on the average annual daily marketHRC price for hot-rolled coil steel in the year the iron ore product iswas consumed in the customer’sArcelorMittal USA’s blast furnaces. We accountaccounted for these provisions as derivative instruments at the time of sale and adjustadjusted the derivative instruments to fair value through Product revenuesRevenues each reporting period until the product iswas consumed and the amounts arewere settled. We had assets of $89.3 million and $37.9 million at December 31, 2018 and 2017, respectively, related to this supply agreement.
The provisional pricing arrangements included in ourThese instruments were classified as Level 3 assets/liabilities specify provisional price calculations, whereassets. Upon the pricing mechanisms generally are based on market pricing, with the final revenue rate to be based on market inputs at a specified point in time in the future, per the termscompletion of the supply agreements. The difference betweenAM USA Transaction, the estimated final revenue rate at the dateoutstanding derivatives were settled as part of sale and the estimated final revenue rate at the measurement date is characterized as a derivative and is required to be accounted for separately once the revenue has been recognized. The derivative instruments are adjusted to fair value through Product revenues each reporting period based upon current market data and forward-looking estimates provided by management until the final revenue rates are determined. We had assets of $2.1 million at December 31, 2018 compared to liabilities of $1.7 million related to provisional pricing arrangements at December 31, 2017.
The following table illustrates information about quantitative inputs and assumptions for the derivative assets and derivative liabilities categorized in Level 3 of the fair value hierarchy:
|
| | | | | | | | | | |
| Qualitative/Quantitative Information About Level 3 Fair Value Measurements |
| | | Fair Value at December 31, 2018 (In Millions) | | Balance Sheet Location | | Valuation Technique | | Unobservable Input | | Point Estimate |
| |
| Customer supply agreement | | $89.3 | | Derivative assets | | Market Approach | | Management's Estimate of Market Hot-Rolled Coil Steel per net ton | | $750 |
| Provisional pricing arrangements | | $2.1 | | Derivative assets | | Market Approach | | Management's Estimate of Platts 62% Price per dry metric ton | | $68 |
The significant unobservable input used in the fair value measurement of our customer supply agreement is a forward-looking estimate of the average annual daily market price for hot-rolled coil steel determined by management.
The significant unobservable inputs used in the fair value measurement of our provisional pricing arrangements are management’s estimates of Platts 62% Price based upon current market data and index pricing, of which includes forward-looking estimates determined by management.acquisition accounting.
The following tables represent a reconciliation of the changes in fair value of financial instruments measured at fair value on a recurring basis using significant unobservable inputs (Level 3):
| | | | | | | | | | | |
| (In Millions) |
| Level 3 Assets |
| 2020 | | 2019 |
| Beginning balance - January 1 | $ | 45 | | | $ | 89 | |
| Total gains included in earnings | 122 | | | 79 | |
| Settlements | (27) | | | (123) | |
| Settlement of pre-existing relationship | (140) | | | 0 | |
| Ending balance - December 31 | $ | 0 | | | $ | 45 | |
| Total gains for the period included in earnings attributable to the change in unrealized gains on assets still held at the reporting date | $ | 0 | | | $ | 45 | |
|
| | | | | | | | | | | | | | | |
| | |
| | Derivative Assets1 (Level 3) | | Derivative Liabilities (Level 3) |
| | Year Ended
December 31, | | Year Ended
December 31, |
| | 2018 | | 2017 | | 2018 | | 2017 |
| Beginning balance - January 1 | $ | 49.5 |
| | $ | 30.1 |
| | $ | (1.7 | ) | | $ | — |
|
| Total gains (losses) | | | | | | | |
| Included in earnings | 428.7 |
| | 176.2 |
| | (6.1 | ) | | (55.6 | ) |
| Settlements | (386.8 | ) | | (168.4 | ) | | 7.8 |
| | 53.9 |
|
| Ending balance - December 31 | $ | 91.4 |
| | $ | 37.9 |
| | $ | — |
| | $ | (1.7 | ) |
| Total gains (losses) for the period included in earnings attributable to the change in unrealized gains (losses) on assets still held at the reporting date | $ | 91.4 |
| | $ | 37.9 |
| | $ | — |
| | $ | (1.7 | ) |
| | | | | | | | |
1 Beginning balance as of January 1, 2018 includes an $11.6 million adjustment for adoption of Topic 606. |
The carrying values of certain financial instruments (e.g. Accounts receivable, net, Accounts payable and Other current liabilities) approximate fair value and, therefore, have been excluded from the table below. A summary of the carrying value and fair value of other financial instruments were as follows:
|
| | | | | | | | | | | | | | | | | |
| | | | (In Millions) |
| | | | December 31, 2018 | | December 31, 2017 |
| | Classification | | Carrying Value | | Fair Value | | Carrying Value | | Fair Value |
| Long-term debt: | | | | | | | | | |
| Secured Notes: | | | | | | | | | |
| $400 Million 4.875% 2024 Senior Notes | Level 1 | | $ | 392.1 |
| | $ | 370.2 |
| | $ | 390.3 |
| | $ | 398.0 |
|
| Unsecured Notes: | | | | | | | | | |
| $400 Million 5.90% 2020 Senior Notes | Level 1 | | — |
| | — |
| | 88.6 |
| | 88.0 |
|
| $500 Million 4.80% 2020 Senior Notes | Level 1 | | — |
| | — |
| | 122.0 |
| | 118.8 |
|
| $700 Million 4.875% 2021 Senior Notes | Level 1 | | 123.8 |
| | 122.3 |
| | 138.0 |
| | 130.8 |
|
| $316.25 Million 1.50% 2025 Convertible Senior Notes | Level 1 | | 235.2 |
| | 352.4 |
| | 224.1 |
| | 352.9 |
|
| $1.075 Billion 5.75% 2025 Senior Notes | Level 1 | | 1,048.8 |
| | 962.0 |
| | 1,047.2 |
| | 1,029.3 |
|
| $800 Million 6.25% 2040 Senior Notes | Level 1 | | 292.8 |
| | 232.8 |
| | 292.6 |
| | 227.1 |
|
| ABL Facility | Level 2 | | — |
| | — |
| | — |
| | — |
|
| Fair Value Adjustment to Interest Rate Hedge | Level 2 | | 0.2 |
| | 0.2 |
| | 1.4 |
| | 1.4 |
|
| Total long-term debt | | | $ | 2,092.9 |
| | $ | 2,039.9 |
| | $ | 2,304.2 |
| | $ | 2,346.3 |
|
| | | | | | | | | | | | | | | | | | | | | | | | | | | | | |
| | | (In Millions) |
| | | December 31, 2020 | | December 31, 2019 |
| Classification | | Carrying
Value | | Fair Value | | Carrying
Value | | Fair Value |
| Senior notes | Level 1 | | $ | 3,802 | | | $ | 4,446 | | | $ | 2,114 | | | $ | 2,237 | |
| IRBs due 2024 to 2028 | Level 1 | | 94 | | | 91 | | | 0 | | | 0 | |
| EDC Revolving Facility - outstanding balance | Level 2 | | 18 | | | 18 | | | 0 | | | 0 | |
| ABL Facility - outstanding balance | Level 2 | | 1,510 | | | 1,510 | | | 0 | | | 0 | |
| Total | | | $ | 5,424 | | | $ | 6,065 | | | $ | 2,114 | | | $ | 2,237 | |
The fair value of both current and long-term debt was determined using quoted market prices.
NOTE 810 - PENSIONS AND OTHER POSTRETIREMENT BENEFITS
We offer defined benefit pension plans, defined contribution pension plans and OPEB plans primarily consistingto a significant portion of retiree healthcare benefits,our employees and retirees. Benefits are also provided through multiemployer plans for certain union members.
As a result of the acquisitions of AK Steel and ArcelorMittal USA, we assumed the obligations under their defined benefit pension plans, OPEB plans, defined contribution plans and commitments to most employees as partmultiemployer pension plans according to collective bargaining agreements that cover certain union-represented employees. The AK Steel defined benefit pension plans and OPEB plans acquired amounted to a benefit obligation, net of assets of $949 million based on a total compensationMarch 13, 2020 measurement. The ArcelorMittal USA defined benefit pension plans and benefits program. OPEB plans acquired amounted to a benefit obligation, net of assets of $3,294 million based on a December 9, 2020 measurement.
Defined Benefit Pension Plans
The defined benefit pension plans are largely noncontributory and benefitslimited in participation. Most plans are closed to new participants with only the legacy iron ore hourly and salaried plans still open. The pension benefit
calculations vary by plan, but are generally are based on a minimum formula or employees’employee's years of service and average earnings forcompensation or a defined period prior to retirement.fixed rate and years of service. Certain salaried plans calculate benefits using a cash balance formula, which earns interest credits and allocations based on a percent of pay.
OPEB Plans
We offer retiree medical coveragepostretirement health care and life insurance benefits to hourly retirees through various plans. The vast majority of our USW-represented mines. Aplans are closed to new four-year agreement with the USW was entered into on October 12, 2018, and is retroactively effective from October 1, 2018 through September 30, 2022. The 2018 USW agreement established the set fixed monthly medical premiums for participants who retired prior to January 1, 2015. These fixed premiums will expire on December 31, 2020 and revert to increasing premiums based a cost-sharing formula thereafter. The agreement also provides for an OPEB cap that limits the amount of contributions that we have to make toward retiree medical insurance coverage for each retiree and spouse of a retiree per calendar year who retired on or after January 1, 2015. The amount of the annual OPEB cap is based upon the gross plan costs we incurred in 2014. The OPEB cap does not apply to surviving spouses.participants. In lieu of retiree medical coverage, USW-representedmany union-represented employees hired after September 1, 2016 receive a 401(k) contribution of $0.50 per hour worked to a restricted Retiree Health Care Account. Beginning January 1, 2019,Cost sharing features between the hourly contribution rate increased to $0.60 per hour worked.
In addition, we currently provide various levels of retirement health careemployer and OPEB to some full-time employees who meet certain length of serviceretiree vary by plan and age requirements (a portion of which is pursuant to collective bargaining agreements). Mostseveral plans require retiree contributions and have deductibles, co-pay requirements and benefit limits. Most bargaining unit plans require retiree contributions and co-pays for medical and prescription drug coverage. There is a cap on our cost for medical coverage under the salaried plans. The annual limit applies to each covered participant and equals $7,000 for coverage prior to age 65, with the retiree’s participation adjusted based on the age at which the retiree’s benefits commence. We do not provide OPEB for most salaried employees hired after January 1, 1993.include employer caps. Retiree healthcare coverage is provided through programs administered by insurance companies whose charges are based on benefits paid.
The following table summarizes Certain labor agreements require the annual expense (income) recognized relatedfunding of VEBAs, which, depending on funding levels, may be used to reimburse the retirement plans:employer for paid benefits.
|
| | | | | | | | | | | |
| | (In Millions) |
| | 2018 | | 2017 | | 2016 |
| Defined benefit pension plans | $ | 12.7 |
| | $ | 18.0 |
| | $ | 16.5 |
|
| Defined contribution pension plans | 3.1 |
| | 2.9 |
| | 2.8 |
|
| Other postretirement benefits | (5.9 | ) | | (6.1 | ) | | (4.0 | ) |
| Total | $ | 9.9 |
| | $ | 14.8 |
| | $ | 15.3 |
|
Obligations and Funded Status
The following tables and information provide additional disclosures:
|
| | | | | | | | | | | | | | | |
| | (In Millions) |
| | Pension Benefits | | Other Benefits |
| Change in benefit obligations: | 2018 | | 2017 | | 2018 | | 2017 |
| Benefit obligations — beginning of year | $ | 973.1 |
| | $ | 931.6 |
| | $ | 265.9 |
| | $ | 264.6 |
|
| Service cost (excluding expenses) | 18.7 |
| | 17.1 |
| | 2.2 |
| | 1.8 |
|
| Interest cost | 30.3 |
| | 30.5 |
| | 8.3 |
| | 8.3 |
|
| Plan amendments | 2.2 |
| | — |
| | 12.8 |
| | — |
|
| Curtailment gain | (0.9 | ) | | — |
| | — |
| | — |
|
| Actuarial (gain) loss | (57.0 | ) | | 54.6 |
| | (29.4 | ) | | 7.4 |
|
| Benefits paid | (60.7 | ) | | (60.7 | ) | | (24.4 | ) | | (21.4 | ) |
| Participant contributions | — |
| | — |
| | 5.6 |
| | 4.6 |
|
| Federal subsidy on benefits paid | — |
| | — |
| | 0.9 |
| | 0.6 |
|
| Benefit obligations — end of year | $ | 905.7 |
| | $ | 973.1 |
| | $ | 241.9 |
| | $ | 265.9 |
|
| | | | | | | | |
| Change in plan assets: | | | | | | | |
| Fair value of plan assets — beginning of year | $ | 749.8 |
| | $ | 685.8 |
| | $ | 262.5 |
| | $ | 253.0 |
|
| Actual return on plan assets | (29.6 | ) | | 100.2 |
| | (8.2 | ) | | 24.2 |
|
| Participant contributions | — |
| | — |
| | 0.5 |
| | 0.3 |
|
| Employer contributions | 27.6 |
| | 24.4 |
| | 3.0 |
| | 1.7 |
|
| Asset transfers | 0.1 |
| | 0.1 |
| | — |
| | — |
|
| Benefits paid | (60.7 | ) | | (60.7 | ) | | (17.6 | ) | | (16.7 | ) |
| Fair value of plan assets — end of year | $ | 687.2 |
| | $ | 749.8 |
| | $ | 240.2 |
| | $ | 262.5 |
|
| | | | | | | | |
| Funded status at December 31: | | | | | | | |
| Fair value of plan assets | $ | 687.2 |
| | $ | 749.8 |
| | $ | 240.2 |
| | $ | 262.5 |
|
| Benefit obligations | (905.7 | ) | | (973.1 | ) | | (241.9 | ) | | (265.9 | ) |
| Amount recognized at December 31 | $ | (218.5 | ) | | $ | (223.3 | ) | | $ | (1.7 | ) | | $ | (3.4 | ) |
| | | | | | | | |
| Amounts recognized in Statements of Financial Position: | | | | | | | |
| Non-current assets | $ | — |
| | $ | — |
| | $ | 32.1 |
| | $ | 35.4 |
|
| Current liabilities | (0.1 | ) | | (0.5 | ) | | (3.5 | ) | | (3.9 | ) |
| Non-current liabilities | (218.4 | ) | | (222.8 | ) | | (30.3 | ) | | (34.9 | ) |
| Total amount recognized | $ | (218.5 | ) | | $ | (223.3 | ) | | $ | (1.7 | ) | | $ | (3.4 | ) |
| | | | | | | | |
| Amounts recognized in accumulated other comprehensive loss: | | | | | | | |
| Net actuarial loss | $ | 330.1 |
| | $ | 318.7 |
| | $ | 82.1 |
| | $ | 88.3 |
|
| Prior service cost (credit) | 8.5 |
| | 8.8 |
| | (9.9 | ) | | (25.6 | ) |
| Net amount recognized | $ | 338.6 |
| | $ | 327.5 |
| | $ | 72.2 |
| | $ | 62.7 |
|
|
| | | | | | | | | | | | | | | | | | | | | | | | | | | | | | | |
| | (In Millions) |
| | 2018 |
| | Pension Plans | | Other Benefits |
| | Salaried | | Hourly | | Mining | | SERP | | Total | | Salaried | | Hourly | | Total |
| Fair value of plan assets | $ | 249.8 |
| | $ | 429.4 |
| | $ | 8.0 |
| | $ | — |
| | $ | 687.2 |
| | $ | — |
| | $ | 240.2 |
| | $ | 240.2 |
|
| Benefit obligation | (340.8 | ) | | (548.9 | ) | | (10.7 | ) | | (5.3 | ) | | (905.7 | ) | | (32.9 | ) | | (209.0 | ) | | (241.9 | ) |
| Funded status | $ | (91.0 | ) | | $ | (119.5 | ) | | $ | (2.7 | ) | | $ | (5.3 | ) | | $ | (218.5 | ) | | $ | (32.9 | ) | | $ | 31.2 |
| | $ | (1.7 | ) |
| | | | | | | | | | | | | | | | |
| | 2017 |
| | Pension Plans | | Other Benefits |
| | Salaried | | Hourly | | Mining | | SERP | | Total | | Salaried | | Hourly | | Total |
| Fair value of plan assets | $ | 269.4 |
| | $ | 473.0 |
| | $ | 7.4 |
| | $ | — |
| | $ | 749.8 |
| | $ | — |
| | $ | 262.5 |
| | $ | 262.5 |
|
| Benefit obligation | (368.0 | ) | | (590.0 | ) | | (10.3 | ) | | (4.8 | ) | | (973.1 | ) | | (37.7 | ) | | (228.2 | ) | | (265.9 | ) |
| Funded status | $ | (98.6 | ) | | $ | (117.0 | ) | | $ | (2.9 | ) | | $ | (4.8 | ) | | $ | (223.3 | ) | | $ | (37.7 | ) | | $ | 34.3 |
| | $ | (3.4 | ) |
The pension and OPEB plans in 2018 experienced a net actuarial gain of $57.0 million and $29.4 million, respectively. The increase in discount rates due to market conditions was the primary driver, which resulted in gains of $75.7 million and $19.0 million for the pension and OPEB plans, respectively. The net gain was offset partially by losses of $21.7 million for the pensions plans and $2.3 million for the OPEB plans relating to demographic experience. The adoption of the new projection scale resulted in gains totaling $3.0 million for the pension plans and $0.8 million for the OPEB plans. Additionally, an update to the assumed per capita cost of medical benefits resulted in a gain of $11.9 million for the OPEB plans.
The pension and OPEB plans in 2017 experienced a net actuarial loss of $54.6 million and $7.4 million, respectively. The decrease in discount rates due to market conditions was the primary driver, which resulted in losses of $46.1 million and $12.6 million for the pension and OPEB plans, respectively. The adoption of the new projection scale resulted in gains totaling $6.1 million for the pension plans and $1.9 million for the OPEB plans. | | | | | | | | | | | | | | | | | | | | | | | |
| (In Millions) |
| Pension Benefits | | OPEB |
| Change in benefit obligations: | 2020 | | 2019 | | 2020 | | 2019 |
| Benefit obligations — beginning of year | $ | 1,021 | | | $ | 906 | | | $ | 255 | | | $ | 242 | |
| Service cost | 23 | | | 17 | | | 8 | | | 2 | |
| Interest cost | 64 | | | 35 | | | 19 | | | 10 | |
| | | | | | | |
| Actuarial loss | 162 | | | 112 | | | 14 | | | 19 | |
| Benefits paid | (146) | | | (62) | | | (89) | | | (26) | |
| Participant contributions | 0 | | | 0 | | | 22 | | | 6 | |
| Acquired through business combinations | 5,535 | | | 0 | | | 3,528 | | | 0 | |
| Effect of settlement | (94) | | | 0 | | | 0 | | | 0 | |
| Other | 0 | | | 13 | | | 0 | | | 2 | |
| Benefit obligations — end of year | $ | 6,565 | | | $ | 1,021 | | | $ | 3,757 | | | $ | 255 | |
| | | | | | | |
| Change in plan assets: | | | | | | | |
| Fair value of plan assets — beginning of year | $ | 749 | | | $ | 687 | | | $ | 260 | | | $ | 240 | |
| Actual return on plan assets | 472 | | | 98 | | | 45 | | | 35 | |
| Participant contributions | 0 | | | 0 | | | 17 | | | 1 | |
| Employer contributions | 50 | | | 16 | | | 30 | | | 3 | |
| Benefits paid | (146) | | | (62) | | | (88) | | | (19) | |
| Acquired through business combinations | 4,301 | | | 0 | | | 519 | | | 0 | |
| Effect of settlement | (94) | | | 0 | | | 0 | | | 0 | |
| Other | 0 | | | 10 | | | 0 | | | 0 | |
| Fair value of plan assets — end of year | $ | 5,332 | | | $ | 749 | | | $ | 783 | | | $ | 260 | |
| Funded status | $ | (1,233) | | | $ | (272) | | | $ | (2,974) | | | $ | 5 | |
| | | | | | | |
| Amounts recognized in Statements of Financial Position: | | | | | | | |
| Non-current assets | $ | 3 | | | $ | 0 | | | $ | 54 | | | $ | 49 | |
| Current liabilities | (12) | | | 0 | | | (139) | | | (4) | |
| Non-current liabilities | (1,224) | | | (272) | | | (2,889) | | | (40) | |
| Total amount recognized | $ | (1,233) | | | $ | (272) | | | $ | (2,974) | | | $ | 5 | |
| | | | | | | |
| Amounts recognized in accumulated other comprehensive loss: | | | | | | | |
| Net actuarial loss | $ | 164 | | | $ | 382 | | | $ | 56 | | | $ | 73 | |
| Prior service cost (credit) | 6 | | | 7 | | | (6) | | | (8) | |
| Net amount recognized | $ | 170 | | | $ | 389 | | | $ | 50 | | | $ | 65 | |
| | | | | | | |
The accumulated benefit obligation for all defined benefit pension plans was $896.8$6,537 million and $963.0$1,010 million at December 31, 20182020 and 2017,2019, respectively.
Components of Net Periodic Benefit Cost (Credit)
| | | | | | | | | | | | | | | | | | | | | | | | | | | | | | | | | | | |
| (In Millions) |
| Pension Benefits | | OPEB |
| 2020 | | 2019 | | 2018 | | 2020 | | 2019 | | 2018 |
| Service cost | $ | 23 | | | $ | 17 | | | $ | 19 | | | $ | 8 | | | $ | 2 | | | $ | 2 | |
| Interest cost | 64 | | | 35 | | | 30 | | | 19 | | | 10 | | | 8 | |
| Expected return on plan assets | (140) | | | (55) | | | (60) | | | (20) | | | (17) | | | (18) | |
| Amortization: | | | | | | | | | | | |
| Net actuarial loss | 27 | | | 24 | | | 21 | | | 3 | | | 5 | | | 5 | |
| Prior service costs (credits) | 1 | | | 1 | | | 2 | | | (2) | | | (2) | | | (3) | |
| Settlements | (6) | | | 0 | | | 1 | | | 0 | | | 0 | | | 0 | |
| Net periodic benefit cost (credit) | $ | (31) | | | $ | 22 | | | $ | 13 | | | $ | 8 | | | $ | (2) | | | $ | (6) | |
For 2021, we estimate net periodic benefit cost (credit) as follows:
| | | | | |
| (In Millions) |
| Defined benefit pension plans | $ | (168) | |
| OPEB plans | 86 | |
| Total | $ | (82) | |
Components of Accumulated Other Comprehensive Loss (Income)
The following includes details on the significant actuarial losses (gains) impacting the benefit obligation:
| | | | | | | | | | | | | | | | | | | | | | | |
| (In Millions) |
| Pension Benefits | | OPEB |
| 2020 | | 2019 | | 2020 | | 2019 |
| Discount rates | $ | 181 | | | $ | 106 | | | $ | 44 | | | $ | 26 | |
| Demographic (gains) losses | (3) | | | 12 | | | (11) | | | 4 | |
| Mortality | (16) | | | (6) | | | (4) | | | (4) | |
| Per capita claims | 0 | | | 0 | | | (10) | | | (9) | |
| Other | 0 | | | 0 | | | (5) | | | 3 | |
| Actuarial loss on benefit obligation | 162 | | | 112 | | | 14 | | | 20 | |
| Actual returns on assets over expected | (332) | | | (44) | | | (26) | | | (18) | |
| Amortization of net actuarial loss | (27) | | | (24) | | | (3) | | | (5) | |
| Amortization of prior service credits (costs) | (1) | | | (1) | | | 2 | | | 2 | |
| Settlements | 6 | | | 0 | | | 0 | | | 0 | |
| Other | (27) | | | 7 | | | (2) | | | (5) | |
| Total recognized in accumulated other comprehensive loss (income) | $ | (219) | | | $ | 50 | | | $ | (15) | | | $ | (6) | |
|
| | | | | | | | | | | | | | | | | | | | | | | |
| | (In Millions) |
| | Pension Benefits | | Other Benefits |
| | 2018 | | 2017 | | 2016 | | 2018 | | 2017 | | 2016 |
| Service cost | $ | 18.7 |
| | $ | 17.1 |
| | $ | 17.6 |
| | $ | 2.2 |
| | $ | 1.8 |
| | $ | 1.7 |
|
| Interest cost | 30.3 |
| | 30.5 |
| | 30.3 |
| | 8.3 |
| | 8.3 |
| | 9.1 |
|
| Expected return on plan assets | (60.0 | ) | | (54.5 | ) | | (54.7 | ) | | (18.4 | ) | | (17.7 | ) | | (17.1 | ) |
| Amortization: |
| |
| |
| |
| |
| |
|
| Prior service costs (credits) | 2.2 |
| | 2.6 |
| | 2.2 |
| | (3.0 | ) | | (3.0 | ) | | (3.7 | ) |
| Net actuarial loss | 21.2 |
| | 22.3 |
| | 21.1 |
| | 5.0 |
| | 4.5 |
| | 6.0 |
|
| Curtailments | 0.3 |
| | — |
| | — |
| | — |
| | — |
| | — |
|
| Net periodic benefit cost (credit) | $ | 12.7 |
| | $ | 18.0 |
| | $ | 16.5 |
| | $ | (5.9 | ) | | $ | (6.1 | ) | | $ | (4.0 | ) |
| Curtailment effects | (0.3 | ) | | — |
| | — |
| | — |
| | — |
| | — |
|
| Current year actuarial loss (gain) | 31.6 |
| | 9.3 |
| | 37.8 |
| | (2.9 | ) | | 1.2 |
| | (8.1 | ) |
| Amortization of net loss | (21.2 | ) | | (22.3 | ) | | (21.1 | ) | | (5.0 | ) | | (4.5 | ) | | (6.0 | ) |
| Current year prior service cost | 2.2 |
| | — |
| | 5.7 |
| | 12.8 |
| | — |
| | 9.8 |
|
| Amortization of prior service credit (cost) | (2.2 | ) | | (2.6 | ) | | (2.2 | ) | | 3.0 |
| | 3.0 |
| | 3.7 |
|
| Total recognized in other comprehensive income (loss) | $ | 10.1 |
| | $ | (15.6 | ) | | $ | 20.2 |
| | $ | 7.9 |
| | $ | (0.3 | ) | | $ | (0.6 | ) |
Total recognized in net periodic cost and other comprehensive income (loss) | $ | 22.8 |
| | $ | 2.4 |
| | $ | 36.7 |
| | $ | 2.0 |
| | $ | (6.4 | ) | | $ | (4.6 | ) |
Annual contributions to the pension plans are made within income tax deductibility restrictions in accordance with statutory regulations. OPEB plans are not subject to minimum regulatory funding requirements, but rather amounts are contributed pursuant to bargaining agreements.
| | | | | | | | | | | | | | | | | | | | | | | | | | |
| | (In Millions) |
| | Pension
Benefits | | Other Benefits |
| Company Contributions (Reimbursements) | | VEBA | | Direct
Payments | | Total |
| 2019 | | $ | 16 | | | $ | 0 | | | $ | 4 | | | $ | 4 | |
| 2020 | | 50 | | | 0 | | | 25 | | | 25 | |
2021 (Expected)1 | | 202 | | | (16) | | | 144 | | | 128 | |
| | | | | | | | |
1 Pursuant to the applicable bargaining agreements, benefits can be paid from certain VEBAs that are at least 70% funded (all VEBAs are over 70% funded at December 31, 2020). Certain agreements with plans holding VEBA assets have capped healthcare costs. For the ArcelorMittal USA VEBA, depending on funding levels and/or Company profits, we may withdraw money from the VEBA plans to the extent funds are available for costs in excess of the cap. The 2021 expected pension contributions include $118 million in deferred 2020 pension contributions in connection with the CARES Act that were paid on January 4, 2021. |
Estimated Future Benefit Payments
| | | | | | | | | | | |
| (In Millions) |
| Pension
Benefits | | OPEB |
| 2021 | $ | 486 | | | $ | 191 | |
| 2022 | 462 | | | 185 | |
| 2023 | 480 | | | 180 | |
| 2024 | 455 | | | 178 | |
| 2025 | 433 | | | 176 | |
| 2026-2030 | 1,983 | | | 884 | |
Assumptions
The discount rate for determining PBO isrates used to measure plan liabilities as of the December 31 measurement date are determined individually for each plan as noted in the assumption chart below.plan. The discount rates are determined by matching the projected cash flows used to determine the PBO and APBOplan liabilities to a projected yield curve of 1,101 Aa gradedhigh-quality corporate bonds available at the measurement date. Discount rates for expense are calculated using the granular approach for each plan.
Depending on the plan, we use either company-specific base mortality tables or tables issued by the Society of Actuaries. We adopted the Pri-2012 mortality tables from the Society of Actuaries in the 40th to 90th percentiles. These bonds are either noncallable or callable with make-whole provisions.
2019. On December 31, 2018,2020, the assumed mortality improvement projection was changedupdated from generational scale MP-2017MP-2019 to generational scale MP-2018. The healthy mortality assumption remains the RP-2014 mortality tables with blue collar adjustmentsMP-2020 for the Iron Hourly Pension and Hourly OPEB plans, with white collar adjustments for the the Salaried OPEB Plan, and without adjustments for the Salaried and Ore Mining Pension Plans. On December 31, 2017, the assumedPri-2012 mortality improvement projection was changed from generational scale MP-2016 to generational scale MP-2017.tables.
Weighted-averageThe following represents weighted-average assumptions used to determine benefit obligations at December 31 were:obligations:
| | | | | | | | | | | | | | | | | | | | | | | | | | | | | | | | | | | |
| Pension Benefits | | OPEB |
| December 31, | | December 31, |
| 2020 | | 2019 | | 2020 | | 2019 |
| Discount rate | 2.34 | % | | 3.27 | % | | 2.71 | % | | 3.28 | % |
| Interest crediting rate | 5.25 | | | 6.00 | | | N/A | | | N/A | |
| Compensation rate increase | 2.56 | | | 2.53 | | | 3.00 | | | 3.00 | |
|
| | | | | | | | | | | |
| | Pension Benefits | | Other Benefits |
| | 2018 | | 2017 | | 2018 | | 2017 |
| Discount rate: | | | | | | | | | | | |
| Iron Hourly Pension Plan | 4.31 | % | | 3.60 | % | | N/A | % | | N/A | % |
| Salaried Pension Plan | 4.21 | | | 3.52 | | | N/A | | | N/A | |
| Ore Mining Pension Plan | 4.33 | | | 3.61 | | | N/A | | | N/A | |
| Supplemental Executive Retirement Plan | 4.22 | | | 3.50 | | | N/A | | | N/A | |
| Hourly OPEB Plan | N/A | | | N/A | | | 4.29 | | | 3.60 | |
| Salaried OPEB Plan | N/A | | | N/A | | | 4.27 | | | 3.57 | |
| Salaried rate of compensation increase | 3.00 | | | 3.00 | | | 3.00 | | | 3.00 | |
| Hourly rate of compensation increase | 2.00 | | | 2.00 | | | N/A | | | N/A | |
Weighted-averageThe following represents weighted-average assumptions used to determine net benefit cost were:cost:
| | | | | | | | | | | | | | | | | | | | | | | | | | | | | | | | | | | | | | | | | | | | | | | | | | | | | |
| Pension Benefits | | OPEB |
| December 31, | | December 31, |
| 2020 | | 2019 | | 2018 | | 2020 | | 2019 | | 2018 |
| Obligation discount rate | 3.02 | | % | | 4.27 | | % | | 3.58 | | % | | 3.28 | | % | | 4.29 | | % | | 3.60 | | % |
| Service cost discount rate | 3.34 | | | | 4.35 | | | | 3.64 | | | | 3.35 | | | | 4.49 | | | | 3.73 | | |
| Interest cost discount rate | 2.53 | | | | 3.92 | | | | 3.16 | | | | 2.51 | | | | 3.94 | | | | 3.11 | | |
| | | | | | | | | | | | | | | | | |
| Interest crediting rate | 5.50 | | | | 6.00 | | | | 6.00 | | | | N/A | | | N/A | | | N/A | |
| Expected return on plan assets | 7.69 | | | | 8.25 | | | | 8.25 | | | | 6.82 | | | | 7.00 | | | | 7.00 | | |
| Compensation rate increase | 2.56 | | | | 2.53 | | | | 2.49 | | | | 3.00 | | | | 3.00 | | | | 3.00 | | |
|
| | | | | | | | | | | | | | | | | |
| | Pension Benefits | | Other Benefits |
| | 2018 | | 2017 | | 2016 | | 2018 | | 2017 | | 2016 |
| Obligation Discount Rate: | | | | | | | | | | | | | | | | | |
| Iron Hourly Pension Plan | 3.61 | % | | 4.02 | % | | 4.27 | % | | N/A | % | | N/A | % | | N/A | % |
| Salaried Pension Plan | 3.52 | | | 3.91 | | | 4.13 | | | N/A | | | N/A | | | N/A | |
| Ore Mining Pension Plan | 3.61 | | | 4.04 | | | 4.28 | | | N/A | | | N/A | | | N/A | |
| Supplemental Executive Retirement Plan | 3.54 | | | 3.90 | | | 4.01 | | | N/A | | | N/A | | | N/A | |
| Hourly OPEB Plan | N/A | | | N/A | | | N/A | | | 3.60 | | | 4.03 | | | 4.32 | |
| Salaried OPEB Plan | N/A | | | N/A | | | N/A | | | 3.57 | | | 3.98 | | | 4.22 | |
| Service Cost Discount Rate: | | | | | | | | | | | | | | | | | |
| Iron Hourly Pension Plan | 3.76 | | | 4.30 | | | 4.66 | | | N/A | | | N/A | | | N/A | |
| Salaried Pension Plan | 3.53 | | | 3.93 | | | 4.14 | | | N/A | | | N/A | | | N/A | |
| Ore Mining Pension Plan | 3.75 | | | 4.27 | | | 4.60 | | | N/A | | | N/A | | | N/A | |
| Supplemental Executive Retirement Plan | 3.43 | | | 3.69 | | | 3.87 | | | N/A | | | N/A | | | N/A | |
| Hourly OPEB Plan | N/A | | | N/A | | | N/A | | | 3.73 | | | 4.23 | | | 4.56 | |
| Salaried OPEB Plan | N/A | | | N/A | | | N/A | | | 3.76 | | | 4.30 | | | 4.63 | |
| Interest Cost Discount Rate: | | | | | | | | | | | | | | | | | |
| Iron Hourly Pension Plan | 3.21 | | | 3.38 | | | 3.46 | | | N/A | | | N/A | | | N/A | |
| Salaried Pension Plan | 3.08 | | | 3.21 | | | 3.21 | | | N/A | | | N/A | | | N/A | |
| Ore Mining Pension Plan | 3.22 | | | 3.41 | | | 3.48 | | | N/A | | | N/A | | | N/A | |
| Supplemental Executive Retirement Plan | 3.16 | | | 3.36 | | | 3.30 | | | N/A | | | N/A | | | N/A | |
| Hourly OPEB Plan | N/A | | | N/A | | | N/A | | | 3.10 | | | 3.24 | | | 3.48 | |
| Salaried OPEB Plan | N/A | | | N/A | | | N/A | | | 3.15 | | | 3.28 | | | 3.31 | |
| | | | | | | | | | | | | | | | | | |
| Expected return on plan assets | 8.25 | | | 8.25 | | | 8.25 | | | 7.00 | | | 7.00 | | | 7.00 | |
| Salaried rate of compensation increase | 3.00 | | | 3.00 | | | 3.00 | | | 3.00 | | | 3.00 | | | 3.00 | |
| Hourly rate of compensation increase | 2.00 | | | 2.00 | | | 2.00 | | | N/A | | | N/A | | | N/A | |
AssumedThe following represents assumed weighted-average health care cost trend rates at December 31 were:rates:
| | | | | | | | December 31, |
| | 2018 | | 2017 | | 2020 | | 2019 |
| Health care cost trend rate assumed for next year | 6.75 | % | | 7.00 | % | Health care cost trend rate assumed for next year | 6.05 | | % | | 6.50 | | % |
| Ultimate health care cost trend rate | 5.00 | | 5.00 | | Ultimate health care cost trend rate | 4.59 | | | 5.00 | | |
| Year that the ultimate rate is reached | 2026 | | 2026 | | Year that the ultimate rate is reached | 2031 | | 2026 | |
Plan Assets
Our financial objectives with respect to our pension and VEBA plan assets are to fully fund the actuarial accrued liability for each of the plans, to maximize investment returns within reasonable and prudent levels of risk, and to maintain sufficient liquidity to meet benefit obligations on a timely basis.
Our investment objective is to outperform the expected return on assets assumption used in the plans’ actuarial reports over the life of the plans. The expected return on assets takes into account historical returns and estimated future long-term returns based on capital market assumptions applied to the asset allocation strategy. The expected return is net of investment expenses paid by the plans. In addition, investment performance is monitored on a quarterly basis by benchmarking to various indices and metrics for the one-, three- and five-year periods.
The asset allocation strategy is determined through a detailed analysis of assets and liabilities by plan, which defines the overall risk that is acceptable with regard to the expected level and variability of portfolio returns, surplus (assets compared to liabilities), contributions and pension expense.
The asset allocation review process involves simulating capital market behaviors including global asset class performance, inflation and interest rates in order to evaluate various asset allocation scenarios and determine the asset mix with the highest likelihood of meeting financial objectives. The process includes factoring in the current funded status and likely future funded status levels of the plans by taking into account expected growth or decline in the contributions over time.
The asset allocation strategy varies by plan. The following table reflects the actual asset allocations for pension and VEBA plan assets as of December 31, 20182020 and 2017,2019, as well as the 20192021 weighted average target asset allocations. Equity investments include securities in large-cap, mid-cap and small-cap companies located in the U.S. and worldwide. Fixed income investments primarily include corporate bonds and government debt securities.
| | | | Pension Assets | | VEBA Assets | | Pension Assets | | VEBA Assets |
| Asset Category | 2019 Target Allocation | | Percentage of Plan Assets at December 31, | | 2019 Target Allocation | | Percentage of Plan Assets at December 31, | Asset Category | | 2021
Target
Allocation | | Percentage of
Plan Assets at
December 31, | | 2021
Target
Allocation | | Percentage of
Plan Assets at
December 31, |
| 2018 | | 2017 | | 2018 | | 2017 | 2020 | | 2019 | | 2020 | | 2019 |
| Equity securities | 45.0 | % | | 38.9 | % | | 43.6 | % | | 8.0 | % | | 8.1 | % | | 8.7 | % | Equity securities | | 41.3 | % | | 51.8 | % | | 44.0 | % | | 20.3 | % | | 22.2 | % | | 7.2 | % |
| Fixed income | 28.0 | % | | 26.0 | % | | 27.0 | % | | 80.0 | % | | 77.0 | % | | 77.7 | % | Fixed income | | 39.7 | | | 33.8 | | | 27.6 | | | 69.6 | | | 66.4 | | | 79.8 | |
| Hedge funds | 5.0 | % | | 5.4 | % | | 5.0 | % | | 4.0 | % | | 4.7 | % | | 4.4 | % | Hedge funds | | 5.0 | | | 2.2 | | | 5.4 | | | 1.1 | | | 1.8 | | | 4.8 | |
| Private equity | 7.0 | % | | 6.2 | % | | 5.3 | % | | 3.0 | % | | 1.2 | % | | 1.5 | % | Private equity | | 2.2 | | | 2.1 | | | 6.6 | | | 1.4 | | | 0.4 | | | 0.7 | |
| Structured credit | 7.5 | % | | 11.4 | % | | 9.7 | % | | 2.0 | % | | 3.5 | % | | 3.0 | % | Structured credit | | 5.2 | | | 5.0 | | | 7.0 | | | 1.0 | | | 0.9 | | | 2.1 | |
| Real estate | 7.5 | % | | 10.3 | % | | 8.7 | % | | 3.0 | % | | 5.4 | % | | 4.6 | % | Real estate | | 5.2 | | | 3.3 | | | 9.4 | | | 1.1 | | | 1.8 | | | 5.4 | |
| Cash | — | % | | 1.8 | % | | 0.7 | % | | — | % | | 0.1 | % | | 0.1 | % | |
| Absolute return fixed income | | Absolute return fixed income | | 1.4 | | | 1.8 | | | 0 | | | 5.5 | | | 6.5 | | | 0 | |
| Total | 100.0 | % | | 100.0 | % | | 100.0 | % | | 100.0 | % | | 100.0 | % | | 100.0 | % | Total | | 100.0 | % | | 100.0 | % | | 100.0 | % | | 100.0 | % | | 100.0 | % | | 100.0 | % |
As a practical expedient, in accordance with ASC 820-10, certain investments that are measured at fair value using the NAV per share have not been classified in the fair value hierarchy below. NAV is based on the value of the underlying assets owned by the fund, minus its liabilities, and then divided by its number of shares outstanding.
The fair value of our pension assets by asset category is as follows:
| | | | | | | | | | | | | | | | | | | | | | | | | | | | | | | | | | | | | | | | | | | | |
| (In Millions) |
| Quoted Prices in Active
Markets for Identical
Assets
(Level 1) | | Significant Other
Observable
Inputs
(Level 2) | | Significant
Unobservable
Inputs
(Level 3) | | Investments Measured at Net Asset Value | | Total |
| Asset Category | 2020 | 2019 | | 2020 | 2019 | | 2020 | 2019 | | 2020 | 2019 | | 2020 | 2019 |
| Equity securities: | | | | | | | | | | | | | | |
| U.S. equities | $ | 1,163 | | $ | 169 | | | $ | 0 | | $ | 0 | | | $ | 0 | | $ | 0 | | | $ | 787 | | $ | 0 | | | $ | 1,950 | | $ | 169 | |
| Global equities | 615 | | 161 | | | 0 | | 0 | | | 0 | | 0 | | | 195 | | 0 | | | 810 | | 161 | |
| Fixed income: | | | | | | | | | | | | | | |
U.S. government securities1 | 141 | | 11 | | | 295 | | 22 | | | 0 | | 0 | | | 40 | | 0 | | | 476 | | 33 | |
| U.S. corporate bonds | 512 | | 174 | | | 466 | | 0 | | | 0 | | 0 | | | 303 | | 0 | | | 1,281 | | 174 | |
| Non U.S. and other bonds | 0 | | 0 | | | 46 | | 0 | | | 0 | | 0 | | | 0 | | 0 | | | 46 | | 0 | |
| Hedge funds | 0 | | 0 | | | 0 | | 0 | | | 118 | | 40 | | | 0 | | 0 | | | 118 | | 40 | |
| Private equity | 0 | | 0 | | | 0 | | 0 | | | 114 | | 50 | | | 0 | | 0 | | | 114 | | 50 | |
| Structured credit | 0 | | 0 | | | 0 | | 0 | | | 264 | | 52 | | | 0 | | 0 | | | 264 | | 52 | |
| Real estate | 0 | | 0 | | | 0 | | 0 | | | 174 | | 70 | | | 0 | | 0 | | | 174 | | 70 | |
| Absolute return fixed income | 0 | | 0 | | | 0 | | 0 | | | 0 | | 0 | | | 99 | | 0 | | | 99 | | 0 | |
| Total | $ | 2,431 | | $ | 515 | | | $ | 807 | | $ | 22 | | | $ | 670 | | $ | 212 | | | $ | 1,424 | | $ | 0 | | | $ | 5,332 | | $ | 749 | |
| | | | | | | | | | | | | | |
1 Includes cash equivalents. |
Assets for OPEB plans include VEBA trusts pursuant to bargaining agreements that are available to fund retired employees’ life insurance obligations and medical benefits. The fair value of our other benefit plan assets by asset category is as follows:
| | | | | | | | | | | | | | | | | | | | | | | | | | | | | | | | | | | | | | | | | | | | |
| (In Millions) |
| Quoted Prices in Active
Markets for Identical
Assets
(Level 1) | | Significant Other
Observable
Inputs
(Level 2) | | Significant
Unobservable
Inputs
(Level 3) | | Investments Measured at Net Asset Value | | Total |
| Asset Category | 2020 | 2019 | | 2020 | 2019 | | 2020 | 2019 | | 2020 | 2019 | | 2020 | 2019 |
| Equity securities: | | | | | | | | | | | | | | |
| U.S. equities | $ | 26 | | $ | 12 | | | $ | 0 | | $ | 0 | | | $ | 0 | | $ | 0 | | | $ | 93 | | $ | 0 | | | $ | 119 | | $ | 12 | |
| Global equities | 6 | | 7 | | | 0 | | 0 | | | 0 | | 0 | | | 49 | | 0 | | | 55 | | 7 | |
| Fixed income: | | | | | | | | | | | | | | |
U.S. government securities1 | 62 | | 0 | | | 94 | | 0 | | | 0 | | 0 | | | 0 | | 0 | | | 156 | | 0 | |
| U.S. corporate bonds | 237 | | 166 | | | 127 | | 41 | | | 0 | | 0 | | | 0 | | 0 | | | 364 | | 207 | |
| Hedge funds | 0 | | 0 | | | 0 | | 0 | | | 14 | | 12 | | | 0 | | 0 | | | 14 | | 12 | |
| Private equity | 0 | | 0 | | | 0 | | 0 | | | 3 | | 2 | | | 0 | | 0 | | | 3 | | 2 | |
| Structured credit | 0 | | 0 | | | 0 | | 0 | | | 7 | | 6 | | | 0 | | 0 | | | 7 | | 6 | |
| Real estate | 0 | | 0 | | | 0 | | 0 | | | 14 | | 14 | | | 0 | | 0 | | | 14 | | 14 | |
| Absolute return fixed income | 0 | | 0 | | | 0 | | 0 | | | 0 | | 0 | | | 51 | | 0 | | | 51 | | 0 | |
| Total | $ | 331 | | $ | 185 | | | $ | 221 | | $ | 41 | | | $ | 38 | | $ | 34 | | | $ | 193 | | $ | 0 | | | $ | 783 | | $ | 260 | |
1 Includes cash equivalents. |
The following represents the fair value measurements of changes in plan assets using significant unobservable inputs (Level 3):
| | | | | | | | | | | | | | | | | | | | | | | |
| (In Millions) |
| Pension Assets | | VEBA Assets |
| 2020 | | 2019 | | 2020 | | 2019 |
| Beginning balance — January 1 | $ | 212 | | | $ | 229 | | | $ | 34 | | | $ | 36 | |
| Actual return on plan assets: | | | | | | | |
| Relating to assets still held at the reporting date | 8 | | | (1) | | | 2 | | | 1 | |
| Relating to assets sold during the period | 6 | | | 30 | | | 1 | | | 0 | |
| Purchases | 195 | | | 17 | | | 0 | | | 0 | |
| Sales | (13) | | | (60) | | | (1) | | | (3) | |
| Acquired through business combinations | 262 | | | — | | | 2 | | | — | |
| Other | 0 | | | (3) | | | 0 | | | 0 | |
| Ending balance — December 31 | $ | 670 | | | $ | 212 | | | $ | 38 | | | $ | 34 | |
Following is a description of the inputs and valuation methodologies used to measure the fair value of our plan assets.
Equity Securities
Equity securities classified as Level 1 investments include U.S. large-, small- and mid-cap investments and international equities. These investments are comprised of securities listed on an exchange, market or automated quotation system for which quotations are readily available. The valuation of these securities is determined using a market approach and is based upon unadjusted quoted prices for identical assets in active markets.
Fixed Income
Fixed income securities classified as Level 1 investments include bonds, and government debt securities.securities and cash equivalents. These investments are comprised of securities listed on an exchange, market or automated
quotation system for which quotations are readily available. The valuation of these securities is determined using a market approach and is based upon unadjusted quoted prices for identical assets in active markets. Also included in Fixedfixed income is a portfolio of U.S. Treasury STRIPS, which are zero-coupon bearing fixed income securities backed by the full faith and credit of the U.S. government. The securities sell at a discount to par because there are no incremental coupon payments. STRIPS are not issued directly by the Treasury, but rather are created by a financial institution, government securities broker or government securities dealer. Liquidity on the issue varies depending on various market conditions; however, in general, the STRIPS market is slightly less liquid than that of the U.S. Treasury Bond market. The STRIPS are priced daily through a bond pricing vendor and are classified as Level 2.
Hedge Funds
Hedge funds are alternative investments comprised of direct or indirect investment in offshore hedge funds with an investment objective to achieve equity-like returns with one half the volatility of equities and moderate correlation. The valuation techniques used to measure fair value attempt to maximize the use of observable inputs and minimize the use of unobservable inputs. Considerable judgment is required to interpret the factors used to develop estimates of fair value. Valuations of the underlying investment funds are obtained and reviewed. The securities that are valued by the funds are interests in the investment funds and not the underlying holdings of such investment funds. Thus, the inputs used to value the investments in each of the underlying funds may differ from the inputs used to value the underlying holdings of such funds. Hedge funds are valued monthly and recorded on a one-month lag.
Private Equity Funds
Private equity funds are alternative investments that represent direct or indirect investments in partnerships, venture funds or a diversified pool of private investment vehicles (fund of funds).
Investment commitments are made in private equity funds based on an asset allocation strategy, and capital calls are made over the life of the funds to fund the commitments. As of December 31, 2018,2020, remaining commitments total $44.2$86 million for both our pension and OPEB plans. Committed amounts are funded from plan assets when capital calls are made. Investment commitments are not pre-funded in reserve accounts.
Private equity investments are valued quarterly and recorded on a one-quarter lag. For alternativeprivate equity investment values reported on a lag, current market information is reviewed for any material changes in values at the reporting date. Capital distributions for the funds do not occur on a regular frequency. Liquidation of these investments would require sale of the partnership interest.
Structured Credit
Structured credit investments are alternative investments comprised of collateralized debt obligationsfunds provide flexibility and other structuredaccess to both complex and illiquid premiums by investing across global, public and private residential, commercial, corporate and specialty credit investmentsmarkets that are priced based on valuations provided by independent, third-party pricing agents, if available. Such values generally reflect the last reported sales price if the security is actively traded. The third-party pricing agents may also value structured credit investments at an evaluated bid price by employing methodologies that utilize actual market transactions, broker-supplied valuations or other methodologies designed to identify the market value of such securities.
Structured credit investments are valued monthly and recordedcertain funds have an initial lock-up period and withdrawal restrictions on a one-month lag.semi-annual and quarterly basis. For alternativestructured credit investment values reported on a lag, current market information is reviewed for any material changes in values at the reporting date. Historically, redemption requests have been considered quarterly, subject to notice of 90 days, although the advisor is currently only requiring notice of 65 days.
Real Estate
The real estate portfolio for the pension plans is an alternative investment primarily comprised of two funds with strategic categories of real estate investments. All real estate holdings are appraised externally at least annually, and appraisals are conducted by reputable, independent appraisal firms that are members of the Appraisal Institute. All external appraisals are performed in accordance with the Uniform Standards of Professional Appraisal Practices. The property valuations and assumptions about each property are reviewed quarterly by the investment advisormanager and values are adjusted if there has been a significant change in circumstances relating to the property since the last external appraisal. The fair value of onevalues of the funds isare updated on either a monthly and there is no lag in reported value.or quarterly basis. Redemption requests are considered on a quarterly basis, subject to notice of 45 days.requirements.
The real estate fund of funds investment for the Empire-Tilden, Hibbing and United Taconite VEBA plans invests in pooled investment vehicles that, in turn, invest in commercial real estate properties. Valuations are performed quarterly and financial statements are prepared on a semi-annual basis, with annual audited statements.
Asset values for this fund are reported with a one-quarter lag, and current market information is reviewed for any material changes in values at the reporting date. Withdrawals are permitted on the last business day of each quarter subject to a 65-day95-day prior written notice.
Absolute Return Fixed Income
Pension
Absolute return fixed income investments consist of a global fixed income fund with the investment objective of generating positive absolute returns over a full market cycle. The fund's investments in securities, forward exchange contracts and futures contracts are reported at fair value on a recurring monthly basis. The fund's trustee values securities based upon independent pricing sources and futures contracts are valued at closing settled prices. Redemptions of the fund at NAV are permitted monthly under most circumstances.
Defined Contribution Plans
Most employees are eligible to participate in various defined contribution plans. Certain of these plans have features with matching contributions or other Company contributions based on our financial results. Company contributions to these plans are expensed as incurred. Total expense from these plans was $22 million, $3 million and $3 million in 2020, 2019 and 2018, respectively.
Multiemployer Plans
We contribute to multiemployer pension plan assets by asset category is as follows:
|
| | | | | | | | | | | | | | | |
| | (In Millions) |
| | December 31, 2018 |
| Asset Category | Quoted Prices in Active Markets for Identical Assets/Liabilities (Level 1) | | Significant Other Observable Inputs (Level 2) | | Significant Unobservable Inputs (Level 3) | | Total |
| Equity securities: | | | | | | | |
| U.S. large-cap | $ | 112.6 |
| | $ | — |
| | $ | — |
| | $ | 112.6 |
|
| U.S. small/mid-cap | 22.5 |
| | — |
| | — |
| | 22.5 |
|
| International | 132.0 |
| | — |
| | — |
| | 132.0 |
|
| Fixed income | 151.1 |
| | 27.4 |
| | — |
| | 178.5 |
|
| Hedge funds | — |
| | — |
| | 37.2 |
| | 37.2 |
|
| Private equity | — |
| | — |
| | 42.6 |
| | 42.6 |
|
| Structured credit | — |
| | — |
| | 78.8 |
| | 78.8 |
|
| Real estate | — |
| | — |
| | 70.5 |
| | 70.5 |
|
| Cash | 12.5 |
| | — |
| | — |
| | 12.5 |
|
| Total | $ | 430.7 |
| | $ | 27.4 |
| | $ | 229.1 |
| | $ | 687.2 |
|
|
| | | | | | | | | | | | | | | |
| | (In Millions) |
| | December 31, 2017 |
| Asset Category | Quoted Prices in Active Markets for Identical Assets/Liabilities (Level 1) | | Significant Other Observable Inputs (Level 2) | | Significant Unobservable Inputs (Level 3) | | Total |
| Equity securities: | | | | | | | |
| U.S. large-cap | $ | 130.1 |
| | $ | — |
| | $ | — |
| | $ | 130.1 |
|
| U.S. small/mid-cap | 35.5 |
| | — |
| | — |
| | 35.5 |
|
| International | 160.9 |
| | — |
| | — |
| | 160.9 |
|
| Fixed income | 173.6 |
| | 28.8 |
| | — |
| | 202.4 |
|
| Hedge funds | — |
| | — |
| | 37.4 |
| | 37.4 |
|
| Private equity | — |
| | — |
| | 39.8 |
| | 39.8 |
|
| Structured credit | — |
| | — |
| | 72.9 |
| | 72.9 |
|
| Real estate | — |
| | — |
| | 65.5 |
| | 65.5 |
|
| Cash | 5.3 |
| | — |
| | — |
| | 5.3 |
|
| Total | $ | 505.4 |
| | $ | 28.8 |
| | $ | 215.6 |
| | $ | 749.8 |
|
The following represents the effect of fair value measurements using significant unobservable inputs (Level 3) on changes in plan assets:
|
| | | | | | | | | | | | | | | | | | | |
| | (In Millions) |
| | Year Ended December 31, 2018 |
| | Hedge Funds | | Private Equity Funds | | Structured Credit Fund | | Real Estate | | Total |
| Beginning balance — January 1, 2018 | $ | 37.4 |
| | $ | 39.8 |
| | $ | 72.9 |
| | $ | 65.5 |
| | $ | 215.6 |
|
| Actual return on plan assets: |
| |
| |
| |
| | |
Relating to assets still held at the reporting date | (0.2 | ) | | 1.4 |
| | 5.9 |
| | 5.4 |
| | 12.5 |
|
Relating to assets sold during the period | — |
| | 4.0 |
| | — |
| | — |
| | 4.0 |
|
| Purchases | — |
| | 5.2 |
| | — |
| | — |
| | 5.2 |
|
| Sales | — |
| | (7.8 | ) | | — |
| | (0.4 | ) | | (8.2 | ) |
| Ending balance — December 31, 2018 | $ | 37.2 |
| | $ | 42.6 |
| | $ | 78.8 |
| | $ | 70.5 |
| | $ | 229.1 |
|
|
| | | | | | | | | | | | | | | | | | | |
| | (In Millions) |
| | Year Ended December 31, 2017 |
| | Hedge Funds | | Private Equity Funds | | Structured Credit Fund | | Real Estate | | Total |
| Beginning balance — January 1, 2017 | $ | 40.6 |
| | $ | 36.1 |
| | $ | 63.8 |
| | $ | 61.9 |
| | $ | 202.4 |
|
| Actual return on plan assets: |
| |
| |
| |
| | |
Relating to assets still held at the reporting date | 2.5 |
| | 0.3 |
| | 9.1 |
| | 4.2 |
| | 16.1 |
|
Relating to assets sold during
the period | 0.4 |
| | 4.5 |
| | — |
| | (0.1 | ) | | 4.8 |
|
| Purchases | 39.0 |
| | 4.5 |
| | — |
| | 14.4 |
| | 57.9 |
|
| Sales | (45.1 | ) | | (5.6 | ) | | — |
| | (14.9 | ) | | (65.6 | ) |
| Ending balance — December 31, 2017 | $ | 37.4 |
| | $ | 39.8 |
| | $ | 72.9 |
| | $ | 65.5 |
| | $ | 215.6 |
|
VEBA
Assets for OPEB plans include VEBA trusts pursuantaccording to collective bargaining agreements that cover certain union-represented employees. The following risks of participating in these multiemployer plans differ from single employer pension plans:
•Employer contributions to a multiemployer plan may be used to provide benefits to employees of other participating employers.
•If a participating employer stops contributing to a multiemployer plan, the remaining participating employers may need to assume the unfunded obligations of the plan.
•If the multiemployer plan becomes significantly underfunded or is unable to pay its benefits, we may be required to contribute additional amounts in excess of the rate required by the collective bargaining agreements.
•If we choose to stop participating in a multiemployer plan, we may be required to pay that plan an amount based on the underfunded status of the plan, referred to as a withdrawal liability.
We are availablea party to fund retired employees’ life insurance obligationsfive collective bargaining agreements at our Ashland Works, Mansfield Works, United Taconite, Tubular Components and medical benefits. The fair valuethe majority of our other benefit plan assets by asset category is as follows:
|
| | | | | | | | | | | | | | | |
| | (In Millions) |
| | December 31, 2018 |
| Asset Category | Quoted Prices in Active Markets for Identical Assets/Liabilities (Level 1) | | Significant Other Observable Inputs (Level 2) | | Significant Unobservable Inputs (Level 3) | | Total |
| Equity securities: | | | | | | | |
| U.S. large-cap | $ | 9.7 |
| | $ | — |
| | $ | — |
| | $ | 9.7 |
|
| U.S. small/mid-cap | 2.4 |
| | — |
| | — |
| | 2.4 |
|
| International | 7.3 |
| | — |
| | — |
| | 7.3 |
|
| Fixed income | 146.8 |
| | 37.8 |
| | — |
| | 184.6 |
|
| Hedge funds | — |
| | — |
| | 11.4 |
| | 11.4 |
|
| Private equity | — |
| | — |
| | 3.0 |
| | 3.0 |
|
| Structured credit | — |
| | — |
| | 8.5 |
| | 8.5 |
|
| Real estate | — |
| | — |
| | 13.1 |
| | 13.1 |
|
| Cash | 0.2 |
| | — |
| | — |
| | 0.2 |
|
| Total | $ | 166.4 |
| | $ | 37.8 |
| | $ | 36.0 |
| | $ | 240.2 |
|
|
| | | | | | | | | | | | | | | |
| | (In Millions) |
| | December 31, 2017 |
| Asset Category | Quoted Prices in Active
Markets for Identical
Assets/Liabilities
(Level 1) | | Significant Other
Observable
Inputs
(Level 2) | | Significant
Unobservable
Inputs
(Level 3) | | Total |
| Equity securities: |
| |
| |
| |
|
| U.S. large-cap | $ | 11.4 |
| | $ | — |
| | $ | — |
| | $ | 11.4 |
|
| U.S. small/mid-cap | 2.8 |
| | — |
| | — |
| | 2.8 |
|
| International | 8.8 |
| | — |
| | — |
| | 8.8 |
|
| Fixed income | 164.1 |
| | 40.0 |
| | — |
| | 204.1 |
|
| Hedge funds | — |
| | — |
| | 11.4 |
| | 11.4 |
|
| Private equity | — |
| | — |
| | 3.9 |
| | 3.9 |
|
| Structured credit | — |
| | — |
| | 7.9 |
| | 7.9 |
|
| Real estate | — |
| | — |
| | 12.0 |
| | 12.0 |
|
| Cash | 0.2 |
| | — |
| | — |
| | 0.2 |
|
| Total | $ | 187.3 |
| | $ | 40.0 |
| | $ | 35.2 |
| | $ | 262.5 |
|
The following represents the effect of fair value measurements using significant unobservable inputs (Level 3) on changes in plan assets:
|
| | | | | | | | | | | | | | | | | | | |
| | (In Millions) |
| | Year Ended December 31, 2018 |
| | Hedge Funds | | Private Equity Funds | | Structured Credit Fund | | Real Estate | | Total |
| Beginning balance — January 1, 2018 | $ | 11.4 |
| | $ | 3.9 |
| | $ | 7.9 |
| | $ | 12.0 |
| | $ | 35.2 |
|
| Actual return on plan assets: |
| |
| |
| |
| | |
| Relating to assets still held at the reporting date | — |
| | (0.1 | ) | | 0.6 |
| | 1.1 |
| | 1.6 |
|
| Relating to assets sold during the period | — |
| | 0.3 |
| | — |
| | — |
| | 0.3 |
|
| Purchases | — |
| | — |
| | — |
| | — |
| | — |
|
| Sales | — |
| | (1.1 | ) | | — |
| | — |
| | (1.1 | ) |
| Ending balance — December 31, 2018 | $ | 11.4 |
| | $ | 3.0 |
| | $ | 8.5 |
| | $ | 13.1 |
| | $ | 36.0 |
|
|
| | | | | | | | | | | | | | | | | | | |
| | (In Millions) |
| | Year Ended December 31, 2017 |
| | Hedge Funds | | Private Equity Funds | | Structured Credit Fund | | Real Estate | | Total |
| Beginning balance — January 1, 2017 | $ | 11.2 |
| | $ | 4.3 |
| | $ | 6.9 |
| | $ | 11.1 |
| | $ | 33.5 |
|
| Actual return on plan assets: |
| |
| |
| |
| | |
| Relating to assets still held at the reporting date | 0.8 |
| | 0.9 |
| | 2.0 |
| | 3.4 |
| | 7.1 |
|
| Relating to assets sold during the period | — |
| | (0.4 | ) | | (1.0 | ) | | (2.5 | ) | | (3.9 | ) |
| Purchases | 17.1 |
| | 1.8 |
| | 2.1 |
| | 3.0 |
| | 24.0 |
|
| Sales | (17.7 | ) | | (2.7 | ) | | (2.1 | ) | | (3.0 | ) | | (25.5 | ) |
| Ending balance — December 31, 2017 | $ | 11.4 |
| | $ | 3.9 |
| | $ | 7.9 |
| | $ | 12.0 |
| | $ | 35.2 |
|
Contributions
AnnualArcelorMittal USA locations that require contributions to the pension plansSteelworkers Pension Trust.
We are made within income tax deductibility restrictionsa party to three collective bargaining agreements at Butler Works, Middletown Works and Zanesville Works that require contributions to the International Association of Machinists and Aerospace Workers ("IAM") National Pension Fund's National Pension Plan. The plan voluntarily elected to place itself in accordance with statutory regulations. In the event"Red Zone" in April 2019 and has implemented a rehabilitation plan. Additional contributions will be required as part of the rehabilitation plan termination,until the plan sponsors could be requiredexits the critical status.
Information with respect to fund additional shut downmultiemployer plans in which we participate follows:
| | | | | | | | | | | | | | | | | | | | | | | | | | | | | |
| Pension Fund | EIN/Pension Plan Number | Pension Protection Act Zone Status (a) | FIP/RP Status Pending/Implemented (b) | Contributions | Surcharge Imposed (c) | Expiration Date of Collective Bargaining Agreement |
| | 2020 | 2019 | | 2020 | 2019 | 2018 | | |
| Steelworkers Pension Trust | 23-6648508/499 | Green | Green | No | $ | 14 | | $ | 4 | | $ | 4 | | No | 1/22/2021 to 10/1/2022 |
| IAM National Pension Fund’s National Pension Plan | 51-6031295/002 | Red | Green | Yes | 16 | | 0 | | 0 | | Yes | 5/31/2022 to 5/15/2023 |
| American Maritime Officers Plan | 13-1936709/001 | Green | Green | No | 0 | | 0 | | 0 | | No | 7/31/2021 |
| Total | | | | | $ | 30 | | $ | 4 | | $ | 4 | | | |
| (a) The most recent Pension Protection Act zone status available in 2020 and 2019 is for each plan's year-end at December 31, 2019 and 2018. The plan's actuary certifies the zone status. Generally, plans in the red zone are less than 65% funded, plans in the yellow zone are between 65% and 80% funded, and plans in the green zone are at least 80% funded. |
| (b) The "FIP/RP Status Pending/Implemented" column indicates plans for which a financial improvement plan or a rehabilitation plan is either pending or has been implemented, as defined by ERISA. |
| (c) The surcharge represents an additional required contribution due as a result of the critical funding status of the plan. |
Prior to the Acquisitions, AK Steel and early retirement obligations that are not includedArcelorMittal USA made up over 30% of the contributions to the Steelworkers Pension Trust in the pension obligations. Costslast three years. Only two other employers contributed more than 5% during this period. As of December 31, 2019 (the last date for early termination for pensions and other benefits are estimated to be $22.1which we have information), the Steelworkers Pension Trust had a total actuarial liability of $5,748 million and $3.4 million, respectively. The Company currently has no intention to shut down, terminate or withdraw from anyassets with a market value of its employee benefit plans.
|
| | | | | | | | | | | | | | | | |
| | | (In Millions) |
| | | Pension Benefits | | Other Benefits |
| Company Contributions | | VEBA | | Direct Payments | | Total |
| 2017 | | $ | 24.4 |
| | $ | — |
| | $ | 2.1 |
| | $ | 2.1 |
|
| 2018 | | 27.6 |
| | — |
| | 3.8 |
| | 3.8 |
|
2019 (Expected)1 | | 15.9 |
| | — |
| | 3.5 |
| | 3.5 |
|
| | | | | | | | | |
1 Pursuant to the bargaining agreement, benefits can be paid from VEBA trusts that are at least 70% funded (all VEBA trusts are over 70% funded at December 31, 2018). Funding obligations have been suspended as UTAC's, Tilden's and Empire's share of the value of their respective trust assets have reached 90% of their obligation. |
VEBA plans are not subject to minimum regulatory funding requirements. Amounts contributed are pursuant to bargaining agreements.
Contributions by participants to the OPEB plans were $5.6$5,372 million, for the year ended December 31, 2018 and $4.6 million for the year ended December 31, 2017.a funded ratio of about 93%.
Estimated Cost for 2019
For 2019, we estimate net periodic benefit cost as follows:
|
| | | |
| | (In Millions) |
| Defined benefit pension plans | $ | 21.5 |
|
| Other postretirement benefits | (2.8 | ) |
| Total | $ | 18.7 |
|
Estimated Future Benefit Payments
|
| | | | | | | | | | | | | | | |
| | (In Millions) |
| | Pension Benefits | | Other Benefits |
Gross Company Benefits | | Less Medicare Subsidy | | Net Benefit Payments |
| 2019 | $ | 70.4 |
| | $ | 18.0 |
| | $ | (0.8 | ) | | $ | 17.2 |
|
| 2020 | 67.9 |
| | 17.7 |
| | (0.8 | ) | | 16.9 |
|
| 2021 | 67.5 |
| | 17.2 |
| | (0.9 | ) | | 16.3 |
|
| 2022 | 67.0 |
| | 17.0 |
| | (0.9 | ) | | 16.1 |
|
| 2023 | 67.9 |
| | 16.9 |
| | (1.0 | ) | | 15.9 |
|
| 2024-2028 | 309.7 |
| | 82.2 |
| | (5.4 | ) | | 76.8 |
|
NOTE 911 - STOCK COMPENSATION PLANS
At December 31, 2018,2020, we havehad outstanding awards under varioustwo share-based compensation plans, which are described below. The compensation cost charged against income from continuing operations for those plans was $15.1 million, $18.2 million and $13.6 million in 2018, 2017 and 2016, respectively, which primarily was recorded in Selling, general and administrative expenses inplans: the Statements of Consolidated Operations. There was no income tax benefit recognized for the years ended December 31, 2018, 2017 and 2016, due to the full valuation allowance.
Employees’ Plans
The A&R 2015 Equity Plan was approved by our Board of Directors on February 21, 2017 and by our shareholders on April 25, 2017. The A&R 2015the 2012 Amended Equity Plan increasedPlan. On March 13, 2020, the maximum number of shares that may be issued by 15.0 million common shares. Theunder the A&R 2015 Equity Plan was approvedincreased by our Board of Directors on March 26, 2015 and by our shareholders on May 19, 2015. The 2015 Equity Plan replaced the 2012 Equity Plan, and allowed for a maximum of 12.95.7 million common shares in relation to be issued.the outstanding AK Steel stock-based incentive awards that we converted at a 0.400 rate of exchange. The converted stock-based incentive awards include 2.0 million stock options, 1.0 million long-term performance plan awards, 0.5 million performance shares, 0.2 million restricted stock awards and 0.3 million restricted stock units. As of December 31, 2020, there were 4.9 million remaining shares available for grant under the A&R 2015 Equity Plan. No additional grants were issued from the 2012 Amended Equity Plan after the date of approval of the A&R 2015 Equity Plan; however, all awards previously granted under the 2012 Amended Equity Plan will continue in full force and effect in accordance with the terms of the outstanding awards.
Stock-Based Compensation Expense
The following table summarizes the total compensation expense recognized for stock-based compensation awards:
| | | | | | | | | | | | | | | | | |
| (In Millions, except per
share amounts) |
| Year Ended December 31, |
| | 2020 | | 2019 | | 2018 |
| Cost of goods sold | $ | (2) | | | $ | (2) | | | $ | (2) | |
| Selling, general and administrative expenses | (13) | | | (16) | | | (13) | |
| Acquisition-related costs | (2) | | | 0 | | | 0 | |
| Stock based compensation expense | (17) | | | (18) | | | (15) | |
Income tax benefit1 | 4 | | | 4 | | | 0 | |
| Stock based compensation expense, net of tax | $ | (13) | | | $ | (14) | | | $ | (15) | |
| | | | | |
| Decrease in basic earnings per common share | $ | (0.03) | | | $ | (0.05) | | | $ | (0.05) | |
| Decrease in diluted earnings per common share | $ | (0.03) | | | $ | (0.05) | | | $ | (0.05) | |
| | | | | |
1 No income tax benefit in 2018 due to the full valuation allowance. |
The total compensation cost related to outstanding awards not yet recognized is a summary$14 million at December 31, 2020. This expense is expected to be recognized over the remaining weighted-average period of approved grants by the Compensation Committee:
|
| | | | | | | | | | |
| Grant Year | | Vesting Date | | Plan Issued Under | | Restricted Stock Units Granted | | Performance Shares Granted |
| 2018 | | 12/31/2020 | | A&R 2015 Equity Plan | | 685,599 |
| | 675,599 |
|
| 2017 | | 12/31/2019 | | A&R 2015 Equity Plan | | 532,358 |
| | 249,106 |
|
| 2017 | | 12/31/2019 | | Amended 2015 Equity Plan | | 553,725 |
| | 553,725 |
|
| 2016 | | 12/31/2018 | | 2015 Equity Plan | | 3,406,716 |
| | — |
|
Performance Shares
The following table summarizes the performance award activity:
| | | | | | | | | | | | | | | | | | | | | | | | | | | | | | | | | | | |
| Year Ended December 31, |
| 2020 | | 2019 | | 2018 |
| Number of Shares | | Weighted Average Grant Date Fair Value | | Number of Shares | | Weighted Average Grant Date Fair Value | | Number of Shares | | Weighted Average Grant Date Fair Value |
| Outstanding at beginning of year | 1,935,878 | | | $ | 15.58 | | | 1,424,723 | | | $ | 14.46 | | | 1,848,312 | | | $ | 13.42 | |
| Granted | 2,510,853 | | | 5.49 | | | 572,104 | | | 18.31 | | | 675,599 | | | 11.93 | |
| Distributed | (1,938,786) | | | 12.23 | | | 0 | | | 0 | | | (489,953) | | | 10.89 | |
| Performance adjustment | 549,154 | | | 15.63 | | | 0 | | | 0 | | | (560,720) | | | 10.69 | |
| Forfeited/canceled | (604,873) | | | 5.70 | | | (60,949) | | | 15.12 | | | (48,515) | | | 19.33 | |
| Outstanding at end of year | 2,452,226 | | | $ | 10.34 | | | 1,935,878 | | | $ | 15.58 | | | 1,424,723 | | | $ | 14.46 | |
The 2.5 million awards granted in 2020 include 1.0 million long-term performance plan awards and 0.5 million performance shares relating to the AK Steel replacement awards. As of December 31, 2020, 0.3 million long-term performance plan awards and 0.1 million performance shares were outstanding as a result of qualifying termination events that triggered accelerated performance share payouts and prorated long-term performance plan awards payouts at target. The long-term performance plan awards are based on a three-year Adjusted EBITDA metric. The weighted average grant date fair value for the converted performance awards was $4.59 per share.
The outstanding performance shares vest over a period of three years and are intended to be paid out in common shares. Performance is measured on the basis of relative TSR for the period and measured against the constituents of the S&P Metals and Mining ETF IndexIndex. The number of shares actually earned at the beginningend of the relevant performance period. The final payout for the outstanding performancethree-year period grants will vary, based on performance, from 0% to 200% of the original grant depending on whether and to what extent the Company achieves certain objectives andnumber of performance goals as established by the Compensation Committee.shares granted.
|
| | | | | | | | | | | | | | | | | |
Performance
Share
Plan Year | | Performance Shares Granted | | Forfeitures to Date | | Expected to Vest | | Grant Date | | Grant Date Fair Value | | Performance Period |
| 2018 | | 675,599 |
| | 2,236 |
| | 673,363 |
| | 2/21/2018 | | $ | 11.93 |
| | 1/1/2018 - 12/31/2020 |
| 2017 | | 249,106 |
| | — |
| | 249,106 |
| | 6/26/2017 | | $ | 10.74 |
| | 5/31/2017 - 12/31/2019 |
| 2017 | | 553,725 |
| | 51,471 |
| | 502,254 |
| | 2/21/2017 | | $ | 19.69 |
| | 1/1/2017 - 12/31/2019 |
Restricted Stock Units
The following table summarizes the restricted stock units activity:
| | | | | | | | | | | | | | | | | | | | | | | | | | | | | | | | | | | |
| Year Ended December 31, |
| 2020 | | 2019 | | 2018 |
| Number of Shares | | Weighted Average Grant Date Fair Value | | Number of Shares | | Weighted Average Grant Date Fair Value | | Number of Shares | | Weighted Average Grant Date Fair Value |
| Outstanding at beginning of year | 2,147,183 | | | $ | 9.10 | | | 4,694,360 | | | $ | 4.18 | | | 4,403,112 | | | $ | 3.64 | |
| Granted | 1,160,928 | | | 4.87 | | | 572,104 | | | 11.24 | | | 685,599 | | | 7.53 | |
| Distributed | (1,101,115) | | | 8.58 | | | (3,058,307) | | | 1.95 | | | (254,196) | | | 3.30 | |
| Forfeited/canceled | (63,413) | | | 7.31 | | | (60,974) | | | 9.31 | | | (140,155) | | | 5.17 | |
| Outstanding at end of year | 2,143,583 | | | $ | 7.12 | | | 2,147,183 | | | $ | 9.10 | | | 4,694,360 | | | $ | 4.18 | |
The 1.2 million restricted stock units granted in 2020 include 0.2 million restricted stock awards relating to AK Steel replacement awards. The restricted stock awards relating to AK Steel vest ratably on the first, second and third anniversaries of the grant. We valued the restricted stock awards and restricted stock units at $4.87 per share using the closing price of our common shares on March 13, 2020, the grant date.
All of the outstanding restricted stock units are subject to continued employment, are retention based, and are payable in common shares or cash in certain circumstances at a time determined by the Compensation Committee at its discretion. The outstanding restricted stock units that were granted in 2018, 2017,2020, 2019 and 20162018 cliff vest inover three years on December 31, 2022, December 31, 2021 and December 31, 2020, 2019respectively.
Stock Options
The following table summarizes the stock option activity:
| | | | | | | | | | | | | | | | | | | | | | | | | | | | | | | | | | | |
| Year Ended December 31, |
| 2020 | | 2019 | | 2018 |
| Number of Shares | | Weighted Average Exercise Price | | Number of Shares | | Weighted Average Exercise Price | | Number of Shares | | Weighted Average Excercise Price |
| Outstanding at beginning of year | 563,230 | | | $ | 10.42 | | | 563,230 | | | $ | 10.42 | | | 599,870 | | | $ | 10.25 | |
| Granted | 2,010,277 | | | 11.86 | | | 0 | | | 0 | | | 0 | | | 0 | |
| Exercised | (79,973) | | | 7.01 | | | 0 | | | 0 | | | (36,640) | | | 7.70 | |
| Forfeited/canceled | (7,726) | | | 41.04 | | | 0 | | | 0 | | | 0 | | | 0 | |
| Outstanding at end of year | 2,485,808 | | | $ | 11.60 | | | 563,230 | | | $ | 10.42 | | | 563,230 | | | $ | 10.42 | |
| | | | | | | | | | | |
| Exercisable at end of year | 2,172,052 | | | $ | 11.86 | | | 563,230 | | | $ | 10.42 | | | 563,230 | | | $ | 10.42 | |
Stock options granted to date generally vest over a period from one to three years with an expiration date at ten years from the date of grant. On March 13, 2020, we granted 2.0 million options as AK Steel replacement awards. The weighted average fair value of the converted options was $0.51 per share and was calculated using the Black-Scholes option-pricing model. Qualifying termination events resulted in vest date accelerations and reductions to the option expiration date from ten years to three years.
The total intrinsic value of options exercised in 2020 and 2018 respectively.
Stock Options
The 412,710 stockwere immaterial. For options that were granted during the first quarter of 2015 vested onoutstanding at December 31, 2017, are2020, the weighted-average remaining contractual life was 3.2 years and the aggregate intrinsic value was $11 million. For options exercisable at a strike price of $7.70 and expire on January 12, 2025. The 250,000 stock options that were granted in the fourth quarter of 2014 vested in equal thirds on each of December 31, 2015, 20162020, the weighted-average remaining contractual life was 2.5 years and 2017 and are exercisable at a strike pricethe aggregate intrinsic value was $9 million.
Employee Stock Purchase Plan
On March 26, 2015, upon recommendation by the Compensation Committee, our Board of Directors approved and adopted, subject to the approval of Cliffs' shareholders at the 2015 Annual Meeting, the Cliffs Natural Resources Inc. 2015 Employee Stock Purchase Plan. This plan was approved by our shareholders at the 2015 Annual Meeting held May 19, 2015. Ten million common shares have been reserved for issuance under this plan; however, as of December 31, 2018, this program has not been made active and no common shares have been purchased. We sought shareholder approval of this plan for the purpose of qualifying the reserved common shares for special tax treatment under Section 423 of the IRC of 1986, as amended.
Nonemployee Directors
Our nonemployee directors are entitled to receive restricted share awards under the Directors’ Plan. For 2018, 20172020, 2019 and 2016,2018, nonemployee directors were granted a specified number of restricted shares, with a value equal to $100,000, $100,000, and $85,000, respectively.$100,000. The number of shares is based on the closing price of our common shares on the date of the Annual Meeting. The restricted share awards issued under the Directors' Plan generally vest 12 months from the grant date. The awards are subject to any deferral election and pursuant to the terms of the Directors’ Plan and an award agreement.
On April 23, 2018, our Governance and Nominating CommitteeMarch 13, 2020, 0.3 million restricted stock units previously awarded to the members of the BoardAK Steel board of Directors approved the acceleration of vesting of the restricted share awards granted to the nonemployee directors prior to April 2018, which were generally subject to three-year vesting. Effective April 30, 2018 and underdistributed per the terms of the Directors' Plan, the vesting of these outstanding awards was accelerated. The Governance and Nominating Committee also approved a change to the vesting period for all future awards under the Directors' Plan. The nonemployee director restricted awards granted on April 25, 2018 and all future awards are subject to one-year vesting.AK Steel Merger Agreement.
For the last three years, grants of restricted and/or deferred shares have been awarded to elected or re-elected nonemployee directors as follows:
| | | | | | | | | | | | | | |
| Year of Grant | | Restricted Shares | | Deferred Shares |
| 2020 | | 253,809 | | | 54,794 | |
| 2019 | | 86,477 | | | 23,659 | |
| 2018 | | 92,718 | | | 17,170 | |
|
| | | | | | |
| Year of Grant | | Restricted Shares | | Deferred Shares |
| 2018 | | 92,718 |
| | 17,170 |
|
| 2017 | | 93,359 |
| | 17,289 |
|
| 2016 | | 135,038 |
| | 29,583 |
|
Other Information
The following table summarizes the share-based compensation expense that we recorded in continuing operations:
|
| | | | | | | | | | | |
| | (In Millions, except per share amounts) |
| | 2018 | | 2017 | | 2016 |
| Cost of goods sold and operating expenses | $ | 1.7 |
| | $ | 1.9 |
| | $ | 1.8 |
|
| Selling, general and administrative expenses | 13.4 |
| | 16.3 |
| | 11.8 |
|
Reduction of operating income from continuing operations before income taxes | 15.1 |
| | 18.2 |
| | 13.6 |
|
Income tax benefit1 | — |
| | — |
| | — |
|
| Reduction of net income from continuing operations attributable to Cliffs shareholders | $ | 15.1 |
| | $ | 18.2 |
| | $ | 13.6 |
|
| Reduction of continuing operations earnings per common share attributable to Cliffs shareholders: | | | | | |
| Basic | $ | 0.05 |
| | $ | 0.06 |
| | $ | 0.07 |
|
| Diluted | $ | 0.05 |
| | $ | 0.06 |
| | $ | 0.07 |
|
| | | | | | |
1 No income tax benefit due to the full valuation allowance. |
Stock option, restricted stock awards and performance share activity under our long-term equity plans and Directors’ Plans are as follows:
|
| | | | | | | | |
| | 2018 | | 2017 | | 2016 |
| | Shares | | Shares | | Shares |
| Stock options: | | | | | |
| Outstanding at beginning of year | 599,870 |
| | 599,870 |
| | 607,489 |
|
| Exercised | (36,640 | ) | | — |
| | — |
|
| Forfeited/canceled | — |
| | — |
| | (7,619 | ) |
| Outstanding at end of year | 563,230 |
| | 599,870 |
| | 599,870 |
|
| Restricted awards: | | | | | |
| Outstanding and restricted at beginning of year | 4,776,483 |
| | 5,461,783 |
| | 2,338,070 |
|
| Granted during the year | 795,487 |
| | 1,196,731 |
| | 3,571,337 |
|
| Vested and issued | (627,567 | ) | | (1,813,315 | ) | | (271,988 | ) |
| Forfeited/canceled | (140,155 | ) | | (68,716 | ) | | (175,636 | ) |
| Outstanding and restricted at end of year | 4,804,248 |
| | 4,776,483 |
| | 5,461,783 |
|
| Performance shares: |
| |
| |
|
| Outstanding at beginning of year | 1,848,312 |
| | 1,368,469 |
| | 1,496,489 |
|
| Granted during the year | 675,599 |
| | 802,831 |
| | — |
|
| Vested and issued | (489,953 | ) | | — |
| | (59,260 | ) |
| Forfeited/canceled | (609,235 | ) | | (322,988 | ) | | (68,760 | ) |
| Outstanding at end of year | 1,424,723 |
| | 1,848,312 |
| | 1,368,469 |
|
Vested or expected to vest as of December 31, 20181 | 6,792,201 |
| | | | |
| Directors’ retainer and voluntary shares: |
| |
| |
|
| Outstanding at beginning of year | — |
| | — |
| | — |
|
| Granted during the year | 27,300 |
| | 25,476 |
| | — |
|
| Vested and issued | (27,300 | ) | | (25,476 | ) | | — |
|
| Outstanding at end of year | — |
| | — |
| | — |
|
| Reserved for future grants or awards at end of year: | | | | | |
| Employee plans | 12,949,420 |
| | | | |
| Directors’ plans | 502,378 |
| | | | |
| Total | 13,451,798 |
| | | | |
| | | | | | |
1 With the adoption of ASU 2016-09, we assume all shares will vest until the date of vesting or forfeiture. |
A summary of our outstanding share-based awards as of December 31, 2018 is shown below:
|
| | | | | | |
| | Shares | | Weighted Average Grant Date Fair Value |
| Outstanding, beginning of year | 7,224,665 |
| | $ | 6.79 |
|
| Granted | 1,498,386 |
| | $ | 9.51 |
|
| Vested and issued | (1,181,460 | ) | | $ | 7.38 |
|
| Forfeited/canceled | (749,390 | ) | | $ | 10.22 |
|
| Outstanding, end of year | 6,792,201 |
| | $ | 6.90 |
|
The total compensation cost related to outstanding awards not yet recognized is $17.1 million at December 31, 2018. The weighted average remaining period for the awards outstanding at December 31, 2018 is approximately 1.0 year.
NOTE 1012 - INCOME TAXES
Income (loss) from continuing operations before income taxes includes the following components:
| | | | | (In Millions) | | (In Millions) |
| | | 2018 | | 2017 | | 2016 | | 2020 | | 2019 | | 2018 |
| United States | | $ | 565.0 |
| | $ | 90.7 |
| | $ | 124.9 |
| United States | | $ | (201) | | | $ | 313 | | | $ | 565 | |
| Foreign | | (0.3 | ) | | 17.5 |
| | (14.5 | ) | Foreign | | 8 | | | 0 | | | 0 | |
| | $ | 564.7 |
| | $ | 108.2 |
| | $ | 110.4 |
| | $ | (193) | | | $ | 313 | | | $ | 565 | |
The components of the income tax benefitprovision (benefit) on continuing operations consist of the following:
| | | | | | | | | | | | | | | | | | | | |
| | (In Millions) |
| | 2020 | | 2019 | | 2018 |
| Current provision (benefit): | | | | | | |
| United States federal | | $ | (2) | | | $ | (1) | | | $ | (1) | |
| United States state & local | | 0 | | | 0 | | | 0 | |
| Foreign | | (1) | | | 0 | | | 1 | |
| | (3) | | | (1) | | | 0 | |
| Deferred provision (benefit): | | | | | | |
| United States federal | | (95) | | | 19 | | | (475) | |
| United States state & local | | (11) | | | 0 | | | 0 | |
| Foreign | | (2) | | | 0 | | | 0 | |
| Total income tax provision (benefit) from continuing operations | | $ | (111) | | | $ | 18 | | | $ | (475) | |
|
| | | | | | | | | | | | |
| | | (In Millions) |
| | | 2018 | | 2017 | | 2016 |
| Current provision (benefit): | | | | | | |
| United States federal | | $ | (0.5 | ) | | $ | (252.6 | ) | | $ | (11.1 | ) |
| United States state & local | | — |
| | (0.1 | ) | | (0.5 | ) |
| Foreign | | 0.7 |
| | 0.3 |
| | (0.1 | ) |
| | | 0.2 |
| | (252.4 | ) | | (11.7 | ) |
| Deferred benefit: | | | | | | |
| United States federal | | (475.4 | ) | | — |
| | (0.5 | ) |
| Total income tax benefit from continuing operations | | $ | (475.2 | ) | | $ | (252.4 | ) | | $ | (12.2 | ) |
Reconciliation of our income tax attributable to continuing operations computed at the U.S. federal statutory rate is as follows:
| | | | | | | | | | | | | | | | | | | | | | | | | | | | | | | | | | | | | | |
| | (In Millions) |
| | 2020 | | 2019 | | 2018 |
| Tax at U.S. statutory rate | | $ | (41) | | | 21 | % | | $ | 66 | | | 21 | % | | $ | 119 | | | 21 | % |
| Increase (decrease) due to: | | | | | | | | | | | | |
| Percentage depletion in excess of cost depletion | | (42) | | | 22 | | | (49) | | | (16) | | | (55) | | | (10) | |
| Non-taxable income related to noncontrolling interests | | (9) | | | 4 | | | 0 | | | 0 | | | 0 | | | 0 | |
| | | | | | | | | | | | |
| Luxembourg legal entity reduction | | 0 | | | 0 | | | 846 | | | 271 | | | 162 | | | 29 | |
| Valuation allowance release: | | | | | | | | | | | | |
| Current year activity | | 0 | | | 0 | | | 0 | | | 0 | | | (80) | | | (14) | |
| Release of U.S. valuation allowance | | 0 | | | 0 | | | 0 | | | 0 | | | (461) | | | (81) | |
| Luxembourg legal entity reduction | | 0 | | | 0 | | | (846) | | | (271) | | | (162) | | | (29) | |
| State taxes, net | | (11) | | | 6 | | | 0 | | | 0 | | | 0 | | | 0 | |
| | | | | | | | | | | | |
| | | | | | | | | | | | |
| | | | | | | | | | | | |
| | | | | | | | | | | | |
| | | | | | | | | | | | |
| | | | | | | | | | | | |
| Other items, net | | (8) | | | 4 | | | 1 | | | 1 | | | 2 | | | 0 | |
| Provision for income tax expense (benefit) and effective income tax rate including discrete items | | $ | (111) | | | 57 | % | | $ | 18 | | | 6 | % | | $ | (475) | | | (84) | % |
|
| | | | | | | | | | | | | | | | | | | | | |
| | | (In Millions) |
| | | 2018 | | 2017 | | 2016 |
| Tax at U.S. statutory rate | | $ | 118.6 |
| | 21.0 | % | | $ | 37.9 |
| | 35.0 | % | | $ | 38.6 |
| | 35.0 | % |
| Increase (decrease) due to: | | | | | | | | | | | | |
| Percentage depletion in excess of cost depletion | | (54.6 | ) | | (9.7 | ) | | (61.6 | ) | | (56.9 | ) | | (36.1 | ) | | (32.7 | ) |
| Impact of tax law change - remeasurement of deferred taxes | | — |
| | — |
| | 407.5 |
| | 376.6 |
| | 149.1 |
| | 135.1 |
|
| Dissolution of Luxembourg entities | | 161.7 |
| | 28.6 |
| | — |
| | — |
| | — |
| | — |
|
| Prior year adjustments in current year | | (1.0 | ) | | (0.2 | ) | | (1.1 | ) | | (1.0 | ) | | (11.8 | ) | | (10.7 | ) |
| Valuation allowance build (reversal): | | | | | | | | | | | | |
| Tax law change - remeasurement of deferred taxes | | — |
| | — |
| | (407.5 | ) | | (376.6 | ) | | (149.1 | ) | | (135.1 | ) |
| Current year activity | | (80.6 | ) | | (14.3 | ) | | (466.3 | ) | | (431.0 | ) | | 122.9 |
| | 111.3 |
|
| Release of U.S. valuation allowance | | (460.5 | ) | | (81.5 | ) | | — |
| | — |
| | — |
| | — |
|
| Repeal of AMT | | — |
| | — |
| | (235.3 | ) | | (217.5 | ) | | — |
| | — |
|
| Dissolution of Luxembourg entities | | (161.7 | ) | | (28.6 | ) | | — |
| | — |
| | — |
| | — |
|
| Prior year adjustments in current year | | 1.0 |
| | 0.2 |
| | (3.5 | ) | | (3.2 | ) | | 9.3 |
| | 8.4 |
|
| Tax uncertainties | | (1.3 | ) | | (0.2 | ) | | (1.4 | ) | | (1.3 | ) | | (11.3 | ) | | (10.2 | ) |
| Worthless stock deduction | | — |
| | — |
| | — |
| | — |
| | (73.4 | ) | | (66.5 | ) |
| Impact of foreign operations | | 0.1 |
| | — |
| | 477.9 |
| | 441.7 |
| | (40.6 | ) | | (36.8 | ) |
| Other items, net | | 3.1 |
| | 0.6 |
| | 1.0 |
| | 0.9 |
| | (9.8 | ) | | (8.9 | ) |
| Provision for income tax benefit and effective income tax rate including discrete items | | $ | (475.2 | ) | | (84.1 | )% | | $ | (252.4 | ) | | (233.3 | )% | | $ | (12.2 | ) | | (11.1 | )% |
Our tax provision for the year ended December 31, 2018 was a benefit of $475.2 million and an effective tax rate of negative 84.1% compared with a benefit of $252.4 million and an effective tax rate of negative 233.3% for the prior year. The increase in income tax benefit from 2019 to 2020 is directly correlated to the increase in pre-tax book loss from the prior yearperiod for both federal and state income tax purposes. The other primary driver of the increase in income tax benefit is related to income of noncontrolling interests for which no tax is recognized.
The increase in income tax expense from 2018 to 2019 is primarily due to release of the valuation allowance in the U.S. of $460.5$461 million in the fourth quarter of 2018. Additionally, during 2018, awhich did not recur in 2019. The Luxembourg legal entity reduction initiative was completedrelates to initiatives resulting in the dissolution of two Luxembourgcertain entities bothand settlement of which held net operating loss deferred tax assets. This asset reduction resultedrelated financial instruments in an expense of $161.7 million which was fully offset by a decrease in valuation allowance. In December 2017, a benefit of $235.3 million was recorded as a result of the repeal of AMT in the 2017 U.S. income tax reform legislation. Additionally, the impact of tax law change - remeasurement of deferred taxes for the year ended December 31, 2017 primarily relates to the statutory rate reduction in the U.S. that decreased the deferred tax assets by $334.1 million, which was fully offset by a decrease in the valuation allowance. Also on December 31, 2017 and 2016, there was a Luxembourg rate reduction that decreased the deferred tax assets by $73.4 million and $149.1 million, respectively. Both of these asset reductions were fully offset by a decrease in valuation allowance. The impact of foreign operations relates to income and losses in foreign jurisdictions where the statutory rates, ranging from 0% to 29.22%, differ from the U.S. statutory rate of 21% for the year ended December 31, 2018 and 35% for the years ended December 31, 20172019 and 2016.
2018. These 2019 and 2018 NOL deferred tax asset reductions resulted in tax expense of $846 million and $162 million, respectively, which were fully offset by decreases in the respective valuation allowance.
The components of income taxes for other than continuing operations consisted of the following:
| | | | | | | | | | | | | | | | | | | | |
| | (In Millions) |
| | 2020 | | 2019 | | 2018 |
| Other comprehensive income: | | | | | | |
| Postretirement benefit liability | | $ | (52) | | | $ | 11 | | | $ | 4 | |
| Unrealized net loss on derivative financial instruments | | (1) | | | 0 | | | 1 | |
| Total | | $ | (53) | | | $ | 11 | | | $ | 5 | |
| | | | | | |
| | | | | | |
| | | | | | |
| | | | | | |
|
| | | | | | | | | | | | |
| | | (In Millions) |
| | | 2018 | | 2017 | | 2016 |
| Other comprehensive (income) loss: | | | | | | |
| Postretirement benefit liability | | $ | 3.6 |
| | $ | — |
| | $ | — |
|
| Unrealized net loss on derivative financial instruments | | 0.7 |
| | — |
| | — |
|
| Other | | — |
| | — |
| | 0.5 |
|
| Total | | $ | 4.3 |
| | $ | — |
| | $ | 0.5 |
|
Significant components of our deferred tax assets and liabilities are as follows:
| | | | (In Millions) |
| | | 2020 | | 2019 |
| Deferred tax assets: | | Deferred tax assets: | | | |
| Operating loss and other carryforwards | | Operating loss and other carryforwards | $ | 1,236 | | | $ | 795 | |
| Pension and OPEB liabilities | | Pension and OPEB liabilities | 228 | | | 114 | |
| | Property, plant and equipment and mineral rights | | Property, plant and equipment and mineral rights | 0 | | | 1 | |
| | | | | (In Millions) | |
| | | 2018 | | 2017 | |
| Deferred tax assets: | | | | | |
| Operating loss carryforwards | | $ | 2,118.8 |
| | $ | 2,362.4 |
| |
| Pensions | | 77.5 |
| | 76.3 |
| |
| OPEB | | 25.3 |
| | 25.6 |
| |
| Deferred income | | 23.3 |
| | 24.2 |
| |
| Intangible assets | | 11.6 |
| | 13.0 |
| |
| Property, plant and equipment and mineral rights | | 13.3 |
| | — |
| |
| State and local | | 68.2 |
| | 74.2 |
| State and local | 132 | | | 71 | |
| | Other liabilities | | 36.8 |
| | 30.4 |
| Other liabilities | 190 | | | 70 | |
| Total deferred tax assets before valuation allowance | | 2,374.8 |
| | 2,606.1 |
| Total deferred tax assets before valuation allowance | 1,786 | | | 1,051 | |
| Deferred tax asset valuation allowance | | (1,287.3 | ) | | (1,983.1 | ) | Deferred tax asset valuation allowance | (836) | | | (441) | |
| Net deferred tax assets | | 1,087.5 |
| | 623.0 |
| Net deferred tax assets | 950 | | | 610 | |
| Deferred tax liabilities: | |
| |
| Deferred tax liabilities: | |
| Investment in partnerships | | Investment in partnerships | (144) | | | (137) | |
| | Property, plant and equipment and mineral rights | | — |
| | (1.5 | ) | Property, plant and equipment and mineral rights | (246) | | | 0 | |
| Investment in ventures | | (141.2 | ) | | (137.5 | ) | |
| Intercompany notes | | (465.7 | ) | | (465.7 | ) | |
| Other assets | | (15.8 | ) | | (18.3 | ) | Other assets | (68) | | | (14) | |
| Total deferred tax liabilities | | (622.7 | ) | | (623.0 | ) | Total deferred tax liabilities | (458) | | | (151) | |
| Net deferred tax assets | | $ | 464.8 |
| | $ | — |
| Net deferred tax assets | $ | 492 | | | $ | 459 | |
We had gross domestic (including states) and foreign net operating loss carryforwardsNOLs of $3.6 billion$7,444 million and $6.6 billion,$1,592 million, respectively, at December 31, 2018.2020. We had gross domestic and foreign net operating loss carryforwardsNOLs of $3,459 million and $1,592 million, respectively, at December 31, 2017 of $4.2 billion and $7.2 billion, respectively.2019. The U.S. Federal net operating lossesfederal NOLs will begin to expire in 2034 and state net operating lossesNOLs will begin to expire in 2019.2021. The foreign net operating lossesNOLs can be carried forward indefinitely. We had foreign tax credit carryforwards of $5.8$6 million at December 31, 2018 and 2017. The foreign tax credit carryforwards will begin to expire2019, which expired in 2020. We had gross interest expense limitation carryforwards of $80 million and $55 million for the years ended December 31, 2020 and 2019, respectively. This interest expense can be carried forward indefinitely.
The changes in the valuation allowance are presented below:
| | | | | | | | | | | | | | | | | |
| (In Millions) |
| 2020 | | 2019 | | 2018 |
| Balance at beginning of year | $ | 441 | | | $ | 1,287 | | | $ | 1,983 | |
| Change in valuation allowance: | | | | | |
| Included in income tax expense (benefit) | (3) | | | (846) | | | (691) | |
| Change in deferred assets in other comprehensive income | 0 | | | 0 | | | (5) | |
| Increase from acquisitions | 398 | | | 0 | | | 0 | |
| Balance at end of year | $ | 836 | | | $ | 441 | | | $ | 1,287 | |
During 2020, we recorded a $398 million valuation allowance through opening balance sheet adjustments to reflect the portion of federal and state NOLs that are limited under Section 382 of the IRC acquired through the AK Steel Merger.
During 2019, a legal entity reduction initiative was completed in Luxembourg resulting in the dissolution of certain entities and settlement of related financial instruments, triggering the utilization of $1.3 billion of NOL deferred tax asset and reversal of the intercompany notes deferred tax liability of $447 million. In addition, prior year adjustments in Luxembourg and a statutory rate reduction from 26.01% to 24.94% resulted in a net increase to the operating loss carryforward deferred tax asset of $46 million. The total net deferred tax reduction resulted in an expense of $846 million which was fully offset by a decrease in the valuation allowance. During 2018, a similar legal entity reduction initiative was completed resulting in the dissolution of certain Luxembourg entities which resulted in a decrease in the NOL deferred tax asset of $162 million which was fully offset by a decrease in valuation allowance. We continue to maintain a full valuation allowance against the remaining Luxembourg net deferred tax assets of $397 million at December 31, 2020 and 2019.Our losses in Luxembourg in recent periods represent sufficient negative evidence to require a full valuation allowance against the deferred tax assets in that jurisdiction. We intend
to maintain a valuation allowance against the deferred tax assets related to these operating losses, until sufficient positive evidence exists to support the realization of such assets.
We recorded a $695.8$696 million net decrease in the valuation allowance of certain deferred tax assets in the year ended December 31, 2018. As of December 31, 2018, our U.S. operations emerged from a three-year cumulative loss position. As the significant negative evidence of cumulative losses hashad been eliminated, we undertook an evaluation of the continuing need for a valuation allowance on the U.S. deferred tax assets, the majority of which relaterelated to the U.S. tax net operating losses.NOLs.
In completing our evaluation of whether a valuation allowance was still needed, we considered all available positive and negative evidence. Positive evidence considered included the emergence from the three-year cumulative loss position, our long-term customer contracts with minimum tonnage requirements, the global scarcity of iron ore pellets, near term forecasts of strong profitability and the recently revised IRC Section 163(j) interest deduction limitation.
Negative evidence included the overall size of the deferred tax asset with limited carryforward and no carryback opportunity, the finite nature of the iron ore resources we mine, the uncertainty of steel tariffs that positively impacted our revenue rates in 2018 and the various market signs that the U.S. economy may be nearing the end of the current expansion.
We also considered that future realization of the deferred tax assets depends on the existence of sufficient taxable income of the appropriate character during the carryforward period. In considering sources of taxable income, we identified that a portion of the deferred tax assets would be utilized by existing taxable temporary differences reversing in the same periods as existing deductible temporary differences. In addition, we determined that carryback opportunities and tax planning strategies do not exist as potential sources of future taxable income. Lastly, forecasting future taxable income was considered, but iswas challenging in a cyclical industry such as ours as it relies heavily on the accuracy of key assumptions, particularly about key pricing benchmarks.
Because historical information is verifiable and more objective than forecast information and due to the cyclicality of the industry, we developed an estimate of future income based on our historical earnings through the most recent industry cycle. We adjusted historical earnings for certain non-recurring items as well as to reflect the current corporate structure by eliminating the impact of discontinued operations and extinguished debt (“core earnings”). Additionally, we adjusted core earnings to reflect the impact of the recently revised IRC Section 163(j) interest expense deduction limitation as well as permanent tax adjustments. The IRC Section 163(j) limitation willwould limit our interest expense deduction, particularly in down years in the industry cycle, resulting in higher taxable income.
Based on the core earnings analysis, the Company’sour average annual book taxable income through the business cycle iswas in excess of the estimated $109.0$10 million taxable income that would be required annually to fully utilize the deferred tax assets within the 19 year19-year carryforward period. We ascribed significant weight in our assessment to the core earnings analysis and the resulting projection of taxable income through the industry cycle. Based on the weight of this positive evidence, and after considering the other available positive and negative evidence, we determined that it was appropriate to release all of the valuation allowance related to U.S. federal deferred tax assets at December 31, 2018 as it iswas more likely than not that the entire amount of the U.S. deferred tax asset willwould be realized before the end of the carryforward period. The income tax benefit recorded for the reversal of the valuation allowance against the U.S. deferred tax assets is $460.5 million.
During 2018, a legal entity reduction initiative was completed resulting in$461 million for the dissolution of two Luxembourg entities, both of which held net operating loss deferred tax assets. This asset reduction resulted in an expense of $161.7 million which was fully offset by a decrease in valuation allowance. The remainder of the decrease relates to current year activity.
We continue to maintain a full valuation allowance against the remaining Luxembourg subsidiaries net deferred tax assets of approximately $1.2 billion.Our losses in Luxembourg in recent periods represent sufficient negative evidence to require a full valuation allowance against the deferred tax assets in that jurisdiction. We intend to maintain a valuation allowance against the deferred tax assets related to these operating losses, until sufficient positive evidence exists to support the realization of such assets.ended December 31, 2018.
We also have a valuation allowance recorded against certain state net operating lossesNOLs and foreign tax credits, which are expected to expire before utilizationutilization. At December 31, 2020 and 2019, we had a valuation allowance recorded against certain state NOLs of approximately $38.3$98 million and $5.8$38 million, atrespectively. At December 31, 2018 and 2017, respectively.2019, we had a valuation allowance recorded against certain foreign tax credits of $6 million, which expired in 2020.
At December 31, 20182020 and 2017,2019, we had no0 cumulative undistributed earnings of foreign subsidiaries included in consolidated retained earnings. Accordingly, no provision has been made for U.S. deferred taxes related to future repatriation of earnings.
A reconciliation of the beginning and ending amount of unrecognized tax benefits is as follows:
| | | | | | | | | | | | | | | | | | | | |
| | (In Millions) |
| | 2020 | | 2019 | | 2018 |
| Unrecognized tax benefits balance as of January 1 | | $ | 29 | | | $ | 29 | | | $ | 33 | |
| | | | | | |
| Increase for tax positions in current year | | 7 | | | 0 | | | 4 | |
| | | | | | |
| Decrease for tax positions of prior year | | (4) | | | 0 | | | 0 | |
| Lapses in statutes of limitations | | 0 | | | 0 | | | (8) | |
| Increases from acquisitions | | 75 | | | 0 | | | 0 | |
| Unrecognized tax benefits balance as of December 31 | | $ | 107 | | | $ | 29 | | | $ | 29 | |
|
| | | | | | | | | | | | |
| | | (In Millions) |
| | | 2018 | | 2017 | | 2016 |
| Unrecognized tax benefits balance as of January 1 | | $ | 33.5 |
| | $ | 30.7 |
| | $ | 156.2 |
|
| Increase (decrease) for tax positions in prior years | | 0.1 |
| | (2.8 | ) | | (61.0 | ) |
| Increase for tax positions in current year | | 3.6 |
| | 4.5 |
| | 0.2 |
|
| Settlements | | — |
| | 1.0 |
| | (64.7 | ) |
| Lapses in statutes of limitations | | (8.2 | ) | | — |
| | — |
|
| Other | | — |
| | 0.1 |
| | — |
|
| Unrecognized tax benefits balance as of December 31 | | $ | 29.0 |
| | $ | 33.5 |
| | $ | 30.7 |
|
At December 31, 20182020 and 2017,2019, we had $29.0$107 million and $33.5$29 million, respectively, of unrecognized tax benefits recorded. Of this amount, $4.2$9 million was recorded in Other current liabilities for the year ended December 31, 2020. Additionally, $2 million and $6.1$4 million, respectively, were recorded in Other non-current liabilities for the years ended December 31, 2020 and $24.82019, respectively, and $96 million and $27.4 million, respectively, werewas recorded as in Other non-current assets for both years in the Statements of Consolidated Financial Position for both years.Position. If the $29.0 millionunrecognized tax benefits were recognized, only $4.2the entire $11 million would impact the effective tax rate. We do not expect that the amount of unrecognized benefits will change significantly within the next 12 months. At December 31, 20182020 and 2017,2019, we had $2.7$1 million and $2.1$4 million, respectively, of accrued interest and penalties related to the unrecognized tax benefits recorded in Other non-current liabilities in the Statements of Consolidated Financial Position.
Tax years 20152016 and forward remain subject to examination for the U.S., and tax years 2008 and forward remain subject to examination for Canada.
NOTE 1113 - ENVIRONMENTAL AND MINE CLOSURELEASE OBLIGATIONS
Our operating leases consist primarily of leases for office space, iron ore vessels, rail cars, processing equipment and mining equipment. Our finance leases consist primarily of processing equipment and mining equipment. We use our incremental borrowing rate as the discount rate to determine the present value of the lease payments, as our leases do not have readily determinable implicit discount rates. Our incremental borrowing rate is the rate of interest that we would have to borrow on a collateralized basis over a similar term and amount in a similar economic environment to pay our lease obligations. We determine the incremental borrowing rates for our leases by adjusting the local risk-free interest rate with a credit risk premium corresponding to our credit rating. From time to time, we may enter into arrangements for the construction or purchase of an asset and then enter into a financing arrangement to lease the asset. We recognize leased assets and liabilities under these arrangements when we obtain control of the asset.
Lease costs are presented below:
| | | | | | | | | | | |
| (In Millions) |
| Year Ended December 31, |
| 2020 | | 2019 |
| Operating leases | $ | 43 | | | $ | 4 | |
| Finance leases: | | | |
| Amortization of lease cost | 15 | | | 6 | |
| Interest on lease liabilities | 4 | | | 2 | |
| Short-term leases | 13 | | | 6 | |
| | | |
| Total | $ | 75 | | | $ | 18 | |
Other information related to leases was as follows:
| | | | | | | | | | | |
| (In Millions) |
| Year Ended December 31, |
| 2020 | | 2019 |
| Cash paid for amounts included in measurement of lease liabilities: | | | |
| Operating leases within cash flows from operating activities | $ | 43 | | | $ | 4 | |
| Finance leases within cash flows from operating activities | $ | 4 | | | $ | 2 | |
| Finance leases within cash flows from financing activities | $ | 15 | | | $ | 6 | |
Right-of-use assets obtained in exchange for new finance lease liabilities1 | $ | 44 | | | $ | 29 | |
| Weighted-average remaining lease term - operating leases (in years) | 8 | | 10 |
| Weighted-average remaining lease term - finance leases (in years) | 5 | | 6 |
| Weighted-average discount rate - operating leases | 8 | % | | 8 | % |
| Weighted-average discount rate - finance leases | 4 | % | | 5 | % |
1 Right-of-use assets obtained in the Acquisitions are not included in this figure. |
Future minimum lease payments under noncancellable finance and operating leases as of December 31, 2020 were as follows:
| | | | | | | | | | | |
| (In Millions) |
| Finance
Leases | | Operating Leases |
| 2021 | $ | 100 | | | $ | 70 | |
| 2022 | 95 | | | 53 | |
| 2023 | 78 | | | 46 | |
| 2024 | 23 | | | 38 | |
| 2025 | 22 | | | 34 | |
| Thereafter | 76 | | | 122 | |
| Total future minimum lease payments | 394 | | | 363 | |
| Less: imputed interest | 59 | | | 99 | |
| Total lease payments | 335 | | | 264 | |
| Less: current portion of lease liabilities | 91 | | | 53 | |
| Long-term lease liabilities | $ | 244 | | | $ | 211 | |
The current and long-term portions of our finance lease liabilities are included in Other current liabilities and Other non-current liabilities, respectively. The current and long-term portions of our operating lease liabilities are included in Other current liabilities and Other non-current liabilities, respectively.
NOTE 14 - ASSET RETIREMENT OBLIGATIONS
The following is a summary of our environmental and mine closureasset retirement obligations:
|
| | | | | | | |
| | (In Millions) |
| | December 31, |
| | 2018 | | 2017 |
| Environmental | $ | 2.5 |
| | $ | 2.9 |
|
Mine closure1 | 172.4 |
| | 168.4 |
|
| Total environmental and mine closure obligations | 174.9 |
| | 171.3 |
|
| Less current portion | 2.9 |
| | 3.6 |
|
| Long-term environmental and mine closure obligations | $ | 172.0 |
| | $ | 167.7 |
|
| | | | |
1 Includes our active operating mines, our indefinitely idled Empire mine and a closed mine formerly operating as LTVSMC. |
Environmental
Our mining and exploration activities are subject to various laws and regulations governing the protection of the environment. We conduct our operations to protect the public health and environment and believe our operations are in compliance with applicable laws and regulations in all material respects. Our environmental liabilities include obligations for known environmental remediation exposures at various active and closed mining operations and other sites, and have been recognized based on the estimated cost of investigation and remediation at each site. If the cost can only be estimated as a range of possible amounts with no specific amount being more likely, the minimum of the range is accrued. Future expenditures are not discounted unless the amount and timing of the cash disbursements are readily known. Potential insurance recoveries have not been reflected. Additional environmental obligations could be incurred, the extent of which cannot be assessed.
Mine Closure | | | | | | | | | | | |
| (In Millions) |
| December 31, |
| 2020 | | 2019 |
Asset retirement obligations1 | $ | 342 | | | $ | 165 | |
| Less: current portion | 7 | | | 2 | |
| Long-term asset retirement obligations | $ | 335 | | | $ | 163 | |
| | | |
1 Includes $190 million and $22 million related to our active operations as of December 31, 2020 and 2019, respectively. |
The accrued closure obligation for our mining operations provides for contractual and legal obligations associated
withrelated to our indefinitely idled and closed operations and for the eventual closure of the miningour active operations. We performed a detailed assessment of our asset retirement obligations related to our active mining locationsoperations most recently in 2020 in accordance with our
accounting policy, under which werequires us to perform an in-depth evaluation of the liability every three years in addition to routine annual assessments. In 2017,2020, we employed a third-party specialistspecialists to assist in the triennial in-depth evaluation.
For the assessments performed,Additionally, we determined the obligations based on detailed estimates adjustedhave included in our asset retirement obligation $172 million for factors that a market participant would consider (e.g., inflation, overheadour integrated steel facilities and profit) and then discounted the obligation using the current credit-adjusted risk-free interest rate based on the corresponding life of mine. The estimate also incorporates incremental increasesother operations acquired in the closure cost estimates and changes in estimates of mine lives.Acquisitions. The closure date for each of our active operating mine sites was determined based on the exhaustion date of the remaining iron ore reserves.mineral reserves and the amortization of the related asset and accretion of the liability is recognized over the estimated mine lives. The closure date and expected timing of the capital requirements to meet our obligations for our indefinitely idled or closed mines is determined based on the unique circumstances of each property. For indefinitely idled or closed mines, the accretion of the liability is recognized over the anticipated timing of remediation. The amortizationAs the majority of our asset retirement obligations at our steelmaking operations have indeterminate settlement dates, asset retirement obligations have been recorded at present values using estimated ranges of the related asset and accretioneconomic lives of the liability is recognized over the estimated mine lives for our active operations.underlying assets.
The following representsis a roll forwardroll-forward of our asset retirement obligation liability for the years ended:liability:
| | | | | | | | | | | | |
| (In Millions) | |
| 2020 | | 2019 | |
| Asset retirement obligation as of January 1 | $ | 165 | | | $ | 172 | | |
| Increase from acquisitions | 172 | | | 0 | | |
| Accretion expense | 14 | | | 10 | | |
| Remediation payments | (9) | | | (1) | | |
| Revision in estimated cash flows | — | | | (16) | | |
| Asset retirement obligation as of December 31 | $ | 342 | | | $ | 165 | | |
|
| | | | | | | |
| | (In Millions) |
| | December 31, |
| | 2018 | | 2017 |
| Asset retirement obligation at beginning of year | $ | 168.4 |
| | $ | 187.8 |
|
| Accretion expense | 9.5 |
| | 13.9 |
|
| Remediation payments | (1.0 | ) | | (5.6 | ) |
| Revision in estimated cash flows | (4.5 | ) | | (27.7 | ) |
| Asset retirement obligation at end of year | $ | 172.4 |
| | $ | 168.4 |
|
ForThe revision in estimated cash flows during the year ended December 31, 2017, the revision of estimated cash flows2019 for $16 million primarily relates primarily to updates to our estimates resulting from our three-year in-depth review of our closure obligations for each of our U.S. mines. The primary driveran extension of the decrease in estimated cash flows was the Empirelife-of-mine plan for Tilden mine as the mine closure obligation was reduced $26.2 million as a result of the refinement of the cash flows required for reclamation, remediation and structural removal. Prior estimates were based on RS Means (a common costing methodology used in the construction and demolition industry) average costing data while the current estimate was compiled using a more detailed cost build-up approach.economic reserve analysis performed during 2019.
NOTE 1215 - DERIVATIVE INSTRUMENTS AND HEDGING ACTIVITIES
The following table presents the fair value of our derivative instruments and the classification of each in the Statements of Consolidated Financial Position:
|
| | | | | | | | | | | | | | | | | | | | | | | |
| | (In Millions) |
| | Derivative Assets | | Derivative Liabilities |
| | December 31, 2018 | | December 31, 2017 | | December 31, 2018 | | December 31, 2017 |
| Derivative Instrument | Balance Sheet Location | | Fair Value | | Balance Sheet Location | | Fair Value | | Balance Sheet Location | | Fair Value | | Balance Sheet Location | | Fair Value |
| Derivatives designated as hedging instruments under ASC 815: | | | | | | | | | | | | | | | |
| Commodity contracts | Derivative assets | | $ | 0.1 |
| | | | $ | — |
| | Other current liabilities | | $ | 3.7 |
| | Other current liabilities | | $ | 0.3 |
|
| Derivatives not designated as hedging instruments under ASC 815: | | | | | | | | | | | | | | | |
| Customer supply agreement | Derivative assets | | 89.3 |
| | Derivative assets | | 37.9 |
| | | | — |
| | | | — |
|
| Provisional pricing arrangements | Derivative assets | | 2.1 |
| | | | — |
| | | | — |
| | Other current liabilities | | 1.7 |
|
| Total derivatives not designated as hedging instruments under ASC 815: | | | $ | 91.4 |
| | | | $ | 37.9 |
| | | | $ | — |
| | | | $ | 1.7 |
|
| Total derivatives | | | $ | 91.5 |
| | | | $ | 37.9 |
| | | | $ | 3.7 |
| | | | $ | 2.0 |
|
Derivatives Designated as Hedging Instruments - Cash Flow Hedges
Commodity Contracts
The following table presents our outstanding hedge contracts:
|
| | | | | | | | | | | |
| | (Quantities in Millions) |
| | December 31, 2018 | | December 31, 2017 |
| | Notional Amount | | Unit of Measure | | Varying Maturity Dates | | Notional Amount | | Unit of Measure | | Varying Maturity Dates |
| Natural gas | 1.8 | | MMBtu | | January 2019 - August 2019 | | 3.5 | | MMBtu | | January 2018 - November 2018 |
| Diesel | 11.0 | | Gallons | | January 2019 - December 2019 | | — | | | | |
Derivatives Not Designated as Hedging Instruments
Customer Supply Agreement
A supply agreement with one customer provides forArcelorMittal USA provided us supplemental revenue or provided refunds to the customerArcelorMittal USA based on the average annual daily steel marketHRC price for hot-rolled coil steel at the time the iron ore product iswas consumed in the customer’sits blast furnace. Historically, prior to the contract that commenced in 2017, this supplemental revenue and refund data source was the customer's average annual realized steel price.furnaces. The supplemental pricing is characterized as a freestanding derivative instrument and is required to be accounted for separately once control transfers to the customer. The derivative instrument, which is finalized based on a future price, is adjusted to fair value through Product revenuesRevenues each reporting period based upon current market data and forward-looking estimates provided by management until the pellets are consumed and the amounts are settled.
Provisional Pricing Arrangements
Certain Upon the completion of our supply agreements specify provisional price calculations, where the pricing mechanisms generally are based on market pricing, withAM USA Transaction, the finaloutstanding derivatives were settled as part of acquisition accounting. Included within Revenues related to Topic 815 for the supplemental revenue rate based on certain market inputs at a specified period in time in
the future, per the termsportion of the supply agreements. Market inputs are tied to indexed price adjustment factors that are integral toagreement is derivative revenue of $122 million, $78 million and $426 million for the iron ore supply contractsyears ended December 31, 2020, 2019 and vary based on the agreement. The pricing mechanisms typically include adjustments based upon changes in the Platts 62% Price, along with Atlantic Basin pellet premiums, published Platts international indexed freight rates and changes in specified Producer Price Indices, including those for industrial commodities, fuel and steel. The pricing adjustments generally operate in the same manner, with each factor typically comprising a portion of the price adjustment, although the weighting of each factor varies based upon the specific terms of each agreement. The price adjustment factors have been evaluated to determine if they qualify as embedded derivatives. The price adjustment factors share the same economic characteristics and risks as the host contract and are integral to the host contract as inflation adjustments; accordingly, they have not been separately valued as derivative instruments.
Revenue is recognized generally upon delivery to our customers. Revenue is measured at the point that control transfers and represents the amount of consideration we expect to receive in exchange for transferring goods. Changes in the expected revenue rate from the date that control transfers through final settlement of contract terms is recorded in accordance with Topic 815 and is characterized as a derivative and accounted for separately. Subsequently, the derivative instruments are adjusted to fair value through Product revenues each reporting period based upon current market data and forward-looking estimates provided by management until the final revenue rate is determined.
The 2018, amounts represent the difference between the amount we expected to receive when revenue was initially measured at the point control transfers and our subsequent estimate of the final revenue rate based on the price calculation established in the supply agreements. The 2017 and 2016 amounts represent the difference between the provisional price agreed upon with our customers based on the supply agreement terms and our estimate of the final revenue rate based on the price calculations established in the supply agreements.
The following summarizes the effect of our derivatives that are not designated as hedging instruments in the Statements of Consolidated Operations:
|
| | | | | | | | | | | | |
| (In Millions) |
| Derivatives Not Designated as Hedging Instruments | Location of Gain (Loss) Recognized in Income on Derivative | Year Ended
December 31, |
| | | 2018 | | 2017 | | 2016 |
| Customer supply agreements | Product revenues | $ | 425.8 |
| | $ | 163.3 |
| | $ | 41.7 |
|
| Provisional pricing arrangements | Product revenues | (3.2 | ) | | (42.7 | ) | | 14.2 |
|
| Commodity contracts | Cost of goods sold and operating expenses | — |
| | (1.3 | ) | | 1.9 |
|
| Total | | $ | 422.6 |
| | $ | 119.3 |
| | $ | 57.8 |
|
Refer to NOTE 79 - FAIR VALUE OF FINANCIAL INSTRUMENTS for additional information.
NOTE 16 - CAPITAL STOCK
Acquisition of AK Steel
As more fully described in NOTE 3 - ACQUISITIONS, we acquired AK Steel on March 13, 2020. At the effective time of the AK Steel Merger, each share of AK Steel common stock issued and outstanding prior to the effective time of the AK Steel Merger was converted into, and became exchangeable for, 0.400 Cliffs common shares, par value $0.125 per share. We issued a total of 127 million Cliffs common shares in connection with the AK Steel Merger at a fair value of $618 million. Following the closing of the AK Steel Merger, AK Steel's common stock was de-listed from the NYSE.
Acquisition of ArcelorMittal USA
As more fully described in NOTE 3 - DISCONTINUED OPERATIONSACQUISITIONS, we acquired ArcelorMittal USA on December 9, 2020. Pursuant to the terms of the AM USA Transaction Agreement, we issued 78,186,671 common shares and 583,273 shares of a new series of our Serial Preferred Stock, Class B, without par value, designated as the “Series B Participating Redeemable Preferred Stock,” in each case to an indirect, wholly owned subsidiary of ArcelorMittal as part of the consideration paid by us in connection with the closing of the AM USA Transaction. Refer to Preferred Stock below for further information.
Preferred Stock
We have 3,000,000 shares of Serial Preferred Stock, Class A, without par value and 4,000,000 shares of Serial Preferred Stock, Class B, without par value, authorized; 0 Class A preferred shares are issued or outstanding. Pursuant to the terms of the AM USA Transaction Agreement, we issued 583,273 shares of a new series of our Serial Preferred Stock, Class B, without par value, designated Series B Participating Redeemable Preferred Stock, without par value, to an indirect, wholly owned subsidiary of ArcelorMittal on December 9, 2020.
Series B Participating Redeemable Preferred Stock Terms
The information below sets forth selected financial information related to operating results of our businessesSeries B Participating Redeemable Preferred Stock is classified for accounting purposes as discontinued operations, which include our former Asia Pacific Iron Ore, North American Coal and Canadian operations. While the reclassification of revenues and expenses related to discontinued operations from prior periods has no impact upon previously reported net income, the Statements of Consolidated Operations present the revenues and expenses that were reclassified from the specified line items to discontinued operations and the Statements of Consolidated Financial Position present the assets and liabilities that were reclassified from the specified line items to assets and liabilities of discontinued operations. The charts below provide an asset group breakout for each financial statement line impacted by discontinued operations.
|
| | | | | | | | | | | | |
| | | (In Millions) |
| | | Year Ended December 31, |
| | | 2018 | | 2017 | | 2016 |
| Income (loss) from discontinued operations, net of tax | | | | | | |
| Asia Pacific Iron Ore | | $ | 118.3 |
| | $ | 21.2 |
| | $ | 96.6 |
|
| North American Coal | | (3.6 | ) | | 2.6 |
| | (2.4 | ) |
| Canadian Operations | | (26.5 | ) | | (21.3 | ) | | (17.5 | ) |
| | | $ | 88.2 |
| | $ | 2.5 |
| | $ | 76.7 |
|
|
| | | | | | | | | | | | | | | | | | | | | | | | |
| | | (In Millions) |
| | | December 31, 2018 | | December 31, 2017 |
| | | Asia Pacific Iron Ore | | North American Coal | | Total | | Asia Pacific Iron Ore | | North American Coal | | Total |
| Current assets of discontinued operations | | $ | 12.4 |
| | $ | — |
| | $ | 12.4 |
| | $ | 118.5 |
| | $ | — |
| | $ | 118.5 |
|
| Non-current assets of discontinued operations | | $ | — |
| | $ | — |
| | $ | — |
| | $ | 20.3 |
| | $ | — |
| | $ | 20.3 |
|
| Current liabilities of discontinued operations | | $ | 3.8 |
| | $ | 2.9 |
| | $ | 6.7 |
| | $ | 71.8 |
| | $ | 3.2 |
| | $ | 75.0 |
|
| Non-current liabilities of discontinued operations | | $ | 8.3 |
| | $ | — |
| | $ | 8.3 |
| | $ | 52.2 |
| | $ | — |
| | $ | 52.2 |
|
|
| | | | | | | | | | | | |
| | | (In Millions) |
| | | Year Ended December 31, |
| | | 2018 | | 2017 | | 2016 |
| Net cash provided (used) by operating activities | | | | | | |
| Asia Pacific Iron Ore | | $ | (81.3 | ) | | $ | 79.6 |
| | $ | 99.8 |
|
| Canadian Operations | | (14.6 | ) | | — |
| | — |
|
| | | $ | (95.9 | ) | | $ | 79.6 |
| | $ | 99.8 |
|
| | | | | | | |
| Net cash provided (used) by investing activities | | | | | | |
| Asia Pacific Iron Ore | | $ | 19.8 |
| | $ | (2.8 | ) | | $ | (0.4 | ) |
| Canadian Operations | | — |
| | (7.7 | ) | | 6.8 |
|
| North American Coal | | — |
| | 2.1 |
| | 3.6 |
|
| | | $ | 19.8 |
| | $ | (8.4 | ) | | $ | 10.0 |
|
Asia Pacific Iron Ore Operations
Background
In January 2018, we announced that we would accelerate the time frame for the planned closure of our Asia Pacific Iron Ore mining operations in Australia. In April 2018, we committed to a course of action leading to the permanent closure of our Asia Pacific Iron Ore mining operations and,temporary equity as planned, completed our final shipment in June 2018. Factors considered in this decision included increasingly discounted prices for lower-iron-content ore and the quality of the remaining iron ore reserves.
During 2018, we sold all of the assets of our Asia Pacific Iron Ore business through a series of sales to third parties. As a result of a change in control provision that could, under remote circumstances, require us to redeem the preferred stock for cash.
The Series B Participating Redeemable Preferred Stock ranks senior to our planned exit, management determinedcommon shares with respect to dividend rights and rights on the distribution of assets upon any voluntary or involuntary liquidation, dissolution or winding up of the affairs of, and certain bankruptcy events involving, Cliffs. Each share of Series B Participating Redeemable Preferred Stock entitles its holder to receive a multiple, initially equal to 100 (subject to certain anti-dilution adjustments, the “Applicable Multiple”), of the aggregate amount per share of all dividends declared on the common shares. In addition, from and after the 24-month anniversary of the issue date of the Series B Participating Redeemable Preferred Stock (the “24-Month Anniversary”), each holder of a share of Series B Participating Redeemable Preferred Stock is entitled to receive cash dividends (the “Additional Dividends”) accruing and compounding on a daily basis at the initial rate of 10% per annum on the sum of (i) the Applicable Multiple then in effect times the volume-weighted average price of the common shares for the 20 consecutive trading days ending on the trading day immediately preceding the 24-Month Anniversary and (ii) the amount of accumulated and unpaid dividends on the Series B Participating Redeemable Preferred Stock to, but not including, the 24-Month Anniversary, if any, which rate will increase by 2% per annum at the end of each six-month period following the 24-Month Anniversary. Additional Dividends will be payable, when, as and if declared by the Board, in quarterly installments.
The Series B Participating Redeemable Preferred Stock is redeemable, in whole or in part, at our option at any time and from time to time on and after the date that our Asia Pacific Iron Ore operating segment metis 180 days after the criteriaissue date at a redemption price per share equal to the Applicable Multiple then in effect times the volume-weighted average price of the common shares for the 20 consecutive trading days ending on the trading day immediately preceding the date fixed for redemption, plus accumulated and unpaid dividends to, but not including, the redemption date.
In the event of a change of control of Cliffs, the Series B Participating Redeemable Preferred Stock will be subject to mandatory redemption at a redemption price per share equal to the Applicable Multiple then in effect times the volume-weighted average price of the common shares for the 20 consecutive trading days ending on the trading day immediately preceding the closing date of the transaction constituting such change of control.
In addition, pursuant to the terms of the Series B Participating Redeemable Preferred Stock, we are restricted from effecting any merger or consolidation with or into another entity unless the Series B Participating Redeemable Preferred Stock remains outstanding following the merger or consolidation, is exchanged for new preferred stock with substantially identical terms or is to be classified as held for sale and a discontinued operation under ASC Topic 205, Presentation of Financial Statements. As such, all current and historical Asia Pacific Iron Ore operating segment results are classified within discontinued operations.
Income from Discontinued Operations
For the reasons discussed above, our previously reported Asia Pacific Iron Ore operating segment results for all periods presented, as well as exit costs, are classified as discontinued operations.
|
| | | | | | | | | | | | |
| | | (In Millions) |
| | | Year Ended December 31, |
| Income from Discontinued Operations | | 2018 | | 2017 | | 2016 |
| Revenues from product sales and services | | $ | 129.1 |
| | $ | 464.2 |
| | $ | 554.5 |
|
| Cost of goods sold and operating expenses | | (230.7 | ) | | (427.9 | ) | | (440.9 | ) |
| Sales margin | | (101.6 | ) | | 36.3 |
| | 113.6 |
|
| Other operating expense | | (3.3 | ) | | (9.9 | ) | | (10.4 | ) |
| Other expense | | (2.3 | ) | | (5.2 | ) | | (6.6 | ) |
| Gain on foreign currency translation | | 228.1 |
| | — |
| | — |
|
| Impairment of long-lived assets | | (2.6 | ) | | — |
| | — |
|
| Income from discontinued operations, net of tax | | $ | 118.3 |
| | $ | 21.2 |
| | $ | 96.6 |
|
Recorded Assets and Liabilities
|
| | | | | | | | |
| | | (In Millions) |
| Assets and Liabilities of Discontinued Operations | | December 31,
2018 | | December 31,
2017 |
| Cash and cash equivalents | | $ | 12.4 |
| | $ | 29.4 |
|
| Accounts receivable, net | | — |
| | 33.9 |
|
| Inventories | | — |
| | 45.0 |
|
| Supplies and other inventories | | — |
| | 5.1 |
|
| Other current assets | | — |
| | 5.1 |
|
| Total current assets of discontinued operations | | 12.4 |
| | 118.5 |
|
| Property, plant and equipment, net | | — |
| | 17.2 |
|
| Other non-current assets | | — |
| | 3.1 |
|
| Total assets of discontinued operations | | $ | 12.4 |
| | $ | 138.8 |
|
| | | | | |
| Accounts payable | | $ | 3.4 |
| | $ | 28.2 |
|
| Accrued liabilities | | 0.4 |
| | 28.0 |
|
| Other current liabilities | | — |
| | 15.6 |
|
| Total current liabilities of discontinued operations | | 3.8 |
| | 71.8 |
|
| Environmental and mine closure obligations | | — |
| | 28.8 |
|
| Other liabilities | | 8.3 |
| | 23.4 |
|
| Total liabilities of discontinued operations | | $ | 12.1 |
| | $ | 124.0 |
|
Foreign Currency
Historically, the functional currency of our Australian subsidiaries was the Australian dollar. The financial statements of our Australian subsidiaries were previously translated into U.S. dollars using the exchange rate at each balance sheet date for assets and liabilities and a weighted average exchange rate for each period for revenues, expenses, gains and losses. Translation adjustments were recorded as Accumulated other comprehensive loss. Income taxes were not provided for foreign currency translation adjustments. Concurrentredeemed in connection with the saleclosing of assetssuch merger or consolidation.
In addition to Mineral Resources Limited in 2018, management determined that there had been significant changes in economic factors relatedthe foregoing, the Series B Participating Redeemable Preferred Stock is subject to our Australian subsidiaries. The change in economic factors is a resultthe express terms of the sale and conveyanceSerial Preferred Stock, Class B, without par value, as set forth in Cleveland-Cliffs Inc.’s Fourth Amended Articles of substantially all assets and liabilitiesIncorporation, as amended, except that holders of our Australian subsidiariesSeries B Participating Redeemable Preferred Stock, in their capacity as such, do not have the right to third parties, representingvote with the other series of Serial Preferred Stock, Class B, without par value, then outstanding, if any, voting separately as a significant change in operations. As such, the functional currencyclass, for the Australian subsidiaries was changed fromelection of additional directors of Cleveland-Cliffs Inc. upon certain defaults by the Australian dollarCompany in the payment of dividends, as provided in Cleveland-Cliffs Inc.’s Fourth Amended Articles of Incorporation, as amended.
Dividends
The below table summarizes our recent dividend activity:
| | | | | | | | | | | | | | | | | | | | |
| Declaration Date | | Record Date | | Payment Date | | Dividend Declared per Common Share1 |
| 2/18/2020 | | 4/3/2020 | | 4/15/2020 | | $ | 0.06 | |
| 12/2/2019 | | 1/3/2020 | | 1/15/2020 | | 0.06 | |
| 9/3/2019 | | 10/4/2019 | | 10/15/2019 | | 0.10 | |
| 5/31/2019 | | 7/5/2019 | | 7/15/2019 | | 0.06 | |
| 2/19/2019 | | 4/5/2019 | | 4/15/2019 | | 0.05 | |
| 10/18/2018 | | 1/4/2019 | | 1/15/2019 | | 0.05 | |
| | | | | | |
1 The dividend declared on September 3, 2019 included a special cash dividend of $0.04 per common share. |
Subsequent to the U.S. dollar and all
remaining Australian denominated monetary balances will be remeasured prospectively through the Statements of Consolidated Operations.
In addition,dividend paid on April 15, 2020, our Board temporarily suspended future dividends as a result of the liquidation of substantially all of the Australian subsidiaries' net assets, the historical changes in foreign currency translation recorded in Accumulated other comprehensive loss in the Statements of Consolidated Financial Position totaling $228.1 million was reclassified and recognized as a gain in Income from discontinued operations, net of tax in the Statements of Consolidated Operations.
North American Coal Operations
As of March 31, 2015, management determined that our North American Coal operating segment met the criteria to be classified as held for sale under ASC Topic 205, Presentation of Financial Statements. The North American Coal segment continued to meet the criteria throughout 2015 until we sold our North American Coal operations during the fourth quarter of 2015. As such, all current and historical North American Coal operating segment results are classified as discontinued operations in our financial statements. Historical results also include our CLCC assets, which were sold during the fourth quarter of 2014.
We have recognized a tax benefit of $1.0 million for the year ended December 31, 2018 included in Income from discontinued operations, net of tax in the Statements of Consolidated Operations related to a loss on our North American Coal investments. There was no tax expense or benefit recognized for the years ended December 31, 2017and 2016.
Canadian Operations
CCAA Proceedings
On January 27, 2015, we announced that the Bloom Lake Group commenced restructuring proceedings in Montreal, Quebec under the CCAA to address the Bloom Lake Group's immediate liquidity issues and to preserve and protect its assets for the benefit of all stakeholders while restructuring and/or sale options were explored. Additionally, on May 20, 2015, the Wabush Group commenced restructuring proceedings in Montreal, Quebec under the CCAA.
During March 2018, we entered into a restructuring term sheet that documented the proposed agreed to terms of a plan of compromise or arrangement with the Bloom Lake Group, the Wabush Group and the Monitor in the CCAA proceedings. By order of the Québec Superior Court of Justice (Commercial Division) (the “Court”) dated April 20, 2018, the Bloom Lake Group and the Wabush Group were authorized to file a joint plan of compromise and arrangement dated April 16, 2018 (the “Original Plan”). Following discussions with various stakeholder groups, the Bloom Lake Group and the Wabush Group were authorized by the Court to amend the Original Plan and to file the amended and restated joint plan of compromise and arrangement dated May 16, 2018 (the “Amended Plan”). The Amended Plan was approved by the required majorities of each unsecured creditor class and was sanctioned by the Court by order dated June 29, 2018. In addition, the Bloom Lake Group and the Wabush Group brought a motion before the Court on July 30, 2018 seeking to make further amendments to the Amended Plan to address the manner in which certain distributions under the Amended Plan would be effected. On July 31, 2018, the conditions precedent to the implementation of the Amended Plan were satisfied and the Amended Plan was implemented.
Under the terms of the Amended Plan, we and certain of our wholly-owned subsidiaries made a C$19.0 million cash contribution to the Wabush Group pension plans and agreed to contribute into the CCAA estate any remaining distributions or payments we may be entitled to receive as creditors of the Bloom Lake Group and the Wabush Group for distribution to other creditors. The Original Plan did not resolve certain employee claims asserted against us and certain of our affiliates outside of the CCAA proceedings. The Amended Plan resolved those employee claims, all claims by the Bloom Lake Group, the Wabush Group and their respective creditors against us as well as all of our claims against the Bloom Lake Group and the Wabush Group.
Loss on Discontinued Operations
Our Canadian exit represented a strategic shift in our business. For this reason, our previously reported Eastern Canadian Iron Ore and Ferroalloys operating segment results for all periods prior to the respective deconsolidations, as well as costs to exit, are classified as discontinued operations.
The chart below provides a breakout of loss from deconsolidation:
|
| | | | | | | | | | | | |
| | | (In Millions) |
| | | Year Ended December 31, |
| | | 2018 | | 2017 | | 2016 |
Investment impairment on deconsolidation1 | | $ | (67.5 | ) | | $ | 3.0 |
| | $ | (17.5 | ) |
| Guarantees and contingent liabilities | | 41.0 |
| | (24.3 | ) | | — |
|
| Total loss from deconsolidation | | $ | (26.5 | ) | | $ | (21.3 | ) | | $ | (17.5 | ) |
| | | | | | | |
1 Includes the adjustments to fair value of our remaining interest in the Canadian Entities for the years ended December 31, 2018, 2017 and 2016, and a tax expense resulting from the implementation of the Amended Plan for the year ended December 31, 2018. |
Investments in the Canadian Entities
From the date of deconsolidation until the Amended Plan was approved by the required majorities of each unsecured creditor class and was sanctioned by the Court by order dated June 29, 2018 (the “Sanction Order”), we adjusted our investment in the Canadian Entities to zero with a corresponding charge to Income from discontinued operations, net of tax.
Amounts Receivable from the Canadian Entities
Prior to the deconsolidations, certain of our wholly-owned subsidiaries made loans to the Canadian Entities for the purpose of funding their operations and had accounts receivable generated in the ordinary course of business. The loans, corresponding interest and the accounts receivable were considered intercompany transactions and eliminated in our consolidated financial statements. Since the deconsolidations, the loans, associated interest and accounts receivable are considered related party transactions and have been recognized in our consolidated financial statements at their estimated fair value. As of December 31, 2017 we had $51.6 million classified as Loans to and accounts receivables from the Canadian Entities in the Statements of Consolidated Financial Position. Following the approval of the Amended Plan, we reversed our outstanding $51.6 million classified within Loans to and accounts receivables from the Canadian Entitieswith a corresponding charge to Income from discontinued operations, net of tax in the Statements of Consolidated Financial Position for the year ended December 31, 2018.
Income Tax Expense
We have recognized tax expense of $15.9 million for the year ended December 31, 2018, included in Income from discontinued operations, net of tax related to a gain on our Canadian investments. This expense is primarily the result of the current year receipt of CCAA estate distributions which were immediately contributed back into the CCAA estate as required by the Amended Plan. There was no tax expense or benefit recognized for the years ended December 31, 2017and 2016.
Guarantees and Contingent Liabilities
Under the terms of the approved Amended Plan in 2018, we and certain of our wholly-owned subsidiaries made a C$19.0 million cash contribution included in Income from discontinued operations, net of tax to the Wabush Group pension plans.
During 2017, we became aware that it was probable the Monitor would assert a preference claim against the Company and/or certain of its affiliates. We estimated a liability of $55.6 million, which included the value of our related-party claims against the Bloom Lake Group and the Wabush Group, classified as Contingent claims in the Statements of Consolidated Financial Position as of December 31, 2017. Following the approval of the Amended Plan, we reversed our outstanding liability of $55.6 million with a corresponding credit to Income from discontinued operations, net of tax in the Statements of Consolidated Operations for the year ended December 31, 2018.
During 2017, the Wabush Scully Mine was sold as part of the ongoing CCAA proceedings for the Wabush Group. We previously recorded liabilities of $37.2 million related to guarantees for certain environmental obligations of the Canadian Entities, classified as Other liabilities in the Statements of Consolidated Financial Position as of December 31, 2016. As part of this transaction, we were required to fund the buyer's financial assurance shortfall of $7.7 millionCOVID-19 pandemic in order to complete the conveyancepreserve cash during this time of the environmental remediation obligations to the buyer, which released us from our guarantees and resulted in a net gain of $31.4 million included in Income from discontinued operations, net of tax in the Statements of Consolidated Operations for the year ended December 31, 2017.
NOTE 14 - CAPITAL STOCKeconomic uncertainty.
Share Repurchase Program
OnIn November 26, 2018, we announced that our Board of Directors authorized a program to repurchase outstanding common shares in the open market or in privately negotiated transactions, up to a maximum of $200 million. We are not obligated to make any purchasemillion, excluding commissions and fees. In April 2019, we announced that our Board of Directors increased the program may be suspended or discontinued at any time.common share repurchase authorization by an additional $100 million, excluding commissions and fees. During 2018,2019, we repurchased 5.424 million common shares at a cost of approximately $47.5$253 million in the aggregate, including commissions and fees, or an average price of approximately $8.78 per share. As of December 31, 2018, there was approximately $152.7 million remaining under the authorization.fees. The share repurchase program is activewas effective until December 31, 2019.
Dividends
On October 18, 2018, the Board of Directors declared a quarterly cash dividend on our common shares of $0.05 per share. As a result, we have recorded $15.0 million in Other current liabilities in the Statements of Consolidated Financial Position for the year ended December 31, 2018. Subsequent to year end on January 15, 2019, the cash dividend was paid to shareholders of record as of the close of business on January 4, 2019.
Common Share Public Offering
On February 9, 2017, we issued 63.25 million common shares in an underwritten public offering at a public offering price of $10.75 per common share. We received net proceeds of $661.3 million. The net proceeds from the issuance of our common shares and our issuance of $500 million aggregate principal amount of 2025 Senior Notes were used to redeem in full all of our outstanding 8.00% 2020 1.5 Lien Notes and 7.75% 2020 Second Lien Notes. The aggregate principal amount outstanding of debt redeemed was $648.6 million. Additionally, through tender offers, we purchased $422.2 million in aggregate principal amount of debt, excluding unamortized discounts and deferred charges, of our 5.90% 2020 Senior Notes, our4.80% 2020 Senior Notes and our 4.875% 2021 Senior Notes. In addition, we redeemed $35.6 million aggregate principal amount of the 8.25% 2020 First Lien Notes with the remaining net proceeds from our common share offering.
On August 10, 2016, we issued 44.4 million common shares in an underwritten public offering at a public offering price of $6.75 per common share. We received net proceeds of $287.4 million. The net proceeds from the issuance of our common shares were used to fully redeem our 3.95% 2018 Senior Notes.
Preferred Shares Conversion to Common Shares
On January 4, 2016, we announced that our Board of Directors determined the final quarterly dividend of our Preferred Shares would not be paid in cash, but instead, pursuant to the terms of the Preferred Shares, the conversion rate was increased such that holders of the Preferred Shares received additional common shares in lieu of the accrued dividend at the time of the mandatory conversion on February 1, 2016. The number of common shares issued on conversion was determined based on the average VWAP per share of our common shares during the 20 trading day period beginning on, and including, the 23rd scheduled trading day prior to February 1, 2016, subject to customary anti-dilution adjustments. Upon conversion on February 1, 2016, an aggregate of 26.5 million common shares were issued, representing 25.2 million common shares issuable upon conversion and 1.3 million that were issued in lieu of a final cash dividend.
Debt-for-Equity Exchanges
During the year ended December 31, 2016, we entered into a series of privately negotiated exchange agreements whereby we issued an aggregate of 8.2 million common shares in exchange for $10.0 million aggregate principal amount of our 3.95% 2018 Senior Notes, $20.1 million aggregate principal amount of our 4.80% 2020 Senior Notes and $26.8 million aggregate principal amount of our 4.875% 2021 Senior Notes. There were no exchanges that represented more than 1% of our outstanding common shares during any quarter. Accordingly, we recognized a gain of $11.3 million in Gain (loss) on extinguishment/restructuring of debt in the Statements of Consolidated Operations for the year ended December 31, 2016. The issuances of the common shares in exchange for our senior notes due 2018, 2020 and 2021 were made in reliance on the exemption from registration provided in Section 3(a)(9) of the Securities Act.
NOTE 1517 - ACCUMULATED OTHER COMPREHENSIVE LOSS
The components of Accumulated other comprehensive loss within Cliffs shareholders’ equity (deficit) and related tax effects allocated to each are shown below:
| | | | | | | | | | | | | | | | | |
| (In Millions) |
| Pre-tax
Amount | | Tax
Benefit | | After-tax
Amount |
| As of December 31, 2020: | | | | | |
| Postretirement benefit liability | $ | (221) | | | $ | 86 | | | $ | (135) | |
| Foreign currency translation adjustments | 3 | | | 0 | | | 3 | |
| Unrealized net loss on derivative financial instruments | (1) | | | 0 | | | (1) | |
| $ | (219) | | | $ | 86 | | | $ | (133) | |
| As of December 31, 2019: | | | | | |
| Postretirement benefit liability | $ | (454) | | | $ | 138 | | | $ | (316) | |
| Unrealized net loss on derivative financial instruments | (4) | | | 1 | | | (3) | |
| $ | (458) | | | $ | 139 | | | $ | (319) | |
| As of December 31, 2018: | | | | | |
| Postretirement benefit liability | $ | (408) | | | $ | 127 | | | $ | (281) | |
| Unrealized net loss on derivative financial instruments | (4) | | | 1 | | | (3) | |
| $ | (412) | | | $ | 128 | | | $ | (284) | |
|
| | | | | | | | | | | |
| | (In Millions) |
| | Pre-tax Amount | | Tax Benefit | | After-tax Amount |
| As of December 31, 2018: | | | | | |
| Postretirement benefit liability | $ | (408.1 | ) | | $ | 127.0 |
| | $ | (281.1 | ) |
| Unrealized net loss on derivative financial instruments | (3.5 | ) | | 0.7 |
| | (2.8 | ) |
| | $ | (411.6 | ) | | $ | 127.7 |
| | $ | (283.9 | ) |
| As of December 31, 2017: | | | | | |
| Postretirement benefit liability | $ | (387.3 | ) | | $ | 123.4 |
| | $ | (263.9 | ) |
| Foreign currency translation adjustments | 225.4 |
| | — |
| | 225.4 |
|
| Unrealized net loss on derivative financial instruments | (0.5 | ) | | — |
| | (0.5 | ) |
| | $ | (162.4 | ) | | $ | 123.4 |
| | $ | (39.0 | ) |
| As of December 31, 2016: | | | | | |
| Postretirement benefit liability | $ | (384.0 | ) | | $ | 123.4 |
| | $ | (260.6 | ) |
| Foreign currency translation adjustments | 239.3 |
| | — |
| | 239.3 |
|
| | $ | (144.7 | ) | | $ | 123.4 |
| | $ | (21.3 | ) |
The following tables reflecttable reflects the changes in Accumulated other comprehensive loss related to Cliffs shareholders’ equity (deficit) for December 31, 2018, 2017 and 2016:equity:
| | | | | | | | | | | | | | | | | | | | | | | |
| (In Millions) |
| Postretirement Benefit Liability,
net of tax | | Foreign Currency Translation | | Derivative Financial Instruments,
net of tax | | Accumulated Other Comprehensive Loss |
| December 31, 2017 | $ | (264) | | | $ | 225 | | | $ | 0 | | | $ | (39) | |
| Other comprehensive income (loss) before reclassifications | (43) | | | 3 | | | (1) | | | (41) | |
| Net loss (gain) reclassified from accumulated other comprehensive loss | 26 | | | (228) | | | (2) | | | (204) | |
| December 31, 2018 | (281) | | | 0 | | | (3) | | | (284) | |
| Other comprehensive loss before reclassifications | (57) | | | 0 | | | (2) | | | (59) | |
| Net loss reclassified from accumulated other comprehensive loss | 22 | | | 0 | | | 2 | | | 24 | |
| December 31, 2019 | (316) | | | 0 | | | (3) | | | (319) | |
| Other comprehensive income (loss) before reclassifications | 163 | | | 3 | | | (6) | | | 160 | |
| Net loss reclassified from accumulated other comprehensive loss | 18 | | | 0 | | | 8 | | | 26 | |
| December 31, 2020 | $ | (135) | | | $ | 3 | | | $ | (1) | | | $ | (133) | |
|
| | | | | | | | | | | | | | | |
| | (In Millions) |
| | Postretirement Benefit Liability, net of tax | | Unrealized Net Gain (Loss) on Foreign Currency Translation | | Net Unrealized Loss on Derivative Financial Instruments, net of tax | | Accumulated Other Comprehensive Loss |
| Balance December 31, 2017 | $ | (263.9 | ) | | $ | 225.4 |
| | $ | (0.5 | ) | | $ | (39.0 | ) |
| Other comprehensive income (loss) before reclassifications | (42.9 | ) | | 2.7 |
| | (0.6 | ) | | (40.8 | ) |
| Net loss (gain) reclassified from accumulated other comprehensive loss | 25.7 |
| | (228.1 | ) | | (1.7 | ) | | (204.1 | ) |
| Balance December 31, 2018 | $ | (281.1 | ) | | $ | — |
| | $ | (2.8 | ) | | $ | (283.9 | ) |
|
| | | | | | | | | | | | | | | |
| | (In Millions) |
| | Postretirement Benefit Liability, net of tax | | Unrealized Net Gain (Loss) on Foreign Currency Translation | | Net Unrealized Loss on Derivative Financial Instruments, net of tax | | Accumulated Other Comprehensive Loss |
| Balance December 31, 2016 | $ | (260.6 | ) | | $ | 239.3 |
| | $ | — |
| | $ | (21.3 | ) |
| Other comprehensive loss before reclassifications | (29.8 | ) | | (13.9 | ) | | (0.5 | ) | | (44.2 | ) |
| Net loss reclassified from accumulated other comprehensive loss | 26.5 |
| | — |
| | — |
| | 26.5 |
|
| Balance December 31, 2017 | $ | (263.9 | ) | | $ | 225.4 |
| | $ | (0.5 | ) | | $ | (39.0 | ) |
|
| | | | | | | | | | | | | | | | | | | |
| | (In Millions) |
| | Postretirement Benefit Liability, net of tax | | Unrealized Net Gain (Loss) on Securities, net of tax | | Unrealized Net Gain on Foreign Currency Translation | | Net Unrealized Gain (Loss) on Derivative Financial Instruments, net of tax | | Accumulated Other Comprehensive Loss |
| Balance December 31, 2015 | $ | (241.4 | ) | | $ | 0.1 |
| | $ | 220.7 |
| | $ | 2.6 |
| | $ | (18.0 | ) |
| Other comprehensive income (loss) before reclassifications | (44.8 | ) | | (0.1 | ) | | 18.4 |
| | (3.3 | ) | | (29.8 | ) |
| Net loss reclassified from accumulated other comprehensive loss | 25.6 |
| | — |
| | 0.2 |
| | 0.7 |
| | 26.5 |
|
| Balance December 31, 2016 | $ | (260.6 | ) | | $ | — |
| | $ | 239.3 |
| | $ | — |
| | $ | (21.3 | ) |
The following table reflects the details about Accumulated other comprehensive loss components related toreclassified from Cliffs shareholders’ equity:
| | | | | | | | | | | | | | | | | | | | | | | | | | |
| | (In Millions) | | |
| Details about Accumulated Other Comprehensive Loss Components | | Amount of (Gain)/Loss
Reclassified into Income, Net of Tax | | Affected Line Item in the Statement of Consolidated Operations |
| Year Ended December 31, | |
| 2020 | | 2019 | | 2018 | |
| Amortization of pension and OPEB liability: | | | | | | | | |
Prior service costs1 | | $ | (1) | | | $ | (1) | | | $ | (1) | | | Other non-operating income |
Net actuarial loss1 | | 30 | | | 29 | | | 27 | | | Other non-operating income |
Settlements1 | | (6) | | | 0 | | | 0 | | | Other non-operating income |
| | 23 | | | 28 | | | 26 | | | Total before taxes |
| Income tax expense | | (5) | | | (6) | | | 0 | | | Income tax benefit (expense) |
| | $ | 18 | | | $ | 22 | | | $ | 26 | | | Net of taxes |
| | | | | | | | |
| Changes in foreign currency translation: | | | | | | | | |
Gain on foreign currency translation2 | | $ | 0 | | | $ | 0 | | | $ | (228) | | | Income (loss) from discontinued operations, net of tax |
| | | | | | | | |
| Changes in derivative financial instruments: | | | | | | | | |
| Commodity contracts | | $ | 10 | | | $ | 3 | | | $ | (2) | | | Cost of goods sold |
| Income tax expense | | (2) | | | (1) | | | 0 | | | Income tax benefit (expense) |
| | $ | 8 | | | $ | 2 | | | $ | (2) | | | Net of taxes |
| | | | | | | | |
| Total reclassifications for the period, net of tax | | $ | 26 | | | $ | 24 | | | $ | (204) | | | |
| | | | | | | | |
1 These accumulated other comprehensive loss components are included in the computation of net periodic benefit cost. See NOTE 10 - PENSIONS AND OTHER POSTRETIREMENT BENEFITS for further information. |
2 Represents Australian accumulated currency translation adjustments due to the liquidation of our Australian subsidiaries' net assets. |
|
| | | | | | | | | | | | | | |
| | | (In Millions) | | |
| Details about Accumulated Other Comprehensive Loss Components | | Amount of (Gain)/Loss Reclassified into Income | | Affected Line Item in the Statement of Consolidated Operations |
| | | Year Ended
December 31, 2018 | | Year Ended
December 31, 2017 | | Year Ended December 31, 2016 | | |
| Amortization of pension and postretirement benefit liability: | | | | | | | | |
Prior service costs1 | | $ | (0.8 | ) | | $ | (0.4 | ) | | $ | (1.5 | ) | | Other non-operating income |
Net actuarial loss1 | | 26.2 |
| | 26.9 |
| | 27.1 |
| | Other non-operating income |
Curtailments1 | | 0.3 |
| | — |
| | — |
| | Other non-operating income |
| | | $ | 25.7 |
| | $ | 26.5 |
| | $ | 25.6 |
| | Net of taxes |
| | | | | | | | | |
| Changes in foreign currency translation: | | | | | | | | |
| Unrealized gain on dissolution of entity | | $ | — |
| | $ | — |
| | $ | 0.2 |
| | Other non-operating income |
Gain on foreign currency translation2 | | (228.1 | ) | | — |
| | — |
| | Income from discontinued operations, net of tax |
| | | $ | (228.1 | ) | | $ | — |
| | $ | 0.2 |
| | Net of taxes |
| | | | | | | | | |
| Unrealized gain (loss) on derivative financial instruments: | | | | | | | | |
| Treasury lock | | $ | — |
| | $ | — |
| | $ | 1.2 |
| | Gain (loss) on extinguishment/restructuring of debt |
| Commodity contracts | | (1.7 | ) | | — |
| | — |
| | Cost of goods sold and operating expenses |
| | | (1.7 | ) | | — |
| | 1.2 |
| | Total before taxes |
| Income tax expense | | — |
| | — |
| | (0.5 | ) | | Income tax benefit |
| | | $ | (1.7 | ) | | $ | — |
| | $ | 0.7 |
| | Net of taxes |
| | | | | | | | | |
| Total reclassifications for the period | | $ | (204.1 | ) | | $ | 26.5 |
| | $ | 26.5 |
| | |
| | | | | | | | | |
1 These accumulated other comprehensive loss components are included in the computation of net periodic benefit cost. See NOTE 8 - PENSIONS AND OTHER POSTRETIREMENT BENEFITS for further information. |
2 Represents Australian accumulated currency translation adjustments due to the liquidation of substantially all of our Australian subsidiaries' net assets. See NOTE 13 - DISCONTINUED OPERATIONS for further information. |
NOTE 16 - CASH FLOW INFORMATION
|
| | | | | | | | | | | |
| | (In Millions) |
| | Year Ended December 31, |
| | 2018 | | 2017 | | 2016 |
Capital additions1 | $ | 394.8 |
| | $ | 156.0 |
| | $ | 68.5 |
|
| Less: | | | | | |
| Non-cash accruals | 93.6 |
| | (2.2 | ) | | (0.6 | ) |
| Capital leases | 7.6 |
| | 6.5 |
| | — |
|
| Grants | (2.5 | ) | | — |
| | — |
|
| Cash paid for capital expenditures including deposits | $ | 296.1 |
| | $ | 151.7 |
| | $ | 69.1 |
|
| | | | | | |
1 Includes capital additions related to discontinued operations of $0.1 million, $2.8 million and $0.2 million for the years ended December 31, 2018, 2017 and 2016, respectively. |
Cash payments for interest and income taxes are as follows:
|
| | | | | | | | | | | |
| | (In Millions) |
| 2018 | | 2017 | | 2016 |
| Taxes paid on income | $ | 2.9 |
| | $ | 1.7 |
| | $ | 5.9 |
|
| Income tax refunds | $ | (11.3 | ) | | $ | (7.8 | ) | | $ | (5.3 | ) |
Interest paid on debt obligations net of capitalized interest1 | $ | 105.7 |
| | $ | 139.0 |
| | $ | 184.0 |
|
| | | | | | |
1 Capitalized interest was $6.5 million for the year ended December 31, 2018. |
Non-Cash Financing Activities - Declared Dividends
On OctoberNOTE 18 2018, the Board of Directors declared a quarterly cash dividend on our common shares of $0.05 per share. The cash dividend of $15.0 million was paid on January 15, 2019 to shareholders of record as of the close of business on January 4, 2019.
NOTE 17 - RELATED PARTIES
OneWe have certain co-owned joint ventures with companies from the steel and mining industries, including integrated steel companies, their subsidiaries and other downstream users of our four operating mines, steel and iron ore products.
Hibbing is a co-owned joint venture with companies that are integrated steel producers or their subsidiaries. We are the managerU.S. Steel, in which, as of HibbingDecember 31, 2020, we own 85.3% and rely on our joint venture partners to make their required capital contributions and to pay for their shareU.S. Steel owns 14.7%. As a result of the iron ore pellets thatAM USA Transaction, we produce. The following isacquired an additional 62.3% ownership stake in the Hibbing mine and became the majority owner and mine manager. Prior to the AM USA Transaction, ArcelorMittal was a summary ofrelated party due to its ownership interest in Hibbing. As such, certain long-term contracts with ArcelorMittal resulted in Revenues from related parties, and are included within the mine ownership of the co-owned iron ore mine at December 31, 2018:below.
|
| | | | | | |
| Mine | | Cleveland-Cliffs Inc. | | ArcelorMittal | | U.S. Steel |
| Hibbing | | 23.0% | | 62.3% | | 14.7% |
Product revenuesRevenues from related parties were as follows:
|
| | | | | | | | | | | |
| | (In Millions) |
| | Year Ended December 31, |
| | 2018 | | 2017 | | 2016 |
| Product revenues from related parties | $ | 1,234.5 |
| | $ | 806.7 |
| | $ | 830.1 |
|
| Total product revenues | $ | 2,172.3 |
| | $ | 1,644.6 |
| | $ | 1,379.7 |
|
| Related party product revenue as a percent of total product revenue | 56.8 | % | | 49.1 | % | | 60.2 | % |
| | | | | | | | | | | | | | | | | |
| (In Millions) |
| Year Ended December 31, |
| 2020 | | 2019 | | 2018 |
| Revenue from related parties | $ | 893 | | | $ | 1,015 | | | $ | 1,344 | |
Revenues1 | $ | 5,354 | | | $ | 1,990 | | | $ | 2,332 | |
Related party revenues as a percent of Revenues1 | 16.7 | % | | 51.0 | % | | 57.6 | % |
| Purchases from related parties | $ | 16 | | | $ | 0 | | | $ | 0 | |
| | | | | |
1 Includes Realization of deferred revenue of $35 million for the year ended December 31, 2020. |
The following table presents the classification of related party assets and liabilities in the Statements of Consolidated Financial Position:
| | | | | | | | | | | | | | |
| | (In Millions) |
| | December 31, |
| Balance Sheet Location of Assets (Liabilities) | | 2020 | | 2019 |
| Accounts receivable, net | | $ | 2 | | | $ | 31 | |
| Other current assets | | 0 | | | 45 | |
| Accounts payable | | (6) | | | 0 | |
| Other current liabilities | | 0 | | | (2) | |
Other current assets
Our supply agreement with ArcelorMittal USA contained provisions that provided us supplemental revenue or provided refunds to ArcelorMittal USA based on the HRC price at the time the iron ore product was consumed in its blast furnaces. The supplemental pricing was categorized as a freestanding derivative. Upon the completion of the AM USA Transaction, the outstanding derivative was settled as part of acquisition accounting.
NOTE 19 - VARIABLE INTEREST ENTITIES
|
| | | | | | | | |
| | | (In Millions) |
| Balance Sheet Location | | December 31, 2018 | | December 31, 2017 |
| Accounts receivable, net | | $ | 176.0 |
| | $ | 68.1 |
|
| Derivative assets | | 89.3 |
| | 37.9 |
|
| Partnership distribution payable | | (43.5 | ) | | (44.2 | ) |
| Other current liabilities | | (1.8 | ) | | (12.3 | ) |
| Other liabilities | | — |
| | (41.4 | ) |
| | | $ | 220.0 |
| | $ | 8.1 |
|
During 2017, ourWe purchase all the coke and electrical power generated from SunCoke Middletown’s plant under long-term supply agreements and have committed to purchase all the expected production from the facility through 2032. We consolidate SunCoke Middletown as a VIE because we are the primary beneficiary despite having no ownership interest in Empire increased to 100% when we reached an agreement to distributeSunCoke Middletown. SunCoke Middletown had income before income taxes of $41 million for the noncontrolling interest netyear ended December 31, 2020, which was included in our consolidated income before income taxes.
The assets of $132.7 millionthe consolidated VIE can only be used to ArcelorMittal, in exchange for its interest in Empire. The net assets were agreed to be distributed in three installments of $44.2 million each,settle the first of which was paid upon the executionobligations of the agreement,consolidated VIE and not obligations of the secondCompany. The creditors of which was paid in August 2018, andSunCoke Middletown do not have recourse to the finalassets or general credit of which is due in August 2019.the Company to satisfy liabilities of the VIE. The remaining installment is reflected in Partnership distribution payable in the Statements of Consolidated Financial Positionconsolidated balance sheet as of December 31, 2018.2020 includes the following amounts for SunCoke Middletown:
A supply agreement with one customer provides for supplemental revenue or refunds to the customer based on the average annual daily market price for hot-rolled coil steel at the time the product is consumed in the customer’s blast furnace. The supplemental pricing is characterized as a freestanding derivative. Refer to NOTE 12 - DERIVATIVE INSTRUMENTS AND HEDGING ACTIVITIES for further information. | | | | | |
| (In Millions) |
| December 31,
2020 |
| Cash and cash equivalents | $ | 5 | |
| Inventories | 21 | |
| Property, plant and equipment, net | 308 | |
| Accounts payable | (15) | |
| Other assets (liabilities), net | (10) | |
| Noncontrolling interest | (309) | |
NOTE 1820 - EARNINGS PER SHARE
The following table summarizes the computation of basic and diluted EPS:
| | | | | | | | | | | | | | | | | |
| (In Millions, Except Per Share Amounts) |
| Year Ended December 31, |
| 2020 | | 2019 | | 2018 |
| Income (loss) from continuing operations | $ | (82) | | | $ | 295 | | | $ | 1,040 | |
| Income from continuing operations attributable to noncontrolling interest | (41) | | | 0 | | | 0 | |
| Net income (loss) from continuing operations attributable to Cliffs shareholders | (123) | | | 295 | | | 1,040 | |
| Income (loss) from discontinued operations, net of tax | 1 | | | (2) | | | 88 | |
| Net income (loss) attributable to Cliffs shareholders | $ | (122) | | | $ | 293 | | | $ | 1,128 | |
| | | | | |
| Weighted average number of shares: | | | | | |
| Basic | 379 | | | 277 | | | 297 | |
| Convertible senior notes | 0 | | | 4 | | | 3 | |
| Employee stock plans | 0 | | | 3 | | | 4 | |
| Diluted | 379 | | | 284 | | | 304 | |
| | | | | |
Earnings (loss) per common share attributable to
Cliffs common shareholders - basic: | | | | | |
| Continuing operations | $ | (0.32) | | | $ | 1.07 | | | $ | 3.50 | |
| Discontinued operations | 0 | | | (0.01) | | | 0.30 | |
| $ | (0.32) | | | $ | 1.06 | | | $ | 3.80 | |
Earnings (loss) per common share attributable to
Cliffs common shareholders - diluted: | | | | | |
| Continuing operations | $ | (0.32) | | | $ | 1.04 | | | $ | 3.42 | |
| Discontinued operations | 0 | | | (0.01) | | | 0.29 | |
| $ | (0.32) | | | $ | 1.03 | | | $ | 3.71 | |
The following table summarizes the shares that have been excluded from the diluted earnings per share:
|
| | | | | | | | | | | |
| | (In Millions, Except Per Share Amounts) |
| | Year Ended
December 31, |
| | 2018 | | 2017 | | 2016 |
| Income from continuing operations | $ | 1,039.9 |
| | $ | 360.6 |
| | $ | 122.6 |
|
Loss (income) from continuing operations attributable to
noncontrolling interest | — |
| | 3.9 |
| | (25.2 | ) |
Net income from continuing operations
attributable to Cliffs shareholders | $ | 1,039.9 |
| | $ | 364.5 |
| | $ | 97.4 |
|
| Income from discontinued operations, net of tax | 88.2 |
| | 2.5 |
| | 76.7 |
|
| Net income attributable to Cliffs shareholders | $ | 1,128.1 |
| | $ | 367.0 |
| | $ | 174.1 |
|
| Weighted average number of shares: | | | | | |
| Basic | 297.2 |
| | 288.4 |
| | 197.7 |
|
| $316.25 million 1.50% 2025 Convertible Senior Notes | 3.4 |
| | — |
| | — |
|
| Employee stock plans | 3.5 |
| | 4.6 |
| | 2.4 |
|
| Diluted | 304.1 |
| | 293.0 |
| | 200.1 |
|
Earnings per common share attributable to
Cliffs common shareholders - basic: | | | | | |
| Continuing operations | $ | 3.50 |
| | $ | 1.27 |
| | $ | 0.49 |
|
| Discontinued operations | 0.30 |
| | 0.01 |
| | 0.39 |
|
| | $ | 3.80 |
| | $ | 1.28 |
| | $ | 0.88 |
|
Earnings per common share attributable to
Cliffs common shareholders - diluted: | | | | | |
| Continuing operations | $ | 3.42 |
| | $ | 1.25 |
| | $ | 0.49 |
|
| Discontinued operations | 0.29 |
| | 0.01 |
| | 0.38 |
|
| | $ | 3.71 |
| | $ | 1.26 |
| | $ | 0.87 |
|
The dilutive impact of 2025 Convertible Notes that were issued in December 2017 is calculated based on the treasury-stock method with the number of dilutive shares being calculated based on the difference in the average share price and the conversion price. There was no dilution during 2017 related to the common share equivalentscalculation for the 2025 Convertible Notesyear ended December 31, 2020, as our common shares average price did not rise in value above the conversion price.they were anti-dilutive:
| | | | | |
| (In Millions) |
| 2020 |
| Redeemable preferred shares | 4 | |
| Convertible senior notes | 2 | |
| Shares related to employee stock plans | 1 | |
NOTE 1921 - COMMITMENTS AND CONTINGENCIES
Purchase Commitments
In 2017, we began to incur capital commitments related toWe purchase portions of the constructionprincipal raw materials required for our steel manufacturing operations under annual and multi-year agreements, some of which have minimum quantity requirements. We also use large volumes of natural gas, electricity and industrial gases in our steel manufacturing operations. We negotiate most of our HBI production plant in Toledo, Ohio.purchases of chrome, industrial gases and a portion of our electricity under multi-year agreements. Our purchases of coke are made under annual or multi-year agreements with periodic price adjustments. We expect to spend approximately $830 million on the HBI production plant, exclusive of construction-related contingencies and capitalized interest through 2020. Through December 31, 2018, we have entered intotypically purchase coal under annual fixed-price agreements. We also purchase certain transportation services under multi-year contracts and purchase orders for approximately $580 million of the total capital investment for the HBI production plant, of which a total of approximately $180 million has been expended project-to-date, including deposits. Of the remaining committed capital, expenditures of approximately $425 million and $225 million are expected to be made during 2019 and 2020, respectively.with minimum quantity requirements.
Contingencies
We are currently the subject of, or party to, various claims and legal proceedings incidental to our operations. If management believes that a loss arising from these matters is probablecurrent and can reasonably be estimated, we record the amount of the loss or the minimum estimated liability when the loss is estimated using a range, and no point within the range is more probable than another. As additional information becomes available, any potential liability related to these matters is assessed and the estimates are revised, if necessary.historical operations. These claims and legal proceedings are subject to inherent uncertainties and unfavorable rulings could occur. An unfavorable ruling could include monetary damages, additional funding requirements or an injunction. If an unfavorable ruling were to occur, there exists the possibility of a material impactadverse effect on the financial position and results of operations for the period in which the ruling occurs or future periods. However, based on currently available information we do not believe that any pending claims or legal proceedings will haveresult in a material adverse effect onin relation to our consolidated financial position, results of operationsstatements.
Environmental Contingencies
Although we believe our operating practices have been consistent with prevailing industry standards, hazardous materials may have been released at operating sites or cash flows.
We previously recorded a liabilitythird-party sites in the Statementspast, including operating sites that we no longer own. If we reasonably can, we estimate potential remediation expenditures for those sites where future remediation efforts are probable based on identified conditions, regulatory requirements, or contractual obligations arising from the sale of Consolidated Financial Position relateda business or facility. For sites involving government required investigations, we typically make an estimate of potential remediation expenditures only after the investigation is complete and when we better understand the nature and scope of the remediation. In general, the material factors in these estimates include the costs associated with investigations, delineations, risk assessments, remedial work, governmental response and oversight, site monitoring, and preparation of reports to the CCAA proceedings, in whichappropriate environmental agencies.
The following is a settlement was reached during the period ended June 30, 2018. Refer toNOTE 13 - DISCONTINUED OPERATIONS for information on the CCAA proceedings.summary of our environmental obligations:
Environmental Matters | | | | | | | | | | | |
| (In Millions) |
| December 31,
2020 | | December 31,
2019 |
| Environmental obligations | $ | 135 | | | $ | 2 | |
| Less current portion | 18 | | | 0 | |
| Long-term environmental obligations | $ | 117 | | | $ | 2 | |
We had environmental liabilitiescannot predict the ultimate costs for each site with certainty because of $2.5 million and $2.9 million at December 31, 2018 and 2017, respectively, including obligations for known environmental remediation exposures at active and closed mining operations and other sites. These amounts have been recognized based on the estimated costevolving nature of the investigation and remediation at eachprocess. Rather, to estimate the probable costs, we must make certain assumptions. The most significant of these assumptions is for the nature and scope of the work that will be necessary to investigate and remediate a particular site and the cost of that work. Other significant assumptions include site studies, designthe cleanup technology that will be used, whether and implementationto what extent any other parties will participate in paying the investigation and remediation costs, reimbursement of remediation plans, legalpast response costs and consulting fees,future oversight costs by governmental agencies, and post-remediation monitoring the reaction of the governing environmental agencies to the proposed work plans. Costs for future investigation
and related activities. Future expendituresremediation are not discounted to their present value, unless the amount and timing of the cash disbursements are readily known. Potential insurance recoveries have not been reflected. Additional environmental obligations could be incurred,To the extent that we have been able to reasonably estimate future liabilities, we do not believe that there is a reasonable possibility that we will incur a loss or losses that exceed the amounts we accrued for the environmental matters discussed below that would, either individually or in the aggregate, have a material adverse effect on our consolidated financial condition, results of which cannotoperations or cash flows. However, since we recognize amounts in the consolidated financial statements in accordance with GAAP that exclude potential losses that are not probable or that may not be assessed. The amountcurrently estimable, the ultimate costs of our ultimate liability with respect to these environmental matters may be affected by several uncertainties, primarilyhigher than the liabilities we currently have recorded in our consolidated financial statements.
Pursuant to RCRA, which governs the treatment, handling and disposal of hazardous waste, the EPA and authorized state environmental agencies may conduct inspections of RCRA-regulated facilities to identify areas where there have been releases of hazardous waste or hazardous constituents into the environment and may order the facilities to take corrective action to remediate such releases. Likewise, the EPA or the states may require closure or post-closure care of residual, industrial and hazardous waste management units, including, but not limited to, landfills and deep injection wells. Environmental regulators have the authority to inspect all of our facilities. While we cannot predict the future actions of these regulators, it is possible that they may identify conditions in future inspections of these facilities that they believe require corrective action.
Pursuant to CERCLA, the EPA and state environmental authorities have conducted site investigations at some of our facilities and other third-party facilities, portions of which previously may have been used for disposal of materials that are currently regulated. The results of these investigations are still pending, and we could be directed to spend funds for remedial activities at the former disposal areas. Because of the uncertain status of these investigations, however, we cannot reasonably predict whether or when such spending might be required or its magnitude.
On April 29, 2002, AK Steel entered a mutually agreed-upon administrative order with the consent of the EPA pursuant to Section 122 of CERCLA to perform a RI/FS of the Hamilton plant site located in New Miami, Ohio. The plant ceased operations in 1990 and all of its former structures have been demolished. AK Steel submitted the investigation portion of the RI/FS and completed supplemental studies. Until the RI/FS is complete, we cannot reasonably estimate the additional costs, if any, we may incur for potentially required remediation of the site or when we may incur them.
EPA Administrative Order In Re: Ashland Coke
On September 26, 2012, the EPA issued an order under Section 3013 of RCRA requiring a plan to be developed for investigation of four areas at the Ashland Works coke plant. The Ashland Works coke plant ceased operations in 2011 and all of its former structures have been demolished and removed. In 1981, AK Steel acquired the plant from Honeywell International Corporation (as successor to Allied Corporation), who had managed the coking operations there for approximately 60 years. In connection with the sale of the coke plant, Honeywell agreed to indemnify AK Steel against certain claims and obligations that could arise from the investigation, and we intend to pursue such indemnification from Honeywell, if necessary. We cannot reasonably estimate how long it will take to complete the site investigation. On March 10, 2016, the EPA invited AK Steel to participate in settlement discussions regarding an enforcement action. Settlement discussions between the parties are ongoing, though whether the parties will reach agreement and any such agreement’s terms are uncertain. Until the site investigation is complete, we cannot reasonably estimate the costs, if any, we may incur for potential additional required remediation of the site or when we may incur them.
Burns Harbor Water Issues
In August 2019, ArcelorMittal Burns Harbor LLC (n/k/a Cleveland-Cliffs Burns Harbor LLC) suffered a loss of the blast furnace cooling water recycle system, which led to the discharge of cyanide and ammonia in excess of the Burns Harbor plant's NPDES permit limits. Since that time, the facility has taken numerous steps to prevent recurrence and maintain compliance with its NPDES permit. Since the August 2019 event, we have been engaged in settlement discussions with the U.S. Department of Justice, the EPA and the State of Indiana to resolve any alleged violations of environmental laws or regulations. Also, ArcelorMittal Burns Harbor LLC was served with a subpoena on December 5, 2019, from the United States District Court for the Northern District of Indiana relating to the August 2019 event and has responded to the subpoena requests. In addition, the plaintiffs in Environmental Law & Policy Center et al. v. ArcelorMittal Burns Harbor LLC et al. (U.S. District Court, N.D. Indiana Case No. 19-cv-473), which was filed on December 20, 2019,have alleged violations resulting from the August 2019 event and other Clean Water Act claims. Although we cannot accurately estimate the amount of civil penalty, the cost of any injunctive relief requirements, or the costs to resolve third-party claims, including potential natural resource damages claims, they are likely to exceed the reporting threshold in total.
In addition to the foregoing matters, we are or may be involved in proceedings with various regulatory authorities that may require us to pay fines, comply with more rigorous standards or other requirements or incur capital and operating expenses for environmental compliance. We believe that the ultimate costdisposition of required remediation andany such proceedings will not have, individually or in the extent to which other responsible parties contribute. Refer to NOTE 11 - ENVIRONMENTAL AND MINE CLOSURE OBLIGATIONS for further information.aggregate, a material adverse effect on our consolidated financial condition, results of operations or cash flows.
Tax Matters
The calculation of our tax liabilities involves dealing with uncertainties in the application of complex tax regulations. We recognize liabilities for anticipated tax audit issues based on our estimate of whether, and the extent to which, additional taxes will be due. If we ultimately determine that payment of these amounts is unnecessary, we reverse the liability and recognize a tax benefit during the period in which we determine that the liability is no longer necessary. We also recognize tax benefits to the extent that it is more likely than not that our positions will be sustained when challenged by the taxing authorities. To the extent we prevail in matters for which liabilities have been established, or are required to pay amounts in excess of our liabilities, our effective tax rate in a given period could be materially affected. An unfavorable tax settlement would require use of our cash and result in an increase in our effective tax rate in the year of resolution. A favorable tax settlement would be recognized as a reduction in our effective tax rate in the year of resolution. Refer to NOTE 1012 - INCOME TAXES for further information.
In addition to the matters discussed above, there are various pending and potential claims against us and our subsidiaries involving product liability, commercial, employee benefits and other matters arising in the ordinary course of business. Because of the considerable uncertainties that exist for any claim, it is difficult to reliably or accurately estimate what the amount of a loss would be if a claimant prevails. If material assumptions or factual understandings we rely on to evaluate exposure for these contingencies prove to be inaccurate or otherwise change, we may be required to record a liability for an adverse outcome. If, however, we have reasonably evaluated potential future liabilities for all of these contingencies, including those described more specifically above, it is our opinion, unless we otherwise noted, that the ultimate liability from these contingencies, individually or in the aggregate, should not have a material adverse effect on our consolidated financial position, results of operations or cash flows.
NOTE 2022 - SUBSEQUENT EVENTS
We have evaluated subsequent events throughOn February 11, 2021, we sold 20 million common shares, and the dateindirect, wholly owned subsidiary of financial statement issuance.
NOTE 21 - QUARTERLY RESULTS OF OPERATIONS (UNAUDITED)
The sumArcelorMittal to which approximately 78 million common shares were issued as part of quarterly EPS may not equal EPS for the year due to discrete quarterly calculations.
|
| | | | | | | | | | | | | | | | | | | |
| | (In Millions, Except Per Share Amounts)1 |
| 2018 |
| Quarters | | |
| First | | Second | | Third | | Fourth | | Year |
| Revenues from product sales and services | $ | 180.0 |
| | $ | 714.3 |
| | $ | 741.8 |
| | $ | 696.3 |
| | $ | 2,332.4 |
|
| Sales margin | 61.5 |
| | 284.5 |
| | 261.6 |
| | 202.0 |
| | 809.6 |
|
| Net income (loss) from continuing operations attributable to Cliffs shareholders | (13.4 | ) | | 229.4 |
| | 199.8 |
| | 624.1 |
| | 1,039.9 |
|
| Income (loss) from discontinued operations, net of tax | (70.9 | ) | | (64.3 | ) | | 238.0 |
| | (14.6 | ) | | 88.2 |
|
| Net income (loss) attributable to Cliffs common shareholders | $ | (84.3 | ) | | $ | 165.1 |
| | $ | 437.8 |
| | $ | 609.5 |
| | $ | 1,128.1 |
|
Earnings (loss) per common share attributable to
Cliffs common shareholders - basic: | | | | | | | | | |
| Continuing operations | $ | (0.05 | ) | | $ | 0.77 |
| | $ | 0.67 |
| | $ | 2.11 |
| | $ | 3.50 |
|
| Discontinued operations | (0.24 | ) | | (0.22 | ) | | 0.80 |
| | (0.05 | ) | | 0.30 |
|
| | $ | (0.29 | ) | | $ | 0.55 |
| | $ | 1.47 |
| | $ | 2.06 |
| | $ | 3.80 |
|
Earnings (loss) per common share attributable to
Cliffs common shareholders - diluted: | | | | | | | | | |
| Continuing operations | $ | (0.05 | ) | | $ | 0.76 |
| | $ | 0.64 |
| | $ | 2.03 |
| | $ | 3.42 |
|
| Discontinued operations | (0.24 | ) | | (0.21 | ) | | 0.77 |
| | (0.05 | ) | | 0.29 |
|
| | $ | (0.29 | ) | | $ | 0.55 |
| | $ | 1.41 |
| | $ | 1.98 |
| | $ | 3.71 |
|
| | | | | | | | | | |
1 On January 1, 2018, we adopted Topic 606 and applied it to all contracts that were not completed using the modified retrospective method. The comparative period information has not been retrospectively revised and continues to be reported under the accounting standards in effect for those periods. Refer to NOTE 2 - NEW ACCOUNTING STANDARDS for information regarding the adoption of Topic 606. |
The diluted earningsconsideration paid by us in connection with the closing of the AM USA Transaction sold 40 million common shares, in each case at a price per share calculation forto the first quarterunderwriter of 2018 excludes equity plan awards of 3.8$16.12, in an underwritten public offering. We also granted the underwriter an option to purchase up to an additional 9 million that were anti-dilutive.
|
| | | | | | | | | | | | | | | | | | | |
| | (In Millions, Except Per Share Amounts) |
| | 2017 |
| Quarters | | |
| First | | Second | | Third | | Fourth | | Year |
| Revenues from product sales and services | $ | 286.2 |
| | $ | 471.3 |
| | $ | 596.7 |
| | $ | 511.8 |
| | $ | 1,866.0 |
|
| Sales margin | 49.0 |
| | 144.7 |
| | 157.8 |
| | 116.1 |
| | 467.6 |
|
| Income (loss) from continuing operations | $ | (78.5 | ) | | $ | 83.8 |
| | $ | 22.3 |
| | $ | 333.0 |
| | $ | 360.6 |
|
| Loss (income) from continuing operations attributable to noncontrolling interest | 1.7 |
| | 1.7 |
| | 0.5 |
| | — |
| | 3.9 |
|
| Net income (loss) from continuing operations attributable to Cliffs shareholders | $ | (76.8 | ) | | $ | 85.5 |
| | $ | 22.8 |
| | $ | 333.0 |
| | $ | 364.5 |
|
| Income (loss) from discontinued operations, net of tax | 48.7 |
| | (53.7 | ) | | 30.6 |
| | (23.1 | ) | | 2.5 |
|
| Net income (loss) attributable to Cliffs common shareholders | $ | (28.1 | ) | | $ | 31.8 |
| | $ | 53.4 |
| | $ | 309.9 |
| | $ | 367.0 |
|
Earnings (loss) per common share attributable to
Cliffs common shareholders - basic: | | | | | | | | | |
| Continuing operations | $ | (0.29 | ) | | $ | 0.28 |
| | $ | 0.08 |
| | $ | 1.12 |
| | $ | 1.27 |
|
| Discontinued operations | 0.18 |
| | (0.18 | ) | | 0.10 |
| | (0.08 | ) | | 0.01 |
|
| | $ | (0.11 | ) | | $ | 0.10 |
| | $ | 0.18 |
| | $ | 1.04 |
| | $ | 1.28 |
|
Earnings (loss) per common share attributable to
Cliffs common shareholders - diluted: | | | | | | | | | |
| Continuing operations | $ | (0.29 | ) | | $ | 0.28 |
| | $ | 0.08 |
| | $ | 1.11 |
| | $ | 1.25 |
|
| Discontinued operations | 0.18 |
| | (0.18 | ) | | 0.10 |
| | (0.08 | ) | | 0.01 |
|
| | $ | (0.11 | ) | | $ | 0.10 |
| | $ | 0.18 |
| | $ | 1.03 |
| | $ | 1.26 |
|
The diluted earningscommon shares from us at a price per share calculation forto the first quarterunderwriter of 2017 excludes equity plan awards$16.12. The underwriter has until March 10, 2021 to exercise such option, which it may do in full, in part or not at all. We did not receive any proceeds from the sale of 4.6the common shares by the selling shareholder in the offering. We intend to use the net proceeds to us from the offering, plus cash on hand, to redeem up to approximately $334 million that were anti-dilutive.
NOTE 22 - SUPPLEMENTARY GUARANTOR INFORMATION
The accompanying condensed consolidating financial information has been prepared and presented pursuant to SEC Regulation S-X, Rule 3-10, “Financial Statements of Guarantors and Issuers of Guaranteed Securities Registered or Being Registered.” Certainaggregate principal amount of our subsidiaries have guaranteedoutstanding 9.875% 2025 Senior Secured Notes. We intend to use any remaining net proceeds to us following such redemption to reduce borrowings under our ABL Facility.
On February 9, 2021, following pricing of the obligations underunderwritten public offering, we issued a conditional notice of partial redemption to holders of the $1.075 billion 5.75%9.875% 2025 Senior Secured Notes to redeem $322 million aggregate principal amount of the outstanding 9.875% 2025 Senior Secured Notes on March 11, 2021, at a redemption price equal to 109.875% of the principal amount to be redeemed, plus accrued and unpaid interest, if any, to, but excluding, the redemption date. The conditional notice of partial redemption was subject to the condition precedent that we close the underwritten public offering of our common shares. As a result, following the closing of the underwritten public offering, the conditional notice of partial redemption became irrevocable.
On February 17, 2021, we issued $500 million aggregate principal amount of 4.625% 2029 Senior Notes and $500 million aggregate principal amount of 4.875% 2031 Senior Notes in an offering that was exempt from the registration requirements of the Securities Act. We intend to use the net proceeds from the notes offering to redeem all of the outstanding 4.875% 2024 Senior Secured Notes and 6.375% 2025 Senior Notes issued by Cleveland-Cliffs Inc. See NOTE 6 - DEBT AND CREDIT FACILITIES for further information.and all of the outstanding 7.625% 2021 AK Senior Notes, 7.50% 2023 AK Senior Notes and 6.375% 2025 AK Senior Notes issued by AK Steel Corporation (n/k/a Cleveland-Cliffs Steel Corporation), and pay fees and expenses in connection with such redemptions, and reduce borrowings under our ABL Facility.
On February 10, 2021, following pricing of the notes offering, we issued notices of redemption to the holders of the 4.875% 2024 Senior Secured Notes, 6.375% 2025 Senior Notes, 7.625% 2021 AK Senior Notes, 7.50% 2023
AK Senior Notes and 6.375% 2025 AK Senior Notes to redeem all of such notes outstanding on March 12, 2021, at the redemption prices listed below, plus accrued and unpaid interest, if any, to, but excluding, the redemption date. The following presentsnotices of redemption with respect to the condensed consolidating financial information for: (i) the Parent Company4.875% 2024 Senior Secured Notes and the Issuer of6.375% 2025 Senior Notes were subject to the guaranteed obligations (Cleveland-Cliffs Inc.); (ii)condition precedent that we close the Guarantor subsidiaries, on a combined basis; (iii) the non-guarantor subsidiaries, on a combined basis; (iv) consolidating eliminations; and (v) Cleveland-Cliffs Inc. and Subsidiaries on a consolidated basis. Each Guarantor subsidiary is 100% owned by the Parent Company as of December 31, 2018. The condensed consolidating financial information is presented as if the Guarantor structure at December 31, 2018 existed for all years presented.notes offering. As a result, following the Guarantor subsidiaries within the condensed consolidating financial information as of December 31, 2018 and 2017 and for the years ended December 31, 2018, 2017 and 2016 include results of subsidiaries that were previously less than wholly-owned and were historically non-guarantors until 100% ownership was obtained.
Eachclosing of the Guarantor subsidiaries fully and unconditionally guarantee, on a joint and several basis,notes offering, the obligationsnotices of Cleveland-Cliffs Inc. underredemption with respect to the $1.075 billion 5.75% 20254.875% 2024 Senior Notes. The guarantee of a Guarantor subsidiary will be automatically and unconditionally released and discharged, and such Guarantor subsidiary’s obligations under the guaranteeSecured Notes and the related indenture governing the $1.075 billion 5.75%6.375% 2025 Senior Notes (the “Indenture”) will be automaticallybecame irrevocable. The notices of redemption with respect to the 7.625% 2021 AK Senior Notes, 7.50% 2023 AK Senior Notes and unconditionally released6.375% 2025 AK Senior Notes were not subject to any conditions and discharged, upon:were irrevocable when issued.
(a) any sale, exchange, transfer or disposition of such Guarantor subsidiary (by merger, consolidation, or the sale of) or the capital stock of such Guarantor subsidiary after which the applicable Guarantor subsidiary is no longer a subsidiary of the Company or the sale of all or substantially all of such Guarantor subsidiary’s assets (other than by lease);
(b) upon designation of any Guarantor subsidiary as an “excluded subsidiary” (as defined in the Indenture); and
(c) upon defeasance or satisfaction and discharge of the Indenture.
Each entity in the consolidating financial information follows the same accounting policies as described in the consolidated financial statements. The accompanying condensed consolidating financial information has been presented on the equity method of accounting for all periods presented. Under this method, investments in subsidiaries are recorded at cost and adjusted for the subsidiaries’ cumulative results of operations, capital contributions and distributions, and other changes in equity. Elimination entries include consolidating and eliminating entries for investments in subsidiaries, and intra-entity activity and balances.
| | | | | | | | | | | |
| Debt Instrument | | Redemption Price1 |
| 4.875% 2024 Senior Secured Notes | | 102.438 | | % |
| 6.375% 2025 Senior Notes | | 103.188 | | |
| 7.625% 2021 AK Senior Notes | | 100.000 | | |
| 7.50% 2023 AK Senior Notes | | 101.875 | | |
| 6.375% 2025 AK Senior Notes | | 103.188 | | |
| | | |
1 Plus accrued and unpaid interest, if any, up to but excluding the redemption date. | | | |
|
| | | | | | | | | | | | | | | | | | | |
| Condensed Consolidating Statement of Financial Position |
| As of December 31, 2018 |
| (In Millions) |
| | Cleveland-Cliffs Inc. | | Guarantor Subsidiaries | | Non-Guarantor Subsidiaries | | Eliminations | | Consolidated |
| ASSETS | | | | | | | | | |
| CURRENT ASSETS | | | | | | | | | |
| Cash and cash equivalents | $ | 819.8 |
| | $ | 0.7 |
| | $ | 2.7 |
| | $ | — |
| | $ | 823.2 |
|
| Accounts receivable, net | 9.2 |
| | 221.3 |
| | 0.3 |
| | (4.1 | ) | | 226.7 |
|
| Inventories | — |
| | 87.9 |
| | — |
| | — |
| | 87.9 |
|
| Supplies and other inventories | — |
| | 93.2 |
| | — |
| | — |
| | 93.2 |
|
| Derivative assets | 0.1 |
| | 91.4 |
| | — |
| | — |
| | 91.5 |
|
| Income tax receivable, current | 117.3 |
| | — |
| | — |
| | — |
| | 117.3 |
|
| Current assets of discontinued operations | — |
| | — |
| | 12.4 |
| | — |
| | 12.4 |
|
| Other current assets | 10.0 |
| | 16.9 |
| | 0.5 |
| | — |
| | 27.4 |
|
| TOTAL CURRENT ASSETS | 956.4 |
| | 511.4 |
| | 15.9 |
| | (4.1 | ) | | 1,479.6 |
|
| PROPERTY, PLANT AND EQUIPMENT, NET | 13.3 |
| | 1,221.9 |
| | 50.8 |
| | — |
| | 1,286.0 |
|
| OTHER ASSETS | | | | | | | | | |
| Deposits for property, plant and equipment | — |
| | 68.4 |
| | 14.6 |
| | — |
| | 83.0 |
|
| Income tax receivable, non-current | 117.2 |
| | 4.1 |
| | — |
| | — |
| | 121.3 |
|
| Deferred income taxes | 463.6 |
| | — |
| | 1.2 |
| | — |
| | 464.8 |
|
| Investment in subsidiaries | 1,262.3 |
| | 50.8 |
| | — |
| | (1,313.1 | ) | | — |
|
| Long-term intercompany notes | — |
| | — |
| | 121.3 |
| | (121.3 | ) | | — |
|
| Other non-current assets | 8.0 |
| | 85.4 |
| | 1.5 |
| | — |
| | 94.9 |
|
| TOTAL OTHER ASSETS | 1,851.1 |
| | 208.7 |
| | 138.6 |
| | (1,434.4 | ) | | 764.0 |
|
| TOTAL ASSETS | $ | 2,820.8 |
| | $ | 1,942.0 |
| | $ | 205.3 |
| | $ | (1,438.5 | ) | | $ | 3,529.6 |
|
| LIABILITIES | | | | | | | | | |
| CURRENT LIABILITIES | | | | | | | | | |
| Accounts payable | $ | 5.3 |
| | $ | 181.4 |
| | $ | 4.2 |
| | $ | (4.1 | ) | | $ | 186.8 |
|
| Accrued employment costs | 28.5 |
| | 45.4 |
| | 0.1 |
| | — |
| | 74.0 |
|
| State and local taxes payable | — |
| | 35.4 |
| | 0.1 |
| | — |
| | 35.5 |
|
| Accrued interest | 38.4 |
| | — |
| | — |
| | — |
| | 38.4 |
|
| Partnership distribution payable | — |
| | 43.5 |
| | — |
| | — |
| | 43.5 |
|
| Current liabilities of discontinued operations | — |
| | — |
| | 6.7 |
| | — |
| | 6.7 |
|
| Other current liabilities | 30.6 |
| | 51.3 |
| | 1.4 |
| | — |
| | 83.3 |
|
| TOTAL CURRENT LIABILITIES | 102.8 |
| | 357.0 |
| | 12.5 |
| | (4.1 | ) | | 468.2 |
|
| POSTEMPLOYMENT BENEFIT LIABILITIES | | | | | | | | | |
| Pensions | 58.3 |
| | 390.5 |
| | (230.4 | ) | | — |
| | 218.4 |
|
| Other postretirement benefits | 6.0 |
| | 23.9 |
| | 0.4 |
| | — |
| | 30.3 |
|
| TOTAL POSTEMPLOYMENT BENEFIT LIABILITIES | 64.3 |
| | 414.4 |
| | (230.0 | ) | | — |
| | 248.7 |
|
| ENVIRONMENTAL AND MINE CLOSURE OBLIGATIONS | — |
| | 152.1 |
| | 19.9 |
| | — |
| | 172.0 |
|
| LONG-TERM DEBT | 2,092.9 |
| | — |
| | — |
| | — |
| | 2,092.9 |
|
| LONG-TERM INTERCOMPANY NOTES | 121.3 |
| | — |
| | — |
| | (121.3 | ) | | — |
|
| NON-CURRENT LIABILITIES OF DISCONTINUED OPERATIONS | — |
| | — |
| | 8.3 |
| | — |
| | 8.3 |
|
| OTHER LIABILITIES | 15.3 |
| | 99.5 |
| | 0.5 |
| | — |
| | 115.3 |
|
| TOTAL LIABILITIES | 2,396.6 |
| | 1,023.0 |
| | (188.8 | ) | | (125.4 | ) | | 3,105.4 |
|
| COMMITMENTS AND CONTINGENCIES | | | | | | | | | |
| EQUITY | | | | | | | | | |
| TOTAL EQUITY | 424.2 |
| | 919.0 |
| | 394.1 |
| | (1,313.1 | ) | | 424.2 |
|
| TOTAL LIABILITIES AND EQUITY | $ | 2,820.8 |
| | $ | 1,942.0 |
| | $ | 205.3 |
| | $ | (1,438.5 | ) | | $ | 3,529.6 |
|
|
| | | | | | | | | | | | | | | | | | | |
| Condensed Consolidating Statement of Financial Position |
| As of December 31, 2017 |
| (In Millions) |
| | Cleveland-Cliffs Inc. | | Guarantor Subsidiaries | | Non-Guarantor Subsidiaries | | Eliminations | | Consolidated |
| ASSETS | | | | | | | | | |
| CURRENT ASSETS | | | | | | | | | |
| Cash and cash equivalents | $ | 948.9 |
| | $ | 2.1 |
| | $ | 27.3 |
| | $ | — |
| | $ | 978.3 |
|
| Accounts receivable, net | 4.5 |
| | 102.9 |
| | — |
| | (0.7 | ) | | 106.7 |
|
| Inventories | — |
| | 138.4 |
| | — |
| | — |
| | 138.4 |
|
| Supplies and other inventories | — |
| | 88.8 |
| | — |
| | — |
| | 88.8 |
|
| Derivative assets | — |
| | 37.9 |
| | — |
| | — |
| | 37.9 |
|
| Income tax receivable, current | 11.4 |
| | 1.9 |
| | — |
| | — |
| | 13.3 |
|
| Loans to and accounts receivables from the Canadian Entities | 44.7 |
| | 6.9 |
| | — |
| | — |
| | 51.6 |
|
| Current assets of discontinued operations | — |
| | — |
| | 118.5 |
| | — |
| | 118.5 |
|
| Other current assets | 5.0 |
| | 5.6 |
| | 0.5 |
| | — |
| | 11.1 |
|
| TOTAL CURRENT ASSETS | 1,014.5 |
| | 384.5 |
| | 146.3 |
| | (0.7 | ) | | 1,544.6 |
|
| PROPERTY, PLANT AND EQUIPMENT, NET | 17.5 |
| | 965.5 |
| | 50.8 |
| | — |
| | 1,033.8 |
|
| OTHER ASSETS | | | | | | | | | |
| Deposits for property, plant and equipment | — |
| | 8.2 |
| | 9.6 |
| | — |
| | 17.8 |
|
| Income tax receivable, non-current | 235.3 |
| | — |
| | — |
| | — |
| | 235.3 |
|
| Investment in subsidiaries | 1,024.3 |
| | 29.9 |
| | — |
| | (1,054.2 | ) | | — |
|
| Long-term intercompany notes | — |
| | — |
| | 242.0 |
| | (242.0 | ) | | — |
|
| Non-current assets of discontinued operations | — |
| | — |
| | 20.3 |
| | — |
| | 20.3 |
|
| Other non-current assets | 7.8 |
| | 91.8 |
| | 2.0 |
| | — |
| | 101.6 |
|
| TOTAL OTHER ASSETS | 1,267.4 |
| | 129.9 |
| | 273.9 |
| | (1,296.2 | ) | | 375.0 |
|
| TOTAL ASSETS | $ | 2,299.4 |
| | $ | 1,479.9 |
| | $ | 471.0 |
| | $ | (1,296.9 | ) | | $ | 2,953.4 |
|
| LIABILITIES | | | | | | | | | |
| CURRENT LIABILITIES | | | | | | | | | |
| Accounts payable | $ | 7.1 |
| | $ | 92.3 |
| | $ | 0.8 |
| | $ | (0.7 | ) | | $ | 99.5 |
|
| Accrued employment costs | 13.7 |
| | 38.9 |
| | 0.1 |
| | — |
| | 52.7 |
|
| State and local taxes payable | — |
| | 30.0 |
| | 0.2 |
| | — |
| | 30.2 |
|
| Accrued interest | 31.4 |
| | — |
| | — |
| | — |
| | 31.4 |
|
| Contingent claims | 55.6 |
| | — |
| | — |
| | — |
| | 55.6 |
|
| Partnership distribution payable | — |
| | 44.2 |
| | — |
| | — |
| | 44.2 |
|
| Current liabilities of discontinued operations | — |
| | — |
| | 75.0 |
| | — |
| | 75.0 |
|
| Other current liabilities | 7.4 |
| | 54.5 |
| | 1.7 |
| | — |
| | 63.6 |
|
| TOTAL CURRENT LIABILITIES | 115.2 |
| | 259.9 |
| | 77.8 |
| | (0.7 | ) | | 452.2 |
|
| POSTEMPLOYMENT BENEFIT LIABILITIES | | | | | | | | | |
| Pensions | 59.2 |
| | 403.6 |
| | (240.0 | ) | | — |
| | 222.8 |
|
| Other postretirement benefits | 7.2 |
| | 27.0 |
| | 0.7 |
| | — |
| | 34.9 |
|
| TOTAL POSTEMPLOYMENT BENEFIT LIABILITIES | 66.4 |
| | 430.6 |
| | (239.3 | ) | | — |
| | 257.7 |
|
| ENVIRONMENTAL AND MINE CLOSURE OBLIGATIONS | — |
| | 140.6 |
| | 27.1 |
| | — |
| | 167.7 |
|
| LONG-TERM DEBT | 2,304.2 |
| | — |
| | — |
| | — |
| | 2,304.2 |
|
| LONG-TERM INTERCOMPANY NOTES | 242.0 |
| | — |
| | — |
| | (242.0 | ) | | — |
|
| NON-CURRENT LIABILITIES OF DISCONTINUED OPERATIONS | — |
| | — |
| | 52.2 |
| | — |
| | 52.2 |
|
| OTHER LIABILITIES | 15.7 |
| | 147.2 |
| | 0.6 |
| | — |
| | 163.5 |
|
| TOTAL LIABILITIES | 2,743.5 |
| | 978.3 |
| | (81.6 | ) | | (242.7 | ) | | 3,397.5 |
|
| COMMITMENTS AND CONTINGENCIES | | | | | | | | | |
| EQUITY | | | | | | | | | |
| TOTAL CLIFFS SHAREHOLDERS' EQUITY (DEFICIT) | (444.1 | ) | | 501.6 |
| | 552.4 |
| | (1,054.2 | ) | | (444.3 | ) |
| NONCONTROLLING INTEREST | — |
| | — |
| | 0.2 |
| | — |
| | 0.2 |
|
| TOTAL DEFICIT | (444.1 | ) | | 501.6 |
| | 552.6 |
| | (1,054.2 | ) | | (444.1 | ) |
| TOTAL LIABILITIES AND DEFICIT | $ | 2,299.4 |
| | $ | 1,479.9 |
| | $ | 471.0 |
| | $ | (1,296.9 | ) | | $ | 2,953.4 |
|
|
| | | | | | | | | | | | | | | | | | | |
| Condensed Consolidating Statement of Operations and Comprehensive Income |
| For the Year Ended December 31, 2018 |
| (In Millions) |
| | Cleveland-Cliffs Inc. | | Guarantor Subsidiaries | | Non-Guarantor Subsidiaries | | Eliminations | | Consolidated |
| REVENUES FROM PRODUCT SALES AND SERVICES | | | | | | | | | |
| Product | $ | — |
| | $ | 2,172.3 |
| | $ | — |
| | $ | — |
| | $ | 2,172.3 |
|
| Freight and venture partners' cost reimbursements | — |
| | 160.1 |
| | — |
| | — |
| | 160.1 |
|
| | — |
| | 2,332.4 |
| | — |
| | — |
| | 2,332.4 |
|
| COST OF GOODS SOLD AND OPERATING EXPENSES | — |
| | (1,522.8 | ) | | — |
| | — |
| | (1,522.8 | ) |
| SALES MARGIN | — |
| | 809.6 |
| | — |
| | — |
| | 809.6 |
|
| OTHER OPERATING INCOME (EXPENSE) | | | | | | | | | |
| Selling, general and administrative expenses | (86.1 | ) | | (30.4 | ) | | (0.3 | ) | | — |
| | (116.8 | ) |
| Miscellaneous - net | (0.3 | ) | | (23.6 | ) | | 4.3 |
| | — |
| | (19.6 | ) |
| | (86.4 | ) | | (54.0 | ) | | 4.0 |
| | — |
| | (136.4 | ) |
| OPERATING INCOME (LOSS) | (86.4 | ) | | 755.6 |
| | 4.0 |
| | — |
| | 673.2 |
|
| OTHER INCOME (EXPENSE) | | | | | | | | | |
| Interest expense, net | (117.6 | ) | | (2.1 | ) | | 0.8 |
| | — |
| | (118.9 | ) |
| Loss on extinguishment of debt | (6.8 | ) | | — |
| | — |
| | — |
| | (6.8 | ) |
| Other non-operating income (loss) | (3.5 | ) | | 0.9 |
| | 19.8 |
| | — |
| | 17.2 |
|
| | (127.9 | ) | | (1.2 | ) | | 20.6 |
| | — |
| | (108.5 | ) |
| INCOME (LOSS) FROM CONTINUING OPERATIONS BEFORE INCOME TAXES | (214.3 | ) | | 754.4 |
| | 24.6 |
| | — |
| | 564.7 |
|
| INCOME TAX BENEFIT | 474.7 |
| | — |
| | 0.5 |
| | — |
| | 475.2 |
|
| EQUITY IN INCOME OF SUBSIDIARIES | 858.2 |
| | 25.5 |
| | — |
| | (883.7 | ) | | — |
|
| INCOME FROM CONTINUING OPERATIONS | 1,118.6 |
| | 779.9 |
| | 25.1 |
| | (883.7 | ) | | 1,039.9 |
|
| INCOME FROM DISCONTINUED OPERATIONS, net of tax | 9.5 |
| | 12.3 |
| | 66.4 |
| | — |
| | 88.2 |
|
| NET INCOME ATTRIBUTABLE TO CLIFFS SHAREHOLDERS | $ | 1,128.1 |
| | $ | 792.2 |
| | $ | 91.5 |
| | $ | (883.7 | ) | | $ | 1,128.1 |
|
| OTHER COMPREHENSIVE LOSS | (244.9 | ) | | (24.1 | ) | | (256.7 | ) | | 280.8 |
| | (244.9 | ) |
| TOTAL COMPREHENSIVE INCOME (LOSS) ATTRIBUTABLE TO CLIFFS SHAREHOLDERS | $ | 883.2 |
| | $ | 768.1 |
| | $ | (165.2 | ) | | $ | (602.9 | ) | | $ | 883.2 |
|
|
| | | | | | | | | | | | | | | | | | | |
| Condensed Consolidating Statement of Operations and Comprehensive Income |
| For the Year Ended December 31, 2017 |
| (In Millions) |
| | Cleveland-Cliffs Inc. | | Guarantor Subsidiaries | | Non-Guarantor Subsidiaries | | Eliminations | | Consolidated |
| REVENUES FROM PRODUCT SALES AND SERVICES | | | | | | | | | |
| Product | $ | — |
| | $ | 1,644.6 |
| | $ | — |
| | $ | — |
| | $ | 1,644.6 |
|
| Freight and venture partners' cost reimbursements | — |
| | 221.4 |
| | — |
| | — |
| | 221.4 |
|
| | — |
| | 1,866.0 |
| | — |
| | — |
| | 1,866.0 |
|
| COST OF GOODS SOLD AND OPERATING EXPENSES | — |
| | (1,398.4 | ) | | — |
| | — |
| | (1,398.4 | ) |
| SALES MARGIN | — |
| | 467.6 |
| | — |
| | — |
| | 467.6 |
|
| OTHER OPERATING INCOME (EXPENSE) | | | | | | | | | |
| Selling, general and administrative expenses | (77.2 | ) | | (19.9 | ) | | (5.8 | ) | | — |
| | (102.9 | ) |
| Miscellaneous - net | (2.3 | ) | | 11.0 |
| | 16.8 |
| | — |
| | 25.5 |
|
| | (79.5 | ) | | (8.9 | ) | | 11.0 |
| | — |
| | (77.4 | ) |
| OPERATING INCOME (LOSS) | (79.5 | ) | | 458.7 |
| | 11.0 |
| | — |
| | 390.2 |
|
| OTHER INCOME (EXPENSE) | | | | | | | | | |
| Interest expense, net | (126.8 | ) | | (1.0 | ) | | 1.0 |
| | — |
| | (126.8 | ) |
| Loss on extinguishment of debt | (165.4 | ) | | — |
| | — |
| | — |
| | (165.4 | ) |
| Other non-operating income (expense) | (4.0 | ) | | (3.0 | ) | | 17.2 |
| | — |
| | 10.2 |
|
| | (296.2 | ) | | (4.0 | ) | | 18.2 |
| | — |
| | (282.0 | ) |
| INCOME (LOSS) FROM CONTINUING OPERATIONS BEFORE INCOME TAXES | (375.7 | ) | | 454.7 |
| | 29.2 |
| | — |
| | 108.2 |
|
| INCOME TAX BENEFIT (EXPENSE) | 251.4 |
| | 1.3 |
| | (0.3 | ) | | — |
| | 252.4 |
|
| EQUITY IN INCOME OF SUBSIDIARIES | 512.6 |
| | 11.8 |
| | — |
| | (524.4 | ) | | — |
|
| INCOME FROM CONTINUING OPERATIONS | 388.3 |
| | 467.8 |
| | 28.9 |
| | (524.4 | ) | | 360.6 |
|
| INCOME (LOSS) FROM DISCONTINUED OPERATIONS, net of tax | (21.3 | ) | | 1.7 |
| | 22.1 |
| | — |
| | 2.5 |
|
| NET INCOME | 367.0 |
| | 469.5 |
| | 51.0 |
| | (524.4 | ) | | 363.1 |
|
| INCOME ATTRIBUTABLE TO NONCONTROLLING INTEREST | — |
| | 3.9 |
| | — |
| | — |
| | 3.9 |
|
| NET INCOME ATTRIBUTABLE TO CLIFFS SHAREHOLDERS | $ | 367.0 |
| | $ | 473.4 |
| | $ | 51.0 |
| | $ | (524.4 | ) | | $ | 367.0 |
|
| OTHER COMPREHENSIVE INCOME (LOSS) | (4.0 | ) | | 12.9 |
| | (4.8 | ) | | (8.1 | ) | | (4.0 | ) |
| TOTAL COMPREHENSIVE INCOME ATTRIBUTABLE TO CLIFFS SHAREHOLDERS | $ | 363.0 |
| | $ | 486.3 |
| | $ | 46.2 |
| | $ | (532.5 | ) | | $ | 363.0 |
|
|
| | | | | | | | | | | | | | | | | | | |
| Condensed Consolidating Statement of Operations and Comprehensive Income |
| For the Year Ended December 31, 2016 |
| (In Millions) |
| | Cleveland-Cliffs Inc. | | Guarantor Subsidiaries | | Non-Guarantor Subsidiaries | | Eliminations | | Consolidated |
| REVENUES FROM PRODUCT SALES AND SERVICES | | | | | | | | | |
| Product | $ | — |
| | $ | 1,379.7 |
| | $ | — |
| | $ | — |
| | $ | 1,379.7 |
|
| Freight and venture partners' cost reimbursements | — |
| | 174.8 |
| | — |
| | — |
| | 174.8 |
|
| | — |
| | 1,554.5 |
| | — |
| | — |
| | 1,554.5 |
|
| COST OF GOODS SOLD AND OPERATING EXPENSES | — |
| | (1,274.4 | ) | | — |
| | — |
| | (1,274.4 | ) |
| SALES MARGIN | — |
| | 280.1 |
| | — |
| | — |
| | 280.1 |
|
| OTHER OPERATING INCOME (EXPENSE) | | | | | | | | | |
| Selling, general and administrative expenses | (94.3 | ) | | (18.0 | ) | | (3.5 | ) | | — |
| | (115.8 | ) |
| Miscellaneous - net | (5.6 | ) | | (12.4 | ) | | (15.6 | ) | | — |
| | (33.6 | ) |
| | (99.9 | ) | | (30.4 | ) | | (19.1 | ) | | — |
| | (149.4 | ) |
| OPERATING INCOME (LOSS) | (99.9 | ) | | 249.7 |
| | (19.1 | ) | | — |
| | 130.7 |
|
| OTHER INCOME (EXPENSE) | | | | | | | | | |
| Interest expense, net | (194.5 | ) | | 0.1 |
| | 0.5 |
| | — |
| | (193.9 | ) |
| Gain on extinguishment/restructuring of debt | 166.3 |
| | — |
| | — |
| | — |
| | 166.3 |
|
| Other non-operating income (expense) | (4.1 | ) | | (5.0 | ) | | 16.4 |
| | — |
| | 7.3 |
|
| | (32.3 | ) | | (4.9 | ) | | 16.9 |
| | — |
| | (20.3 | ) |
| INCOME (LOSS) FROM CONTINUING OPERATIONS BEFORE INCOME TAXES | (132.2 | ) | | 244.8 |
| | (2.2 | ) | | — |
| | 110.4 |
|
| INCOME TAX BENEFIT | 4.3 |
| | 3.0 |
| | 4.9 |
| | — |
| | 12.2 |
|
| EQUITY IN INCOME OF SUBSIDIARIES | 319.1 |
| | 13.7 |
| | — |
| | (332.8 | ) | | — |
|
| INCOME FROM CONTINUING OPERATIONS | 191.2 |
| | 261.5 |
| | 2.7 |
| | (332.8 | ) | | 122.6 |
|
| INCOME (LOSS) FROM DISCONTINUED OPERATIONS, net of tax | (17.1 | ) | | 2.6 |
| | 91.2 |
| | — |
| | 76.7 |
|
| NET INCOME (LOSS) | 174.1 |
| | 264.1 |
| | 93.9 |
| | (332.8 | ) | | 199.3 |
|
| INCOME ATTRIBUTABLE TO NONCONTROLLING INTEREST | — |
| | (25.2 | ) | | — |
| | — |
| | (25.2 | ) |
| NET INCOME ATTRIBUTABLE TO CLIFFS SHAREHOLDERS | $ | 174.1 |
| | $ | 238.9 |
| | $ | 93.9 |
| | $ | (332.8 | ) | | $ | 174.1 |
|
| OTHER COMPREHENSIVE INCOME (LOSS) | (3.3 | ) | | (20.7 | ) | | 15.4 |
| | 5.3 |
| | (3.3 | ) |
| TOTAL COMPREHENSIVE INCOME ATTRIBUTABLE TO CLIFFS SHAREHOLDERS | $ | 170.8 |
| | $ | 218.2 |
| | $ | 109.3 |
| | $ | (327.5 | ) | | $ | 170.8 |
|
|
| | | | | | | | | | | | | | | | | | | |
| Condensed Consolidating Statement of Cash Flows |
| For the Year Ended December 31, 2018 |
| (In Millions) |
| | Cleveland-Cliffs Inc. | | Guarantor Subsidiaries | | Non-Guarantor Subsidiaries | | Eliminations | | Consolidated |
| Net cash provided (used) by operating activities | $ | (120.7 | ) | | $ | 741.0 |
| | $ | (141.8 | ) | | $ | — |
| | $ | 478.5 |
|
| INVESTING ACTIVITIES | | | | | | | | | |
| Purchase of property, plant and equipment | (1.2 | ) | | (207.3 | ) | | (0.1 | ) | | — |
| | (208.6 | ) |
| Deposits for property, plant and equipment | — |
| | (82.3 | ) | | (5.2 | ) | | — |
| | (87.5 | ) |
| Intercompany investing | 399.1 |
| | (7.1 | ) | | 120.7 |
| | (512.7 | ) | | — |
|
| Other investing activities | — |
| | 3.1 |
| | 19.9 |
| | — |
| | 23.0 |
|
| Net cash provided (used) in investing activities | 397.9 |
| | (293.6 | ) | | 135.3 |
| | (512.7 | ) | | (273.1 | ) |
| FINANCING ACTIVITIES | | | | | | | | | |
| Repurchase of common shares | (47.5 | ) | | — |
| | — |
| | — |
| | (47.5 | ) |
| Debt issuance costs | (1.5 | ) | | — |
| | — |
| | — |
| | (1.5 | ) |
| Repurchase of debt | (234.5 | ) | | — |
| | — |
| | — |
| | (234.5 | ) |
| Distributions of partnership equity | — |
| | (44.2 | ) | | — |
| | — |
| | (44.2 | ) |
| Intercompany financing | (120.7 | ) | | (402.4 | ) | | 10.4 |
| | 512.7 |
| | — |
|
| Other financing activities | (2.1 | ) | | (2.2 | ) | | (43.2 | ) | | — |
| | (47.5 | ) |
| Net cash used by financing activities | (406.3 | ) | | (448.8 | ) | | (32.8 | ) | | 512.7 |
| | (375.2 | ) |
| EFFECT OF EXCHANGE RATE CHANGES ON CASH | — |
| | — |
| | (2.3 | ) | | — |
| | (2.3 | ) |
| DECREASE IN CASH AND CASH EQUIVALENTS, INCLUDING CASH CLASSIFIED WITHIN CURRENT ASSETS OF DISCONTINUED OPERATIONS | (129.1 | ) | | (1.4 | ) | | (41.6 | ) | | — |
| | (172.1 | ) |
| LESS: DECREASE IN CASH AND CASH EQUIVALENTS CLASSIFIED WITHIN CURRENT ASSETS OF DISCONTINUED OPERATIONS | — |
| | — |
| | (17.0 | ) | | — |
| | (17.0 | ) |
| NET DECREASE IN CASH AND CASH EQUIVALENTS | (129.1 | ) | | (1.4 | ) | | (24.6 | ) | | — |
| | (155.1 | ) |
| CASH AND CASH EQUIVALENTS AT BEGINNING OF YEAR | 948.9 |
| | 2.1 |
| | 27.3 |
| | — |
| | 978.3 |
|
| CASH AND CASH EQUIVALENTS AT END OF YEAR | $ | 819.8 |
| | $ | 0.7 |
| | $ | 2.7 |
| | $ | — |
| | $ | 823.2 |
|
|
| | | | | | | | | | | | | | | | | | | |
| Condensed Consolidating Statement of Cash Flows |
| For the Year Ended December 31, 2017 |
| (In Millions) |
| | Cleveland-Cliffs Inc. | | Guarantor Subsidiaries | | Non-Guarantor Subsidiaries | | Eliminations | | Consolidated |
| Net cash provided (used) by operating activities | $ | (166.8 | ) | | $ | 430.0 |
| | $ | 74.9 |
| | $ | — |
| | $ | 338.1 |
|
| INVESTING ACTIVITIES | | | | | | | | | |
| Purchase of property, plant and equipment | (3.4 | ) | | (79.8 | ) | | (51.7 | ) | | — |
| | (134.9 | ) |
| Deposits for property, plant and equipment | — |
| | (11.7 | ) | | (5.1 | ) | | — |
| | (16.8 | ) |
| Intercompany investing | 225.7 |
| | (7.3 | ) | | (45.1 | ) | | (173.3 | ) | | — |
|
| Other investing activities | (7.7 | ) | | 3.4 |
| | — |
| | — |
| | (4.3 | ) |
| Net cash provided (used) by investing activities | 214.6 |
| | (95.4 | ) | | (101.9 | ) | | (173.3 | ) | | (156.0 | ) |
| FINANCING ACTIVITIES | | | | | | | | | |
| Net proceeds from issuance of common shares | 661.3 |
| | — |
| | — |
| | — |
| | 661.3 |
|
| Proceeds from issuance of debt | 1,771.5 |
| | — |
| | — |
| | — |
| | 1,771.5 |
|
| Debt issuance costs | (28.6 | ) | | — |
| | — |
| | — |
| | (28.6 | ) |
| Repurchase of debt | (1,720.7 | ) | | — |
| | — |
| | — |
| | (1,720.7 | ) |
| Acquisition of noncontrolling interest | (105.0 | ) | | — |
| | — |
| | — |
| | (105.0 | ) |
| Distributions of partnership equity | — |
| | (52.9 | ) | | — |
| | — |
| | (52.9 | ) |
| Intercompany financing | 45.0 |
| | (277.6 | ) | | 59.3 |
| | 173.3 |
| | — |
|
| Other financing activities | (5.8 | ) | | (4.5 | ) | | (16.4 | ) | | — |
| | (26.7 | ) |
| Net cash provided (used) by financing activities | 617.7 |
| | (335.0 | ) | | 42.9 |
| | 173.3 |
| | 498.9 |
|
| EFFECT OF EXCHANGE RATE CHANGES ON CASH | — |
| | — |
| | 3.3 |
| | — |
| | 3.3 |
|
| INCREASE (DECREASE) IN CASH AND CASH EQUIVALENTS, INCLUDING CASH CLASSIFIED WITHIN CURRENT ASSETS OF DISCONTINUED OPERATIONS | 665.5 |
| | (0.4 | ) | | 19.2 |
| | — |
| | 684.3 |
|
| LESS: INCREASE IN CASH AND CASH EQUIVALENTS CLASSIFIED WITHIN CURRENT ASSETS OF DISCONTINUED OPERATIONS | — |
| | — |
| | 18.8 |
| | — |
| | 18.8 |
|
| NET INCREASE IN CASH AND CASH EQUIVALENTS | 665.5 |
| | (0.4 | ) | | 0.4 |
| | — |
| | 665.5 |
|
| CASH AND CASH EQUIVALENTS AT BEGINNING OF YEAR | 283.4 |
| | 2.5 |
| | 26.9 |
| | — |
| | 312.8 |
|
| CASH AND CASH EQUIVALENTS AT END OF YEAR | $ | 948.9 |
| | $ | 2.1 |
| | $ | 27.3 |
| | $ | — |
| | $ | 978.3 |
|
|
| | | | | | | | | | | | | | | | | | | |
| Condensed Consolidating Statement of Cash Flows |
| For the Year Ended December 31, 2016 |
| (In Millions) |
| | Cleveland-Cliffs Inc. | | Guarantor Subsidiaries | | Non-Guarantor Subsidiaries | | Eliminations | | Consolidated |
| Net cash provided (used) by operating activities | $ | (275.7 | ) | | $ | 462.9 |
| | $ | 115.8 |
| | $ | — |
| | $ | 303.0 |
|
| INVESTING ACTIVITIES | | | | | | | | | |
| Purchase of property, plant and equipment | (6.2 | ) | | (55.1 | ) | | (0.4 | ) | | — |
| | (61.7 | ) |
| Deposits for property, plant and equipment | — |
| | (4.9 | ) | | (2.5 | ) | | — |
| | (7.4 | ) |
| Intercompany investments | 356.6 |
| | (3.3 | ) | | (117.0 | ) | | (236.3 | ) | | — |
|
| Other investing activities | 0.4 |
| | 10.8 |
| | — |
| | — |
| | 11.2 |
|
| Net cash provided (used) by investing activities | 350.8 |
| | (52.5 | ) | | (119.9 | ) | | (236.3 | ) | | (57.9 | ) |
| FINANCING ACTIVITIES | | | | | | | | | |
| Net proceeds from issuance of common shares | 287.4 |
| | — |
| | — |
| | — |
| | 287.4 |
|
| Debt issuance costs | (5.2 | ) | | — |
| | — |
| | — |
| | (5.2 | ) |
| Borrowings under credit facilities | 105.0 |
| | — |
| | — |
| | — |
| | 105.0 |
|
| Repayments on credit facilities | (105.0 | ) | | — |
| | — |
| | — |
| | (105.0 | ) |
| Repayments on equipment loans | (95.6 | ) | | — |
| | — |
| | — |
| | (95.6 | ) |
| Repurchase of debt | (305.4 | ) | | — |
| | — |
| | — |
| | (305.4 | ) |
| Distributions of partnership equity | — |
| | (59.9 | ) | | — |
| | — |
| | (59.9 | ) |
| Intercompany financing | 117.0 |
| | (339.9 | ) | | (13.4 | ) | | 236.3 |
| | — |
|
| Other financing activities | (0.6 | ) | | (9.9 | ) | | (17.2 | ) | | — |
| | (27.7 | ) |
| Net cash used by financing activities | (2.4 | ) | | (409.7 | ) | | (30.6 | ) | | 236.3 |
| | (206.4 | ) |
| EFFECT OF EXCHANGE RATE CHANGES ON CASH | — |
| | — |
| | (0.5 | ) | | — |
| | (0.5 | ) |
| INCREASE (DECREASE) IN CASH AND CASH EQUIVALENTS, INCLUDING CASH CLASSIFIED WITHIN CURRENT ASSETS OF DISCONTINUED OPERATIONS | 72.7 |
| | 0.7 |
| | (35.2 | ) | | — |
| | 38.2 |
|
| LESS: DECREASE IN CASH AND CASH EQUIVALENTS CLASSIFIED WITHIN CURRENT ASSETS OF DISCONTINUED OPERATIONS | — |
| | — |
| | (35.3 | ) | | — |
| | (35.3 | ) |
| NET INCREASE IN CASH AND CASH EQUIVALENTS | 72.7 |
| | 0.7 |
| | 0.1 |
| | — |
| | 73.5 |
|
| CASH AND CASH EQUIVALENTS AT BEGINNING OF YEAR | 210.7 |
| | 1.8 |
| | 26.8 |
| | — |
| | 239.3 |
|
| CASH AND CASH EQUIVALENTS AT END OF YEAR | $ | 283.4 |
| | $ | 2.5 |
| | $ | 26.9 |
| | $ | — |
| | $ | 312.8 |
|
REPORT OF INDEPENDENT REGISTERED PUBLIC ACCOUNTING FIRM
To the shareholders and the Board of Directors of
Cleveland-Cliffs Inc.
Opinion on the Financial Statements
We have audited the accompanying statements of consolidated financial position of Cleveland-Cliffs Inc. and subsidiaries (the "Company") as of December 31, 20182020 and 2017,2019, the related statements of consolidated operations, comprehensive income, cash flows, and changes in equity, for each of the three years in the period ended December 31, 2018,2020, and the related notes and the financial schedule listed in the Index at Item 15 (collectively referred to as the "financial statements"). In our opinion, the financial statements present fairly, in all material respects, the financial position of the Company as of December 31, 20182020 and 2017,2019, and the results of its operations and its cash flows for each of the three years in the period ended December 31, 2018,2020, in conformity with accounting principles generally accepted in the United States of America.
We have also audited, in accordance with the standards of the Public Company Accounting Oversight Board (United States) (PCAOB), the Company's internal control over financial reporting as of December 31, 2018,2020, based on criteria established in Internal Control -— Integrated Framework (2013) issued by the Committee of Sponsoring Organizations of the Treadway Commission and our report dated February 8, 2019,26, 2021, expressed an unqualified opinion on the Company's internal control over financial reporting.
Change in Accounting Principle
As discussed in Note 2 to the consolidated financial statements, effective January 1, 2018, the Company changed its method of accounting for revenue by adopting FASB ASC 606, Revenue from Contracts with Customers, on a modified retrospective basis.
Basis for Opinion
These financial statements are the responsibility of the Company's management. Our responsibility is to express an opinion on the Company's financial statements based on our audits. We are a public accounting firm registered with the PCAOB and are required to be independent with respect to the Company in accordance with the U.S. federal securities laws and the applicable rules and regulations of the Securities and Exchange Commission and the PCAOB.
We conducted our audits in accordance with the standards of the PCAOB. Those standards require that we plan and perform the audit to obtain reasonable assurance about whether the financial statements are free of material misstatement, whether due to error or fraud. Our audits included performing procedures to assess the risks of material misstatement of the financial statements, whether due to error or fraud, and performing procedures that respond to those risks. Such procedures included examining, on a test basis, evidence regarding the amounts and disclosures in the financial statements. Our audits also included evaluating the accounting principles used and significant estimates made by management, as well as evaluating the overall presentation of the financial statements. We believe that our audits provide a reasonable basis for our opinion.
Critical Audit Matters
The critical audit matters communicated below are matters arising from the current-period audit of the financial statements that were communicated or required to be communicated to the audit committee and that (1) relates to accounts or disclosures that are material to the financial statements and (2) involved our especially challenging, subjective, or complex judgments. The communication of critical audit matters does not alter in any way our opinion on the financial statements, taken as a whole, and we are not, by communicating the critical audit matters below, providing a separate opinion on the critical audit matters or on the accounts or disclosures to which they relate.
Mineral Reserves — Asset Retirement Obligations, Valuation of Long-Lived Assets, Depreciation, Depletion and Amortization of Property, Plant and Equipment and Valuation in Acquisition Accounting —Refer to Notes 3, 5, 6 and 14 to the financial statements
Critical Audit Matter Description
Iron ore mineral reserve estimates, combined with estimated annual production levels, are used to determine the iron ore mine closure dates utilized in recording the fair value liability for asset retirement obligations for active operating iron ore mines. Since the liability represents the present value of the expected future obligation, a significant change in iron ore mineral reserves or iron ore mine lives could have a substantial effect on the recorded obligation. Iron ore mineral reserve estimates are also used in evaluating potential impairments of iron ore mine asset groups as they are indicative of future cash flows and in determining maximum useful lives utilized to calculate depreciation, depletion and amortization of long-lived iron ore mine assets. Further, iron ore mineral reserve estimates are used in estimating the fair value of mineral reserves established through the purchase price allocation in a business combination. The Company performs an in-depth evaluation of its iron ore mineral reserve estimates by iron ore mine on a periodic basis, in addition to routine annual assessments. The determination of iron ore mineral reserves requires management, with the support of management’s experts, to make significant estimates and assumptions related to
key inputs including (1) the determination of the size and scope of the iron ore body through technical modeling, (2) the estimates of future iron ore prices recognizing that the price shall not exceed the three-year trailing average index price of iron ore adjusted to the Company’s realized price, production costs and capital expenditures, and (3) management’s mine plan for the proven and probable iron ore mineral reserves (collectively “the iron ore mineral reserve inputs”). Changes in any of the judgments or assumptions related to the iron ore mineral reserve inputs can have a significant impact with respect to the accrual for asset retirement obligations, the impairment of long-lived asset groups, the amount of depreciation, depletion and amortization expense and the estimated fair value of mineral reserves established through the purchase price allocation in a business combination. The consolidated asset retirement obligation balance was $342 million as of December 31, 2020, of which $83 million related to active iron ore mine operations. The total asset balance associated with the Company’s Steelmaking reportable segment was $15,849 million as of December 31, 2020, of which $1,661 million related to long-lived assets associated with the Company’s combined iron ore mine asset groups, and is inclusive of $235 million related to iron ore mineral reserves acquired through the AM USA Transaction. Depreciation, depletion and amortization expense for the Company’s combined iron ore mine asset groups was $78 million for the year ended December 31, 2020.
Given the significant judgments and assumptions made by management to estimate iron ore mineral reserves and the sensitivity of changes to iron ore mineral reserve estimates on the Company’s recorded asset retirement obligations, long-lived asset impairment considerations, calculated depreciation, depletion and amortization expense and estimated fair value of mineral reserves established through the purchase price allocation of a business combination, performing audit procedures to evaluate the reasonableness of management’s judgments and estimates related to the iron ore mineral reserve inputs required a high degree of auditor judgment and an increased extent of effort.
How the Critical Audit Matter Was Addressed in the Audit
Our audit procedures related to management’s significant judgments and assumptions related to iron ore mineral reserve quantities and the related iron ore mine closure dates included the following, among others:
•We tested the operating effectiveness of internal controls related to the Company’s estimation of iron ore mineral reserve quantities and the related iron ore mine closure dates.
•We evaluated the experience, qualifications and objectivity of management’s experts, including in-house iron ore mine engineers.
•For an iron ore mine subject to the Company’s routine annual assessment we evaluated management’s assessment by:
◦Understanding the process used by management to survey and analyze the geological and operational status of current year iron ore mine production.
◦Evaluating the historical accuracy of management’s technical model as compared to actual iron ore mine production results.
◦Comparing the iron ore mine plan, updated for current year depletion, to
▪Presentations to the Audit Committee.
▪Information by asset group, asset retirement obligation valuation models, depreciation, depletion and amortization expense calculations and mineral reserve purchase price allocation valuation models.
•For an iron ore mine subject to the Company’s periodic in-depth evaluation of its iron ore mineral reserve estimate:
◦We evaluated management’s determination of the size and scope of the iron ore body, by:
▪Understanding the process used by management to complete research and exploration activities including mineralized resource drill samples.
▪Understanding the methodology utilized by management to apply the research and exploration data to the development of a technical model of the iron ore body.
▪Evaluating the historical accuracy of management’s technical model as compared to actual iron ore mine production results.
◦We evaluated management’s estimates of future iron ore prices, production costs and capital expenditures (the “financial assumptions”), by:
▪Understanding and testing the methodology utilized by management for development of the future iron ore prices recognizing that the price shall not exceed the three-year trailing average index price of iron ore adjusted to the Company’s realized price.
▪Evaluated management’s ability to accurately forecast future iron ore prices, production costs and capital expenditures by comparing actual results to management’s historical forecasts.
▪Evaluated the reasonableness of management’s estimates of future iron ore prices to forecasted information included in analyst reports.
▪Evaluated the reasonableness of management’s forecast for production costs and capital expenditures by comparing the forecasts to: (1) historical results and (2) internal communications to management and the Board of Directors.
◦We evaluated management’s iron ore mine plan for the proven and probable mineral reserves, by:
▪Understanding the process used by management to develop the iron ore mine plan for proven and probable iron ore mineral reserves applying key inputs such as the technical model of the iron ore body and the financial assumptions.
▪Comparing the iron ore mine plan to
•Presentations to the Audit Committee.
•Historical iron ore mine plan(s).
•Information by asset group, asset retirement obligation valuation models, depreciation, depletion and amortization expense calculations, and mineral reserve purchase price allocation valuation models.
Acquisitions — AK Steel —Refer to Note 3 to the financial statements
Critical Audit Matter Description
The Company completed the acquisition of AK Steel Holding Corporation for approximately $1.5 billion on March 13, 2020. The Company accounted for the acquisition under the acquisition method of accounting for business combinations. Accordingly, the purchase price was initially allocated to three operations of the AK Steel business including Steelmaking, Tooling and Stamping and Tubular using a discounted cash flow model (the “Operations Allocation”). Following the Operations Allocation, the purchase price was then allocated to the assets acquired and liabilities assumed comprising the three operations of the AK Steel business based on their respective fair values, including $174 million goodwill balance assigned to the Tooling and Stamping and Tubular operations. The Operations Allocation required management to make significant estimates and assumptions related to forecasts of future revenues and earnings before interest, taxes, depreciation, and amortization (EBITDA) and discount rates.
Given the Operations Allocation requires management to make significant estimates and assumptions related to the forecasts of future revenues and EBITDA (the “Forecasts”), as well as the selection of the discount rates, and considering to the sensitivity of the allocated goodwill balance to changes in projected future cash flows at the Steelmaking, Tooling and Stamping, and Tubular operations, performing audit procedures to evaluate the reasonableness of the Forecasts and selected discount rates required a high degree of auditor judgment and an increased extent of effort, including the need to involve our fair value specialists.
How the Critical Audit Matter Was Addressed in the Audit
Our audit procedures related to the Forecasts and the selection of the discount rates included the following, among others:
•We tested the operating effectiveness of internal controls over management’s purchase price allocation, such as controls related to management’s Forecasts and the selection of the discount rates.
•We evaluated the reasonableness of management’s Forecasts by comparing the Forecasts to (1) historical results, (2) internal communications to management and the Board of Directors, and (3) forecasted information included in industry reports and other economic indicators.
•With the assistance of our fair value specialists, we evaluated the reasonableness of the discount rates by:
◦Testing the source information underlying the determination of the discount rates and testing the mathematical accuracy of the calculation.
◦Developing a range of independent estimates and comparing those to the discount rates selected by management.
•We evaluated whether management’s Forecasts were consistent with evidence obtained in other areas of the audit.
/s/ DELOITTE & TOUCHE LLP
Cleveland, Ohio
February 8, 201926, 2021
We have served as the Company's auditor since 2004.
REPORT OF INDEPENDENT REGISTERED PUBLIC ACCOUNTING FIRM
To the shareholders and the Board of Directors of
Cleveland-Cliffs Inc.
Opinion on Internal Control over Financial Reporting
We have audited the internal control over financial reporting of Cleveland-Cliffs Inc. and subsidiaries (the "Company") as of December 31, 2018, based on criteria established in Internal Control - Integrated Framework (2013) issued by the Committee of Sponsoring Organizations of the Treadway Commission (COSO). In our opinion, the Company maintained, in all material respects, effective internal control over financial reporting as of December 31, 2018, based on criteria established in Internal Control - Integrated Framework (2013) issued by COSO.
We have also audited, in accordance with the standards of the Public Company Accounting Oversight Board (United States) (PCAOB), the consolidated financial statements and financial statement schedule as of and for the year ended December 31, 2018, of the Company and our report dated February 8, 2019, expressed an unqualified opinion on those financial statements and financial statement schedule and included an explanatory paragraph regarding the Company’s change to its method of accounting for revenue by adopting FASB ASC 606, Revenue from Contracts with Customers.
Basis for Opinion
The Company’s management is responsible for maintaining effective internal control over financial reporting and for its assessment of the effectiveness of internal control over financial reporting, included in the accompanying Management’s Report on Internal Control Over Financial Reporting. Our responsibility is to express an opinion on the Company’s internal control over financial reporting based on our audit. We are a public accounting firm registered with the PCAOB and are required to be independent with respect to the Company in accordance with the U.S. federal securities laws and the applicable rules and regulations of the Securities and Exchange Commission and the PCAOB.
We conducted our audit in accordance with the standards of the PCAOB. Those standards require that we plan and perform the audit to obtain reasonable assurance about whether effective internal control over financial reporting was maintained in all material respects. Our audit included obtaining an understanding of internal control over financial reporting, assessing the risk that a material weakness exists, testing and evaluating the design and operating effectiveness of internal control based on the assessed risk, and performing such other procedures as we considered necessary in the circumstances. We believe that our audit provides a reasonable basis for our opinion.
Definition and Limitations of Internal Control over Financial Reporting
A company’s internal control over financial reporting is a process designed to provide reasonable assurance regarding the reliability of financial reporting and the preparation of financial statements for external purposes in accordance with generally accepted accounting principles. A company’s internal control over financial reporting includes those policies and procedures that (1) pertain to the maintenance of records that, in reasonable detail, accurately and fairly reflect the transactions and dispositions of the assets of the company; (2) provide reasonable assurance that transactions are recorded as necessary to permit preparation of financial statements in accordance with generally accepted accounting principles, and that receipts and expenditures of the company are being made only in accordance with authorizations of management and directors of the company; and (3) provide reasonable assurance regarding prevention or timely detection of unauthorized acquisition, use, or disposition of the company’s assets that could have a material effect on the financial statements.
Because of its inherent limitations, internal control over financial reporting may not prevent or detect misstatements. Also, projections of any evaluation of effectiveness to future periods are subject to the risk that controls may become inadequate because of changes in conditions, or that the degree of compliance with the policies or procedures may deteriorate.
/s/ DELOITTE & TOUCHE LLP
Cleveland, Ohio
February 8, 2019
|
| | | | |
| Item 9. | Changes in and Disagreements With Accountants on Accounting and Financial Disclosure |
None.
|
| | | | |
| Item 9A. | Controls and Procedures |
We maintain disclosure controls and procedures that are designed to ensure that information required to be disclosed in our Exchange Act reports is recorded, processed, summarized and reported within the time periods specified in the SEC’s rules and forms, and that such information is accumulated and communicated to our management, including our President and Chief Executive Officer and Chief Financial Officer, as appropriate, to allow timely decisions regarding required disclosure based solely on the definition of “disclosure controls and procedures” in Rule 13a-15(e) promulgated under the Exchange Act. In designing and evaluating the disclosure controls and procedures, management recognized that any controls and procedures, no matter how well designed and operated, can provide only reasonable assurance of achieving the desired control objectives, and management necessarily was required to apply its judgment in evaluating the cost-benefit relationship of possible controls and procedures.
As of the end of the period covered by this report, we carried out an evaluation under the supervision and with the participation of our management, including our President and Chief Executive Officer and our Chief Financial Officer, of the effectiveness of the design and operation of our disclosure controls and procedures. Based on the foregoing, our President and Chief Executive Officer and Chief Financial Officer concluded that our disclosure controls and procedures were effective.
Management's Report on Internal Control Over Financial Reporting
Our management is responsible for establishing and maintaining adequate internal control over financial reporting as such term is defined under Rule 13a-15(f) promulgated under the Exchange Act.
Internal control over financial reporting is a process designed to provide reasonable assurance regarding the reliability of financial reporting and the preparation of the Company's consolidated financial statements for external purposes in accordance with generally accepted accounting principles.
Internal control over financial reporting includes those policies and procedures that (i) pertain to the maintenance of records that, in reasonable detail, accurately and fairly reflect the transactions and dispositions of the assets of the Company; (ii) provide reasonable assurance that transactions are recorded as necessary to permit the preparation of the consolidated financial statements in accordance with generally accepted accounting principles, and that receipts and expenditures of the Company are being made only in accordance with appropriate authorizations of management and directors of the Company; and (iii) provide reasonable assurance regarding prevention or timely detection of unauthorized acquisition, use or disposition of the Company's assets that could have a material effect on the consolidated financial statements.
Because of its inherent limitations, internal control over financial reporting may not prevent or detect misstatements. Also, projections of any evaluation of effectiveness to future periods are subject to the risk that controls may become inadequate because of changes in conditions, or that the degree of compliance with the policies or procedures may deteriorate.
Management conducted an assessment of the Company's internal control over financial reporting as of December 31, 20182020 using the framework specified in Internal Control - Integrated Framework (2013), published by the Committee of Sponsoring Organizations of the Treadway Commission. We have excluded from our assessment the internal control over financial reporting at AK Steel, which was acquired on March 13, 2020, and whose assets as of December 31, 2020 constituted 32% of the Company’s consolidated total assets as of December 31, 2020, and whose revenues for the period from March 13, 2020 through December 31, 2020, inclusive, constituted 67% of the Company’s consolidated revenues for the year ended December 31, 2020. Management also excluded from our assessment the internal control over financial reporting at ArcelorMittal USA, which was acquired on December 9, 2020, and whose assets as of December 31, 2020 constituted 49% of the Company’s consolidated total assets as of December 31, 2020, and whose revenues for the period from December 9, 2020 through December 31, 2020, inclusive, constituted 8% of the Company’s consolidated revenues for the year ended December 31, 2020.
Based on such assessment, management has concluded that the Company's internal control over financial reporting was effective as of December 31, 2018.2020.
The effectiveness of the Company's internal control over financial reporting as of December 31, 20182020 has been audited by Deloitte & Touche LLP, an independent registered public accounting firm, as stated in their report that appears herein.
February 8, 201926, 2021
Changes in Internal Control Over Financial Reporting
There have been no changes in our internal control over financial reporting or in other factors that occurred during our last fiscal quarter that have materially affected, or are reasonably likely to materially affect, our internal control over financial reporting.
REPORT OF INDEPENDENT REGISTERED PUBLIC ACCOUNTING FIRM
To the shareholders and the Board of Directors of
Cleveland-Cliffs Inc.
Opinion on Internal Control over Financial Reporting
We have audited the internal control over financial reporting of Cleveland-Cliffs Inc. and subsidiaries (the "Company") as of December 31, 2020, based on criteria established in Internal Control — Integrated Framework (2013) issued by the Committee of Sponsoring Organizations of the Treadway Commission (COSO). In our opinion, the Company maintained, in all material respects, effective internal control over financial reporting as of December 31, 2020, based on criteria established in Internal Control — Integrated Framework (2013) issued by COSO.
We have also audited, in accordance with the standards of the Public Company Accounting Oversight Board (United States) (PCAOB), the consolidated financial statements as of and for the year ended December 31, 2020, of the Company and our report dated February 26, 2021, expressed an unqualified opinion on those financial statements.
As described in Management’s Report on Internal Control Over Financial Reporting, management excluded from its assessment the internal control over financial reporting at AK Steel, which was acquired on March 13, 2020, and whose assets as of December 31, 2020 constituted 32% of the Company’s consolidated total assets as of December 31, 2020, and whose revenues for the period from March 13, 2020 through December 31, 2020, inclusive, constituted 67% of the Company’s consolidated revenues for the year ended December 31, 2020. Management also excluded from its assessment the internal control over financial reporting at ArcelorMittal USA, which was acquired on December 9, 2020, and whose assets as of December 31, 2020 constituted 49% of the Company’s consolidated total assets as of December 31, 2020, and whose revenues for the period from December 9, 2020 through December 31, 2020, inclusive, constituted 8% of the Company’s consolidated revenues for the year ended December 31, 2020. Accordingly, our audit did not include the internal control over financial reporting at either AK Steel or ArcelorMittal USA.
Basis for Opinion
The Company’s management is responsible for maintaining effective internal control over financial reporting and for its assessment of the effectiveness of internal control over financial reporting, included in the accompanying Management’s Report on Internal Control Over Financial Reporting. Our responsibility is to express an opinion on the Company’s internal control over financial reporting based on our audit. We are a public accounting firm registered with the PCAOB and are required to be independent with respect to the Company in accordance with the U.S. federal securities laws and the applicable rules and regulations of the Securities and Exchange Commission and the PCAOB.
We conducted our audit in accordance with the standards of the PCAOB. Those standards require that we plan and perform the audit to obtain reasonable assurance about whether effective internal control over financial reporting was maintained in all material respects. Our audit included obtaining an understanding of internal control over financial reporting, assessing the risk that a material weakness exists, testing and evaluating the design and operating effectiveness of internal control based on the assessed risk, and performing such other procedures as we considered necessary in the circumstances. We believe that our audit provides a reasonable basis for our opinion.
Definition and Limitations of Internal Control over Financial Reporting
A company’s internal control over financial reporting is a process designed to provide reasonable assurance regarding the reliability of financial reporting and the preparation of financial statements for external purposes in accordance with generally accepted accounting principles. A company’s internal control over financial reporting includes those policies and procedures that (1) pertain to the maintenance of records that, in reasonable detail, accurately and fairly reflect the transactions and dispositions of the assets of the company; (2) provide reasonable assurance that transactions are recorded as necessary to permit preparation of financial statements in accordance with generally accepted accounting principles, and that receipts and expenditures of the company are being made only in accordance with authorizations of management and directors of the company; and (3) provide reasonable assurance regarding prevention or timely detection of unauthorized acquisition, use, or disposition of the company’s assets that could have a material effect on the financial statements.
Because of its inherent limitations, internal control over financial reporting may not prevent or detect misstatements. Also, projections of any evaluation of effectiveness to future periods are subject to the risk that controls may become inadequate because of changes in conditions, or that the degree of compliance with the policies or procedures may deteriorate.
/s/ DELOITTE & TOUCHE LLP
Cleveland, Ohio
February 26, 2021
|
| | | | |
| Item 9B. | Other Information |
None.
PART III
|
| | | | |
| Item 10. | Directors, Executive Officers and Corporate Governance |
The information required to be furnished by this Item will be set forth in our definitive proxy statement for the 20192021 Annual Meeting of Shareholders (the "Proxy Statement") under the headings "Board Meetings and Committees -— Audit Committee", "Code of Business Conduct and Ethics", "Independence and Related Party Transactions", and "Information Concerning Director Nominees” and “Section 16(a) Beneficial Ownership Reporting Compliance”, and is incorporated herein by reference and made a part hereof from the Proxy Statement. The information regarding executive officers required by this Item is set forth in Part I - Item 1. Business hereof under the heading “Executive Officers of the Registrant”“Information About Our Executive Officers”, which information is incorporated herein by reference and made a part hereof.
|
| | | | |
| Item 11. | Executive Compensation |
The information required to be furnished by this Item will be set forth in ourthe Proxy Statement under the headings “Director Compensation”, "Compensation Discussion and Analysis", “Compensation Committee Report”, “Compensation Committee Interlocks and Insider Participation”, "Compensation-Related Risk Assessment" and “Executive Compensation” and is incorporated herein by reference and made a part hereof from the Proxy Statement.
|
| | | | |
| Item 12. | Security Ownership of Certain Beneficial Owners and Management and Related Stockholder Matters |
The information required to be furnished by this Item regarding "Securities Authorized for Issuance Under Equity Compensation Plans", "Related Stockholder Matters" and "Security Ownership" will be set forth in the Proxy Statement under the headings "Independence and Related Party Transactions", "Ownership of Equity Securities of the Company" and "Equity Compensation Plan Information", respectively, and is incorporated herein by reference and made a part hereof from the Proxy Statement.
|
| | | | |
| Item 13. | Certain Relationships and Related Transactions, and Director Independence |
The information required to be furnished by this Item will be set forth in the Proxy Statement under the heading “Independence and Related Party Transactions” and is incorporated herein by reference and made a part hereof from the Proxy Statement.
|
| | | | |
| Item 14. | Principal Accountant Fees and Services |
The information required to be furnished by this Item will be set forth in the Proxy Statement under the heading “Ratification of Independent Registered Public Accounting Firm” and is incorporated herein by reference and made a part hereof from the Proxy Statement.
PART IV
|
| | | | |
| Item 15. | Exhibits and Financial Statement Schedules |
(a)(1) and (2) - List of Financial Statements and Financial Statement Schedules.
The following consolidated financial statements of Cleveland-Cliffs Inc. are included at Item 8. Financial Statements and Supplementary Dataabove:
The following consolidated financial statement schedule of Cleveland-Cliffs Inc. is included herein in Item 15(d) and attached as Exhibit 99(a):Schedule II (a)(2) - Valuation and Qualifying AccountsFinancial Statement Schedules
All other schedules for which provision is made in the applicable accounting regulation of the SEC are not required under the related instructions or are inapplicable, and therefore have been omitted.omitted or are contained in the applicable financial statements or the notes thereto.
(a)(3) List of Exhibits
All documents referenced below have been filed pursuant to the Securities Exchange Act of 1934 by Cleveland-Cliffs Inc., file number 1-09844, unless otherwise indicated.
|
| | | | |
Exhibit
Number
| Exhibit |
| Plan of purchase, sale, reorganization, arrangement, liquidation or succession |
| **Agreement and Plan of Merger, dated as of December 2, 2019, by and among Cleveland-Cliffs Inc., AK Steel Holding Corporation and Pepper Merger Sub Inc. (filed as Exhibit 2.1 to Cliffs' Form 8-K on December 4, 2019 and incorporated herein by reference) |
| ***Unit PurchaseTransaction Agreement, dated as of December 22, 2015,September 28, 2020, by and among Cliffs Natural Resourcesbetween Cleveland-Cliffs Inc., CLF PinnOak LLC and Seneca Coal Resources, LLCArcelorMittal S.A. (filed as Exhibit 2.32.1 to Cliffs’ Form 10-K10-Q for the period ended December 31, 2015September 30, 2020 and incorporated herein by reference) |
| Articles of Incorporation and By-LawsRegulations of Cleveland-Cliffs Inc. |
| ThirdFourth Amended Articles of Incorporation of Cliffs, as filed with the Secretary of State of the State of Ohio on May 13, 2013September 25, 2020 (filed as Exhibit 3.13.2 to Cliffs’ Form 8-K on May 13, 2013September 28, 2020 and incorporated herein by reference) |
| Certificate of Amendment to ThirdFourth Amended Articles of Incorporation of Cliffs, as filed with the Secretary of State of the State of Ohio on April 26, 2017December 7, 2020 (filed as Exhibit 3.1 to Cliffs’Cliffs Form 8-K on April 27, 2017December 9, 2020 and incorporated herein by reference) |
| Certificate of Amendment to Third Amended Articles of Incorporation of Cliffs, as amended, as filed with the Secretary of State of the State of Ohio on August 15, 2017 (filed as Exhibit 3.1 to Cliffs’ Form 8-K on August 17, 2017 and incorporated herein by reference) |
| Regulations of Cliffs (filed as Exhibit 3.2 to Cliffs’ Form 10-K for the period ended December 31, 2011 and incorporated herein by reference) |
| Instruments defining rights of security holders, including indentures |
| Indenture, dated as of March 17, 2010, between Cliffs Natural Resources Inc. (n/k/a Cleveland-Cliffs Inc.) and U.S. Bank National Association, as trustee dated March 17, 2010 (filed as Exhibit 4.3 to Cliffs’ Registration Statement on Form S-3 (Registration No. 333-186617333-186617) on February 12, 2013 and incorporated herein by reference) |
| Form of 6.25% Notes due 2040 Third Supplemental Indenture, dated as of September 20, 2010, between Cliffs Natural Resources Inc. (n/k/a Cleveland-Cliffs Inc.) and U.S. Bank National Association, as trustee, dated September 20, 2010, including Form of 6.25% Notes due 2040 (filed as Exhibit 4.4 to Cliffs’ Form 8-K on September 17, 2010 and incorporated herein by reference) |
|
| |
| FormFifth Supplemental Indenture, dated as of 4.875% Notes due 2021 Fourth Supplemental IndentureMarch 31, 2011, between Cliffs Natural Resources Inc. (n/k/a Cleveland-Cliffs Inc.) and U.S. Bank National Association, as trustee dated March 23, 2011, including Form of 4.875% Notes due 2021 (filed as Exhibit 4.1 to Cliffs’ Form 8-K on March 23, 2011 and incorporated herein by reference) |
| Fifth Supplemental Indenture between Cliffs Natural Resources Inc. and U.S. Bank National Association, as trustee, dated March 31, 2011 (filed as Exhibit 4(b) to Cliffs’ Form 10-Q for the period ended June 30, 2011 and incorporated herein by reference) |
| | | | | |
| Seventh Supplemental Indenture, dated as of May 7, 2013, between Cliffs Natural Resources Inc. (n/k/a Cleveland-Cliffs Inc.) and U.S. Bank National Association, as trustee dated May 7, 2013 (as filed(filed as Exhibit 4.1 to Cliffs' Form 10-Q for the period ended June 30, 2013 and incorporated herein by reference) |
| Eighth Supplemental Indenture, dated as of December 19, 2017, by and between Cleveland-Cliffs Inc. and U.S. Bank National Association, as trustee, including Form of 1.50% Convertible Senior Notes due 2025 (filed as Exhibit 4.2 to Cliffs' Form 8-K on December 19, 2017 and incorporated herein by reference) |
| Indenture, dated as of February 27, 2017, among Cliffs Natural Resources Inc. (n/k/a Cleveland-Cliffs Inc.), the Guarantors party thereto and U.S. Bank National Association, as trustee, including Form of 5.75% Senior Notes due 2025 (filed as Exhibit 4.1 to Cliffs' Form 8-K on August 7, 2017 and incorporated herein by reference) |
| First Supplemental Indenture, dated as of August 7, 2017, among Cliffs Natural Resources Inc. (n/k/a Cleveland-Cliffs Inc.), the Guarantors party thereto and U.S. Bank National Association, as trustee, including Form of 5.75% Senior Notes due 2025 (filed as Exhibit 4.2 to Cliffs' Form 8-K filed on August 7, 2017 and incorporated herein by reference) |
| Second Supplemental Indenture, dated as of September 29, 2017, among Cliffs Empire II Inc. and Empire Iron Mining Partnership, as additional guarantors, Cleveland-Cliffs Inc., the Additional Guarantors party thereto and U.S. Bank National Association, as trustee (filed as Exhibit 4.11 to Cliffs’ Form 10-K for the period ended December 31, 2017 and incorporated herein by reference) |
| Third Supplemental Indenture, dated as of October 27, 2017, among Cliffs TIOP II, LLC, Marquette Range Coal Service Company and Tilden Mining Company L.C., as additional guarantors thereto, Cleveland-Cliffs Inc., the Additional Guarantors party thereto and U.S. Bank National Association, as trustee (filed as Exhibit 4.12 to Cliffs’ Form 10-K for the period ended December 31, 2017 and incorporated herein by reference) |
| Fourth Supplemental Indenture, dated as of August 27, 2018, among Cleveland-Cliffs Inc., the Additional Guarantor party thereto and U.S. Bank National Association, as trustee (filed as Exhibit 4.10 to Cliffs’ Form 10-K for the period ended December 31, 2019 and incorporated herein by reference) |
| Fifth Supplemental Indenture, dated as of March 13, 2020, among Cleveland-Cliffs Inc., the Additional Guarantors party thereto and U.S. Bank National Association, as trustee (filed as Exhibit 4.2 to Cliffs’ Form 10-Q for the period ended March 31, 2020 and incorporated herein by reference) |
| Sixth Supplemental Indenture, dated as of May 22, 2020, among Cleveland-Cliffs Inc., the Additional Guarantors party thereto and U.S. Bank National Association, as trustee (filed as Exhibit 4.4 to Cliffs’ Form 10-Q for the period ended June 30, 2020 and incorporated herein by reference) |
| Seventh Supplemental Indenture, dated as of December 9, 2020, among Cleveland-Cliffs Inc., the Additional Guarantors party thereto and U.S. Bank National Association, as trustee (filed herewith) |
| Eighth Supplemental Indenture, dated as of December 18, 2020, among Cleveland-Cliffs Inc., the Additional Guarantors party thereto and U.S. Bank National Association, as trustee (filed herewith) |
| Indenture, dated as of December 19, 2017, by and among Cleveland-Cliffs Inc., the guarantorsGuarantors party thereto and U.S. Bank National Association, as trustee and first lien notes collateral agent, including Form of 4.875% Senior Secured Notes due 2024 (filed as Exhibit 4.1 to Cliffs' Form 8-K filed on December 19, 2017 and incorporated herein by reference) |
| Registration Rights Agreement,First Supplemental Indenture, dated as of FebruaryAugust 27, 2017,2018, among Cleveland-Cliffs Inc., the Additional Guarantor party thereto and U.S. Bank National Association, as trustee (filed as Exhibit 4.12 to Cliffs’ Form 10-K for the period ended December 31, 2019 and incorporated herein by andreference) |
| Second Supplemental Indenture, dated as of March 13, 2020, among Cliffs Natural Resources Inc. (n/k/a Cleveland-Cliffs Inc.), the Additional Guarantors party thereto and Merrill Lynch, Pierce, Fenner & Smith Incorporated,U.S. Bank National Association, as representative of the several initial purchaserstrustee and first lien notes collateral agent (filed as Exhibit 4.24.3 to Cliffs' Form 10-Q for the period ended March 31, 20172020 and incorporated herein by reference) |
| JoinderThird Supplemental Indenture, dated as of May 22, 2020, among Cleveland-Cliffs Inc., the Additional Guarantors party thereto and U.S. Bank National Association, as trustee and first lien notes collateral agent (filed as Exhibit 4.5 to Cliffs’ Form 10-Q for the period ended June 30, 2020 and incorporated herein by reference) |
| Fourth Supplemental Indenture, dated as of December 9, 2020, among Cleveland-Cliffs Inc., the Additional Guarantors party thereto and U.S. Bank National Association, as trustee and first lien notes collateral agent (filed herewith) |
| Fifth Supplemental Indenture, dated as of December 18, 2020, among Cleveland-Cliffs Inc., the Additional Guarantors party thereto and U.S. Bank National Association, as trustee and first lien notes collateral agent (filed herewith) |
| Indenture, dated as of May 13, 2019, among Cleveland-Cliffs Inc., the Guarantors party thereto and U.S. Bank National Association, as trustee, including Form of 5.875% Senior Notes due 2027 (filed as Exhibit 4.1 to Cliffs' Form 8-K on May 14, 2019 and incorporated herein by reference) |
| First Supplemental Indenture, dated as of March 13, 2020, among Cleveland-Cliffs Inc., the Additional Guarantors party thereto and U.S. Bank National Association, as trustee (filed as Exhibit 4.4 to Cliffs' Form 10-Q for the period ended March 31, 2020 and incorporated herein by reference) |
| | | | | |
| Second Supplemental Indenture, dated as of May 22, 2020, among Cleveland-Cliffs Inc., the Additional Guarantors party thereto and U.S. Bank National Association, as trustee (filed as Exhibit 4.6 to Cliffs’ Form 10-Q for the period ended June 30, 2020 and incorporated herein by reference) |
| Third Supplemental Indenture, dated as of December 9, 2020, among Cleveland-Cliffs Inc., the Additional Guarantors party thereto and U.S. Bank National Association, as trustee (filed herewith) |
| Fourth Supplemental Indenture, dated as of December 18, 2020, among Cleveland-Cliffs Inc., the Additional Guarantors party thereto and U.S. Bank National Association, as trustee (filed herewith) |
| Indenture, dated as of March 13, 2020, among Cleveland-Cliffs Inc., the Guarantors party thereto and U.S. Bank National Association, as trustee and first lien notes collateral agent, including Form of 6.75% Senior Secured Notes due 2026 (filed as Exhibit 4.1 to Cliffs’ Form 10-Q for the period ended March 31, 2020 and incorporated herein by reference) |
| First Supplemental Indenture, dated as of May 22, 2020, among Cleveland-Cliffs Inc., the Additional Guarantors party thereto and U.S. Bank National Association, as trustee and first lien notes collateral agent (filed as Exhibit 4.9 to Cliffs’ Form 10-Q for the period ended June 30, 2020 and incorporated herein by reference) |
| Second Supplemental Indenture, dated as of June 19, 2020, among Cleveland-Cliffs Inc., the Guarantors party thereto and U.S. Bank National Association, as trustee and first lien notes collateral agent, including Form of 6.75% Senior Secured Notes due 2026 (filed as Exhibit 4.10 to Cliffs’ Form 10-Q for the period ended June 30, 2020 and incorporated herein by reference) |
| Third Supplemental Indenture, dated as of December 9, 2020, among Cleveland-Cliffs Inc., the Additional Guarantors party thereto and U.S. Bank National Association, as trustee and first lien notes collateral agent (filed herewith) |
| Fourth Supplemental Indenture, dated as of December 18, 2020, among Cleveland-Cliffs Inc., the Additional Guarantors party thereto and U.S. Bank National Association, as trustee and first lien notes collateral agent (filed herewith) |
| Indenture, dated as of March 16, 2020, by and among Cleveland-Cliffs Inc., the Guarantors party thereto and U.S. Bank National Association, as trustee, including Form of 6.375% Senior Notes due 2025 (filed as Exhibit 4.5 to Cliffs’ Form 10-Q for the period ended March 31, 2020 and incorporated herein by reference) |
| First Supplemental Indenture, dated as of May 22, 2020, among Cleveland-Cliffs Inc., the Additional Guarantors party thereto and U.S. Bank National Association, as trustee (filed as Exhibit 4.8 to Cliffs’ Form 10-Q for the period ended June 30, 2020 and incorporated herein by reference) |
| Second Supplemental Indenture, dated as of December 9, 2020, among Cleveland-Cliffs Inc., the Additional Guarantors party thereto and U.S. Bank National Association, as trustee (filed herewith) |
| Third Supplemental Indenture, dated as of December 18, 2020, among Cleveland-Cliffs Inc., the Additional Guarantors party thereto and U.S. Bank National Association, as trustee (filed herewith) |
| Registration Rights Agreement, dated as of August 7, 2017, by andMarch 16, 2020, among Cliffs Natural Resources Inc. (n/k/a Cleveland-Cliffs Inc.), the Guarantors party thereto and Credit Suisse Securities (USA) LLC, as representativedealer manager, with respect to Cleveland-Cliffs Inc.’s 6.375% Senior Notes due 2025 (filed as Exhibit 4.6 to Cliffs’ Form 10-Q for the period ended March 31, 2020 and incorporated herein by reference) |
| Indenture, dated as of March 16, 2020, among Cleveland-Cliffs Inc., the several initial purchasersGuarantors party thereto and U.S. Bank National Association, as trustee, including Form of 7.00% Senior Notes due 2027 (filed as Exhibit 4.7 to Cliffs’ Form 10-Q for the period ended March 31, 2020 and incorporated herein by reference) |
| First Supplemental Indenture, dated as of May 22, 2020, among Cleveland-Cliffs Inc., the Additional Guarantors party thereto and U.S. Bank National Association, as trustee (filed as Exhibit 4.7 to Cliffs’ Form 10-Q for the period ended June 30, 2020 and incorporated herein by reference) |
| Second Supplemental Indenture, dated as of December 9, 2020, among Cleveland-Cliffs Inc., the Additional Guarantors party thereto and U.S. Bank National Association, as trustee (filed herewith) |
| Third Supplemental Indenture, dated as of December 18, 2020, among Cleveland-Cliffs Inc., the Additional Guarantors party thereto and U.S. Bank National Association, as trustee (filed herewith) |
| Registration Rights Agreement, dated March 16, 2020, among Cleveland-Cliffs Inc., as issuer, the Guarantors party thereto and Credit Suisse Securities (USA) LLC, as dealer manager, with respect to Cleveland-Cliffs Inc.’s 7.00% Senior Notes due 2027 (filed as Exhibit 4.8 to Cliffs’ Form 10-Q for the period ended March 31, 2020 and incorporated herein by reference) |
| Indenture, dated as of April 17, 2020, among Cleveland-Cliffs Inc., the Guarantors party thereto and U.S. Bank National Association, as trustee and first lien notes collateral agent, including Form of 9.875% Senior Secured Notes due 2025 (filed as Exhibit 4.1 to Cliffs’ Form 10-Q for the period ended June 30, 2020 and incorporated herein by reference) |
| | | | | |
| First Supplemental Indenture, dated as of April 24, 2020, among Cleveland-Cliffs Inc., the Guarantors party thereto and U.S. Bank National Association, as trustee and first lien notes collateral agent, including Form of 9.875% Senior Secured Notes due 2025 (filed as Exhibit 4.2 to Cliffs’ Form 10-Q for the period ended June 30, 2020 and incorporated herein by reference) |
| Second Supplemental Indenture, dated as of May 22, 2020, among Cleveland-Cliffs Inc., the Additional Guarantors party thereto and U.S. Bank National Association, as trustee and first lien notes collateral agent (filed as Exhibit 4.3 to Cliffs'Cliffs’ Form 8-K on August 7, 201710-Q for the period ended June 30, 2020 and incorporated herein by reference) |
| Third Supplemental Indenture, dated as of December 9, 2020, among Cleveland-Cliffs Inc., the Additional Guarantors party thereto and U.S. Bank National Association, as trustee and first lien notes collateral agent (filed herewith) |
| Fourth Supplemental Indenture, dated as of December 18, 2020, among Cleveland-Cliffs Inc., the Additional Guarantors party thereto and U.S. Bank National Association, as trustee and first lien notes collateral agent (filed herewith) |
| Form of Common Share Certificate (filed as Exhibit 4.44.1 to Cliffs’ Form 10-Q for the period ended September 30, 20172019 and incorporated herein by reference) |
| Form of Series B Participating Redeemable Preferred Stock Certificate (included in Exhibit 3.2) |
| Description of Securities Registered under Section 12 of the Securities Exchange Act of 1934 (filed herewith) |
| Material contracts |
| Amended and Restated Syndicated Facility Agreement, by and among Bank of America, N.A., as Administrative Agent and Australian Security Trustee, the Lenders that are Parties hereto, as the Lenders, Cleveland-Cliffs Inc., as Parent and a Borrower, and the Subsidiaries of Parent Party hereto, as Borrowers, dated as of February 28, 2018 (filed as Exhibit 10.1 to Cliffs’ Form 10-Q for the period ended March 31, 2018 and incorporated herein by reference) |
| * Form of Change in Control Severance Agreement (covering newly hired officers) (filed as Exhibit 10.4 to Cliffs’ Form 8-K/A on September 16, 2014 and incorporated herein by reference) |
| * Form of 2016 Change in Control Severance Agreement (filed as Exhibit 10.1 to Cliffs’ 10-Q for the period ended September 30, 2016 and incorporated herein by reference) |
| * Cleveland-Cliffs Inc. 2012 Non-Qualified Deferred Compensation Plan (effective January 1, 2012) dated November 8, 2011 (filed as Exhibit 10.1 to Cliffs’ Form 8-K on November 8, 2011 and incorporated herein by reference) |
| * Form of Director and Officer Indemnification Agreement between Cleveland-Cliffs Inc. and Directors and Officers (filed as Exhibit 10.510.2 to Cliffs’ Form 10-K10-Q for the period ended DecemberMarch 31, 20112019 and incorporated herein by reference) |
| * Cliffs Natural Resources Inc. Amended and Restated 2014 Nonemployee Directors’ Compensation Plan (filed as Exhibit 10.1 to Cliffs’ Form 8-K on May 2, 2016 and incorporated herein by reference) |
|
| |
| *Form of Restricted Shares Agreement for Nonemployee Directors (filed as Exhibit 10.1 to Cliffs’ Form 10-Q for the period ended June 30, 2018 and incorporated herein by reference) |
| *Form of Deferred Shares Agreement for Nonemployee Directors (filed as Exhibit 10.2 to Cliffs’ Form 10-Q for the period ended June 30, 2018 and incorporated herein by reference) |
| * Trust Agreement No. 1 (Amended and Restated effective June 1, 1997), dated June 12, 1997, by and between Cleveland-Cliffs Inc and KeyBank National Association, Trustee, with respect to the Cleveland-Cliffs Inc Supplemental Retirement Benefit Plan, Severance Pay Plan for Key Employees and certain executive agreements (filed as Exhibit 10.10 to Cliffs’ Form 10-K for the period ended December 31, 2011 and incorporated herein by reference) |
| * Trust Agreement No. 1 Amendments to Exhibits, effective as of January 1, 2000, by and between Cleveland-Cliffs Inc and KeyBank National Association, as Trustee (filed as Exhibit 10.11 to Cliffs’ Form 10-K for the period ended December 31, 2011 and incorporated herein by reference) |
| * First Amendment to Trust Agreement No. 1, effective September 10, 2002, by and between Cleveland-Cliffs Inc and KeyBank National Association, as Trustee (filed as Exhibit 10.12 to Cliffs’ Form 10-K for the period ended December 31, 2011 and incorporated herein by reference) |
| * Second Amendment to Trust Agreement No. 1 between Cliffs Natural Resources Inc. (f/k/a Cleveland-Cliffs Inc) and KeyBank National Association, Trustee, entered into and effective as of December 31, 2008 (filed as Exhibit 10(y) to Cliffs’ Form 10-K for the period ended December 31, 2008 and incorporated herein by reference) |
| * Third Amendment to Trust Agreement No. 1 between Cliffs Natural Resources Inc. (f/k/a Cleveland-Cliffs Inc) and KeyBank National Association, Trustee, entered into and effective as of July 28, 2014 (filed as Exhibit 10.15 to Cliffs’ Form 10-K for the period ended December 31, 2014 and incorporated herein by reference) |
| * Amended and Restated Trust Agreement No. 2, effective as of October 15, 2002, by and between Cleveland-Cliffs Inc and KeyBank National Association, Trustee, with respect to Executive Agreements and Indemnification Agreements with the Company’s Directors and certain Officers, the Company’s Severance Pay Plan for Key Employees, and the Retention Plan for Salaried Employees (filed as Exhibit 10.14 to Cliffs’ Form 10-K for the period ended December 31, 2011 and incorporated herein by reference) |
| | | | | |
| * Second Amendment to Amended and Restated Trust Agreement No. 2 between Cliffs Natural Resources Inc. (f/k/a Cleveland-Cliffs Inc) and KeyBank National Association, Trustee, entered into and effective as of December 31, 2008 (filed as Exhibit 10(aa) to Cliffs’ Form 10-K for the period ended December 31, 2008 and incorporated herein by reference) |
| * Third Amendment to Amended and Restated Trust Agreement No. 2 between Cliffs Natural Resources Inc. (f/k/a Cleveland-Cliffs Inc) and KeyBank National Association, Trustee, entered into and effective as of July 28, 2014 (filed as Exhibit 10.18 to Cliffs’ Form 10-K for the period ended December 31, 2014 and incorporated herein by reference) |
| * Trust Agreement No. 7, dated as of April 9, 1991, by and between Cliffs Natural ResourcesCleveland-Cliffs Inc and KeyBank National Association, Trustee, with respect to the Cleveland-Cliffs Inc Supplemental Retirement Benefit Plan (filed as Exhibit 10.23 to Cliffs’ Form 10-K for the period ended December 31, 2011 and incorporated herein by reference) |
| * First Amendment to Trust Agreement No. 7, by and between Cleveland-Cliffs Inc and KeyBank National Association, Trustee, dated as of March 9, 1992 (filed as Exhibit 10.24 to Cliffs’ Form 10-K for the period ended December 31, 2011 and incorporated herein by reference) |
| * Second Amendment to Trust Agreement No. 7, dated November 18, 1994, by and between Cleveland-Cliffs Inc and KeyBank National Association, Trustee (filed as Exhibit 10.25 to Cliffs’ Form 10-K for the period ended December 31, 2011 and incorporated herein by reference) |
| * Third Amendment to Trust Agreement No. 7, dated May 23, 1997, by and between Cleveland-Cliffs Inc and KeyBank National Association, Trustee (filed as Exhibit 10.26 to Cliffs’ Form 10-K for the period ended December 31, 2011 and incorporated herein by reference) |
| * Fourth Amendment to Trust Agreement No. 7, dated July 15, 1997, by and between Cleveland-Cliffs Inc and KeyBank National Association, Trustee (filed as Exhibit 10.27 to Cliffs’ Form 10-K for the period ended December 31, 2011 and incorporated herein by reference) |
| * Amendment to Exhibits to Trust Agreement No. 7, effective as of January 1, 2000, by and between Cleveland-Cliffs Inc and KeyBank National Association, Trustee (filed as Exhibit 10.28 to Cliffs’ Form 10-K for the period ended December 31, 2011 and incorporated herein by reference) |
| * Sixth Amendment to Trust Agreement No. 7 between Cliffs Natural Resources Inc. (f/k/a Cleveland-Cliffs Inc) and KeyBank National Association, Trustee, entered into and effective as of December 31, 2008 (filed as Exhibit 10(oo) to Cliffs’ Form 10-K for the period ended December 31, 2008 and incorporated herein by reference) |
|
| |
| * Seventh Amendment to Trust Agreement No. 7 between Cliffs Natural Resources Inc. (f/k/a Cleveland-Cliffs Inc) and KeyBank National Association, Trustee, entered into and effective as of July 28, 2014 (filed as Exhibit 10.34 to Cliffs’ Form 10-K for the period ended December 31, 2014 and incorporated herein by reference) |
| * Trust Agreement No. 10, dated as of November 20, 1996, by and between Cleveland-Cliffs Inc and KeyBank National Association, Trustee, with respect to the Cleveland-Cliffs Inc Nonemployee Directors’ Compensation Plan (filed as Exhibit 10.36 to Cliffs’ Form 10-K for the period ended December 31, 2011 and incorporated herein by reference) |
| *First Amendment to Trust Agreement No. 10 between Cliffs Natural Resources Inc. (f/k/a Cleveland-Cliffs Inc) and KeyBank National Association, Trustee, entered into and effective as of December 31, 2008 (filed as Exhibit 10(ww) to Cliffs’ Form 10-K for the period ended February 26, 2009 and incorporated herein by reference) |
| * Second Amendment to Trust Agreement No. 10 between Cliffs Natural Resources Inc. (f/k/a Cleveland-Cliffs Inc) and KeyBank National Association, Trustee, entered into and effective as of July 28, 2014 (filed as Exhibit 10.45 to Cliffs’ Form 10-K for the period ended December 31, 2014 and incorporated herein by reference) |
| *Severance Agreement and Release, by and between P. Kelly Tompkins and Cleveland-Cliffs Inc., effective December 31, 2017 (filed as Exhibit 10.36 to Cliffs' Form 10-K for period ended December 31, 2017 and incorporated herein by reference) |
| * Letter Agreement, by and between Lourenco Goncalves and Cliffs Natural Resources Inc., signed as of September 11, 2014 (filed as Exhibit 10.1 to Cliffs’ Form 8-K/A on September 16, 2014 and incorporated herein by reference) |
| * Cleveland-Cliffs Inc and Subsidiaries Management Performance Incentive Plan Summary, effective January 1, 2004 (filed as Exhibit 10.47 to Cliffs’ Form 10-K for the period ended December 31, 2011 and incorporated herein by reference) |
| * Cliffs Natural Resources Inc. 2017 Executive Management Performance Incentive Plan effective January 1, 2017 (filed as Exhibit 10.2 to Cliffs' Form 8-K on April 27, 2017 and incorporated herein by reference) |
| * Cliffs Natural Resources Inc. Amended and Restated 2012 Incentive Equity Plan (filed as Exhibit 10.1 to Cliffs’ Form 8-K on August 4, 2014 and incorporated herein by reference) |
| * Form of Cliffs Natural Resources Inc. Amended and Restated 2012 Incentive Equity Plan Performance Unit Award Memorandum (2014 Grant) and Performance Unit Award Agreement (filed as Exhibit 10.3 to Cliffs’ Form 8-K/A on September 16, 2014 and incorporated herein by reference) |
| * Form of Cliffs Natural Resources Inc. Amended and Restated 2012 Incentive Equity Plan Non-Qualified Stock Option Award Memorandum (3-Year Vesting – January 2015 Grant) and Stock Option Award Agreement (filed as Exhibit 10.69 to Cliffs’ Form 10-K for the period ended December 31, 2014 and incorporated herein by reference) |
| | | | | |
| * Cliffs Natural Resources Inc. 2015 Equity and Incentive Compensation Plan (filed as Exhibit 10.1 to Cliffs’ Form 8-K on May 21, 2015 and incorporated herein by reference) |
| * Form of Cliffs Natural Resources Inc. 2015 Equity and Incentive Compensation Plan Restricted Stock Unit Award Memorandum (Vesting December 31, 2018) and Restricted Stock Unit Award Agreement (filed as Exhibit 10.1 to Cliffs’ Form 10-Q for the period ended March 31, 2016 and incorporated herein by reference) |
| * Form of Cliffs Natural Resources Inc. 2015 Equity and Incentive Compensation Plan Cash Incentive Award Memorandum (TSR) (Vesting December 31, 2018) and Cash Incentive Award Agreement (TSR) (filed as Exhibit 10.2 to Cliffs’ Form 10-Q for the period ended March 31, 2016 and incorporated herein by reference) |
| * Form of Cliffs Natural Resources Inc. 2015 Equity and Incentive Compensation Plan Cash Incentive Award Memorandum (EBITDA) (January 1, 20XX - December 31, 20XX) and Cash Incentive Award Agreement (EBITDA) (filed as Exhibit 10.3 to Cliffs’ Form 10-Q for the period ended March 31, 2016 and incorporated herein by reference) |
| * Form of Cliffs Natural Resources Inc. 2015 Equity and Incentive Compensation Plan, as Amended, Performance Share Award Memorandum and Performance Share Award Agreement (filed as Exhibit 10.3 to Cliffs’ Form 10-Q for the period ended June 30, 2017 and incorporated herein by reference) |
| * Cliffs Natural Resources Inc. Amended and Restated 2015 Equity and Incentive Compensation Plan (filed as Exhibit 10.1 to Cliffs’ Form 8-K on April 27, 2017 and incorporated herein by reference) |
| * Form of Cliffs Natural Resources Inc. Amended and Restated 2015 Equity and Incentive Compensation Plan Performance Share Award Memorandum and Performance Share Award Agreement (filed as Exhibit 10.4 to Cliffs’ Form 10-Q for the period ended June 30, 2017 and incorporated herein by reference) |
| * Form of Cliffs Natural Resources Inc. Amended and Restated 2015 Equity and Incentive Compensation Plan Restricted Stock Unit Award Memorandum and Restricted Stock Unit Award Agreement (filed as Exhibit 10.5 to Cliffs’ Form 10-Q for the period ended June 30, 2017 and incorporated herein by reference) |
|
| |
| * Form of Cleveland-Cliffs Inc. Amended and Restated 2015 Equity and Incentive Compensation Plan Restricted Stock Unit Award Memorandum (Vesting December 31, 2020) and Restricted Stock Unit Award Agreement (filed as Exhibit 10.2 to Cliffs’ Form 10-Q for the period ended March 31, 2018 and incorporated herein by reference) |
| * Form of Cleveland-Cliffs Inc. Amended and Restated 2015 Equity and Incentive Compensation Plan Performance Share Award Memorandum and Performance Share Award Agreement (filed as Exhibit 10.3 to Cliffs’ Form 10-Q for the period ended March 31, 2018 and incorporated herein by reference) |
| * Form of Cleveland-Cliffs Inc. Amended and Restated 2015 Equity and Incentive Compensation Plan Cash Incentive Award Memorandum (TSR) (Vesting December 31, 2020) and Cash Incentive Award Agreement (TSR) (filed as Exhibit 10.4 to Cliffs’ Form 10-Q for the period ended March 31, 2018 and incorporated herein by reference) |
| * Cliffs Natural Resources Inc. Supplemental Retirement Benefit Plan (as Amended and Restated effective December 1, 2006) dated December 31, 2008 (filed as Exhibit 10(mmm) to Cliffs’ Form 10-K for the period ended December 31, 2008 and incorporated herein by reference) |
| * Cliffs Natural ResourcesAsset-Based Revolving Credit Agreement, dated as of March 13, 2020, among Cleveland-Cliffs Inc. 2015 Employee Stock Purchase Plan, the lenders party thereto from time to time and Bank of America, N.A., as administrative agent (filed as Exhibit 4.410.1 to Cliffs’ Registration Statement on Form S-8 on August 20, 201510-Q for the period ended March 31, 2020 and incorporated herein by reference) |
| ** Pellet Sale and PurchaseFirst Amendment to Asset-Based Revolving Credit Agreement, effectivedated as of October 31, 2016, byMarch 27, 2020, among Cleveland-Cliffs Inc., the lenders party thereto from time to time and among Cliffs Natural Resources Inc.Bank of America, N.A., The Cleveland-Cliffs Iron Company and Cliffs Mining Company and ArcelorMittal USA LLCas administrative agent (filed as Exhibit 10.7210.2 to Cliffs’ Registration Statement on Form S-1/A No. 333-212054 on August 4, 201610-Q for the period ended March 31, 2020 and incorporated herein by reference) |
| ** Amended and Restated Pellet Sale and PurchaseSecond Amendment to Asset-Based Revolving Credit Agreement, effectivedated as of December 31, 2015,9, 2020, among Cleveland-Cliffs Inc., the lenders party thereto from time to time and Bank of America, N.A., as administrative agent (filed herewith) |
| Investor Rights Agreement, dated as of December 9, 2020, by and among Thebetween Cleveland-Cliffs Iron Company, Cliffs Mining CompanyInc. and AK Steel CorporationArcelorMittal S.A. (filed as Exhibit 10.5910.1 to Cliffs’Cliffs' Form 10-K/A for the period ended8-K on December 31, 20179, 2020 and incorporated herein by reference) |
| ** Pellet Sale and Purchase Agreement, effective as of January 1, 2014, by and among Cliffs Mining Company (f/k/a Cliffs Sales Company) and AK Steel Corporation (filed herewith) |
| Subsidiaries of the Registrant (filed herewith) |
| Schedule of the obligated group, including the parent and issuer and the subsidiary guarantors that have guaranteed the obligations under the 4.875% 2024 Senior Secured Notes, the 5.75% 2025 Senior Notes, the 6.375% 2025 Senior Notes, the 6.75% 2026 Senior Secured Notes, the 5.875% 2027 Senior Notes, the 7.00% 2027 Senior Notes and the 9.875% 2025 Senior Secured Notes issued by Cleveland-Cliffs Inc. (filed herewith) |
| Consent of Independent Registered Public Accounting Firm (filed herewith) |
| Power of Attorney (filed herewith) |
| Certification Pursuant to 15 U.S.C. Section 7241, as Adopted Pursuant to Section 302 of the Sarbanes-Oxley Act of 2002, signed and dated by Lourenco Goncalves as of February 8, 201926, 2021 (filed herewith) |
| Certification Pursuant to 15 U.S.C. Section 7241, as Adopted Pursuant to Section 302 of the Sarbanes-Oxley Act of 2002, signed and dated by Timothy K. FlanaganKeith A. Koci as of February 8, 201926, 2021 (filed herewith) |
| Certification Pursuant to 18 U.S.C. Section 1350, as Adopted Pursuant to Section 906 of the Sarbanes-Oxley Act of 2002, signed and dated by Lourenco Goncalves, Chairman, President and Chief Executive Officer of Cleveland-Cliffs Inc., as of February 8, 201926, 2021 (filed herewith) |
| Certification Pursuant to 18 U.S.C. Section 1350, as Adopted Pursuant to Section 906 of the Sarbanes-Oxley Act of 2002, signed and dated by Timothy K. Flanagan,Keith A. Koci, Executive Vice President, Chief Financial Officer of Cleveland-Cliffs Inc., as of February 8, 201926, 2021 (filed herewith) |
| Mine Safety Disclosures (filed herewith) |
| 101 | Schedule II – ValuationThe following financial information from Cleveland-Cliffs Inc.'s Annual Report on Form 10-K for the year ended December 31, 2020 formatted in Inline XBRL (Extensible Business Reporting Language) includes: (i) the Statements of Consolidated Financial Position, (ii) the Statements of Consolidated Operations, (iii) the Statements of Consolidated Comprehensive Income, (iv) the Statements of Consolidated Cash Flows, (v) the Statements of Consolidated Changes in Equity, and Qualifying Accounts (filed herewith)(vi) Notes to the Consolidated Financial Statements. |
101.INS104 | XBRL Instance Document |
101.SCH | XBRL Taxonomy Extension Schema Document |
101.CAL | XBRL Taxonomy Extension Calculation Linkbase Document |
101.DEF | XBRL Taxonomy Extension Definition Linkbase Document |
101.LAB | XBRL Taxonomy Extension Label Linkbase Document |
101.PRE | XBRL Taxonomy Extension Presentation Linkbase DocumentThe cover page from this Annual Report on Form 10-K, formatted in Inline XBRL. |
_______________
* Indicates management contract or other compensatory arrangement.
| |
** | Confidential treatment requested and/or approved as to certain portions, which portions have been omitted and filed separately with the Securities and Exchange Commission. |
| |
*** | Certain immaterial schedules and exhibits to this exhibit have been omitted pursuant to the provisions of Regulation S-K, Item 601(b)(2)** Certain immaterial schedules and exhibits to this exhibit have been omitted pursuant to the provisions of Regulation S-K, Item 601(a)(5). A copy of any of the omitted schedules and exhibits will be furnished to the Securities and Exchange Commission upon request. |
(c) Exhibits listed in Item 15(a)(3) above are incorporated herein by reference.
(d) The schedule listed above in Item 15(a)(1) and (2) is attached as Exhibit 99(a) and incorporated herein by reference.
|
| | | | |
| Item 16. | Form 10-K Summary |
None.
SIGNATURES
Pursuant to the requirements of Section 13 or 15(d) of the Securities Exchange Act of 1934, the Registrantregistrant has duly caused this report to be signed on its behalf by the undersigned, thereunto duly authorized. |
| | | | | | | | | | | | | | | | | | | | | | |
| | | CLEVELAND-CLIFFS INC. |
| | | | |
| | | By: | | /s/ R. C. CebulaKimberly A. Floriani |
| | | | | Name: | | R. Christopher CebulaKimberly A. Floriani |
| | | | | Title: | | Vice President, Corporate Controller & |
| Date: | February 8, 201926, 2021 | | | | | | Chief Accounting Officer |
Pursuant to the requirements of the Securities Exchange Act of 1934, this report has been signed below by the following persons on behalf of the Registrantregistrant and in the capacities and on the dates indicated. |
| | | | | | | | | | | | | | | | |
| Signatures | Title | Date |
| | |
| /s/ C. L. Goncalves | Chairman, President and | February 8, 2019 |
C. L. Goncalves |
Chief Executive Officer | |
|
(Principal Executive Officer) | February 26, 2021 |
| C. L. Goncalves |
|
/s/ T. K. FlanaganA. Koci | Executive Vice President, | February 8, 2019 |
T. K. Flanagan |
Chief Financial Officer | |
|
(Principal Financial Officer) | February 26, 2021 |
| K. A. Koci |
|
/s/ R. C. CebulaK. A. Floriani | Vice President, Corporate Controller
& | February 8, 2019 |
R. C. Cebula | Chief Accounting Officer | |
|
(Principal Accounting Officer) | February 26, 2021 |
* | Director | February 8, 2019K. A. Floriani |
|
| * | Director | February 26, 2021 |
| J. T. Baldwin | | |
| * | Director | February 8, 201926, 2021 |
| R. P. Fisher, Jr. | | |
| * | Director | February 8, 201926, 2021 |
| W. K. Gerber |
| * | Director | February 26, 2021 |
| S. M. Green | | |
| * | Director | N/AFebruary 26, 2021 |
| M. A. Harlan | | |
| * | Director | N/AFebruary 26, 2021 |
| R. S. Michael, III |
| * | Director | February 26, 2021 |
| J. L. Miller | | |
| * | Director | February 8, 201926, 2021 |
J. A. Rutkowski, Jr. | | |
* | Director | February 8, 2019 |
| E. M. Rychel | | |
| * | Director | February 8, 201926, 2021 |
M. D. Siegal | | G. Stoliar |
| * | Director | February 8, 201926, 2021 |
G. Stoliar | | |
* | Director | February 8, 2019 |
| D. C. Taylor |
| * | Director | February 26, 2021 |
| A. M. Yocum |
* The undersigned, by signing his name hereto, does sign and execute this Annual Report on Form 10-K pursuant to a Power of Attorney executed on behalf of the above-indicated officers and directors of the registrant and filed herewith as Exhibit 24 on behalf of the registrant.
|
| | | | |
| By: | /s/ T. K. FlanaganA. Koci |
| (T. K. Flanagan,A. Koci, as Attorney-in-Fact) |