UNITED STATES
SECURITIES AND EXCHANGE COMMISSION
Washington, D.C. 20549
FORM 10-K
| | | | | | | | | | | |
| ☒ | ANNUAL REPORT PURSUANT TO SECTION 13 OR 15(d) OF THE SECURITIES EXCHANGE ACT OF 1934 | |
For the fiscal year ended December 31, 20202023
OR
| | | | | | | | | | | |
| ☐ | TRANSITION REPORT PURSUANT TO SECTION 13 OR 15(d) OF THE SECURITIES EXCHANGE ACT OF 1934 | |
For the transition period from to
Commission File Number: 1-8944
CLEVELAND-CLIFFS INC.
(Exact name of registrant as specified in its charter)
| | | | | | | | | | | | | | | | | | | | |
| Ohio | | 34-1464672 | |
| (State or Other Jurisdiction of
Incorporation or Organization) | | (I.R.S. Employer
Identification No.) | |
| | | | | | |
| 200 Public Square, | Cleveland, | Ohio | | 44114-2315 | |
| (Address of Principal Executive Offices) | | (Zip Code) | |
Registrant’s telephone number, including area code: (216) 694-5700
Securities registered pursuant to Section 12(b) of the Act:
| | | | | | | | | | | | | | |
| Title of each class | | Trading Symbol(s) | | Name of each exchange on which registered |
| Common Shares, par value $0.125 per share | | CLF | | New York Stock Exchange |
Securities registered pursuant to section 12(g) of the Act: NONE
Indicate by check mark if the registrant is a well-known seasoned issuer, as defined in Rule 405 of the Securities Act. Yes ☒ NO ☐
Indicate by check mark if the registrant is not required to file reports pursuant to Section 13 or Section 15(d) of the Act. Yes ☐ No ☒
Indicate by check mark whether the registrant (1) has filed all reports required to be filed by Section 13 or 15(d) of the Securities Exchange Act of 1934 during the preceding 12 months (or for such shorter period that the registrant was required to file such reports), and (2) has been subject to such filing requirements for the past 90 days. Yes ☒ No ☐
Indicate by check mark whether the registrant has submitted electronically every Interactive Data File required to be submitted pursuant to Rule 405 of Regulation S-T (§232.405 of this chapter) during the preceding 12 months (or for such shorter period that the registrant was required to submit such files). Yes ☒ No ☐
Indicate by check mark whether the registrant is a large accelerated filer, an accelerated filer, a non-accelerated filer, a smaller reporting company, or an emerging growth company. See the definitions of “large accelerated filer,” “accelerated filer,” “smaller reporting company,” and "emerging growth company" in Rule 12b-2 of the Exchange Act.
| | | | | | | | | | | |
| Large accelerated filer | ☒ | Accelerated filer | ☐ |
| Non-accelerated filer | ☐ | Smaller reporting company | ☐ |
| | Emerging growth company | ☐ |
If an emerging growth company, indicate by check mark if the registrant has elected not to use the extended transition period for complying with any new or revised financial accounting standards provided pursuant to Section 13(a) of the Exchange Act. ☐
Indicate by check mark whether the registrant has filed a report on and attestation to its management’s assessment of the effectiveness of its internal control over financial reporting under Section 404(b) of the Sarbanes-Oxley Act (15 U.S.C. 7262(b)) by the registered public accounting firm that prepared or issued its audit report. ☒
If securities are registered pursuant to Section 12(b) of the Act, indicate by check mark whether the financial statements of the registrant included in the filing reflect the correction of an error to previously issued financial statements. ☐
Indicate by check mark whether any of those error corrections are restatements that required a recovery analysis of incentive-based compensation received by any of the registrant's executive officers during the relevant recovery period pursuant to §240.10D-1(b). ☐
Indicate by check mark whether the registrant is a shell company (as defined in Rule 12b-2 of the Act). Yes ☐ No ☒
As of June 30, 2020,2023, the aggregate market value of the voting and non-voting common shares held by non-affiliates of the registrant, based on the closing price of $5.52$16.76 per share as reported on the New York Stock Exchange — Composite Index, was $2,171,029,299$8,390,625,983 (excluded from this figure are the voting shares beneficially owned by the registrant’s officers and directors).
The number of shares outstanding of the registrant’s common shares, par value $0.125 per share, was 498,885,558498,289,476 as of February 24, 2021.8, 2024.
DOCUMENTS INCORPORATED BY REFERENCE
Portions of the registrant’s proxy statement for its 20212024 annual meeting of shareholders are incorporated by reference into Part III.
TABLE OF CONTENTS
| | | | | | | | | | | | | | | | | |
| | | | | |
| | | Page Number |
| | | | | |
| DEFINITIONS | | | |
| | | |
| PART I | | | |
| ItemITEM 1. | BusinessBUSINESS | | | |
| | Information About Our Executive Officers | | | |
| ItemITEM 1A. | Risk FactorsRISK FACTORS | | | |
| ItemITEM 1B. | Unresolved Staff CommentsUNRESOLVED STAFF COMMENTS | | | |
| ITEM 1C. | ItemCYBERSECURITY | | | |
| ITEM 2. | PropertiesPROPERTIES | | | |
| ItemITEM 3. | Legal ProceedingsLEGAL PROCEEDINGS | | | |
| ITEM 4. | MINE SAFETY DISCLOSURES | | | |
| | | | | |
| PART II | | | |
| ITEM 5. | MARKET FOR REGISTRANT'S COMMON EQUITY, RELATED STOCKHOLDER MATTERS AND ISSUER PURCHASES OF EQUITY SECURITIES | | | |
| ITEM 6. | [Reserved] | | | |
| Item 4.ITEM 7. | Mine Safety DisclosuresMANAGEMENT'S DISCUSSION AND ANALYSIS OF FINANCIAL CONDITION AND RESULTS OF OPERATIONS | | | |
| | | | | |
PART II | | | |
| Item 5.ITEM 7A. | Market for Registrant's Common Equity, Related Stockholder Matters and Issuer Purchases of Equity SecuritiesQUANTITATIVE AND QUALITATIVE DISCLOSURES ABOUT MARKET RISK | | | |
| Item 6.ITEM 8. | Selected Financial DataFINANCIAL STATEMENTS AND SUPPLEMENTARY DATA | | | |
| Item 7.ITEM 9. | Management's Discussion and Analysis of Financial Condition and Results of OperationsCHANGES IN AND DISAGREEMENTS WITH ACCOUNTANTS ON ACCOUNTING AND FINANCIAL DISCLOSURE | | | |
| Item 7A.ITEM 9A. | Quantitative and Qualitative Disclosures About Market RiskCONTROLS AND PROCEDURES | | | |
| Item 8.ITEM 9B. | Financial Statements and Supplementary DataOTHER INFORMATION | | | |
| Item 9.ITEM 9C. | Changes in and Disagreements With Accountants on Accounting and Financial DisclosureDISCLOSURE REGARDING FOREIGN JURISDICTIONS THAT PREVENT INSPECTIONS | | | |
| | Item 9A. | Controls and Procedures | | |
| Item 9B. | Other Information | | | |
| | | |
| PART III | | | |
| ItemITEM 10. | Directors, Executive Officers and Corporate GovernanceDIRECTORS, EXECUTIVE OFFICERS AND CORPORATE GOVERNANCE | | | |
| ItemITEM 11. | Executive CompensationEXECUTIVE COMPENSATION | | | |
| ItemITEM 12. | Security Ownership of Certain Beneficial Owners and Management and Related Stockholder MattersSECURITY OWNERSHIP OF CERTAIN BENEFICIAL OWNERS AND MANAGEMENT AND RELATED STOCKHOLDER MATTERS | | | |
| ItemITEM 13. | Certain Relationships and Related Transactions, and Director IndependenceCERTAIN RELATIONSHIPS AND RELATED TRANSACTIONS, AND DIRECTOR INDEPENDENCE | | | |
| ItemITEM 14. | Principal Accountant Fees and ServicesPRINCIPAL ACCOUNTANT FEES AND SERVICES | | | |
| | | | | |
| PART IV | | | |
| ItemITEM 15. | Exhibits and Financial Statement SchedulesEXHIBITS AND FINANCIAL STATEMENT SCHEDULES | | | |
| ItemITEM 16. | FormFORM 10-K SummarySUMMARY | | | |
| | | |
| SIGNATURES | | | |
DEFINITIONS
The following abbreviations or acronyms are used in the text. References in this report to the “Company,” “we,” “us,” “our”“our,” "Cleveland-Cliffs" and “Cliffs” are to Cleveland-Cliffs Inc. and subsidiaries, collectively. References to “$” is to United States currency.
| | | | | | | | |
| Abbreviation or acronym | | Term |
| 4.625% 2029 Senior Notes | | 4.625% Senior Guaranteed Notes due 2029 issued by Cleveland-Cliffs Inc. on February 17, 2021 in an aggregate principal amount of $500 million |
| 4.875% 2031 Senior Notes | | 4.875% Senior Guaranteed Notes due 2031 issued by Cleveland-Cliffs Inc. on February 17, 2021 in an aggregate principal amount of $500 million |
| 2012 Amended Equity Plan | | Cliffs Natural Resources Inc. 2012 Incentive Equity Plan, as amended or amended and restated from time to time |
| | |
| 2021 Equity Plan | | Cleveland-Cliffs Inc. 2021 Equity and Incentive Compensation Plan |
| A&R 2015 Equity Plan | | Cliffs Natural Resources Inc. Amended and Restated 2015 Equity and Incentive Compensation Plan |
ABL Amendment | | Second Amendment to Asset-Based Revolving Credit Agreement, dated as of December 9, 2020, among Cleveland-Cliffs Inc., the lenders party thereto from time to time and Bank of America, N.A., as administrative agent |
ABL Facility | | Asset-Based Revolving Credit Agreement, dated as of March 13, 2020, among Cleveland-Cliffs Inc., the lenders party thereto from time to time and Bank of America, N.A., as administrative agent, as amended as of March 27, 2020, and December 9, 2020, December 17, 2021, and June 9, 2023, and as may be further amended from time to time |
Acquisitions | | The AK Steel Merger and AM USA Transaction, together |
| Adjusted EBITDA | | EBITDA, excluding certain items such as EBITDA of noncontrolling interests, extinguishment of debt, severance, acquisition-related costs, amortization of inventory step-up, impacts of discontinued operationsexpenses and intersegment corporate allocations of selling, generaladjustments, goodwill impairment, asset impairment and administrative costsother, net |
| AG | | Autogenous grinding |
| AHSS | | Advanced high-strength steel |
AK Coal | | AK Coal Resources, Inc., an indirect, wholly owned subsidiary of AK Steel, and related coal mining assets |
AK Steel | | AK Steel Holding Corporation (n/k/a Cleveland-Cliffs Steel Holding Corporation) and its consolidated subsidiaries, including AK Steel Corporation (n/k/a Cleveland-Cliffs Steel Corporation), its direct, wholly owned subsidiary, collectively, unless stated otherwise or the context indicates otherwise |
AK Steel Merger | | The merger of Merger Sub with and into AK Steel, with AK Steel surviving the merger as a wholly owned subsidiary of Cleveland-Cliffs Inc., subject to the terms and conditions set forth in the Merger Agreement, consummated on March 13, 2020 |
AK Steel Merger Agreement | | Agreement and Plan of Merger, dated as of December 2, 2019, among Cleveland-Cliffs Inc., AK Steel and Merger Sub |
| AM USA Transaction | | The acquisition of ArcelorMittal USA, consummated on December 9, 2020 and the entry into the ABL Amendment, together |
AM USA Transaction Agreement | | Transaction Agreement, dated as of September 28, 2020, by and between Cleveland-Cliffs Inc. and ArcelorMittal S.A. |
AMT | | Alternative minimum tax |
| AOCI | | Accumulated other comprehensive income (loss) |
APBO | | Accumulated postretirement benefit obligation |
| ArcelorMittal | | ArcelorMittal S.A., a company organized under the laws of Luxembourg and the former ultimate parent company of ArcelorMittal USA |
| ArcelorMittal USA | | Substantially all of the operations of the former ArcelorMittal USA LLC, its subsidiaries and certain affiliates, and Kote and Tek, collectively |
| ASC | | Accounting Standards Codification |
ASTM | | American Society for Testing and Materials |
| ASU | | Accounting Standards Update |
BART | | Best available retrofit technology |
BNSF | | Burlington Northern Santa Fe, LLC |
| Board | | The Board of Directors of Cleveland-Cliffs Inc. |
CARES ActBOF | | Coronavirus Aid, Relief, and Economic Security ActBasic oxygen furnace |
CECL | | Current expected credit losses |
| CERCLA | | Comprehensive Environmental Response, Compensation and Liability Act of 1980 |
CFRCHIPS Act | | CostCreating Helpful Incentives to Produce Semiconductors and freightScience Act of 2022 |
| Clean Water Act | | Federal Water Pollution Control Act |
| CN | | Canadian National Railway Company |
| Compensation Committee | | Compensation and Organization Committee of the Board |
CO2e | | Carbon dioxide equivalent |
| COVID-19 | | A novel strain of coronavirus that the World Health Organization declared a global pandemic in March 2020 |
| Directors’ Plan | | Cliffs Natural ResourcesCleveland-Cliffs Inc. Amended and Restated 20142021 Nonemployee Directors’ Compensation Plan |
| Dodd-Frank Act | | Dodd-Frank Wall Street Reform and Consumer Protection Act |
| DOE | | U.S. Department of Energy |
| DR-grade | | Direct reduction-grade |
| EAF | | Electric arc furnace |
| EBITDA | | Earnings before interest, taxes, depreciation and amortization |
EDC Revolving Facility | | Credit Facility Agreement, dated November 9, 2020, among Export Development Canada and Cleveland-Cliffs Inc.'s indirect, wholly owned subsidiaries, Fleetwood Metal Industries Inc. and The Electromac Group Inc. |
EGLE | | Michigan Department of Environment, Great Lakes and Energy |
| | | | | | | | |
Abbreviation or acronym | | Term |
| Empire | | Iron ore mining property owned by Empire Iron Mining Partnership, an indirect, wholly owned subsidiary of Cliffs |
| EPA | | U.S. Environmental Protection Agency |
| EPS | | Earnings per share |
| ERISA | | Employee Retirement Income Security Act of 1974, as amended |
| EV | | Electric vehicle |
| Exchange Act | | Securities Exchange Act of 1934, as amended |
| FASB | | Financial Accounting Standards Board |
| Fe | | Iron |
| | | | | | | | |
| Abbreviation or acronym | | Term |
| FeT | | Total iron |
FILO | | First-in, last-out |
| FIP | | Federal implementation plan |
FMSH ActFourth ABL Amendment | | Federal Mine Safety and Health Act of 1977, as amended |
Former ABL Facility | | Amended and Restated Syndicated FacilityFourth Amendment to Asset-Based Revolving Credit Agreement, dated as of March 30, 2015,June 9, 2023, among Cleveland-Cliffs Inc., the subsidiary borrowerslenders party thereto the lenders party theretofrom time to time and Bank of America, N.A., as administrative agent |
| FPT | | Ferrous Processing and Trading Company, including certain related entities |
| FPT Acquisition | | The purchase of FPT, subject to the terms and conditions set forth in the FPT Acquisition Agreement |
| FPT Acquisition Agreement | | Securities Purchase Agreement, dated as of October 8, 2021, by and between Cleveland-Cliffs Inc. and Anthony Soave Revocable Trust u/a/d January 14, 1987, as amended and restated as of February 28, 2018, and as further amended, which was terminated on March 13, 2020 in connection with entering into the ABL Facility |
| GAAP | | Accounting principles generally accepted in the United States |
| GHG | | Greenhouse gas |
| GOES | | Grain oriented electrical steel |
H/EVHAP | | Hybrid/electric vehicleHazardous air pollutant |
| HBI | | Hot briquetted iron |
| Hibbing | | Iron ore mining property owned by Hibbing Taconite Company, an unincorporated joint venture between subsidiaries of Cliffs and U.S. Steel |
| HRC | | Hot-rolled coil steel |
IRBHVAC | | Heating, ventilation and air conditioning equipment |
| IAM | | Industrial Revenue BondInternational Association of Machinists and Aerospace Workers |
| Inflation Reduction Act | | Inflation Reduction Act of 2022 |
| Infrastructure and Jobs Act | | Infrastructure Investment and Jobs Act of 2021 |
| IRC | | U.S. Internal Revenue Code of 1986, as amended |
| ISO | | International Organization for Standardization |
| IT | | Information technology |
| JSW Steel | | JSW Steel (USA) Inc. and JSW Steel USA Ohio, Inc., collectively |
| Kote and Tek | | I/NCleveland-Cliffs Kote L.P. (n/k/a Cleveland-Cliffs Kote L.P.) and I/N Tek L.P. (n/k/a Cleveland-Cliffs Tek L.P.), former joint ventures between subsidiaries of the former ArcelorMittal USA LLC and Nippon Steel Corporationcollectively |
| LIBOR | | London Interbank Offered Rate |
| LIFO | | Last-in, first-out |
| LoM | | Life-of-mine |
| Long ton (lt) | | 2,240 pounds |
LS&IMetric ton (mt) | | Lake Superior & Ishpeming Railroad Company |
Merger Sub | | Pepper Merger Sub Inc., a direct, wholly owned subsidiary of Cliffs prior to the AK Steel Merger |
Metric ton | | 2,205 pounds |
| Minorca | | Iron ore mining property owned by Cleveland-Cliffs Minorca Mine Inc. (f/k/a ArcelorMittal Minorca Mine Inc.), an
|
| MMBtu | | Million British Thermal Units |
| MPCA | | Minnesota Pollution Control Agency |
| MSHA | | U.S. Mine Safety and Health Administration of the U.S. Department of Labor |
| NAV | | Net asset value |
| Net ton (nt) | | 2,000 pounds |
| NOL | | Net operating loss |
NOVs | | Notices of violations |
NOx
| | Nitrogen oxide |
| NOES | | Non-oriented electrical steel |
| Northshore | | Iron ore mining property owned by Northshore Mining Company, a direct, wholly owned subsidiary of Cliffs |
| NPDES | | National Pollutant Discharge Elimination System, authorized by the Clean Water Act |
NYSE | | New York Stock Exchange |
| OPEB | | Other postretirement benefits |
| OSHA | | Occupational Safety and Health Administration of the U.S. Department of Labor |
| PBO | | Projected benefit obligation
PHS | | Press-hardened steel |
| Platts 62% price | | Platts IODEX 62% Fe Fines CFR North China |
PPIQA/QC | | Producer Price IndicesQuality assurance/quality control |
Precision PartnersQP | | PPHC Holdings, LLC, an indirect, wholly owned subsidiaryQualified person, within the meaning set forth in Item 1300 of AK Steel, and its subsidiaries, collectively, unless stated otherwise or the context indicates otherwise |
RCRA | | Resource Conservation and Recovery ActRegulation S-K |
| RI/FS | | Remedial Investigation/Feasibility Study |
| | | | | | | | |
Abbreviation or acronym | | Term |
ROM | | Run-of-mine coal |
| S&P | | Standard & Poor's |
| SEC | | U.S. Securities and Exchange Commission |
| Section 232 | | Section 232 of the Trade Expansion Act of 1962 (as amended by the Trade Act of 1974) |
| Securities Act | | Securities Act of 1933, as amended |
| | | | | | | | |
SIPAbbreviation or acronym | | Term |
| SLR | | State Implementation PlanSLR Consulting US LLC (f/k/a SLR International Corporation) |
| SOFR | | Secured Overnight Financing Rate |
| STRIPS | | Separate Trading of Registered Interest and Principal of Securities |
| SunCoke Middletown | | Middletown Coke Company, LLC, a subsidiary of SunCoke Energy, Inc. |
| Tilden | | Iron ore mining property owned by Tilden Mining Company L.C., an indirect, wholly owned subsidiary of Cliffs |
| TMDL | | Total maximum daily load |
| Tooling and Stamping | | Cleveland-Cliffs Tooling and Stamping Holdings LLC, an indirect, wholly owned subsidiary of Cliffs, together with its subsidiaries |
| Topic 805 | | ASC Topic 805, Business Combinations |
| Topic 815 | | ASC Topic 815, Derivatives and Hedging |
| TSR | | Total shareholder return |
| Tubular Components | | Cleveland-Cliffs Tubular Components LLC, (f/k/a AK Tube LLC), an indirect, wholly owned subsidiary of AKCliffs |
| U.S. | | United States of America |
| U.S. Steel | | United States Steel Corporation and its subsidiaries, collectively, unless stated otherwise or the context indicates otherwise |
| UAW | | United Auto Workers |
| United Taconite | | Iron ore mining property owned by United Taconite LLC, an indirect, wholly owned subsidiary of Cliffs |
U.S. | | United States of America |
U.S. Steel | | U.S. Steel Corporation and its subsidiaries, collectively, unless stated otherwise or the context indicates otherwise |
| USMCA | | United States-Mexico-Canada Agreement |
| USW | | United Steelworkers |
| VEBA | | Voluntary employee benefit association trusts |
| VIE | | Variable interest entity |
| WLT | | Wet long ton |
PART I
| | |
| | |
ItemITEM 1. | Business BUSINESS |
IntroductionINTRODUCTION
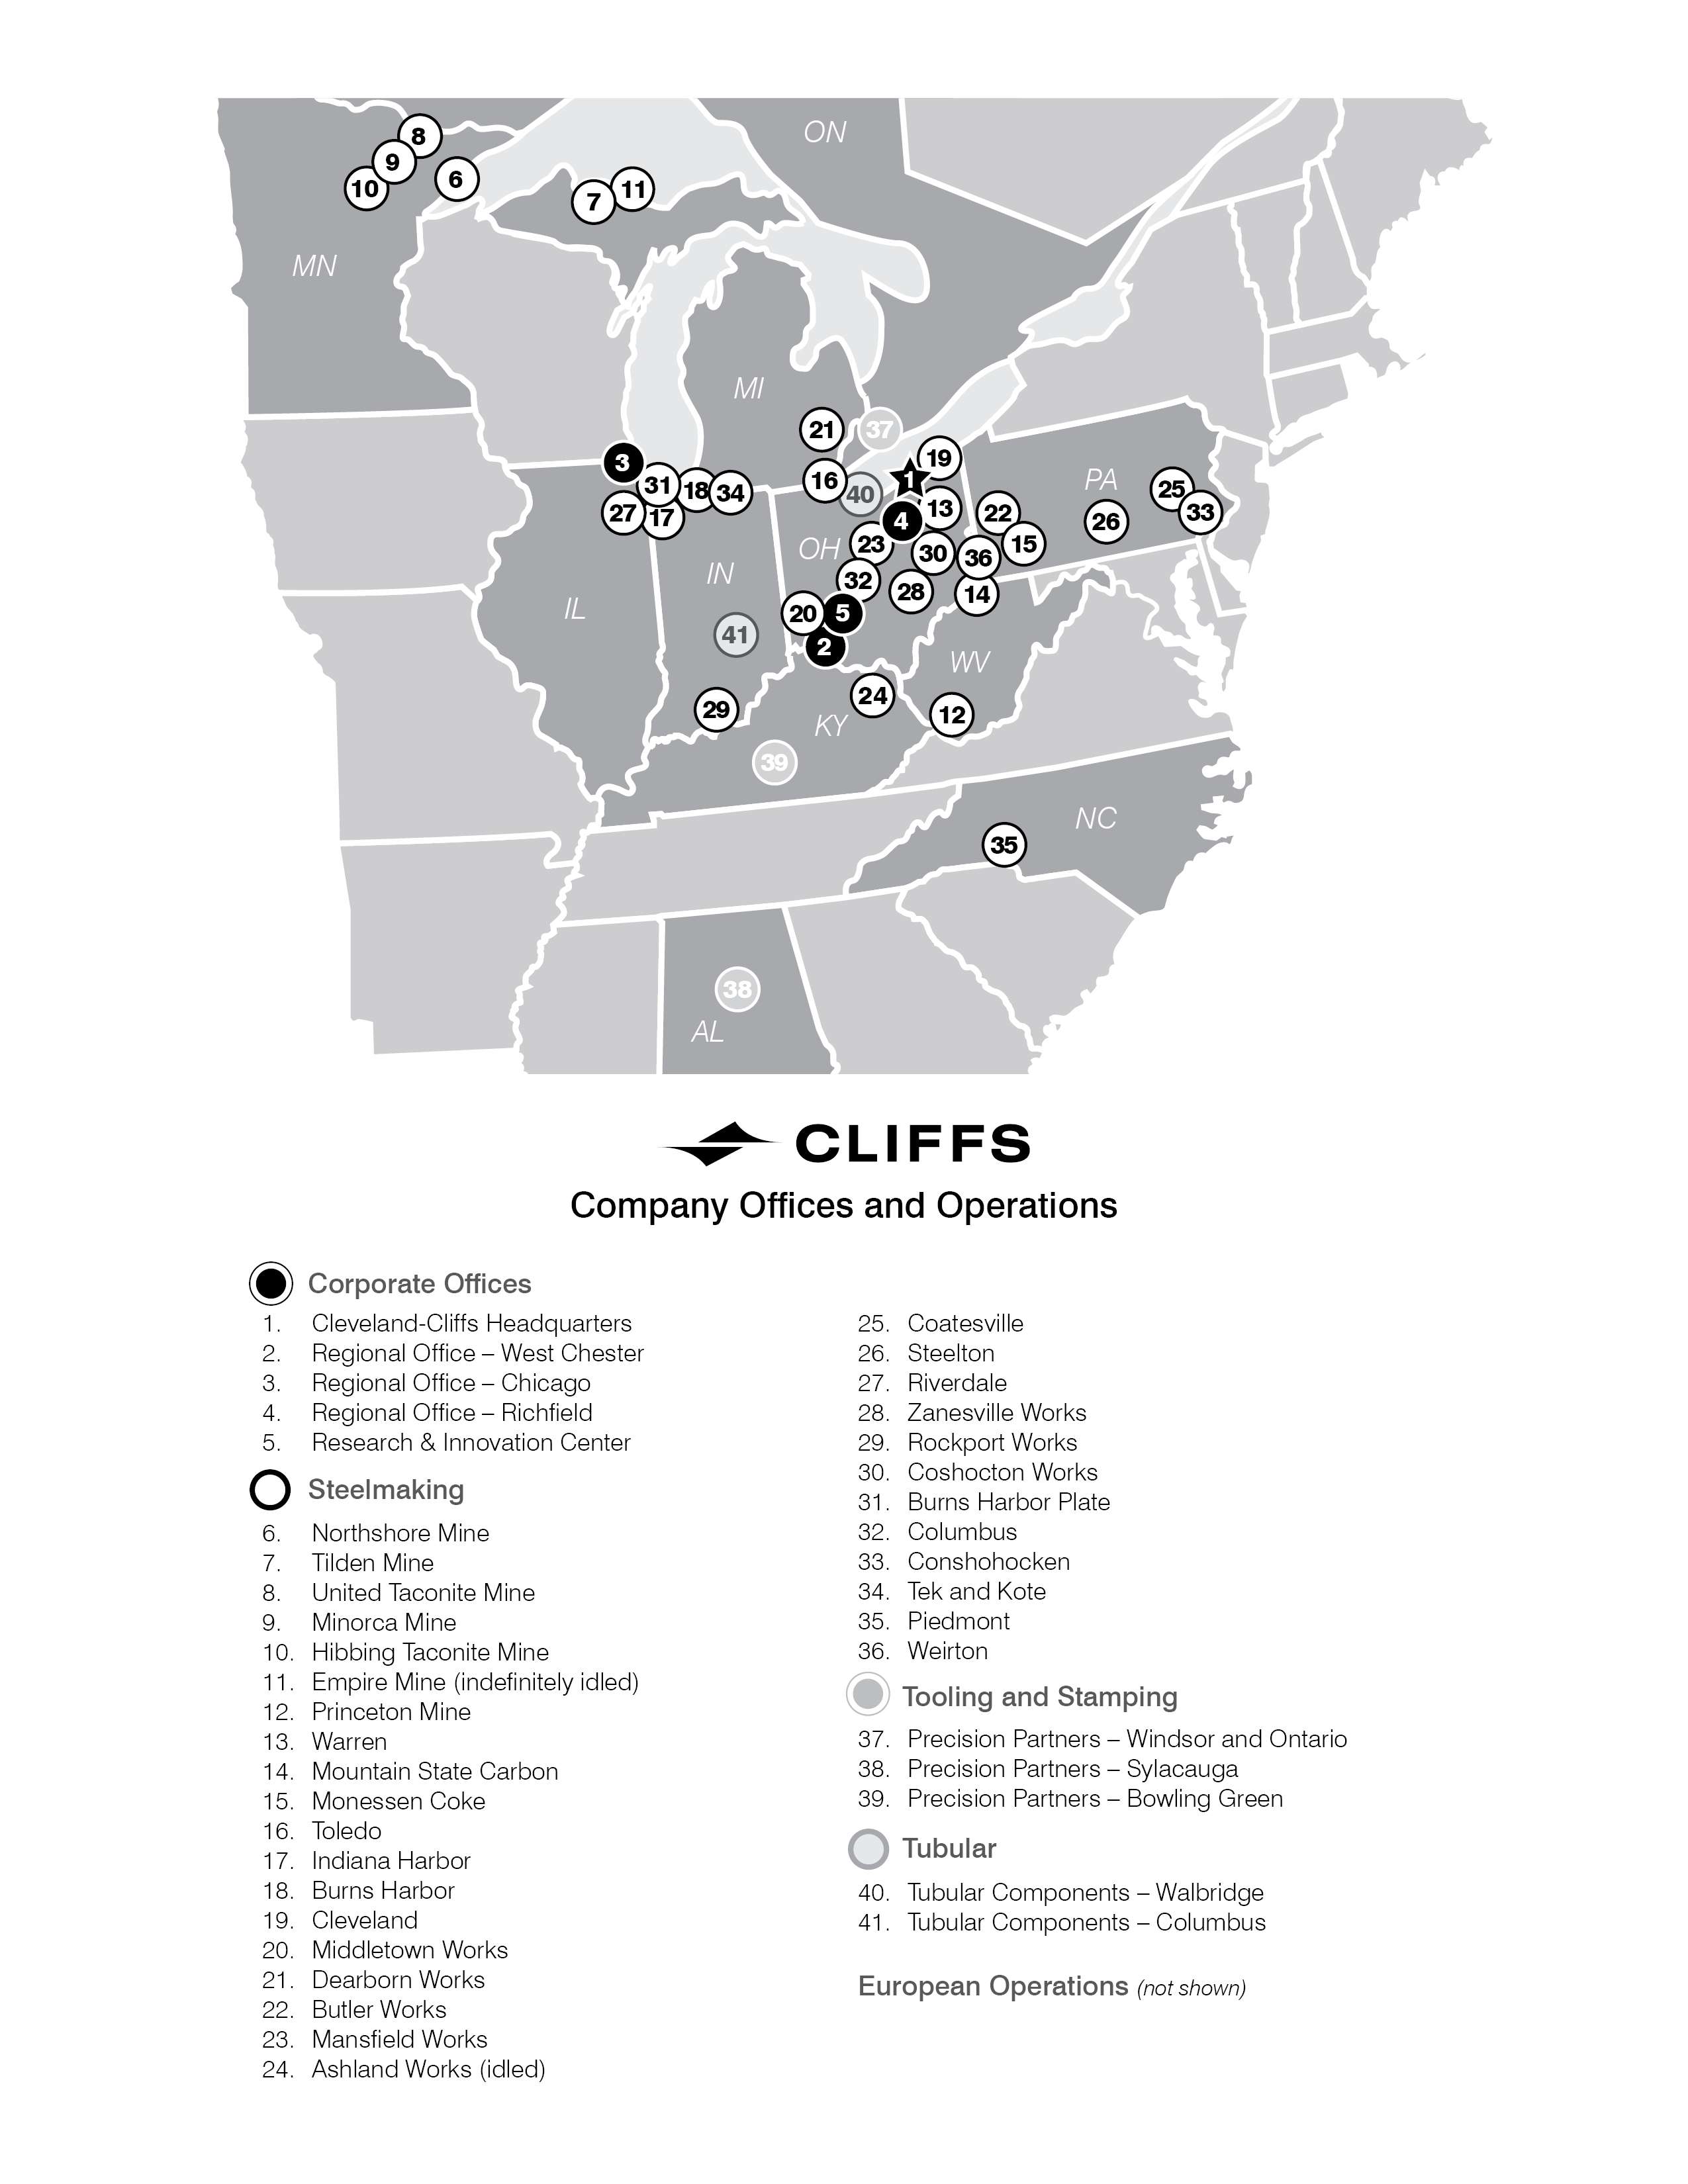
Cliffs isWe are the largest flat-rolled steel producer in North America. Founded in 1847 as a mine operator, we are also the largest suppliermanufacturer of iron ore pellets in North America. In 2020, we acquired two major steelmakers, AK SteelWe are vertically integrated from mined raw materials, direct reduced iron, and ArcelorMittal USA, vertically integrating our legacy iron ore business with quality-focusedferrous scrap to primary steelmaking and downstream finishing, stamping, tooling and tubing. We are the largest supplier of steel production and emphasis onto the automotive end market. Our fully integrated portfolio includes custom-made pelletsindustry in North America and HBI;serve a diverse range of other markets due to our comprehensive offering of flat-rolled carbon steel stainless, electrical, plate, tinplate and long steel products; as well as carbon and stainless steel tubing, hot and cold stamping and tooling.products. Headquartered in Cleveland, Ohio, we employ approximately 25,00028,000 people across our mining, steel and downstream manufacturing operations in the United States and Canada.
On March 13, 2020, we completed the acquisition of AK Steel, a leading producer of flat-rolled carbon, stainless and electrical steel products. These operations consist primarily of seven steelmaking and finishing plants, two cokemaking operations, three tube manufacturing plants and ten tooling and stamping operations. The Tubular Components and Precision Partners businesses provide customer solutions with carbon and stainless steel tubing products, die design and tooling, and hot- and cold-stamped components.
On December 9, 2020, we completed the acquisition of ArcelorMittal USA. These operations include six steelmaking facilities, eight finishing facilities, two iron ore mining and pelletizing operations, one coal mining complex and three cokemaking operations. These assets build upon our existing high-end steelmaking and raw material capabilities, and also open up new markets to us. The combination provides us additional scale and technical capabilities necessary in a competitive and increasingly quality-focused marketplace.
Competitive StrengthsCOMPETITIVE STRENGTHS
As the largestleading flat-rolled steel producer in North America, we benefit from having the size and scale necessary in a competitive, capital intensive business. Our sizeable operating footprint provides us with the operational leverage flexibility and cost performanceflexibility to achieve competitive margins throughout the business cycle. We also have a unique vertically integrated profile which begins at the mining stagefrom mined raw materials, direct reduced iron, and goes all the way through the manufacturing of steel products, includingferrous scrap to primary steelmaking and downstream finishing, stamping, tooling and tubing. This positioning gives us both lower and more predictable costs throughout theour supply chain and more control over both our manufacturing inputs and our end productend-product destination.
Our primary competitive strength lies within our automotive steel business. We are a leading supplier of automotive-grade steel in the U.S. Compared to other steel end markets, automotive steel is generally higher quality, more operationally and technologically intensive to produce, and requires significantly more devotion to customer service than other steel end markets. This dedication to service and the infrastructure in place to meet our automotive customers’ demanding needs took decades to develop. We have continued to invest capital and resources to meet the requirements needed to serve the automotive industry and intend to maintain our position as an industry leader going forward.
Due to its demanding nature, the automotive steel business typically generates higher through-the-cycle margins, making it a desirable end market. Demand for automotive-grade steel is expected to remain strong in the coming years as a result of low unemployment, pent-up automotive demand arising out of supply chain issues and the replacement of older vehicles.
Our footprint provides us with a competitive advantage in supplying automotive and other highly demanding end markets, as we are able to produce a wide range of high-quality products. Our integrated facilities utilize domestic internally sourced iron ore as the primary feedstock, which allows us to produce a high-quality product with low residual content. We also possess the breadth and depth related to customer service, technical support, and research and development, which are necessary to supply the demanding needs of the automotive industry.
Since the acquisition of our steelmaking assets, we have dedicated significant resources to maintain and upgrade our facilities and equipment. The quality of our assets gives us a unique advantage in product offerings and operational efficiencies. After elevated spend in 2022 to perform overdue maintenance work at the facilities acquired as part of the 2020 acquisitions, we resumed normalized levels of maintenance capital and operating expense in 2023. The necessary resources that we have invested in our footprint are expected to keep our assets at an automotive-grade level of quality and reliability for years to come.
Our industry leading portfolio of fixed price contracts provides us a competitive advantage, as the steel industry is often viewed as volatile and subject to the market price of steel. Our fixed price contracts mitigate pricing volatility and support us in achieving healthy margins through the cycle.
Our ability to source our primary feedstock domestically and internally is a competitive strength. This model reduces our exposure to volatile pricing and unreliable global sourcing. The ongoing conflict between Russia and Ukraine, along with other global tensions, has displayed the importance of our U.S.-centric footprint, as our competitors who primarily operate EAF facilities rely on imported pig iron to produce flat-rolled steel, the supply of which has been disrupted. The best example is our legacy business of producing iron ore pellets, our primary steelmaking raw material input, is another competitive advantage. Mini-mills (producers using EAFs) comprise about 70% of steel production in the U.S. Their primary iron input is scrap metal, which has unpredictable and often volatile pricing.pellets. By controlling our iron ore pellet supply, our primary steelmaking raw material feedstock can be secured at a stable and predictable cost and not be subject to as many factors outside of our control.
We are also the largest supplier of automotive-grade steel in the U.S. Compared to other steel end markets, automotive steel is generally higher quality and more operationally and technologically intensive to produce. As such, it often generates higher through-the-cycle margins, making it a desirable end market for the steel industry. With our continued technological innovation, as well as leading delivery performance,believe we expect to remain the leader in supplying this industry.
We offer the most comprehensive flat-rolled steel product selection in the industry, along with several complementary products and services. A sampling of thisour offering includes AHSS, hot-dipped galvanized, aluminized, galvalume, electrogalvanized, galvanneal, HRC, cold-rolled coil, plate, tinplate, GOES, NOES, stainless steels, tool &and die, stamped components, rail, slab and slabs.cast ingot. Across the quality spectrum and the supply chain, our customers can frequently find the solutions they need from our product selection.
We are currently a leading producer of electrical steels referred to as GOES and NOES in the U.S. In November 2021, the Infrastructure and Jobs Act was passed in the U.S., which provides funding to be used for the modernization of the electrical grid and the infrastructure needed to allow for increased EV adoption, both of which require electrical steels. Our electrical steel business is expected to continue achieving strong profitability in the coming years. During the second half of 2023, we commissioned our NOES expansion at our Zanesville facility, which increased our annual capacity by approximately 70,000 net tons.
We are the first and the only supplierproducer of HBI in the Great Lakes region. Construction of our Toledo Ohio, direct reduction plant was completed in the fourth quarter of 2020.2020 and reached full run-rate nameplate annual capacity of 1.9 million metric tons during the middle of 2021. From this modern plant, we offerproduce a high-quality, low-cost and low-carbon intensive HBI product that can be used in our blast furnaces as a productivity enhancer, or in our BOFs and EAFs as a premium scrap alternative. We use HBI to stretch our hot metal production, lowering carbon intensity and pig iron alternative to the several EAFs in the region. Previously, ore-based metallics that compete with our HBI had to be imported from locations like Russia, Ukraine and Brazil.reliance on coke. With growing EAF capacity in the U.S. and
increasing tightness in the scrap market,and metallics markets combined with our own internal needs, we expect our Toledo direct reduction plant to generatesupport healthy margins for us going forward.
StrategySTRATEGY
Optimizing Our Fully-Integrated Steelmaking FootprintMAXIMIZE OUR COMMERCIAL STRENGTHS
We have transformed into a fully-integrated steel enterprise with the size and scale to achieve improved through-the-cycle margins and are the largest flat-rolled steel producer in North America.
Now that the AM USA Transaction is completed, our focus is on the integration of these facilities within our footprint. These assets build upon our existing high-end steelmaking and raw material capabilities, and also open up new markets to us. The combination provides us the additional scale and technical capabilities necessary in a competitive and increasingly quality-focused marketplace. We have ample opportunities to implement improvements in logistics, procurement, utilization and quality.
We expect the AM USA Transaction to improve our production capabilities, flexibility, and cost performance. We have identified approximately $150 million of potential cost synergies through asset optimization, economies of scale, and duplicative overhead savings. The AM USA Transaction also enhances optionality for future production of merchant pig iron to complement our HBI offering in the metallics space.
Maximizing Our Commercial Strengths
With the Acquisitions completed, we now have enhanced our offering tooffer a full suite of flat steel products encompassing effectively all steps of the steel manufacturing process.our customers' needs. We have increased our industry-leading market share inare a leading supplier to the automotive sector, where our portfolio of high-end products will deliverdelivers a broad range of differentiated solutions for this highly sought after customer base.
We believeAs a result of our exposure to these high-end markets, we have the broadest flathighest fixed price contractual volumes in our industry. Approximately 40-45% of our volumes are sold under these contracts. These contracts reduce volatility and allow for more predictable through-the-cycle margins. In addition to our fixed price contracts, we also sell significant volumes under index-linked contracts, which reduces our reliance on spot sales and allows us to improve our efficiency with increased volumes.
Our unique capabilities, driven by our portfolio of assets and technical expertise, give us an advantage in our flat-rolled product offering. We offer products that have superior formability, surface quality, strength and corrosion resistance for the automotive industry. In addition, our state-of-the-art Research and Innovation Center in Middletown, Ohio gives us the ability to collaborate with our customers and create new products and develop new and efficient steel manufacturing processes. During 2022, we introduced our MOTOR-MAX™ product offeringline of NOES for high frequency motors and generators. During 2023, we introduced our C-STAR™ protection design, which was developed for the purpose of providing EV battery protection for improved safety purposes, but can be used in North America,any type of light vehicle. These unique product offerings and can meet customer needsservice capabilities enable us to remain a leading steel supplier to the automotive industry.
TAKE ADVANTAGE OF OUR U.S.-CENTRIC, INTERNALLY SOURCED SUPPLY CHAIN
The ongoing conflict between Russia and Ukraine has reinforced the unique advantage of our vertically integrated business model. Two-thirds of U.S. imports of pig iron, a critical raw material for flat-rolled EAFs, had historically been sourced from a varietyRussia and Ukraine. This supply remains largely disrupted, driving volatility in input costs and reducing availability for our competitors’ ferrous inputs. We, on the other hand, produce our pig iron and liquid steel entirely in the U.S., supported by internally sourced iron ore and HBI and supplemented with internally sourced scrap. In addition, our internally produced pig iron is more environmentally friendly than imported pig iron, which is often made from sintered iron ore fines and with higher coke rates, for example. While competitors are forced to rely on suppliers who are subject to unpredictable disruptions in their ability to supply materials, we are able to take advantage of end markets and quality specifications. We have several finishing and downstream facilities with advanced technological capabilities. We also pride ourselves on our excellent delivery performance, which provides us opportunities to augment our relationships with current customers given our reputation as a reliable supplier.vertically integrated footprint.
We are also proponentsbegan construction of the “value over volume” approach in terms of steel supply. We take our leadership role in the industry very seriously and intend to manage our steel output in a responsible manner.
Expanding to New Markets
Our Toledo direct reduction plant in 2017, in part because of the uncertainty of the industry sourcing metallics from Russia and Ukraine. Russia had previously invaded the Crimea peninsula in 2014, and we saw a need for more on-shore metallics capacity in the U.S. HBI, which is a lower-carbon alternative to imported pig iron, continues to be a critical component of our decarbonization strategy.
OPTIMIZE OUR FULLY-INTEGRATED STEELMAKING FOOTPRINT
We are a fully-integrated steel enterprise with the size and scale to achieve margins above industry averages for flat-rolled steel. Our focus remains on realizing our inherent cost advantage in flat-rolled steel while also lowering carbon emissions. The combination of our ferrous raw materials, including iron ore, scrap and HBI, allows us to offer another unique, high-quality productdo so relative to discerningpeers who must rely on more unpredictable and unreliable raw material buyers. EAF steelmakers primarilysourcing strategies.
We have ample access to scrap along with internally sourced iron ore pellets and HBI. Our ability to optimize use of these raw materials in our blast furnaces and BOFs ultimately boosts liquid steel output, reduces coke needs and lowers carbon emissions from our operations. As a result of successful operational improvements, we announced the indefinite idle of the Indiana Harbor #4 blast furnace in the first quarter of 2022. The indefinite idle reduced our operational blast furnaces from eight to seven. Our strategic use of HBI in our blast furnaces and maximizing scrap usage in our BOFs has allowed us to achieve the same steel production with one less blast furnace in our footprint.
During the second quarter of 2023, it was announced that we entered into long-term state mineral leases for theirmore than 2,600 acres of iron feedstock, andore at the Nashwauk mine site in Itasca County, Minnesota. The award of these leases is expected to resolve years of uncertainty regarding Hibbing Taconite’s mine life. This ore body is intended to serve as an extension of Hibbing Taconite, as the state’s mineral leases, combined with our HBI offers a sophisticated alternative with less impurities, allowing other steelmakersown private mineral holdings at Nashwauk, are expected to increase the qualityprovide more than two decades of their respective end-steel products and reduce reliance on imported metallics.additional ore reserves.
The completed Acquisitions provide other potential outlets for HBI, as it can also be usednecessary resources that we have invested in our integrated steel operationsfootprint are expected to increase productivitykeep our assets at an automotive-grade level of quality and helpreliability for years to reduce carbon footprint, allowing for more cost efficientcome, positioning us to benefit from operating efficiencies and environmentally friendly steelmaking.improved capabilities in the coming years.
ADVANCE OUR PARTICIPATION IN THE GREEN ECONOMY
We are also seeking to expand our customer base with the rapidly growing and desirable electric vehicleEV market. At this time, we believe the North American automotive industry is approachingat a monumentalstructural inflection point, with the adoption of electrical motors in passenger vehicles. As this market grows, it will require more advanced steel applications to meet the needs of electric vehicleEV producers and consumers. These features include the already existing sophisticated steel supply for internal combustion engine vehicle parts, along with the added need for steel-based battery enclosures and reinforcement in EVs. With our unique technical capabilities and leadership in the automotive industry, we believe we are positioned better than any other North American steelmaker to supply the steel and parts necessary to fill these needs.
Improving Financial FlexibilityWe also have the right products to meet the growing demand for renewable energy as well as for the modernization of the U.S. electrical grid. We offer plate products that can be used in windmills, which we estimate contain 130 tons of steel per megawatt of electricity. In addition, panels for solar power are heavy consumers of galvanized steel, where we are a leading producer. We estimate solar panels consume 40 tons of steel per megawatt of electricity.
Given the cyclicalityWe are currently a leading producer of our business, it is important to us to beelectrical steel in the financial position to easily withstand any negative demand or pricing pressure we may encounter. As such, our top priority forU.S., which can facilitate the allocationmodernization of our free cash flow is to improve our balance sheet via the reductionU.S. electrical grid. Along with charging networks, electrical steels are also needed in the motors of long-term debt. During the COVID-19 pandemic, we were able to issue secured debt to provide insurance capital through the uncertain industry conditions that the pandemic caused. Now that business conditions have improved and we expect to generate healthy free cash flow during 2021, we have the ability to lower our long-term debt balance.EVs.
ENHANCE OUR ENVIRONMENTAL SUSTAINABILITY Our stated initial target will be to reduce total debt to less than three times our annual Adjusted EBITDA. We will continue to review the composition of our debt, as we are interested in both extending our maturity profile and increasing our ratio of unsecured debt to secured debt, which we demonstrated by executing a series of favorable debt and equity capital markets transactions during February 2021, as described under Part II – Item 7. Management’s Discussion and Analysis of Financial Condition and Results of Operations. These actions will better prepare us to navigate more easily through potentially volatile industry conditions in the future.
Enhance our Environmental Sustainability
As the Company transforms, our commitment to operating our business in a more environmentally responsible manner remains constant. One of the most important issues impacting our industry, our stakeholders and our planet is climate change. As a result,In early 2021, we are continuing Cliffs’ proactive approach by announcingannounced our plancommitment to reduce GHG emissions 25% from 2017 levels by 2030. This goal represents combined Scope 1 (direct)(direct emissions) and Scope 2 (indirect)(indirect emissions from purchased electricity or other forms of energy) GHG emission reductions across all of our operations.
Prior to setting this goal with our newly acquired steel assets, we exceeded our previous 26% GHG reduction target at our legacy facilities six years ahead of our 2025 goal. In 2019, we reduced our combined Our 2022 absolute Scope 1 and Scope 2 GHG emissions by 42% on a mass basis from 2005 baseline levels. Ourwere below our reduction goal is to further reduce those emissions in coming years.
Additionally, manywell ahead of our steel assets2030 target year. Since 2017, we have improved plant and energy efficiency through participationreduced our absolute emissions by 32% from 44 million metric tons to 30 million metric tons of CO2e in programs like2022.
In May 2023, we completed a successful blast furnace hydrogen injection trial at Middletown Works. During the U.S. Department of Energy’s Better Plants program andtrial, hydrogen gas was injected in all 20 tuyeres at the EPA’s Energy Star program. With our longstanding focus on plant and energy efficiency, we aim to build on our previous successes across our newly integrated enterprise.
Our GHG reduction commitment is based on executing the following five strategic priorities:
•Developing domestically sourced, high quality iron ore feedstock and utilizing natural gas inMiddletown #3 blast furnace, facilitating the production of HBI;clean pig iron. In this trial, hydrogen served as a partial substitute for the fossil fuels necessary for iron reduction, ultimately replacing the release of CO2 with the release of H2O (water vapor) with no impact to product quality or operating efficiency.
•In October 2023, the DOE announced the intention to award funding under the Infrastructure and Jobs Act for seven regional hydrogen hubs, including the Midwest Alliance for Clean Hydrogen. This hub covering Illinois, Indiana and Michigan was selected for $1 billion in funding and is near our two largest steel plants, Indiana Harbor and Burns Harbor. We recently commissioned a pipeline and successfully completed a hydrogen injection trial at our Indiana Harbor blast furnace #7. This follows an initial similar trial of hydrogen at our blast furnace in Middletown earlier in 2023. The use of hydrogen within our blast furnace is expected to partially reduce coke rate and displace the release of COImplementing energy efficiency2 with H2O, reducing our overall emissions.
Our future GHG emissions reductions are expected to be driven by the use of direct reduced iron in blast furnaces, the stretching of hot metal with additional scrap, driving more productivity out of fewer blast furnaces, implementing hydrogen use where possible, adopting carbon capture and utilization, procuring more clean energy projects;and operating with higher energy efficiency.
•InvestingIMPROVE FINANCIAL FLEXIBILITY
Given the cyclicality of our business, it is important to us to be in the developmentfinancial position to easily withstand economic cycles and be opportunistic when attractive strategic opportunities arise. Since the acquisition of carbon capture technology;
•Enhancing our GHG emissions transparencysteelmaking assets in 2020, we have demonstrated our ability to generate healthy free cash flow and sustainability focus;use it to reduce substantial amounts of debt, return capital to shareholders through our share repurchase program, and
•Supporting public policies that facilitate GHG reduction make investments to both improve and grow our business. During 2023, we reduced the principal amount of outstanding long-term debt by $1.1 billion while returning $152 million in capital to shareholders via share repurchases. We have also historically shown our ability to take advantage of volatility in the domestic steel industry.debt markets and repurchase notes at a discount.
We expect to have ample opportunities to reduce our debt and return capital to shareholders with our own free cash flow generation in the coming years. It is also important for us to maintain sufficient liquidity. Our liquidity as of December 31, 2023 of $4.5 billion is the highest in our Company’s history.
Business OperationsBUSINESS OPERATIONS
We arehave a vertically integrated fromportfolio, which begins at the mining stage and goes all the way through the manufacturing of iron oresteel products, including stamping, tooling and coal; to production of metallics and coke; through iron making, steelmaking, rolling and finishing; and to downstream tubular components, stamping and tooling.tubing. We have the unique advantage as a steel producer of being fully or partially self-sufficient with our production of raw materials for steel manufacturing, which includes iron ore pellets, HBI, scrap and coking coal. As we expand our presence, we believe such vertical integration represents a sustainable business model that is in the best interest of all stakeholders and the surest way to secure a long-term competitive advantage.
We strive to operate responsibly and produce more environmentally friendly iron ore pellets that enable production of clean steel, which is also the most recycled material on the planet. Additionally, our investment in the direct reduction plant in Toledo, Ohio, also helps to support environmental stewardship, as the production of HBI is more environmentally friendly than its substitute, foreign pig iron. From a focus on key environmental processes, such as steel recycling and water reuse, to corporate and social responsibility, sustainability is central to our values and operations.
We have updated our segment structure to coincide with our new business model and are organized into four operating segments based on the differentiated products – Steelmaking, Tubular, Tooling and Stamping and European Operations. Through the third quarter ended September 30, 2020, we had operated through two reportable segments – the Steel and Manufacturing segment and the Mining and Pelletizing segment. However, given the recent transformation of the business, beginning with our financial statements as of and for the year ended December 31, 2020, weWe primarily operate through one reportable segment – the Steelmaking segment.
Our primary steel producing and finishing facilities are located across Illinois, Indiana, Michigan, Ohio, Pennsylvania and West Virginia. We operate seven blast furnaces and five EAFs with the configured capability of producing approximately 20.5 million tons of raw steel annually. Raw steel is generally cast into slabs and finished based on customer specifications. Finishing is completed on site at our integrated operations or at one of our standalone finishing facilities.
The following table listsFerrous raw materials for the production of steel are internally sourced from our main properties, their locationiron ore mines in Michigan and theirMinnesota, our direct reduction plant in Ohio and our scrap facilities in Michigan, Ohio, Tennessee, Florida and Ontario. We also operate a coal mining complex in West Virginia and produce coke from our facilities in Indiana, Ohio, and Pennsylvania.
Our Other Businesses primarily includes the Tubular Components and Tooling and Stamping operating segments that provide customer solutions with carbon and stainless steel tubing products, advanced-engineered solutions, tool design and services:build, hot- and cold-stamped steel components and complex assemblies.
Refer to Part I - Item 2. Properties for additional information.
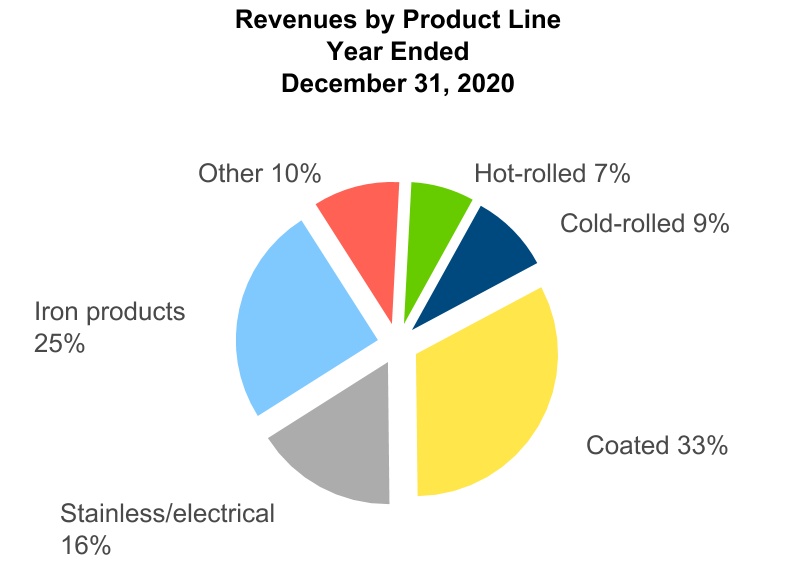
PRODUCTS AND MARKETS
| | | | | | | | | | | | | | | | | | | | |
Property2023 Product Mix (By Revenue) | | Segment | | State/ Province | | Primary Products and Services |
Hibbing (85.3% ownership) | | Steelmaking | | Minnesota | | Iron ore pellets |
Minorca | | Steelmaking | | Minnesota | | Iron ore pellets |
Northshore | | Steelmaking | | Minnesota | | Iron ore pellets |
Tilden | | Steelmaking | | Michigan | | Iron ore pellets |
United Taconite | | Steelmaking | | Minnesota | | Iron ore pellets |
Empire (indefinitely idled) | | Steelmaking | | Michigan | | Iron ore pellets |
Toledo | | Steelmaking | | Ohio | | HBI |
Princeton | | Steelmaking | | West Virginia | | Coal |
Mountain State Carbon | | Steelmaking | | West Virginia | | Coke |
Monessen | | Steelmaking | | Pennsylvania | | Coke |
Warren | | Steelmaking | | Ohio | | Coke |
Ashland Works (idled) | | Steelmaking | | Kentucky | | Potential pig iron plant |
Burns Harbor | | Steelmaking | | Indiana | | Hot-rolled, cold-rolled, and hot-dipped galvanized sheet and coke |
Burns Harbor Plate and Gary Plate | | Steelmaking | | Indiana | | Carbon steel plate, high-strength low alloy steel plate, ASTM grades steel plate |
Butler Works | | Steelmaking | | Pennsylvania | | Flat-rolled electrical and stainless steel, stainless and carbon semi-finished slabs |
Cleveland | | Steelmaking | | Ohio | | Hot-rolled and hot-dipped galvanized sheet |
Coatesville | | Steelmaking | | Pennsylvania | | Steel plate - carbon, high-strength low-alloy, commercial allow, military alloy, flame-cut |
Columbus | | Steelmaking | | Ohio | | Hot-dipped galvanized steel |
Conshohocken | | Steelmaking | | Pennsylvania | | Coiled and discrete plate, military alloy, commercial alloy, heat-treated carbon |
Coshocton Works | | Steelmaking | | Ohio | | Flat-rolled stainless steel |
Dearborn Works | | Steelmaking | | Michigan | | Carbon semi-finished slabs, hot-dipped galvanized, AHSS |
Indiana Harbor | | Steelmaking | | Indiana | | Hot-rolled, cold-rolled and hot-dipped galvanized sheet |
Kote and Tek | | Steelmaking | | Indiana | | Cold-rolled, hot-dipped galvanized and galvannealed, electrogalvanized coil |
Mansfield Works | | Steelmaking | | Ohio | | Semi-finished hot bands, high chrome ferritic and martensitic stainless steels |
Middletown Works | | Steelmaking | | Ohio | | Hot-rolled, cold-rolled, hot-dipped galvanized, aluminized sheet and coke |
Piedmont | | Steelmaking | | North Carolina | | Plasma-cuts plate steel products into blanks |
Riverdale | | Steelmaking | | Illinois | | Hot-rolled sheet |
Rockport Works | | Steelmaking | | Indiana | | Cold-rolled carbon, coated and stainless steels |
Steelton | | Steelmaking | | Pennsylvania | | Railroad rails, specialty blooms, flat bars |
Weirton | | Steelmaking | | West Virginia | | Tinplate, cold-rolled sheet |
Zanesville Works | | Steelmaking | | Ohio | | Electrical steels |
Tubular Components | | Other Businesses | | Indiana and Ohio | | AHSS tube, electric resistant welded tubing |
Precision Partners | | Other Businesses | | Ontario, Alabama and Kentucky | | Cold and hot stamp assembly solutions |

| | | | | | | | | | | |
| ◦HOT-ROLLED | ◦STAINLESS AND ELECTRICAL | ◦OTHER |
| ◦COLD-ROLLED | ◦Scrap |
| ◦COATED | ◦GOES | ◦Iron Ore |
| ◦Aluminized | ◦NOES | ◦HBI |
| ◦Electrogalvanized | ◦Auto Chrome | ◦Coal |
| ◦Galvalume | ◦PLATE | ◦Coke |
| ◦Galvanneal | ◦SLAB AND OTHER STEEL PRODUCTS | ◦NON-STEELMAKING |
| ◦Hot-dipped Galvanized | ◦Stamped Components |
| ◦Tinplate | ◦Slab | ◦Tool and Die |
| | ◦Rail | ◦Tubing |
| | ◦Blooms | |
| | ◦Cast Ingots | |
Customers and Markets
steel solutions. We primarily sell our products to customers in four broad market categories: automotive; infrastructure and manufacturing, which includes electrical power; distributors and converters; and steel producers, which consume iron ore and metallics.categories. The following table presents the percentage of our net salesrevenues to each of these markets during the year:
| | | | | | | | |
Market | | 2020 |
Automotive | | 45 | % |
Infrastructure and manufacturing | | 15 | % |
Distributors and converters | | 13 | % |
Steel producers | | 27 | % |
| | | | | | | | | | | | | | | | | | | | |
| Market | | Primary Products Sold to End Market | | 2023 | | 2022 |
| Direct automotive | | Cold-rolled, galvanized, aluminized, NOES and stainless | | 36 | % | | 31 | % |
| Infrastructure and manufacturing | | Hot-rolled, cold-rolled, galvanized, plate, GOES, stainless, tinplate and rail | | 26 | % | | 26 | % |
| Distributors and converters | | All grades of steel | | 25 | % | | 28 | % |
| Steel producers | | Slab, scrap, iron ore, HBI, coal and coke | | 13 | % | | 15 | % |
CertainThe change in percentages of revenues to each market in 2023, compared to 2022, was driven primarily by the increase in volumes and in selling prices for our fixed price contracts to the direct automotive market, lower pricing on index-linked sales, and lower pricing on spot sales. Additionally, our sales to the direct automotive market increased as prior supply chain issues eased and light vehicle production in North America reached the highest level since 2019.
We sell our products principally to customers in North America. Approximately 40-45% of our flat-rolled steel shipments are sold under fixed base price contracts. These contracts are typically one year in duration and expire at various times throughout the year. Some of these contracts have a surcharge mechanism that passes through certain changes in input costs. A certain portion of our flat-rolled steel shipments are sold based on the spot market at prevailing market prices or under contracts that involve variable pricing that is tied to an independently published steel index.
We sell our steel products principally to customers in North America. For the vast majority of international sales, we are not the importer of record and do not bear the responsibility for paying any applicable tariffs.AUTOMOTIVE MARKET
Automotive Market
The automotive industry is our largest market, and we aim to address the principal needs of major automotive manufacturers and their suppliers. We specialize in manufacturing difficult-to-produce and high-quality steel products combined with demanding delivery performance and first-class customer technical support andsupport. Through our collaborative relationships towith automotive producers, we develop breakthrough steel solutions that help our customers meet their product requirements. In addition, manyThe quality of our competitors do not have the capabilitysteel is appealing to supply the full portfolioend users because of products that we make for our automotive customers, suchits strength, surface quality and formability. EAF producers’ equipment is designed to utilize scrap as steel for exposed automotive applications, the most sophisticated grades of AHSS and value-added stainless steel products.their main feedstock, which often contains high residual or impure content, limiting their product capabilities. The exacting requirements for servicing the automotive market generally allows for higher selling prices for products sold to that market than for the commodity types of carbon and stainless steelssteel sold to other markets.
In light ofThe largest end user for our steel products is the automotive market’s importance to us,industry in North America, which makes light vehicle production a key driver of demand. During 2023, North American light vehicle production has a significant impact on our total sales and shipments. North American light vehicle production for 2020 declined 20% to approximately 13was 15.6 million units, up from the prior year due to impacts of the COVID-19 pandemic, which forced businesses to begin to shut down at the end of March 2020 until they slowly re-started near the end of the second quarter. During the third quarter of 2020, auto makers saw the pent-up demand bring sales back to more normal levels as buyers and dealers adapted to new procedures and virtual shopping. Fourth quarter 2020 sales were more14.3 million units in line with expected sales for the time of year, but did not quite return to pre-COVID-19 levels. Currently, we are expecting2022. North American light vehicle production in 20212024 is estimated to significantly increaseexceed 2023 units, indicating continued strength from the automotive industry. The long-term outlook for the automotive industry remains positive as pent-up demand remains strong, inventory levels are below historical averages and return to near 2019 levels, which tothe average age of vehicles on the road in the U.S. reached an extent depends on continued demand,all-time high during 2023, surpassing the levelprevious record set in 2022.
Furthermore, during 2020,2023, consumer demand for sport utility vehicles, trucks crossovers and larger vehiclescrossovers continued to increase while demand for smaller sedans and compact cars declined. We benefit from intentionally targeting larger vehicle platforms to take advantage of consumer preferences, and we have focused on and have been successful in getting sourced onsupplying sizeable portions of numerous sport utility vehicles, truck, crossover and largerlarge vehicle platforms. As a result, a significant portion of the carbon automotive steel that we sell is used to produce these popular larger vehicles. In addition to benefiting from our exposure to consumers’ strong demand for larger vehicles, these vehicles also typically contain a higher volume of steel than smaller sedans and compact cars, providing us the opportunity to sell a greater proportionhigher volume of our steel products to our automotive customers.products.
Automotive manufacturers are under pressure to achieve heightened federally mandated fuel economy standards (the Corporate Average Fuel Economy, or “CAFE,” standards). The CAFE standards generally require automobile manufacturers to meet an average fuel economy goal across the fleet of vehicles they produce with certain milestone dates. As a result, our automotive customers continue to explore various avenues for achieving the standards, including light weighting components and developing more fuel-efficient engines. Light weighting efforts include the use of alternativesopportunities to traditional carbon steels, such as AHSS and other materials. While this could reduce the aggregate volume of steel consumed by the automotive industry, we expectdevelop vehicles that demand will increase for current
and next-generation AHSS and that our AHSS and other innovative steels will command higher margins.are lighter in weight. We are collaboratingcollaborate with our automotive customers and their suppliers to develop innovative solutions using our developments in light weighting, efficiency, and material strength and formability across our extensive product portfolio, in combination with our automotive stamping and tube-making capabilities. During 2023, we introduced an all steel battery box design utilizing various grades of AHSS for improved use for lower GHG emissions, to maintain light-weighting targets, and to gain cost benefits when compared to using alternative materials. We believe we offer steel products that are also working with our customersstronger, less expensive, have competitive weight savings, are easier to develop steels with greater heat resistance for exhaust systems that support new, fuel-efficient engines that run at higher temperatures.repair and are more environmentally friendly than alternative materials.
Automotive manufacturers have also been increasing their development of H/EVs and battery electric vehicles in order to meet the CAFE standards and growing customer adoption of H/EVs. Many motors used in H/EVs being sold in the U.S. today are imported from foreign suppliers, but more local sourcing and manufacturing of motors is expected to occur in the future. As the onlya leading producer in North American producerAmerica of high-efficiency NOES, which is a critical component of H/EV motors, we are positioned to potentially benefit from the growth of H/EVs going forward. During 2023, we introduced our C-STAR™ protection design, which was developed for the purpose of providing EV battery protection for improved safety purposes, but can be used in any type of light vehicle. In 2022, we introduced our MOTOR-MAX™ product line of NOES for high frequency motors and generators. We believe our strong foundation in electrical steels and long-standing relationships with automotive manufacturers and their suppliers will provide us with an advantage in this market as it continues to grow and mature. Likewise, the growing customer adoption of H/EVs may also increase demand for improvements in the electric grid to support higher demand for more extensive battery charging, which our GOES could support.
Infrastructure and Manufacturing MarketThe majority of our sales to the automotive market are under annual fixed price contracts. In 2024, we expect contract prices to be roughly similar when compared to the prior year.
INFRASTRUCTURE AND MANUFACTURING MARKET
We sell a variety of our steel products, including hot-rolled, cold-rolled, galvanized, plate, carbon, stainless, electrical, tinplate and rail, to the infrastructure and manufacturing market. This market includes sales to manufacturers of heating, ventilation and air conditioning equipment,HVAC, appliances, power transmission and distribution transformers, storage tanks, ships, and railcars, wind towers, machinery parts, heavy equipment, military armor, food preservation and railway lines. Domestic construction activity and the replacement of aging infrastructure directly affectsaffect sales of steel to this market. During 2020, there were nearly 1.4 million new housing starts inRecent government legislation, including the U.S., an increase of approximately 6% from 2019,Infrastructure and home sales reached nearly 6 million,Jobs Act, the highest annual mark since 2006, withCHIPS Act and the supply of existing homes having reached all-time lows. The recent strength in home sales has been due to lower mortgage rates and remote work flexibility andInflation Reduction Act, is expected to keep demand elevated for steel products related to renewable energy, as well as the modernization of the U.S. electrical grid. Our plate products can be used in windmills, which we estimate contain 130 metric tons of steel per megawatt of electrical generating capacity. Additionally, we estimate solar panels consume 40 metric tons of steel per megawatt of electrical generating capacity. We should also continue through 2021.to benefit from a tax credit provided by the Inflation Reduction Act for consumers who buy new EVs, which should increase the demand for our electrical steel used in charging stations.
DistributorsSales to this end market are made under a combination of annual fixed price contracts and Converters Marketindex-linked pricing arrangements. Our selling prices under our annual fixed price contracts are expected to be roughly similar in 2024 when compared to the prior year.
DISTRIBUTORS AND CONVERTERS MARKET
Virtually all of the grades of steel we produce are sold to the steel distributors and converters market. This market generally represents downstream steel service centers, whowhich source various types of steel from us and fabricate it according to their customers' needs. Our steel is typically sold to this market on a spot basis or under short-term contracts linked to steel pricing indices. Demand and pricing for this market can be highly dependent on a variety of factors, outside our control, including global and domestic commodity steel production capacity, demand for manufactured goods, the price of scrap, the relative health of countries’ economiesthe global economy, the import and whether they are consuming or exporting excessexport levels of other steel capacity,producing nations, service center inventory management, the provisions of international trade agreements and fluctuations in international currencies and, therefore, are subject to market changes in steel prices.currencies.
The price for domestic HRC, which is an important attributethe most significant index in driving the revenues and profitability of this end market,our Steelmaking segment, averaged $588$906 per net ton for the year ended December 31, 2020, 2% lower than the prior year. The price of HRC was negatively impacted by lower demand related2023, compared to the COVID-19 pandemic, and hit a low point of $438$1,011 per net ton on April 30, 2020. However,in 2022. The main decline in pricing occurred in the third quarter of 2023 as demand from service centers was adversely impacted due to the industry recoveredanticipation of, and supply-demand dynamics improved,ultimate occurrence of, the price rebounded dramatically, risingUAW strike at certain domestic automotive producers. The automotive strike concluded in the fourth quarter of 2023, resulting in increased demand from our automotive and service center customers. This increased demand led to a peak of $1,030sharp rebound in HRC pricing, which ended the year at approximately $1,100 per net ton by December 31, 2020 and reaching all time-highs early in 2021. The improved pricing environment should bolster profitability for this end market during 2021.ton.
Steel Producers MarketSTEEL PRODUCERS MARKET
The steel producers market represents third-party sales to other steel producers, including those who operate blast furnaces and EAFs. It includes sales of raw materials and semi-finished and finished goods, including iron ore pellets, coal, coke, HBI, scrap, slab and other steel products.
FPT is one of the largest processors of prime scrap in the country. Our scrap presence has developed further since acquiring FPT as we have leveraged our long-standing flat-rolled automotive and other customer relationships into recycling partnerships. Our
steelmaking operations consume a large portion of the ferrous scrap processed by FPT. We also have third-party sales of ferrous and non-ferrous scrap.
Third-party slab sales are also a large component of sales to this market, which are primarily made under a long-term supply agreement that was initiated in connection with the closing of the AM USA Transaction.
Production from our iron ore mines is predominantly consumed by our steelmaking operations. During 2023 and 2022, we sold 4 million and 3 million long tons of iron ore products, respectively, to third parties from our share of production from our iron ore mines. The merchant portion of our iron ore pellet production is sold pursuant to long-term supply agreements and through spot contracts. Certain
The price of our supply agreements containbusheling scrap, a base price that is adjusted periodically as specified by the contracts, using one or more adjustment factors. Factors that could resultnecessary input for flat-rolled steel production in price adjustments under our contracts include changesEAFs in the Platts 62% price, published Platts international indexed freight rates and changes in specified PPI, including those for industrial commodities, fuel and steel.
As a result of the Acquisitions, production from our iron ore mines is now predominantly consumed by our newly acquired steelmaking operations. On a full-year basis, we would expect between 22 million and 24 millionU.S., averaged $488 per long tons of our iron ore pellets to be consumed by our steelmaking operations. During 2020, 2019 and 2018, we sold 12
million, 19 million and 21 million long tons of iron ore product, respectively, to third parties from our share of production from our iron ore mines.
We produce various grades of iron ore pellets, including standard, fluxed and DR-grade, for use as part of the steelmaking process. The variation in grade of iron ore pellets resultston during 2023, an 8% decrease from the specific chemical and metallurgical propertiesprior year, but remained well above the historical ten-year average of approximately $390 per long ton. We expect the ores at each mine, the requirementsprice of end users' steelmaking processes and whether or not fluxstone is addedbusheling scrap to remain elevated above historical averages in the process. Although the grade or grades of pellets currently delivered to each customer are based on that customer’s preferences, which depend in part on the characteristics of the customer’s steelmaking operation, in certain cases our iron ore pellets can be used interchangeably. Standard pellets require less processing, are generally the least costly pellets to produce and are called “standard” because no ground fluxstone, such as limestone or dolomite, is addedcoming years due to the iron ore concentrate before turningcontinued decline of prime scrap generation and the concentrate into pellets. In the casegrowth of fluxed pellets, fluxstone is added to the concentrate, which produces pellets that can perform at higher productivity levelsEAF capacity in the customer’s specific blast furnace and will minimize the amount of fluxstone the customer may be required to add to the blast furnace. DR-grade pellets require additional processing to makeU.S., along with a pellet that contains higher iron and lower silica content than a standard pellet. Unlike standard or fluxed pellets, DR-grade pellets are produced to be fed into a direct reduction facility.
Beginning in 2021, we expect to also sell HBI to third-party customers, primarily EAFs with operations in the Great Lakes region. We expect our Toledo direct reduction plant to begin shipping saleable product to third-party customers during the first quarter of 2021. The Toledo direct reduction plant has a nameplate production capacity of 1.9 million metric tons, and we expect to reach its productive capacity by the second quarter of 2021.push for expanded scrap use globally.
Applied Technology, Research and DevelopmentAPPLIED TECHNOLOGY, RESEARCH AND DEVELOPMENT
We have an extensive historyThe utilization of being an innovator dating back more than a century. From upstreamour research and development capabilities has allowed us to downstream applications, we have dedicated technical and engineering resources that begin with improving customers' production and manufacturing performance to applications for their end product use.
We have been a leader in iron ore mining and processing technology through the application ofintroduce new technologysteel products to the centuries-old businessmarketplace. Our research and development activities provide us the ability to offer a broad range of mineral extraction. We have also been a pioneersteel products, improve existing products and processes and develop new ones. As part of our underlying strategy to maintain and improve our product, service and technical capabilities, research and innovation spend totaled $30 million and $24 million in iron ore pelletizing with over 60 years2023 and 2022, respectively.
As the largest supplier of experience. We are ablesteel to produce customized, environmentally friendly pellets to meet blast furnace specifications and produce standard, fluxed and DR-grade pellets.
We now have athe automotive industry in North America, it is important that we maintain our world-class research and development team expandingto expand our capabilities toand bring new steel products to the marketplace. Rapidly evolving and highly competitive markets for our steel products require our customers to seek new, comprehensive steel solutions, and we believe we are well positioned to deliver the most robust solutions through our broad portfolio of offerings. Collaboration across our research groups and operations generates innovative and comprehensive solutions for our customers, which we believe enhances our competitive advantage.
Creating innovative products and breakthrough solutions is a strategic priority, as we believe differentiation through producing higher value steels to meet challenging requirements enables us to maintain and enhance our margins. We conduct a broad range of research and development activities aimed at improving existing products and processes and developing new ones. Our innovation of steel has produced a highly diversified steel product portfolio. As part of our underlying strategy to focus on higher-value materials and minimize exposure to commodity products, we have invested in research and innovation totaling $15 million in 2020. Our ongoing efforts begin at our state-of-the-art Research and Innovation Center in Middletown, Ohio, where we collaborate with our automotive customers and their suppliers to enhancedevelop products that meet their needs. We have a customer technical collaboration have increased the introduction of new steelsupport team that is dedicated to understanding customers’ current and long-term requirements and translating them into product designs. The dedication and resources we allocate toward our research and development help us maintain our extensive product offering and provide our automotive customers with solutions to meet their steel needs. Our research and development capabilities will support us in efforts to remain the marketplace.leading supplier to the automotive industry as automotive manufacturers continue to pursue EVs, lighter weight vehicles and other advancements in vehicle capabilities.
HBI
We are a pioneerA prime example of our ability to help our customers through research and development can be seen in the support and products we offer as automotive manufacturers have started increasing their development of emerging reduction technologies, a leaderEVs to meet the growing consumer adoption of EVs. During 2023, we introduced our C-STAR™ protection design, which was developed for the purpose of providing EV battery protection for improved safety purposes, but can be used in the extractionany type of value from challenging resourceslight vehicle. We also introduced an all steel battery box design utilizing various grades of AHSS for improved use for lower GHG emissions, to maintain light-weighting targets, and a front-runner in the implementation of safe and sustainable technology.to gain cost benefits when compared to using alternative materials. We are also devoted to promoting environmental sustainability, evidenceda leading producer in North America of high-efficiency NOES, which is a critical component of EV motors. Our MOTOR-MAX™ NOES product line is used for high frequency motors and generators. We believe our strong foundation in electrical steels and long-standing relationships with the development of our direct reduction plant in Toledo, Ohio. We expect our introduction of HBI to the Great Lakes EAF market will be notable in the evolution of the steel industry.
We completed construction of our Toledo direct reduction plant and began production in the fourth quarter of 2020. Our Toledo direct reduction plant is expected to produce 1.9 million metric tons of HBI per year, replacing a portion of the over 3 million metric tons of ore-based metallics that are imported into the Great Lakes region every year from Russia, Ukraine, Brazil and Venezuela, as well as approximately 20 million metric tons of scrap used in the Great Lakes area every year.
Carbon Steel
We focus much of our research and innovation efforts on carbon steel applications for automotive manufacturers and their suppliers. We are particularly focused on AHSS for the automotivesuppliers will provide us with an advantage in this market as it continues to grow and we produce virtually every AHSS grade currently used by our customers. Our AHSS grades, such as Dual Phase 590, 780, 980 and 1180, have been adopted by our customers for both stamped and roll-formed parts, and our NEXMET® 1000 and 1200 products have demonstrated enhanced strength, formability and opportunities for automotive light weighting in cold-stamped applications. We are also pursuing application of NEXMET 440EX and NEXMET 490EX in surface-critical, exposed auto body panels as an alternative to aluminum.mature.
Third Generation Advanced High-Strength Steel
COMPETITION
Our third generation NEXMET 1000 and NEXMET 1200 AHSS products enable our customers to achieve significant light weighting in the unexposed structural components of their vehicles. NEXMET 1200, for example, offers superior formability similar to conventional Dual Phase 600 steel, but at twice the strength level. We have expanded the application of the NEXMET technology to our tubular products and stamped components businesses. These AHSS products allow automotive engineers to design lightweight parts that meet rigorous service and safety requirements. The NEXMET family of steels helps our customers achieve vehicle weight savings for ambitious fuel efficiency standards while avoiding significant capital costs required to re-design production facilities to use alternative materials.
Both galvanized and cold-rolled NEXMET 1000 and NEXMET 1200 AHSS are progressing through product qualification with several original equipment manufacturer customers. A number of stamping and component assembly trials have been completed successfully, with more planned and underway. Because the timing of automotive design and production cycles spans several years, widespread automotive customer adoption of revolutionary new material such as NEXMET AHSS may also extend over several years. We expect that other automotive vehicle platforms will incorporate NEXMET AHSS in their designs and that NEXMET AHSS will become a strong differentiator for us going forward.
Downstream Steel Applications
Our portfolio of steel solutions includes the operations of Precision Partners, which provides advanced-engineered solutions, tool design and build, hot and cold-stamped components and complex assemblies for the automotive market. In addition to Precision Partners, our downstream operations include Tubular Components, which manufactures advanced tubular products for automotive and other applications using carbon and stainless steels. We believe that collaboration among our steelmaking operations and our downstream businesses can accelerate the adoption of our innovative steel products by automotive manufacturers and their Tier 1 suppliers.
Our research and technical experts have undertaken numerous collaborative projects that are generating robust solutions for our customers. Precision Partners’ expertise in tool design and stamping capabilities has allowed us to create prototype components using AK Steel’s innovative new materials and present customers with new potential steel solutions. This approach has and, we expect, will continue to demonstrate to customers that they can significantly lightweight automotive parts on an accelerated timeline and in a cost-effective manner by using our highly formable grades of AHSS in place of traditional material types.
In addition, our collaborative projects are enhancing our collective knowledge and experience in the stamping of new, advanced grades of steel, advanced engineered solutions, and tool design and build. For example, Precision Partners specializes in hot-stamping PHS for automotive applications. AK Steel’s experience as a leader in PHS and Precision Partners’ expertise in hot-stamping has enabled these teams to have greater insight into these high-growth areas and has accelerated product development and customer adoption of these automotive light weighting solutions. Likewise, collaboration with Tubular Components strategically advances our mission to innovate in AHSS for the automotive industry, as Tubular Components has been at the forefront of producing tubular products from third-generation AHSS. We believe the combination of Precision Partners’ stamping and advanced die-making capabilities, Tubular Component’s leading tube making capabilities and our breakthrough material introductions will enhance our ability to deliver innovative, steel solutions to our customers.
Precision Partners has recently been awarded contracts with several customers to supply complex assemblies and stamped automotive parts. In winning these contracts, Precision Partners has been able to leverage our hot-stamping tooling leadership, in addition to our innovative hot-stamping process, to capture new strategic opportunities and demonstrate that Precision Partners is one of the few businesses in North America that has the technical capabilities to produce a major complex assembly and stamping work of this nature.
Competition
We principally competeSteelmaking segment primarily competes with domestic and foreign producers of flat-rolled carbon, plate, tinplate, stainless, rail and electrical steel, carbon and stainless tubular products, aluminum, carbon fiber, concrete and other materials that may be used as a substitute for flat-rolled steels in manufactured products. Precision PartnersOur Tooling and Stamping and Tubular Components businesses both compete against other niche companiesdownstream business in highly fragmented markets.
The steel industry is often viewed as volatile and is subject to the market price of steel. Market pricing can be adversely impacted from foreign competition selling steel products into the U.S. at discounts and the oversupply of steel products within the domestic market from both domestic and foreign competition. To limit our exposure to volatility from market pricing, we have structured our business to have an industry leading portion of fixed price contracts. Our fixed price contracts provide us stability on a large portion of our business when market pricing is volatile.
Price, quality, on-time delivery, customer service, technical expertise and product innovation are the primary competitive factors in the steel industry and vary in importance according to the product category and customer requirements. Steel producers that sell to the automotive market faceare required to meet strict and high-quality product specifications that demand strong technical capabilities, investment in capital and other resources to manage inventory, customer service, and research and development. As the largest supplier of steel to the automotive industry in North America, we continue to meet all the requirements needed to serve the automotive industry and maintain our position as an industry leader going forward. Significant capital investments in equipment, technology and other resources that would effectively replicate our processes, at a likely higher cost than ours, would be required for certain competitors to meet all the demands required of the automotive industry.
The steel industry has faced competition from aluminum manufacturers (and, to a lesser extent, other materials) as automotive manufacturers attempt to develop vehicles that will enable them to satisfy more stringent, government-imposed fuel efficiency standards.are lighter in weight. To address automotive manufacturers’ light weighting needs that the aluminum industry is targeting, we and others in the steel industry are developinghave developed AHSS grades that we believe provide weight savings similar to aluminum, while being stronger, less costly, more sustainable, easier to repair, more sustainable and more environmentally friendly. Aluminum penetration has been primarily limited to specific automotive applications, such as outer panels and closures, rather than entire
body designs. In addition, our automotive customers who continue to use steel, as opposed to aluminum and other alternative materials, are able to avoid the significant capital expenditures required to re-tool their manufacturing processes to accommodate the use of non-steel materials.
Mini-mills (producers using EAFs)EAFs comprise aboutover 70% of steel production and more than 40% of flat-rolled steel production in the U.S. TheirThe primary raw material ismaterials used by EAFs include scrap metal and ore based metallics, which hashave unpredictable and often volatile pricing. Additionally, the availability of these materials can be unreliable as most competition relies on imported ore based metallics. Due to therecently completed and further announced mini-millflat-rolled EAF capacity additions in the U.S. and increasing demand for scrap from China,focus on industry decarbonization, we expect the price of scrap to remain elevated over historical averages, providing our integrated footprint a competitive cost advantage. Mini-mills also generally offer a narrower range of products thanOur integrated steel mills, butfacilities utilize domestic internally sourced iron ore as the increasing use of pig iron and direct reduced iron have enabled them to modestly expand their product capabilities in recent years. However, we believe mini-mills often do not have the equipment capabilitiesprimary feedstock, which allows us to produce high-quality products with low residual content. We also possess the product range that integrated facilities offer, nor do we believe they possess ourbreadth and depth ofrelated to customer service, technical support, and research and innovation.development necessary to supply the demanding needs of the automotive industry and other demanding end markets. The additional capacity from domestic EAF competition could displace imports as the U.S. is still the largest net importer of steel in the world, and domestically produced steel is generally more environmentally friendly than imported steel.
Domestic steel producers including us,can face significant competition from foreign producers. For many reasons,In certain instances, these foreign producers are often are able to sell products in the U.S. at prices substantially lower than domestic producers. Depending on the country of origin, these reasons may include government subsidies; illegal dumping; lower labor, raw material, energy and regulatory costs; less stringent environmental regulations; less stringent safety requirements; the maintenance of artificially low exchange rates against the U.S. dollar; and preferential trade practices in their home countries. Since late 2017, import levels of flat-rolled products into the United States have shown a gradual and steady decline and have recently been more reflective of historical levels before the unprecedented surge that began in 2014. We believe the decline is at least partially attributableIn 2023, finished steel imports decreased 14% compared to the implementationprior year as imports were unattractive for the majority of 2023 due to low pricing spreads between the U.S. and other regions. However, a disparity between domestic and foreign steel prices or modifications to certain trade restrictions currently in place on imported steel over the past five years, including both targeted trade cases and the more broad Section 232 tariffs. Modifications to these trade restrictions by government officialsauthorities could directly or indirectly impact import levels in the future. Import levels are also affected to varying degrees by the relative level of steel production in China and other countries, the strength of demand for steel outside the U.S., and the relative strength or weakness of the U.S. dollar against various foreign currencies. Imports of finished steel into the U.S. accounted for approximately 18%21% of domestic steel market consumption in 2020.2023.
We continue to provide significant pension and healthcare benefits to a greatgreater number of our retirees compared to certain other domestic and foreign steel producers that do not provide such benefits to any or most of their retirees, which increasesimpacts our overall cost of production relative to certain other steelmakers. However, we have taken a number of actions to reduce pension and healthcare benefits costs, including using our size and scale to proactively renegotiate lower healthcare premiums, negotiating progressive labor agreements, that have significantly reduced total employment costs at all of our union-represented facilities, transferring all responsibility for healthcare benefits for various groups of retirees to VEBAs, offering voluntary lump-sum settlements to pension plan participants and lowering retiree benefit costs for salaried employees, and transferring pension obligations to highly rated insurance companies.employees. These actions have not only reduced some of the risks associated with our pension fundfunding obligations, but more importantly have reduced our risk exposure to performance of the financial markets, which areis a principal driver of pension funding requirements. We continue to actively seek opportunities to reduce pension and healthcare benefits costs.
EnvironmentENVIRONMENTAL MATTERS
Our mining, steel and downstream manufacturing operations are subject to various laws and regulations governing the protection of the environment. We monitor these laws and regulations, which change over time, to assess whether the changes affect our operations. We conduct our operations in a manner that is protective of public health and the environment.
Environmental matters and their management continuedcontinue to be an important focus at each of our operations throughout 2020, including operations at AK Steel (acquiredoperations. From 2017 to 2021, we invested approximately $1 billion into our Toledo direct reduction plant, which provides a low carbon intensity raw material to our steelmaking operations. The HBI produced from the plant requires less energy to produce compared to traditional feedstock and can be used in March 2020)blast furnaces to reduce emissions by improving energy efficiency and ArcelorMittal USA (acquired in December 2020). reducing the amount of coke required for steel production.
In the construction and operation of our facilities, substantial costs have been and will continue to be incurred to comply with regulatory requirements and avoid undue effect on the environment. In 2020, 2019,2023, 2022 and 2018,2021, our capital expenditures relating to environmental matters totaled approximately $34$66 million, $9$133 million and $10$62 million, respectively. Our current estimate for capital expenditures for environmental improvements in 20212024 is approximately $51$75 million for various water treatment, air quality, dust control, tailings management and other miscellaneous environmental projects. Additionally, we expect capital expenditures for environmental improvements for each of 20222025 and 20232026 to be generally in line with 2021's2024's estimated spending.
Regulatory DevelopmentsREGULATORY DEVELOPMENTS
Various governmental bodies continually promulgate new or amended laws and regulations that affect us, our customers and our suppliers in many areas, including air and water discharges, waste dischargemanagement and disposal, the classification of materials and products air and water discharges and other environmental, health and safety matters. Although we believe that our environmental policies and practices are sound and do not expect that the application of any current laws, regulations or permits would reasonably be expected to result in a material adverse effect on our business or financial condition, we cannot predict the collective potential adverse impact of the expanding body of laws and regulations. Moreover, because all domestic steel, scrap and mining producers operate under the same federal environmental regulations, we do not believe that we are more disadvantaged than our domestic competitors by our need to comply with these regulations. Some foreign competitors may benefit from less stringent environmental requirements in the countries where they produce, resulting in lower compliance costs for them and providing those foreign competitors with a cost advantage on their products.
Specifically, there are several notable proposed or potential rulemakings or activities that could have a material adverse impact on our facilities in the future depending on their ultimate outcome: Minnesota's potential revisionsclimate change and GHG regulations; changes to the National Ambient Air Quality Standard for particulate matter; changes to ozone transport regulations; selenium discharge regulation; Minnesota's sulfate wild rice water quality standard; evolving water quality standards for selenium and conductivity; scope of the Clean Water Act and the definition of “Waters of the United States”; Minnesota's Mercurymercury TMDL and mercury reduction rules; and changes to National Emission Standards for Hazardous Air Pollutants in the taconite, iron and steel, and coke sectors.
CLIMATE CHANGE AND GREENHOUSE GAS REGULATIONS
Continued attention to issues concerning climate change, the role of human activity in affecting climate change, and potential mitigation through regulation and legislation may have a material impact on our customers and suppliers, our operations and financial results in the future. Policymakers are evaluating or developing carbon regulation at the state, regional, national and international levels. Additionally, international treaties or agreements such as the Paris Agreement may influence legislative and regulatory decisions in the U.S. Potential climate-related regulations and legislation that could impact our business include reporting obligations, such as the climate accountability package enacted in California in late 2023, mandatory carbon reductions, carbon pricing mechanisms and trade policies, such as the European Union's Carbon Border Adjustment Mechanism, which entered into its transitional phase late in 2023, and climate-related procurement and product labeling requirements. The dynamic forward outlook for these potential regulations presents a challenge to large industrial companies to assess the long-term net impacts of carbon compliance costs on their operations. In the absence of comprehensive federal carbon legislation, numerous state, regional and federal regulatory initiatives are under development or are becoming effective, thereby creating a disjointed approach to GHG emissions control, potential carbon pricing and climate-related procurement activities. We intend to remain active in the discussions related to legislative and regulatory changes at the federal and state levels.
Our exposure on this issue includes both the direct and indirect financial risks associated rules governing mercury air emission reductions; Climate Change and GHG Regulation; the Regional Haze FIP Rule; andwith the regulation of dischargesGHG emissions, as well as potential physical risks associated with climate change adaptation. We are continuing to groundwater.review the physical risks related to climate change. As an energy-intensive business, we have a broad range of GHG emissions sources, such as iron ore furnaces and kilns, mobile equipment, EAFs and integrated steelmaking facilities, among others. As such, among our most significant regulatory risks are: (1) the costs associated with on-site emissions levels (direct impacts) or the reduction thereof; and (2) indirect costs passed through to us from energy providers and other suppliers (indirect impacts).
Minnesota’s Sulfate Wild Rice Water Quality StandardInternationally, mechanisms to require or incentivize emissions reductions are being implemented in various countries, with differing designs and stringency, according to resources, economic structure and politics. However, some foreign competitors may benefit from less stringent climate-related requirements, providing those foreign competitors with a cost advantage on their products.
The Minnesota Governor established a Wild Rice Task Force by Executive Order in May 2018 that provided recommendationsDue to the Governor’s Office on wild rice restorationpotential variety of federal, state or international carbon restriction schemes, our business and regulation. The existing water quality standard for wild rice has not been appliedcustomer base could suffer negative financial impacts over time as a result of increased energy, environmental and other costs to any of our discharge permits or enforced in decades, and it may be unenforceable because of legislation and because the water bodies to which the existing standard applies have never been identified specifically in rule, nor are there criteria for identifying them. The MPCA is complyingcomply with the legislationlimitations that prohibits enforcementcould be imposed on GHG emissions. We believe our exposure can be reduced by numerous factors, including engaging with relevant stakeholders and policymakers on potential GHG regulation and legislation; emissions reduction opportunities, such as energy efficiency, industrial electrification, carbon capture, utilization and sequestration, renewable energy and fuel flexibility, such as hydrogen; and other efficiency-improving material inputs, products and technologies.
CHANGES TO NATIONAL AMBIENT AIR QUALITY STANDARDS FOR PARTICULATE MATTER
On January 6, 2023, the EPA proposed changes to the National Ambient Air Quality Standards for particulate matter. The proposal sought comment on lowering the primary annual fine particulate matter (PM2.5) level from 12 micrograms per cubic meter (ug/m3) of air to 9 – 10 ug/m3 while taking comment on alternative annual standard levels down to 8 ug/m3 and up to 11 ug/m3. The EPA also proposed to retain the water quality current primary 24-hour PM2.5 standard untilof 35 ug/m3 while soliciting comments on revising the obsoletelevel as low as 25 ug/m3. The lower the standard, is updated basedthe greater potential effect on modern science. For these reasons,our operations. We actively engaged with various experts and trade associations to provide legal and technical comments on the impact ofproposal. On February 7, 2024, the proposed wild rice water qualityEPA issued a final rule lowering the primary annual PM2.5 standard to 9.0 ug/m3. This standard will be final 60 days after publication in the Federal Register and will affect permitting for new or modified sources after that date. States will have three and a half years to submit State Implementation Plans to the EPA detailing how they intend to address existing sources that affect any nonattainment areas in the state. The EPA retained the current primary 24-hour PM2.5 standard of 35 ug/m3. The potential changes to air pollution control equipment or operations needed at our Minnesota iron ore miningplants to comply with the new particulate matter standard are not known at this time, and pelletizing operationsthe potential cost is not estimable at this time, but it could have an adverse materialbe material. It is highly likely that the revised standard will be appealed, and a stay of the standard could be issued, but is uncertain.
CHANGES TO OZONE TRANSPORT REGULATIONS
In 2022, the EPA proposed to impose new standards for nitrogen oxide (an ozone precursor) on various industries (including the steel and iron ore sectors) that operate in specific states, including numerous states where we operate (Illinois, Indiana, Michigan, Minnesota, Ohio, Pennsylvania and West Virginia). Although there were changes in the final rule that resulted in less impact ifto our operations, we are requiredappealing the final rule as it applies to significantly reduce sulfatereheat furnaces and boilers. If the appeal is unsuccessful, then we will have to invest in our discharges.new or revised air pollution control equipment, for which the actual cost is unknown but could be material.
Selenium Discharge RegulationSELENIUM DISCHARGE REGULATION
In Michigan, theour Empire and Tilden mines have implemented compliance plans to manage selenium according to theapplicable permit conditions. The remaining infrastructure needed for managementConstruction of selenium in stormwater will likely be completed in 2021. Aa water treatment system for both facilities is anticipated sometime before 2028.to begin in 2028, and the system is anticipated to be operational in 2030. As of December 31, 2020,2023, included within our Empire asset retirement obligation is a discounted liability of approximately $100$131 million, which includes the estimated costs associated with the construction of Empire's portion of the required infrastructure and expected future operating costs of the treatment facilities. Additionally, included within our Tilden future
capital plan is approximately $20$32 million for the construction of Tilden's portion of the required infrastructure. We are continuing to assess and develop potential cost effective and sustainable selenium treatment technologies.
In July 2016, the EPA published new selenium fish tissue limits and lower lentic and lotic water column concentration criteria, which may someday increase the cost for treatment should EGLEthe Michigan Department of Environment, Great Lakes and Energy adopt these new standards in lieu of the existing limits required by the Great Lakes Water Quality Initiative. Accordingly, we cannot reasonably estimate the timing or long-term impact of thethese water quality criteria toon our business.
MercuryMINNESOTA'S SULFATE WILD RICE WATER QUALITY STANDARD
The Minnesota Governor established a Wild Rice Task Force by Executive Order in May 2018 that provided recommendations on wild rice restoration and regulation. The existing sulfate water quality standard for lakes and streams that contain wild rice has not been applied to any of our discharge permits or enforced historically by Minnesota. Further, the standard may be unenforceable because of legislation that prohibits the MPCA from enforcing it until the obsolete standard is updated based on modern science.
Minnesota submitted a list of impaired water revisions to the EPA in 2020. In 2021, the EPA disapproved of Minnesota’s draft list and subsequently announced its proposed list of wild rice water bodies that were impaired due to sulfate under the Clean Water Act’s Section 303(d) process, which resulted in the addition of 32 waters in November 2021. At this time, it is unknown how the MPCA intends to implement requirements to address sulfate impaired waters.
For these reasons, the impact of potential obligations to address sulfate concentrations in certain water discharges from our Minnesota iron ore mining and pelletizing operations is not estimable at this time, but it could have a material adverse impact if we are required to significantly reduce sulfate in certain discharges.
MINNESOTA'S MERCURY TMDL and Minnesota Taconite Mercury Reduction StrategyAND MERCURY REDUCTION RULES
In September 2014, Minnesota promulgated the Mercury Air Emissions Reporting and Reduction Rules, mandating mercury air emissions reporting and reductions from certain sources, including taconite facilities. The rule is applicablerules apply to all of our Minnesota iron ore mining and pelletizing operations and required submittal of a Mercury Reduction Plan to the MPCA by the end ofin 2018 with plan implementation requirements becoming effective on January 1, 2025. In the Mercury Reduction Plan, facilities evaluated if available control technologies cancould technically achieve a 72% mercury reduction rate. If available control technologies cannotcould not technically achieve a 72% mercury reduction rate, the facilities must propose alternative mercury reduction measures. One of the main tenets agreed upon for evaluating potential mercury reduction technologies during TMDL implementation and 2014 rule development proceedings was that the selected technology must meet the following “Adaptive Management Criteria”: the technology must be technically feasible; must be economically feasible; must not impact pellet quality; and must not cause excessive corrosion in the indurating furnaces or air pollution control equipment.
The Mercury Reduction Plans for our Minnesota facilities were submitted to the MPCA in December 2018.In 2020, the MPCA provided comments on the The plans and we responded in a timely manner. There isdetermined that there are currently no proven technologytechnologies to cost effectively reduce mercury emissions from taconite furnaces to achieve the targeted 72% reduction rate, while satisfying all four Adaptive Management Criteria. The Mercury Reduction Plans that were submitted to the MPCA include documentation that describes the results ofThis determination was based on detailed engineering analysis and research testing on potentialtesting. In January 2023, MPCA responded that certain technologies to support this determination. The resultsmay be appropriate, and MPCA requested submission of this analysis will continue to guide dialogue withrevised Mercury Reduction Plans from the MPCA.facilities within 180 days of the effective date of the forthcoming Taconite National Emission Standards for Hazardous Air Pollutants rule. Potential impacts to us are not estimable at this time because the revised Mercury Reduction Plans remain under development.
RISK AND TECHNOLOGY REVIEWS FOR TACONITE, INTEGRATED IRON AND STEEL, AND COKE CATEGORIES
Under the Clean Air Act, within eight years after promulgating National Emissions Standards for Hazardous Air Pollutants in industry-specific categories, the EPA must review the standards to determine whether they continue to protect public health with an ample margin of safety and additional technical information are currently being reviewed byprotect against adverse environment effects. In addition, the MPCA.EPA is required to review and revise the standard every eight years to account for improvements in HAP control technology or methods.
Climate Change and GHG Regulation
With the complexities and uncertainties associatedThe EPA has worked with the U.S.taconite and global navigationintegrated iron and steel industries for years to collect data in order to recalculate the risk from HAP emissions from each category and to address whether new technologies existed in those sectors. In 2020, the EPA determined that the risk from the sources in both of those categories was acceptable and adopted new rules for both sectors in 2020. However, also in 2020, a court ruled that the climate change issue as a whole, one of our potentially significant risksEPA must address all HAPs in its National Emissions Standards for Hazardous Air Pollutants Risk and Technology Reviews. See Louisiana Environmental Action Network, et al. v. Environmental Protection Agency and Andrew Wheeler 955 F.3d 1088 (D.C. Cir. 2020). The EPA then reopened the future is mandatory carbon pricing obligations. Policymakers arerulemakings for numerous source categories, including taconite and integrated iron and steel, to confirm that all HAPs had been addressed in the design process of carbon regulation atupdates to those rules.
In 2023, the state, regional, national and international levels. The currentEPA determined that several HAPs are emitted from the sectors that are not yet regulated, so the EPA proposed new standards for those specific HAPs. In addition, the EPA based some proposed regulatory patchwork of carbon compliance schemes presents a challenge for multi-facility entities to identify their near-term risks. Amplifying the uncertainty, the dynamic forward outlook for carbon pricing obligations presents a challenge to large industrial companies to assess the long-term net impacts of carbon compliance costschanges on their operations. Our exposure on this issue includes both the direct and indirect financial risks associated with the regulation of GHG emissions, as well as potential physical risks associated with climate change adaptation. We are continuing to review the physical risks related to climate change. As an energy-intensive business, our GHG emissions inventory includes a broad range of emissions sources, such as iron ore furnaces and kilns, diesel mining equipment, and integrated steelmaking facilities, among others. As such, our most significant regulatory risks are: (1) the costs associated with on-site emissions levels (direct impacts), and (2) indirect costs passed through to us from electrical and fuel suppliers (indirect impacts).
Internationally, mechanisms to reduce emissions are being implemented in various countries, with differing designs and stringency, according to resources, economic structure and politics. The Paris Agreement to reduce global GHG emissions and limit global temperature increases to 2 degrees Celsius became effective in November 2016 with 196 signatory countries. On January 20, 2021, President Biden signed an executive order triggering the 30-day process of rejoining the Paris Agreement, beginning the process of a pledge to reduce U.S. GHG emissions.During the Obama Administration, the U.S. became a signatory to the Paris Agreement with a pledge to reduce its GHG emissions by 26-28% from 2005 levels by 2025. Continued attention to issues concerning climate change, the role of human activity inwhat it and potential mitigation through regulation may have a material impact on our customer base, operations and financial resultsdeemed technological developments in the future.
Insectors. Several trade organizations commented on the U.S., future federal and/proposed rules with our input, and the rules are expected to be finalized in 2024. Some proposed changes, if finalized as proposed and if upheld on appeal, could result in significant expenditures for our taconite, iron and steel, or state carbon regulation potentially presents a significantly greater impact to our operations. To date,coke oven assets. At this time the U.S. Congress has not legislated carbon constraints. In the absence of comprehensive federal carbon legislation, numerous state, regional and federal regulatory initiativesexact expenditures are under development or are becoming effective, thereby creating a disjointed approach to GHG control and potential carbon pricing impacts.unknown. We intend to remain active inuse all available tools to ensure that the discussions relatedregulations are based on sound science and feasible technology.
In 2023, the EPA likewise determined that the residual risk from coke ovens and from coke pushing, quenching, and battery stacks were low, and that no new technology developments justified changes to legislativethe regulations. However, the EPA proposed new limits on formerly unregulated HAPs and regulatory changesother requirements that, taken together, could require investments at our coke facilities. At this time, the federal and state levels.amount of anticipated expenditures is unknown.
1412 | CLF 2023 FORM 10-K
DueOTHER GOVERNMENT LAWS AND REGULATIONS
In addition to environmental laws and regulations, we are subject to various laws and regulations around the potential patchwork of federal, stateworld. For example, changes in trade regulations, including tariffs or regional carbon restriction schemes,other import or export restrictions, could lead to lower or more volatile global steel prices, impacting our businessprofitability. In addition, health and customer base could suffer negative financial impacts over time assafety regulations, including OSHA and MSHA regulations, have necessitated, and may continue to necessitate, increased operating costs or capital investments to promote a result of increased energy, environmental and other costssafe working environment. We are also required to comply with complex foreign and U.S. laws and regulations, which may include the limitations that would be imposed on GHG emissions. We believe our exposure can be reduced substantially by numerous factors, including currently contemplated regulatory flexibility mechanisms, suchForeign Corrupt Practices Act and other anti-bribery laws, the European Union’s General Data Protection Regulation and other U.S. and foreign privacy regulations, and transportation and logistics regulations. The laws and regulations noted above, as allowance allocations, fixed process emissions exemptions, offsetswell as other applicable laws and international provisions; emissions reduction opportunities, including energy efficiency, biofuelsregulations, or the manner in which they are interpreted or enforced, may require us to make material investments in the form of additional processes, training and fuel flexibility; and business opportunitiescapital, among other things. For a discussion of the risks associated with pursuing combined heat and power partnerships and new products, including DR-grade pellets, HBI, fluxed pellets and other efficiency-improving technologies.
Regional Haze FIP Rule
In June 2005, the EPA finalized amendments to its regional haze rules that require states to establish goals and emission reduction strategies for improving visibility in all Class I national parks and wilderness areas to natural background levels by 2064. Among the states with Class I areas are Michigan and Minnesota, in which we currently own mining operations, and Indiana, in which we own steelmaking operations. The first phase of the regional haze rule required analysis and installation of BART on eligible emission sources and incorporation of BART and associated emission limits into SIPs.
EPA disapproved Minnesota's and Michigan's BART SIPs for taconite furnaces and instead promulgated a Taconite Regional Haze FIP in February 2013. We petitioned the Eighth Circuit Court of Appeals for a review of the FIP and filed a joint motion for stay of the 2013 FIP, which was granted in June 2013. We reached a settlement agreement with EPA, which was subsequently published in the Federal Register to implement components of the settlement agreement in April 2016, with an effective date of May 12, 2016. We believe the 2016 Regional Haze FIP reflects progress toward a more technically and economically feasible regional haze implementation plan. In November 2016, the Eighth Circuit Court of Appeals terminated the June 2013 stay and extended the deadlines in the original 2013 FIP. Cost estimates associated with implementation of the 2013 and 2016 FIPs are reflected in our five-year capital plan.
Due to inconsistencies in language describing the procedures for calculating NOx emission limits between the settlement agreement and the 2016 FIP final rule, we jointly filed a Petition for Reconsideration and Petition for Judicial Review in June 2016. We have been working toward a settlement agreement with EPA to resolve the outstanding issue with the emission limit calculation method and anticipate resolution of the issue in 2021. The outcome of this proceeding is not expected to have a material adverse impact on us.
In 2020, the states began a second decadal review, which examined if additional technological controls are warranted for certain sources. The states are required to submit their updated Regional Haze SIPs by July 2021. At this time, we do not expect any state will require additional emission control requirements on our operations. We will review and comment on SIPs as necessary in the states in which we operate.
Conductivity
Conductivity, the measurement of water’s ability to conduct electricity, is a surrogate parameter that generally increases as the amount of dissolved minerals in water increases. In December 2016, EPA issued a notice soliciting public comments on its draft guidance, Field-Based Methods for Developing Aquatic Life Criteria for Specific Conductivity. In April 2017, comments were submitted by our trade associations providing objective evidence indicating the draft methodology was scientifically flawed and unfit for promulgation. EPA confirmed in October 2019 that the 2016 draft guidance was rescinded in accordance with an August 2019 EPA memorandum regarding draft guidance documents and further expressed that EPA must update the science and subject future recommended methods or criteria for conductivity to peer review and public comment. Although the adoption of the previously proposed methodology is unlikely in the states, the Fond du Lac Band in Minnesota adopted certain conductivity criteria in 2020. We are assessing the impact of those criteria on our Minnesota iron ore mining and pelletizing operations and evaluating methods to challenge the criteria as a whole or on a site-by-site basis.
Definition of “Waters of the United States” Under the Clean Water Act
The EPA and Army Corps of Engineers published a final rule in October 2019 repealing the 2015 rule that was to become effective on December 23, 2019. On April 21, 2020, the EPA and the Department of the Army published the Navigable Waters Protection Rule in the Federal Register to finalize a revised definition of “waters of the United States” under the Clean Water Act. For the first time, the agencies have streamlined the definition so that it includes four simple categories of jurisdictional waters, provides clear exclusions for many water features that traditionally have not been regulated, and defines terms in the regulatory text that have never been defined before. The rule is on
appeal in various jurisdictions. The rule is not expected to have a material adverse effect on us, but we will continue to assess the potential impacts to our operations.
Regulation of Discharges to Groundwater
In general, states traditionally have regulated discharges of pollutants to groundwater through various programs such as wellhead protection programsapplicable laws and regulations, related to remediation. In April 2020, the United States Supreme Court held insee County of Maui v. Hawaiʻi Wildlife Fund that EPA (and delegated states) have jurisdiction under the NPDES program if the discharge to groundwater is the “functional equivalent” of a discharge to waters of the United States. Until now, the NPDES program has only regulated direct discharges to waters of the United States from point sources. EPA subsequently issued a guidance document on what the term “functional equivalent” means. Although we do not anticipate that broadening EPA jurisdiction over groundwater discharges will materially adversely affect our operations, the impact to our operations is not reasonably estimable at this time.Part I – Item 1A. Risk Factors.
Raw Materials and EnergyRAW MATERIALS AND ENERGY
Our steelmaking operations require iron ore, HBI, coke, coal, ferrous and carbon and stainless scrap, chrome, nickel, zinc and zincother alloys as primary raw materials. We also consume natural gas, electricity, industrial gases and diesel fuel at our steelmaking and mining operations. As a vertically integrated steel company, we are able to internally supply a majority of our ferrous raw materials needed for our steelmaking operations. We also attempt to reduce the risk of future supply shortages and price volatility in other ways. If multi-year contracts are available in the marketplace for those raw materials that we cannot supply internally, we may use these contracts to secure sufficient supply to satisfy our key raw material needs. When multi-year contracts are not available, or are not available on acceptable terms, we purchase the remainder of our raw materialsmaterial needs under annual contracts or conduct spot purchases. We also regularly evaluate alternative sources and substitute materials. Additionally, we may hedge portions of our energy and raw materials purchases to reduce volatility and risk. We believe that we have secured, or will be able to secure, adequate supply to fulfill our raw materials and energy requirements for 2021.2024.
The raw materials needed to produce a ton of steel will fluctuate based upon the specifications of the final steel products, the quality of raw materials and, to a lesser extent, differences among steel production equipment. For example, generally, in our integrated steelmaking facilities, we consume approximately 1.4 net tons of coal to produce one net ton of coke. The process to produce one ton of raw steel generally(generally defined as a carbon slab) requires approximately 1.4 net tons of iron ore pellets and/or HBI pellet equivalents, 0.3 to 0.4 net tons of coke and 0.3 net tons of steel scrap.scrap or scrap substitutes. At normal operating levels, we also consume approximately 5 to 6 MMBtu’s of natural gas per net ton produced.of raw steel produced, prior to rolling, finishing and further processing. Additionally, on average, our EAF'sEAFs require 1.1 net tons of ferrous orscrap, stainless scrap or scrap substitutes to produce one net ton of high quality steel. We consume approximately 420 kilowatt-hours of electricity per net ton of steel produced. While these estimated consumption amounts are presented to give a general sense of raw material and energy consumption used in our steel production, substantial variations may occur.
IRON ORE
We own or co-own five active iron ore mines in Minnesota and Michigan. Based on our ownership in these mines, our share of annual rated iron ore production capacity is approximately 28 million long tons, which supplies all of the iron ore needed for our steelmaking operations. Refer to Part I - Item 2. Properties for additional information.
HBI
Our investment into HBI production provides us access, when needed, to clean iron units in order to make advanced steel and stainless products. This access to our own production provides us flexibility and allows us to avoid the risks and carbon footprints of imported iron substitutes. Iron substitutes imported into the U.S. are traditionally sourced from regions of the world that have historically experienced greater political turmoil and have lower pollution standards than the U.S. Our investment demonstrates our raw material and company strategy in responsibly managing the risks of pricing, availability and overall carbon footprint of our critical inputs. We have an annual capacity of 1.9 million metric tons of HBI per year.
We typically purchase ferrous and stainless steel scrap, natural gas, a substantial portion of our electricity and most other raw materials at prevailing market prices, which may fluctuate with market supply and demand.
Iron Ore
We own or co-own five active iron ore mines in Minnesota and Michigan. Based on our ownership in these mines, our share of annual rated iron ore production capacity is approximately 28.0 million long tons, which supplies all of the iron ore needed for our steelmaking operations. Refer to Part I - Item 2. Properties for additional information.
Coke and CoalCOKE AND COAL
We own fivethree active cokemaking facilities, including twoone coke batteriesplant located within our steelmaking facilities.Burns Harbor facility. These facilities currently provide overapproximately half of the coke requirements for our steelmaking operations and have an annual rated capacity of approximately 3.92.6 million net tons. Additionally, we have coke supply agreements with suppliers that provide our remaining requirements. Our purchases of coke are made under annual or multi-year agreements
with periodic price adjustments. We typically purchase most of our metallurgical coal under annual fixed-price agreements.
We have annual rated metallurgical coal production capacity of 2.31.8 million net tons from our Princeton mine, which supplies a portion of our metallurgical coal needs. We typically purchase most of our metallurgical coal under annual fixed price agreements. We believe there are adequate external supplies of coke and coal available at competitive market prices to meet our needs. Refer to Part I - Item 2. Properties for additional information.
Steel ScrapSTEEL SCRAP
We own the assets of FPT, which provides us sourcing and Other Materialsprocessing capabilities for both prime and obsolete scrap. This access is critical, because prime scrap demand is expected to grow as new flat-rolled EAF capacity has started to come online and is expected to increase in the coming years. FPT includes 22 facilities that are primarily located in the Midwest near our steel
Generally, approximately 43%
facilities. Additionally, our access to scrap furthers our commitment to being an environmentally-friendly, low-carbon intensity steelmaker with a cleaner materials mix as we are able to better optimize productivity at our existing EAFs and BOFs.
The majority of our steel scrap requirements arecan be generated internally through normal operations.or processed from internal sources, including scrap generated at our steel production facilities. We believe that supplies of additional steel scrap to meet the needs of our steelmaking operations are readily available from outside sources at competitive market prices.
OTHER MATERIALS
We believe that supplies of chrome, nickel, zinc and zincother alloys adequate to meet the needs of our steelmaking operations are readily available from outside sources at competitive market prices.
EnergyENERGY
We consume a large amount of natural gas, electricity, industrial gases and diesel fuel, which are significant costs to our operations. The majority of our energy requirements are purchased from outside sources. Access to long-term, low costlow-cost sources of energy in various forms is critically important to our operations.
Natural gas is procured for our operations utilizing a combination of long-term, annual, quarterly, monthly and spot contracts from various suppliers at market-based pricing. We believe access to low-cost and reliable sources of natural gas is available to meet our operations’ requirements.
We purchase electricity for all of our operations in either regulated or deregulated markets. Due to the distinct nature of these markets,the regulated market, we procure electricity through either long-term or annual contracts. In deregulated markets, we purchase the majority of our electricity in the day-ahead market. Some of our operations also use self-generated coke oven gas and/or blast furnace gas to produce electricity, which is an environmentally-friendly practice that also reduces our need to purchase electricity from external sources. We also closely monitor developments at the state and federal levels that could impact electricity availability or cost and incorporate such changes into our electricity supply strategy in order to maintain reliable, low-cost supply. We also are currently contracting for the increased use of renewable energy to complement our existing supply, which will reduce our emissions profile. We believe there is an adequate supply of competitively priced electricity to fulfill our requirements.
We purchase industrial gases and diesel fuel under long-term contracts with various suppliers. We believe we have access to adequate supplies of industrial gases to meet our needs.
We predominantly purchase diesel fuel for our mining operations under long-term contracts with various suppliers.We believe we have access to adequate supplies ofand diesel fuel to meet our needs.
Human CapitalHUMAN CAPITAL
Cliffs has a long, proven history of attracting and retaining exceptional talent. We believe our employee-centric management philosophy is the key to our success.
As of December 31, 2020,2023, we employed approximately 25,000 people. Approximately 24,000 were28,000 people, with approximately 27,000 employed in the U.S., with the remainder employed in Ontario, Canada. Approximately 24,00026,000 employees were employed at production facilities, with the balance employed in corporate support roles. The vast majority of our approximately 20,00022,000 hourly employees were subject to collective bargaining agreements (approximately 18,500)20,000) with various labor unions. Overall,
LABOR RELATIONS
Our labor relations philosophy is a cornerstone of our talent strategy. At Cliffs, we know that maintaining strong, positive relationships with labor unions is key to our long-term growth. We recognize and respect the right of our employees to freely associate and collectively bargain, and we do not engage in harassment, intimidation or retaliation for their efforts to bargain collectively.
More than 90% of Cliffs’ hourly workforce are represented by three prominent unions — USW, UAW and IAM. The hardworking union-represented men and women of Cliffs are the lifeblood of our Company. Our employees operate and maintain our facilities and are, ultimately, responsible for safely delivering a quality product internally and to our customers. Therefore, we engage with our unions as business partners, and together we have good relationsachieved a number of successes that benefit our business and our people alike.
We are proud to report that we successfully renegotiated all of our open labor agreements during 2023 without any difficulty or disruption. Our hourly employees at our Northshore Mining operation also elected to unionize in 2023, and we successfully negotiated a new labor agreement there with the USW on an expedited basis. This positive partnership with our workforceunions helps us remain competitive for talent and theprotects our customers and their supply chains from disruptions due to labor unions that represent our hourly employees.disagreements.
TALENT RETENTION
We believe that our future success largely depends upon our continued ability to attract and retain a highly skilled workforce. We provide our employees with competitive salaries, incentive-based bonus programs that provide above-market compensation opportunities when theour Company performs well, development programs that enable continued learning and growth, and a robust benefitbenefits package that promotes well-being across all aspects of their lives, including health care, retirement planning and paid time off. In addition to these programs, we have used targeted, equity-based grants with vesting conditions to facilitate retention of key personnel. These tools have enabled us to increase the retention of key personnel, including our corporate and site leadership teams and critical technical talent.
ROBUST EMPLOYEE BENEFITS PROGRAMS
The success of our business is fundamentally connected to the well-being of our people. Accordingly, we are committed to the health, safety and wellness of our employees. We provide our employees and their families with access to a variety of innovative, flexible and convenient health and wellness programs, including benefits that provide protection and security so they can have peace of mind concerning events that may require time away from work or that impact their financial well-being; that support their physical and mental health by providing tools and resources to help them improve or maintain their health and encourage engagement in healthy behaviors; and that offer choice where possible so they can customize their benefits to meet their needs and the needs of their families. In response
DIVERSITY, EQUITY AND INCLUSION
We continue to the COVID-19 pandemic,foster a culture of diversity, equity and inclusion at Cliffs. Through our OneCliffs Way of Doing Business (our Code of Business Conduct and Ethics), we implemented significant changesoutline our Core Values, which include Trust, Respect and Open Communication. To us, this means encouraging and accepting different views and supporting and advancing gender and racial diversity. Further, our OneCliffs Way of Doing Business provides that we determined werewill not make employment-related decisions nor will we discriminate based on race, color, religion, national origin, age, military or veteran status, disability, sex (including sexual orientation and gender identity), pregnancy, genetic information, ethnicity or any other characteristic protected by applicable law. We strive to make Cliffs a safe place to work for all. Harassment and/or intimidation are not tolerated anywhere in the best interest ofour Company. This allows our employees as well asto develop a career at Cliffs by focusing on the communities in which we operate,meaningful and which comply with government regulations. This includes having all employees who could perform their work remotely work from home, while implementing numerous safety measures for employees continuing critical on-sitechallenging work at our operations.Company.
SafetySAFETY
Safe production is our primary core value as we continue toward achievingto reinforce a zero injury culture at our facilities. We constantly monitor our safety performance and make continuous improvements to affecteffect change. Best practices and incident learnings are shared globallythroughout the Company to ensure each facility can administer the most effective policies and procedures for enhanced workplace safety. Progress toward achieving our objectives is accomplished through a focus on proactive sustainabilitysustainable safety initiatives, and results are measured against established industry and companyCompany benchmarks, including our company-wideCompany-wide Total Reportable Incident Rate. During 2020,2023, our Total Reportable Incident Rate (including contractors) was 0.921.22 per 200,000 hours worked.
Refer to Exhibit 95 Mine Safety Disclosures (filed herewith) for mine safety information required in accordance with Section 1503(a) of the Dodd-Frank Act.
Available InformationAVAILABLE INFORMATION
Our headquarters are located at 200 Public Square, Suite 3300, Cleveland, Ohio 44114-2315, and our telephone number is (216) 694-5700. We are subject to the reporting requirements of the Exchange Act and its rules and regulations. The Exchange Act requires us to file reports, proxy statements and other information with the SEC.
The SEC maintains a website that contains reports, proxy statements and other information regarding issuers that file electronically with the SEC. These materials may be obtained electronically by accessing the SEC’s home page at www.sec.gov.www.sec.gov.
We use our website, www.clevelandcliffs.com, as a channel for routine distribution of important information, including news releases, investor presentations and financial information. We also make available, free of charge on our website, our Annual ReportReports on Form 10-K, Quarterly Reports on Form 10-Q, Current Reports on Form 8-K and amendments to these reports filed or furnished pursuant to Section 13(a) or 15(d) of the Exchange Act, as soon as reasonably practicable after we electronically file these documents with, or furnish them to, the SEC. In addition, our website allows investors and other interested persons to sign up to receive automatic email alerts when we post news releases and financial information on our website.
We also make available, free of charge, the charters of the Audit Committee, Strategy and Sustainability Committee, Governance and Nominating Committee, and Compensation and Organization Committee, as well as the Corporate Governance Guidelines, and the Code of Business Conduct and Ethics adopted by our Board of Directors. These documents are available through our investor relations page on our website at www.clevelandcliffs.com. The SEC filings are available by selecting “Financial Information”“Investors” and then “SEC Filings,” and corporate governance materials are available by selecting “Corporate Governance”"Investors" and then “Governance” for the Board Committee Charters, operational governance guidelinesthe Corporate Governance Guidelines, and the Code of Business Conduct and Ethics.
References to our website or the SEC’s website do not constitute incorporation by reference of the information contained on such websites, and such information is not part of this Annual Report on Form 10-K.
Copies of the above-referenced information are also available, free of charge, by calling (216) 694-5700 or upon written request to:
Cleveland-Cliffs Inc.
Investor Relations
200 Public Square, Suite 3300
Cleveland, OH 44114-2315
1815 | CLF 2023 FORM 10-K
INFORMATION ABOUT OUR EXECUTIVE OFFICERS
Following are the names, ages and positions of the executive officers of the Company as of February 26, 2021.8, 2024. Unless otherwise noted, all positions indicated are or were held with Cleveland-Cliffs Inc.
| | | | | | | | |
| Name | Age | Position(s) Held |
| Lourenco Goncalves | 6365 | Chairman, President and Chief Executive Officer (August 2014 – present); and Chairman, President and Chief Executive Officer of Metals USA Holdings Corp., an American manufacturer and processor of steel and other metals (May 2006 – April 2013). |
Clifford T. Smith | 6164 | Executive Vice President & President, Cleveland-Cliffs Steel (September 2021 – present); Executive Vice President, Chief Operating Officer (January 2019 – present)September 2021); and Executive Vice President, Business Development (April 2015 – January 2019). |
Keith A. Koci | 5659 | Executive Vice President & President, Cleveland-Cliffs Services (September 2021 – present); Executive Vice President, Chief Financial Officer (February 2019 – present)September 2021); and Senior Vice President and Chief Financial Officer, Metals USA Holdings Corp. (2013 – February 2019). |
| Celso Goncalves | 35 | Executive Vice President, Chief Financial Officer (September 2021 – present); Senior Vice President, Finance & Treasurer (March 2020 – September 2021); and Vice President, Treasurer (January 2018 – March 2020). |
Terry G. Fedor | 5659 | Executive Vice President, Operations (October 2022 – present); Executive Vice President, Operations, East (September 2021 – October 2022); Executive Vice President, Chief Operating Officer, Steel Mills (March 2020 – present)September 2021); Executive Vice President, Operations (February 2019 – March 2020); and Executive Vice President, U.S. Iron Ore (January 2014 – JanuaryFebruary 2019). |
Traci L. Forrester | 4952 | Executive Vice President, Environmental & Sustainability (May 2021 – present); Executive Vice President, Business Development (May 2019 – present)May 2021); and Vice President, (January 2018 – May 2019); Deputy General Counsel & Assistant Secretary (January 20172018 – May 2019); and Assistant General Counsel (August 2013 – January 2017). |
James D. Graham | 5558 | Executive Vice President, (November 2014Chief Legal and Administrative Officer & Secretary (January 2024 – present); Chief Legal Officer (March 2013 – present); and Secretary (March 2014 – present). |
Maurice D. Harapiak | 59 | Executive Vice President, Human Resources, (MarchChief Legal and Administrative Officer & Secretary (April 2022 – January 2024); and Executive Vice President, Chief Legal Officer & Secretary (November 2014 – present); and Chief Administration Officer (January 2018 – present)April 2022). |
Kimberly A. Floriani | 3841 | Senior Vice President, Controller & Chief Accounting Officer (August 2021 – present); Vice President, Corporate Controller & Chief Accounting Officer (April 2020 – present)August 2021); and Director, Accounting & Reporting (August 2015 – April 2020); Manager, Financial Reporting (January 2012 – August 2015). |
All executive officers serve at the pleasure of the Board. There are no arrangements or understandings between any executive officer and any other person pursuant to which an executive officer was selected to be an officer of the Company. Celso Goncalves, our Executive Vice President, Chief Financial Officer, is the son of Lourenco Goncalves, our Chairman, President and Chief Executive Officer. There is no other family relationship between any of our executive officers or between any of our executive officers and any of our directors.
1916 | CLF 2023 FORM 10-K
| | |
| | |
ItemITEM 1A. | Risk Factors RISK FACTORS |
An investment in our common shares or other securities is subject to risks inherent in our businesses and the industries in which we operate. DescribedWe describe below are certain risks and uncertainties, the occurrences of which could have a material adverse effect on us. The risks and uncertainties described below include known material risks that we face currently, but our material risks are constantly evolving, and the below descriptions may not include future risks that are not presently known, that are not currently believed to be material or that are common to all businesses. Investors should not interpret the disclosure of any risk to imply that such risk has not already materialized. Although we have extensive risk management policies, practices and procedures in place that are aimed to mitigateat mitigating these risks, the occurrence of these uncertainties may nevertheless impair our business operations and adversely affect the actual outcome of matters as to which forward-looking statements are made. This report is qualified in its entirety by these risk factors. Before making an investment decision, investors should carefully consider carefully all of the risks described below together with the other information included in this report and the other reports we file with the SEC.
Management has identified several categories of material riskrisks that we are subject to, including: (I) economic and market, (II) regulatory, (III) financial, (IV) operational, (V) developmentsustainability and sustainabilitydevelopment and (VI) human capital. Although we have organized the risks are organized by these headings and we have discussed each risk is discussed separately, many of the risks are interrelated.
I. ECONOMIC AND MARKET RISKS
The ongoing COVID-19 pandemic has had, and is expected to continue to have, an adverse impact on our businesses.
The ongoing COVID-19 pandemic is continuing to impact countries, communities, supply chains and markets. Responses by individuals, governments and businesses to the COVID-19 pandemic and efforts to reduce its spread, including quarantines, travel restrictions, business closures, and mandatory stay-at-home or work-from-home orders, have led to significant disruptions to overall business and economic activity. While vaccines are now being manufactured and distributed, it is currently unknown when or whether the economy will return to pre-pandemic levels of consumer and business activity.
During 2020, the COVID-19 pandemic adversely affected our businesses by temporarily curtailing certain of our end markets. In particular, the automotive industry, which we rely on directly and indirectly for a significant amount of our sales, was severely disrupted during the first half of 2020. The slowdown in the automotive industry led, in turn, to disruptions to our operations. For example, although our steel and mining operations are considered “essential” by the states in which we operate, certain of our mining and production facilities were idled for various periods during 2020 in response to the decrease in customer demand. While we were able to resume operations at many of these facilities later in 2020, we cannot predict whether any other production facilities or mines will experience disruptions in the future as a result of adverse impacts of the COVID-19 pandemic.
In addition, the COVID-19 pandemic has heightened the risk that a significant portion of our workforce and on-site contractors will suffer illness or otherwise be unable to perform their ordinary work functions. While we instituted remote work policies where practical across our footprint, the safe and responsible operation of our production facilities often requires that workers be on-site. Accordingly, during 2020, we experienced direct and indirect workforce impacts from COVID-19 at many of our operations. We also may need to reduce our workforce as a result of declines in our business caused by the COVID-19 pandemic, and there can be no assurance that we will be able to rehire our workforce once our business has recovered. We may also experience supply chain disruptions or operational issues with our vendors, as our suppliers and contractors face similar challenges related to the COVID-19 pandemic.
Because the impact of the COVID-19 pandemic continues to evolve, we cannot predict the full extent to which our businesses, results of operations, financial condition or liquidity will ultimately be impacted. To the extent the COVID-19 pandemic adversely affects our businesses, it may also have the effect of exacerbating many of the other risks described in this ‘‘Risk Factors’’ section, any of which could have a material adverse effect on us.
The volatility of commodity prices, including steel, and iron ore and scrap metal, directly and indirectly affects our ability to generate revenue, maintain stable cash flows and fund our operations, including growth and expansion projects.operations.
Our profitability is dependent upon the historically volatile market prices of the steel, and iron ore products that we sell to our customers and the prices of the products our customers sell. As an integrated producer of steel and iron ore, wescrap metal. We experience direct impacts of steel price fluctuations through customer sales, as well as direct and indirect impacts of iron ore and scrap metal price fluctuations through third-party sales and the impacts that fluctuationsmovements in iron ore and scrap metal prices have on steel prices. TheAs described elsewhere in this report, the prices of steel, and iron ore and scrap metal have fluctuated significantly in the recent past, and these pricing shifts are unpredictable and affected by factors beyond our control, including: international demand for, and the impact of higher rates of inflation on, raw materials used in steel production; availability of scrap metal substitutes such as pig iron; commodity price speculation; rates of global economic growth, especially
construction and infrastructure activity that requires significant amounts of steel; changes in the levels of economic activity in the U.S., China, India, Europe and other industrialized or developing economies;economies, including as a result of geopolitical conflicts or otherwise; changes in China’s emissions policies and environmental compliance enforcement practices; changes in the production capacity, production rate and inventory levels of other steel producers, anddistributors, iron ore suppliers;suppliers and scrap metal processors and traders; changes in trade laws; volumes of unfairly traded imports; imposition or termination of duties, tariffs, import and export controls and other trade barriers impacting the steel and iron ore markets; climate change and other weather-related disruptions, infectious disease outbreaks, such as the COVID-19 pandemic, or natural disasters that may impact the global supply of steel, iron ore or iron ore;scrap metal; and the proximity, capacity and cost of infrastructure and transportation.
Our earnings,revenues, therefore, may fluctuatevary in accordance with the prices of the products we sell and ofsell. During 2023, for example, we experienced lower average selling prices for our steel products as compared to 2022 due to the products our customers sell.impact from lower index pricing, which resulted in lower revenues despite increased sales volumes. To the extent that thecommodity prices, of steel and iron ore, including the hot-rolled coil steelHRC price, coated and other specialty steel prices, the Platts 62% Price, pellet premiumsinternational steel prices and Platts international indexed freight rates,scrap metal prices, significantly decline for an extended period, of time, whether due to the COVID-19 pandemic or otherwise, we may have to further revise our operating plans, including curtailing production, reducing operating costs and deferring capital expenditures, and discontinuing certain exploration and development programs. Weexpenditures. As a result, we also may have to takerecord impairments on our goodwill, intangible assets, long-lived assets and/or inventory. Sustained lower prices also could cause us to further reduce existing mineral reserves if certain reserves can no longer can be economically mined or processed at prevailing prices. WeParticularly during periods of increased inflation resulting in higher input costs, we may be unable to decrease our costs in an amount sufficient to offset reductions in revenues and may incur losses. These events could have a material adverse effect on us.
We sell a significant portion of our steel products to the automotive market, and fluctuations or changes in the automotive market could adversely affect our business operations and financial performance.
For the full-year 2020, approximately 40% of AK Steel’s and ArcelorMittal USA's combined sales were toThe largest end user for our steel products is the automotive market.industry in North America. Beyond these direct sales to the automotive industry, we make additional sales to distributors and converters, which may ultimately resell some of that volume to the automotive market. In addition to the sizemagnitude of our exposure to the automotive industry, we face risks arising from our relative concentration of sales to certain specific automotive manufacturers, including severaland our sales volumes and revenues may be adversely affected if we are unable to renew our fixed price contracts with one or more significant automotive customers that idledor if those customers choose to move certain automotive production facilities in 2020 in responseportions of their parts business to the COVID-19 pandemic. In addition, automotivealternate suppliers. Automotive production and sales are cyclical and sensitive to general economic conditions and other factors, including interest rates, consumer credit, and consumer spending and preferences, as well as the current COVID-19 pandemic.and supply chain disruptions. If automotive production and sales decline, whether due to consumers facing reduced purchasing power caused by inflation, higher interest rates or otherwise, our sales and shipments to the automotive market are likely to decline in a corresponding manner. Adverse impacts that we may sustain as a result include, without limitation, lower margins because of the need to sell our steel to less profitable customers and markets, higher fixed costs from lower steel production if we are unable to sell the same amount of steel to other customers and markets, and lower sales, shipments, pricing and margins generally as our competitors face similar challenges and compete vigorously in other markets that we serve. These adverse impacts wouldcould negatively affect our sales,revenues, financial results and cash flows. Additionally, the trend toward light weighting in the automotive industry, which requires lighter gauges
Moreover, despite our newly acquired position as the largest flat-rolled steel producer in North America, competition for automotive business has intensified in recent years, as steel producers and companies producing alternative materials have focused their efforts on capturing and/or expanding their market share of automotive business because of less favorable conditions in other markets for steel and other metals, including commodity products and steel for use in the oil and gas markets.products. As a result, the potential exists that we may lose market share to existing or new entrants or that automotive manufacturers will take advantage of the intense competition among potential suppliers during annualperiodic contract renewal negotiations to pressure our pricing and margins in order to maintain or expand our market share with them, which could negatively affect our sales,revenues, financial results and cash flows.
Global steelmaking overcapacity, steel imports and oversupply of iron ore could lead to lower or more volatile global steel and iron ore prices, directly or indirectly impacting our profitability.
Significant existing global steel capacity and new or expanded production capacity in North America in recent years has caused and continues tocould potentially cause capacity to exceed demand globally, as well as in our primary markets in North America.globally. Although certain of our U.S. competitors temporarilyhave shut down production capacity, during the COVID-19 pandemic, a restartcertain of previously idledour competitors have announced and are moving ahead with plans to develop new steelmaking capacity and the development of new capacity by our U.S. competitors has occurred in recent months and may occur in the future in connection with any economic recovery following the COVID-19 pandemic.near term. In addition, certain foreign competitors, which may have cost advantages due to being owned, controlled or subsidized by foreign governments, have substantially increased their steel production capacity in the last few years and in some instances appear to have targeted the U.S. market for imports. Also, some foreign economies, such as China, have slowed relative to recent historical norms, resulting in an increased volume of steel
products that cannot be consumed by industries in those foreign steel producers’ own countries. The risk of even greater levels of imports may continue, depending upon foreign market and economic conditions, changes in trade agreements and treaties, laws, regulations or government policies affecting trade, the ability of foreign producers to circumvent U.S. trade sanctions and policy (including in the markets for tin mill products and electrical steels), the value of the U.S. dollar relative to other currencies and other variables beyond our control. A significant further increase in domestic steel capacity or foreign imports could adversely affect our sales, financial results and cash flows. In addition, recent increases in thehigher sustained market prices of steel and iron ore products could cause new producers to enter the market or existing producers to further expand productive capacity.capacity, which could in turn lead to lower steel prices and increasing prices of steelmaking inputs, such as scrap metal. Excess steel and iron ore supply combined with reduced global steel demand including in China,and increased imports could also lead to lower steel and iron ore prices, which would typically contribute to lower steel prices, as iron ore is a principal steelmaking raw material.prices. Downward pressure on steel and/or iron ore and/or steel prices could have an adverse effect on our results of operations, financial condition and profitability.
Severe financial hardship or bankruptcy of one or more of our major customers or key suppliersvendors could adversely affect our business operations and financial performance.
Sales and operations offor a majority of our customers are sensitive to general economic conditions especially, with respect to our steel customers, as they affectin the North American automotive, housing, construction, appliance, energy, defense and other industries. Some of our customers are highly leveraged. If there is a significant weakening of current economic conditions, whether because of operational, cyclical, supply chain or other issues, including the COVID-19 pandemic,inflationary pressures, higher interest rates or an infectious disease outbreak, it could cause customers to reduce, delay or cancel their orders with us, impact significantly the creditworthiness of our customers, and lead to other financial difficulties or even bankruptcy filings by our customers. Failure to receive payment from our customers for products that we have delivered could adversely affect our results of operations, financial condition and liquidity. The concentration of customers in a specific industry, such as the automotive industry, may increase our risk because of the likelihood that circumstances may affect multiple customers at the same time. For example, during the first half of 2020, the automotive industry was significantly disrupted by the COVID-19 pandemic, which concurrently adversely impacted multiple customers. Such events could cause us to experience lost sales or losses associated with the potential inability to collect all outstanding accounts receivable andas well as reduced liquidity. Similarly, if our key suppliersvendors face financial hardship or need to operate in bankruptcy, as we experienced with one of our major steel mill slag services providers during 2022-2023, such suppliersvendors could experiencesuffer operational disruption or even face liquidation, which could result in such vendor defaulting on its obligations to us or in our inability to secure replacement raw materials or services on a timely basis, or at all, or cause us to incur increased costs to do so. Such events could adversely impact our continuity of operations, financial results and cash flows.
II. REGULATORY RISKS
U.S. government actions on trade agreements and treaties, laws, regulations, or policies affecting trade could lead to lower or more volatile global steel or iron ore prices, impacting our profitability.
In recent years, the U.S. government has altered its approach to international trade policy, both generally and with respect to matters directly and indirectly affecting the steel industry, including by undertaking certain unilateral actions affecting trade, renegotiating existing bilateral or multilateral trade agreements, and entering into new agreements or treaties with foreign countries. For example, in March 2018, the U.S. government issued a proclamation pursuant to Section 232 imposing a 25% tariff on imported steel. These Section 232 tariffs were imposed on national security grounds and addressed imported steel that was being unfairly traded by certain foreign competitors at artificially low prices. In retaliation against the Section 232 tariffs, the European Union subsequently imposed its own tariffs against certain steel products and other goods imported from the U.S. Moreover, in light ofFollowing the November 2020 U.S. presidential election, negotiations between the U.S. government leadership changes resulting from the November 2020 federal congressional and presidential elections, it is currently uncertain what changes, if any,other governments have resulted in revisions to these measures. For example, the U.S. government agreed to modified tariff rate quota systems with each of the European Union, Japan and the United Kingdom that allow more imports from those trading partners to enter the U.S. market free of Section 232 tariffs. The U.S. government may make to its recent tariff and trade policies and priorities.also negotiate reductions or eliminations of Section 232 duties with other trading partners. If for example, the Section 232 tariffsmeasures are further removed or substantially lessened, whether through legal challenge, legislation, executive action or otherwise, imports of foreign steel would likely increase and steel prices in the U.S. would likely fall, which could materially adversely affect our sales,revenues, financial results and cash flows.
In addition, during 2020, the USMCA was implemented among the U.S., Mexico and Canada in place of the North American Free Trade Agreement. Because all of our steel manufacturing facilities are located in North America and one of our principal markets is automotive manufacturing in North America, we believe that the USMCA has the potential to positively impact our business by incentivizing automakers and other manufacturers to increase manufacturing production in North America and to use North
American steel. However, it is difficult to predict the short- and long-term implications of changes in trade policy and, therefore, whether the USMCA or other new or renegotiated trade agreements, treaties, laws, regulations or policies that may be implemented in connection withby the recent U.S. government, leadership changes, or otherwise, will have a beneficial or detrimental impact on our business and our customers’ and suppliers’ businesses. Adverse effects could occur directly from a disruption to trade and commercial transactions and/or indirectly by adversely affecting the U.S. economy or certain sectors of the economy, impacting demand for our customers’ products and, in turn, negatively affecting demand for our products. Important
links of the supply chain for some of our key customers, including automotive manufacturers, could be negatively impacted by the USMCA or other new or renegotiated trade agreements, treaties, laws, regulations or policies. Any of these actions and their direct and indirect impacts could materially adversely affect our sales, financial results and cash flows.
AlthoughWhile we may currently benefit from certain antidumping and countervailing duty orders, any such relief is subject to periodic reviews and challenges, which can result in revocation or modification of the orders or reduction of the duties. In addition,During 2022 and 2023, the U.S. International Trade Commission reviewed and continued antidumping and countervailing duty orders covering imports from several major trading partners of some of our key products, including corrosion-resistant steel, cold-rolled steel, hot-rolled steel and cut-to-length plate. However, previously granted and future petitions for trade relief may not be successful or fully effective at preventing harm. Even if received, it is uncertain if any relief will be continued in the future or will be adequate to counteract completely the harmful effectsharm from dumped and subsidized imports. Any of unfairly traded imports.these actions and their direct and indirect impacts could materially adversely affect our revenues, financial results and cash flows.
We are subject to extensive governmental regulation, which imposes and will continue to impose, potentialpotentially significant costs and liabilities on us. Future laws and regulations or the manner in whichway they are interpreted and enforced could increase these costs and liabilities or limit our ability to produce our raw materials and products.
New laws or regulations, or changes in existing laws or regulations, including the response of federal, state, local and foreign governments to the COVID-19 pandemic or arising out of the changes in U.S. government leadership resulting from the November 2020 elections, or the manner of their interpretation or enforcement, could increase our cost of doing business and restrict our ability to operate our businesses or execute our strategies. This includes, among other things,things: changes in the interpretation of MSHA regulations, such as workplace exam rules or safety aroundrespirable silica standards and surface mobile equipment rules; reevaluation of the National Ambient Air Quality Standards, such as revised nitrogen dioxide, sulfur dioxide, lead, ozone and particulate matter criteria,criteria; changes in the interpretation of OSHA regulations, such as standards for occupational exposure to noise, certain chemicals or hazardous substances, and infectious diseases and potentially hazardous machinery; and changes in tax laws and regulations, including the possible taxation under U.S. lawor foreign country laws of certain income from foreignworldwide operations.
In addition, weWe and our operations are subject to various international, foreign, federal, state, provincial and local laws and regulations relating to protection of the environment and human health and safety, including those relating to air quality, water pollution,quality and conservation, plant, wetlands, natural resources and wildlife protection (including endangered or threatened species), reclamation, remediation and restoration of properties and related surety bonds or other financial assurances, land use, the discharge of materials into the environment, the effects that industrial operations and mining have on groundwater quality conductivity and availability, the management of electrical equipment containing polychlorinated biphenyls, and other related matters. Compliance with numerous governmental permitsDespite implementation of rigorous environmental protocols and approvals is required for our operations. Wemanagement systems, we cannot be certain that we have been or will be at all times in complete compliance with all such laws regulations, permits and approvals.regulations. If we violate or fail to comply with these laws regulations, permits or approvals,regulations, we could be fined, required to cease operations, subject to criminal or civil liability, or otherwise sanctioned by regulators.regulators or barred from participating in government contracts. In particular,addition, federal or state regulatory agencies have the authority under certain circumstances following significant health and safety incidents, such as fatalities, to order a mine or production facility to be temporarily or permanently closed.closed where imminent danger that could cause death or serious physical harm is perceived. Compliance with the complex and extensive laws and regulations to which we are subject imposes substantial costs on us, which could increase over time because of heightened regulatory oversight, adoption of more stringent environmental, health and safety standards and greater demand for remediation services leading to shortages of equipment, supplies and labor, as well as other factors.
Specifically, there are several notable proposed or recently enacted rulemakings or activities to which we would be subject or that would further regulate and/or tax us and our customers, which may also require us or our customers to reduce or otherwise change operations significantly or incur significant additional costs, potentially limiting our ability to produce our raw materials and products, depending on their ultimate outcome. These emerging or recently enacted rules, regulations and policy guidance include, but are not limited to: governmental regulations imposed in response to the COVID-19 pandemic; trade regulations, such as the USMCA and/or other trade agreements, treaties or policies; tariffs, such aschanges in tariff policy, including with respect to the 25% tariff on certain imported steel imposed under Section 232; Minnesota’s potentialclimate change mitigation strategies and GHG regulation; selenium discharge regulation; revisions to the sulfate wild rice water quality standard; evolving water quality standards for seleniumstandard and conductivity; scope of the Clean Water Act and the definition of “Waters of the United States”;its implementation; Minnesota’s Mercury TMDL and associated federal rules governing mercury air emission reductions; Climate Change and GHG Regulation; the Regional Haze FIP Rule; ozone transport regulations; agency decisions related to environmental justice initiatives; revised National Ambient Air Quality Standards, particularly for ozone and particulate matter; revised National Emission Standards for Hazardous Air Pollutants in the regulation of dischargestaconite, coke, and iron and steel sectors; and additional regulations regarding per- and polyfluoroalkyl substances. We similarly expect both federal and state governments to water. In addition, the Biden Administration has indicated via executive orders and in campaign statements that it willcontinue to propose more stringent environmental regulation, in particular related to climate change. Any new or more stringent legislation, regulations, rules, interpretations or orders, when enacted and enforced, including any related to required monitoring and reporting or reductions in, or taxes on, levels of carbon emissions, could have a material adverse effect on our business, results of operations, financial condition or profitability.
Our operations may be impacted by the recent enactment, and ongoing consideration, of significant federal and state laws and regulations relating to certain mine-related issues, such as the stability of tailings basins, mine drainage and fill activities, reclamation and safety in underground and surface mines. With respect to underground mines, for
example, these laws and regulations include requirements for constructing and maintaining caches for the storage of additional self-contained self-rescuers throughout undergroundthe mines; installing rescue chambers in undergroundthe mines; continuous tracking of and communication with personnel in the mines; installing cable lifelines from the mine portal to all sections of the mine to assist in emergency escape; submission and approval of emergency response plans; and additional safety training. Additionally, there are requirements for the prompt reporting
of accidents and increased fines and penalties for violations of these and existing regulations. These laws and regulations may cause us to incur substantial additional costs.
Additionally,In addition, certain of our operations are subject to the risks of doing business abroad and we must comply with complex foreign and U.S. laws and regulations, which may include, but are not limited to, the Foreign Corrupt Practices Act and other anti-bribery laws, regulations related to import/export and trade controls, the European Union’s General Data Protection Regulation and other U.S. and foreign privacy regulations, and transportation and logistics regulations. These laws and regulations may increase our costs of doing business in international jurisdictions and expose our operations and our employees to elevated risk. We require our employees, contractors and agents to comply with these and all other applicable laws and regulations, but failure to do so could result in possible administrative, civil or criminal liability and reputational harm to us and our employees.
As a supplier on federal, state and local public procurement projects, including projects that may arise out of proposed or recently enacted governmental legislation regarding infrastructure investments such as the Infrastructure Investment and Jobs Act of 2021, we may be subject to certain stringent procurement regulations that may present compliance challenges or may increase the costs of securing certain business. We may also be indirectly affected through regulatory changes that impact our customers, which in turn could reduce the quantity of our products they demand, adversely impact the terms upon which they purchase or the prices for our products they are willing to pay. Regulatory changes that impact our suppliers, such as any changes in labor or environmental standards in China, could decrease the supplyavailability of products or availability of services they sell to us or could increase the price they demand for products or services they sell to us.
Our operations use hazardous materials and inadvertently may impact the environment, or cause exposure to hazardous substances, which could result in material liabilities to us.
Our operations currently use, and have in the past used, hazardous materials and from time to time,substances, and we have generated, and expect to continue to generate, solid and hazardous waste. We have been, and may in the future be, subject to claims under international, foreign, federal, state, provincial and local laws and regulations for toxic torts, natural resource damages and other damages as well as for the investigation and clean-up of soil, surface water, sediments, groundwater and other natural resources and reclamation of properties. Such claims for damages, as well as investigation, remediation and reclamation requirements, have arisen and may arise in the future out of current, future or former conditions at sites that we or our acquired companies currently own, lease or operate, as well as sites that we or our acquired companies formerly owned, leased or operated, and at contaminated sites that are or have been owned, leased or operated by our joint venture partners. We may also have liability for contamination at third-party sites where we have sent hazardous wastes. Our liability for these claims may be strict and/or joint and several, such that we may be held responsible for more than our share of the contamination or other damages, or even for entire claims regardless of fault. We are currently subject to potential liabilities relating to investigation and remediation activities at certain sites. In addition to sites currently owned, leased or operated, these include sites where we formerly conducted raw material processing or other operations, inactive sites that we currently own, formerly owned predecessor sites, acquired sites, leased land sites and third-party waste disposal sites. We may be named as a potentially responsible party at other third-party sites in the future, and we cannot be certain that the costs associated with these additional sites will not exceed any reserves we have established or otherwise be material.
We also are subject to claims asserting bodily injuries arising from alleged exposure to hazardous substances. For example, certain of our subsidiaries have been named in lawsuits claiming exposure to asbestos, many of which have been dismissed and/or settled for non-material amounts. It is likely that similar types of claims will continue to be filed in the future.
We may be unable to obtain, maintain, renew or comply with permits and licenses necessary for our operations or be required to provide additional financial assurances, which could reduce our production, cash flows, profitability and available liquidity.
We must obtain, maintain and comply with numerous permits and licenses that require approval of operational plans and impose strict conditions on various environmental, health and safety matters in connection with our steel production and processing and mining and other operations. These include permits and approvals issued by various federal, state, provincial, foreign and local agencies and regulatory bodies.bodies, with which we may not always be able to comply. The permitting rules are complex and may change over time, making our ability to comply with the applicable requirements more difficult or potentially impractical and costly, possibly precluding the continuance of ongoing operations or the development of future operations. Interpretations of rules may also change over time and may lead to requirements, such as additional financial assurance,assurances, making it costlier to comply. For example,Moreover, despite our ongoing efforts to reduce our environmental footprint and improve the resiliency of our business model, heightened levels of regulatory oversight with respect tofocused on addressing climate change and industrial activities that generate GHG emissions, such as our coalsteelmaking, cokemaking and mining operations, acquired as part of the AM USA Transaction could impact, delay, or disrupt our ability to obtain new or renewed permits or modifications to existing permits.
In addition, the public, including special interest groups and individuals, have certain rights under various statutes and burgeoning environmental justice policies to comment upon, submit objections to, and otherwise engage in the permitting process, including bringing citizens’ lawsuits to challenge such permits or activities. Accordingly,For example, we have encountered and expect to continue to encounter public objections to permit renewal applications relating to certain of our major steelmaking facilities, including our Indiana Harbor Works. Due to these factors or for other reasons, required permits may not be issued or renewed in a timely fashion (oror at all),all, or permits issued or renewed may include conditions that we cannot meet or otherwise be conditioned in ways that may restrict our ability to conduct our production, mining and miningprocessing activities efficiently or include requirements for additional financial assurances that we may not be able to provide on commercially reasonable terms (oror at all),all, which could reduce available borrowing capacity under our ABL Facility. Such conditions, restrictions or requirements could also reduce our production, cash flows profitability or liquidity.profitability.
III. FINANCIAL RISKS
Our existing and future indebtedness may limit cash flow available to invest in the ongoing needs of our businesses, which could prevent us from fulfilling our obligations under our senior notes, ABL Facility and other debt, and we may be forced to take other actions to satisfy our obligations under our debt, which may not be successful.
As of December 31, 2020,2023, we had $5,595$3,192 million aggregate principal amount of long-term debt outstanding, $2,195$829 million of which was secured (excluding $247$56 million of outstanding letters of credit and $335$215 million of finance leases), and $112$198 million of cash on our balance sheet. Onstatement of consolidated financial position. As of December 9, 2020, in connection with the consummation of the AM USA Transaction, we amended our ABL Facility to, among other things, increase the tranche A revolver commitments available under the ABL Facility by an additional $1,500 million. After giving effect to this amendment, the31, 2023, $3,192 million aggregate principal amount of tranche Aour senior notes was outstanding. The aggregate principal amount of revolver commitments under our ABL Facility is $3,350 million, and the aggregate principal amount of tranche B revolver commitments under our ABL Facility remains at $150 million.$4.75 billion. As of December 31, 2020, $1,510 million was2023, we had no outstanding borrowings under our ABL Facility, and the principal amount of letters of credit obligations and other commitments totaled $247$56 million. As of December 31, 2020, the available2023, borrowing capacity onavailability under our ABL Facility was $1,743 million.$4,341 million based on outstanding letters of credit obligations and our borrowing base at that time.
We dedicate aA portion of our cash flow from operations is used to the payment ofservice debt service,under our senior notes and ABL Facility, reducing the availability of our cash flow to fund capital expenditures, acquisitions or strategic development initiatives, and other general corporate purposes. purposes or to return capital to shareholders, including via share repurchases. Although it is uncertain whether the U.S. Federal Reserve will lower, maintain or further raise interest rates during 2024 and beyond, higher rates would increase the amount of cash we would need to allocate to servicing the interest expense on our debt in the event we have an outstanding balance drawn under our ABL Facility.
Our ability to make scheduled payments on the principal, premium, if any, and interest on our debt, or to refinance our debt obligations, depends on our ability to generate cash in the future and our financial condition and operating performance, which are subject to prevailing economic and competitive conditions and to certain financial, business and other factors beyond our control, as described elsewhere in this “Risk Factors” section. If we are unable to service our debt obligations, we could face substantial liquidity problems and we may be forced to reduce or delay investments, capital expenditures and share repurchases, or to sell assets, seek additional capital, including additional secured or unsecured debt, or restructure or refinance our debt, and we may be unable to continue as a going concern. We may be unable to consummate any proposed asset sales or recover the impactcarrying value of the COVID-19 pandemic. There canthese assets, and any proceeds may not be no assurance that we will maintainadequate to meet any debt service obligations then due. Any of these examples potentially could have a level of cash flows from operating activities sufficient to permit us to pay the principal, premium, if any, and interestmaterial adverse impact on our debt.results of operations, profitability, shareholders’ equity and capital structure. In addition, anya failure to comply with any applicable covenants in the instruments governing our debt could result in an event of default that, if not cured or waived, would have a material adverse effect on us.
Our level of indebtedness could have further consequences, including, but not limited to, increasing our vulnerability to adverse economic or industry conditions, placing us at a competitive disadvantage compared to other businesses in the industries in which we operate that are not as leveraged and that may be better positioned to withstand economic downturns and recessionary environments, limiting our flexibility to plan for, or react to, changes in our businesses and the industries in which we operate, and requiring us to refinance all or a portion of our existing debt. We may not be able to refinance on commercially reasonable terms or at all, and any refinancing of our debt could be at higher interest rates and may require us to comply with more onerous covenants, making it more difficult to obtain surety bonds, letters of credit or other financial assurances that may be demanded by our vendors or regulatory agencies, particularly during periods in which credit markets are weak.
A portion of our borrowing capacity and outstanding indebtedness bears interest at a variable rate based on LIBOR. There is considerable uncertainty regarding the publication of LIBOR beyond 2021. The uncertainty regarding the future of LIBOR, as well as the transition from LIBOR to another benchmark rate or rates, could have adverse impacts on our outstanding debt that currently uses LIBOR as a benchmark rate and, in turn, could adversely affect our financial condition and results of operations.
If we are unable to service our debt obligations, we could face substantial liquidity problems and we may be forced to reduce or delay investments and capital expenditures, or to sell assets, seek additional capital, including additional secured or unsecured debt, or restructure or refinance our debt, and we may be unable to continue as a going concern. We may be unable to consummate any proposed asset sales or recover the carrying value of these assets, and any proceeds may not be adequate to meet any debt service obligations then due. Any of these examples potentially could have a material adverse impact on our results of operations, profitability, shareholders’ equity and capital structure.
Changes in credit ratings issued by nationally recognized statistical rating organizations could adversely affect In addition, our cost of financing or refinancing, access to the capital markets, and the market price of our securities.
Credit ratingterms under which we purchase goods and services could be adversely affected if credit ratings agencies could downgrade our ratings, whether due to various developments, including matters arising out of the AK Steel Merger or the AM USA Transaction, incurring additional indebtedness and other factors specific to our businesses,business or debt profile, a prolonged cyclical downturn in the steel, scrap metal and mining industries whether due to the COVID-19 pandemic or otherwise, or macroeconomic trends (such as global or regional recessions), increases in pension and OPEB obligations, adverse impacts of inflation and high interest rates, or trends in credit and capital markets more generally. Any decline inA portion of our credit ratings may result in anborrowing capacity and any outstanding indebtedness under our ABL Facility bears interest at a variable rate based on SOFR. To the extent these interest rates increase, to our cost of future financing or limit ourinterest expense will increase. Restricted access to the capital markets whichand/or increased borrowing costs could harm our financial condition, hinder our ability to refinance existing indebtedness on acceptable terms, or have an adverse effect on the market priceour results of our securitiesoperations, cash flows, financial condition and the terms under which we purchase goods and services.liquidity.
Our actual operating results may differ significantly from our guidance.
From time to time, we release guidance, including that set forth under “Management’s Discussion and Analysis of Financial Condition and Results of Operations–Outlook” in our Annual Reports on Form 10-K and our Quarterly Reports on Form 10-Q, regarding our future performance. This guidance, which consists of forward-looking statements, is prepared by our management and is qualified by, and subject to, the assumptions and the other information included in our Annual Reports on Form 10-K and our Quarterly Reports on Form 10-Q. Our guidance is not prepared with a view toward compliance with published guidelines of the American Institute of Certified Public Accountants, and neither our independent registered public accounting firm nor any other independent or outside party compiles or examines the guidance and, accordingly, no such person expresses any opinion or any other form of assurance with respect thereto.
Guidance is based upon a number of assumptions and estimates that, while presented with numerical specificity, are inherently subject to business, economic, regulatory and competitive uncertainties and contingencies, many of which are beyond our control and are based upon specific assumptions with respect to future business decisions, some of which will change. The principal reason that we release such data is to provide a basis for our management to discuss our business outlook with analysts and investors. We do not accept any responsibility for any projections or reports published by any such third parties.
Guidance is necessarily speculative in nature, and it can be expected that some or all of the assumptions of the guidance furnished by us will not materialize or will vary significantly from actual results. Accordingly, our guidance is only an estimate of what management believes is realizable as of the date of release. Actual results will vary from the guidance. Investors should also recognize that the reliability of any forecasted financial data diminishes the further in the future that the data are forecast. In light ofConsidering the foregoing, investors are urged to put the guidance in context and not to place undue reliance on it.
Any failure to successfully implement our operating strategy or the occurrence of any of the risks described in our Annual Reports on Form 10-K or our Quarterly Reports on Form 10-Q could result incause actual operating results being different thanto differ from the guidance, and such differences may be adverse and material.
Our assets as of December 31, 2020 include a deferred tax asset, the full value of which we may not be able to realize.
We recognize deferred tax assets and liabilities based on differences between the financial statement carrying amounts and the tax basis of assets and liabilities. At December 31, 2020, the net deferred tax asset was $492 million, primarily related to U.S. NOLs. We regularly review our deferred tax assets for recoverability based on our history of earnings, expectations for future earnings and expected timing of reversals of temporary differences. Realization of deferred tax assets ultimately depends on the existence of sufficient taxable income. We believe the recorded net deferred tax asset at December 31, 2020, is fully realizable based on our expected future earnings. However, our assumptions and estimates are inherently subject to business, economic and competitive uncertainties and contingencies, many of which are beyond our control and some of which may change. As a result, we could ultimately lose a portion of our deferred tax asset related to NOLs due to expiration, which could have a material adverse effect on our results of operations and cash flows.
The ability to use our NOLs and certain other tax attributes to offset future taxable income may be subject to certain limitations.
If a corporation undergoes an “ownership change” within the meaning of Section 382 of the IRC, the corporation’s NOLs and certain other tax attributes arising before the “ownership change” are subject to limitations after the “ownership change.” An “ownership change” under Section 382 of the IRC generally occurs if onevarious lawsuits, claims, arbitrations or more
shareholders or groups of shareholders who own at least 5% of the corporation’s equity increase their ownershipgovernmental proceedings that could result in the aggregate by more than 50 percentage points over their lowest ownership percentage within a rolling period that begins on the later of three years prior to the testing date and the date of the last “ownership change.” If an “ownership change” were to occur, Section 382 of the IRC would impose an annual limit on the amount of pre-ownership change NOLs and other tax attributes the corporation could use to reduce its taxable income, potentially increasing and accelerating the corporation’s liability for income taxes, and also potentially causing tax attributes to expire unused. The amount of the annual limitation is determined based on a corporation’s value immediately prior to the ownership change.
As of December 31, 2020, after taking into account limitations (or disallowance) on use, we had $2,510 million and $1,009 million of available U.S. federal and state NOLs, respectively, including amounts acquired in the AK Steel Merger. The use of our common shares in the Acquisitions in conjunction with subsequent issuances or sales of our shares (including transactions that are outside of our control) could cause us to experience an “ownership change.” If we experience an “ownership change” under Section 382 of the IRC, further limitations (or disallowances) may apply and similar rules may also apply under state and foreign laws. Consequently, we may not be able to utilize a material portion of our NOLs and other tax attributes, which, in addition to increasing our U.S. federal and state income tax liability, could adversely affect our share price, financial condition, results of operations and cash flows.
Holders of our common shares may not receive dividends on their common shares.significant expenditures.
We are not required to declare cash dividends on our common shares and, in April 2020, we announced the suspension of future dividends. Holders of our common shares are entitled to receive only such dividends as our Board may from time to time declare out of funds legally available for such payments. We are incorporated in Ohio and governed by the Ohio General Corporation Law, which allows a corporation to pay dividends, in general, in an amount that cannot exceed its surplus, as determined under Ohio law. Our ability to pay dividends will be subject to our future earnings, capital requirementsvarious lawsuits, claims, arbitrations or governmental proceedings relating to commercial and financial condition, as well as our compliance with covenantsbusiness disputes, antitrust claims, environmental matters, government investigations, occupational or personal injury claims, property damage, labor and financial ratios related to existingemployment matters, or future indebtedness, business prospectssuits involving legacy operations and other factors that our Board may deem relevant. Additionally, our ABL Facility contains, and agreements governing anymatters. For example, certain of our subsidiaries have been named in lawsuits claiming exposure to asbestos, many of which have been dismissed and/or settled for non-material amounts. Nevertheless, it is likely that similar types of claims will continue to be filed in the future, debtand we could experience material adverse judgments or incur significant costs to defend such claims or any other existing and future lawsuits, claims, arbitrations or governmental proceedings. The insurance we maintain may contain, covenants and other restrictions that,not be adequate to protect us in certain circumstances, could limit the levelevent of dividends that we are able to pay on our common shares.significant claims.
IV. OPERATIONAL RISKS
We face significant risks relating to our recent acquisitions of the AK Steel and ArcelorMittal USA businesses.
During 2020, we completed both the AK Steel Merger and the AM USA Transaction. These recent transformative acquisitions involve a number of significant risks and uncertainties that may adversely affect us, including the following:
•inability to realize anticipated synergies or other expected benefits or cost savings;
•additional debt incurred or assumed in connection with the acquisitions could limit our financial flexibility, including our ability to acquire additional assets and make further strategic investments in the future;
•diversion of financial resources to the new operations or acquired businesses;
•assumption of substantial additional environmental exposures, commitments, contingencies and remediation and reclamation projects;
•liabilities for acquired pension and OPEB obligations, which could require us to make significant cash expenditures and funding contributions in excess of current estimates and contribution rates;
•impairment of recorded tangible and intangible asset values, including goodwill, could result in material non-cash charges to our results of operations in the future;
•failure to successfully integrate acquired systems, business processes, policies and procedures;
•exposure to unknown liabilities and unforeseen costs that were not discovered during due diligence;
•loss of human capital resources and support services historically provided by ArcelorMittal and potential failure of ArcelorMittal or its affiliates to perform under various contracts entered into in connection with the AM USA Transaction, including the intellectual property license agreement, slab supply agreement and
transition services agreement, which could adversely impact our integration of the ArcelorMittal USA operations;
•potential loss of key employees, suppliers or customers; and
•other challenges associated with managing the larger, more complex and integrated combined businesses.
If one or more of these risks and uncertainties were to materialize, we could experience reduced sales, higher costs, lower profitability and other adverse impacts to our operations and businesses.
In addition, in connection with the closing of the AM USA Transaction, we issued approximately 78 million of our common shares to an indirect, wholly owned subsidiary of ArcelorMittal, equating to approximately 16% of our then-outstanding common shares. On February 11, 2021, in connection with our sale of 20 million of our common shares in an underwritten public offering, such subsidiary of ArcelorMittal, as a selling shareholder in the offering, sold 40 million of our common shares. We believe such subsidiary of ArcelorMittal continues to hold approximately 38 million of our common shares, equating to approximately 8% of our outstanding common shares following completion of such offering. Although ArcelorMittal and its affiliates are subject to certain restrictions and requirements under an Investor Rights Agreement with respect to its and its affiliates' ownership and voting of our common shares, at such a level of beneficial ownership, ArcelorMittal and its affiliates may be able to exert influence over us and actions requiring the approval of our common shareholders. Under the Investor Rights Agreement, ArcelorMittal and its affiliates are permitted to transfer all of our common shares held by them, subject to certain restrictions on transfers to persons whose beneficial ownership of our common shares following any such transfer would exceed 5% or 10% of our then-outstanding common shares. Sales of our shares by ArcelorMittal and its affiliates or other shareholders, coupled with the increase in the outstanding number of our common shares, may affect the market for, and the market price of, our common shares in an adverse manner.
We also issued 583,273 shares of Series B Preferred Stock to an indirect, wholly owned subsidiary of ArcelorMittal in connection with the closing of the AM USA Transaction. Pursuant to the terms of the Series B Preferred Stock, from and after the 24-month anniversary of the issue date of the Series B Preferred Stock (the “24-Month Anniversary”), each holder of a share of Series B Preferred Stock is entitled to receive cash dividends (the “Additional Dividends”) that will accrue and compound at a significant rate. Although the Series B Preferred Stock is redeemable at our option 180 days after the issue date, the agreements governing our debt may restrict us from paying the redemption price at any given time. If we are unable to redeem the Series B Preferred Stock prior to the 24-Month Anniversary and we become obligated to pay the Additional Dividends, we may be required to divert financial resources from our operations or borrow additional debt in order to satisfy such obligations, which could have a material adverse effect on our business, financial condition and results of operations.
We have limited ability to control our joint venture operations, rely on our joint venture partners to meet their payment obligations, and are subject to risks involving the acts or omissions of our joint venture partners.
As part of the AM USA Transaction, we acquired ArcelorMittal USA’s interest in Hibbing and again became the manager of Hibbing, which we co-own with U.S. Steel. In our steel business, we are party to various joint venture arrangements primarily related to downstream steel processing operations. Due to shared ownership, we have limited ability to control our joint venture operations, and we cannot control the actions of our joint venture partners. Accordingly, we rely on our joint venture partners to make their required capital contributions and to pay for their share of joint venture obligations. If our joint venture partners experience financial hardship or fail to perform their obligations, we may be required to assume additional material obligations to minimize operational disruption or as part of a liquidation, including significant capital contributions, costs of environmental remediation, and pension and OPEB obligations.
Our operating expenses could increase significantly if the priceprices of raw materials, electrical power, fuel or other energy sources increases.increase.
Our operations require significant use of energy and raw materials. Energy expenses are sensitive to changes in electricity, energy transportation and fuel prices, including diesel fuel and natural gas. Although we are fully self-sufficient in iron ore other raw materials or production inputs whereand partially self-sufficient in coke, metallurgical coal and scrap metal, we are wholly or partially dependent on third-party suppliers includefor certain critical raw materials and production inputs, including industrial gases, graphite electrodes, scrap, chrome, zinc, coke, metallurgical coal, scrap metal and coal.other alloys. Prices for electricity, natural gas, diesel fuel, oils and raw materials can fluctuate widely with availability and demand levels from other users, including fluctuations caused by the impact of recent inflationary pressures, supply chain constraints, infectious disease outbreaks and geopolitical conflicts. For example, increased electricity demand to the COVID-19 pandemic.grid in response to physical climate-related risks, adverse or extreme weather events and electrification of the economy could adversely impact energy prices. During periods of peak usage, although some operations have contractual arrangements in place whereby they receive certain offsetting payments in exchange for electricity load reduction, supplies of energy and raw materials in general may be curtailed and we may not be able to purchase them at historical rates. A disruption in the transmission of energy, inadequate energy transmission
infrastructure, or the termination of any of our energy supply contracts could interrupt our energy supply and adversely affect our operations. While we have some long-term contracts with electrical, natural gas and raw material suppliers, we are exposed to fluctuations in energy, natural gas and raw material costs that can affect our production costs. As an example, our Toledo direct reduction plant is subject to changes in the market price of natural gas, which is a key input in the direct reduction of iron ore pellets to produce HBI. We enter into many market-based pricing supply contracts for electricity, natural gas and diesel fuel for use in our operations. Those contracts expose us to price increases in energy costs, which could cause our profitability to decrease significantly. In addition, U.S. public utilities may impose rate increases andand/or pass through additional capital and operating cost increases to their customers related to new or pending U.S. environmental regulations or other charges that may require significant capital investment andand/or use of cleaner fuels in the future. In particular, the recent decision of the U.S. Court of Appeals for the District of Columbia vacating and remanding the Affordable Clean Energy Rule, as well as recentRecent executive orders from President Biden regarding the environment and climate change, and the regulations providing for GHG emissions standards proposed by the EPA, indicate that new or revised regulations under the Biden Administrationor other government actions could result in rate and/or cost increases from U.S. utilities.public utilities, which could significantly increase the costs of operating our mining and manufacturing facilities. Although we regularly monitor and from time to time challenge rate cases initiated by these utilities or other sources seeking to increase the amounts that our facilities must pay for electricity, natural gas or water, there is no assurance that our challenges will be successful in reducing or eliminating proposed rate and/or cost increases.
The majority of our steel shipments are sold under contracts that do not allow us to pass through all increases in raw materials, supplies and energy costs. Some of our steel shipments to contract customerscustomer contracts include variable-pricing or surcharge mechanisms allowing us to adjust the total sales price based on changes in specified raw materials, supplies and energy costs. Those adjustments, however, rarely reflect all of our underlying raw materials, supplies and energy cost changes. The scope of the adjustment may also be limited by the terms of the negotiated language, including limitations on when and to what extent the adjustment occurs. Further, as a result of recent inflationary pressures, many of our vendors have been seeking substantial price increases in order to continue providing critical goods and services, and to the extent we are required to pay relatively more for our steelmaking inputs and are unable to recognize corresponding sales price increases, we would realize lower margins on sales of our products, negatively impacting our results of operations. Our need to consume existing inventories may also delay the impact of a change in prices of raw materials or supplies. Significant changes in raw material costs may also increase the potential for inventory value write-downs in the event of a reduction in selling prices and our inability to realize the cost of the inventory. As we source a portion of our critical supplies, manufacturing equipment and raw materials from China, such as refractories, electrodes, chemicals and spare parts, existing tensions or further adverse geopolitical developments between the U.S. and China triggering or exacerbating sanctions or trading restrictions could lead to us experiencing disruptions, delays or higher costs in supplying our operations and maintaining steady-state production. In addition, even though we are partially self-sufficient in scrap metal, if the market price of scrap metal were to experience a sustained price increase, our cost to produce steel would be adversely affected due to the higher
prices we would need to pay to acquire third-party scrap metal for consumption in our operations, which would adversely affect the margins we would realize on our fixed price contracts.
Our sales and competitive position depend on transporting our products to customers at competitive rates and in a timely manner, and our ability to optimize our operational footprint depends on predictably and cost effectively moving products and raw materials internally among our facilities.
Disruption of the rail, trucking, lake and other waterway transportation services because of weather-related problems, including ice and winter weather conditions on the Great Lakes or St. Lawrence Seaway, climate change, strikes, lock-outs, driver shortages and other disruptions in the trucking industry, train crew shortages or other rail network constraints, infectious disease outbreaks or other events and lack of alternative transportation options could impair our ability to move products internally among our facilities and to supply products to our customers at competitive rates or in a timely manner and, thus, could adversely affect our operations, revenues, margins and profitability. For example, if the vessel shipping season on the Great Lakes were to be interrupted or shortened as compared to historical levels, whether due to extended winter conditions, operational failure of critical shipping locks or otherwise, our ability to transport iron ore pellets to our steel mills could be adversely affected, resulting in potential operational disruptions and reduced production volumes. Further, dredging issues and environmental changes, particularly at Great Lakes ports or along navigable rivers, could adversely impact our ability to move certain of our products or result in higher freight rates. Similarly, we depend on third-party transportation services for delivery of raw materials and other production inputs to us, and failures or delays in delivery would have an adverse effect on our ability to maintain steady-state production and processing operations to meet customer obligations.
The cost or time to implement a strategic or sustaining capital project may prove to be greater than originally anticipated.
Most of our mines and production and processing facilities have been in operation for several decades, and the equipment is aged, requiring that we continually and successfully implement extensive and costly maintenance practices, programs and upgrades, which may take longer or be more costly than expected. From time to time, we undertake capital projects to enhance, expand, maintain or upgrade our production, mining and processing capabilities, such as the 2022 blast furnace reline project at our Cleveland Works, or to diversify our customer base, such as our Toledo direct reduction plant. Our ability to achieve the anticipated production volumes, revenues or otherwise realize acceptable returns on capital projects that we may undertake is subject to a number of risks, many of which are beyond our control, including a variety of market, operational, permitting and labor-related factors. Further, the cost to implement any given capital project may prove to be greater or may take more time than originally anticipated, including due to supply chain issues that may be experienced by our vendors, and the scope of a capital project may expand or otherwise be modified. Capital projects may also interrupt production capabilities, which could have an adverse effect on costs and profitability. Inability to achieve the expected results from the implementation of our capital projects, incurring unanticipated costs or delays, or the inability to meet contractual obligations could adversely affect our results of operations, future earnings and cash flow generation.
Natural or human-caused disasters, weather conditions, disruption of energy, unanticipated geological conditions, equipment failures, infectious disease outbreaks, and other unexpected events may lead our customers, our suppliers or our facilities to curtail production or shut down operations.
Operating levels within our industry and the industries of our customers and suppliers are subject to unexpected conditions and events that are beyond the industries’ control. Those events, including the occurrence of an infectious disease, widespread illness or public health emergency, could cause industry members or their suppliers to curtail production or shut down a portion or all of their operations, which could reduce the demand for our products and adversely affect our revenues, margins and profitability. For example, the temporary production shutdowns in the automotive industry that occurred during 2020 due to the onset of the COVID‑19 pandemic and associated reduction in demand for our products led to our decision to temporarily idle certain steelmaking facilities and iron ore mines.
Our operating levels are subject to conditions beyond our control that can delay deliveries or increase the cost of production for varying lengths of time. Factors that could cause production disruptions could include adverse weather conditions due to climate change or otherwise (such as severe winter weather, tornadoes, floods, temperature extremes and the lack of availability of process water due to drought) and natural and human-caused disasters, lack of adequate raw materials, energy or other supplies, and infectious disease outbreaks. Additional factors that could adversely impact production and operations at our mining facilities include tailings dam failures, pit wall failures, unanticipated geological conditions, including variations in the amount of rock and soil overlying deposits of iron ore and metallurgical coal, and processing changes.
Our mining operations, processing facilities, steelmaking and logistics operations depend on critical pieces of equipment. This equipment may, on occasion, be out of service because of unanticipated failures or unplanned outages. In the future, we may experience additional lengthy shutdowns or periods of reduced production because of equipment failures or unplanned maintenance activities. Further, remediation of any interruption in production capability may require us to make large capital expenditures that could have a negative impact on our profitability and cash flows. Our business interruption insurance may not be available to cover lost revenues associated with equipment failures or maintenance difficulties. Longer-term business disruptions could result in a loss of customers, which could adversely affect our future sales levels and revenues.
Many of our production facilities and mines are dependent on a sole source for electric power, natural gas, water, industrial gases and/or certain other raw materials or supplies. A significant interruption in service from our suppliers due to production or transportation issues, workforce difficulties, terrorism or sabotage, weather conditions such as heat waves that may be attributable
to climate change, natural disasters, equipment failure or any other cause could result in substantial losses that may not be fully recoverable, either from our business interruption insurance or responsible third parties.
A disruption in or failure of our IT systems, including those related to cybersecurity, could adversely affect our business operations, reputation and financial performance.
We rely on the accuracy, capacity, integrity and security of our IT systems for the operation of many of our business processes and to comply with regulatory, legal and tax requirements. While we maintain some of our critical IT systems, we are also dependent on third parties to provide important IT services relating to, among other things, off-site content hosting, operational process technology at our facilities, human resources, electronic communications and certain finance functions. Further, in connection with our recent acquisitions, we inherited certain legacy hardware and software IT systems that can be supported only by a very limited number of specialists in the market, and our increased reliance on these legacy IT systems may increase the risk of IT system disruption or failure, which could adversely affect our operations.
Despite the security measures that we have implemented, including those related to cybersecurity and data privacy, our IT systems could be breached or damaged by computer viruses, ransomware, natural or human-caused incidents or disasters, or unauthorized physical or electronic access or intrusions, any of which could result in the loss, theft or corruption of sensitive or essential business or personal information and the inability to access or control our IT systems or information. Given our status as a critical supplier of steel to U.S. business and defense interests and the U.S. government’s broad support of Ukraine in defending against Russia’s invasion, we may be the target of malicious cyber activities sponsored by the Russian or Chinese governments or other state actors like those described in recent threat advisories issued by the U.S. Cybersecurity & Infrastructure Security Agency. Though we have controls in place and regularly conduct employee training, we cannot provide assurance that a cyberattack will not occur or cause damage or business interruption. Furthermore, despite our efforts to audit certain critical vendors’ information security controls, significant risk may remain with respect to security measures employed by third-party service providers, which may ultimately prove to be ineffective at countering threats.
Failures of our IT systems, whether caused maliciously or inadvertently, may result in the disruption of our business processes, or in the unauthorized release of sensitive, confidential, personally identifiable or otherwise protected information, or result in the corruption of data, each of which could adversely affect our businesses. For example, cybersecurity vulnerabilities could result in an interruption of the functionality of our automated manufacturing, operating, or health and safety systems, which, if compromised, could cease, threaten, delay or slow down our ability to produce or process steel or any of our other products for the duration of such interruption or lead to unanticipated health or safety incidents, which could result in reputational harm and may adversely affect our employees, results of operations, financial condition and cash flows. In addition, any compromise of the security of our IT systems could result in a loss of confidence in our security measures and subject us to litigation, regulatory investigations and negative publicity that could adversely affect our reputation and financial condition. Our customers, suppliers and vendors may also access or store certain of our sensitive information on their IT systems, which, if breached, attacked or accessed by unauthorized persons, could likewise expose our sensitive information and adversely impact our businesses. Furthermore, as cybersecurity threats continue to evolve and become more sophisticated, including through the use of artificial intelligence, we may be required to incur significant costs and invest additional resources to protect against and, if required, remediate the damage caused by such disruptions or system failures in the future. The amount of insurance coverage we maintain and require our vendors to maintain may be inadequate to cover claims or liabilities resulting from cybersecurity attacks.
The closure of an operating facility or mine closures entailentails substantial costs. If our assumptions underlying our accruals for closure costs prove to be inaccurate or we prematurely close one or more of our facilities or mines, our results of operations and financial condition would likely be adversely affected.
If faced with overcapacity in the market, regulatory challenges or other adverse conditions, including as a result of the COVID-19 pandemic, we may seek to rationalize manufacturing and production assets through asset sales, temporary shutdowns, indefinite idles or facility closures. If we indefinitely idle or permanently close any of our facilities or mines, our production and revenues would be reduced unless we were able to increase production at our other facilities or mines in an offsetting amount, which may not be possible, and could result in customers responding negatively by taking current or future business away from us if we seek to transition production to a different facility. Alternatively, we could fail to meet customer specifications at the facilities to which products are transitioned, resulting in customer dissatisfaction or claims. To the extent an idled or closed facility formerly supplied critical inputs to our upstream production facilities, we may need to secure alternate sources for such critical inputs, the cost and availability of which may be uncertain.
The closure of a steelmaking or other operating facility or mining operation involves significant closure costs, including reclamation and other environmental costs, the costs of terminating long-term obligations, including customer, energy and transportation contracts and equipment and real property leases, costs associated with the altered tax profile of an idled or closed facility, and certain accounting charges, including asset impairment and accelerated depreciation. In addition, a permanent steelmaking facility or mine closure could accelerate and significantly increase employment legacy costs, including our expense and funding costs for pension and OPEB obligations and multiemployer pension withdrawal liabilities. AFor example, a number of employees would be eligible for immediate retirement under special eligibility rules that apply upon a steelmaking facility or mine closure. AllThe employees eligible for immediate retirement under the pension plans at the time of the permanent closure also could be eligible for OPEB, thereby accelerating our obligation to provide these benefits. Certain closures would precipitate a pension closure liability significantly greater than an ongoing operation liability and may trigger certain severance liability obligations. In addition, we are party to several joint ventures relating to iron ore mining, downstream steel processing and scrap metal recycling, and if our joint venture partners experience financial hardships or fail to perform their obligations upon closure, we may be required to assume significant
additional obligations on behalf of the joint venture, including costs of environmental remediation and pension and OPEB obligations.
Although we base our assumptions regarding the life of our mines on detailed studies we perform from time to time, butwhich are reviewed and validated by QPs, those studies and assumptions are subject to uncertainties and estimates that may not be accurate. We recognize the costs of reclaiming open pits, stockpiles, tailings ponds, roads and other mining support areas based on the estimated mining life of our property.properties. If our assumptions underlying our accruals for closure costs, including reclamation and other environmental costs, prove to be inaccurate or insufficient, or our liability in any particular year is greater than currently anticipated, our results of operations and financial condition could be adversely affected. In addition, if we were to significantly reduce the estimated life of any of our mines, the mine closure costs would be applied to a shorter period of production, which would increase costs per ton produced and could adversely affect our results of operations and financial condition.
Our sales and competitive position depend on the ability to transport our products to our customers at competitive rates and in a timely manner.
Disruption of the lake, rail and/or trucking transportation services because of weather-related problems, including ice and winter weather conditions on the Great Lakes or St. Lawrence Seaway, climate change, strikes, lock-outs, driver shortages and other disruptions in the trucking industry, rail network constraints, global or domestic pandemics or epidemics (such as the COVID-19 pandemic) or other infectious disease outbreaks, in each case causing a business disruption, or other events and lack of alternative transportation options could impair our ability to move products internally among our facilities and to supply products to our customers at competitive rates or in a timely manner and, thus, could adversely affect our sales, margins and profitability. Further, dredging issues and environmental changes, particularly at Great Lakes ports, could impact adversely our ability to move certain of our products or result in higher freight rates. Similarly, we depend on third-party transportation services for delivery of raw materials to us, and failures or delays in delivery would have an adverse effect on our ability to maintain steady-state production operations to meet customer obligations.
Natural or human-caused disasters, weather conditions, disruption of energy, unanticipated geological conditions, equipment failures, infectious disease outbreaks, and other unexpected events may lead our customers, our suppliers or our facilities to curtail production or shut down operations.
Operating levels within our industry and the industries of our customers and suppliers are subject to unexpected conditions and events that are beyond the industries’ control. Those events, including the occurrence of an infectious disease or illness, such as the COVID-19 pandemic, could cause industry members or their suppliers to curtail production or shut down a portion or all of their operations, which could reduce the demand for our products and adversely affect our sales, margins and profitability. For example, the temporary production shutdowns in the automotive industry during 2020 as a result of the COVID-19 pandemic and associated reduction in demand for our products led to our decision to temporarily idle certain steelmaking facilities and iron ore mines.
Our operating levels are subject to conditions beyond our control that can delay deliveries or increase the cost of production for varying lengths of time. Factors that could cause production disruptions could include adverse weather conditions (for example, extreme winter weather, tornadoes, floods, and the lack of availability of process water due to drought) and natural and man-made disasters, lack of adequate raw materials, energy or other supplies, and infectious disease outbreaks, such as the COVID-19 pandemic. In addition, factors that could adversely impact production and operations at our mining operations include tailings dam failures, pit wall failures, unanticipated geological conditions, including variations in the amount of rock and soil overlying deposits of iron ore and coal, variations in rock and other natural materials, and variations in geologic conditions and processing changes.
Our mining operations, processing facilities, steelmaking and logistics operations depend on critical pieces of equipment. This equipment may, on occasion, be out of service because of unanticipated failures or unplanned outages. In addition, most of our mines and production and processing facilities have been in operation for several decades, and the equipment is aged. In the future, we may experience additional lengthy shutdowns or periods of reduced production because of equipment failures. Further, remediation of any interruption in production capability may require us to make large capital expenditures that could have a negative impact on our profitability and cash flows. Our business interruption insurance would not cover all of the lost revenues associated with equipment failures. Longer-term business disruptions could result in a loss of customers, which could adversely affect our future sales levels and revenues.
Many of our production facilities and mines are dependent on one source for electric power, natural gas, industrial gases and/or certain other raw materials or supplies. A significant interruption in service from our suppliers due to the COVID-19 pandemic, terrorism or sabotage, weather conditions, natural disasters, equipment failure or any other cause could result in substantial losses that may not be fully recoverable, either from our business interruption insurance or responsible third parties.
We incur certain costs when production capacity is idled, as well as increased costs to resume production at previously idled facilities.
Our decisions concerning which facilities to operate and at what production levels are made based in part upon our customers’ orders for products, as well as the quality, performance capabilities and cost of our operations. During depressed market conditions, we may concentrate production at certain facilities and not operate others in response to customer demand or other reasons, and as a result we may incur idle costs that could offset our anticipated savings from not operating the idled facility. For example, due to reducedincreased scrap usage and less demand as a result of the COVID-19 pandemic, certain offor iron ore pellets in our steelmaking facilitiesoperations, our Northshore mining and iron ore mines werepelletizing facility was temporarily idled during portions of 20202022 and 2023, and we continued to incur
incurred certain fixed costs at those facilities.that facility during the idle periods. We cannot predict whether our operations will experience additional similar or dissimilar disruptions in the future.
When we restart idled facilities, we incur certain costs to replenish inventories, prepare the previously idled facilities for operation, perform the required repair and maintenance activities, and prepare employees to return to work safely and resume production responsibilities. The amount of any such costs cancould be material,significant, depending on a variety of factors, such as the period of idle time, necessary repairs and available employees, and is difficult to project.
We may not have adequate insurance coverage for some business risks.
Our operations are generally subject to a number of hazards and risks whichthat could result in personal injury or damage to, or destruction of, equipment, properties or facilities. TheDepending on the nature and extent of a loss, the insurance that we maintain to address risks that are typical in our businesses may not providebe adequate coverage.or available to fully protect or reimburse us, or our insurance coverage may be limited, canceled or otherwise terminated. Insurance against some risks, such as liabilities for environmental pollution, tailings basin breaches, or certain hazards or interruption of certain business activities, may not be available at an economically reasonable cost, or at all. Even if available, we may self-insure or maintain high deductibles where we determine it is most cost effective to do so. As a result, despite the insurance coverage that we carry, accidents or other negative developments involving our production, mining, processing or transportation activities causing losses in excess of policy limits, or losses arising from events not covered under insurance policies or subject to substantial deductibles, could have a material adverse effect on our financial condition and cash flows. In addition, the potential increase in extreme weather events due to climate change or otherwise may adversely impact our access to cost effective insurance in the future. The risk of increased insurance costs may have greater impact where the adverse event results in us asserting an insurance claim, the cost of which our insurers may seek to recoup during a future insurance renewal through increased premiums or limitations on coverage.
A disruption in or failure ofV. SUSTAINABILITY AND DEVELOPMENT RISKS
As we and our IT systems, including those related to cybersecurity, could adversely affect ourcustomers, competitors and investors seek reduced carbon footprints, transition toward carbon neutrality and enhance business operations andsustainability, we face increased financial, performance.
We rely on the accuracy, capacity, integrity and security of our IT systems for the operation of many of our business processes and to comply with regulatory, legal and tax requirements. Whilereputational risks and potential loss of business opportunities because our operations utilize carbon-based energy sources and produce GHG emissions.
As described in detail in Part I - Item 1. Business - Environmental Matters - Regulatory Developments - Climate Change and GHG Regulations above, because our operations use carbon-based energy and produce GHG emissions, we maintain someare subject to a number of risks relating to decarbonization initiatives being undertaken by regulators and other stakeholders as part of global efforts to address the potential impacts of climate change. For example, as part of climate change mitigation strategies, federal, state, local or foreign governmental authorities may introduce mandatory carbon pricing obligations, carbon emissions limitations, carbon taxes or carbon trading mechanisms, any of which could impose significant costs on our operations, including causing us to incur higher energy and supplier costs, invest in costly and potentially unproven emissions control or reduction technologies, and engage in more intensive environmental monitoring and reporting efforts. In addition, complying with current or future international treaties and federal, state, local or foreign laws or regulations concerning climate change and GHG emissions could negatively impact our ability, and that of our critical IT systems, we are also dependent on third partiescustomers and suppliers, to provide important IT services relatingcompete with companies located in areas not subject to among other things, operational process technology at our facilities, human resources, electronic communications and certain finance functions. Further, in connectionor not complying with the Acquisitions, we inherited certain legacy hardware and software IT systems that can be supported only by a very limited number of specialists in the market, and our increased reliance on these legacy IT systems may increase the risk of IT system disruption or failure, which could adversely affect our operations.
Despite the security measures that we have implemented, including those related to cybersecurity, our IT systems could be breached or damaged by computer viruses, natural or man-made incidents or disasters, or unauthorized physical or electronic access or intrusions. Though we have controls in place, we cannot provide assurance that a cyberattack will not occur. Furthermore, we may have little or no oversight with respect to security measures employed by third-party service providers, which may ultimately prove to be ineffective at countering threats.such constraints. We may also experienceface more limited access to, or increased riskcosts of, IT system failures or cyberattacks as many of our employees continue to work from home as part of our responsecapital to the COVID-19 pandemic. In addition, we may experience increased risk of IT system failures or cyberattacks as transitional activitiesextent financial institutions and investors increase expectations relating to the Acquisitions arelowering GHG emissions or reduce investments in progress, since these activities expose each companycarbon-intensive businesses or industries. Further, increased pressure from customers or other business partners seeking to the other’s security vulnerabilities,reduce their indirect carbon footprints and because the Acquisitions may attract the attentionachieve certain overall decarbonization targets, including by sourcing a larger percentage of potential cyber criminals.
Failures of our IT systems, whether caused maliciously or inadvertently, maysteel products from recycled steel, could result in the disruption of our business processes, or in the unauthorized release of sensitive, confidential, personally identifiable or otherwise protected information, or result in the corruption of data, each of which could adversely affect our businesses. For example, cybersecurity vulnerabilities could result in an interruption of the functionality of our automated manufacturing operating systems, which, if compromised, could cease, threaten, delay or slow down our ability to produce or process steel or any of our other products for the duration of such interruption, which could result in reputational harm and may adversely affect our results of operations, financial condition and cash flows. In addition, any compromise of the security of our IT systems could result in apotential loss of confidence inbusiness opportunities if we are unable to meet their carbon, GHG emissions or sustainability expectations, or if we are perceived to have higher GHG intensity than our security measures and subject us to litigation, regulatory investigations and negative publicity that could adversely affect our reputation and financial condition.Our customers, suppliers and vendors may also access or store certain of our sensitive information on their IT systems, which, if breached, attacked or accessed by unauthorized persons, could likewise expose our sensitive information and adversely impact our businesses. Furthermore, as cybersecurity threats continue to evolve and become more sophisticated, we may be required to incur significant costs and invest additional resources to protect against and, if required, remediate the damage caused by such disruptions or system failures in the future.competition.
3125 | CLF 2023 FORM 10-K
V. DEVELOPMENT AND SUSTAINABILITY RISKS
The costIn addition, as part of our decarbonization strategy, we are investigating and time to implement a strategic capital project may prove to be greater than originally anticipated.
Fromfrom time to time may consider investments in or other relationships with various renewable and clean energy initiatives. For example, we undertake strategic capitalengaged in various discussions with other companies, universities and national research laboratories to leverage funding available under the DOE's Regional Clean Hydrogen Hubs Funding Opportunity Announcement to develop and implement clean hydrogen solutions for our industrial applications. The DOE awarded funding to seven hydrogen hubs, and we have expressed interest in offtaking hydrogen from two of them and have recently commissioned a pipeline and completed a hydrogen injection trial at our Indiana Harbor blast furnace #7 with the aim of enabling us to utilize clean hydrogen once it becomes commercially available. We continue to engage with renewable energy developers on clean energy projects, including the previously announced 200-megawatt Headwaters III Wind Farm being proposed for construction in Indiana as well as onsite solar applications. While we are pursuing these decarbonization and energy-related projects with the aim of contributing to a greener power grid and lowering our GHG emissions in alignment with our targets, there are no guarantees that sufficient funding or the necessary advanced technology will be available to complete any of these projects under currently anticipated timeframes or at all, and we may experience delays and higher-than-anticipated costs to install the necessary infrastructure to implement such renewable and clean energy initiatives. In addition, we may not be successful in achieving our current or any future short, medium or long-term GHG emissions reduction goals, including any net-zero or near-zero goals, due to adverse changes in business conditions over time, unanticipated financial challenges, operational improvement efforts like carbon capture, utilization and sequestration projects at certain of our facilities that may not be as successful as originally forecasted, or regulatory developments arising after such goals were initially announced.
To maintain consistent operational performance and foster growth in our recently-completed Toledo direct reduction plant, in orderbusinesses, we must maintain our social license to enhance, expand or upgradeoperate with our productionstakeholders.
Maintaining a strong reputation and mining capabilities or diversifyconsistent operational, environmental and safety track records is vital to continuing to foster business growth and maintaining our customer base.permission to operate. As stakeholders’ sustainability expectations increase and regulatory requirements continue to evolve, maintaining our social license to operate becomes increasingly important. Our ability to achievemaintain our reputation and strong operating track record could be threatened, including by challenges relating to the anticipated production volumes, revenuesintegration of our recent acquisitions or otherwise realize acceptable returns on strategic capital projects that we may undertake is subject to a numberby circumstances outside of risks, many of which are beyond our control, including a variety of market (suchsuch as a volatile pricing environment for our products), operational, permittingdisasters caused or suffered by other companies in the steel and labor-related factors. Further, the costmining industries. Our social license to implement any given strategic capital project ultimately may proveoperate could also be adversely affected and claims have been and could continue to be greatermade against us to the extent that environmental factors negatively impact local communities, such as air emissions, discharges to water, dust, odors, noise and may take more time than originally anticipated. Inabilityother factors that are inherent in industrial activities like our steelmaking, cokemaking, scrap metal processing and mining operations, even if such activities are conducted in accordance with legal, regulatory and permit requirements. If we are not able to achieve the anticipated results from the implementation ofrespond effectively to these and other challenges to our strategic capital projects, incurring unanticipated implementation costssocial license to operate, our reputation could be damaged significantly. Damage to our reputation or penalties, or the inabilitythird-party claims initiated in response to meet contractual obligationsour ongoing activities could adversely affect our resultscontinuity of operations, current and future earningsprospective business relationships, and cash flow generation.
We must continually replace reserves depleted by production. Exploration activities may not result in additional discoveries.
Our ability to replenish mineral reserves is important to our long-term viability. Depleted reserves must be replaced by further delineation of existing mineral bodies or by locating new deposits in order to maintain production levels over the long term. Decisions to defer mine development activities may adversely impact our ability to substantially increase future mineral production. Resource exploration and development are highly speculative in nature. Exploration projects involve many risks, require substantial expenditures and may not result in the discovery of sufficient additional mineral deposits that can be mined economically. Once a mineral body is discovered, it may take several years from the initial phases of drilling until production is possible, during which time the economic feasibility of production may change. Substantial expenditures are required to establish recoverable proven and probable reserves and to construct mining and processing facilities. As a result, there is no assurance that current or future exploration programs will be successful, and there is a risk that depletion of reserves will not be offset by discoveries or acquisitions.foster growth projects.
We rely on estimates of our recoverable mineral reserves, which isare complex due to geological characteristics of the properties and the number of assumptions made.
We regularly evaluate, and engage third-party QPs to review and validate, our iron ore and coalmineral reserves based on revenues and costs and update them as required in accordance with SEC regulations. We anticipate further updating our mining properties disclosure in accordance with the SEC’s Final Rule 13-10570, ModernizationEstimates of Property Disclosures for Mining Registrants, which became effective February 25, 2019, and which rescinds SEC Industry Guide 7 following a two-year transition period, which means that we will be required to comply with the new rule no later than our fiscal year beginning January 1, 2021.
Estimates ofmineral reserves and future net cash flows necessarily depend upon a number of variable factors and assumptions, some of which are beyond our control, such as production capacity, effects of regulations by governmental agencies,regulations, future prices for iron ore and coal,minerals we mine, future industry conditions and operating costs, severance and excise taxes, development costs, and costs of extraction and reclamation. Estimating the quantity and grade of mineral reserves requires us to determine the size, shape and depth of our mineralmineralized bodies by analyzing geological data, such as samplings of drill holes.holes, and a QP to review and validate our determinations. Estimated mineral reserves could be affected by future industry conditions, future changes in the SEC’s mining property disclosure requirements, variation in geological conditions and ongoing mine planning. Actual volume and grade of reserves recovered, production rates, revenues on third-party sales and expenditures with respect to our reserves will likely vary from estimates, and if such variances are material, our sales and profitabilitygross margins could be adversely affected.
Defects in title or loss of any access rights or leasehold interests in our mining properties could limit our ability to mine these properties or result in significant unanticipated costs.
Many of our mining operations are conducted on properties we lease, license or as to which we have easements or other possessory interests. We generally do not maintain title insurance on our properties. Amining properties, and certain of our land access arrangements were negotiated many years ago and have not been updated. Any title defect, inability to negotiate future access rights required by our mine plans, or the loss of any lease, license, easement or other possessory interest for any mining property could adversely affect our ability to mine any associated reserves. In addition, from time to time the rights of third parties for competing uses of adjacent, overlying or underlying lands, such as for roads, easements, public facilities or other mining activities, may result in disputes and affect our ability to operate as planned if our title is not superior or mutually acceptable arrangements cannot be negotiated. Any challenge to or inability to establish our title or access could delay the exploration and development of some reserves, resources, deposits or surface rights, cause us to incur unanticipated costs, and could ultimately result in the loss of some or all of our interest in those properties.
In the event we lose reserves, resources, deposits or surface rights, we may be required to shut down or significantly alter impacted mining operations, thereby affecting future production, internal supply patterns and margins, revenues and cash flows.
In order to continue to foster growth in
VI. HUMAN CAPITAL RISKS
We depend on our businesses and maintain stability of our earnings, we must maintain our social license to operate with our stakeholders.
Maintaining a strong reputation and consistent operational, environmental and safety track record is vital in order to continue to foster growth and maintain stability in our earnings. As stakeholders’ sustainability expectations increase and regulatory requirements continue to evolve, maintaining our social license to operate becomes increasingly important. Our ability to maintain our reputation and strong operating track record could be threatened, including by challenges relating to the integration of the AK Steel and ArcelorMittal USA businesses or by circumstances outside of our control, such as disasters caused or suffered by other companies in the steel and mining industries. If we are not able to respond effectively to thesesenior management team and other challenges to our social license to operate, our reputation could be damaged significantly. Damage to our reputationkey employees, and the loss of these employees could adversely affect our operations andbusinesses.
Our success depends in part on our ability to foster growthattract, retain, develop and motivate our senior management and key employees. Achieving this objective may be difficult due to a variety of factors, including fluctuations in global economic and industry conditions, competitors’ hiring practices, cost reduction activities, and the effectiveness of our compensation programs. Competition for qualified personnel can be intense. We must continue to recruit, retain, develop and motivate our senior management and key personnel to maintain our businesses and support our projects.
VI. HUMAN CAPITAL RISKS A loss of senior management and key personnel could prevent us from capitalizing on business opportunities, and our operating results could be adversely affected.
Our profitability could be adversely affected if we fail to maintain satisfactory labor relations.
Our production is dependent upon the efforts of our employees. We are party to labor agreements with various labor unions that represent employees at the majoritymost of our operations. Such labor agreements are negotiated periodically, and, therefore, we are subject to the risk that these agreements may not be able to be renewed on reasonably satisfactory terms. It is difficult to predict what issues may arise as part of the collective bargaining process, and whether negotiations concerning these issues will be successful. Due to union activities or other employee actions, we could experience labor disputes, work stoppages or other disruptions in our production that could affect us adversely. WeWhile we successfully negotiated all three of our labor agreements that expired in 2023 and a new labor agreement at our Northshore operation, we have several other labor agreements that will expire in 2024, including those covering union workers at five locations in 2021our Dearborn, Rockport and sixteen locations in 2022.Toledo operations, and the outcomes of those labor negotiations are uncertain. If we enter into a new labor agreement with any union that significantly increases our labor costs relative to our competitors or fail to come to an agreement upon expiry, our ability to compete or continuity of production may be materially and adversely affected.
We may encounter labor shortages for critical operational positions, which could adversely affect our ability to produce our products.
We are predicting a long-term shortage of skilled workers in heavy industry and in certain highly specialized IT roles, and competition for the available workers limits our ability to attract and retain employees as well as engage third-party contractors. As our experienced employees retire, we may have difficulty replacing them at competitive wages. In addition, the ongoing COVID-19 pandemic has resulted and may continue to result in increased government restrictions and regulation, including quarantines of our personnel and potential inability to access facilities, which has adversely affected and could continue to adversely affect our operations.
Our expenditures for pension and OPEB obligations could be materially higher than we have predicted if our underlying assumptions differ from actual outcomes, there are regulatory changes or our joint venture partners fail to perform their obligationsthe funded status of the multiemployer plans that relate to employee pension plans.we participate in degrade.
We provide retiree benefits through defined benefit pension and OPEB plans to certain eligible employees and retirees. Certain defined benefit pension plans are underfunded and may be subject to minimum cash contributions required by ERISA. Certain OPEB to certain eligible union and non-union employees, includingplans have funding requirements that are set under our share of expense andcollective bargaining agreements. Our funding obligations with respect to our unconsolidated joint ventures. Our pension and OPEB expenses and our required contributions to our pension and OPEB plans are affected directly by the value ofcan significantly increase if plan assets underperform, the projectedinterest rates used to calculate minimum funding levels decrease, there are changes in laws and actual rateregulations affecting funding requirements or if there are increases to the benefit obligations. The calculation of returnthe benefit obligation is based on plan assets,several assumptions, including discount rates, healthcare trend rates, benefit levels pursuant to collective bargaining, mortality and the actuarial assumptions we use to measure our defined benefit pension plan obligations, including the rate at which future obligations are discounted. We cannot predict whether changing market or economic conditions, regulatory changes or other factors will increase our pension and OPEB expenses or our funding obligations, diverting funds we would otherwise apply to other uses.
demographic assumptions. We have calculated our unfunded pensionseen significant changes in retiree healthcare costs in recent years, which can be affected by changes in laws and OPEB obligations based on a number of assumptions.regulations. If our assumptions do not materialize as expected and we make adverse changes to these assumptions, our earnings and cash expenditures and costs that we incurflows could be materially higher. Moreover, we cannot be certain that regulatory changes will not increase our obligations to provide these or additional benefits. These obligations also may increase substantially in the event of adverse medical cost trends or unexpected rates of early retirement, particularly for bargaining unit retirees. In addition, changes in the laws governing pensions could also materially adversely affect our costs and ability to meet our pension obligations.
We also contribute to certain multiemployer pension plans, including the Steelworkers’ Pension Trust, for which we are one of the largest contributing employers. IfContribution amounts are determined during collective bargaining with our unions and could increase during future collective bargaining negotiations. Our obligations to these multiemployer plans could also increase if the funded status were to decline, which could be due to poor plan asset performance or if other contributors do not meet their obligations. If a multiemployer plan were to default on their obligationsterminate or if we choose to contribute to any such plans,withdraw, we could become liable for additional unfunded contributionsbe subject to a liability based on the plans.plan's underfunded status.
In addition, some of the transactions in which we previously sold or otherwise disposed of our non-core assets included provisions transferring certain pension and other liabilities to the purchasers or acquirers of those assets. While we believe that all such transfers were completed properly and are legally binding, if the purchaser fails to fulfill its obligations, we may be at risk that a court, arbitrator or regulatory body could disagree and determine that we remain responsible for pension and other liabilities that we intended to and did transfer.
We depend on our senior management team and other key employees, and the loss of these employeesmay encounter labor shortages for critical operational positions, which could adversely affect our businesses.ability to produce our products.
Our success dependsWe are predicting a long-term shortage of skilled workers in part onheavy industry, such as electricians, and in certain highly specialized IT roles, and competition for available workers limits our ability to attract and retain develop and motivate our senior management and key employees. Achieving this objectiveemployees as well as engage third-party contractors. We may be difficult due to a variety of factors, including fluctuations in the global economic and industry conditions, competitors’ hiring practices, cost reduction activities, and the effectivenessface potential labor shortages, as many of our compensation programs. Competition for qualified personnel can be intense. We must continue to recruit, retain, developmost specialized and motivateskilled roles are held by our more senior, management and key personnel in order to maintain our business and support our projects. A loss of senior management and key personnel could prevent us from capitalizing on business opportunities, and our operating results could be adversely affected. We are also subject to the risk that the COVID-19 pandemicexperienced employees. As we lose these employees through attrition or otherwise, we may impact the health or effectiveness of memberslose these workers’ specialized institutional knowledge of our senior management teamlegacy businesses and systems, and we may have difficulty replacing them at competitive wages or other key employees.at all.
| | |
| | |
ItemITEM 1B. | Unresolved Staff Comments UNRESOLVED STAFF COMMENTS |
We have no unresolved comments from the SEC.
3427 | CLF 2023 FORM 10-K
Management of cybersecurity risks is an integral part of our overall risk management framework and is essential for safeguarding our business and data. We have developed an information security program to assess, identify and manage material risks from cybersecurity threats. The program includes policies and procedures that identify how security measures and controls drawn from multiple security frameworks are developed, implemented and maintained. Our cybersecurity risk management program works to balance critical infrastructure, network, application, cloud and information security objectives with overall business objectives and risk tolerance. Specific controls that are used include endpoint threat detection and response, identity and access management, privileged access management, logging and monitoring involving the use of security information and event management, multi-factor authentication, firewalls and intrusion detection and prevention, and vulnerability and patch management.
We use threat intelligence to inform our defensive measures. We use external and internal threat intelligence sources, including information from industry vendors and government agencies. Evolving threats and risks we are also monitoring and working to protect against include artificial intelligence, ransomware and nation-state attacks.
We believe in continuous improvement as part of the effort to optimize security, and we work to foster that culture through various initiatives:
•Cybersecurity Awareness Trainings: We educate employees on best practices for online safety and for identifying potential cybersecurity threats, including by initiating quarterly training programs for our non-represented salaried workforce.
•Simulated Cyberattacks: With assistance from qualified third-party experts, we periodically conduct penetration testing and tabletop exercises to test our technical controls and incident response plans.
•Security Monitoring: We monitor our information technology environment with both our internal cybersecurity resources and third-party service providers. We also have processes in place to monitor the cybersecurity practices of various third-party service providers, including certain vendors that have access to our information systems or sensitive data.
•Proactive Reporting and Investigation: As part of our training initiatives, we regularly educate employees on how to report any suspicious cyber activity or potential cybersecurity issues, and we investigate reported concerns.
Third-party security firms are used in different capacities to provide or operate some of these programs, controls and technology systems, including cloud-based platforms and services.
Our Board of Directors has overall oversight responsibility for our enterprise risk management program and delegates cybersecurity risk management oversight to the Audit Committee of the Board of Directors. The Audit Committee is responsible for ensuring that management has processes in place designed to identify and evaluate cybersecurity risks to which the Company is exposed and implement processes and programs to manage cybersecurity risks and mitigate cybersecurity incidents. Management, including the Chief Information Officer with support from our cybersecurity team, updates the Audit Committee on at least a biannual basis regarding our cybersecurity programs and material cybersecurity risks and mitigation strategies. The Audit Committee also regularly reports on discussions regarding cybersecurity risks to our full Board of Directors. Management is responsible for identifying, considering and assessing material cybersecurity risks on an ongoing basis, establishing processes to ensure that such potential cybersecurity risk exposures are monitored, putting in place appropriate mitigation measures and maintaining cybersecurity programs. Our cybersecurity programs are under the direction of our Chief Information Officer, who receives reports from our cybersecurity team and monitors the prevention, detection, mitigation and remediation of cybersecurity incidents. Our cybersecurity team includes personnel that have obtained credentials from the International System Security Certification Consortium and the SANS Institute, such as Certified Information Systems Security Professional (CISSP) and GIAC Certified Incident Handler, as well as experienced information systems security professionals and information security managers. Additionally, our internal Information Security Committee, composed of leaders from key departments, collaborates on a cross-functional basis to identify practices that can counter threats and to monitor our cybersecurity programs and our cybersecurity incident response plans.
We recognize the ever-present global risk of cyberattacks from diverse threat actors, including nation-states, cybercriminals, hacktivists, insiders and organized crime. In spite of our efforts, we (or third parties we rely on) may not be able to fully, continuously and effectively implement security controls as intended. As described above, we utilize a risk-based approach and judgment to determine the security controls to implement, but it is possible we may not implement appropriate controls if we do not recognize or we underestimate a particular risk. In addition, security controls, no matter how well designed or implemented, may only mitigate and not fully eliminate risks. Further, even events that are detected by security tools or third parties may not always be immediately understood or acted upon. While no organization is immune to attack attempts and we cannot eliminate all risks from cybersecurity threats or provide assurance that we have not experienced an undetected cybersecurity incident, in 2023 we did not identify any material cybersecurity events that have materially affected or are reasonably likely to materially affect our business strategy, results of operations or financial condition. For more information about these risks, please see Part I - Item 1A. Risk Factors - IV. Operational Risks - A disruption in or failure of our IT systems, including those related to cybersecurity, could adversely affect our business operations, reputation and financial performance.
| | |
|
| ITEM 2. | Properties PROPERTIES |
The following map shows the locations of our operations and officescorporate headquarters as of December 31, 2020:2023:
Corporate Offices
We lease our corporate headquarters in Cleveland, Ohio. We also have leased office space in West Chester, OhioOhio; Chicago, Illinois; and Chicago, Illinois.Detroit, Michigan. We own our office space located in Richfield, Ohio,Burns Harbor, Indiana and our Research and Innovation Center located in Middletown, Ohio.
SteelmakingSTEELMAKING
Steelmaking and Finishing Facilities
Below is a listing and description of our principal steelmaking and finishing facilities:
Burns Harbor is a fully integrated steelmaking facility located on Lake Michigan in Northwest Indiana, 50 miles southeast of Chicago. The location allows for prime shipping access to the Port of Indiana, as well as excellent highway and railroad transport. Burns Harbor’s major production facilities include coke plant operations, iron producing, steel producing, hot rolling and finishing and plate rolling and heat treating. The plant operates two blast furnaces and is capable of producing hot-rolled sheet, cold-rolled sheet and hot dip galvanized sheet. Burns Harbor is capable of producing nearly 5 million net tons of raw steel annually. Burns Harbor serves key markets including the automotive, appliance, construction, converters, distribution and pipe and tube markets.
Burns Harbor Plate and Gary Plate are located in Burns Harbor and Gary, Indiana, respectively, and are heat treating and finishing operations producing carbon steel plate, high-strength low alloy steel plate and ASTM grades steel plate. These operations serve the construction, distribution, energy, heavy equipment, infrastructure, military, pipe and tube, rail car and shipbuilding markets.
Butler Works is located in Butler, Pennsylvania, and produces stainless, electrical and carbon steel. Melting takes place in an EAF that feeds an argon-oxygen decarburization unit for the specialty steels. A ladle metallurgy furnace feeds two double-strand continuous casters, which are capable of producing 1 million net tons of raw steel annually. Butler Works also includes a hot rolling mill, annealing and pickling units and two tandem cold rolling mills. It also has various intermediate and finishing operations for both stainless and electrical steels. Butler Works primarily serves the power and distribution transformers and stainless and carbon converters markets.
The Cleveland facility is an integrated steelmaking facility strategically located on the Cuyahoga River in Cleveland, Ohio, with access to the Port of Cleveland and Great Lakes shipping, as well as excellent highway and railroad transport. The Cleveland facility is supplied with coke from our cokemaking operations in Warren, Ohio. Cleveland's major production facilities include two blast furnaces, two steel producing facilities, an 84-inch hot strip mill, a pickling line, a five-stand tandem mill, and a hot dip coating line. The plant's two blast furnaces feed the two steelmaking facilities, which are capable of producing more than 3 million net tons of raw steel annually. Products made at this location are hot-rolled, cold-rolled and hot-dipped galvanized sheet and semi-finished slabs. The Cleveland facility serves the automotive, construction, converters and distribution markets.
The Kote and Tek operations are located in New Carlisle, Indiana, and receive substantially all of their feedstock from Indiana Harbor via daily unit trains. Cleveland-Cliffs Tek is a continuous cold-rolling plant that is capable of producing 1.7 million net tons of sheet steel annually through a continuous descale cold mill and 1.0 million net tons of sheet steel annually through a continuous annealing processing line. Cleveland-Cliffs Kote has separate lines producing 0.5 million net tons of hot-dip galvanized and galvannealed and 0.5 million net tons of electrogalvanized sheet annually. The principal customers of Kote and Tek are in the automotive and appliance markets.
Coatesville is a steel plate production facility located in Coatesville, Pennsylvania, about 40 miles west of Philadelphia, Pennsylvania, and has access to highways and railroads. The facility produces steel from scrap in an EAF and is capable of producing approximately 0.8 million net tons of raw steel annually. The facility also operates ingot teeming facilities, a slab caster, two plate mills, heat-treating facilities, quench and temper and flame-cut shape facilities. The Coatesville facility refines more than 450 different steel chemistries and, together with the Conshohocken facility, produces some of the widest, thickest and heaviest steel plates in the industry. Steel plate products made at this location include carbon, high-strength low-alloy, commercial alloy, military alloy and flame-cut steel. Coatesville serves the aircraft and aerospace, construction, distribution, energy, heavy equipment, military, mold and tool and shipbuilding markets.
Our Columbus operationsinclude a hot-dip galvanizing facility in Columbus, Ohio, and a processing facility in nearby Obetz, Ohio. These operations are temporarily idled due to the COVID-19 pandemic. These central Ohio locations are able to utilize highway and rail transport shipping access. Two zinc pots enable the transition between | | | | | | | | | | | | | | | | | | | | | | | | | | | | | | | | | | | | | | |
| Location | | | Raw Material |
| (Tons in millions) | State | | Iron Ore | Capacity (lt) | HBI | Capacity (mt) | Coke | Capacity (nt) | Coal | Capacity (nt) | Scrap | Capacity (mt) |
| | | | | | | | | | | | |
| Hibbing Taconite | MN | | l | 7.0 | | | | | | | | |
| Minorca | MN | | l | 3.0 | | | | | | | | |
| Northshore | MN | | l | 5.0 | | | | | | | | |
| Tilden | MI | | l | 7.0 | | | | | | | | |
| United Taconite | MN | | l | 6.0 | | | | | | | | |
| Toledo HBI | OH | | | | l | 1.9 | | | | | | |
| Burns Harbor (Coke) | IN | | | | | | l | 1.8 | | | | |
| Monessen | PA | | | | | | l | 0.3 | | | | |
| Warren | OH | | | | | | l | 0.5 | | | | |
| Princeton | WV | | | | | | | | l | 1.8 | | |
| FPT | Multiple | | | | | | | | | | l | N/A |
3629 | CLF 2023 FORM 10-K
coatings to be accomplished in a timely manner while allowing for longer exposed runs. The plant produces hot-dip galvanized sheet using cold-rolled coils supplied by other Cliffs facilities and is capable of coating 450,000 net tons annually. The Columbus operations serve the automotive and distribution markets. | | | | | | | | | | | | | | | | | | | | | | | | | | | | | | | | | | | | | | |
| Location | | | Raw Steel | | Processing and Finishing |
| (Tons in millions) | State | | BF-BOF | EAF | Configured Capacity (nt) | | Hot-Rolled | Cold-Rolled | Coated | Stainless & Electrical | Plate | Slab & Other |
| | | | | | | | | | | | |
| Burns Harbor | IN | | l | | 5.0 | | l | l | l | | | l |
| Burns Harbor Plate | IN | | | | | | | | | | l | |
| Butler | PA | | | l | 0.4 | | | | | l | | |
| Cleveland Works | OH | | l | | 3.4 | | l | l | l | | | l |
| Coatesville | PA | | | l | 0.2 | | | | | | l | l |
| Columbus | OH | | | | | | | | l | | | |
| Conshohocken | PA | | | | | | | | | | l | |
| Coshocton | OH | | | | | | | | | l | | |
| Dearborn Works | MI | | l | | 3.0 | | | l | l | | | l |
| Gary Plate | IN | | | | | | | | | | l | |
| Indiana Harbor Works | IN | | l | | 4.0 | | l | l | l | | | l |
| Mansfield Works | OH | | | l | 0.5 | | | | | l | | |
| Middletown Works | OH | | l | | 3.0 | | l | l | l | l | | l |
| Piedmont | NC | | | | | | | | | | l | |
| Riverdale | IL | | l | | 0.7 | | l | | | | | |
| Rockport Works | IN | | | | | | | l | l | l | | |
| Steelton | PA | | | l | 0.3 | | | | | | | l |
| Tek & Kote | IN | | | | | | | l | l | | | |
| Weirton | WV | | | | | | | l | l | | | |
| Zanesville | OH | | | | | | | | | l | | |
Conshohocken is a plate finishing facility located on the Schuylkill River adjacent to Philadelphia, Pennsylvania. The area is surrounded by highway and railroad systems that provide shipping access. Coatesville suppliesSTEELMAKING AND FINISHING FACILITIES
Our primary steel plate to the Conshohocken plant, which operates heat treat, finishing and inspection facilities for steel plate finishing. The Conshohocken plant has a steckel mill that is currently idled, which is capable of producing coil and discrete plates. Conshohocken plate products are used in construction and military applications.
Coshocton Works is located in Coshocton, Ohio, and consists of a stainless steel finishing plant containing two Sendzimer mills and two Z-high mills for cold reduction, four annealing and pickling lines, bell annealing furnaces, two bright annealing lines, two temper mills, and other processing equipment, including temper rolling, slitting and a packaging line. Coshocton Works produces various flat-rolled stainless steel products including austenitic (chrome nickel) stainless steel grades, martensitic (chrome) stainless steel grades and ferritic (chrome) stainless steel grades, serving the automotive, appliance, distribution and medical markets among others.
Dearborn Works is located in Dearborn, Michigan, with carbon steel melting, casting, cold rolling and finishing facilities are located across Illinois, Indiana, Michigan, Ohio, Pennsylvania and West Virginia. We operate seven blast furnaces and five EAFs on nine properties. Finishing is completed on site at our integrated operations for carbon steel. The major production facilities include a blast furnace, basic oxygen furnaces, two ladle metallurgy furnaces, a vacuum degasser, two slab casters, a pickling line tandem cold mill and a hot-dipped galvanizing line. Dearborn Works is capable of producing between 2 and 3 million net tons of raw steel annually. Products madeor at this location include carbon slabs, hot dip galvanized ZINCGRIP®, hot dip galvannealed ZINCGRIP GA steel and AHSS. Dearborn Works serves the automotive, heating, ventilation and air conditioning, converters and distribution markets. During 2020, the Dearborn Works hot strip mill, anneal and temper operations were permanently idled as partone of our cost reduction efforts.
Indiana Harbor is one of the largest integrated steelmaking facilities in North America and is located in East Chicago, Indiana, just 20 miles southeast of Chicago, Illinois. The major production facilities include three blast furnaces, two of which are currently operating, a recycle plant, four basic oxygen furnaces, ladle metallurgy facilities and vacuum degassing, four continuous casting machines, a slab dimensioning facility, an 80-inch hot strip mill, a pickling line, a five-stand tandem mill, batch and continuous annealing, a temper mill and two hot-dip galvanizing lines. Indiana Harbor currently operates two blast furnaces capable of producing 5.5 million net tons of raw steel annually and has a diverse facility capable of making a full range of flat products, including AHSS, American Petroleum Institute pipe skelp, motor-laminations, automotive exposed and martinsitic grades. Indiana Harbor is a leader in North American development of new automotive products, and is a primary supplier of coils to Kote and Tek. Indiana Harbor serves the automotive, appliance, contractor applications, distribution, strip converters and tubular markets.
Mansfield Works is located in Mansfield, Ohio, and produces high chrome ferritics and martensitic stainless steels and semi-finished hot bands. The major production facilities include a melt shop with two EAFs, an argon oxygen decarburization unit, a ladle metallurgy facility, a thin slab continuous caster, a walking beam slab furnace and a hot rolling mill. The thin slab caster uses an advanced technology production system to meet customer specifications. Mansfield Works is capable of producing approximately 0.6 million net tons of raw steel annually. Mansfield Works serves the automotive and appliance for stainless products markets.
Middletown Works is an integrated steel operation with carbon steel melting, casting, hot and cold rolling,10 stand-alone processing and finishing operations located in Middletown, Ohio. The major production facilities include a coke facility, a blast furnace, basic oxygen furnaces, a Composition Adjustment by Sealed argon bubbling – Oxygen Blowing (CAS-OB), a vacuum degasser and a continuous caster for the production of carbon steel, which is capable of producing nearly 3 million net tons of raw steel annually. Middletown Works also has a hot strip mill, pickling lines, a five-stand cold mill, an electrogalvanizing line, a hot dip carbon and stainless aluminizing line, a hot dip galvanizing line, box annealing furnaces, temper mills and an open coil annealing facility for finishing products. Products made at this location include hot-rolled and cold-rolled carbon steels, enameling steels, electrogalvanized ZINCGRIP ELECTRASMOOTH® steels, hot dip galvanized ZINCGRIP products and aluminized carbon and stainless steels. Middletown Works serves the automotive, appliance, heating, ventilation and air conditioning, culvert and distribution markets.
Piedmont is a finishing facility located in Newton, North Carolina, 50 miles northwest of Charlotte. The facility specializes in plasma cutting plate steel products into blanks for machinery and automotive manufacturers and primarily serves the truck axle blank business. Additionally, it provides services such as part leveling and just-in-time deliveries.
Riverdale is a compact strip mill that produces hot-rolled sheet located in Illinois, 14 miles west of our Indiana Harbor facility. The location allows for close shipping access to Lake Michigan, and is surrounded by highway and railroad systems. The Riverdale facility operates two basic oxygen furnaces, a ladle metallurgy facility, continuous thin slab caster, tunnel furnace and hot strip mill, which are capable of producing approximately 1 million net tons of thin-slab casting and rolling annually. The light gauge capabilities and tight gauge tolerances are desired characteristics for line pipe and structural and mechanical tubing producers. Principal products made at this plant include hot-rolled black bands in a full range of grades, including high carbon and alloy. The Riverdale facility primarily serves cold-rolled strip producers who supply the automotive, saw blade and strapping markets.
Rockport Works is located on the Ohio River in southwest Indiana near Rockport, Indiana. Rockport Works consists of a carbon and stainless steel finishing plant containing a continuous cold rolling mill, a continuous hot-dip galvanizing and galvannealing line, a continuous carbon and stainless steel pickling line, a continuous stainless steel annealing and pickling line, hydrogen annealing facilities and a temper mill. Utilizing innovative manufacturing technologies, the plant incorporates automated guidance vehicles and automated cranes to move the steel through the various finishing operations. Steels from Rockport Works include a full range of cold-rolled carbon, coated and stainless steels in either the annealed and pickled or temper rolled surface condition. Product offerings include a wide variety of AHSS. The Rockport Works hot dip galvanizing and galvannealing line incorporates revolutionary proprietary technologies, including induction transition heating, which provides rapid, accurate annealing temperature control. In addition, the Rockport Works line produces 80-inch sheet steel. Rockport Works serves the automotive, appliance, heating, ventilation and air conditioning and distribution for carbon and stainless markets.
Steelton is one of only three rail producers in North and South America and is located in Steelton, Pennsylvania, about 100 miles west of Philadelphia, Pennsylvania. Steelton consists of a 150 net ton direct current EAF with ladle refining and vacuum degassing, a three-strand continuous jumbo bloom caster and an ingot teeming facility. Steelton has an annual steelmaking capacity of 1 million net tons. Steelton produces railroad rails, specialty blooms and flat bars for use in railroad and forging markets.
Our Weirton facility is a tinplate facility located on the northern panhandle of West Virginia along the Ohio River in the city of Weirton, West Virginia. The location provides shipping access along the Ohio River, as well as highway and railroad shipping. Products made at this location include cold-rolled and tinplate products serving the distribution and packaging markets.
Zanesville Works is located on the Muskingum River in Zanesville, Ohio. The finishing facility's products include regular GOES and cold-rolled NOES. These specialty flat-rolled steels enable customers to create a variety of products, including generators, transformers and a host of other electrical devices. The primary markets Zanesville Works serves are the power and distribution transformers markets.
facilities. In the aggregate, we have annual configured production capacity of approximately 2320.5 million net tons of raw steel. Due toDuring the timing of the Acquisitionsyears ended December 31, 2023 and the idling of facilities in response to impacts of the COVID-19 pandemic,2022, our steelmaking facilities produced a total of 419.0 million and 16.8 million net tons of raw steel, duringrespectively.
SCRAP PROCESSING FACILITIES
Our scrap business consists of our subsidiary FPT, which has 22 locations in Michigan, Ohio, Tennessee, Florida and Ontario. These facilities are primarily located in Michigan and Ohio, which are in close proximity to our scrap consuming steel facilities. During the yearyears ended December 31, 2020.2023 and 2022, FPT processed approximately 3 million net tons of scrap metal, of which approximately 50% of total output was prime grade.
Direct Reduction Plant, Iron Ore Mines and Pellet PlantsDIRECT REDUCTION PLANT
Our direct reduction plant is located in Toledo, Ohio, and is near an existing dock, and has access to rail access and heavy haul roads for operation logistics. We are leasing the property on which the plant is located. Our Toledo direct reductionThis plant which began production in the fourth quarter of 2020, produces a specialized high quality iron alternative to scrap and pig iron. The Toledo direct reduction plantiron and has annual capacity of 1.9 million metric tons of HBI. During the years ended December 31, 2023 and 2022, our direct reduction plant produced a total of 1.7 million and 1.6 million metric tons of HBI, perrespectively.
IRON ORE MINES AND PELLET PLANTS
The following information concerning our mining properties has been prepared in accordance with the requirements of subpart 1300 of Regulation S-K, which first became applicable to us for the fiscal year ended December 31, 2021. These requirements differ significantly from the previously applicable disclosure requirements of SEC Industry Guide 7. Among other differences, subpart 1300 of Regulation S-K requires us to disclose our mineral resources, in addition to our mineral reserves, as of the end of our most recently completed fiscal year both in the aggregate and we expectfor each of our individually material mining properties.
As used in this Annual Report on Form 10-K, the terms “mineral resource,” “measured mineral resource,” “indicated mineral resource,” “inferred mineral resource,” “mineral reserve,” “proven mineral reserve,” and “probable mineral reserve” are defined and used in accordance with subpart 1300 of Regulation S-K. Under subpart 1300 of Regulation S-K, mineral resources may not be classified as “mineral reserves” unless the determination has been made by a QP that the mineral resources can be the basis of an economically viable project. Investors are specifically cautioned not to reach full production rateassume that any part or all of the mineral deposits (including any mineral resources) in these categories will ever be converted into mineral reserves, as defined by the second quarterSEC.
Investors are cautioned that, except for that portion of 2021.mineral resources classified as mineral reserves, mineral resources do not have demonstrated economic value. Estimates of inferred mineral resources have too high of a degree of uncertainty as to their existence and may not be converted to a mineral reserve. Therefore, investors are cautioned not to assume that all or any part of an inferred mineral resource exists, that it can be the basis of an economically viable project, or that it will ever be upgraded to a higher category. Likewise, investors are cautioned not to assume that all or any part of measured or indicated mineral resources will ever be converted to mineral reserves.
See Part I – Item 1A. Risk Factors – V. Sustainability and Development Risks – We rely on estimates of our recoverable mineral reserves, which are complex due to geological characteristics of the properties and the number of assumptions made.
The information that follows relating to the Hibbing, Minorca, Northshore, Tilden and United Taconite iron ore mines is derived, for the most part, from, and in some instances is an extract from, the Technical Report Summaries relating to such properties prepared in compliance with Item 601(b)(96) and subpart 1300 of Regulation S-K. Portions of the following information are based on assumptions, qualifications and procedures that are not fully described herein. Reference should be made to the full text of the Technical Report Summaries, which are filed as Exhibits 96.1 through 96.5 to this Annual Report on Form 10-K and are incorporated by reference herein.
All of our iron ore mining operations are open-pit mines. Additional pit development is underway as required by long-range mine plans. Drilling programs are conducted periodically to collect geologic modeling data and for refining ongoing operations.
Geologic models are developed for all mines to define the major ore and waste rock types. Computerized block models for iron ore are constructed that include all relevant geologic and metallurgical data. These are used to generate grade and tonnage estimates, followed by detailed mine design and life of mineLoM operating schedules.
We currently own or co-own and operate five operatingproduction-stage iron ore mines in Michigan and Minnesota, as well as one indefinitely idled mine in Michigan. Following the AM USA Transaction, we now have an aggregate annual production capacity of approximately 28 million long tons of iron ore pellets, including our 85.3% share of the Hibbing mine production. Historically, our share of production capacity was approximately 21 million long tons of iron ore pellets
annually. We produced 17 million, 20 million and 20 million long tons of iron ore pellets in 2020, 2019 and 2018, respectively.
Our iron ore mines produce from deposits located within the Biwabik and Negaunee Iron Formation, which are classified as Lake Superior type iron formations that formed under similar sedimentary conditions in shallow marine basins approximately two billion years ago. Magnetite and hematite are the predominant iron oxide ore minerals present, with lesser amounts of goethite and limonite. Quartz is the predominant waste mineral present, with lesser amounts of other chiefly iron bearing silicate and carbonate minerals. The ore minerals liberate from the waste minerals upon fine grinding.
The following represents iron ore production for the last three fiscal years:
| | | | | | | | | | | | | | | | | |
| Iron Ore Production |
| (In millions of long tons) | 2023 | | 2022 | | 2021 |
Hibbing1 | 6 | | | 5 | | | 7 | |
| Minorca | 3 | | | 3 | | | 3 | |
Northshore2 | 3 | | | 1 | | | 5 | |
| Tilden | 8 | | | 6 | | | 7 | |
| United Taconite | 5 | | | 5 | | | 5 | |
| Total | 25 | | | 20 | | | 27 | |
| | | | | |
1Hibbing is reported at 85.3% based on our ownership level. |
2In the second quarter of 2022, we temporarily idled our Northshore operations. The Northshore mine restarted production in the second quarter of 2023. |
The following provides an overview of our iron ore properties:
All the infrastructure necessary to mine and process significant commercial quantities of iron ore is currently in place at all of our mine locations. Infrastructure items include high voltage electrical supplies, natural gas pipelines that connect to the North American distribution system, water sources, paved roads and highways, railroads for transporting crude ore and finished products, port facilities that connect to the Great Lakes, and accommodations for employees. Local and state infrastructure also includes hospitals, schools, airports, equipment suppliers, fuel suppliers, commercial laboratories and communication systems. Labor is readily available with major population centers within 25 miles of all of our properties.
All of our iron ore mining operations grant leases, licenses and easements for various purposes, including miscellaneous community land uses, utility infrastructure and other third-party uses, that encumber our properties but do not materially inhibit operations. Certain assets also serve as collateral securing obligations under our ABL Facility and our senior secured notes. We maintain the requisite state and federal permits and are in material compliance with all material permits.
HIBBING
Hibbing (85.3% owned) is located immediately north of the city of Hibbing, Minnesota in the center of Minnesota’s Mesabi Iron Range. The mining and processing operation is located between latitude 47°25’48” N and 47°31’48” N and longitude 93°04’54” W and 92°54’36” W.
| | | | | |
Mining began in 1976 as a joint venture between Bethlehem Steel Corporation and Steel Company of Canada. Cliffs first became involved in the joint venture when it purchased Pickands Mather's 15% share in 1986. Prior to the AM USA Transaction, we owned 23% of Hibbing, ArcelorMittal USA had a 62.3% interest and U.S. Steel had a 14.7% interest. On December 9, 2020, as a result of the AM USA Transaction, we acquired an additional 62.3% ownership stake in the Hibbing mine and became the majority owner and mine manager. Hibbing holds 30,670 acres of surface rights, of which 1,150 acres are associated with mineral leases. The majority of the mineral rights are leased. The property is comprised of 6,913 acres of mineral leases expiring between 2024 and 2056. Leases are maintained by making minimum prepaid royalty payments. Mining leases routinely are renegotiated and renewed as they approach their respective expiration dates. The operation includes an open pit truck and shovel mine, a concentrator that utilizes single stage crushing, AG mills and magnetic separation to produce a magnetite concentrate, which is then delivered to an on-site pellet plant. From the site, pellets are transported by BNSF (Burlington Northern Santa Fe, LLC) rail to a ship loading port at Superior, Wisconsin, operated by BNSF. The net book value of our ownership of Hibbing's property, plant and equipment was $85 million as of December 31, 2023. | |
For more information, see Exhibit 96.1, the Technical Report Summary on the Hibbing Taconite Property, Minnesota, USA, prepared for the Company by the QP, SLR, with an effective date of December 31, 2021.MINORCA
Minorca (100% owned) is located in the center of Minnesota’s Mesabi Iron RangeRange. The Laurentian Pit is located near the City of Gilbert, Minnesota at latitude 47°30'0"N and longitude 92°26’30"W, East 1 Pit is approximately ten miles north of Hibbing, Minnesota,located at latitude 47°31'30"N and five mileslongitude 92°23’30"W, and East 2 Pit is located just west of Chisholm, Minnesota. We own an 85.3% interest in the Hibbing mine, which has been operating since 1976. A subsidiaryCity of U.S. Steel owns the remaining 14.7% of the Hibbing mine. Prior to the AM USA Transaction, we owned 23% of Hibbing, ArcelorMittal USA had a 62.3% interestBiwabik at latitude 47°32'0"N and U.S. Steel had a 14.7% interest. On December 9, 2020, as a result of the AM USA Transaction, we acquired an additional 62.3% ownership stake in the Hibbing mine and became the majority owner and mine manager. Each partner takes its share of production pro rata; however, provisions in the joint venture agreement allow additional or reduced production to be delivered under certain circumstances. In 2020, the Hibbing mine produced 5.5 million long tons of iron ore pellets, of which 1.6 million long tons were for our account. Hibbing owns 3% of the ore reserves and leases 97% via multiple mineral leases having varying expiration dates. Mining leases routinely are renegotiated and renewed as they approach their respective expiration dates. Hibbing operations consist of an open pit truck and shovel mine, a concentrator that utilizes single stage crushing, AG mills and magnetic separation to produce a magnetite concentrate, which is then delivered to an on-site pellet plant. From the site, pellets are transported by BNSF rail to a ship loading port at Superior, Wisconsin, operated by BNSF.
longitude 92°22’30"W. The Minorca mineplant is located in the center of Minnesota’s Mesabi Iron Range near Virginia, Minnesota. In 2020, the mine produced 2.8 million long tons of iron ore pellets, of which approximately 0.2 million long tons were produced during the period subsequent to the AM USA Transaction. We own 100% of the Minorca mine, which has been operating since 1977, and lease 100% of the mineral rights. Mining is conducted on multiple mineral leases having varying expiration dates. Mining leases routinely are renegotiated and renewed as they approach their respective expiration dates. This operation includes a concentrating and pelletizing facility, along with two open pit iron ore mines located approximately seven miles fromto the processing facilities. The processing operations consistnortheast, near the town of a crushing facility, a three-line concentration facilityVirginia, Minnesota at latitude 47°33'30"N and a single-line straight grate pelletizing plant. Pellets are transportedlongitude 92°31.5'30"W.
Operations commenced in 1976 as an asset of Inland Steel Company. In 1998, Ispat International purchased Inland Steel and, in 2004, merged with LNM Holdings and International Steel Group to form Mittal Steel, which in 2007 merged with Arcelor to form ArcelorMittal. Minorca has been wholly owned by Cliffs since the 2020 AM USA Transaction.
| | | | | |
| Minorca holds 13,690 acres of surface rights, of which 282 acres are associated with mineral leases. 100% of the mineral rights are leased. The property is comprised of 3,135 acres of mineral leases expiring between 2035 and 2056. Leases are maintained by making minimum prepaid royalty payments. Mining leases routinely are renegotiated and renewed as they approach their respective expiration dates. The operation includes a concentrating and pelletizing facility, along with two open pit iron ore mines located approximately seven miles from the processing facilities. The processing operations consist of a crushing facility, a three-line concentration facility and a single-line straight grate pelletizing plant. Pellets are transported by CN rail to ports on Lake Superior. The net book value of Minorca's property, plant and equipment was $209 million as of December 31, 2023. |
For more information, see Exhibit 96.2, Technical Report Summary on Lake Superior and shipped to Indiana Harbor located in East Chicago, Indiana.the Minorca Property, Minnesota, USA, prepared for the Company by the QP, SLR, with an effective date of December 31, 2021.
NORTHSHORE
Northshore's (100% owned) mine is located on the northeastern edge of the Mesabi Iron Range in northeastern Minnesota, approximately twofour miles southsoutheast of Babbitt, Minnesota onat latitude 47°40'12.15"N and longitude 91°53'1.28"W. The processing facility is approximately 41 miles to the northeastern endsoutheast and immediately adjacent to the city of the Mesabi Iron Range. Northshore’s processing facilities are located in Silver Bay in Lake County, Minnesota near Lake Superior. In 2020, the Northshore mine produced 3.8 million long tons of iron ore pellets, including both standardat latitude 47°17'38.95"N and DR-grade pellets. We own 100% of the Northshore mine, which has been operating since 1990, and lease 100% of the mineral rights. Mining is conducted on multiple mineral leases having varying expiration dates. Mining leases routinely are renegotiated and renewed as they approach their respective expiration dates. Operations consistlongitude 91°15'23.38"W.
| | | | | |
Operations commenced in 1952 as an asset of the Reserve Mining Company and continued production until 1986 when Reserve Mining declared bankruptcy. Cyprus Minerals Company purchased the facilities in 1989. Cyprus subsequently sold the facilities to Cliffs in 1994. Northshore holds 28,041 acres of surface rights, of which 8,966 acres are associated with mineral leases. 100% of the mineral rights are leased. The property is comprised of 10,356 acres of mineral leases. Some leases do not expire until the mineral reserves are exhausted while others expire between 2034 and 2075. Leases are maintained by making minimum prepaid royalty payments. Mining leases routinely are renegotiated and renewed as they approach their respective expiration dates. | |
The operation includes an open pit truck and shovel mine where two stages of crushing occur before the ore is transported along a wholly owned 47-mile rail line to the plant site in Silver Bay. At the plant site, two additional stages of crushing occur before the ore is sent to the concentrator. The concentrator utilizes rod mills and magnetic separation to produce a magnetite concentrate, which is delivered to the pellet plant located on-site. The plant can produce both standard and DR-grade pellets. The plant site has its own ship loading port located on Lake Superior.
The net book value of Northshore's property, plant and equipment was $235 million as of December 31, 2023.
For more information, see Exhibit 96.3, Technical Report Summary on the Northshore Property, Minnesota, USA, prepared for the Company by the QP, SLR, with an effective date of December 31, 2021.
TILDEN
Tilden mine(100% owned) is located in Marquette County in Michigan’s Upper Peninsula, on the Marquette Iron Range, in Michigan’s Upper Peninsula approximately five miles south of Ishpeming, Michigan. In 2020, the Tilden mine produced 6.3 million long tons of iron ore pellets. We own 100% of the Tilden mine, which has been operating since 1974. We own 91% and lease the remaining 9% of the ore reserves. Operations consist of an open pit truck and shovel mine, a concentrator that utilizes single stage crushing, AG mills, magnetite separation and floatation to produce hematite and magnetite concentrates that are then supplied to the on-site pellet plant. From the site, pellets are transported by our LS&I rail to a ship loading port at Marquette, Michigan, operated by LS&I.
The United Taconite mine is located on Minnesota’s Mesabi Iron Range in and around the city of Eveleth, Minnesota. Ishpeming, Michigan at latitude 46° 29' N and longitude 87° 40' W.
| | | | | |
| The property commenced operations in 1974 under a partnership of Algoma Steel, Stelco, J&L Steel, Wheeling-Pittsburgh Steel, Sharon Steel and The Cleveland-Cliffs Iron Company. The property has since been at least partially in the possession of a subsidiary of Cliffs. In 2001, Cliffs acquired Algoma Steel's 45% interest in Tilden. In 2017, Cliffs became the sole owner of Tilden. Tilden holds 21,100 acres of surface rights and leases 2,470 acres of mineral rights expiring between 2061 and 2070. Leases are maintained by making minimum prepaid royalty payments. Mining leases routinely are renegotiated and renewed as they approach their respective expiration dates. Operations include an open pit truck and shovel mine, a concentrator that utilizes single stage crushing, AG mills and floatation to produce hematite concentrates that are then supplied to the on-site pellet plant. From the site, pellets are transported by our LS&I (Lake Superior & Ishpeming Railroad Company) rail to a ship loading port at Marquette, Michigan, operated by LS&I. |
The United Taconite concentratornet book value of Tilden's property, plant and pelletizing facilities are located ten miles southequipment was $245 million as of December 31, 2023.For more information, see Exhibit 96.5, Technical Report Summary on the mine, nearTilden Property, Michigan, USA, prepared for the townCompany by the QP, SLR, with an effective date of Forbes, Minnesota. In 2020, the United Taconite mine produced 5.2 million long tons of iron ore pellets. We own 100% of the United Taconite mine, which has been operating since 1965, and lease 100% of the mineral rights. Mining is conducted on multiple mineral leases having varying expiration dates. Mining leases routinely are renegotiated and renewed as they approach their respective expiration dates. United Taconite operations consist ofDecember 31, 2021.
3933 | CLF 2023 FORM 10-K
UNITED TACONITE
United Taconite's (100% owned) mine and offices are located on Minnesota's Mesabi Iron Range just north of Eveleth, Minnesota at latitude 47°29'1.62" N, longitude 92°32'23.69" W. The processing facilities are located approximately eight miles to the southeast.
| | | | | |
The property commenced operations as an asset of Eveleth Taconite Company in 1965 before it was purchased by United Taconite (70% Cliffs and 30% Laiwu Steel) in December 2003. The property has been a wholly owned subsidiary of Cliffs since 2008. United Taconite owns 14,199 acres of surface rights, of which 703 acres are associated with mineral leases. An additional 145 acres of surface rights are leased from the State of Minnesota. We lease 100% of the mineral rights, comprised of 4,908 acres expiring between 2037 and 2066, with the exception of the State of Minnesota mineral lease, which expires in 2027. Leases are maintained by making minimum prepaid royalty payments. Mining leases routinely are renegotiated and renewed as they approach their respective expiration dates. Operations include an open pit truck and shovel mine where two stages of crushing occur before the ore is transported by rail, operated by CN, to the plant site. At the plant site an additional stage of crushing occurs before the ore is sent to the concentrator. The concentrator utilizes rod mills and magnetic separation to produce a magnetite concentrate, which is delivered to the on-site pellet plant. From the plant site, pellets are transported by CN rail to a ship loading port at Duluth, Minnesota, operated by CN. The net book value of United Taconite's property, plant and equipment was $559 million as of December 31, 2023. | |
For more information, see Exhibit 96.4, Technical Report Summary on the United Taconite Property, Minnesota, USA, prepared for the Company by the QP, SLR, with an effective date of December 31, 2021.MINERAL RESOURCES
Mineral resources are defined under Item 1300 of Regulation S-K as a concentration or occurrence of material of economic interest in or on the Earth’s crust in such form, grade or quality, and quantity that there are reasonable prospects for economic extraction. A mineral resource is a reasonable estimate of mineralization, taking into account relevant factors such as cut-off grade, likely mining dimensions, location or continuity that, with the assumed justifiable technical and economic conditions, is likely to, in whole or part, become economically extractable.
A detailed breakdown of the mineral resources exclusive of mineral reserves is presented in the table below. Mineral resources were defined and constrained within open-pit shells, prepared by Cliffs, and based on a US$90.00/WLT pellet price, while meeting defined cut-off grade criteria and existing pellet specifications. All mineral resource estimates were reviewed and validated by the QP, SLR.
The following represents iron ore mineral resources, exclusive of mineral reserves, as of December 31, 2023 and 2022:
| | | | | | | | | | | | | | | | | | | | | | | | | | | | | |
| Iron Ore Mineral Resources |
| Measured | Indicated | Measured + Indicated | Process | Inferred |
| (In millions of long tons) | Tonnage | % Grade | Tonnage | % Grade | Tonnage | % Grade | Recovery | Tonnage | % Grade |
| Total Iron Ore | 1,351 | | 22.5 | | 1,483 | | 23.6 | | 2,834 | | 23.1 | | 31% | 420 | | 32.4 | |
| | | | | | | | | |
| Michigan | — | | — | | 135 | | 35.5 | | 135 | | 35.5 | | 36% | 350 | | 34.7 | |
| Minnesota | 1,351 | | 22.5 | | 1,348 | | 22.4 | | 2,699 | | 22.4 | | 31% | 70 | | 21.0 | |
| | | | | | | | | |
Hibbing1 | 8 | | 19.2 | | 1 | | 18.7 | | 9 | | 19.2 | | 25% | — | | — | |
| Minorca | 484 | | 22.9 | | 317 | | 22.9 | | 801 | | 22.9 | | 33% | 30 | | 21.1 | |
| Northshore | 767 | | 22.1 | | 391 | | 22.4 | | 1,158 | | 22.2 | | 26% | 14 | | 19.8 | |
| Tilden | — | | — | | 135 | | 35.5 | | 135 | | 35.5 | | 36% | 350 | | 34.7 | |
| United Taconite | 92 | | 23.6 | | 639 | | 22.2 | | 731 | | 22.4 | | 32% | 26 | | 21.5 | |
| | | | | | | | | |
1Hibbing is reported at 85.3% based on our ownership level. | |
| Reference point selected is the saleable tons based on the process recovery. |
| Process recovery may change based on the required saleable product mix and is reported as wet product percentage. |
| Mineral resources are estimated using the following cut-off grades: 25% FeT for Tilden hematite; 15% magnetic Fe for Northshore; 16% magnetic Fe for Minorca; 17% magnetic Fe for United Taconite; and 13% magnetic Fe for Hibbing. |
| Tonnage is reported in long tons equivalent to 2,240 pounds and has been rounded to the nearest 100,000. |
| Mineral resources are reported at a $90.00/lt wet standard pellet price freight-on-board (FOB) Lake Superior, which is based on the mine planning model's three-year trailing average of the realized product revenue rate. |
We did not have any material changes to our mineral resources during 2023. The material assumptions and criteria used for the mineral resource estimates, including but not limited to leases, permits and geotechnical pit design, are covered in more detail in Sections 11 through 13 of the respective Technical Report Summaries filed as Exhibits 96.1 through 96.5 to this Annual Report on Form 10-K.
MINERAL RESERVES
Mineral reserves are defined under Item 1300 of Regulation S-K as an estimate of tonnage and grade or quality of indicated and measured mineral resources that, in the opinion of the QP, can be the basis of an economically viable project. More specifically, it is the economically mineable part of a measured or indicated mineral resource, which includes diluting materials and allowances for losses that may occur when the material is mined or extracted.
Proven mineral reserves are defined under Item 1300 of Regulation S-K as the economically mineable part of a measured mineral resource and can only result from conversion of a measured mineral resource. Probable mineral reserves are defined under Item 1300 of Regulation S-K as the economically mineable part of an indicated and, in some cases, a measured mineral resource. All mineral reserves are classified as proven or probable and are supported by LoM plans.
Mineral reserves are based on pricing that does not exceed the three-year trailing average index price of iron pellets adjusted to realized price. We evaluate and analyze, and engage QPs to review and verify, mineral reserves in accordance with our mineral policy and SEC requirements and then complete updated LoM plans. The table below identifies the year in which the latest updated LoM plan was completed.
Mineral reserves estimates for our iron mines are constrained by fully designed open pits developed using three-dimensional modeling techniques. These open pits incorporate design slopes, practical mining shapes and access ramps to assure the accuracy of our mineral reserve estimates. All operations' mineral reserves have been adjusted net of production through year-end 2023. All mineral reserves estimates as of December 31, 2021 were reviewed and validated by the QP, SLR.
The following represents iron ore mineral reserves as of December 31, 2023:
| | | | | | | | | | | | | | | | | | | | | | | | | | |
| Iron Ore Mineral Reserves |
| as of December 31, 2023 |
| Last LoM Plan | Proven | Probable | Proven & Probable | Process |
| (In millions of long tons) | Reserve Analysis | Tonnage | % Grade | Tonnage | % Grade | Tonnage | % Grade | Recovery |
| Total Iron Ore | | 539 | | 24.0 | | 1,643 | | 26.4 | | 2,182 | | 25.8 | | 33% |
| | | | | | | | |
| Michigan | | 4 | | 35.3 | | 478 | | 34.7 | | 482 | | 34.7 | | 37% |
| Minnesota | | 535 | | 23.9 | | 1,165 | | 23.0 | | 1,700 | | 23.3 | | 31% |
| | | | | | | | |
Hibbing1 | 2021 | 47 | | 18.7 | | 8 | | 18.7 | | 55 | | 18.7 | | 26% |
| Minorca | 2021 | 86 | | 23.7 | | 7 | | 25.1 | | 93 | | 23.8 | | 34% |
| Northshore | 2020 | 288 | | 25.3 | | 519 | | 24.1 | | 807 | | 24.5 | | 29% |
| Tilden | 2021 | 4 | | 35.3 | | 478 | | 34.7 | | 482 | | 34.7 | | 37% |
| United Taconite | 2019 | 114 | | 23.1 | | 631 | | 22.1 | | 745 | | 22.3 | | 33% |
| | | | | | | | |
1Hibbing is reported at 85.3% based on our ownership level. |
| Reference point selected by the QP is the saleable tons based on the process recovery. |
| Process recovery may change based on the required saleable product mix and is reported as wet product percentage. |
| Mineral reserves are estimated using the following cut-off grades: 25% FeT for Tilden hematite; 19% magnetic Fe for Northshore; 16% magnetic Fe for Minorca; 17% magnetic Fe for United Taconite; and 13% magnetic Fe for Hibbing. |
| Tonnage is reported in long tons equivalent to 2,240 pounds and has been rounded to the nearest 100,000. |
| Mineral reserves are classified as probable if not scheduled within the first 20 years. |
| Mineral reserves are reported at a $90.00/lt wet standard pellet price freight-on-board (FOB) Lake Superior, which is based on the mine planning model's three-year trailing average of the realized product revenue rate. |
The material assumptions and criteria used for the mineral reserves estimates, including but not limited to leases, permits and geotechnical pit design, are covered in more detail in Sections 11 through 13 of the respective Technical Report Summaries filed as Exhibits 96.1 through 96.5 to this Annual Report on Form 10-K.
For comparison purposes, the following represents iron ore mineral reserves as of December 31, 2022:
| | | | | | | | | | | | | | | | | | | | | | | |
| Iron Ore Mineral Reserves |
| as of December 31, 2022 |
| Proven | Probable | Proven & Probable | Process |
| (In millions of long tons) | Tonnage | % Grade | Tonnage | % Grade | Tonnage | % Grade | Recovery |
| Total Iron Ore | 593 | | 23.8 | | 1,665 | | 26.5 | | 2,258 | | 25.8 | | 32% |
| | | | | | | |
| Michigan | 4 | | 35.3 | | 500 | | 34.7 | | 504 | | 34.7 | | 37% |
| Minnesota | 589 | | 23.7 | | 1,165 | | 23.0 | | 1,754 | | 23.2 | | 31% |
| | | | | | | |
Hibbing1 | 67 | | 18.7 | | 8 | | 18.7 | | 75 | | 18.7 | | 26% |
| Minorca | 95 | | 23.7 | | 7 | | 25.1 | | 102 | | 23.8 | | 34% |
| Northshore | 299 | | 25.3 | | 519 | | 24.1 | | 818 | | 24.6 | | 29% |
| Tilden | 4 | | 35.3 | | 500 | | 34.7 | | 504 | | 34.7 | | 37% |
| United Taconite | 128 | | 23.1 | | 631 | | 22.1 | | 759 | | 22.3 | | 33% |
| | | | | | | |
1Hibbing is reported at 85.3% based on our ownership level. |
| Reference point selected by the QP is the saleable tons based on the process recovery. |
| Process recovery may change based on the required saleable product mix and is reported as wet product percentage. |
| Mineral reserves are estimated using the following cut-off grades: 25% FeT for Tilden hematite; 19% magnetic Fe for Northshore; 16% magnetic Fe for Minorca; 17% magnetic Fe for United Taconite; and 13% magnetic Fe for Hibbing. |
| Tonnage is reported in long tons equivalent to 2,240 pounds and has been rounded to the nearest 100,000. |
| Mineral Reserves are classified as probable if not scheduled within the first 20 years. |
| Mineral Reserves are reported at a $90.00/lt wet standard pellet price freight-on-board (FOB) Lake Superior, which is based on the mine planning model's three-year trailing average of the realized product revenue rate. |
Overall, mineral reserves estimates as of December 31, 2023, as compared to the prior-year period, decreased by 3%, which was driven by mining depletion.
INTERNAL CONTROLS DISCLOSURE
We demonstrated repeated attainment of annual production and quality targets for at least 40 years at each material iron ore mine operated by the Company. Internal controls the Company uses in its industry-standard approach to exploration and mineral resource and reserve estimation efforts are governed by its Mineral Reserve and Mineral Resource Estimation Policy and are detailed in Cliffs’ minimum operating standards for Resource Estimation and Strategic Mine Planning. The controls include: confirmation of drill collar locations and drill hole traces, drill logging and sample collection and security, database verification and security, QA/QC programs, internal and third-party QP statistical analysis, third-party QP model validation, and reconciliation. Modeling and analysis of the Company’s resources has been developed by Company personnel or third-party consultant SLR and reviewed by internal management and the external independent QP, SLR. Reserve estimations have been completed by Company personnel and reviewed by internal management and the QP, SLR.
Drill hole collar surveying methods have evolved with advancements in technology, moving from optical methods to global positioning system, which is currently in use. For the deposit type, all survey methods used for the collar locations are expected to provide adequate accuracy for the drill hole locations. Due to the relatively shallow depth and vertical nature of drill holes at Cliffs’ Minnesota mining operations, downhole deviation surveys are typically not conducted. Drill holes pierce the generally shallow-dipping, tabular iron formation at near perpendicular angles. At the more geologically and structurally complex Tilden mine in Michigan, where drilling deeper than 500 feet is required, downhole surveys have moved from a clay-impression procedure to the gyroscopic method currently in use.
Drill core is transported directly from the drill rig to each site’s core logging facility by rail, operated by CN,either the drilling contractor or Cliffs’ personnel. Temporary core storage is located at each site’s secure logging facility. Depending on the mining operation, unused sample reserves, parts, concentrates and splits are securely stored in labeled boxes or barrels at a Cliffs laboratory facility or logging facility, or via a contracted external laboratory.
Cliffs' QA/QC programs are site-specific and range from in-development to well-developed, long standing protocols that involve formal procedures for the use of crude material standards developed from on-site material, as well as regularly inserted coarse and concentrate duplicate samples, control chart analysis and reporting. Cliffs typically uses internal and external labs for geometallurgical analyses that are accredited with ASQ/ANSI ISO-9001:2015 (American Society for Quality/American National Standards Institute) for their system of quality management. Quality sample results are monitored and enacted on where warranted. Also, Cliffs has implemented a drill campaign reporting practice to ensure results are documented, with defined and illustrated failure metrics, outcomes of investigations, comparisons with previous year’s results and recommendations. The QP, SLR, reviewed Cliffs' QA/QC practices and provided recommendations for further work. Where QA/QC programs are still in
development and prior to resource estimation, Cliffs conducted data verification studies utilizing a suite of blind crude ore standards and blind duplicates from historical sample reserves within the LoM plan. Where unaccredited labs provided data used in resource estimation, check lab studies were initiated to verify analytical results. Cliffs is currently working toward aligning QA/QC protocols at each mine to the plant site. AtCompany’s current best practice.
Cliffs maintains exploration drill hole data in an externally-managed, access-controlled acQuire database that is backed up online at regularly scheduled intervals to provide data redundancy and security. Certification of database integrity is accomplished by both visual and statistical inspections comparing geology, assay values and survey locations cross-referenced back to laboratory data and geologic logs. Any discrepancies identified are corrected by referring to hard-copy assay and core log information archived in Cliffs' Mine Engineering department files. Prior to modeling, a secondary validation check is completed using built-in data validation routines in the plant site an additional stagemodeling software.
Cliffs performs routine drill hole database verification with every new drilling program and new block model build, including: check of crushing occurs beforeunique drill hole identifications and collar coordinates; check of assay or lithology points extending past the orespecified maximum depth of drill hole; check of abnormal dips and azimuths of downhole drill hole surveys; check of negative, overlapping and missing intervals; and check of incorrect lithologic codes and assay values.
In 2020 and 2021, Cliffs' geologists completed data verification exercises within the LoM plan area for each mining operation. This was audited by the QP, SLR, to assess accuracy and completeness. Database values were checked against source documents including collar surveys, geologic logs and assay certificates. Data verification included collar coordinates, depth intervals of geologic units and assay samples, and results of geometallurgical analyses applied to mineral resource estimation and mine planning.
Cliffs’ mineral resource estimates were validated by the QP, SLR, using standard industry techniques including statistical comparisons with composite samples and parallel nearest neighbor estimates, swath plots, as well as visual reviews in cross-section and plan. A visual review comparing blocks to drill holes for key economic variables, completed after the block modeling work, was performed to ensure general lithologic and analytical conformance. Cliffs’ mining operations have demonstrated good agreement between planned and actual product produced over more than 40 years for each operation.
Cliffs classifies the mineral resources based primarily on drill hole spacing and influenced by geologic continuity, ranges of economic criteria and reconciliation. Some post-processing is sentundertaken to ensure spatial consistency and remove isolated and fringe blocks. The resource area for each operation is limited by a polygon and subsequent pit shell based on practical mining limits. To ensure that all mineral resource statements satisfy the concentrator. The concentrator utilizes rod mills and magnetic separation to produce a magnetite concentrate, which is delivered to“reasonable prospects for economic extraction” requirement, in the on-site pellet plant. From the plant site, pellets are transported by CN rail to a ship loading port at Duluth, Minnesota, operated by CN.
The Empire mine was indefinitely idled in 2016 and had an annual iron ore pellet production capability of 6 million long tons. We own 47%definition of the oremineral resources under Item 1300 of Regulation S-K, factors significant to technical feasibility and potential economic viability are considered (e.g., ability to obtain permits and legal and land tenure considerations). Mineral resources are defined and constrained within optimized, open-pit shells, prepared by Cliffs and reviewed by the QP, SLR, and based on a US$90.00/WLT pellet value and target pellet iron content.
Grade and tonnage reconciliations are run on current production versus modeled production, which provides insight on the accuracy of the modeled assay data versus actual production for each mining operation.
For a discussion of comprehensive risk inherent in the estimation of mineral reserves, see Part I - Item 1A. Risk Factors - V. Sustainability and leaseDevelopment Risks - We rely on estimates of our recoverable mineral reserves, which are complex due to geological characteristics of the remaining 53%.properties and the number of assumptions made.
Coal Mining and CokemakingCOAL MINING AND COKEMAKING
Princeton is a coal mining complex located in West Virginia that specializes in surface and underground mining of metallurgical coal to produce coke and pulverized coal injection coal. WeAs of December 31, 2023, we have annual rated metallurgical coal production capacity of 2.31.8 million net tons from our Princeton mine. In 2020,During the years ended December 31, 2023 and 2022, the mine produced approximately 1.61.3 million and 1.5 million net tons of coal, of which approximately 0.1 million net tons were produced during the period subsequent to the AM USA Transaction.respectively. We own 100% of the Princeton mine, which has been operating since 1995. We own 52%60% of the coal reservesmineral rights and lease 48%40% via multiple mineral leases having varying expiration dates. Mining leases routinely are renegotiated and renewed as they approach their respective expiration dates. Princeton's operations consist of twothree open-pit surface mines, two underground mines, a preparation plant and two rail loadouts.
In 2020, our cokemakingOur Monessen and Warren facilities produced between 2.0 million and 2.5 million net tons of coke, of which approximately 0.6 million net tons were produced during the period subsequent to the respective date of acquisition for each facility. Mountain State Carbon produces furnace coke and related by-products from its plant in Follansbee, West Virginia, which consists of four batteries. Monessen producesproduce furnace coke and related by-products in Monessen, Pennsylvania and is temporarily idled due to the COVID-19 pandemic. Warren produces furnace coke and related by-products from its plant in Warren, Ohio, and supplies the Cleveland facility.respectively. We also operate a cokemaking facilitiesfacility located within Burns HarborHarbor. These facilities have an aggregate annual rated capacity of 2.6 million net tons. During the years ended December 31, 2023 and Middletown Works.2022, our cokemaking facilities produced 2.4 million and 2.1 million net tons of coke, respectively.
Other BusinessesOTHER BUSINESSES
Our Tubular operating segment consists of our subsidiary Tubular Components, which has plants in Walbridge, Ohio;Ohio and Columbus, Indiana; and Queretaro, Mexico.Indiana. The Walbridge plant operates six electric resistance welded tube mills.mills on owned property. The Columbus plant also operates sixfive electric resistance welded tube mills and four high-speed cold saws on leased property. The plant in Queretaro, Mexico is currently in the process of being shut down and has ceased tube production. The Queretaro plant is located on leased land in a leased building, under a lease that expires in April 2021. The high-speed cold saw that was operating at the Queretaro plant has already been relocated to the Columbus plant and the tube mill will be returned to the U.S. and replace an existing, older tube mill currently in operation.
Our Tooling and Stamping operating segment consists of our subsidiary Precision Partners,Tooling and Stamping and its related companies, which provides advanced-engineered solutions, tool design and build, hot- and cold-stamped steel components and complex assemblies for the automotive market across ten plants, of which certain of these are under long-term lease agreements, in Ontario, Alabama, Kentucky and Kentucky.Tennessee. Its facilities feature seveneight large-bed, hot-stamping presses, providing 1314 lines of production; 8182 cold-stamping presses ranging from 150 net tons to 3,000 net tons of pressing capacity; 1718 large-bed, high-tonnage tryout presses with
prove-out capabilities for new tool builds; and 144151 multi-axis welding assembly cells. We are also in the process of constructing a new Precision Partners facility in Tennessee. We expect to complete construction and begin production of prototype components in the third quarter of 2021, and expect to reach commercial production in the first quarter of 2022.
Mineral Policy
We have a corporate policy prescribing internal controls and procedures with respect to auditing and estimating of minerals. The procedures contained in the policy include the calculation of mineral estimates at each property by our engineers, geologists and accountants, as well as third-party consultants. Management compiles and reviews the calculations, and once finalized, such information is used to prepare the disclosures for our annual and quarterly reports. The disclosures are reviewed and approved by management, including our chief executive officer and chief financial officer. Additionally, the long-range mine planning and mineral estimates are reviewed annually by our Audit Committee. Furthermore, all changes to mineral estimates, other than those due to production, are adequately documented and submitted to senior operations officers for review and approval. Finally, periodic reviews of long-range mine plans and mineral reserve estimates are conducted at mine staff meetings, senior management meetings and by independent experts.
Reserves are defined by SEC Industry Standard Guide 7 as that partOur European operating segment consists of a mineral depositmetal distribution company that could be economicallybuys and legally extractedsells steel, steel products and produced atother materials. We operate out of six different European countries: the time ofNetherlands, Italy, Germany, France, Spain and the reserve determination. All reserves are classified as proven or probable and are supported by life-of-mine plans.United Kingdom.
Reserve estimates are based on pricing that does not exceed the three-year trailing average index price of iron ore and coal adjusted to realized price. We evaluate and analyze mineral reserve estimates in accordance with our mineral policy and SEC requirements. The table below identifies the year in which the latest reserve estimate was completed.
| | |
| | | | | |
Property | | Date of Latest Economic
Reserve Analysis |
Iron ore mines: | | |
Hibbing | | 2015 |
Minorca | | 2019 |
Northshore | | 2020 |
Tilden | | 2019 |
United Taconite | | 2019 |
Coal mines: | | |
Princeton | | 2019ITEM 3. LEGAL PROCEEDINGS |
Ore reserve estimatesLEGAL PROCEEDINGS RELATING TO OUR BUSINESS
JSW Steel Litigation. On June 8, 2021, JSW Steel filed a complaint against Cleveland-Cliffs Inc., AK Steel Holding Corporation (now known as Cleveland-Cliffs Steel Holding Corporation), Nucor Corporation and U.S. Steel in the United States District Court for our iron ore minesthe Southern District of Texas. JSW Steel alleges that the defendants engaged in a group boycott against JSW Steel in violation of federal and Texas antitrust laws by refusing to sell semi-finished steel slabs to JSW Steel, beginning in 2018 and continuing through the present; civil conspiracy among the defendants; and tortious interference with JSW Steel’s contractual rights and business relations involving its vendors and customers. JSW Steel’s allegations involve the tariffs and quotas imposed on steel imports by the U.S. government under Section 232 beginning in March 2018, which JSW Steel alleges raised the price of imported slabs, and statements made to the U.S. government related to exemption requests submitted by JSW Steel in 2018 and 2021. JSW Steel further claims that this alleged anticompetitive conduct negatively impacted JSW Steel’s costs, production and revenues and prevented it from pursuing expansion plans at its Ohio and Texas facilities that would compete with the defendants. JSW Steel is seeking to hold the defendants jointly and severally liable for treble damages in an amount in excess of $500 million and other relief. On February 17, 2022, the district court granted the defendants' Motions to Dismiss in their entirety and dismissed all of JSW's claims with prejudice. On March 16, 2022, JSW filed a notice of appeal to the United States Court of Appeals for the Fifth Circuit, and oral arguments on the appeal were estimated from fully designed open pits developed using three-dimensional modeling techniques. These fully designed pits incorporate design slopes, practical mining shapesheld on February 6, 2023. We continue to believe the claims asserted against us are without merit, and access ramps to assure the accuracy of our reserve estimates. All operations' reserves have been adjusted net of production through 2020.
The following represents iron ore mineral reserves:
| | | | | | | | | | | | | | | | | | | | | | | | | | | | | | | | | | | |
| Iron Ore Mineral Reserves |
| as of December 31, 2020 |
| (In Millions of Long Tons) |
| | Proven | | Probable | | Proven & Probable | | |
| Property | | Tonnage | % Grade | | Tonnage | % Grade | | Tonnage | % Grade3 | | Process Recovery4 |
Hibbing1 | | 76 | | 19.7 | | | 25 | | 19.6 | | | 101 | | 19.7 | | | 27% |
| Minorca | | 113 | | 23.6 | | | 7 | | 25.3 | | | 120 | | 23.7 | | | 31% |
| Northshore | | 318 | | 25.3 | | | 519 | | 24.1 | | | 837 | | 24.6 | | | 29% |
Tilden2 | | 168 | | 35.2 | | | 418 | | 34.8 | | | 586 | | 34.8 | | | 34% |
| United Taconite | | 158 | | 23.1 | | | 631 | | 22.1 | | | 789 | | 22.3 | | | 31% |
| Total | | 833 | | | | 1,600 | | | | 2,433 | | | | |
| | | | | | | | | | | |
1 The Hibbing mine is reported on a 100% basis, of which, our ownership is 85.3%. |
2 Tilden hematite reported grade is percent FeT; all other properties are percent magnetic iron. |
3 Cutoff for Tilden hematite is 25% FeT. Cutoff grades for magnetic ore are 20% for Tilden, 19% for Northshore, 16% for Minorca, 17% for United Taconite and 15% for Hibbing. |
4 Process recovery includes all factors for converting crude ore tonnage, shown above, to a dry saleable product. |
The following represents recoverable coal reserves:
| | | | | | | | | | | | | | | | | | | | | | | | | | | | | | | | | | | | | | |
| Recoverable Coal Reserves |
| as of December 31, 2020 |
| (In Millions of Net Tons) |
| | Proven | | Probable | | Proven & Probable |
| Property | | ROM | Wet Recovery | | ROM | Wet Recovery | | ROM | Wet Recovery | Ash % | Sulfur % | Volatile % |
| Princeton Coal | | 69.5 | | 44.7 | | | 26.5 | | 11.0 | | | 96.0 | | 55.7 | | 5% | 0.7% | 18% |
Legal Proceedings Relating to our Business
Mesabi Metallics Adversary Proceeding. On September 7, 2017, Mesabi Metallics Company LLC (f/k/a Essar Steel Minnesota LLC) ("Mesabi Metallics") filed a complaint against Cleveland-Cliffs Inc. in the Essar Steel Minnesota LLC and ESML Holdings Inc. bankruptcy proceeding that is pending in the United States Bankruptcy Court, District of Delaware. Mesabi Metallics alleges tortious interference with its contractual rights and business relations involving certain vendors, suppliers and contractors, violations of federal and Minnesota antitrust laws through monopolization, attempted monopolization and restraint of trade, violation of the automatic stay, and civil conspiracy with unnamed Doe defendants. Mesabi Metallics amended its complaint to add additional defendants, including, among others, our subsidiary, Cleveland-Cliffs Minnesota Land Development Company LLC ("Cliffs Minnesota Land"), and to add additional claims, including avoidance and recovery of unauthorized post-petition transfers of real estate interests, claims disallowance, civil contempt and declaratory relief. Mesabi Metallics seeks, among other things, unspecified damages and injunctive relief. Cliffs and Cliffs Minnesota Land filed counterclaims against Mesabi Metallics, Chippewa Capital Partners ("Chippewa"), and Thomas M. Clarke ("Clarke") for tortious interference and civil conspiracy, as well as additional claims against Chippewa and Clarke for aiding and abetting tortious interference, for which we seek, among other things, damages and injunctive relief. Our counterclaim against Clarke for libel was dismissed on jurisdictional grounds. The parties filed various dispositive motions on certain of the claims, including a motion for partial summary judgment to settle a dispute over real estate transactions between Cliffs Minnesota Land and Glacier Park Iron Ore Properties LLC ("GPIOP"). A ruling in favor of Cliffs, Cliffs Minnesota Land and GPIOP was issued on July 23, 2018, finding that Mesabi Metallics' leases had terminated and upholding Cliffs' and Cliffs Minnesota Land's purchase and lease of the contested real estate interests. Mesabi Metallics filed a Motion for Leave to File an Interlocutory Appeal, which was denied on September 10, 2019. Discovery is ongoing.has been completed, and we have filed for summary judgment on all claims that Mesabi Metallics has asserted against us. Mesabi Metallics, Chippewa and Clarke have also filed for summary judgment on various claims and issues in the case. We believe the claims asserted against us are without merit, and we intend to continue to vigorously defend against anyall remaining claims in the lawsuit.
Mesabi Trust Arbitration. On December 9, 2019, Mesabi Trust filed a demand for arbitration with the American Arbitration Association against Northshore and Cleveland-Cliffs Inc. alleging various breaches of a royalty agreement under which Northshore extracts iron ore from Mesabi Trust lands in return for paying royalties to Mesabi Trust. In its demand, Mesabi Trust asserts that we improperly based royalty payments for intercompany sales of DR-grade pellets on artificially low pricing of DR-grade pellet sales to one of our arms’ length third-party customers. Mesabi Trust further asserts that we paid royalties too soon on DR-grade pellets stockpiled at Northshore and destined for shipment to our Toledo direct reduction plant. The allegations also include failure to provide access to information and individuals necessary to determine compliance with the royalty agreement. In addition to seeking damages and costs, Mesabi Trust seeks declarations as to the methodology and timing for calculating royalties on our intercompany DR-grade pellet sales, and that Mesabi Trust should have full and unfettered access to all of our information and employees. During 2020, the parties appointed a three-member arbitration panel and engaged in discovery. The arbitration hearing is scheduled for May 2021. We believe the claims asserted against us are without merit, and we intend to vigorously defend against them.
Certain Legacy Legal Proceedings Relating to our Steel Operations. Certain of our acquired subsidiaries have been named as defendants, among many other named defendants, in numerous lawsuits filed since 1990 claiming injury allegedly resulting from exposure to asbestos. Similar lawsuits seeking monetary relief continue to be filed in various jurisdictions in the U.S., which cases are vigorously defended. Although predictions about the outcome of pending litigation is subject to uncertainties, based upon present knowledge, we believe it is unlikely that the resolution in the aggregate of these claims will have a materiallymaterial adverse effect on our consolidated results of operations, cash flows or financial condition.
Legal Proceedings Relating to Environmental MattersLEGAL PROCEEDINGS RELATING TO ENVIRONMENTAL MATTERS
SEC regulations require us to disclose certain information about administrative or judicial proceedings involving the environment and to which a governmental authority is a party if we reasonably believe that such proceedings may result in monetary sanctions above a stated threshold. Pursuant to SEC regulations, we use a threshold of $1 million for purposes of determining whether disclosure of any such proceedings is required. We believe that this threshold is reasonably designed to result in disclosure of any such proceedings that are material to our business or financial condition. Applying this threshold, we are disclosing
Burns Harbor Water Issues. In August 2019, ArcelorMittal Burns Harbor LLC (n/k/a Cleveland-Cliffs Burns Harbor LLC) suffered a loss of the following environmental proceedings for the period covered by this report:
Dearborn Works Air NOVs. On November 18, 2019, November 26, 2019, and March 16, 2020, EGLE issued NOVs with respectblast furnace cooling water recycle system, which led to the basic oxygen furnace electrostatic precipitator at Dearborn Works allegingdischarge of cyanide and ammonia in excess of the Burns Harbor plant's NPDES permit limits. Since that time, the facility has taken numerous steps to prevent recurrence and maintain compliance with its NPDES permit. We engaged in settlement discussions with the U.S. Department of Justice, the EPA and the State of Indiana to resolve any alleged violations of manganese, lead and opacity limits. We are investigating these claims and will work with EGLE to attempt to resolveenvironmental laws or regulations arising out of the August 2019 event. Later
4239 | CLF 2023 FORM 10-K
them.stages of the settlement discussions included the Environmental Law and Policy Center (ELPC) and Hoosier Environmental Council (HEC), which had filed a lawsuit on December 20, 2019 in the U.S. District Court for the Northern District of Indiana alleging violations resulting from the August 2019 event and other Clean Water Act claims. On February 14, 2022, the United States and the State of Indiana filed a complaint and a proposed consent decree, and on April 21, 2022, the United States, with the consent of all of the parties, filed a motion seeking final approval of the consent decree from the court. The consent decree was approved by the court with an effective date of May 6, 2022. The consent decree requires specified enhancements to the mill's wastewater treatment systems and required us to pay a $3 million civil penalty, along with other terms and conditions. Other parties to the consent decree include the United States, the State of Indiana, ELPC and HEC. The ELPC/HEC civil litigation was dismissed with prejudice on May 12, 2022. In addition, ArcelorMittal Burns Harbor LLC was served with a subpoena on December 5, 2019, from the United States District Court for the Northern District of Indiana, relating to the August 2019 event. We intendresponded to vigorously contestthe subpoena requests, including follow-up requests, and we have been informed that the government has now closed its investigation. With the resolution of monetary sanctions and injunctive relief requirements under the consent decree, we do not believe that the costs to resolve any other third-party claims that cannot be resolved through a settlement. Until a settlement is reached with EGLE or the claimsarise out of the NOVsAugust 2019 event, including natural resource damages claims pending final resolution, are otherwise resolved, we cannot reasonably estimatelikely to have, individually or in the costs, if any, associated with any potentially required work.
Additional information for this item relating to certain other environmental proceedings may be found under the headings EPA Administrative Order In Re: Ashland Coke and Burns Harbor Water Issues in NOTE 21 - COMMITMENTS AND CONTINGENCIES to theaggregate, a material adverse effect on our consolidated financial statements in Part II – Item 8. Financial Statements and Supplementary Data, which information is incorporated herein by reference.condition, results of operations or cash flows.
| | |
| | |
ItemITEM 4. | Mine Safety Disclosures MINE SAFETY DISCLOSURES |
We are committed to protecting the occupational health and well-being of each of our employees. Safety is one of our core values and we strive to ensure that safe production is the first priority for all employees. Our internal objective is to achieve zero injuries and incidents across the Company by focusing on proactively identifying needed prevention activities, establishing standards and evaluating performance to mitigate any potential loss to people, equipment, production and the environment. We have implemented intensive employee training that is geared toward maintaining a high level of awareness and knowledge of safety and health issues in the work environment through the development and coordination of requisite information, skills and attitudes. We believe that through these policies, we have developed an effective safety management system.
Under the Dodd-Frank Act, each operator of a coal or other mine is required to include certain mine safety results within its periodic reports filed with the SEC. As required by the reporting requirements included in §1503(a) of the Dodd-Frank Act and Item 104 of Regulation S-K, the requiredinformation concerning mine safety results regarding certain mining safety and health or other regulatory matters for each of our mine locations that are covered under the scope of the Dodd-Frank Act areis included in Exhibit 95 of Part IV – Item 15. Exhibits and Financial Statement Schedules of this Annual Report on Form 10-K.
4340 | CLF 2023 FORM 10-K
PART II
| | |
| | |
ItemITEM 5. | Market for Registrant's Common Equity, Related Stockholder Matters and Issuer Purchases of Equity Securities MARKET FOR REGISTRANT'S COMMON EQUITY, RELATED STOCKHOLDER MATTERS AND ISSUER PURCHASES OF EQUITY SECURITIES |
Stock Exchange InformationSTOCK EXCHANGE INFORMATION
Our common shares (ticker symbol CLF) are listed on the NYSE.NYSE (New York Stock Exchange).
HoldersHOLDERS
At February 24, 2021,8, 2024, we had 2,5862,526 shareholders of record.
Shareholder Return PerformanceSHAREHOLDER RETURN PERFORMANCE
The following graph shows changes over the past five-year period in the value of $100 invested in: (1) Cliffs' common shares; (2) S&P 500 Index; (3) S&P Small Cap 600Metals and Mining Select Industry Index; and (4) S&P Metals and Mining Select IndustryMidCap 400 Index. The values of each investment are based on price change plus reinvestment of all dividends reported to shareholders, based on monthly granularity.
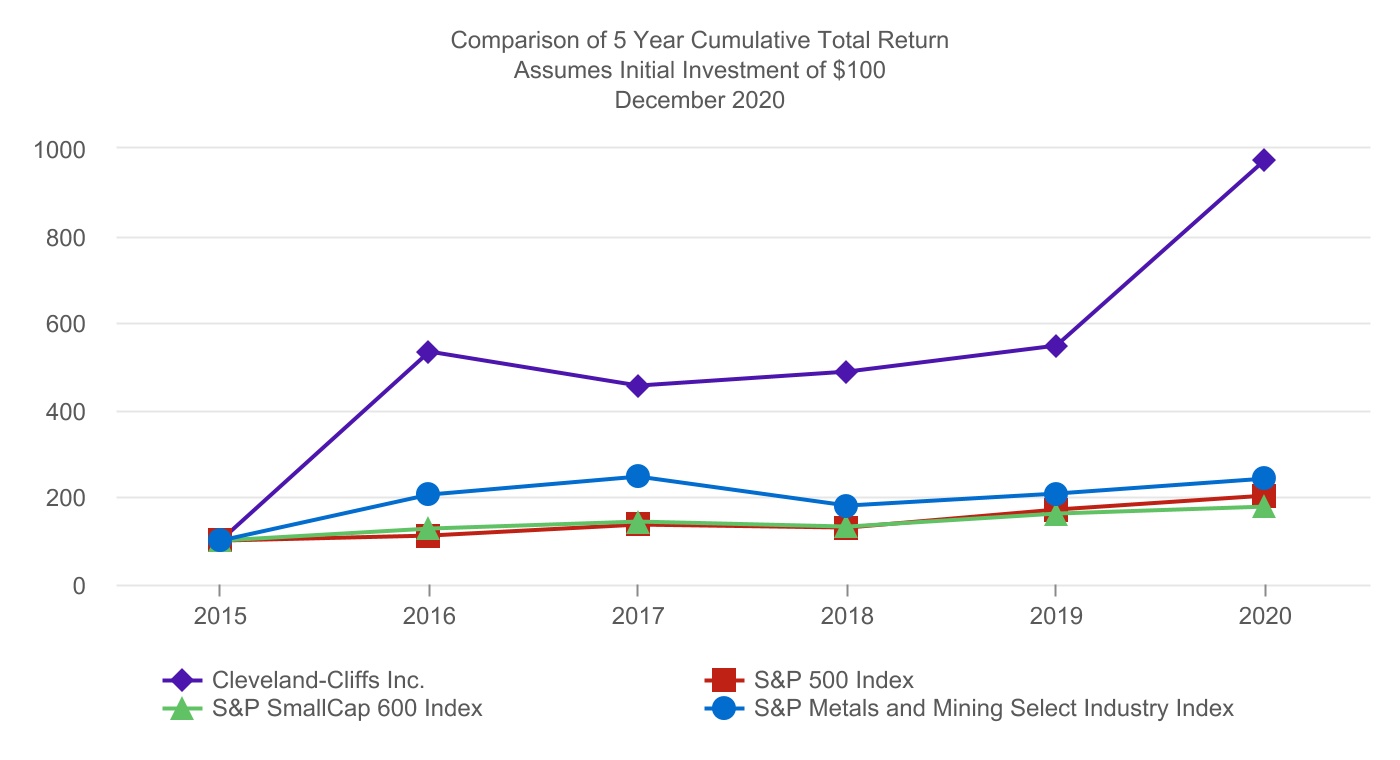

| | 2015 | | 2016 | | 2017 | | 2018 | | 2019 | | 2020 |
| | | 2018 | | | | | 2018 | | 2019 | | 2020 | | 2021 | | 2022 | | 2023 |
| Cleveland-Cliffs Inc. | Cleveland-Cliffs Inc. | Return % | | — | | | 432.28 | | (14.27) | | 6.66 | | 12.60 | | 77.46 |
| Cum $ | | 100.00 | | 532.28 | | 456.32 | | 486.71 | | 548.04 | | 972.55 |
| Cumulative $ | | | Cumulative $ | | 100.00 | | 112.60 | | 199.82 | | 298.77 | | 221.09 | | 280.23 |
| S&P 500 Index | S&P 500 Index | Return % | | — | | | 11.93 | | 21.80 | | (4.39) | | 31.48 | | 18.39 |
| Cum $ | | 100.00 | | 111.93 | | 136.33 | | 130.35 | | 171.38 | | 202.90 |
| S&P Small Cap 600 Index | Return % | | — | | | 26.46 | | 13.15 | | (8.52) | | 22.74 | | 11.24 |
| Cum $ | | 100.00 | | 126.46 | | 143.09 | | 130.90 | | 160.66 | | 178.72 |
| Cumulative $ | | | Cumulative $ | | 100.00 | | 131.48 | | 155.66 | | 200.30 | | 163.99 | | 207.05 |
| S&P Metals and Mining Select Industry Index | S&P Metals and Mining Select Industry Index | Return % | | — | | | 105.09 | | 20.61 | | (26.76) | | 14.70 | | 15.97 |
| Cum $ | | 100.00 | | 205.09 | | 247.36 | | 181.17 | | 207.80 | | 240.98 |
| Cumulative $ | | | Cumulative $ | | 100.00 | | 114.70 | | 133.02 | | 179.50 | | 203.05 | | 246.73 |
| S&P MidCap 400 Index | |
| Cumulative $ | | | Cumulative $ | | 100.00 | | | 126.17 | | 143.39 | | 178.85 | | 155.42 | | 180.89 |
4441 | CLF 2023 FORM 10-K
Issuer Purchases of Equity SecuritiesISSUER PURCHASES OF EQUITY SECURITIES
The following table presents information with respect to repurchases by the Company of our common shares during the periods indicated:
ISSUER PURCHASES OF EQUITY SECURITIES
| | Period | Period | | Total Number of Shares (or Units) Purchased1 | | Average Price Paid per Share
(or Unit) | | Total Number of Shares (or Units) Purchased as Part of Publicly Announced Plans or Programs | | Maximum Number (or Approximate Dollar Value) of Shares (or Units) that May Yet be Purchased Under the Plans or Programs | Period | | Total Number of Shares (or Units) Purchased1 | | Average Price Paid per Share
(or Unit) | | Total Number of Shares (or Units) Purchased as Part of Publicly Announced Plans or Programs | | Maximum Number (or Approximate Dollar Value) of Shares (or Units) that May Yet be Purchased Under the Plans or Programs2 |
| October 1 - 31, 2020 | | 2,293 | | | $ | 6.69 | | | — | | | $ | — | |
| November 1 - 30, 2020 | | 3,594 | | | 7.23 | | | — | | | — | |
| December 1 - 31, 2020 | | 262 | | | 12.88 | | | — | | | — | |
| October 1 - 31, 2023 | |
| November 1 - 30, 2023 | |
| December 1 - 31, 2023 | |
| Total | Total | | 6,149 | | | $ | 7.27 | | | — | | | $ | — | |
| 1 All shares were delivered to us to satisfy tax withholding obligations due upon the vesting or payment of stock awards. | | 1 All shares were delivered to us to satisfy tax withholding obligations due upon the vesting or payment of stock awards. | |
| 1 All shares were delivered to us to satisfy tax withholding obligations due upon the vesting or payment of stock awards. | |
2 On February 10, 2022, our Board of Directors authorized a program to repurchase our outstanding common shares in the open market or in privately negotiated transactions, which may include purchases pursuant to Rule 10b5-1 plans or accelerated share repurchases, up to a maximum of $1 billion. We are not obligated to make any purchases, and the program may be suspended or discontinued at any time. The share repurchase program does not have a specific expiration date. | | 2 On February 10, 2022, our Board of Directors authorized a program to repurchase our outstanding common shares in the open market or in privately negotiated transactions, which may include purchases pursuant to Rule 10b5-1 plans or accelerated share repurchases, up to a maximum of $1 billion. We are not obligated to make any purchases, and the program may be suspended or discontinued at any time. The share repurchase program does not have a specific expiration date. |
| | |
| | |
ItemITEM 6. | Selected Financial Data [Reserved] |
[Reserved]
| | |
| | |
ItemITEM 7. | Management's Discussion and Analysis of Financial Condition and Results of Operations MANAGEMENT'S DISCUSSION AND ANALYSIS OF FINANCIAL CONDITION AND RESULTS OF OPERATIONS |
Management's Discussion and Analysis of Financial Condition and Results of Operations is designed to provide a reader of our financial statements with a narrative from the perspective of management on our financial condition, results of operations, liquidity and other factors that may affect our future results. The following discussion should be read in conjunction with the consolidated financial statements and related notes that appear in Part II – Item 8. Financial Statements and Supplementary Data of this Annual Report on Form 10-K.
Overview
The year 2020 represented a transformative periodManagement's Discussion and Analysis of Financial Condition and Results of Operations included in this report discusses our Company's 173-year history. Duringfinancial condition and results of operations as of and for the years ended December 31, 2023 and 2022. A discussion related to our financial condition and results of operations for 2022 as compared to 2021 can be found in Part II - Item 7. Management's Discussion and Analysis of Financial Condition and Results of Operations of our Annual Report on Form 10-K for the year we completed the vertical integration of our legacy iron ore pellet businessended December 31, 2022, filed with the acquisitionsSEC on February 14, 2023.OVERVIEW
Throughout 2023, we continued to position the Company for long-term success as we had record steel shipments, with particular strength in automotive; significantly reduced our operational costs with greater emphasis on throughput and productivity; dramatically improved our balance sheet; reached our stated net debt target of steelmakers AK Steel$3.0 billion; returned substantial capital to shareholders through share repurchases; and ArcelorMittal USA, becomingcontinued to focus on our goal of reducing GHG emissions, all with an eye toward the largest flat-rolled steel producerfuture and in North America.line with our consistent strategic objectives. As of December 31, 2023, we have a record level of liquidity of $4.5 billion. Our new unique, vertically integrated business model provides a competitive advantage over other steelmakers that procure a larger proportion of their steelmaking raw materials from external sources,strong balance sheet and allows us to controloperational achievements further strengthens our production from upstream mining to downstream stamping and tubing.
We believe the Acquisitions give us a leading position as an American leader in the highly desirable automotive end market, wheresteel industry as we supply best-in-class volumes, quality and delivery performance, and give us the most comprehensive flat steel product offering in the industry. Duecontinue to the much larger operational footprint we now have, we anticipate synergies of approximately $310 million from asset optimization, economies of scale and streamlining overhead, over half of which has already been set in motion.
We are now focused on maximizing thecreate value for all stakeholders of the iron ore pellets we produce from our legacyCompany.
2023 HIGHLIGHTS
•Net income of $450 million
•Adjusted EBITDA of $1.9 billion
•Revenues of $22 billion and recently acquired mines in Michiganthird consecutive year of revenues over $20 billion
•Significantly reduced unit costs year-over-year
•Record steel shipments of 16.4 million net tons
•Record automotive shipments
•Reduced total outstanding long-term debt by $1.1 billion to $3.2 billion
•Net debt of $2.9 billion below stated target of $3.0 billion and Minnesota. A majoritylowest net debt level since becoming a steel company
•Reached record liquidity of the pellets we produce is dedicated to internal consumption, and we do not rely on external sources of pellets. As such, our new Steelmaking segment captures effectively all of the production activity in the steelmaking process, which begins at our mines.
In 2020, we also completed construction of and began production at our state-of-the-art direct reduction plant in Toledo, Ohio. This facility produces high-quality HBI, and is the first of its kind in the Great Lakes region. Our HBI provides a high-quality and environmentally friendly alternative to the scrap and imported pig iron that our potential customers currently utilize. We expect to begin selling this product to third parties during the first quarter of 2021 and reach nameplate capacity at our direct reduction plant during the second quarter of 2021.
Along with these notable accomplishments, we have been able to successfully navigate through the COVID-19 pandemic while preserving the health and safety of both our workforce and our Company for the long term. The COVID-19 pandemic caused its fair share of challenges, as disruptions in demand led to lower sales output and necessitated the unplanned idling of certain production facilities. These production outages, along with the lower$4.5 billion
4542 | CLF 2023 FORM 10-K
demand•Returned $152 million in capital to shareholders through share repurchase program
•Net pension and lower prices that came asOPEB liabilities of $586 million are lowest since becoming a resultsteel company
•Successfully implemented Cliffs H surcharge for steel melted with HBI
•Continued focus on our goal of the pandemic, generated weaker results during the year than what we would normally expect.reducing GHG emissions
As the demand environment began•Secured award of Nashwauk state mineral leases, which is expected to recover, our results in the second half of the year improved dramatically and operations at temporarily idled facilities resumed. Now, with steel prices and scrap prices in the U.S. recently reaching all-time highs, we believe our decisive actions and accomplishments during 2020 will allow us to deliver strong financial results and free cash flow in 2021. We also believe our new vertically integrated business model is well-equipped to navigate and succeed through future pricing or demand volatility that is common in our industry.provide additional long-term iron ore reserves
Despite the ongoing pandemic, weWe also continued our best practices from both a safety and environmental standpoint. During 2020,2023, our safety TRIRTotal Reportable Incident Rate (including contractors) was 0.921.22 per 200,000 hours worked. On environmental matters,Throughout 2023, we recently made a commitmentcontinued to reducefocus on our goal of reducing GHG emissions 25%with our optimal utilization of HBI and scrap throughout our facilities, as well as efficient power generation through recycling of off-gases. We have also continued our partnership with the DOE as part of the Better Climate Challenge initiative, which was established in December 2021. We continue to pursue opportunities such as carbon capture and the use of hydrogen within our facilities. With the U.S. government awarding funding for the development of regional hydrogen hubs throughout the country, including near our largest facilities, we expect to dramatically increase our use of hydrogen gas as both a reducing agent and energy source as the clean hydrogen production facilities come online. Additionally, we have continued forming partnerships to develop renewable and clean energy sources - such as wind, solar and hydrogen - which will benefit our own environmental footprint while combating the global impacts of climate change.
FINANCIAL SUMMARY
The following is a summary of our consolidated results for the years ended December 31, 2023, 2022 and 2021 (in millions, except for diluted EPS):
| | | | | | | | | | | | | | | | | | | | |
| Total Revenue | | Net Income | | Adjusted EBITDA | | Diluted EPS |
See "— Non-GAAP Financial Measures" below for a reconciliation of our Net income to Adjusted EBITDA.
ECONOMIC OVERVIEW
STEEL MARKET OVERVIEW
Steel market conditions in 2023 were marked by 2030notable volatility, driven by both improved light vehicle production but also inconsistent service center buying behavior. The price for domestic HRC, the most significant index impacting our revenues and profitability, averaged $906 per net ton for 2023, which was 10% lower than 2022. Demand for steel from 2017automotive manufacturers improved in 2023 as supply chain issues continued to ease and light vehicle sales increased. North American light vehicle production of 15.6 million units in 2023 was the highest since 2019. Demand for steel from service centers was adversely impacted at certain points of the year due to recessionary fears and the anticipation of, and ultimate occurrence of, the UAW strike at certain domestic automotive producers. During 2023, service center inventories were as low as 1.6 months of inventory on hand, significantly lower than the prior ten-year average of 2.2 months of inventory on hand. Low inventory levels generated significant demand for steel toward the end of 2023 as the UAW strike concluded and service centers needed to meet the continued healthy demand from their end-use customers. Additionally, steel imports remained unattractive for the majority of 2023 due to low pricing spreads between the U.S. and other regions. Looking forward, we expect domestic steel demand to remain healthy as automotive production continues to improve, service centers restock inventory and incremental steel demand stimulated by government legislation is realized.
The Infrastructure and Jobs Act, the CHIPS Act and Inflation Reduction Act should continue to provide meaningful support for overall domestic steel demand in the coming years. Our extensive portfolio of products should result in increased steel demand from some of our end markets. The Infrastructure and Jobs Act was signed into law in November 2021 and includes approximately $550 billion of authorized spending for new investments and programs. This legislation provides direct spending support for roads, bridges and other infrastructure projects, including upgrades to the domestic power grid and building out a higher reduction targetnational network of EV chargers. We expect to continue to benefit from these steel-intensive projects in the coming years as they will consume our hot-rolled, plate, electrical, rail and other steel products. The CHIPS Act promotes semiconductor manufacturing in the U.S., which should help support non-residential construction as well as machinery and equipment. Additionally, the on-shoring of manufacturing in the U.S. should reduce risk of supply chain issues in the future. The Inflation Reduction Act provides a tax credit for consumers who buy new EVs, which further incentivizes consumers to purchase vehicles in an environment where pent-up
demand is still very strong from a low unemployment rate, recent supply chain issues and lower than historical dealer inventory levels. The Inflation Reduction Act also provides incentives for the use of domestic steel for investments in clean energy projects, including wind and solar projects, which consume a substantial amount of steel. We expect to benefit from the spending related to this legislation for years to come.
OTHER KEY DRIVERS
The largest market for our competitorssteel products is the automotive industry in North America, which makes light vehicle production a key driver of demand. During 2023, North American light vehicle production was approximately 15.6 million units, up from 14.3 million units in 2022, and the highest level since 2019. During 2023, light vehicle sales in the U.S. saw an average seasonally adjusted annualized rate of 15.5 million units sold, representing a 13% increase compared to 2022. North American light vehicle production in 2024 is estimated to exceed 2023 units, indicating continued strength from the automotive industry. Additionally, the average age of light vehicles on the road in the U.S. reached an all-time high during 2023, surpassing the previous record set in 2022, which should support demand as older vehicles need to be replaced. As a leading supplier of automotive-grade steel in the U.S., we expect to benefit from increased vehicle production over the coming years.
Since 2021, the price for busheling scrap, a necessary input for flat-rolled steel production in EAFs in the U.S., has continued to average well above the prior annual ten-year average of approximately $390 per long ton. The busheling price averaged $488 per long ton during 2023. We expect the supply of busheling scrap to further tighten due to decreasing prime scrap generation from original equipment manufacturers and the growth of EAF capacity in the U.S., reduced metallics import availability, and a demonstration of the newfound leadership rolepush for expanded scrap use globally. As we plan to takeare fully integrated and have primarily a blast furnace footprint, increased prices for busheling scrap in the domestic steel industry.
Recent Developments
AcquisitionU.S. bolster our competitive advantage, as we source the majority of ArcelorMittal USA
On December 9, 2020, pursuant to the terms of the AM USA Transaction Agreement, we purchased ArcelorMittal USAour iron feedstock from ArcelorMittal. In connection with the closing of the AM USA Transaction, as contemplated by the terms of the AM USA Transaction Agreement, ArcelorMittal’s former joint venture partner in Kote and Tek exercised its put right pursuant to the terms of the Kote and Tek joint venture agreements. As a result, we purchased all of such joint venture partner’s interests in Kote and Tek. Following the closing of the AM USA Transaction, we own 100% of the interests in Kote and Tek.
The assets of ArcelorMittal USA acquired by us at the closing of the AM USA Transaction include six steelmaking facilities, eight finishing facilities, three cokemaking operations, two iron oreour stable-cost mining and pelletizing operations in Minnesota and Michigan.
As for iron ore, the Platts 62% price averaged $120 per metric ton in 2023, which is 24% higher than the prior annual ten-year average. While higher iron ore prices play a role in increased steel prices, we also directly benefit from higher iron ore prices for the portion of iron ore pellets we sell to third parties.
OTHER FACTORS
On September 14, 2023, the UAW announced a simultaneous labor strike against three domestic automotive manufacturers, as each of the individual companies were unable to come to terms on a new labor agreement. The strike originally impacted one assembly plant at each company and was further expanded to additional facilities, including certain parts-distribution centers for each company. Steel demand remained strong from the automotive industry as the strike was limited to certain facilities, allowing the automotive manufacturers to continue production at other facilities within their footprint. On October 30, 2023, the UAW strike concluded after the UAW reached tentative labor deals with each of the three domestic automotive manufacturers. The conclusion of the strike led to increased demand in the fourth quarter of 2023 from automotive customers as well as service centers who had significantly reduced their inventory levels in anticipation of a broader strike.
In January 2023, we announced that we partnered with the USW and filed antidumping and countervailing duty petitions against eight countries related to unfairly traded tin and chromium coated sheet steel products. Tin mill products are used primarily for packaging applications, particularly canned food. We produce tin mill products at our Weirton, West Virginia operating facility and sell approximately 300,000 net tons per year, representing approximately two percent of total Company steel sales volumes. The U.S. Department of Commerce determined that imports of tin mill products from Canada, China, Germany and South Korea are being unfairly priced and dumped into the United States and that imports from China are being unfairly subsidized. On January 5, 2024, the U.S. Department of Commerce announced its final countervailing and antidumping determination of tin mill products. The U.S. Department of Commerce imposed countervailing subsidy rates on China ranging from 331.88% to 649.98%, based on the exporter. Final antidumping duty rates on tin and chromium-coated sheet steel products were imposed on Canada, China, Germany and South Korea ranging from 2.69% to 122.52%. However, on February 6, 2024, the U.S. International Trade Commission terminated the investigation on South Korea and reached negative determinations in the investigations on Canada, China and Germany. As a result, countervailing duties and antidumping duties will not be imposed on imports of tin and chromium-coated steel sheet products from these four countries.
During 2023, we significantly reduced costs compared to the prior year as we had higher production volume, normalized repair and maintenance spending, and inflationary pressures on input and energy costs eased. We expect to benefit further from reduced costs in 2024 as we have worked through higher cost inventory, production volumes should remain similar, and reductions in coal mining complex.and alloy costs should mitigate any cost increases.
STEELMAKING RESULTS
COMPARISON OF 2023 TO 2022
The following is a summary of the Steelmaking segment operating results for the years ended December 31, 2023 and 2022 (dollars in millions, except for average selling price and shipments in thousands of net tons):
| | | | | | | | | | | | | | | | | | | | |
| Total Revenue | | Gross Margin | | Adjusted EBITDA | | Steel Shipments (nt) |
| | | | | | | | | | | | | | | | | | | | | | | | | | | | | | | | |
| 2022 | 2023 | | 2022 | 2023 | | 2022 | 2023 | | 2022 | 2023 |
| | | | | | |
| STEEL PRODUCT REVENUE: | | GROSS MARGIN %: | | ADJUSTED EBITDA %: | | AVERAGE SELLING PRICE PER TON OF STEEL PRODUCTS: |
| $20,054 | $19,237 | | 11% | 6% | | 14% | 9% | | $1,360 | $1,171 |
REVENUE
The following tables represent our steel shipments by product and total revenues by market:
| | | | | | | | | | | | | | | | | | | |
| Year Ended December 31, | | |
| (In thousands of net tons) | 2023 | | 2022 | | % Change |
| Steel shipments by product: | | | | | | | |
| Hot-rolled steel | 5,899 | | | | 4,326 | | | | 36 | % |
| Cold-rolled steel | 2,389 | | | | 2,286 | | | | 5 | % |
| Coated steel | 4,791 | | | | 4,730 | | | | 1 | % |
| Stainless and electrical steel | 682 | | | | 763 | | | | (11) | % |
| Plate | 899 | | | | 880 | | | | 2 | % |
| Slab and other steel products | 1,772 | | | | 1,766 | | | | — | % |
| Total steel shipments by product | 16,432 | | | | 14,751 | | | | 11 | % |
| | | | | | | |
| Year Ended December 31, | | |
| (In millions) | 2023 | | 2022 | | % Change |
| Steelmaking revenues by market: | | | | | | | |
| Direct automotive | $ | 7,440 | | | | $ | 6,661 | | | | 12 | % |
| Infrastructure and manufacturing | 5,612 | | | | 5,869 | | | | (4) | % |
| Distributors and converters | 5,330 | | | | 6,388 | | | | (17) | % |
| Steel producers | 2,949 | | | | 3,465 | | | | (15) | % |
| Total Steelmaking revenues by market | $ | 21,331 | | | | $ | 22,383 | | | | (5) | % |
Revenues decreased by 5% during the year ended December 31, 2023, as compared to the prior year, primarily due to:
•A decrease in revenues from the distributors and converters market of $1,058 million, or 17%, predominantly due to the average HRC price declining, which was partially offset by increased hot-rolled steel shipments; and
•A decrease in revenues from the steel producers market of $516 million, or 15%, which was primarily due to the decrease in pricing indices for slabs and busheling scrap.
•These decreases were partially offset by an increase in revenues from the direct automotive market of $779 million, or 12%, predominantly due to increases in selling prices as a result of favorable renewals of annual fixed price contracts and an increase in shipments.
GROSS MARGIN
Gross margin decreased by $1,117 million, or 45%, during the year ended December 31, 2023, as compared to the prior year, primarily due to:
•A decrease in selling prices (approximately $2.4 billion impact) predominantly due to lower spot prices, which was partially offset by favorable renewals of annual sales contracts.
•This decrease was partially offset by a decrease in costs of production (approximately $700 million impact) driven by lower raw materials and utility costs, including natural gas, coal, coke, alloys and scrap, coupled with decreased maintenance costs; and
•An increase in sales volumes (approximately $500 million impact).
ADJUSTED EBITDA
Adjusted EBITDA from our Steelmaking segment for the year ended December 31, 2023, decreased by $1,216 million, as compared to 2022, primarily due to the decreased gross margin from our operations. Additionally, our Steelmaking Adjusted EBITDA included $549 million and $439 million of Selling, general and administrative expenses for the years ended December 31, 2023 and 2022, respectively.
CONSOLIDATED RESULTS
COMPARISON OF 2023 TO 2022
REVENUES AND GROSS MARGIN
During the year ended December 31, 2023, our consolidated Revenues decreased by $993 million, compared to 2022. The decrease was primarily due to the decrease in the average steel product selling price of $189 per net ton, partially offset by the increase of 1.7 million net tons of steel shipments from our Steelmaking segment.
During the year ended December 31, 2023, our consolidated gross margin decreased by $1,127 million, as compared to 2022. See "— Steelmaking Results" above for further detail on our operating results.
SELLING, GENERAL AND ADMINISTRATIVE EXPENSES
Selling, general and administrative expenses increased by $112 million during the year ended December 31, 2023, as compared to 2022. The increase primarily relates to employment-related costs, including higher incentive compensation, and external service costs.
GOODWILL IMPAIRMENT
Our 2023 annual goodwill impairment analysis resulted in an impairment charge of $125 million for goodwill related to our Tooling and Stamping reporting unit. Refer to NOTE 3 - ACQUISITIONS"— Market Risks" below for additional information.further detail.
Financing TransactionsMISCELLANEOUS – NET
OnMiscellaneous expense decreased by $110 million for the year ended December 9, 2020, we entered into31, 2023, as compared to 2022. The decrease in miscellaneous expense for the ABL Amendment. The ABL Amendment modified the ABL Facility to, among other things, increase the amount of tranche A revolver commitments available thereunder by an additional $1.5 billion and increase certain dollar basketsyear ended December 31, 2023, was primarily related to certain negative covenants that applythe $63 million gain on sale of business, along with lower idle expenses as compared to the ABL Facility. After giving effectprior year. Additionally, in 2022, we had a $29 million asset impairment, which was not repeated in 2023. These decreases were partially offset by the higher expenses in 2023 related to the ABL Amendment, the aggregate principal amount of tranche A revolver commitments under the ABL Facility is $3.35 billionour asset retirement obligations for our indefinitely idled and the aggregate principal amount of tranche B revolver commitments under the ABL Facility remains at $150 million.
On February 11, 2021, we sold 20 millionclosed operations as a result of our common shares, andthree-year detailed assessment.
LOSS ON EXTINGUISHMENT OF DEBT
The loss on extinguishment of debt of $75 million for the indirect, wholly owned subsidiary of ArcelorMittal to which approximately 78 million common shares were issued as part of the consideration paid by us in connection with the closing of the AM USA Transaction sold 40 million common shares, in each case at a price per share to the underwriter of $16.12, in an underwritten public offering. We also granted the underwriter an option to purchase up to an additional 9 million common shares from us at a price per share to the underwriter of $16.12. The underwriter has until March 10, 2021 to exercise such option, which it may do in full, in part or not at all. We did not receive any proceedsyear ended December 31, 2022 primarily resulted from the saleredemption of the common shares by the selling shareholder in the offering. We intend to use the net proceeds to us from the offering, plus cash on hand, to redeem up to approximately $334all $607 million aggregate principal amount of our outstanding 9.875% 2025 Senior Secured Notes. We intend to use any remaining net proceeds to us following such redemption to reduce borrowings under our ABL Facility.
On February 17, 2021, we issued $500 million aggregate principal amount of 4.625% 2029 Senior Notes and $500 million aggregate principal amount of 4.875% 2031 Senior Notes in an offering that was exempt from the registration requirements of the Securities Act. We intend to use the net proceeds from the notes offering to redeem all of the outstanding 4.875% 2024 Senior Secured Notes and 6.375% 2025 Senior Notes issued by Cleveland-Cliffs Inc. and all of the outstanding 7.625% 2021 AK Senior Notes, 7.50% 2023 AK Senior Notes and 6.375% 2025 AK Senior Notes issued by AK Steel Corporation (n/k/a Cleveland-Cliffs Steel Corporation), and pay fees and expenses in connection with such redemptions, and reduce borrowings under our ABL Facility.
Company Structure
We have updated our segment structure to coincide with our new business model and are organized into four operating segments based on differentiated products, Steelmaking, Tubular, Tooling and Stamping, and European Operations. Our previous Mining and Pelletizing segment is included within Steelmaking as iron ore pellets are a
primary raw material for our steel products. We have one reportable segment - Steelmaking. Our other operating segments are classified as our Other Businesses.
COVID-19
In December 2019, COVID-19 surfaced in Wuhan, China, and then spread to other countries, including the United States. In March 2020, the World Health Organization characterized COVID-19 as a pandemic. Efforts to contain the spread of COVID-19 intensified throughout 2020, and many countries, including the United States, took steps to restrict travel, temporarily close businesses and issue quarantine orders. It remains unclear how long and to what degree of severity the economic impact of the COVID-19 pandemic will be felt.
On March 27, 2020, the CARES Act was signed into law. The CARES Act, among other things, includes provisions relating to refundable payroll tax credits, deferment of employer-side social security payments, NOL carryback periods, AMT credit refunds, modifications to the net interest deduction limitations and technical corrections to tax depreciation methods for qualified improvement property. During 2020, the CARES Act provided liquidity relief by enabling us to accelerate the receipt of $60 million of AMT credit refunds in July 2020, defer pension contributions until January 2021, and defer employer social security payments until 2021 and 2022.
We continue to utilize stringent social distancing procedures in our operating facilities, including checking employees’ temperatures and symptoms before entering the workplace each day and deep cleaning our operational facilities. Although we continue to utilize these measures, the outbreak of COVID-19 has heightened the risk that a significant portion of our workforce will suffer illness or otherwise be unable to perform their ordinary work functions.
Although steel and iron ore production are considered “essential” by the states in which we operate, certain of our facilities and construction activities were temporarily idled during the second quarter of 2020 due primarily to temporarily reduced product demand. Most of these temporarily idled facilities were restarted during the second quarter of 2020,April 2022 and the remaining operations were restarted during the third quarterredemption of 2020. Our Columbus and Monessen facilities acquired through the AM USA Transaction are temporarily idled due to the COVID-19 pandemic.
We cannot predict whether our operations will experience additional disruptions in the future. We may also continue to experience supply chain disruptions or operational issues with our vendors, as our suppliers and contractors face similar challenges related to the COVID-19 pandemic. Because the impact of the COVID-19 pandemic continues to evolve, we cannot currently predict the extent to which our business, results of operations, financial condition or liquidity will ultimately be impacted.
To mitigate the impact of the COVID-19 pandemic, we took a number of steps throughout 2020 to solidify our liquidity position, including issuing $520 million aggregate principal amount of secured debt, adding a $150 million FILO tranche to our ABL Facility, idling several facilities both temporarily and permanently, temporarily deferring our Chief Executive Officer’s compensation by 40%, temporarily deferring salaries by up to 20%, temporarily deferring other salaried employee benefits, and temporarily suspending capital expenditures. Lastly, our Board suspended future dividends, which was a typical cash obligation of approximately $100 million on an annualized basis.
Results of Operations
Overview
For the year ended December 31, 2020, we had a Net loss of $81 million. For the years ended December 31, 2019 and 2018, we had Net income of $293 million and $1,128 million, respectively. Our total revenues, diluted EPS and Adjusted EBITDA were as follows:
See "— Results of Operations — Adjusted EBITDA" below for a reconciliation of our Net Income (loss) to Adjusted EBITDA.
Revenues
Revenues from iron products made up 100% of our revenues by product line for the year ended December 31, 2019.
During the year ended December 31, 2020, our consolidated Revenues were approximately $5.4 billion, an increase of approximately $3.4 billion, or 169%, compared to 2019. The increase was due to the addition of $4.0 billion in revenues as a result of the Acquisitions, partially offset by a decrease in revenue from iron products of $655 million resulting from lower sales volumes of 6.9 million long tons compared to 2019. The lower sales volumes of iron products in 2020, as compared to 2019, were partially due to the diversion of pellets for internal consumption following the Acquisitions. Overall, we experienced lower customer demand during 2020 as a result of the reduced manufacturing activity caused by the COVID-19 pandemic.
Revenues by Market
The following table represents our consolidated Revenues and percentage of revenues to each of the markets we supply:
| | | | | | | | | | | | | | | | | | | | | | | |
| (In Millions) |
| Year Ended December 31, |
| 2020 | | 2019 |
| Revenue | | % | | Revenue | | % |
| Automotive | $ | 2,391 | | | 45 | % | | $ | — | | | — | % |
| Infrastructure and Manufacturing | 818 | | | 15 | % | | — | | | — | % |
| Distributors and Converters | 722 | | | 13 | % | | — | | | — | % |
Steel producers1 | 1,423 | | | 27 | % | | 1,990 | | | 100 | % |
| Total revenues | $ | 5,354 | | | | | $ | 1,990 | | | |
| | | | | | | |
1 Includes Realization of deferred revenue of $35 million for the year ended December 31, 2020. |
Automotive Market
North American light vehicle production for 2020 declined 20% to approximately 13 million units from the prior year due to the impacts of the COVID-19 pandemic, which forced automotive businesses to shut down from the end of the first quarter of 2020 until near the end of the second quarter of 2020. During the third quarter of 2020, auto makers saw pent-up demand bring sales back to more normal levels as buyers and dealers adapted to new procedures and virtual shopping. Fourth quarter 2020 sales for the automotive industry were more in line with expected sales for the time of year, returning to near pre-COVID-19 levels.
Infrastructure and Manufacturing
Domestic construction activity and the replacement of aging infrastructure directly affects sales of our carbon, stainless and electrical steel products, particularly for GOES. Additionally, during 2020, there were nearly 1.4 million new housing starts in the U.S., an increase of approximately 6% from 2019, and home sales reached nearly 6 million, the highest annual mark since 2006, despite the supply of existing homes reaching all-time lows. This provides a positive indication that domestic GOES customers could continue to experience steady demand consistent with the construction and electrical transformer replacement markets.
Distributors and Converters
Steel distributors and converters typically source from the commodity carbon, stainless and electrical spot markets. The price for domestic HRC, which is an important attribute in the profitability of this end market, averaged $588 per net ton for the year ended December 31, 2020. The price of HRC was negatively impacted by lower demand related to the COVID-19 pandemic, and hit a low point of $438 per net ton on April 30, 2020. However, after the industry recovered and supply-demand dynamics improved, the price rebounded dramatically, improving to a peak of $1,030 per net ton by December 31, 2020.
Steel Producers Market
The steel producers market represents third-party sales to other steel producers, including those who operate blast furnaces and EAFs. It includes sales of raw materials and semi-finished and finished goods, including iron ore pellets, coal, coke, HBI and steel products. Iron ore product revenues declined during 2020, as compared to 2019, partially as a result of the Acquisitions as our iron ore pellet production was consumed internally and the respective intercompany revenue was eliminated in consolidation. Additionally, we experienced lower customer demand during 2020 as a result of the reduced manufacturing activity caused by the impacts of the COVID-19 pandemic.
Operating Costs
Cost of goods sold
Cost of goods sold increased by $3,688 million for the year ended December 31, 2020, as compared to the prior year, primarily due to the addition of 4 million net tons of steel shipments resulting from the Acquisitions, partially offset by lower sales volumes of iron products. During 2020, Cost of goods sold was unfavorably impacted by temporary idle-related costs of approximately $225 million, resulting from the impacts of the COVID-19 pandemic.
Selling, general and administrative expenses
As a result of the Acquisitions, our Selling, general and administrative expenses increased by $131 million during the year ended December 31, 2020, as compared to 2019.
Acquisition-related costs
The Acquisition-related costs of $90 millionfor the year ended December 31, 2020, include severance of $38 million and other various third-party expenses related to the Acquisitions of $52 million. Refer to NOTE 3 - ACQUISITIONS for further information on the Acquisitions.
Miscellaneous – net
Miscellaneous – net increased by $33 million for the year ended December 31, 2020, as compared to the prior year, which was primarily due to an increase in expenses incurred at our Toledo direct reduction plant, primarily related to the hiring and training of employees leading up to the start of production.
Other Income (Expense)
Interest expense, net
Interest expense, net increased by $137 million for the year ended December 31, 2020, as compared to the prior year, primarily due to the incremental debt that we incurred in connection with the AK Steel Merger. The increase was offset partially by an increase in capitalized interest, primarily related to the construction of the Toledo direct reduction plant.
Gain (loss) on extinguishment of debt
The Gain (loss) on extinguishment of debt of $130 million for the year ended December 31, 2020 primarily relates to the repurchase of $748all $294 million aggregate principal amount of our outstanding senior notes of various series using1.500% 2025 Convertible Senior Notes in January 2022. The losses were partially offset by the net proceeds fromgain on extinguishment for the issuancerepurchase of an additional $555$417 million aggregate principal amount of our 9.875% 2025 Senior Secured Notes on April 24, 2020outstanding industrial revenue bonds and other sourcessenior notes of cash. This compares to a loss on extinguishment of debt of $18 million for the year ended December 31, 2019, primarily related to the redemption of all of our then-outstanding 4.875% 2021 Senior Notes and the repurchase of $600 million aggregate principal amount of our 5.75% 2025 Senior Notes. Refer to NOTE 8 - DEBT AND CREDIT FACILITIES for further details.
Other non-operating incomevarious series.
The increase of $54 million in INCOME TAXESOther non-operating income primarily relates to an increase in net periodic benefit credits other than service cost component predominantly due to the expected return on assets resulting from the Acquisitions and increased asset values for the plans held in 2019. Refer to NOTE 10 - PENSIONS AND OTHER POSTRETIREMENT BENEFITS for further details.
Income Taxes
Our effective tax rate is affectedimpacted by state income tax expense and permanent items, primarily depletion. It also is affected by discrete items that may occur in any given period but are not consistent from period to period. The following represents a summary of our tax provision and corresponding effective rates:
| | (In Millions) |
| Year Ended December 31, |
| 2020 | | 2019 |
| Income tax benefit (expense) | $ | 111 | | | $ | (18) | |
| Year Ended December 31, | | | Year Ended December 31, |
| (In millions) | | (In millions) | 2023 | | 2022 |
| Income tax expense | |
| Effective tax rate | Effective tax rate | 57 | % | | 6 | % | Effective tax rate | 25 | % | | 23 | % |
5046 | CLF 2023 FORM 10-K
A reconciliation of our income tax attributable to continuing operations compared to the U.S. federal statutory rate is as follows:
| | Year Ended December 31, | |
| Year Ended December 31, | |
| Year Ended December 31, | |
| (In millions) | |
| (In millions) | |
| (In millions) | |
| Tax at U.S. statutory rate | |
| Tax at U.S. statutory rate | |
| Tax at U.S. statutory rate | |
| Increase (decrease) due to: | |
| Increase (decrease) due to: | |
| Increase (decrease) due to: | |
| Percentage depletion in excess of cost depletion | |
| Percentage depletion in excess of cost depletion | |
| Percentage depletion in excess of cost depletion | |
| | | (In Millions) |
| | Year Ended December 31, | |
| | 2020 | | 2019 | |
| Tax at U.S. statutory rate | | $ | (41) | | | 21 | % | | $ | 66 | | | 21 | % | |
| Increase (decrease) due to: | | |
| Percentage depletion in excess of cost depletion | | (42) | | | 22 | | | (49) | | | (16) | | |
| Non-taxable income related to noncontrolling interests | | (9) | | | 4 | | | — | | | — | | |
| Luxembourg legal entity reduction | | — | | | — | | | 846 | | | 271 | | |
| Valuation allowance release: | | |
| Valuation allowance | |
| | Luxembourg legal entity reduction | | — | | | — | | | (846) | | | (271) | | |
| | Valuation allowance | |
| | Valuation allowance | |
| Unrecognized tax benefits | |
| Unrecognized tax benefits | |
| Unrecognized tax benefits | |
| State taxes, net | State taxes, net | | (11) | | | 6 | | | — | | | — | | |
| State taxes, net | |
| State taxes, net | |
| Federal & state provision to return | |
| Federal & state provision to return | |
| Federal & state provision to return | |
| Income not subject to tax | |
| Income not subject to tax | |
| Income not subject to tax | |
| Goodwill impairment | |
| Goodwill impairment | |
| Goodwill impairment | |
| Other items, net | Other items, net | | (8) | | | 4 | | | 1 | | | 1 | | |
| Provision for income tax expense (benefit) and effective income tax rate including discrete items | | $ | (111) | | | 57 | % | | $ | 18 | | | 6 | % | |
| Other items, net | |
| Other items, net | |
| Provision for income tax expense and effective income tax rate including discrete items | |
| Provision for income tax expense and effective income tax rate including discrete items | |
| Provision for income tax expense and effective income tax rate including discrete items | |
The increasedecrease in income tax benefitexpense in 2020,2023, as compared to the prior year, is directlypredominantly related to the increasedecrease in the pre-tax book lossincome year-over-year. The Luxembourg legal entity reduction relates to initiatives resulting in the dissolution of entities and settlement of related financial instruments in the year ended December 31, 2019. The 2019 NOL deferred tax asset reduction resulted in tax expense of $846 million, which was fully offset by a decrease in the valuation allowance.
See NOTE 1211 - INCOME TAXES for further information.
AdjustedCASH FLOW, LIQUIDITY AND CAPITAL RESOURCES
OVERVIEW
Our capital allocation decision-making process is focused on preserving healthy liquidity levels while maintaining the strength of our balance sheet and creating financial flexibility to manage through the cyclical demand for our products and volatility in commodity prices. We are focused on maximizing the cash generation of our operations, reducing debt, returning capital to shareholders and aligning capital investments with our strategic priorities and the requirements of our business plan, including regulatory and permission-to-operate related projects.
The following table provides a summary of our cash flow:
| | | | | | | | | | | |
| Year Ended December 31, |
| (In millions) | 2023 | | 2022 |
| Cash flows provided by (used in): | | | |
| Operating activities | $ | 2,267 | | | $ | 2,423 | |
| Investing activities | (591) | | | (936) | |
| Financing activities | (1,504) | | | (1,509) | |
| Net increase (decrease) in cash and cash equivalents | $ | 172 | | | $ | (22) | |
| | | |
Free cash flow1 | $ | 1,621 | | | $ | 1,480 | |
| | | |
1See "— Non-GAAP Financial Measures" for a reconciliation of our free cash flow. |
The recent market environment has provided us opportunities to reduce our debt and return capital to shareholders with our free cash flow generation. We also continue to look at the composition of our debt, as we are interested in both extending our average maturity length and increasing our ratio of unsecured debt to secured debt, which can be accomplished with cash provided by operating activities. During 2023, we took action in alignment with our capital allocation priorities, as follows:
•We issued $750 million aggregate principal amount of our 6.750% 2030 Senior Notes. The net proceeds from the 6.750% 2030 Senior Notes issuance were used to repay a portion of the borrowings under our ABL Facility. The transaction increased our financial flexibility and liquidity, extended our debt maturity profile, and was effectively leverage and interest expense neutral.
•We entered into the Fourth ABL Amendment, which, among other things, extended the maturity date of our ABL Facility to June 9, 2028, and increased the overall commitments under our ABL Facility to $4.75 billion, which added $250 million of commitments.
•We used our free cash flow to reduce the total principal of our long-term debt by $1.1 billion.
•We returned capital to shareholders through our share repurchase program, repurchasing 10.4 million common shares at a cost of $152 million in the aggregate.
These actions with respect to our debt give us additional flexibility and liquidity, along with extending our average debt maturity date, which will better prepare us to navigate more easily through potentially volatile industry conditions in the future.
Additionally, we expect to have opportunities to continue to reduce our debt and return capital to shareholders with our free cash flow generation during 2024. As of December 31, 2023, we had $1.5 billion aggregate principal amount outstanding of callable notes and had $608 million remaining under the authorization of our share repurchase program.
CASH FLOWS
OPERATING ACTIVITIES
| | | | | | | | | | | | | | | | | |
| Year Ended December 31, | | |
| (In millions) | 2023 | | 2022 | | Variance |
| Net income | $ | 450 | | | $ | 1,376 | | | $ | (926) | |
| Non-cash adjustments to net income | 1,125 | | | 1,218 | | | (93) | |
| Income taxes | 122 | | | (22) | | | 144 | |
| Pension and OPEB payments and contributions | (94) | | | (204) | | | 110 | |
| Working capital (receivables, inventories, payables and other liabilities) | 664 | | | 55 | | | 609 | |
| Net cash provided by operating activities | $ | 2,267 | | | $ | 2,423 | | | $ | (156) | |
The variance was driven by:
•A $1,019 million decrease in net income after adjustments for non-cash items due to lower gross margins resulting from a decrease in selling prices for our steel products, which was partially offset by an increase in sales volumes and a decrease in costs of production. See "— Steelmaking Results" above for further detail on our operating results.
•A $110 million decrease in payments and contributions relating to our pension and OPEB plans. As part of the 2022 USW labor negotiations, we paused the contribution requirement to the Cleveland-Cliffs Steel LLC VEBA plan and introduced certain Medicare-eligible retirees to Medicare Advantage plans. Additionally, we negotiated favorable Medical Advantage Prescription Drug healthcare rates, which went into effect January 1, 2023.
•A $609 million increase in cash provided for working capital is primarily due to a decrease in inventories resulting from lower costs of steel driven by higher production, cost control and lower raw material costs.
INVESTING ACTIVITIES
| | | | | | | | | | | | | | | | | |
| Year Ended December 31, | | |
| (In millions) | 2023 | | 2022 | | Variance |
| Purchase of property, plant and equipment | $ | (646) | | | $ | (943) | | | $ | 297 | |
| Acquisitions, net of cash acquired | — | | | (31) | | | 31 | |
| Other | 55 | | | 38 | | | 17 | |
| Net cash used by investing activities | $ | (591) | | | $ | (936) | | | $ | 345 | |
The variance was driven by:
•A $297 million decrease in cash used for capital expenditures. We incurred higher capital expenditures in 2022 compared to 2023 primarily relating to sustaining capital expenditures, including the completion of a reline of blast furnace #5 at Cleveland Works during the third quarter of 2022. After elevated spend in 2022 to perform overdue maintenance work at the facilities acquired as part of the 2020 acquisitions, we resumed normalized levels of maintenance capital and operating expense in 2023. Included within cash used for capital expenditures was $25 million for the year ended December 31, 2023, compared to $12 million for the year ended December 31, 2022, related to our non-owned SunCoke Middletown VIE. Our capital expenditures primarily relate to sustaining capital spend, which includes infrastructure, mobile equipment, fixed equipment, product quality, environmental, and health and safety.
FINANCING ACTIVITIES
| | | | | | | | | | | | | | | | | |
| Year Ended December 31, | | |
| (In millions) | 2023 | | 2022 | | Variance |
| Net borrowings (repayments) of debt | $ | 750 | | | $ | (1,358) | | | $ | 2,108 | |
| Net borrowings (repayments) under credit facilities | (1,864) | | | 255 | | | (2,119) | |
| Repurchase of common shares | (152) | | | (240) | | | 88 | |
| Other | (238) | | | (166) | | | (72) | |
| Net cash used by financing activities | $ | (1,504) | | | $ | (1,509) | | | $ | 5 | |
LIQUIDITY AND CAPITAL RESOURCES
Our primary sources of liquidity are Cash and cash equivalents, cash generated from our operations, availability under the ABL Facility and access to capital markets. Cash and cash equivalents, which totaled $198 million as of December 31, 2023, include cash on hand and on deposit, as well as short-term securities held for the primary purpose of general liquidity. The combination of cash and availability under our ABL Facility gives us $4.5 billion in liquidity as of December 31, 2023. During 2023, we issued $750 million in aggregate principal amount of our 6.750% 2030 Senior Notes. We used the net proceeds from the offering to repay a portion of the borrowings under our ABL Facility, increasing our liquidity. Additionally, during 2023, we entered into the Fourth ABL Amendment to our ABL Facility, increasing the commitments thereunder by $250 million. We believe our liquidity and access to capital markets will be adequate to fund our cash requirements for the next 12 months and for the foreseeable future.
Our ABL Facility, which now matures in June 2028, has a maximum borrowing base of $4.75 billion. The available borrowing base is determined by applying customary advance rates to eligible accounts receivable, inventory and certain mobile equipment. Our ABL Facility includes a $555 million sublimit for the issuance of letters of credit and a $200 million sublimit for swingline loans. As of December 31, 2023, outstanding letters of credit totaled $56 million, which reduced availability. We issue standby letters of credit with certain financial institutions in order to support business obligations, including, but not limited to, workers' compensation, operating agreements, employee severance, environmental obligations and insurance. Our ABL Facility agreement contains various financial and other covenants. As of December 31, 2023, we were in compliance with all of our ABL Facility covenants.
We have the capability to issue additional unsecured notes and, subject to the limitations set forth in our existing senior notes indentures and ABL Facility, additional secured notes, if we elect to access the debt capital markets. However, our ability to issue additional notes could be limited by market conditions. We intend from time to time to seek to redeem or repurchase our outstanding senior notes with cash on hand, borrowings from existing credit sources or new debt financings and/or exchanges for debt or equity securities, in open market purchases, privately negotiated transactions or otherwise. Such redemptions or repurchases, if any, will depend on prevailing market conditions, our liquidity requirements, contractual restrictions and other factors, and the amounts involved may be material.
Refer to NOTE 8 - DEBT AND CREDIT FACILITIES for more information on our ABL Facility and debt.
MATERIAL CASH REQUIREMENTS
We have material cash requirements for known contractual obligations and commitments for the following:
CAPITAL EXPENDITURES
We anticipate total cash used for capital expenditures during the next 12 months to be between $675 and $725 million, which primarily consists of sustaining capital spend. After elevated spend in 2022 to perform overdue maintenance work at the facilities acquired as part of the 2020 acquisitions, we resumed normalized levels of maintenance capital and operating expense in 2023. The necessary resources that we have invested in our footprint are expected to keep our assets at an automotive-grade level of quality and reliability for years to come.
DEBT
We have principal long-term debt of $3,192 million with maturities starting in 2026. Refer to NOTE 8 - DEBT AND CREDIT FACILITIES for further information on our long-term debt and interest.
LEASE OBLIGATIONS
We have future minimum lease payments under noncancellable finance and operating leases. As of December 31, 2023, the current and long-term liabilities for our lease obligations were $90 million and $363 million, respectively. Refer to NOTE 12 - LEASE OBLIGATIONS for further information.
POST-RETIREMENT EMPLOYEE BENEFITS
We make both required and discretionary pension contributions. Required contributions are based on minimum funding requirements pursuant to ERISA regulations. We expect to make $122 million in pension contributions and payments in 2024. The cash requirements for our OPEB plans consist of VEBA contributions and direct payments from corporate assets primarily for medical and drug costs. We expect to make $66 million in OPEB contributions and payments from corporate assets in 2024. Contributions and payments in future years can significantly change and will depend on the actual returns on assets, discount rates, actual health care trend rates, government regulations, changes to employee benefits through labor agreements and other demographic factors. Refer to NOTE 9 - PENSIONS AND OTHER POSTRETIREMENT BENEFITS for further information.
ENVIRONMENTAL AND ASSET RETIREMENT OBLIGATIONS
Refer to NOTE 20 - COMMITMENTS AND CONTINGENCIES and NOTE 13 - ASSET RETIREMENT OBLIGATIONS for further information on our environmental and asset retirement obligations.
SHARE REPURCHASE PROGRAM
On February 10, 2022, our Board of Directors authorized a program to repurchase outstanding common shares in the open market or in privately negotiated transactions, which may include purchases pursuant to Rule 10b5-1 plans or accelerated share repurchases, up to a maximum of $1 billion. As of December 31, 2023, there was $608 million remaining under the authorization. We are not obligated to make any purchases and the program may be suspended or discontinued at any time. The share repurchase program does not have a specific expiration date.
OFF-BALANCE SHEET ARRANGEMENTS
In the normal course of business, we are a party to certain off-balance sheet arrangements that are not reflected on our Statements of Consolidated Financial Position. These arrangements include unconditional purchase obligations, surety bonds and letters of credit. Our unconditional purchase obligations include minimum "take or pay" commitments, such as minimum electric power demand charges, minimum coal, diesel and natural gas purchase commitments, minimum railroad transportation commitments and minimum port facility usage commitments.
We use surety bonds and letters of credit to provide financial assurance for certain obligations. As of December 31, 2023, we had $260 million of outstanding surety bonds and surety-backed letters of credit. The use of surety bonds and surety-backed letters of credit has no impact on our liquidity. Additionally, as of December 31, 2023, we had $56 million of outstanding letters of credit issued under our ABL Facility, which reduced our availability thereunder.
Refer to NOTE 20 - COMMITMENTS AND CONTINGENCIES for further information on our unconditional purchase obligations, surety bonds and surety-backed letters of credit.
NON-GAAP FINANCIAL MEASURES
The following provides a description and reconciliation of each of our non-GAAP financial measures to its most directly comparable respective GAAP measure. The presentation of these measures is not intended to be considered in isolation from, as a substitute for, or as superior to, the financial information prepared and presented in accordance with GAAP. The presentation of these measures may be different from non-GAAP financial measures used by other companies.
ADJUSTED EBITDA
We evaluate performance on an operating segment basis, as well as a consolidated basis, based on Adjusted EBITDA, which is a non-GAAP measure. This measure is used by management, investors, lenders and other external users of our financial statements to assess our operating performance and to compare operating performance to other companies in the steel industry, although it is not necessarily comparable to similarly titled measures used by other companies.industry. In addition, management believes Adjusted EBITDA is a useful measure to assess the earnings power of the business without the impact of capital structure and can be used to assess our ability to service debt and fund future capital expenditures in the business.
The following table provides a reconciliation of our Net income (loss) to Adjusted EBITDA:
| | | | | | | | | | | |
| (In Millions) |
| Year Ended December 31, |
| 2020 | | 2019 |
| Net income (loss) | $ | (81) | | | $ | 293 | |
| Less: | | | |
| Interest expense, net | (238) | | | (101) | |
| Income tax benefit (expense) | 111 | | | (18) | |
| Depreciation, depletion and amortization | (308) | | | (85) | |
| Total EBITDA | $ | 354 | | | $ | 497 | |
| Less: | | | |
EBITDA from noncontrolling interests1 | $ | 56 | | | $ | — | |
| Gain (loss) on extinguishment of debt | 130 | | | (18) | |
| Severance costs | (38) | | | (2) | |
| Acquisition-related costs excluding severance costs | (52) | | | (7) | |
| Amortization of inventory step-up | (96) | | | — | |
| Impact of discontinued operations | 1 | | | (1) | |
| Total Adjusted EBITDA | $ | 353 | | | $ | 525 | |
| | | |
1 EBITDA of noncontrolling interests includes $41 million for income and $15 million for depreciation, depletion and amortization for the year ended December 31, 2020. |
| | | | | | | | | | | | | | | | | |
| Year Ended December 31, |
| (In millions) | 2023 | | 2022 | | 2021 |
| Net income | $ | 450 | | | $ | 1,376 | | | $ | 3,033 | |
| Less: | | | | | |
| Interest expense, net | (289) | | | (276) | | | (337) | |
| Income tax expense | (148) | | | (423) | | | (773) | |
| Depreciation, depletion and amortization | (973) | | | (1,034) | | | (897) | |
| Total EBITDA | $ | 1,860 | | | $ | 3,109 | | | $ | 5,040 | |
| Less: | | | | | |
EBITDA from noncontrolling interests1 | $ | 83 | | | $ | 74 | | | $ | 75 | |
| Acquisition-related expenses and adjustments | (12) | | | (1) | | | (197) | |
| Goodwill impairment | (125) | | | — | | | — | |
| Non-cash gain on sale of business | 28 | | | — | | | — | |
| Loss on extinguishment of debt | — | | | (75) | | | (88) | |
| Asset impairment | — | | | (29) | | | — | |
| Other, net | (25) | | | (29) | | | (27) | |
| Total Adjusted EBITDA | $ | 1,911 | | | $ | 3,169 | | | $ | 5,277 | |
| | | | | |
1 EBITDA of noncontrolling interests includes the following: | | | | | |
| Net income attributable to noncontrolling interests | $ | 51 | | | $ | 41 | | | $ | 45 | |
| Depreciation, depletion and amortization | 32 | | | 33 | | | 30 | |
| EBITDA of noncontrolling interests | $ | 83 | | | $ | 74 | | | $ | 75 | |
The following table provides a summary of our Adjusted EBITDA by segment:
| | (In Millions) |
| Year Ended December 31, |
| 2020 | | 2019 |
| Year Ended December 31, | | | Year Ended December 31, |
| (In millions) | | (In millions) | 2023 | | 2022 |
| Adjusted EBITDA: | Adjusted EBITDA: | | | |
| Steelmaking | Steelmaking | $ | 433 | | | $ | 636 | |
| Steelmaking | |
| Steelmaking | |
| Other Businesses | Other Businesses | 47 | | | — | |
| Corporate and eliminations | (127) | | | (111) | |
| Eliminations | |
| Total Adjusted EBITDA | Total Adjusted EBITDA | $ | 353 | | | $ | 525 | |
The year ended December 31, 2020 results were unfavorably impacted by decreased customer demand resulting fromFREE CASH FLOW
Free cash flow is a non-GAAP measure defined as operating cash flow less purchase of property, plant and equipment. Management believes it is an important measure to assess the impacts of the COVID-19 pandemic. As a result of the COVID-19 pandemic, we incurred temporary idle-related costs resulting from production curtailments, excluding idle depreciation, depletion and amortization expense, of approximately $214 million during 2020.
Adjusted EBITDA from Corporate and eliminations primarily relatescash generation available to Selling, general and administrative expenses at our Corporate headquarters.
Steelmakingservice debt, strategic initiatives or other financing activities.
The following table provides a reconciliation of our operating cash flow to free cash flow:
| | | | | | | | | | | |
| Year Ended December 31, |
| (In millions) | 2023 | | 2022 |
| Net cash provided by operating activities | $ | 2,267 | | | $ | 2,423 | |
| Purchase of property, plant and equipment | (646) | | | (943) | |
| Free cash flow | $ | 1,621 | | | $ | 1,480 | |
NET DEBT
Net debt is a summarynon-GAAP financial measure that management uses in evaluating financial position. Net debt is defined as long-term debt less cash and cash equivalents. Management believes net debt is an important measure of our Steelmaking segment results included in our consolidated financial statements for the years ended December 31, 2020 and 2019. These results include the AK Steel operations subsequent to March 13, 2020, the ArcelorMittal USA operations subsequent to December 9, 2020, and our results from operations previously reported as part of our Mining and Pelletizing segment.
The following is a summary of the Steelmaking segment operating results:
| | | | | | | | | | | |
| Year Ended December 31, |
| 2020 | | 2019 |
| Operating Results - In Millions | | | |
Revenues1 | $ | 4,965 | | | $ | 1,990 | |
| Cost of goods sold | $ | (4,749) | | | $ | (1,414) | |
| Selling Price - Per Ton | | | |
| Average net selling price per net ton of steel products | $ | 947 | | | N/A |
| Average net selling price per long ton of iron products | $ | 114 | | | $ | 107 | |
| | | |
1 Includes Realization of deferred revenue of $35 million for the year ended December 31, 2020. |
The following table represents our segment Revenues by product line:
| | | | | | | | | | | | | | | | | | | | | | | |
| (Dollars In Millions,
Sales Volumes In Thousands) |
| Year Ended December 31, |
| 2020 | | 2019 |
| Revenue | | Volume1 | | Revenue | | Volume1 |
| Hot-rolled steel | $ | 386 | | | 633 | | | $ | — | | | — | |
| Cold-rolled steel | 490 | | | 682 | | | — | | | — | |
| Coated steel | 1,747 | | | 1,911 | | | — | | | — | |
| Stainless and electrical steel | 868 | | | 416 | | | — | | | — | |
| Other steel products | 92 | | | 141 | | | — | | | — | |
Iron products2 | 1,335 | | | 11,707 | | | 1,990 | | | 18,583 | |
| Other | 47 | | | N/A | | — | | | — | |
| Total | $ | 4,965 | | | | | $ | 1,990 | | | |
1 Carbon steel products, stainless and electrical steel and plate steel volumes are stated in net tons. Iron product volumes are stated in long tons. |
2 Includes Realization of deferred revenue of $35 million for the year ended December 31, 2020. |
Operating Results
Despite the downward pressures on markets as a result of the COVID-19 pandemic during 2020, the operating results during the second half of the year showed significant signs of improvement heading into 2021, as we have seen pricing for HRC continue to rise and sales volumes begin to return to normal. Steelmaking revenues increased by $2,975 million compared to 2019,position due to the addition of sales following the Acquisitions. This increase was partially offset by a decrease in revenue from iron products of $655 million resulting from lower sales volumes of 7 million long tons compared to 2019, partially due to the diversion of pellets for internal consumption following the Acquisitions, as well as lower overall demand from customers as a result of the impacts of the COVID-19 pandemic.
Cost of goods sold increased $3,335 million during 2020, compared to 2019, predominantly due to additional sales resulting from the Acquisitions; however, this increase was also unfavorably impacted by idle-related costs of approximately $225 million, driven by the temporary idling of facilities in response to lower customer demand due to the COVID-19 pandemic.
As a result, Adjusted EBITDA was $433 million for the year ended December 31, 2020, compared to $636 million for the prior year. Refer to "— Results of Operations" above for additional information.
Production
During 2020, we produced 4 million net tons of raw steel, 17 million long tons of iron ore pellets and 1 million net tons of coke. During 2020, certain of our operations were temporarily idled in response to the COVID-19 pandemic, with most restarting and resuming production in the second quarter of 2020 and the remainder in the third quarter of 2020. Dearborn Works' hot strip mill, anneal and temper operations and AK Coal remain permanently idled as part of the permanent cost reduction efforts. Our Columbus and Monessen facilities acquired through the AM USA Transaction are temporarily idled due to impacts of the COVID-19 pandemic. During 2019, we produced 20 million long tons of iron ore pellets.
Liquidity, Cash Flows and Capital Resources
Our primary sources of liquidity are Cash and cash equivalents and cash generated from our operations, availability under the ABL Facility and other financing activities. Our capital allocation decision-making process is focused on preserving healthy liquidity levels, while maintaining the strength of our balance sheet and creating financial flexibility to manage through the inherent cyclical demand for our products and volatility in commodity prices. We are focused on maximizing the cash generation of our operations, reducing debt, and aligning capital investments with our strategic priorities and the requirements of our business plan, including regulatory and permission-to-operate related projects.
Since the onset of the COVID-19 pandemic in the U.S., our primary focus has been on maintaining adequate levels of liquidity to manage through a potentially prolonged economic downturn. In alignment with this, we made several operational adjustments, including facility closures, idles and extended maintenance outages. Along with the cost savings achieved through these operational adjustments, during 2020, we reduced planned capital expenditures for the year, reduced overhead costs and suspended our quarterly dividend payment. Additionally, on April 17, 2020 and April 24, 2020, we issued $400 million aggregate principal amount and an additional $555 million aggregate principal amount, respectively, of 9.875% 2025 Senior Secured Notes to further bolster our liquidity position and pay-down existing debt. We also issued an additional $120 million aggregate principal amount of 6.75% 2026 Senior Secured Notes on June 19, 2020, the net proceeds of which we used to finance construction of our Toledo direct reduction plant. Prior to such use, the net proceeds were used to temporarily reduce the outstanding borrowings under our ABL Facility. We believe these measures have helped us to maintain healthy liquidity levels during the COVID-19 pandemic.
Now that business conditions have improved and we expect to generate healthy free cash flow during 2021, we believe we have the ability to lower our long-term debt balance. Our stated initial target will be to reduce total debt to less than three times our annual Adjusted EBITDA. We also look at the composition of our debt, as well, as we are interested in both extending our maturity profile and increasing our ratio of unsecured debt to secured debt. These actions will better prepare us to navigate more easily through potentially volatile industry conditions in the future. In furtherance of these goals, we consummated certain financing transactions in February 2021.
On February 11, 2021, we sold 20 million common shares and the indirect, wholly owned subsidiary of ArcelorMittal to which approximately 78 million common shares were issued as part of the consideration paid by us in connection with the closing of the AM USA Transaction sold 40 million common shares, in each case at a price per share to the underwriter of $16.12, in an underwritten public offering. We also granted the underwriter an option to purchase up to an additional 9 million common shares from us at a price per share to the underwriter of $16.12. The underwriter has until March 10, 2021 to exercise such option, which it may do in full, in part or not at all. We did not receive any proceeds from the sale of the common shares by the selling shareholder in the offering. We intend to use the net proceeds to us from the offering, plus cash on hand, to redeem up to approximately $334 million aggregate principal amount of our outstanding 9.875% 2025 Senior Secured Notes. We intend to use any remaining net proceeds to us following such redemption to reduce borrowings under our ABL Facility.
On February 17, 2021, we issued $500 million aggregate principal amount of 4.625% 2029 Senior Notes and $500 million aggregate principal amount of 4.875% 2031 Senior Notes in an offering that was exempt from the registration requirements of the Securities Act. We intend to use the net proceeds from the notes offering to redeem all of the outstanding 4.875% 2024 Senior Secured Notes and 6.375% 2025 Senior Notes issued by Cleveland-Cliffs Inc. and all of the outstanding 7.625% 2021 AK Senior Notes, 7.50% 2023 AK Senior Notes and 6.375% 2025 AK Senior Notes issued by AK Steel Corporation (n/k/a Cleveland-Cliffs Steel Corporation), and pay fees and expenses in connection with such redemptions, and reduce borrowings under our ABL Facility.
In connection with the underwritten public offering, we provided notice to redeem $322.4 million aggregate principal amount of our 9.875% 2025 Senior Secured Notes on March 11, 2021. In connection with the notes offering, we provided notice to redeem all of the outstanding 4.875% 2024 Senior Secured Notes, 6.375% 2025 Senior Notes,
7.625% 2021 AK Senior Notes, 7.50% 2023 AK Senior Notes and 6.375% 2025 AK Senior Notes on March 12, 2021. Refer to NOTE 22 – SUBSEQUENT EVENTS for more information regarding February 2021 financing transactions.
The application of the net proceeds to us from the February 2021 financing transactions will shift our debt horizon, by providing a four-year window in which none of our long-term notes are due, clearing the way for us to fully focus on operational integration.
Based on our outlook for the next 12 months, which is subject to continued changing demand from customers and volatility in domestic steel prices, we expect to have ample liquidity through cash generated from operations and availability under our ABL Facility sufficient to meet the needs of our operations and service our debt obligations.
The following discussion summarizes the significant items impacting our cash flows during 2020 and comparative years as well as expected impacts to our future cash flows over the next 12 months. Refer to the Statements of Consolidated Cash Flows for additional information.
Operating Activities
Net cash used by operating activities was $261 million for the year ended December 31, 2020, compared to net cash provided by operating activities of $563 million for the year ended December 31, 2019. The change in cash used by operating activities during 2020, compared to cash provided by operating activities in 2019, was due primarily to the slowing economy in connection with the COVID-19 pandemic, resulting in reduced customer demand and the need to temporarily idle many of our operations, which had an adverse effect on our operating results. Our working capital was negatively impacted as a result of ArcelorMittal USA's accounts receivable factoring arrangement that was in place prior to the AM USA Transaction. This negatively impacted working capital by $315 million for the year ended December 31, 2020 and is expected to impact the first quarter of 2021 by approximately $260 million.
Our U.S. Cash and cash equivalents balance at December 31, 2020 was $90 million, or 84% of our consolidated Cash and cash equivalents balance, excluding cash related to our consolidated VIE of $5 million. Additionally, we had a cash balance at December 31, 2020 of $4 million classified as part of Other current assets in the Statements of Consolidated Financial Position related to our discontinued operations.
Investing Activities
Net cash used by investing activities was $2,042 million and $644 million for the years ended December 31, 2020 and 2019, respectively. During the year ended December 31, 2020, we had net cash outflows of $658 million related to the AM USA Transaction, net of cash acquired. Additionally, during the year ended December 31, 2020, we had net cash outflows of $869 million related to the AK Steel Merger, net of cash acquired, which included $590 million used to repay the former AK Steel Corporation revolving credit facility and $324 million used to purchase outstanding 7.50% 2023 AK Senior Notes. Refer to NOTE 3 - ACQUISITIONS for additional details on the Acquisitions.
Additionally, we had capital expenditures, including capitalized interest, of $525 million and $656 million for the years ended December 31, 2020 and 2019, respectively. We had cash outflows, including deposits and capitalized interest, for the development of the Toledo direct reduction plant of $348 million and $544 million for the years ended December 31, 2020 and 2019, respectively. During the year ended December 31, 2019, we also had cash outflows, including deposits and capitalized interest, of $43 million on the upgrades at Northshore. Additionally, we spent $177 million and $69 million on sustaining capital expenditures during 2020 and 2019, respectively. Sustaining capital expenditures include capital expenditures related to infrastructure, mobile equipment, fixed equipment, product quality, environment, health and safety.
During 2020, in response to the COVID-19 pandemic, we temporarily limited our cash used for capital expenditures to critical sustaining capital, but have now resumed growth capital spending. During the fourth quarter of 2020, we completed construction of our Toledo direct reduction plant. We anticipate total cash used for capital expenditures during the next 12 months to be between $600 million and $650 million.
Financing Activities
Net cash provided by financing activities was $2,059 million for the year ended December 31, 2020, compared to net cash used by financing activities of $394 million for the year ended December 31, 2019. Cash provided by financing activities for the year ended December 31, 2020 primarily related to the issuances in separate offerings consummated on March 13, 2020 and June 19, 2020 of $845 million combined aggregate principal amount of 6.75% 2026 Senior Secured Notes, the issuances in separate offerings consummated on April 17, 2020 and April 24, 2020 of $955 million combined aggregate principal amount of 9.875% 2025 Senior Secured Notes and borrowings
of $2,060 million under the ABL Facility. The net proceeds from the initial issuance of $725 million aggregate principal amount of the 6.75% 2026 Senior Secured Notes on March 13, 2020, along with cash on hand, were used to purchase $373 million aggregate principal amount of 7.625% 2021 AK Senior Notes and $367 million aggregate principal amount of 7.50% 2023 AK Senior Notes, in each case issued by AK Steel Corporation (n/k/a Cleveland-Cliffs Steel Corporation), that we accepted for purchase pursuant to our tender offers for any and all such notes then-outstanding in connection with the AK Steel Merger and to pay for the $44 million of debt issuance costs in the first quarter of 2020. The net proceeds from the additional issuance of $555 million aggregate principal amount of the 9.875% 2025 Senior Secured Notes on April 24, 2020 were used to repurchase $736 million aggregate principal amount of our outstanding senior notes of various series in private exchanges exempt from the registration requirements of the Securities Act. The net proceeds from the additional issuance of $120 million aggregate principal amount of 6.75% 2026 Senior Secured Notes on June 19, 2020 were used to finance construction of our Toledo direct reduction plant. Prior to such use, the net proceeds were used to temporarily reduce the outstanding borrowings under our ABL Facility. Additionally, during the year ended December 31, 2020, we repaid $550 million under the ABL Facility.
Net cash used by financing activities during 2019 primarily related to the repurchase of 24 million common shares for $253 million in the aggregate under the $300 million share repurchase program, which was active until December 31, 2019. Additionally, we issued $750 million aggregate principal amount of 5.875% 2027 Senior Notes, which provided net proceeds of approximately $714 million. The net proceeds from the notes offering, along with cash on hand, were used to redeem in full all of our then-outstanding 4.875% 2021 Senior Notes and to purchase $600 million aggregate principal amount of our outstanding 5.75% 2025 Senior Notes pursuant to a tender offer. In total, during 2019, we purchased $724 million aggregate principal amount of senior notes for $729 million in cash.
Additional uses of cash from financing activities during 2019 included payments of regular quarterly cash dividends and a special cash dividend on our common shares of $72 million and a cash payment of $44 million related to the third and final annual installment of the distribution of Empire partnership equity.
We have temporarily suspended future dividend distributions as a result of impacts of the COVID-19 pandemic in order to preserve cash during this time of economic uncertainty. We anticipate future uses of cash and cash provided by financing activities during the next 12 months to include opportunistic debt transactions as part of our liability management strategy, similar to the transactions that occurred during 2020 and February 2021, in addition to providing supplemental financing to meet cash requirements for business improvement opportunities.
The discussion of our Liquidity, Cash Flows and Capital Resources results for 2019 compared to 2018 can be found in Part II, Item 7., "Management's Discussion and Analysis of Financial Condition and Results of Operations", in our Annual Reportequivalents on Form 10-K for the year ended December 31, 2019, filed with the SEC on February 20, 2020.
The following representstable provides a reconciliation of our future cash commitments and contractual obligations as of December 31, 2020:long-term debt to net debt:
| | | | | | | | | | | | | | | | | | | | | | | | | | | | | |
| Payments Due by Period (In Millions) |
| Total | | Less than
1 Year | | 1 - 3
Years | | 3 - 5
Years | | More than 5 Years |
Long-term debt1 | $ | 5,595 | | | $ | 34 | | | $ | 13 | | | $ | 2,197 | | | $ | 3,351 | |
Interest on debt1 | 1,772 | | | 303 | | | 601 | | | 507 | | | 361 | |
| Operating lease obligations | 363 | | | 70 | | | 99 | | | 72 | | | 122 | |
| Finance lease obligations | 394 | | | 100 | | | 173 | | | 45 | | | 76 | |
| Purchase obligations: | | | | | | | | | |
| Open purchase orders | 347 | | | 342 | | | 5 | | | — | | | — | |
Minimum "take or pay" purchase commitments2 | 8,853 | | | 2,865 | | | 2,708 | | | 1,607 | | | 1,673 | |
| Total purchase obligations | 9,200 | | | 3,207 | | | 2,713 | | | 1,607 | | | 1,673 | |
| Other long-term liabilities: | | | | | | | | | |
| Pension funding minimums | 887 | | | 202 | | | 178 | | | 238 | | | 269 | |
| OPEB claim payments | 1,777 | | | 144 | | | 280 | | | 269 | | | 1,084 | |
| Environmental and asset retirement obligations | 589 | | | 27 | | | 51 | | | 42 | | | 469 | |
| Other | 272 | | | 71 | | | 99 | | | 31 | | | 71 | |
| Total other long-term liabilities | 3,525 | | | 444 | | | 608 | | | 580 | | | 1,893 | |
| Total | $ | 20,849 | | | $ | 4,158 | | | $ | 4,207 | | | $ | 5,008 | | | $ | 7,476 | |
| | | | | | | | | |
1 Refer to NOTE 8 - DEBT AND CREDIT FACILITIES for additional information regarding our debt and related interest rates. |
2 Includes minimum railroad and vessel transportation obligations, minimum electric power demand charges, minimum diesel and natural gas obligations and minimum port facility obligations. Additionally, includes our coke purchase commitments related to our coke supply agreement with SunCoke Middletown. |
Refer to NOTE 21 - COMMITMENTS AND CONTINGENCIES for additional information regarding our future commitments and obligations.
Capital Resources
We expect to fund our business obligations from available cash, current and future operations and existing and future borrowing arrangements. We also may pursue other funding strategies in the capital markets to strengthen our liquidity, extend debt maturities and/or fund strategic initiatives. The following represents a summary of key liquidity measures:
| | | | | |
| (In Millions) |
| December 31,
2020 |
Cash and cash equivalents | $ | 112 | |
Cash and cash equivalents from discontinued operations, included within Other current assets
| 4 | |
Less: Cash and cash equivalents from VIE's | (5) | |
Total cash and cash equivalents | $ | 111 | |
| |
Available borrowing base on ABL Facility1
| $ | 3,500 | |
Borrowings | (1,510) | |
Letter of credit obligations | (247) | |
Borrowing capacity available | $ | 1,743 | |
| |
| |
1 As of December 31, 2020, the ABL Facility had a maximum borrowing base of $3.5 billion, determined by applying customary advance rates to eligible accounts receivable, inventory and certain mobile equipment.
|
Our primary sources of funding are cash and cash equivalents, which totaled $111 million as of December 31, 2020, cash generated by our business, availability under the ABL Facility and other financing activities. Cash and cash equivalents include cash on hand and on deposit. The combination of cash and availability under the ABL Facility gives us $1.9 billion in liquidity entering the first quarter of 2021, which is expected to be adequate to fund operations, letter of credit obligations, sustaining and expansion capital expenditures and other cash commitments for at least the next 12 months.
As of February 24, 2021, we had total liquidity of approximately $2.6 billion, consisting of approximately $200 million in cash and approximately $2.4 billion of availability under its ABL credit facility, of which approximately $850 million is expected to be used to redeem the senior notes for which notice of redemption was provided in connection with the offerings consummated in February 2021.
As of December 31, 2020, we were in compliance with the ABL Facility liquidity requirements and, therefore, the springing financial covenant requiring a minimum Fixed Charge Coverage Ratio of 1.0 to 1.0 was not applicable. We believe that the cash on hand and the ABL Facility provide us sufficient liquidity to support our operating, investing and financing activities. We have the capability to issue additional unsecured notes and, subject to the limitations set forth in our existing senior notes indentures, additional secured debt, if we elect to access the debt capital markets. However, our ability to issue additional notes could be limited by market conditions.
We intend from time to time to seek to retire or purchase our outstanding senior notes with cash on hand, borrowings from existing credit sources or new debt financings and/or exchanges for debt or equity securities, in open market purchases, privately negotiated transactions or otherwise. Such repurchases, if any, will depend on prevailing market conditions, our liquidity requirements, contractual restrictions and other factors, and the amounts involved may be material.
Off-Balance Sheet Arrangements
In the normal course of business, we are a party to certain arrangements that are not reflected on our Statements of Consolidated Financial Position. These arrangements include minimum "take or pay" purchase commitments, such as minimum electric power demand charges, minimum coal, diesel and natural gas purchase commitments, minimum railroad transportation commitments and minimum port facility usage commitments; and financial instruments with off-balance sheet risk, such as bank letters of credit and bank guarantees. | | | | | | | | | | | |
| (In millions) | December 31, 2023 | | December 31, 2022 |
| Long-term debt | $ | 3,137 | | | $ | 4,249 | |
| Less: Cash and cash equivalents | 198 | | | 26 | |
| Net debt | $ | 2,939 | | | $ | 4,223 | |
Information about our Guarantors and the Issuer of our Guaranteed SecuritiesINFORMATION ABOUT OUR GUARANTORS AND THE ISSUER OF OUR GUARANTEED SECURITIES
The accompanying summarized financial information has been prepared and presented pursuant to SEC Regulation S-X, Rule 3-10, “Financial Statements of Guarantors and Issuers of Guaranteed Securities Registered or
Being Registered,” and Rule 13-01 "Financial Disclosures about Guarantors and Issuers of Guaranteed Securities and Affiliates Whose Securities Collateralized a Registrant's Securities." Certain of our subsidiaries (the "Guarantor subsidiaries") as of December 31, 2023 have fully and unconditionally, and jointly and severally, guaranteed the obligations under (a) the 5.75% 2025 Senior Notes, the 6.375% 2025 Senior Notes, the 5.875% 2027 Senior Notes, the 7.000% 2027 Senior Notes, the 4.625% 2029 Senior Notes, the 6.750% 2030 Senior Notes, and the 7.00% 20274.875% 2031 Senior Notes issued by Cleveland-Cliffs Inc. on a senior unsecured basis and (b) the 4.875% 2024 Senior Secured Notes, the 6.75%6.750% 2026 Senior Secured Notes and the 9.875% 2025 Senior Secured Notesissued by Cleveland-Cliffs Inc. on a senior secured basis. See NOTE 78 - DEBT AND CREDIT FACILITIES for further information.
The following presents the summarized financial information on a combined basis for Cleveland-Cliffs Inc. (parent company and issuer of the guaranteed obligations) and the Guarantor subsidiaries, collectively referred to as the obligated group. Transactions between the obligated group have been eliminated. Information for the non-Guarantor subsidiaries was excluded from the combined summarized financial information of the obligated group.
Each Guarantor subsidiary is consolidated by Cleveland-Cliffs Inc. as of December 31, 2020.2023. Refer to Exhibit 22.1,22, incorporated herein by reference, for the detailed list of entities included within the obligated group as of December 31, 2020 and2023. As of December 31, 2019.
The2023, the guarantee of a Guarantor subsidiary with respect to Cliffs' 5.75% 20256.750% 2026 Senior Secured Notes, 6.375% 2025 Senior Notes,the 5.875% 2027 Senior Notes, 7.00%the 7.000% 2027 Senior Notes, 4.875% 2024the 4.625% 2029 Senior Secured Notes, 6.75% 2026the 6.750% 2030 Senior Secured Notes and 9.875% 2025the 4.875% 2031 Senior Secured Notes will be automatically and unconditionally released and discharged, and such Guarantor subsidiary’s obligations under the guarantee and the related indentures (the “Indentures”) will be automatically and unconditionally released and discharged, upon the occurrence of any of the following, along with the delivery to the trustee of an officer’s certificate and an opinion of counsel, each stating that all conditions precedent provided for in the applicable Indenture relating to the release and discharge of such Guarantor subsidiary’s guarantee have been complied with:
(a) any sale, exchange, transfer or disposition of such Guarantor subsidiary (by merger, consolidation, or the sale of) or the capital stock of such Guarantor subsidiary after which the applicable Guarantor subsidiary is no longer a subsidiary of the Company or the sale of all or substantially all of such Guarantor subsidiary’s assets (other than by lease), whether or not such Guarantor subsidiary is the surviving entity in such transaction, to a person which is not the Company or a subsidiary of the Company; provided that (i) such sale, exchange, transfer or disposition is made in compliance with the applicable Indenture, including the covenants regarding consolidation, merger and sale of assets and, as applicable, dispositions of assets that constitute notes collateral, and (ii) all the obligations of such Guarantor subsidiary under all debt of the Company or its subsidiaries terminate upon consummation of such transaction;
(b) designation of any Guarantor subsidiary as an “excluded subsidiary” (as defined in the Indentures); or
(c) defeasance or satisfaction and discharge of the Indentures.
Each entity in the summarized combined financial information follows the same accounting policies as described in the consolidated financial statements. The accompanying summarized combined financial information does not reflect investments of the obligated group in non-Guarantor subsidiaries. The financial information of the obligated group is presented on a combined basis; intercompany balances and transactions within the obligated group have been eliminated. The obligated group's amounts due from, amounts due to, and transactions with, non-Guarantor subsidiaries and related parties have been presented in separate line items.
Summarized Combined Financial Information of the Issuer and Guarantor Subsidiaries:SUMMARIZED COMBINED FINANCIAL INFORMATION OF THE ISSUER AND GUARANTOR SUBSIDIARIES
The following table is summarized combined financial information from the Statements of Condensed Consolidated Financial Position of the obligated group:
| | | | | | | | | | | |
| (In Millions) |
| December 31, 2020 | | December 31, 2019 |
| Current assets | $ | 4,903 | | | $ | 891 | |
| Non-current assets | 10,535 | | | 2,382 | |
| Current liabilities | (2,767) | | | (393) | |
| Non-current liabilities | (10,563) | | | (2,792) | |
| | | |
| | | | | | | |
| December 31, |
| (In millions) | 2023 | | |
| Current assets | $ | 7,150 | | | |
| Non-current assets | 10,111 | | | |
| Current liabilities | (4,283) | | | |
| Non-current liabilities | (5,463) | | | |
| | | |
The following table is summarized combined financial information from the Statements of Condensed Consolidated Operations of the obligated group:
| | | | | |
| (In Millions) |
| Year Ended |
| (In millions) | December 31, 20202023 |
Revenues1 | $ | 5,17021,694 | |
| Cost of goods sold | (5,008)(20,263) | |
LossIncome from continuing operations | (120)531 | |
Net lossincome | (118)532 | |
Net lossincome attributable to Cliffs shareholders | (118)532 | |
1 Includes Realization of deferred revenue of $35 million for the year ended December 31, 2020.
As of December 31, 20202023 and 2019,2022, the obligated group had the following balances with non-Guarantor subsidiaries and other related parties:
| | | | | | | | | | | |
| (In Millions) |
| December 31, 2020 | | December 31, 2019 |
| Balances with non-Guarantor subsidiaries: | | | |
| Accounts receivable, net | $ | 69 | | | $ | — | |
| Accounts payable | (17) | | | — | |
| | | |
| Balances with other related parties: | | | |
| Accounts receivable, net | $ | 2 | | | $ | 31 | |
| Other current assets | — | | | 45 | |
| Accounts payable | (6) | | | — | |
| Other current liabilities | — | | | (2) | |
| | | | | | | |
| December 31, |
| (In millions) | 2023 | | |
| Balances with non-Guarantor subsidiaries: | | | |
| Accounts receivable, net | $ | 743 | | | |
| Accounts payable | (1,004) | | | |
| | | |
| Balances with other related parties: | | | |
| Accounts receivable, net | $ | 5 | | | |
| | | |
| Accounts payable | (11) | | | |
| | | |
Additionally, for the year ended December 31, 2020,2023, the obligated group had Revenues of $893$110 million and Cost of goods sold of $602$81 million, in each case with other related parties.
Market RisksMARKET RISKS
We are subject to a variety of risks, including those caused by changes in commodity prices and interest rates. We have established policies and procedures to manage such risks; however, certain risks are beyond our control.
PRICING RISKS
In the ordinary course of business, we are exposed to market risk and price fluctuations related to the sale of our products, which are impacted primarily by market prices for HRC and other related spot pricing indices, and the purchase of energy and raw materials used in our operations, which are impacted by market prices for electricity, natural gas, electricity, ferrous and stainless steel scrap, chrome,metallurgical coal, coke, zinc, chrome, nickel and zinc.other alloys. Our strategy to address market risk has generally been to obtain competitive prices for our products and services and allow operating results to reflect market price movements dictated by supply and demand; however, we make forward physical purchases and enter into hedge contracts to manage exposure to price risk related to the purchases of certain raw materials and energy used in the production process.
Our financial results can vary for our operations as a result of fluctuations in market prices. We attempt to mitigate these risks by aligning fixed and variable components in our customer pricing contracts, supplier purchasing agreements and derivative financial instruments.
Some customer contracts have fixed-pricingfixed pricing terms, which increase our exposure to fluctuations in raw material and energy costs. To reduce our exposure, we enter into annual, fixed-pricefixed price agreements for certain raw materials. Some of our existing multi-year raw material supply agreements have required minimum purchase quantities. Under adverse economic conditions, those minimums may exceed our needs. Absent exceptions for force
majeure and other circumstances affecting the legal enforceability of the agreements, these minimum purchase requirements may compel us to purchase quantities of raw materials that could significantly exceed our anticipated needs or pay damages to the supplier for shortfalls. In these circumstances, we would attempt to negotiate agreements for new purchase quantities. There is a risk, however, that we would not be successful in reducing purchase quantities, either through negotiation or litigation. If that occurred, we would likely be required to purchase more of a particular raw material in a particular year than we need, negatively affecting our results of operations and cash flows.
Certain of our customer contracts include variable-pricing mechanisms that adjust selling prices in response to changes in the costs of certain raw materials and energy, while other of our customer contracts exclude such mechanisms. We may enter into multi-year purchase agreements for certain raw materials with similar variable-price mechanisms, allowing us to achieve natural hedges between the customer contracts and supplier purchase agreements. Therefore, in some cases, price fluctuations for energy (particularly natural gas and electricity), raw materials (such as scrap, chrome, zinc and nickel) or other commodities may be, in part, passed on to customers rather than absorbed solely by us. There is a risk, however, that the variable-price mechanisms in the sales contracts may not necessarily change in tandem with the variable-price mechanisms in our purchase agreements, negatively affecting our results of operations and cash flows.
Our strategy to address volatile natural gas rates and electricity rates includes improving efficiency in energy usage, identifying alternative providers and utilizing the lowest cost alternative fuels. If we are unable to align fixed and variable components between customer contracts and supplier purchase agreements, we routinely evaluate the use of derivative instruments to hedge market risk. As a result, we use cash-settled commodity price swaps and options to hedge the market risk associated with the purchase of certain of our raw materials and energy requirements. Additionally, we routinely use these derivative instruments to hedge a portion of our exposure from our natural gas electricity and zincelectricity requirements. Our hedging strategy is designed to protect us from excessive pricing volatility. However, since we do not typically hedge 100% of our exposure, abnormal price increases in any of these commodity markets might still negatively affect operating costs.
The following table summarizes the impactnegative effect of a hypothetical change in the fair value of our derivative instruments outstanding as of December 31, 2023, due to a 10% and 25% change in the market price fromof each of the December 31, 2020 estimated price on our derivative instruments, thereby impacting our pre-taxindicated commodities:
| | | | | | | | | | | | | | |
| | (In millions) |
| Commodity Derivative | | 10% Change | | 25% Change |
| Natural gas | | $ | 53 | | | $ | 131 | |
| Electricity | | 15 | | | 36 | |
| | | | |
| | | | |
Any resulting changes in fair value would be recorded as adjustments to AOCI, net of income taxes, or recognized in net earnings, as appropriate. These hypothetical losses would be partially offset by the same amount.benefit of lower prices paid for the related commodities.
| | | | | | | | | | | |
| (In Millions) |
| Positive or Negative Effect on
Pre-tax Income |
| Commodity Derivative | 10% Increase or Decrease | | 25% Increase or Decrease |
| Natural gas | $ | 28 | | | $ | 69 | |
| Electricity | 2 | | | 4 | |
| Zinc | 1 | | | 2 | |
Valuation of Goodwill and Other Long-Lived AssetsGOODWILL
We assign goodwill arising from acquired companies to the reporting units that are expected to benefit from the synergies of the acquisition. Goodwill is tested on a qualitative or quantitative basis for impairment at the reporting unit level on an annual basis (October 1) and between annual tests if an event occurs or circumstances change that would more likely than not reduce the fair value of a reporting unit below its carrying value. These events or circumstances could include a significant change in the business climate, legal factors, operating performance indicators, competition, or sale or disposition of a significant portion of a reporting unit. As necessary, shouldWe have an unconditional option to bypass the qualitative test for any reporting unit in any period and proceed directly to performing the quantitative test. Should our qualitative test indicate that it is more likely than not that the fair value of a reporting unit is less than its carry amount,carrying value, we perform a quantitative test to determine the amount of impairment, if any, to the carrying value of the reporting unit and its associated goodwill.
Application of the goodwill impairment test requires judgment, including the identification of reporting units, assignment of assets and liabilities to reporting units, assignment of goodwill to reporting units and if a quantitative assessment is deemed necessary in determination of the fair value of each reporting unit. The fair value of each reporting unit is estimated using athe guideline public company method, the discounted cash flow methodology, or a combination of both, which considers forecasted cash flows
discounted at an estimated weighted average cost of capital. Assessing the recoverability of our goodwill requires significant assumptions regarding the estimated future cash flows and other factors to determine the fair value of a reporting unit, including, among other things, estimates related to forecasts of future revenues, expected Adjusted EBITDA, expected capital expenditures and working capital requirements, which are based upon our long-range plan estimates. The assumptions used to calculate the fair value of a reporting unit may change from year to year based on operating results, market conditions and other factors. Changes in these assumptions could materially affect the determination of fair value for each reporting unit.
TableOur 2023 annual goodwill impairment analysis resulted in an impairment charge of Contents$125 million for goodwill related to our Tooling and Stamping reporting unit. The decline in the fair value of our Tooling and Stamping reporting unit below its carrying value during 2023 resulted from forgoing previous investment and capital plans in favor of other opportunities and an increase in the discount rate. No impairment charges were identified in connection with our annual goodwill assessment with respect to our other identified reporting units. We determined that our other identified reporting units were not at risk of failing the goodwill impairment test as of December 31, 2023.OTHER LONG-LIVED ASSETS
Long-lived assets are reviewed for impairment upon the occurrence of events or changes in circumstances that would indicate that the carrying value of the assets may not be recoverable. Such indicators may include: a significant decline in expected future cash flows; a sustained, significant decline in market pricing; a significant adverse change in legal or environmental factors or in the business climate; changes in estimates of our recoverable reserves; and unanticipated competition. Any adverse change in these factors could have a significant impact on the recoverability of our long-lived assets and could have a material impact on our consolidated statements of operations and statementstatements of financial position.
A comparison of each asset group's carrying value to the estimated undiscounted net future cash flows expected to result from the use of the assets, including cost of disposition, is used to determine if an asset is recoverable. Projected future cash flows reflect management's best estimate of economic and market conditions over the projected period, including growth rates in revenues and costs, and estimates of future expected changes in operating margins and capital expenditures. If the carrying value of the asset group is higher than its undiscounted net future cash flows, the asset group is measured at fair value and the difference is recorded as a reduction to the long-lived assets. We estimate fair value using a market approach, an income approach or a cost approach. While we concluded that an event triggering the need for an impairment assessment did not occur during
During the year ended December 31, 2020,2023, we concluded there were no triggering events resulting in the need for an asset impairment assessment except for our Tooling and Stamping operations. The goodwill impairment we recorded at our Tooling and Stamping operations was deemed a prolonged COVID-19 pandemic could impacttriggering event; however, the results of operations due to changes to assumptions that would indicate that the carrying value of ourother long-lived assets recoverability assessment did not result in an asset groups may not be recoverable.impairment charge.
Interest Rate RiskINTEREST RATE RISK
Interest payable on our senior notes is at fixed rates. Interest payable under our ABL Facility is at a variable rate based upon the applicable base rate plus the applicable base rate margin depending on the excess availability. As of December 31, 2020,2023, we had $1,510 million outstanding under the ABL Facility. An increase in prevailing interest rates would increase interest expense and interest paid for anyno outstanding borrowings under theour ABL Facility. For example, a 100 basis point changediscussion of the attendant risk, see Part I - Item 1A. Risk Factors - III. Financial Risks- Our existing and future indebtedness may limit cash flow available to interest ratesinvest in the ongoing needs of our businesses, which could prevent us from fulfilling our obligations under theour senior notes, ABL Facility at the December 31, 2020 borrowing level would result in a change of $15 millionand other debt, and we may be forced to interest expense on an annual basis.take other actions to satisfy our obligations under our debt, which may not be successful.
Supply Concentration RisksSUPPLY CONCENTRATION RISKS
Many of our operations and mines rely on one source for each of electric power and natural gas. A significant interruption or change in service or rates from our energy suppliers could materially impact our production costs, margins and profitability.
Recently Issued Accounting PronouncementsRECENTLY ISSUED ACCOUNTING PRONOUNCEMENTS
Refer to NOTE 1 - BASIS OF PRESENTATION AND SIGNIFICANT ACCOUNTING POLICIES of the consolidated financial statements for a description of recent accounting pronouncements, including the respective dates of adoption and effects on results of operations and financial condition.
Critical Accounting Estimates
CRITICAL ACCOUNTING ESTIMATES
Management's discussion and analysis of financial condition and results of operations is based on our consolidated financial statements, which have been prepared in accordance with GAAP. Preparation of financial statements requires management to make assumptions, estimates and judgments that affect the reported amounts of assets, liabilities, revenues, costs and expenses, and the related disclosures of contingencies. Management bases its estimates on various assumptions and historical experience, which are believed to be reasonable; however, due to the inherent nature of estimates, actual results may differ significantly due to changed conditions or assumptions. On a regular basis, management reviews the accounting policies, assumptions, estimates and judgments to ensure that our financial statements are fairly presented in accordance with GAAP. However, because future events and their effects cannot be determined with certainty, actual results could differ from our assumptions and estimates, and such differences could be material. Management believes that the following critical accounting estimates and judgments have a significant impact on our financial statements.
Business Combinations
Assets acquired and liabilities assumed in a business combination are recognized and measured based on their estimated fair values at the acquisition date, while the acquisition-related costs are expensed as incurred. Any excess of the purchase consideration when compared to the fair value of the net tangible and intangible assets acquired, if any, is recorded as goodwill. We engaged independent valuation specialists to assist with the determination of the fair value of assets acquired, liabilities assumed, noncontrolling interest, and goodwill, for the Acquisitions. If the initial accounting for the business combination is incomplete by the end of the reporting period in which the acquisition occurs, an estimate will be recorded. Subsequent to the acquisition date, and not later than one
year from the acquisition date, we will record any material adjustments to the initial estimate based on new information obtained that would have existed as of the date of the acquisition. Any adjustment that arises from information obtained that did not exist as of the date of the acquisition will be recorded in the period the adjustment arises.
Valuation of Goodwill and Other Long-Lived AssetsVALUATION OF GOODWILL AND OTHER LONG-LIVED ASSETS
The valuation of goodwill and other long-lived assets includes various assumptions and are considered critical accounting estimates. Refer to "–Market Risks" above for additional information.
IRON ORE MINERAL RESERVES
We regularly evaluate, and engage QPs to review and validate, our mineral reserves and update them as required in accordance with SEC Industry Guide 7.Subpart 1300 of Regulation S-K. We perform an in-depth evaluation of our mineral reserve estimates by mine on a periodic basis, in addition to routine annual assessments. The determination of mineral reserves requires us with the support of ourand third-party experts,QPs to make significant estimates and assumptions related to key inputs, including, but not limited to, (1) the determination of the size and scope of the iron ore body through technical modeling, (2) the estimates of future iron ore prices, production costs and capital expenditures, and (3) management’s mine plan for the proven and probable mineral reserves. The significant estimates and assumptions could be affected by future industry conditions, geological conditions and ongoing mine planning. Additional capital and development expenditures may be required to maintain effective production capacity. Generally, as mining operations progress, haul distances increase. Alternatively, changes in economic conditions or the expected quality of mineral resources and reserves could decrease capacity of mineral reserves.effective production capacity. Technological progress could alleviate such factors or increase capacity of mineral reserves.
We use our mineral reserve estimates, combined with our estimated annual production levels and operating scenarios, to determine the mine closure dates utilized in recording the fair value liability for asset retirement obligations for our active operating mines. Refer to NOTE 14 - ASSET RETIREMENT OBLIGATIONS, for further information. Since the liability represents the present value of the expected future obligation, a significant change in mineral reserves or mine lives could have a substantial effect on the recorded obligation. We also utilize mineral reserves for evaluating potential impairments of goodwill and mine asset groups as they are indicative of future cash flows and in determining maximum useful lives utilized to calculate depreciation, depletion and amortization of long-lived mine assets and in determining the estimated fair value of mineral reserves established through the purchase price allocation in a business combination.assets. The consolidated asset retirement obligation balance was $342$459 million as of December 31, 2020,2023, of which $83$171 million related to active iron ore mine operations. The total asset balance associated with our Steelmaking reportable segment was $15,849 million as of December 31, 2020, of which $1,661 million relatedRefer to long-lived assets associated with our combined iron ore mine asset groups, and is inclusive of $235 million related to iron ore mineral reserves acquired through the AM USA Transaction. Depreciation, depletion and amortization expenseNOTE 13 - ASSET RETIREMENT OBLIGATIONS for the our combined iron ore mine asset groups was $78 million for the year ended December 31, 2020. Increases or decreases in mineral reserves or mine lives could significantly affect these items.further information.
Asset Retirement ObligationsASSET RETIREMENT OBLIGATIONS
The accrued closure obligation is predominantly related to our indefinitely idled and closed iron ore mining operations and provides for contractual and legal obligations associated with the eventual closure of thoseour active operations. We perform an in-depth evaluation of the liability every three years in addition to our routine annual assessments. In 2020,2023, we employed third-party specialists to assist in the evaluation. Our obligations are determined based on detailed estimates adjusted for factors that a market participant would consider (e.g., inflation, overhead and profit), which are escalated at an assumed rate of inflation to the estimated closure dates and then discounted using the current credit-adjusted risk-free interest rate. The estimate also incorporates incremental increases in the closure cost estimates and changes in estimates of mine lives for our active mine sites. The closure date for each of our active mine sites is determined based on the exhaustion date of the remaining iron oremineral reserves, which is dependent on our estimate of mineral reserves. The estimated obligations for our active mine sites are particularly sensitive to the impact of changes in mine lives given the difference between the inflation and discount rates. The closure dates for a majority ofAsset retirement obligations at our steelmaking facilities are indefinite,operations primarily include the closure and as such, the assetpost-closure care for on-site landfills and other waste containment facilities. Asset retirement obligations arehave been recorded at present values using estimated ranges of the economic lives of the underlying assets.settlement dates based on when we expect these facilities to reach capacity and close. Changes in the base estimates of legal and contractual closure costs due to changes in legal or contractual requirements, available technology, inflation, overhead or profit rates also could have a significant impact on the recorded obligations. Refer to NOTE 1413 - ASSET RETIREMENT OBLIGATIONS, for further information.
Environmental Remediation CostsENVIRONMENTAL REMEDIATION COSTS
We have a formal policy for environmental protection and remediation. Our obligations for known environmental matters at active and closed operations have been recognized based on estimates of the cost of investigation and remediation at each facility. If the obligation can only be estimated as a range of possible amounts, with no specific amount being more likely, the minimum of the range is accrued. Management reviews its environmental remediation sites quarterly to determine if additional cost adjustments or disclosures are required. The characteristics of environmental remediation obligations, where information concerning the nature and extent of clean-up activities is not immediately available and which are subject to changes in regulatory requirements, result in a significant risk of increase to the obligations as they mature. Expected future expenditures are not discounted to present value unless the amount and timing of the cash disbursements cancannot be reasonably estimated.
Income TaxesINCOME TAXES
Our income tax expense, deferred tax assets and liabilities and reserves for unrecognized tax benefits reflect management's best assessment of estimated future taxes to be paid. We are subject to income taxes in the U.S. and various foreign jurisdictions. Significant judgments and estimates are required in determining the consolidated income tax expense.
Deferred income taxes arise from temporary differences between tax and financial statement recognition of revenue and expense. In evaluating our ability to recover our deferred tax assets, we consider all available positive and negative evidence, including scheduled reversals of deferred tax liabilities, projected future taxable income, tax planning strategies and recent financial operations. In projecting future taxable income, we begin with historical results adjusted for the results of discontinued operations and changes in accounting policies and incorporate assumptions including the amount of future state, federal and foreign pretaxpre-tax operating income, the reversal of temporary differences, and the implementation of feasible and prudent tax planning strategies. These assumptions require significant judgment about the forecasts of future taxable income and are consistent with the plans and estimates we are using to manage the underlying businesses.
At December 31, 20202023 and 2019,2022, we had a valuation allowance of $836$396 million and $441$390 million, respectively, against our deferred tax assets. Of these amounts, $439 millionAt December 31, 2023 and $44 million relate to2022, the valuation allowance on our U.S. deferred tax assets at December 31, 2020was $40 million and 2019,$48 million, respectively, and $397 million and $397 million relate tothe valuation allowance on our foreign deferred tax assets was $356 million and $342 million, respectively.
During 2023, we determined that it was appropriate to release all of therecorded a $14 million valuation allowance related to U.S. federalagainst a portion of our Canadian deferred tax assets as it is more likely than not that the entiredue to losses in recent years. We intend to maintain a valuation allowance against these deferred tax asset will be realized beforeassets, unless and until sufficient positive evidence exists to support the endrealization of the carryforward period. See NOTE 12 - INCOME TAXES for further information and considerations related to the release.
such assets. Our losses in Luxembourg in recent periods represent sufficient negative evidence to require a full valuation allowance against the deferred tax assets in that jurisdiction. We intend to maintain a valuation allowance against the deferred tax assets related to these operating losses, unless and until sufficient positive evidence exists to support the realization of such assets.
Changes in tax laws and rates also could affect recorded deferred tax assets and liabilities in the future. The calculation of our tax liabilities involves dealing with uncertainties in the application of complex tax laws and regulations in various jurisdictions across our global operations. The ultimate impact of the U.S. income tax reform legislation may differ from our current estimates due to changes in the interpretations and assumptions made as well as additional regulatory guidance that may be issued.
Accounting for uncertainty in income taxes recognized in the financial statements requires that a tax benefit from an uncertain tax position be recognized when it is more likely than not that the position will be sustained upon examination, including resolutions of any related appeals or litigation processes, based on technical merits.
We recognize tax liabilities in accordance with ASC 740, Income Taxes, and we adjust these liabilities when our judgment changes because of evaluation of new information not previously available. Due to the complexity of some of these uncertainties, the ultimate resolution may result in payment that is materially different from our current estimate of the tax liabilities. These differences will be reflected as increases or decreases to income tax expense in the period in which they are determined. Refer to NOTE 1211 - INCOME TAXES, for further information.
Employee Retirement Benefit ObligationsEMPLOYEE RETIREMENT BENEFIT OBLIGATIONS
We offer defined benefit pension plans, defined contribution pension plans and OPEB plans, primarily consisting of retiree healthcare benefits, to most employees in North America as part of a total compensation and benefits program.
The following is a summary of our U.S. defined benefit pension and OPEB funding and expense:
| | | | | | | | | | | | | | | | | | | | | | | | | | |
| | Pension | | OPEB |
| | Funding | | Expense (Benefit) | | Funding | | Expense (Benefit) |
| 2018 | | $ | 28 | | | $ | 13 | | | $ | 4 | | | $ | (6) | |
| 2019 | | 16 | | | 22 | | | 4 | | | (2) | |
| 2020 | | 50 | | | (31) | | | 25 | | | 8 | |
2021 (Estimated)1 | | 202 | | | (168) | | | 144 | | | 86 | |
| | | | | | | | |
1 The estimated 2021 pension funding includes $118 million, which was deferred as a result of the CARES Act. |
Assumptions used in determining the benefit obligations and the value of plan assets forsponsor various defined benefit pension plans and OPEB plans primarily consisting of retiree healthcare benefits, thatfor certain current employees and retirees. For accounting purposes, we offer are evaluated periodically by management. Criticaluse various actuarial assumptions such as the discount rate usedand methodologies to measure the plan obligations, assets and related net periodic benefit obligations,cost or credit at the end of each year. These assumptions include discount rates, expected long-term rate of return on plan assets, the medical care cost trend, and the ratemortality rates, rates of compensation increase, healthcare trend rates and certain demographic assumptions. Assumptions and calculations are reviewed annually.by management and reflect our best estimates and judgment. Future changes in assumptions or differences between actual and expected can significantly impact the future funded status of our plans as well as their related net periodic benefit cost or credit.
The following represents weighted-average assumptions used to determine benefit obligationsWe believe discount rates and net benefit costs:
| | | | | | | | | | | | | | | | | | | | | | | | | | | | | | | | | | | |
| Pension | | Other Benefits |
| December 31, | | December 31, |
| 2020 | | 2019 | | 2020 | | 2019 |
| Discount rate | 2.34 | | % | | 3.27 | | % | | 2.71 | | % | | 2.71 | | % |
| Compensation rate increase | 2.56 | | | | 2.53 | | | | 3.00 | | | | 3.00 | | |
| Expected return on plan assets | 7.69 | | | | 8.25 | | | | 6.82 | | | | 7.00 | | |
The following represents assumed weighted-average health care cost trend rates:
| | | | | | | | | | | | | | | | | |
| December 31, |
| 2020 | | 2019 |
| Health care cost trend rate assumed for next year | 6.05 | | % | | 6.50 | | % |
| Ultimate health care cost trend rate | 4.59 | | | | 5.00 | | |
| Year that the ultimate rate is reached | 2031 | | | | 2026 | | |
expected return on assets are the most critical assumptions. The discount rates used to measure plan liabilities as of the December 31 measurement date are determined individually for each plan. The discount rates are determined by matching the projected cash flows used to determine the plan liabilities to a projected yield curve of high-quality corporate bonds available at the measurement date. Discount rates for expense are calculated using the granular approach for each plan.
DependingThe expected return on plan assets are calculated on a plan-by-plan basis and take into account each plan's strategic asset allocation. The calculation of rates by asset class are based primarily on our future expected returns and take into consideration the duration of the cash flows, active management and fees. The difference between our expected return on plan we use either company-specific base mortality tablesassets assumptions and the actual returns are recorded in AOCI and ultimately affects future earnings in subsequent years. Although our actual returns will likely differ from our estimate on any given year, the returns over the long term are expected to match our assumptions. In 2024, our weighted average expected return on assets for pension and OPEB plans will increase from 7.66% to 7.85% and from 5.87% to 5.94%, respectively.
Cumulative actuarial gains and losses will be amortized to expense using the corridor method, where gains and losses are recognized if they exceed 10% of the greater of the fair value of plan assets or tables issuedthe plans' benefit obligations. The amortization period will vary by the Society of Actuaries. We adopted the Pri-2012 mortality tables from the Society of Actuaries in 2019. On December 31, 2020, the assumed mortality improvement projection was updated from generational scale MP-2019 to generational scale MP-2020 for the Pri-2012 mortality tables.plan.
FollowingThe following are sensitivities of potential further changes in these key assumptions on the estimated 20212024 pension and OPEB expense and the pension and OPEB obligations as of December 31, 2020:2023:
| | | | | | | | | | | | | | | | | | | | | | | |
| (In Millions) |
| Increase (Decrease) in Expense | | Increase in
Benefit Obligation |
| Pension | | OPEB | | Pension | | OPEB |
| Decrease discount rate 0.25% | $ | (4) | | | $ | (2) | | | $ | 164 | | | $ | 131 | |
| Decrease return on assets 1.00% | 53 | | | 8 | | | N/A | | N/A |
Changes in actuarial assumptions, including discount rates, employee retirement rates, mortality, compensation levels, plan asset investment performance and healthcare costs, are determined based on analyses of actual and expected factors. Changes in actuarial assumptions and/or investment performance of plan assets may have a significant impact on our financial condition due to the magnitude of our retirement obligations. | | | | | | | | | | | | | | | | | | | | | | | |
| Increase (Decrease) in Expense | | Increase in Benefit Obligation |
| (In millions) | Pension | | OPEB | | Pension | | OPEB |
| Decrease discount rate 0.25% | $ | (3) | | | $ | 1 | | | $ | 93 | | | $ | 22 | |
| Decrease return on assets 1.00% | 41 | | | 7 | | | N/A | | N/A |
Refer to NOTE 109 - PENSIONS AND OTHER POSTRETIREMENT BENEFITS for further information.
Forward-Looking Statements
FORWARD-LOOKING STATEMENTS
This report contains statements that constitute "forward-looking statements" within the meaning of the federal securities laws. As a general matter, forward-looking statements relate to anticipated trends and expectations rather than historical matters. Forward-looking statements are subject to uncertainties and factors relating to our operations and business environment that are difficult to predict and may be beyond our control. Such uncertainties and factors may cause actual results to differ materially from those expressed or implied by the forward-looking statements. These statements speak only as of the date of this report, and we undertake no ongoing obligation, other than that imposed by law, to update these statements. Investors are cautioned not to place undue reliance on forward-looking statements. Uncertainties and risk factors that could affect our future performance and cause results to differ from the forward-looking statements in this report include, but are not limited to:
•disruptions to our operations relating to the COVID-19 pandemic, including the heightened risk that a significant portion of our workforce or on-site contractors may suffer illness or otherwise be unable to perform their ordinary work functions;
•continued volatility of steel, and iron ore and scrap metal market prices, which directly and indirectly impact the prices of the products that we sell to our customers;
•uncertainties associated with the highly competitive and cyclical steel industry and our reliance on the demand for steel from the automotive industry, which has been experiencing a trend toward light weighting that could result in lower steel volumes being consumed;industry;
•potential weaknesses and uncertainties in global economic conditions, excess global steelmaking capacity, oversupply of iron ore, prevalence of steel imports and reduced market demand, including as a result of the COVID-19 pandemic;demand;
•severe financial hardship, bankruptcy, temporary or permanent shutdowns or operational challenges due to the COVID-19 pandemic or otherwise, of one or more of our major customers, including customers in the automotive market, key suppliers or contractors, which, among other adverse effects, could disrupt our operations or lead to reduced demand for our products, increased difficulty collecting receivables, and customers and/or suppliers asserting force majeure or other reasons for not performing their contractual obligations to us;
•risks related to U.S. government actions with respect to Section 232, the USMCA and/or other trade agreements, tariffs, treaties or policies, as well as the uncertainty of obtaining and maintaining effective antidumping and countervailing duty orders to counteract the harmful effects of unfairly traded imports;
•impacts of existing and increasing governmental regulation, including potential environmental regulations relating to climate change and other environmental regulation that may be proposed under the Biden Administration,carbon emissions, and related costs and liabilities, including failure to receive or maintain required operating and environmental permits, approvals, modifications or other authorizations of, or from, any governmental or regulatory authority and costs related to implementing improvements to ensure compliance with regulatory changes, including potential financial assurance requirements;requirements, and reclamation and remediation obligations;
•potential impacts to the environment or exposure to hazardous substances resulting from our operations;
•our ability to maintain adequate liquidity, our level of indebtedness and the availability of capital could limit our financial flexibility and cash flow necessary to fund working capital, planned capital expenditures, acquisitions, and other general corporate purposes or ongoing needs of our business;business, or to repurchase our common shares;
•our ability to reduce our indebtedness or return capital to shareholders within the currently expected timeframes or at all;
•adverse changes in credit ratings, interest rates, foreign currency rates and tax laws;
•limitations on our ability to realize some or allthe outcome of, our deferred tax assets, including our NOLs;
•our ability to realize the anticipated synergies and benefits of the Acquisitions and to successfully integrate the businesses of AK Steel and ArcelorMittal USA into our existing businesses, including uncertainties associated with maintaining relationships with customers, vendors and employees;
•additional debt we assumed, incurred or issued in connection with the Acquisitions, as well as additional debt wecosts incurred in connection with, enhancing our liquidity during the COVID-19 pandemic, may negatively impact our credit profilelawsuits, claims, arbitrations or governmental proceedings relating to commercial and limit our financial flexibility;
•knownbusiness disputes, antitrust claims, environmental matters, government investigations, occupational or personal injury claims, property-related matters, labor and unknown liabilities we assumed in connection with the Acquisitions, including significant environmental, pensionemployment matters, or suits involving legacy operations and OPEB obligations;
•the ability of our customers, joint venture partners and third-party service providers to meet their obligations to us on a timely basis or at all;other matters;
•supply chain disruptions or changes in the cost, quality or qualityavailability of energy sources, orincluding electricity, natural gas and diesel fuel, critical raw materials and supplies, including iron ore, industrial gases, graphite electrodes, scrap metal, chrome, zinc, other alloys, coke and coal;
•liabilitiesmetallurgical coal, and costs arising in connection with any business decisions to temporarily idle or permanently close a mine or production facility, which could adversely impact the carrying value of associated assetscritical manufacturing equipment and give rise to impairment charges or closure and reclamation obligations, as well as uncertainties associated with restarting any previously idled mine or production facility;spare parts;
•problems or disruptions associated with transporting products to our customers, moving manufacturing inputs or products internally among our facilities, or suppliers transporting raw materials to us;
•the risk that the cost or time to implement a strategic or sustaining capital project may prove to be greater than originally anticipated;
•our ability to consummate any public or private acquisition transactions and to realize any or all of the anticipated benefits or estimated future synergies, as well as to successfully integrate any acquired businesses into our existing businesses;
•uncertainties associated with natural or human-caused disasters, adverse weather conditions, unanticipated geological conditions, critical equipment failures, infectious disease outbreaks, tailings dam failures and other unexpected events;
•cybersecurity incidents relating to, disruptions in, or failures of, information technology systems that are managed by us or third parties that host or have access to our data or systems, including the loss, theft or corruption of sensitive or essential business or personal information and the inability to access or control systems;
•liabilities and costs arising in connection with any business decisions to temporarily or indefinitely idle or permanently close an operating facility or mine, which could adversely impact the carrying value of associated assets and give rise to impairment charges or closure and reclamation obligations, as well as uncertainties associated with restarting any previously idled operating facility or mine;
•our level of self-insurance and our ability to obtain sufficient third-party insurance to adequately cover potential adverse events and business risks;
•disruptionsuncertainties associated with our ability to meet customers’ and suppliers’ decarbonization goals and reduce our GHG emissions in or failures of,alignment with our information technology systems, including those related to cybersecurity;own announced targets;
•our abilitychallenges to successfully identify and consummate any strategic investments or development projects, cost-effectively achieve planned production rates or levels, and diversify our product mix and add new customers;
•our actual economic iron ore and coal reserves or reductions in current mineral estimates, including whether we are able to replace depleted reserves with additional mineral bodies to support the long-term viability of our operations;
•the outcome of any contractual disputes with our customers, joint venture partners, lessors, or significant energy, raw material or service providers, or any other litigation or arbitration;
•our ability to maintainmaintaining our social license to operate with our stakeholders, including by fosteringthe impacts of our operations on local communities, reputational impacts of operating in a strong reputationcarbon-intensive industry that produces GHG emissions, and our ability to foster a consistent operational and safety track record;
•our actual economic mineral reserves or reductions in current mineral reserve estimates, and any title defect or loss of any lease, license, easement or other possessory interest for any mining property;
•our ability to maintain satisfactory labor relations with unions and employees;
•availability of workers to fill critical operational positions and potential labor shortages caused by the COVID-19 pandemic, as well as our ability to attract, hire, develop and retain key personnel, including within the acquired AK Steel and ArcelorMittal USA businesses;
•unanticipated or higher costs associated with pension and OPEB obligations resulting from changes in the value of plan assets or contribution increases required for unfunded obligations; and
67•uncertain availability or cost of skilled workers to fill critical operational positions and potential labor shortages caused by experienced employee attrition or otherwise, as well as our ability to attract, hire, develop and retain key personnel;
Table•the amount and timing of Contentsany repurchases of our common shares; and•potential significant deficiencies or material weaknesses in our internal control over financial reporting.
For additional factors affecting our businesses, refer to Part I – Item 1A. Risk Factors. You are urged to carefully consider these risk factors.
Forward-looking and other statements in this Annual Report on Form 10-K regarding our GHG reduction plans and goals are not an indication that these statements are necessarily material to investors or required to be disclosed in our filings with the SEC. In addition, historical, current and forward-looking GHG-related statements may be based on standards for measuring progress that are still developing, internal controls and processes that continue to evolve, and assumptions that are subject to change in the future.
| | |
| | |
ItemITEM 7A. | Quantitative and Qualitative Disclosures About Market Risk QUANTITATIVE AND QUALITATIVE DISCLOSURES ABOUT MARKET RISK |
Information regarding our Market Riskmarket risk is presented under the caption Market"Market Risks,," which is included in ItemITEM 7. Management's Discussion and Analysis of Financial Condition and Results of OperationsMANAGEMENT'S DISCUSSION AND ANALYSIS OF FINANCIAL CONDITION AND RESULTS OF OPERATIONS and is incorporated by reference and made a part hereof.
6858 | CLF 2023 FORM 10-K
| | |
| | |
ItemITEM 8. | Financial Statements and Supplementary Data FINANCIAL STATEMENTS AND SUPPLEMENTARY DATA |
Statements of Consolidated Financial PositionSTATEMENTS OF CONSOLIDATED FINANCIAL POSITION
Cleveland-Cliffs Inc. and SubsidiariesCLEVELAND-CLIFFS INC. AND SUBSIDIARIES
| | (In Millions) |
| December 31, |
| 2020 | | 2019 |
| December 31, | | | December 31, |
| (In millions, except share information) | | (In millions, except share information) | 2023 | | 2022 |
| ASSETS | ASSETS | | | |
| Current assets: | Current assets: | |
| Current assets: | |
| Current assets: | |
| Cash and cash equivalents | |
| Cash and cash equivalents | |
| Cash and cash equivalents | Cash and cash equivalents | $ | 112 | | | $ | 353 | |
| Accounts receivable, net | Accounts receivable, net | 1,169 | | | 94 | |
| Inventories | Inventories | 3,828 | | | 317 | |
| Income tax receivable, current | 24 | | | 59 | |
| Other current assets | Other current assets | 165 | | | 75 | |
| Total current assets | Total current assets | 5,298 | | | 898 | |
| Non-current assets: | Non-current assets: | |
| Property, plant and equipment, net | Property, plant and equipment, net | 8,743 | | | 1,929 | |
| Property, plant and equipment, net | |
| Property, plant and equipment, net | |
| Goodwill | Goodwill | 1,406 | | | 2 | |
| Deferred income taxes | 537 | | | 460 | |
| Pension and OPEB assets | |
| | Other non-current assets | |
| Other non-current assets | |
| Other non-current assets | Other non-current assets | 787 | | | 215 | |
| TOTAL ASSETS | TOTAL ASSETS | $ | 16,771 | | | $ | 3,504 | |
| LIABILITIES AND EQUITY | LIABILITIES AND EQUITY | | | |
| Current liabilities: | Current liabilities: | |
| Current liabilities: | |
| Current liabilities: | |
| Accounts payable | |
| Accounts payable | |
| Accounts payable | Accounts payable | $ | 1,575 | | | $ | 193 | |
| Accrued employment costs | Accrued employment costs | 460 | | | 67 | |
| State and local taxes | 147 | | | 38 | |
| Pension and OPEB liabilities, current | 151 | | | 4 | |
| Accrued expenses | |
| Other current liabilities | Other current liabilities | 596 | | | 107 | |
| Total current liabilities | Total current liabilities | 2,929 | | | 409 | |
| Non-current liabilities: | Non-current liabilities: | |
| Long-term debt | Long-term debt | 5,390 | | | 2,114 | |
| Pension and OPEB liabilities, non-current | 4,113 | | | 312 | |
| Long-term debt | |
| Long-term debt | |
| Pension and OPEB liabilities | |
| | Deferred income taxes | |
| Deferred income taxes | |
| Deferred income taxes | |
| Other non-current liabilities | Other non-current liabilities | 1,260 | | | 311 | |
| TOTAL LIABILITIES | TOTAL LIABILITIES | 13,692 | | | 3,146 | |
| Commitments and contingencies (See Note 21) | 0 | | 0 |
| Series B Participating Redeemable Preferred Stock - 0 par value | |
| Authorized, Issued and Outstanding - 583,273 shares | 738 | | | 0 | |
| Commitments and contingencies (See NOTE 20) | | Commitments and contingencies (See NOTE 20) | | | |
| Equity: | Equity: | |
| Common Shares - par value $0.125 per share | Common Shares - par value $0.125 per share | |
| Authorized - 600,000,000 shares (2019 - 600,000,000 shares); | |
| Issued - 506,832,537 shares (2019 - 301,886,794 shares); | |
| Outstanding - 477,517,372 shares (2019 - 270,084,005 shares) | 63 | | | 37 | |
| Common Shares - par value $0.125 per share | |
| Common Shares - par value $0.125 per share | |
| Authorized - 1,200,000,000 shares (2022 - 1,200,000,000 shares); | |
| Authorized - 1,200,000,000 shares (2022 - 1,200,000,000 shares); | |
| Authorized - 1,200,000,000 shares (2022 - 1,200,000,000 shares); | |
| Issued - 531,051,530 shares (2022 - 531,051,530 shares); | |
| Issued - 531,051,530 shares (2022 - 531,051,530 shares); | |
| Issued - 531,051,530 shares (2022 - 531,051,530 shares); | |
| Outstanding - 504,886,773 shares (2022 - 513,340,779 shares) | |
| Outstanding - 504,886,773 shares (2022 - 513,340,779 shares) | |
| Outstanding - 504,886,773 shares (2022 - 513,340,779 shares) | |
| Capital in excess of par value of shares | Capital in excess of par value of shares | 5,431 | | | 3,873 | |
| Retained deficit | (2,989) | | | (2,842) | |
| Cost of 29,315,165 common shares in treasury (2019 - 31,802,789 shares) | (354) | | | (391) | |
| Accumulated other comprehensive loss | (133) | | | (319) | |
| Retained earnings | |
| Cost of 26,164,757 common shares in treasury (2022 - 17,710,751 shares) | |
| Accumulated other comprehensive income | |
| Total Cliffs shareholders' equity | Total Cliffs shareholders' equity | 2,018 | | | 358 | |
| Noncontrolling interest | 323 | | | 0 | |
| Noncontrolling interests | |
| TOTAL EQUITY | TOTAL EQUITY | 2,341 | | | 358 | |
| TOTAL LIABILITIES, REDEEMABLE PREFERRED STOCK AND EQUITY | $ | 16,771 | | | $ | 3,504 | |
| TOTAL LIABILITIES AND EQUITY | |
The accompanying notes are an integral part of these consolidated financial statements.
6959 | CLF 2023 FORM 10-K
Statements of Consolidated OperationsSTATEMENTS OF CONSOLIDATED OPERATIONS
Cleveland-Cliffs Inc. and SubsidiariesCLEVELAND-CLIFFS INC. AND SUBSIDIARIES
| | (In Millions, Except Per Share Amounts) |
| Year Ended December 31, |
| 2020 | | 2019 | | 2018 |
| Year Ended December 31, | | | Year Ended December 31, |
| (In millions, except per share amounts) | | (In millions, except per share amounts) | 2023 | | 2022 | | 2021 |
| Revenues | Revenues | $ | 5,319 | | | $ | 1,990 | | | $ | 2,332 | |
| Realization of deferred revenue | 35 | | | 0 | | | 0 | |
| Operating costs: | Operating costs: | |
| Cost of goods sold | |
| Cost of goods sold | |
| Cost of goods sold | Cost of goods sold | (5,102) | | | (1,414) | | | (1,523) | |
| Selling, general and administrative expenses | Selling, general and administrative expenses | (244) | | | (113) | | | (113) | |
| Acquisition-related costs | Acquisition-related costs | (90) | | | (7) | | | 0 | |
| Goodwill impairment | |
| Miscellaneous – net | Miscellaneous – net | (60) | | | (27) | | | (23) | |
| Total operating costs | Total operating costs | (5,496) | | | (1,561) | | | (1,659) | |
| Operating income (loss) | (142) | | | 429 | | | 673 | |
| Operating income | |
| Other income (expense): | Other income (expense): | |
| Interest expense, net | Interest expense, net | (238) | | | (101) | | | (119) | |
| Gain (loss) on extinguishment of debt | 130 | | | (18) | | | (7) | |
| Other non-operating income | 57 | | | 3 | | | 18 | |
| Interest expense, net | |
| Interest expense, net | |
| Loss on extinguishment of debt | |
| Net periodic benefit credits other than service cost component | |
| Other non-operating income (loss) | |
| Total other expense | Total other expense | (51) | | | (116) | | | (108) | |
| Income (loss) from continuing operations before income taxes | (193) | | | 313 | | | 565 | |
| Income tax benefit (expense) | 111 | | | (18) | | | 475 | |
| Income (loss) from continuing operations | (82) | | | 295 | | | 1,040 | |
| Income (loss) from discontinued operations, net of tax | 1 | | | (2) | | | 88 | |
| Net income (loss) | (81) | | | 293 | | | 1,128 | |
| Income attributable to noncontrolling interest | (41) | | | 0 | | | 0 | |
| Net income (loss) attributable to Cliffs shareholders | $ | (122) | | | $ | 293 | | | $ | 1,128 | |
| Income from continuing operations before income taxes | |
| Income tax expense | |
| Income from continuing operations | |
| Income from discontinued operations, net of tax | |
| Net income | |
| Net income attributable to noncontrolling interests | |
| Net income attributable to Cliffs shareholders | |
| | Earnings (loss) per common share attributable to Cliffs shareholders - basic | |
| Earnings per common share attributable to Cliffs shareholders - basic | |
| Earnings per common share attributable to Cliffs shareholders - basic | |
| Earnings per common share attributable to Cliffs shareholders - basic | |
| Continuing operations | |
| Continuing operations | |
| Continuing operations | Continuing operations | $ | (0.32) | | | $ | 1.07 | | | $ | 3.50 | |
| Discontinued operations | Discontinued operations | 0 | | | (0.01) | | | 0.30 | |
| $ | (0.32) | | | $ | 1.06 | | | $ | 3.80 | |
| Earnings (loss) per common share attributable to Cliffs shareholders - diluted | | | | | |
| $ | |
| Earnings per common share attributable to Cliffs shareholders - diluted | |
| Continuing operations | |
| Continuing operations | |
| Continuing operations | Continuing operations | $ | (0.32) | | | $ | 1.04 | | | $ | 3.42 | |
| Discontinued operations | Discontinued operations | 0 | | | (0.01) | | | 0.29 | |
| $ | (0.32) | | | $ | 1.03 | | | $ | 3.71 | |
| $ | |
The accompanying notes are an integral part of these consolidated financial statements.
7060 | CLF 2023 FORM 10-K
Statements of Consolidated Comprehensive IncomeSTATEMENTS OF CONSOLIDATED COMPREHENSIVE INCOME
Cleveland-Cliffs Inc. and SubsidiariesCLEVELAND-CLIFFS INC. AND SUBSIDIARIES
| | (In Millions) |
| Year Ended December 31, |
| 2020 | | 2019 | | 2018 |
| Net income (loss) | $ | (81) | | | $ | 293 | | | $ | 1,128 | |
| Year Ended December 31, | | | Year Ended December 31, |
| (In millions) | | (In millions) | 2023 | | 2022 | | 2021 |
| Net income | |
| Other comprehensive income (loss): | Other comprehensive income (loss): | |
| Changes in pension and OPEB, net of tax | Changes in pension and OPEB, net of tax | 181 | | | (35) | | | (17) | |
| Changes in pension and OPEB, net of tax | |
| Changes in pension and OPEB, net of tax | |
| Changes in derivative financial instruments, net of tax | |
| Changes in foreign currency translation | Changes in foreign currency translation | 3 | | | 0 | | | (225) | |
| Changes in derivative financial instruments, net of tax | 2 | | | 0 | | | (3) | |
| Total other comprehensive income (loss) | Total other comprehensive income (loss) | 186 | | | (35) | | | (245) | |
| Comprehensive income | Comprehensive income | 105 | | | 258 | | | 883 | |
| Comprehensive income attributable to noncontrolling interests | Comprehensive income attributable to noncontrolling interests | (41) | | | 0 | | | 0 | |
| Comprehensive income attributable to Cliffs shareholders | Comprehensive income attributable to Cliffs shareholders | $ | 64 | | | $ | 258 | | | $ | 883 | |
The accompanying notes are an integral part of these consolidated financial statements.
7161 | CLF 2023 FORM 10-K
Statements of Consolidated Cash FlowsSTATEMENTS OF CONSOLIDATED CASH FLOWS
Cleveland-Cliffs Inc. and SubsidiariesCLEVELAND-CLIFFS INC. AND SUBSIDIARIES
| | Year Ended December 31, | | | Year Ended December 31, |
| (In millions) | | (In millions) | 2023 | | 2022 | | 2021 |
| OPERATING ACTIVITIES | |
| Net income | |
| Net income | |
| Net income | |
| Adjustments to reconcile net income to net cash provided by operating activities: | |
| Depreciation, depletion and amortization | |
| Depreciation, depletion and amortization | |
| Depreciation, depletion and amortization | |
| Deferred income taxes | |
| Pension and OPEB credits | |
| Goodwill impairment | |
| | Loss on extinguishment of debt | |
| Loss on extinguishment of debt | |
| Loss on extinguishment of debt | |
| Amortization of inventory step-up | |
| | | (In Millions) |
| Other | |
| | Year Ended December 31, |
| Other | |
| | 2020 | | 2019 | | 2018 |
| OPERATING ACTIVITIES | | | | | |
| Net income (loss) | $ | (81) | | | $ | 293 | | | $ | 1,128 | |
| Adjustments to reconcile net income (loss) to net cash provided (used) by operating activities: | |
| Depreciation, depletion and amortization | 308 | | | 85 | | | 89 | |
| Amortization of inventory step-up | 96 | | | 0 | | | 0 | |
| Deferred income taxes | (101) | | | 17 | | | (461) | |
| Loss (gain) on extinguishment of debt | (130) | | | 18 | | | 7 | |
| Loss (gain) on derivatives | (104) | | | 47 | | | (110) | |
| Gain on foreign currency translation | 0 | | | 0 | | | (228) | |
| Other | Other | 11 | | | 66 | | | 21 | |
| Changes in operating assets and liabilities, net of business combination: | Changes in operating assets and liabilities, net of business combination: | |
| Receivables and other assets | (42) | | | 255 | | | 52 | |
| Accounts receivable, net | |
| Accounts receivable, net | |
| Accounts receivable, net | |
| Inventories | Inventories | (146) | | | (136) | | | 44 | |
| Income taxes | |
| Pension and OPEB payments and contributions | Pension and OPEB payments and contributions | (75) | | | (20) | | | (32) | |
| Payables, accrued expenses and other liabilities | 3 | | | (62) | | | (31) | |
| Net cash provided (used) by operating activities | (261) | | | 563 | | | 479 | |
| Payables, accrued employment and accrued expenses | |
| Other, net | |
| Net cash provided by operating activities | |
| INVESTING ACTIVITIES | INVESTING ACTIVITIES | |
| Purchase of property, plant and equipment | Purchase of property, plant and equipment | (525) | | | (656) | | | (296) | |
| Purchase of property, plant and equipment | |
| Purchase of property, plant and equipment | |
| | Acquisition of FPT, net of cash acquired | |
| Acquisition of FPT, net of cash acquired | |
| Acquisition of FPT, net of cash acquired | |
| Acquisition of ArcelorMittal USA, net of cash acquired | Acquisition of ArcelorMittal USA, net of cash acquired | (658) | | | 0 | | | 0 | |
| Acquisition of AK Steel, net of cash acquired | (869) | | | 0 | | | 0 | |
| Other investing activities | Other investing activities | 10 | | | 12 | | | 23 | |
| Net cash used by investing activities | Net cash used by investing activities | (2,042) | | | (644) | | | (273) | |
| FINANCING ACTIVITIES | FINANCING ACTIVITIES | |
| Repurchase of common shares | Repurchase of common shares | 0 | | | (253) | | | (48) | |
| Dividends paid | (41) | | | (72) | | | 0 | |
| Repurchase of common shares | |
| Repurchase of common shares | |
| Series B Redeemable Preferred Stock redemption | |
| Proceeds from issuance of common shares | |
| Proceeds from issuance of debt | Proceeds from issuance of debt | 1,763 | | | 721 | | | 0 | |
| Debt issuance costs | (76) | | | (7) | | | (2) | |
| Repurchase of debt | (1,023) | | | (729) | | | (235) | |
| Repayments of senior notes | |
| Borrowings under credit facilities | Borrowings under credit facilities | 2,060 | | | 0 | | | 0 | |
| Repayments under credit facilities | Repayments under credit facilities | (550) | | | 0 | | | 0 | |
| SunCoke Middletown distributions to noncontrolling interest owners | (61) | | | 0 | | | 0 | |
| Debt issuance costs | |
| Other financing activities | Other financing activities | (13) | | | (54) | | | (91) | |
| Net cash provided (used) by financing activities | 2,059 | | | (394) | | | (376) | |
| Effect of exchange rate changes on cash | 0 | | | 0 | | | (2) | |
| Decrease in cash and cash equivalents, including cash classified within other current assets related to discontinued operations | (244) | | | (475) | | | (172) | |
| Less: decrease in cash and cash equivalents from discontinued operations, classified within other current assets | (3) | | | (5) | | | (17) | |
| Net decrease in cash and cash equivalents | (241) | | | (470) | | | (155) | |
| Net cash used by financing activities | |
| Net increase (decrease) in cash and cash equivalents | |
| Cash and cash equivalents at beginning of year | Cash and cash equivalents at beginning of year | 353 | | | 823 | | | 978 | |
| Cash and cash equivalents at end of year | Cash and cash equivalents at end of year | $ | 112 | | | $ | 353 | | | $ | 823 | |
The accompanying notes are an integral part of these consolidated financial statements.
7262 | CLF 2023 FORM 10-K
Statements of Consolidated Changes in EquitySTATEMENTS OF CONSOLIDATED CHANGES IN EQUITY
Cleveland-Cliffs Inc. and SubsidiariesCLEVELAND-CLIFFS INC. AND SUBSIDIARIES
| | | | | | | | | | | | | | | | | | | | | | | | | | | | | | | | | | | | | | | | | | | | | | | |
| (In Millions) |
| Cliffs Shareholders | | | | |
| Number
of
Common
Shares Outstanding | | Par Value of Common
Shares Issued | | Capital in
Excess of
Par Value
of Shares | | Retained
Deficit | | Common
Shares
in
Treasury | | AOCI
(Loss) | | Non-
controlling
Interest | | Total |
| December 31, 2017 | 297 | | | $ | 37 | | | $ | 3,934 | | | $ | (4,207) | | | $ | (170) | | | $ | (39) | | | $ | 0 | | | $ | (445) | |
| Adoption of accounting standard | — | | | — | | | — | | | 34 | | | — | | | — | | | — | | | 34 | |
| Comprehensive income (loss) | — | | | — | | | — | | | 1,128 | | | — | | | (245) | | | 0 | | | 883 | |
| Stock and other incentive plans | 1 | | | — | | | (17) | | | — | | | 31 | | | — | | | — | | | 14 | |
| Common stock repurchases | (5) | | | — | | | — | | | — | | | (47) | | | — | | | — | | | (47) | |
| Common stock dividends ($0.05 per share) | — | | | — | | | — | | | (15) | | | — | | | — | | | — | | | (15) | |
| December 31, 2018 | 293 | | | $ | 37 | | | $ | 3,917 | | | $ | (3,060) | | | $ | (186) | | | $ | (284) | | | $ | 0 | | | $ | 424 | |
| Comprehensive income (loss) | — | | | — | | | — | | | 293 | | | — | | | (35) | | | 0 | | | 258 | |
| Stock and other incentive plans | 2 | | | — | | | (44) | | | — | | | 48 | | | — | | | — | | | 4 | |
| Common stock repurchases | (24) | | | — | | | — | | | — | | | (253) | | | — | | | — | | | (253) | |
| Common stock dividends ($0.27 per share) | — | | | — | | | — | | | (75) | | | — | | | — | | | — | | | (75) | |
| December 31, 2019 | 271 | | | $ | 37 | | | $ | 3,873 | | | $ | (2,842) | | | $ | (391) | | | $ | (319) | | | $ | 0 | | | $ | 358 | |
| Comprehensive income (loss) | — | | | — | | | — | | | (122) | | | — | | | 186 | | | 41 | | | 105 | |
| Stock and other incentive plans | 2 | | | — | | | (24) | | | — | | | 37 | | | — | | | — | | | 13 | |
| Acquisition of AK Steel | 127 | | | 16 | | | 602 | | | — | | | — | | | — | | | 330 | | | 948 | |
| Acquisition of ArcelorMittal USA | 78 | | | 10 | | | 980 | | | — | | | — | | | — | | | 13 | | | 1,003 | |
| Common stock dividends ($0.06 per share) | — | | | — | | | — | | | (25) | | | — | | | — | | | — | | | (25) | |
| Net distributions to noncontrolling interests | — | | | — | | | — | | | — | | | — | | | — | | | (61) | | | (61) | |
| December 31, 2020 | 478 | | | $ | 63 | | | $ | 5,431 | | | $ | (2,989) | | | $ | (354) | | | $ | (133) | | | $ | 323 | | | $ | 2,341 | |
| | | | | | | | | | | | | | | | | | | | | | | | | | | | | | | | | | | | | | | | | | | | | | | |
| Cliffs Shareholders | | | | |
| (In millions) | Number
of
Common
Shares Outstanding | | Par Value of Common
Shares Issued | | Capital in
Excess of
Par Value
of Shares | | Retained Earnings
(Deficit) | | Common
Shares
in
Treasury | | AOCI
(Loss) | | Non-
controlling
Interests | | Total |
| December 31, 2020 | 477.5 | | | $ | 63 | | | $ | 5,431 | | | $ | (2,989) | | | $ | (354) | | | $ | (133) | | | $ | 323 | | | $ | 2,341 | |
| Comprehensive income | — | | | — | | | — | | | 2,988 | | | — | | | 751 | | | 45 | | | 3,784 | |
| Issuance of common shares | 20.0 | | | — | | | 78 | | | — | | | 244 | | | — | | | — | | | 322 | |
| Stock and other incentive plans | 2.6 | | | — | | | (8) | | | — | | | 28 | | | — | | | — | | | 20 | |
| Series B Redeemable Preferred Stock redemption | — | | | — | | | (604) | | | — | | | — | | | — | | | — | | | (604) | |
| 1.500% 2025 Convertible Senior Notes redemption | — | | | — | | | (5) | | | — | | | — | | | — | | | — | | | (5) | |
| Acquisition of ArcelorMittal USA - Measurement period adjustments | — | | | — | | | — | | | — | | | — | | | — | | | (22) | | | (22) | |
| Net distributions to noncontrolling interests | — | | | — | | | — | | | — | | | — | | | — | | | (62) | | | (62) | |
| December 31, 2021 | 500.1 | | | 63 | | | 4,892 | | | (1) | | | (82) | | | 618 | | | 284 | | | 5,774 | |
| Comprehensive income | — | | | — | | | — | | | 1,335 | | | — | | | 1,212 | | | 41 | | | 2,588 | |
| Stock and other incentive plans | 1.5 | | | — | | | 7 | | | — | | | 12 | | | — | | | — | | | 19 | |
| 1.500% 2025 Convertible Senior Notes redemption | 24.2 | | | 3 | | | (28) | | | — | | | — | | | — | | | — | | | (25) | |
| Common share repurchases | (12.5) | | | — | | | — | | | — | | | (240) | | | — | | | — | | | (240) | |
| Net distributions to noncontrolling interests | — | | | — | | | — | | | — | | | — | | | — | | | (74) | | | (74) | |
| December 31, 2022 | 513.3 | | | 66 | | | 4,871 | | | 1,334 | | | (310) | | | 1,830 | | | 251 | | | 8,042 | |
| Comprehensive income (loss) | — | | | — | | | — | | | 399 | | | — | | | (173) | | | 51 | | | 277 | |
| | | | | | | | | | | | | | | |
| Stock and other incentive plans | 2.0 | | | — | | | (10) | | | — | | | 33 | | | — | | | — | | | 23 | |
| Common share repurchases, net of excise tax | (10.4) | | | — | | | — | | | — | | | (153) | | | — | | | — | | | (153) | |
| Net distributions to noncontrolling interests | — | | | — | | | — | | | — | | | — | | | | | (67) | | | (67) | |
| December 31, 2023 | 504.9 | | | $ | 66 | | | $ | 4,861 | | | $ | 1,733 | | | $ | (430) | | | $ | 1,657 | | | $ | 235 | | | $ | 8,122 | |
The accompanying notes are an integral part of these consolidated financial statements.
7363 | CLF 2023 FORM 10-K
Notes to Consolidated Financial StatementsNOTES TO CONSOLIDATED FINANCIAL STATEMENTS
Cleveland-Cliffs Inc. and SubsidiariesCLEVELAND-CLIFFS INC. AND SUBSIDIARIES
NOTE 1 - BASIS OF PRESENTATION AND SIGNIFICANT ACCOUNTING POLICIES
Business, Consolidation and PresentationBUSINESS, CONSOLIDATION AND PRESENTATION
Nature of BusinessNATURE OF BUSINESS
Cliffs isWe are the largest flat-rolled steel producer in North America. Founded in 1847 as a mine operator, we are also the largest producermanufacturer of iron ore pellets in North America. In 2020, we acquired two major steelmakers, AK SteelWe are vertically integrated from mined raw materials, direct reduced iron and ArcelorMittal USA, vertically integratingferrous scrap to primary steelmaking and downstream finishing, stamping, tooling and tubing. We are the largest supplier of steel to the automotive industry in North America and serve a diverse range of other markets due to our legacy iron ore business. Our fully-integrated portfolio includes custom-made pellets and HBI;comprehensive offering of flat-rolled carbon steel stainless, electrical, plate, tinplate and long steel products; as well as carbon and stainless steel tubing, hot and cold stamping and tooling.products. Headquartered in Cleveland, Ohio, we employ approximately 25,00028,000 people across our mining, steel and downstream manufacturing operations in the United States and Canada.Canada, of which approximately 20,000 were represented by labor unions under various agreements. More than 90% of our hourly workforce is represented by three prominent unions - USW, UAW and IAM.
Unless otherwise noted, discussion of our business and results of operations in this Annual Report on Form 10-K refers to our continuing operations.
Acquisition of AK Steel
On March 13, 2020, we consummated the AK Steel Merger, pursuant to which, upon the terms and subject to the conditions set forth in the AK Steel Merger Agreement, Merger Sub was merged with and into AK Steel, with AK Steel surviving the AK Steel Merger as a wholly owned subsidiary of Cleveland-Cliffs Inc. Refer to NOTE 3 - ACQUISITIONS for further information.
AK Steel is a North American producer of flat-rolled carbon, stainless and electrical steel products, primarily for the automotive, infrastructure and manufacturing markets. These operations consist primarily of seven steelmaking and finishing plants, two cokemaking operations, three tube manufacturing plants and ten tooling and stamping operations. The acquisition of AK Steel transformed us into a vertically integrated producer of value-added iron ore and steel products.
Acquisition of ArcelorMittal USA
On December 9, 2020, pursuant to the terms of the AM USA Transaction Agreement, we purchased ArcelorMittal USA from ArcelorMittal. In connection with the closing of the AM USA Transaction, as contemplated by the terms of the AM USA Transaction Agreement, ArcelorMittal’s former joint venture partner in Kote and Tek exercised its put right pursuant to the terms of the Kote and Tek joint venture agreements. As a result, we purchased all of such joint venture partner’s interests in Kote and Tek. Following the closing of the AM USA Transaction, we own 100% of the interests in Kote and Tek.
The assets of ArcelorMittal USA we acquired at the closing of the AM USA Transaction include six steelmaking facilities, eight finishing facilities, three cokemaking operations, two iron ore mining and pelletizing operations and one coal mining complex.
Refer to NOTE 3 - ACQUISITIONS for further information.
Business OperationsBUSINESS OPERATIONS
We are vertically integrated from the mining of iron ore and coal; to production of metallics and coke; through iron making, steelmaking, rolling and finishing; and to downstream tubular components, stamping and tooling. We have the unique advantage as a steel producer of being fully or partially self-sufficient with our production of raw materials for steel manufacturing, which includes iron ore pellets, HBI and coking coal.
We have updated our segment structure to coincide with our new business model and are organized into four operating segments based on differentiated products, Steelmaking, Tubular, Tooling and Stamping and European Operations. Through the third quarter ended September 30, 2020, we had operated through two reportable segments – the Steel and Manufacturing segment and the Mining and Pelletizing segment. However, given the recent
transformation of the business, beginning with our financial statements as of and for the year ended December 31, 2020, weWe primarily operate through one reportable segment – the Steelmaking segment.
COVID-19
In response to the COVID-19 pandemic, we made various operational changes to adjust to the demand for our products. Although steel and iron ore production have been considered “essential” by the states in which we operate, certain of our facilities and construction activities were temporarily idled during the second quarter of 2020. Most of these temporarily idled facilities were restarted during the second quarter, and the remaining operations were restarted during the third quarter. Dearborn Works' hot strip mill, anneal and temper operations and AK Coal remain permanently idled as part of the permanent cost reduction efforts. Our Columbus and Monessen facilities acquired through the AM USA Transaction are temporarily idled due to the COVID-19 pandemic.
Basis of ConsolidationBASIS OF CONSOLIDATION
The condensed consolidated financial statements consolidate our accounts and the accounts of our wholly owned subsidiaries, all subsidiaries in which we have a controlling interest and VIEs for which we are the primary beneficiary. All intercompany transactions and balances are eliminated upon consolidation.
Investments in AffiliatesINVESTMENTS IN AFFILIATES
We have investments in several businesses accounted for using the equity method of accounting. These investments are included within our Steelmaking segment. We review an investment for impairment when circumstances indicate that a loss in value below its carrying amount is other than temporary. Investees and equity ownership percentages are presented below:
| | | | | | | | |
Investee | | Equity Ownership Percentage |
Combined Metals of Chicago, LLC | | 40.0% |
Spartan Steel Coating, LLC | | 48.0% |
As of December 31, 2019, our 23% ownership in Hibbing was recorded as an equity method investment. As a result of the acquisition of ArcelorMittal USA, we acquired an additional 62.3% ownership interest in Hibbing. As of December 31, 2020, our ownership in the Hibbing joint venture was 85.3% and was fully consolidated within our operating results with a noncontrolling interest.
We recorded a basis difference for Spartan Steel of $33 million as part of the AK Steel Merger. The basis difference relates to the excess of the fair value over the investee's carrying amount of property, plant and equipment and will be amortized over the remaining useful lives of the underlying assets.
As of December 31, 2020, ourOur investment in affiliates of $105$123 million and $133 million as of December 31, 2023 and 2022, respectively, was classified in Other non-current assets. As of December 31, 2019, our investment in affiliates of $18 million was classified in Other non-current liabilities.assets.
Significant Accounting PoliciesSIGNIFICANT ACCOUNTING POLICIES
We consider the following policies to be beneficial in understanding the judgments involved in the preparation of our consolidated financial statements and the uncertainties that could impact our financial condition, results of operations and cash flows. Certain prior period amounts have been reclassified to conform with the current year presentation.
Use of EstimatesUSE OF ESTIMATES
The preparation of financial statements in conformity with GAAP requires management to make estimates and assumptions that affect the reported amounts of assets and liabilities and disclosure of contingent assets and liabilities at the date of the financial statements and the reported amounts of revenues and expenses during the reporting period. Our mineral reserves; future realizable cash flow; environmental, reclamation and closure obligations; valuation of business combinations, goodwill, long-lived assets, inventory, tax assets and post-employment, post-retirement and other employee benefit liabilities; reserves for contingencies and litigation require the use of various management estimates and assumptions. Actual results could differ from estimates. Management reviews its estimates on an ongoing basis. Changes in facts and circumstances may alter such estimates and affect the results of operations and financial position in future periods.
Business CombinationsBUSINESS COMBINATIONS
Assets acquired and liabilities assumed in a business combination are recognized and measured based on their estimated fair values at the acquisition date, while the acquisition-related costs are expensed as incurred. Any excess of the purchase consideration when compared to the fair value of the net tangible and intangible assets acquired if any, is recorded as goodwill. We engaged independent valuation specialists to assist with the determination of the fair value of assets acquired, liabilities assumed, noncontrolling interest, and goodwill, for the Acquisitions.acquisitions. If the initial accounting for the business combination is incomplete by the end of the reporting period in which the acquisition occurs, an estimate will be recorded. Subsequent to the acquisition date, and not later than one year from the acquisition date, we will record any material adjustments to the initial estimate based on new information obtained that would have existed as of the date of the acquisition. Any adjustment that arises from information obtained that did not exist as of the date of the acquisition will be recorded in the period the adjustment arises.
Cash and Cash EquivalentsCASH AND CASH EQUIVALENTS
Cash and cash equivalents include cash on hand and on deposit as well as all short-term securities held for the primary purpose of general liquidity. We consider investments in highly liquid debt instruments with an original maturity of three months or less from the date of acquisition and longer maturities when funds can be withdrawn in three months or less without a significant penalty to be cash equivalents. We routinely monitor and evaluate counterparty credit risk related to the financial institutions in which our short-term investment securities are held. Where right of offset exists, we report cash balances net.
Trade Accounts Receivable and Allowance for Credit Loss
TRADE ACCOUNTS RECEIVABLE AND ALLOWANCE FOR CREDIT LOSS
Trade accounts receivable are recorded at the point control transfers and represent the amount of consideration we expect to receive in exchange for transferred goods and do not bear interest. We establish provisions for expected lifetime losses on accounts receivable at the time a receivable is recorded based on historical experience, customer credit quality and forecasted economic conditions. We regularly review our accounts receivable balances and the allowance for credit loss and establish or adjust the allowance as necessary using the specific identification method in accordance with CECL.method. We evaluate the aggregation and risk characteristics of receivable pools and develop loss rates that reflect historical collections, current forecasts of future economic conditions over the time horizon we are exposed to credit risk, and payment terms or conditions that may materially affect future forecasts.
InventoriesINVENTORIES
Inventories are generally stated at the lower of cost or net realizable value using average cost, excluding depreciation and amortization. Certain iron ore inventories are stated at the lower of cost or market using the LIFO method.
Refer to NOTE 2 - SUPPLEMENTARYDERIVATIVE FINANCIAL STATEMENT INFORMATION for further information.
Derivative Financial Instruments and Hedging ActivitiesINSTRUMENTS AND HEDGING ACTIVITIES
We are exposed to certain risks related to the ongoing operations of our business, including those caused by changes in commodity prices and energy rates. We have established policies and procedures, including the use of certain derivative instruments, to manage such risks, if deemed necessary.risks.
Derivative financial instruments are recognized as either assets or liabilities inon the Statements of Consolidated Financial Position and measured at fair value. On the date a qualifying hedging instrument is executed, we designate the hedging instrument as a hedge of the variability of cash flows to be received or paid related to a forecasted transaction (cash flow hedge). We formally document all relationships between hedging instruments and hedged items, as well as our risk-management objective and strategy for undertaking various hedge transactions. This process includes linking all derivatives that are designated as cash flow hedges to specific firm commitments or forecasted transactions. We also formally assess, both at the hedge's inception and on an ongoing basis, whether the derivatives that are used in hedging transactions are highly effective in offsetting changes in cash flows of the related hedged items. When it is determined that a derivative is not highly effective as a hedge, we discontinue hedge accounting prospectively and record all future changes in fair value in the period of the instrument's earnings or losses.
For derivative instruments that have been designated as cash flow hedges, the changes in fair value are recorded in Accumulated other comprehensive lossincome. Amounts recorded in Accumulated other comprehensive lossincome are
reclassified to earnings or losses in the period the underlying hedged transaction affects earnings or when the underlying hedged transaction is no longer reasonably possible of occurring. The cash flows resulting from these derivative instruments are classified in Other, net in operating activities on the Statements of Consolidated Cash Flows.
For derivative instruments that have not been designated as cash flow hedges, such as provisional pricing arrangements, changes in fair value are recorded in the period of the instrument's earnings or losses.
Refer to Revenue Recognition below for discussion of derivatives recorded as a result of pricing terms in our sales contracts. Additionally, refer to NOTE 15 - DERIVATIVE INSTRUMENTS for further information.
Property, Plant and EquipmentPROPERTY, PLANT AND EQUIPMENT
Our properties are stated at the lower of cost less accumulated depreciation. Depreciation of plant and equipment is computed principally by the straight-line method based on estimated useful lives. Depreciation continues to be recognized when operations are idled temporarily. Depreciation and depletion are recorded over the following estimated useful lives:
| | | | | | | | | | | | | | |
| Asset Class | | Basis | | Life |
| Land, land improvements and mineral rights | | | | |
| Land and mineral rights | | Units of production | | Life of mine |
| Land improvements | | Straight line | | 20 to 45 years |
| Buildings | | Straight line | | 20 to 45 years |
| Equipment | | Straight line/Double declining balance | | 3 to 2045 years |
Refer to NOTE 6 - PROPERTY, PLANT AND EQUIPMENT for further information.
GoodwillGOODWILL
Goodwill represents the excess purchase price paid over the fair value of the net assets duringfrom an acquisition. Goodwill is not amortized butfor financial statement purposes. Goodwill is assessedtested on a qualitative or quantitative basis for impairment at the reporting unit level on an annual basis on October 1 (orand between annual tests if an event occurs or circumstances change that would more frequentlylikely than not reduce the fair value of a reporting unit below its carrying value. We have an unconditional option to bypass the qualitative test for any reporting unit in any period and proceed directly to performing the quantitative test. Should our qualitative test indicate that it is more likely than not that the fair value of a reporting unit is less than its carrying value, we perform a quantitative test to determine the amount of impairment, if necessary).any, to the carrying value of the reporting unit and its associated goodwill.
Other Intangible Assets and LiabilitiesOTHER INTANGIBLE ASSETS AND LIABILITIES
Intangible assets and liabilities are subject to periodic amortization on a straight-line basis over their estimated useful lives as follows:lives.
| | | | | | | | | | | | | | |
Type | | Basis | | Useful Life |
Intangible assets: | | | | |
Customer relationships | | Straight line | | 18 years |
Developed technology | | Straight line | | 17 years |
Trade names and trademarks | | Straight line | | 10 years |
Mining permits | | Straight line | | Life of mine |
Intangible liabilities: | | | | |
Above-market supply contracts | | Straight line | | Contract term |
Refer to NOTE 7 - GOODWILL AND INTANGIBLE ASSETS AND LIABILITIES for further information.
LeasesLEASES
We determine if an arrangement contains a lease at inception. We recognize right-of-use assets and lease liabilities associated with leases based on the present value of the future minimum lease payments over the lease term at the commencement date.
Lease terms reflect options to extend or terminate the lease when it is reasonably certain that the option will be exercised. For short-termShort-term leases (leases with an initial lease term of 12 months or less), right-of-use assets and lease liabilities are not recognized inon the consolidated balance sheet, andStatements of Consolidated Financial Position. Operating lease expense is recognized on a straight-line basis over the lease term.
Refer to NOTE 13 - LEASE OBLIGATIONS for further information.
Asset ImpairmentASSET IMPAIRMENT
We monitor conditions that may affect the carrying value of our long-lived tangible and intangible assets when events and circumstances indicate that the carrying value of the asset groups may not be recoverable. In order to determine if assets have been impaired, assets are grouped and tested at the lowest level for which identifiable, independent cash flows are available ("asset group"). The measurement of the impairment loss to be recognized is based on the difference between the fair value and the carrying value of the asset group. Fair value can be determined using a market approach, income approach or cost approach.
For the years ended December 31, 2020, 2019 and 2018, no impairment indicators were present that would indicate the carrying value of any of our asset groups may not be recoverable; as a result, no impairment assessments were required.
Fair Value MeasurementsFAIR VALUE MEASUREMENTS
ASC Topic 820, Fair Value Measurements and Disclosures, establishes a three-level valuation hierarchy for classification of fair value measurements. The valuation hierarchy is based upon the transparency of inputs to the valuation of an asset or liability as of the measurement date. Inputs refer broadly to the assumptions that market participants would use in pricing an asset or liability. Inputs may be observable or unobservable. Observable inputs are inputs that reflect the assumptions market participants would use in pricing the asset or liability developed based on market data obtained from independent sources. Unobservable inputs are inputs that reflect our own views about the assumptions market participants would use in pricing the asset or liability developed based on the best information available in the circumstances. The three-tier hierarchy of inputs is summarized below:
•Level 1 — Valuation is based upon quoted prices (unadjusted) for identical assets or liabilities in active markets.
•Level 2 — Valuation is based upon quoted prices for similar assets and liabilities in active markets, or other inputs that are observable for the asset or liability, either directly or indirectly, for substantially the full term of the financial instrument.
•Level 3 — Valuation is based upon other unobservable inputs that are significant to the fair value measurement.
The classification of assets and liabilities within the valuation hierarchy is based upon the lowest level of input that is significant to the fair value measurement in its entirety.
Refer to NOTE 9 - FAIR VALUE OF FINANCIAL INSTRUMENTS and NOTE 10 - PENSIONSPENSION AND OTHER POSTRETIREMENT BENEFITS for further information.
Pensions and Other Postretirement Benefits
We offer defined benefit pension plans, defined contribution pension plans and OPEB plans, primarily consisting of retiree healthcare benefits as part of our total compensation and benefits programs.
We recognize the funded or unfunded status of our pension and OPEB obligations on our December 31, 2020 and 2019the Statements of Consolidated Financial Position based on the difference between the market value of plan assets and the actuarial present value of our retirement obligations on that date, on a plan-by-plan basis. If the plan assets exceed the pension and OPEB obligations, the amount of the surplus is recorded as an asset; if the pension and OPEB obligations exceed the plan assets, the amount of the underfunded obligations is recorded as a liability. Year-end balance sheet adjustments to pension and OPEB assets and obligations are recorded as Accumulated other comprehensive lossincome inon the Statements of Consolidated Financial Position.
The actuarial estimates of the PBO (Projected benefit obligation) and APBO (Accumulated postretirement benefit obligation) incorporate various assumptions including the discount rates, the rates of increases in compensation, healthcare cost trend rates, mortality, retirement timing, employee turnover and employee turnover.other demographic assumptions. The discount rate is determined based on the prevailing year-end rates for high-grade corporate bonds with a duration matching the expected cash flow timing of the benefit payments from the various plans. The remaining assumptions are based on our estimates of future events by incorporating historical trends and future expectations. The amount of net periodic cost that is recorded in the Statements of Consolidated Operations consists of several components including service cost, interest cost, expected return on plan assets, and amortization of previously unrecognized amounts. Service cost represents the value of the benefits earned in the current year by the participants. Interest cost represents the cost associated with the passage of time. Certain items, such as plan amendments, gains and/or losses resulting from differences between actual and assumed results for demographic
and economic factors affecting the obligations and assets of the plans, and changes in other assumptions are subject to deferred recognition for income and expense purposes. The expected return on plan assets is determined utilizing the weighted average ofcalculated on a plan-by-plan basis using each plan's strategic asset allocation and our expected returns for plan asset investments in various asset categories based on historical performance, adjusted for current trends.long-term capital market return assumptions. Service costs are classified within Cost of goods sold, Selling, general and administrative expenses and Miscellaneous – net while the interest cost, expected return on assets, amortization of prior service costs/credits, net actuarial gain/loss, and other costs are classified within Other non-operating income.Net periodic benefit credits other than service cost component.
ReferCumulative actuarial gains and losses will be amortized to NOTE 10 - PENSIONS AND OTHER POSTRETIREMENT BENEFITS for further information.expense using the corridor method, where gains and losses are recognized if they exceed 10% of the greater of the fair value of plan assets or the plans' benefit obligations. The amortization period varies by plan.
Labor AgreementsASSET RETIREMENT OBLIGATIONS
At December 31, 2020, we employed approximately 25,000 people, of which approximately 18,500 were represented by labor unions under various agreements. We have agreements that will expire at five locations in 2021 and sixteen locations in 2022. Workers at some of our North American facilities are covered by agreements with the USW or other unions that have various expiration dates.
Asset Retirement Obligations
AssetAn asset retirement obligations areobligation is recognized when incurred if a reasonable estimate of fair value can be made, and recorded as liabilitiesis initially measured at fair value. The fair value of the liability is determined as the discounted value of the expected future cash flows. The asset retirement obligation is accreted over time through periodic charges to earnings. In addition, the asset retirement cost is capitalized and amortized over the life of the related asset. Reclamation costs are adjusted periodically to reflect changes in the estimated present value resulting from the passage of time and revisions to the estimates of either the timing or amount of the reclamation costs. We review, on an annual basis, unless otherwise deemed necessary, the asset retirement obligation for each
applicable operation in accordance with the provisions of ASC Topic 410, Asset Retirement and Environmental Obligations. We perform an in-depth evaluation of the liability every three years in addition to our routine annual assessments.
Future reclamation costs for inactive operations are accrued based on management’s best estimate at the end of each period of the costs expected to be incurred at a site. Such cost estimates include, where applicable, ongoing maintenance and monitoring costs. Changes in estimates at inactive operations are reflected in earningsMiscellaneous – net on the Statements of Consolidated Operations in the period an estimate is revised.
Refer to NOTE 14 - ASSET RETIREMENT OBLIGATIONS for further information.ENVIRONMENTAL REMEDIATION COSTS
Environmental Remediation Costs
We have a formal policy for environmental protection and restoration. Certain of ourOur operating activities are subject to various laws and regulations governing protection of the environment. We conduct our operations to protect the public health and environment and believe our operations are in compliance with applicable laws and regulations in all material respects. Our environmental liabilities, including obligations for known environmental remediation exposures, have been recognized based on the estimated cost of investigation and remediation at each site. If the cost can only be estimated as a range of possible amounts with no point in the range being more likely, the minimum of the range is accrued. Future expenditures are discounted unless the amount and timing of the cash disbursements cannot be reasonably estimated. It is possible that additional environmental obligations could be incurred, the extent of which cannot be assessed. Potential insurance recoveries have not been reflected in the determination of the liabilities.
Refer to NOTE 21 - COMMITMENTS AND CONTINGENCIES for further information.
Revenue RecognitionREVENUE RECOGNITION
Sales are recognized when our performance obligations are satisfied. Generally, our performance obligations are satisfied, control of our products is transferred and revenue is recognized at a single point in time, when title transfers to our customer for product shipped according to shipping terms. Shipping and other transportation costs charged to customers are treated as fulfillment activities and are recorded in both revenue and cost of sales at the time control is transferred to the customer. Refer to NOTE 4 - REVENUES for further information.
Repairs and MaintenanceREPAIRS AND MAINTENANCE
Repairs, maintenance and replacement of components are expensed as incurred. The cost of major equipment overhauls is capitalized and depreciated over the estimated useful life, which is the period until the next scheduled overhauls. All other planned and unplanned repairs and maintenance costs are expensed when incurred.
Share-Based Compensation
The fair value of each performance share grant is estimated on the date of grant using a Monte Carlo simulation to forecast relative TSR performance. A correlation matrix of historical and projected stock prices was developed for both the Company and its predetermined peer group of mining and metals companies. The fair value assumes that the performance objective will be achieved. The expected term of the grant represents the time from the grant date to the end of the service period. We estimate the volatility of our common shares and that of the peer group of mining and metals companies using daily price intervals for all companies. The risk-free interest rate is the rate at the grant date on zero-coupon government bonds, with a term commensurate with the remaining performance period.
The fair value of the restricted stock units is determined based on the closing price of our common shares on the grant date.
Upon vesting of share-based compensation awards, we issue shares from treasury shares before issuing new shares. Forfeitures are recognized when they occur.
The fair value of stock options is estimated on the date of grant using a Black-Scholes model using the grant date price of our common shares and option exercise price, and assumptions regarding the option’s expected term, the volatility of our common shares, the risk-free interest rate, and the dividend yield over the option’s expected term.
Refer to NOTE 11 - STOCK COMPENSATION PLANS for additional information.
Income TaxesINCOME TAXES
Income taxes are based on income for financial reporting purposes, calculated using tax rates by jurisdiction, and reflect a current tax liability or asset for the estimated taxes payable or recoverable on the current year tax return and expected annual changes in deferred taxes. Any interest or penalties on income tax are recognized as a component of Income tax benefit (expense)expense.
We account for income taxes under the asset and liability method, which requires the recognition of deferred tax assets and liabilities for the expected future tax consequences of events that have been included in the financial statements. Under this method, deferred tax assets and liabilities are determined based on the differences between the financial statement and tax basis of assets and liabilities using enacted tax rates in effect for the year in which the differences are expected to reverse. The effect of a change in tax rates on deferred tax assets and liabilities is recognized within Net income (loss) in the period that includes the enactment date.
We record net deferred tax assets to the extent we believe these assets will more likely than not be realized. In making such determination, we consider all available positive and negative evidence, including scheduled reversals of deferred tax liabilities, projected future taxable income, tax planning strategies and recent financial results of operations.
Accounting for uncertainty in income taxes recognized in the financial statements requires that a tax benefit from an uncertain tax position be recognized when it is more likely than not that the position will be sustained upon examination, including resolutions of any related appeals or litigation processes, based on technical merits.
See NOTE 12 - INCOME TAXES for further information.
Discontinued Operations
During 2018, we committed to a course of action leading to the permanent closure of the Asia Pacific Iron Ore mining operations and sold all of the assets of our Asia Pacific Iron Ore business through a series of sales to third parties. As a result of our exit, management determined that our Asia Pacific Iron Ore mining operations met the criteria to be classified as held for sale and a discontinued operation under ASC Topic 205, Presentation of Financial
Statements. As such, all current and historical Asia Pacific Iron Ore operating results are classified within discontinued operations.
Foreign CurrencyFOREIGN CURRENCY
Our financial statements are prepared with the U.S. dollar as the reporting currency, and the functional currency of all subsidiaries is the U.S. dollar, except for our European Operations for which the functional currency is the Euro. In August 2018, management determined that there were significant changes in economic factors related to our Australian subsidiaries. The change in economic factors was a result of the sale and conveyance of substantially all assets and liabilities of our Australian subsidiaries to third parties, representing a significant change in operations. As such, the functional currency for the Australian subsidiaries changed from the Australian dollar to the U.S. dollar and all remaining Australian denominated monetary balances will be remeasured prospectively through the Statements of Consolidated Operations.
As a result of the liquidation of the Australian subsidiaries' assets, the historical impact of foreign currency translation recorded in Accumulated other comprehensive loss in the Statements of Consolidated Financial Position of $228 million was reclassified and recognized as a gain in Income (loss) from discontinued operations, net of tax in the Statements of Consolidated Operations for the year ended December 31, 2018.
Earnings Per ShareEARNINGS PER SHARE
We present both basic and diluted EPS amounts for continuing operations and discontinued operations. Total basic EPS amounts are calculated by dividing Net income (loss) attributable to Cliffs shareholders, less the earnings allocated to any of our outstanding Series B Participating Redeemable Preferred Stock, by the weighted average number of common shares outstanding during the period presented.
Total diluted EPS amounts are calculated by dividing Net income (loss) attributable to Cliffs shareholders by the weighted average number of common shares, common share equivalents under stock plans using the treasury-stock method, common share equivalents of the Series B Participating Redeemable Preferred Stock using the if-converted method and the calculated common share equivalents in excess of the conversion rate related to our 1.50%1.500% 2025 Convertible Senior Notes using the treasury-stock method. Common share equivalents are excluded from EPS computations in the periods in which they have an anti-dilutive effect.
See NOTE 8 - DEBT AND CREDIT FACILITIESand NOTE 20 - EARNINGS PER SHARE for further information.
Variable Interest EntitiesVARIABLE INTEREST ENTITIES
We assess whether we have a variable interest in legal entities in which we have a financial relationship and, if so, whether or not those entities are VIEs. A VIE is an entity with insufficient equity at risk for the entity to finance its activities without additional
subordinated financial support or in which equity investors lack the characteristics of a controlling financial interest. If an entity is determined to be a VIE, we evaluate whether we are the primary beneficiary. The primary beneficiary analysis is a qualitative analysis based on power and economics. We conclude that we are the primary beneficiary and consolidate the VIE if we have both (i) the power to direct the activities of the VIE that most significantly influence the VIE's economic performance and (ii) the obligation to absorb losses of, or the right to receive benefits from, the VIE that could potentially be significant to the VIE. Refer to NOTE 19 - VARIABLE INTEREST ENTITIES for additional information.
Recent Accounting PronouncementsRECENT ACCOUNTING PRONOUNCEMENTS AND LEGISLATION
Issued and Adopted
On March 2, 2020, the SEC issued a final rule that amended the disclosure requirements related to certain registered securities under SEC Regulation S-X, Rule 3-10, which required separate financial statements for subsidiary issuers and guarantors of registered debt securities unless certain exceptions are met. The final rule replaces the previous requirement under Rule 3-10 to provide condensed consolidating financial information in the registrant’s financial statements with a requirement to provide alternative financial disclosures (which include summarized financial information of the parent and any issuers and guarantors, as well as other qualitative disclosures) in either the registrant’s Management's Discussion and Analysis of Financial Condition and Results of Operations or its financial statements, in addition to other simplifications. The final rule is effective for filings on or after January 4, 2021, and early adoption is permitted. We elected to early adopt this disclosure update for the period ended March 31, 2020. As a result, we have excluded the footnote disclosures required under the previous Rule 3-10, and applied the final rule by including the summarized financial information and qualitative disclosures in Part II -
Item 7. Management's Discussion and Analysis of Financial Condition and Results of Operations of this Annual Report on Form 10-K and Exhibit 22, filed herewith.ACCOUNTING PRONOUNCEMENTS
In February 2016,September 2022, the FASB issued ASU No. 2016-02, Leases (Topic 842)2022-04, Liabilities - Supplier Finance Programs (Subtopic 405-50): Disclosure of Supplier Finance Program Obligations. This guidance requires annual and interim disclosure of the key terms of outstanding supplier finance programs and a roll-forward of the related obligations. The new standard requires lessees to recognize a right-of-use asset and a lease liability ondoes not affect the balance sheet for all leases except for short-term leases. For lessees, leases are classified as either operatingrecognition, measurement or financial statement presentation of the supplier finance leases.program obligations. We have adopted this standard, on its effective date of January 1, 2019 using the optional alternative approach, which requires application of the new guidance at the beginning of the standard's effective date. Adoption of the updated standard did not have a material effect on our consolidated financial statements.
In June 2016, the FASB issued ASU No. 2016-13, Financial Instruments-Credit Losses (Topic 326), which introduces a new accounting model, CECL. CECL requires earlier recognition of credit losses, while also providing additional transparency about credit risk. CECL utilizes a lifetime expected credit loss measurement objectiveexcept for the recognition of credit losses at the time the financial asset is originated or acquired. The expected credit losses are adjusted each period for changes in expected lifetime credit losses. We elected to early adopt this standard on December 31, 2019. Upon adoption, the updated standard did not have a material effect on our consolidated financial statements.
Issued and Not Effective
In August 2020, the FASB issued ASU 2020-06, Debt—Debt with Conversion and Other Options (Subtopic 470-20) and Derivatives and Hedging—Contracts in Entity’s Own Equity (Subtopic 815-40). This update requires certain convertible instruments to be accounted for as a single liability measured at its amortized cost. Additionally, the update requires the use of the "if-converted" method, removing the treasury stock method, when calculating diluted shares. The two methods of adoption are the full and modified retrospective approaches. We expect to utilize the modified retrospective approach. Using this approach, the guidance shall be applied to transactions outstanding as of the beginning of the fiscal year inroll-forward information, which the amendment is adopted. The final rule is effective for fiscal years beginning after December 15, 2021. Early adoption is permitted31, 2023. Refer to NOTE 2 - SUPPLEMENTARY FINANCIAL STATEMENT INFORMATION for further information.
In November 2023, the FASB issued ASU No. 2023-07, Segment Reporting (Topic 280): Improvements to Reportable Segment Disclosures. This guidance requires additional annual and interim disclosures for reportable segments. This new standard does not affect the recognition, measurement or financial statement presentation. The amendments are effective for fiscal years beginning after December 15, 2020, including2023, and interim periods within those fiscal years. Weyears beginning after December 15, 2024.
In December 2023, the FASB issued ASU No. 2023-09, Income Taxes (Topic 740): Improvements to Income Tax Disclosures. This guidance requires additional annual and interim disclosures for income taxes. This new standard does not affect the recognition, measurement or financial statement presentation. The amendments are continuing to evaluateeffective for fiscal years beginning after December 15, 2024.
LEGISLATION
In August 2022, the impactU.S. government signed the Inflation Reduction Act into law. The Inflation Reduction Act introduced, among other legislation, a 1% excise tax on the fair market value of this updatestock repurchases net of the fair market value of stock issuances during the tax year and a 15% U.S. corporate alternative minimum tax on adjusted financial statement income. The excise tax and corporate alternative minimum tax, both of which are immaterial to our consolidated financial statements, are effective on transactions occurring after December 31, 2022. The excise tax is recorded in equity as a cost of common shares in treasury. In addition, a 15% global minimum corporate tax under Pillar Two of the Organization for Economic Cooperation and would expectDevelopment’s Global Anti-Base Erosion Rules has been adopted by the European Union requiring its Member States to adopt at the required adoption date of January 1, 2022.implement national legislation applicable for fiscal years starting on or after December 31, 2023. This global minimum corporate tax is expected to be immaterial to our 2024 financial statements.
NOTE 2 - SUPPLEMENTARY FINANCIAL STATEMENT INFORMATION
Allowance for Credit LossesALLOWANCE FOR CREDIT LOSSES
The following is a roll-forward of our allowance for credit losses associated with Accounts receivable, net:
| | (In Millions) |
| 2020 | | 2019 |
| (In millions) | | (In millions) | 2023 | | 2022 |
| Allowance for credit losses as of January 1 | Allowance for credit losses as of January 1 | $ | 0 | | | $ | 0 | |
| Increase in allowance | Increase in allowance | (5) | | | 0 | |
| Allowance for credit losses as of December 31 | Allowance for credit losses as of December 31 | $ | (5) | | | $ | 0 | |
InventoriesINVENTORIES
The following table presents the detail of our Inventories inon the Statements of Consolidated Financial Position:
| | | | | | | | | | | |
| (In Millions) |
| Year Ended December 31, |
| 2020 | | 2019 |
| Product inventories | | | |
| Finished and semi-finished goods | $ | 2,125 | | | $ | 114 | |
| Work-in-process | 0 | | | 69 | |
| Raw materials | 1,431 | | | 9 | |
| Total product inventories | 3,556 | | | 192 | |
| Manufacturing supplies and critical spares | 272 | | | 125 | |
| Inventories | $ | 3,828 | | | $ | 317 | |
| | | | | | | | | | | |
| December 31, |
| (In millions) | 2023 | | 2022 |
| Product inventories | | | |
| Finished and semi-finished goods | $ | 2,573 | | | $ | 2,971 | |
| | | |
| Raw materials | 1,476 | | | 1,794 | |
| Total product inventories | 4,049 | | | 4,765 | |
| Manufacturing supplies and critical spares | 411 | | | 365 | |
| Inventories | $ | 4,460 | | | $ | 5,130 | |
The excess of current cost over LIFO cost of iron ore inventories was $104$131 million and $101$169 million at December 31, 20202023 and 2019,2022, respectively. As of December 31, 2020,2023, the product inventory balance for iron ore inventories increased, resulting in a LIFO increment in 2023. The effect of the inventory build was an increase in Inventories of $21 million on the Statements of Consolidated Financial Position for the year ended December 31, 2023. As of December 31, 2022, the product inventory balance
for iron ore inventories decreased, resulting in thea liquidation of a LIFO layer.layer in 2022. The effect of the inventory reduction was an increase in Cost of goods sold of $30$36 million inon the Statements of Consolidated Operations for the year ended December 31, 2020.2022.
SUPPLY CHAIN FINANCE PROGRAMS
We negotiate payment terms directly with our suppliers for the purchase of goods and services. We currently offer voluntary supply chain finance programs that enable our suppliers to sell their Company receivables to financial intermediaries, at the sole discretion of both the suppliers and financial intermediaries. No guarantees are provided by us or our subsidiaries under the supply chain finance programs. The supply chain finance programs allow our suppliers to be paid by the financial intermediaries earlier than the due date on the applicable invoice. Supply chain finance programs that extend terms or provide us an economic benefit are classified as short-term financings. As of December 31, 2019,2023 and 2022, we had $21 million and $19 million, respectively, deemed as short-term financings that are classified in Other current liabilities. Additionally, as of December 31, 2023 and 2022, we had $91 million and $112 million, respectively, classified as Accounts payable.
SALE OF BUSINESS
On October 6, 2023, we entered into a membership interest purchase agreement for the product inventory balance for iron ore inventories increased, resulting in a LIFO increment in 2019. The effectsale of the inventory build was an increaselegal entities owning, among other things, our closed coal mines in Pennsylvania. As a result of the sale, we recorded a gain of $63 million classified in InventoriesMiscellaneous – net in theStatements of $34 millionConsolidated Operations and as Other in operating activities on the Statements of Consolidated Financial Position forCash Flows. As part of this transaction, we received $35 million in proceeds related to the year ended December 31, 2019.sale that is classified as Other investing activities on the Statements of Consolidated Cash Flows.
The allowance for obsolete and surplus items in supplies and other inventories was $13 million at both December 31, 2020 and 2019.
Cash Flow InformationCASH FLOW INFORMATION
A reconciliation of capital additions to cash paid for capital expenditures is as follows:
| | (In Millions) |
| Year Ended December 31, |
| 2020 | | 2019 | | 2018 |
| Year Ended December 31, | | | Year Ended December 31, |
| (In millions) | | (In millions) | 2023 | | 2022 | | 2021 |
| Capital additions | Capital additions | $ | 483 | | | $ | 690 | | | $ | 395 | |
| Less: | Less: | |
| Non-cash accruals | Non-cash accruals | (86) | | | 15 | | | 94 | |
| Non-cash accruals | |
| Non-cash accruals | |
| Equipment financed with seller | |
| Right-of-use assets - finance leases | Right-of-use assets - finance leases | 44 | | | 29 | | | 8 | |
| Grants | 0 | | | (10) | | | (3) | |
| Cash paid for capital expenditures including deposits | Cash paid for capital expenditures including deposits | $ | 525 | | | $ | 656 | | | $ | 296 | |
Additionally, included within Other investing activities on the Statements of Consolidated Cash Flows are grant reimbursements related to governmental funded capital projects. For the years ended December 31, 2023, 2022 and 2021, grant reimbursements were $13 million, $27 million and $2 million, respectively.
Cash payments (receipts) for interest and income taxes are as follows:
| | | | | | | | | | | | | | | | | |
| (In Millions) |
| 2020 | | 2019 | | 2018 |
| Taxes paid on income | $ | 5 | | | $ | 0 | | | $ | 3 | |
| Income tax refunds | (120) | | | (118) | | | (11) | |
Interest paid on debt obligations net of capitalized interest1 | 170 | | | 98 | | | 106 | |
| | | | | |
1 Capitalized interest was $53 million, $25 million and $7 million for the years ended December 31, 2020, 2019 and 2018, respectively. |
| | | | | | | | | | | | | | | | | |
| Year Ended December 31, |
| (In millions) | 2023 | | 2022 | | 2021 |
| Income taxes paid | $ | 94 | | | $ | 334 | | | $ | 166 | |
| Income tax refunds | (205) | | | (3) | | | (16) | |
Interest paid on debt obligations net of capitalized interest1 | 256 | | | 249 | | | 299 | |
| | | | | |
1 Capitalized interest was $12 million, $9 million and $6 million for the years ended December 31, 2023, 2022 and 2021, respectively. |
Non-Cash InvestingOther non-cash investing and Financing Activitiesfinancing activities are as follows:
| | | | | | | | | | | | | | | | | |
| (In Millions) |
| 2020 | | 2019 | | 2018 |
| Fair value of common shares issued as part of consideration in connection with AM USA Transaction | $ | 990 | | | $ | 0 | | | $ | 0 | |
| Fair value of Series B Participating Redeemable Preferred Stock issued as part of consideration in connection with AM USA Transaction | 738 | | | 0 | | | 0 | |
| Fair value of settlement of a pre-existing relationship as part of consideration in connection with AM USA Transaction | 237 | | | 0 | | | 0 | |
| Fair value of common shares issued as consideration in connection with AK Steel Merger | 618 | | | 0 | | | 0 | |
| Fair value of equity awards assumed in connection with AK Steel Merger | 4 | | | 0 | | | 0 | |
Discontinued Operations
We had income from discontinued operations, net of tax of $88 million for the year ended December 31, 2018. During 2018, we sold all of the assets of our Asia Pacific Iron Ore mining operations, which had operating losses of $105 million for the year ended December 31, 2018. Additionally, as a result of the liquidation of the net assets of our Australian subsidiaries, the historical changes in foreign currency translation recorded in Accumulated other comprehensive loss totaling $228 million was reclassified and recognized as a gain in Income (loss) from discontinued operations, net of tax.
| | | | | | | | | | | | | | | | | |
| Year Ended December 31, |
| (In millions) | 2023 | | 2022 | | 2021 |
| 1.500% 2025 Convertible Senior Notes redemption | $ | — | | | $ | 25 | | | $ | — | |
| Fair value of settlement of a pre-existing relationship as part of consideration in connection with FPT Acquisition | — | | | — | | | (20) | |
NOTE 3 - ACQUISITIONS
In 2020, we acquired two major steelmakers, AK Steel and ArcelorMittal USA, vertically integrating our legacy iron ore business with steel production. Our fully-integrated portfolio includes custom-made pellets and HBI; flat-rolled carbon steel, stainless, electrical, plate, tinplate and long steel products; as well as carbon and stainless steel tubing, hot and cold stamping and tooling. The AK Steel Merger combined Cliffs, a producer of iron ore pellets, with AK Steel, a producer of flat-rolled carbon, stainless and electrical steel products, to create a vertically integrated producer of value-added iron ore and steel products. The AM USA Transaction transformed us into a fully-integrated steel enterprise with the size and scale to achieve improved through-the-cycle margins.
We now have a presence across the entire steel manufacturing process, from mining to pelletizing to the development and production of finished high value steel products. The combination is expected to create significant opportunities to generate additional value from market trends across the entire steel value chain and enable more consistent, predictable performance through normal market cycles.
Acquisition of ArcelorMittal USA
OverviewFPT ACQUISITION OVERVIEW
On December 9, 2020,November 18, 2021, pursuant to the terms of the AM USA TransactionFPT Acquisition Agreement, we purchased ArcelorMittal USA from ArcelorMittal. In connection withcompleted the closingFPT Acquisition, in which we were the acquirer. The FPT Acquisition entered us into the scrap business and provides us a competitive advantage in sourcing prime scrap, a key raw material for our steelmaking facilities.
Following the acquisition, the operating results of ArcelorMittal USA are included in our consolidated financial statements. For the period subsequent to the acquisition (December 9, 2020 through December 31, 2020), ArcelorMittal USA generated Revenues of $446 million and a loss of $40 million included within Net income (loss) attributable to Cliffs shareholders, which included $21 million related to amortization of the fair value inventory step-up.ContentsAdditionally, we incurred acquisition-related costs excluding severance costs of $26 million for the year endedDecember 31, 2020, which were recorded in Acquisition-related costs on the Statements of Consolidated Operations.
The AM USA Transaction was accounted for under the acquisition method of accounting for business combinations.
The fair value of the total purchase consideration was determined as follows:
| | | | | |
| (In Millions)millions) | |
Fair value of Cliffs common shares issuedCash consideration: | |
| Cash consideration pursuant to the FPT Acquisition Agreement | $ | 990778 | |
Fair value of Series B Participating Redeemable Preferred Stock issuedCash consideration paid related to IRC Section 338(h)(10) | 73823 | |
| Total cash consideration | 801 | |
| Fair value of settlement of a pre-existing relationship | 237 (20) | |
Cash consideration (subject to customary working capital adjustments) | 631 | |
| Total purchase consideration | $ | 2,596781 | |
The fair value of Cliffs common shares issued is calculated as follows:
| | | | | |
Number of Cliffs common shares issued | 78,186,671 |
Closing price of Cliffs common share as of December 9, 2020 | $ | 12.66 | |
Fair value of Cliffs common shares issued (in millions) | $ | 990 | |
The fair value of Cliffs Series B Participating Redeemable Preferred Stock issued is calculated as follows:
| | | | | |
Number of Cliffs Series B Participating Redeemable Preferred Stock issued | 583,273 | |
Redemption price as of December 9, 2020 | $ | 1,266 | |
Fair value of Cliffs Series B Participating Redeemable Preferred Stock issued (in millions) | $ | 738 | |
The fair valueWe made certain elections under Section 338(h)(10) of the estimatedIRC with respect to entities acquired in connection with the FPT Acquisition that were finalized during the third quarter of 2022, which changed the final cash consideration is comprised of the following:consideration.
| | | | | |
| (In Millions) |
Cash consideration pursuant to the AM USA Transaction Agreement | $ | 505 | |
Cash consideration for purchase of the remaining JV partners' interest of Kote and Tek | 182 | |
Estimated total cash consideration receivable | (56) | |
Total estimated cash consideration | $ | 631 | |
VALUATION ASSUMPTION AND PURCHASE PRICE ALLOCATIONThe cash portion of the purchase price is subject to customary working capital adjustments.
The fair value of the settlement of a pre-existing relationship is comprised of the following:
| | | | | |
| (In Millions) |
Accounts receivable | $ | 97 | |
Freestanding derivative asset from customer supply agreement | 140 | |
Total fair value of settlement of a pre-existing relationship | $ | 237 | |
Valuation Assumption and Preliminary Purchase Price Allocation
We estimated fair values at December 9, 2020 for the preliminary allocation of consideration to the net tangible and intangible assets acquired and liabilities assumed in connection with the AM USA Transaction. DuringFPT Acquisition was based on estimated fair values at November 18, 2021, and was finalized during the measurement period, we will continue to obtain information to assist in finalizing the fair value of assets acquired and liabilities assumed, which may differ materially from these preliminary estimates. If we determine any measurement period adjustments are material, we will apply those adjustments, including any related impacts to net income, in the reporting period in which the adjustments are determined. We are in the process of conductingquarter ended December 31, 2022. The following is a valuationsummary of the assets acquired and liabilities assumed related to the AM USA Transaction, most notably, inventories, personal and real property, mineral reserves, leases, investments, deferred taxes, asset retirement obligations, pension and OPEB liabilities, and the final allocation will be made when completed, including the result of any identified goodwill. Accordingly, the provisional measurements noted below are preliminary and subject to modification in the future.
The preliminary purchase price allocation to assets acquired and liabilities assumed in the AM USA Transaction was:FPT Acquisition:
| | | | | |
| (In Millions) |
Cash and cash equivalents | $ | 35 | |
Accounts receivable, net | 349 | |
Inventories | 2,115 | |
Income tax receivable, current | 12 | |
Other current assets | 22 | |
Property, plant and equipment | 4,017 | |
Other non-current assets | 158 | |
Accounts payable | (758) | |
Accrued employment costs | (271) | |
State and local taxes | (76) | |
Pension and OPEB liabilities, current | (109) | |
Other current liabilities | (322) | |
Pension and OPEB liabilities, non-current | (3,195) | |
Other non-current liabilities | (598) | |
Noncontrolling interest | (13) | |
Net identifiable assets acquired | 1,366 | |
Goodwill | 1,230 | |
Total net assets acquired | $ | 2,596 | |
| | | | | | | | | | | | | | | | | |
| (In millions) | Initial Allocation of Consideration | | Measurement
Period Adjustments | | Final Allocation of Consideration as of December 31, 2022 |
| Cash and cash equivalents | $ | 9 | | | $ | — | | | $ | 9 | |
| Accounts receivable, net | 233 | | | 2 | | | 235 | |
| Inventories | 137 | | | (2) | | | 135 | |
| Other current assets | 4 | | | (1) | | | 3 | |
| Property, plant and equipment | 179 | | | 12 | | | 191 | |
| Other non-current assets | 74 | | | (2) | | | 72 | |
| Accounts payable | (122) | | | — | | | (122) | |
| Accrued employment costs | (8) | | | — | | | (8) | |
| | | | | |
| Other current liabilities | (9) | | | 3 | | | (6) | |
| | | | | |
| | | | | |
| | | | | |
| Other non-current liabilities | (21) | | | — | | | (21) | |
| | | | | |
| Net identifiable assets acquired | 476 | | | 12 | | | 488 | |
| Goodwill | 279 | | | 14 | | | 293 | |
| Total net assets acquired | $ | 755 | | | $ | 26 | | | $ | 781 | |
The goodwill resulting from the acquisition of ArcelorMittal USAFPT Acquisition primarily represents the growth opportunities in the automotive, construction, appliances, infrastructure and machinery and equipment markets,incremental benefit of providing substantial access to prime scrap for our vertically integrated steelmaking business, as well as any synergistic benefits to be realized from the AM USA Transaction and was assigned to our flat steel operationsFPT Acquisition within our Steelmaking segment. GoodwillWe have $296 million in goodwill that is expected to be deductible for U.S. federal income tax purposes.
Acquisition of AK Steel
Overview
On March 13, 2020, pursuant to the AK Steel Merger Agreement, we completed the acquisition of AK Steel, in which we were the acquirer. As a result of the AK Steel Merger, each share of AK Steel common stock issued and outstanding immediately prior to the effective time of the AK Steel Merger (other than excluded shares) was converted into the right to receive 0.400 Cliffs common shares and, if applicable, cash in lieu of any fractional Cliffs common shares.
Following the acquisition, the operating results of AK Steel are included in our consolidated financial statements. For the period subsequent to the acquisition (March 13, 2020 through December 31, 2020), AK Steel generated Revenues of $3,573 million and a loss of $302 million included within Net income (loss) attributable to Cliffs shareholders, which included $74 million and $35 million related to amortization of the fair value inventory step-up and severance costs, respectively.
Additionally, we incurred acquisition-related costs excluding severance costs of $26 million for the year endedDecember 31, 2020, which were recorded in Acquisition-related costs on the Statements of Consolidated Operations.
Refer to NOTE 8 - DEBT AND CREDIT FACILITIES for information regarding debt transactions executed in connection with the AK Steel Merger.
The AK Steel Merger was accounted for under the acquisition method of accounting for business combinations. The acquisition date fair value of the consideration transferred totaled $1,535 million. The following tables summarize the consideration paid for AK Steel and the estimated fair values of the assets acquired and liabilities assumed at the acquisition date.
The fair value of the total purchase consideration was determined as follows:
| | | | | |
| (In Millions) |
Fair value of AK Steel debt | $ | 914 | |
Fair value of Cliffs common shares issued for AK Steel outstanding common stock | 618 | |
Other | 3 | |
Total purchase consideration | $ | 1,535 | |
The fair value of Cliffs common shares issued for outstanding shares of AK Steel common stock and with respect to Cliffs common shares underlying converted AK Steel equity awards that vested upon completion of the AK Steel Merger is calculated as follows:
| | | | | |
| (In Millions, Except Per Share Amounts) |
Number of shares of AK Steel common stock issued and outstanding | 317 | |
Exchange ratio | 0.400 | |
Shares of Cliffs common shares issued to AK Steel stockholders | 127 | |
Price per share of Cliffs common shares | $ | 4.87 | |
Fair value of Cliffs common shares issued for outstanding AK Steel common stock | $ | 618 | |
The fair value of AK Steel's debt included in the consideration is calculated as follows:
| | | | | |
| (In Millions) |
Credit Facility | $ | 590 | |
7.50% Senior Secured Notes due July 2023 | 324 | |
Fair value of debt included in consideration | $ | 914 | |
Valuation Assumption and Preliminary Purchase Price Allocation
We estimated fair values at March 13, 2020 for the preliminary allocation of consideration to the net tangible and intangible assets acquired and liabilities assumed in connection with the AK Steel Merger. During the measurement period, we will continue to obtain information to assist in finalizing the fair value of assets acquired and liabilities assumed, which may differ materially from these preliminary estimates. If we determine any measurement period adjustments are material, we will apply those adjustments, including any related impacts to net income, in the reporting period in which the adjustments are determined. We are in the process of conducting a valuation of the assets acquired and liabilities assumed related to the AK Steel Merger, most notably, personal and real property, leases, deferred taxes, asset retirement obligations and intangible assets and liabilities, and the final allocation will be made when completed, including the result of any identified goodwill. Accordingly, the provisional measurements noted below are preliminary and subject to modification in the future.
The preliminary purchase price allocation to assets acquired and liabilities assumed in the AK Steel Merger was:
| | | | | | | | | | | | | | | | | |
| (In Millions) |
| Initial Allocation of Consideration | | Measurement Period Adjustments | | Updated Allocation |
| Cash and cash equivalents | $ | 38 | | | $ | 1 | | | $ | 39 | |
| Accounts receivable, net | 666 | | | (2) | | | 664 | |
| Inventories | 1,563 | | | (243) | | | 1,320 | |
| Income tax receivable, current | 3 | | | 0 | | | 3 | |
| Other current assets | 65 | | | (16) | | | 49 | |
| Property, plant and equipment | 2,184 | | | 128 | | | 2,312 | |
| Deferred income taxes | 0 | | | 30 | | | 30 | |
| Other non-current assets | 475 | | | (3) | | | 472 | |
| Accounts payable | (636) | | | (8) | | | (644) | |
| Accrued employment costs | (94) | | | 1 | | | (93) | |
| State and local taxes | (35) | | | 4 | | | (31) | |
| Pension and OPEB liabilities, current | (75) | | | (3) | | | (78) | |
| Other current liabilities | (201) | | | 5 | | | (196) | |
| Long-term debt | (1,179) | | | 0 | | | (1,179) | |
| Pension and OPEB liabilities, non-current | (873) | | | 2 | | | (871) | |
| Other non-current liabilities | (507) | | | 72 | | | (435) | |
| Noncontrolling interest | 0 | | | (1) | | | (1) | |
| Net identifiable assets acquired | 1,394 | | | (33) | | | 1,361 | |
| Goodwill | 141 | | | 33 | | | 174 | |
| Total net assets acquired | $ | 1,535 | | | $ | 0 | | | $ | 1,535 | |
During the period subsequent to the AK Steel Merger, we made certain measurement period adjustments to the acquired assets and liabilities assumed due to clarification of information utilized to determine fair value during the measurement period. The Inventories measurement period adjustments of $243 million resulted in a favorable impact of $8 million to Cost of goods sold for the year ended December 31, 2020.
The goodwill resultingpurposes from the acquisition of AK Steel was assigned to our downstream Tubular and Tooling and Stamping operating segments. Goodwill is calculated as the excess of the purchase price over the net identifiable assets recognized and primarily represents the growth opportunities in light weighting solutions to automotive customers, as well as any synergistic benefits to be realized. Goodwill from the AK Steel Merger is not expected be deductible for income tax purposes.FPT Acquisition.
The preliminary purchase price allocated to identifiable intangible assets and liabilities acquired was:
| | | | | | | | | | | |
| (In Millions) | | Weighted Average Life (In Years) |
| Intangible assets: | | | |
| Customer relationships | $ | 77 | | | 18 |
| Developed technology | 60 | | | 17 |
| Trade names and trademarks | 11 | | | 10 |
| Total identifiable intangible assets | $ | 148 | | | 17 |
| Intangible liabilities: | | | |
| Above-market supply contracts | $ | (71) | | | 12 |
| | | | | | | | | | | |
| (In millions) | | Weighted Average Life (In years) |
| Customer relationships | $ | 13 | | | 15 |
| Supplier relationships | 29 | | | 18 |
| Trade names and trademarks | 7 | | | 15 |
| Total identifiable intangible assets | $ | 49 | | | 17 |
The above-market supply contracts relate toIntangible assets are classified as Other non-current assets on the long-term coke and energy supply agreements with SunCoke Energy, which includes SunCoke Middletown, a consolidated VIE. Refer to NOTE 19 - VARIABLE INTEREST ENTITIES for further information.Statements of Consolidated Financial Position.
8870 | CLF 2023 FORM 10-K
Pro Forma ResultsPRO FORMA RESULTS
The following table provides unaudited pro forma financial information, prepared in accordance with Topic 805, for the years ended December 31, 2020 and 2019, as if ArcelorMittal USA and AK SteelFPT had been acquired as of January 1, 2019:2020:
| | | | | | | | | | | |
| (In Millions) |
| Year Ended December 31, |
| 2020 | | 2019 |
| Revenues | $ | 12,837 | | | $ | 17,163 | |
| Net income (loss) attributable to Cliffs shareholders | (520) | | | (11) | |
| | | | | | | |
| Year Ended |
| (In millions) | December 31, 2021 | | |
| Revenues | $ | 21,701 | | | |
| Net income attributable to Cliffs shareholders | 3,074 | | | |
The unaudited pro forma financial information has been calculated after applying our accounting policies and adjusting the historical results with pro forma adjustments, net of tax, that assume the AcquisitionsFPT Acquisition occurred on January 1, 2019. Significant2020. There were no significant pro forma adjustments include the following:
1.The elimination of intercompany revenues between Cliffs and ArcelorMittal USA and AK Steel of $844 million and $1,499 million for the years ended December 31, 2020 and 2019, respectively.
2.The 2020 pro forma net loss was adjusted to exclude $96 million of non-recurring inventory acquisition accounting adjustments incurred during the year ended December 31, 2020. The 2019 pro forma net loss was adjusted to include $362 million of non-recurring inventory acquisition accounting adjustments for the year ended December 31, 2019.
3.The elimination of non-recurring transaction costs incurred by Cliffs, AK Steel and ArcelorMittal USA in connection with the Acquisitions were $93 million for the year ended December 31, 2020. The 2019 pro forma net loss was adjusted to include $93 million of non-recurring transaction cost adjustments for the year ended December 31, 2019.
4.The 2020 pro forma net loss was adjusted to exclude restructuring costs of $1,820 million of non-recurring costs incurred by ArcelorMittal USA prior to the AM USA Transaction.
5.The 2020 and 2019 pro forma net losses were adjusted to exclude $140 million and $129 million for the years ended December 31, 2020 and 2019, respectively, for the impact of reversal of the fees charged for management, financial and legal services under the Industrial Franchise Agreement with the former parent.
6.Total other pro forma adjustments included reduced expenses of $32 million for the year ended December 31, 2020, primarily due to decreased depreciation expense and pension and OPEB expense, offset partially by increased interest and amortization expense.
7.Total other pro forma adjustments included an expense of $76 million for the year ended December 31, 2019, primarily due to increased interest, amortization and pension and OPEB expense, offset partially by decreased depreciation expense.
8.The income tax impact of pro forma transaction adjustments that affect Net income (loss) attributable to Cliffs shareholders at a statutory rate of 24.3% resulted in an increased benefit to Income tax benefit (expense) of $170 million and $117 million for the years ended December 31, 2020 and 2019, respectively.FPT Acquisition.
The unaudited pro forma financial information does not reflect the potential realization of synergies or cost savings, nor does it reflect other costs relating to the integration of the acquired companies.company. This unaudited pro forma financial information should not be considered indicative of the results that would have actually occurred if the AcquisitionsFPT Acquisition had been consummated on January 1, 2019,2020, nor are they indicative of future results.
NOTE 4 - REVENUES
We generate our revenue through product sales, in which shipping terms generally indicate when we have fulfilled our performance obligations and transferred control of products to our customer. Our revenue transactions consist of a single performance obligation to transfer promised goods. Our contracts with customers usually define the mechanism for determining the sales price, which is generally fixed upon transfer of control, but the contracts generally do not impose a specific quantity on either party. Quantities to be delivered to the customer are generally determined at a point near the date of delivery through purchase orders or other written instructions we receive from the customer. Spot market sales are made through purchase orders or other written instructions. We consider our performance obligation to be complete and recognize revenue when control transfers in accordance with shipping terms.
Revenue is measured as the amount of consideration we expect to receive in exchange for transferring product. We reduce the amount of revenue recognized for estimated returns and other customer credits, such as discounts and volume rebates, based on the expected value to be realized. Payment terms are consistent with terms standard to the markets we serve. Sales taxes collected from customers are excluded from revenues.
Prior to the AM USA Transaction, we had a supply agreement with ArcelorMittal USA, which included supplemental revenue or refunds based on the HRC price in the year the iron ore was consumed in ArcelorMittal USA's blast furnaces. As control transferred prior to consumption, the supplemental revenue was recorded in accordance with Topic 815. All sales occurring subsequent to the AM USA Transaction are intercompany and eliminated in consolidation. Included within Revenues related to Topic 815 for the supplemental revenue portion of the supply agreement is derivative revenue of $122 million, $78 million and $426 million for the years ended December 31, 2020, 2019 and 2018, respectively.
The following table represents our Revenues by market:
| | (In Millions) |
| Year Ended December 31, |
| 2020 | | 2019 | | 2018 |
| Year Ended December 31, | | | Year Ended December 31, |
| (In millions) | | (In millions) | 2023 | | 2022 | | 2021 |
| Steelmaking: | Steelmaking: | | | | | |
| Automotive | |
| Automotive | |
| Automotive | Automotive | $ | 2,062 | | | $ | 0 | | | $ | 0 | |
| Infrastructure and manufacturing | Infrastructure and manufacturing | 784 | | | 0 | | | 0 | |
| Distributors and converters | Distributors and converters | 696 | | | 0 | | | 0 | |
Steel producers1 | 1,423 | | 1,990 | | | 2,332 | |
| Total steelmaking | 4,965 | | | 1,990 | | | 2,332 | |
| Steel producers | |
| Total Steelmaking | |
| Other Businesses: | Other Businesses: | |
| Automotive | |
| Automotive | |
| Automotive | Automotive | 329 | | | 0 | | | 0 | |
| Infrastructure and manufacturing | Infrastructure and manufacturing | 34 | | | 0 | | | 0 | |
| Distributors and converters | Distributors and converters | 26 | | | 0 | | | 0 | |
| Total Other Businesses | Total Other Businesses | 389 | | | 0 | | | 0 | |
| Total revenues | Total revenues | $ | 5,354 | | | $ | 1,990 | | | $ | 2,332 | |
| 1 Includes Realization of deferred revenue of $35 million for the year ended December 31, 2020. |
9071 | CLF 2023 FORM 10-K
The following table represents our consolidated Revenues by product line:
| | | | | | | | | | | | | | | | | | | | | | | | | | | | | | | | | | | |
| (Dollars In Millions, Sales Volumes in Thousands) |
| Year Ended December 31, |
| 2020 | | 2019 | | 2018 |
| Revenue | | Volume1 | | Revenue | | Volume1 | | Revenue | | Volume1 |
| Steelmaking: | | | | | | | | | | | |
| Hot-rolled steel | $ | 386 | | | 633 | | | $ | 0 | | | 0 | | | $ | 0 | | | 0 | |
| Cold-rolled steel | 490 | | | 682 | | | 0 | | | 0 | | | 0 | | | 0 | |
| Coated steel | 1,747 | | | 1,911 | | | 0 | | | 0 | | | 0 | | | 0 | |
| Stainless and electrical steel | 868 | | | 416 | | | 0 | | | 0 | | | 0 | | | 0 | |
| Other steel products | 92 | | | 141 | | | 0 | | | 0 | | | 0 | | | 0 | |
Iron products2 | 1,335 | | | 11,707 | | | 1,990 | | | 18,583 | | | 2,332 | | | 20,563 | |
| Other | 47 | | | N/A | | 0 | | | — | | | 0 | | | — | |
| Total steelmaking | 4,965 | | | | | 1,990 | | | | | 2,332 | | | |
| Other Businesses: | | | | | | | | | | | |
| Other | 389 | | | N/A | | 0 | | | N/A | | 0 | | | N/A |
| Total revenues | $ | 5,354 | | | | | $ | 1,990 | | | | | $ | 2,332 | | | |
| | | | | | | | | | | |
1 Carbon steel products, stainless and electrical steel and plate steel volumes are stated in net tons. Iron product volumes are stated in long tons. |
2 Includes Realization of deferred revenue of $35 million for the year ended December 31, 2020. |
Deferred Revenue
The table below summarizes our deferred revenue balances:
| | | | | | | | | | | | | | | | | | | | | | | |
| (In Millions) |
| Deferred Revenue (Current) | | Deferred Revenue (Long-Term) |
| 2020 | | 2019 | | 2020 | | 2019 |
| Opening balance as of January 1 | $ | 22 | | | $ | 21 | | | $ | 26 | | | $ | 39 | |
| Net increase (decrease) | (15) | | | 1 | | | (26) | | | (13) | |
| Closing balance as of December 31 | $ | 7 | | | $ | 22 | | | $ | 0 | | | $ | 26 | |
Prior to the AK Steel Merger, our iron ore pellet sales agreement with Severstal Dearborn, LLC, subsequently assumed by AK Steel, required supplemental payments to be paid by the customer during the period from 2009 through 2013. Installment amounts received under this arrangement in excess of sales were classified as deferred revenue in the Statements of Consolidated Financial Position upon receipt of payment and the revenue was recognized over the term of the supply agreement, which had extended until 2022, in equal annual installments. As a result of the termination of that iron ore pellet sales agreement, we realized $35 million of deferred revenue, which was recognized within Realization of deferred revenue in the Statements of Consolidated Operations during the year ended December 31, 2020.
We have certain other sales agreements that require customers to pay in advance. Payments received pursuant to these agreements prior to revenue being recognized are recorded as deferred revenue in Other current liabilities. | | | | | | | | | | | | | | | | | |
| Year Ended December 31, |
| (In millions) | 2023 | | 2022 | | 2021 |
| Steelmaking: | | | | | |
| Hot-rolled steel | $ | 4,864 | | | $ | 4,529 | | | $ | 5,615 | |
| Cold-rolled steel | 2,658 | | | 3,193 | | | 3,186 | |
| Coated steel | 6,661 | | | 6,905 | | | 5,864 | |
| Stainless and electrical steel | 2,281 | | | 2,284 | | | 1,622 | |
| Plate | 1,444 | | | 1,651 | | | 1,316 | |
| Slab and other steel products | 1,329 | | | 1,492 | | | 1,247 | |
| Other | 2,094 | | | 2,329 | | | 1,051 | |
| Total Steelmaking | 21,331 | | | 22,383 | | | 19,901 | |
| Other Businesses: | | | | | |
| Other | 665 | | | 606 | | | 543 | |
| Total revenues | $ | 21,996 | | | $ | 22,989 | | | $ | 20,444 | |
NOTE 5 - SEGMENT REPORTING
We are vertically integrated from the mining ofmined raw materials and direct reduced iron ore and coal;ferrous scrap to production of metallicsprimary steelmaking and coke; through iron making, steelmaking, rolling, finishing;downstream finishing, stamping, tooling and to downstream tubing, stamping and tooling.tubing. We are organized into 4four operating segments based on our differentiated products - Steelmaking, Tubular, Tooling and Stamping, and European Operations. Our previous Mining and Pelletizing segment is included within the Steelmaking operating segment as iron ore pellets are a primary raw material for our steel products. We have 1one reportable segment - Steelmaking. The operating segment results of our Tubular, Tooling and Stamping, and European Operations that do not constitute reportable segments are combined and disclosed in the Other Businesses category. Our Steelmaking
segment isoperates as the largest flat-rolled steel producer supported by being the largest iron ore pellet producer as well as a leading prime scrap processor in North America, primarily serving the automotive, infrastructure and manufacturing, and distributors and converters markets. Our Other Businesses primarily include the operating segments that provide customer solutions with carbon and stainless steel tubing products, advanced-engineered solutions, tool design and build, hot- and cold-stamped steel components, and complex assemblies. All intersegment transactions were eliminated in consolidation. We allocate Corporate Selling, general and administrative expenses to our operating segments.
We evaluate performance on an operating segment basis, as well as a consolidated basis, based on Adjusted EBITDA, which is a non-GAAP measure. This measure is used by management, investors, lenders and other external users of our financial statements to assess our operating performance and to compare operating performance to other companies in the steel industry. In addition, management believes Adjusted EBITDA is a useful measure to assess the earnings power of the business without the impact of capital structure and can be used to assess our ability to service debt and fund future capital expenditures in the business.
Our results by segment are as follows:
| | (In Millions) |
| Year Ended December 31, |
| 2020 | | 2019 | | 2018 |
| Year Ended December 31, | | | Year Ended December 31, |
| (In millions) | | (In millions) | 2023 | | 2022 | | 2021 |
| Revenues: | Revenues: | | | | | |
Steelmaking1 | $ | 4,965 | | | $ | 1,990 | | | $ | 2,332 | |
| Steelmaking | |
| Steelmaking | |
| Steelmaking | |
| Other Businesses | Other Businesses | 389 | | | 0 | | | 0 | |
| Total revenues | Total revenues | $ | 5,354 | | | $ | 1,990 | | | $ | 2,332 | |
| | Adjusted EBITDA: | Adjusted EBITDA: | |
| Adjusted EBITDA: | |
| Adjusted EBITDA: | |
| Steelmaking | |
| Steelmaking | |
| Steelmaking | Steelmaking | $ | 433 | | | $ | 636 | | | $ | 872 | |
| Other Businesses | Other Businesses | 47 | | | 0 | | | 0 | |
| Corporate and eliminations | (127) | | | (111) | | | (106) | |
| Eliminations | |
| Total Adjusted EBITDA | Total Adjusted EBITDA | $ | 353 | | | $ | 525 | | | $ | 766 | |
| 1 Includes Realization of deferred revenue of $35 million for the year ended December 31, 2020. |
9272 | CLF 2023 FORM 10-K
The following table provides a reconciliation of our consolidated Net income (loss) to total Adjusted EBITDA:
| | | | | | | | | | | | | | | | | |
| (In Millions) |
| Year Ended December 31, |
| 2020 | | 2019 | | 2018 |
| Net income (loss) | $ | (81) | | | $ | 293 | | | $ | 1,128 | |
| Less: | | | | | |
| Interest expense, net | (238) | | | (101) | | | (121) | |
| Income tax benefit (expense) | 111 | | | (18) | | | 460 | |
| Depreciation, depletion and amortization | (308) | | | (85) | | | (89) | |
| 354 | | | 497 | | | 878 | |
| Less: | | | | | |
EBITDA from noncontrolling interests1 | 56 | | | 0 | | | 0 | |
| Gain (loss) on extinguishment of debt | 130 | | | (18) | | | (7) | |
| Severance costs | (38) | | | (2) | | | 0 | |
| Acquisition-related costs excluding severance costs | (52) | | | (7) | | | 0 | |
| Amortization of inventory step-up | (96) | | | 0 | | | 0 | |
| Impact of discontinued operations | 1 | | | (1) | | | 121 | |
| Foreign exchange remeasurement | 0 | | | 0 | | | (1) | |
| Impairment of other long-lived assets | 0 | | | 0 | | | (1) | |
| Total Adjusted EBITDA | $ | 353 | | | $ | 525 | | | $ | 766 | |
| | | | | |
1 EBITDA of noncontrolling interests includes $41 million for income and $15 million for depreciation, depletion and amortization for the year ended December 31, 2020. |
| | | | | | | | | | | | | | | | | |
| Year Ended December 31, |
| (In millions) | 2023 | | 2022 | | 2021 |
| Net income | $ | 450 | | | $ | 1,376 | | | $ | 3,033 | |
| Less: | | | | | |
| Interest expense, net | (289) | | | (276) | | | (337) | |
| Income tax expense | (148) | | | (423) | | | (773) | |
| Depreciation, depletion and amortization | (973) | | | (1,034) | | | (897) | |
| 1,860 | | | 3,109 | | | 5,040 | |
| Less: | | | | | |
EBITDA from noncontrolling interests1 | 83 | | | 74 | | | 75 | |
| Acquisition-related expenses and adjustments | (12) | | | (1) | | | (197) | |
| Goodwill impairment | (125) | | | — | | | — | |
| Non-cash gain on sale of business | 28 | | | — | | | — | |
| Loss on extinguishment of debt | — | | | (75) | | | (88) | |
| Asset impairment | — | | | (29) | | | — | |
| Other, net | (25) | | | (29) | | | (27) | |
| Total Adjusted EBITDA | $ | 1,911 | | | $ | 3,169 | | | $ | 5,277 | |
| | | | | |
1 EBITDA of noncontrolling interests includes the following: | | | | | |
| Net income attributable to noncontrolling interests | $ | 51 | | | $ | 41 | | | $ | 45 | |
| Depreciation, depletion and amortization | 32 | | | 33 | | | 30 | |
| EBITDA of noncontrolling interests | $ | 83 | | | $ | 74 | | | $ | 75 | |
The following table summarizes our depreciation, depletion and amortization and capital additions by segment:
| | | | | | | | | | | | | | | | | |
| (In Millions) |
| Year Ended December 31, |
| 2020 | | 2019 | | 2018 |
| Depreciation, depletion and amortization: | | | | | |
| Steelmaking | $ | 276 | | | $ | 80 | | | $ | 68 | |
| Other Businesses | 27 | | | 0 | | | 0 | |
| Corporate | 5 | | | 5 | | | 6 | |
| Total depreciation, depletion and amortization | $ | 308 | | | $ | 85 | | | $ | 74 | |
| | | | | |
Capital additions1: | | | | | |
| Steelmaking | $ | 436 | | | $ | 687 | | | $ | 393 | |
| Other Businesses | 45 | | | 0 | | | 0 | |
| Corporate | 2 | | | 3 | | | 2 | |
| Total capital additions | $ | 483 | | | $ | 690 | | | $ | 395 | |
| | | | | |
1 Refer to NOTE 2 - SUPPLEMENTARY FINANCIAL STATEMENT INFORMATION for additional information. |
| | | | | | | | | | | | | | | | | |
| Year Ended December 31, |
| (In millions) | 2023 | | 2022 | | 2021 |
| Depreciation, depletion and amortization: | | | | | |
| Steelmaking | $ | (938) | | | $ | (994) | | | $ | (860) | |
| Other Businesses | (35) | | | (40) | | | (37) | |
| Total depreciation, depletion and amortization | $ | (973) | | | $ | (1,034) | | | $ | (897) | |
| | | | | |
Capital additions1: | | | | | |
| Steelmaking | $ | 778 | | | $ | 997 | | | $ | 787 | |
| Other Businesses | 3 | | | 30 | | | 52 | |
| Corporate | 4 | | | 6 | | | 18 | |
| Total capital additions | $ | 785 | | | $ | 1,033 | | | $ | 857 | |
| | | | | |
1 Refer to NOTE 2 - SUPPLEMENTARY FINANCIAL STATEMENT INFORMATION for additional information. |
The following summarizes our assets by segment:
| | (In Millions) |
| December 31, |
| 2020 | | 2019 |
| December 31, | | | December 31, |
| (In millions) | | (In millions) | 2023 | | 2022 |
| Assets: | Assets: | | | |
| Steelmaking | Steelmaking | $ | 15,849 | | | $ | 2,557 | |
| Steelmaking | |
| Steelmaking | |
| Other Businesses | Other Businesses | 239 | | | 0 | |
| Intersegment eliminations | |
| Total segment assets | Total segment assets | 16,088 | | | 2,557 | |
| Corporate | 683 | | | 947 | |
| Corporate/Eliminations | |
| Total assets | Total assets | $ | 16,771 | | | $ | 3,504 | |
Included in the consolidated financial statements are the following amounts relating to geographic location based on product destination:
| | (In Millions) |
| 2020 | | 2019 | | 2018 |
| (In millions) | | (In millions) | 2023 | | 2022 | | 2021 |
| Revenues: | Revenues: | | | | | |
| United States | |
| United States | |
| United States | United States | $ | 4,580 | | | $ | 1,505 | | | $ | 1,847 | |
| Canada | Canada | 602 | | | 448 | | | 395 | |
| Other countries | Other countries | 172 | | | 37 | | | 90 | |
| Total revenues | Total revenues | $ | 5,354 | | | $ | 1,990 | | | $ | 2,332 | |
| Property, plant and equipment, net: | Property, plant and equipment, net: | | | | | |
| United States | United States | $ | 8,647 | | | $ | 1,929 | | | $ | 1,286 | |
| United States | |
| United States | |
| Canada | Canada | 91 | | | 0 | | | 0 | |
| Other countries | Other countries | 5 | | | 0 | | | 0 | |
| Total property, plant and equipment, net | Total property, plant and equipment, net | $ | 8,743 | | | $ | 1,929 | | | $ | 1,286 | |
NOTE 6 - PROPERTY, PLANT AND EQUIPMENT
The following table indicates the carrying value of each of the major classes of our depreciable assets:
| | (In Millions) |
| December 31, |
| 2020 | | 2019 |
| Land, land improvements, and mineral rights | $ | 1,213 | | | $ | 582 | |
| December 31, | | | December 31, |
| (In millions) | | (In millions) | 2023 | | 2022 |
| Land, land improvements and mineral rights | |
| Buildings | Buildings | 703 | | | 158 | |
| Equipment | Equipment | 6,786 | | | 1,456 | |
| Other | Other | 151 | | | 101 | |
| Construction in progress | Construction in progress | 1,364 | | | 730 | |
Total property, plant and equipment1 | Total property, plant and equipment1 | 10,217 | | | 3,027 | |
| Allowance for depreciation and depletion | Allowance for depreciation and depletion | (1,474) | | | (1,098) | |
| Property, plant, and equipment, net | $ | 8,743 | | | $ | 1,929 | |
| Property, plant and equipment, net | |
| 1 Includes right-of-use assets related to finance leases of $361 million and $49 million as of December 31, 2020 and 2019, respectively. | 1 Includes right-of-use assets related to finance leases of $306 million and $408 million as of December 31, 2023 and 2022, respectively. | |
1 Includes right-of-use assets related to finance leases of $306 million and $408 million as of December 31, 2023 and 2022, respectively. | |
1 Includes right-of-use assets related to finance leases of $306 million and $408 million as of December 31, 2023 and 2022, respectively. | |
We recorded depreciation expense of $298$932 million, $77$988 million and $66$848 million for the years ended December 31, 2020, 20192023, 2022 and 2018,2021, respectively.
We recorded capitalized interest into property, plant and equipment of $53 million, $25 million and $7 million during Depreciation expense for the yearsyear ended December 31, 2020, 20192022 includes $23 million of accelerated depreciation related to the decision to indefinitely idle the coke facility at Middletown Works and 2018, respectively.$68 million of accelerated depreciation related to the indefinite idle of the Indiana Harbor #4 blast furnace.
94During the year ended December 31, 2022, we announced the permanent closure of Mountain State Carbon, which resulted in a $29 million asset impairment charge.
The net book value of the mineral and land rights are as follows:
| | (In Millions) |
| December 31, |
| 2020 | | 2019 |
| December 31, | | | December 31, |
| (In millions) | | (In millions) | 2023 | | 2022 |
| Mineral rights: | Mineral rights: | | | |
| Cost | |
| Cost | |
| Cost | Cost | $ | 773 | | | $ | 537 | |
| Depletion | Depletion | (142) | | | (134) | |
| Net mineral rights | Net mineral rights | $ | 631 | | | $ | 403 | |
| | Land rights | Land rights | $ | 361 | | | $ | 12 | |
| Land rights | |
| Land rights | |
We recorded depletion expense of $8$33 million, $8$38 million and $7$46 million for the years ended December 31, 2020, 2019,2023, 2022, and 2018,2021, respectively.
NOTE 7 - GOODWILL AND INTANGIBLE ASSETS AND LIABILITIES
GoodwillGOODWILL
The following is a summary of goodwillGoodwill by segment:
| | (In Millions) |
| December 31, |
| 2020 | | 2019 |
| December 31, | | | December 31, |
| (In millions) | | (In millions) | 2023 | | 2022 |
| Steelmaking | Steelmaking | $ | 1,232 | | | $ | 2 | |
| Other Businesses | Other Businesses | 174 | | | 0 | |
| Total goodwill | Total goodwill | $ | 1,406 | | | $ | 2 | |
Our 2023 annual goodwill impairment analysis resulted in a full impairment charge of $125 million for goodwill related to our Tooling and Stamping reporting unit. The fair value of our Tooling and Stamping reporting unit was estimated using the discounted cash flow methodology (level 3 within the fair value hierarchy), which considers forecasted cash flows discounted at an estimated weighted average cost of capital. The decline in the fair value of our Tooling and Stamping reporting unit below its carrying value during 2023 resulted from forgoing previous investment and capital plans in favor of other opportunities and an increase in the balance of goodwill in our Steelmaking segment as of December 31, 2020, compared to December 31, 2019, is due to the preliminary assignment of $1,230 million to Goodwill in 2020 based on the preliminary purchase price allocation for the acquisition of ArcelorMittal USA. The increase in the balance of goodwill for our Other Businesses as of December 31, 2020, compared to December 31, 2019, is due to the preliminary assignment of $174 million to Goodwill in 2020 based on the preliminary purchase price allocation for the acquisition of AK Steel, which was attributable to our Tubular and Tooling and Stamping operating segments.discount rate.
Intangible Assets and LiabilitiesINTANGIBLE ASSETS AND LIABILITIES
The following is a summary of our intangible assets and liabilities:
| | | | | | | | | | | | | | | | | | | | | | | |
| | | (In Millions) |
| Classification1 | | Gross Amount | | Accumulated Amortization | | Net Amount |
| As of December 31, 2020 | | | | | | | |
| Intangible assets: | | | | | | | |
| Customer relationships | Other non-current assets | | $ | 77 | | | $ | (3) | | | $ | 74 | |
| Technology | Other non-current assets | | 60 | | | (3) | | | 57 | |
| Trade names and trademarks | Other non-current assets | | 11 | | | (1) | | | 10 | |
| Mining permits | Other non-current assets | | 72 | | | (25) | | | 47 | |
| Total intangible assets | | | $ | 220 | | | $ | (32) | | | $ | 188 | |
| Intangible liabilities: | | | | | | | |
| Above-market supply contracts | Other non-current liabilities | | $ | (71) | | | $ | 7 | | | $ | (64) | |
| | | | | | | |
| As of December 31, 2019 | | | | | | | |
| Intangible assets: | | | | | | | |
| Mining permits | Other non-current assets | | $ | 72 | | | $ | (24) | | | $ | 48 | |
1 Amortization of intangible liabilities related to above-market supply contracts and intangible assets related to mining permits is recognized in Cost of goods sold. Amortization of all other intangible assets is recognized in Selling, general and administrative expenses. |
| | | | | | | | | | | | | | | | | | | | | | | | | | | | | | | | | | | |
| December 31, 2023 | | December 31, 2022 |
| (In millions) | Gross Amount | | Accumulated Amortization | | Net Amount | | Gross Amount | | Accumulated Amortization | | Net Amount |
Intangible assets1: | | | | | | | | | | | |
| Customer relationships | $ | 90 | | | $ | (18) | | | $ | 72 | | | $ | 90 | | | $ | (13) | | | $ | 77 | |
| Developed technology | 60 | | | (14) | | | 46 | | | 60 | | | (10) | | | 50 | |
| Trade names and trademarks | 18 | | | (5) | | | 13 | | | 18 | | | (4) | | | 14 | |
| Mining permits | 72 | | | (28) | | | 44 | | | 72 | | | (27) | | | 45 | |
| Supplier relationships | 29 | | | (3) | | | 26 | | | 29 | | | (1) | | | 28 | |
| Total intangible assets | $ | 269 | | | $ | (68) | | | $ | 201 | | | $ | 269 | | | $ | (55) | | | $ | 214 | |
Intangible liabilities2: | | | | | | | | | | | |
| Above-market supply contracts | $ | (71) | | | $ | 24 | | | $ | (47) | | | $ | (71) | | | $ | 19 | | | $ | (52) | |
| | | | | | | | | | | |
1 Intangible assets are classified as Other non-current assets. Amortization related to mining permits is recognized in Cost of goods sold. Amortization of all other intangible assets is recognized in Selling, general and administrative expenses. |
2 Intangible liabilities are classified as Other non-current liabilities. Amortization of all intangible liabilities is recognized in Cost of goods sold. |
Amortization expense related to intangible assets was $8$13 million and $1 million for both the years ended December 31, 20202023 and 2019, respectively.2022. Estimated future amortization expense related to intangible assets is $10$13 million annually for the years 20212024 through 2025. 2028.
Income from amortization related to the intangible liabilities was $7$5 million for both the yearyears ended December 31, 2020.2023 and 2022. Estimated future amortization income related to the intangible liabilities is $8$5 million annually for the years 20212024 through 2025.2028.
9675 | CLF 2023 FORM 10-K
NOTE 8 - DEBT AND CREDIT FACILITIES
The following represents a summary of our long-term debt:
| | | | | | | | | | | | | | | | | | | | | | | | | | | | | | | | | | | | | | |
| (In Millions) |
| December 31, 2020 |
| Debt Instrument | | Issuer1 | | Annual Effective Interest Rate | | Total Principal Amount | | Unamortized Debt Issuance Costs | | Unamortized Premiums (Discounts) | | Total Debt |
| Senior Secured Notes: | | | | | | | | | | | | |
| 4.875% 2024 Senior Secured Notes | | Cliffs | | 5.00% | | $ | 395 | | | $ | (3) | | | $ | (1) | | | $ | 391 | |
| 9.875% 2025 Senior Secured Notes | | Cliffs | | 10.57% | | 955 | | | (8) | | | (25) | | | 922 | |
| 6.75% 2026 Senior Secured Notes | | Cliffs | | 6.99% | | 845 | | | (20) | | | (9) | | | 816 | |
| Senior Unsecured Notes: | | | | | | | | | | | | |
| 7.625% 2021 AK Senior Notes | | AK Steel | | 7.33% | | 34 | | | 0 | | | 0 | | | 34 | |
| 7.50% 2023 AK Senior Notes | | AK Steel | | 6.17% | | 13 | | | 0 | | | 0 | | | 13 | |
| 6.375% 2025 Senior Notes | | Cliffs | | 8.11% | | 64 | | | 0 | | | (4) | | | 60 | |
| 6.375% 2025 AK Senior Notes | | AK Steel | | 8.11% | | 29 | | | 0 | | | (2) | | | 27 | |
| 1.50% 2025 Convertible Senior Notes | | Cliffs | | 6.26% | | 296 | | | (4) | | | (49) | | | 243 | |
| 5.75% 2025 Senior Notes | | Cliffs | | 6.01% | | 396 | | | (3) | | | (4) | | | 389 | |
| 7.00% 2027 Senior Notes | | Cliffs | | 9.24% | | 73 | | | 0 | | | (8) | | | 65 | |
| 7.00% 2027 AK Senior Notes | | AK Steel | | 9.24% | | 56 | | | 0 | | | (6) | | | 50 | |
| 5.875% 2027 Senior Notes | | Cliffs | | 6.49% | | 556 | | | (4) | | | (18) | | | 534 | |
| 6.25% 2040 Senior Notes | | Cliffs | | 6.34% | | 263 | | | (2) | | | (3) | | | 258 | |
| IRBs due 2024 to 2028 | | AK Steel | | Various | | 92 | | | 0 | | | 2 | | | 94 | |
EDC Revolving Facility3 | | * | | 3.25% | | 40 | | | — | | | — | | | 18 | |
ABL Facility3 | | Cliffs2 | | 2.15% | | 3,500 | | | — | | | — | | | 1,510 | |
| Total debt | | | | | | | | | | | | 5,424 | |
| Less: current debt | | | | | | | | | | | | 34 | |
| Total long-term debt | | | | | | | | | | | | $ | 5,390 | |
| | | | | | | | | | | | |
| * Our subsidiaries, Fleetwood Metal Industries Inc. and The Electromac Group Inc., are the borrowers under the EDC Revolving Facility. |
1 Unless otherwise noted, references in this column and throughout this Note 8 - DEBT AND CREDIT FACILITIES to "Cliffs" are to Cleveland-Cliffs Inc., and references to "AK Steel" are to AK Steel Corporation (n/k/a Cleveland-Cliffs Steel Corporation). |
2 Refers to Cleveland-Cliffs Inc. as borrower under our ABL Facility. |
3 The total principal amounts for the indicated credit facilities are stated at their respective maximum borrowing capacities. |
| | | | | | | | | | | | | | | | | | | | | | | | | | |
| (In Millions) |
| Debt Instrument | | Issuer1 | | Annual Effective Interest Rate | | December 31, 2023 | | December 31, 2022 |
| Senior Secured Notes: | | | | | | | | |
| 6.750% 2026 Senior Secured Notes | | Cliffs | | 6.990% | | 829 | | | 829 | |
| Senior Unsecured Notes: | | | | | | | | |
| 7.000% 2027 Senior Notes | | Cliffs | | 9.240% | | 73 | | | 73 | |
| 7.000% 2027 AK Senior Notes | | AK Steel | | 9.240% | | 56 | | | 56 | |
| 5.875% 2027 Senior Notes | | Cliffs | | 6.490% | | 556 | | | 556 | |
| 4.625% 2029 Senior Notes | | Cliffs | | 4.625% | | 368 | | | 368 | |
| 6.750% 2030 Senior Notes | | Cliffs | | 6.750% | | 750 | | | — | |
| 4.875% 2031 Senior Notes | | Cliffs | | 4.875% | | 325 | | | 325 | |
| 6.250% 2040 Senior Notes | | Cliffs | | 6.340% | | 235 | | | 235 | |
| ABL Facility | | Cliffs2 | | Variable3 | | — | | | 1,864 | |
| Total debt | | | | | | 3,192 | | | 4,306 | |
| Unamortized discounts and issuance costs | | | | | | (55) | | | (57) | |
| Total long-term debt | | | | | | $ | 3,137 | | | $ | 4,249 | |
| | | | | | | | |
|
1 Unless otherwise noted, references in this column and throughout this NOTE 8 - DEBT AND CREDIT FACILITIES to "Cliffs" are to Cleveland-Cliffs Inc., and references to "AK Steel" are to AK Steel Corporation (n/k/a Cleveland-Cliffs Steel Corporation). |
2 Refers to Cleveland-Cliffs Inc. as borrower under our ABL Facility. |
3 Our ABL Facility annual effective interest rate was 5.60% as of December 31, 2022. |
| | | | | | | | | | | | | | | | | | | | | | | | | | | | | | | | | | | | | | |
| (In Millions) |
| December 31, 2019 |
| Debt Instrument | | Issuer1 | | Annual Effective Interest Rate | | Total Principal Amount | | Debt Issuance Costs | | Unamortized Discounts | | Total Debt |
| Senior Secured Notes: | | | | | | | | | | | | |
| 4.875% 2024 Senior Notes | | Cliffs | | 5.00% | | $ | 400 | | | $ | (5) | | | $ | (2) | | | $ | 393 | |
| Senior Unsecured Notes: | | | | | | | | | | | | |
| 1.50% 2025 Convertible Senior Notes | | Cliffs | | 6.26% | | 316 | | | (4) | | | (65) | | | 247 | |
| 5.75% 2025 Senior Notes | | Cliffs | | 6.01% | | 473 | | | (3) | | | (6) | | | 464 | |
| 5.875% 2027 Senior Notes | | Cliffs | | 6.49% | | 750 | | | (6) | | | (27) | | | 717 | |
| 6.25% 2040 Senior Notes | | Cliffs | | 6.34% | | 298 | | | (2) | | | (3) | | | 293 | |
| Former ABL Facility | | Cliffs2 | | N/A | | 450 | | | N/A | | N/A | | 0 | |
| Total long-term debt | | | | | | | | | | | | $ | 2,114 | |
| | | | | | | | | | | | |
1 Unless otherwise noted, references in this column to "Cliffs" are to Cleveland-Cliffs Inc. |
2 Refers to Cleveland-Cliffs Inc. and certain of its subsidiaries as borrowers under our Former ABL Facility. |
Outstanding Senior Secured Notes
9.875% 2025 Senior Secured Notes
On April 17, 2020, we entered into an indenture among Cliffs, the guarantors party thereto and U.S. Bank National Association, as trustee and notes collateral agent, relating to the issuance by Cliffs of $400 million aggregate principal amount of 9.875% 2025 Senior Secured Notes issued at 94.5% of face value.
On April 24, 2020, we issued an additional $555 million aggregate principal amount of 9.875% 2025 Senior Secured Notes issued at 99.0% of face value. These additional notes are of the same class and series as, and otherwise identical to, the 9.875% 2025 Senior Secured Notes issued on April 17, 2020, other than with respect to the date of issuance and issue price.OUTSTANDING SENIOR SECURED NOTES
The 9.875% 2025 Senior Secured Notes were issued in private placement transactions exempt from the registration requirements of the Securities Act. The 9.875% 20256.750% 2026 Senior Secured Notes bear interest at a rate of 9.875%6.750% per annum, payable semi-annually in arrears on April 17March 15 and October 17September 15 of each year, commencing on October 17, 2020.year. The 9.875% 20256.750% 2026 Senior Secured Notes will mature on October 17, 2025 and are secured senior obligations of Cliffs.March 15, 2026.
The 9.875% 20256.750% 2026 Senior Secured Notes are jointly and severally and fully and unconditionally guaranteed on a senior secured basis by substantially all of our material domestic subsidiaries and are secured (subject in each case to certain exceptions and permitted liens) by (i) a first-priority lien, on a pari passu basis with the 6.75% 2026 Senior Secured Notes and 4.875% 2024 Senior Secured Notes, on substantially all of our assets and the assets of the guarantors, other than the ABL Collateral (as defined below), and (ii) a second-priority lien on the ABL Collateral, which is junior to a first-priority lien for the benefit of the lenders under our ABL Facility.
The 9.875% 2025We may redeem the 6.750% 2026 Senior Secured Notes may be redeemed, in whole or in part, at any time at our option upon not less than 30, and not more than 60, days' prior notice sent to the holders of the 9.875% 20256.750% 2026 Senior Secured Notes. The following is a summary of redemption prices for our 9.875% 20256.750% 2026 Senior Secured Notes:
| | | | | | | | | | | | | | | | | |
Redemption Period | | Redemption Price1
| | Restricted Amount |
Prior to October 17, 2022 - using proceeds of equity issuance | | 109.875 | | % | | Up to 35% of original aggregate principal |
Prior to October 17, 20222
| | 100.000 | | | | |
Beginning on October 17, 2022 | | 107.406 | | | | |
Beginning on April 17, 2023 | | 104.938 | | | | |
Beginning on April 17, 2024 | | 102.469 | | | | |
Beginning on April 17, 2025 and thereafter | | 100.000 | | | | |
| | | | | |
1 Plus accrued and unpaid interest, if any, up to, but excluding, the redemption date.
|
2 Plus a "make-whole" premium.
|
Notes are redeemable at a price equal to 103.375% of the principal amount thereof, decreasing to 101.688% on March 15, 2024 and are redeemable at par beginning on March 15, 2025. In each case, we pay the redemption premiums plus accrued and unpaid interest, if any, to, but not including, the date of redemption.In addition, if a change in control triggering event, as defined in the indenture, occurs with respect to the 9.875% 2025 Senior Secured Notes, we will be required to offer to purchase the notes at a purchase price equal to 101% of their principal amount, plus accrued and unpaid interest, if any, to, but not including, the date of purchase.
The terms of the 9.875% 2025 Senior Secured Notes contain certain customary covenants; however, there are no financial covenants.
6.75% 2026 Senior Secured Notes
On March 13, 2020, we entered into an indenture among Cliffs, the guarantors party thereto and U.S. Bank National Association, as trustee and notes collateral agent, relating to the issuance of $725 million aggregate principal amount of 6.75% 2026 Senior Secured Notes issued at 98.783% of face value.
On June 19, 2020, we issued an additional $120 million aggregate principal amount of 6.75% 2026 Senior Secured Notes issued at 99.25% of face value. These additional notes are of the same class and series as, and otherwise identical to, the 6.75% 2026 Senior Secured Notes issued on March 13, 2020, other than with respect to the date of issuance and issue price.
The 6.75% 2026 Senior Secured Notes were issued in private placement transactions exempt from the registration requirements of the Securities Act. The 6.75% 2026 Senior Secured Notes bear interest at a rate of 6.75% per annum, payable semi-annually in arrears on March 15 and September 15 of each year, commencing on September 15, 2020. The 6.75% 2026 Senior Secured Notes mature on March 15, 2026 and are secured senior obligations of Cliffs.
The 6.75% 2026 Senior Secured Notes are jointly and severally and fully and unconditionally guaranteed on a senior secured basis by substantially all of our material domestic subsidiaries and are secured (subject in each case to certain exceptions and permitted liens) by (i) a first-priority lien, on a pari passu basis with the 4.875% 2024 Senior Secured Notes and 9.875% 2025 Senior Secured Notes, on substantially all of our assets and the assets of the guarantors, other than the ABL Collateral, and (ii) a second-priority lien on the ABL Collateral, which is junior to a first-priority lien for the benefit of the lenders under our ABL Facility.
The 6.75% 2026 Senior Secured Notes may be redeemed, in whole or in part, at any time at our option upon not less than 30, and not more than 60, days' prior notice sent to the holders of the 6.75% 2026 Senior Secured Notes. The following is a summary of redemption prices (expressed as a percentage of the principal amount to be redeemed) for our 6.75% 2026 Senior Secured Notes:
| | | | | | | | | | | | | | | | | |
Redemption Period | | Redemption Price1
| | Restricted Amount |
Prior to March 15, 2022 - using proceeds of equity issuance | | 106.750 | | % | | Up to 35% of original aggregate principal |
Prior to March 15, 20222
| | 100.000 | | | | |
Beginning on March 15, 2022 | | 105.063 | | | | |
Beginning on March 15, 2023 | | 103.375 | | | | |
Beginning on March 15, 2024 | | 101.688 | | | | |
Beginning on March 15, 2025 and thereafter | | 100.000 | | | | |
| | | | | |
1 Plus accrued and unpaid interest, if any, up to, but excluding, the redemption date.
|
2 Plus a "make-whole" premium.
|
| | | | | |
| | | | | |
In addition, if a change in control triggering event, as defined in the indenture, occurs with respect to the 6.75%6.750% 2026 Senior Secured Notes, we will be required to offer to purchase the notes at a purchase price equal to 101% of their principal amount, plus accrued and unpaid interest, if any, to, but not including, the date of purchase.
The terms of the 6.75%6.750% 2026 Senior Secured Notes contain certain customary covenants; however, there are no financial covenants.
4.875% 2024OUTSTANDING SENIOR UNSECURED NOTES
CLEVELAND-CLIFFS INC. 6.750% 2030 SENIOR NOTES - 2023 OFFERING
On April 14, 2023, we entered into an indenture among Cliffs, the guarantors party thereto and U.S. Bank Trust Company, National Association, as trustee, relating to the issuance of $750 million aggregate principal amount of our 6.750% 2030 Senior Secured Notes, which were issued at par. The 6.750% 2030 Senior Notes were issued in a private placement transaction exempt from the registration requirements of the Securities Act.
Our 4.875% 2024The 6.750% 2030 Senior Secured Notes bear interest at a rate of 4.875%6.750% per annum, which is payable semi-annually in arrears on JanuaryApril 15 and JulyOctober 15 of each year.year, which commenced on October 15, 2023. The 4.875% 20246.750% 2030 Senior Secured Notes mature on JanuaryApril 15, 2024 and2030.
The 6.750% 2030 Senior Notes are securedunsecured senior obligations and rank equally in right of Cliffs.
Our 4.875% 2024payment with all of our existing and future unsecured and unsubordinated indebtedness. The 6.750% 2030 Senior Secured Notes are jointly and severally and fully and unconditionally guaranteed on a senior securedunsecured basis by substantiallyour material direct and indirect wholly owned domestic subsidiaries. The 6.750% 2030 Senior Notes are structurally
subordinated to all existing and future indebtedness and other liabilities of our material domestic subsidiaries and are secured (subject in each case to certain exceptions and permitted liens) by (i) a first-priority lien, on a pari passu basis withthat do not guarantee the 9.875% 20256.750% 2030 Senior Secured Notes and 6.75% 2026 Senior Secured Notes, on substantially all of our assets and the assets of the guarantors, other than the ABL Collateral, and (ii) a second-priority lien on the ABL Collateral, which is junior to a first-priority lien for the benefit of the lenders under our ABL Facility.Notes.
The 4.875% 20246.750% 2030 Senior Secured Notes may be redeemed, in whole or in part, at any time at our option upon not less than 30, and not10 days nor more than 60 days'days after prior notice is sent to the holders of the 4.875% 20246.750% 2030 Senior Secured Notes. The following is6.750% 2030 Senior Notes are redeemable prior to April 15, 2026, at a summary of redemption prices (expressed as a percentageprice equal to 100% of the principal amount thereof plus a "make-whole" premium set forth in the indenture. We may also redeem up to be redeemed) for our 4.875% 202435% of the aggregate principal amount of the 6.750% 2030 Senior Secured Notes:
| | | | | | | | | | | |
Redemption Period | | Redemption Price1
|
Beginning on January 15, 2021 | | 102.438 | | % |
Beginning on January 15, 2022 | | 101.219 | | |
Beginning on January 15, 2023 and thereafter | | 100.000 | | |
| | | |
1 Plus accrued and unpaid interest, if any, up to but excluding the redemption date.
|
Notes prior to April 15, 2026 at a redemption price equal to 106.750% of the principal amount thereof with the net cash proceeds of one or more equity offerings. The 6.750% 2030 Senior Notes are redeemable beginning on April 15, 2026, at a redemption price equal to 103.375% of the principal amount thereof, decreasing to 101.688% on April 15, 2027, and are redeemable at par beginning on April 15, 2028. In each case, we pay the applicable redemption and "make-whole" premiums plus accrued and unpaid interest, if any, to, but not including, the date of redemption.In addition, if a change in control triggering event, as defined in the indenture, occurs with respect to the 4.875% 20246.750% 2030 Senior Secured Notes, we will be required to offer to purchaserepurchase the notes at a purchase price equal to 101% of their principal amount, plus accrued and unpaid interest, if any, to, but not including, the date of purchase.repurchase.
The terms of the 4.875% 2024 Senior Secured Notes contain certain covenants; however, there are no financial covenants.
Outstanding Senior Unsecured Notes
Cliffs Senior Notes exchanged for AK Steel Corporation Senior Notes
On March 16, 2020, we entered into indentures, in each case among Cliffs, the guarantors party thereto and U.S. Bank National Association, as trustee, relating to the issuance by Cliffs of $232 million aggregate principal amount of 6.375% 2025 Senior Notes and $335 million aggregate principal amount of 7.00% 2027 Senior Notes. The new notes were issued in exchange for equal aggregate principal amounts of 6.375% 2025 AK Senior Notes and 7.00% 2027 AK Senior Notes, respectively, issued by AK Steel Corporation. The 6.375% 2025 Senior Notes and 7.00% 2027 Senior Notes were issued in connection with the AK Steel Merger pursuant to private exchange offers exempt from the registration requirements of the Securities Act made by Cliffs. Pursuant to the registration rights agreements executed in connection with the issuance of the new notes, we agreed to file registration statements with the SEC with respect to registered offers to exchange the 6.375% 2025 Senior Notes and 7.00% 2027 Senior Notes for publicly registered notes within 365 days of the closing date, with all significant terms and conditions remaining the same.
The 6.375% 2025 Senior Notes and 7.00% 2027 Senior Notes are unsecured obligations and rank equally in right of payment with all of our existing and future unsecured and unsubordinated indebtedness. The notes are guaranteed on a senior unsecured basis by our material direct and indirect wholly owned domestic subsidiaries and, therefore, are structurally senior to any of our existing and future indebtedness that is not guaranteed by such guarantors and are structurally subordinated to all existing and future indebtedness and other liabilities of our subsidiaries that do not guarantee the notes.
In addition, if a change in control triggering event, as defined in the indentures, occurs with respect to the 6.375% 2025 Senior Notes or 7.00% 2027 Senior Notes, we will be required to offer to purchase the notes at a purchase price equal to 101% of their principal amount, plus accrued and unpaid interest, if any, to, but not including, the date of purchase.
The terms of the 6.375% 2025 Senior Notes and 7.00% 20276.750% 2030 Senior Notes contain certain customary covenants; however, there are no financial covenants.
6.375% 2025 Senior Notes
The 6.375% 2025 Senior Notes bear interest at a rate of 6.375% per annum, payable semi-annually in arrears on April 15 and October 15 of each year, commencing on April 15, 2020. The 6.375% 2025 Senior Notes mature on October 15, 2025.
The 6.375% 2025 Senior Notes may be redeemed, in whole or in part, at any time at our option upon not less than 30, and not more than 60, days' prior notice sent to the holders of the 6.375% 2025 Senior Notes. The following is a summary of redemption prices (expressed as a percentage of the principal amount to be redeemed) for our 6.375% 2025 Senior Notes:
| | | | | | | | | | | |
Redemption Period | | Redemption Price1
|
Beginning on October 15, 2020 | | 103.188 | | % |
Beginning on October 15, 2021 | | 101.594 | | |
Beginning on October 15, 2022 and thereafter | | 100.000 | | |
| | | |
1 Plus accrued and unpaid interest, if any, up to but excluding the redemption date.
|
7.00% 2027 Senior Notes
The 7.00% 2027 Senior Notes bear interest at a rate of 7.00% per annum, payable semi-annually in arrears on March 15 and September 15 of each year, commencing on September 15, 2020. The 7.00% 2027 Senior Notes mature on March 15, 2027.
The 7.00% 2027 Senior Notes may be redeemed, in whole or in part, at any time at our option upon not less than 30, and not more than 60, days' prior notice sent to the holders of the 7.00% 2027 Senior Notes. The following is a summary of redemption prices (expressed as a percentage of the principal amount to be redeemed) for our 7.00% 2027 Senior Notes:
| | | | | | | | | | | |
Redemption Period | | Redemption Price1
|
Prior to March 15, 20222
| | 100.000 | | % |
Beginning on March 15, 2022 | | 103.500 | | |
Beginning on March 15, 2023 | | 102.333 | | |
Beginning on March 15, 2024 | | 101.167 | | |
Beginning on March 15, 2025 and thereafter | | 100.000 | | |
| | | |
1 Plus accrued and unpaid interest, if any, up to but excluding the redemption date.
|
2 Plus a "make-whole" premium.
|
AK Steel Corporation Unsecured Senior Notes
As of December 31, 2020, AK Steel Corporation had outstanding a total of $132 million aggregate principal amount of 7.625% 2021 AK Senior Notes, 7.50% 2023 AK Senior Notes, 6.375% 2025 AK Senior Notes and 7.00% 2027 AK Senior Notes. These senior notes are unsecured obligations and rank equally in right of payment with AK Steel Corporation's guarantees of Cliffs' unsecured and unsubordinated indebtedness. These notes contain no financial covenants.
The 7.625% 2021 AK Senior Notes, 7.50% 2023 AK Senior Notes, 6.375% 2025 AK Senior Notes and 7.00% 2027 AK Senior Notes may be redeemed, in whole or in part, at any time at our option upon not less than 30, and not more than 60, days' prior notice sent to the respective holders of such notes.
We may redeem the 7.625% 2021 AK Senior Notes at 100.000% of their principal amount, together with all accrued and unpaid interest to the date of redemption.
The following is a summary of redemption prices (expressed as a percentage of the principal amount to be redeemed) for the 7.50% 2023 AK Senior Notes:
| | | | | | | | | | | |
Redemption Period | | Redemption Price1
|
Beginning on July 15, 2020 | | 101.875 | | % |
Beginning on July 15, 2021 and thereafter | | 100.000 | | |
| | | |
1 Plus accrued and unpaid interest, if any, up to but excluding the redemption date.
|
The following is a summary of redemption prices (expressed as a percentage of the principal amount to be redeemed) for the 6.375% 2025 AK Senior Notes:
| | | | | | | | | | | |
Redemption Period | | Redemption Price1
|
Beginning on October 15, 2020 | | 103.188 | | % |
Beginning on October 15, 2021 | | 101.594 | | |
Beginning on October 15, 2022 and thereafter | | 100.000 | | |
| | | |
1 Plus accrued and unpaid interest, if any, up to but excluding the redemption date.
|
The following is a summary of redemption prices (expressed as a percentage of the principal amount to be redeemed) for the 7.00% 2027 AK Senior Notes:
| | | | | | | | | | | |
Redemption Period | | Redemption Price1
|
Prior to March 15, 20222
| | 100.000 | | % |
Beginning on March 15, 2022 | | 103.500 | | |
Beginning on March 15, 2023 | | 102.333 | | |
Beginning on March 15, 2024 | | 101.167 | | |
Beginning on March 15, 2025 and thereafter | | 100.000 | | |
| | | |
1 Plus accrued and unpaid interest, if any, up to but excluding the redemption date.
|
2 Plus a "make-whole" premium.
|
1.50% 2025 Convertible Senior Notes
The 1.50% 2025 Convertible Senior Notes bear interest at a rate of 1.50% per year, payable semiannually in arrears on January 15 and July 15 of each year. The 1.50% 2025 Convertible Senior Notes mature on January 15, 2025. The 1.50% 2025 Convertible Senior Notes are senior unsecured obligations and rank senior in right of payment to any of our indebtedness that is expressly subordinated in right of payment to the 1.50% 2025 Convertible Senior Notes; equal in right of payment to any of our unsecured indebtedness that is not so subordinated; effectively junior in right of payment to any of our secured indebtedness to the extent of the value of the assets securing such indebtedness; and structurally junior to all indebtedness and other liabilities (including trade payables) of our subsidiaries. The terms of the 1.50% 2025 Convertible Senior Notes contain certain customary covenants; however, there are no financial covenants.
Holders may convert their 1.50% 2025 Convertible Senior Notes at their option at any time prior to the close of business on the business day immediately preceding July 15, 2024, only under the following circumstances: (1) during any calendar quarter commencing after the calendar quarter ending on March 31, 2018, if the last reported sale price of our common shares, par value $0.125 per share, for at least 20 trading days (whether or not consecutive) during a period of 30 consecutive trading days ending on the last trading day of the immediately preceding calendar quarter is greater than or equal to 130% of the conversion price on each applicable trading day; (2) during the five-business day period after any five-consecutive trading day period (the “measurement period”) in which the trading price per $1,000 principal amount of 1.50% 2025 Convertible Senior Notes for each trading day of the measurement period was less than 98% of the product of the last reported sale price of our common shares and the conversion rate on each such trading day; (3) if we call the notes for redemption, at any time prior to the close of business on the scheduled trading day immediately preceding the redemption date; or (4) upon the occurrence of specified corporate events. On or after July 15, 2024 until the close of business on the second scheduled trading day immediately preceding the maturity date, holders may convert their 1.50% 2025 Convertible Senior Notes at any time, regardless of the foregoing circumstances. Upon conversion, we will pay or deliver, as the case may be, cash, common shares or a combination of cash and common shares, at our election.
Upon the issuance of the 1.50% 2025 Convertible Senior Notes the initial conversion rate was 122.4365 common shares per $1,000 principal, with a conversion price of $8.17 per common share. The conversion rate is subject to adjustment in some circumstances, including the payment of dividends on common shares, but will not be adjusted for any accrued and unpaid interest. In addition, following certain corporate events that occur prior to the maturity date, or if we deliver a notice of redemption, we will, in certain circumstances, increase the conversion rate for a holder who elects to convert its 1.50% 2025 Convertible Senior Notes in connection with such a corporate event or notice of redemption, as the case may be. As of December 31, 2020, the conversion rate was 129.2985 common shares per $1,000 principal amount of 1.50% 2025 Convertible Senior Notes.
We may not redeem the 1.50% 2025 Convertible Senior Notes prior to January 15, 2022. We may redeem all or any portion of the 1.50% 2025 Convertible Senior Notes, for cash at our option on or after January 15, 2022 if the last reported sale price of our common shares has been at least 130% of the conversion price then in effect for at least 20 trading days (whether or not consecutive) during any 30-consecutive trading day period (including the last trading day of such period) ending on, and including, the trading day immediately preceding the date on which we provide notice of redemption at a redemption price equal to 100% of the principal amount of the 1.50% 2025 Convertible Senior Notes to be redeemed, plus accrued and unpaid interest to, but excluding, the redemption date.
It is our current intent to settle conversions through combination settlement or fully in cash. Our ability to settle conversions through combination settlement and cash settlement will be subject to restrictions in the agreement governing our ABL Facility and may be subject to restrictions in agreements governing our future debt.
If we undergo a fundamental change as defined in the indenture, holders may require us to repurchase for cash all or any portion of their 1.50% 2025 Convertible Senior Notes at a fundamental change repurchase price equal to 100% of the principal amount of the 1.50% 2025 Convertible Senior Notes to be repurchased, plus accrued and unpaid interest to, but excluding, the fundamental change repurchase date.
In accounting for the issuance of the notes, we separated the 1.50% 2025 Convertible Senior Notes into liability and equity components. The carrying amount of the liability component was calculated by measuring the fair value of similar liabilities that did not have associated convertible features. The carrying amount of the equity component of $86 million representing the conversion option was determined by deducting the fair value of the liability component from the par value of the notes. The difference represents the debt discount that is amortized to interest expense over the term of the notes. The equity component is not remeasured as long as it continues to qualify for equity classification.
Other Outstanding Unsecured Senior NotesCLEVELAND-CLIFFS INC. OTHER OUTSTANDING UNSECURED SENIOR NOTES
The following represents a summary of our other unsecured senior notes' maturity and interest payable due dates:
| | | | | | | | | | | | | | |
| Debt Instrument | | Maturity | | Interest Payable
(until maturity) |
5.75% 20257.000% 2027 Senior Notes | | March 15, 2027 | | March 15 and September 15 |
| 5.875% 2027 Senior Notes | | June 1, 2027 | | June 1 and December 1 |
| 4.625% 2029 Senior Notes | | March 1, 20252029 | | March 1 and September 1 |
| | | | |
| 4.875% 2031 Senior Notes | | March 1, 2031 | | March 1 and September 1 |
5.875% 2027 Senior Notes | | June 1, 2027 | | June 1 and December 1 |
6.25%6.250% 2040 Senior Notes | | October 1, 2040 | | April 1 and October 1 |
The senior notes are unsecured obligations and rank equally in right of payment with all our other existing and future unsecured and unsubordinated indebtedness. There are no subsidiary guarantees of the interest and principal amounts for the 6.25% 2040The 7.000% 2027 Senior Notes. The 5.75% 2025Notes, 5.875% 2027 Senior Notes, 4.625% 2029 Senior Notes and 5.875% 20274.875% 2031 Senior Notes are guaranteed on a senior unsecured basis by our material direct and indirect wholly owned domestic subsidiaries and, therefore, are structurally senior to any of our existing and future indebtedness that is not guaranteed by such guarantors and are structurally subordinated to all existing and future indebtedness and other liabilities of our subsidiaries that do not guarantee the 5.75% 2025notes. There are no subsidiary guarantees of the interest and principal amounts for the 6.250% 2040 Senior Notes.
The 7.000% 2027 Senior Notes and 5.875% 2027 Senior Notes.
We may redeem the 5.75% 2025 Senior Notes,be redeemed, in whole or in part, at any time at our option upon not less than 30, and not more than 60, days' prior notice sent to the holders. The 7.000% 2027 Senior Notes are redeemable at a price equal to 102.333% of the principal amount thereof, decreasing to 101.167% on or after March 1, 2020,15, 2024 and are redeemable at par beginning on March 15, 2025. In each case, we pay the redemption prices set forth in the indenture,premiums plus accrued and unpaid interest, if any, to, but not including, the date of redemption.
We may redeem theThe 5.875% 2027 Senior Notes may be redeemed, in whole or in part, at any time at our option upon not less than 30, and not more than 60, days' prior notice sent to the holders. The 5.875% 2027 Senior Notes are redeemable at a price equal to 101.958% of the principal amount thereof, decreasing to 100.979% on or after June 1, 2022,2024 and are redeemable at par beginning on June 1, 2025. In each case, we pay the redemption prices set forth in the indenture,premiums plus accrued and unpaid interest, if any, to, but not including, the date of redemption, andredemption.
The 4.625% 2029 Senior Notes may be redeemed, in whole or in part, on not less than 10, nor more than 60, days’ prior notice sent to the holders of the notes. The 4.625% 2029 Senior Notes are redeemable prior to JuneMarch 1, 2022,2024, at a redemption price equal to 100% of the principal amount thereof plus a “make-whole”"make-whole" premium set forth in the indenture,indenture. We may also redeem up to 35% of the aggregate principal amount of the 4.625% 2029 Senior Notes prior to March 1, 2024 at a redemption price equal to 104.625% of the principal amount thereof with the net cash proceeds of one or more equity offerings. The 4.625% 2029 Senior Notes are redeemable beginning on March 1, 2024, at a redemption price equal to 102.313% of the principal amount thereof, decreasing to 101.156% on March 1, 2025 and are redeemable at par beginning on March 1, 2026. In each case, we pay the redemption and "make-whole" premiums plus accrued and unpaid interest, if any, to, but not including, the date of redemption.
The 4.875% 2031 Senior Notes may be redeemed, in whole or in part, on not less than 10, nor more than 60, days’ prior notice sent to the holders of the notes. The 4.875% 2031 Senior Notes are redeemable prior to March 1, 2026, at a redemption price equal to 100% of the principal amount thereof plus a "make-whole" premium set forth in the indenture. We may also redeem up to 35% of the aggregate principal amount of the 5.875% 20274.875% 2031 Senior Notes on or prior to JuneMarch 1, 20222026 at a redemption price equal to 105.875%104.875% of the principal amount thereof with the net cash proceeds of one or more equity offerings. The 4.875% 2031 Senior Notes are redeemable beginning on March 1, 2026, at a redemption price equal to 102.438% of the principal amount thereof, decreasing to 101.625% on March 1, 2027, 100.813% on March 1, 2028 and are redeemable at par beginning on March 1, 2029.
In each case, we pay the redemption and "make-whole" premiums plus accrued and unpaid interest, if any, to, but not including, the date of redemption with the net cash proceeds of one or more equity offerings.redemption.
The 6.25%6.250% 2040 Senior Notes may be redeemed any time at our option upon not less than 30, nor more than 60, days' prior notice is sent to the holders. The 6.25%6.250% 2040 Senior Notes are redeemable at a redemption price equal to the greater of (1) 100% of the principal amount of the notes to be redeemed or (2) the sum of the present values of the remaining scheduled payments of principal and interest on the notes to be redeemed, discounted to the redemption date on a semi-annual basis at the treasury rate plus 40 basis points, plus accrued and unpaid interest, if any, to, but not including, the date of redemption.
In addition, if a change of control triggering event, as defined in the applicable indenture, occurs with respect to the unsecured notes, we will be required to offer to purchase the notes of the applicable series at a purchase price equal to 101% of the principal amount, plus accrued and unpaid interest, if any, to, but not including, the date of purchase.
The terms of the unsecured notes contain certain customary covenants; however, there are no financial covenants.
AK STEEL CORPORATION UNSECURED SENIOR NOTES
As of December 31, 2023, AK Steel had outstanding a total of $56 million aggregate principal amount of 7.000% 2027 AK Senior Notes. These senior notes are unsecured obligations and rank equally in right of payment with AK Steel's guarantees of Cliffs' unsecured and unsubordinated indebtedness. These notes contain no financial covenants.
The 7.000% 2027 AK Senior Notes may be redeemed, in whole or in part, at any time at our option upon not less than 30, and not more than 60, days' prior notice sent to the holders. The 7.000% 2027 AK Senior Notes are redeemable at a price equal to 102.333% of the principal amount thereof, decreasing to 101.167% on March 15, 2024 and are redeemable at par beginning on March 15, 2025. In each case, we pay the redemption premiums plus accrued and unpaid interest, if any, to, but not including, the date of redemption.
ABL FacilityFACILITY
On March 13, 2020, in connection with the AK Steel Merger,June 9, 2023, we entered into a newthe Fourth ABL Amendment to our ABL Facility. The Fourth ABL Amendment increased the amount of tranche A revolver commitments thereunder by an additional $250 million to an aggregate principal amount of $4.75 billion. As of December 31, 2023, the ABL Facility with various financial institutions to replace and refinance Cliffs’ Former ABL Facility and AK Steel Corporation’s former revolving credit facility. The ABL Facility will mature upon the earlier of March 13, 2025 or 91 days prior to the maturity of certain other material debt and providedprovides for up to $2$4.75 billion in borrowings, including a $555 million sublimit for the issuance of letters of credit and a $125$200 million sublimit for swingline loans. The Fourth ABL Amendment also extended the maturity date of all commitments under the ABL Facility from March 13, 2025 to June 9, 2028 or 91 days prior to the maturity of certain other material debt. Availability under the ABL Facility is limited to an eligible borrowing base, as applicable, determined by applying customary advance rates to eligible accounts receivable, inventory and certain mobile equipment.
On March 27, 2020,The Fourth ABL Amendment removed the ABL Facility was amended, byLIBOR option for variable loans due to its cessation and among Cliffs, the lenders and the administrative agent. The amendment modified the ABL Facility to, among other things, provide forreplaced it with a new FILO tranche B of commitments in the aggregate amount of $150 million by exchanging existing commitments under the ABL Facility. The total commitmentsSOFR option. Borrowings under the ABL Facility after giving effectbear interest, at our option, at a base rate, or if certain conditions are met, a SOFR rate, in each case, plus an applicable tiered margin. The base rate is equal to the amendment remained at $2 billion. The termsgreater of the federal funds rate plus 0.5% or the term SOFR plus 1.25%. In addition, there is an unused commitment fee of between 0.25% and conditions (other than the pricing) that apply0.35%, which is applied to the FILO tranche are substantially the same as the terms and conditions that apply to the tranche A facilityunused portion of the ABL Facility immediately prior to the amendment.
On December 9, 2020, we entered into the ABL Amendment with various financial institutions. The ABL Amendment modified the ABL Facility to, among other things, increase the amount of tranche A revolver commitments available thereunder by an additional $1.5 billion and increase certain dollar baskets related to certain negative covenants that apply to the ABL Facility. After giving effect to the ABL Amendment, the aggregate principal amount of tranche A revolver commitments under the ABL Facility is $3.35 billion and the aggregate principal amount of FILO tranche B revolver commitments under the ABL Facility remains at $150 million.
The ABL Facility and certain bank products and hedge obligations are guaranteed by certain of our existing wholly owned U.S. subsidiaries and are required to be guaranteed by certain of our future U.S. subsidiaries. Amounts outstanding under the ABL Facility are secured by (i) a first-priority security interest in the accounts receivable and other rights to payment, inventory, as-extracted collateral, certain investment property, deposit accounts, securities accounts, certain general intangibles and commercial tort claims, certain mobile equipment, commodities accounts and other related assets of ours, the other borrowers and the guarantors, and proceeds and products of each of the foregoing (collectively, the “ABL Collateral”) and (ii) a second-priority security interest in substantially all of our assets and the assets of the other borrowers and the guarantors other than the ABL Collateral.
Borrowings under the ABL Facility bear interest, at our option, at a base rate or, if certain conditions are met, a LIBOR rate, in each case plus an applicable margin. We may amend our ABL Facility to replace the LIBOR rate with one or more secured overnight financing based rates or an alternative benchmark rate, giving consideration to any evolving or then-existing convention for similar dollar denominated syndicated credit facilities for such alternative benchmarks.
The ABL Facility contains customary representations and warranties and affirmative and negative covenants including, among others, covenants regarding the maintenance of certain financial ratios if certain conditions are triggered, covenants relating to financial reporting, covenants relating to the payment of dividends on, or purchase or redemption of, our capital stock, covenants relating to the incurrence or prepayment of certain debt, covenants relating to the incurrence of liens or encumbrances, covenants relating to compliance with laws, covenants relating to transactions with affiliates, covenants relating to mergers and sales of all or substantially all of our assets and limitations on changes in the nature of our business. As of December 31, 2023 and 2022, we were in compliance with the ABL Facility liquidity requirements and, therefore, the springing financial covenant requiring a minimum fixed charge coverage ratio of 1.0 to 1.0 was not applicable.
The ABL Facility provides for customary events of default, including, among other things, the event of nonpayment of principal, interest, fees or other amounts, a representation or warranty proving to have been materially incorrect when made, failure to perform or observe certain covenants within a specified period of time, a cross-default to certain material indebtedness, the bankruptcy or insolvency of the Company and certain of its subsidiaries, monetary judgment defaults of a specified amount, invalidity of any loan documentation, a change of control of the Company, and ERISA defaults resulting in liability of a specified amount. If an event of default exists (beyond any applicable grace or cure period), the administrative agent may, and at the direction of the requisite number of lenders shall, declare all amounts owing under the ABL Facility immediately due and payable, terminate such lenders’ commitments to make loans under the ABL Facility and/or exercise any and all remedies and other rights under the ABL Facility. For certain events of default related to insolvency and receivership, the commitments of the lenders will be automatically terminated and all outstanding loans and other amounts will become immediately due and payable.
10578 | CLF 2023 FORM 10-K
As of December 31, 2020 and 2019, we were in compliance with the ABL Facility liquidity requirements and, therefore, the springing financial covenant requiring a minimum fixed charge coverage ratio of 1.0 to 1.0 was not applicable.
The following represents a summary of our borrowing capacity under the ABL Facility:
| | | | | |
| December 31, |
| (In Millions)millions) |
| December 31,
20202023 |
Available borrowing base on ABL Facility1 | $ | 3,5004,397 | |
| Borrowings | (1,510)— | |
Letter of credit obligations2 | (247)(56) | |
| Borrowing capacity available | $ | 1,7434,341 | |
| |
1 As of December 31, 2020,2023, the ABL Facility has a maximum borrowing base of $3.5$4.75 billion. The available borrowing base is determined by applying customary advance rates to eligible accounts receivable, inventory and certain mobile equipment. |
2 We issued standby letters of credit with certain financial institutions in order to support business obligations, including, but not limited to, operating agreements, employee severance, environmental obligations, workers' compensation, employee severance,and insurance operating agreements, IRBs and environmental obligations. |
Other Financing Arrangements
Industrial Revenue Bonds
AK Steel Corporation had outstanding $66 million aggregate principal amount of fixed-rate, tax-exempt IRBs as of December 31, 2020. The weighted-average fixed rate of these IRBs is 6.86%. These IRBs are unsecured senior debt obligations that are equal in ranking with AK Steel Corporation's senior notes and AK Steel Corporation's guarantees of Cliffs' unsubordinated indebtedness. These IRBs are effectively subordinated to AK Steel Corporation’s guarantees of Cliffs’ secured indebtedness to the extent of the value of AK Steel Corporation’s assets securing such guarantees. In addition, AK Steel Corporation had outstanding $26 million aggregate principal amount of variable-rate IRBs as of December 31, 2020 that are backed by a letter of credit. These IRBs contain certain customary covenants; however, there are no financial covenants.
EDC Revolving Facility
On November 9, 2020, our Canadian subsidiaries Fleetwood Metal Industries Inc. and The Electromac Group Inc. entered into a new revolving facility with Export Development Canada. The EDC Revolving Facility enables our Tooling and Stamping business to finance the purchase of tooling and related equipment to manufacture and process long lead-time parts for our automotive customers. The EDC Revolving Facility provides for up to $40 million in borrowings and expires in November 2022. Borrowings under the EDC Revolving Facility bear interest at a LIBOR rate plus a base rate. The EDC Revolving Facility is secured by the assets of Fleetwood Metal Industries Inc. and The Electromac Group Inc. and fully guaranteed by Cliffs. As of December 31, 2020, we had outstanding borrowings on the EDC Revolving Facility of $18 million.
Debt Extinguishment - 2020
During the year ended December 31, 2020, we used the net proceeds from the offering of the additional 9.875% 2025 Senior Secured Notes to repurchase $736 million aggregate principal amount of our outstanding senior notes of various series, which resulted in a net debt reduction of $181 million. We also repurchased an additional $35 million aggregate principal amount of our outstanding senior notes of various series and we redeemed $7 million aggregate principal amount of our outstanding 2020 IRBs, with cash on hand.
Additionally, in connection with the AK Steel Merger, we purchased $364 million aggregate principal amount of 7.625% 2021 AK Senior Notes and $311 million aggregate principal amount of 7.50% 2023 AK Senior Notes upon early settlement of tender offers made by Cliffs. The net proceeds from the offering of 6.75% 2026 Senior Secured Notes, along with a portion of the ABL Facility borrowings, were used to fund such purchases. As the 7.625% 2021 AK Senior Notes and 7.50% 2023 AK Senior Notes were recorded at fair value just prior to being purchased, there was no gain or loss on extinguishment. Additionally, in connection with the final settlement of the tender offers, we purchased $9 million aggregate principal amount of the 7.625% 2021 AK Senior Notes and $56 million aggregate principal amount of the 7.50% 2023 AK Senior Notes with cash on hand.
The following is a summary of the debt extinguished and the respective impact on extinguishment:
| | | | | | | | | | | |
| (In Millions) |
| Year Ended
December 31, 2020 |
| Debt Extinguished | | Gain (Loss) on Extinguishment |
| 7.625% 2021 AK Senior Notes | $ | 373 | | | $ | 0 | |
| 7.50% 2023 AK Senior Notes | 367 | | | 3 | |
| 4.875% 2024 Senior Secured Notes | 6 | | | 1 | |
| 6.375% 2025 Senior Notes | 168 | | | 21 | |
| 1.50% 2025 Convertible Senior Notes | 20 | | | 1 | |
| 5.75% 2025 Senior Notes | 77 | | | 16 | |
| 7.00% 2027 Senior Notes | 262 | | | 27 | |
| 5.875% 2027 Senior Notes | 195 | | | 49 | |
| 6.25% 2040 Senior Notes | 36 | | | 13 | |
| 6.375% 2025 AK Senior Notes | 9 | | | (1) | |
| Total | $ | 1,513 | | | $ | 130 | |
Subsequent to the year ended December 31, 2020, we consummated an underwritten public offering of our common shares and a private offering of new senior unsecured notes. We intend to use the net proceeds to us from the underwritten public offering of our common shares, plus cash on hand, to redeem up to approximately $334 million aggregate principal amount of our outstanding 9.875% 2025 Senior Secured Notes. We intend to use any remaining net proceeds from the underwritten public offering of our common shares following such redemption to reduce borrowings under our ABL Facility. We intend to use the net proceeds from the private notes offering to redeem all of our outstanding 4.875% 2024 Senior Secured Notes, 7.625% 2021 AK Senior Notes, 7.50% 2023 AK Senior Notes, 6.375% 2025 Senior Notes and 6.375% 2025 AK Senior Notes, and pay fees and expenses in connection with such redemptions, and reduce borrowings under our ABL Facility. Refer to NOTE 22 - SUBSEQUENT EVENTS for further information regarding the offerings consummated subsequent to the year ended December 31, 2020.
Debt Extinguishment - 2019
During the year ended December 31, 2019, we used the net proceeds from the issuance of $750 million aggregate principal amount of 5.875% 2027 Senior Notes, along with cash on hand, to redeem in full all of our outstanding 4.875% 2021 Senior Notes and to fund the repurchase of $600 million aggregate principal amount of our outstanding 5.75% 2025 Senior Notes in a tender offer.
The following is a summary of the debt extinguished and the respective impact on extinguishment:
| | | | | | | | | | | |
| (In Millions) |
| Year Ended
December 31, 2019 |
| Debt Extinguished | | (Loss) on Extinguishment |
| 4.875% 2021 Senior Notes | $ | 124 | | | $ | (5) | |
| 5.75% 2025 Senior Notes | 600 | | | (13) | |
| Total | $ | 724 | | | $ | (18) | |
Debt Extinguishment - 2018
During the year ended December 31, 2018, we redeemed in full all of our outstanding 5.90% 2020 Senior Notes and 4.80% 2020 Senior Notes with cash on hand. Additionally, we purchased certain of our 4.875% 2021 Senior Notes and 5.75% 2025 Senior Notes.
The following is a summary of the debt extinguished and the respective impact on extinguishment:
| | | | | | | | | | | |
| (In Millions) |
| Year Ended
December 31, 2018 |
| Debt Extinguished | | (Loss) on Extinguishment |
| 5.90% 2020 Senior Notes | $ | 89 | | | $ | (3) | |
| 4.80% 2020 Senior Notes | 122 | | | (4) | |
| 4.875% 2021 Senior Notes | 14 | | | 0 | |
| 5.75% 2025 Senior Notes | 2 | | | 0 | |
| Total | $ | 227 | | | $ | (7) | |
Debt MaturitiesDEBT MATURITIES
The following represents a summary of our debt instrument maturities based on the principal amounts outstanding at December 31, 2020:2023 (in millions):
| | | | | |
| (In Millions) |
| Maturities of Debt |
| 2021 | $ | 34 | |
| 2022 | 0 | |
| 2023 | 13 | |
| 2024 | 457 | |
| 2025 | 1,740 | |
| Thereafter | 3,351 | |
| Total maturities of debt | $ | 5,595 | |
| | | | | | | | | | | | | | | | | | | | | | | | | | | | | | | | | | | | | | |
| 2024 | | 2025 | | 2026 | | 2027 | | 2028 | | Thereafter | | Total |
| $ | — | | | $ | — | | | $ | 829 | | | $ | 685 | | | $ | — | | | $ | 1,678 | | | $ | 3,192 | |
NOTE 9 - FAIR VALUE OF FINANCIAL INSTRUMENTS
There were no significant assets or liabilities measured at fair value as of December 31, 2020. The following represents the assets and liabilities measured at fair value as of December 31, 2019:
| | | | | | | | | | | | | | | | | | | | | | | |
| (In Millions) |
| December 31, 2019 |
| Quoted Prices in Active
Markets for Identical
Assets/Liabilities (Level 1) | | Significant Other Observable Inputs
(Level 2) | | Significant Unobservable Inputs
(Level 3) | | Total |
| Assets: | | | | | | | |
| Cash equivalents - Commercial paper | $ | 0 | | | $ | 188 | | | $ | 0 | | | $ | 188 | |
| Other current assets: | | | | | | | |
| Customer supply agreement | 0 | | | 0 | | | 45 | | | 45 | |
| Total | $ | 0 | | | $ | 188 | | | $ | 45 | | | $ | 233 | |
The valuation of financial assets classified in Level 2 was determined using a market approach based upon quoted prices for similar assets in active markets, or other inputs that were observable.
Our supply agreement with ArcelorMittal USA contained provisions for supplemental revenue or refunds based on the HRC price in the year the iron ore product was consumed in ArcelorMittal USA’s blast furnaces. We accounted for these provisions as derivative instruments at the time of sale and adjusted the derivative instruments to fair value through Revenues each reporting period until the product was consumed and the amounts were settled. These instruments were classified as Level 3 assets. Upon the completion of the AM USA Transaction, the outstanding derivatives were settled as part of acquisition accounting.
The following tables represent a reconciliation of the changes in fair value of financial instruments measured at fair value on a recurring basis using significant unobservable inputs (Level 3):
| | | | | | | | | | | |
| (In Millions) |
| Level 3 Assets |
| 2020 | | 2019 |
| Beginning balance - January 1 | $ | 45 | | | $ | 89 | |
| Total gains included in earnings | 122 | | | 79 | |
| Settlements | (27) | | | (123) | |
| Settlement of pre-existing relationship | (140) | | | 0 | |
| Ending balance - December 31 | $ | 0 | | | $ | 45 | |
| Total gains for the period included in earnings attributable to the change in unrealized gains on assets still held at the reporting date | $ | 0 | | | $ | 45 | |
The carrying values of certain financial instruments (e.g. Accounts receivable, net, Accounts payable and Other current liabilities) approximate fair value and, therefore, have been excluded from the table below. A summary of the carrying value and fair value of other financial instruments were as follows:
| | | | | | | | | | | | | | | | | | | | | | | | | | | | | |
| | | (In Millions) |
| | | December 31, 2020 | | December 31, 2019 |
| Classification | | Carrying
Value | | Fair Value | | Carrying
Value | | Fair Value |
| Senior notes | Level 1 | | $ | 3,802 | | | $ | 4,446 | | | $ | 2,114 | | | $ | 2,237 | |
| IRBs due 2024 to 2028 | Level 1 | | 94 | | | 91 | | | 0 | | | 0 | |
| EDC Revolving Facility - outstanding balance | Level 2 | | 18 | | | 18 | | | 0 | | | 0 | |
| ABL Facility - outstanding balance | Level 2 | | 1,510 | | | 1,510 | | | 0 | | | 0 | |
| Total | | | $ | 5,424 | | | $ | 6,065 | | | $ | 2,114 | | | $ | 2,237 | |
The fair value of both current and long-term debt was determined using quoted market prices.
NOTE 10 - PENSIONS AND OTHER POSTRETIREMENT BENEFITS
We offer benefits through defined benefit pension plans, defined contribution pension plans and OPEB plans to a significant portion of our employees and retirees. Benefits are also provided through multiemployer plans for certain union members.
As a result of the acquisitions of AK Steel and ArcelorMittal USA, we assumed the obligations under their defined benefit pension plans, OPEB plans, defined contribution plans and commitments to multiemployer pension plans according to collective bargaining agreements that cover certain union-represented employees. The AK Steel defined benefit pension plans and OPEB plans acquired amounted to a benefit obligation, net of assets of $949 million based on a March 13, 2020 measurement. The ArcelorMittal USA defined benefit pension plans and OPEB plans acquired amounted to a benefit obligation, net of assets of $3,294 million based on a December 9, 2020 measurement.
Defined Benefit Pension PlansDEFINED BENEFIT PENSION PLANS
The defined benefit pension plans are largely noncontributory and limited in participation. Most plans are closed to new participants with only the legacy iron ore hourly and salaried plans still open. The pension benefit
calculations vary by plan but are generally based on employee'semployees' years of service and compensation or a fixed rate and years of service. Certain salaried plans calculate benefits using a cash balance formula, which earns interest credits and allocations based on a percent of pay.
OPEB PlansPLANS
We offer postretirement health care and life insurance benefits to retirees through various funded and unfunded plans. The vast majority of our plans are closed to new participants. In lieu of retiree medical coverage, many union-represented employees receive a 401(k) contribution per hour worked to a restricted Retiree Health Care Account. Cost sharing features between the employer and retiree vary by plan and several plans include employer caps. Retiree healthcare coverage is provided through programs administered by insurance companies whose charges are based on benefits paid. Certain labor agreements require the funding of VEBAs, which, depending on funding levels, may be used to reimburse the employer for paid benefits.
11079 | CLF 2023 FORM 10-K
Obligations and Funded Status
OBLIGATIONS AND FUNDED STATUS
The following tables and information provide additional disclosures:
| | (In Millions) |
| Pension Benefits | | OPEB |
| (In millions) | | (In millions) | Pension Benefits | | OPEB |
| Change in benefit obligations: | Change in benefit obligations: | 2020 | | 2019 | | 2020 | | 2019 | Change in benefit obligations: | 2023 | | 2022 | | 2023 | | 2022 |
| Benefit obligations — beginning of year | Benefit obligations — beginning of year | $ | 1,021 | | | $ | 906 | | | $ | 255 | | | $ | 242 | |
| Service cost | Service cost | 23 | | | 17 | | | 8 | | | 2 | |
| Interest cost | Interest cost | 64 | | | 35 | | | 19 | | | 10 | |
| | Actuarial loss | 162 | | | 112 | | | 14 | | | 19 | |
| Plan amendments | |
| Actuarial loss (gain) | |
| Benefits paid | Benefits paid | (146) | | | (62) | | | (89) | | | (26) | |
| Participant contributions | Participant contributions | 0 | | | 0 | | | 22 | | | 6 | |
| Acquired through business combinations | 5,535 | | | 0 | | | 3,528 | | | 0 | |
| Effect of settlement | Effect of settlement | (94) | | | 0 | | | 0 | | | 0 | |
| Other | Other | 0 | | | 13 | | | 0 | | | 2 | |
| Benefit obligations — end of year | Benefit obligations — end of year | $ | 6,565 | | | $ | 1,021 | | | $ | 3,757 | | | $ | 255 | |
| | Change in plan assets: | Change in plan assets: | |
| Change in plan assets: | |
| Change in plan assets: | |
| Fair value of plan assets — beginning of year | |
| Fair value of plan assets — beginning of year | |
| Fair value of plan assets — beginning of year | Fair value of plan assets — beginning of year | $ | 749 | | | $ | 687 | | | $ | 260 | | | $ | 240 | |
| Actual return on plan assets | Actual return on plan assets | 472 | | | 98 | | | 45 | | | 35 | |
| Participant contributions | Participant contributions | 0 | | | 0 | | | 17 | | | 1 | |
| Employer contributions | Employer contributions | 50 | | | 16 | | | 30 | | | 3 | |
| Benefits paid | Benefits paid | (146) | | | (62) | | | (88) | | | (19) | |
| Acquired through business combinations | 4,301 | | | 0 | | | 519 | | | 0 | |
| | Effect of settlement | Effect of settlement | (94) | | | 0 | | | 0 | | | 0 | |
| Other | 0 | | | 10 | | | 0 | | | 0 | |
| Effect of settlement | |
| Effect of settlement | |
| | Fair value of plan assets — end of year | |
| Fair value of plan assets — end of year | |
| Fair value of plan assets — end of year | Fair value of plan assets — end of year | $ | 5,332 | | | $ | 749 | | | $ | 783 | | | $ | 260 | |
| Funded status | Funded status | $ | (1,233) | | | $ | (272) | | | $ | (2,974) | | | $ | 5 | |
| | Amounts recognized in Statements of Financial Position: | Amounts recognized in Statements of Financial Position: | |
| Amounts recognized in Statements of Financial Position: | |
| Amounts recognized in Statements of Financial Position: | |
| Non-current assets | Non-current assets | $ | 3 | | | $ | 0 | | | $ | 54 | | | $ | 49 | |
| Current liabilities | (12) | | | 0 | | | (139) | | | (4) | |
| Non-current assets | |
| Non-current assets | |
Current liabilities1 | |
| Non-current liabilities | Non-current liabilities | (1,224) | | | (272) | | | (2,889) | | | (40) | |
| Total amount recognized | Total amount recognized | $ | (1,233) | | | $ | (272) | | | $ | (2,974) | | | $ | 5 | |
| | Amounts recognized in accumulated other comprehensive loss: | |
| Net actuarial loss | $ | 164 | | | $ | 382 | | | $ | 56 | | | $ | 73 | |
| Amounts recognized in accumulated other comprehensive loss (income): | |
| Amounts recognized in accumulated other comprehensive loss (income): | |
| Amounts recognized in accumulated other comprehensive loss (income): | |
| Net actuarial gain | |
| Net actuarial gain | |
| Net actuarial gain | |
| Prior service cost (credit) | Prior service cost (credit) | 6 | | | 7 | | | (6) | | | (8) | |
| Net amount recognized | Net amount recognized | $ | 170 | | | $ | 389 | | | $ | 50 | | | $ | 65 | |
| 1 Current liabilities are classified within Other current liabilities on the Statements of Consolidated Financial Position. | |
1 Current liabilities are classified within Other current liabilities on the Statements of Consolidated Financial Position. | |
1 Current liabilities are classified within Other current liabilities on the Statements of Consolidated Financial Position. | |
The accumulated benefit obligation for all defined benefit pension plans was $6,537$4,557 million and $1,010$4,628 million at December 31, 20202023 and 2019,2022, respectively.
11180 | CLF 2023 FORM 10-K
Components of Net Periodic Benefit Cost (Credit)COMPONENTS OF NET PERIODIC BENEFIT COST (CREDIT)
| | (In Millions) |
| Pension Benefits | | OPEB |
| 2020 | | 2019 | | 2018 | | 2020 | | 2019 | | 2018 |
| Pension Benefits | | | Pension Benefits | | OPEB |
| (In millions) | | (In millions) | 2023 | | 2022 | | 2021 | | 2023 | | 2022 | | 2021 |
| Service cost | Service cost | $ | 23 | | | $ | 17 | | | $ | 19 | | | $ | 8 | | | $ | 2 | | | $ | 2 | |
| Interest cost | Interest cost | 64 | | | 35 | | | 30 | | | 19 | | | 10 | | | 8 | |
| Expected return on plan assets | Expected return on plan assets | (140) | | | (55) | | | (60) | | | (20) | | | (17) | | | (18) | |
| Amortization: | Amortization: | |
| Net actuarial loss | 27 | | | 24 | | | 21 | | | 3 | | | 5 | | | 5 | |
| Net actuarial loss (gain) | |
| Net actuarial loss (gain) | |
| Net actuarial loss (gain) | |
| Prior service costs (credits) | Prior service costs (credits) | 1 | | | 1 | | | 2 | | | (2) | | | (2) | | | (3) | |
| Settlements | Settlements | (6) | | | 0 | | | 1 | | | 0 | | | 0 | | | 0 | |
| Net periodic benefit cost (credit) | Net periodic benefit cost (credit) | $ | (31) | | | $ | 22 | | | $ | 13 | | | $ | 8 | | | $ | (2) | | | $ | (6) | |
For 2021,2024, we estimate net periodic benefit cost (credit) as follows:
| | | | | |
| (In Millions)millions) | |
| Defined benefit pension plans | $ | (168)(58) | |
| OPEB plans | 86 (154) | |
| Total | $ | (82)(212) | |
Components of Accumulated Other Comprehensive Loss (Income)COMPONENTS OF OTHER COMPREHENSIVE LOSS (INCOME)
The following includes details on the significant actuarial losses (gains) impacting the benefit obligation:obligation and other components of other comprehensive loss (income):
| | (In Millions) |
| Pension Benefits | | OPEB |
| 2020 | | 2019 | | 2020 | | 2019 |
| Pension Benefits | | | Pension Benefits | | OPEB |
| (In millions) | | (In millions) | 2023 | | 2022 | | 2023 | | 2022 |
| Discount rates | Discount rates | $ | 181 | | | $ | 106 | | | $ | 44 | | | $ | 26 | |
| Demographic (gains) losses | (3) | | | 12 | | | (11) | | | 4 | |
Demographic updates1 | |
| Mortality | Mortality | (16) | | | (6) | | | (4) | | | (4) | |
| Per capita claims | 0 | | | 0 | | | (10) | | | (9) | |
Per capita healthcare costs and healthcare trend2 | |
| Other | Other | 0 | | | 0 | | | (5) | | | 3 | |
| Actuarial loss on benefit obligation | 162 | | | 112 | | | 14 | | | 20 | |
| Actual returns on assets over expected | (332) | | | (44) | | | (26) | | | (18) | |
| Amortization of net actuarial loss | (27) | | | (24) | | | (3) | | | (5) | |
| Actuarial loss (gain) on benefit obligation | |
| Actual returns on assets under (over) expected | |
| Amortization of net actuarial gain (loss) | |
| Amortization of prior service credits (costs) | Amortization of prior service credits (costs) | (1) | | | (1) | | | 2 | | | 2 | |
| Settlements | Settlements | 6 | | | 0 | | | 0 | | | 0 | |
| Other | (27) | | | 7 | | | (2) | | | (5) | |
| Total recognized in accumulated other comprehensive loss (income) | $ | (219) | | | $ | 50 | | | $ | (15) | | | $ | (6) | |
Plan amendments3 | |
| Total recognized in other comprehensive loss (income) | |
| 1 In 2023, the OPEB plans generated an actuarial gain relating to updates for demographic experience. We had adjustments relating to retirements, participation, persistency and census data updates. | |
1 In 2023, the OPEB plans generated an actuarial gain relating to updates for demographic experience. We had adjustments relating to retirements, participation, persistency and census data updates. | |
1 In 2023, the OPEB plans generated an actuarial gain relating to updates for demographic experience. We had adjustments relating to retirements, participation, persistency and census data updates. | |
2 The gain in per capita healthcare costs in 2022 relating to our OPEB plans is primarily due to the negotiation of favorable Medicare Advantage Prescription Drug healthcare rates, which went into effect on January 1, 2023. Additionally, we expanded the Medicare Advantage program to retirees on some of our other plans during the 2022 USW labor negotiations which added additional savings. The negotiated rates extend through 2025. | | 2 The gain in per capita healthcare costs in 2022 relating to our OPEB plans is primarily due to the negotiation of favorable Medicare Advantage Prescription Drug healthcare rates, which went into effect on January 1, 2023. Additionally, we expanded the Medicare Advantage program to retirees on some of our other plans during the 2022 USW labor negotiations which added additional savings. The negotiated rates extend through 2025. |
3 In 2022, the plan amendment gains and losses were generated from the ratification of the 2022 USW labor agreements. The plan amendment loss related to our pension plans is attributable to the increase to the pre-2023 service multiplier to $115 and the service multiplier applicable to service beginning in 2023 to $126 for retirements after January 1, 2023. The plan amendment gain related to our OPEB plans is attributable to the implementation of a cap on healthcare costs for employees retiring after January 1, 2026 on one of our Cleveland-Cliffs Steel LLC plans as well as the extension of the Medicare Advantage program to plans that previously did not have the offering. | | 3 In 2022, the plan amendment gains and losses were generated from the ratification of the 2022 USW labor agreements. The plan amendment loss related to our pension plans is attributable to the increase to the pre-2023 service multiplier to $115 and the service multiplier applicable to service beginning in 2023 to $126 for retirements after January 1, 2023. The plan amendment gain related to our OPEB plans is attributable to the implementation of a cap on healthcare costs for employees retiring after January 1, 2026 on one of our Cleveland-Cliffs Steel LLC plans as well as the extension of the Medicare Advantage program to plans that previously did not have the offering. |
11281 | CLF 2023 FORM 10-K
ContributionsCONTRIBUTIONS
AnnualWe make both required and discretionary pension contributions. Required contributions are based on minimum funding requirements pursuant to the pension plans are made within income tax deductibility restrictions in accordance with statutoryERISA regulations. Funded OPEB plans are not subject to minimum regulatory funding requirements, but rather amounts are contributed pursuant to bargaining agreements. Contributions toward unfunded OPEB plans are payments made directly from corporate assets and are displayed net of participant contributions and other reimbursements. Company contributions and payments we expect to make in 2024, and made in 2023 and 2022 are as follows:
| | | | | | | | | | | | | | | | | | | | | | | | | | |
| | (In Millions) |
| | Pension
Benefits | | Other Benefits |
| Company Contributions (Reimbursements) | | VEBA | | Direct
Payments | | Total |
| 2019 | | $ | 16 | | | $ | 0 | | | $ | 4 | | | $ | 4 | |
| 2020 | | 50 | | | 0 | | | 25 | | | 25 | |
2021 (Expected)1 | | 202 | | | (16) | | | 144 | | | 128 | |
| | | | | | | | |
1 Pursuant to the applicable bargaining agreements, benefits can be paid from certain VEBAs that are at least 70% funded (all VEBAs are over 70% funded at December 31, 2020). Certain agreements with plans holding VEBA assets have capped healthcare costs. For the ArcelorMittal USA VEBA, depending on funding levels and/or Company profits, we may withdraw money from the VEBA plans to the extent funds are available for costs in excess of the cap. The 2021 expected pension contributions include $118 million in deferred 2020 pension contributions in connection with the CARES Act that were paid on January 4, 2021. |
| | | | | | | | | | | | | | | | | | | | | | | | | | |
| | Pension Benefits | | OPEB |
| (In millions) | | VEBA1 | | Direct Payments | | Total |
| 2022 | | $ | 6 | | | $ | 85 | | | $ | 113 | | | $ | 198 | |
| 2023 | | 29 | | | — | | | 65 | | | 65 | |
| 2024 (Expected) | | 122 | | | — | | | 66 | | | 66 | |
| | | | | | | | |
1 Pursuant to the applicable bargaining agreements, benefits can be paid from certain VEBAs that are at least 70% funded (all VEBAs were over 70% funded at December 31, 2023). Certain agreements with plans holding VEBA assets have capped healthcare costs. For the Cleveland-Cliffs Steel LLC VEBA, we are required to make contributions based on earnings, and we may withdraw money from the VEBA plan to the extent funds are available for costs in excess of the cap. VEBA withdrawals are represented net of direct payments. There will be no further contributions to the Cleveland-Cliffs Steel LLC VEBA based on earnings for the remainder of the labor agreement with the USW, which expires in September of 2026. |
Estimated Future Benefit PaymentsESTIMATED FUTURE BENEFIT PAYMENTS
| | | | | | | | | | | |
| (In Millions) |
| Pension
Benefits | | OPEB |
| 2021 | $ | 486 | | | $ | 191 | |
| 2022 | 462 | | | 185 | |
| 2023 | 480 | | | 180 | |
| 2024 | 455 | | | 178 | |
| 2025 | 433 | | | 176 | |
| 2026-2030 | 1,983 | | | 884 | |
| | | | | | | | | | | |
| (In millions) | Pension Benefits | | OPEB1 |
| 2024 | $ | 503 | | | $ | 107 | |
| 2025 | 442 | | | 98 | |
| 2026 | 433 | | | 95 | |
| 2027 | 415 | | | 89 | |
| 2028 | 400 | | | 86 | |
| 2029-2033 | 1,728 | | | 380 | |
| | | |
1 OPEB benefit payments are displayed net of participant contributions. |
AssumptionsASSUMPTIONS
The discount rates used to measure plan liabilities as of the December 31 measurement date are determined individually for each plan. The discount rates are determined by matching the projected cash flows used to determine the plan liabilities to a projected yield curve of high-quality corporate bonds available at the measurement date. Discount rates for expense are calculated using the granular approach for each plan.
Depending on the plan, weWe use either company-specific base mortality tables orfor healthy annuitants in qualified pension plans. We use tables issued by the Society of Actuaries. We adoptedActuaries for non-annuitants in qualified pension plans, all nonqualified pension participants and OPEB participants. For tables issued by the Society of Actuaries, we use Pri-2012 mortality tables with adjustments for blue collar, white collar or no collar depending on the plan. Mortality is projected for all plans using Scale MP-2021 with generational projection for both years. In 2023, we switched two OPEB plans from company-specific base mortality tables to the Pri-2012 mortality tables to align with our other OPEB plans. In 2022, we switched one pension plan from the Society of Actuaries in 2019. On December 31, 2020, the assumedPri-2012 mortality improvement projection was updated from generational scale MP-2019tables to generational scale MP-2020 for the Pri-2012company-specific base mortality tables.
The following represents weighted-average assumptions used to determine benefit obligations:
| | Pension Benefits | | OPEB |
| December 31, | | December 31, |
| 2020 | | 2019 | | 2020 | | 2019 |
| Pension Benefits | | | Pension Benefits | | OPEB |
| December 31, | | | December 31, |
| 2023 | | | 2023 | | 2022 | | 2023 | | 2022 |
| Discount rate | Discount rate | 2.34 | % | | 3.27 | % | | 2.71 | % | | 3.28 | % | Discount rate | 5.12 | % | | 5.47 | % | | 5.15 | % | | 5.52 | % |
| Interest crediting rate | Interest crediting rate | 5.25 | | 6.00 | | N/A | | N/A | |
| Compensation rate increase | Compensation rate increase | 2.56 | | 2.53 | | 3.00 | | 3.00 | |
| Compensation rate increase | |
| Compensation rate increase | |
11382 | CLF 2023 FORM 10-K
The following represents weighted-average assumptions used to determine net benefit cost:
| | Pension Benefits | | OPEB |
| December 31, | | December 31, |
| 2020 | | 2019 | | 2018 | | 2020 | | 2019 | | 2018 |
| Pension Benefits | | | Pension Benefits | | OPEB |
| December 31, | | | December 31, |
| 2023 | | | 2023 | | 2022 | | 2021 | | 2023 | | 2022 | | 2021 |
| Obligation discount rate | Obligation discount rate | 3.02 | | % | | 4.27 | | % | | 3.58 | | % | | 3.28 | | % | | 4.29 | | % | | 3.60 | | % | Obligation discount rate | 5.47 | | % | % | | 3.21 | | % | % | | 2.32 | | % | % | | 5.52 | | % | % | | 3.33 | | % | % | | 2.46 | | % | % |
| Service cost discount rate | Service cost discount rate | 3.34 | | | 4.35 | | | 3.64 | | | 3.35 | | | 4.49 | | | 3.73 | | |
| Interest cost discount rate | Interest cost discount rate | 2.53 | | | 3.92 | | | 3.16 | | | 2.51 | | | 3.94 | | | 3.11 | | |
| Interest cost discount rate | |
| Interest cost discount rate | |
| | Interest crediting rate | |
| | Interest crediting rate | |
| | Interest crediting rate | Interest crediting rate | 5.50 | | | 6.00 | | | 6.00 | | | N/A | | N/A | | N/A | |
| Expected return on plan assets | Expected return on plan assets | 7.69 | | | 8.25 | | | 8.25 | | | 6.82 | | | 7.00 | | | 7.00 | | |
| Expected return on plan assets | |
| Expected return on plan assets | |
| Compensation rate increase | Compensation rate increase | 2.56 | | | 2.53 | | | 2.49 | | | 3.00 | | | 3.00 | | | 3.00 | | |
| Compensation rate increase | |
| Compensation rate increase | |
The following represents assumed weighted-average health care cost trend rates:
| | December 31, |
| 2020 | | 2019 |
| Health care cost trend rate assumed for next year | 6.05 | | % | | 6.50 | | % |
| December 31, | | | December 31, |
| 2023 | | | 2023 | | 2022 |
Health care cost trend rate assumed for next year1 | | Health care cost trend rate assumed for next year1 | 5.49 | | % | | 5.44 | | % |
| Ultimate health care cost trend rate | Ultimate health care cost trend rate | 4.59 | | | 5.00 | | | Ultimate health care cost trend rate | 4.50 | | % | % | | 4.50 | | % | % |
| Year that the ultimate rate is reached | Year that the ultimate rate is reached | 2031 | | 2026 | |
| 1 The health care trend rate for the next year is weighted for all of our OPEB plans and factors in our Medicare Advantage Prescription Drug pricing arrangements. In 2023, we increased our assumed health care cost trend rate for self insured plans to 6.50% from 6.00% for 2024, which grades down on a linear basis to 4.50% by 2032. The health care trend rate for the Medicare Advantage Prescription Drug plans is set to match the negotiated rates through 2025 and then converts to the same trend rate as our self insured plan. In 2023, we layered in a one time increase to the healthcare trend rate for the Medicare Advantage Prescription Drug plans for 2026. These increases align with our expectation of higher health care costs due to increased popularity of specialty medication, current carrier and provider negotiations and impacts from third party funding associated with the Inflation Reduction Act. | |
| 1 The health care trend rate for the next year is weighted for all of our OPEB plans and factors in our Medicare Advantage Prescription Drug pricing arrangements. In 2023, we increased our assumed health care cost trend rate for self insured plans to 6.50% from 6.00% for 2024, which grades down on a linear basis to 4.50% by 2032. The health care trend rate for the Medicare Advantage Prescription Drug plans is set to match the negotiated rates through 2025 and then converts to the same trend rate as our self insured plan. In 2023, we layered in a one time increase to the healthcare trend rate for the Medicare Advantage Prescription Drug plans for 2026. These increases align with our expectation of higher health care costs due to increased popularity of specialty medication, current carrier and provider negotiations and impacts from third party funding associated with the Inflation Reduction Act. | |
| 1 The health care trend rate for the next year is weighted for all of our OPEB plans and factors in our Medicare Advantage Prescription Drug pricing arrangements. In 2023, we increased our assumed health care cost trend rate for self insured plans to 6.50% from 6.00% for 2024, which grades down on a linear basis to 4.50% by 2032. The health care trend rate for the Medicare Advantage Prescription Drug plans is set to match the negotiated rates through 2025 and then converts to the same trend rate as our self insured plan. In 2023, we layered in a one time increase to the healthcare trend rate for the Medicare Advantage Prescription Drug plans for 2026. These increases align with our expectation of higher health care costs due to increased popularity of specialty medication, current carrier and provider negotiations and impacts from third party funding associated with the Inflation Reduction Act. | |
Plan AssetsPLAN ASSETS
Our financialinvestment objectives with respect to our pension and VEBAOPEB assets are to fully fund the actuarial accrued liability for each of the plans, to maximize investment returns within reasonable and prudent levels of risk and to maintain sufficient liquidity to meet benefit obligations on a timely basis.
Our investment objective is to outperform the expected return on assets assumption used in the plans’ actuarial reports over the life of each plan. The asset allocations are tailored to each individual plan and are determined by analyzing each plan's duration of benefit obligations, funded status and risk profile. Our investment strategy utilizes a broad mix of equity, fixed income and alternative investments to generate returns and manage risk. Equity investments are diversified across large-cap, mid-cap and small-cap companies located in the plans. U.S. and worldwide, with a bias towards U.S. companies. Fixed income investments primarily include corporate bonds and government debt securities, which are generally customized based on a plan's obligation duration. To enhance our diversification, we also invest in hedge funds, private equity, structured credit and real estate.
We review investment performance, asset allocations and policy compliance on a quarterly basis. In the fourth quarter of 2022, we increased our fixed income allocation for one of our more mature pension plans, which totaled $1.2 billion on December 31, 2022. In the fourth quarter of 2022, we also transitioned $2.9 billion of pension and OPEB assets to be managed by an external investment advisor in a delegated manner, which resulted in a shift to treasury based hedging, a higher alternative investment allocation and reduction to equity risk exposure. These changes resulted in a shift in underlying investments and increased our weighted-average expected return on plan assets in 2023 compared to 2022.
The expected return on plan assets takesare calculated on a plan-by-plan basis and take into account historicaleach plan's strategic asset allocation. The calculation of rates by asset class are based primarily on our future expected returns and estimated future long-term returns based on capital market assumptions applied totake into consideration the asset allocation strategy. The expected return is net of investment expenses paid by the plans. In addition, investment performance is monitored on a quarterly basis by benchmarking to various indices and metrics for the one-, three- and five-year periods.
The asset allocation strategy is determined through a detailed analysis of assets and liabilities by plan, which defines the overall risk that is acceptable with regard to the expected level and variability of portfolio returns, surplus (assets compared to liabilities), contributions and pension expense.
The asset allocation review process involves simulating capital market behaviors including global asset class performance, inflation and interest rates in order to evaluate various asset allocation scenarios and determine the asset mix with the highest likelihood of meeting financial objectives. The process includes factoring in the current funded status and likely future funded status levelsduration of the cash flows, active management and fees.
Assets for OPEB plans by taking into account expected growth or decline in the contributions over time.
The asset allocation strategy varies by plan.include VEBA trusts pursuant to bargaining agreements that are available to fund retired employees’ life insurance obligations and medical benefits. The following table reflects the actual asset allocations for pension and VEBA assets as of December 31, 20202023 and 2019,2022, as well as the 20212024 weighted average target asset allocations. Equityallocations:
| | | | | | | | | | | | | | | | | | | | | | | | | | | | | | | | | | | | | | |
| | Pension Assets | | VEBA Assets |
| Asset Category | | 2024
Target
Allocation | | Actual Asset Allocation at December 31, | | 2024
Target
Allocation | | Actual Asset Allocation at December 31, |
| 2023 | | 2022 | | 2023 | | 2022 |
| Equity securities | | 33.8 | % | | 32.1 | % | | 36.1 | % | | 16.6 | % | | 18.4 | % | | 22.0 | % |
| Fixed income | | 41.1 | | | 38.8 | | | 40.9 | | | 78.5 | | | 74.5 | | | 67.4 | |
| Hedge funds | | 9.4 | | | 9.4 | | | 2.7 | | | 1.4 | | | 1.5 | | | 1.9 | |
| Private equity | | 3.3 | | | 3.4 | | | 3.3 | | | — | | | — | | | — | |
| Structured credit | | 2.4 | | | 5.1 | | | 6.9 | | | 0.2 | | | 0.9 | | | 1.2 | |
| Real estate | | 10.0 | | | 11.2 | | | 8.2 | | | 3.3 | | | 4.7 | | | 1.7 | |
| Absolute return fixed income | | — | | | — | | | 1.9 | | | — | | | — | | | 5.8 | |
| Total | | 100.0 | % | | 100.0 | % | | 100.0 | % | | 100.0 | % | | 100.0 | % | | 100.0 | % |
FAIR VALUE MEASUREMENTS
Investments classified as Level 1 primarily include equity investments include securities in large-cap, mid-cap and small-cap companies located in the U.S. and worldwide.fixed income mutual funds that are based on observable quoted market prices on an active exchange. Fixed income investments primarilyclassified as Level 2 include U.S. Treasury STRIPS which are priced daily through a bond pricing vendor as well as corporate bonds, mortgage-backed securities and government debt securities.non-US bonds which have valuations based on their bid-ask spreads or quoted prices of securities with similar characteristics.
quoted market prices and inherent lack of liquidity. These investments are generally valued at estimated fair value based on financial inputs from our investment advisors, investment managers or third party appraisers. Certain Level 3 investments may be lagged up to three months if there are no financial inputs available. | | | | | | | | | | | | | | | | | | | | | | | | | | | | | | | | | | | | | | |
| | Pension Assets | | VEBA Assets |
| Asset Category | | 2021
Target
Allocation | | Percentage of
Plan Assets at
December 31, | | 2021
Target
Allocation | | Percentage of
Plan Assets at
December 31, |
| 2020 | | 2019 | | 2020 | | 2019 |
| Equity securities | | 41.3 | % | | 51.8 | % | | 44.0 | % | | 20.3 | % | | 22.2 | % | | 7.2 | % |
| Fixed income | | 39.7 | | | 33.8 | | | 27.6 | | | 69.6 | | | 66.4 | | | 79.8 | |
| Hedge funds | | 5.0 | | | 2.2 | | | 5.4 | | | 1.1 | | | 1.8 | | | 4.8 | |
| Private equity | | 2.2 | | | 2.1 | | | 6.6 | | | 1.4 | | | 0.4 | | | 0.7 | |
| Structured credit | | 5.2 | | | 5.0 | | | 7.0 | | | 1.0 | | | 0.9 | | | 2.1 | |
| Real estate | | 5.2 | | | 3.3 | | | 9.4 | | | 1.1 | | | 1.8 | | | 5.4 | |
| Absolute return fixed income | | 1.4 | | | 1.8 | | | 0 | | | 5.5 | | | 6.5 | | | 0 | |
| Total | | 100.0 | % | | 100.0 | % | | 100.0 | % | | 100.0 | % | | 100.0 | % | | 100.0 | % |
As a practical expedient, in accordance with ASC 820-10, certain investments that are measured at fair value using the NAV per share have not been classified in the fair value hierarchy below. NAV is based on the value of the underlying assets owned by the fund, minus its liabilities, and then divided by its number of shares outstanding.
The fair value of our pension assets by asset category is as follows:
| | (In Millions) |
| Quoted Prices in Active
Markets for Identical
Assets
(Level 1) | | Significant Other
Observable
Inputs
(Level 2) | | Significant
Unobservable
Inputs
(Level 3) | | Investments Measured at Net Asset Value | | Total |
| (In millions) | | (In millions) | Quoted Prices in Active Markets for Identical Assets (Level 1) | | Significant Other Observable Inputs
(Level 2) | | Significant
Unobservable
Inputs
(Level 3) | | Investments Measured at Net Asset Value | | Total |
| Asset Category | Asset Category | 2020 | 2019 | | 2020 | 2019 | | 2020 | 2019 | | 2020 | 2019 | | 2020 | 2019 | Asset Category | 2023 | 2022 | | 2023 | 2022 | | 2023 | 2022 | | 2023 | 2022 | | 2023 | 2022 |
| Equity securities: | Equity securities: | | | | | | | | | |
| U.S. equities | U.S. equities | $ | 1,163 | | $ | 169 | | | $ | 0 | | $ | 0 | | | $ | 0 | | $ | 0 | | | $ | 787 | | $ | 0 | | | $ | 1,950 | | $ | 169 | |
| U.S. equities | |
| U.S. equities | |
| Global equities | Global equities | 615 | | 161 | | | 0 | | 0 | | | 0 | | 0 | | | 195 | | 0 | | | 810 | | 161 | |
| Fixed income: | Fixed income: | |
U.S. government securities1 | |
U.S. government securities1 | |
U.S. government securities1 | U.S. government securities1 | 141 | | 11 | | | 295 | | 22 | | | 0 | | 0 | | | 40 | | 0 | | | 476 | | 33 | |
| U.S. corporate bonds | U.S. corporate bonds | 512 | | 174 | | | 466 | | 0 | | | 0 | | 0 | | | 303 | | 0 | | | 1,281 | | 174 | |
| Non U.S. and other bonds | Non U.S. and other bonds | 0 | | 0 | | | 46 | | 0 | | | 0 | | 0 | | | 0 | | 0 | | | 46 | | 0 | |
| Hedge funds | Hedge funds | 0 | | 0 | | | 0 | | 0 | | | 118 | | 40 | | | 0 | | 0 | | | 118 | | 40 | |
| Private equity | Private equity | 0 | | 0 | | | 0 | | 0 | | | 114 | | 50 | | | 0 | | 0 | | | 114 | | 50 | |
| Structured credit | Structured credit | 0 | | 0 | | | 0 | | 0 | | | 264 | | 52 | | | 0 | | 0 | | | 264 | | 52 | |
| Real estate | Real estate | 0 | | 0 | | | 0 | | 0 | | | 174 | | 70 | | | 0 | | 0 | | | 174 | | 70 | |
| Absolute return fixed income | Absolute return fixed income | 0 | | 0 | | | 0 | | 0 | | | 0 | | 0 | | | 99 | | 0 | | | 99 | | 0 | |
| Total | Total | $ | 2,431 | | $ | 515 | | | $ | 807 | | $ | 22 | | | $ | 670 | | $ | 212 | | | $ | 1,424 | | $ | 0 | | | $ | 5,332 | | $ | 749 | |
| 1 Includes cash equivalents. | 1 Includes cash equivalents. | |
1 Includes cash equivalents. | |
11584 | CLF 2023 FORM 10-K
Assets for OPEB plans include VEBA trusts pursuant to bargaining agreements that are available to fund retired employees’ life insurance obligations and medical benefits. The fair value of our other benefit planVEBA assets by asset category is as follows:
| | (In Millions) |
| Quoted Prices in Active
Markets for Identical
Assets
(Level 1) | | Significant Other
Observable
Inputs
(Level 2) | | Significant
Unobservable
Inputs
(Level 3) | | Investments Measured at Net Asset Value | | Total |
| (In millions) | | (In millions) | Quoted Prices in Active Markets for Identical Assets
(Level 1) | | Significant Other Observable Inputs
(Level 2) | | Significant
Unobservable
Inputs
(Level 3) | | Investments Measured at Net Asset Value | | Total |
| Asset Category | Asset Category | 2020 | 2019 | | 2020 | 2019 | | 2020 | 2019 | | 2020 | 2019 | | 2020 | 2019 | Asset Category | 2023 | 2022 | | 2023 | 2022 | | 2023 | 2022 | | 2023 | 2022 | | 2023 | 2022 |
| Equity securities: | Equity securities: | | | | | | | | | |
| U.S. equities | |
| U.S. equities | |
| U.S. equities | U.S. equities | $ | 26 | | $ | 12 | | | $ | 0 | | $ | 0 | | | $ | 0 | | $ | 0 | | | $ | 93 | | $ | 0 | | | $ | 119 | | $ | 12 | |
| Global equities | Global equities | 6 | | 7 | | | 0 | | 0 | | | 0 | | 0 | | | 49 | | 0 | | | 55 | | 7 | |
| Fixed income: | Fixed income: | |
U.S. government securities1 | U.S. government securities1 | 62 | | 0 | | | 94 | | 0 | | | 0 | | 0 | | | 0 | | 0 | | | 156 | | 0 | |
U.S. government securities1 | |
U.S. government securities1 | |
| U.S. corporate bonds | U.S. corporate bonds | 237 | | 166 | | | 127 | | 41 | | | 0 | | 0 | | | 0 | | 0 | | | 364 | | 207 | |
| Non U.S. and other bonds | |
| Hedge funds | Hedge funds | 0 | | 0 | | | 0 | | 0 | | | 14 | | 12 | | | 0 | | 0 | | | 14 | | 12 | |
| Private equity | Private equity | 0 | | 0 | | | 0 | | 0 | | | 3 | | 2 | | | 0 | | 0 | | | 3 | | 2 | |
| Structured credit | Structured credit | 0 | | 0 | | | 0 | | 0 | | | 7 | | 6 | | | 0 | | 0 | | | 7 | | 6 | |
| Real estate | Real estate | 0 | | 0 | | | 0 | | 0 | | | 14 | | 14 | | | 0 | | 0 | | | 14 | | 14 | |
| Absolute return fixed income | Absolute return fixed income | 0 | | 0 | | | 0 | | 0 | | | 0 | | 0 | | | 51 | | 0 | | | 51 | | 0 | |
| Total | Total | $ | 331 | | $ | 185 | | | $ | 221 | | $ | 41 | | | $ | 38 | | $ | 34 | | | $ | 193 | | $ | 0 | | | $ | 783 | | $ | 260 | |
| 1 Includes cash equivalents. | 1 Includes cash equivalents. | |
1 Includes cash equivalents. | |
The following represents the fair value measurements of changes in plan assets using significant unobservable inputs (Level 3):
| | (In Millions) |
| Pension Assets | | VEBA Assets |
| 2020 | | 2019 | | 2020 | | 2019 |
| Pension Assets | | | Pension Assets | | VEBA Assets |
| (In millions) | | (In millions) | 2023 | | 2022 | | 2023 | | 2022 |
| Beginning balance — January 1 | Beginning balance — January 1 | $ | 212 | | | $ | 229 | | | $ | 34 | | | $ | 36 | |
| Actual return on plan assets: | Actual return on plan assets: | |
| Relating to assets still held at the reporting date | |
| Relating to assets still held at the reporting date | |
| Relating to assets still held at the reporting date | Relating to assets still held at the reporting date | 8 | | | (1) | | | 2 | | | 1 | |
| Relating to assets sold during the period | Relating to assets sold during the period | 6 | | | 30 | | | 1 | | | 0 | |
| Purchases | Purchases | 195 | | | 17 | | | 0 | | | 0 | |
| Sales | Sales | (13) | | | (60) | | | (1) | | | (3) | |
| Acquired through business combinations | 262 | | | — | | | 2 | | | — | |
| Other | 0 | | | (3) | | | 0 | | | 0 | |
| | Ending balance — December 31 | Ending balance — December 31 | $ | 670 | | | $ | 212 | | | $ | 38 | | | $ | 34 | |
| Ending balance — December 31 | |
| Ending balance — December 31 | |
Following is a description of the inputs and valuation methodologies used to measure the fair value of our plan assets.
Equity Securities
Equity securities classified as Level 1 investments include U.S. large-, small- and mid-cap investments and international equities. These investments are comprised of securities listed on an exchange, market or automated quotation system for which quotations are readily available. The valuation of these securities is determined using a market approach and is based upon unadjusted quoted prices for identical assets in active markets.
Fixed Income
Fixed income securities classified as Level 1 investments include bonds, government debt securities and cash equivalents. These investments are comprised of securities listed on an exchange, market or automated
quotation system for which quotations are readily available. The valuation of these securities is determined using a market approach and is based upon unadjusted quoted prices for identical assets in active markets. Also included in fixed income is a portfolio of U.S. Treasury STRIPS, which are zero-coupon bearing fixed income securities backed by the full faith and credit of the U.S. government. The securities sell at a discount to par because there are no incremental coupon payments. STRIPS are not issued directly by the Treasury, but rather are created by a financial institution, government securities broker or government securities dealer. Liquidity on the issue varies depending on various market conditions; however, in general, the STRIPS market is slightly less liquid than that of the U.S. Treasury Bond market. The STRIPS are priced daily through a bond pricing vendor and are classified as Level 2.
Hedge Funds
Hedge funds are alternative investments comprised of direct or indirect investment in offshore hedge funds with an investment objective to achieve equity-like returns with one half the volatility of equities and moderate correlation. The valuation techniques used to measure fair value attempt to maximize the use of observable inputs and minimize the use of unobservable inputs. Considerable judgment is required to interpret the factors used to develop estimates of fair value. Valuations of the underlying investment funds are obtained and reviewed. The securities that are valued by the funds are interests in the investment funds and not the underlying holdings of such investment funds. Thus, the inputs used to value the investments in each of the underlying funds may differ from the inputs used to value the underlying holdings of such funds. Hedge funds are valued monthly and recorded on a one-month lag.
Private Equity Funds
Private equity funds are alternative investments that represent direct or indirect investments in partnerships, venture funds or a diversified pool of private investment vehicles (fund of funds).
Investment commitments are made in private equity funds based on an asset allocation strategy, and capital calls are made over the life of the funds to fund the commitments. As of December 31, 2020, remaining commitments total $86 million for our pension and OPEB plans. Committed amounts are funded from plan assets when capital calls are made. Investment commitments are not pre-funded in reserve accounts.
Private equity investments are valued quarterly and recorded on a one-quarter lag. For private equity investment values reported on a lag, current market information is reviewed for any material changes in values at the reporting date. Capital distributions for the funds do not occur on a regular frequency. Liquidation of these investments would require sale of the partnership interest.
Structured Credit
Structured credit funds provide flexibility and access to both complex and illiquid premiums by investing across global, public and private residential, commercial, corporate and specialty credit markets that are priced based on valuations provided by independent, third-party pricing agents, if available. Such values generally reflect the last reported sales price if the security is actively traded. The third-party pricing agents may also value structured credit investments at an evaluated bid price by employing methodologies that utilize actual market transactions, broker-supplied valuations or other methodologies designed to identify the market value of such securities.
Structured credit investments are valued monthly and certain funds have an initial lock-up period and withdrawal restrictions on a semi-annual and quarterly basis. For structured credit investment values reported on a lag, current market information is reviewed for any material changes in values at the reporting date.
Real Estate
The real estate portfolio for the pension plans is an alternative investment comprised of funds with strategic categories of real estate investments. All real estate holdings are appraised externally at least annually, and appraisals are conducted by reputable, independent appraisal firms that are members of the Appraisal Institute. All external appraisals are performed in accordance with the Uniform Standards of Professional Appraisal Practices. The property valuations and assumptions about each property are reviewed quarterly by the investment manager and values are adjusted if there has been a significant change in circumstances relating to the property since the last external appraisal. The fair values of the funds are updated on either a monthly or quarterly basis. Redemption requests are considered on a quarterly basis, subject to notice requirements.
The real estate fund of funds investment for the Empire-Tilden, Hibbing and United Taconite VEBA plans invests in pooled investment vehicles that, in turn, invest in commercial real estate properties. Valuations are performed quarterly and financial statements are prepared on a semi-annual basis, with annual audited statements.
Asset values for this fund are reported with a one-quarter lag, and current market information is reviewed for any material changes in values at the reporting date. Withdrawals are permitted on the last business day of each quarter subject to a 95-day prior written notice.
Absolute Return Fixed Income
Absolute return fixed income investments consist of a global fixed income fund with the investment objective of generating positive absolute returns over a full market cycle. The fund's investments in securities, forward exchange contracts and futures contracts are reported at fair value on a recurring monthly basis. The fund's trustee values securities based upon independent pricing sources and futures contracts are valued at closing settled prices. Redemptions of the fund at NAV are permitted monthly under most circumstances.
Defined Contribution PlansDEFINED CONTRIBUTION PLANS
Most employees are eligible to participate in various defined contribution plans. Certain of these plans have features with matching contributions or other Company contributions based on our financial results. Company contributions to these plans are expensed as incurred. Total expense from these plans was $22$59 million, $3$52 million and $3$55 million in 2020, 20192023, 2022 and 2018,2021, respectively.
Multiemployer PlansMULTlEMPLOYER PLANS
We contribute to multiemployer pension plans according to collective bargaining agreements that cover certain union-represented employees. The following risks of participating in these multiemployer plans differare different from single employerthe risks of participating in single-employer pension plans:plans in the following respects:
•Employer contributionsAssets contributed to a multiemployer plan by one employer may be used to provide benefits to employees of other participating employers.
•If a participating employer stops contributing to a multiemployer plan, the remaining participating employers may need to assume the unfunded obligations of the plan.plan may be borne by the remaining participating employers.
•If the multiemployer plan becomes significantly underfunded or is unable to pay its benefits, we may be required to contribute additional amounts in excess of the rate required by the collective bargaining agreements.
•If we choose to stop participating in a multiemployer plan, we may be required to pay that plan an amount based on the underfunded status of the plan, referred to as a withdrawal liability.
We are a party to five collective bargaining agreements at our Ashland Works, Mansfield Works, United Taconite, Tubular Components and the majority of our ArcelorMittal USA locations that require contributions to the Steelworkers Pension Trust.
We are a party to three collective bargaining agreements at Butler Works, Middletown Works and Zanesville Works that require contributions to the International Association of Machinists and Aerospace Workers ("IAM") National Pension Fund's National Pension Plan. The plan voluntarily elected to place itself in the "Red Zone" in April 2019 and has implemented a rehabilitation plan. Additional contributions will be required as part of the rehabilitation plan until the plan exits the critical status.
11885 | CLF 2023 FORM 10-K
Information with respect to multiemployer plans in which we participate follows:
| | Pension Fund | Pension Fund | EIN/Pension Plan Number | Pension Protection Act Zone Status (a) | FIP/RP Status Pending/Implemented (b) | Contributions | Surcharge Imposed (c) | Expiration Date of Collective Bargaining Agreement | Pension Fund | EIN/Pension Plan Number | Pension Protection Act Zone Status1 | FIP/RP Status Pending/Implemented2 | Contributions
(in millions) | Surcharge Imposed3 | Expiration Date of Collective Bargaining Agreement4 |
| 2020 | 2019 | | 2020 | 2019 | 2018 | |
| | 2023 | |
| Steelworkers Pension Trust | |
| Steelworkers Pension Trust | |
| Steelworkers Pension Trust | Steelworkers Pension Trust | 23-6648508/499 | Green | No | $ | 14 | | $ | 4 | | $ | 4 | | No | 1/22/2021 to 10/1/2022 | 23-6648508/499 | Green | No | $ | 119 | | $ | 93 | | $ | 88 | | No | No | 4/1/2025 to 9/1/2026 |
| IAM National Pension Fund’s National Pension Plan | IAM National Pension Fund’s National Pension Plan | 51-6031295/002 | Red | Green | Yes | 16 | | 0 | | 0 | | Yes | 5/31/2022 to 5/15/2023 | IAM National Pension Fund’s National Pension Plan | 51-6031295/002 | Red | Yes | 23 | | 22 | 22 | | 16 | 16 | | Yes | Yes | 5/31/2025 to 5/15/2027 |
| American Maritime Officers Plan | 13-1936709/001 | Green | No | 0 | | 0 | | 0 | | No | 7/31/2021 |
Other Plans5 | |
| Total | Total | | $ | 30 | | $ | 4 | | $ | 4 | | |
(a) The most recent Pension Protection Act zone status available in 2020 and 2019 is for each plan's year-end at December 31, 2019 and 2018. The plan's actuary certifies the zone status. Generally, plans in the red zone are less than 65% funded, plans in the yellow zone are between 65% and 80% funded, and plans in the green zone are at least 80% funded. | (b) The "FIP/RP Status Pending/Implemented" column indicates plans for which a financial improvement plan or a rehabilitation plan is either pending or has been implemented, as defined by ERISA. | (c) The surcharge represents an additional required contribution due as a result of the critical funding status of the plan. | | Total | |
| Total | |
| 1 The most recent Pension Protection Act zone status available in 2023 and 2022 is for each plan's year-end at December 31, 2022 and 2021. The plan's actuary certifies the zone status. Generally, plans in the red zone are less than 65% funded, plans in the yellow zone are between 65% and 80% funded, and plans in the green zone are at least 80% funded. The IAM National Pension Fund's National Pension Plan voluntarily elected to place itself in the "Red Zone" in April 2019 and has implemented a rehabilitation plan to address its underfunded status. Additional contributions will be required as part of the rehabilitation plan until the plan exits the "Red Zone". | |
| 1 The most recent Pension Protection Act zone status available in 2023 and 2022 is for each plan's year-end at December 31, 2022 and 2021. The plan's actuary certifies the zone status. Generally, plans in the red zone are less than 65% funded, plans in the yellow zone are between 65% and 80% funded, and plans in the green zone are at least 80% funded. The IAM National Pension Fund's National Pension Plan voluntarily elected to place itself in the "Red Zone" in April 2019 and has implemented a rehabilitation plan to address its underfunded status. Additional contributions will be required as part of the rehabilitation plan until the plan exits the "Red Zone". | |
| 1 The most recent Pension Protection Act zone status available in 2023 and 2022 is for each plan's year-end at December 31, 2022 and 2021. The plan's actuary certifies the zone status. Generally, plans in the red zone are less than 65% funded, plans in the yellow zone are between 65% and 80% funded, and plans in the green zone are at least 80% funded. The IAM National Pension Fund's National Pension Plan voluntarily elected to place itself in the "Red Zone" in April 2019 and has implemented a rehabilitation plan to address its underfunded status. Additional contributions will be required as part of the rehabilitation plan until the plan exits the "Red Zone". | |
2 The "FIP/RP Status Pending/Implemented" column indicates plans for which a financial improvement plan or a rehabilitation plan is either pending or has been implemented, as defined by ERISA. | | 2 The "FIP/RP Status Pending/Implemented" column indicates plans for which a financial improvement plan or a rehabilitation plan is either pending or has been implemented, as defined by ERISA. |
3 The surcharge represents an additional required contribution due as a result of the critical funding status of the plan. | | 3 The surcharge represents an additional required contribution due as a result of the critical funding status of the plan. |
4 We are a party to six collective bargaining agreements that require contributions to the Steelworkers Pension Trust and three collective bargaining agreements that require contributions to the IAM National Pension Fund's National Pension Plan. | | 4 We are a party to six collective bargaining agreements that require contributions to the Steelworkers Pension Trust and three collective bargaining agreements that require contributions to the IAM National Pension Fund's National Pension Plan. |
5 Plans that are not individually significant to our Company are presented in aggregate. | | 5 Plans that are not individually significant to our Company are presented in aggregate. |
Prior toWith the Acquisitions, AK Steel and ArcelorMittal USA made up over 30%ratification of the contributions2022 USW labor agreements, we increased our contribution rate to the Steelworkers Pension Trust by $0.50 to $4.00 per eligible hour. The increase was effective November 1, 2022.
We are one of the largest contributors to the Steelworkers Pension Trust. Our contributions exceeded 5% of total combined contributions in the last three years. Only two other employers contributed more than 5% during this period.2023 and 2022. As of December 31, 2019January 1, 2023 (the last date for which we have information), the Steelworkers Pension Trust had a total actuarial liability of $5,748$6,378 million and assets with a market value of $5,372$5,827 million, for a funded ratio of about 93%91%.
NOTE 1110 - STOCK COMPENSATION PLANS
At December 31, 2020,2023, we had outstanding awards under twothree share-based compensation plans: the 2021 Equity Plan, the A&R 2015 Equity Plan and the 2012 Amended Equity Plan. On March 13, 2020, the maximum number of shares that may be issued under the A&R 2015 Equity Plan increased by 5.7 million common shares in relation to the outstanding AK Steel stock-based incentive awards that we converted at a 0.400 rate of exchange. The converted stock-based incentive awards include 2.0 million stock options, 1.0 million long-term performance plan awards, 0.5 million performance shares, 0.2 million restricted stock awards and 0.3 million restricted stock units. As of December 31, 2020,2023, there were 4.923.0 million remaining shares available for grant under the A&R 20152021 Equity Plan. No additional grants were issued from the 2012 Amended Equity Plan or the A&R 2015 Equity Plan after the date of approval of the A&R 20152021 Equity Plan; however, all awards previously granted under the 2012 Amended Equity Planpredecessor plans will continue in accordance with the terms of the outstanding awards.
share-based compensation awards, we issue shares from treasury shares before issuing new shares. Forfeitures are recognized when they occur. Stock-Based Compensation ExpenseSTOCK-BASED COMPENSATION EXPENSE
The following table summarizes the total compensation expense recognized for stock-based compensation awards:
| | (In Millions, except per
share amounts) |
| Year Ended December 31, |
| | 2020 | | 2019 | | 2018 |
| Year Ended December 31, | | | Year Ended December 31, |
| (In millions, except per share amounts) | | (In millions, except per share amounts) | 2023 | | 2022 | | 2021 |
| Cost of goods sold | Cost of goods sold | $ | (2) | | | $ | (2) | | | $ | (2) | |
| Selling, general and administrative expenses | Selling, general and administrative expenses | (13) | | | (16) | | | (13) | |
| Acquisition-related costs | (2) | | | 0 | | | 0 | |
| Stock based compensation expense | Stock based compensation expense | (17) | | | (18) | | | (15) | |
Income tax benefit1 | 4 | | | 4 | | | 0 | |
| Income tax benefit | |
| Stock based compensation expense, net of tax | Stock based compensation expense, net of tax | $ | (13) | | | $ | (14) | | | $ | (15) | |
| | Decrease in basic earnings per common share | Decrease in basic earnings per common share | $ | (0.03) | | | $ | (0.05) | | | $ | (0.05) | |
| Decrease in basic earnings per common share | |
| Decrease in basic earnings per common share | |
| Decrease in diluted earnings per common share | Decrease in diluted earnings per common share | $ | (0.03) | | | $ | (0.05) | | | $ | (0.05) | |
| 1 No income tax benefit in 2018 due to the full valuation allowance. |
The total compensation cost related to outstanding awards not yet recognized is $14$53 million at December 31, 2020.2023. This expense is expected to be recognized over the remaining weighted-average period of approximately 1.7 years.
PERFORMANCE SHARES
The following table summarizes the performance award activity:
| | | | | | | | | | | | | | | | | | | | | | | | | | | | | | | | | | | |
| Year Ended December 31, |
| 2020 | | 2019 | | 2018 |
| Number of Shares | | Weighted Average Grant Date Fair Value | | Number of Shares | | Weighted Average Grant Date Fair Value | | Number of Shares | | Weighted Average Grant Date Fair Value |
| Outstanding at beginning of year | 1,935,878 | | | $ | 15.58 | | | 1,424,723 | | | $ | 14.46 | | | 1,848,312 | | | $ | 13.42 | |
| Granted | 2,510,853 | | | 5.49 | | | 572,104 | | | 18.31 | | | 675,599 | | | 11.93 | |
| Distributed | (1,938,786) | | | 12.23 | | | 0 | | | 0 | | | (489,953) | | | 10.89 | |
| Performance adjustment | 549,154 | | | 15.63 | | | 0 | | | 0 | | | (560,720) | | | 10.69 | |
| Forfeited/canceled | (604,873) | | | 5.70 | | | (60,949) | | | 15.12 | | | (48,515) | | | 19.33 | |
| Outstanding at end of year | 2,452,226 | | | $ | 10.34 | | | 1,935,878 | | | $ | 15.58 | | | 1,424,723 | | | $ | 14.46 | |
The 2.5 million awards granted in 2020 include 1.0 million long-term performance plan awards and 0.5 million performance shares relating to the AK Steel replacement awards. As of December 31, 2020, 0.3 million long-term performance plan awards and 0.1 million performance shares were outstanding as a result of qualifying termination events that triggered accelerated performance share payouts and prorated long-term performance plan awards payouts at target. The long-term performance plan awards are based on a three-year Adjusted EBITDA metric. The weighted average grant date fair value for the converted performance awards was $4.59 per share. | | | | | | | | | | | | | | | | | | | | | | | | | | | | | | | | | | | |
| 2023 | | 2022 | | 2021 |
| (Shares in millions) | Number of Shares | | Weighted Average Grant Date Fair Value | | Number of Shares | | Weighted Average Grant Date Fair Value | | Number of Shares | | Weighted Average Grant Date Fair Value |
| Outstanding at beginning of year | 2.7 | | | $ | 18.53 | | | 2.4 | | | $ | 14.04 | | | 2.5 | | | $ | 10.34 | |
| Granted | 1.1 | | | 31.88 | | | 1.0 | | | 28.46 | | | 0.7 | | | 25.12 | |
| Distributed | (1.8) | | | 6.50 | | | (1.1) | | | 17.04 | | | (1.3) | | | 11.74 | |
| Performance adjustment | 0.7 | | | 6.43 | | | 0.5 | | | 17.84 | | | 0.6 | | | 11.93 | |
| Forfeited/canceled | (0.2) | | | 28.65 | | | (0.1) | | | 23.74 | | | (0.1) | | | 11.27 | |
| Outstanding at end of year | 2.5 | | | $ | 29.09 | | | 2.7 | | | $ | 18.53 | | | 2.4 | | | $ | 14.04 | |
The outstanding performance shares vest over a period of three years and are intended to be paid out in common shares. Performance is measured on the basis of relative TSR for the period and measured against the constituents of the S&P Metals and Mining ETF Index. The number of shares actually earned at the end of the three-year period will vary, based on performance, from 0% to 200% of the number of performance shares granted.
historical and projected stock prices was developed for both the Company and its predetermined peer group of metals and mining companies. The fair value assumes that the performance objective will be achieved. The expected term of the grant represents the time from the grant date to the end of the service period. We estimate the volatility of our common shares and that of the peer group of metals and mining companies using daily price intervals for all companies. The risk-free interest rate is the rate at the grant date on zero-coupon government bonds, with a term commensurate with the remaining performance period. Restricted Stock UnitsRESTRICTED STOCK UNITS
The following table summarizes the restricted stock units activity:
| | Year Ended December 31, |
| 2020 | | 2019 | | 2018 |
| Number of Shares | | Weighted Average Grant Date Fair Value | | Number of Shares | | Weighted Average Grant Date Fair Value | | Number of Shares | | Weighted Average Grant Date Fair Value |
| 2023 | | | 2023 | | 2022 | | 2021 |
| (Shares in millions) | | (Shares in millions) | Number of Shares | | Weighted Average Grant Date Fair Value | | Number of Shares | | Weighted Average Grant Date Fair Value | | Number of Shares | | Weighted Average Grant Date Fair Value |
| Outstanding at beginning of year | Outstanding at beginning of year | 2,147,183 | | | $ | 9.10 | | | 4,694,360 | | | $ | 4.18 | | | 4,403,112 | | | $ | 3.64 | |
| Granted | Granted | 1,160,928 | | | 4.87 | | | 572,104 | | | 11.24 | | | 685,599 | | | 7.53 | |
| Distributed | Distributed | (1,101,115) | | | 8.58 | | | (3,058,307) | | | 1.95 | | | (254,196) | | | 3.30 | |
| Forfeited/canceled | Forfeited/canceled | (63,413) | | | 7.31 | | | (60,974) | | | 9.31 | | | (140,155) | | | 5.17 | |
| Outstanding at end of year | Outstanding at end of year | 2,143,583 | | | $ | 7.12 | | | 2,147,183 | | | $ | 9.10 | | | 4,694,360 | | | $ | 4.18 | |
The 1.2 millionWe value our restricted stock units granted in 2020 include 0.2 million restricted stock awards relating to AK Steel replacement awards. The restricted stock awards relating to AK Steel vest ratably on the first, second and third anniversaries of the grant. We valued the restricted stock awards and restricted stock units at $4.87 per share using the closing price of our common shares on March 13, 2020, the grant date.
All of the outstanding restricted stock units are subject to continued employment, are retention based, and are payable in common shares or cash in certain circumstances at a time determined by the Compensation Committee at its discretion. TheMost restricted stock units that were granted in 2020, 2019 and 2018under three-year cliff vest over three years on December 31, 2022, December 31, 2021 and December 31, 2020, respectively.vesting terms.
Stock Options87 | CLF 2023 FORM 10-K
STOCK OPTIONS
The following table summarizes the stock option activity:
| | Year Ended December 31, |
| 2020 | | 2019 | | 2018 |
| Number of Shares | | Weighted Average Exercise Price | | Number of Shares | | Weighted Average Exercise Price | | Number of Shares | | Weighted Average Excercise Price |
| 2023 | | | 2023 | | 2022 | | 2021 |
| (Shares in millions) | | (Shares in millions) | Number of Shares | | Weighted Average Exercise Price | | Number of Shares | | Weighted Average Exercise Price | | Number of Shares | | Weighted Average Exercise Price |
| Outstanding at beginning of year | Outstanding at beginning of year | 563,230 | | | $ | 10.42 | | | 563,230 | | | $ | 10.42 | | | 599,870 | | | $ | 10.25 | |
| Granted | 2,010,277 | | | 11.86 | | | 0 | | | 0 | | | 0 | | | 0 | |
| Exercised | Exercised | (79,973) | | | 7.01 | | | 0 | | | 0 | | | (36,640) | | | 7.70 | |
| Forfeited/canceled | Forfeited/canceled | (7,726) | | | 41.04 | | | 0 | | | 0 | | | 0 | | | 0 | |
| Outstanding at end of year | Outstanding at end of year | 2,485,808 | | | $ | 11.60 | | | 563,230 | | | $ | 10.42 | | | 563,230 | | | $ | 10.42 | |
| | Exercisable at end of year | Exercisable at end of year | 2,172,052 | | | $ | 11.86 | | | 563,230 | | | $ | 10.42 | | | 563,230 | | | $ | 10.42 | |
| Exercisable at end of year | |
| Exercisable at end of year | |
Stock options granted to date generally vest over a period from one to three years with an expiration date at ten years from the date of grant. On March 13, 2020, we granted 2.0 million options as AK Steel replacement awards. The weighted average fair value of the converted options was $0.51 per share and was calculated using the Black-Scholes option-pricing model. Qualifying termination events resulted in vest date accelerations and reductions to the option expiration date from ten years to three years.
The total intrinsic value of options exercised in 20202023 was $1 million and 2018the amount in 2022 was $3 million. As of December 31, 2023, all outstanding options were immaterial.exercisable. For options outstanding at December 31, 2020,2023, the weighted-average remaining contractual life was 3.22.1 years and the aggregate intrinsic value was $11$5 million. For
The fair value of stock options exercisable at December 31, 2020,is estimated on the weighted-average remaining contractual life was 2.5 yearsdate of grant using a Black-Scholes model using the grant date price of our common shares, the option exercise price, the option’s expected term, the volatility of our common shares, the risk-free interest rate and the aggregate intrinsic value was $9 million.dividend yield over the option’s expected term.
Nonemployee DirectorsNONEMPLOYEE DIRECTORS
Our nonemployee directors are entitled to receive restricted share awards under the Directors’ Plan. For 2020, 20192023, 2022 and 2018,2021, nonemployee directors were granted a specified number of restricted shares, with a value equal to $100,000.$140,000, $140,000 and $120,000, respectively. The number of shares is based on the closing price of our common shares on the date of the Annual Meeting. The restricted share awards issued under the Directors' Plan generally vest 12 months from the grant date. The awards are subject to any deferral election and the terms of the Directors’ Plan and an award agreement.
On March 13, 2020, 0.3 million restricted stock units previously awarded to the members of the AK Steel board of directors were distributed per the terms of the AK Steel Merger Agreement.
For the last three years, grants of restricted and/or deferred shares have been awarded to elected or re-elected nonemployee directors as follows:
| | | | | | | | | | | | | | |
| Year of Grant | | Restricted Shares | | Deferred Shares |
| 2020 | | 253,809 | | | 54,794 | |
| 2019 | | 86,477 | | | 23,659 | |
| 2018 | | 92,718 | | | 17,170 | |
NOTE 1211 - INCOME TAXES
Income (loss) from continuing operations before income taxes includes the following components:
| | (In Millions) |
| 2020 | | 2019 | | 2018 |
| | Year Ended December 31, | | | | Year Ended December 31, |
| (In millions) | | (In millions) | | 2023 | | 2022 | | 2021 |
| United States | United States | | $ | (201) | | | $ | 313 | | | $ | 565 | |
| Foreign | Foreign | | 8 | | | 0 | | | 0 | |
| $ | (193) | | | $ | 313 | | | $ | 565 | |
| Total | |
The components of the income tax provision (benefit) onexpense from continuing operations consist of the following:
| | (In Millions) |
| 2020 | | 2019 | | 2018 |
| Current provision (benefit): | | | | | | |
| | Year Ended December 31, | | | | Year Ended December 31, |
| (In millions) | | (In millions) | | 2023 | | 2022 | | 2021 |
| Current provision: | |
| United States federal | |
| United States federal | |
| United States federal | United States federal | | $ | (2) | | | $ | (1) | | | $ | (1) | |
| United States state & local | United States state & local | | 0 | | | 0 | | | 0 | |
| Foreign | Foreign | | (1) | | | 0 | | | 1 | |
| (3) | | | (1) | | | 0 | |
| | 34 | |
| Deferred provision (benefit): | Deferred provision (benefit): | |
| United States federal | |
| United States federal | |
| United States federal | United States federal | | (95) | | | 19 | | | (475) | |
| United States state & local | United States state & local | | (11) | | | 0 | | | 0 | |
| Foreign | Foreign | | (2) | | | 0 | | | 0 | |
| Total income tax provision (benefit) from continuing operations | | $ | (111) | | | $ | 18 | | | $ | (475) | |
| Total income tax expense from continuing operations | |
12288 | CLF 2023 FORM 10-K
Reconciliation of our income tax attributable to continuing operations computed at the U.S. federal statutory rate is as follows:
| | | | | | | | | | | | | | | | | | | | | | | | | | | | | | | | | | | | | | |
| | (In Millions) |
| | 2020 | | 2019 | | 2018 |
| Tax at U.S. statutory rate | | $ | (41) | | | 21 | % | | $ | 66 | | | 21 | % | | $ | 119 | | | 21 | % |
| Increase (decrease) due to: | | | | | | | | | | | | |
| Percentage depletion in excess of cost depletion | | (42) | | | 22 | | | (49) | | | (16) | | | (55) | | | (10) | |
| Non-taxable income related to noncontrolling interests | | (9) | | | 4 | | | 0 | | | 0 | | | 0 | | | 0 | |
| | | | | | | | | | | | |
| Luxembourg legal entity reduction | | 0 | | | 0 | | | 846 | | | 271 | | | 162 | | | 29 | |
| Valuation allowance release: | | | | | | | | | | | | |
| Current year activity | | 0 | | | 0 | | | 0 | | | 0 | | | (80) | | | (14) | |
| Release of U.S. valuation allowance | | 0 | | | 0 | | | 0 | | | 0 | | | (461) | | | (81) | |
| Luxembourg legal entity reduction | | 0 | | | 0 | | | (846) | | | (271) | | | (162) | | | (29) | |
| State taxes, net | | (11) | | | 6 | | | 0 | | | 0 | | | 0 | | | 0 | |
| | | | | | | | | | | | |
| | | | | | | | | | | | |
| | | | | | | | | | | | |
| | | | | | | | | | | | |
| | | | | | | | | | | | |
| | | | | | | | | | | | |
| Other items, net | | (8) | | | 4 | | | 1 | | | 1 | | | 2 | | | 0 | |
| Provision for income tax expense (benefit) and effective income tax rate including discrete items | | $ | (111) | | | 57 | % | | $ | 18 | | | 6 | % | | $ | (475) | | | (84) | % |
| | | | | | | | | | | | | | | | | | | | | | | | | | | | | | | | | | | | | | |
| (In millions) | | 2023 | | 2022 | | 2021 |
| Tax at U.S. statutory rate | | $ | 125 | | | 21 | % | | $ | 377 | | | 21 | % | | $ | 799 | | | 21 | % |
| Increase (decrease) due to: | | | | | | | | | | | | |
| Percentage depletion in excess of cost depletion | | (32) | | | (5) | | | (49) | | | (3) | | | (99) | | | (3) | |
| | | | | | | | | | | | |
| | | | | | | | | | | | |
| | | | | | | | | | | | |
| | | | | | | | | | | | |
| | | | | | | | | | | | |
| Valuation allowance | | 14 | | | 2 | | | — | | | — | | | — | | | — | |
| Unrecognized tax benefits | | 7 | | | 1 | | | 2 | | | — | | | 9 | | | — | |
| State taxes, net | | 28 | | | 5 | | | 71 | | | 4 | | | 86 | | | 2 | |
| | | | | | | | | | | | |
| Federal & state provision to return | | (20) | | | (3) | | | 27 | | | 1 | | | (2) | | | — | |
| | | | | | | | | | | | |
| Income not subject to tax | | (11) | | | (2) | | | (9) | | | — | | | (9) | | | — | |
| Goodwill impairment | | 26 | | | 4 | | | — | | | — | | | — | | | — | |
| Other items, net | | 11 | | | 2 | | | 4 | | | — | | | (11) | | | — | |
| Provision for income tax expense and effective income tax rate including discrete items | | $ | 148 | | | 25 | % | | $ | 423 | | | 23 | % | | $ | 773 | | | 20 | % |
The increase in income tax benefit from 2019 to 2020 is directly correlated to the increase in pre-tax book loss from the prior period for both federal and state income tax purposes. The other primary driver of the increase in income tax benefit is related to income of noncontrolling interests for which no tax is recognized.
The increasedecreases in income tax expense from 2018in 2023, as compared to 2019 is primarily due2022, as well as 2022 compared to release of2021 are predominately related to the valuation allowancedecrease in the U.S. of $461 million in 2018, which did not recur in 2019. The Luxembourg legal entity reduction relates to initiatives resulting in the dissolution of certain entities and settlement of related financial instruments in the years ended December 31, 2019 and 2018. These 2019 and 2018 NOL deferred tax asset reductions resulted in tax expense of $846 million and $162 million, respectively, which were fully offset by decreases in the respective valuation allowance.pre-tax book income year-over-year.
The components of income taxes for other than continuing operations consisted of the following:
| | | | | | | | | | | | | | | | | | | | |
| | (In Millions) |
| | 2020 | | 2019 | | 2018 |
| Other comprehensive income: | | | | | | |
| Postretirement benefit liability | | $ | (52) | | | $ | 11 | | | $ | 4 | |
| Unrealized net loss on derivative financial instruments | | (1) | | | 0 | | | 1 | |
| Total | | $ | (53) | | | $ | 11 | | | $ | 5 | |
| | | | | | |
| | | | | | |
| | | | | | |
| | | | | | |
| | | | | | | | | | | | | | | | | | | | |
| (In millions) | | 2023 | | 2022 | | 2021 |
| Other comprehensive income (loss): | | | | | | |
| Pension and OPEB | | $ | 10 | | | $ | (425) | | | $ | (206) | |
| Derivative financial instruments | | 47 | | | 26 | | | (21) | |
| Total | | $ | 57 | | | $ | (399) | | | $ | (227) | |
| | | | | | |
| | | | | | |
| | | | | | |
| | | | | | |
Significant components of our deferred tax assets and liabilities are as follows:
| | (In Millions) |
| 2020 | | 2019 |
| (In millions) | | (In millions) | 2023 | | 2022 |
| Deferred tax assets: | Deferred tax assets: | | | |
| Operating loss and other carryforwards | |
| Operating loss and other carryforwards | |
| Operating loss and other carryforwards | Operating loss and other carryforwards | $ | 1,236 | | | $ | 795 | |
| Pension and OPEB liabilities | Pension and OPEB liabilities | 228 | | | 114 | |
| | Property, plant and equipment and mineral rights | 0 | | | 1 | |
| | Environmental | |
| | Environmental | |
| | Environmental | |
| | Product inventories | |
| Product inventories | |
| Product inventories | |
| | State and local | State and local | 132 | | | 71 | |
| | State and local | |
| State and local | |
| Lease liabilities | |
| Other liabilities | Other liabilities | 190 | | | 70 | |
| Total deferred tax assets before valuation allowance | Total deferred tax assets before valuation allowance | 1,786 | | | 1,051 | |
| Deferred tax asset valuation allowance | Deferred tax asset valuation allowance | (836) | | | (441) | |
| Net deferred tax assets | Net deferred tax assets | 950 | | | 610 | |
| Deferred tax liabilities: | Deferred tax liabilities: | |
| Investment in partnerships | (144) | | | (137) | |
| Investment in ventures | |
| Investment in ventures | |
| Investment in ventures | |
| | Lease assets | |
| Lease assets | |
| Lease assets | |
| Property, plant and equipment and mineral rights | Property, plant and equipment and mineral rights | (246) | | | 0 | |
| Other assets | Other assets | (68) | | | (14) | |
| Total deferred tax liabilities | Total deferred tax liabilities | (458) | | | (151) | |
| Net deferred tax assets | $ | 492 | | | $ | 459 | |
| Net deferred tax assets (liabilities) | |
We had gross domestic (including states) and foreign NOLs of $7,444$1,704 million and $1,592$1,452 million, respectively, at December 31, 2020.2023. We had gross domestic (including states) and foreign NOLs of $3,459$2,278 million and $1,592$1,444 million, respectively, at December 31, 2019.2022. The U.S. federal NOLs will begin to expire in 2034 and state NOLs will begin to expire in 2021.2024. The foreign NOLs can be carried forward indefinitely. We had foreign tax credit carryforwards of $6 million atbegin to expire in 2035. For the year ended December 31, 2019, which expired in 2020. We2023, we had no gross interest expense limitation carryforwards of $80 million and $55 million forcarryforwards. For the yearsyear ended December 31, 2020 and 2019, respectively. This2022, we had $77 million gross interest expense can be carried forward indefinitely.limitation carryforwards.
The changes in the valuation allowance are presented below:
| | (In Millions) |
| 2020 | | 2019 | | 2018 |
| (In millions) | | (In millions) | 2023 | | 2022 | | 2021 |
| Balance at beginning of year | Balance at beginning of year | $ | 441 | | | $ | 1,287 | | | $ | 1,983 | |
| Change in valuation allowance: | Change in valuation allowance: | |
| Included in income tax expense (benefit) | (3) | | | (846) | | | (691) | |
| Change in deferred assets in other comprehensive income | 0 | | | 0 | | | (5) | |
| Increase from acquisitions | 398 | | | 0 | | | 0 | |
| Included in income tax expense | |
| Included in income tax expense | |
| Included in income tax expense | |
| | Decrease from acquisitions | |
| Decrease from acquisitions | |
| Decrease from acquisitions | |
| Balance at end of year | Balance at end of year | $ | 836 | | | $ | 441 | | | $ | 1,287 | |
At December 31, 2023 and 2022, we have a valuation allowance recorded of $356 million and $342 million, respectively, related to foreign deferred tax assets, and an additional $40 million and $48 million, respectively, against certain state NOLs, which are expected to expire before utilization.
During 2020,2023, we recorded a $398$14 million valuation allowance through opening balance sheet adjustments to reflect theagainst a portion of our Canadian deferred tax assets due to losses in recent years. We intend to maintain a valuation allowance against these deferred tax assets, unless and until sufficient positive evidence exists to support the realization of such assets.
During 2021, we recorded a decrease to the valuation allowance of $345 million related to the election filed with our 2020 federal and statetax return to waive the pre-acquisition NOLs that are limited under Section 382 of the IRC acquired through the AK Steel Merger.
During 2019, a legal entity reduction initiativeIRC. An offsetting decrease was completed in Luxembourg resulting in the dissolution of certain entities and settlement of related financial instruments, triggering the utilization of $1.3 billion of NOL deferred tax asset and reversal of the intercompany notes deferred tax liability of $447 million. In addition, prior year adjustments in Luxembourg and a statutory rate reduction from 26.01% to 24.94% resulted in a net increase to the operating loss carryforward deferred tax asset of $46 million. The total net deferred tax reduction resulted in an expense of $846 million which was fully offset by a decrease in the valuation allowance. During 2018, a similar legal entity reduction initiative was completed resulting in the dissolution of certain Luxembourg entities which resulted in a decreaserecorded in the NOL deferred tax asset of $162 million which was fully offset by a decrease in valuation allowance. We continue to maintain a full valuation allowance against the remaining Luxembourg net deferred tax assets of $397 million at December 31, 2020 and 2019.same period.
Our losses in Luxembourg in recent periods represent sufficient negative evidence to require a full valuation allowance against the deferred tax assets in that jurisdiction. We intend
to maintain a valuation allowance against the deferred tax assets related to these operating losses, unless and until sufficient positive evidence exists to support the realization of such assets.
We recorded a $696 million net decrease in the valuation allowance in the year ended December 31, 2018. As of December 31, 2018, our U.S. operations emerged from a three-year cumulative loss position. As the significant negative evidence of cumulative losses had been eliminated, we undertook an evaluation of the continuing need for a valuation allowance on the U.S. deferred tax assets, the majority of which related to the U.S. tax NOLs.
In completing our evaluation of whether a valuation allowance was still needed, we considered all available positive and negative evidence. Positive evidence considered included the emergence from the three-year cumulative loss position, our long-term customer contracts with minimum tonnage requirements, the global scarcity of iron ore pellets, near term forecasts of strong profitability and the recently revised IRC Section 163(j) interest deduction limitation. Negative evidence included the overall size of the deferred tax asset with limited carryforward and no carryback opportunity, the finite nature of the iron ore resources we mine, the uncertainty of steel tariffs that positively impacted our revenue rates in 2018 and the various market signs that the U.S. economy may be nearing the end of the current expansion.
We also considered that future realization of the deferred tax assets depends on the existence of sufficient taxable income of the appropriate character during the carryforward period. In considering sources of taxable income, we identified that a portion of the deferred tax assets would be utilized by existing taxable temporary differences reversing in the same periods as existing deductible temporary differences. In addition, we determined that carryback opportunities and tax planning strategies do not exist as potential sources of future taxable income. Lastly, forecasting future taxable income was considered, but was challenging in a cyclical industry such as ours as it relies heavily on the accuracy of key assumptions, particularly about key pricing benchmarks.
Because historical information is verifiable and more objective than forecast information and due to the cyclicality of the industry, we developed an estimate of future income based on our historical earnings through the most recent industry cycle. We adjusted historical earnings for certain non-recurring items as well as to reflect the current corporate structure by eliminating the impact of discontinued operations and extinguished debt (“core earnings”). Additionally, we adjusted core earnings to reflect the impact of the recently revised IRC Section 163(j) interest expense deduction limitation as well as permanent tax adjustments. The IRC Section 163(j) limitation would limit our interest expense deduction, particularly in down years in the industry cycle, resulting in higher taxable income.
Based on the core earnings analysis, our average annual book taxable income through the business cycle was in excess of the estimated $10 million taxable income that would be required annually to fully utilize the deferred tax assets within the 19-year carryforward period. We ascribed significant weight in our assessment to the core earnings analysis and the resulting projection of taxable income through the industry cycle. Based on the weight of this positive evidence, and after considering the other available positive and negative evidence, we determined that it was appropriate to release all of the valuation allowance related to U.S. federal deferred tax assets at December 31, 2018 as it was more likely than not that the entire amount of the U.S. deferred tax asset would be realized before the end of the carryforward period. The income tax benefit recorded for the reversal of the valuation allowance against the U.S. deferred tax assets was $461 million for the year ended December 31, 2018.
We also have a valuation allowance recorded against certain state NOLs and foreign tax credits, which are expected to expire before utilization. At December 31, 20202023 and 2019,2022, we had a valuation allowance recorded against certain state NOLs of $98 million and $38 million, respectively. At December 31, 2019, we had a valuation allowance recorded against certain foreign tax credits of $6 million, which expired in 2020.
At December 31, 2020 and 2019, we had 0no cumulative undistributed earnings of foreign subsidiaries included in retained earnings. Accordingly, no provision has been made for U.S. deferred taxes related to future repatriation of earnings.
A reconciliation of the beginning and ending amount of unrecognized tax benefits is as follows:
| | (In Millions) |
| 2020 | | 2019 | | 2018 |
| (In millions) | | (In millions) | 2023 | | 2022 | | 2021 |
| Unrecognized tax benefits balance as of January 1 | Unrecognized tax benefits balance as of January 1 | | $ | 29 | | | $ | 29 | | | $ | 33 | |
| | Increase for tax positions in current year | | 7 | | | 0 | | | 4 | |
| Increases for tax positions in current year | |
| Increases for tax positions in current year | |
| Increases for tax positions in current year | |
| | Decrease for tax positions of prior year | | (4) | | | 0 | | | 0 | |
| Decrease due to tax positions in prior year | |
| Decrease due to tax positions in prior year | |
| Decrease due to tax positions in prior year | |
| Lapses in statutes of limitations | Lapses in statutes of limitations | | 0 | | | 0 | | | (8) | |
| Increases from acquisitions | | 75 | | | 0 | | | 0 | |
| | Unrecognized tax benefits balance as of December 31 | Unrecognized tax benefits balance as of December 31 | | $ | 107 | | | $ | 29 | | | $ | 29 | |
| Unrecognized tax benefits balance as of December 31 | |
| Unrecognized tax benefits balance as of December 31 | |
At December 31, 20202023 and 2019,2022, we had $107 million and $29 million, respectively, of unrecognized tax benefits recorded. Of this amount, $9 million was recorded in Other current liabilities for the year ended December 31, 2020. Additionally, $2of $76 million and $4$58 million, were recordedrespectively, included in Other non-current liabilities for the years ended December 31, 2020 and 2019, respectively, and $96 million was recorded in Other non-current assets for both years inon the Statements of Consolidated Financial Position. If the unrecognized tax benefits were recognized, the entire $11full $76 million would impact the effective tax rate. Interest and penalties related to unrecognized tax benefits are $8 million for the year ended December 31, 2023. We do not expect that the amount of unrecognized benefits will change significantly within the next 12 months. At December 31, 2020 and 2019, we had $1 million and $4 million, respectively, of accrued interest and penalties related to the unrecognized tax benefits recorded in Other non-current liabilities in the Statements of Consolidated Financial Position.
Tax years 2016 and forward remain subject to examination for the U.S., and tax years 20082018 and forward remain subject to examination for Canada.
NOTE 1312 - LEASE OBLIGATIONS
Our operating leases consist primarily of leases for land, office space, iron ore vessels, rail cars processing equipment and mining equipment.storage tanks. Our finance leases consist primarily of processingmining equipment and mining equipment. Werail cars. When an implicit discount rate is not readily determinable under our leases, we use our incremental borrowing rate as the discount rate to determine the present value of the lease payments, as our leases do not have readily determinable implicit discount rates.payments. Our incremental borrowing rate is the rate of interest that we would have to borrow on a collateralized basis over a similar term and amount in a similar economic environment to pay our lease obligations. We determine the incremental borrowing rates for our leases by adjusting the local risk-free interest rate with a credit risk premium corresponding to our credit rating. From time to time, we may enter into arrangements for the construction or purchase of an asset and then enter into a financing arrangement to lease the asset. We recognize leased assets and liabilities under these arrangements when we obtain control of the asset.
Lease costs are presented below:
| | | | | | | | | | | |
| (In Millions) |
| Year Ended December 31, |
| 2020 | | 2019 |
| Operating leases | $ | 43 | | | $ | 4 | |
| Finance leases: | | | |
| Amortization of lease cost | 15 | | | 6 | |
| Interest on lease liabilities | 4 | | | 2 | |
| Short-term leases | 13 | | | 6 | |
| | | |
| Total | $ | 75 | | | $ | 18 | |
12690 | CLF 2023 FORM 10-K
Lease costs are presented below:
| | | | | | | | | | | | | |
| Year Ended December 31, |
| (In millions) | 2023 | | 2022 | | |
| Operating leases | $ | 59 | | | $ | 64 | | | |
| Finance leases: | | | | | |
| Amortization of right-of-use assets | 92 | | | 103 | | | |
| Interest on lease liabilities | 11 | | | 8 | | | |
| Short-term leases | 171 | | | 160 | | | |
| | | | | |
| Total | $ | 333 | | | $ | 335 | | | |
Lease terms and discount rates are shown below:
| | | | | |
| December 31, |
| (In millions) | 2023 |
| Weighted average lease term (in years): | |
| Operating leases | 8 |
| Finance leases | 7 |
| Weighted average discount rate: | |
| Operating leases | 8 | % |
| Finance leases | 6 | % |
Other information related to leases was as follows:
| | | | | | | | | | | |
| (In Millions) |
| Year Ended December 31, |
| 2020 | | 2019 |
| Cash paid for amounts included in measurement of lease liabilities: | | | |
| Operating leases within cash flows from operating activities | $ | 43 | | | $ | 4 | |
| Finance leases within cash flows from operating activities | $ | 4 | | | $ | 2 | |
| Finance leases within cash flows from financing activities | $ | 15 | | | $ | 6 | |
Right-of-use assets obtained in exchange for new finance lease liabilities1 | $ | 44 | | | $ | 29 | |
| Weighted-average remaining lease term - operating leases (in years) | 8 | | 10 |
| Weighted-average remaining lease term - finance leases (in years) | 5 | | 6 |
| Weighted-average discount rate - operating leases | 8 | % | | 8 | % |
| Weighted-average discount rate - finance leases | 4 | % | | 5 | % |
1 Right-of-use assets obtained in the Acquisitions are not included in this figure. |
| | | | | | | | | | | | | | | | | |
| Year Ended December 31, |
| (In millions) | 2023 | | 2022 | | 2021 |
| Cash paid for amounts included in measurement of lease liabilities: | | | | | |
| Operating leases within cash flows from operating activities | $ | 57 | | $ | 62 | | $ | 70 |
| Finance leases within cash flows from operating activities | 11 | | 8 | | 9 |
| Finance leases within cash flows from financing activities | 92 | | 96 | | 94 |
| Right-of-use assets obtained in exchange for new finance lease liabilities | 93 | | 55 | | 50 |
Future minimum lease payments under noncancellable finance and operating leases as of December 31, 20202023 were as follows:
| | (In Millions) |
| Finance
Leases | | Operating Leases |
| 2021 | $ | 100 | | | $ | 70 | |
| 2022 | 95 | | | 53 | |
| 2023 | 78 | | | 46 | |
| (In millions) | | (In millions) | Finance Leases | | Operating Leases |
| 2024 | 2024 | 23 | | | 38 | |
| 2025 | 2025 | 22 | | | 34 | |
| 2026 | |
| 2027 | |
| 2028 | |
| Thereafter | Thereafter | 76 | | | 122 | |
| Total future minimum lease payments | Total future minimum lease payments | 394 | | | 363 | |
| Less: imputed interest | Less: imputed interest | 59 | | | 99 | |
| Total lease payments | Total lease payments | 335 | | | 264 | |
| Less: current portion of lease liabilities | Less: current portion of lease liabilities | 91 | | | 53 | |
| Long-term lease liabilities | Long-term lease liabilities | $ | 244 | | | $ | 211 | |
The current and long-term portions of our finance lease liabilities are included in Other current liabilitiesandOther non-current liabilities, respectively. The current and long-term portions of our operating lease liabilities are included in Other current liabilities and Other non-current liabilities, respectively.
NOTE 1413 - ASSET RETIREMENT OBLIGATIONS
The following is a summary of our asset retirement obligations:
| | | | | | | | | | | |
| (In Millions) |
| December 31, |
| 2020 | | 2019 |
Asset retirement obligations1 | $ | 342 | | | $ | 165 | |
| Less: current portion | 7 | | | 2 | |
| Long-term asset retirement obligations | $ | 335 | | | $ | 163 | |
| | | |
1 Includes $190 million and $22 million related to our active operations as of December 31, 2020 and 2019, respectively. |
The accrued closure obligation provides for contractual and legal obligations related to our indefinitely idled and closed operations and for the eventual closure of our active operations. We performed a detailed assessment of our asset retirement obligations related to our active operations most recently in 2020 in accordance with our
accounting policy, which requires us to perform an in-depth evaluation of the liability every three years in addition to routine annual assessments. In 2020, we employed third-party specialists to assist in the evaluation.
Additionally, we have included in our asset retirement obligation $172 million for our integrated steel facilities and other operations acquired in the Acquisitions. The closure date for each of our active mine sites was determined based on the exhaustion date of the remaining mineral reserves, and the amortization of the related asset and accretion of the liability is recognized over the estimated mine lives. The closure date and expected timing of the capital requirements to meet our obligations for our indefinitely idled or closed mines is determined based on the unique circumstances of each property. For indefinitely idled or closed mines, the accretion of the liability is recognized over the anticipated timing of remediation. As the majority of our assetAsset retirement obligations at our steelmaking operations have indeterminate settlement dates, assetprimarily include the closure and post-closure care for on-site landfills and other waste containment facilities. Asset retirement obligations have been recorded at present values using estimated rangessettlement dates based on when we expect these facilities to reach capacity and close.
We performed a detailed assessment of our asset retirement obligations related to our active mining operations most recently in 2023 in accordance with our accounting policy, which requires us to perform an in-depth evaluation of the economic livesliability every three years in addition to routine annual assessments. In 2023, we employed third-party specialists to assist in the evaluation.
The following is a summary of the underlying assets.our asset retirement obligations:
| | | | | | | | | | | |
| December 31, |
| (In millions) | 2023 | | 2022 |
Asset retirement obligations1 | $ | 459 | | | $ | 520 | |
| Less: current portion | 15 | | | 21 | |
| Long-term asset retirement obligations | $ | 444 | | | $ | 499 | |
| | | |
1 Includes $259 million and $277 million related to our active operations as of December 31, 2023 and 2022, respectively. |
The following is a roll-forward of our asset retirement obligation liability:obligation:
| | (In millions) | |
| (In millions) | |
| (In millions) | |
| Asset retirement obligation as of January 1 | |
| Asset retirement obligation as of January 1 | |
| Asset retirement obligation as of January 1 | |
| | (In Millions) | |
| Decrease from sale of business | |
| | 2020 | | 2019 | |
| Asset retirement obligation as of January 1 | $ | 165 | | | $ | 172 | | |
| Increase from acquisitions | 172 | | | 0 | | |
| Decrease from sale of business | |
| | Decrease from sale of business | |
| Reclassification from environmental obligations | |
| Reclassification from environmental obligations | |
| Reclassification from environmental obligations | |
| Accretion expense | |
| Accretion expense | |
| Accretion expense | Accretion expense | 14 | | | 10 | | |
| Remediation payments | Remediation payments | (9) | | | (1) | | |
| Remediation payments | |
| Remediation payments | |
| Revision in estimated cash flows | |
| Revision in estimated cash flows | |
| Revision in estimated cash flows | Revision in estimated cash flows | — | | | (16) | | |
| Asset retirement obligation as of December 31 | Asset retirement obligation as of December 31 | $ | 342 | | | $ | 165 | | |
| Asset retirement obligation as of December 31 | |
| Asset retirement obligation as of December 31 | |
During 2023, we entered into a membership interest purchase agreement for the sale of the legal entities owning, among other things, our closed coal mines in Pennsylvania, resulting in a decrease to our asset retirement obligation.
NOTE 14 - FAIR VALUE OF FINANCIAL INSTRUMENTS
The carrying values of certain financial instruments (e.g. Accounts receivable, net, Accounts payable and Other current liabilities) approximate fair value and, therefore, have been excluded from the table below. See NOTE 15 - DERIVATIVE INSTRUMENTS AND HEDGING for information on our derivative instruments, which are accounted for at fair value on a recurring basis.
A summary of the carrying value and fair value of other financial instruments were as follows:
| | | | | | | | | | | | | | | | | | | | | | | | | | | | | |
| | | December 31, 2023 | | December 31, 2022 |
| (In millions) | Classification | | Carrying
Value | | Fair Value | | Carrying
Value | | Fair Value |
| Senior notes | Level 1 | | $ | 3,137 | | | $ | 3,118 | | | $ | 2,385 | | | $ | 2,311 | |
| ABL Facility - outstanding balance | Level 2 | | — | | | — | | | 1,864 | | | 1,864 | |
| Total | | | $ | 3,137 | | | $ | 3,118 | | | $ | 4,249 | | | $ | 4,175 | |
The revisionvaluation of financial assets classified in estimated cash flows during the year ended December 31, 2019Level 2 was determined using a market approach based upon quoted prices for $16 million primarily relates to an extension of the life-of-mine plan for Tilden mine based on the economic reserve analysis performed during 2019.similar assets in active markets or other inputs that were observable.
NOTE 15 - DERIVATIVE INSTRUMENTS AND HEDGING
Derivatives Not Designated as Hedging Instruments
Customer Supply Agreement
A supply agreement with ArcelorMittal USA provided us supplemental revenue or provided refundsWe are exposed to ArcelorMittal USA based onfluctuations in market prices of raw materials and energy sources. We may use cash-settled commodity swaps to hedge the HRC price at the time the iron ore product was consumed in its blast furnaces. The supplemental pricing is characterized as a freestanding derivative instrument and is required to be accounted for separately once control transfers to the customer. The derivative instrument, which is finalized based on a future price, is adjusted to fair value through Revenues each reporting period based upon current market data and forward-looking estimates provided by management until the pellets are consumed and the amounts are settled. Upon the completion of the AM USA Transaction, the outstanding derivatives were settled as part of acquisition accounting. Included within Revenues related to Topic 815 for the supplemental revenue portion of the supply agreement is derivative revenue of $122 million, $78 million and $426 million for the years ended December 31, 2020, 2019 and 2018, respectively.
Refer to NOTE 9 - FAIR VALUE OF FINANCIAL INSTRUMENTS for additional information.
NOTE 16 - CAPITAL STOCK
Acquisition of AK Steel
As more fully described in NOTE 3 - ACQUISITIONS, we acquired AK Steel on March 13, 2020. At the effective time of the AK Steel Merger, each share of AK Steel common stock issued and outstanding prior to the effective time of the AK Steel Merger was converted into, and became exchangeable for, 0.400 Cliffs common shares, par value $0.125 per share. We issued a total of 127 million Cliffs common shares in connectionrisk associated with the AK Steel Merger at a fair valuepurchase of $618 million. Followingcertain of our raw materials and energy requirements. Our hedging strategy is to reduce the closing of the AK Steel Merger, AK Steel's common stock was de-listedeffect on earnings from the NYSE.price volatility of these various commodity exposures, including timing differences between when we incur raw material commodity costs and when we receive sales surcharges from our customers
12892 | CLF 2023 FORM 10-K
Acquisitionbased on those raw materials. Independent of ArcelorMittal USAany hedging activities, price changes in any of these commodity markets could negatively affect operating costs.
As more fully described in NOTE 3 - ACQUISITIONS, we acquired ArcelorMittal USA on December 9, 2020. Pursuant to the terms of the AM USA Transaction Agreement, we issued 78,186,671 common shares and 583,273 shares of a new series of our Serial Preferred Stock, Class B, without par value,Our commodity contracts are designated as cash flow hedges for accounting purposes, and we record the “Series B Participating Redeemable Preferred Stock,”gains and losses for the derivatives in each case to an indirect, wholly owned subsidiaryAccumulated other comprehensive income until we reclassify them into Cost of ArcelorMittal as part ofgoods sold when we recognize the consideration paid by us in connection with the closing of the AM USA Transaction.associated underlying operating costs. Refer to Preferred Stock belowNOTE 17 - ACCUMULATED OTHER COMPREHENSIVE INCOME (LOSS) for further information.
Preferred StockOur commodity contracts are classified as Level 2 as values were determined using a market approach based upon quoted prices for similar assets in active markets or other inputs that were observable.
We have 3,000,000 shares of Serial Preferred Stock, Class A, without par value and 4,000,000 shares of Serial Preferred Stock, Class B, without par value, authorized; 0 Class A preferred shares are issued or outstanding. Pursuant toThe following table presents the terms of the AM USA Transaction Agreement, we issued 583,273 shares of a new seriesnotional amount of our Serial Preferred Stock, Class B, without par value, designated Series B Participating Redeemable Preferred Stock, without par value,outstanding hedge contracts:
| | | | | | | | | | | | | | | | | | | | | | | | | | |
| | | | | | Notional Amount |
| | | | | | December 31, |
| Commodity Contracts | | Unit of Measure | | Maturity Dates | | 2023 | | 2022 |
| Natural Gas | | MMBtu | | January 2024 - August 2026 | | 168,590,000 | | 127,790,000 |
| | | | | | | | |
| Electricity | | Megawatt hours | | January 2024 - October 2026 | | 3,501,898 | | 432,043 |
| | | | | | | | |
At December 31, 2023, we expect to an indirect, wholly owned subsidiaryreclassify $155 million of ArcelorMittal on December 9, 2020.
Series B Participating Redeemable Preferred Stock Termsnet losses related to our hedge contracts from Accumulated other comprehensive income into Cost of goods sold during the next 12 months.
The Series B Participating Redeemable Preferred Stock is classified for accounting purposes as temporary equity as a resultfollowing table presents the fair value of a change in control provision that could, under remote circumstances, require us to redeemour cash flow hedges and the preferred stock for cash.
The Series B Participating Redeemable Preferred Stock ranks senior to our common shares with respect to dividend rights and rightsclassification on the distributionStatements of assets upon any voluntary or involuntary liquidation, dissolution or winding up of the affairs of, and certain bankruptcy events involving, Cliffs. Each share of Series B Participating Redeemable Preferred Stock entitles its holder to receive a multiple, initially equal to 100 (subject to certain anti-dilution adjustments, the “Applicable Multiple”), of the aggregate amount per share of all dividends declared on the common shares. In addition, from and after the 24-month anniversary of the issue date of the Series B Participating Redeemable Preferred Stock (the “24-Month Anniversary”), each holder of a share of Series B Participating Redeemable Preferred Stock is entitled to receive cash dividends (the “Additional Dividends”) accruing and compounding on a daily basis at the initial rate of 10% per annum on the sum of (i) the Applicable Multiple then in effect times the volume-weighted average price of the common shares for the 20 consecutive trading days ending on the trading day immediately preceding the 24-Month Anniversary and (ii) the amount of accumulated and unpaid dividends on the Series B Participating Redeemable Preferred Stock to, but not including, the 24-Month Anniversary, if any, which rate will increase by 2% per annum at the end of each six-month period following the 24-Month Anniversary. Additional Dividends will be payable, when, as and if declared by the Board, in quarterly installments.Consolidated Financial Position:
The Series B Participating Redeemable Preferred Stock is redeemable, in whole or in part, at our option at any time and from time to time on and after the date that is 180 days after the issue date at a redemption price per share equal to the Applicable Multiple then in effect times the volume-weighted average price of the common shares for the 20 consecutive trading days ending on the trading day immediately preceding the date fixed for redemption, plus accumulated and unpaid dividends to, but not including, the redemption date. | | | | | | | | | | | | | | |
| | December 31, |
| Balance Sheet Location (In millions) | | 2023 | | 2022 |
| Other current assets | | $ | — | | | $ | 15 | |
| Other non-current assets | | 1 | | | 30 | |
| Other current liabilities | | (105) | | | (87) | |
| Other non-current liabilities | | (52) | | | (10) | |
In the event of a change of control of Cliffs, the Series B Participating Redeemable Preferred Stock will be subject to mandatory redemption at a redemption price per share equal to the Applicable Multiple then in effect times the volume-weighted average price of the common shares for the 20 consecutive trading days ending on the trading day immediately preceding the closing date of the transaction constituting such change of control.
In addition, pursuant to the terms of the Series B Participating Redeemable Preferred Stock, we are restricted from effecting any merger or consolidation with or into another entity unless the Series B Participating Redeemable Preferred Stock remains outstanding following the merger or consolidation, is exchanged for new preferred stock with substantially identical terms or is to be redeemed in connection with the closing of such merger or consolidation.NOTE 16 - CAPITAL STOCK
In addition to the foregoing, the Series B Participating Redeemable Preferred Stock is subject to the express terms of the Serial Preferred Stock, Class B, without par value, as set forth in Cleveland-Cliffs Inc.’s Fourth Amended Articles of Incorporation, as amended, except that holders of Series B Participating Redeemable Preferred Stock, in their capacity as such, do not have the right to vote with the other series of Serial Preferred Stock, Class B, without par value, then outstanding, if any, voting separately as a class, for the election of additional directors of Cleveland-Cliffs Inc. upon certain defaults by the Company in the payment of dividends, as provided in Cleveland-Cliffs Inc.’s Fourth Amended Articles of Incorporation, as amended.SHARE REPURCHASE PROGRAM
Dividends
The below table summarizes our recent dividend activity:
| | | | | | | | | | | | | | | | | | | | |
Declaration Date | | Record Date | | Payment Date | | Dividend Declared per Common Share1
|
2/18/2020 | | 4/3/2020 | | 4/15/2020 | | $ | 0.06 | |
12/2/2019 | | 1/3/2020 | | 1/15/2020 | | 0.06 | |
9/3/2019 | | 10/4/2019 | | 10/15/2019 | | 0.10 | |
5/31/2019 | | 7/5/2019 | | 7/15/2019 | | 0.06 | |
2/19/2019 | | 4/5/2019 | | 4/15/2019 | | 0.05 | |
10/18/2018 | | 1/4/2019 | | 1/15/2019 | | 0.05 | |
| | | | | | |
1 The dividend declared on September 3, 2019 included a special cash dividend of $0.04 per common share.
|
Subsequent to the dividend paid on April 15, 2020, our Board temporarily suspended future dividends as a result of the COVID-19 pandemic in order to preserve cash during this time of economic uncertainty.
Share Repurchase Program
In November 2018, we announced thatOn February 10, 2022, our Board of Directors authorized a program to repurchase outstanding common shares in the open market or in privately negotiated transactions, which may include purchases pursuant to Rule 10b5-1 plans or accelerated share repurchases, up to a maximum of $200 million, excluding commissions$1 billion. We are not obligated to make any purchases and fees. In April 2019, we announced that our Board of Directors increased the commonprogram may be suspended or discontinued at any time. The share repurchase authorization by an additional $100program does not have a specific expiration date. For the years ended December 31, 2023 and 2022, we repurchased 10.4 million excluding commissions and fees. During 2019,12.5 million common shares, respectively, at a cost of $152 million and $240 million in the aggregate, respectively. The cost of our share repurchases excludes the excise tax due under the Inflation Reduction Act. As of December 31, 2023, there was $608 million remaining under the authorization.
1.500% 2025 CONVERTIBLE SENIOR NOTES REDEMPTION
On December 1, 2021, we repurchasedissued a notice of redemption for all $294 million in aggregate principal amount outstanding of our 1.500% 2025 Convertible Senior Notes. Our 1.500% 2025 Convertible Senior Notes were redeemed on January 18, 2022, through a combination settlement, with the aggregate principal amount of $294 million paid in cash, and 24 million common shares, with a fair value of $499 million, delivered to noteholders in settlement of the premium due per the terms of the indenture, plus cash in respect of the accrued and unpaid interest on the 1.500% 2025 Convertible Senior Notes to, but not including, the redemption date per the terms of the indenture.
UNDERWRITTEN PUBLIC OFFERING
On February 11, 2021, we sold 20 million of our common shares and 40 million common shares were sold by an affiliate of ArcelorMittal in an underwritten public offering. In each case, shares were sold at a costprice per share of $253$16.12. Prior to this sale, ArcelorMittal held approximately 78 million of our common shares, which were issued as a part of the consideration in connection with the AM USA Transaction. We did not receive any proceeds from the sale of the 40 million common shares sold on behalf of ArcelorMittal. We used the net proceeds from the offering, plus cash on hand, to redeem $322 million aggregate including commissionsprincipal amount of our outstanding 9.875% 2025 Senior Secured Notes.
SERIES B PARTICIPATING REDEEMABLE PREFERRED STOCK REDEMPTION
We had 583,273 shares of our Series B Participating Redeemable Preferred Stock issued and fees. The share repurchase program was effective untiloutstanding as of December 31, 2019.2020. During the third quarter of 2021, we redeemed all 583,273 shares of our Series B Participating Redeemable Preferred Stock at a redemption price of $1.3 billion using borrowings under our ABL Facility.
AMENDMENT TO ARTICLES OF INCORPORATION
On April 29, 2021, we filed a Certificate of Amendment to our Fourth Amended Articles of Incorporation, as amended, to increase the total number of authorized common shares from 600,000,000 to 1,200,000,000.
PREFERRED STOCK
We have 3,000,000 shares of Serial Preferred Stock, Class A, without par value, authorized, and 4,000,000 shares of Serial Preferred Stock, Class B, without par value, authorized; no preferred shares were issued or outstanding as of December 31, 2023.
NOTE 17 - ACCUMULATED OTHER COMPREHENSIVE LOSSINCOME (LOSS)
The components of Accumulated other comprehensive lossincome within Cliffs shareholders’ equity and related tax effects allocated to each are shown below:
| | | | | | | | | | | | | | | | | |
| (In Millions) |
| Pre-tax
Amount | | Tax
Benefit | | After-tax
Amount |
| As of December 31, 2020: | | | | | |
| Postretirement benefit liability | $ | (221) | | | $ | 86 | | | $ | (135) | |
| Foreign currency translation adjustments | 3 | | | 0 | | | 3 | |
| Unrealized net loss on derivative financial instruments | (1) | | | 0 | | | (1) | |
| $ | (219) | | | $ | 86 | | | $ | (133) | |
| As of December 31, 2019: | | | | | |
| Postretirement benefit liability | $ | (454) | | | $ | 138 | | | $ | (316) | |
| Unrealized net loss on derivative financial instruments | (4) | | | 1 | | | (3) | |
| $ | (458) | | | $ | 139 | | | $ | (319) | |
| As of December 31, 2018: | | | | | |
| Postretirement benefit liability | $ | (408) | | | $ | 127 | | | $ | (281) | |
| Unrealized net loss on derivative financial instruments | (4) | | | 1 | | | (3) | |
| $ | (412) | | | $ | 128 | | | $ | (284) | |
The following table reflects the changes in Accumulated other comprehensive loss related to Cliffs shareholders’ equity:
| | | | | | | | | | | | | | | | | | | | | | | |
| (In Millions) |
| Postretirement Benefit Liability,
net of tax | | Foreign Currency Translation | | Derivative Financial Instruments,
net of tax | | Accumulated Other Comprehensive Loss |
| December 31, 2017 | $ | (264) | | | $ | 225 | | | $ | 0 | | | $ | (39) | |
| Other comprehensive income (loss) before reclassifications | (43) | | | 3 | | | (1) | | | (41) | |
| Net loss (gain) reclassified from accumulated other comprehensive loss | 26 | | | (228) | | | (2) | | | (204) | |
| December 31, 2018 | (281) | | | 0 | | | (3) | | | (284) | |
| Other comprehensive loss before reclassifications | (57) | | | 0 | | | (2) | | | (59) | |
| Net loss reclassified from accumulated other comprehensive loss | 22 | | | 0 | | | 2 | | | 24 | |
| December 31, 2019 | (316) | | | 0 | | | (3) | | | (319) | |
| Other comprehensive income (loss) before reclassifications | 163 | | | 3 | | | (6) | | | 160 | |
| Net loss reclassified from accumulated other comprehensive loss | 18 | | | 0 | | | 8 | | | 26 | |
| December 31, 2020 | $ | (135) | | | $ | 3 | | | $ | (1) | | | $ | (133) | |
The following table reflects the details about Accumulated other comprehensive loss components reclassified from Cliffs shareholders’ equity:
| | | | | | | | | | | | | | | | | | | | | | | | | | |
| | (In Millions) | | |
| Details about Accumulated Other Comprehensive Loss Components | | Amount of (Gain)/Loss
Reclassified into Income, Net of Tax | | Affected Line Item in the Statement of Consolidated Operations |
| Year Ended December 31, | |
| 2020 | | 2019 | | 2018 | |
| Amortization of pension and OPEB liability: | | | | | | | | |
Prior service costs1 | | $ | (1) | | | $ | (1) | | | $ | (1) | | | Other non-operating income |
Net actuarial loss1 | | 30 | | | 29 | | | 27 | | | Other non-operating income |
Settlements1 | | (6) | | | 0 | | | 0 | | | Other non-operating income |
| | 23 | | | 28 | | | 26 | | | Total before taxes |
| Income tax expense | | (5) | | | (6) | | | 0 | | | Income tax benefit (expense) |
| | $ | 18 | | | $ | 22 | | | $ | 26 | | | Net of taxes |
| | | | | | | | |
| Changes in foreign currency translation: | | | | | | | | |
Gain on foreign currency translation2 | | $ | 0 | | | $ | 0 | | | $ | (228) | | | Income (loss) from discontinued operations, net of tax |
| | | | | | | | |
| Changes in derivative financial instruments: | | | | | | | | |
| Commodity contracts | | $ | 10 | | | $ | 3 | | | $ | (2) | | | Cost of goods sold |
| Income tax expense | | (2) | | | (1) | | | 0 | | | Income tax benefit (expense) |
| | $ | 8 | | | $ | 2 | | | $ | (2) | | | Net of taxes |
| | | | | | | | |
| Total reclassifications for the period, net of tax | | $ | 26 | | | $ | 24 | | | $ | (204) | | | |
| | | | | | | | |
1 These accumulated other comprehensive loss components are included in the computation of net periodic benefit cost. See NOTE 10 - PENSIONS AND OTHER POSTRETIREMENT BENEFITS for further information. |
2 Represents Australian accumulated currency translation adjustments due to the liquidation of our Australian subsidiaries' net assets. |
NOTE 18 - RELATED PARTIES
We have certain co-owned joint ventures with companies from the steel and mining industries, including integrated steel companies, their subsidiaries and other downstream users of steel and iron ore products.
Hibbing is a co-owned joint venture with U.S. Steel, in which, as of December 31, 2020, we own 85.3% and U.S. Steel owns 14.7%. As a result of the AM USA Transaction, we acquired an additional 62.3% ownership stake in the Hibbing mine and became the majority owner and mine manager. Prior to the AM USA Transaction, ArcelorMittal was a related party due to its ownership interest in Hibbing. As such, certain long-term contracts with ArcelorMittal resulted in Revenues from related parties, and are included within the below.
Revenues from related parties were as follows:
| | | | | | | | | | | | | | | | | |
| (In Millions) |
| Year Ended December 31, |
| 2020 | | 2019 | | 2018 |
| Revenue from related parties | $ | 893 | | | $ | 1,015 | | | $ | 1,344 | |
Revenues1 | $ | 5,354 | | | $ | 1,990 | | | $ | 2,332 | |
Related party revenues as a percent of Revenues1 | 16.7 | % | | 51.0 | % | | 57.6 | % |
| Purchases from related parties | $ | 16 | | | $ | 0 | | | $ | 0 | |
| | | | | |
1 Includes Realization of deferred revenue of $35 million for the year ended December 31, 2020. |
The following table presents the classification of related party assets and liabilities in the Statements of Consolidated Financial Position:
| | | | | | | | | | | | | | |
| | (In Millions) |
| | December 31, |
| Balance Sheet Location of Assets (Liabilities) | | 2020 | | 2019 |
| Accounts receivable, net | | $ | 2 | | | $ | 31 | |
| Other current assets | | 0 | | | 45 | |
| Accounts payable | | (6) | | | 0 | |
| Other current liabilities | | 0 | | | (2) | |
Other current assets
Our supply agreement with ArcelorMittal USA contained provisions that provided us supplemental revenue or provided refunds to ArcelorMittal USA based on the HRC price at the time the iron ore product was consumed in its blast furnaces. The supplemental pricing was categorized as a freestanding derivative. Upon the completion of the AM USA Transaction, the outstanding derivative was settled as part of acquisition accounting. | | | | | | | | | | | | | | | | | |
| December 31, |
| (In millions) | 2023 | | 2022 | | 2021 |
| Foreign Currency Translation | | | | | |
| Beginning balance | $ | (1) | | | $ | 1 | | | $ | 3 | |
| Other comprehensive income (loss) before reclassifications | 1 | | | (2) | | | (2) | |
| Ending balance | $ | — | | | $ | (1) | | | $ | 1 | |
| | | | | |
| Derivative Instruments | | | | | |
| Beginning balance | $ | (16) | | | $ | 68 | | | $ | (1) | |
| Other comprehensive income (loss) before reclassifications | (345) | | | 146 | | | 151 | |
| Income tax | 81 | | | (33) | | | (34) | |
| Other comprehensive income (loss) before reclassifications, net of tax | (264) | | | 113 | | | 117 | |
Losses (gains) reclassified from AOCI to net income1 | 144 | | | (256) | | | (61) | |
Income tax expense (benefit)2 | (34) | | | 59 | | | 13 | |
| Net losses (gains) reclassified from AOCI to net income | 110 | | | (197) | | | (48) | |
| Ending balance | $ | (170) | | | $ | (16) | | | $ | 68 | |
| | | | | |
| Pension and OPEB | | | | | |
| Beginning balance | $ | 1,847 | | | $ | 549 | | | $ | (135) | |
Other comprehensive income before reclassifications4 | 115 | | | 1,759 | | | 878 | |
| Income tax | (39) | | | (434) | | | (203) | |
| Other comprehensive income before reclassifications, net of tax | 76 | | | 1,325 | | | 675 | |
Losses (gains) reclassified from AOCI to net income3 | (145) | | | (36) | | | 12 | |
Income tax expense (benefit)2 | 49 | | | 9 | | | (3) | |
| Net losses (gains) reclassified from AOCI to net income | (96) | | | (27) | | | 9 | |
| Ending balance | $ | 1,827 | | | $ | 1,847 | | | $ | 549 | |
| | | | | |
| Total AOCI Ending Balance | $ | 1,657 | | | $ | 1,830 | | | $ | 618 | |
|
1 Amounts recognized in Cost of goods sold in the Statements of Consolidated Operations. |
2 Amounts recognized in Income tax expense in the Statements of Consolidated Operations. |
3 Amounts recognized in Net periodic benefit credits other than service cost component in the Statements of Consolidated Operations. |
4 Refer to NOTE 9 - PENSIONS AND OTHER POSTRETIREMENT BENEFITS for further information. |
NOTE 1918 - VARIABLE INTEREST ENTITIES
SunCoke MiddletownSUNCOKE MIDDLETOWN
We purchase all the coke and electrical power generated from SunCoke Middletown’s plant under long-term supply agreements and have committed to purchase all the expected production from the facility through 2032. We consolidate SunCoke Middletown as a VIE because we are the primary beneficiary despite having no ownership interest in SunCoke Middletown. SunCoke Middletown had income before income taxes of $41$52 million and $47 million for the years ended December 31, 2023 and 2022, respectively, which was included in our consolidated Income from continuing operations before income taxes. Additionally, SunCoke Middletown had cash used for capital expenditures of $25 million for the year ended December 31, 2020, which was included in our consolidated income before income taxes.2023, compared to
13294 | CLF 2023 FORM 10-K
$12 million for the year ended December 31, 2022, that are included in our consolidated Purchase of property, plant and equipment on the Statements of Consolidated Cash Flows.
The assets of the consolidated VIE can only be used to settle the obligations of the consolidated VIE and not obligations of the Company. The creditors of SunCoke Middletown do not have recourse to the assets or general credit of the Company to satisfy liabilities of the VIE. The consolidated balance sheet asStatements of December 31, 2020Consolidated Financial Position includes the following amounts for SunCoke Middletown:
| | | | | |
| (In Millions) |
| December 31,
2020 |
Cash and cash equivalents | $ | 5 | |
Inventories | 21 | |
Property, plant and equipment, net | 308 | |
Accounts payable | (15) | |
Other assets (liabilities), net | (10) | |
Noncontrolling interest | (309) | |
| | | | | | | | | | | |
| December 31, |
| (In millions) | 2023 | | 2022 |
| | | |
| Inventories | $ | 29 | | | $ | 28 | |
| Property, plant and equipment, net | 288 | | | 288 | |
| Accounts payable | (26) | | | (19) | |
| Other assets (liabilities), net | (39) | | | (27) | |
| Noncontrolling interests | (252) | | | (270) | |
NOTE 2019 - EARNINGS PER SHARE
The following table summarizes the computation of basic and diluted EPS:
| | | | | | | | | | | | | | | | | |
| (In Millions, Except Per Share Amounts) |
| Year Ended December 31, |
| 2020 | | 2019 | | 2018 |
| Income (loss) from continuing operations | $ | (82) | | | $ | 295 | | | $ | 1,040 | |
| Income from continuing operations attributable to noncontrolling interest | (41) | | | 0 | | | 0 | |
| Net income (loss) from continuing operations attributable to Cliffs shareholders | (123) | | | 295 | | | 1,040 | |
| Income (loss) from discontinued operations, net of tax | 1 | | | (2) | | | 88 | |
| Net income (loss) attributable to Cliffs shareholders | $ | (122) | | | $ | 293 | | | $ | 1,128 | |
| | | | | |
| Weighted average number of shares: | | | | | |
| Basic | 379 | | | 277 | | | 297 | |
| Convertible senior notes | 0 | | | 4 | | | 3 | |
| Employee stock plans | 0 | | | 3 | | | 4 | |
| Diluted | 379 | | | 284 | | | 304 | |
| | | | | |
Earnings (loss) per common share attributable to
Cliffs common shareholders - basic: | | | | | |
| Continuing operations | $ | (0.32) | | | $ | 1.07 | | | $ | 3.50 | |
| Discontinued operations | 0 | | | (0.01) | | | 0.30 | |
| $ | (0.32) | | | $ | 1.06 | | | $ | 3.80 | |
Earnings (loss) per common share attributable to
Cliffs common shareholders - diluted: | | | | | |
| Continuing operations | $ | (0.32) | | | $ | 1.04 | | | $ | 3.42 | |
| Discontinued operations | 0 | | | (0.01) | | | 0.29 | |
| $ | (0.32) | | | $ | 1.03 | | | $ | 3.71 | |
| | | | | | | | | | | | | | | | | |
| Year Ended December 31, |
| (In millions, except per share amounts) | 2023 | | 2022 | | 2021 |
| Income from continuing operations | $ | 449 | | | $ | 1,373 | | | $ | 3,030 | |
| Income from continuing operations attributable to noncontrolling interest | (51) | | | (41) | | | (45) | |
| Net income from continuing operations attributable to Cliffs shareholders | 398 | | | 1,332 | | | 2,985 | |
| Income from discontinued operations, net of tax | 1 | | | 3 | | | 3 | |
| Net income attributable to Cliffs shareholders | $ | 399 | | | $ | 1,335 | | | $ | 2,988 | |
| | | | | |
| Weighted average number of shares: | | | | | |
| Basic | 510 | | | 519 | | | 498 | |
| Redeemable preferred shares | — | | | — | | | 33 | |
Convertible senior notes1 | — | | | 2 | | | 22 | |
| Employee stock plans | 1 | | | 3 | | | 5 | |
| Diluted | 511 | | | 524 | | | 558 | |
| | | | | |
Earnings per common share attributable to Cliffs common shareholders - basic2: | | | | | |
| Continuing operations | $ | 0.78 | | | $ | 2.57 | | | $ | 5.62 | |
| Discontinued operations | — | | | — | | | 0.01 | |
| $ | 0.78 | | | $ | 2.57 | | | $ | 5.63 | |
| Earnings per common share attributable to Cliffs common shareholders - diluted: | | | | | |
| Continuing operations | $ | 0.78 | | | $ | 2.55 | | | $ | 5.35 | |
| Discontinued operations | — | | | — | | | 0.01 | |
| $ | 0.78 | | | $ | 2.55 | | | $ | 5.36 | |
| | | | | |
1 On January 1, 2022, we adopted ASU 2020-06, Debt - Debt with Conversion and Other Options (Subtopic 470-20) and Derivatives and Hedging - Contracts in Entity's Own Equity (Subtopic 815-40). We utilized the modified retrospective method of adoption; using this approach, the guidance was applied to transactions outstanding as of the beginning of the fiscal year. |
2 For the year ended December 31, 2021, basic earnings per share was calculated by dividing Net income attributable to Cliffs shareholders, less $187 million of earnings attributed to Series B Participating Redeemable Preferred Stock, by the weighted average number of basic common shares outstanding during the period presented. |
The following table summarizes the potentially dilutive shares that have beenwere excluded from the computation of diluted earnings per share calculation for the year ended December 31, 2020, as they werebecause their effect would have been anti-dilutive:
| | | | | |
| (In Millions) |
| 2020 |
Redeemable preferred shares | 4 | |
Convertible senior notes | 2 | |
Shares related to employee stock plans | 1 | |
| | | | | | | | | | | | | | | | | |
| Year Ended December 31, |
| (In millions) | 2023 | | 2022 | | 2021 |
| Employee stock plans | 2 | | — | | | — | |
NOTE 2120 - COMMITMENTS AND CONTINGENCIES
Purchase CommitmentsPURCHASE COMMITMENTS
We purchase portions of the principal raw materials required for our steel manufacturing operations under annual and multi-year agreements, some of which have minimum quantity requirements. We also use large volumes of natural gas, electricity and industrial gases in our steel manufacturing operations. We negotiate most of our purchases of chrome, industrial gases and a portion of our electricity under multi-year agreements. Our purchases of coke are made under annual or multi-year agreements with periodic price adjustments. We typically purchase coal under annual fixed-pricefixed price agreements. We also purchase certain transportation services under multi-year contracts with minimum quantity requirements.
ContingenciesUnconditional purchase obligations, including take-or-pay agreements, are as follows (in millions):
| | | | | | | | | | | | | | | | | | | | | | | | | | | | | | | | |
| 2024 | | 2025 | | 2026 | | 2027 | | 2028 | | Thereafter |
| $ | 2,984 | | | $ | 1,707 | | | $ | 1,133 | | | $ | 1,025 | | | $ | 929 | | | $ | 5,365 | |
OTHER COMMERCIAL COMMITMENTS
We use surety bonds and letters of credit to provide financial assurance for certain obligations and statutory requirements. As of December 31, 2023, we had $260 million of surety-backed letters of credit and surety bonds outstanding. Additionally, as of December 31, 2023, we had $56 million of outstanding letters of credit issued under our ABL Facility.
CONTINGENCIES
We are currently the subject of, or party to, various claims and legal proceedings incidental to our current and historical operations. These claims and legal proceedings are subject to inherent uncertainties and unfavorable rulings could occur. An unfavorable ruling could include monetary damages, additional funding requirements or an injunction. If an unfavorable ruling were to occur, there exists the possibility of a material adverse effect on theour financial position and results of operations for the period in which the ruling occurs or future periods. However, based on currently available information we do not believe that any pending claims or legal proceedings will result in a material adverse effect in relation to our consolidated financial statements.
Environmental ContingenciesENVIRONMENTAL CONTINGENCIES
Although we believe our operating practices have been consistent with prevailing industry standards, hazardous materials may have been released at operating sites or third-party sites in the past, including operating sites that we no longer own. If we reasonably can, we estimate potential remediation expenditures for those sites where future remediation efforts are probable based on identified conditions, regulatory requirements, or contractual obligations arising from the sale of a business or facility. For sites involving government required investigations, we typically make an estimate of potential remediation expenditures only after the investigation is complete and when we better understand the nature and scope of the remediation. In general, the material factors in these estimates include the costs associated with investigations, delineations, risk assessments, remedial work, governmental response and oversight, site monitoring, and preparation of reports to the appropriate environmental agencies.
The following is a summary of our environmental obligations:
| | (In Millions) |
| December 31,
2020 | | December 31,
2019 |
| December 31, | | | December 31, |
| (In millions) | | (In millions) | 2023 | | 2022 |
| Environmental obligations | Environmental obligations | $ | 135 | | | $ | 2 | |
| Less current portion | 18 | | | 0 | |
| Less: current portion | |
| Long-term environmental obligations | Long-term environmental obligations | $ | 117 | | | $ | 2 | |
We cannot predict the ultimate costs for each site with certainty because of the evolving nature of the investigation and remediation process. Rather, to estimate the probable costs, we must make certain assumptions. The most significant of these assumptions is for the nature and scope of the work that will be necessary to investigate and remediate a particular site and the cost of that work. Other significant assumptions include the cleanup technology that will be used, whether and to what extent any other parties will participate in paying the investigation and remediation costs, reimbursement of past response costs and future oversight costs by governmental agencies, and the reaction of the governing environmental agencies to the proposed work plans. Costs for future investigation
and remediation are not discounted to their present value, unless the amount and timing of the cash disbursements are readily known. To the extent that we have been able to reasonably estimate future liabilities, we do not believe that there is a reasonable possibility that we will incur a loss or losses that exceed the amounts we accrued for the environmental matters discussed below that would, either individually or in the aggregate, have a material adverse effect on our consolidated financial condition, results of operations or cash flows. However, since we recognize amounts in the consolidated financial statements in accordance with GAAP that exclude potential losses that are not probable or that may not be currently estimable, the ultimate costs of these environmental matters may be higher than the liabilities we currently have recorded in our consolidated financial statements.
Pursuant to RCRA (Resource Conservation and Recovery Act), which governs the treatment, handling and disposal of hazardous waste, the EPA and authorized state environmental agencies may conduct inspections of RCRA-regulated facilities to identify areas where there have been releases of hazardous waste or hazardous constituents into the environment and may order the facilities to
take corrective action to remediate such releases. Likewise, the EPA or the states may require closure or post-closure care of residual, industrial and hazardous waste management units, including, but not limited to, landfills and deep injection wells.units. Environmental regulators have the authority to inspect all of our facilities. While we cannot predict the future actions of these regulators, it is possible that they may identify conditions in future inspections of these facilities that they believe require corrective action.
Pursuant to CERCLA, the EPA and state environmental authorities have conducted site investigations at some of our facilities and other third-party facilities, portions of which previously may have been used for disposal of materials that are currently regulated. The results of these investigations are still pending, and we could be directed to spend funds for remedial activities at the former disposal areas. Because of the uncertain status of these investigations, however, we cannot reasonably predict whether or when such spending might be required or its magnitude.
On April 29, 2002, AK Steel entered a mutually agreed-upon administrative order with the consent of the EPA pursuant to Section 122 of CERCLA to perform a RI/FS of the Hamilton plant site located in New Miami, Ohio. The plant ceased operations in 1990 and all of its former structures have been demolished. AK Steel submitted the investigation portion of the RI/FS and completed supplemental studies. Until the RI/FS is complete, we cannot reasonably estimate the additional costs, if any, we may incur for potentially required remediation of the site or when we may incur them.
EPA Administrative Order In Re: Ashland Coke
On September 26, 2012, the EPA issued an order under Section 3013 of RCRA requiring a plan to be developed for investigation of four areas at the Ashland Works coke plant. The Ashland Works coke plant ceased operations in 2011 and all of its former structures have been demolished and removed. In 1981, AK Steel acquired the plant from Honeywell International Corporation (as successor to Allied Corporation), who had managed the coking operations there for approximately 60 years. In connection with the sale of the coke plant, Honeywell agreed to indemnify AK Steel against certain claims and obligations that could arise from the investigation, and we intend to pursue such indemnification from Honeywell, if necessary. We cannot reasonably estimate how long it will take to complete the site investigation. On March 10, 2016, the EPA invited AK Steel to participate in settlement discussions regarding an enforcement action. Settlement discussions between the parties are ongoing, though whether the parties will reach agreement and any such agreement’s terms are uncertain. Until the site investigation is complete, we cannot reasonably estimate the costs, if any, we may incur for potential additional required remediation of the site or when we may incur them.
Burns Harbor Water Issues
In August 2019, ArcelorMittal Burns Harbor LLC (n/k/a Cleveland-Cliffs Burns Harbor LLC) suffered a loss of the blast furnace cooling water recycle system, which led to the discharge of cyanide and ammonia in excess of the Burns Harbor plant's NPDES permit limits. Since that time, the facility has taken numerous steps to prevent recurrence and maintain compliance with its NPDES permit. Since the August 2019 event, we have been engaged in settlement discussions with the U.S. Department of Justice, the EPA and the State of Indiana to resolve any alleged violations of environmental laws or regulations. Also, ArcelorMittal Burns Harbor LLC was served with a subpoena on December 5, 2019, from the United States District Court for the Northern District of Indiana relating to the August 2019 event and has responded to the subpoena requests. In addition, the plaintiffs in Environmental Law & Policy Center et al. v. ArcelorMittal Burns Harbor LLC et al. (U.S. District Court, N.D. Indiana Case No. 19-cv-473), which was filed on December 20, 2019,have alleged violations resulting from the August 2019 event and other Clean Water Act claims. Although we cannot accurately estimate the amount of civil penalty, the cost of any injunctive relief requirements, or the costs to resolve third-party claims, including potential natural resource damages claims, they are likely to exceed the reporting threshold in total.
In addition to the foregoing matters, we are or may be involved in proceedings with various regulatory authorities that may require us to pay fines, comply with more rigorous standards or other requirements or incur capital and operating expenses for environmental compliance. We believe that the ultimate disposition of any such proceedings will not have, individually or in the aggregate, a material adverse effect on our consolidated financial condition, results of operations or cash flows.
Tax MattersTAX MATTERS
The calculation of our tax liabilities involves dealing with uncertainties in the application of complex tax regulations. We recognize liabilities for anticipated tax audit issues based on our estimate of whether, and the extent to which, additional taxes will be due. If we ultimately determine that payment of these amounts is unnecessary, we reverse the liability and recognize a tax benefit during the period in which we determine that the liability is no longer necessary. We also recognize tax benefits to the extent that it is more likely than not that our positions will be sustained when challenged by the taxing authorities. To the extent we prevail in matters for which liabilities have been established, or are required to pay amounts in excess of our liabilities, our effective tax rate in a given period could be materially affected. An unfavorable tax settlement would require use of our cash and result in an increase in our effective tax rate in the year of resolution. A favorable tax settlement would be recognized as a reduction in our effective tax rate in the year of resolution. Refer to NOTE 1211 - INCOME TAXES for further information.
Other ContingenciesOTHER CONTINGENCIES
In addition to the matters discussed above, there are various pending and potential claims against us and our subsidiaries involving product liability, personal injury, commercial, employee benefits and other matters arising in the ordinary course of business. Because of the considerable uncertainties that exist for any claim, it is difficult to reliably or accurately estimate what the amount of a loss would be if a claimant prevails. If material assumptions or factual understandings we rely on to evaluate exposure for these contingencies prove to be inaccurate or otherwise change, we may be required to record a liability for an adverse outcome. If, however, we have reasonably evaluated potential future liabilities for all of these contingencies, including those described more specifically above, it is our opinion, unless we otherwise noted, that the ultimate liability from these contingencies, individually or in the aggregate, should not have a material adverse effect on our consolidated financial position, results of operations or cash flows.
NOTE 2221 - SUBSEQUENT EVENTS
On February 11, 2021, we sold 20 million common shares, andWe have evaluated subsequent events through the indirect, wholly owned subsidiarydate of ArcelorMittal to which approximately 78 million common shares were issued as part of the consideration paid by us in connection with the closing of the AM USA Transaction sold 40 million common shares, in each case at a price per share to the underwriter of $16.12, in an underwritten public offering. We also granted the underwriter an option to purchase up to an additional 9 million common shares from us at a price per share to the underwriter of $16.12. The underwriter has until March 10, 2021 to exercise such option, which it may do in full, in part or not at all. We did not receive any proceeds from the sale of the common shares by the selling shareholder in the offering. We intend to use the net proceeds to us from the offering, plus cash on hand, to redeem up to approximately $334 million aggregate principal amount of our outstanding 9.875% 2025 Senior Secured Notes. We intend to use any remaining net proceeds to us following such redemption to reduce borrowings under our ABL Facility.
On February 9, 2021, following pricing of the underwritten public offering, we issued a conditional notice of partial redemption to holders of the 9.875% 2025 Senior Secured Notes to redeem $322 million aggregate principal amount of the outstanding 9.875% 2025 Senior Secured Notes on March 11, 2021, at a redemption price equal to 109.875% of the principal amount to be redeemed, plus accrued and unpaid interest, if any, to, but excluding, the redemption date. The conditional notice of partial redemption was subject to the condition precedent that we close the underwritten public offering of our common shares. As a result, following the closing of the underwritten public offering, the conditional notice of partial redemption became irrevocable.
On February 17, 2021, we issued $500 million aggregate principal amount of 4.625% 2029 Senior Notes and $500 million aggregate principal amount of 4.875% 2031 Senior Notes in an offering that was exempt from the registration requirements of the Securities Act. We intend to use the net proceeds from the notes offering to redeem all of the outstanding 4.875% 2024 Senior Secured Notes and 6.375% 2025 Senior Notes issued by Cleveland-Cliffs Inc. and all of the outstanding 7.625% 2021 AK Senior Notes, 7.50% 2023 AK Senior Notes and 6.375% 2025 AK Senior Notes issued by AK Steel Corporation (n/k/a Cleveland-Cliffs Steel Corporation), and pay fees and expenses in connection with such redemptions, and reduce borrowings under our ABL Facility.
On February 10, 2021, following pricing of the notes offering, we issued notices of redemption to the holders of the 4.875% 2024 Senior Secured Notes, 6.375% 2025 Senior Notes, 7.625% 2021 AK Senior Notes, 7.50% 2023financial statement issuance.
AK Senior Notes and 6.375% 2025 AK Senior Notes to redeem all of such notes outstanding on March 12, 2021, at the redemption prices listed below, plus accrued and unpaid interest, if any, to, but excluding, the redemption date. The notices of redemption with respect to the 4.875% 2024 Senior Secured Notes and the 6.375% 2025 Senior Notes were subject to the condition precedent that we close the notes offering. As a result, following the closing of the notes offering, the notices of redemption with respect to the 4.875% 2024 Senior Secured Notes and the 6.375% 2025 Senior Notes became irrevocable. The notices of redemption with respect to the 7.625% 2021 AK Senior Notes, 7.50% | CLF 2023 AK Senior Notes and 6.375% 2025 AK Senior Notes were not subject to any conditions and were irrevocable when issued.
| | | | | | | | | | | |
Debt InstrumentFORM 10-K | | Redemption Price1
|
4.875% 2024 Senior Secured Notes | | 102.438 | | % |
6.375% 2025 Senior Notes | | 103.188 | | |
7.625% 2021 AK Senior Notes | | 100.000 | | |
7.50% 2023 AK Senior Notes | | 101.875 | | |
6.375% 2025 AK Senior Notes | | 103.188 | | |
| | | |
1 Plus accrued and unpaid interest, if any, up to but excluding the redemption date.
| | | |
REPORT OF INDEPENDENT REGISTERED PUBLIC ACCOUNTING FIRM
To the shareholders and the Board of Directors of
Cleveland-Cliffs Inc.
Opinion on the Financial StatementsOPINION ON THE FINANCIAL STATEMENTS
We have audited the accompanying statements of consolidated financial position of Cleveland-Cliffs Inc. and subsidiaries (the "Company") as of December 31, 20202023 and 2019,2022, the related statements of consolidated operations, comprehensive income, cash flows, and changes in equity, for each of the three years in the period ended December 31, 2020,2023, and the related notes (collectively referred to as the "financial statements"). In our opinion, the financial statements present fairly, in all material respects, the financial position of the Company as of December 31, 20202023 and 2019,2022, and the results of its operations and its cash flows for each of the three years in the period ended December 31, 2020,2023, in conformity with accounting principles generally accepted in the United States of America.
We have also audited, in accordance with the standards of the Public Company Accounting Oversight Board (United States) (PCAOB), the Company's internal control over financial reporting as of December 31, 2020,2023, based on criteria established in Internal Control — Integrated Framework (2013) issued by the Committee of Sponsoring Organizations of the Treadway Commission and our report dated February 26, 2021,8, 2024, expressed an unqualified opinion on the Company's internal control over financial reporting.
Basis for OpinionBASIS FOR OPINION
These financial statements are the responsibility of the Company's management. Our responsibility is to express an opinion on the Company's financial statements based on our audits. We are a public accounting firm registered with the PCAOB and are required to be independent with respect to the Company in accordance with the U.S. federal securities laws and the applicable rules and regulations of the Securities and Exchange Commission and the PCAOB.
We conducted our audits in accordance with the standards of the PCAOB. Those standards require that we plan and perform the audit to obtain reasonable assurance about whether the financial statements are free of material misstatement, whether due to error or fraud. Our audits included performing procedures to assess the risks of material misstatement of the financial statements, whether due to error or fraud, and performing procedures that respond to those risks. Such procedures included examining, on a test basis, evidence regarding the amounts and disclosures in the financial statements. Our audits also included evaluating the accounting principles used and significant estimates made by management, as well as evaluating the overall presentation of the financial statements. We believe that our audits provide a reasonable basis for our opinion.
Critical Audit MattersCRITICAL AUDIT MATTER
The critical audit mattersmatter communicated below are mattersis a matter arising from the current-period audit of the financial statements that werewas communicated or required to be communicated to the audit committee and that (1) relates to accounts or disclosures that are material to the financial statements and (2) involved our especially challenging, subjective, or complex judgments. The communication of critical audit matters does not alter in any way our opinion on the financial statements, taken as a whole, and we are not, by communicating the critical audit mattersmatter below, providing a separate opinion on the critical audit mattersmatter or on the accounts or disclosures to which they relate.it relates.
Mineral ReservesIRON ORE MINERAL RESERVES — Asset Retirement Obligations, Valuation of Long-Lived Assets, Depreciation, Depletion and Amortization of Property, Plant and Equipment and Valuation in Acquisition Accounting —Refer to Notes 3, 5, 6 and 14 to the financial statementsIMPACT ON ASSET RETIREMENT OBLIGATIONS — REFER TO NOTE 13 TO THE FINANCIAL STATEMENTS
Critical Audit Matter Description
Iron ore mineral reserve estimates, combined with estimated annual production levels, are used to determine the iron ore mine closure dates utilized in recording the fair value liability for asset retirement obligations for active operating iron ore mines. Since the liability represents the present value of the expected future obligation, a significant change in iron ore mineral reserves or iron ore mine lives could have a substantial effect on the recorded obligation. Iron ore mineral reserve estimates are also used in evaluating potential impairments of goodwill and iron ore mine asset groups as they are indicative of future cash flows and in determining maximum useful lives utilized to calculate depreciation, depletion and amortization of long-lived iron ore mine assets. Further, iron ore mineral reserve estimates are used in estimating the fair value of mineral reserves established through the purchase price allocation in a business combination.
The Company performs an in-depth evaluation of its iron ore mineral reserve estimates by iron ore mine on a periodic basis, in addition to routine annual assessments. The determination of iron ore mineral reserves requires management, with the support of management’s experts, to make significant estimates and assumptions related to
key inputs including (1) the determination of the size and scope of the iron ore body through technical modeling, (2) the estimates of future iron ore prices recognizing that the price shall not exceed the three-year trailing average index price of iron ore adjusted to the Company’s realized price, production costs and capital expenditures, and (3) management’s mine plan for the proven and probable iron ore mineral reserves (collectively “the iron ore mineral reserve inputs”). Changes in any of the judgments or assumptions related to the iron ore mineral reserve inputs can have a significant impact with respect to the accrual for asset retirement obligations, the impairment of goodwill and long-lived asset groups and the amount of depreciation, depletion, and amortization expense andexpense. The closure date utilized in the estimated fair valueCompany’s accrual for asset retirement obligations for each of their active iron ore mine operations is determined based on the exhaustion date of the remaining iron ore mineral reserves, established throughwhich is dependent on the purchase price allocation in a business combination.estimate of iron ore mineral reserves. The consolidated asset retirement obligation balance was $342$459 million as of December 31, 2020,2023, of which $83$171 million related to active iron ore mine operations. The total asset balance associated with the Company’s Steelmaking reportable segment was $15,849 million as
Given the significant judgments and assumptions made by management to estimate iron ore mineral reserves and the sensitivity of changes to iron ore mineral reserve estimatesinputs on the Company’s recorded asset retirement obligations, long-lived asset impairment considerations, calculated depreciation, depletion and amortization expense and estimated fair value of mineral reserves established through the purchase price allocation of a business combination, performing audit procedures to evaluate the reasonableness of management’s judgments and estimates related to the iron ore mineral reserve inputs required a high degree of auditor judgment and an increased extent of effort.
How the Critical Audit Matter Was Addressed in the Audit
Our audit procedures related to management’s significant judgments and assumptionsestimates related to iron ore mineral reserve quantities and the related iron ore mine closure datesreserves included the following, among others:
•We tested the operating effectiveness of internal controls related to the Company’s estimation of iron ore mineral reserve quantities and the related iron ore mine closure dates.reserves.
•We evaluated the experience, qualifications and objectivity of management’s experts, including in-house iron ore mine engineers.engineers and the third-party Qualified Person.
•For an iron ore mine subject to the Company’s routine annual assessment we evaluated management’s assessment by:
◦Understanding the process used by management to survey and analyze the geological and operational status of current year iron ore mine production.
◦Evaluating the historical accuracy of management’s technical model as compared to actual iron ore mine production results.
◦Comparing the iron ore mine plan per the most recent Technical Report Summary, updated for current year depletion, toto:
▪Presentations to the Audit Committee.
▪Information by asset group, assetAsset retirement obligation valuation models, depreciation, depletion and amortization expense calculations and mineral reserve purchase price allocation valuation models.
•For an iron ore mine subject to the Company’s periodic in-depth evaluation of its iron ore mineral reserve estimate:
◦We evaluated management’s determination of the size and scope of the iron ore body, by:
▪Understanding the process used by management to complete research and exploration activities including mineralized resource drill samples.
▪Understanding the methodology utilized by management to apply the research and exploration data to the development of a technical model of the iron ore body.
▪Evaluating the historical accuracy of management’s technical model as compared to actual iron ore mine production results.
◦We evaluated management’s estimates of future iron ore prices, production costs and capital expenditures (the “financial assumptions”), by:
▪Understanding and testing the methodology utilized by management for development of the future iron ore prices recognizing that the price shall not exceed the three-year trailing average index price of iron ore adjusted to the Company’s realized price.
▪Evaluated management’s ability to accurately forecast future iron ore prices, production costs and capital expenditures by comparing actual results to management’s historical forecasts.
▪Evaluated the reasonableness of management’s estimates of future iron ore prices to forecasted information included in analyst reports.
▪Evaluated the reasonableness of management’s forecast for production costs and capital expenditures by comparing the forecasts to: (1) historical results and (2) internal communications to management and the Board of Directors.
◦We evaluated management’s iron ore mine plan for the proven and probable mineral reserves, by:
▪Understanding the process used by management to develop the iron ore mine plan for proven and probable iron ore mineral reserves applying key inputs such as the technical model of the iron ore body and the financial assumptions.
▪Comparing the iron ore mine plan to
•Presentations to the Audit Committee.
•Historical iron ore mine plan(s).
•Information by asset group, asset retirement obligation valuation models, depreciation, depletion and amortization expense calculations, and mineral reserve purchase price allocation valuation models.
Acquisitions — AK Steel —Refer to Note 3 to the financial statements
Critical Audit Matter Description
The Company completed the acquisition of AK Steel Holding Corporation for approximately $1.5 billion on March 13, 2020. The Company accounted for the acquisition under the acquisition method of accounting for business combinations. Accordingly, the purchase price was initially allocated to three operations of the AK Steel business including Steelmaking, Tooling and Stamping and Tubular using a discounted cash flow model (the “Operations Allocation”). Following the Operations Allocation, the purchase price was then allocated to the assets acquired and liabilities assumed comprising the three operations of the AK Steel business based on their respective fair values, including $174 million goodwill balance assigned to the Tooling and Stamping and Tubular operations. The Operations Allocation required management to make significant estimates and assumptions related to forecasts of future revenues and earnings before interest, taxes, depreciation, and amortization (EBITDA) and discount rates.
Given the Operations Allocation requires management to make significant estimates and assumptions related to the forecasts of future revenues and EBITDA (the “Forecasts”), as well as the selection of the discount rates, and considering to the sensitivity of the allocated goodwill balance to changes in projected future cash flows at the Steelmaking, Tooling and Stamping, and Tubular operations, performing audit procedures to evaluate the reasonableness of the Forecasts and selected discount rates required a high degree of auditor judgment and an increased extent of effort, including the need to involve our fair value specialists.
How the Critical Audit Matter Was Addressed in the Audit
Our audit procedures related to the Forecasts and the selection of the discount rates included the following, among others:
•We tested the operating effectiveness of internal controls over management’s purchase price allocation, such as controls related to management’s Forecasts and the selection of the discount rates.
•We evaluated the reasonableness of management’s Forecasts by comparing the Forecasts to (1) historical results, (2) internal communications to management and the Board of Directors, and (3) forecasted information included in industry reports and other economic indicators.
•With the assistance of our fair value specialists, we evaluated the reasonableness of the discount rates by:
◦Testing the source information underlying the determination of the discount rates and testing the mathematical accuracy of the calculation.
◦Developing a range of independent estimates and comparing those to the discount rates selected by management.
•We evaluated whether management’s Forecasts were consistent with evidence obtained in other areas of the audit.
/s/ DELOITTE & TOUCHE LLP
Cleveland, Ohio
February 26, 20218, 2024
We have served as the Company's auditor since 2004.
14199 | CLF 2023 FORM 10-K
| | |
| | |
ItemITEM 9. | Changes in and Disagreements With Accountants on Accounting and Financial Disclosure CHANGES IN AND DISAGREEMENTS WITH ACCOUNTANTS ON ACCOUNTING AND FINANCIAL DISCLOSURE |
None.
| | |
| | |
ItemITEM 9A. | Controls and Procedures CONTROLS AND PROCEDURES |
We maintain disclosure controls and procedures that are designed to ensure that information required to be disclosed in our Exchange Act reports is recorded, processed, summarized and reported within the time periods specified in the SEC’s rules and forms, and that such information is accumulated and communicated to our management, including our President and Chief Executive Officer and Chief Financial Officer, as appropriate, to allow timely decisions regarding required disclosure based solely on the definition of “disclosure controls and procedures” in Rule 13a-15(e) promulgated under the Exchange Act. In designing and evaluating the disclosure controls and procedures, management recognized that any controls and procedures, no matter how well designed and operated, can provide only reasonable assurance of achieving the desired control objectives, and management necessarily was required to apply its judgment in evaluating the cost-benefit relationship of possible controls and procedures.
As of the end of the period covered by this report, we carried out an evaluation under the supervision and with the participation of our management, including our President and Chief Executive Officer and our Chief Financial Officer, of the effectiveness of the design and operation of our disclosure controls and procedures. Based on the foregoing, our President and Chief Executive Officer and Chief Financial Officer concluded that our disclosure controls and procedures were effective.
Management's Report on Internal Control Over Financial ReportingMANAGEMENT'S REPORT ON INTERNAL CONTROL OVER FINANCIAL REPORTING
Our management is responsible for establishing and maintaining adequate internal control over financial reporting as such term is defined under Rule 13a-15(f) promulgated under the Exchange Act.
Internal control over financial reporting is a process designed to provide reasonable assurance regarding the reliability of financial reporting and the preparation of the Company's consolidated financial statements for external purposes in accordance with generally accepted accounting principles.
Internal control over financial reporting includes those policies and procedures that (i) pertain to the maintenance of records that, in reasonable detail, accurately and fairly reflect the transactions and dispositions of the assets of the Company; (ii) provide reasonable assurance that transactions are recorded as necessary to permit the preparation of the consolidated financial statements in accordance with generally accepted accounting principles, and that receipts and expenditures of the Company are being made only in accordance with appropriate authorizations of management and directors of the Company; and (iii) provide reasonable assurance regarding prevention or timely detection of unauthorized acquisition, use or disposition of the Company's assets that could have a material effect on the consolidated financial statements.
Because of its inherent limitations, internal control over financial reporting may not prevent or detect misstatements. Also, projections of any evaluation of effectiveness to future periods are subject to the risk that controls may become inadequate because of changes in conditions, or that the degree of compliance with the policies or procedures may deteriorate.
Management conducted an assessment of the Company's internal control over financial reporting as of December 31, 20202023 using the framework specified in Internal Control - Integrated Framework (2013), published by the Committee of Sponsoring Organizations of the Treadway Commission. We have excluded from our assessment the internal control over financial reporting at AK Steel, which was acquired on March 13, 2020, and whose assets as of December 31, 2020 constituted 32% of the Company’s consolidated total assets as of December 31, 2020, and whose revenues for the period from March 13, 2020 through December 31, 2020, inclusive, constituted 67% of the Company’s consolidated revenues for the year ended December 31, 2020. Management also excluded from our assessment the internal control over financial reporting at ArcelorMittal USA, which was acquired on December 9, 2020, and whose assets as of December 31, 2020 constituted 49% of the Company’s consolidated total assets as of December 31, 2020, and whose revenues for the period from December 9, 2020 through December 31, 2020, inclusive, constituted 8% of the Company’s consolidated revenues for the year ended December 31, 2020.
Based on such assessment, management has concluded that the Company's internal control over financial reporting was effective as of December 31, 2020.
The effectiveness of the Company's internal control over financial reporting as of December 31, 20202023 has been audited by Deloitte & Touche LLP (PCAOB ID No. 34), an independent registered public accounting firm, as stated in their report that appears herein.
February 26, 20218, 2024
Changes in Internal Control Over Financial ReportingCHANGES IN INTERNAL CONTROL OVER FINANCIAL REPORTING
There have been no changes in our internal control over financial reporting or in other factors that occurred during our last fiscal quarter that have materially affected, or are reasonably likely to materially affect, our internal control over financial reporting.
143100 | CLF 2023 FORM 10-K
REPORT OF INDEPENDENT REGISTERED PUBLIC ACCOUNTING FIRM
To the shareholders and the Board of Directors of
Cleveland-Cliffs Inc.
Opinion on Internal Control over Financial ReportingOPINION ON INTERNAL CONTROL OVER FINANCIAL REPORTING
We have audited the internal control over financial reporting of Cleveland-Cliffs Inc. and subsidiaries (the "Company") as of December 31, 2020,2023, based on criteria established in Internal Control — Integrated Framework (2013) issued by the Committee of Sponsoring Organizations of the Treadway Commission (COSO). In our opinion, the Company maintained, in all material respects, effective internal control over financial reporting as of December 31, 2020,2023, based on criteria established in Internal Control — Integrated Framework (2013) issued by COSO.
We have also audited, in accordance with the standards of the Public Company Accounting Oversight Board (United States) (PCAOB), the consolidated financial statements as of and for the year ended December 31, 2020,2023, of the Company and our report dated February 26, 2021,8, 2024, expressed an unqualified opinion on those financial statements.
As described in Management’s Report on Internal Control Over Financial Reporting, management excluded from its assessment the internal control over financial reporting at AK Steel, which was acquired on March 13, 2020, and whose assets as of December 31, 2020 constituted 32% of the Company’s consolidated total assets as of December 31, 2020, and whose revenues for the period from March 13, 2020 through December 31, 2020, inclusive, constituted 67% of the Company’s consolidated revenues for the year ended December 31, 2020. Management also excluded from its assessment the internal control over financial reporting at ArcelorMittal USA, which was acquired on December 9, 2020, and whose assets as of December 31, 2020 constituted 49% of the Company’s consolidated total assets as of December 31, 2020, and whose revenues for the period from December 9, 2020 through December 31, 2020, inclusive, constituted 8% of the Company’s consolidated revenues for the year ended December 31, 2020. Accordingly, our audit did not include the internal control over financial reporting at either AK Steel or ArcelorMittal USA.BASIS FOR OPINION
Basis for Opinion
The Company’s management is responsible for maintaining effective internal control over financial reporting and for its assessment of the effectiveness of internal control over financial reporting, included in the accompanying Management’s Report on Internal Control Over Financial Reporting.Reporting. Our responsibility is to express an opinion on the Company’s internal control over financial reporting based on our audit. We are a public accounting firm registered with the PCAOB and are required to be independent with respect to the Company in accordance with the U.S. federal securities laws and the applicable rules and regulations of the Securities and Exchange Commission and the PCAOB.
We conducted our audit in accordance with the standards of the PCAOB. Those standards require that we plan and perform the audit to obtain reasonable assurance about whether effective internal control over financial reporting was maintained in all material respects. Our audit included obtaining an understanding of internal control over financial reporting, assessing the risk that a material weakness exists, testing and evaluating the design and operating effectiveness of internal control based on the assessed risk, and performing such other procedures as we considered necessary in the circumstances. We believe that our audit provides a reasonable basis for our opinion.
Definition and Limitations of Internal Control over Financial ReportingDEFINITION AND LIMITATIONS OF INTERNAL CONTROL OVER FINANCIAL REPORTING
A company’s internal control over financial reporting is a process designed to provide reasonable assurance regarding the reliability of financial reporting and the preparation of financial statements for external purposes in accordance with generally accepted accounting principles. A company’s internal control over financial reporting includes those policies and procedures that (1) pertain to the maintenance of records that, in reasonable detail, accurately and fairly reflect the transactions and dispositions of the assets of the company; (2) provide reasonable assurance that transactions are recorded as necessary to permit preparation of financial statements in accordance with generally accepted accounting principles, and that receipts and expenditures of the company are being made only in accordance with authorizations of management and directors of the company; and (3) provide reasonable assurance regarding prevention or timely detection of unauthorized acquisition, use, or disposition of the company’s assets that could have a material effect on the financial statements.
Because of its inherent limitations, internal control over financial reporting may not prevent or detect misstatements. Also, projections of any evaluation of effectiveness to future periods are subject to the risk that controls may become inadequate because of changes in conditions, or that the degree of compliance with the policies or procedures may deteriorate.
/s/ DELOITTE & TOUCHE LLP
Cleveland, Ohio
February 26, 20218, 2024
144101 | CLF 2023 FORM 10-K
| | |
| | |
ItemITEM 9B. | Other Information OTHER INFORMATION |
None.During the quarter ended December 31, 2023, no director or officer (as defined in Rule 16a-1(f) promulgated under the Exchange Act) of the Company adopted or terminated a "Rule 10b5-1 trading arrangement" or "non-Rule 10b5-1 trading arrangement" (as each term is defined in Item 408 of Regulation S-K).
| | |
|
| ITEM 9C. DISCLOSURE REGARDING FOREIGN JURISDICTIONS THAT PREVENT INSPECTIONS |
Not applicable.
145102 | CLF 2023 FORM 10-K
PART III
| | |
| | |
ItemITEM 10. | Directors, Executive Officers and Corporate Governance DIRECTORS, EXECUTIVE OFFICERS AND CORPORATE GOVERNANCE |
The information required to be furnished by this Item will be set forth in ourthe definitive proxy statement for the 2021our 2024 Annual Meeting of Shareholders (the "Proxy Statement") under the headings "Board Meetings and Committees — Audit Committee", "Code of Business Conduct and Ethics", "Independence and Related Party Transactions", and "Information Concerning Director Nominees”, and is incorporated herein by reference and made a part hereof from the Proxy Statement. The information regarding executive officers required by this Item is set forth in Part I - Item 1. Business hereof under the heading “Information About Our Executive Officers”, which information is incorporated herein by reference and made a part hereof.
| | |
| | |
ItemITEM 11. | Executive Compensation EXECUTIVE COMPENSATION |
The information required to be furnished by this Item will be set forth in the Proxy Statement under the headings “Director Compensation”, "Compensation Discussion and Analysis", “Compensation Committee Report”, “Compensation Committee Interlocks and Insider Participation”, "Compensation-Related Risk Assessment" and “Executive Compensation” and is incorporated herein by reference and made a part hereof from the Proxy Statement.
| | |
| | |
ItemITEM 12. | Security Ownership of Certain Beneficial Owners and Management and Related Stockholder Matters SECURITY OWNERSHIP OF CERTAIN BENEFICIAL OWNERS AND MANAGEMENT AND RELATED STOCKHOLDER MATTERS |
The information required to be furnished by this Item will be set forth in the Proxy Statement under the headings "Ownership of Equity Securities of the Company" and "Equity Compensation Plan Information" and is incorporated herein by reference and made a part hereof from the Proxy Statement.
| | |
| | |
ItemITEM 13. | Certain Relationships and Related Transactions, and Director Independence CERTAIN RELATIONSHIPS AND RELATED TRANSACTIONS, AND DIRECTOR INDEPENDENCE |
The information required to be furnished by this Item will be set forth in the Proxy Statement under the heading “Independence and Related Party Transactions” and is incorporated herein by reference and made a part hereof from the Proxy Statement.
| | |
| | |
ItemITEM 14. | Principal Accountant Fees and Services PRINCIPAL ACCOUNTANT FEES AND SERVICES |
The information required to be furnished by this Item will be set forth in the Proxy Statement under the heading “Ratification of Independent Registered Public Accounting Firm” and is incorporated herein by reference and made a part hereof from the Proxy Statement.
146103 | CLF 2023 FORM 10-K
PART IV
| | | | | |
| Item
| ITEM 15. | Exhibits and Financial Statement Schedules EXHIBITS AND FINANCIAL STATEMENT SCHEDULES |
(a)(1) - List of Financial Statements
The following consolidated financial statements of Cleveland-Cliffs Inc. are included at ItemITEM 8. Financial Statements and Supplementary DataFINANCIAL STATEMENTS AND SUPPLEMENTARY DATA above:
•Statements of Consolidated Financial Position - December 31, 20202023 and 20192022
•Statements of Consolidated Operations - Years ended December 31, 2020, 20192023, 2022 and 20182021
•Statements of Consolidated Comprehensive Income - Years ended December 31, 2020, 20192023, 2022 and 20182021
•Statements of Consolidated Cash Flows - Years ended December 31, 2020, 20192023, 2022 and 20182021
•Statements of Consolidated Changes in Equity - Years ended December 31, 2020, 20192023, 2022 and 20182021
•Notes to Consolidated Financial Statements
(a)(2) - Financial Statement Schedules
All schedules for which provision is made in the applicable accounting regulation of the SEC are not required under the related instructions or are inapplicable, and therefore have been omitted or are contained in the applicable financial statements or the notes thereto.
(a)(3) List of Exhibits
All documents referenced below have been filed pursuant to the Securities Exchange Act of 1934 by Cleveland-Cliffs Inc., file number 1-09844, unless otherwise indicated.
| | | | | |
Exhibit
| Exhibit |
| Plan of purchase, sale, reorganization, arrangement, liquidation or succession |
| **Agreement and Plan of Merger, dated as of December 2, 2019, by and among Cleveland-Cliffs Inc., AK Steel Holding Corporation and Pepper Merger Sub Inc. (filed as Exhibit 2.1 to Cliffs' Form 8-K on December 4, 2019 and incorporated herein by reference) |
| **Transaction Agreement, dated as of September 28, 2020, by and between Cleveland-Cliffs Inc. and ArcelorMittal S.A. (filed as Exhibit 2.1 to Cliffs’ Form 10-Q for the period ended September 30, 2020 and incorporated herein by reference) |
| Articles of Incorporation and Regulations of Cleveland-Cliffs Inc. |
| Fourth Amended Articles of Incorporation of Cliffs, as filed with the Secretary of State of the State of Ohio on September 25, 2020 (filed as Exhibit 3.2 to Cliffs’ Form 8-K on September 28, 2020 and incorporated herein by reference). |
| Certificate of Amendment to Fourth Amended Articles of Incorporation of Cliffs, as filed with the Secretary of State of the State of Ohio on December 7, 2020 (filed as Exhibit 3.1 to CliffsCliffs' Form 8-K on December 9, 2020 and incorporated herein by reference). |
| Certificate of Amendment to Fourth Amended Articles of Incorporation of Cliffs, as amended, as filed with the Secretary of State of the State of Ohio on April 29, 2021 (filed as Exhibit 3.1 to Cliffs' Form 8-K on April 30, 2021 and incorporated herein by reference). |
| Regulations of Cliffs (filed as Exhibit 3.2 to Cliffs’ Form 10-K for the period ended December 31, 2011 and incorporated herein by reference). |
| Instruments defining rights of security holders, including indentures |
| Indenture, dated as of March 17, 2010, between Cliffs Natural Resources Inc. (n/k/a Cleveland-Cliffs Inc.) and U.S. Bank National Association, as trustee (filed as Exhibit 4.3 to Cliffs’ Registration Statement on Form S-3 (Registration No. 333-186617) on February 12, 2013 and incorporated herein by reference). |
| Third Supplemental Indenture, dated as of September 20, 2010, between Cliffs Natural Resources Inc. (n/k/a Cleveland-Cliffs Inc.) and U.S. Bank National Association, as trustee, including Form of 6.25% Notes due 2040 (filed as Exhibit 4.4 to Cliffs’ Form 8-K on September 17, 2010 and incorporated herein by reference). |
| Fifth Supplemental Indenture, dated as of March 31, 2011, between Cliffs Natural Resources Inc. (n/k/a Cleveland-Cliffs Inc.) and U.S. Bank National Association, as trustee (filed as Exhibit 4(b) to Cliffs’ Form 10-Q for the period ended June 30, 2011 and incorporated herein by reference) |
| | | | | . |
| Seventh Supplemental Indenture, dated as of May 7, 2013, between Cliffs Natural Resources Inc. (n/k/a Cleveland-Cliffs Inc.) and U.S. Bank National Association, as trustee (filed as Exhibit 4.1 to Cliffs' Form 10-Q for the period ended June 30, 2013 and incorporated herein by reference). |
| Eighth Supplemental Indenture, dated as of December 19, 2017, by and between Cleveland-Cliffs Inc. and U.S. Bank National Association, as trustee, including Form of 1.50% Convertible Senior Notes due 2025 (filed as Exhibit 4.2 to Cliffs' Form 8-K on December 19, 2017 and incorporated herein by reference) |
| Indenture, dated as of February 27, 2017, among Cliffs Natural Resources Inc. (n/k/a Cleveland-Cliffs Inc.), the Guarantors party thereto and U.S. Bank National Association, as trustee, including Form of 5.75% Senior Notes due 2025 (filed as Exhibit 4.1 to Cliffs' Form 8-K on August 7, 2017 and incorporated herein by reference) |
| First Supplemental Indenture, dated as of August 7, 2017, among Cliffs Natural Resources Inc. (n/k/a Cleveland-Cliffs Inc.), the Guarantors party thereto and U.S. Bank National Association, as trustee, including Form of 5.75% Senior Notes due 2025 (filed as Exhibit 4.2 to Cliffs' Form 8-K on August 7, 2017 and incorporated herein by reference) |
| Second Supplemental Indenture, dated as of September 29, 2017, among Cleveland-Cliffs Inc., the Additional Guarantors party thereto and U.S. Bank National Association, as trustee (filed as Exhibit 4.11 to Cliffs’ Form 10-K for the period ended December 31, 2017 and incorporated herein by reference) |
| Third Supplemental Indenture, dated as of October 27, 2017, among Cleveland-Cliffs Inc., the Additional Guarantors party thereto and U.S. Bank National Association, as trustee (filed as Exhibit 4.12 to Cliffs’ Form 10-K for the period ended December 31, 2017 and incorporated herein by reference) |
| Fourth Supplemental Indenture, dated as of August 27, 2018, among Cleveland-Cliffs Inc., the Additional Guarantor party thereto and U.S. Bank National Association, as trustee (filed as Exhibit 4.10 to Cliffs’ Form 10-K for the period ended December 31, 2019 and incorporated herein by reference) |
| Fifth Supplemental Indenture, dated as of March 13, 2020, among Cleveland-Cliffs Inc., the Additional Guarantors party thereto and U.S. Bank National Association, as trustee (filed as Exhibit 4.2 to Cliffs’ Form 10-Q for the period ended March 31, 2020 and incorporated herein by reference) |
| Sixth Supplemental Indenture, dated as of May 22, 2020, among Cleveland-Cliffs Inc., the Additional Guarantors party thereto and U.S. Bank National Association, as trustee (filed as Exhibit 4.4 to Cliffs’ Form 10-Q for the period ended June 30, 2020 and incorporated herein by reference) |
| Seventh Supplemental Indenture, dated as of December 9, 2020, among Cleveland-Cliffs Inc., the Additional Guarantors party thereto and U.S. Bank National Association, as trustee (filed herewith) |
| Eighth Supplemental Indenture, dated as of December 18, 2020, among Cleveland-Cliffs Inc., the Additional Guarantors party thereto and U.S. Bank National Association, as trustee (filed herewith) |
| Indenture, dated as of December 19, 2017, by and among Cleveland-Cliffs Inc., the Guarantors party thereto and U.S. Bank National Association, as trustee and first lien notes collateral agent, including Form of 4.875% Senior Secured Notes due 2024 (filed as Exhibit 4.1 to Cliffs' Form 8-K on December 19, 2017 and incorporated herein by reference) |
| First Supplemental Indenture, dated as of August 27, 2018, among Cleveland-Cliffs Inc., the Additional Guarantor party thereto and U.S. Bank National Association, as trustee (filed as Exhibit 4.12 to Cliffs’ Form 10-K for the period ended December 31, 2019 and incorporated herein by reference) |
| Second Supplemental Indenture, dated as of March 13, 2020, among Cleveland-Cliffs Inc., the Additional Guarantors party thereto and U.S. Bank National Association, as trustee and first lien notes collateral agent (filed as Exhibit 4.3 to Cliffs' Form 10-Q for the period ended March 31, 2020 and incorporated herein by reference) |
| Third Supplemental Indenture, dated as of May 22, 2020, among Cleveland-Cliffs Inc., the Additional Guarantors party thereto and U.S. Bank National Association, as trustee and first lien notes collateral agent (filed as Exhibit 4.5 to Cliffs’ Form 10-Q for the period ended June 30, 2020 and incorporated herein by reference) |
| Fourth Supplemental Indenture, dated as of December 9, 2020, among Cleveland-Cliffs Inc., the Additional Guarantors party thereto and U.S. Bank National Association, as trustee and first lien notes collateral agent (filed herewith) |
| Fifth Supplemental Indenture, dated as of December 18, 2020, among Cleveland-Cliffs Inc., the Additional Guarantors party thereto and U.S. Bank National Association, as trustee and first lien notes collateral agent (filed herewith) |
| Indenture, dated as of May 13, 2019, among Cleveland-Cliffs Inc., the Guarantors party thereto and U.S. Bank National Association, as trustee, including Form of 5.875% Senior Notes due 2027 (filed as Exhibit 4.1 to Cliffs' Form 8-K on May 14, 2019 and incorporated herein by reference). |
| First Supplemental Indenture, dated as of March 13, 2020, among Cleveland-Cliffs Inc., the Additional Guarantors party thereto and U.S. Bank National Association, as trustee (filed as Exhibit 4.4 to Cliffs' Form 10-Q for the period ended March 31, 2020 and incorporated herein by reference). |
| | | | | |
| Exhibit Number | | | | | Exhibit |
| Second Supplemental Indenture, dated as of May 22, 2020, among Cleveland-Cliffs Inc., the Additional Guarantors party thereto and U.S. Bank National Association, as trustee (filed as Exhibit 4.6 to Cliffs’ Form 10-Q for the period ended June 30, 2020 and incorporated herein by reference). |
| Third Supplemental Indenture, dated as of December 9, 2020, among Cleveland-Cliffs Inc., the Additional Guarantors party thereto and U.S. Bank National Association, as trustee (filed herewith)as Exhibit 4.24 to Cliffs’ Form 10-K for the period ended December 31, 2020 and incorporated herein by reference). |
| Fourth Supplemental Indenture, dated as of December 18, 2020, among Cleveland-Cliffs Inc., the Additional Guarantors party thereto and U.S. Bank National Association, as trustee (filed herewith)as Exhibit 4.25 to Cliffs’ Form 10-K for the period ended December 31, 2020 and incorporated herein by reference). |
| Fifth Supplemental Indenture, dated as of December 22, 2021, among Cleveland-Cliffs Inc., the Additional Guarantor party thereto and U.S. Bank National Association, as trustee (filed as Exhibit 4.11 to Cliffs’ Form 10-K for the period ended December 31, 2021 and incorporated herein by reference). |
| Sixth Supplemental Indenture, dated as of July 31, 2023, among Cleveland-Cliffs Inc., the Additional Guarantors party thereto and U.S. Bank Trust Company, National Association (successor in interest to U.S. Bank National Association), as trustee (filed as Exhibit 4.1 to Cliffs' Form 10-Q for the period ended September 30, 2023 and incorporated herein by reference). |
| Indenture, dated as of March 13, 2020, among Cleveland-Cliffs Inc., the Guarantors party thereto and U.S. Bank National Association, as trustee and first lien notes collateral agent, including Form of 6.75% Senior Secured Notes due 2026 (filed as Exhibit 4.1 to Cliffs’ Form 10-Q for the period ended March 31, 2020 and incorporated herein by reference). |
| First Supplemental Indenture, dated as of May 22, 2020, among Cleveland-Cliffs Inc., the Additional Guarantors party thereto and U.S. Bank National Association, as trustee and first lien notes collateral agent (filed as Exhibit 4.9 to Cliffs’ Form 10-Q for the period ended June 30, 2020 and incorporated herein by reference). |
| Second Supplemental Indenture, dated as of June 19, 2020, among Cleveland-Cliffs Inc., the Guarantors party thereto and U.S. Bank National Association, as trustee and first lien notes collateral agent, including Form of 6.75% Senior Secured Notes due 2026 (filed as Exhibit 4.10 to Cliffs’ Form 10-Q for the period ended June 30, 2020 and incorporated herein by reference). |
| Third Supplemental Indenture, dated as of December 9, 2020, among Cleveland-Cliffs Inc., the Additional Guarantors party thereto and U.S. Bank National Association, as trustee and first lien notes collateral agent (filed herewith)as Exhibit 4.29 to Cliffs’ Form 10-K for the period ended December 31, 2020 and incorporated herein by reference). |
| Fourth Supplemental Indenture, dated as of December 18, 2020, among Cleveland-Cliffs Inc., the Additional Guarantors party thereto and U.S. Bank National Association, as trustee and first lien notes collateral agent (filed herewith)as Exhibit 4.30 to Cliffs’ Form 10-K for the period ended December 31, 2020 and incorporated herein by reference). |
| Fifth Supplemental Indenture, dated as of March 16, 2020, by andDecember 22, 2021, among Cleveland-Cliffs Inc., the GuarantorsAdditional Guarantor party thereto and U.S. Bank National Association, as trustee including Form of 6.375% Senior Notes due 2025and first lien notes collateral agent (filed as Exhibit 4.54.17 to Cliffs’ Form 10-Q10-K for the period ended MarchDecember 31, 20202021 and incorporated herein by reference). |
| FirstSixth Supplemental Indenture, dated as of May 22, 2020,July 31, 2023, among Cleveland-Cliffs Inc., the Additional Guarantors party thereto and U.S. Bank Trust Company, National Association and U.S. Bank National Association, as first lien notes collateral agent (successor in interest to U.S. Bank National Association), as trustee (filed as Exhibit 4.84.2 to Cliffs’Cliffs' Form 10-Q for the period ended JuneSeptember 30, 20202023 and incorporated herein by reference). |
| Second Supplemental Indenture, dated as of December 9, 2020, among Cleveland-Cliffs Inc., the Additional Guarantors party thereto and U.S. Bank National Association, as trustee (filed herewith) |
| Third Supplemental Indenture, dated as of December 18, 2020, among Cleveland-Cliffs Inc., the Additional Guarantors party thereto and U.S. Bank National Association, as trustee (filed herewith) |
| Registration Rights Agreement, dated March 16, 2020, among Cleveland-Cliffs Inc., the Guarantors party thereto and Credit Suisse Securities (USA) LLC, as dealer manager, with respect to Cleveland-Cliffs Inc.’s 6.375% Senior Notes due 2025 (filed as Exhibit 4.6 to Cliffs’ Form 10-Q for the period ended March 31, 2020 and incorporated herein by reference) |
| Indenture, dated as of March 16, 2020, among Cleveland-Cliffs Inc., the Guarantors party thereto and U.S. Bank National Association, as trustee, including Form of 7.00% Senior Notes due 2027 (filed as Exhibit 4.7 to Cliffs’ Form 10-Q for the period ended March 31, 2020 and incorporated herein by reference). |
| First Supplemental Indenture, dated as of May 22, 2020, among Cleveland-Cliffs Inc., the Additional Guarantors party thereto and U.S. Bank National Association, as trustee (filed as Exhibit 4.7 to Cliffs’ Form 10-Q for the period ended June 30, 2020 and incorporated herein by reference). |
| Second Supplemental Indenture, dated as of December 9, 2020, among Cleveland-Cliffs Inc., the Additional Guarantors party thereto and U.S. Bank National Association, as trustee (filed herewith)as Exhibit 4.38 to Cliffs’ Form 10-K for the period ended December 31, 2020 and incorporated herein by reference). |
| Third Supplemental Indenture, dated as of December 18, 2020, among Cleveland-Cliffs Inc., the Additional Guarantors party thereto and U.S. Bank National Association, as trustee (filed herewith)as Exhibit 4.39 to Cliffs’ Form 10-K for the period ended December 31, 2020 and incorporated herein by reference). |
| Registration Rights Agreement,Fourth Supplemental Indenture, dated March 16, 2020,as of December 22, 2021, among Cleveland-Cliffs Inc., the Additional Guarantor party thereto and U.S. Bank National Association, as issuer,trustee (filed as Exhibit 4.22 to Cliffs’ Form 10-K for the period ended December 31, 2021 and incorporated herein by reference). |
| | | | | |
| Exhibit Number | Exhibit |
| Fifth Supplemental Indenture, dated as of July 31, 2023, among Cleveland-Cliffs Inc., the Additional Guarantors party thereto and Credit Suisse Securities (USA) LLC,U.S. Bank Trust Company, National Association (successor in interest to U.S. Bank National Association), as dealer manager, with respect to Cleveland-Cliffs Inc.’s 7.00% Senior Notes due 2027trustee (filed as Exhibit 4.84.3 to Cliffs’Cliffs' Form 10-Q for the period ended March 31, 2020September 30, 2023 and incorporated herein by reference). |
| Indenture, dated as of AprilFebruary 17, 2020,2021, among Cleveland-Cliffs Inc., the Guarantors party thereto and U.S. Bank National Association, as trustee, and first lien notes collateral agent, including FormForms of 9.875%4.625% Senior SecuredGuaranteed Notes due 20252029 and 4.875% Senior Guaranteed Notes due 2031 (filed as Exhibit 4.1 to Cliffs’Cliffs' Form 10-Q for the period ended June 30, 2020March 31, 2021 and incorporated herein by reference). |
| | | | | |
| First Supplemental Indenture, dated as of April 24, 2020,December 22, 2021, among Cleveland-Cliffs Inc., the GuarantorsAdditional Guarantor party thereto and U.S. Bank National Association, as trustee and first lien notes collateral agent, including Form of 9.875% Senior Secured Notes due 2025 (filed as Exhibit 4.24.30 to Cliffs’ Form 10-Q10-K for the period ended June 30, 2020December 31, 2021 and incorporated herein by reference). |
| Second Supplemental Indenture, dated as of May 22, 2020,July 31, 2023, among Cleveland-Cliffs Inc., the Additional Guarantors party thereto and U.S. Bank Trust Company, National Association (successor in interest to U.S. Bank National Association), as trustee (filed as Exhibit 4.4 to Cliffs' Form 10-Q for the period ended September 30, 2023 and incorporated herein by reference). |
| Indenture, dated as of April 14, 2023, among Cleveland-Cliffs Inc., the Guarantors party thereto and U.S. Bank Trust Company, National Association, as trustee, and first lien notes collateral agentincluding Form of 6.750% Senior Guaranteed Notes due 2030 (filed as Exhibit 4.34.1 to Cliffs’Cliffs' Form 10-Q for the period ended June 30, 20202023 and incorporated herein by reference). |
| ThirdFirst Supplemental Indenture, dated as of December 9, 2020,July 31, 2023, among Cleveland-Cliffs Inc., the Additional Guarantors party thereto and U.S. Bank Trust Company, National Association, as trustee (filed as Exhibit 4.5 to Cliffs' Form 10-Q for the period ended September 30, 2023 and first lien notes collateral agent (filed herewith)incorporated herein by reference). |
| Fourth Supplemental Indenture, dated as of December 18, 2020, among Cleveland-Cliffs Inc., the Additional Guarantors party thereto and U.S. Bank National Association, as trustee and first lien notes collateral agent (filed herewith) |
| Form of Common Share Certificate (filed as Exhibit 4.1 to Cliffs’ Form 10-Q for the period ended September 30, 2019 and incorporated herein by reference). |
| Form of Series B Participating Redeemable Preferred Stock Certificate (included in Exhibit 3.2) |
| Description of Securities Registered under Section 12 of the Securities Exchange Act of 1934 (filed herewith)as Exhibit 4.25 to Cliffs’ Form 10-K for the period ended December 31, 2022 and incorporated herein by reference). |
| Material contracts |
| * Form of 2014 Change in Control Severance Agreement (covering newly hired officers) (filed as Exhibit 10.4 to Cliffs’ Form 8-K/A on September 16, 2014 and incorporated herein by reference). |
| * Form of 2016 Change in Control Severance Agreement (filed as Exhibit 10.1 to Cliffs’ 10-Q for the period ended September 30, 2016 and incorporated herein by reference). |
| * Cleveland-Cliffs Inc. 2012 Non-Qualified Deferred Compensation Plan (effective January 1, 2012) dated November 8, 2011(Amended and Restated effective October 26, 2021) (filed as Exhibit 10.110.3 to Cliffs’ Form 8-K on November 8, 201110-K for the period ended December 31, 2021 and incorporated herein by reference). |
| * Form of Director and Officer Indemnification Agreement between Cleveland-Cliffs Inc. and Directors and Officers (filed as Exhibit 10.2 to Cliffs’ Form 10-Q for the period ended March 31, 2019 and incorporated herein by reference). |
| * Cliffs Natural ResourcesCleveland-Cliffs Inc. Amended and Restated 20142021 Nonemployee Directors’ Compensation Plan (filed as Exhibit 10.110.2 to Cliffs’ Form 8-K on May 2, 2016April 30, 2021 and incorporated herein by reference). |
| *Form of Restricted Shares Agreement for Nonemployee Directors (filed as Exhibit 10.1 to Cliffs’ Form 10-Q for the period ended June 30, 20182023 and incorporated herein by reference). |
| *Form of Deferred Shares Agreement for Nonemployee Directors (filed as Exhibit 10.2 to Cliffs’ Form 10-Q for the period ended June 30, 20182023 and incorporated herein by reference). |
| * Trust Agreement No. 1 (Amended and Restated effective June 1, 1997), dated June 12, 1997, by and between Cleveland-Cliffs Inc and KeyBank National Association, Trustee, with respect to the Cleveland-Cliffs Inc Supplemental Retirement Benefit Plan, Severance Pay Plan for Key Employees and certain executive agreements (filed as Exhibit 10.10 to Cliffs’ Form 10-K for the period ended December 31, 2011 and incorporated herein by reference). |
| * Trust Agreement No. 1 Amendments to Exhibits, effective as of January 1, 2000, by and between Cleveland-Cliffs Inc and KeyBank National Association, as Trustee (filed as Exhibit 10.11 to Cliffs’ Form 10-K for the period ended December 31, 2011 and incorporated herein by reference). |
| * First Amendment to Trust Agreement No. 1, effective September 10, 2002, by and between Cleveland-Cliffs Inc and KeyBank National Association, as Trustee (filed as Exhibit 10.12 to Cliffs’ Form 10-K for the period ended December 31, 2011 and incorporated herein by reference). |
| * Second Amendment to Trust Agreement No. 1 between Cliffs Natural Resources Inc. (f/k/a Cleveland-Cliffs Inc) and KeyBank National Association, Trustee, entered into and effective as of December 31, 2008 (filed as Exhibit 10(y) to Cliffs’ Form 10-K for the period ended December 31, 2008 and incorporated herein by reference). |
| | | | | |
| Exhibit Number | Exhibit |
| * Third Amendment to Trust Agreement No. 1 between Cliffs Natural Resources Inc. (f/k/a Cleveland-Cliffs Inc) and KeyBank National Association, Trustee, entered into and effective as of July 28, 2014 (filed as Exhibit 10.15 to Cliffs’ Form 10-K for the period ended December 31, 2014 and incorporated herein by reference). |
| * Amended and Restated Trust Agreement No. 2, effective as of October 15, 2002, by and between Cleveland-Cliffs Inc and KeyBank National Association, Trustee, with respect to Executive Agreements and Indemnification Agreements with the Company’s Directors and certain Officers, the Company’s Severance Pay Plan for Key Employees, and the Retention Plan for Salaried Employees (filed as Exhibit 10.14 to Cliffs’ Form 10-K for the period ended December 31, 2011 and incorporated herein by reference) |
| | | | | . |
| * Second Amendment to Amended and Restated Trust Agreement No. 2 between Cliffs Natural Resources Inc. (f/k/a Cleveland-Cliffs Inc) and KeyBank National Association, Trustee, entered into and effective as of December 31, 2008 (filed as Exhibit 10(aa) to Cliffs’ Form 10-K for the period ended December 31, 2008 and incorporated herein by reference). |
| * Third Amendment to Amended and Restated Trust Agreement No. 2 between Cliffs Natural Resources Inc. (f/k/a Cleveland-Cliffs Inc) and KeyBank National Association, Trustee, entered into and effective as of July 28, 2014 (filed as Exhibit 10.18 to Cliffs’ Form 10-K for the period ended December 31, 2014 and incorporated herein by reference). |
| * Trust Agreement No. 7, dated as of April 9, 1991, by and between Cleveland-Cliffs Inc and KeyBank National Association, Trustee, with respect to the Cleveland-Cliffs Inc Supplemental Retirement Benefit Plan (filed as Exhibit 10.23 to Cliffs’ Form 10-K for the period ended December 31, 2011 and incorporated herein by reference). |
| * First Amendment to Trust Agreement No. 7, by and between Cleveland-Cliffs Inc and KeyBank National Association, Trustee, dated as of March 9, 1992 (filed as Exhibit 10.24 to Cliffs’ Form 10-K for the period ended December 31, 2011 and incorporated herein by reference). |
| * Second Amendment to Trust Agreement No. 7, dated November 18, 1994, by and between Cleveland-Cliffs Inc and KeyBank National Association, Trustee (filed as Exhibit 10.25 to Cliffs’ Form 10-K for the period ended December 31, 2011 and incorporated herein by reference). |
| * Third Amendment to Trust Agreement No. 7, dated May 23, 1997, by and between Cleveland-Cliffs Inc and KeyBank National Association, Trustee (filed as Exhibit 10.26 to Cliffs’ Form 10-K for the period ended December 31, 2011 and incorporated herein by reference). |
| * Fourth Amendment to Trust Agreement No. 7, dated July 15, 1997, by and between Cleveland-Cliffs Inc and KeyBank National Association, Trustee (filed as Exhibit 10.27 to Cliffs’ Form 10-K for the period ended December 31, 2011 and incorporated herein by reference). |
| * Amendment to Exhibits to Trust Agreement No. 7, effective as of January 1, 2000, by and between Cleveland-Cliffs Inc and KeyBank National Association, Trustee (filed as Exhibit 10.28 to Cliffs’ Form 10-K for the period ended December 31, 2011 and incorporated herein by reference). |
| * Sixth Amendment to Trust Agreement No. 7 between Cliffs Natural Resources Inc. (f/k/a Cleveland-Cliffs Inc) and KeyBank National Association, Trustee, entered into and effective as of December 31, 2008 (filed as Exhibit 10(oo) to Cliffs’ Form 10-K for the period ended December 31, 2008 and incorporated herein by reference). |
| * Seventh Amendment to Trust Agreement No. 7 between Cliffs Natural Resources Inc. (f/k/a Cleveland-Cliffs Inc) and KeyBank National Association, Trustee, entered into and effective as of July 28, 2014 (filed as Exhibit 10.34 to Cliffs’ Form 10-K for the period ended December 31, 2014 and incorporated herein by reference). |
| * Trust Agreement No. 10, dated as of November 20, 1996, by and between Cleveland-Cliffs Inc and KeyBank National Association, Trustee, with respect to the Cleveland-Cliffs Inc Nonemployee Directors’ Compensation Plan (filed as Exhibit 10.36 to Cliffs’ Form 10-K for the period ended December 31, 2011 and incorporated herein by reference). |
| *First Amendment to Trust Agreement No. 10 between Cliffs Natural Resources Inc. (f/k/a Cleveland-Cliffs Inc) and KeyBank National Association, Trustee, entered into and effective as of December 31, 2008 (filed as Exhibit 10(ww) to Cliffs’ Form 10-K for the period ended February 26, 2009 and incorporated herein by reference). |
| * Second Amendment to Trust Agreement No. 10 between Cliffs Natural Resources Inc. (f/k/a Cleveland-Cliffs Inc) and KeyBank National Association, Trustee, entered into and effective as of July 28, 2014 (filed as Exhibit 10.45 to Cliffs’ Form 10-K for the period ended December 31, 2014 and incorporated herein by reference). |
| * Separation and Release Agreement, by and between Maurice D. Harapiak and Cleveland-Cliffs Inc., effective April 22, 2022 (filed as Exhibit 10.1 to Cliffs' Form 10-Q for the period ended June 30, 2022 and incorporated herein by reference). |
| * Letter Agreement, by and between Lourenco Goncalves and Cliffs Natural Resources Inc., signed as of September 11, 2014 (filed as Exhibit 10.1 to Cliffs’ Form 8-K/A on September 16, 2014 and incorporated herein by reference). |
| | | | | |
| Exhibit Number | Exhibit |
| * Cleveland-Cliffs Inc and Subsidiaries Management Performance Incentive Plan Summary, effective January 1, 2004 (filed as Exhibit 10.47 to Cliffs’ Form 10-K for the period ended December 31, 2011 and incorporated herein by reference). |
| * Cliffs Natural Resources Inc. 2017 Executive Management Performance Incentive Plan effective January 1, 2017 (filed as Exhibit 10.2 to Cliffs' Form 8-K on April 27, 2017 and incorporated herein by reference). |
| * Cliffs Natural Resources Inc. Amended and Restated 2012 Incentive Equity Plan (filed as Exhibit 10.1 to Cliffs’ Form 8-K on August 4, 2014 and incorporated herein by reference). |
| * Form of Cliffs Natural Resources Inc. Amended and Restated 2012 Incentive Equity Plan Non-Qualified Stock Option Award Memorandum (3-Year Vesting – January 2015 Grant) and Stock Option Award Agreement (filed as Exhibit 10.69 to Cliffs’ Form 10-K for the period ended December 31, 2014 and incorporated herein by reference) |
| | | | | |
| * Cliffs Natural Resources Inc. 2015 Equity and Incentive Compensation Plan (filed as Exhibit 10.1 to Cliffs’ Form 8-K on May 21, 2015 and incorporated herein by reference) |
| * Cliffs Natural Resources Inc. Amended and Restated 2015 Equity and Incentive Compensation Plan (filed as Exhibit 10.1 to Cliffs’ Form 8-K on April 27, 2017 and incorporated herein by reference). |
| * Cleveland-Cliffs Inc. 2021 Equity and Incentive Compensation Plan (filed as Exhibit 10.1 to Cliffs’ Form 8-K on April 30, 2021 and incorporated herein by reference). |
| * Form of Cleveland-Cliffs Inc. Amended and Restated 20152021 Equity and Incentive Compensation Plan Restricted Stock Unit Award Memorandum and Restricted Stock Unit Award Agreement (filed as Exhibit 10.1 to Cliffs’ Form 10-Q for the period ended March 31, 2022 and incorporated herein by reference). |
| * Form of Cleveland-Cliffs Inc. 2021 Equity and Incentive Compensation Plan Performance Share Award Memorandum (TSR) and Performance Share Award Agreement (filed as Exhibit 10.2 to Cliffs’ Form 10-Q for the period ended March 31, 20182022 and incorporated herein by reference). |
| * Form of Cleveland-Cliffs Inc. Amended and Restated 2015 Equity and Incentive Compensation Plan Performance Share Award Memorandum and Performance Share Award Agreement (filed as Exhibit 10.3 to Cliffs’ Form 10-Q for the period ended March 31, 2018 and incorporated herein by reference) |
| * Form of Cleveland-Cliffs Inc. Amended and Restated 20152021 Equity and Incentive Compensation Plan Cash Incentive Award Memorandum (TSR) and Cash Incentive Award Agreement (TSR) (filed as Exhibit 10.410.3 to Cliffs’ Form 10-Q for the period ended March 31, 20182022 and incorporated herein by reference). |
| * Form of Cleveland-Cliffs Inc. 2021 Equity and Incentive Compensation Plan Restricted Stock Unit Award Memorandum and Restricted Stock Unit Award Agreement (filed as Exhibit 10.1 to Cliffs’ Form 10-Q for the period ended March 31, 2023 and incorporated herein by reference). |
| * Cliffs Natural ResourcesForm of Cleveland-Cliffs Inc. 2021 Equity and Incentive Compensation Plan Performance Share Award Memorandum (TSR) and Performance Share Award Agreement (filed as Exhibit 10.2 to Cliffs’ Form 10-Q for the period ended March 31, 2023 and incorporated herein by reference). |
| * Form of Cleveland-Cliffs Inc. 2021 Equity and Incentive Compensation Plan Cash Incentive Award Memorandum (TSR) and Cash Incentive Award Agreement (TSR) (filed as Exhibit 10.3 to Cliffs’ Form 10-Q for the period ended March 31, 2023 and incorporated herein by reference). |
| * Cleveland-Cliffs Inc. Supplemental Retirement Benefit Plan (as Amended and Restated effective December 1, 2006) dated December 31, 2008October 26, 2021) (filed as Exhibit 10(mmm)10.40 to Cliffs’ Form 10-K for the period ended December 31, 20082021 and incorporated herein by reference). |
| * Amendment No. 1 to Cleveland-Cliffs Inc. Supplemental Retirement Benefit Plan, dated December 14, 2023 (filed herewith). |
| Asset-Based Revolving Credit Agreement, dated as of March 13, 2020, among Cleveland-Cliffs Inc., the lenders party thereto from time to time and Bank of America, N.A., as administrative agent (filed as Exhibit 10.1 to Cliffs’ Form 10-Q for the period ended March 31, 2020 and incorporated herein by reference). |
| First Amendment to Asset-Based Revolving Credit Agreement, dated as of March 27, 2020, among Cleveland-Cliffs Inc., the lenders party thereto from time to time and Bank of America, N.A., as administrative agent (filed as Exhibit 10.2 to Cliffs’ Form 10-Q for the period ended March 31, 2020 and incorporated herein by reference). |
| Second Amendment to Asset-Based Revolving Credit Agreement, dated as of December 9, 2020, among Cleveland-Cliffs Inc., the lenders party thereto from time to time and Bank of America, N.A., as administrative agent (filed herewith)as Exhibit 10.42 to Cliffs’ Form 10-K for the period ended December 31, 2020 and incorporated herein by reference). |
| Investor RightsThird Amendment to Asset-Based Revolving Credit Agreement, dated as of December 9, 2020, by17, 2021, among Cleveland-Cliffs Inc., the lenders party thereto from time to time and between Cleveland-Cliffs Inc. and ArcelorMittal S.A.Bank of America, N.A., as administrative agent (filed as Exhibit 10.1 to Cliffs'Cliffs’ Form 8-K on December 9, 202023, 2021 and incorporated herein by reference). |
| Fourth Amendment to Asset-Based Revolving Credit Agreement, dated as of June 9, 2023, among Cleveland-Cliffs Inc., the lenders party thereto from time to time and Bank of America, N.A., as administrative agent (filed as Exhibit 10.3 to Cliffs’ Form 10-Q for the period ended June 30, 2023 and incorporated herein by reference). |
| Subsidiaries of the Registrant (filed herewith). |
| Schedule of the obligated group, including the parent and issuer and the subsidiary guarantors that have guaranteed the obligations under the 4.875% 2024 Senior Secured Notes, the 5.75% 2025 Senior Notes, the 6.375% 2025 Senior Notes, the 6.75%6.750% 2026 Senior Secured Notes, the 5.875% 2027 Senior Notes, the 7.00%7.000% 2027 Senior Notes, the 4.625% 2029 Senior Notes, the 6.750% 2030 Senior Notes and the 9.875% 20254.875% 2031 Senior Secured Notes issued by Cleveland-Cliffs Inc. (filed herewith). |
| | | | | |
| Exhibit Number | Exhibit |
| Consent of Independent Registered Public Accounting Firm (filed herewith). |
| Consent of SLR International Corporation regarding Hibbing Taconite Property, Minnesota, USA (filed herewith). |
| Consent of SLR International Corporation regarding Minorca Property, Minnesota, USA (filed herewith). |
| Consent of SLR International Corporation regarding Northshore Property, Minnesota, USA (filed herewith). |
| Consent of SLR International Corporation regarding United Taconite Property, Minnesota, USA (filed herewith). |
| Consent of SLR International Corporation regarding Tilden Property, Michigan, USA (filed herewith). |
| Power of Attorney (filed herewith). |
| Certification Pursuant to 15 U.S.C. Section 7241, as Adopted Pursuant to Section 302 of the Sarbanes-Oxley Act of 2002, signed and dated by Lourenco Goncalves as of February 26, 20218, 2024 (filed herewith). |
| Certification Pursuant to 15 U.S.C. Section 7241, as Adopted Pursuant to Section 302 of the Sarbanes-Oxley Act of 2002, signed and dated by Keith A. KociCelso L. Goncalves Jr. as of February 26, 20218, 2024 (filed herewith). |
| Certification Pursuant to 18 U.S.C. Section 1350, as Adopted Pursuant to Section 906 of the Sarbanes-Oxley Act of 2002, signed and dated by Lourenco Goncalves, Chairman, President and Chief Executive Officer of Cleveland-Cliffs Inc., as of February 26, 20218, 2024 (filed herewith). |
| Certification Pursuant to 18 U.S.C. Section 1350, as Adopted Pursuant to Section 906 of the Sarbanes-Oxley Act of 2002, signed and dated by Keith A. Koci,Celso L. Goncalves Jr., Executive Vice President, Chief Financial Officer of Cleveland-Cliffs Inc., as of February 26, 20218, 2024 (filed herewith). |
| Mine Safety Disclosures (filed herewith). |
| Technical Report Summary on the Hibbing Taconite Property, Minnesota, USA, prepared for the Company by SLR International Corporation with an effective date of December 31, 2021 (filed as Exhibit 96.1 to Cliffs’ Form 8-K on February 11, 2022 and incorporated herein by reference). |
| Technical Report Summary on the Minorca Property, Minnesota, USA, prepared for the Company by SLR International Corporation with an effective date of December 31, 2021 (filed as Exhibit 96.2 to Cliffs’ Form 8-K on February 11, 2022 and incorporated herein by reference). |
| Technical Report Summary on the Northshore Property, Minnesota, USA, prepared for the Company by SLR International Corporation with an effective date of December 31, 2021 (filed as Exhibit 96.3 to Cliffs’ Form 8-K on February 11, 2022 and incorporated herein by reference). |
| Technical Report Summary on the United Taconite Property, Minnesota, USA, prepared for the Company by SLR International Corporation with an effective date of December 31, 2021 (filed as Exhibit 96.4 to Cliffs’ Form 8-K on February 11, 2022 and incorporated herein by reference). |
| Technical Report Summary on the Tilden Property, Michigan, USA, prepared for the Company by SLR International Corporation with an effective date of December 31, 2021 (filed as Exhibit 96.5 to Cliffs’ Form 10-K for the period ended December 31, 2021 and incorporated herein by reference). |
| Cleveland-Cliffs Inc. Compensation Clawback Policy, effective October 2, 2023 (filed herewith). |
| 101 | The following financial information from Cleveland-Cliffs Inc.'s Annual Report on Form 10-K for the year ended December 31, 20202023 formatted in Inline XBRL (Extensible Business Reporting Language) includes: (i) the Statements of Consolidated Financial Position, (ii) the Statements of Consolidated Operations, (iii) the Statements of Consolidated Comprehensive Income, (iv) the Statements of Consolidated Cash Flows, (v) the Statements of Consolidated Changes in Equity, and (vi) Notes to the Consolidated Financial Statements. |
| 104 | The cover page from this Annual Report on Form 10-K, formatted in Inline XBRL. |
_______________
*Indicates management contract or other compensatory arrangement.
** Certain immaterial schedules and exhibits to this exhibit have been omitted pursuant to the provisions of Regulation S-K, Item 601(a)(5). A copy of any of the omitted schedules and exhibits will be furnished to the Securities and Exchange Commission upon request.
| | | | | |
| Item
| ITEM 16. | Form FORM 10-K SummarySUMMARY |
None.
SIGNATURES
Pursuant to the requirements of Section 13 or 15(d) of the Securities Exchange Act of 1934, the registrant has duly caused this report to be signed on its behalf by the undersigned, thereunto duly authorized.
| | | | | | | | | | | | | | | | | | | | | | | |
| | | CLEVELAND-CLIFFS INC. |
| | | | |
| | | By: | | /s/ KimberlyK. A. Floriani |
| | | | | Name: | | Kimberly A. Floriani |
| | | | | Title: | | Senior Vice President, Corporate Controller &
Chief Accounting Officer |
| Date: | February 26, 20218, 2024 | | | | | | Chief Accounting Officer |
Pursuant to the requirements of the Securities Exchange Act of 1934, this report has been signed below by the following persons on behalf of the registrant and in the capacities and on the dates indicated.
| | | | | | | | | | | | | | | | | |
| Signatures | Title | Date |
| | |
| /s/ C. L. Goncalves | Chairman, President and
Chief Executive Officer
(Principal Executive Officer) | February 26, 20218, 2024 |
| C. L. Goncalves |
|
/s/ K. A. KociC. L. Goncalves Jr. | Executive Vice President,
Chief Financial Officer
(Principal Financial Officer) | February 26, 20218, 2024 |
K. A. KociC. L. Goncalves Jr. |
|
| /s/ K. A. Floriani | Senior Vice President, Corporate Controller
& Chief Accounting Officer
(Principal Accounting Officer) | February 26, 20218, 2024 |
| K. A. Floriani |
|
| * | Director | February 26, 20218, 2024 |
| J. T. Baldwin |
| Director | |
| R. A. Bloom |
| * | Director | February 26, 20218, 2024 |
| R. P. Fisher, Jr. |
| * | Director | February 26, 20218, 2024 |
| W. K. Gerber |
| * | Director | February 26, 20218, 2024 |
| S. M. Green |
| * | Director | February 26, 2021 |
M. A. Harlan |
* | Director | February 26, 20218, 2024 |
| R. S. Michael, III |
| * | Director | February 26, 20218, 2024 |
| J. L. Miller |
| * | Director | February 26, 2021 |
E. M. Rychel |
* | Director | February 26, 20218, 2024 |
| G. Stoliar |
| * | Director | February 26, 20218, 2024 |
| D. C. Taylor |
| * | Director | February 26, 20218, 2024 |
| A. M. Yocum |
* The undersigned, by signing his name hereto, does sign and execute this Annual Report on Form 10-K pursuant to a Power of Attorney executed on behalf of the above-indicated directors of the registrant and filed herewith as Exhibit 24 on behalf of the registrant.
| | | | | |
| By: | /s/ K. A. KociC. L. Goncalves Jr. |
| (K. A. Koci,C. L. Goncalves Jr., as Attorney-in-Fact) |