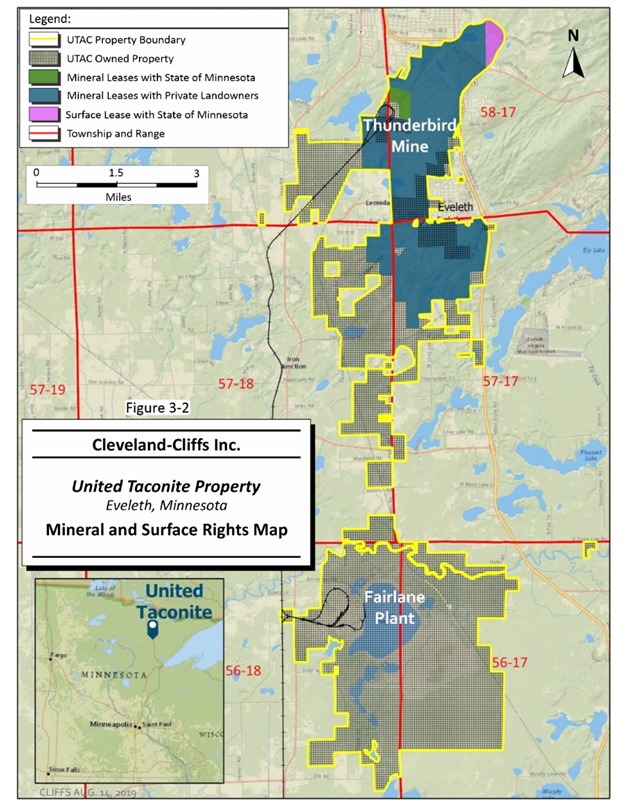
TheUNITED TACONITEUnited Taconite's (100% owned) mine and offices are located on Minnesota's Mesabi Iron Range just north of Eveleth, Minnesota at latitude 47°29'1.62" N, longitude 92°32'23.69" W. The processing facilities are located approximately eight miles to the southeast.
| | | | | |
The property commenced operations as an asset of Eveleth MN at latitude 47°29'1.62" N, longitude 92°32'23.69" W.Taconite Company in 1965 before it was purchased by United Taconite (70% Cliffs and 30% Laiwu Steel) in December 2003. The processing facilities are located approximately eight miles to the southeast. | property has been a wholly owned subsidiary of Cliffs since 2008. United Taconite owns 14,199 acres of surface rights, of which 703 acres are associated with mineral leases. An additional 145 acres of surface rights are leased from the State of Minnesota., We lease 100% of the mineral rights, comprisingcomprised of 4,908 acres expiring between 2037 and 2066, with the exception of the State of Minnesota mineral lease, which expires in 2027. Leases are maintained by making minimum prepaid royalty payments. Mining leases routinely are renegotiated and renewed as they approach their respective expiration dates. | OpenOperations include an open pit truck and shovel mine where two stages of crushing occur before the ore is transported by rail, operated by CN, to the plant site. At the plant site an additional stage of crushing occurs before the ore is sent to the concentrator. The concentrator utilizes rod mills and magnetic separation to produce a magnetite concentrate, which is delivered to the on-site pellet plant. From the plant site, pellets are transported by CN rail to a ship loading port at Duluth, MN,Minnesota, operated by CN. The net book value of United Taconite's property, plant and equipment was $559 million as of December 31, 2023. | The property commenced operations as an asset of Eveleth Taconite Company in 1965 before it was purchased by United Taconite (70% Cliffs and 30% Laiwu Steel) in December 2003. The Property has been a wholly owned subsidiary of Cliffs since 2008. | $567 |
For more information, see Exhibit 96.4, Technical Report Summary on the United Taconite Property, Minnesota, USA, prepared for the Company by the QP, SLR, with an effective date of December 31, 2021.
Mineral ResourcesMINERAL RESOURCES
Mineral resources are defined under Item 1300 of Regulation S-K as a concentration or occurrence of material of economic interest in or on the Earth’s crust in such form, grade or quality, and quantity that there are reasonable prospects for economic extraction. A mineral resource is a reasonable estimate of mineralization, taking into account relevant factors such as cut-off grade, likely mining dimensions, location or continuity that, with the assumed justifiable technical and economic conditions, is likely to, in whole or part, become economically extractable.
A detailed breakdown of the mineral resources exclusive of mineral reserves is presented in the table below. Mineral resources were defined and constrained within open-pit shells, prepared by Cliffs, and based on a US$90.00/WLT pellet price, while meeting defined cut-off grade criteria and existing pellet specifications. All mineral resource estimates were reviewed and validated by the QP, SLR.
The following represents iron ore mineral resources, exclusive of mineral reserves, as of December 31, 2021:2023 and 2022:
| | Iron Ore Mineral Resources | Iron Ore Mineral Resources | Iron Ore Mineral Resources |
as of December 31, 2021 | (In Millions of Long Tons) | | Measured | Indicated | Measured + Indicated | Process | Inferred |
| Tonnage | % Grade | Tonnage | % Grade | Tonnage | % Grade | Recovery | Tonnage | % Grade |
| Measured | | | Measured | Indicated | Measured + Indicated | Process | Inferred |
| (In millions of long tons) | | (In millions of long tons) | Tonnage | % Grade | Tonnage | % Grade | Tonnage | % Grade | Recovery | Tonnage | % Grade |
| Total Iron Ore | Total Iron Ore | 1,351 | | 22.5 | | 1,483 | | 23.6 | | 2,834 | | 23.1 | | 31% | 420 | | 32.4 | |
| | Michigan | Michigan | — | | — | | 135 | | 35.5 | | 135 | | 35.5 | | 36% | 350 | | 34.7 | |
| Michigan | |
| Michigan | |
| Minnesota | Minnesota | 1,351 | | 22.5 | | 1,348 | | 22.4 | | 2,699 | | 22.4 | | 31% | 70 | | 21.0 | |
| Hibbing1 | |
Hibbing1 | |
Hibbing1 | Hibbing1 | 8 | | 19.2 | | 1 | | 18.7 | | 9 | | 19.2 | | 25% | — | | — | |
| Minorca | Minorca | 484 | | 22.9 | | 317 | | 22.9 | | 801 | | 22.9 | | 33% | 30 | | 21.1 | |
| Northshore | Northshore | 767 | | 22.1 | | 391 | | 22.4 | | 1,158 | | 22.2 | | 26% | 14 | | 19.8 | |
| Tilden | Tilden | — | | — | | 135 | | 35.5 | | 135 | | 35.5 | | 36% | 350 | | 34.7 | |
| United Taconite | United Taconite | 92 | | 23.6 | | 639 | | 22.2 | | 731 | | 22.4 | | 32% | 26 | | 21.5 | |
| 1Hibbing is reported at 85.3% based on our ownership level. | 1Hibbing is reported at 85.3% based on our ownership level. | |
1Hibbing is reported at 85.3% based on our ownership level. | |
1Hibbing is reported at 85.3% based on our ownership level. | |
| Reference point selected is the saleable tons based on the process recovery. | |
| Reference point selected is the saleable tons based on the process recovery. | |
Reference point selected is the saleable tons based on the process recovery. | Process recovery may change based on the required saleable product mix and is reported as wet product percentage. | Mineral resources are estimated using the following cut-off grades: 25% FeT for Tilden hematite; 15% magnetic Fe for Northshore; 16% magnetic Fe for Minorca; 17% magnetic Fe for United Taconite; and 13% magnetic Fe for Hibbing. | | Tonnage is reported in long tons equivalent to 2,240 pounds and has been rounded to the nearest 100,000. | Tonnage is reported in long tons equivalent to 2,240 pounds and has been rounded to the nearest 100,000. | Tonnage is reported in long tons equivalent to 2,240 pounds and has been rounded to the nearest 100,000. |
Mineral resources are reported at a $90.00/LT wet standard pellet price freight-on-board (FOB) Lake Superior, which is based on the mine planning model's three-year trailing average of the realized product revenue rate. | | Mineral resources are reported at a $90.00/lt wet standard pellet price freight-on-board (FOB) Lake Superior, which is based on the mine planning model's three-year trailing average of the realized product revenue rate. | | Mineral resources are reported at a $90.00/lt wet standard pellet price freight-on-board (FOB) Lake Superior, which is based on the mine planning model's three-year trailing average of the realized product revenue rate. |
OurWe did not have any material changes to our mineral resource estimates have not been previously disclosed.resources during 2023. The material assumptions and criteria used for the mineral resource estimates, including but not limited to leases, permits and geotechnical pit design, are covered in more detail in Sections 11 through 13 of the respective Technical Report Summaries filed as Exhibits 96.1 through 96.5 to this Annual Report on Form 10-K.
Mineral ReservesMINERAL RESERVES
Mineral reserves are defined under Item 1300 of Regulation S-K as an estimate of tonnage and grade or quality of indicated and measured mineral resources that, in the opinion of the QP, can be the basis of an economically viable project. More specifically, it is the economically mineable part of a measured or indicated mineral resource, which includes diluting materials and allowances for losses that may occur when the material is mined or extracted.
Proven mineral reserves are defined under Item 1300 of Regulation S-K as the economically mineable part of a measured mineral resource and can only result from conversion of a measured mineral resource. Probable mineral reserves are defined under Item 1300 of Regulation S-K as the economically mineable part of an indicated and, in some cases, a measured mineral resource. All mineral reserves are classified as proven or probable and are supported by LoM plans.
Mineral reserves are based on pricing that does not exceed the three-year trailing average index price of iron pellets adjusted to realized price. We evaluate and analyze, and engage QPs to review and verify, mineral reserves in accordance with our mineral policy and SEC requirements and then complete updated LoM plans. The table below identifies the year in which the latest updated LoM plan was completed.
Mineral reserves estimates for our iron mines are constrained by fully designed open pits developed using three-dimensional modeling techniques. These open pits incorporate design slopes, practical mining shapes and access ramps to assure the accuracy of our mineral reserve estimates. All operations' mineral reserves have been adjusted net of production through year-end 2021.2023. All mineral reservereserves estimates as of December 31, 2021 were reviewed and validated by the QP, SLR.
The following represents iron ore mineral reserves as of December 31, 2021:2023:
| | Iron Ore Mineral Reserves | Iron Ore Mineral Reserves | Iron Ore Mineral Reserves |
as of December 31, 2021 | (In Millions of Long Tons) | | Last LoM Plan | Proven | Probable | Proven & Probable | Process |
| Reserve Analysis | Tonnage | % Grade | Tonnage | % Grade | Tonnage | % Grade | Recovery |
| as of December 31, 2023 | | as of December 31, 2023 |
| Last LoM Plan | | | Last LoM Plan | Proven | Probable | Proven & Probable | Process |
| (In millions of long tons) | | (In millions of long tons) | Reserve Analysis | Tonnage | % Grade | Tonnage | % Grade | Tonnage | % Grade | Recovery |
| Total Iron Ore | Total Iron Ore | | 638 | | 23.6 | | 1,682 | | 26.6 | | 2,320 | | 25.8 | | 33% | Total Iron Ore | | 539 | | 24.0 | 24.0 | | 1,643 | 1,643 | | 26.4 | 26.4 | | 2,182 | 2,182 | | 25.8 | 25.8 | | 33% | 33% |
| | Michigan | Michigan | | 4 | | 35.3 | | 516 | | 34.7 | | 520 | | 34.7 | | 37% |
| Michigan | |
| Michigan | | | 4 | | 35.3 | | 478 | | 34.7 | | 482 | | 34.7 | | 37% |
| Minnesota | Minnesota | | 634 | | 23.5 | | 1,166 | | 23.0 | | 1,800 | | 23.2 | | 31% | Minnesota | | 535 | | 23.9 | 23.9 | | 1,165 | 1,165 | | 23.0 | 23.0 | | 1,700 | 1,700 | | 23.3 | 23.3 | | 31% | 31% |
| Hibbing1 | |
Hibbing1 | |
Hibbing1 | Hibbing1 | 2021 | 85 | | 18.7 | | 8 | | 18.7 | | 93 | | 18.7 | | 25% | 2021 | 47 | | 18.7 | 18.7 | | 8 | 8 | | 18.7 | 18.7 | | 55 | 55 | | 18.7 | 18.7 | | 26% | 26% |
| Minorca | Minorca | 2021 | 103 | | 23.6 | | 7 | | 25.3 | | 110 | | 23.7 | | 34% | Minorca | 2021 | 86 | | 23.7 | 23.7 | | 7 | 7 | | 25.1 | 25.1 | | 93 | 93 | | 23.8 | 23.8 | | 34% | 34% |
| Northshore | Northshore | 2020 | 303 | | 25.3 | | 519 | | 24.1 | | 822 | | 24.6 | | 29% | Northshore | 2020 | 288 | | 25.3 | 25.3 | | 519 | 519 | | 24.1 | 24.1 | | 807 | 807 | | 24.5 | 24.5 | | 29% | 29% |
| Tilden | Tilden | 2021 | 4 | | 35.3 | | 516 | | 34.7 | | 520 | | 34.7 | | 37% | Tilden | 2021 | 4 | | 35.3 | 35.3 | | 478 | 478 | | 34.7 | 34.7 | | 482 | 482 | | 34.7 | 34.7 | | 37% | 37% |
| United Taconite | United Taconite | 2019 | 143 | | 23.1 | | 632 | | 22.1 | | 775 | | 22.3 | | 33% | United Taconite | 2019 | 114 | | 23.1 | 23.1 | | 631 | 631 | | 22.1 | 22.1 | | 745 | 745 | | 22.3 | 22.3 | | 33% | 33% |
| 1Hibbing is reported at 85.3% based on our ownership level. | 1Hibbing is reported at 85.3% based on our ownership level. | |
1Hibbing is reported at 85.3% based on our ownership level. | |
Reference point selected by the QP is the saleable tons based on the process recovery. | Process recovery may change based on the required saleable product mix and is reported as wet product percentage. | Mineral reserves are estimated using the following cut-off grades: 25% FeT for Tilden hematite; 19% magnetic Fe for Northshore; 16% magnetic Fe for Minorca; 17% magnetic Fe for United Taconite; and 13% magnetic Fe for Hibbing. | | Tonnage is reported in long tons equivalent to 2,240 pounds and has been rounded to the nearest 100,000. | Tonnage is reported in long tons equivalent to 2,240 pounds and has been rounded to the nearest 100,000. | Tonnage is reported in long tons equivalent to 2,240 pounds and has been rounded to the nearest 100,000. |
| Mineral reserves are classified as probable if not scheduled within the first 20 years. | Mineral reserves are classified as probable if not scheduled within the first 20 years. | Mineral reserves are classified as probable if not scheduled within the first 20 years. |
Mineral reserves are reported at a $90.00/LT wet standard pellet price freight-on-board (FOB) Lake Superior, which is based on the mine planning model's three-year trailing average of the realized product revenue rate. | | Mineral reserves are reported at a $90.00/lt wet standard pellet price freight-on-board (FOB) Lake Superior, which is based on the mine planning model's three-year trailing average of the realized product revenue rate. | | Mineral reserves are reported at a $90.00/lt wet standard pellet price freight-on-board (FOB) Lake Superior, which is based on the mine planning model's three-year trailing average of the realized product revenue rate. |
The material assumptions and criteria used for the mineral reserves estimates, including but not limited to leases, permits and geotechnical pit design, are covered in more detail in Sections 11 through 13 of the respective Technical Report Summaries filed as Exhibits 96.1 through 96.5 to this Annual Report on Form 10-K.
4836 | CLF 2023 FORM 10-K
For comparison purposes, the following represents iron ore mineral reserves as of December 31, 2020: | | | | | | | | | | | | | | | | | | | | | | | |
| Iron Ore Mineral Reserves |
| as of December 31, 2020 |
| (In Millions of Long Tons) |
| Proven | Probable | Proven & Probable | Process |
| Tonnage | % Grade | Tonnage | % Grade | Tonnage | % Grade | Recovery |
| Total Iron Ore | 822 | | 26.2 | | 1,596 | | 26.0 | | 2,418 | | 26.0 | | 31% |
| | | | | | | |
| Michigan | 168 | | 35.2 | | 418 | | 34.8 | | 586 | | 34.8 | | 34% |
| Minnesota | 654 | | 23.9 | | 1,178 | | 23.0 | | 1,832 | | 23.3 | | 30% |
| | | | | | | |
Hibbing1 | 65 | | 19.7 | | 21 | | 19.6 | | 86 | | 19.7 | | 27% |
| Minorca | 113 | | 23.6 | | 7 | | 25.3 | | 120 | | 23.7 | | 31% |
| Northshore | 318 | | 25.3 | | 519 | | 24.1 | | 837 | | 24.6 | | 29% |
| Tilden | 168 | | 35.2 | | 418 | | 34.8 | | 586 | | 34.8 | | 34% |
| United Taconite | 158 | | 23.1 | | 631 | | 22.1 | | 789 | | 22.3 | | 31% |
| | | | | | | |
1Hibbing is reported at 85.3% based on our ownership level. |
| Reference point selected was the saleable tons based on the process recovery. |
| Process recovery may change based on the required saleable product mix and is reported as wet product percentage. |
| Mineral reserves are estimated using the following cut-off grades: 25% FeT for Tilden hematite; 19% magnetic Fe for Northshore; 16% magnetic Fe for Minorca; 17% magnetic Fe for United Taconite; and 15% magnetic Fe for Hibbing. |
| Tonnage is reported in long tons equivalent to 2,240 pounds and has been rounded to the nearest 100,000. |
| Mineral Reserves are classified as probable if not scheduled within the first 20 years. |
| Mineral Reserves are reported at a $90.00/LT wet standard pellet price freight-on-board (FOB) Lake Superior, which is based on the mine planning model's three-year trailing average of the realized product revenue rate. |
| | | | | | | | | | | | | | | | | | | | | | | |
| Iron Ore Mineral Reserves |
| as of December 31, 2022 |
| Proven | Probable | Proven & Probable | Process |
| (In millions of long tons) | Tonnage | % Grade | Tonnage | % Grade | Tonnage | % Grade | Recovery |
| Total Iron Ore | 593 | | 23.8 | | 1,665 | | 26.5 | | 2,258 | | 25.8 | | 32% |
| | | | | | | |
| Michigan | 4 | | 35.3 | | 500 | | 34.7 | | 504 | | 34.7 | | 37% |
| Minnesota | 589 | | 23.7 | | 1,165 | | 23.0 | | 1,754 | | 23.2 | | 31% |
| | | | | | | |
Hibbing1 | 67 | | 18.7 | | 8 | | 18.7 | | 75 | | 18.7 | | 26% |
| Minorca | 95 | | 23.7 | | 7 | | 25.1 | | 102 | | 23.8 | | 34% |
| Northshore | 299 | | 25.3 | | 519 | | 24.1 | | 818 | | 24.6 | | 29% |
| Tilden | 4 | | 35.3 | | 500 | | 34.7 | | 504 | | 34.7 | | 37% |
| United Taconite | 128 | | 23.1 | | 631 | | 22.1 | | 759 | | 22.3 | | 33% |
| | | | | | | |
1Hibbing is reported at 85.3% based on our ownership level. |
| Reference point selected by the QP is the saleable tons based on the process recovery. |
| Process recovery may change based on the required saleable product mix and is reported as wet product percentage. |
| Mineral reserves are estimated using the following cut-off grades: 25% FeT for Tilden hematite; 19% magnetic Fe for Northshore; 16% magnetic Fe for Minorca; 17% magnetic Fe for United Taconite; and 13% magnetic Fe for Hibbing. |
| Tonnage is reported in long tons equivalent to 2,240 pounds and has been rounded to the nearest 100,000. |
| Mineral Reserves are classified as probable if not scheduled within the first 20 years. |
| Mineral Reserves are reported at a $90.00/lt wet standard pellet price freight-on-board (FOB) Lake Superior, which is based on the mine planning model's three-year trailing average of the realized product revenue rate. |
Overall, as compared to the mineral reserve estimates as of December 31, 2020, mineral reserves estimates as of December 31, 20212023, as compared to the prior-year period, decreased by 4%3%, which was driven by mining depletion. The mineral reserves of Minorca, Northshore and United Taconite as of December 31, 2021 have decreased mainly due to depletion through mining, the mineral reserves for Tilden as of December 31, 2021 have decreased primarily due to the mine plan changes, and the mineral reserves for Hibbing as of December 31, 2021 have increased primarily due to the mine plan changes.
Internal Controls DisclosureINTERNAL CONTROLS DISCLOSURE
We demonstrated repeated attainment of annual production and quality targets for at least 40 years at each material iron ore mine operated by the Company. Internal controls the Company uses in its industry-standard approach to exploration and mineral resource and reserve estimation efforts are governed by its Mineral Reserve and Mineral Resource Estimation Policy and are detailed in Cliffs’ minimum operating standards for Resource Estimation and Strategic Mine Planning. The controls include: confirmation of drill collar locations and drill hole traces, drill logging and sample collection and security, database verification and security, QA/QC programs, internal and third-party QP statistical analysis, third-party QP model validation, and reconciliation. Modeling and analysis of the Company’s resources has been developed by Company personnel or third-party consultant SLR and reviewed by internal management and the external independent QP, SLR. Reserve estimations have been completed by Company personnel and reviewed by internal management and the QP, SLR.
Drill hole collar surveying methods have evolved with advancements in technology, moving from optical methods to global positioning system, which is currently in use. For the deposit type, all survey methods used for the collar locations are expected to provide adequate accuracy for the drill hole locations. Due to the relatively shallow depth and vertical nature of drill holes at Cliffs’ Minnesota mining operations, downhole deviation surveys are typically not conducted. Drill holes pierce the generally shallow-dipping, tabular iron formation at near perpendicular angles. At the more geologically and structurally complex Tilden mine in Michigan, where drilling deeper than 500 feet is required, downhole surveys have moved from a clay-impression procedure to the gyroscopic method currently in use.
Drill core is transported directly from the drill rig to each site’s core logging facility by either the drilling contractor or Cliffs’ personnel. Temporary core storage is located at each site’s secure logging facility. Depending on the mining operation, unused sample reserves, parts, concentrates and splits are securely stored in labeled boxes or barrels at a Cliffs laboratory facility or logging facility, or via a contracted external laboratory.
CliffsCliffs' QA/QC programs are site-specific and range from in-development to well-developed, long standing protocols that involve formal procedures for the use of crude material standards developed from on-site material, as well as regularly inserted coarse and concentrate duplicate samples, control chart analysis and reporting. Cliffs typically uses internal and external labs for geometallurgical analyses that are accredited with ASQ/ANSI ISO-9001:2015 (American Society for Quality/American National Standards Institute) for their system of quality management. Quality sample results are monitored and enacted on where warranted. Also, Cliffs has implemented a drill campaign reporting practice to ensure results are documented, with defined and illustrated failure metrics, outcomes of investigations, comparisons with previous year’s results and recommendations. The QP, SLR, reviewed CliffsCliffs' QA/QC practices and provided recommendations for further work. Where QA/QC programs are still in
development and prior to resource estimation, Cliffs conducted data verification studies utilizing a suite of blind crude ore standards and blind duplicates from historical sample reserves within the LoM plan. Where unaccredited labs provided data used in resource estimation, check lab studies were initiated to verify analytical results. Cliffs is currently working towardstoward aligning QA/QC protocols at each mine to the Company’s current best practice.
Cliffs maintains exploration drill hole data in an externally-managed, access-controlled acQuire database that is backed up online at regularly scheduled intervals to provide data redundancy and security. Certification of database integrity is accomplished by both visual and statistical inspections comparing geology, assay values and survey locations cross-referenced back to laboratory data and geologic logs. Any discrepancies identified are corrected by referring to hard-copy assay and core log information archived in Cliffs' Mine Engineering department file cabinets.files. Prior to modeling, a secondary validation check is completed using built-in data validation routines in the modeling software.
Cliffs performs routine drill hole database verification with every new drilling program and new block model build, including: check of unique drill hole IDsidentifications and collar coordinates; check of assay or lithology points extending past the specified maximum depth of drill hole; check of abnormal dips and azimuths of downhole drill hole surveys; check of negative, overlapping and missing intervals; and check of incorrect lithologic codes and assay values.
In 2020 and 2021, CliffsCliffs' geologists completed data verification exercises within the LoM plan area for each mining operation. This was audited by the QP, SLR, to assess accuracy and completeness. Database values were checked against source documents including collar surveys, geologic logs and assay certificates. Data verification included collar coordinates, depth intervals of geologic units and assay samples, and results of geometallurgical analyses applied to mineral resource estimation and mine planning.
Cliffs’ mineral resource estimates were validated by the QP, SLR, using standard industry techniques including statistical comparisons with composite samples and parallel nearest neighbor estimates, swath plots, as well as visual reviews in cross-section and plan. A visual review comparing blocks to drill holes for key economic variables, completed after the block modeling work, was performed to ensure general lithologic and analytical conformance. Cliffs’ mining operations have demonstrated good agreement between planned and actual product produced over more than 40 years for each operation.
Cliffs classifies the mineral resources based primarily on drill hole spacing and influenced by geologic continuity, ranges of economic criteria and reconciliation. Some post-processing is undertaken to ensure spatial consistency and remove isolated and fringe blocks. The resource area for each operation is limited by a polygon and subsequent pit shell based on practical mining limits. To ensure that all mineral resource statements satisfy the “reasonable prospects for economic extraction” requirement, in the definition of the mineral resources under Item 1300 of Regulation S-K, factors significant to technical feasibility and potential economic viability are considered (e.g., ability to obtain permits and legal and land tenure considerations). Mineral resources are defined and constrained within optimized, open-pit shells, prepared by Cliffs and reviewed by the QP, SLR, and based on a US$90.00/WLT pellet value and target pellet iron content.
Grade and tonnage reconciliations are run on current production versus modeled production, which provides insight on the accuracy of the modeled assay data versus actual production for each mining operation.
For a discussion of comprehensive risk inherent in the estimation of mineral reserves, see Part I - Item 1A,1A. Risk Factors - V. Sustainability and Development Risks - We rely on estimates of our recoverable mineral reserves, which isare complex due to the geological characteristics of the properties and the number of assumptions made.
Coal Mining and CokemakingCOAL MINING AND COKEMAKING
Princeton is a coal mining complex located in West Virginia that specializes in surface and underground mining of metallurgical coal to produce coke and pulverized coal injection coal. WeAs of December 31, 2023, we have annual rated metallurgical coal production capacity of 2.31.8 million net tons from our Princeton mine. In 2021,During the years ended December 31, 2023 and 2022, the mine produced 1.41.3 million and 1.5 million net tons of coal.coal, respectively. We own 100% of the Princeton mine, which has been operating since 1995. We own 52%60% of the mineral rights and lease 48%40% via multiple mineral leases having varying expiration dates. Mining leases routinely are renegotiated and renewed as they approach their respective expiration dates. Princeton's operations consist of twothree open-pit surface mines, two underground mines, a preparation plant and two rail loadouts.
In 2021, our cokemakingOur Monessen and Warren facilities produced 2.9 million net tons of coke. Mountain State Carbon produces furnace coke and related by-products from its plant in Follansbee, West Virginia, which consists of four batteries. Monessen producesproduce furnace coke and related by-products in Monessen, Pennsylvania which was temporarily idled due to the COVID-19 pandemic and restarted production during the third quarter of 2021. Warren produces furnace coke and related by-products from its plant in Warren, Ohio, and supplies its coke to the Cleveland facility.respectively. We also operate a cokemaking facilitiesfacility located within Burns HarborHarbor. These facilities have an aggregate annual rated capacity of 2.6 million net tons. During the years ended December 31, 2023 and Middletown Works.
As a result of2022, our internal usage of HBI, coupled with our ongoing evaluationcokemaking facilities produced 2.4 million and 2.1 million net tons of coke, use strategies, we idled our coke facility at Middletown Works during the third quarter of 2021, and we intend to permanently idle our Mountain State Carbon coke plant in the second quarter of 2022.respectively.
Other BusinessesOTHER BUSINESSES
Our Tubular operating segment consists of our subsidiary Tubular Components, which has plants in Walbridge, Ohio and Columbus, Indiana. The Walbridge plant operates six electric resistance welded tube mills.mills on owned property. The Columbus plant operates five electric resistance welded tube mills and four high-speed cold saws on leased property. Tubular Components shut down and ceased tube production at the Queretaro, Mexico plant in April 2021. The high-speed cold saw that was operating at the Queretaro plant was relocated to the Columbus plant and the tube mill returned to the U.S. is replacing an existing, older tube mill currently in operation.
Our Tooling and Stamping operating segment consists of our subsidiary Tooling and Stamping and its related companies, which provides advanced-engineered solutions, tool design and build, hot- and cold-stamped steel components and complex assemblies for the automotive market across ten plants, of which certain of these are under long-term lease agreements, in Ontario, Alabama, Kentucky and Kentucky.Tennessee. Its facilities feature seveneight large-bed, hot-stamping presses, providing 1314 lines of production; 8182 cold-stamping presses ranging from 150 net tons to 3,000 net tons of pressing capacity; 1718 large-bed, high-tonnage tryout presses with
prove-out capabilities for new tool builds; and 149151 multi-axis welding assembly cells. Construction
Our European operating segment consists of our new facility in Tennessee is substantially completea metal distribution company that buys and sells steel, steel products and other materials. We operate out of six different European countries: the Netherlands, Italy, Germany, France, Spain and the facility began producing prototype components in the third quarter of 2021. Commercial start of production at the Tennessee location is expected to begin in the second quarter of 2022.United Kingdom.
| | |
| | |
ItemITEM 3. | Legal Proceedings LEGAL PROCEEDINGS |
Legal Proceedings Relating to our BusinessLEGAL PROCEEDINGS RELATING TO OUR BUSINESS
JSW Steel Litigation. On June 8, 2021, JSW Steel filed a complaint against Cleveland-Cliffs Inc., AK Steel Holding Corporation (now known as Cleveland-Cliffs Steel Holding Corporation), Nucor Corporation and U.S. Steel in the United States District Court for the Southern District of Texas. JSW Steel alleges that the defendants engaged in a group boycott against JSW Steel in violation of federal and Texas antitrust laws by refusing to sell semi-finished steel slabs to JSW Steel, beginning in 2018 and continuing through the present; civil conspiracy among the defendants; and tortious interference with JSW Steel’s contractual rights and business relations involving its vendors and customers. JSW Steel’s allegations involve the tariffs and quotas imposed on steel imports by the U.S. government under Section 232 beginning in March 2018, which JSW Steel alleges raised the price of imported slabs, and statements made to the U.S. government related to exemption requests submitted by JSW Steel in 2018 and 2021. JSW Steel further claims that this alleged anticompetitive conduct negatively impacted JSW Steel’s costs, production and revenues and prevented it from pursuing expansion plans at its Ohio and Texas facilities that would compete with the defendants. JSW Steel is seeking to hold the defendants jointly and severally liable for treble damages in an amount in excess of $500 million and other relief. We filed a MotionOn February 17, 2022, the district court granted the defendants' Motions to Dismiss in their entirety and dismissed all of JSW's claims with prejudice. On March 16, 2022, JSW filed a notice of appeal to the case during 2021,United States Court of Appeals for the Fifth Circuit, and discovery remains stayed untiloral arguments on the court decides our motion.appeal were held on February 6, 2023. We continue to believe the claims asserted against us are without merit, and we are vigorously defending against them.
Mesabi Metallics Adversary Proceeding. On September 7, 2017, Mesabi Metallics Company LLC (f/k/a Essar Steel Minnesota LLC) ("Mesabi Metallics") filed a complaint against Cleveland-Cliffs Inc. in the Essar Steel Minnesota
LLC and ESML Holdings Inc. bankruptcy proceeding that is pending in the United States Bankruptcy Court, District of Delaware. Mesabi Metallics alleges tortious interference with its contractual rights and business relations involving certain vendors, suppliers and contractors, violations of federal and Minnesota antitrust laws through monopolization, attempted monopolization and restraint of trade, violation of the automatic stay, and civil conspiracy with unnamed Doe defendants. Mesabi Metallics amended its complaint to add additional defendants, including, among others, our subsidiary, Cleveland-Cliffs Minnesota Land Development Company LLC ("Cliffs Minnesota Land"), and to add additional claims, including avoidance and recovery of unauthorized post-petition transfers of real estate interests, claims disallowance, civil contempt and declaratory relief. Mesabi Metallics seeks, among other things, unspecified damages and injunctive relief. Cliffs and Cliffs Minnesota Land filed counterclaims against Mesabi Metallics, Chippewa Capital Partners ("Chippewa"), and Thomas M. Clarke ("Clarke") for tortious interference and civil conspiracy, as well as additional claims against Chippewa and Clarke for aiding and abetting tortious interference, for which we seek, among other things, damages and injunctive relief. Our counterclaim against Clarke for libel was dismissed on jurisdictional grounds. The parties filed various dispositive motions on certain of the claims, including a motion for partial summary judgment to settle a dispute over real estate transactions between Cliffs Minnesota Land and Glacier Park Iron Ore Properties LLC ("GPIOP"). A ruling in favor of Cliffs, Cliffs Minnesota Land and GPIOP was issued on July 23, 2018, finding that Mesabi Metallics' leases had terminated and upholding Cliffs' and Cliffs Minnesota Land's purchase and lease of the contested real estate interests. Mesabi Metallics filed a Motion for Leave to File an Interlocutory Appeal, which was denied on September 10, 2019. Discovery is ongoing.has been completed, and we have filed for summary judgment on all claims that Mesabi Metallics has asserted against us. Mesabi Metallics, Chippewa and Clarke have also filed for summary judgment on various claims and issues in the case. We believe the claims asserted against us are without merit, and we intend to continue to vigorously defend against anyall remaining claims in the lawsuit.
Certain Legacy Legal Proceedings Relating to our Steel Operations. Certain of our acquired subsidiaries have been named as defendants, among many other named defendants, in numerous lawsuits filed since 1990 claiming injury allegedly resulting from exposure to asbestos. Similar lawsuits seeking monetary relief continue to be filed in various jurisdictions in the U.S., which cases are vigorously defended. Although predictions about the outcome of pending litigation is subject to uncertainties, based upon present knowledge, we believe it is unlikely that the resolution in the aggregate of these claims will have a materiallymaterial adverse effect on our consolidated results of operations, cash flows or financial condition.
Legal Proceedings Relating to Environmental MattersLEGAL PROCEEDINGS RELATING TO ENVIRONMENTAL MATTERS
SEC regulations require us to disclose certain information about administrative or judicial proceedings involving the environment and to which a governmental authority is a party if we reasonably believe that such proceedings may result in monetary sanctions above a stated threshold. Pursuant to SEC regulations, we use a threshold of $1 million for purposes of determining whether disclosure of any such proceedings is required. We believe that this threshold is reasonably designed to result in disclosure of any such proceedings that are material to our business or financial condition.
Information for this item relating to certain other environmental proceedings may be found under the heading Burns Harbor Water Issues Issues.in NOTE 20 - COMMITMENTS AND CONTINGENCIES In August 2019, ArcelorMittal Burns Harbor LLC (n/k/a Cleveland-Cliffs Burns Harbor LLC) suffered a loss of the blast furnace cooling water recycle system, which led to the discharge of cyanide and ammonia in excess of the Burns Harbor plant's NPDES permit limits. Since that time, the facility has taken numerous steps to prevent recurrence and maintain compliance with its NPDES permit. We engaged in settlement discussions with the U.S. Department of Justice, the EPA and the State of Indiana to resolve any alleged violations of environmental laws or regulations arising out of the August 2019 event. Later
stages of the settlement discussions included the Environmental Law and Policy Center (ELPC) and Hoosier Environmental Council (HEC), which had filed a lawsuit on December 20, 2019 in the U.S. District Court for the Northern District of Indiana alleging violations resulting from the August 2019 event and other Clean Water Act claims. On February 14, 2022, the United States and the State of Indiana filed a complaint and a proposed consent decree, and on April 21, 2022, the United States, with the consent of all of the parties, filed a motion seeking final approval of the consent decree from the court. The consent decree was approved by the court with an effective date of May 6, 2022. The consent decree requires specified enhancements to the mill's wastewater treatment systems and required us to pay a $3 million civil penalty, along with other terms and conditions. Other parties to the consent decree include the United States, the State of Indiana, ELPC and HEC. The ELPC/HEC civil litigation was dismissed with prejudice on May 12, 2022. In addition, ArcelorMittal Burns Harbor LLC was served with a subpoena on December 5, 2019, from the United States District Court for the Northern District of Indiana, relating to the August 2019 event. We responded to the subpoena requests, including follow-up requests, and we have been informed that the government has now closed its investigation. With the resolution of monetary sanctions and injunctive relief requirements under the consent decree, we do not believe that the costs to resolve any other third-party claims that arise out of the August 2019 event, including natural resource damages claims pending final resolution, are likely to have, individually or in the aggregate, a material adverse effect on our consolidated financial statements in Part II – Item 8. Financial Statements and Supplementary Data, which information is incorporated herein by reference.condition, results of operations or cash flows.
| | |
| | |
ItemITEM 4. | Mine Safety Disclosures MINE SAFETY DISCLOSURES |
We are committed to protecting the occupational health and well-being of each of our employees. Safety is one of our core values and we strive to ensure that safe production is the first priority for all employees. Our internal objective is to achieve zero injuries and incidents across the Company by focusing on proactively identifying needed prevention activities, establishing standards and evaluating performance to mitigate any potential loss to people, equipment, production and the environment. We have implemented intensive employee training that is geared toward maintaining a high level of awareness and knowledge of safety and health issues in the work environment through the development and coordination of requisite information, skills and attitudes. We believe that through these policies, we have developed an effective safety management system.
Under the Dodd-Frank Act, each operator of a coal or other mine is required to include certain mine safety results within its periodic reports filed with the SEC. As required by the reporting requirements included in §1503(a) of the Dodd-Frank Act and Item 104 of Regulation S-K, the requiredinformation concerning mine safety results regarding certain mining safety and health or other regulatory matters for each of our mine locations that are covered under the scope of the Dodd-Frank Act areis included in Exhibit 95 of Part IV – Item 15. Exhibits and Financial Statement Schedules of this Annual Report on Form 10-K.
5240 | CLF 2023 FORM 10-K
PART II
| | |
| | |
ItemITEM 5. | Market for Registrant's Common Equity, Related Stockholder Matters and Issuer Purchases of Equity Securities MARKET FOR REGISTRANT'S COMMON EQUITY, RELATED STOCKHOLDER MATTERS AND ISSUER PURCHASES OF EQUITY SECURITIES |
Stock Exchange InformationSTOCK EXCHANGE INFORMATION
Our common shares (ticker symbol CLF) are listed on the NYSE.NYSE (New York Stock Exchange).
HoldersHOLDERS
At February 10, 2022,8, 2024, we had 2,5322,526 shareholders of record.
Shareholder Return PerformanceSHAREHOLDER RETURN PERFORMANCE
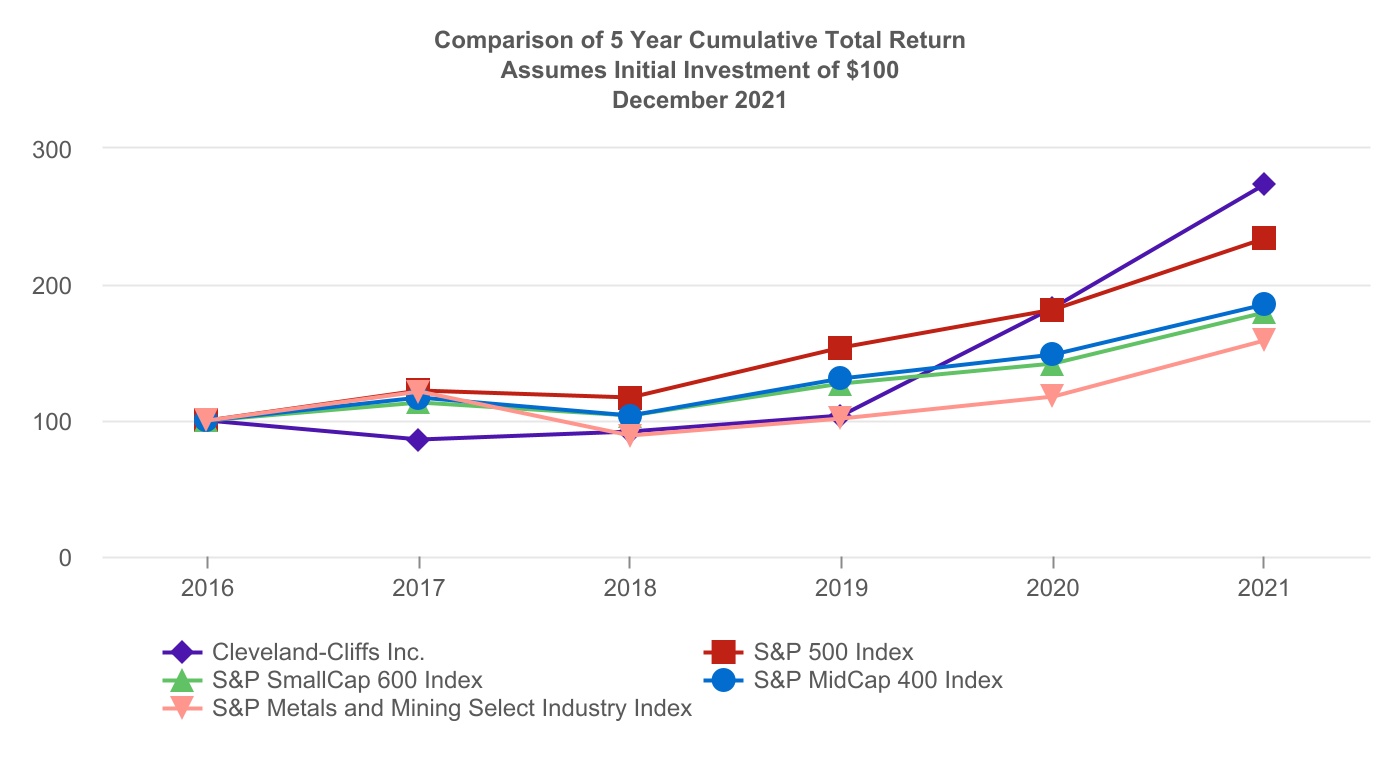
The following graph shows changes over the past five-year period in the value of $100 invested in: (1) Cliffs' common shares; (2) S&P 500 Index; (3) S&P SmallCap 600Metals and Mining Select Industry Index; and (4) S&P MidCap 400 Index; and (5) S&P Metals and Mining Select Industry Index. Due to the increased market capitalization of the Company, we were included within the S&P MidCap 400 Index and removed from the S&P SmallCap 600 Index during the year ended December 31, 2021. The values of each investment are based on price change plus reinvestment of all dividends reported to shareholders, based on monthly granularity.

| | 2016 | | 2017 | | 2018 | | 2019 | | 2020 | | 2021 |
| | | 2018 | | | | | 2018 | | 2019 | | 2020 | | 2021 | | 2022 | | 2023 |
| Cleveland-Cliffs Inc. | Cleveland-Cliffs Inc. | Return % | | — | | | (14.27) | | 6.66 | | 12.60 | | 77.46 | | 49.52 |
| Cum $ | | 100.00 | | 85.73 | | 91.44 | | 102.96 | | 182.71 | | 273.19 |
| Cumulative $ | | | Cumulative $ | | 100.00 | | 112.60 | | 199.82 | | 298.77 | | 221.09 | | 280.23 |
| S&P 500 Index | S&P 500 Index | Return % | | — | | | 21.80 | | (4.39) | | 31.48 | | 18.39 | | 28.68 |
| Cum $ | | 100.00 | | 121.80 | | 116.45 | | 153.11 | | 181.27 | | 233.25 |
| S&P SmallCap 600 Index | Return % | | — | | | 13.15 | | (8.52) | | 22.74 | | 11.24 | | 26.74 |
| Cum $ | | 100.00 | | 113.15 | | 103.51 | | 127.05 | | 141.33 | | 179.12 |
| Cumulative $ | | | Cumulative $ | | 100.00 | | 131.48 | | 155.66 | | 200.30 | | 163.99 | | 207.05 |
| S&P Metals and Mining Select Industry Index | |
| Cumulative $ | | | Cumulative $ | | 100.00 | | 114.70 | | 133.02 | | 179.50 | | 203.05 | | 246.73 |
| S&P MidCap 400 Index | S&P MidCap 400 Index | Return % | | — | | | 16.23 | | (11.10) | | 26.17 | | 13.65 | | 24.73 |
| Cum $ | | 100.00 | | | 116.23 | | 103.33 | | 130.37 | | 148.16 | | 184.80 |
| S&P Metals and Mining Select Industry Index | Return % | | — | | | 20.61 | | (26.76) | | 14.70 | | 15.97 | | 34.94 |
| Cum $ | | 100.00 | | 120.61 | | 88.33 | | 101.32 | | 117.50 | | 158.56 |
| Cumulative $ | | | Cumulative $ | | 100.00 | | | 126.17 | | 143.39 | | 178.85 | | 155.42 | | 180.89 |
5341 | CLF 2023 FORM 10-K
Issuer Purchases of Equity Securities
The following table presents information with respect to repurchases by the Company of our common shares during the periods indicated:
ISSUER PURCHASES OF EQUITY SECURITIES
| | | | | | | | | | | | | | | | | | | | | | | | | | |
| Period | | Total Number of Shares (or Units) Purchased1 | | Average Price Paid per Share
(or Unit) | | Total Number of Shares (or Units) Purchased as Part of Publicly Announced Plans or Programs | | Maximum Number (or Approximate Dollar Value) of Shares (or Units) that May Yet be Purchased Under the Plans or Programs2 |
| October 1 - 31, 2021 | | 534 | | | $ | 19.66 | | | — | | | $ | — | |
| November 1 - 30, 2021 | | — | | | — | | | — | | | — | |
| December 1 - 31, 2021 | | — | | | — | | | — | | | — | |
| Total | | 534 | | | $ | 19.66 | | | — | | | $ | — | |
| | | | | | | | |
1 All shares were delivered to us to satisfy tax withholding obligations due upon the vesting or payment of stock awards. |
2 On February 10, 2022, our Board of Directors authorized a program to repurchase our outstanding common shares in the open market or in privately negotiated transactions, which may include purchases pursuant to Rule 10b5-1 plans or accelerated share repurchases, up to a maximum of $1 billion. We are not obligated to make any purchases, and the program may be suspended or discontinued at any time. The share repurchase program does not have a specific expiration date. |
| | | | | | | | | | | | | | | | | | | | | | | | | | |
| Period | | Total Number of Shares (or Units) Purchased1 | | Average Price Paid per Share
(or Unit) | | Total Number of Shares (or Units) Purchased as Part of Publicly Announced Plans or Programs | | Maximum Number (or Approximate Dollar Value) of Shares (or Units) that May Yet be Purchased Under the Plans or Programs2 |
| October 1 - 31, 2023 | | 7,796 | | | $ | 18.33 | | | — | | | $ | 608,285,509 | |
| November 1 - 30, 2023 | | 3,165 | | | 16.79 | | | — | | | 608,285,509 | |
| December 1 - 31, 2023 | | 601 | | | 17.30 | | | — | | | 608,285,509 | |
| Total | | 11,562 | | | $ | 17.85 | | | — | | | |
| | | | | | | | |
1 All shares were delivered to us to satisfy tax withholding obligations due upon the vesting or payment of stock awards. |
2 On February 10, 2022, our Board of Directors authorized a program to repurchase our outstanding common shares in the open market or in privately negotiated transactions, which may include purchases pursuant to Rule 10b5-1 plans or accelerated share repurchases, up to a maximum of $1 billion. We are not obligated to make any purchases, and the program may be suspended or discontinued at any time. The share repurchase program does not have a specific expiration date. |
| | |
| | |
ItemITEM 6. | [Reserved] [Reserved] |
| | |
| | |
ItemITEM 7. | Management's Discussion and Analysis of Financial Condition and Results of Operations MANAGEMENT'S DISCUSSION AND ANALYSIS OF FINANCIAL CONDITION AND RESULTS OF OPERATIONS |
Management's Discussion and Analysis of Financial Condition and Results of Operations is designed to provide a reader of our financial statements with a narrative from the perspective of management on our financial condition, results of operations, liquidity and other factors that may affect our future results. The following discussion should be read in conjunction with the consolidated financial statements and related notes that appear in Part II – Item 8. Financial Statements and Supplementary Data of this Annual Report on Form 10-K.
Overview
OVERVIEW
Throughout 2023, we continued to position the Company for long-term success as wellwe had record steel shipments, with particular strength in automotive; significantly reduced our operational costs with greater emphasis on throughput and productivity; dramatically improved our balance sheet; reached our stated net debt target of $3.0 billion; returned substantial capital to shareholders through share repurchases; and continued to focus on our goal of reducing GHG emissions, all with an eye toward the future and in line with our consistent strategic objectives. As of December 31, 2023, we have a record level of liquidity of $4.5 billion. Our strong balance sheet and operational achievements further strengthens our position as an American leader in the immediate benefitssteel industry as we continue to create value for all stakeholders of the transformational acquisitions we completed in 2020 were on full display during the year as we achieved these phenomenal results. Our commercial actions, along with a healthy demand environment for steel, drove substantially higher selling prices for the majorityCompany.
2023 HIGHLIGHTS
•Net income of products we sell, and we adjusted production to meet the needs of our order book. Combined with this, we believe we were able to manage costs better than our peers due to our vertically integrated footprint, which reduces the impact of material price inflation on our major cost inputs. As a result, we produced record revenues, record net income, record $450 million
•Adjusted EBITDA of $1.9 billion
•Revenues of $22 billion and third consecutive year of revenues over $20 billion
•Significantly reduced unit costs year-over-year
•Record steel shipments of 16.4 million net tons
•Record automotive shipments
•Reduced total outstanding long-term debt by $1.1 billion to $3.2 billion
•Net debt of $2.9 billion below stated target of $3.0 billion and lowest net debt level since becoming a steel company
•Reached record operating cash flow in 2021.
The HRC index averaged $1,573 per net ton for 2021, a record year that was also 174% higher than 2020. The record prices for steel products in 2021 resulted from both supply and demand factors, each driven by a rapid recovery from the impactsliquidity of the COVID-19 pandemic. Stay-at-home mandates and fiscal stimulus drove strong demand for consumer goods, such as HVAC products and appliances. Demand from machinery and equipment producers has also been robust. The demand for light vehicles was also strong; however, automotive supply chain difficulties have limited the demand for steel from automotive manufacturers. On the supply side, spot steel availability was limited throughout the year.
We expect healthy demand to continue into 2022 as we start to see the impacts of the Infrastructure and Jobs Act of 2021, growing environmentally-focused capital projects, healthy economic conditions and pent-up automotive demand, as supply chain issues begin to show signs of waning. With strong demand and steel prices in the U.S. reaching all-time highs in 2021, we were well positioned to negotiate our fixed price contracts, which represent approximately 45% of our volumes, at favorable levels, which should enable us to deliver strong financial results and free cash flow in 2022, even if HRC pricing falls considerably.$4.5 billion
5442 | CLF 2023 FORM 10-K
As•Returned $152 million in capital to shareholders through share repurchase program
•Net pension and OPEB liabilities of $586 million are lowest since becoming a resultsteel company
•Successfully implemented Cliffs H surcharge for steel melted with HBI
•Continued focus on our goal of our healthy free cash flow in 2021, we were able to complete several strategic and financial transactions, including the FPT Acquisition. FPT is onereducing GHG emissions
•Secured award of the largest processors of prime scrap in the country, representing approximately 15% of the entire U.S. merchant market. We believe this acquisition is a complementary addition to our footprint, as prime scrap demandNashwauk state mineral leases, which is expected to grow with new flat-rolled EAF capacity set to come online over the next five years and as the worldwide focus on decarbonization continues. We expect to be able to leverage our long-standing flat-rolled automotive and other customer relationships into recycling partnerships to further grow our prime scrap presence. Additionally, FPT allows us to optimize productivity at our existing EAFs and BOFs and furthers our commitment to environmentally-friendly, low-carbon intensity steelmaking with a cleaner materials mix.
Another use of our robust cash flow was the complete redemption of our Series B Participating Redeemable Preferred Stock for $1,343 million during the third quarter of 2021. This transaction reduced our diluted share count by approximately 10%, providing a meaningful return to our shareholders. During February 2021, we executed a series of favorable debt and equity capital market transactions in an effort to extend our average debt maturity profile and increase our ratio of unsecured debt to secured debt. We also completedprovide additional financing transactions, including the redemption of all $396 million aggregate principal amount of our 5.750% 2025 Senior Notes in June 2021, and provided notice of our election to redeem all remaining $294 million aggregate principal amount of our 1.500% 2025 Convertible Senior Notes in December 2021, which was completed in January 2022.
In 2021, we reached full run-rate nameplate annual capacity at our state-of-the-art direct reduction plant in Toledo, Ohio. This facility produces high-quality HBI and is the first of its kind in the Great Lakes region. While we originally expected to be a merchant seller of HBI, following the 2020 Acquisitions, we have instead maximized the value of our HBI by utilizing it primarily in our blast furnaces, which allows us to improve costs and productivity while reducing our coke rates and reducing our carbonlong-term iron ore reservesemissions. As a result of our internal usage of HBI, coupled with our ongoing evaluation of coke use strategies, we idled our coke facility at Middletown Works in 2021 and we intend to permanently idle our Mountain State Carbon coke plant in 2022.
Along with these notable accomplishments, we have been able to continue successfully navigating through the COVID-19 pandemic while preserving the health and safety of both our workforce and our Company for the long term. The health and safety of our employees has always been our top priority. In an effort to best protect our workforce and our Company, we launched a vaccine incentive program in July 2021 that was developed in partnership with our labor unions. Throughout the 45 days the program was in place, the vaccination rate more than doubled, and we achieved a total vaccination rate of over 75% throughout our workforce. The initiative resulted in a payout of $45 million in total cash incentives to our vaccinated workforce. The successful vaccination program allowed us to operate efficiently and safely throughout the remainder of 2021 and into 2022.
We also continued our best practices from both a safety and environmental standpoint. During 2021,2023, our safety TRIRTotal Reportable Incident Rate (including contractors) was 1.371.22 per 200,000 hours worked. Throughout 2021,2023, we made continued progress towardsto focus on our goal of reducing GHG emissions with our increased usageoptimal utilization of HBI and scrap inthroughout our facilities, as well as more efficient power generation through recycling of gases at certain facilities.off-gases. We arehave also partneringcontinued our partnership with the U.S. Department of EnergyDOE as part of the Better Climate Challenge initiative, which was established in December 2021. We continue to pursue opportunities such as we aim to build oncarbon capture and the use of hydrogen within our GHG emission reduction progress.
Recent Developments
Acquisition of FPT
On November 18, 2021, we completed the acquisition of FPT, a leading prime ferrous scrap processor infacilities. With the U.S. These operations consistgovernment awarding funding for the development of 22 scrap processingregional hydrogen hubs throughout the country, including near our largest facilities, primarily inwe expect to dramatically increase our use of hydrogen gas as both a reducing agent and energy source as the Midwest regionclean hydrogen production facilities come online. Additionally, we have continued forming partnerships to develop renewable and clean energy sources - such as wind, solar and hydrogen - which will benefit our own environmental footprint while combating the global impacts of the U.S. Refer to NOTE 3 - ACQUISITIONS for additional information.climate change.
Financing TransactionsFINANCIAL SUMMARY
On December 1, 2021, we issued a notice of redemption for all $294 million in aggregate principal amount outstanding of the 1.500% 2025 Convertible Senior Notes. The 1.500% 2025 Convertible Senior Notes were redeemed on January 18, 2022, through a combination settlement, with the aggregate principal amount of $294 million paid in cash, and 24 million common shares delivered to noteholders, with a fair value of $499 million in settlement of the premium due per the terms of the indenture, plus cash in respect of the accrued and unpaid interest of the 1.500% 2025 Convertible Senior Notes to, but not including, the redemption date per the terms of the indenture.
On December 17, 2021, we entered into the Third ABL Amendment. The Third ABL Amendment modified our ABL Facility to, among other things, increase the amount of tranche A revolver commitments available thereunder by an additional $1 billion and exchange $150 million of tranche B revolver commitments available thereunder for tranche
A revolver commitments. After giving effect to the Third ABL Amendment, the aggregate principal amount of tranche A revolver commitments under our ABL Facility is $4.5 billion and there are no longer any tranche B revolver commitments. This action increased our liquidity by $1.0 billion. The increasefollowing is a resultsummary of a larger projected borrowing base driven by more favorable market conditions.our consolidated results for the years ended December 31, 2023, 2022 and 2021 (in millions, except for diluted EPS):
Share Repurchase Program | | | | | | | | | | | | | | | | | | | | |
| Total Revenue | | Net Income | | Adjusted EBITDA | | Diluted EPS |
On February 10, 2022, our Board of Directors authorized a program to repurchase our outstanding common shares in the open market or in privately negotiated transactions, which may include purchases pursuant to Rule 10B5-1 plans or accelerated share repurchases, up to a maximum of $1 billion. We are not obligated to make any purchases and the program may be suspended or discontinued at any time. The share repurchase program does not have a specific expiration date.
Results of Operations
Overview
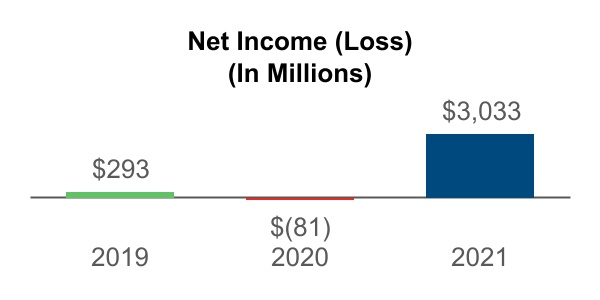
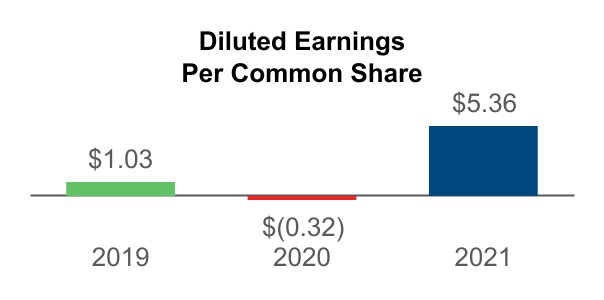
Our total revenues, net income (loss), diluted EPS and Adjusted EBITDA were as follows:
See "— Results of Operations — Adjusted EBITDA"Non-GAAP Financial Measures" below for a reconciliation of our Net Income (loss)income to Adjusted EBITDA.
ECONOMIC OVERVIEW
STEEL MARKET OVERVIEW
Steel market conditions in 2023 were marked by notable volatility, driven by both improved light vehicle production but also inconsistent service center buying behavior. The resultsprice for 2021 includedomestic HRC, the FPT operations subsequentmost significant index impacting our revenues and profitability, averaged $906 per net ton for 2023, which was 10% lower than 2022. Demand for steel from automotive manufacturers improved in 2023 as supply chain issues continued to ease and light vehicle sales increased. North American light vehicle production of 15.6 million units in 2023 was the highest since 2019. Demand for steel from service centers was adversely impacted at certain points of the year due to recessionary fears and the anticipation of, and ultimate occurrence of, the UAW strike at certain domestic automotive producers. During 2023, service center inventories were as low as 1.6 months of inventory on hand, significantly lower than the prior ten-year average of 2.2 months of inventory on hand. Low inventory levels generated significant demand for steel toward the end of 2023 as the UAW strike concluded and service centers needed to meet the continued healthy demand from their end-use customers. Additionally, steel imports remained unattractive for the majority of 2023 due to low pricing spreads between the U.S. and other regions. Looking forward, we expect domestic steel demand to remain healthy as automotive production continues to improve, service centers restock inventory and incremental steel demand stimulated by government legislation is realized.
The Infrastructure and Jobs Act, the CHIPS Act and Inflation Reduction Act should continue to provide meaningful support for overall domestic steel demand in the coming years. Our extensive portfolio of products should result in increased steel demand from some of our end markets. The Infrastructure and Jobs Act was signed into law in November 18, 2021 and full-year resultsincludes approximately $550 billion of authorized spending for allnew investments and programs. This legislation provides direct spending support for roads, bridges and other operations. The results for 2020 include AK Steel operations subsequent to March 13, 2020, ArcelorMittal USA operations subsequent to December 9, 2020, and our results from operations previously reported as part of our historical Mining and Pelletizing segment.
Revenues
During the year ended December 31, 2021, our consolidated Revenues increased by $15,090 million, compared to 2020. The increase was primarily dueinfrastructure projects, including upgrades to the additiondomestic power grid and building out a national network of 12.1 million net tons of steel shipmentsEV chargers. We expect to continue to benefit from our Steelmaking segment resulting from the 2020 Acquisitions, along with an increasethese steel-intensive projects in the averagecoming years as they will consume our hot-rolled, plate, electrical, rail and other steel product selling priceproducts. The CHIPS Act promotes semiconductor manufacturing in the U.S., which should help support non-residential construction as well as machinery and equipment. Additionally, the on-shoring of $240 per net ton.manufacturing in the U.S. should reduce risk of supply chain issues in the future. The Inflation Reduction Act provides a tax credit for consumers who buy new EVs, which further incentivizes consumers to purchase vehicles in an environment where pent-up
5643 | CLF 2023 FORM 10-K
Revenues by Product Line
demand is still very strong from a low unemployment rate, recent supply chain issues and lower than historical dealer inventory levels. The following represents our consolidated Revenues by product lineInflation Reduction Act also provides incentives for the use of domestic steel for investments in clean energy projects, including wind and solar projects, which consume a substantial amount of steel. We expect to benefit from the spending related to this legislation for years ended:to come.
The change in product mix for 2021, compared to 2020, is due primarily to the inclusion of full-period results for the 2020 Acquisitions. The results for 2020 include AK Steel operations subsequent to March 13, 2020, ArcelorMittal USA operations subsequent to December 9, 2020, and our results from operations previously reported as part of our historical Mining and Pelletizing segment.
Revenues by Market
The following table represents our consolidated Revenues and percentage of revenues attributable to each of the markets we supply:
| | | | | | | | | | | | | | | | | | | | | | | |
| (In Millions) |
| Year Ended December 31, |
| 2021 | | 2020 |
| Revenue | | % | | Revenue | | % |
| Automotive | $ | 5,152 | | | 25 | % | | $ | 2,391 | | | 45 | % |
| Infrastructure and Manufacturing | 5,427 | | | 27 | % | | 818 | | | 15 | % |
| Distributors and Converters | 7,741 | | | 38 | % | | 722 | | | 13 | % |
| Steel producers | 2,124 | | | 10 | % | | 1,423 | | | 27 | % |
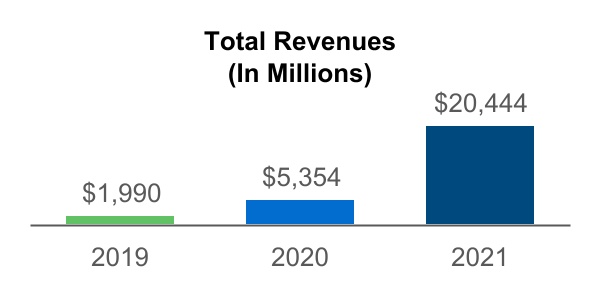
| Total revenues | $ | 20,444 | | | | | $ | 5,354 | | | |
The change in percentages of net revenues to each market in 2021 compared to 2020 was driven primarily by the AM USA Transaction, which increased overall sales to automotive customers, but reduced the total percentage exposure, increased exposure to infrastructure and manufacturing and distributors and converters customers, and drove more in-house iron ore sales, which reduced the percentage of sales to steel producers.
Automotive MarketOTHER KEY DRIVERS
The largest end usermarket for our steel products is the automotive industry in North America, which makes light vehicle production a key driver of demand. During 2021,2023, North American light vehicle production was approximately 13.015.6 million units, the same as the prior year. Production the past two years has been down approximately 3.0up from 14.3 million units compared to the prior ten-year average, primarily due to the global semiconductor shortage, as well as other material shortages and supply chain disruptions resulting from the COVID-19 pandemic. This has caused several outages amongst light vehicle manufacturers despite strong consumer demand. In light of these production outages, we have been able to redirect certain volumes originally intended for this end market to the spot market, where demand has been strong and pricing has reached all-time highs. The percentage of sales to the automotive market should increase in 2022, as fixed price contract prices increase and volumes expand as the material shortage issues ease.
highest level since 2019. During 2021,2023, light vehicle sales in the U.S. were 15.1saw an average seasonally adjusted annualized rate of 15.5 million units sold, representing a 3%13% increase over the prior year. These improved sales, combined with continued production difficulties, broughtcompared to 2022. North American light vehicle inventoriesproduction in 2024 is estimated to exceed 2023 units, indicating continued strength from the automotive industry. Additionally, the average age of light vehicles on the road in the U.S. reached an all-time lowhigh during 2023, surpassing the previous record set in 2022, which should support demand as older vehicles need to be replaced. As a leading supplier of 22 days' supply during the third quarter of 2021.
Infrastructure and Manufacturing
We sell a variety of our steel products, including plate, carbon, stainless, electrical, tinplate and rail, to the infrastructure and manufacturing market. This market includes sales to manufacturers of HVAC, appliances, power transmission and distribution transformers, storage tanks, ships and railcars, wind towers, machinery parts, heavy equipment, military armor, food preservation, and railway lines. Domestic construction activity and the replacement of aging infrastructure directly affects sales of steel to this market. Residential construction spending surged in 2021 due to overwhelming demand for new houses. Nonresidential construction spending was slightly down in 2021; however, the sector saw a surge in spending in the second half of the year that will likely continue into 2022 with the passing of the Infrastructure and Jobs Act of 2021. The Infrastructure and Jobs Act of 2021 is also expected to increase demand for steel products related to renewable energy as well as the modernization of the U.S. electrical grid. Our plate products can be used in windmills, which we estimate contain 130 metric tons of steel per megawatt of electrical generating capacity. Additionally, we estimate solar panels consume 40 metric tons of steel per megawatt of electrical generating capacity. We also expect to see an increase in charging stations for EVs, which we will benefit from as we are the sole producer of electricalautomotive-grade steel in the U.S., we expect to benefit from increased vehicle production over the coming years.
Distributors and Converters
Virtually all ofSince 2021, the grades of steel we produce are sold to the steel distributors and converters market. This market generally represents downstream steel service centers, which source various types of steel from us and fabricate it according to their customers' needs, which also includes automotive customers. Our steel is typically sold to this market onprice for busheling scrap, a spot basis or under short-term contracts linked to steel pricing indices. Demand and pricingnecessary input for this market can be highly dependent on a variety of factors outside our control, including global and domestic commodityflat-rolled steel production in EAFs in the U.S., has continued to average well above the prior annual ten-year average of approximately $390 per long ton. The busheling price averaged $488 per long ton during 2023. We expect the supply of busheling scrap to further tighten due to decreasing prime scrap generation from original equipment manufacturers and the growth of EAF capacity in the relative healthU.S., reduced metallics import availability, and a push for expanded scrap use globally. As we are fully integrated and have primarily a blast furnace footprint, increased prices for busheling scrap in the U.S. bolster our competitive advantage, as we source the majority of countries’ economiesour iron feedstock from our stable-cost mining and whether they are consuming or exporting excess steel production,pelletizing operations in Minnesota and Michigan.
As for iron ore, the provisions of international trade agreements and fluctuationsPlatts 62% price averaged $120 per metric ton in international currencies and, therefore, are subject to market changes in steel prices.
The price for domestic HRC,2023, which is an important attribute in the profitability of this end market, averaged $1,573 per net ton for the year ended December 31, 2021, 174%24% higher than the prior year. The record prices for steel products in 2021 resulted from both supply and demand factors, each driven by a rapid recovery since the onset of the COVID-19 pandemic in 2020.
Steel Producers Market
The steel producers market represents third-party sales to other steel producers, including those who operate blast furnaces and EAFs. It includes sales of raw materials and semi-finished and finished goods, including iron ore pellets, coal, coke, HBI, scrap and steel products.
The increase in revenues from the steel producers market for 2021, as compared to 2020, is primarily due to the inclusion of full-period results for the AK Steel and ArcelorMittal USA operations. This was partially offset by a decrease in iron ore product revenues during 2021, as compared to 2020, primarily as a result of the 2020 Acquisitions, as our iron ore pellet production is now predominately consumed internally and the respective intercompany revenue is eliminated in consolidation.
The largest component of sales to this market during the year ended December 31, 2021 was third-party slab sales, which are primarily made under a long-term supply agreement that was initiated in connection with the closing of the AM USA Transaction. Additionally, while it has fallen from peak 2021 levels in recent months, the price of iron ore has also risen dramatically over the past year, which, along with strong demand, has been an important factor in rising steel prices globally. The Platts 62% Price averaged $159 per metric ton during 2021, a 46% increase compared to the prior year.annual ten-year average. While higher iron ore prices play a role in increased steel prices, we also directly benefit from higher iron ore prices for the portion of iron ore pellets we sell to third parties.
Operating CostsOTHER FACTORS
CostOn September 14, 2023, the UAW announced a simultaneous labor strike against three domestic automotive manufacturers, as each of goods soldthe individual companies were unable to come to terms on a new labor agreement. The strike originally impacted one assembly plant at each company and was further expanded to additional facilities, including certain parts-distribution centers for each company. Steel demand remained strong from the automotive industry as the strike was limited to certain facilities, allowing the automotive manufacturers to continue production at other facilities within their footprint. On October 30, 2023, the UAW strike concluded after the UAW reached tentative labor deals with each of the three domestic automotive manufacturers. The conclusion of the strike led to increased demand in the fourth quarter of 2023 from automotive customers as well as service centers who had significantly reduced their inventory levels in anticipation of a broader strike.
In January 2023, we announced that we partnered with the USW and filed antidumping and countervailing duty petitions against eight countries related to unfairly traded tin and chromium coated sheet steel products. Tin mill products are used primarily for packaging applications, particularly canned food. We produce tin mill products at our Weirton, West Virginia operating facility and sell approximately 300,000 net tons per year, representing approximately two percent of total Company steel sales volumes. The U.S. Department of Commerce determined that imports of tin mill products from Canada, China, Germany and South Korea are being unfairly priced and dumped into the United States and that imports from China are being unfairly subsidized. On January 5, 2024, the U.S. Department of Commerce announced its final countervailing and antidumping determination of tin mill products. The U.S. Department of Commerce imposed countervailing subsidy rates on China ranging from 331.88% to 649.98%, based on the exporter. Final antidumping duty rates on tin and chromium-coated sheet steel products were imposed on Canada, China, Germany and South Korea ranging from 2.69% to 122.52%. However, on February 6, 2024, the U.S. International Trade Commission terminated the investigation on South Korea and reached negative determinations in the investigations on Canada, China and Germany. As a result, countervailing duties and antidumping duties will not be imposed on imports of tin and chromium-coated steel sheet products from these four countries.
During 2023, we significantly reduced costs compared to the prior year as we had higher production volume, normalized repair and maintenance spending, and inflationary pressures on input and energy costs eased. We expect to benefit further from reduced costs in 2024 as we have worked through higher cost inventory, production volumes should remain similar, and reductions in coal and alloy costs should mitigate any cost increases.
STEELMAKING RESULTS
COMPARISON OF 2023 TO 2022
The following is a summary of the Steelmaking segment operating results for the years ended December 31, 2023 and 2022 (dollars in millions, except for average selling price and shipments in thousands of net tons):
| | | | | | | | | | | | | | | | | | | | |
| Total Revenue | | Gross Margin | | Adjusted EBITDA | | Steel Shipments (nt) |
| | | | | | | | | | | | | | | | | | | | | | | | | | | | | | | | |
| 2022 | 2023 | | 2022 | 2023 | | 2022 | 2023 | | 2022 | 2023 |
| | | | | | |
| STEEL PRODUCT REVENUE: | | GROSS MARGIN %: | | ADJUSTED EBITDA %: | | AVERAGE SELLING PRICE PER TON OF STEEL PRODUCTS: |
| $20,054 | $19,237 | | 11% | 6% | | 14% | 9% | | $1,360 | $1,171 |
REVENUE
The following tables represent our steel shipments by product and total revenues by market:
| | | | | | | | | | | | | | | | | | | |
| Year Ended December 31, | | |
| (In thousands of net tons) | 2023 | | 2022 | | % Change |
| Steel shipments by product: | | | | | | | |
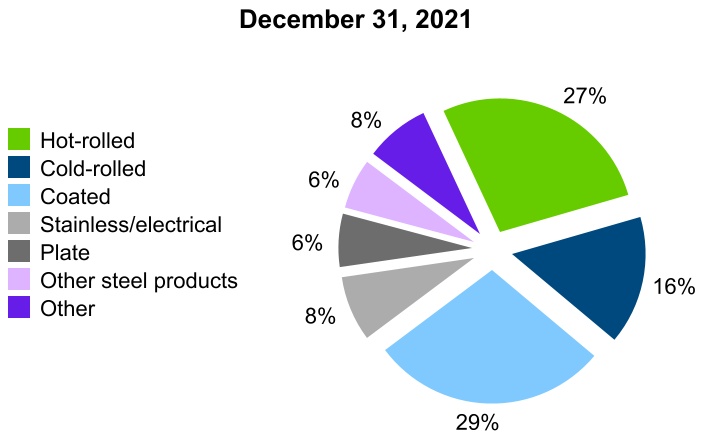
| Hot-rolled steel | 5,899 | | | | 4,326 | | | | 36 | % |
| Cold-rolled steel | 2,389 | | | | 2,286 | | | | 5 | % |
| Coated steel | 4,791 | | | | 4,730 | | | | 1 | % |
| Stainless and electrical steel | 682 | | | | 763 | | | | (11) | % |
| Plate | 899 | | | | 880 | | | | 2 | % |
| Slab and other steel products | 1,772 | | | | 1,766 | | | | — | % |
| Total steel shipments by product | 16,432 | | | | 14,751 | | | | 11 | % |
| | | | | | | |
| Year Ended December 31, | | |
| (In millions) | 2023 | | 2022 | | % Change |
| Steelmaking revenues by market: | | | | | | | |
| Direct automotive | $ | 7,440 | | | | $ | 6,661 | | | | 12 | % |
| Infrastructure and manufacturing | 5,612 | | | | 5,869 | | | | (4) | % |
| Distributors and converters | 5,330 | | | | 6,388 | | | | (17) | % |
| Steel producers | 2,949 | | | | 3,465 | | | | (15) | % |
| Total Steelmaking revenues by market | $ | 21,331 | | | | $ | 22,383 | | | | (5) | % |
CostRevenues decreased by 5% during the year ended December 31, 2023, as compared to the prior year, primarily due to:
•A decrease in revenues from the distributors and converters market of goods sold $1,058 million, or 17%, predominantly due to the average HRC price declining, which was partially offset by increased hot-rolled steel shipments; and
•A decrease in revenues from the steel producers market of $516 million, or 15%, which was primarily due to the decrease in pricing indices for slabs and busheling scrap.
•These decreases were partially offset by an increase in revenues from the direct automotive market of $779 million, or 12%, predominantly due to increases in selling prices as a result of favorable renewals of annual fixed price contracts and an increase in shipments.
GROSS MARGIN
Gross margin decreased by $1,117 million, or 45%, during the year ended December 31, 2023, as compared to the prior year, primarily due to:
•A decrease in selling prices (approximately $2.4 billion impact) predominantly due to lower spot prices, which was partially offset by favorable renewals of annual sales contracts.
•This decrease was partially offset by a decrease in costs of production (approximately $700 million impact) driven by lower raw materials and utility costs, including natural gas, coal, coke, alloys and scrap, coupled with decreased maintenance costs; and
•An increase in sales volumes (approximately $500 million impact).
ADJUSTED EBITDA
Adjusted EBITDA from our Steelmaking segment for the year ended December 31, 2023, decreased by $1,216 million, as compared to 2022, primarily due to the decreased gross margin from our operations. Additionally, our Steelmaking Adjusted EBITDA included $549 million and $439 million of Selling, general and administrative expenses for the years ended December 31, 2023 and 2022, respectively.
CONSOLIDATED RESULTS
COMPARISON OF 2023 TO 2022
REVENUES AND GROSS MARGIN
During the year ended December 31, 2023, our consolidated Revenues decreased by $993 million, compared to 2022. The decrease was primarily due to the decrease in the average steel product selling price of $189 per net ton, partially offset by the increase of 1.7 million net tons of steel shipments from our Steelmaking segment.
During the year ended December 31, 2023, our consolidated gross margin decreased by $1,127 million, as compared to 2022. See "— Steelmaking Results" above for further detail on our operating results.
SELLING, GENERAL AND ADMINISTRATIVE EXPENSES
Selling, general and administrative expensesincreased by $10,808$112 million during the year ended December 31, 2023, as compared to 2022. The increase primarily relates to employment-related costs, including higher incentive compensation, and external service costs.
GOODWILL IMPAIRMENT
Our 2023 annual goodwill impairment analysis resulted in an impairment charge of $125 million for goodwill related to our Tooling and Stamping reporting unit. Refer to "— Market Risks" below for further detail.
MISCELLANEOUS – NET
Miscellaneous expense decreased by $110 million for the year ended December 31, 2021,2023, as compared to 2020, primarily due to the addition of 12.1 million net tons of steel shipments resulting from the 2020 Acquisitions.
Selling, general and administrative expenses
As a result of the 2020 Acquisitions, our Selling, general and administrative expenses increased by $178 million during the year ended December 31, 2021, as compared to 2020.
Acquisition-related costs
2022. The following table represents the components of Acquisition-related costs:
| | | | | | | | | | | | | | | | | |
| (In Millions) |
| Year Ended December 31, |
| 2021 | | 2020 | | 2019 |
| Severance | $ | (15) | | | $ | (38) | | | $ | (2) | |
| Third-party expenses | (5) | | | (52) | | | (7) | |
| Total | $ | (20) | | | $ | (90) | | | $ | (9) | |
Refer to NOTE 3 - ACQUISITIONS for further information on the acquisitions.
Miscellaneous – net
Miscellaneous – net increased by $20 milliondecrease in miscellaneous expense for the year ended December 31, 2021, as compared to 2020. The increase in miscellaneous expense2023, was primarily duerelated to the acquisition-related loss$63 million gain on equity method investment during 2021.
Other Income (Expense)
Interest expense, net
Interest expense, net increased by $99 million for the year ended December 31, 2021,sale of business, along with lower idle expenses as compared to the prior year. The increase during 2021Additionally, in 2022, we had a $29 million asset impairment, which was primarily duenot repeated in 2023. These decreases were partially offset by the higher expenses in 2023 related to borrowings on our ABL Facility,asset retirement obligations for our indefinitely idled and closed operations as a decrease in capitalized interest during 2021 due to the completionresult of our Toledo direct reduction plant in December 2020 and the full-year interest on the incremental debt that we incurred in connection with the AK Steel Merger.three-year detailed assessment.
Gain (loss) on extinguishment of debtLOSS ON EXTINGUISHMENT OF DEBT
The loss on extinguishment of debt of $88$75 million for the year ended December 31, 20212022 primarily resulted from the redemption of $396 million aggregate principal amount of 5.750% 2025 Senior Notes, $395 million aggregate principal amount of 4.875% 2024 Senior Secured Notes and $347 million aggregate principal amount of 9.875% 2025 Senior Secured Notes.
This compares to a gain on extinguishment of debt of $130 million for the year ended December 31, 2020 primarily related to the repurchase of $748all $607 million aggregate principal amount of our outstanding senior notes9.875% 2025 Senior Secured Notes in April 2022 and the redemption of various series using the net proceeds from the issuance of an additional $555all $294 million aggregate principal amount of our 9.875%outstanding 1.500% 2025 Convertible Senior Secured Notes in January 2022. The losses were partially offset by the net gain on April 24, 2020extinguishment for the repurchase of $417 million aggregate principal amount of our outstanding industrial revenue bonds and other sourcessenior notes of cash. Refer to NOTE 8 - DEBT AND CREDIT FACILITIES for further details.
Net periodic benefit credits (costs) other than service cost componentvarious series.
The increase of $156 million in INCOME TAXESNet periodic benefit credits (costs) other than service cost component primarily relates to the expected return on assets component. The higher return is primarily attributable to the full-year effect of additional pension and OPEB plan assets acquired in the 2020 Acquisitions. Refer to NOTE 10 - PENSIONS AND OTHER POSTRETIREMENT BENEFITS for further details.
Income Taxes
Our effective tax rate is affectedimpacted by state income tax expense and permanent items, primarily depletion. It also is affected by discrete items that may occur in any given period but are not consistent from period to period. The following represents a summary of our tax provision and corresponding effective rates:
| | (In Millions) |
| Year Ended December 31, |
| 2021 | | 2020 |
| Income tax benefit (expense) | $ | (773) | | | $ | 111 | |
| Year Ended December 31, | | | Year Ended December 31, |
| (In millions) | | (In millions) | 2023 | | 2022 |
| Income tax expense | |
| Effective tax rate | Effective tax rate | 20 | % | | 57 | % | Effective tax rate | 25 | % | | 23 | % |
5946 | CLF 2023 FORM 10-K
A reconciliation of our income tax attributable to continuing operations compared to the U.S. federal statutory rate is as follows:
| | Year Ended December 31, | |
| Year Ended December 31, | |
| Year Ended December 31, | |
| (In millions) | |
| (In millions) | |
| (In millions) | |
| Tax at U.S. statutory rate | |
| Tax at U.S. statutory rate | |
| Tax at U.S. statutory rate | |
| Increase (decrease) due to: | |
| Increase (decrease) due to: | |
| Increase (decrease) due to: | |
| Percentage depletion in excess of cost depletion | |
| Percentage depletion in excess of cost depletion | |
| Percentage depletion in excess of cost depletion | |
| | | (In Millions) |
| | Year Ended December 31, | |
| | 2021 | | 2020 | |
| Tax at U.S. statutory rate | | $ | 799 | | | 21 | % | | $ | (41) | | | 21 | % | |
| Increase (decrease) due to: | | |
| Percentage depletion in excess of cost depletion | | (99) | | | (3) | | | (42) | | | 22 | | |
| Non-taxable income related to noncontrolling interests | | (9) | | | — | | | (9) | | | 4 | | |
| Valuation allowance | |
| | Valuation allowance | |
| | | Valuation allowance | |
| Unrecognized tax benefits | |
| Unrecognized tax benefits | |
| Unrecognized tax benefits | |
| State taxes, net | State taxes, net | | 86 | | | 2 | | | (11) | | | 6 | | |
| State taxes, net | |
| State taxes, net | |
| Federal & state provision to return | |
| Federal & state provision to return | |
| Federal & state provision to return | |
| Income not subject to tax | |
| Income not subject to tax | |
| Income not subject to tax | |
| Goodwill impairment | |
| Goodwill impairment | |
| Goodwill impairment | |
| Other items, net | Other items, net | | (4) | | | — | | | (8) | | | 4 | | |
| Provision for income tax expense (benefit) and effective income tax rate including discrete items | | $ | 773 | | | 20 | % | | $ | (111) | | | 57 | % | |
| Other items, net | |
| Other items, net | |
| Provision for income tax expense and effective income tax rate including discrete items | |
| Provision for income tax expense and effective income tax rate including discrete items | |
| Provision for income tax expense and effective income tax rate including discrete items | |
The increasedecrease in income tax expense in 2021,2023, as compared to the prior year, is directlypredominantly related to the increasedecrease in the pre-tax book income year-over-year.
See NOTE 1211 - INCOME TAXES for further information.
AdjustedCASH FLOW, LIQUIDITY AND CAPITAL RESOURCES
OVERVIEW
Our capital allocation decision-making process is focused on preserving healthy liquidity levels while maintaining the strength of our balance sheet and creating financial flexibility to manage through the cyclical demand for our products and volatility in commodity prices. We are focused on maximizing the cash generation of our operations, reducing debt, returning capital to shareholders and aligning capital investments with our strategic priorities and the requirements of our business plan, including regulatory and permission-to-operate related projects.
The following table provides a summary of our cash flow:
| | | | | | | | | | | |
| Year Ended December 31, |
| (In millions) | 2023 | | 2022 |
| Cash flows provided by (used in): | | | |
| Operating activities | $ | 2,267 | | | $ | 2,423 | |
| Investing activities | (591) | | | (936) | |
| Financing activities | (1,504) | | | (1,509) | |
| Net increase (decrease) in cash and cash equivalents | $ | 172 | | | $ | (22) | |
| | | |
Free cash flow1 | $ | 1,621 | | | $ | 1,480 | |
| | | |
1See "— Non-GAAP Financial Measures" for a reconciliation of our free cash flow. |
The recent market environment has provided us opportunities to reduce our debt and return capital to shareholders with our free cash flow generation. We also continue to look at the composition of our debt, as we are interested in both extending our average maturity length and increasing our ratio of unsecured debt to secured debt, which can be accomplished with cash provided by operating activities. During 2023, we took action in alignment with our capital allocation priorities, as follows:
•We issued $750 million aggregate principal amount of our 6.750% 2030 Senior Notes. The net proceeds from the 6.750% 2030 Senior Notes issuance were used to repay a portion of the borrowings under our ABL Facility. The transaction increased our financial flexibility and liquidity, extended our debt maturity profile, and was effectively leverage and interest expense neutral.
•We entered into the Fourth ABL Amendment, which, among other things, extended the maturity date of our ABL Facility to June 9, 2028, and increased the overall commitments under our ABL Facility to $4.75 billion, which added $250 million of commitments.
•We used our free cash flow to reduce the total principal of our long-term debt by $1.1 billion.
•We returned capital to shareholders through our share repurchase program, repurchasing 10.4 million common shares at a cost of $152 million in the aggregate.
These actions with respect to our debt give us additional flexibility and liquidity, along with extending our average debt maturity date, which will better prepare us to navigate more easily through potentially volatile industry conditions in the future.
Additionally, we expect to have opportunities to continue to reduce our debt and return capital to shareholders with our free cash flow generation during 2024. As of December 31, 2023, we had $1.5 billion aggregate principal amount outstanding of callable notes and had $608 million remaining under the authorization of our share repurchase program.
CASH FLOWS
OPERATING ACTIVITIES
| | | | | | | | | | | | | | | | | |
| Year Ended December 31, | | |
| (In millions) | 2023 | | 2022 | | Variance |
| Net income | $ | 450 | | | $ | 1,376 | | | $ | (926) | |
| Non-cash adjustments to net income | 1,125 | | | 1,218 | | | (93) | |
| Income taxes | 122 | | | (22) | | | 144 | |
| Pension and OPEB payments and contributions | (94) | | | (204) | | | 110 | |
| Working capital (receivables, inventories, payables and other liabilities) | 664 | | | 55 | | | 609 | |
| Net cash provided by operating activities | $ | 2,267 | | | $ | 2,423 | | | $ | (156) | |
The variance was driven by:
•A $1,019 million decrease in net income after adjustments for non-cash items due to lower gross margins resulting from a decrease in selling prices for our steel products, which was partially offset by an increase in sales volumes and a decrease in costs of production. See "— Steelmaking Results" above for further detail on our operating results.
•A $110 million decrease in payments and contributions relating to our pension and OPEB plans. As part of the 2022 USW labor negotiations, we paused the contribution requirement to the Cleveland-Cliffs Steel LLC VEBA plan and introduced certain Medicare-eligible retirees to Medicare Advantage plans. Additionally, we negotiated favorable Medical Advantage Prescription Drug healthcare rates, which went into effect January 1, 2023.
•A $609 million increase in cash provided for working capital is primarily due to a decrease in inventories resulting from lower costs of steel driven by higher production, cost control and lower raw material costs.
INVESTING ACTIVITIES
| | | | | | | | | | | | | | | | | |
| Year Ended December 31, | | |
| (In millions) | 2023 | | 2022 | | Variance |
| Purchase of property, plant and equipment | $ | (646) | | | $ | (943) | | | $ | 297 | |
| Acquisitions, net of cash acquired | — | | | (31) | | | 31 | |
| Other | 55 | | | 38 | | | 17 | |
| Net cash used by investing activities | $ | (591) | | | $ | (936) | | | $ | 345 | |
The variance was driven by:
•A $297 million decrease in cash used for capital expenditures. We incurred higher capital expenditures in 2022 compared to 2023 primarily relating to sustaining capital expenditures, including the completion of a reline of blast furnace #5 at Cleveland Works during the third quarter of 2022. After elevated spend in 2022 to perform overdue maintenance work at the facilities acquired as part of the 2020 acquisitions, we resumed normalized levels of maintenance capital and operating expense in 2023. Included within cash used for capital expenditures was $25 million for the year ended December 31, 2023, compared to $12 million for the year ended December 31, 2022, related to our non-owned SunCoke Middletown VIE. Our capital expenditures primarily relate to sustaining capital spend, which includes infrastructure, mobile equipment, fixed equipment, product quality, environmental, and health and safety.
FINANCING ACTIVITIES
| | | | | | | | | | | | | | | | | |
| Year Ended December 31, | | |
| (In millions) | 2023 | | 2022 | | Variance |
| Net borrowings (repayments) of debt | $ | 750 | | | $ | (1,358) | | | $ | 2,108 | |
| Net borrowings (repayments) under credit facilities | (1,864) | | | 255 | | | (2,119) | |
| Repurchase of common shares | (152) | | | (240) | | | 88 | |
| Other | (238) | | | (166) | | | (72) | |
| Net cash used by financing activities | $ | (1,504) | | | $ | (1,509) | | | $ | 5 | |
LIQUIDITY AND CAPITAL RESOURCES
Our primary sources of liquidity are Cash and cash equivalents, cash generated from our operations, availability under the ABL Facility and access to capital markets. Cash and cash equivalents, which totaled $198 million as of December 31, 2023, include cash on hand and on deposit, as well as short-term securities held for the primary purpose of general liquidity. The combination of cash and availability under our ABL Facility gives us $4.5 billion in liquidity as of December 31, 2023. During 2023, we issued $750 million in aggregate principal amount of our 6.750% 2030 Senior Notes. We used the net proceeds from the offering to repay a portion of the borrowings under our ABL Facility, increasing our liquidity. Additionally, during 2023, we entered into the Fourth ABL Amendment to our ABL Facility, increasing the commitments thereunder by $250 million. We believe our liquidity and access to capital markets will be adequate to fund our cash requirements for the next 12 months and for the foreseeable future.
Our ABL Facility, which now matures in June 2028, has a maximum borrowing base of $4.75 billion. The available borrowing base is determined by applying customary advance rates to eligible accounts receivable, inventory and certain mobile equipment. Our ABL Facility includes a $555 million sublimit for the issuance of letters of credit and a $200 million sublimit for swingline loans. As of December 31, 2023, outstanding letters of credit totaled $56 million, which reduced availability. We issue standby letters of credit with certain financial institutions in order to support business obligations, including, but not limited to, workers' compensation, operating agreements, employee severance, environmental obligations and insurance. Our ABL Facility agreement contains various financial and other covenants. As of December 31, 2023, we were in compliance with all of our ABL Facility covenants.
We have the capability to issue additional unsecured notes and, subject to the limitations set forth in our existing senior notes indentures and ABL Facility, additional secured notes, if we elect to access the debt capital markets. However, our ability to issue additional notes could be limited by market conditions. We intend from time to time to seek to redeem or repurchase our outstanding senior notes with cash on hand, borrowings from existing credit sources or new debt financings and/or exchanges for debt or equity securities, in open market purchases, privately negotiated transactions or otherwise. Such redemptions or repurchases, if any, will depend on prevailing market conditions, our liquidity requirements, contractual restrictions and other factors, and the amounts involved may be material.
Refer to NOTE 8 - DEBT AND CREDIT FACILITIES for more information on our ABL Facility and debt.
MATERIAL CASH REQUIREMENTS
We have material cash requirements for known contractual obligations and commitments for the following:
CAPITAL EXPENDITURES
We anticipate total cash used for capital expenditures during the next 12 months to be between $675 and $725 million, which primarily consists of sustaining capital spend. After elevated spend in 2022 to perform overdue maintenance work at the facilities acquired as part of the 2020 acquisitions, we resumed normalized levels of maintenance capital and operating expense in 2023. The necessary resources that we have invested in our footprint are expected to keep our assets at an automotive-grade level of quality and reliability for years to come.
DEBT
We have principal long-term debt of $3,192 million with maturities starting in 2026. Refer to NOTE 8 - DEBT AND CREDIT FACILITIES for further information on our long-term debt and interest.
LEASE OBLIGATIONS
We have future minimum lease payments under noncancellable finance and operating leases. As of December 31, 2023, the current and long-term liabilities for our lease obligations were $90 million and $363 million, respectively. Refer to NOTE 12 - LEASE OBLIGATIONS for further information.
POST-RETIREMENT EMPLOYEE BENEFITS
We make both required and discretionary pension contributions. Required contributions are based on minimum funding requirements pursuant to ERISA regulations. We expect to make $122 million in pension contributions and payments in 2024. The cash requirements for our OPEB plans consist of VEBA contributions and direct payments from corporate assets primarily for medical and drug costs. We expect to make $66 million in OPEB contributions and payments from corporate assets in 2024. Contributions and payments in future years can significantly change and will depend on the actual returns on assets, discount rates, actual health care trend rates, government regulations, changes to employee benefits through labor agreements and other demographic factors. Refer to NOTE 9 - PENSIONS AND OTHER POSTRETIREMENT BENEFITS for further information.
ENVIRONMENTAL AND ASSET RETIREMENT OBLIGATIONS
Refer to NOTE 20 - COMMITMENTS AND CONTINGENCIES and NOTE 13 - ASSET RETIREMENT OBLIGATIONS for further information on our environmental and asset retirement obligations.
SHARE REPURCHASE PROGRAM
On February 10, 2022, our Board of Directors authorized a program to repurchase outstanding common shares in the open market or in privately negotiated transactions, which may include purchases pursuant to Rule 10b5-1 plans or accelerated share repurchases, up to a maximum of $1 billion. As of December 31, 2023, there was $608 million remaining under the authorization. We are not obligated to make any purchases and the program may be suspended or discontinued at any time. The share repurchase program does not have a specific expiration date.
OFF-BALANCE SHEET ARRANGEMENTS
In the normal course of business, we are a party to certain off-balance sheet arrangements that are not reflected on our Statements of Consolidated Financial Position. These arrangements include unconditional purchase obligations, surety bonds and letters of credit. Our unconditional purchase obligations include minimum "take or pay" commitments, such as minimum electric power demand charges, minimum coal, diesel and natural gas purchase commitments, minimum railroad transportation commitments and minimum port facility usage commitments.
We use surety bonds and letters of credit to provide financial assurance for certain obligations. As of December 31, 2023, we had $260 million of outstanding surety bonds and surety-backed letters of credit. The use of surety bonds and surety-backed letters of credit has no impact on our liquidity. Additionally, as of December 31, 2023, we had $56 million of outstanding letters of credit issued under our ABL Facility, which reduced our availability thereunder.
Refer to NOTE 20 - COMMITMENTS AND CONTINGENCIES for further information on our unconditional purchase obligations, surety bonds and surety-backed letters of credit.
NON-GAAP FINANCIAL MEASURES
The following provides a description and reconciliation of each of our non-GAAP financial measures to its most directly comparable respective GAAP measure. The presentation of these measures is not intended to be considered in isolation from, as a substitute for, or as superior to, the financial information prepared and presented in accordance with GAAP. The presentation of these measures may be different from non-GAAP financial measures used by other companies.
ADJUSTED EBITDA
We evaluate performance on an operating segment basis, as well as a consolidated basis, based on Adjusted EBITDA, which is a non-GAAP measure. This measure is used by management, investors, lenders and other external users of our financial statements to assess our operating performance and to compare operating performance to other companies in the steel industry. In addition, management believes Adjusted EBITDA is a useful measure to assess the earnings power of the business without the impact of capital structure and can be used to assess our ability to service debt and fund future capital expenditures in the business.
The following table provides a reconciliation of our Net income (loss) to Adjusted EBITDA:
| | (In Millions) |
| Year Ended December 31, |
| 2021 | | 2020 |
| Net income (loss) | $ | 3,033 | | | $ | (81) | |
| Year Ended December 31, | | | Year Ended December 31, |
| (In millions) | | (In millions) | 2023 | | 2022 | | 2021 |
| Net income | |
| Less: | Less: | |
| Interest expense, net | Interest expense, net | (337) | | | (238) | |
| Income tax benefit (expense) | (773) | | | 111 | |
| Interest expense, net | |
| Interest expense, net | |
| Income tax expense | |
| Depreciation, depletion and amortization | Depreciation, depletion and amortization | (897) | | | (308) | |
| Total EBITDA | Total EBITDA | $ | 5,040 | | | $ | 354 | |
| Less: | Less: | | | |
EBITDA from noncontrolling interests1 | EBITDA from noncontrolling interests1 | $ | 75 | | | $ | 56 | |
| Gain (loss) on extinguishment of debt | (88) | | | 130 | |
| Severance costs | (15) | | | (38) | |
| Acquisition-related costs excluding severance costs | (5) | | | (52) | |
| Acquisition-related loss on equity method investment | (31) | | | — | |
| Amortization of inventory step-up | (161) | | | (96) | |
| Impact of discontinued operations | 3 | | | 1 | |
EBITDA from noncontrolling interests1 | |
EBITDA from noncontrolling interests1 | |
| Acquisition-related expenses and adjustments | |
| Goodwill impairment | |
| Non-cash gain on sale of business | |
| Loss on extinguishment of debt | |
| Asset impairment | |
| Other, net | |
| Total Adjusted EBITDA | Total Adjusted EBITDA | $ | 5,262 | | | $ | 353 | |
| 1 EBITDA of noncontrolling interests includes the following: | 1 EBITDA of noncontrolling interests includes the following: | |
1 EBITDA of noncontrolling interests includes the following: | |
1 EBITDA of noncontrolling interests includes the following: | |
| Net income attributable to noncontrolling interests | |
| Net income attributable to noncontrolling interests | |
| Net income attributable to noncontrolling interests | Net income attributable to noncontrolling interests | $ | 45 | | | $ | 41 | |
| Depreciation, depletion and amortization | Depreciation, depletion and amortization | 30 | | | 15 | |
| EBITDA of noncontrolling interests | EBITDA of noncontrolling interests | $ | 75 | | | $ | 56 | |
The following table provides a summary of our Adjusted EBITDA by segment:
| | (In Millions) |
| Year Ended December 31, |
| 2021 | | 2020 |
| Year Ended December 31, | | | Year Ended December 31, |
| (In millions) | | (In millions) | 2023 | | 2022 |
| Adjusted EBITDA: | Adjusted EBITDA: | | | |
| Steelmaking | Steelmaking | $ | 5,422 | | | $ | 433 | |
| Steelmaking | |
| Steelmaking | |
| Other Businesses | Other Businesses | 9 | | | 47 | |
| Corporate and eliminations | (169) | | | (127) | |
| Eliminations | |
| Total Adjusted EBITDA | Total Adjusted EBITDA | $ | 5,262 | | | $ | 353 | |
Adjusted EBITDA from our Steelmaking segment forFREE CASH FLOW
Free cash flow is a non-GAAP measure defined as operating cash flow less purchase of property, plant and equipment. Management believes it is an important measure to assess the year ended December 31, 2021, increased by $4,989 million, as comparedcash generation available to 2020. The results were favorably impacted by the operating results of the acquired steelmaking operations. Our Steelmaking Adjusted EBITDA included $232 million of Selling, general and administrative expenses for the year ended December 31, 2021.
Adjusted EBITDA from Corporate and eliminations primarily relates to Selling, general and administrative expenses at our Corporate headquarters.
Steelmakingservice debt, strategic initiatives or other financing activities.
The following table provides a reconciliation of our operating cash flow to free cash flow:
| | | | | | | | | | | |
| Year Ended December 31, |
| (In millions) | 2023 | | 2022 |
| Net cash provided by operating activities | $ | 2,267 | | | $ | 2,423 | |
| Purchase of property, plant and equipment | (646) | | | (943) | |
| Free cash flow | $ | 1,621 | | | $ | 1,480 | |
NET DEBT
Net debt is a summarynon-GAAP financial measure that management uses in evaluating financial position. Net debt is defined as long-term debt less cash and cash equivalents. Management believes net debt is an important measure of our Steelmaking segment results included in our consolidated financial statements for the years ended December 31, 2021 and 2020. The results for 2021 include the FPT operations
subsequent to November 18, 2021 and full-year results for all other Steelmaking operations. The results for 2020 include the AK Steel operations subsequent to March 13, 2020, the ArcelorMittal USA operations subsequent to December 9, 2020, and our results from operations previously reported as part of our Mining and Pelletizing segment.
The following is a summary of the Steelmaking segment operating results:
| | | | | | | | | | | |
| Year Ended December 31, |
| 2021 | | 2020 |
| Operating Results - In Millions | | | |
| Revenues | $ | 19,901 | | | $ | 4,965 | |
| Cost of goods sold | $ | (15,379) | | | $ | (4,749) | |
| Selling Price - Per Ton | | | |
| Average net selling price per net ton of steel products | $ | 1,187 | | | $ | 947 | |
The following table represents our segment Revenues by product line:
| | | | | | | | | | | | | | | | | | | | | | | |
| (Dollars In Millions,
Sales Volumes In Thousands) |
| Year Ended December 31, |
| 2021 | | 2020 |
| Revenue | | Volume1 | | Revenue | | Volume1 |
| Hot-rolled steel | $ | 5,615 | | | 4,886 | | | $ | 386 | | | 633 | |
| Cold-rolled steel | 3,186 | | | 2,790 | | | 490 | | | 682 | |
| Coated steel | 5,864 | | | 5,056 | | | 1,747 | | | 1,911 | |
| Stainless and electrical steel | 1,622 | | | 674 | | | 868 | | | 416 | |
| Plate | 1,316 | | | 1,020 | | | 46 | | | 62 | |
| Other steel products | 1,247 | | | 1,460 | | | 46 | | | 79 | |
| | | | | | | |
| | | | | | | |
| Other | 1,051 | | | N/A | | 1,382 | | | N/A |
| Total | $ | 19,901 | | | | | $ | 4,965 | | | |
| | | | | | | |
1 All steel product volumes are stated in net tons. |
Operating Results
Steelmaking revenues for 2021 increased by $14,936 million as compared to 2020, primarilyposition due to the addition of sales following the 2020 Acquisitions. Results for the year ended December 31, 2021 were also impacted positively by the increase in the price for domestic HRC, which is the most significant index driving our revenues and profitability. The HRC index averaged $1,573 per net ton for 2021, 174% higher than 2020. The price of HRC reached an all-time high in 2021, as a direct result of favorable supply-demand dynamics driven by a rapid recovery since the onset of the COVID-19 pandemic in 2020. We have also benefited from higher steel shipments due to stronger demand.
Cost of goods sold for 2021 increased by $10,630 million as compared to 2020, predominantly due to additional sales as discussed above.
As a result, Adjusted EBITDA was $5,422 million for the year ended December 31, 2021, compared to $433 million for the prior year. Adjusted EBITDA for 2021 was positively impacted by the addition of sales following the 2020 Acquisitions, the increase in the price for HRC and the higher demand for steel products, as discussed above.
Production
Our steelmaking facilities produced a total of 18 million net tons of raw steel during the year ended December 31, 2021. Due to the timing of the 2020 Acquisitions and the idling of facilities in response to impacts of the COVID-19 pandemic, our steelmaking facilities produced a total of 4 million net tons of raw steel during the year ended December 31, 2020.
Liquidity, Cash Flows and Capital Resources
Our primary sources of liquidity are Cash and cash equivalents and cash generated from our operations, availability under the ABL Facility and other financing activities. Our capital allocation decision-making process is focused on preserving healthy liquidity levels, while maintaining the strength of our balance sheet and creating financial flexibility to manage through the inherent cyclical demand for our products and volatility in commodity prices. We are focused on maximizing the cash generation of our operations, reducing debt, and aligning capital investments with our strategic priorities and the requirements of our business plan, including regulatory and permission-to-operate related projects.
Following the onset of the COVID-19 pandemic in the U.S. in 2020, our primary focus was to maintain adequate levels of liquidity to manage through a potentially prolonged economic downturn. Now that business conditions have improved, allowing us to generate a healthy free cash flow during 2021, we have had the ability to make investments to both improve and grow our business, particularly as it pertains to scrap metal. We entered into the scrap business on November 18, 2021 with the FPT Acquisition. We were also able to reduce our diluted share count and effectively return capital to shareholders via the cash redemption of all of the outstanding shares of our Series B Participating Redeemable Preferred Stock during the third quarter of 2021. In December 2021, we also increased our liquidity by amending our ABL Facility to increase the aggregate revolver commitments from $3.5 billion to $4.5 billion. Additionally, we expect to be able to return capital to shareholders in 2022 through our share repurchase program, which was authorized by our Board on February 10, 2022.
In addition, we anticipate that the current strong market environment will provide us ample opportunities to reduce our debt with our own free cash flow generation. We also continue to look at the composition of our debt, as we are interested in both extending our average maturity length and increasing our ratio of unsecured debt to secured debt, which can be accomplished with cash provided by operating activities. On January 18, 2022, we took action to reduce our debt by redeeming all of our then-outstanding 1.500% 2025 Convertible Senior Notes. The notes were redeemed through a combination settlement, with the aggregate principal amount of $294 million paid in cash, and 24 million common shares delivered to noteholders per the terms of the indenture.
In furtherance of these goals, we also consummated the following financing transactions during 2021:
On February 11, 2021, we sold 20 million common shares at a price per share of $16.12, in an underwritten public offering. We used the net proceeds from the offering, plus cash on hand, to redeem $322 million aggregate principal amount of our outstanding 9.875% 2025 Senior Secured Notes. Prior to such use, the net proceeds were used to temporarily reduce the outstanding borrowings under our ABL Facility.
On February 17, 2021, we issued $500 million aggregate principal amount of 4.625% 2029 Senior Notes and $500 million aggregate principal amount of 4.875% 2031 Senior Notes in an offering that was exempt from the registration requirements of the Securities Act. We used the net proceeds from the notes offering to redeem all of the outstanding 4.875% 2024 Senior Secured Notes and 6.375% 2025 Senior Notes issued by Cleveland-Cliffs Inc. and all of the outstanding 7.625% 2021 AK Senior Notes, 7.500% 2023 AK Senior Notes and 6.375% 2025 AK Senior Notes issued by AK Steel Corporation (n/k/a Cleveland-Cliffs Steel Corporation), and pay fees and expenses in connection with such redemptions, and reduce borrowings under our ABL Facility.
Additionally, on June 28, 2021, we redeemed the entirety of our outstanding 5.750% 2025 Senior Notes using available liquidity. Pursuant to the terms of the indenture governing the 5.750% 2025 Senior Notes, we paid $415 million, including $396 million aggregate principal amount, plus make-whole premiums and accrued and unpaid interest to, but not including, the redemption date.
These actions give us additional financial flexibility and will better prepare us to navigate more easily through potentially volatile industry conditions in the future.
Based on our outlook for the next 12 months, which is subject to continued changing demand from customers and volatility in domestic steel prices, we expect to have ample liquidity through cash generated from operations and availability under our ABL Facility sufficient to meet the needs of our operations, service and repay our debt obligations and return capital to shareholders.
The following discussion summarizes the significant items impacting our cash flows during 2021 and comparative years as well as expected impacts to our future cash flows over the next 12 months. Refer to the Statements of Consolidated Cash Flows for additional information.
Operating Activities
Net cash provided by operating activities was $2,785 million for the year ended December 31, 2021, compared to net cash used by operating activities of $258 million for the year ended December 31, 2020. The year-over-year improvement was driven by improved operating results, partially offset by changes in working capital. Changes in working capital included increases in inventory primarily related to the global semiconductor shortage and increased raw material and production costs, as well as increases in receivables primarily related to rising prices. Additionally, we had incremental pension and OPEB payments and contributions of $268 million, which included $118 million of deferred 2020 pension contributions in connection with the CARES Act.
Investing Activities
Net cash used by investing activities was $1,379 million and $2,042 million for the years ended December 31, 2021 and 2020, respectively. During the year ended December 31, 2021, we had net cash outflows of $761 million related to the FPT Acquisition, net of cash acquired. We had total capital expenditures of $705 million and $525 million for the years ended December 31, 2021 and 2020, respectively. Included in the total capital expenditures, we had cash outflows for expansion capital expenditures relating to the development of our Toledo direct reduction plant of $64 million and $348 million for the years ended December 31, 2021 and 2020, respectively. Additionally, included in the total capital expenditures, we spent $641 million and $177 million primarily on sustaining capital expenditures during the years ended December 31, 2021 and 2020, respectively. Sustaining capital spend includes infrastructure, mobile equipment, fixed equipment, product quality, environment, health and safety.
During the year ended December 31, 2020, we had net cash outflows of $658 million related to the AM USA Transaction, net of cash acquired. Additionally, during the year ended December 31, 2020, we had net cash outflows of $869 million related to the AK Steel Merger, net of cash acquired, which included $590 million used to repay the former AK Steel Corporation revolving credit facility and $324 million used to purchase outstanding 7.500% 2023 AK Senior Notes.
We anticipate total cash used for capital expenditures during the next 12 months to be between $800 and $900 million.
Financing Activities
Net cash used by financing activities was $1,470 million for the year ended December 31, 2021, compared to net cash provided by financing activities of $2,059 million for the year ended December 31, 2020. Cash outflows from financing activities for the year ended December 31, 2021 included the redemption of all 583,273 shares outstanding of our Series B Participating Redeemable Preferred Stock at a redemption price of $1,343 million during the third quarter of 2021, along with $1.4 billion for repayments of debt. We used available liquidity to redeem all $396 million aggregate principal amount outstanding of our 5.750% 2025 Senior Notes. We used the net proceeds from the issuance of the 20 million common shares, and cash on hand, to redeem $322 million in aggregate principal amount of 9.875% 2025 Senior Secured Notes. We used the net proceeds from the issuances of the 4.625% 2029 Senior Notes and 4.875% 2031 Senior Notes to redeem all of the outstanding 4.875% 2024 Senior Secured Notes, 6.375% 2025 Senior Notes, 7.625% 2021 AK Senior Notes, 7.500% 2023 AK Senior Notes and 6.375% 2025 AK Senior Notes, and pay fees and expenses in connection with such redemptions, and reduce borrowings under our ABL Facility.
Cash inflows from financing activities for the year ended December 31, 2021 included the issuances of $500 million aggregate principal amount of 4.625% 2029 Senior Notes, $500 million aggregate principal amount of 4.875% 2031 Senior Notes and 20 million common shares for proceeds of $322 million, along with net borrowings of $73 million under credit facilities.
Net cash provided by financing activities for the year ended December 31, 2020 primarily related to the issuances of $845 million aggregate principal amount of 6.750% 2026 Senior Secured Notes, $955 million aggregate principal amount of 9.875% 2025 Senior Secured Notes and net borrowings of $1,510 million under our ABL Facility. The net proceeds from the initial issuance of $725 million aggregate principal amount of the 6.750% 2026 Senior Secured Notes, along with cash on hand, were used to purchase $373 million aggregate principal amount of 7.625% 2021 AK Senior Notes and $367 million aggregate principal amount of 7.500% 2023 AK Senior Notes and to pay for the $44 million of debt issuance costs in the first quarter of 2020. The net proceeds from the additional issuance of $555 million aggregate principal amount of the 9.875% 2025 Senior Secured Notes were used to repurchase $736 million aggregate principal amount of our outstanding senior notes.
The following represents our future cash commitments and contractual obligations as of December 31, 2021:
| | | | | | | | | | | | | | | | | | | | | | | | | | | | | |
| Payments Due by Period (In Millions) |
| Total | | Less than
1 Year | | 1 - 3
Years | | 3 - 5
Years | | More than 5 Years |
Long-term debt1 | $ | 5,369 | | | $ | — | | | $ | 36 | | | $ | 3,355 | | | $ | 1,978 | |
Interest on debt1 | 1,497 | | | 262 | | | 453 | | | 361 | | | 421 | |
| Operating lease obligations | 378 | | | 68 | | | 103 | | | 74 | | | 133 | |
| Finance lease obligations | 345 | | | 105 | | | 127 | | | 47 | | | 66 | |
| Purchase obligations: | | | | | | | | | |
| Open purchase orders | 374 | | | 328 | | | 1 | | | — | | | 45 | |
Minimum "take or pay" purchase commitments2 | 8,590 | | | 2,785 | | | 2,947 | | | 1,493 | | | 1,365 | |
| Total purchase obligations | 8,964 | | | 3,113 | | | 2,948 | | | 1,493 | | | 1,410 | |
| Other long-term liabilities: | | | | | | | | | |
Pension funding minimums3 | 132 | | | 4 | | | 61 | | | 67 | | | — | |
OPEB claim payments3 | 613 | | | 138 | | | 242 | | | 233 | | | — | |
| Environmental and asset retirement obligations | 655 | | | 54 | | | 76 | | | 30 | | | 495 | |
| Other | 91 | | | 4 | | | 24 | | | 18 | | | 45 | |
| Total other long-term liabilities | 1,491 | | | 200 | | | 403 | | | 348 | | | 540 | |
| Total | $ | 18,044 | | | $ | 3,748 | | | $ | 4,070 | | | $ | 5,678 | | | $ | 4,548 | |
| | | | | | | | | |
1 Refer to NOTE 8 - DEBT AND CREDIT FACILITIES for additional information regarding our debt and related interest rates. |
2 Includes minimum railroad and vessel transportation obligations, minimum electric power demand charges, minimum diesel and natural gas obligations and minimum port facility obligations. Additionally, includes our coke purchase commitments related to our coke supply agreement with SunCoke Middletown. |
3 Estimates beyond five years for pension and OPEB contributions and payments are not included due to the uncertainty of future investment performance, funding legislation, discount rates, healthcare costs, plan design and other factors. Refer to NOTE 10 - PENSIONS AND OTHER POSTRETIREMENT BENEFITS for additional information regarding our pension and OPEB obligations. |
Refer to NOTE 20 - COMMITMENTS AND CONTINGENCIES for additional information regarding our future commitments and obligations.
Capital Resources
We expect to fund our business obligations from available cash, current and future operations and existing and future borrowing arrangements. We also may pursue other funding strategies in the capital markets to strengthen our liquidity, extend debt maturities and/or fund strategic initiatives. The following represents a summary of key liquidity measures:
| | | | | |
| (In Millions) |
| December 31,
2021 |
Cash and cash equivalents | $ | 48 | |
| |
Available borrowing base on ABL Facility1
| $ | 4,500 | |
Borrowings | (1,609) | |
Letter of credit obligations | (175) | |
Borrowing capacity available | $ | 2,716 | |
| |
| |
1 As of December 31, 2021, the ABL Facility had a maximum borrowing base of $4.5 billion, determined by applying customary advance rates to eligible accounts receivable, inventory and certain mobile equipment.
|
Our primary sources of funding are cash and cash equivalents which totaled $48 million ason hand.
The following table provides a reconciliation of December 31, 2021, cash generated by our business, availability under our ABL Facility and other financing activities. Cash and cash equivalents include cash on hand and on deposit. The combination of cash and availability under our ABL Facility gives us $2.8 billion in liquidity entering the first quarter of 2022, which is expectedlong-term debt to be adequate to fund operations, letter of credit obligations, capital expenditures and other cash commitments for at least the next 12 months.net debt:
As of December 31, 2021, we were in compliance with the ABL Facility liquidity requirements and, therefore, the springing financial covenant requiring a minimum Fixed Charge Coverage Ratio of 1.0 to 1.0 was not applicable. We believe that the cash on hand and our ABL Facility provide us sufficient liquidity to support our operating, investing and financing activities. We have the capability to issue additional unsecured notes and, subject to the limitations set forth in our existing senior notes indentures, additional secured debt, if we elect to access the debt capital markets. However, our ability to issue additional notes could be limited by market conditions.
We intend from time to time to seek to retire or repurchase our outstanding senior notes with cash on hand, borrowings from existing credit sources or new debt financings and/or exchanges for debt or equity securities, in open market purchases, privately negotiated transactions or otherwise. Such repurchases, if any, will depend on prevailing market conditions, our liquidity requirements, contractual restrictions and other factors, and the amounts involved may be material.
Off-Balance Sheet Arrangements
In the normal course of business, we are a party to certain arrangements that are not reflected on our Statements of Consolidated Financial Position. These arrangements include minimum "take or pay" purchase commitments, such as minimum electric power demand charges, minimum coal, diesel and natural gas purchase commitments, minimum railroad transportation commitments and minimum port facility usage commitments; and financial instruments with off-balance sheet risk, such as bank letters of credit and bank guarantees. | | | | | | | | | | | |
| (In millions) | December 31, 2023 | | December 31, 2022 |
| Long-term debt | $ | 3,137 | | | $ | 4,249 | |
| Less: Cash and cash equivalents | 198 | | | 26 | |
| Net debt | $ | 2,939 | | | $ | 4,223 | |
Information about our Guarantors and the Issuer of our Guaranteed SecuritiesINFORMATION ABOUT OUR GUARANTORS AND THE ISSUER OF OUR GUARANTEED SECURITIES
The accompanying summarized financial information has been prepared and presented pursuant to SEC Regulation S-X, Rule 3-10, “Financial Statements of Guarantors and Issuers of Guaranteed Securities Registered or Being Registered,” and Rule 13-01 "Financial Disclosures about Guarantors and Issuers of Guaranteed Securities and Affiliates Whose Securities Collateralized a Registrant's Securities." Certain of our subsidiaries (the "Guarantor subsidiaries") as of December 31, 2023 have fully and unconditionally, and jointly and severally, guaranteed the obligations under (a) the 5.875% 2027 Senior Notes, the 7.000% 2027 Senior Notes, the 4.625% 2029 Senior Notes, the 6.750% 2030 Senior Notes, and the 4.875% 2031 Senior Notes issued by Cleveland-Cliffs Inc. on a senior unsecured basis and (b) the 6.750% 2026 Senior Secured
Notes and the 9.875% 2025 Senior Secured Notesissued by Cleveland-Cliffs Inc. on a senior secured basis. See NOTE 8 - DEBT AND CREDIT FACILITIES for further information.
The following presents the summarized financial information on a combined basis for Cleveland-Cliffs Inc. (parent company and issuer of the guaranteed obligations) and the Guarantor subsidiaries, collectively referred to as the obligated group. Transactions between the obligated group have been eliminated. Information for the non-Guarantor subsidiaries was excluded from the combined summarized financial information of the obligated group.
Each Guarantor subsidiary is consolidated by Cleveland-Cliffs Inc. as of December 31, 2021.2023. Refer to Exhibit 22, incorporated herein by reference, for the detailed list of entities included within the obligated group as of December 31, 2021.2023. TheAs of December 31, 2023, the guarantee of a Guarantor subsidiary with respect to Cliffs' 6.750% 2026 Senior Secured Notes, the 5.875% 2027 Senior Notes, the 7.000% 2027 Senior Notes, the 9.875% 20254.625% 2029 Senior Secured Notes, the 4.625% 20296.750% 2030 Senior Notes and the 4.875% 2031 Senior Notes will be automatically and unconditionally released and discharged, and such Guarantor subsidiary’s obligations under the guarantee and the related indentures (the “Indentures”) will be automatically and unconditionally released and discharged, upon the occurrence of any of the following, along with the delivery to the trustee of an officer’s certificate and an opinion of counsel, each stating that all conditions precedent provided for in the applicable Indenture relating to the release and discharge of such Guarantor subsidiary’s guarantee have been complied with:
(a) any sale, exchange, transfer or disposition of such Guarantor subsidiary (by merger, consolidation, or the sale of) or the capital stock of such Guarantor subsidiary after which the applicable Guarantor subsidiary is no longer a subsidiary of the Company or the sale of all or substantially all of such Guarantor subsidiary’s assets (other than by lease), whether or not such Guarantor subsidiary is the surviving entity in such transaction, to a person which is not the Company or a subsidiary of the Company; provided that (i) such sale, exchange, transfer or disposition is made in compliance with the applicable Indenture, including the covenants regarding consolidation, merger and sale of assets and, as applicable, dispositions of assets that constitute notes collateral, and (ii) all the obligations of such Guarantor subsidiary under all debt of the Company or its subsidiaries terminate upon consummation of such transaction;
(b) designation of any Guarantor subsidiary as an “excluded subsidiary” (as defined in the Indentures); or
(c) defeasance or satisfaction and discharge of the Indentures.
Each entity in the summarized combined financial information follows the same accounting policies as described in the consolidated financial statements. The accompanying summarized combined financial information does not reflect investments of the obligated group in non-Guarantor subsidiaries. The financial information of the obligated group is presented on a combined basis; intercompany balances and transactions within the obligated group have been eliminated. The obligated group's amounts due from, amounts due to, and transactions with, non-Guarantor subsidiaries and related parties have been presented in separate line items.
Summarized Combined Financial Information of the Issuer and Guarantor Subsidiaries:SUMMARIZED COMBINED FINANCIAL INFORMATION OF THE ISSUER AND GUARANTOR SUBSIDIARIES
The following table is summarized combined financial information from the Statements of Condensed Consolidated Financial Position of the obligated group:
| | | | | | | | | | | |
| (In Millions) |
| December 31, 2021 | | December 31, 2020 |
| Current assets | $ | 6,539 | | | $ | 4,903 | |
| Non-current assets | 12,753 | | | 10,535 | |
| Current liabilities | (3,222) | | | (2,767) | |
| Non-current liabilities | (9,081) | | | (10,563) | |
| | | |
| | | | | | | |
| December 31, |
| (In millions) | 2023 | | |
| Current assets | $ | 7,150 | | | |
| Non-current assets | 10,111 | | | |
| Current liabilities | (4,283) | | | |
| Non-current liabilities | (5,463) | | | |
| | | |
The following table is summarized combined financial information from the Statements of Condensed Consolidated Operations of the obligated group:
| | | | | |
| (In Millions) |
| Year Ended |
| (In millions) | December 31, 20212023 |
| Revenues | $ | 19,97321,694 | |
| Cost of goods sold | (15,582)(20,263) | |
| Income from continuing operations | 2,923531 | |
| Net income | 2,929532 | |
| Net income attributable to Cliffs shareholders | 2,929532 | |
As of December 31, 20212023 and 2020,2022, the obligated group had the following balances with non-Guarantor subsidiaries and other related parties:
| | | | | | | | | | | |
| (In Millions) |
| December 31, 2021 | | December 31, 2020 |
| Balances with non-Guarantor subsidiaries: | | | |
| Accounts receivable, net | $ | 199 | | | $ | 69 | |
| Accounts payable | (186) | | | (17) | |
| | | |
| Balances with other related parties: | | | |
| Accounts receivable, net | $ | 3 | | | $ | 2 | |
| | | |
| Accounts payable | (7) | | | (6) | |
| | | |
| | | | | | | |
| December 31, |
| (In millions) | 2023 | | |
| Balances with non-Guarantor subsidiaries: | | | |
| Accounts receivable, net | $ | 743 | | | |
| Accounts payable | (1,004) | | | |
| | | |
| Balances with other related parties: | | | |
| Accounts receivable, net | $ | 5 | | | |
| | | |
| Accounts payable | (11) | | | |
| | | |
Additionally, for the year ended December 31, 2021,2023, the obligated group had Revenues of $139$110 million and Cost of goods sold of $117$81 million, in each case with other related parties.
Market RisksMARKET RISKS
We are subject to a variety of risks, including those caused by changes in commodity prices and interest rates. We have established policies and procedures to manage such risks; however, certain risks are beyond our control.
PRICING RISKS
In the ordinary course of business, we are exposed to market risk and price fluctuations related to the sale of our products, which are impacted primarily by market prices for HRC and other related spot pricing indices, and the purchase of energy and raw materials used in our operations, which are impacted by market prices for electricity, natural gas, electricity, ferrous and stainless steel scrap, chrome, metallurgical coal, coke, zinc, chrome, nickel and zinc.other alloys. Our strategy to address market risk has generally been to obtain competitive prices for our products and services and allow operating results to reflect market price movements dictated by supply and demand; however, we make forward physical purchases and enter into hedge contracts to manage exposure to price risk related to the purchases of certain raw materials and energy used in the production process.
Our financial results can vary for our operations as a result of fluctuations in market prices. We attempt to mitigate these risks by aligning fixed and variable components in our customer pricing contracts, supplier purchasing agreements and derivative financial instruments.
Some customer contracts have fixed-pricingfixed pricing terms, which increase our exposure to fluctuations in raw material and energy costs. To reduce our exposure, we enter into annual, fixed-pricefixed price agreements for certain raw materials. Some of our existing multi-year raw material supply agreements have required minimum purchase quantities. Under adverse economic conditions, those minimums may exceed our needs. Absent exceptions for force majeure and other circumstances affecting the legal enforceability of the agreements, these minimum purchase requirements may compel us to purchase quantities of raw materials that could significantly exceed our anticipated needs or pay damages to the supplier for shortfalls. In these circumstances, we would attempt to negotiate agreements for new purchase quantities. There is a risk, however, that we would not be successful in reducing
purchase quantities, either through negotiation or litigation. If that occurred, we would likely be required to purchase more of a particular raw material in a particular year than we need, negatively affecting our results of operations and cash flows.
Certain of our customer contracts include variable-pricing mechanisms that adjust selling prices in response to changes in the costs of certain raw materials and energy, while other of our customer contracts exclude such mechanisms. We may enter into multi-year purchase agreements for certain raw materials with similar variable-price mechanisms, allowing us to achieve natural hedges between the customer contracts and supplier purchase agreements. Therefore, in some cases, price fluctuations for energy (particularly natural gas and electricity), raw materials (such as scrap, chrome, zinc and nickel) or other commodities may be, in part, passed on to customers rather than absorbed solely by us. There is a risk, however, that the variable-price mechanisms in the sales contracts may not necessarily change in tandem with the variable-price mechanisms in our purchase agreements, negatively affecting our results of operations and cash flows.
Our strategy to address volatile natural gas rates and electricity rates includes improving efficiency in energy usage, identifying alternative providers and utilizing the lowest cost alternative fuels. If we are unable to align fixed and variable components between customer contracts and supplier purchase agreements, we routinely evaluate the use of derivative instruments to hedge market risk. As a result, we use cash-settled commodity price swaps and options to hedge the market risk associated with the purchase of certain of our raw materials and energy requirements. Additionally, we routinely use these derivative instruments to hedge a portion of our exposure from our natural gas and zincelectricity requirements. Our hedging strategy is designed to protect us from excessive pricing volatility. However, since we do not typically hedge 100% of our exposure, abnormal price increases in any of these commodity markets might still negatively affect operating costs.
The following table summarizes the negative effect of a hypothetical change in the fair value of our derivative instruments outstanding as of December 31, 2021,2023, due to a 10% and 25% change in the market price of each of the indicated commodities:
| | | (In millions) | | | | (In millions) |
| Commodity Derivative | | Commodity Derivative | | 10% Change | | 25% Change |
| Natural gas | |
| Electricity | |
| | | (In Millions) |
| Positive or Negative Effect on
Pre-tax Income |
| Commodity Derivative | 10% Increase or Decrease | | 25% Increase or Decrease |
| Natural gas | $ | 32 | | | $ | 81 | |
| | Zinc | 6 | | | 15 | |
ValuationAny resulting changes in fair value would be recorded as adjustments to AOCI, net of Goodwill and Other Long-Lived Assetsincome taxes, or recognized in net earnings, as appropriate. These hypothetical losses would be partially offset by the benefit of lower prices paid for the related commodities.
VALUATION OF GOODWILL AND OTHER LONG-LIVED ASSETS
GOODWILL
We assign goodwill arising from acquired companies to the reporting units that are expected to benefit from the synergies of the acquisition. Goodwill is tested on a qualitative or quantitative basis for impairment at the reporting unit level on an annual basis (October 1) and between annual tests if an event occurs or circumstances change that would more likely than not reduce the fair value of a reporting unit below its carrying value. These events or circumstances could include a significant change in the business climate, legal factors, operating performance indicators, competition, or sale or disposition of a significant portion of a reporting unit. As necessary, shouldWe have an unconditional option to bypass the qualitative test for any reporting unit in any period and proceed directly to performing the quantitative test. Should our qualitative test indicate that it is more likely than not that the fair value of a reporting unit is less than its carry amount,carrying value, we perform a quantitative test to determine the amount of impairment, if any, to the carrying value of the reporting unit and its associated goodwill.
Application of the goodwill impairment test requires judgment, including the identification of reporting units, assignment of assets and liabilities to reporting units, assignment of goodwill to reporting units and if a quantitative assessment is deemed necessary in determination of the fair value of each reporting unit. The fair value of each reporting unit is estimated using athe guideline public company method, the discounted cash flow methodology, or a combination of both, which considers forecasted cash flows
discounted at an estimated weighted average cost of capital. Assessing the recoverability of our goodwill requires significant assumptions regarding the estimated future cash flows and other factors to determine the fair value of a reporting unit, including, among other things, estimates related to forecasts of future revenues, expected Adjusted EBITDA, expected capital expenditures and working capital requirements, which are based upon our long-range plan estimates. The assumptions used to calculate the fair value of a reporting unit may change from year to year based on operating results, market conditions and other factors. Changes in these assumptions could materially affect the determination of fair value for each reporting unit.
Our 2023 annual goodwill impairment analysis resulted in an impairment charge of $125 million for goodwill related to our Tooling and Stamping reporting unit. The decline in the fair value of our Tooling and Stamping reporting unit below its carrying value during 2023 resulted from forgoing previous investment and capital plans in favor of other opportunities and an increase in the discount rate. No impairment charges were identified in connection with our annual goodwill assessment with respect to our other identified reporting units. We determined that our other identified reporting units were not at risk of failing the goodwill impairment test as of December 31, 2023.
OTHER LONG-LIVED ASSETS
Long-lived assets are reviewed for impairment upon the occurrence of events or changes in circumstances that would indicate that the carrying value of the assets may not be recoverable. Such indicators may include: a significant decline in expected future cash flows; a sustained, significant decline in market pricing; a significant
adverse change in legal or environmental factors or in the business climate; changes in estimates of our recoverable reserves; and unanticipated competition. Any adverse change in these factors could have a significant impact on the recoverability of our long-lived assets and could have a material impact on our consolidated statements of operations and statements of financial position.
A comparison of each asset group's carrying value to the estimated undiscounted net future cash flows expected to result from the use of the assets, including cost of disposition, is used to determine if an asset is recoverable. Projected future cash flows reflect management's best estimate of economic and market conditions over the projected period, including growth rates in revenues and costs, and estimates of future expected changes in operating margins and capital expenditures. If the carrying value of the asset group is higher than its undiscounted net future cash flows, the asset group is measured at fair value and the difference is recorded as a reduction to the long-lived assets. We estimate fair value using a market approach, an income approach or a cost approach. For
During the year ended December 31, 2021,2023, we concluded that an eventthere were no triggering events resulting in the need for an asset impairment assessment except for our Tooling and Stamping operations. The goodwill impairment we recorded at our Tooling and Stamping operations was deemed a triggering event; however, the other long-lived assets recoverability assessment did not occur.result in an asset impairment charge.
Interest Rate RiskINTEREST RATE RISK
Interest payable on our senior notes is at fixed rates. Interest payable under our ABL Facility is at a variable rate based upon the applicable base rate plus the applicable base rate margin depending on the excess availability. As of December 31, 2021,2023, we had $1,609 million outstanding under our ABL Facility. An increase in prevailing interest rates would increase interest expense and interest paid for anyno outstanding borrowings under our ABL Facility. For example, a 100 basis point change to interest rates under our ABL Facility at the December 31, 2021 borrowing level would result in a change of $16 million to interest expense on an annual basis.
Additionally, a portion of our borrowing capacity and outstanding indebtedness under the ABL Facility bears interest at a variable rate based on LIBOR. For a discussion of the attendant risk, see Part I - Item 1A,1A. Risk Factors - III. Financial Risks - Our existing and future indebtedness may limit cash flow available to invest in the ongoing needs of our businesses, which could prevent us from fulfilling our obligations under our senior notes, ABL Facility and other debt, and we may be forced to take other actions to satisfy our obligations under our debt, which may not be successful.
Supply Concentration RisksSUPPLY CONCENTRATION RISKS
Many of our operations and mines rely on one source for each of electric power and natural gas. A significant interruption or change in service or rates from our energy suppliers could materially impact our production costs, margins and profitability.
Recently Issued Accounting PronouncementsRECENTLY ISSUED ACCOUNTING PRONOUNCEMENTS
Refer to NOTE 1 - BASIS OF PRESENTATION AND SIGNIFICANT ACCOUNTING POLICIES of the consolidated financial statements for a description of recent accounting pronouncements, including the respective dates of adoption and effects on results of operations and financial condition.
Critical Accounting Estimates
CRITICAL ACCOUNTING ESTIMATES
Management's discussion and analysis of financial condition and results of operations is based on our consolidated financial statements, which have been prepared in accordance with GAAP. Preparation of financial statements requires management to make assumptions, estimates and judgments that affect the reported amounts of assets, liabilities, revenues, costs and expenses, and the related disclosures of contingencies. Management bases its estimates on various assumptions and historical experience, which are believed to be reasonable; however, due to the inherent nature of estimates, actual results may differ significantly due to changed conditions or assumptions. On a regular basis, management reviews the accounting policies, assumptions, estimates and judgments to ensure that our financial statements are fairly presented in accordance with GAAP. However, because future events and their effects cannot be determined with certainty, actual results could differ from our assumptions and estimates, and such differences could be material. Management believes that the following critical accounting estimates and judgments have a significant impact on our financial statements.
Business Combinations
Assets acquired and liabilities assumed in a business combination are recognized and measured based on their estimated fair values at the acquisition date, while the acquisition-related costs are expensed as incurred. Any excess of the purchase consideration when compared to the fair value of the net tangible and intangible assets acquired, if any, is recorded as goodwill. We engaged independent valuation specialists to assist with the
determination of the fair value of assets acquired, liabilities assumed, noncontrolling interest, and goodwill, for the acquisitions. If the initial accounting for the business combination is incomplete by the end of the reporting period in which the acquisition occurs, an estimate will be recorded. Subsequent to the acquisition date, and not later than one year from the acquisition date, we will record any material adjustments to the initial estimate based on new information obtained that would have existed as of the date of the acquisition. Any adjustment that arises from information obtained that did not exist as of the date of the acquisition will be recorded in the period the adjustment arises.
Valuation of Goodwill and Other Long-Lived AssetsVALUATION OF GOODWILL AND OTHER LONG-LIVED ASSETS
The valuation of goodwill and other long-lived assets includes various assumptions and are considered critical accounting estimates. Refer to "–Market Risks" above for additional information.
IRON ORE MINERAL RESERVES
We regularly evaluate, and engage QPs to review and validate, our mineral reserves and update them as required in accordance with Subpart 1300 of Regulation S-K. We perform an in-depth evaluation of our mineral reserve estimates by mine on a periodic basis, in addition to routine annual assessments. The determination of mineral reserves requires us and third-party QPs to make significant estimates and assumptions related to key inputs, including, but not limited to, (1) the determination of the size and scope of the iron ore body through technical modeling, (2) the estimates of future iron ore prices, production costs and capital expenditures, and (3) management’s mine plan for the proven and probable mineral reserves. The significant estimates and assumptions could be affected by future industry conditions, geological conditions and ongoing mine planning. Additional capital and development expenditures may be required to maintain effective production capacity. Generally, as mining operations progress, haul distances increase. Alternatively, changes in economic conditions or the expected quality of mineral resources and reserves could decrease effective production capacity. Technological progress could alleviate such factors or increase capacity of mineral reserves.
We use our mineral reserve estimates, combined with our estimated annual production levels and operating scenarios, to determine the mine closure dates utilized in recording the fair value liability for asset retirement obligations for our active operating mines. Refer to NOTE 14 - ASSET RETIREMENT OBLIGATIONS, for further information. Since the liability represents the present value of the expected future obligation, a significant change in mineral reserves or mine lives could have a substantial effect on the recorded obligation. We also utilize mineral reserves for evaluating potential impairments of goodwill and mine asset groups as they are indicative of future cash flows and in determining maximum useful lives utilized to calculate depreciation, depletion and amortization of long-lived mine assets and in determining the estimated fair value of mineral reserves established through the purchase price allocation in a business combination.assets. The consolidated asset retirement obligation balance was $449$459 million as of December 31, 2021,2023, of which $208$171 million related to active iron ore mine operations. The total asset balance associated with our Steelmaking reportable segment was $18,326 million as of December 31, 2021, of which $1,622 million relatedRefer to long-lived assets associated with our combined iron ore mine asset groups, and is inclusive of $231 million related to iron ore mineral reserves acquired through the AM USA Transaction. Depreciation, depletion and amortization expenseNOTE 13 - ASSET RETIREMENT OBLIGATIONS for our combined iron ore mine asset groups was $172 million for the year ended December 31, 2021. Increases or decreases in mineral reserves or mine lives could significantly affect these items.further information.
Asset Retirement ObligationsASSET RETIREMENT OBLIGATIONS
The accrued closure obligation is predominantly related to our indefinitely idled and closed iron ore mining operations and provides for contractual and legal obligations associated with the eventual closure of thoseour active operations. We perform an in-depth evaluation of the liability every three years in addition to our routine annual assessments. In 2020,2023, we employed third-party specialists to assist in the evaluation. Our obligations are determined based on detailed estimates adjusted for factors that a market participant would consider (e.g., inflation, overhead and profit), which are escalated at an assumed rate of inflation to the estimated closure dates and then discounted using the current credit-adjusted risk-free interest rate. The estimate also incorporates incremental increases in the closure cost estimates and changes in estimates of mine lives for our active mine sites. The closure date for each of our active mine sites is determined based on the exhaustion date of the remaining mineral reserves, which is dependent on our estimate of mineral reserves. The estimated obligations for our active mine sites are particularly sensitive to the impact of changes in mine lives given the difference between the inflation and discount rates. The closure dates for a majority ofAsset retirement obligations at our steelmaking facilities are indefinite,operations primarily include the closure and as such, the assetpost-closure care for on-site landfills and other waste containment facilities. Asset retirement obligations arehave been recorded at present values using estimated ranges of the economic lives of the underlying assets.settlement dates based on when we expect these facilities to reach capacity and close. Changes in the base estimates of legal and contractual closure costs due to changes in legal or contractual requirements, available technology,
inflation, overhead or profit rates also could have a significant impact on the recorded obligations. Refer to NOTE 1413 - ASSET RETIREMENT OBLIGATIONS, for further information.
Environmental Remediation CostsENVIRONMENTAL REMEDIATION COSTS
We have a formal policy for environmental protection and remediation. Our obligations for known environmental matters at active and closed operations have been recognized based on estimates of the cost of investigation and remediation at each facility. If the obligation can only be estimated as a range of possible amounts, with no specific amount being more likely, the minimum of the range is accrued. Management reviews its environmental remediation sites quarterly to determine if additional cost adjustments or disclosures are required. The characteristics of environmental remediation obligations, where information concerning the nature and extent of clean-up activities is not immediately available and which are subject to changes in regulatory requirements, result in a significant risk of increase to the obligations as they mature. Expected future expenditures are discounted to present value unless the amount and timing of the cash disbursements cannot be reasonably estimated.
Income TaxesINCOME TAXES
Our income tax expense, deferred tax assets and liabilities and reserves for unrecognized tax benefits reflect management's best assessment of estimated future taxes to be paid. We are subject to income taxes in the U.S. and various foreign jurisdictions. Significant judgments and estimates are required in determining the consolidated income tax expense.
Deferred income taxes arise from temporary differences between tax and financial statement recognition of revenue and expense. In evaluating our ability to recover our deferred tax assets, we consider all available positive and negative evidence, including scheduled reversals of deferred tax liabilities, projected future taxable income, tax planning strategies and recent financial operations. In projecting future taxable income, we begin with historical results adjusted for the results of discontinued operations and changes in accounting policies and incorporate assumptions including the amount of future state, federal and foreign pretaxpre-tax operating income, the reversal of temporary differences, and the implementation of feasible and prudent tax planning strategies. These assumptions require significant judgment about the forecasts of future taxable income and are consistent with the plans and estimates we are using to manage the underlying businesses.
At December 31, 20212023 and 2020,2022, we had a valuation allowance of $409$396 million and $836$390 million, respectively, against our deferred tax assets. Of these amounts, $70 millionAt December 31, 2023 and $439 million relate to2022, the valuation allowance on our U.S. deferred tax assets at December 31, 2021was $40 million and 2020,$48 million, respectively, and $339 million and $397 million relate tothe valuation allowance on our foreign deferred tax assets was $356 million and $342 million, respectively.
During 2023, we recorded a $14 million valuation allowance against a portion of our Canadian deferred tax assets due to losses in recent years. We intend to maintain a valuation allowance against these deferred tax assets, unless and until sufficient positive evidence exists to support the realization of such assets. Our losses in Luxembourg in recent periods represent sufficient negative evidence to require a full valuation allowance against the deferred tax assets in that jurisdiction. We intend to maintain a valuation allowance against the deferred tax assets related to these operating losses, unless and until sufficient positive evidence exists to support the realization of such assets.
Changes in tax laws and rates also could affect recorded deferred tax assets and liabilities in the future. The calculation of our tax liabilities involves dealing with uncertainties in the application of complex tax laws and regulations in various jurisdictions across our global operations. The ultimate impact of U.S. income tax reform legislation may differ from our current estimates due to changes in the interpretations and assumptions made as well as additional regulatory guidance that may be issued.
Accounting for uncertainty in income taxes recognized in the financial statements requires that a tax benefit from an uncertain tax position be recognized when it is more likely than not that the position will be sustained upon examination, including resolutions of any related appeals or litigation processes, based on technical merits.
We recognize tax liabilities in accordance with ASC 740, Income Taxes, and we adjust these liabilities when our judgment changes because of evaluation of new information not previously available. Due to the complexity of some of these uncertainties, the ultimate resolution may result in payment that is materially different from our current estimate of the tax liabilities. These differences will be reflected as increases or decreases to income tax expense in the period in which they are determined. Refer to NOTE 1211 - INCOME TAXES, for further information.
Employee Retirement Benefit ObligationsEMPLOYEE RETIREMENT BENEFIT OBLIGATIONS
We offer defined benefit pension plans, defined contribution pension plans and OPEB plans, primarily consisting of retiree healthcare benefits, to most employees in North America as part of a total compensation and benefits program.
The following is a summary of our U.S. defined benefit pension and OPEB funding and expense:
| | | | | | | | | | | | | | | | | | | | | | | | | | |
| | Pension | | OPEB |
| | Funding | | Expense (Benefit) | | Funding | | Expense (Benefit) |
| 2019 | | $ | 16 | | | $ | 22 | | | $ | 4 | | | $ | (2) | |
| 2020 | | 50 | | | (31) | | | 25 | | | 8 | |
20211 | | 163 | | | (189) | | | 180 | | | 86 | |
| 2022 (Estimated) | | 4 | | | (179) | | | 138 | | | 72 | |
| | | | | | | | |
1 The 2021 pension funding includes $118 million that was deferred as a result of the CARES Act. |
Assumptions used in determining the benefit obligations and the value of plan assets forsponsor various defined benefit pension plans and OPEB plans primarily consisting of retiree healthcare benefits, thatfor certain current employees and retirees. For accounting purposes, we offer are evaluated periodically by management. Criticaluse various actuarial assumptions such as the discount rate usedand methodologies to measure the plan obligations, assets and related net periodic benefit obligations,cost or credit at the expected long-term rateend of return on plan assets, the medical care cost trend, and the rate of compensation increase are reviewed annually.
The following represents weighted-averageeach year. These assumptions used to determine benefit obligations and net benefit costs:
| | | | | | | | | | | | | | | | | | | | | | | | | | | | | | | | | | | |
| Pension | | Other Benefits |
| December 31, | | December 31, |
| 2021 | | 2020 | | 2021 | | 2020 |
| Discount rate | 2.75 | | % | | 2.34 | | % | | 3.01 | | % | | 2.71 | | % |
| Compensation rate increase | 2.52 | | | | 2.56 | | | | 3.00 | | | | 3.00 | | |
| Expected return on plan assets | 6.84 | | | | 7.69 | | | | 5.20 | | | | 6.82 | | |
For the pension plans, the weighted-averageinclude discount rates, expected return on plan assets, for 2022 is 6.87%, anmortality rates, rates of compensation increase, from 6.84%healthcare trend rates and certain demographic assumptions. Assumptions and calculations are reviewed by management and reflect our best estimates and judgment. Future changes in 2021. Forassumptions or differences between actual and expected can significantly impact the OPEBfuture funded status of our plans the weighted-averageas well as their related net periodic benefit cost or credit.
We believe discount rates and expected return on plan assets for 2022 is 4.86%, a decrease from 5.20% in 2021.
The following represents assumed weighted-average health care cost trend rates:
| | | | | | | | | | | | | | | | | |
| December 31, |
| 2021 | | 2020 |
| Health care cost trend rate assumed for next year | 2.36 | | % | | 6.05 | | % |
| Ultimate health care cost trend rate | 4.50 | | | | 4.59 | | |
| Year that the ultimate rate is reached | 2031 | | | | 2031 | | |
are the most critical assumptions. The discount rates used to measure plan liabilities as of the December 31 measurement date are determined individually for each plan. The discount rates are determined by matching the projected cash flows used to determine the plan liabilities to a projected yield curve of high-quality corporate bonds available at the measurement date. Discount rates for expense are calculated using the granular approach for each plan.
DependingThe expected return on plan assets are calculated on a plan-by-plan basis and take into account each plan's strategic asset allocation. The calculation of rates by asset class are based primarily on our future expected returns and take into consideration the duration of the cash flows, active management and fees. The difference between our expected return on plan we use either company-specific base mortality tablesassets assumptions and the actual returns are recorded in AOCI and ultimately affects future earnings in subsequent years. Although our actual returns will likely differ from our estimate on any given year, the returns over the long term are expected to match our assumptions. In 2024, our weighted average expected return on assets for pension and OPEB plans will increase from 7.66% to 7.85% and from 5.87% to 5.94%, respectively.
Cumulative actuarial gains and losses will be amortized to expense using the corridor method, where gains and losses are recognized if they exceed 10% of the greater of the fair value of plan assets or tables issuedthe plans' benefit obligations. The amortization period will vary by the Society of Actuaries. We use the Pri-2012 mortality tables from the Society of Actuaries with adjustments for blue collar, white collar or no collar depending on the plan. On December 31, 2021, the assumed mortality improvement projection was updated from generational scale MP-2020 to generational scale MP-2021 for the Pri-2012 mortality tables.
FollowingThe following are sensitivities of potential further changes in these key assumptions on the estimated 20222024 pension and OPEB expense and the pension and OPEB obligations as of December 31, 2021:2023:
| | | | | | | | | | | | | | | | | | | | | | | |
| (In Millions) |
| Increase (Decrease) in Expense | | Increase in
Benefit Obligation |
| Pension | | OPEB | | Pension | | OPEB |
| Decrease discount rate 0.25% | $ | (3) | | | $ | 6 | | | $ | 147 | | | $ | 111 | |
| Decrease return on assets 1.00% | 54 | | | 8 | | | N/A | | N/A |
Changes in actuarial assumptions, including discount rates, employee retirement rates, mortality, compensation levels, plan asset investment performance and healthcare costs, are determined based on analyses of actual and expected factors. Changes in actuarial assumptions and/or investment performance of plan assets may have a significant impact on our financial condition due to the magnitude of our retirement obligations. | | | | | | | | | | | | | | | | | | | | | | | |
| Increase (Decrease) in Expense | | Increase in Benefit Obligation |
| (In millions) | Pension | | OPEB | | Pension | | OPEB |
| Decrease discount rate 0.25% | $ | (3) | | | $ | 1 | | | $ | 93 | | | $ | 22 | |
| Decrease return on assets 1.00% | 41 | | | 7 | | | N/A | | N/A |
Refer to NOTE 109 - PENSIONS AND OTHER POSTRETIREMENT BENEFITS for further information.
Forward-Looking Statements
FORWARD-LOOKING STATEMENTS
This report contains statements that constitute "forward-looking statements" within the meaning of the federal securities laws. As a general matter, forward-looking statements relate to anticipated trends and expectations rather than historical matters. Forward-looking statements are subject to uncertainties and factors relating to our operations and business environment that are difficult to predict and may be beyond our control. Such uncertainties and factors may cause actual results to differ materially from those expressed or implied by the forward-looking statements. These statements speak only as of the date of this report, and we undertake no ongoing obligation, other than that imposed by law, to update these statements. Investors are cautioned not to place undue reliance on forward-looking statements. Uncertainties and risk factors that could affect our future performance and cause results to differ from the forward-looking statements in this report include, but are not limited to:
•disruptions to our operations relating to the ongoing COVID-19 pandemic, including the heightened risk that a significant portion of our workforce or on-site contractors may suffer illness or otherwise be unable to perform their ordinary work functions;
•continued volatility of steel, iron ore and scrap metal market prices, which directly and indirectly impact the prices of the products that we sell to our customers;
•uncertainties associated with the highly competitive and cyclical steel industry and our reliance on the demand for steel from the automotive industry, which has been experiencing a trend toward light weighting and supply chain disruptions, such as the semiconductor shortage, that could result in lower steel volumes being consumed;industry;
•potential weaknesses and uncertainties in global economic conditions, excess global steelmaking capacity, oversupply of iron ore, prevalence of steel imports and reduced market demand, including as a result of the prolonged COVID-19 pandemic;demand;
•severe financial hardship, bankruptcy, temporary or permanent shutdowns or operational challenges due to the ongoing COVID-19 pandemic or otherwise, of one or more of our major customers, including customers in the automotive market, key suppliers or contractors, which, among other adverse effects, could disrupt our operations or lead to reduced demand for our products, increased difficulty collecting receivables, and customers and/or suppliers asserting force majeure or other reasons for not performing their contractual obligations to us;
•risks related to U.S. government actions with respect to Section 232, the USMCA and/or other trade agreements, tariffs, treaties or policies, as well as the uncertainty of obtaining and maintaining effective antidumping and countervailing duty orders to counteract the harmful effects of unfairly traded imports;
•impacts of existing and increasing governmental regulation, including potential environmental regulations relating to climate change and carbon emissions, and related costs and liabilities, including failure to receive or maintain required operating and environmental permits, approvals, modifications or other authorizations of, or from, any governmental or regulatory authority and costs related to implementing
improvements to ensure compliance with regulatory changes, including potential financial assurance requirements;requirements, and reclamation and remediation obligations;
•potential impacts to the environment or exposure to hazardous substances resulting from our operations;
•our ability to maintain adequate liquidity, our level of indebtedness and the availability of capital could limit our financial flexibility and cash flow necessary to fund working capital, planned capital expenditures, acquisitions, and other general corporate purposes or ongoing needs of our business;business, or to repurchase our common shares;
•our ability to reduce our indebtedness or return capital to shareholders within the currently expected timeframes or at all;
•adverse changes in credit ratings, interest rates, foreign currency rates and tax laws;
•the outcome of, and costs incurred in connection with, lawsuits, claims, arbitrations or governmental proceedings relating to commercial and business disputes, antitrust claims, environmental matters, government investigations, occupational or personal injury claims, property damage,property-related matters, labor and employment matters, or suits involving legacy operations and other matters;
•supply chain disruptions or changes in the cost, quality or qualityavailability of energy sources, including electricity, natural gas and diesel fuel, or critical raw materials and supplies, including iron ore, industrial gases, graphite electrodes, scrap metal, chrome, zinc, other alloys, coke and metallurgical coal;coal, and critical manufacturing equipment and spare parts;
•problems or disruptions associated with transporting products to our customers, moving manufacturing inputs or products internally among our facilities, or suppliers transporting raw materials to us;
•the risk that the cost or time to implement a strategic or sustaining capital project may prove to be greater than originally anticipated;
•our ability to consummate any public or private acquisition transactions and to realize any or all of the anticipated benefits or estimated future synergies, as well as to successfully integrate any acquired businesses into our existing businesses;
•uncertainties associated with natural or human-caused disasters, adverse weather conditions, unanticipated geological conditions, critical equipment failures, infectious disease outbreaks, tailings dam failures and other unexpected events;
•cybersecurity incidents relating to, disruptions in, or failures of, our information technology systems that are managed by us or third parties that host or have access to our data or systems, including those relatedthe loss, theft or corruption of sensitive or essential business or personal information and the inability to cybersecurity;access or control systems;
•liabilities and costs arising in connection with any business decisions to temporarily or indefinitely idle or permanently close an operating facility or mine, which could adversely impact the carrying value of associated assets and give rise to impairment charges or closure and reclamation obligations, as well as uncertainties associated with restarting any previously idled operating facility or mine;
•57our ability to realize the anticipated synergies and benefits | CLF 2023 FORM 10-K
•our level of self-insurance and our ability to obtain sufficient third-party insurance to adequately cover potential adverse events and business risks;
•uncertainties associated with our ability to meet customers’ and suppliers’ decarbonization goals and reduce our GHG emissions in alignment with our own announced targets;
•challenges to maintaining our social license to operate with our stakeholders, including the impacts of our operations on local communities, reputational impacts of operating in a carbon-intensive industry that produces GHG emissions, and our ability to foster a consistent operational and safety track record;
•our ability to successfully identify and consummate any strategic capital investments or development projects, cost-effectively achieve planned production rates or levels, and diversify our product mix and add new customers;
•our actual economic mineral reserves or reductions in current mineral reserve estimates, and any title defect or loss of any lease, license, easement or other possessory interest for any mining property;
•availability of workers to fill critical operational positions and potential labor shortages caused by the ongoing COVID-19 pandemic, as well as our ability to attract, hire, develop and retain key personnel;
•our ability to maintain satisfactory labor relations with unions and employees;
•unanticipated or higher costs associated with pension and OPEB obligations resulting from changes in the value of plan assets or contribution increases required for unfunded obligations;
•uncertain availability or cost of skilled workers to fill critical operational positions and potential labor shortages caused by experienced employee attrition or otherwise, as well as our ability to attract, hire, develop and retain key personnel;
•the amount and timing of any repurchases of our common shares; and
•potential significant deficiencies or material weaknesses in our internal control over financial reporting.
For additional factors affecting our businesses, refer to Part I – Item 1A. Risk Factors. You are urged to carefully consider these risk factors.
Forward-looking and other statements in this Annual Report on Form 10-K regarding our GHG reduction plans and goals are not an indication that these statements are necessarily material to investors or required to be disclosed in our filings with the SEC. In addition, historical, current and forward-looking GHG-related statements may be based on standards for measuring progress that are still developing, internal controls and processes that continue to evolve, and assumptions that are subject to change in the future.
| | |
| | |
ItemITEM 7A. | Quantitative and Qualitative Disclosures About Market Risk QUANTITATIVE AND QUALITATIVE DISCLOSURES ABOUT MARKET RISK |
Information regarding our market risk is presented under the caption "Market Risks," which is included in ItemITEM 7. Management's Discussion and Analysis of Financial Condition and Results of OperationsMANAGEMENT'S DISCUSSION AND ANALYSIS OF FINANCIAL CONDITION AND RESULTS OF OPERATIONS and is incorporated by reference and made a part hereof.
7658 | CLF 2023 FORM 10-K
| | |
| | |
ItemITEM 8. | Financial Statements and Supplementary Data FINANCIAL STATEMENTS AND SUPPLEMENTARY DATA |
Statements of Consolidated Financial PositionSTATEMENTS OF CONSOLIDATED FINANCIAL POSITION
Cleveland-Cliffs Inc. and SubsidiariesCLEVELAND-CLIFFS INC. AND SUBSIDIARIES
| | (In Millions) |
| December 31, |
| 2021 | | 2020 |
| December 31, | | | December 31, |
| (In millions, except share information) | | (In millions, except share information) | 2023 | | 2022 |
| ASSETS | ASSETS | | | |
| Current assets: | Current assets: | |
| Current assets: | |
| Current assets: | |
| Cash and cash equivalents | |
| Cash and cash equivalents | |
| Cash and cash equivalents | Cash and cash equivalents | $ | 48 | | | $ | 112 | |
| Accounts receivable, net | Accounts receivable, net | 2,154 | | | 1,169 | |
| Inventories | Inventories | 5,188 | | | 3,828 | |
| | Other current assets | Other current assets | 263 | | | 189 | |
| Total current assets | Total current assets | 7,653 | | | 5,298 | |
| Non-current assets: | Non-current assets: | |
| Property, plant and equipment, net | Property, plant and equipment, net | 9,186 | | | 8,743 | |
| Property, plant and equipment, net | |
| Property, plant and equipment, net | |
| Goodwill | Goodwill | 1,116 | | | 1,406 | |
| Pension and OPEB assets | |
| | Other non-current assets | |
| Other non-current assets | |
| Other non-current assets | Other non-current assets | 1,020 | | | 1,324 | |
| TOTAL ASSETS | TOTAL ASSETS | $ | 18,975 | | | $ | 16,771 | |
| LIABILITIES AND EQUITY | LIABILITIES AND EQUITY | | | |
| Current liabilities: | Current liabilities: | |
| Current liabilities: | |
| Current liabilities: | |
| Accounts payable | |
| Accounts payable | |
| Accounts payable | Accounts payable | $ | 2,073 | | | $ | 1,575 | |
| Accrued employment costs | Accrued employment costs | 585 | | | 460 | |
| State and local taxes | 138 | | | 147 | |
| | Accrued expenses | |
| Other current liabilities | Other current liabilities | 765 | | | 747 | |
| Total current liabilities | Total current liabilities | 3,561 | | | 2,929 | |
| Non-current liabilities: | Non-current liabilities: | |
| Long-term debt | Long-term debt | 5,238 | | | 5,390 | |
| Pension liability, non-current | 578 | | | 1,224 | |
| OPEB liability, non-current | 2,383 | | | 2,889 | |
| Long-term debt | |
| Long-term debt | |
| Pension and OPEB liabilities | |
| | Deferred income taxes | |
| Deferred income taxes | |
| Deferred income taxes | |
| Other non-current liabilities | Other non-current liabilities | 1,441 | | | 1,260 | |
| TOTAL LIABILITIES | TOTAL LIABILITIES | 13,201 | | | 13,692 | |
| Commitments and contingencies (See Note 20) | 0 | | 0 |
| Series B Participating Redeemable Preferred Stock - no par value | |
| Authorized, Issued and Outstanding - no shares (2020 - 583,273 shares) | — | | | 738 | |
| Commitments and contingencies (See NOTE 20) | | Commitments and contingencies (See NOTE 20) | | | |
| Equity: | Equity: | |
| Common Shares - par value $0.125 per share | Common Shares - par value $0.125 per share | |
| Authorized - 1,200,000,000 shares (2020 - 600,000,000 shares); | |
| Issued - 506,832,537 shares (2020 - 506,832,537 shares); | |
| Outstanding - 500,158,955 shares (2020 - 477,517,372 shares) | 63 | | | 63 | |
| Common Shares - par value $0.125 per share | |
| Common Shares - par value $0.125 per share | |
| Authorized - 1,200,000,000 shares (2022 - 1,200,000,000 shares); | |
| Authorized - 1,200,000,000 shares (2022 - 1,200,000,000 shares); | |
| Authorized - 1,200,000,000 shares (2022 - 1,200,000,000 shares); | |
| Issued - 531,051,530 shares (2022 - 531,051,530 shares); | |
| Issued - 531,051,530 shares (2022 - 531,051,530 shares); | |
| Issued - 531,051,530 shares (2022 - 531,051,530 shares); | |
| Outstanding - 504,886,773 shares (2022 - 513,340,779 shares) | |
| Outstanding - 504,886,773 shares (2022 - 513,340,779 shares) | |
| Outstanding - 504,886,773 shares (2022 - 513,340,779 shares) | |
| Capital in excess of par value of shares | Capital in excess of par value of shares | 4,892 | | | 5,431 | |
| Retained deficit | (1) | | | (2,989) | |
| Cost of 6,673,582 common shares in treasury (2020 - 29,315,165 shares) | (82) | | | (354) | |
| Accumulated other comprehensive income (loss) | 618 | | | (133) | |
| Retained earnings | |
| Cost of 26,164,757 common shares in treasury (2022 - 17,710,751 shares) | |
| Accumulated other comprehensive income | |
| Total Cliffs shareholders' equity | Total Cliffs shareholders' equity | 5,490 | | | 2,018 | |
| Noncontrolling interest | 284 | | | 323 | |
| Noncontrolling interests | |
| TOTAL EQUITY | TOTAL EQUITY | 5,774 | | | 2,341 | |
| TOTAL LIABILITIES, REDEEMABLE PREFERRED STOCK AND EQUITY | $ | 18,975 | | | $ | 16,771 | |
| TOTAL LIABILITIES AND EQUITY | |
The accompanying notes are an integral part of these consolidated financial statements.
7759 | CLF 2023 FORM 10-K
Statements of Consolidated OperationsSTATEMENTS OF CONSOLIDATED OPERATIONS
Cleveland-Cliffs Inc. and SubsidiariesCLEVELAND-CLIFFS INC. AND SUBSIDIARIES
| | (In Millions, Except Per Share Amounts) |
| Year Ended December 31, |
| 2021 | | 2020 | | 2019 |
| Year Ended December 31, | | | Year Ended December 31, |
| (In millions, except per share amounts) | | (In millions, except per share amounts) | 2023 | | 2022 | | 2021 |
| Revenues | Revenues | $ | 20,444 | | | $ | 5,354 | | | $ | 1,990 | |
| Operating costs: | Operating costs: | |
| Cost of goods sold | Cost of goods sold | (15,910) | | | (5,102) | | | (1,414) | |
| Cost of goods sold | |
| Cost of goods sold | |
| Selling, general and administrative expenses | Selling, general and administrative expenses | (422) | | | (244) | | | (113) | |
| Acquisition-related costs | Acquisition-related costs | (20) | | | (90) | | | (7) | |
| Goodwill impairment | |
| Miscellaneous – net | Miscellaneous – net | (80) | | | (60) | | | (27) | |
| Total operating costs | Total operating costs | (16,432) | | | (5,496) | | | (1,561) | |
| Operating income (loss) | 4,012 | | | (142) | | | 429 | |
| Operating income | |
| Other income (expense): | Other income (expense): | |
| Interest expense, net | Interest expense, net | (337) | | | (238) | | | (101) | |
| Gain (loss) on extinguishment of debt | (88) | | | 130 | | | (18) | |
| Net periodic benefit credits (costs) other than service cost component | 210 | | | 54 | | | (1) | |
| Other non-operating income | 6 | | | 3 | | | 4 | |
| Interest expense, net | |
| Interest expense, net | |
| Loss on extinguishment of debt | |
| Net periodic benefit credits other than service cost component | |
| Other non-operating income (loss) | |
| Total other expense | Total other expense | (209) | | | (51) | | | (116) | |
| Income (loss) from continuing operations before income taxes | 3,803 | | | (193) | | | 313 | |
| Income tax benefit (expense) | (773) | | | 111 | | | (18) | |
| Income (loss) from continuing operations | 3,030 | | | (82) | | | 295 | |
| Income (loss) from discontinued operations, net of tax | 3 | | | 1 | | | (2) | |
| Net income (loss) | 3,033 | | | (81) | | | 293 | |
| Income attributable to noncontrolling interest | (45) | | | (41) | | | — | |
| Net income (loss) attributable to Cliffs shareholders | $ | 2,988 | | | $ | (122) | | | $ | 293 | |
| Income from continuing operations before income taxes | |
| Income tax expense | |
| Income from continuing operations | |
| Income from discontinued operations, net of tax | |
| Net income | |
| Net income attributable to noncontrolling interests | |
| Net income attributable to Cliffs shareholders | |
| | Earnings (loss) per common share attributable to Cliffs shareholders - basic | |
| Earnings per common share attributable to Cliffs shareholders - basic | |
| Earnings per common share attributable to Cliffs shareholders - basic | |
| Earnings per common share attributable to Cliffs shareholders - basic | |
| Continuing operations | |
| Continuing operations | |
| Continuing operations | Continuing operations | $ | 5.62 | | | $ | (0.32) | | | $ | 1.07 | |
| Discontinued operations | Discontinued operations | 0.01 | | | — | | | (0.01) | |
| $ | 5.63 | | | $ | (0.32) | | | $ | 1.06 | |
| Earnings (loss) per common share attributable to Cliffs shareholders - diluted | | | | | |
| $ | |
| Earnings per common share attributable to Cliffs shareholders - diluted | |
| Continuing operations | |
| Continuing operations | |
| Continuing operations | Continuing operations | $ | 5.35 | | | $ | (0.32) | | | $ | 1.04 | |
| Discontinued operations | Discontinued operations | 0.01 | | | — | | | (0.01) | |
| $ | 5.36 | | | $ | (0.32) | | | $ | 1.03 | |
| $ | |
The accompanying notes are an integral part of these consolidated financial statements.
7860 | CLF 2023 FORM 10-K
Statements of Consolidated Comprehensive IncomeSTATEMENTS OF CONSOLIDATED COMPREHENSIVE INCOME
Cleveland-Cliffs Inc. and SubsidiariesCLEVELAND-CLIFFS INC. AND SUBSIDIARIES
| | (In Millions) |
| Year Ended December 31, |
| 2021 | | 2020 | | 2019 |
| Net income (loss) | $ | 3,033 | | | $ | (81) | | | $ | 293 | |
| Year Ended December 31, | | | Year Ended December 31, |
| (In millions) | | (In millions) | 2023 | | 2022 | | 2021 |
| Net income | |
| Other comprehensive income (loss): | Other comprehensive income (loss): | |
| Changes in pension and OPEB, net of tax | Changes in pension and OPEB, net of tax | 684 | | | 181 | | | (35) | |
| Changes in pension and OPEB, net of tax | |
| Changes in pension and OPEB, net of tax | |
| Changes in derivative financial instruments, net of tax | |
| Changes in foreign currency translation | Changes in foreign currency translation | (2) | | | 3 | | | — | |
| Changes in derivative financial instruments, net of tax | 69 | | | 2 | | | — | |
| Total other comprehensive income (loss) | Total other comprehensive income (loss) | 751 | | | 186 | | | (35) | |
| Comprehensive income | Comprehensive income | 3,784 | | | 105 | | | 258 | |
| Comprehensive income attributable to noncontrolling interests | Comprehensive income attributable to noncontrolling interests | (45) | | | (41) | | | — | |
| Comprehensive income attributable to Cliffs shareholders | Comprehensive income attributable to Cliffs shareholders | $ | 3,739 | | | $ | 64 | | | $ | 258 | |
The accompanying notes are an integral part of these consolidated financial statements.
7961 | CLF 2023 FORM 10-K
Statements of Consolidated Cash FlowsSTATEMENTS OF CONSOLIDATED CASH FLOWS
Cleveland-Cliffs Inc. and SubsidiariesCLEVELAND-CLIFFS INC. AND SUBSIDIARIES
| | Year Ended December 31, | | | Year Ended December 31, |
| (In millions) | | (In millions) | 2023 | | 2022 | | 2021 |
| OPERATING ACTIVITIES | |
| Net income | |
| Net income | |
| Net income | |
| Adjustments to reconcile net income to net cash provided by operating activities: | |
| Depreciation, depletion and amortization | |
| Depreciation, depletion and amortization | |
| Depreciation, depletion and amortization | |
| Deferred income taxes | |
| Pension and OPEB credits | |
| Goodwill impairment | |
| | Loss on extinguishment of debt | |
| Loss on extinguishment of debt | |
| Loss on extinguishment of debt | |
| Amortization of inventory step-up | |
| | | (In Millions) |
| Other | |
| | Year Ended December 31, |
| 2021 | | 2020 | | 2019 |
| OPERATING ACTIVITIES | | | | | |
| Net income (loss) | $ | 3,033 | | | $ | (81) | | | $ | 293 | |
| Adjustments to reconcile net income (loss) to net cash provided (used) by operating activities: | |
| Depreciation, depletion and amortization | 897 | | | 308 | | | 85 | |
| Amortization of inventory step-up | 161 | | | 96 | | | — | |
| Deferred income taxes | 767 | | | (101) | | | 17 | |
| Pension and OPEB costs (credits) | (103) | | | (23) | | | 20 | |
| Loss (gain) on extinguishment of debt | 88 | | | (130) | | | 18 | |
| Other | |
| | Other | Other | 139 | | | (70) | | | 93 | |
| Changes in operating assets and liabilities, net of business combination: | Changes in operating assets and liabilities, net of business combination: | |
| Receivables and other assets | (858) | | | (42) | | | 255 | |
| Accounts receivable, net | |
| Accounts receivable, net | |
| Accounts receivable, net | |
| Inventories | Inventories | (1,370) | | | (146) | | | (136) | |
| Income taxes | |
| Pension and OPEB payments and contributions | Pension and OPEB payments and contributions | (343) | | | (75) | | | (20) | |
| Payables, accrued expenses and other liabilities | 374 | | | 6 | | | (57) | |
| Net cash provided (used) by operating activities | 2,785 | | | (258) | | | 568 | |
| Payables, accrued employment and accrued expenses | |
| Other, net | |
| Net cash provided by operating activities | |
| INVESTING ACTIVITIES | INVESTING ACTIVITIES | |
| Purchase of property, plant and equipment | Purchase of property, plant and equipment | (705) | | | (525) | | | (656) | |
| Purchase of property, plant and equipment | |
| Purchase of property, plant and equipment | |
| | Acquisition of FPT, net of cash acquired | |
| Acquisition of FPT, net of cash acquired | |
| Acquisition of FPT, net of cash acquired | Acquisition of FPT, net of cash acquired | (761) | | | — | | | — | |
| Acquisition of ArcelorMittal USA, net of cash acquired | Acquisition of ArcelorMittal USA, net of cash acquired | 54 | | | (658) | | | — | |
| Acquisition of AK Steel, net of cash acquired | — | | | (869) | | | — | |
| Other investing activities | Other investing activities | 33 | | | 10 | | | 12 | |
| Net cash used by investing activities | Net cash used by investing activities | (1,379) | | | (2,042) | | | (644) | |
| FINANCING ACTIVITIES | FINANCING ACTIVITIES | |
| Repurchase of common shares | |
| Repurchase of common shares | |
| Repurchase of common shares | |
| Series B Redeemable Preferred Stock redemption | Series B Redeemable Preferred Stock redemption | (1,343) | | | — | | | — | |
| Proceeds from issuance of common shares | Proceeds from issuance of common shares | 322 | | | — | | | — | |
| Repurchase of common shares | — | | | — | | | (253) | |
| | Proceeds from issuance of debt | Proceeds from issuance of debt | 1,000 | | | 1,763 | | | 721 | |
| Debt issuance costs | (20) | | | (76) | | | (7) | |
| Repayments of debt | (1,372) | | | (1,023) | | | (729) | |
| Repayments of senior notes | |
| Borrowings under credit facilities | Borrowings under credit facilities | 5,962 | | | 2,060 | | | — | |
| Repayments under credit facilities | Repayments under credit facilities | (5,889) | | | (550) | | | — | |
| | Debt issuance costs | |
| Other financing activities | Other financing activities | (130) | | | (115) | | | (126) | |
| Net cash provided (used) by financing activities | (1,470) | | | 2,059 | | | (394) | |
| | Net decrease in cash and cash equivalents | (64) | | | (241) | | | (470) | |
| Net cash used by financing activities | |
| Net increase (decrease) in cash and cash equivalents | |
| Cash and cash equivalents at beginning of year | Cash and cash equivalents at beginning of year | 112 | | | 353 | | | 823 | |
| Cash and cash equivalents at end of year | Cash and cash equivalents at end of year | $ | 48 | | | $ | 112 | | | $ | 353 | |
The accompanying notes are an integral part of these consolidated financial statements.
8062 | CLF 2023 FORM 10-K
Statements of Consolidated Changes in EquitySTATEMENTS OF CONSOLIDATED CHANGES IN EQUITY
Cleveland-Cliffs Inc. and SubsidiariesCLEVELAND-CLIFFS INC. AND SUBSIDIARIES
| | (In Millions) |
| Cliffs Shareholders | |
| Number
of
Common
Shares Outstanding | | Par Value of Common
Shares Issued | | Capital in
Excess of
Par Value
of Shares | | Retained Earnings
(Deficit) | | Common
Shares
in
Treasury | | AOCI
(Loss) | | Non-
controlling
Interest | | Total |
| December 31, 2018 | 293 | | | $ | 37 | | | $ | 3,917 | | | $ | (3,060) | | | $ | (186) | | | $ | (284) | | | $ | — | | | $ | 424 | |
| Comprehensive income (loss) | — | | | — | | | — | | | 293 | | | — | | | (35) | | | — | | | 258 | |
| Stock and other incentive plans | 2 | | | — | | | (44) | | | — | | | 48 | | | — | | | — | | | 4 | |
| Common share repurchases | (24) | | | — | | | — | | | — | | | (253) | | | — | | | — | | | (253) | |
| Common share dividends ($0.27 per share) | — | | | — | | | — | | | (75) | | | — | | | — | | | — | | | (75) | |
| December 31, 2019 | 271 | | | $ | 37 | | | $ | 3,873 | | | $ | (2,842) | | | $ | (391) | | | $ | (319) | | | $ | — | | | $ | 358 | |
| Comprehensive income (loss) | — | | | — | | | — | | | (122) | | | — | | | 186 | | | 41 | | | 105 | |
| Stock and other incentive plans | 2 | | | — | | | (24) | | | — | | | 37 | | | — | | | — | | | 13 | |
| Acquisition of AK Steel | 127 | | | 16 | | | 602 | | | — | | | — | | | — | | | 330 | | | 948 | |
| Acquisition of ArcelorMittal USA | 78 | | | 10 | | | 980 | | | — | | | — | | | — | | | 13 | | | 1,003 | |
| Common share dividends ($0.06 per share) | — | | | — | | | — | | | (25) | | | — | | | — | | | — | | | (25) | |
| Net distributions to noncontrolling interests | — | | | — | | | — | | | — | | | — | | | — | | | (61) | | | (61) | |
| Cliffs Shareholders | |
| (In millions) | |
| (In millions) | |
| (In millions) | | Number
of
Common
Shares Outstanding | | Par Value of Common
Shares Issued | | Capital in
Excess of
Par Value
of Shares | | Retained Earnings
(Deficit) | | Common
Shares
in
Treasury | | AOCI
(Loss) | | Non-
controlling
Interests | | Total |
| December 31, 2020 | December 31, 2020 | 478 | | | $ | 63 | | | $ | 5,431 | | | $ | (2,989) | | | $ | (354) | | | $ | (133) | | | $ | 323 | | | $ | 2,341 | |
| Comprehensive income (loss) | — | | | — | | | — | | | 2,988 | | | — | | | 751 | | | 45 | | | 3,784 | |
| Comprehensive income | |
| Issuance of common shares | Issuance of common shares | 20 | | | — | | | 78 | | | — | | | 244 | | | — | | | — | | | 322 | |
| Stock and other incentive plans | Stock and other incentive plans | 2 | | | — | | | (8) | | | — | | | 28 | | | — | | | — | | | 20 | |
| Series B Redeemable Preferred Stock redemption | Series B Redeemable Preferred Stock redemption | — | | | — | | | (604) | | | — | | | — | | | — | | | — | | | (604) | |
| 1.500% 2025 Convertible Senior Notes redemption | 1.500% 2025 Convertible Senior Notes redemption | — | | | — | | | (5) | | | — | | | — | | | — | | | — | | | (5) | |
| Acquisition of ArcelorMittal USA - Measurement period adjustments | Acquisition of ArcelorMittal USA - Measurement period adjustments | — | | | — | | | — | | | — | | | — | | | — | | | (22) | | | (22) | |
| Net distributions to noncontrolling interests | Net distributions to noncontrolling interests | — | | | — | | | — | | | — | | | — | | | (62) | | | (62) | |
| December 31, 2021 | December 31, 2021 | 500 | | | $ | 63 | | | $ | 4,892 | | | $ | (1) | | | $ | (82) | | | $ | 618 | | | $ | 284 | | | $ | 5,774 | |
| Comprehensive income | |
| Stock and other incentive plans | |
| 1.500% 2025 Convertible Senior Notes redemption | |
| Common share repurchases | |
| Net distributions to noncontrolling interests | |
| December 31, 2022 | |
| Comprehensive income (loss) | |
| | Stock and other incentive plans | |
| Stock and other incentive plans | |
| Stock and other incentive plans | |
| Common share repurchases, net of excise tax | |
| Net distributions to noncontrolling interests | |
| December 31, 2023 | |
The accompanying notes are an integral part of these consolidated financial statements.
8163 | CLF 2023 FORM 10-K
Notes to Consolidated Financial StatementsNOTES TO CONSOLIDATED FINANCIAL STATEMENTS
Cleveland-Cliffs Inc. and SubsidiariesCLEVELAND-CLIFFS INC. AND SUBSIDIARIES
NOTE 1 - BASIS OF PRESENTATION AND SIGNIFICANT ACCOUNTING POLICIES
Business, Consolidation and PresentationBUSINESS, CONSOLIDATION AND PRESENTATION
Nature of BusinessNATURE OF BUSINESS
Cliffs isWe are the largest flat-rolled steel producer in North America. Founded in 1847 as a mine operator, we are also the largest manufacturer of iron ore pellets in North America. We are vertically integrated from mined raw materials, direct reduced iron and ferrous scrap to primary steelmaking and downstream finishing, stamping, tooling and tubing. We serve a diverse range of markets due to our comprehensive offering of flat-rolled steel products and are the largest supplier of steel to the automotive industry in North America.America and serve a diverse range of other markets due to our comprehensive offering of flat-rolled steel products. Headquartered in Cleveland, Ohio, we employ approximately 26,00028,000 people across our operations in the United States and Canada.Canada, of which approximately 20,000 were represented by labor unions under various agreements. More than 90% of our hourly workforce is represented by three prominent unions - USW, UAW and IAM.
Unless otherwise noted, discussion of our business and results of operations in this Annual Report on Form 10-K refers to our continuing operations.
Acquisition of FPT
On November 18, 2021, we completed the acquisition of FPT. FPT is a leading prime ferrous scrap processor in the U.S. FPT's operations consist of 22 scrap facilities located primarily in the Midwest region of the United States.
Refer to NOTE 3 - ACQUISITIONS for further information.
Business OperationsBUSINESS OPERATIONS
We are organized into 4four operating segments based on differentiated products, Steelmaking, Tubular, Tooling and Stamping and European Operations. We primarily operate through 1one reportable segment – the Steelmaking segment.
Basis of ConsolidationBASIS OF CONSOLIDATION
The condensed consolidated financial statements consolidate our accounts and the accounts of our wholly owned subsidiaries, all subsidiaries in which we have a controlling interest and VIEs for which we are the primary beneficiary. All intercompany transactions and balances are eliminated upon consolidation.
Investments in AffiliatesINVESTMENTS IN AFFILIATES
We have investments in several businesses accounted for using the equity method of accounting. These investments are included within our Steelmaking segment. We review an investment for impairment when circumstances indicate that a loss in value below its carrying amount is other than temporary.
As of December 31, 2019, our 23% ownership in Hibbing was recorded as an equity method investment. As a result of the acquisition of ArcelorMittal USA, we acquired an additional 62.3% ownership interest in Hibbing. As of both December 31, 2021 and December 31, 2020, our ownership in the Hibbing joint venture was 85.3% and was fully consolidated within our operating results with a noncontrolling interest.
Our investment in affiliates of $128$123 million and $105$133 million as of December 31, 20212023 and 2020,2022, respectively, was classified in Other non-current assets.
Significant Accounting PoliciesSIGNIFICANT ACCOUNTING POLICIES
We consider the following policies to be beneficial in understanding the judgments involved in the preparation of our consolidated financial statements and the uncertainties that could impact our financial condition, results of operations and cash flows. Certain prior period amounts have been reclassified to conform with the current year presentation.
Use of EstimatesUSE OF ESTIMATES
The preparation of financial statements in conformity with GAAP requires management to make estimates and assumptions that affect the reported amounts of assets and liabilities and disclosure of contingent assets and liabilities at the date of the financial statements and the reported amounts of revenues and expenses during the
reporting period. Our mineral reserves; future realizable cash flow; environmental, reclamation and closure obligations; valuation of business combinations, goodwill, long-lived assets, inventory, tax assets and post-employment, post-retirement and other employee benefit liabilities; reserves for contingencies and litigation require the use of various management estimates and assumptions. Actual results could differ from estimates. Management reviews its estimates on an ongoing basis. Changes in facts and circumstances may alter such estimates and affect the results of operations and financial position in future periods.
Business CombinationsBUSINESS COMBINATIONS
Assets acquired and liabilities assumed in a business combination are recognized and measured based on their estimated fair values at the acquisition date, while the acquisition-related costs are expensed as incurred. Any excess of the purchase consideration when compared to the fair value of the net tangible and intangible assets acquired if any, is recorded as goodwill. We engaged independent valuation specialists to assist with the determination of the fair value of assets acquired, liabilities assumed, noncontrolling interest, and goodwill, for the acquisitions. If the initial accounting for the business combination is incomplete by the end of the reporting period in which the acquisition occurs, an estimate will be recorded. Subsequent to the acquisition date, and not later than one year from the acquisition date, we will record any material adjustments to the initial estimate based on new information obtained that would have existed as of the date of the acquisition. Any adjustment that arises from information obtained that did not exist as of the date of the acquisition will be recorded in the period the adjustment arises.
Cash and Cash EquivalentsCASH AND CASH EQUIVALENTS
Cash and cash equivalents include cash on hand and on deposit as well as all short-term securities held for the primary purpose of general liquidity. We routinely monitor and evaluate counterparty credit risk related to the financial institutions in which our short-term investment securities are held. Where right of offset exists, we report cash balances net.
Trade Accounts Receivable and Allowance for Credit Loss
TRADE ACCOUNTS RECEIVABLE AND ALLOWANCE FOR CREDIT LOSS
Trade accounts receivable are recorded at the point control transfers and represent the amount of consideration we expect to receive in exchange for transferred goods and do not bear interest. We establish provisions for expected lifetime losses on accounts receivable at the time a receivable is recorded based on historical experience, customer credit quality and forecasted economic conditions. We regularly review our accounts receivable balances and the allowance for credit loss and establish or adjust the allowance as necessary using the specific identification method in accordance with CECL.method. We evaluate the aggregation and risk characteristics of receivable pools and develop loss rates that reflect historical collections, current forecasts of future economic conditions over the time horizon we are exposed to credit risk, and payment terms or conditions that may materially affect future forecasts.
InventoriesINVENTORIES
Inventories are generally stated at the lower of cost or net realizable value using average cost, excluding depreciation and amortization. Certain iron ore inventories are stated at the lower of cost or market using the LIFO method.
Refer to NOTE 2 - SUPPLEMENTARYDERIVATIVE FINANCIAL STATEMENT INFORMATION for further information.
Derivative Financial Instruments and Hedging ActivitiesINSTRUMENTS AND HEDGING ACTIVITIES
We are exposed to certain risks related to the ongoing operations of our business, including those caused by changes in commodity prices and energy rates. We have established policies and procedures, including the use of certain derivative instruments, to manage such risks.
Derivative financial instruments are recognized as either assets or liabilities inon the Statements of Consolidated Financial Position and measured at fair value. On the date a qualifying hedging instrument is executed, we designate the hedging instrument as a hedge of the variability of cash flows to be received or paid related to a forecasted transaction (cash flow hedge). We formally document all relationships between hedging instruments and hedged items, as well as our risk-management objective and strategy for undertaking various hedge transactions. This process includes linking all derivatives that are designated as cash flow hedges to specific firm commitments or forecasted transactions. We also formally assess, both at the hedge's inception and on an ongoing basis, whether the derivatives that are used in hedging transactions are highly effective in offsetting changes in cash flows of the related hedged items. When it is determined that a derivative is not highly effective as a hedge, we discontinue hedge
accounting prospectively and record all future changes in fair value in the period of the instrument's earnings or losses.
For derivative instruments that have been designated as cash flow hedges, the changes in fair value are recorded in Accumulated other comprehensive income (loss). Amounts recorded in Accumulated other comprehensive income (loss) are reclassified to earnings or losses in the period the underlying hedged transaction affects earnings or when the underlying hedged transaction is no longer reasonably possible of occurring. The cash flows resulting from these derivative instruments are classified in Other, net in operating activities on the Statements of Consolidated Cash Flows.
For derivative instruments that have not been designated as cash flow hedges, changes in fair value are recorded in the period of the instrument's earnings or losses.
Property, Plant and EquipmentPROPERTY, PLANT AND EQUIPMENT
Our properties are stated at cost less accumulated depreciation. Depreciation of plant and equipment is computed principally by the straight-line method based on estimated useful lives. Depreciation continues to be recognized when operations are idled temporarily. Depreciation and depletion are recorded over the following estimated useful lives:
| | | | | | | | | | | | | | |
| Asset Class | | Basis | | Life |
| Land, land improvements and mineral rights | | | | |
| Land and mineral rights | | Units of production | | Life of mine |
| Land improvements | | Straight line | | 20 to 45 years |
| Buildings | | Straight line | | 20 to 45 years |
| Equipment | | Straight line/Double declining balance | | 3 to 2745 years |
Refer to NOTE 6 - PROPERTY, PLANT AND EQUIPMENT for further information.
GoodwillGOODWILL
Goodwill represents the excess purchase price paid over the fair value of the net assets from an acquisition. Goodwill is not amortized for financial statement purposes, but itpurposes. Goodwill is assessedtested on a qualitative or quantitative basis for impairment at the reporting unit level on an annual basis on October 1 (orand between annual tests if an event occurs or circumstances change that would more frequentlylikely than not reduce the fair value of a reporting unit below its carrying value. We have an unconditional option to bypass the qualitative test for any reporting unit in any period and proceed directly to performing the quantitative test. Should our qualitative test indicate that it is more likely than not that the fair value of a reporting unit is less than its carrying value, we perform a quantitative test to determine the amount of impairment, if necessary).any, to the carrying value of the reporting unit and its associated goodwill.
Refer to NOTE 3 - ACQUISITIONS and NOTE 7 - GOODWILL ANDOTHER INTANGIBLE ASSETS AND LIABILITIES for further information.
Other Intangible Assets and Liabilities
Intangible assets and liabilities are subject to periodic amortization on a straight-line basis over their estimated useful lives.
Refer to NOTE 3 - ACQUISITIONS and NOTE 7 - GOODWILL AND INTANGIBLE ASSETS AND LIABILITIES for further information.
LeasesLEASES
We determine if an arrangement contains a lease at inception. We recognize right-of-use assets and lease liabilities associated with leases based on the present value of the future minimum lease payments over the lease term at the commencement date.
Lease terms reflect options to extend or terminate the lease when it is reasonably certain that the option will be exercised. For short-termShort-term leases (leases with an initial lease term of 12 months or less), right-of-use assets and lease liabilities are not recognized inon the consolidated balance sheet.Statements of Consolidated Financial Position. Operating lease expense is recognized on a straight-line basis over the lease term.
Refer to NOTE 13 - LEASE OBLIGATIONS for further information.
Asset ImpairmentASSET IMPAIRMENT
We monitor conditions that may affect the carrying value of our long-lived tangible and intangible assets when events and circumstances indicate that the carrying value of the asset groups may not be recoverable. In order to determine if assets have been impaired, assets are grouped and tested at the lowest level for which identifiable, independent cash flows are available ("asset group"). The measurement of the impairment loss to be recognized is
based on the difference between the fair value and the carrying value of the asset group. Fair value can be determined using a market approach, income approach or cost approach.
For the years ended December 31, 2021, 2020 and 2019, no impairment indicators were present that would indicate the carrying value of any of our asset groups may not be recoverable; as a result, no impairment assessments were required.
Fair Value MeasurementsFAIR VALUE MEASUREMENTS
ASC Topic 820, Fair Value Measurements and Disclosures, establishes a three-level valuation hierarchy for classification of fair value measurements. The valuation hierarchy is based upon the transparency of inputs to the valuation of an asset or liability as of the measurement date. Inputs refer broadly to the assumptions that market participants would use in pricing an asset or liability. Inputs may be observable or unobservable. Observable inputs are inputs that reflect the assumptions market participants would use in pricing the asset or liability developed based on market data obtained from independent sources. Unobservable inputs are inputs that reflect our own views about the assumptions market participants would use in pricing the asset or liability developed based on the best information available in the circumstances. The three-tier hierarchy of inputs is summarized below:
•Level 1 — Valuation is based upon quoted prices (unadjusted) for identical assets or liabilities in active markets.
•Level 2 — Valuation is based upon quoted prices for similar assets and liabilities in active markets, or other inputs that are observable for the asset or liability, either directly or indirectly, for substantially the full term of the financial instrument.
•Level 3 — Valuation is based upon other unobservable inputs that are significant to the fair value measurement.
The classification of assets and liabilities within the valuation hierarchy is based upon the lowest level of input that is significant to the fair value measurement in its entirety.
Refer to NOTE 9 - FAIR VALUE OF FINANCIAL INSTRUMENTS and NOTE 10 - PENSIONSPENSION AND OTHER POSTRETIREMENT BENEFITS for further information.
Pensions and Other Postretirement Benefits
We offer defined benefit pension plans, defined contribution pension plans and OPEB plans, primarily consisting of retiree healthcare benefits as part of our total compensation and benefits programs.
We recognize the funded or unfunded status of our pension and OPEB obligations on the Statements of Consolidated Financial Position based on the difference between the market value of plan assets and the actuarial present value of our retirement obligations on that date, on a plan-by-plan basis. If the plan assets exceed the pension and OPEB obligations, the amount of the surplus is recorded as an asset; if the pension and OPEB obligations exceed the plan assets, the amount of the underfunded obligations is recorded as a liability. Year-end balance sheet adjustments to pension and OPEB assets and obligations are recorded as Accumulated other comprehensive income (loss) inon the Statements of Consolidated Financial Position.
The actuarial estimates of the PBO (Projected benefit obligation) and APBO (Accumulated postretirement benefit obligation) incorporate various assumptions including the discount rates, the rates of increases in compensation, healthcare cost trend rates, mortality, retirement timing, employee turnover and employee turnover.other demographic assumptions. The discount rate is determined based on the prevailing year-end rates for high-grade corporate bonds with a duration matching the expected cash flow timing of the benefit payments from the various plans. The remaining assumptions are based on our estimates of future events by incorporating historical trends and future expectations. The amount of net periodic cost that is recorded in the Statements of Consolidated Operations consists of several components including service cost, interest cost, expected return on plan assets, and amortization of previously unrecognized amounts. Service cost represents the value of the benefits earned in the current year by the participants. Interest cost represents the cost associated with the passage of time. Certain items, such as plan amendments, gains and/or losses resulting from differences between actual and assumed results for demographic and economic factors affecting the obligations and assets of the plans, and changes in other assumptions are subject to deferred recognition for income and expense purposes. The expected return on plan assets is calculated on a plan-by-plan basis using each plan's strategic asset allocation and our expected long-term capital market return assumptions. Service costs are classified within Cost of goods sold, Selling, general and administrative expenses and Miscellaneous – net while the interest cost, expected return on assets, amortization of prior service costs/credits,
net actuarial gain/loss, and other costs are classified within Net periodic benefit credits (costs) other than service cost component.
ReferCumulative actuarial gains and losses will be amortized to NOTE 10 - PENSIONS AND OTHER POSTRETIREMENT BENEFITS for further information.expense using the corridor method, where gains and losses are recognized if they exceed 10% of the greater of the fair value of plan assets or the plans' benefit obligations. The amortization period varies by plan.
Labor AgreementsASSET RETIREMENT OBLIGATIONS
At December 31, 2021, we employed approximately 26,000 people, of which approximately 18,500 were represented by labor unions under various agreements. We have ten agreements that expire in 2022 and three agreements that expire in 2023. Workers at some of our North American facilities are covered by agreements with the USW, UAW and IAM, as well as several other smaller unions that have various expiration dates.
Asset Retirement Obligations
AssetAn asset retirement obligations areobligation is recognized when incurred if a reasonable estimate of fair value can be made, and recorded as liabilitiesis initially measured at fair value. The fair value of the liability is determined as the discounted value of the expected future cash flows. The asset retirement obligation is accreted over time through periodic charges to earnings. In addition, the asset retirement cost is capitalized and amortized over the life of the related asset. Reclamation costs are adjusted periodically to reflect changes in the estimated present value resulting from the passage of time and revisions to the estimates of either the timing or amount of the reclamation costs. We review, on an annual basis, unless otherwise deemed necessary, the asset retirement obligation for each
applicable operation in accordance with the provisions of ASC Topic 410, Asset Retirement and Environmental Obligations. We perform an in-depth evaluation of the liability every three years in addition to our routine annual assessments.
Future reclamation costs for inactive operations are accrued based on management’s best estimate at the end of each period of the costs expected to be incurred at a site. Such cost estimates include, where applicable, ongoing maintenance and monitoring costs. Changes in estimates at inactive operations are reflected in earningsMiscellaneous – net on the Statements of Consolidated Operations in the period an estimate is revised.
Refer to NOTE 14 - ASSET RETIREMENT OBLIGATIONS for further information.ENVIRONMENTAL REMEDIATION COSTS
Environmental Remediation Costs
Certain of ourOur operating activities are subject to various laws and regulations governing protection of the environment. We conduct our operations to protect the public health and environment and believe our operations are in compliance with applicable laws and regulations in all material respects. Our environmental liabilities, including obligations for known environmental remediation exposures, have been recognized based on the estimated cost of investigation and remediation at each site. If the cost can only be estimated as a range of possible amounts with no point in the range being more likely, the minimum of the range is accrued. Future expenditures are discounted unless the amount and timing of the cash disbursements cannot be reasonably estimated. It is possible that additional environmental obligations could be incurred, the extent of which cannot be assessed. Potential insurance recoveries have not been reflected in the determination of the liabilities.
Refer to NOTE 20 - COMMITMENTS AND CONTINGENCIES for further information.
Revenue RecognitionREVENUE RECOGNITION
Sales are recognized when our performance obligations are satisfied. Generally, our performance obligations are satisfied, control of our products is transferred and revenue is recognized at a single point in time, when title transfers to our customer for product shipped according to shipping terms. Shipping and other transportation costs charged to customers are treated as fulfillment activities and are recorded in both revenue and cost of sales at the time control is transferred to the customer.
Refer to NOTE 4 - REVENUES for further information.
Repairs and MaintenanceREPAIRS AND MAINTENANCE
Repairs, maintenance and replacement of components are expensed as incurred. The cost of major equipment overhauls is capitalized and depreciated over the estimated useful life, which is the period until the next scheduled overhauls. All other planned and unplanned repairs and maintenance costs are expensed when incurred.
Share-Based Compensation
The fair value of each performance share grant is estimated on the date of grant using a Monte Carlo simulation to forecast relative TSR performance. A correlation matrix of historical and projected stock prices was developed for both the Company and its predetermined peer group of mining and metals companies. The fair value assumes that the performance objective will be achieved. The expected term of the grant represents the time from the grant date to the end of the service period. We estimate the volatility of our common shares and that of the peer group of mining and metals companies using daily price intervals for all companies. The risk-free interest rate is the rate at the grant date on zero-coupon government bonds, with a term commensurate with the remaining performance period.
The fair value of the restricted stock units is determined based on the closing price of our common shares on the grant date.
Upon vesting of share-based compensation awards, we issue shares from treasury shares before issuing new shares. Forfeitures are recognized when they occur.
The fair value of stock options is estimated on the date of grant using a Black-Scholes model using the grant date price of our common shares, the option exercise price, the option’s expected term, the volatility of our common shares, the risk-free interest rate and the dividend yield over the option’s expected term.
Refer to NOTE 11 - STOCK COMPENSATION PLANS for additional information.
Income TaxesINCOME TAXES
Income taxes are based on income for financial reporting purposes, calculated using tax rates by jurisdiction, and reflect a current tax liability or asset for the estimated taxes payable or recoverable on the current year tax return and expected annual changes in deferred taxes. Any interest or penalties on income tax are recognized as a component of Income tax benefit (expense)expense.
We account for income taxes under the asset and liability method, which requires the recognition of deferred tax assets and liabilities for the expected future tax consequences of events that have been included in the financial statements. Under this method, deferred tax assets and liabilities are determined based on the differences between the financial statement and tax basis of assets and liabilities using enacted tax rates in effect for the year in which the differences are expected to reverse. The effect of a change in tax rates on deferred tax assets and liabilities is recognized within Net income (loss) in the period that includes the enactment date.
We record net deferred tax assets to the extent we believe these assets will more likely than not be realized. In making such determination, we consider all available positive and negative evidence, including scheduled reversals of deferred tax liabilities, projected future taxable income, tax planning strategies and recent financial results of operations.
Accounting for uncertainty in income taxes recognized in the financial statements requires that a tax benefit from an uncertain tax position be recognized when it is more likely than not that the position will be sustained upon examination, including resolutions of any related appeals or litigation processes, based on technical merits.
Refer to NOTE 12 - INCOME TAXES for further information.
Foreign CurrencyFOREIGN CURRENCY
Our financial statements are prepared with the U.S. dollar as the reporting currency, and the functional currency of all subsidiaries is the U.S. dollar, except for our European Operations for which the functional currency is the Euro.
Earnings Per ShareEARNINGS PER SHARE
We present both basic and diluted EPS amounts for continuing operations and discontinued operations. Total basic EPS amounts are calculated by dividing Net income (loss) attributable to Cliffs shareholders, less the earnings allocated to any of our outstanding Series B Participating Redeemable Preferred Stock, by the weighted average number of common shares outstanding during the period presented.
Total diluted EPS amounts are calculated by dividing Net income (loss) attributable to Cliffs shareholders by the weighted average number of common shares, common share equivalents under stock plans using the treasury-stock method, common share equivalents of the Series B Participating Redeemable Preferred Stock using the if-
convertedif-converted method and the calculated common share equivalents in excess of the conversion rate related to our 1.500% 2025 Convertible Senior Notes using the treasury-stock method. Common share equivalents are excluded from EPS computations in the periods in which they have an anti-dilutive effect.
Refer to NOTE 8 - DEBT AND CREDIT FACILITIESand NOTE 19 - EARNINGS PER SHARE for further information.
Variable Interest EntitiesVARIABLE INTEREST ENTITIES
We assess whether we have a variable interest in legal entities in which we have a financial relationship and, if so, whether or not those entities are VIEs. A VIE is an entity with insufficient equity at risk for the entity to finance its activities without additional
subordinated financial support or in which equity investors lack the characteristics of a controlling financial interest. If an entity is determined to be a VIE, we evaluate whether we are the primary beneficiary. The primary beneficiary analysis is a qualitative analysis based on power and economics. We conclude that we are the primary beneficiary and consolidate the VIE if we have both (i) the power to direct the activities of the VIE that most significantly influence the VIE's economic performance and (ii) the obligation to absorb losses of, or the right to receive benefits from, the VIE that could potentially be significant to the VIE.
Refer to NOTE 18 - VARIABLE INTEREST ENTITIES for additional information.RECENT ACCOUNTING PRONOUNCEMENTS AND LEGISLATION
Recent Accounting Pronouncements
Issued and Not EffectiveACCOUNTING PRONOUNCEMENTS
In August 2020,September 2022, the FASB issued ASU 2020-06, Debt—Debt with ConversionNo. 2022-04, Liabilities - Supplier Finance Programs (Subtopic 405-50): Disclosure of Supplier Finance Program Obligations. This guidance requires annual and Other Options (Subtopic 470-20) and Derivatives and Hedging—Contracts in Entity’s Own Equity (Subtopic 815-40). This update requires certain convertible instruments to be accounted for as a single liability measured at its amortized cost. Additionally, the update requires the useinterim disclosure of the "if-converted" method, removing the treasury stock method, when calculating diluted shares. The two methodskey terms of adoption are the fulloutstanding supplier finance programs and modified retrospective approaches. We expect to utilize the modified retrospective approach. Using this approach, the guidance shall be applied to transactions outstanding asa roll-forward of the beginningrelated obligations. The new standard does not affect the recognition, measurement or financial statement presentation of the supplier finance program obligations. We have adopted this standard, except for the roll-forward information, which is effective for fiscal year in which the amendment is adopted. Subsequent to the year endedyears beginning after December 31, 2021, we redeemed all of our outstanding 1.500% 2025 Convertible Senior Notes; therefore, there will be no impact as a result of our adoption of this update as of January 1, 2022.2023. Refer to NOTE 212 - SUBSEQUENT EVENTSSUPPLEMENTARY FINANCIAL STATEMENT INFORMATION for further information.
In November 2023, the FASB issued ASU No. 2023-07, Segment Reporting (Topic 280): Improvements to Reportable Segment Disclosures. This guidance requires additional annual and interim disclosures for reportable segments. This new standard does not affect the recognition, measurement or financial statement presentation. The amendments are effective for fiscal years beginning after December 15, 2023, and interim periods within fiscal years beginning after December 15, 2024.
In December 2023, the FASB issued ASU No. 2023-09, Income Taxes (Topic 740): Improvements to Income Tax Disclosures. This guidance requires additional annual and interim disclosures for income taxes. This new standard does not affect the recognition, measurement or financial statement presentation. The amendments are effective for fiscal years beginning after December 15, 2024.
LEGISLATION
In August 2022, the U.S. government signed the Inflation Reduction Act into law. The Inflation Reduction Act introduced, among other legislation, a 1% excise tax on the fair market value of stock repurchases net of the fair market value of stock issuances during the tax year and a 15% U.S. corporate alternative minimum tax on adjusted financial statement income. The excise tax and corporate alternative minimum tax, both of which are immaterial to our financial statements, are effective on transactions occurring after December 31, 2022. The excise tax is recorded in equity as a cost of common shares in treasury. In addition, a 15% global minimum corporate tax under Pillar Two of the Organization for Economic Cooperation and Development’s Global Anti-Base Erosion Rules has been adopted by the European Union requiring its Member States to implement national legislation applicable for fiscal years starting on or after December 31, 2023. This global minimum corporate tax is expected to be immaterial to our 2024 financial statements.
NOTE 2 - SUPPLEMENTARY FINANCIAL STATEMENT INFORMATION
Allowance for Credit LossesALLOWANCE FOR CREDIT LOSSES
The following is a roll-forward of our allowance for credit losses associated with Accounts receivable, net:
| | (In Millions) |
| 2021 | | 2020 |
| (In millions) | | (In millions) | 2023 | | 2022 |
| Allowance for credit losses as of January 1 | Allowance for credit losses as of January 1 | $ | (5) | | | $ | — | |
| Decrease (increase) in allowance | 1 | | | (5) | |
| Increase in allowance | |
| Allowance for credit losses as of December 31 | Allowance for credit losses as of December 31 | $ | (4) | | | $ | (5) | |
InventoriesINVENTORIES
The following table presents the detail of our Inventories inon the Statements of Consolidated Financial Position:
| | (In Millions) |
| Year Ended December 31, |
| 2021 | | 2020 |
| December 31, | | | December 31, |
| (In millions) | | (In millions) | 2023 | | 2022 |
| Product inventories | Product inventories | | | |
| Finished and semi-finished goods | Finished and semi-finished goods | $ | 2,814 | | | $ | 2,125 | |
| Finished and semi-finished goods | |
| Finished and semi-finished goods | |
| | Raw materials | |
| Raw materials | |
| Raw materials | Raw materials | 2,070 | | | 1,431 | |
| Total product inventories | Total product inventories | 4,884 | | | 3,556 | |
| Manufacturing supplies and critical spares | Manufacturing supplies and critical spares | 304 | | | 272 | |
| Inventories | Inventories | $ | 5,188 | | | $ | 3,828 | |
The excess of current cost over LIFO cost of iron ore inventories was $124$131 million and $104$169 million at December 31, 20212023 and 2020,2022, respectively. As of December 31, 2021,2023, the product inventory balance for iron ore inventories increased, resulting in a LIFO increment in 2021.2023. The effect of the inventory build was an increase in Inventories of $45$21 million inon the Statements of Consolidated OperationsFinancial Position for the year ended December 31, 2021.2023. As of December 31, 2020,2022, the product inventory balance
for iron ore inventories decreased, resulting in thea liquidation of a LIFO layer.layer in 2022. The effect of the inventory reduction was an increase in Cost of goods sold of $30$36 million inon the Statements of Consolidated Operations for the year ended December 31, 2020.2022.
SUPPLY CHAIN FINANCE PROGRAMS
We negotiate payment terms directly with our suppliers for the purchase of goods and services. We currently offer voluntary supply chain finance programs that enable our suppliers to sell their Company receivables to financial intermediaries, at the sole discretion of both the suppliers and financial intermediaries. No guarantees are provided by us or our subsidiaries under the supply chain finance programs. The supply chain finance programs allow our suppliers to be paid by the financial intermediaries earlier than the due date on the applicable invoice. Supply chain finance programs that extend terms or provide us an economic benefit are classified as short-term financings. As of December 31, 2023 and 2022, we had $21 million and $19 million, respectively, deemed as short-term financings that are classified in Other current liabilities. Additionally, as of December 31, 2023 and 2022, we had $91 million and $112 million, respectively, classified as Accounts payable.
SALE OF BUSINESS
On October 6, 2023, we entered into a membership interest purchase agreement for the sale of the legal entities owning, among other things, our closed coal mines in Pennsylvania. As a result of the sale, we recorded a gain of $63 million classified in Miscellaneous – net in theStatements of Consolidated Operations and as Other in operating activities on the Statements of Consolidated Cash Flow InformationFlows. As part of this transaction, we received $35 million in proceeds related to the sale that is classified as Other investing activities on the Statements of Consolidated Cash Flows.
CASH FLOW INFORMATION
A reconciliation of capital additions to cash paid for capital expenditures is as follows:
| | (In Millions) |
| Year Ended December 31, |
| 2021 | | 2020 | | 2019 |
| Year Ended December 31, | | | Year Ended December 31, |
| (In millions) | | (In millions) | 2023 | | 2022 | | 2021 |
| Capital additions | Capital additions | $ | 857 | | | $ | 483 | | | $ | 690 | |
| Less: | Less: | |
| Non-cash accruals | Non-cash accruals | 102 | | | (86) | | | 15 | |
| Non-cash accruals | |
| Non-cash accruals | |
| Equipment financed with seller | |
| Right-of-use assets - finance leases | Right-of-use assets - finance leases | 50 | | | 44 | | | 29 | |
| Grants | — | | | — | | | (10) | |
| Cash paid for capital expenditures including deposits | Cash paid for capital expenditures including deposits | $ | 705 | | | $ | 525 | | | $ | 656 | |
Additionally, included within Other investing activities on the Statements of Consolidated Cash Flows are grant reimbursements related to governmental funded capital projects. For the years ended December 31, 2023, 2022 and 2021, grant reimbursements were $13 million, $27 million and $2 million, respectively.
Cash payments (receipts) for interest and income taxes are as follows:
| | | | | | | | | | | | | | | | | |
| (In Millions) |
| 2021 | | 2020 | | 2019 |
| Taxes paid on income | $ | 166 | | | $ | 5 | | | $ | — | |
| Income tax refunds | (16) | | | (120) | | | (118) | |
Interest paid on debt obligations net of capitalized interest1 | 299 | | | 170 | | | 98 | |
| | | | | |
1 Capitalized interest was $6 million, $53 million and $25 million for the years ended December 31, 2021, 2020 and 2019, respectively. |
| | | | | | | | | | | | | | | | | |
| Year Ended December 31, |
| (In millions) | 2023 | | 2022 | | 2021 |
| Income taxes paid | $ | 94 | | | $ | 334 | | | $ | 166 | |
| Income tax refunds | (205) | | | (3) | | | (16) | |
Interest paid on debt obligations net of capitalized interest1 | 256 | | | 249 | | | 299 | |
| | | | | |
1 Capitalized interest was $12 million, $9 million and $6 million for the years ended December 31, 2023, 2022 and 2021, respectively. |
Other Non-Cash Investingnon-cash investing and Financing Activitiesfinancing activities are as follows:
| | | | | | | | | | | | | | | | | |
| (In Millions) |
| 2021 | | 2020 | | 2019 |
| Fair value of settlement of a pre-existing relationship as part of consideration in connection with FPT Acquisition | $ | (20) | | | $ | — | | | $ | — | |
| Fair value of common shares issued as part of consideration in connection with AM USA Transaction | — | | | 990 | | | — | |
| Fair value of Series B Participating Redeemable Preferred Stock issued as part of consideration in connection with AM USA Transaction | — | | | 738 | | | — | |
| Fair value of settlement of a pre-existing relationship as part of consideration in connection with AM USA Transaction | — | | | 237 | | | — | |
| Fair value of common shares issued as consideration in connection with AK Steel Merger | — | | | 618 | | | — | |
| Fair value of equity awards assumed in connection with AK Steel Merger | — | | | 4 | | | — | |
| | | | | | | | | | | | | | | | | |
| Year Ended December 31, |
| (In millions) | 2023 | | 2022 | | 2021 |
| 1.500% 2025 Convertible Senior Notes redemption | $ | — | | | $ | 25 | | | $ | — | |
| Fair value of settlement of a pre-existing relationship as part of consideration in connection with FPT Acquisition | — | | | — | | | (20) | |
NOTE 3 - ACQUISITIONS
In 2020, we acquired 2 major steelmakers, AK Steel and ArcelorMittal USA, vertically integrating our legacy iron ore business with steel production. In 2021, we also entered into the scrap business with the FPT Acquisition. We are vertically integrated from mined raw materials, direct reduced iron and ferrous scrap to primary steelmaking and downstream finishing, stamping, tooling and tubing. We now have a presence across the entire steel manufacturing process, from mining to pelletizing to the development and production of finished high value steel products. The AK Steel Merger combined Cliffs, a historic producer of iron ore pellets, with AK Steel, a producer of flat-rolled carbon, stainless and electrical steel products, to create a vertically integrated producer of value-added iron ore and steel products. The AM USA Transaction transformed us into a fully-integrated steel enterprise with the size and scale to expand product offerings and improve through-the-cycle margins. The FPT Acquisition gives us a competitive advantage in sourcing prime scrap, a key raw material for our steelmaking facilities.ACQUISITION OVERVIEW
FPT Acquisition
Overview
On November 18, 2021, pursuant to the FPT Acquisition Agreement, we completed the FPT Acquisition, in which we were the acquirer. Following theThe FPT Acquisition entered us into the operating results of FPT are includedscrap business and provides us a competitive advantage in sourcing prime scrap, a key raw material for our consolidated financial statements. For the period subsequent to the FPT Acquisition (November 18, 2021 through December 31, 2021), FPT generated steelmaking facilities.
Revenues69 of $153 million and a loss of $18 million included within| Net income (loss) attributable to Cliffs shareholders,CLF which included $22 million related to amortization2023 FORM 10-K
Additionally, we incurred acquisition-related costs, excluding severance costs, of $1 million for the year ended December 31, 2021 in connection with the FPT Acquisition, which was recorded in Acquisition-related costs on the Statements of Consolidated Operations.
The fair value of the total purchase consideration was determined as follows:
| | | | | |
| (In Millions)millions) | |
| Cash consideration: | |
Cash consideration (subjectpursuant to customary working capital adjustments)the FPT Acquisition Agreement | $ | 775778 | |
| Cash consideration paid related to IRC Section 338(h)(10) | 23 | |
| Total cash consideration | 801 | |
| Fair value of settlement of a pre-existing relationship | (20) | |
| Total purchase consideration | $ | 755781 | |
The cash portion of the purchase price is subject to customary working capital adjustments. Additionally, if the Company decides to make anyWe made certain elections under Section 338(h)(10) of the IRC with respect to entities acquired in connection with the FPT Acquisition that were finalized during the third quarter of 2022, which changed the final cash consideration could potentially change.consideration.
Valuation Assumption and Purchase Price AllocationVALUATION ASSUMPTION AND PURCHASE PRICE ALLOCATION
We estimated fair values at November 18, 2021 for the preliminaryThe allocation of consideration to the net tangible and intangible assets acquired and liabilities assumed in connection with the FPT Acquisition. DuringAcquisition was based on estimated fair values at November 18, 2021, and was finalized during the measurement period, we will continue to obtain information to assist in finalizing the fair value of assets acquired and
liabilities assumed, which may differ materially from these preliminary estimates. If we determine any measurement period adjustments are material, we will apply those adjustments, including any related impacts to net income, in the reporting period in which the adjustments are determined. We are in the process of conductingquarter ended December 31, 2022. The following is a valuationsummary of the assets acquired and liabilities assumed related to the FPT Acquisition, most notably, inventories, personal and real property, leases, investments, deferred taxes, environmental obligations and intangible assets, and the final allocation will be made when completed, including the result of any identified goodwill. Accordingly, the provisional measurements noted below are preliminary and subject to modification in the future.
The preliminary purchase price allocation to assets acquired and liabilities assumed in the FPT Acquisition was:Acquisition:
| | | | | |
| (In Millions) |
| Initial Allocation of Consideration |
Cash and cash equivalents | $ | 9 | |
Accounts receivable, net | 233 | |
Inventories | 137 | |
Other current assets | 4 | |
Property, plant and equipment | 179 | |
Other non-current assets | 74 | |
Accounts payable | (122) | |
Accrued employment costs | (8) | |
State and local taxes | (1) | |
Other current liabilities | (8) | |
| |
| |
| |
Other non-current liabilities | (21) | |
| |
Net identifiable assets acquired | 476 | |
Goodwill | 279 | |
Total net assets acquired | $ | 755 | |
| | | | | | | | | | | | | | | | | |
| (In millions) | Initial Allocation of Consideration | | Measurement
Period Adjustments | | Final Allocation of Consideration as of December 31, 2022 |
| Cash and cash equivalents | $ | 9 | | | $ | — | | | $ | 9 | |
| Accounts receivable, net | 233 | | | 2 | | | 235 | |
| Inventories | 137 | | | (2) | | | 135 | |
| Other current assets | 4 | | | (1) | | | 3 | |
| Property, plant and equipment | 179 | | | 12 | | | 191 | |
| Other non-current assets | 74 | | | (2) | | | 72 | |
| Accounts payable | (122) | | | — | | | (122) | |
| Accrued employment costs | (8) | | | — | | | (8) | |
| | | | | |
| Other current liabilities | (9) | | | 3 | | | (6) | |
| | | | | |
| | | | | |
| | | | | |
| Other non-current liabilities | (21) | | | — | | | (21) | |
| | | | | |
| Net identifiable assets acquired | 476 | | | 12 | | | 488 | |
| Goodwill | 279 | | | 14 | | | 293 | |
| Total net assets acquired | $ | 755 | | | $ | 26 | | | $ | 781 | |
The goodwill resulting from the FPT Acquisition primarily represents the incremental benefit of providing substantial access to prime scrap for our vertically integrated steelmaking business, as well as any synergistic benefits to be realized from the FPT Acquisition within our Steelmaking segment. We have $296 million in goodwill that is deductible for tax purposes from the FPT Acquisition.
The preliminary purchase price allocated to identifiable intangible assets acquired was:
| | (In Millions) | | Weighted Average Life (In Years) |
| (In millions) | | | (In millions) | | Weighted Average Life (In years) |
| Customer relationships | Customer relationships | $ | 18 | | | 15 | Customer relationships | $ | 13 | | | 15 | | 15 |
| Supplier relationships | Supplier relationships | 18 | | | 18 | Supplier relationships | 29 | | | 18 | | 18 |
| Trade names and trademarks | Trade names and trademarks | 7 | | | 15 | Trade names and trademarks | 7 | | | 15 | | 15 |
| Total identifiable intangible assets | Total identifiable intangible assets | $ | 43 | | | 16 | Total identifiable intangible assets | $ | 49 | | | 17 | | 17 |
Intangible assets are classified as Other non-current assets on the Statements of Consolidated Financial Position.
Acquisition of ArcelorMittal USA
Overview
On December 9, 2020, pursuant to the terms of the AM USA Transaction Agreement, we purchased ArcelorMittal USA from ArcelorMittal. In connection with the closing of the AM USA Transaction, as contemplated by the terms of the AM USA Transaction Agreement, ArcelorMittal’s former joint venture partner in Kote and Tek exercised its put right pursuant to the terms of the Kote and Tek joint venture agreements. As a result, we purchased all of such joint venture partner’s interests in Kote and Tek. Following the closing of the AM USA Transaction, we own 100% of the interests in Kote and Tek.
9170 | CLF 2023 FORM 10-K
We incurred acquisition-related costs, excluding severance costs, of $3 million and $26 million for the years ended December 31, 2021 and 2020, respectively, in connection with the AM USA Transaction, which were recorded in Acquisition-related costs on the Statements of Consolidated Operations.
The fair value of the total purchase consideration was determined as follows:
| | | | | |
| (In Millions) |
Fair value of Cliffs common shares issued | $ | 990 | |
Fair value of Cliffs Series B Participating Redeemable Preferred Stock issued | 738 | |
Fair value of settlement of a pre-existing relationship | 237 | |
Cash consideration | 639 | |
Total purchase consideration | $ | 2,604 | |
The fair value of Cliffs common shares issued was calculated as follows:
| | | | | |
Number of Cliffs common shares issued | 78,186,671 |
Closing price of Cliffs common share as of December 9, 2020 | $ | 12.66 | |
Fair value of Cliffs common shares issued (in millions) | $ | 990 | |
The fair value of Cliffs Series B Participating Redeemable Preferred Stock issued was calculated as follows:
| | | | | |
Number of Cliffs Series B Participating Redeemable Preferred Stock issued | 583,273 | |
Redemption price per share as of December 9, 2020 | $ | 1,266 | |
Fair value of Cliffs Series B Participating Redeemable Preferred Stock issued (in millions) | $ | 738 | |
The fair value of the cash consideration was comprised of the following:
| | | | | |
| (In Millions) |
Cash consideration pursuant to the AM USA Transaction Agreement | $ | 505 | |
Cash consideration for purchase of the remaining JV partner's interest of Kote and Tek | 182 | |
Total cash consideration receivable | (48) | |
Total cash consideration | $ | 639 | |
The cash portion of the purchase price was subject to customary working capital adjustments, and the working capital adjustments were finalized during the second quarter of 2021. We made certain elections under Section 338(h)(10) of the IRC with respect to entities acquired in connection with the AM USA Transaction, which did not change the final cash consideration.
The fair value of the settlement of a pre-existing relationship was comprised of the following:
| | | | | |
| (In Millions) |
Accounts receivable | $ | 97 | |
Freestanding derivative asset from customer supply agreement | 140 | |
Total fair value of settlement of a pre-existing relationship | $ | 237 | |
Valuation Assumption and Purchase Price Allocation
The allocation of consideration to the net tangible and intangible assets acquired and liabilities assumed in connection with the AM USA Transaction was based on estimated fair values at December 9, 2020, and was finalized during the quarter ended December 31, 2021. The following is a summary of the purchase price allocation to assets acquired and liabilities assumed in the AM USA Transaction:
| | | | | | | | | | | | | | | | | |
| (In Millions) |
| Initial Allocation of Consideration | | Measurement
Period Adjustments | | Final Allocation Consideration as of December 31, 2021 |
| Cash and cash equivalents | $ | 35 | | | $ | — | | | $ | 35 | |
| Accounts receivable, net | 349 | | | (3) | | | 346 | |
| Inventories | 2,115 | | | 14 | | | 2,129 | |
| Other current assets | 34 | | | 2 | | | 36 | |
| Property, plant and equipment | 4,017 | | | 387 | | | 4,404 | |
| Deferred income taxes | — | | | 285 | | | 285 | |
| Other non-current assets | 158 | | | 7 | | | 165 | |
| Accounts payable | (736) | | | 8 | | | (728) | |
| Accrued employment costs | (271) | | | 5 | | | (266) | |
| State and local taxes | (76) | | | — | | | (76) | |
| Other current liabilities | (453) | | | 23 | | | (430) | |
| | | | | |
| Pension liability, non-current | (730) | | | — | | | (730) | |
| OPEB liability, non-current | (2,465) | | | — | | | (2,465) | |
| Other non-current liabilities | (598) | | | (171) | | | (769) | |
| Noncontrolling interest | (13) | | | 21 | | | 8 | |
| Net identifiable assets acquired | 1,366 | | | 578 | | | 1,944 | |
| Goodwill | 1,230 | | | (570) | | | 660 | |
| Total net assets acquired | $ | 2,596 | | | $ | 8 | | | $ | 2,604 | |
During the period subsequent to the AM USA Transaction, we made certain measurement period adjustments to the acquired assets and liabilities assumed due to clarification of information utilized to determine fair value during the measurement period. The measurement period adjustments related to the revaluation of the Company's previously held equity method investment, which is now being consolidated post-acquisition, resulting in a loss of $31 million, within Miscellaneous – net for the year ended December 31, 2021.
The goodwill resulting from the acquisition of ArcelorMittal USA primarily represents the growth opportunities in the automotive, construction, appliances, infrastructure and machinery and equipment markets, as well as any synergistic benefits to be realized from the AM USA Transaction, and was assigned to our flat steel operations within our Steelmaking segment.
Acquisition of AK Steel
Overview
On March 13, 2020, pursuant to the AK Steel Merger Agreement, we completed the acquisition of AK Steel, in which we were the acquirer. As a result of the AK Steel Merger, each share of AK Steel common stock issued and outstanding immediately prior to the effective time of the AK Steel Merger (other than excluded shares) was converted into the right to receive 0.400 Cliffs common shares and, if applicable, cash in lieu of any fractional Cliffs common shares.
We incurred acquisition-related costs, excluding severance costs, of $1 million and $26 million for the years ended December 31, 2021 and 2020, respectively, in connection with the AK Steel Merger, which were recorded in Acquisition-related costs on the Statements of Consolidated Operations.
The fair value of the total purchase consideration was determined as follows:
| | | | | |
| (In Millions) |
Fair value of AK Steel debt | $ | 914 | |
Fair value of Cliffs common shares issued for AK Steel outstanding common stock | 618 | |
Other | 3 | |
Total purchase consideration | $ | 1,535 | |
The fair value of Cliffs common shares issued for outstanding shares of AK Steel common stock and with respect to Cliffs common shares underlying converted AK Steel equity awards that vested upon completion of the AK Steel Merger was calculated as follows:
| | | | | |
| (In Millions,
Except Per Share Amounts) |
Number of shares of AK Steel common stock issued and outstanding | 317 | |
Exchange ratio | 0.400 | |
Shares of Cliffs common shares issued to AK Steel stockholders | 127 | |
Price per share of Cliffs common shares | $ | 4.87 | |
Fair value of Cliffs common shares issued for outstanding AK Steel common stock | $ | 618 | |
The fair value of AK Steel's debt included in the consideration was calculated as follows:
| | | | | |
| (In Millions) |
Credit Facility | $ | 590 | |
7.500% Senior Secured Notes due July 2023 | 324 | |
Fair value of debt included in consideration | $ | 914 | |
Valuation Assumption and Purchase Price Allocation
The allocation of consideration to the net tangible and intangible assets acquired and liabilities assumed in connection with the AK Steel Merger was based on estimated fair values at March 13, 2020, and was finalized during the quarter ended March 31, 2021. The following is a summary of the purchase price allocation to assets acquired and liabilities assumed in the AK Steel Merger:
| | | | | | | | | | | | | | | | | |
| (In Millions) |
| Initial Allocation of Consideration | | Measurement Period Adjustments | | Final Allocation of Consideration as of March 31, 2021 |
| Cash and cash equivalents | $ | 38 | | | $ | 1 | | | $ | 39 | |
| Accounts receivable, net | 666 | | | (2) | | | 664 | |
| Inventories | 1,563 | | | (243) | | | 1,320 | |
| Other current assets | 68 | | | (16) | | | 52 | |
| Property, plant and equipment | 2,184 | | | 90 | | | 2,274 | |
| Deferred income taxes | — | | | 69 | | | 69 | |
| Other non-current assets | 475 | | | (4) | | | 471 | |
| Accounts payable | (636) | | | (8) | | | (644) | |
| Accrued employment costs | (94) | | | 1 | | | (93) | |
| State and local taxes | (35) | | | 4 | | | (31) | |
| Other current liabilities | (276) | | | 2 | | | (274) | |
| Long-term debt | (1,179) | | | — | | | (1,179) | |
| Pension liability, non-current | (473) | | | 10 | | | (463) | |
| OPEB liability, non-current | (400) | | | (8) | | | (408) | |
| Other non-current liabilities | (507) | | | 72 | | | (435) | |
| Noncontrolling interest | — | | | (1) | | | (1) | |
| Net identifiable assets acquired | 1,394 | | | (33) | | | 1,361 | |
| Goodwill | 141 | | | 33 | | | 174 | |
| Total net assets acquired | $ | 1,535 | | | $ | — | | | $ | 1,535 | |
During the period subsequent to the AK Steel Merger, we made certain measurement period adjustments to the acquired assets and liabilities assumed due to clarification of information utilized to determine fair value during the measurement period.
The goodwill resulting from the acquisition of AK Steel was assigned to our downstream Tubular and Tooling and Stamping operating segments. Goodwill is calculated as the excess of the purchase price over the net identifiable assets recognized and primarily represents the growth opportunities in light weighting solutions to automotive customers, as well as any synergistic benefits to be realized. Goodwill from the AK Steel Merger is not expected to be deductible for income tax purposes.
The purchase price allocated to identifiable intangible assets and liabilities acquired was:
| | | | | | | | | | | |
| (In Millions) | | Weighted Average Life (In Years) |
| Intangible assets: | | | |
| Customer relationships | $ | 77 | | | 18 |
| Developed technology | 60 | | | 17 |
| Trade names and trademarks | 11 | | | 10 |
| Total identifiable intangible assets | $ | 148 | | | 17 |
| Intangible liabilities: | | | |
| Above-market supply contracts | $ | (71) | | | 12 |
Intangible assets are classified as Other non-current assets on the Statements of Consolidated Financial Position. Intangible liabilities are classified as Other non-current liabilities on the Statements of Consolidated Financial Position.
The above-market supply contracts relate to the long-term coke and energy supply agreements with SunCoke Energy, which includes SunCoke Middletown, a consolidated VIE. Refer to NOTE 18 - VARIABLE INTEREST ENTITIES for further information.
Pro Forma Results
2020 Acquisitions
The following table provides unaudited pro forma financial information, prepared in accordance with Topic 805, as if ArcelorMittal USA and AK Steel had been acquired as of January 1, 2019:
| | | | | | | | | | | |
| (In Millions) |
| Year Ended December 31, |
| 2020 | | 2019 |
| Revenues | $ | 12,837 | | | $ | 17,163 | |
| Net income (loss) attributable to Cliffs shareholders | (520) | | | (11) | |
The unaudited pro forma financial information has been calculated after applying our accounting policies and adjusting the historical results with pro forma adjustments, net of tax, that assume the 2020 Acquisitions occurred on January 1, 2019. Significant pro forma adjustments include the following:
1.The elimination of intercompany revenues between Cliffs and ArcelorMittal USA and AK Steel of $844 million and $1,499 million for the years ended December 31, 2020 and 2019, respectively.
2.The 2020 pro forma net loss was adjusted to exclude $96 million of non-recurring inventory acquisition accounting adjustments incurred during the year ended December 31, 2020. The 2019 pro forma net loss was adjusted to include $362 million of non-recurring inventory acquisition accounting adjustments for the year ended December 31, 2019.
3.The elimination of non-recurring transaction costs incurred by Cliffs, AK Steel and ArcelorMittal USA in connection with the 2020 Acquisitions were $93 million for the year ended December 31, 2020. The 2019 pro forma net loss was adjusted to include $93 million of non-recurring transaction cost adjustments for the year ended December 31, 2019.
4.The 2020 pro forma net loss was adjusted to exclude restructuring costs of $1,820 million of non-recurring costs incurred by ArcelorMittal USA prior to the AM USA Transaction.
5.The 2020 and 2019 pro forma net losses were adjusted to exclude $140 million and $129 million for the years ended December 31, 2020 and 2019, respectively, for the impact of reversal of the fees charged for management, financial and legal services under the Industrial Franchise Agreement with the former parent.
6.Total other pro forma adjustments included reduced expenses of $32 million for the year ended December 31, 2020, primarily due to decreased depreciation expense and pension and OPEB expense, offset partially by increased interest and amortization expense.
7.Total other pro forma adjustments included an expense of $76 million for the year ended December 31, 2019, primarily due to increased interest, amortization and pension and OPEB expense, offset partially by decreased depreciation expense.
8.The income tax impact of pro forma transaction adjustments that affect Net income (loss) attributable to Cliffs shareholders at a statutory rate of 24.3% resulted in an increased benefit to Income tax benefit (expense) of $170 million and $117 million for the years ended December 31, 2020 and 2019, respectively.
FPT AcquisitionPRO FORMA RESULTS
The following table provides unaudited pro forma financial information, prepared in accordance with Topic 805, as if FPT had been acquired as of January 1, 2020:
| | | | | | | | | | | |
| (In Millions) |
| Year Ended December 31, |
| 2021 | | 2020 |
| Revenues | $ | 21,701 | | | $ | 13,549 | |
| Net income (loss) attributable to Cliffs shareholders | 3,074 | | | (526) | |
| | | | | | | |
| Year Ended |
| (In millions) | December 31, 2021 | | |
| Revenues | $ | 21,701 | | | |
| Net income attributable to Cliffs shareholders | 3,074 | | | |
The unaudited pro forma financial information has been calculated after applying our accounting policies and adjusting the historical results with pro forma adjustments, net of tax, that assume the FPT Acquisition occurred on January 1, 2020. There were no significant pro forma adjustments for the FPT Acquisition.
The unaudited pro forma financial information does not reflect the potential realization of synergies or cost savings, nor does it reflect other costs relating to the integration of the acquired companies.company. This unaudited pro forma financial information should not be considered indicative of the results that would have actually occurred if the 2020 Acquisitions had been consummated on January 1, 2019, or if the FPT Acquisition had been consummated on January 1, 2020, nor are they indicative of future results.
NOTE 4 - REVENUES
We generate our revenue through product sales, in which shipping terms indicate when we have fulfilled our performance obligations and transferred control of products to our customer. Our revenue transactions consist of a single performance obligation to transfer promised goods. Our contracts with customers define the mechanism for determining the sales price, which is generally fixed upon transfer of control, but the contracts generally do not impose a specific quantity on either party. Quantities to be delivered to the customer are determined at a point near the date of delivery through purchase orders or other written instructions we receive from the customer. Spot market sales are made through purchase orders or other written instructions. We consider our performance obligation to be complete and recognize revenue when control transfers in accordance with shipping terms.
Revenue is measured as the amount of consideration we expect to receive in exchange for transferring product. We reduce the amount of revenue recognized for estimated returns and other customer credits, such as discounts and volume rebates, based on the expected value to be realized. Payment terms are consistent with terms standard to the markets we serve. Sales taxes collected from customers are excluded from revenues.
Prior to the AM USA Transaction, we had a supply agreement with ArcelorMittal USA, which included supplemental revenue or refunds based on the HRC price in the year the iron ore was consumed in ArcelorMittal USA's blast furnaces. As control transferred prior to consumption, the supplemental revenue was recorded in accordance with Topic 815. All sales occurring subsequent to the AM USA Transaction are intercompany and eliminated in consolidation. Included within Revenues related to Topic 815 for the supplemental revenue portion of the supply agreement is derivative revenue of $122 million and $78 million for the years ended December 31, 2020 and 2019, respectively.
The following table represents our Revenues by market:
| | (In Millions) |
| Year Ended December 31, |
| 2021 | | 2020 | | 2019 |
| Year Ended December 31, | | | Year Ended December 31, |
| (In millions) | | (In millions) | 2023 | | 2022 | | 2021 |
| Steelmaking: | Steelmaking: | | | | | |
| Automotive | |
| Automotive | |
| Automotive | Automotive | $ | 4,726 | | | $ | 2,062 | | | $ | — | |
| Infrastructure and manufacturing | Infrastructure and manufacturing | 5,380 | | | 784 | | | — | |
| Distributors and converters | Distributors and converters | 7,671 | | | 696 | | | — | |
| Steel producers | Steel producers | 2,124 | | 1,423 | | | 1,990 | |
| Total Steelmaking | Total Steelmaking | 19,901 | | | 4,965 | | | 1,990 | |
| Other Businesses: | Other Businesses: | |
| Automotive | Automotive | 426 | | | 329 | | | — | |
| Automotive | |
| Automotive | |
| Infrastructure and manufacturing | Infrastructure and manufacturing | 47 | | | 34 | | | — | |
| Distributors and converters | Distributors and converters | 70 | | | 26 | | | — | |
| Total Other Businesses | Total Other Businesses | 543 | | | 389 | | | — | |
| Total revenues | Total revenues | $ | 20,444 | | | $ | 5,354 | | | $ | 1,990 | |
The following table represents our Revenues by product line:
| | | | | | | | | | | | | | | | | | | | | | | | | | | | | | | | | | | |
| (Dollars In Millions, Sales Volumes in Thousands) |
| Year Ended December 31, |
| 2021 | | 2020 | | 2019 |
| Revenue | | Volume1 | | Revenue | | Volume1 | | Revenue | | Volume1 |
| Steelmaking: | | | | | | | | | | | |
| Hot-rolled steel | $ | 5,615 | | | 4,886 | | | $ | 386 | | | 633 | | | $ | — | | | — | |
| Cold-rolled steel | 3,186 | | | 2,790 | | | 490 | | | 682 | | | — | | | — | |
| Coated steel | 5,864 | | | 5,056 | | | 1,747 | | | 1,911 | | | — | | | — | |
| Stainless and electrical steel | 1,622 | | | 674 | | | 868 | | | 416 | | | — | | | — | |
| Plate | 1,316 | | | 1,020 | | | 46 | | | 62 | | | — | | | — | |
| Other steel products | 1,247 | | | 1,460 | | | 46 | | | 79 | | | — | | | — | |
| | | | | | | | | | | |
| | | | | | | | | | | |
| Other | 1,051 | | | N/A | | 1,382 | | | N/A | | 1,990 | | | N/A |
| Total steelmaking | 19,901 | | | | | 4,965 | | | | | 1,990 | | | |
| Other Businesses: | | | | | | | | | | | |
| Other | 543 | | | N/A | | 389 | | | N/A | | — | | | N/A |
| Total revenues | $ | 20,444 | | | | | $ | 5,354 | | | | | $ | 1,990 | | | |
| | | | | | | | | | | |
1 All product volumes are stated in net tons. |
Deferred Revenue
The table below summarizes our deferred revenue balances:
| | | | | | | | | | | | | | | | | | | | | | | |
| (In Millions) |
| Deferred Revenue (Current) | | Deferred Revenue (Long-Term) |
| 2021 | | 2020 | | 2021 | | 2020 |
| Opening balance as of January 1 | $ | 7 | | | $ | 22 | | | $ | — | | | $ | 26 | |
| Net increase (decrease) | 18 | | | (15) | | | — | | | (26) | |
| Closing balance as of December 31 | $ | 25 | | | $ | 7 | | | $ | — | | | $ | — | |
Prior to the AK Steel Merger, our iron ore pellet sales agreement with Severstal Dearborn, LLC, subsequently assumed by AK Steel, required supplemental payments to be paid by the customer during the period from 2009 through 2013. Installment amounts received under this arrangement in excess of sales were classified as deferred revenue in the Statements of Consolidated Financial Position upon receipt of payment and the revenue was recognized over the term of the supply agreement, which had extended until 2022, in equal annual installments. As a result of the termination of that iron ore pellet sales agreement, we realized $35 million of deferred revenue, which was recognized within Revenues in the Statements of Consolidated Operations during the year ended December 31, 2020. | | | | | | | | | | | | | | | | | |
| Year Ended December 31, |
| (In millions) | 2023 | | 2022 | | 2021 |
| Steelmaking: | | | | | |
| Hot-rolled steel | $ | 4,864 | | | $ | 4,529 | | | $ | 5,615 | |
| Cold-rolled steel | 2,658 | | | 3,193 | | | 3,186 | |
| Coated steel | 6,661 | | | 6,905 | | | 5,864 | |
| Stainless and electrical steel | 2,281 | | | 2,284 | | | 1,622 | |
| Plate | 1,444 | | | 1,651 | | | 1,316 | |
| Slab and other steel products | 1,329 | | | 1,492 | | | 1,247 | |
| Other | 2,094 | | | 2,329 | | | 1,051 | |
| Total Steelmaking | 21,331 | | | 22,383 | | | 19,901 | |
| Other Businesses: | | | | | |
| Other | 665 | | | 606 | | | 543 | |
| Total revenues | $ | 21,996 | | | $ | 22,989 | | | $ | 20,444 | |
NOTE 5 - SEGMENT REPORTING
We are vertically integrated from mined raw materials and direct reduced iron and ferrous scrap to primary steelmaking and downstream finishing, stamping, tooling and tubing. We are organized into 4four operating segments based on our differentiated products - Steelmaking, Tubular, Tooling and Stamping, and European Operations. We have 1one reportable segment - Steelmaking. The operating segment results of our Tubular, Tooling and Stamping, and European Operations that do not constitute reportable segments are combined and disclosed in the Other Businesses category. Our Steelmaking segment operates as the largest flat-rolled steel producer supported by being the largest iron ore pellet producer as well as a leading prime scrap processor in North America, primarily serving the automotive, infrastructure and manufacturing, and distributors and converters markets. Our Other Businesses primarily include the operating segments that provide customer solutions with carbon and stainless steel tubing products, advanced-engineered solutions, tool design and build, hot- and cold-stamped steel components, and complex assemblies. All intersegment transactions were eliminated in consolidation. We allocate Corporate Selling, general and administrative expenses to our operating segments.
We evaluate performance on an operating segment basis, as well as a consolidated basis, based on Adjusted EBITDA, which is a non-GAAP measure. This measure is used by management, investors, lenders and other external users of our financial statements to assess our operating performance and to compare operating performance to other companies in the steel industry. In addition, management believes Adjusted EBITDA is a useful measure to assess the earnings power of the business without the impact of capital structure and can be used to assess our ability to service debt and fund future capital expenditures in the business.
Our results by segment are as follows:
| | (In Millions) |
| Year Ended December 31, |
| 2021 | | 2020 | | 2019 |
| Year Ended December 31, | | | Year Ended December 31, |
| (In millions) | | (In millions) | 2023 | | 2022 | | 2021 |
| Revenues: | Revenues: | | | | | |
| Steelmaking | |
| Steelmaking | |
| Steelmaking | Steelmaking | $ | 19,901 | | | $ | 4,965 | | | $ | 1,990 | |
| Other Businesses | Other Businesses | 543 | | | 389 | | | — | |
| Total revenues | Total revenues | $ | 20,444 | | | $ | 5,354 | | | $ | 1,990 | |
| | Adjusted EBITDA: | Adjusted EBITDA: | |
| Adjusted EBITDA: | |
| Adjusted EBITDA: | |
| Steelmaking | |
| Steelmaking | |
| Steelmaking | Steelmaking | $ | 5,422 | | | $ | 433 | | | $ | 636 | |
| Other Businesses | Other Businesses | 9 | | | 47 | | | — | |
| Corporate and eliminations | (169) | | | (127) | | | (111) | |
| Eliminations | |
| Total Adjusted EBITDA | Total Adjusted EBITDA | $ | 5,262 | | | $ | 353 | | | $ | 525 | |
9972 | CLF 2023 FORM 10-K
The following table provides a reconciliation of our consolidated Net income (loss) to total Adjusted EBITDA:
| | (In Millions) |
| Year Ended December 31, |
| 2021 | | 2020 | | 2019 |
| Net income (loss) | $ | 3,033 | | | $ | (81) | | | $ | 293 | |
| Year Ended December 31, | | | Year Ended December 31, |
| (In millions) | | (In millions) | 2023 | | 2022 | | 2021 |
| Net income | |
| Less: | Less: | |
| Interest expense, net | Interest expense, net | (337) | | | (238) | | | (101) | |
| Income tax benefit (expense) | (773) | | | 111 | | | (18) | |
| Interest expense, net | |
| Interest expense, net | |
| Income tax expense | |
| Depreciation, depletion and amortization | Depreciation, depletion and amortization | (897) | | | (308) | | | (85) | |
| 5,040 | | | 354 | | | 497 | |
| 1,860 | |
| Less: | Less: | |
EBITDA from noncontrolling interests1 | EBITDA from noncontrolling interests1 | 75 | | | 56 | | | — | |
| Gain (loss) on extinguishment of debt | (88) | | | 130 | | | (18) | |
| Severance costs | (15) | | | (38) | | | (2) | |
| Acquisition-related costs excluding severance costs | (5) | | | (52) | | | (7) | |
| Acquisition-related loss on equity method investment | (31) | | | — | | | — | |
| Amortization of inventory step-up | (161) | | | (96) | | | — | |
| Impact of discontinued operations | 3 | | | 1 | | | (1) | |
| EBITDA from noncontrolling interests1 | |
EBITDA from noncontrolling interests1 | |
| Acquisition-related expenses and adjustments | |
| Goodwill impairment | |
| Non-cash gain on sale of business | |
| Loss on extinguishment of debt | |
| Asset impairment | |
| Other, net | |
| Total Adjusted EBITDA | Total Adjusted EBITDA | $ | 5,262 | | | $ | 353 | | | $ | 525 | |
| 1 EBITDA of noncontrolling interests includes the following: | 1 EBITDA of noncontrolling interests includes the following: | |
1 EBITDA of noncontrolling interests includes the following: | |
1 EBITDA of noncontrolling interests includes the following: | |
| Net income attributable to noncontrolling interests | |
| Net income attributable to noncontrolling interests | |
| Net income attributable to noncontrolling interests | Net income attributable to noncontrolling interests | $ | 45 | | | $ | 41 | | | $ | — | |
| Depreciation, depletion and amortization | Depreciation, depletion and amortization | 30 | | | 15 | | | — | |
| EBITDA of noncontrolling interests | EBITDA of noncontrolling interests | $ | 75 | | | $ | 56 | | | $ | — | |
The following table summarizes our depreciation, depletion and amortization and capital additions by segment:
| | | | | | | | | | | | | | | | | |
| (In Millions) |
| Year Ended December 31, |
| 2021 | | 2020 | | 2019 |
| Depreciation, depletion and amortization: | | | | | |
| Steelmaking | $ | 855 | | | $ | 276 | | | $ | 80 | |
| Other Businesses | 37 | | | 27 | | | — | |
| Corporate | 5 | | | 5 | | | 5 | |
| Total depreciation, depletion and amortization | $ | 897 | | | $ | 308 | | | $ | 85 | |
| | | | | |
Capital additions1: | | | | | |
| Steelmaking | $ | 787 | | | $ | 436 | | | $ | 687 | |
| Other Businesses | 52 | | | 45 | | | — | |
| Corporate | 18 | | | 2 | | | 3 | |
| Total capital additions | $ | 857 | | | $ | 483 | | | $ | 690 | |
| | | | | |
1 Refer to NOTE 2 - SUPPLEMENTARY FINANCIAL STATEMENT INFORMATION for additional information. |
| | | | | | | | | | | | | | | | | |
| Year Ended December 31, |
| (In millions) | 2023 | | 2022 | | 2021 |
| Depreciation, depletion and amortization: | | | | | |
| Steelmaking | $ | (938) | | | $ | (994) | | | $ | (860) | |
| Other Businesses | (35) | | | (40) | | | (37) | |
| Total depreciation, depletion and amortization | $ | (973) | | | $ | (1,034) | | | $ | (897) | |
| | | | | |
Capital additions1: | | | | | |
| Steelmaking | $ | 778 | | | $ | 997 | | | $ | 787 | |
| Other Businesses | 3 | | | 30 | | | 52 | |
| Corporate | 4 | | | 6 | | | 18 | |
| Total capital additions | $ | 785 | | | $ | 1,033 | | | $ | 857 | |
| | | | | |
1 Refer to NOTE 2 - SUPPLEMENTARY FINANCIAL STATEMENT INFORMATION for additional information. |
The following summarizes our assets by segment:
| | (In Millions) |
| December 31, |
| 2021 | | 2020 |
| December 31, | | | December 31, |
| (In millions) | | (In millions) | 2023 | | 2022 |
| Assets: | Assets: | | | |
| Steelmaking | Steelmaking | $ | 18,326 | | | $ | 15,849 | |
| Steelmaking | |
| Steelmaking | |
| Other Businesses | Other Businesses | 306 | | | 239 | |
| Intersegment eliminations | |
| Total segment assets | Total segment assets | 18,632 | | | 16,088 | |
| Corporate | 343 | | | 683 | |
| Corporate/Eliminations | |
| Total assets | Total assets | $ | 18,975 | | | $ | 16,771 | |
Included in the consolidated financial statements are the following amounts relating to geographic location based on product destination:
| | (In Millions) |
| 2021 | | 2020 | | 2019 |
| (In millions) | | (In millions) | 2023 | | 2022 | | 2021 |
| Revenues: | Revenues: | | | | | |
| United States | |
| United States | |
| United States | United States | $ | 18,881 | | | $ | 4,580 | | | $ | 1,505 | |
| Canada | Canada | 803 | | | 602 | | | 448 | |
| Other countries | Other countries | 760 | | | 172 | | | 37 | |
| Total revenues | Total revenues | $ | 20,444 | | | $ | 5,354 | | | $ | 1,990 | |
| Property, plant and equipment, net: | Property, plant and equipment, net: | | | | | |
| United States | United States | $ | 9,092 | | | $ | 8,647 | | | $ | 1,929 | |
| United States | |
| United States | |
| Canada | Canada | 93 | | | 91 | | | — | |
| Other countries | Other countries | 1 | | | 5 | | | — | |
| Total property, plant and equipment, net | Total property, plant and equipment, net | $ | 9,186 | | | $ | 8,743 | | | $ | 1,929 | |
NOTE 6 - PROPERTY, PLANT AND EQUIPMENT
The following table indicates the carrying value of each of the major classes of our depreciable assets:
| | (In Millions) |
| December 31, |
| 2021 | | 2020 |
| Land, land improvements, and mineral rights | $ | 1,291 | | | $ | 1,213 | |
| December 31, | | | December 31, |
| (In millions) | | (In millions) | 2023 | | 2022 |
| Land, land improvements and mineral rights | |
| Buildings | Buildings | 889 | | | 703 | |
| Equipment | Equipment | 8,709 | | | 6,786 | |
| Other | Other | 229 | | | 151 | |
| Construction in progress | Construction in progress | 408 | | | 1,364 | |
Total property, plant and equipment1 | Total property, plant and equipment1 | 11,526 | | | 10,217 | |
| Allowance for depreciation and depletion | Allowance for depreciation and depletion | (2,340) | | | (1,474) | |
| Property, plant, and equipment, net | $ | 9,186 | | | $ | 8,743 | |
| Property, plant and equipment, net | |
| 1 Includes right-of-use assets related to finance leases of $411 million and $361 million as of December 31, 2021 and 2020, respectively. | 1 Includes right-of-use assets related to finance leases of $306 million and $408 million as of December 31, 2023 and 2022, respectively. | |
1 Includes right-of-use assets related to finance leases of $306 million and $408 million as of December 31, 2023 and 2022, respectively. | |
1 Includes right-of-use assets related to finance leases of $306 million and $408 million as of December 31, 2023 and 2022, respectively. | |
We recorded depreciation expense of $848$932 million, $298$988 million and $77$848 million for the years ended December 31, 2023, 2022 and 2021, 2020 and 2019, respectively.
We recorded capitalized interest into property, plant and equipment of $6 million, $53 million and $25 million during Depreciation expense for the yearsyear ended December 31, 2021, 20202022 includes $23 million of accelerated depreciation related to the decision to indefinitely idle the coke facility at Middletown Works and 2019, respectively.$68 million of accelerated depreciation related to the indefinite idle of the Indiana Harbor #4 blast furnace.
101During the year ended December 31, 2022, we announced the permanent closure of Mountain State Carbon, which resulted in a $29 million asset impairment charge.
The net book value of the mineral and land rights are as follows:
| | (In Millions) |
| December 31, |
| 2021 | | 2020 |
| December 31, | | | December 31, |
| (In millions) | | (In millions) | 2023 | | 2022 |
| Mineral rights: | Mineral rights: | | | |
| Cost | |
| Cost | |
| Cost | Cost | $ | 780 | | | $ | 773 | |
| Depletion | Depletion | (187) | | | (142) | |
| Net mineral rights | Net mineral rights | $ | 593 | | | $ | 631 | |
| | Land rights | Land rights | $ | 406 | | | $ | 361 | |
| Land rights | |
| Land rights | |
We recorded depletion expense of $46$33 million, $8$38 million and $8$46 million for the years ended December 31, 2021, 2020,2023, 2022, and 2019,2021, respectively.
NOTE 7 - GOODWILL AND INTANGIBLE ASSETS AND LIABILITIES
GoodwillGOODWILL
The following is a summary of Goodwill by segment:
| | (In Millions) |
| December 31, |
| 2021 | | 2020 |
| December 31, | | | December 31, |
| (In millions) | | (In millions) | 2023 | | 2022 |
| Steelmaking | Steelmaking | $ | 942 | | | $ | 1,232 | |
| Other Businesses | Other Businesses | 174 | | | 174 | |
| Total goodwill | Total goodwill | $ | 1,116 | | | $ | 1,406 | |
Our 2023 annual goodwill impairment analysis resulted in a full impairment charge of $125 million for goodwill related to our Tooling and Stamping reporting unit. The decreasefair value of $290 millionour Tooling and Stamping reporting unit was estimated using the discounted cash flow methodology (level 3 within the fair value hierarchy), which considers forecasted cash flows discounted at an estimated weighted average cost of capital. The decline in the balancefair value of Goodwillour Tooling and Stamping reporting unit below its carrying value during 2023 resulted from forgoing previous investment and capital plans in our Steelmaking segment asfavor of December 31, 2021, compared to December 31, 2020, is due toother opportunities and an increase in the decrease in estimated identified goodwill as a result of measurement period adjustments to the purchase price allocation for the acquisition of ArcelorMittal USA, partially offset by the increase due to the preliminary assignment of Goodwill in 2021 based on the preliminary purchase price allocation for the acquisition of FPT. Refer to NOTE 3 - ACQUISITIONS for further details.discount rate.
Intangible Assets and LiabilitiesINTANGIBLE ASSETS AND LIABILITIES
The following is a summary of our intangible assets and liabilities:
| | (In Millions) |
| December 31, 2021 | | December 31, 2020 |
| Gross Amount | | Accumulated Amortization | | Net Amount | | Gross Amount | | Accumulated Amortization | | Net Amount |
| December 31, 2023 | | | December 31, 2023 | | December 31, 2022 |
| (In millions) | | (In millions) | Gross Amount | | Accumulated Amortization | | Net Amount | | Gross Amount | | Accumulated Amortization | | Net Amount |
Intangible assets1: | Intangible assets1: | | | | | | | | | | | | |
| Customer relationships | |
| Customer relationships | |
| Customer relationships | Customer relationships | | $ | 95 | | | $ | (8) | | | $ | 87 | | | $ | 77 | | | $ | (3) | | | $ | 74 | |
| Developed technology | Developed technology | | 60 | | | (6) | | | 54 | | | 60 | | | (3) | | | 57 | |
| Trade names and trademarks | Trade names and trademarks | | 18 | | | (2) | | | 16 | | | 11 | | | (1) | | | 10 | |
| Mining permits | Mining permits | | 72 | | | (26) | | | 46 | | | 72 | | | (25) | | | 47 | |
| Supplier relationships | Supplier relationships | | 18 | | | — | | | 18 | | | — | | | — | | | — | |
| Total intangible assets | Total intangible assets | | $ | 263 | | | $ | (42) | | | $ | 221 | | | $ | 220 | | | $ | (32) | | | $ | 188 | |
Intangible liabilities2: | Intangible liabilities2: | | | | | | | | | | | | |
| Above-market supply contracts | Above-market supply contracts | | $ | (71) | | | $ | 14 | | | $ | (57) | | | $ | (71) | | | $ | 7 | | | $ | (64) | |
| Above-market supply contracts | |
| Above-market supply contracts | |
| 1 Intangible assets are classified as Other non-current assets. Amortization related to mining permits is recognized in Cost of goods sold. Amortization of all other intangible assets is recognized in Selling, general and administrative expenses. | 1 Intangible assets are classified as Other non-current assets. Amortization related to mining permits is recognized in Cost of goods sold. Amortization of all other intangible assets is recognized in Selling, general and administrative expenses. | |
1 Intangible assets are classified as Other non-current assets. Amortization related to mining permits is recognized in Cost of goods sold. Amortization of all other intangible assets is recognized in Selling, general and administrative expenses. | |
2 Intangible liabilities are classified as Other non-current liabilities. Amortization of all intangible liabilities is recognized in Cost of goods sold. | 2 Intangible liabilities are classified as Other non-current liabilities. Amortization of all intangible liabilities is recognized in Cost of goods sold. | 2 Intangible liabilities are classified as Other non-current liabilities. Amortization of all intangible liabilities is recognized in Cost of goods sold. |
Amortization expense related to intangible assets was $10$13 million and $8 million for both the years ended December 31, 20212023 and 2020, respectively.2022. Estimated future amortization expense related to intangible assets is $13 million annually for the years 20222024 through 2026.2028.
Income from amortization related to intangible liabilities was $7$5 million infor both of the years ended December 31, 20212023 and 2020.2022. Estimated future amortization income related to the intangible liabilities is $5 million annually for the years 20222024 through 2026.2028.
10375 | CLF 2023 FORM 10-K
NOTE 8 - DEBT AND CREDIT FACILITIES
The following represents a summary of our long-term debt:
| | (In Millions) | (In Millions) | (In Millions) |
December 31, 2021 | | Debt Instrument | Debt Instrument | | Issuer1 | | Annual Effective Interest Rate | | Total Principal Amount | | Unamortized Debt Issuance Costs | | Unamortized Premiums (Discounts) | | Total Debt | Debt Instrument | | Issuer1 | | Annual Effective Interest Rate | | December 31, 2023 | | December 31, 2022 |
| Senior Secured Notes: | Senior Secured Notes: | | | | | | | | | | | | |
| 9.875% 2025 Senior Secured Notes | | Cliffs | | 10.57% | | $ | 607 | | | $ | (4) | | | $ | (13) | | | $ | 590 | |
| 6.750% 2026 Senior Secured Notes | |
| 6.750% 2026 Senior Secured Notes | |
| 6.750% 2026 Senior Secured Notes | 6.750% 2026 Senior Secured Notes | | Cliffs | | 6.99% | | 845 | | | (16) | | | (7) | | | 822 | |
| Senior Unsecured Notes: | Senior Unsecured Notes: | |
| 1.500% 2025 Convertible Senior Notes | | Cliffs | | 6.26% | | 294 | | | (3) | | | (39) | | | 252 | |
| 7.000% 2027 Senior Notes | |
| 7.000% 2027 Senior Notes | |
| 7.000% 2027 Senior Notes | 7.000% 2027 Senior Notes | | Cliffs | | 9.24% | | 73 | | | — | | | (7) | | | 66 | |
| 7.000% 2027 AK Senior Notes | 7.000% 2027 AK Senior Notes | | AK Steel | | 9.24% | | 56 | | | — | | | (5) | | | 51 | |
| 5.875% 2027 Senior Notes | 5.875% 2027 Senior Notes | | Cliffs | | 6.49% | | 556 | | | (3) | | | (15) | | | 538 | |
| 4.625% 2029 Senior Notes | 4.625% 2029 Senior Notes | | Cliffs | | 4.63% | | 500 | | | (8) | | | — | | | 492 | |
| 6.750% 2030 Senior Notes | |
| 4.875% 2031 Senior Notes | 4.875% 2031 Senior Notes | | Cliffs | | 4.88% | | 500 | | | (8) | | | — | | | 492 | |
| 6.250% 2040 Senior Notes | 6.250% 2040 Senior Notes | | Cliffs | | 6.34% | | 263 | | | (2) | | | (3) | | | 258 | |
| IRBs due 2024 to 2028 | | AK Steel | | Various | | 66 | | | — | | | 2 | | | 68 | |
| ABL Facility3 | | Cliffs2 | | 1.87% | | 4,500 | | | — | | | — | | | 1,609 | |
| | ABL Facility | |
| Total debt | |
| Unamortized discounts and issuance costs | |
| Total long-term debt | Total long-term debt | | $ | 5,238 | |
| | 1 Unless otherwise noted, references in this column and throughout this NOTE 8 - DEBT AND CREDIT FACILITIES to "Cliffs" are to Cleveland-Cliffs Inc., and references to "AK Steel" are to AK Steel Corporation (n/k/a Cleveland-Cliffs Steel Corporation). | | 1 Unless otherwise noted, references in this column and throughout this NOTE 8 - DEBT AND CREDIT FACILITIES to "Cliffs" are to Cleveland-Cliffs Inc., and references to "AK Steel" are to AK Steel Corporation (n/k/a Cleveland-Cliffs Steel Corporation). | |
| 1 Unless otherwise noted, references in this column and throughout this NOTE 8 - DEBT AND CREDIT FACILITIES to "Cliffs" are to Cleveland-Cliffs Inc., and references to "AK Steel" are to AK Steel Corporation (n/k/a Cleveland-Cliffs Steel Corporation). | |
2 Refers to Cleveland-Cliffs Inc. as borrower under our ABL Facility. | 2 Refers to Cleveland-Cliffs Inc. as borrower under our ABL Facility. | 2 Refers to Cleveland-Cliffs Inc. as borrower under our ABL Facility. |
3 The total principal amount for the ABL Facility is stated at the maximum borrowing capacity. | 3 Our ABL Facility annual effective interest rate was 5.60% as of December 31, 2022. | | 3 Our ABL Facility annual effective interest rate was 5.60% as of December 31, 2022. |
OUTSTANDING SENIOR SECURED NOTES | | | | | | | | | | | | | | | | | | | | | | | | | | | | | | | | | | | | | | |
| (In Millions) |
| December 31, 2020 |
| Debt Instrument | | Issuer1 | | Annual Effective Interest Rate | | Total Principal Amount | | Unamortized
Debt Issuance Costs | | Unamortized Premiums (Discounts) | | Total Debt |
| Senior Secured Notes: | | | | | | | | | | | | |
| 4.875% 2024 Senior Secured Notes | | Cliffs | | 5.00% | | $ | 395 | | | $ | (3) | | | $ | (1) | | | $ | 391 | |
| 9.875% 2025 Senior Secured Notes | | Cliffs | | 10.57% | | 955 | | | (8) | | | (25) | | | 922 | |
| 6.750% 2026 Senior Secured Notes | | Cliffs | | 6.99% | | 845 | | | (20) | | | (9) | | | 816 | |
| Senior Unsecured Notes: | | | | | | | | | | | | |
| 7.625% 2021 AK Senior Notes | | AK Steel | | 7.33% | | 34 | | | — | | | — | | | 34 | |
| 7.500% 2023 AK Senior Notes | | AK Steel | | 6.17% | | 13 | | | — | | | — | | | 13 | |
| 6.375% 2025 Senior Notes | | Cliffs | | 8.11% | | 64 | | | — | | | (4) | | | 60 | |
| 6.375% 2025 AK Senior Notes | | AK Steel | | 8.11% | | 29 | | | — | | | (2) | | | 27 | |
| 1.500% 2025 Convertible Senior Notes | | Cliffs | | 6.26% | | 296 | | | (4) | | | (49) | | | 243 | |
| 5.750% 2025 Senior Notes | | Cliffs | | 6.01% | | 396 | | | (3) | | | (4) | | | 389 | |
| 7.000% 2027 Senior Notes | | Cliffs | | 9.24% | | 73 | | | — | | | (8) | | | 65 | |
| 7.000% 2027 AK Senior Notes | | AK Steel | | 9.24% | | 56 | | | — | | | (6) | | | 50 | |
| 5.875% 2027 Senior Notes | | Cliffs | | 6.49% | | 556 | | | (4) | | | (18) | | | 534 | |
| 6.250% 2040 Senior Notes | | Cliffs | | 6.34% | | 263 | | | (2) | | | (3) | | | 258 | |
| IRBs due 2024 to 2028 | | AK Steel | | Various | | 92 | | | — | | | 2 | | | 94 | |
EDC Revolving Facility3 | | * | | 3.25% | | 40 | | | — | | | — | | | 18 | |
ABL Facility3 | | Cliffs2 | | 2.15% | | 3,500 | | | — | | | — | | | 1,510 | |
| Total debt | | | | | | | | | | | | 5,424 | |
| Less: current | | | | | | | | | | | | 34 | |
| Total long-term debt | | | | | | | | | | | | $ | 5,390 | |
| *Our subsidiaries, Fleetwood Metal Industries Inc. and The Electromac Group Inc., were the borrowers under the EDC Revolving Facility. |
1 Unless otherwise noted, references in this column and throughout this NOTE 8 - DEBT AND CREDIT FACILITIES to "Cliffs" are to Cleveland-Cliffs Inc., and references to "AK Steel" are to "AK Steel Corporation (n/k/a Cleveland-Cliffs Steel Corporation). |
2 Refers to Cleveland-Cliffs Inc. as borrower under our ABL Facility. |
3 The total principal amounts for the indicated credit facilities are stated at their respective maximum borrowing capacities. |
OutstandingThe 6.750% 2026 Senior Secured Notes bear interest at a rate of 6.750% per annum, payable semi-annually in arrears on March 15 and September 15 of each year. The 6.750% 2026 Senior Secured Notes will mature on March 15, 2026.
The following represents a summary of our senior secured notes' maturity and interest payable due dates:
| | | | | | | | | | | | | | |
Debt Instrument | | Maturity | | Interest Payable
(until maturity) |
9.875% 2025 Senior Secured Notes | | October 17, 2025 | | April 17 and October 17 |
| 6.750% 2026 Senior Secured Notes | | March 15, 2026 | | March 15 and September 15 |
The senior secured notes of each series are jointly and severally and fully and unconditionally guaranteed on a senior secured basis by substantially all of our material domestic subsidiaries and are secured (subject in each case to certain exceptions and permitted liens) by (i) a first-priority lien, on a pari passu basis with the senior secured notes of the other series, on substantially all of our assets and the assets of the guarantors, other than the ABL Collateral (as defined below), and (ii) a second-priority lien on the ABL Collateral, which is junior to a first-priority lien for the benefit of the lenders under our ABL Facility.
We may redeem the 9.875% 2025 Senior Secured Notes, in whole or in part, at any time at our option upon not less than 30, and not more than 60, days' prior notice sent to the holders of the 9.875% 2025 Senior Secured Notes. The 9.875% 2025 Senior Secured Notes are redeemable prior to October 17, 2022, at a redemption price equal to 100% of the principal amount thereof plus a "make-whole" premium set forth in the indenture, plus accrued
and unpaid interest, if any, to, but not including, the date of redemption. We may also redeem up to 35% of the aggregate principal amount of the 9.875% 2025 Senior Secured Notes prior to October 17, 2022, at a redemption price equal to 109.875% of the principal amount thereof, plus accrued and unpaid interest, if any, to but not including, the date of redemption with the net cash proceeds of one or more equity offerings. On March 11, 2021, we exercised this optional redemption feature when we purchased $322 million aggregate principal amount of the 9.875% 2025 Senior Secured Notes using the net proceeds from the underwritten public offering of 20 million common shares. The 9.875% 2025 Senior Secured Notes are redeemable beginning on October 17, 2022, at a redemption price equal to 107.406% of the principal amount thereof, decreasing on each April 17 thereafter until April 17, 2025, on and after which the 9.875% 2025 Senior Secured Notes are redeemable at par, in each case, plus accrued and unpaid interest, if any, to, but not including, the date of redemption.
We may redeem the 6.750% 2026 Senior Secured Notes in whole or in part, at any time at our option upon not less than 30, and not more than 60, days' prior notice sent to the holders of the 6.750% 2026 Senior Secured Notes. The 6.750% 2026 Senior Secured Notes are redeemable prior to March 15, 2022, at a redemption price equal to 100% of the principal amount thereof plus a "make-whole" premium set forth in the indenture, plus accrued and unpaid interest, if any, to, but not including, the date of redemption. We may also redeem up to 35% of the aggregate principal amount of the 6.750% 2026 Senior Secured Notes prior to March 15, 2022, at a redemption price equal to 106.750% of the principal amount thereof, plus accrued and unpaid interest, if any, to but not including, the date of redemption with the net cash proceeds of one or more equity offerings. The 6.750% 2026 Senior Secured Notes are redeemable beginning on March 15, 2022, at a redemption price equal to 105.063%103.375% of the principal amount thereof, decreasing to 101.688% on each March 15, thereafter until March 15, 2025, on2024 and after which the 6.750% 2026 Senior Secured Notes are redeemable at par inbeginning on March 15, 2025. In each case, we pay the redemption premiums plus accrued and unpaid interest, if any, to, but not including, the date of redemption.
In addition, if a change in control triggering event, as defined in the indenture, occurs with respect to the senior secured notes,6.750% 2026 Senior Secured Notes, we will be required to offer to purchase the notes at a purchase price equal to 101% of their principal amount, plus accrued and unpaid interest, if any, to, but not including, the date of purchase.
The terms of the senior secured notes6.750% 2026 Senior Secured Notes contain certain customary covenants; however, there are no financial covenants.
Outstanding Senior Unsecured NotesOUTSTANDING SENIOR UNSECURED NOTES
2021 IssuancesCLEVELAND-CLIFFS INC. 6.750% 2030 SENIOR NOTES - 2023 OFFERING
On February 17, 2021,April 14, 2023, we entered into an indenture among Cliffs, the guarantors party thereto and U.S. Bank Trust Company, National Association, as trustee, relating to the issuancesissuance of $500$750 million aggregate principal amount of 4.625% 2029our 6.750% 2030 Senior Notes, and $500 million aggregate principal amount of 4.875% 2031 Senior Notes, eachwhich were issued at par. The 4.625% 2029 Senior Notes and 4.875% 20316.750% 2030 Senior Notes were issued in a private placement transactionstransaction exempt from the registration requirements of the Securities Act.
The 4.625% 20296.750% 2030 Senior Notes bear interest at a rate of 6.750% per annum, payable semi-annually in arrears on April 15 and 4.875% 2031October 15 of each year, which commenced on October 15, 2023. The 6.750% 2030 Senior Notes mature on April 15, 2030.
The 6.750% 2030 Senior Notes are unsecured senior obligations and rank equally in right of payment with all of our existing and future unsecured and unsubordinated indebtedness. The 4.625% 2029 Senior Notes and 4.875% 20316.750% 2030 Senior Notes are guaranteed on a senior unsecured basis by our material direct and indirect wholly owned domestic subsidiaries and, therefore,subsidiaries. The 6.750% 2030 Senior Notes are structurally senior to any
subordinated to all existing and future indebtedness and other liabilities of our subsidiaries that do not guarantee the 4.625% 20296.750% 2030 Senior Notes.
The 6.750% 2030 Senior Notes and 4.875% 2031may be redeemed, in whole or in part, at any time at our option not less than 10 days nor more than 60 days after prior notice is sent to the holders of the 6.750% 2030 Senior Notes. The 6.750% 2030 Senior Notes are redeemable prior to April 15, 2026, at a redemption price equal to 100% of the principal amount thereof plus a "make-whole" premium set forth in the indenture. We may also redeem up to 35% of the aggregate principal amount of the 6.750% 2030 Senior Notes prior to April 15, 2026 at a redemption price equal to 106.750% of the principal amount thereof with the net cash proceeds of one or more equity offerings. The 6.750% 2030 Senior Notes are redeemable beginning on April 15, 2026, at a redemption price equal to 103.375% of the principal amount thereof, decreasing to 101.688% on April 15, 2027, and are redeemable at par beginning on April 15, 2028. In each case, we pay the applicable redemption and "make-whole" premiums plus accrued and unpaid interest, if any, to, but not including, the date of redemption.
In addition, if a change in control triggering event, as defined in the indenture, occurs with respect to the 4.625% 2029 Senior Notes and 4.875% 20316.750% 2030 Senior Notes, we will be required to offer to repurchase the notes at a purchase price equal to 101% of their principal amount, plus accrued and unpaid interest, if any, to, but not including, the date of repurchase.
The terms of the 4.625% 2029 Senior Notes and 4.875% 20316.750% 2030 Senior Notes contain certain customary covenants; however, there are no financial covenants.
4.625% 2029 Senior Notes
The 4.625% 2029 Senior Notes bear interest at a rate of 4.625% per annum, payable semi-annually in arrears on March 1 and September 1 of each year, commencing on September 1, 2021. The 4.625% 2029 Senior Notes will mature on March 1, 2029.
The 4.625% 2029 Senior Notes may be redeemed, in whole or in part, on not less than 10, nor more than 60, days’ prior notice sent to the holders of the notes. The following is a summary of redemption prices for our 4.625% 2029 Senior Notes:
| | | | | | | | | | | | | | | | | |
Redemption Period | | Redemption Price1
| | Restricted Amount |
Prior to March 1, 2024 - using the proceeds of equity issuance | | 104.625 | | % | | Up to 35% of original aggregate principal |
Prior to March 1, 20242
| | 100.000 | | | | |
Beginning March 1, 2024 | | 102.313 | | | | |
Beginning March 1, 2025 | | 101.156 | | | | |
Beginning on March 1, 2026 and thereafter | | 100.000 | | | | |
| | | | | |
1 Plus accrued and unpaid interest, if any, up to, but excluding, the redemption date.
|
2 Plus a "make-whole" premium.
|
4.875% 2031 Senior Notes
The 4.875% 2031 Senior Notes bear interest at a rate of 4.875% per annum, payable semi-annually in arrears on March 1 and September 1 of each year, commencing on September 1, 2021. The 4.875% 2031 Senior Notes will mature on March 1, 2031.
The 4.875% 2031 Senior Notes may be redeemed, in whole or in part, on not less than 10, nor more than 60, days’ prior notice sent to the holders of the notes. The following is a summary of redemption prices for our 4.875% 2031 Senior Notes:
| | | | | | | | | | | | | | | | | |
Redemption Period | | Redemption Price1
| | Restricted Amount |
Prior to March 1, 2026 - using the proceeds of equity issuance | | 104.875 | | % | | Up to 35% of original aggregate principal |
Prior to March 1, 2026 2
| | 100.000 | | | | |
Beginning March 1, 2026 | | 102.438 | | | | |
Beginning March 1, 2027 | | 101.625 | | | | |
Beginning March 1, 2028 | | 100.813 | | | | |
Beginning on March 1, 2029 and thereafter | | 100.000 | | | | |
| | | | | |
1 Plus accrued and unpaid interest, if any, up to, but excluding, the redemption date.
|
2 Plus a "make-whole" premium.
|
1.500% 2025 Convertible Senior Notes
The 1.500% 2025 Convertible Senior Notes bear interest at a rate of 1.500% per year, payable semiannually in arrears on January 15 and July 15 of each year. The 1.500% 2025 Convertible Senior Notes mature on January 15, 2025. The 1.500% 2025 Convertible Senior Notes are senior unsecured obligations and rank senior in right of payment to any of our indebtedness that is expressly subordinated in right of payment to the 1.500% 2025 Convertible Senior Notes; equal in right of payment to any of our unsecured indebtedness that is not so subordinated; effectively junior in right of payment to any of our secured indebtedness to the extent of the value of the assets securing such indebtedness; and structurally junior to all indebtedness and other liabilities (including trade payables) of our subsidiaries. The terms of the 1.500% 2025 Convertible Senior Notes contain certain customary covenants; however, there are no financial covenants.
Holders may convert their 1.500% 2025 Convertible Senior Notes at their option at any time prior to the close of business on the business day immediately preceding July 15, 2024, only under the following circumstances: (1) during any calendar quarter commencing after the calendar quarter ending on March 31, 2018, if the last reported sale price of our common shares, par value $0.125 per share, for at least 20 trading days (whether or not consecutive) during a period of 30 consecutive trading days ending on the last trading day of the immediately preceding calendar quarter is greater than or equal to 130% of the conversion price on each applicable trading day; (2) during the five-business day period after any five-consecutive trading day period (the “measurement period”) in which the trading price per $1,000 principal amount of 1.500% 2025 Convertible Senior Notes for each trading day of
the measurement period was less than 98% of the product of the last reported sale price of our common shares and the conversion rate on each such trading day; (3) if we call the notes for redemption, at any time prior to the close of business on the scheduled trading day immediately preceding the redemption date; or (4) upon the occurrence of specified corporate events. On or after July 15, 2024 until the close of business on the second scheduled trading day immediately preceding the maturity date, holders may convert their 1.500% 2025 Convertible Senior Notes at any time, regardless of the foregoing circumstances. Upon conversion, we will pay or deliver, as the case may be, cash, common shares or a combination of cash and common shares, at our election.
Upon the issuance of the 1.500% 2025 Convertible Senior Notes the initial conversion rate was 122.4365 common shares per $1,000 principal, with a conversion price of $8.17 per common share. The conversion rate is subject to adjustment in some circumstances, including the payment of dividends on common shares, but will not be adjusted for any accrued and unpaid interest. In addition, following certain corporate events that occur prior to the maturity date, or if we deliver a notice of redemption, we will, in certain circumstances, increase the conversion rate for a holder who elects to convert its 1.500% 2025 Convertible Senior Notes in connection with such a corporate event or notice of redemption, as the case may be. As of December 31, 2021, the conversion rate was 129.2985 common shares per $1,000 principal amount of 1.500% 2025 Convertible Senior Notes.
We may not redeem the 1.500% 2025 Convertible Senior Notes prior to January 15, 2022. We may redeem all or any portion of the 1.500% 2025 Convertible Senior Notes, for cash at our option on or after January 15, 2022 if the last reported sale price of our common shares has been at least 130% of the conversion price then in effect for at least 20 trading days (whether or not consecutive) during any 30-consecutive trading day period (including the last trading day of such period) ending on, and including, the trading day immediately preceding the date on which we provide notice of redemption at a redemption price equal to 100% of the principal amount of the 1.500% 2025 Convertible Senior Notes to be redeemed, plus accrued and unpaid interest to, but excluding, the redemption date.
If we undergo a fundamental change as defined in the indenture, holders may require us to repurchase for cash all or any portion of their 1.500% 2025 Convertible Senior Notes at a fundamental change repurchase price equal to 100% of the principal amount of the 1.500% 2025 Convertible Senior Notes to be repurchased, plus accrued and unpaid interest to, but excluding, the fundamental change repurchase date.
In accounting for the issuance of the notes, we separated the 1.500% 2025 Convertible Senior Notes into liability and equity components. The carrying amount of the liability component was calculated by measuring the fair value of similar liabilities that did not have associated convertible features. The carrying amount of the equity component of $86 million representing the conversion option was determined by deducting the fair value of the liability component from the par value of the notes. The difference represents the debt discount that is amortized to interest expense over the term of the notes. The equity component is not remeasured as long as it continues to qualify for equity classification.
On December 1, 2021, we issued a notice of redemption for all $294 million aggregate principal amount outstanding of the 1.500% 2025 Convertible Senior Notes. Refer to NOTE 21 - SUBSEQUENT EVENTS for further information on the redemption of the 1.500% 2025 Convertible Senior Notes.
Other Outstanding Unsecured Senior NotesCLEVELAND-CLIFFS INC. OTHER OUTSTANDING UNSECURED SENIOR NOTES
The following represents a summary of our other unsecured senior notes' maturity and interest payable due dates:
| | | | | | | | | | | | | | |
| Debt Instrument | | Maturity | | Interest Payable
(until maturity) |
| 7.000% 2027 Senior Notes | | March 15, 2027 | | March 15 and September 15 |
| 5.875% 2027 Senior Notes | | June 1, 2027 | | June 1 and December 1 |
| 4.625% 2029 Senior Notes | | March 1, 2029 | | March 1 and September 1 |
| | | | |
| 4.875% 2031 Senior Notes | | March 1, 2031 | | March 1 and September 1 |
| 6.250% 2040 Senior Notes | | October 1, 2040 | | April 1 and October 1 |
The senior notes are unsecured obligations and rank equally in right of payment with all our other existing and future unsecured and unsubordinated indebtedness. The 7.000% 2027 Senior Notes, and 5.875% 2027 Senior Notes, 4.625% 2029 Senior Notes and 4.875% 2031 Senior Notes are guaranteed on a senior unsecured basis by our material direct and indirect wholly owned domestic subsidiaries and, therefore, are structurally senior to any of our existing and future indebtedness that is not guaranteed by such guarantors and are structurally subordinated to all existing and future indebtedness and other liabilities of our subsidiaries that do not guarantee the notes. There are no subsidiary guarantees of the interest and principal amounts for the 6.250% 2040 Senior Notes.
The 7.000% 2027 Senior Notes may be redeemed, in whole or in part, at any time at our option upon not less than 30, and not more than 60, days' prior notice sent to the holders. The 7.000% 2027 Senior Notes are redeemable at a price equal to 102.333% of the principal amount thereof, decreasing to 101.167% on March 15, 2024 and are redeemable at par beginning on March 15, 2025. In each case, we pay the redemption premiums plus accrued and unpaid interest, if any, to, but not including, the date of redemption.
The 5.875% 2027 Senior Notes may be redeemed, in whole or in part, at any time at our option upon not less than 30, and not more than 60, days' prior notice sent to the holders. The 5.875% 2027 Senior Notes are redeemable at a price equal to 101.958% of the principal amount thereof, decreasing to 100.979% on June 1, 2024 and are redeemable at par beginning on June 1, 2025. In each case, we pay the redemption premiums plus accrued and unpaid interest, if any, to, but not including, the date of redemption.
The 4.625% 2029 Senior Notes may be redeemed, in whole or in part, on not less than 10, nor more than 60, days’ prior notice sent to the holders of the notes. The 4.625% 2029 Senior Notes are redeemable prior to March 15, 2022,1, 2024, at a redemption price equal to 100% of the principal amount thereof plus a "make-whole" premium set forth in the indenture, plus accrued and unpaid interest, if any,indenture. We may also redeem up to but not including,35% of the dateaggregate principal amount of redemption.the 4.625% 2029 Senior Notes prior to March 1, 2024 at a redemption price equal to 104.625% of the principal amount thereof with the net cash proceeds of one or more equity offerings. The 7.000% 20274.625% 2029 Senior Notes are redeemable beginning on March 15, 2022,1, 2024, at a redemption price equal to 103.500%102.313% of the principal amount thereof, decreasing to 101.156% on each March 15 thereafter until March 15,1, 2025 on and after which the 7.000% 2027 Senior Notes are redeemable at par inbeginning on March 1, 2026. In each case, we pay the redemption and "make-whole" premiums plus accrued and unpaid interest, if any, to, but not including, the date of redemption.
The 5.875% 20274.875% 2031 Senior Notes may be redeemed, in whole or in part, on not less than 10, nor more than 60, days’ prior notice sent to the holders of the notes. The 4.875% 2031 Senior Notes are redeemable prior to JuneMarch 1, 2022,2026, at a redemption price equal to 100% of the principal amount thereof plus a “make-whole”"make-whole" premium set forth in the indenture, plus accrued and unpaid interest, if any, to, but not including, the date of redemption.indenture. We may also redeem up to 35% of the aggregate principal amount of the 5.875% 20274.875% 2031 Senior Notes prior to JuneMarch 1, 20222026 at a redemption price equal to 105.875%104.875% of the principal amount thereof plus accrued and unpaid interest, if any, to, but not including, the date of redemption with the net cash proceeds of one or more equity offerings. The 5.875% 20274.875% 2031 Senior Notes are redeemable beginning on JuneMarch 1, 2022,2026, at a redemption price equal to 102.938%102.438% of the principal amount thereof, decreasing to 101.625% on each JuneMarch 1, thereafter until June2027, 100.813% on March 1, 2025, on2028 and after which the 5.875% 2027 Senior Notes are redeemable at par inbeginning on March 1, 2029.
In each case, we pay the redemption and "make-whole" premiums plus accrued and unpaid interest, if any, to, but not including, the date of redemption.
The 6.250% 2040 Senior Notes may be redeemed any time at our option upon not less than 30, nor more than 60, days' prior notice is sent to the holders. The 6.250% 2040 Senior Notes are redeemable at a redemption price equal to the greater of (1) 100% of the principal amount of the notes to be redeemed or (2) the sum of the present values of the remaining scheduled payments of principal and interest on the notes to be redeemed, discounted to the redemption date on a semi-annual basis at the treasury rate plus 40 basis points, plus accrued and unpaid interest, if any, to, but not including, the date of redemption.
In addition, if a change of control triggering event, as defined in the applicable indenture, occurs with respect to the unsecured notes, we will be required to offer to purchase the notes of the applicable series at a purchase price equal to 101% of the principal amount, plus accrued and unpaid interest, if any, to, but not including, the date of purchase.
The terms of the unsecured notes contain certain customary covenants; however, there are no financial covenants.
AK Steel Corporation Unsecured Senior NotesSTEEL CORPORATION UNSECURED SENIOR NOTES
As of December 31, 2021,2023, AK Steel had outstanding a total of $56 million aggregate principal amount of 7.000% 2027 AK Senior Notes. These senior notes are unsecured obligations and rank equally in right of payment with AK Steel's guarantees of Cliffs' unsecured and unsubordinated indebtedness. These notes contain no financial covenants.
The 7.000% 2027 AK Senior Notes may be redeemed, in whole or in part, at any time at our option upon not less than 30, and not more than 60, days' prior notice sent to the holders. The 7.000% 2027 AK Senior Notes are redeemable prior to March 15, 2022, at a redemption price equal to 100% of the principal amount thereof plus a “make-whole” premium set forth in the indenture, plus accrued and unpaid interest, if any, to, but not including, the date of redemption. The 7.000% 2027 AK Senior Notes are redeemable beginning on March 15, 2022, at a redemption price equal to 103.500%102.333% of the principal amount thereof, decreasing to 101.167% on each March 15, thereafter until March 15, 2025, on2024 and after which the 7.000% 2027 Senior Notes are redeemable at par inbeginning on March 15, 2025. In each case, we pay the redemption premiums plus accrued and unpaid interest, if any, to, but not including, the date of redemption.
ABL FacilityFACILITY
On March 13, 2020, in connection with the AK Steel Merger,June 9, 2023, we entered into a newthe Fourth ABL Amendment to our ABL Facility. The Fourth ABL Amendment increased the amount of tranche A revolver commitments thereunder by an additional $250 million to an aggregate principal amount of $4.75 billion. As of December 31, 2023, the ABL Facility with various financial institutions to replace and refinance Cliffs’ Former ABL Facility and AK Steel Corporation’s former revolving credit facility. The ABL Facility will mature upon the earlier of March 13, 2025 or 91 days prior to the maturity of certain other material debt and providedprovides for up to $2$4.75 billion in borrowings, including a $555 million sublimit for the issuance of letters of credit and a $125$200 million sublimit for swingline loans. The Fourth ABL Amendment also extended the maturity date of all commitments under the ABL Facility from March 13, 2025 to June 9, 2028 or 91 days prior to the maturity of certain other material debt. Availability under the ABL Facility is limited to an eligible borrowing base, as applicable, determined by applying customary advance rates to eligible accounts receivable, inventory and certain mobile equipment.
On March 27, 2020, we amended ourThe Fourth ABL FacilityAmendment removed the LIBOR option for variable loans due to among other things, provide forits cessation and replaced it with a new FILO tranche B of commitments in the aggregate amount of $150 million by exchanging existing commitments under the ABL Facility.
The total commitmentsSOFR option. Borrowings under the ABL Facility after giving effect to this first amendment remainedbear interest, at $2 billion.our option, at a base rate, or if certain conditions are met, a SOFR rate, in each case, plus an applicable tiered margin. The terms and conditions (other than the pricing) that applybase rate is equal to the FILO tranche were substantiallygreater of the same asfederal funds rate plus 0.5% or the termsterm SOFR plus 1.25%. In addition, there is an unused commitment fee of between 0.25% and conditions that apply0.35%, which is applied to the tranche A facilityunused portion of the ABL Facility immediately prior to the amendment.
On December 9, 2020, we entered into the Second ABL Amendment. The Second ABL Amendment modified the ABL Facility to, among other things, increase the amount of tranche A revolver commitments available thereunder by an additional $1.5 billion and increase certain dollar baskets related to certain negative covenants that apply to the ABL Facility. After giving effect to the ABL Amendment, the aggregate principal amount of tranche A revolver commitments under the ABL Facility was $3.35 billion and the aggregate principal amount of FILO tranche B revolver commitments under the ABL Facility remained at $150 million.
On December 17, 2021, we entered into the Third ABL Amendment. The Third ABL Amendment modified the ABL Facility to, among other things, increase the amount of tranche A revolver commitments available thereunder by an additional $1 billion and exchange $150 million of tranche B revolver commitments available thereunder for tranche A revolver commitments. After giving effect to the Third ABL Amendment, the aggregate principal amount of tranche A revolver commitments under the ABL Facility is $4.5 billion and there are no remaining tranche B revolver commitments under the ABL Facility. The increase is a result of a larger projected borrowing base driven by more favorable market conditions.
The ABL Facility and certain bank products and hedge obligations are guaranteed by certain of our existing wholly owned U.S. subsidiaries and are required to be guaranteed by certain of our future U.S. subsidiaries. Amounts outstanding under the ABL Facility are secured by (i) a first-priority security interest in the accounts receivable and other rights to payment, inventory, as-extracted collateral, certain investment property, deposit accounts, securities accounts, certain general intangibles and commercial tort claims, certain mobile equipment, commodities accounts and other related assets of ours, the other borrowers and the guarantors, and proceeds and products of each of the foregoing (collectively, the “ABL Collateral”) and (ii) a second-priority security interest in substantially all of our assets and the assets of the other borrowers and the guarantors other than the ABL Collateral.
Borrowings under the ABL Facility bear interest, at our option, at a base rate or, if certain conditions are met, a LIBOR rate, in each case, plus an applicable margin. We may amend our ABL Facility to replace the LIBOR rate with one or more secured overnight financing based rates or an alternative benchmark rate, giving consideration to any evolving or then-existing convention for similar dollar denominated syndicated credit facilities for such alternative benchmarks.
The ABL Facility contains customary representations and warranties and affirmative and negative covenants including, among others, covenants regarding the maintenance of certain financial ratios if certain conditions are triggered, covenants relating to financial reporting, covenants relating to the payment of dividends on, or purchase or redemption of, our capital stock, covenants relating to the incurrence or prepayment of certain debt, covenants relating to the incurrence of liens or encumbrances, covenants relating to compliance with laws, covenants relating to transactions with affiliates, covenants relating to mergers and sales of all or substantially all of our assets and limitations on changes in the nature of our business. As of December 31, 2023 and 2022, we were in compliance with the ABL Facility liquidity requirements and, therefore, the springing financial covenant requiring a minimum fixed charge coverage ratio of 1.0 to 1.0 was not applicable.
The ABL Facility provides for customary events of default, including, among other things, the event of nonpayment of principal, interest, fees or other amounts, a representation or warranty proving to have been materially incorrect when made, failure to perform or observe certain covenants within a specified period of time, a cross-default to certain material indebtedness, the bankruptcy or insolvency of the Company and certain of its subsidiaries, monetary judgment defaults of a specified amount, invalidity of any loan documentation, a change of control of the Company, and ERISA defaults resulting in liability of a specified amount. If an event of default exists (beyond any applicable grace or cure period), the administrative agent may, and at the direction of the requisite number of lenders shall, declare all amounts owing under the ABL Facility immediately due and payable, terminate such lenders’ commitments to make loans under the ABL Facility and/or exercise any and all remedies and other rights under the ABL Facility. For certain events of default related to insolvency and receivership, the commitments of the lenders will be automatically terminated and all outstanding loans and other amounts will become immediately due and payable.
As of December 31, 2021 and 2020, we were in compliance with the ABL Facility liquidity requirements and, therefore, the springing financial covenant requiring a minimum fixed charge coverage ratio of 1.0 to 1.0 was not applicable.
11078 | CLF 2023 FORM 10-K
The following represents a summary of our borrowing capacity under the ABL Facility:
| | | | | |
| December 31, |
| (In Millions)millions) |
| December 31,
20212023 |
Available borrowing base on ABL Facility1 | $ | 4,5004,397 | |
| Borrowings | (1,609)— | |
Letter of credit obligations2 | (175)(56) | |
| Borrowing capacity available | $ | 2,7164,341 | |
| |
1 As of December 31, 2021,2023, the ABL Facility has a maximum available borrowing base of $4.5$4.75 billion. The available borrowing base is determined by applying customary advance rates to eligible accounts receivable, inventory and certain mobile equipment. |
2 We issued standby letters of credit with certain financial institutions in order to support business obligations, including, but not limited to, operating agreements, employee severance, environmental obligations, workers' compensation, employee severance,and insurance operating agreements and environmental obligations. |
Other Financing Arrangements
Industrial Revenue Bonds
AK Steel had outstanding $66 million aggregate principal amount of fixed-rate, tax-exempt IRBs as of December 31, 2021. The weighted-average fixed rate of these IRBs is 6.86%. These IRBs are unsecured senior debt obligations that are equal in ranking with AK Steel's senior notes and AK Steel's guarantees of Cliffs' unsubordinated indebtedness. These IRBs are effectively subordinated to AK Steel’s guarantees of Cliffs’ secured indebtedness to the extent of the value of AK Steel’s assets securing such guarantees. These IRBs contain certain customary covenants; however, there are no financial covenants.
Debt Extinguishment - 2021
During the fourth quarter of 2021, we paid in full the outstanding balance of our EDC revolving facilities for $55 million in aggregate principal amount and terminated the agreements. Prior to such terminations, the EDC revolving facilities provided for up to $80 million in borrowings.
On October 15, 2021, we redeemed $26 million in aggregate principal amount of the IRBs due 2024. During the third quarter of 2021, we repurchased $2 million in aggregate principal amount of 1.500% 2025 Convertible Senior Notes. On June 28, 2021, we redeemed all $396 million aggregate principal amount outstanding of the 5.750% 2025 Senior Notes using available liquidity. During the second quarter of 2021, we also repurchased $25 million aggregate principal amount of 9.875% 2025 Senior Secured Notes.
On March 11, 2021, we purchased $322 million aggregate principal amount of the 9.875% 2025 Senior Secured Notes using the net proceeds from the February 11, 2021 issuance of 20 million common shares and cash on hand. On March 12, 2021, we fully redeemed the 4.875% 2024 Senior Secured Notes, 7.625% 2021 AK Senior Notes, 7.50% 2023 AK Senior Notes, 6.375% 2025 Senior Notes and 6.375% 2025 AK Senior Notes, which totaled an aggregate principal amount of $535 million.
The following is a summary of the debt extinguished and the respective impact on extinguishment:
| | | | | | | | | | | |
| (In Millions) |
| Year Ended
December 31, 2021 |
| Debt Extinguished | | (Loss) on Extinguishment |
| 9.875% 2025 Senior Secured Notes | $ | 347 | | | $ | (47) | |
| 4.875% 2024 Senior Secured Notes | 395 | | | (14) | |
| 7.625% 2021 AK Senior Notes | 34 | | | — | |
| 7.500% 2023 AK Senior Notes | 13 | | | — | |
| 6.375% 2025 Senior Notes | 64 | | | (7) | |
| 1.500% 2025 Convertible Senior Notes | 2 | | | — | |
| 6.375% 2025 AK Senior Notes | 29 | | | (3) | |
| 5.750% 2025 Senior Notes | 396 | | | (17) | |
| IRBs due 2024 | 26 | | | — | |
| Total | $ | 1,306 | | | $ | (88) | |
Debt Extinguishment - 2020
During the year ended December 31, 2020, we used the net proceeds from the offering of the additional 9.875% 2025 Senior Secured Notes to repurchase $736 million aggregate principal amount of our outstanding senior notes of various series, which resulted in a net debt reduction of $181 million. We also repurchased an additional $35 million aggregate principal amount of our outstanding senior notes of various series and we redeemed $7 million aggregate principal amount of our outstanding 2020 IRBs, with cash on hand.
Additionally, in connection with the AK Steel Merger, we purchased $364 million aggregate principal amount of 7.625% 2021 AK Senior Notes and $311 million aggregate principal amount of 7.500% 2023 AK Senior Notes upon early settlement of tender offers made by Cliffs. The net proceeds from the offering of 6.750% 2026 Senior Secured Notes, along with a portion of the ABL Facility borrowings, were used to fund such purchases. As the 7.625% 2021 AK Senior Notes and 7.500% 2023 AK Senior Notes were recorded at fair value just prior to being purchased, there was no gain or loss on extinguishment. Additionally, in connection with the final settlement of the tender offers, we purchased $9 million aggregate principal amount of the 7.625% 2021 AK Senior Notes and $56 million aggregate principal amount of the 7.500% 2023 AK Senior Notes with cash on hand.
The following is a summary of the debt extinguished and the respective impact on extinguishment:
| | | | | | | | | | | |
| (In Millions) |
| Year Ended
December 31, 2020 |
| Debt Extinguished | | Gain (Loss) on Extinguishment |
| 7.625% 2021 AK Senior Notes | $ | 373 | | | $ | — | |
| 7.500% 2023 AK Senior Notes | 367 | | | 3 | |
| 4.875% 2024 Senior Secured Notes | 6 | | | 1 | |
| 6.375% 2025 Senior Notes | 168 | | | 21 | |
| 1.500% 2025 Convertible Senior Notes | 20 | | | 1 | |
| 5.750% 2025 Senior Notes | 77 | | | 16 | |
| 7.000% 2027 Senior Notes | 262 | | | 27 | |
| 5.875% 2027 Senior Notes | 195 | | | 49 | |
| 6.250% 2040 Senior Notes | 36 | | | 13 | |
| 6.375% 2025 AK Senior Notes | 9 | | | (1) | |
| Total | $ | 1,513 | | | $ | 130 | |
Debt Extinguishment - 2019
During the year ended December 31, 2019, we used the net proceeds from the issuance of $750 million aggregate principal amount of 5.875% 2027 Senior Notes, along with cash on hand, to redeem in full all of our outstanding 4.875% 2021 Senior Notes and to fund the repurchase of $600 million aggregate principal amount of our outstanding 5.750% 2025 Senior Notes in a tender offer.
The following is a summary of the debt extinguished and the respective impact on extinguishment:
| | | | | | | | | | | |
| (In Millions) |
| Year Ended
December 31, 2019 |
| Debt Extinguished | | (Loss) on Extinguishment |
| 4.875% 2021 Senior Notes | $ | 124 | | | $ | (5) | |
| 5.750% 2025 Senior Notes | 600 | | | (13) | |
| Total | $ | 724 | | | $ | (18) | |
Debt MaturitiesDEBT MATURITIES
The following represents a summary of our debt instrument maturities based on the principal amounts outstanding at December 31, 2021:2023 (in millions):
| | | | | |
| (In Millions) |
| Maturities of Debt |
| 2022 | $ | — | |
| 2023 | — | |
| 2024 | 36 | |
| 2025 | 2,510 | |
| 2026 | 845 | |
| Thereafter | 1,978 | |
| Total maturities of debt | $ | 5,369 | |
| | | | | | | | | | | | | | | | | | | | | | | | | | | | | | | | | | | | | | |
| 2024 | | 2025 | | 2026 | | 2027 | | 2028 | | Thereafter | | Total |
| $ | — | | | $ | — | | | $ | 829 | | | $ | 685 | | | $ | — | | | $ | 1,678 | | | $ | 3,192 | |
NOTE 9 - FAIR VALUE OF FINANCIAL INSTRUMENTS
There were no significant assets or liabilities measured at fair value as of December 31, 2021 or December 31, 2020.
The valuation of financial assets classified in Level 2 was determined using a market approach based upon quoted prices for similar assets in active markets or other inputs that were observable.
Our supply agreement with ArcelorMittal USA contained provisions for supplemental revenue or refunds based on the HRC price in the year the iron ore product was consumed in ArcelorMittal USA’s blast furnaces. We accounted for these provisions as derivative instruments at the time of sale and adjusted the derivative instruments to fair value through Revenues each reporting period until the product was consumed and the amounts were settled. These instruments were classified as Level 3 assets. Upon the completion of the AM USA Transaction, the outstanding derivatives were settled as part of acquisition accounting.
The following tables represent a reconciliation of the changes in fair value of financial instruments measured at fair value on a recurring basis using significant unobservable inputs (Level 3):
| | | | | | | | | | | |
| (In Millions) |
| Level 3 Assets |
| 2021 | | 2020 |
| Beginning balance - January 1 | $ | — | | | $ | 45 | |
| Total gains included in earnings | — | | | 122 | |
| Settlements | — | | | (27) | |
| Settlement of pre-existing relationship | — | | | (140) | |
| Ending balance - December 31 | $ | — | | | $ | — | |
| Total gains for the period included in earnings attributable to the change in unrealized gains on assets still held at the reporting date | $ | — | | | $ | — | |
The carrying values of certain financial instruments (e.g. Accounts receivable, net, Accounts payable and Other current liabilities) approximate fair value and, therefore, have been excluded from the table below. A summary of the carrying value and fair value of other financial instruments were as follows:
| | | | | | | | | | | | | | | | | | | | | | | | | | | | | |
| | | (In Millions) |
| | | December 31, 2021 | | December 31, 2020 |
| Classification | | Carrying
Value | | Fair Value | | Carrying
Value | | Fair Value |
| Senior notes | Level 1 | | $ | 3,561 | | | $ | 3,911 | | | $ | 3,802 | | | $ | 4,446 | |
| IRBs due 2024 to 2028 | Level 1 | | 68 | | | 66 | | | 94 | | | 91 | |
| EDC Revolving Facility - outstanding balance | Level 2 | | — | | | — | | | 18 | | | 18 | |
| ABL Facility - outstanding balance | Level 2 | | 1,609 | | | 1,609 | | | 1,510 | | | 1,510 | |
| Total | | | $ | 5,238 | | | $ | 5,586 | | | $ | 5,424 | | | $ | 6,065 | |
The fair value of both current and long-term debt was determined using quoted market prices.
NOTE 10 - PENSIONS AND OTHER POSTRETIREMENT BENEFITS
We offer benefits through defined benefit pension plans, defined contribution pension plans and OPEB plans to a significant portion of our employees and retirees. Benefits are also provided through multiemployer plans for certain union members.
As a result of the acquisitions of AK Steel and ArcelorMittal USA, we assumed the obligations under their defined benefit pension plans, OPEB plans, defined contribution plans and commitments to multiemployer pension plans according to collective bargaining agreements that cover certain union-represented employees. The AK Steel defined benefit pension plans and OPEB plans acquired amounted to a benefit obligation, net of assets of $949 million based on a March 13, 2020 measurement. The ArcelorMittal USA defined benefit pension plans and OPEB plans acquired amounted to a benefit obligation, net of assets of $3,294 million based on a December 9, 2020 measurement.
Defined Benefit Pension PlansDEFINED BENEFIT PENSION PLANS
The defined benefit pension plans are largely noncontributory and limited in participation. Most plans are closed to new participants with only the legacy iron ore hourly and salaried plans still open. The pension benefit calculations vary by plan but are generally based on employees' years of service and compensation or a fixed rate and years of service. Certain salaried plans calculate benefits using a cash balance formula, which earns interest credits and allocations based on a percent of pay.
OPEB PlansPLANS
We offer postretirement health care and life insurance benefits to retirees through various funded and unfunded plans. The vast majority of our plans are closed to new participants. In lieu of retiree medical coverage, many union-represented employees receive a 401(k) contribution per hour worked to a restricted Retiree Health Care Account. Cost sharing features between the employer and retiree vary by plan and several plans include employer caps. Retiree healthcare coverage is provided through programs administered by insurance companies whose charges are based on benefits paid. Certain labor agreements require the funding of VEBAs, which, depending on funding levels, may be used to reimburse the employer for paid benefits.
Obligations and Funded Status
OBLIGATIONS AND FUNDED STATUS
The following tables and information provide additional disclosures:
| | | | | | | | | | | | | | | | | | | | | | | |
| (In Millions) |
| Pension Benefits | | OPEB |
| Change in benefit obligations: | 2021 | | 2020 | | 2021 | | 2020 |
| Benefit obligations — beginning of year | $ | 6,565 | | | $ | 1,021 | | | $ | 3,757 | | | $ | 255 | |
| Service cost | 56 | | | 23 | | | 51 | | | 8 | |
| Interest cost | 103 | | | 64 | | | 74 | | | 19 | |
| Plan amendments | — | | | — | | | 8 | | | — | |
| Actuarial loss (gain) | (131) | | | 162 | | | (456) | | | 14 | |
| Benefits paid | (456) | | | (146) | | | (227) | | | (89) | |
| Participant contributions | — | | | — | | | 47 | | | 22 | |
| Acquired through business combinations | — | | | 5,535 | | | — | | | 3,528 | |
| Effect of settlement | (101) | | | (94) | | | — | | | — | |
| | | | | | | |
| Benefit obligations — end of year | $ | 6,036 | | | $ | 6,565 | | | $ | 3,254 | | | $ | 3,757 | |
| | | | | | | |
| Change in plan assets: | | | | | | | |
| Fair value of plan assets — beginning of year | $ | 5,332 | | | $ | 749 | | | $ | 783 | | | $ | 260 | |
| Actual return on plan assets | 668 | | | 472 | | | 29 | | | 45 | |
| Participant contributions | — | | | — | | | 26 | | | 17 | |
| Employer contributions | 155 | | | 50 | | | 139 | | | 30 | |
| Benefits paid | (454) | | | (146) | | | (165) | | | (88) | |
| Acquired through business combinations | — | | | 4,301 | | | — | | | 519 | |
| Effect of settlement | (95) | | | (94) | | | — | | | — | |
| | | | | | | |
| Fair value of plan assets — end of year | $ | 5,606 | | | $ | 5,332 | | | $ | 812 | | | $ | 783 | |
| Funded status | $ | (430) | | | $ | (1,233) | | | $ | (2,442) | | | $ | (2,974) | |
| | | | | | | |
| Amounts recognized in Statements of Financial Position: | | | | | | | |
| Non-current assets | $ | 153 | | | $ | 3 | | | $ | 71 | | | $ | 54 | |
| Current liabilities | (5) | | | (12) | | | (130) | | | (139) | |
| Non-current liabilities | (578) | | | (1,224) | | | (2,383) | | | (2,889) | |
| Total amount recognized | $ | (430) | | | $ | (1,233) | | | $ | (2,442) | | | $ | (2,974) | |
| | | | | | | |
| Amounts recognized in accumulated other comprehensive loss (income): | | | | | | | |
| Net actuarial loss (gain) | $ | (286) | | | $ | 164 | | | $ | (392) | | | $ | 56 | |
| Prior service cost (credit) | 5 | | | 6 | | | 4 | | | (6) | |
| Net amount recognized | $ | (281) | | | $ | 170 | | | $ | (388) | | | $ | 50 | |
| | | | | | | |
| | | | | | | | | | | | | | | | | | | | | | | |
| (In millions) | Pension Benefits | | OPEB |
| Change in benefit obligations: | 2023 | | 2022 | | 2023 | | 2022 |
| Benefit obligations — beginning of year | $ | 4,646 | | | $ | 6,036 | | | $ | 1,233 | | | $ | 3,254 | |
| Service cost | 31 | | | 45 | | | 10 | | | 35 | |
| Interest cost | 235 | | | 144 | | | 64 | | | 72 | |
| Plan amendments | 3 | | | 122 | | | 8 | | | (163) | |
| Actuarial loss (gain) | 116 | | | (1,236) | | | (158) | | | (1,781) | |
| Benefits paid | (436) | | | (431) | | | (163) | | | (232) | |
| Participant contributions | — | | | — | | | 42 | | | 47 | |
| Effect of settlement | (24) | | | (34) | | | — | | | — | |
| Other | — | | | — | | | — | | | 1 | |
| Benefit obligations — end of year | $ | 4,571 | | | $ | 4,646 | | | $ | 1,036 | | | $ | 1,233 | |
| | | | | | | |
| Change in plan assets: | | | | | | | |
| Fair value of plan assets — beginning of year | $ | 4,338 | | | $ | 5,606 | | | $ | 728 | | | $ | 812 | |
| Actual return on plan assets | 375 | | | (809) | | | 67 | | | (97) | |
| Participant contributions | — | | | — | | | 42 | | | 47 | |
| Employer contributions | 29 | | | 6 | | | 65 | | | 198 | |
| Benefits paid | (436) | | | (431) | | | (163) | | | (232) | |
| | | | | | | |
| Effect of settlement | (24) | | | (34) | | | — | | | — | |
| | | | | | | |
| Fair value of plan assets — end of year | $ | 4,282 | | | $ | 4,338 | | | $ | 739 | | | $ | 728 | |
| Funded status | $ | (289) | | | $ | (308) | | | $ | (297) | | | $ | (505) | |
| | | | | | | |
| Amounts recognized in Statements of Financial Position: | | | | | | | |
| Non-current assets | $ | 137 | | | $ | 195 | | | $ | 192 | | | $ | 161 | |
Current liabilities1 | (18) | | | (30) | | | (76) | | | (81) | |
| Non-current liabilities | (408) | | | (473) | | | (413) | | | (585) | |
| Total amount recognized | $ | (289) | | | $ | (308) | | | $ | (297) | | | $ | (505) | |
| | | | | | | |
| Amounts recognized in accumulated other comprehensive loss (income): | | | | | | | |
| Net actuarial gain | $ | (304) | | | $ | (361) | | | $ | (2,033) | | | $ | (1,996) | |
| Prior service cost (credit) | 106 | | | 121 | | | (131) | | | (156) | |
| Net amount recognized | $ | (198) | | | $ | (240) | | | $ | (2,164) | | | $ | (2,152) | |
| | | | | | | |
1 Current liabilities are classified within Other current liabilities on the Statements of Consolidated Financial Position. |
The accumulated benefit obligation for all defined benefit pension plans was $6,013$4,557 million and $6,537$4,628 million at December 31, 20212023 and 2020,2022, respectively.
| | | | | | | | | | | | | | | | | | | | | | | | | | | | | | | | | | | |
| (In Millions) |
| Pension Benefits | | OPEB |
| 2021 | | 2020 | | 2019 | | 2021 | | 2020 | | 2019 |
| Service cost | $ | 56 | | | $ | 23 | | | $ | 17 | | | $ | 51 | | | $ | 8 | | | $ | 2 | |
| Interest cost | 103 | | | 64 | | | 35 | | | 74 | | | 19 | | | 10 | |
| Expected return on plan assets | (359) | | | (140) | | | (55) | | | (40) | | | (20) | | | (17) | |
| Amortization: | | | | | | | | | | | |
| Net actuarial loss | 32 | | | 27 | | | 24 | | | 3 | | | 3 | | | 5 | |
| Prior service costs (credits) | 1 | | | 1 | | | 1 | | | (2) | | | (2) | | | (2) | |
| Settlements | (22) | | | (6) | | | — | | | — | | | — | | | — | |
| Net periodic benefit cost (credit) | $ | (189) | | | $ | (31) | | | $ | 22 | | | $ | 86 | | | $ | 8 | | | $ | (2) | |
| | | | | | | | | | | | | | | | | | | | | | | | | | | | | | | | | | | |
| Pension Benefits | | OPEB |
| (In millions) | 2023 | | 2022 | | 2021 | | 2023 | | 2022 | | 2021 |
| Service cost | $ | 31 | | | $ | 45 | | | $ | 56 | | | $ | 10 | | | $ | 35 | | | $ | 51 | |
| Interest cost | 235 | | | 144 | | | 103 | | | 64 | | | 72 | | | 74 | |
| Expected return on plan assets | (315) | | | (355) | | | (359) | | | (43) | | | (37) | | | (40) | |
| Amortization: | | | | | | | | | | | |
| Net actuarial loss (gain) | 3 | | | 13 | | | 32 | | | (145) | | | (43) | | | 3 | |
| Prior service costs (credits) | 18 | | | 5 | | | 1 | | | (17) | | | (3) | | | (2) | |
| Settlements | (4) | | | (8) | | | (22) | | | — | | | — | | | — | |
| Net periodic benefit cost (credit) | $ | (32) | | | $ | (156) | | | $ | (189) | | | $ | (131) | | | $ | 24 | | | $ | 86 | |
For 2022,2024, we estimate net periodic benefit cost (credit) as follows:
| | | | | |
| (In Millions)millions) | |
| Defined benefit pension plans | $ | (179)(58) | |
| OPEB plans | 72 (154) | |
| Total | $ | (107)(212) | |
Components of Accumulated Other Comprehensive Loss (Income)COMPONENTS OF OTHER COMPREHENSIVE LOSS (INCOME)
The following includes details on the significant actuarial losses (gains) impacting the benefit obligation:obligation and other components of other comprehensive loss (income):
| | (In Millions) |
| Pension Benefits | | OPEB |
| 2021 | | 2020 | | 2021 | | 2020 |
| Pension Benefits | | | Pension Benefits | | OPEB |
| (In millions) | | (In millions) | 2023 | | 2022 | | 2023 | | 2022 |
| Discount rates | Discount rates | $ | (224) | | | $ | 181 | | | $ | (117) | | | $ | 44 | |
| Demographic updates | 76 | | | (3) | | | 3 | | | (11) | |
Demographic updates1 | |
| Mortality | Mortality | 19 | | | (16) | | | 13 | | | (4) | |
| Per capita health care costs | — | | | — | | | (350) | | | (10) | |
Per capita healthcare costs and healthcare trend2 | |
| Other | Other | (2) | | | — | | | (5) | | | (5) | |
| Actuarial loss (gain) on benefit obligation | Actuarial loss (gain) on benefit obligation | (131) | | | 162 | | | (456) | | | 14 | |
| Actual returns on assets under (over) expected | Actual returns on assets under (over) expected | (309) | | | (332) | | | 11 | | | (26) | |
| Amortization of net actuarial gain (loss) | Amortization of net actuarial gain (loss) | (32) | | | (27) | | | 2 | | | (3) | |
| Amortization of prior service credits (costs) | Amortization of prior service credits (costs) | (1) | | | (1) | | | (3) | | | 2 | |
| Settlements | Settlements | 22 | | | 6 | | | — | | | — | |
| Other | — | | | (27) | | | 8 | | | (2) | |
| Total recognized in accumulated other comprehensive income | $ | (451) | | | $ | (219) | | | $ | (438) | | | $ | (15) | |
Plan amendments3 | |
| Total recognized in other comprehensive loss (income) | |
| 1 In 2023, the OPEB plans generated an actuarial gain relating to updates for demographic experience. We had adjustments relating to retirements, participation, persistency and census data updates. | |
1 In 2023, the OPEB plans generated an actuarial gain relating to updates for demographic experience. We had adjustments relating to retirements, participation, persistency and census data updates. | |
1 In 2023, the OPEB plans generated an actuarial gain relating to updates for demographic experience. We had adjustments relating to retirements, participation, persistency and census data updates. | |
2 The gain in per capita healthcare costs in 2022 relating to our OPEB plans is primarily due to the negotiation of favorable Medicare Advantage Prescription Drug healthcare rates, which went into effect on January 1, 2023. Additionally, we expanded the Medicare Advantage program to retirees on some of our other plans during the 2022 USW labor negotiations which added additional savings. The negotiated rates extend through 2025. | | 2 The gain in per capita healthcare costs in 2022 relating to our OPEB plans is primarily due to the negotiation of favorable Medicare Advantage Prescription Drug healthcare rates, which went into effect on January 1, 2023. Additionally, we expanded the Medicare Advantage program to retirees on some of our other plans during the 2022 USW labor negotiations which added additional savings. The negotiated rates extend through 2025. |
3 In 2022, the plan amendment gains and losses were generated from the ratification of the 2022 USW labor agreements. The plan amendment loss related to our pension plans is attributable to the increase to the pre-2023 service multiplier to $115 and the service multiplier applicable to service beginning in 2023 to $126 for retirements after January 1, 2023. The plan amendment gain related to our OPEB plans is attributable to the implementation of a cap on healthcare costs for employees retiring after January 1, 2026 on one of our Cleveland-Cliffs Steel LLC plans as well as the extension of the Medicare Advantage program to plans that previously did not have the offering. | | 3 In 2022, the plan amendment gains and losses were generated from the ratification of the 2022 USW labor agreements. The plan amendment loss related to our pension plans is attributable to the increase to the pre-2023 service multiplier to $115 and the service multiplier applicable to service beginning in 2023 to $126 for retirements after January 1, 2023. The plan amendment gain related to our OPEB plans is attributable to the implementation of a cap on healthcare costs for employees retiring after January 1, 2026 on one of our Cleveland-Cliffs Steel LLC plans as well as the extension of the Medicare Advantage program to plans that previously did not have the offering. |
11681 | CLF 2023 FORM 10-K
ContributionsCONTRIBUTIONS
AnnualWe make both required and discretionary pension contributions. Required contributions are based on minimum funding requirements pursuant to the pension plans are made within income tax deductibility restrictions in accordance with statutoryERISA regulations. Funded OPEB plans are not subject to minimum regulatory funding requirements, but rather amounts are contributed pursuant to bargaining agreements. Contributions toward unfunded OPEB plans are payments made directly from corporate assets and are displayed net of participant contributions and other reimbursements. Company contributions and payments we expect to make in 2024, and made in 2023 and 2022 are as follows:
| | | | | | | | | | | | | | | | | | | | | | | | | | |
| | (In Millions) |
| | Pension Benefits1 | | Other Benefits2 |
| Company Contributions & Payments | | VEBA | | Direct
Payments | | Total |
| 2020 | | $ | 50 | | | $ | — | | | $ | 25 | | | $ | 25 | |
| 2021 | | 163 | | | 67 | | | 113 | | | 180 | |
| 2022 (Expected) | | 4 | | | 28 | | | 110 | | | 138 | |
| | | | | | | | |
1 The 2021 pension contributions include $118 million in deferred 2020 pension contributions in connection with the CARES Act that were paid on January 4, 2021. |
2 Pursuant to the applicable bargaining agreements, benefits can be paid from certain VEBAs that are at least 70% funded (all VEBAs were over 70% funded at December 31, 2021). Certain agreements with plans holding VEBA assets have capped healthcare costs. For the Cleveland-Cliffs Steel LLC VEBA, we are required to make contributions based on earnings, and we may withdraw money from the VEBA plan to the extent funds are available for costs in excess of the cap. VEBA withdrawals are represented net of direct payments. The amount expected for 2022 in the VEBA column reflects the contribution to be made in February 2022 for earnings in the quarter ended December 31, 2021. We do not include an estimate for contributions beyond that due to the variability of the calculation. |
| | | | | | | | | | | | | | | | | | | | | | | | | | |
| | Pension Benefits | | OPEB |
| (In millions) | | VEBA1 | | Direct Payments | | Total |
| 2022 | | $ | 6 | | | $ | 85 | | | $ | 113 | | | $ | 198 | |
| 2023 | | 29 | | | — | | | 65 | | | 65 | |
| 2024 (Expected) | | 122 | | | — | | | 66 | | | 66 | |
| | | | | | | | |
1 Pursuant to the applicable bargaining agreements, benefits can be paid from certain VEBAs that are at least 70% funded (all VEBAs were over 70% funded at December 31, 2023). Certain agreements with plans holding VEBA assets have capped healthcare costs. For the Cleveland-Cliffs Steel LLC VEBA, we are required to make contributions based on earnings, and we may withdraw money from the VEBA plan to the extent funds are available for costs in excess of the cap. VEBA withdrawals are represented net of direct payments. There will be no further contributions to the Cleveland-Cliffs Steel LLC VEBA based on earnings for the remainder of the labor agreement with the USW, which expires in September of 2026. |
Estimated Future Benefit PaymentsESTIMATED FUTURE BENEFIT PAYMENTS
| | (In Millions) |
| Pension
Benefits | | OPEB |
| 2022 | $ | 475 | | | $ | 180 | |
| 2023 | 477 | | | 171 | |
| (In millions) | | (In millions) | Pension Benefits | | OPEB1 |
| 2024 | 2024 | 451 | | | 167 | |
| 2025 | 2025 | 428 | | | 163 | |
| 2026 | 2026 | 424 | | | 163 | |
| 2027-2031 | 1,879 | | | 823 | |
| 2027 | |
| 2028 | |
| 2029-2033 | |
| 1 OPEB benefit payments are displayed net of participant contributions. | |
1 OPEB benefit payments are displayed net of participant contributions. | |
1 OPEB benefit payments are displayed net of participant contributions. | |
AssumptionsASSUMPTIONS
The discount rates used to measure plan liabilities as of the December 31 measurement date are determined individually for each plan. The discount rates are determined by matching the projected cash flows used to determine the plan liabilities to a projected yield curve of high-quality corporate bonds available at the measurement date. Discount rates for expense are calculated using the granular approach for each plan.
Depending on the plan, weWe use either company-specific base mortality tables orfor healthy annuitants in qualified pension plans. We use tables issued by the Society of Actuaries. We use the Pri-2012 mortalityActuaries for non-annuitants in qualified pension plans, all nonqualified pension participants and OPEB participants. For tables fromissued by the Society of Actuaries, we use Pri-2012 mortality tables with adjustments for blue collar, white collar or no collar depending on the plan. On December 31, 2021,Mortality is projected for all plans using Scale MP-2021 with generational projection for both years. In 2023, we switched two OPEB plans from company-specific base mortality tables to the assumedPri-2012 mortality improvement projection was updatedtables to align with our other OPEB plans. In 2022, we switched one pension plan from generational scale MP-2020the Pri-2012 mortality tables to generational scale MP-2021 for the Pri-2012company-specific base mortality tables.
The following represents weighted-average assumptions used to determine benefit obligations:
| | Pension Benefits | | OPEB |
| December 31, | | December 31, |
| 2021 | | 2020 | | 2021 | | 2020 |
| Pension Benefits | | | Pension Benefits | | OPEB |
| December 31, | | | December 31, |
| 2023 | | | 2023 | | 2022 | | 2023 | | 2022 |
| Discount rate | Discount rate | 2.75 | % | | 2.34 | % | | 3.01 | % | | 2.71 | % | Discount rate | 5.12 | % | | 5.47 | % | | 5.15 | % | | 5.52 | % |
| Interest crediting rate | Interest crediting rate | 5.35 | | 5.25 | | N/A | | N/A | |
| Compensation rate increase | Compensation rate increase | 2.52 | | 2.56 | | 3.00 | | 3.00 | |
| Compensation rate increase | |
| Compensation rate increase | |
11782 | CLF 2023 FORM 10-K
The following represents weighted-average assumptions used to determine net benefit cost:
| | Pension Benefits | | OPEB |
| December 31, | | December 31, |
| 2021 | | 2020 | | 2019 | | 2021 | | 2020 | | 2019 |
| Pension Benefits | | | Pension Benefits | | OPEB |
| December 31, | | | December 31, |
| 2023 | | | 2023 | | 2022 | | 2021 | | 2023 | | 2022 | | 2021 |
| Obligation discount rate | Obligation discount rate | 2.32 | | % | | 3.02 | | % | | 4.27 | | % | | 2.46 | | % | | 3.28 | | % | | 4.29 | | % | Obligation discount rate | 5.47 | | % | % | | 3.21 | | % | % | | 2.32 | | % | % | | 5.52 | | % | % | | 3.33 | | % | % | | 2.46 | | % | % |
| Service cost discount rate | Service cost discount rate | 2.78 | | | 3.34 | | | 4.35 | | | 3.28 | | | 3.35 | | | 4.49 | | |
| Interest cost discount rate | Interest cost discount rate | 1.64 | | | 2.53 | | | 3.92 | | | 2.04 | | | 2.51 | | | 3.94 | | |
| Interest cost discount rate | |
| Interest cost discount rate | |
| | Interest crediting rate | |
| | Interest crediting rate | |
| | Interest crediting rate | Interest crediting rate | 5.35 | | | 5.50 | | | 6.00 | | | N/A | | N/A | | N/A | |
| Expected return on plan assets | Expected return on plan assets | 6.84 | | | 7.69 | | | 8.25 | | | 5.20 | | | 6.82 | | | 7.00 | | |
| Expected return on plan assets | |
| Expected return on plan assets | |
| Compensation rate increase | Compensation rate increase | 2.54 | | | 2.56 | | | 2.53 | | | 3.00 | | | 3.00 | | | 3.00 | | |
| Compensation rate increase | |
| Compensation rate increase | |
The following represents assumed weighted-average health care cost trend rates:
| | December 31, |
| 2021 | | 2020 |
| Health care cost trend rate assumed for next year | 2.36 | | % | | 6.05 | | % |
| December 31, | | | December 31, |
| 2023 | | | 2023 | | 2022 |
Health care cost trend rate assumed for next year1 | | Health care cost trend rate assumed for next year1 | 5.49 | | % | | 5.44 | | % |
| Ultimate health care cost trend rate | Ultimate health care cost trend rate | 4.50 | | | 4.59 | | | Ultimate health care cost trend rate | 4.50 | | % | % | | 4.50 | | % | % |
| Year that the ultimate rate is reached | Year that the ultimate rate is reached | 2031 | | 2031 | |
| 1 The health care trend rate for the next year is weighted for all of our OPEB plans and factors in our Medicare Advantage Prescription Drug pricing arrangements. In 2023, we increased our assumed health care cost trend rate for self insured plans to 6.50% from 6.00% for 2024, which grades down on a linear basis to 4.50% by 2032. The health care trend rate for the Medicare Advantage Prescription Drug plans is set to match the negotiated rates through 2025 and then converts to the same trend rate as our self insured plan. In 2023, we layered in a one time increase to the healthcare trend rate for the Medicare Advantage Prescription Drug plans for 2026. These increases align with our expectation of higher health care costs due to increased popularity of specialty medication, current carrier and provider negotiations and impacts from third party funding associated with the Inflation Reduction Act. | |
| 1 The health care trend rate for the next year is weighted for all of our OPEB plans and factors in our Medicare Advantage Prescription Drug pricing arrangements. In 2023, we increased our assumed health care cost trend rate for self insured plans to 6.50% from 6.00% for 2024, which grades down on a linear basis to 4.50% by 2032. The health care trend rate for the Medicare Advantage Prescription Drug plans is set to match the negotiated rates through 2025 and then converts to the same trend rate as our self insured plan. In 2023, we layered in a one time increase to the healthcare trend rate for the Medicare Advantage Prescription Drug plans for 2026. These increases align with our expectation of higher health care costs due to increased popularity of specialty medication, current carrier and provider negotiations and impacts from third party funding associated with the Inflation Reduction Act. | |
| 1 The health care trend rate for the next year is weighted for all of our OPEB plans and factors in our Medicare Advantage Prescription Drug pricing arrangements. In 2023, we increased our assumed health care cost trend rate for self insured plans to 6.50% from 6.00% for 2024, which grades down on a linear basis to 4.50% by 2032. The health care trend rate for the Medicare Advantage Prescription Drug plans is set to match the negotiated rates through 2025 and then converts to the same trend rate as our self insured plan. In 2023, we layered in a one time increase to the healthcare trend rate for the Medicare Advantage Prescription Drug plans for 2026. These increases align with our expectation of higher health care costs due to increased popularity of specialty medication, current carrier and provider negotiations and impacts from third party funding associated with the Inflation Reduction Act. | |
Plan AssetsPLAN ASSETS
Our financialinvestment objectives with respect to our pension and VEBAOPEB assets are to fully fund the actuarial accrued liability for each of the plans, to maximize investment returns within reasonable and prudent levels of risk and to maintain sufficient liquidity to meet benefit obligations on a timely basis.
Our investment objective is to outperform the expected return on assets assumption used in the plans’ actuarial reports over the life of each plan. The asset allocations are tailored to each individual plan and are determined by analyzing each plan's duration of benefit obligations, funded status and risk profile. Our investment strategy utilizes a broad mix of equity, fixed income and alternative investments to generate returns and manage risk. Equity investments are diversified across large-cap, mid-cap and small-cap companies located in the plans. U.S. and worldwide, with a bias towards U.S. companies. Fixed income investments primarily include corporate bonds and government debt securities, which are generally customized based on a plan's obligation duration. To enhance our diversification, we also invest in hedge funds, private equity, structured credit and real estate.
We review investment performance, asset allocations and policy compliance on a quarterly basis. In the fourth quarter of 2022, we increased our fixed income allocation for one of our more mature pension plans, which totaled $1.2 billion on December 31, 2022. In the fourth quarter of 2022, we also transitioned $2.9 billion of pension and OPEB assets to be managed by an external investment advisor in a delegated manner, which resulted in a shift to treasury based hedging, a higher alternative investment allocation and reduction to equity risk exposure. These changes resulted in a shift in underlying investments and increased our weighted-average expected return on plan assets in 2023 compared to 2022.
The expected return on plan assets takesare calculated on a plan-by-plan basis and take into account historicaleach plan's strategic asset allocation. The calculation of rates by asset class are based primarily on our future expected returns and estimated future long-term returns based on capital market assumptions applied totake into consideration the asset allocation strategy. The expected return is net of investment expenses paid by the plans. In addition, investment performance is monitored quarterly by benchmarking to various indices and metrics for the one-, three- and five-year periods.
The asset allocation strategy is determined through a detailed analysis of assets and liabilities by plan, which defines the overall risk that is acceptable with regard to the expected level and variability of portfolio returns, surplus (assets compared to liabilities), contributions and pension expense.
The asset allocation review process involves simulating capital market behaviors including global asset class performance, inflation and interest rates in order to evaluate various asset allocation scenarios and determine the asset mix with the highest likelihood of meeting financial objectives. The process includes factoring in the current funded status and likely future funded status levelsduration of the cash flows, active management and fees.
Assets for OPEB plans by taking into account expected growth or decline in the contributions over time.
The asset allocation strategy varies by plan.include VEBA trusts pursuant to bargaining agreements that are available to fund retired employees’ life insurance obligations and medical benefits. The following table reflects the actual asset allocations for pension and VEBA assets as of December 31, 20212023 and 2020,2022, as well as the 20222024 weighted average target asset allocations. Equityallocations:
| | | | | | | | | | | | | | | | | | | | | | | | | | | | | | | | | | | | | | |
| | Pension Assets | | VEBA Assets |
| Asset Category | | 2024
Target
Allocation | | Actual Asset Allocation at December 31, | | 2024
Target
Allocation | | Actual Asset Allocation at December 31, |
| 2023 | | 2022 | | 2023 | | 2022 |
| Equity securities | | 33.8 | % | | 32.1 | % | | 36.1 | % | | 16.6 | % | | 18.4 | % | | 22.0 | % |
| Fixed income | | 41.1 | | | 38.8 | | | 40.9 | | | 78.5 | | | 74.5 | | | 67.4 | |
| Hedge funds | | 9.4 | | | 9.4 | | | 2.7 | | | 1.4 | | | 1.5 | | | 1.9 | |
| Private equity | | 3.3 | | | 3.4 | | | 3.3 | | | — | | | — | | | — | |
| Structured credit | | 2.4 | | | 5.1 | | | 6.9 | | | 0.2 | | | 0.9 | | | 1.2 | |
| Real estate | | 10.0 | | | 11.2 | | | 8.2 | | | 3.3 | | | 4.7 | | | 1.7 | |
| Absolute return fixed income | | — | | | — | | | 1.9 | | | — | | | — | | | 5.8 | |
| Total | | 100.0 | % | | 100.0 | % | | 100.0 | % | | 100.0 | % | | 100.0 | % | | 100.0 | % |
FAIR VALUE MEASUREMENTS
Investments classified as Level 1 primarily include equity investments include securities in large-cap, mid-cap and small-cap companies located in the U.S. and worldwide.fixed income mutual funds that are based on observable quoted market prices on an active exchange. Fixed income investments primarilyclassified as Level 2 include U.S. Treasury STRIPS which are priced daily through a bond pricing vendor as well as corporate bonds, mortgage-backed securities and government debt securities.non-US bonds which have valuations based on their bid-ask spreads or quoted prices of securities with similar characteristics.
quoted market prices and inherent lack of liquidity. These investments are generally valued at estimated fair value based on financial inputs from our investment advisors, investment managers or third party appraisers. Certain Level 3 investments may be lagged up to three months if there are no financial inputs available. | | | | | | | | | | | | | | | | | | | | | | | | | | | | | | | | | | | | | | |
| | Pension Assets | | VEBA Assets |
| Asset Category | | 2022
Target
Allocation | | Percentage of
Plan Assets at
December 31, | | 2022
Target
Allocation | | Percentage of
Plan Assets at
December 31, |
| 2021 | | 2020 | | 2021 | | 2020 |
| Equity securities | | 46.3 | % | | 47.6 | % | | 51.8 | % | | 21.2 | % | | 22.5 | % | | 22.2 | % |
| Fixed income | | 34.6 | | | 34.6 | | | 33.8 | | | 68.5 | | | 66.4 | | | 66.4 | |
| Hedge funds | | 2.2 | | | 2.2 | | | 2.2 | | | 1.4 | | | 1.8 | | | 1.8 | |
| Private equity | | 5.0 | | | 2.7 | | | 2.1 | | | 1.1 | | | — | | | 0.4 | |
| Structured credit | | 5.2 | | | 5.6 | | | 5.0 | | | 1.0 | | | 1.2 | | | 0.9 | |
| Real estate | | 5.2 | | | 5.6 | | | 3.3 | | | 1.0 | | | 2.1 | | | 1.8 | |
| Absolute return fixed income | | 1.5 | | | 1.7 | | | 1.8 | | | 5.8 | | | 6.0 | | | 6.5 | |
| Total | | 100.0 | % | | 100.0 | % | | 100.0 | % | | 100.0 | % | | 100.0 | % | | 100.0 | % |
As a practical expedient, in accordance with ASC 820-10, certain investments that are measured at fair value using the NAV per share have not been classified in the fair value hierarchy below. NAV is based on the value of the underlying assets owned by the fund, minus its liabilities, and then divided by its number of shares outstanding.
The fair value of our pension assets by asset category is as follows:
| | (In Millions) |
| Quoted Prices in Active
Markets for Identical
Assets
(Level 1) | | Significant Other
Observable
Inputs
(Level 2) | | Significant
Unobservable
Inputs
(Level 3) | | Investments Measured at Net Asset Value | | Total |
| (In millions) | | (In millions) | Quoted Prices in Active Markets for Identical Assets (Level 1) | | Significant Other Observable Inputs
(Level 2) | | Significant
Unobservable
Inputs
(Level 3) | | Investments Measured at Net Asset Value | | Total |
| Asset Category | Asset Category | 2021 | 2020 | | 2021 | 2020 | | 2021 | 2020 | | 2021 | 2020 | | 2021 | 2020 | Asset Category | 2023 | 2022 | | 2023 | 2022 | | 2023 | 2022 | | 2023 | 2022 | | 2023 | 2022 |
| Equity securities: | Equity securities: | | | | | | | | | |
| U.S. equities | U.S. equities | $ | 1,157 | | $ | 1,163 | | | $ | — | | $ | — | | | $ | — | | $ | — | | | $ | 775 | | $ | 787 | | | $ | 1,932 | | $ | 1,950 | |
| U.S. equities | |
| U.S. equities | |
| Global equities | Global equities | 617 | | 615 | | | — | | — | | | — | | — | | | 117 | | 195 | | | 734 | | 810 | |
| Fixed income: | Fixed income: | |
U.S. government securities1 | |
U.S. government securities1 | |
U.S. government securities1 | U.S. government securities1 | 140 | | 141 | | | 310 | | 295 | | | — | | — | | | 50 | | 40 | | | 500 | | 476 | |
| U.S. corporate bonds | U.S. corporate bonds | 502 | | 512 | | | 371 | | 466 | | | — | | — | | | 503 | | 303 | | | 1,376 | | 1,281 | |
| Non U.S. and other bonds | Non U.S. and other bonds | — | | — | | | 66 | | 46 | | | — | | — | | | — | | — | | | 66 | | 46 | |
| Hedge funds | Hedge funds | — | | — | | | — | | — | | | 125 | | 118 | | | — | | — | | | 125 | | 118 | |
| Private equity | Private equity | — | | — | | | — | | — | | | 151 | | 114 | | | — | | — | | | 151 | | 114 | |
| Structured credit | Structured credit | — | | — | | | — | | — | | | 315 | | 264 | | | — | | — | | | 315 | | 264 | |
| Real estate | Real estate | — | | — | | | — | | — | | | 313 | | 174 | | | — | | — | | | 313 | | 174 | |
| Absolute return fixed income | Absolute return fixed income | — | | — | | | — | | — | | | — | | — | | | 94 | | 99 | | | 94 | | 99 | |
| Total | Total | $ | 2,416 | | $ | 2,431 | | | $ | 747 | | $ | 807 | | | $ | 904 | | $ | 670 | | | $ | 1,539 | | $ | 1,424 | | | $ | 5,606 | | $ | 5,332 | |
| 1 Includes cash equivalents. | 1 Includes cash equivalents. | |
1 Includes cash equivalents. | |
11984 | CLF 2023 FORM 10-K
Assets for OPEB plans include VEBA trusts pursuant to bargaining agreements that are available to fund retired employees’ life insurance obligations and medical benefits. The fair value of our other benefit planVEBA assets by asset category is as follows:
| | (In Millions) |
| Quoted Prices in Active
Markets for Identical
Assets
(Level 1) | | Significant Other
Observable
Inputs
(Level 2) | | Significant
Unobservable
Inputs
(Level 3) | | Investments Measured at Net Asset Value | | Total |
| (In millions) | | (In millions) | Quoted Prices in Active Markets for Identical Assets
(Level 1) | | Significant Other Observable Inputs
(Level 2) | | Significant
Unobservable
Inputs
(Level 3) | | Investments Measured at Net Asset Value | | Total |
| Asset Category | Asset Category | 2021 | 2020 | | 2021 | 2020 | | 2021 | 2020 | | 2021 | 2020 | | 2021 | 2020 | Asset Category | 2023 | 2022 | | 2023 | 2022 | | 2023 | 2022 | | 2023 | 2022 | | 2023 | 2022 |
| Equity securities: | Equity securities: | | | | | | | | | |
| U.S. equities | |
| U.S. equities | |
| U.S. equities | U.S. equities | $ | 26 | | $ | 26 | | | $ | — | | $ | — | | | $ | — | | $ | — | | | $ | 103 | | $ | 93 | | | $ | 129 | | $ | 119 | |
| Global equities | Global equities | 6 | | 6 | | | — | | — | | | — | | — | | | 48 | | 49 | | | 54 | | 55 | |
| Fixed income: | Fixed income: | |
U.S. government securities1 | U.S. government securities1 | 111 | | 62 | | | 80 | | 94 | | | — | | — | | | — | | — | | | 191 | | 156 | |
U.S. government securities1 | |
U.S. government securities1 | |
| U.S. corporate bonds | U.S. corporate bonds | 219 | | 237 | | | 129 | | 127 | | | — | | — | | | — | | — | | | 348 | | 364 | |
| Non U.S. and other bonds | |
| Hedge funds | Hedge funds | — | | — | | | — | | — | | | 15 | | 14 | | | — | | — | | | 15 | | 14 | |
| Private equity | Private equity | — | | — | | | — | | — | | | — | | 3 | | | — | | — | | | — | | 3 | |
| Structured credit | Structured credit | — | | — | | | — | | — | | | 10 | | 7 | | | — | | — | | | 10 | | 7 | |
| Real estate | Real estate | — | | — | | | — | | — | | | 17 | | 14 | | | — | | — | | | 17 | | 14 | |
| Absolute return fixed income | Absolute return fixed income | — | | — | | | — | | — | | | — | | — | | | 48 | | 51 | | | 48 | | 51 | |
| Total | Total | $ | 362 | | $ | 331 | | | $ | 209 | | $ | 221 | | | $ | 42 | | $ | 38 | | | $ | 199 | | $ | 193 | | | $ | 812 | | $ | 783 | |
| 1 Includes cash equivalents. | 1 Includes cash equivalents. | |
1 Includes cash equivalents. | |
The following represents the fair value measurements of changes in plan assets using significant unobservable inputs (Level 3):
| | (In Millions) |
| Pension Assets | | VEBA Assets |
| 2021 | | 2020 | | 2021 | | 2020 |
| Pension Assets | | | Pension Assets | | VEBA Assets |
| (In millions) | | (In millions) | 2023 | | 2022 | | 2023 | | 2022 |
| Beginning balance — January 1 | Beginning balance — January 1 | $ | 670 | | | $ | 212 | | | $ | 38 | | | $ | 34 | |
| Actual return on plan assets: | Actual return on plan assets: | |
| Relating to assets still held at the reporting date | |
| Relating to assets still held at the reporting date | |
| Relating to assets still held at the reporting date | Relating to assets still held at the reporting date | 124 | | | 8 | | | 6 | | | 2 | |
| Relating to assets sold during the period | Relating to assets sold during the period | 8 | | | 6 | | | — | | | 1 | |
| Purchases | Purchases | 142 | | | 195 | | | — | | | — | |
| Sales | Sales | (40) | | | (13) | | | (2) | | | (1) | |
| Acquired through business combinations | — | | | 262 | | | — | | | 2 | |
| | Ending balance — December 31 | Ending balance — December 31 | $ | 904 | | | $ | 670 | | | $ | 42 | | | $ | 38 | |
| Ending balance — December 31 | |
| Ending balance — December 31 | |
Following is a description of the inputs and valuation methodologies used to measure the fair value of our plan assets.
Equity Securities
Equity securities classified as Level 1 investments include U.S. large-, small- and mid-cap investments and international equities. These investments are comprised of securities listed on an exchange, market or automated quotation system for which quotations are readily available. The valuation of these securities is determined using a market approach and is based upon unadjusted quoted prices for identical assets in active markets.
Fixed Income
Fixed income securities classified as Level 1 investments include bonds, government debt securities and cash equivalents. These investments are comprised of securities listed on an exchange, market or automated quotation system for which quotations are readily available. The valuation of these securities is determined using a
market approach and is based upon unadjusted quoted prices for identical assets in active markets. Also included in fixed income is a portfolio of U.S. Treasury STRIPS, which are zero-coupon bearing fixed income securities backed by the full faith and credit of the U.S. government. The securities sell at a discount to par because there are no incremental coupon payments. STRIPS are not issued directly by the Treasury, but rather are created by a financial institution, government securities broker or government securities dealer. Liquidity on the issue varies depending on various market conditions; however, in general, the STRIPS market is slightly less liquid than that of the U.S. Treasury Bond market. The STRIPS are priced daily through a bond pricing vendor and are classified as Level 2.
Hedge Funds
Hedge funds are alternative investments comprised of direct or indirect investment in offshore hedge funds with an investment objective to achieve equity-like returns with one half the volatility of equities and moderate correlation. The valuation techniques used to measure fair value attempt to maximize the use of observable inputs and minimize the use of unobservable inputs. Considerable judgment is required to interpret the factors used to develop estimates of fair value. Valuations of the underlying investment funds are obtained and reviewed. The securities that are valued by the funds are interests in the investment funds and not the underlying holdings of such investment funds. Thus, the inputs used to value the investments in each of the underlying funds may differ from the inputs used to value the underlying holdings of such funds. Hedge funds are valued monthly and recorded on a one-month lag.
Private Equity Funds
Private equity funds are alternative investments that represent direct or indirect investments in partnerships, venture funds or a diversified pool of private investment vehicles (fund of funds).
Investment commitments are made in private equity funds based on an asset allocation strategy, and capital calls are made over the life of the funds to fund the commitments. As of December 31, 2021, remaining commitments total $151 million for our pension and OPEB plans. Committed amounts are funded from plan assets when capital calls are made. Investment commitments are not pre-funded in reserve accounts.
Private equity investments are valued quarterly and recorded on a one-quarter lag. For private equity investment values reported on a lag, current market information is reviewed for any material changes in values at the reporting date. Capital distributions for the funds do not occur on a regular frequency. Liquidation of these investments would require sale of the partnership interest.
Structured Credit
Structured credit funds provide flexibility and access to both complex and illiquid premiums by investing across global, public and private residential, commercial, corporate and specialty credit markets that are priced based on valuations provided by independent, third-party pricing agents, if available. Such values generally reflect the last reported sales price if the security is actively traded. The third-party pricing agents may also value structured credit investments at an evaluated bid price by employing methodologies that utilize actual market transactions, broker-supplied valuations or other methodologies designed to identify the market value of such securities.
Structured credit investments are valued monthly and certain funds have an initial lock-up period and withdrawal restrictions on a semi-annual and quarterly basis. For structured credit investment values reported on a lag, current market information is reviewed for any material changes in values at the reporting date.
Real Estate
The real estate portfolio for the pension plans is an alternative investment comprised of funds with strategic categories of real estate investments. All real estate holdings are appraised externally at least annually, and appraisals are conducted by reputable, independent appraisal firms that are members of the Appraisal Institute. All external appraisals are performed in accordance with the Uniform Standards of Professional Appraisal Practices. The property valuations and assumptions about each property are reviewed quarterly by the investment manager and values are adjusted if there has been a significant change in circumstances relating to the property since the last external appraisal. The fair values of the funds are updated on either a monthly or quarterly basis. Redemption requests are considered on a quarterly basis, subject to notice requirements.
The real estate fund of funds investment for the VEBA trusts invests in pooled investment vehicles that, in turn, invest in commercial real estate properties. Valuations are performed quarterly and financial statements are prepared on a semi-annual basis, with annual audited statements. Asset values for this fund are reported with a one-
quarter lag, and current market information is reviewed for any material changes in values at the reporting date. Withdrawals are permitted on the last business day of each quarter subject to a 95-day prior written notice.
Absolute Return Fixed Income
Absolute return fixed income investments consist of a global fixed income fund with the investment objective of generating positive absolute returns over a full market cycle. The fund's investments in securities, forward exchange contracts and futures contracts are reported at fair value on a recurring monthly basis. The fund's trustee values securities based upon independent pricing sources and futures contracts are valued at closing settled prices. Redemptions of the fund at NAV are permitted monthly under most circumstances.
Defined Contribution PlansDEFINED CONTRIBUTION PLANS
Most employees are eligible to participate in various defined contribution plans. Certain of these plans have features with matching contributions or other Company contributions based on our financial results. Company contributions to these plans are expensed as incurred. Total expense from these plans was $59 million, $52 million and $55 million $22 millionin 2023, 2022 and $3 million in 2021, 2020 and 2019, respectively.
Multiemployer PlansMULTlEMPLOYER PLANS
We contribute to multiemployer pension plans according to collective bargaining agreements that cover certain union-represented employees. The risks of participating in these multiemployer plans are different from the risks of participating in single-employer pension plans in the following respects:
•Assets contributed to a multiemployer plan by one employer may be used to provide benefits to employees of other participating employers.
•If a participating employer stops contributing to a multiemployer plan, the unfunded obligations of the plan may be borne by the remaining participating employers.
•If the multiemployer plan becomes significantly underfunded or is unable to pay its benefits, we may be required to contribute additional amounts in excess of the rate required by the collective bargaining agreements.
•If we choose to stop participating in a multiemployer plan, we may be required to pay that plan an amount based on the underfunded status of the plan, referred to as a withdrawal liability.
12285 | CLF 2023 FORM 10-K
Information with respect to multiemployer plans in which we participate follows:
| | | | | | | | | | | | | | | | | | | | | | | | | | | | | |
| Pension Fund | EIN/Pension Plan Number | Pension Protection Act Zone Status (a) | FIP/RP Status Pending/Implemented (b) | Contributions | Surcharge Imposed (c) | Expiration Date of Collective Bargaining Agreement (d) |
| | 2021 | 2020 | | 2021 | 2020 | 2019 | | |
| Steelworkers Pension Trust | 23-6648508/499 | Green | Green | No | $ | 88 | | $ | 14 | | $ | 4 | | No | 9/1/2022 to 09/1/2025 |
| IAM National Pension Fund’s National Pension Plan | 51-6031295/002 | Red | Red | Yes | 16 | | 16 | | — | | Yes | 5/31/2022 to 5/15/2023 |
Other Plans(e) | | | | | — | | — | | — | | | |
| Total | | | | | $ | 104 | | $ | 30 | | $ | 4 | | | |
| | | | | | | | | |
| (a) The most recent Pension Protection Act zone status available in 2021 and 2020 is for each plan's year-end at December 31, 2020 and 2019. The plan's actuary certifies the zone status. Generally, plans in the red zone are less than 65% funded, plans in the yellow zone are between 65% and 80% funded, and plans in the green zone are at least 80% funded. The IAM National Pension Fund's National Pension Plan voluntarily elected to place itself in the "Red Zone" in April 2019 and has implemented a rehabilitation plan to address its underfunded status. Additional contributions will be required as part of the rehabilitation plan until the plan exits the "Red Zone". |
| (b) The "FIP/RP Status Pending/Implemented" column indicates plans for which a financial improvement plan or a rehabilitation plan is either pending or has been implemented, as defined by ERISA. |
| (c) The surcharge represents an additional required contribution due as a result of the critical funding status of the plan. |
| (d) We are a party to five collective bargaining agreements that require contributions to the Steelworkers Pension Trust and three collective bargaining agreements that require contributions to the IAM National Pension Fund's National Pension Plan. |
| (e) Plans that are not individually significant to our Company are presented in aggregate. |
| | | | | | | | | | | | | | | | | | | | | | | | | | | | | |
| Pension Fund | EIN/Pension Plan Number | Pension Protection Act Zone Status1 | FIP/RP Status Pending/Implemented2 | Contributions
(in millions) | Surcharge Imposed3 | Expiration Date of Collective Bargaining Agreement4 |
| | 2023 | 2022 | | 2023 | 2022 | 2021 | | |
| Steelworkers Pension Trust | 23-6648508/499 | Green | Green | No | $ | 119 | | $ | 93 | | $ | 88 | | No | 4/1/2025 to 9/1/2026 |
| IAM National Pension Fund’s National Pension Plan | 51-6031295/002 | Red | Red | Yes | 23 | | 22 | | 16 | | Yes | 5/31/2025 to 5/15/2027 |
Other Plans5 | | | | | 1 | | — | | — | | | |
| Total | | | | | $ | 143 | | $ | 115 | | $ | 104 | | | |
| | | | | | | | | |
1 The most recent Pension Protection Act zone status available in 2023 and 2022 is for each plan's year-end at December 31, 2022 and 2021. The plan's actuary certifies the zone status. Generally, plans in the red zone are less than 65% funded, plans in the yellow zone are between 65% and 80% funded, and plans in the green zone are at least 80% funded. The IAM National Pension Fund's National Pension Plan voluntarily elected to place itself in the "Red Zone" in April 2019 and has implemented a rehabilitation plan to address its underfunded status. Additional contributions will be required as part of the rehabilitation plan until the plan exits the "Red Zone". |
2 The "FIP/RP Status Pending/Implemented" column indicates plans for which a financial improvement plan or a rehabilitation plan is either pending or has been implemented, as defined by ERISA. |
3 The surcharge represents an additional required contribution due as a result of the critical funding status of the plan. |
4 We are a party to six collective bargaining agreements that require contributions to the Steelworkers Pension Trust and three collective bargaining agreements that require contributions to the IAM National Pension Fund's National Pension Plan. |
5 Plans that are not individually significant to our Company are presented in aggregate. |
With the 2020 Acquisitions,ratification of the 2022 USW labor agreements, we increased our contribution rate to the Steelworkers Pension Trust by $0.50 to $4.00 per eligible hour. The increase was effective November 1, 2022.
We are one of the largest contributors to the Steelworkers Pension Trust. Our contributions exceeded 5% of total combined contributions in 20212023 and 2020.2022. As of January 1, 20212023 (the last date for which we have information), the Steelworkers Pension Trust had a total actuarial liability of $5,960$6,378 million and assets with a market value of $5,998$5,827 million, for a funded ratio of about 101%91%.
NOTE 1110 - STOCK COMPENSATION PLANS
At December 31, 2021,2023, we had outstanding awards under three share-based compensation plans: the 2021 Equity Plan, the A&R 2015 Equity Plan and the 2012 Amended Equity Plan. On April 28, 2021, the Company's shareholders approved the 2021 Equity Plan, which succeeded the A&R 2015 Equity Plan and made available 26.0 million new common shares plus 2.5 million shares remaining available under the A&R 2015 Equity Plan. As of December 31, 2021,2023, there were 28.023.0 million remaining shares available for grant under the 2021 Equity Plan. No additional grants were issued from the 2012 Amended Equity Plan or the A&R 2015 Equity Plan after the date of approval of the 2021 Equity Plan; however, all awards previously granted under the predecessor plans will continue in accordance with the terms of the outstanding awards.
On March 13, 2020, the maximum numberUpon vesting of share-based compensation awards, we issue shares that may be issued under the A&R 2015 Equity Plan increased by 5.7 million commonfrom treasury shares in relation to the outstanding AK Steel stock-based incentive awards that we converted at a 0.400 rate of exchange. The converted stock-based incentive awards include 2.0 million stock options, 1.0 million long-term performance plan awards, 0.5 million performance shares, 0.2 million restricted stock awards and 0.3 million restricted stock units.before issuing new shares. Forfeitures are recognized when they occur.
Stock-Based Compensation ExpenseSTOCK-BASED COMPENSATION EXPENSE
The following table summarizes the total compensation expense recognized for stock-based compensation awards:
| | (In Millions, except per
share amounts) |
| Year Ended December 31, |
| | 2021 | | 2020 | | 2019 |
| Year Ended December 31, | | | Year Ended December 31, |
| (In millions, except per share amounts) | | (In millions, except per share amounts) | 2023 | | 2022 | | 2021 |
| Cost of goods sold | Cost of goods sold | $ | (2) | | | $ | (2) | | | $ | (2) | |
| Selling, general and administrative expenses | Selling, general and administrative expenses | (16) | | | (13) | | | (16) | |
| Acquisition-related costs | — | | | (2) | | | — | |
| Stock based compensation expense | Stock based compensation expense | (18) | | | (17) | | | (18) | |
| Income tax benefit | Income tax benefit | 4 | | | 4 | | | 4 | |
| Stock based compensation expense, net of tax | Stock based compensation expense, net of tax | $ | (14) | | | $ | (13) | | | $ | (14) | |
| | Decrease in basic earnings per common share | Decrease in basic earnings per common share | $ | (0.03) | | | $ | (0.03) | | | $ | (0.05) | |
| Decrease in basic earnings per common share | |
| Decrease in basic earnings per common share | |
| Decrease in diluted earnings per common share | Decrease in diluted earnings per common share | $ | (0.03) | | | $ | (0.03) | | | $ | (0.05) | |
The total compensation cost related to outstanding awards not yet recognized is $24$53 million at December 31, 2021.2023. This expense is expected to be recognized over the remaining weighted-average period of 1.41.7 years.
PERFORMANCE SHARES
The following table summarizes the performance award activity:
| | | | | | | | | | | | | | | | | | | | | | | | | | | | | | | | | | | |
| Year Ended December 31, |
| 2021 | | 2020 | | 2019 |
| Number of Shares | | Weighted Average Grant Date Fair Value | | Number of Shares | | Weighted Average Grant Date Fair Value | | Number of Shares | | Weighted Average Grant Date Fair Value |
| Outstanding at beginning of year | 2,452,226 | | | $ | 10.34 | | | 1,935,878 | | | $ | 15.58 | | | 1,424,723 | | | $ | 14.46 | |
| Granted | 652,888 | | | 25.12 | | | 960,637 | | | 6.93 | | | 572,104 | | | 18.31 | |
| Granted - replacement awards | — | | | — | | | 1,550,216 | | | 4.59 | | | — | | | — | |
| Distributed | (1,279,509) | | | 11.74 | | | (1,938,786) | | | 12.23 | | | — | | | — | |
| Performance adjustment | 625,355 | | | 11.93 | | | 549,154 | | | 15.63 | | | — | | | — | |
| Forfeited/canceled | (80,490) | | | 11.27 | | | (604,873) | | | 5.70 | | | (60,949) | | | 15.12 | |
| Outstanding at end of year | 2,370,470 | | | $ | 14.04 | | | 2,452,226 | | | $ | 10.34 | | | 1,935,878 | | | $ | 15.58 | |
On March 13, 2020, we granted 1.0 million long-term performance plan awards and 0.5 million performance shares as AK Steel replacement awards. As of December 31, 2021, 0.2 million long-term performance plan awards and 0.1 million performance shares were outstanding as a result of qualifying termination events that triggered accelerated performance share payouts and prorated long-term performance plan awards payouts at target. The long-term performance plan awards are based on a three-year Adjusted EBITDA metric. | | | | | | | | | | | | | | | | | | | | | | | | | | | | | | | | | | | |
| 2023 | | 2022 | | 2021 |
| (Shares in millions) | Number of Shares | | Weighted Average Grant Date Fair Value | | Number of Shares | | Weighted Average Grant Date Fair Value | | Number of Shares | | Weighted Average Grant Date Fair Value |
| Outstanding at beginning of year | 2.7 | | | $ | 18.53 | | | 2.4 | | | $ | 14.04 | | | 2.5 | | | $ | 10.34 | |
| Granted | 1.1 | | | 31.88 | | | 1.0 | | | 28.46 | | | 0.7 | | | 25.12 | |
| Distributed | (1.8) | | | 6.50 | | | (1.1) | | | 17.04 | | | (1.3) | | | 11.74 | |
| Performance adjustment | 0.7 | | | 6.43 | | | 0.5 | | | 17.84 | | | 0.6 | | | 11.93 | |
| Forfeited/canceled | (0.2) | | | 28.65 | | | (0.1) | | | 23.74 | | | (0.1) | | | 11.27 | |
| Outstanding at end of year | 2.5 | | | $ | 29.09 | | | 2.7 | | | $ | 18.53 | | | 2.4 | | | $ | 14.04 | |
The outstanding performance shares vest over a period of three years and are intended to be paid out in common shares. Performance is measured on the basis of relative TSR for the period and measured against the constituents of the S&P Metals and Mining ETF Index. The number of shares actually earned at the end of the three-year period will vary, based on performance, from 0% to 200% of the number of performance shares granted.
historical and projected stock prices was developed for both the Company and its predetermined peer group of metals and mining companies. The fair value assumes that the performance objective will be achieved. The expected term of the grant represents the time from the grant date to the end of the service period. We estimate the volatility of our common shares and that of the peer group of metals and mining companies using daily price intervals for all companies. The risk-free interest rate is the rate at the grant date on zero-coupon government bonds, with a term commensurate with the remaining performance period. Restricted Stock UnitsRESTRICTED STOCK UNITS
The following table summarizes the restricted stock units activity:
| | | | | | | | | | | | | | | | | | | | | | | | | | | | | | | | | | | |
| Year Ended December 31, |
| 2021 | | 2020 | | 2019 |
| Number of Shares | | Weighted Average Grant Date Fair Value | | Number of Shares | | Weighted Average Grant Date Fair Value | | Number of Shares | | Weighted Average Grant Date Fair Value |
| Outstanding at beginning of year | 2,143,583 | | | $ | 7.12 | | | 2,147,183 | | | $ | 9.10 | | | 4,694,360 | | | $ | 4.18 | |
| Granted | 678,420 | | | 17.45 | | | 960,637 | | | 4.87 | | | 572,104 | | | 11.24 | |
| Granted - replacement awards | — | | | — | | | 200,291 | | | 4.87 | | | — | | | — | |
| Distributed | (642,992) | | | 7.31 | | | (1,101,115) | | | 8.58 | | | (3,058,307) | | | 1.95 | |
| Forfeited/canceled | (56,185) | | | 9.50 | | | (63,413) | | | 7.31 | | | (60,974) | | | 9.31 | |
| Outstanding at end of year | 2,122,826 | | | $ | 10.31 | | | 2,143,583 | | | $ | 7.12 | | | 2,147,183 | | | $ | 9.10 | |
On March 13, 2020, we granted 0.2 million restricted stock awards as AK Steel replacement awards. The restricted stock awards relating to AK Steel vest ratably on the first, second and third anniversaries of the grant. We valued the AK Steel replacement rewards at $4.87 per share using the closing price of our common shares on March 13, 2020, the grant date. | | | | | | | | | | | | | | | | | | | | | | | | | | | | | | | | | | | |
| 2023 | | 2022 | | 2021 |
| (Shares in millions) | Number of Shares | | Weighted Average Grant Date Fair Value | | Number of Shares | | Weighted Average Grant Date Fair Value | | Number of Shares | | Weighted Average Grant Date Fair Value |
| Outstanding at beginning of year | 2.4 | | | $ | 13.66 | | | 2.1 | | | $ | 10.31 | | | 2.1 | | | $ | 7.12 | |
| Granted | 1.2 | | | 19.30 | | | 1.0 | | | 19.41 | | | 0.7 | | | 17.45 | |
| Distributed | (0.9) | | | 5.99 | | | (0.6) | | | 10.47 | | | (0.6) | | | 7.31 | |
| Forfeited/canceled | (0.2) | | | 19.84 | | | (0.1) | | | 17.82 | | | (0.1) | | | 9.50 | |
| Outstanding at end of year | 2.5 | | | $ | 18.87 | | | 2.4 | | | $ | 13.66 | | | 2.1 | | | $ | 10.31 | |
We value our restricted stock units using the closing price of our common shares on the grant date. All of the outstanding restricted stock units are subject to continued employment, are retention based, and are payable in common shares or cash in certain circumstances at a time determined by the Compensation Committee at its discretion. Most restricted stock units that were granted in 2021, 2020 and 2019under three-year cliff vest over three years on December 31,vesting terms.
87 | CLF 2023 December 31, 2022 and December 31, 2021, respectively.FORM 10-K
Stock OptionsSTOCK OPTIONS
The following table summarizes the stock option activity:
| | Year Ended December 31, |
| 2021 | | 2020 | | 2019 |
| Number of Shares | | Weighted Average Exercise Price | | Number of Shares | | Weighted Average Exercise Price | | Number of Shares | | Weighted Average Exercise Price |
| 2023 | | | 2023 | | 2022 | | 2021 |
| (Shares in millions) | | (Shares in millions) | Number of Shares | | Weighted Average Exercise Price | | Number of Shares | | Weighted Average Exercise Price | | Number of Shares | | Weighted Average Exercise Price |
| Outstanding at beginning of year | Outstanding at beginning of year | 2,485,808 | | | $ | 11.60 | | | 563,230 | | | $ | 10.42 | | | 563,230 | | | $ | 10.42 | |
| Granted - replacement awards | — | | | — | | | 2,010,277 | | | 11.86 | | | — | | | — | |
| Exercised | Exercised | (1,457,495) | | | 10.36 | | | (79,973) | | | 7.01 | | | — | | | — | |
| Forfeited/canceled | Forfeited/canceled | (26,253) | | | 36.48 | | | (7,726) | | | 41.04 | | | — | | | — | |
| Outstanding at end of year | Outstanding at end of year | 1,002,060 | | | $ | 12.75 | | | 2,485,808 | | | $ | 11.60 | | | 563,230 | | | $ | 10.42 | |
| | Exercisable at end of year | Exercisable at end of year | 904,574 | | | $ | 13.35 | | | 2,172,052 | | | $ | 11.86 | | | 563,230 | | | $ | 10.42 | |
| Exercisable at end of year | |
| Exercisable at end of year | |
Stock options granted to date generally vest over a period from one to three years with an expiration date at ten years from the date of grant. On March 13, 2020, we granted 2.0 million options as AK Steel replacement awards. The weighted average fair value of the converted options was $0.51 per share and was calculated using the Black-Scholes option-pricing model. Qualifying termination events resulted in vest date accelerations and reductions to the option expiration date from ten years to three years.
The total intrinsic value of options exercised in 20212023 was $13$1 million and the amount in 20202022 was immaterial.$3 million. As of December 31, 2023, all outstanding options were exercisable. For options outstanding at December 31, 2021,2023, the weighted-average remaining contractual life was 3.02.1 years and the aggregate intrinsic value was $10$5 million. For
The fair value of stock options exercisable at December 31, 2021,is estimated on the weighted-average remaining contractual life was 2.6 yearsdate of grant using a Black-Scholes model using the grant date price of our common shares, the option exercise price, the option’s expected term, the volatility of our common shares, the risk-free interest rate and the aggregate intrinsic value was $8 million.dividend yield over the option’s expected term.
Nonemployee DirectorsNONEMPLOYEE DIRECTORS
Our nonemployee directors are entitled to receive restricted share awards under the Directors’ Plan. For 2021, 20202023, 2022 and 2019,2021, nonemployee directors were granted a specified number of restricted shares, with a value equal to $120,000, $100,000$140,000, $140,000 and $100,000,$120,000, respectively. The number of shares is based on the closing price of our common shares on the date of the Annual Meeting. The restricted share awards issued under the Directors' Plan generally vest 12 months from the grant date. The awards are subject to any deferral election and the terms of the Directors’ Plan and an award agreement.
On March 13, 2020, 0.3 million restricted stock units previously awarded to the members of the AK Steel board of directors were distributed per the terms of the AK Steel Merger Agreement.
For the last three years, grants of restricted and/or deferred shares have been awarded to elected or re-elected nonemployee directors as follows:
| | | | | | | | | | | | | | |
| Year of Grant | | Restricted Shares | | Deferred Shares |
| 2021 | | 58,851 | | | 13,078 | |
| 2020 | | 253,809 | | | 54,794 | |
| 2019 | | 86,477 | | | 23,659 | |
NOTE 1211 - INCOME TAXES
Income (loss) from continuing operations before income taxes includes the following components:
| | (In Millions) |
| 2021 | | 2020 | | 2019 |
| | Year Ended December 31, | | | | Year Ended December 31, |
| (In millions) | | (In millions) | | 2023 | | 2022 | | 2021 |
| United States | United States | | $ | 3,827 | | | $ | (201) | | | $ | 313 | |
| Foreign | Foreign | | (24) | | | 8 | | | — | |
| $ | 3,803 | | | $ | (193) | | | $ | 313 | |
| Total | |
The components of the income tax provision (benefit) onexpense from continuing operations consist of the following:
| | (In Millions) |
| 2021 | | 2020 | | 2019 |
| Current provision (benefit): | | | | | | |
| | Year Ended December 31, | | | | Year Ended December 31, |
| (In millions) | | (In millions) | | 2023 | | 2022 | | 2021 |
| Current provision: | |
| United States federal | |
| United States federal | |
| United States federal | United States federal | | $ | 14 | | | $ | (2) | | | $ | (1) | |
| United States state & local | United States state & local | | 55 | | | — | | | — | |
| Foreign | Foreign | | — | | | (1) | | | — | |
| 69 | | | (3) | | | (1) | |
| | 34 | |
| Deferred provision (benefit): | Deferred provision (benefit): | |
| United States federal | |
| United States federal | |
| United States federal | United States federal | | 683 | | | (95) | | | 19 | |
| United States state & local | United States state & local | | 31 | | | (11) | | | — | |
| Foreign | Foreign | | (10) | | | (2) | | | — | |
| Total income tax provision (benefit) from continuing operations | | $ | 773 | | | $ | (111) | | | $ | 18 | |
| Total income tax expense from continuing operations | |
12688 | CLF 2023 FORM 10-K
Reconciliation of our income tax attributable to continuing operations computed at the U.S. federal statutory rate is as follows:
| | (In Millions) |
| 2021 | | 2020 | | 2019 |
| (In millions) | | (In millions) | | 2023 | | 2022 | | 2021 |
| Tax at U.S. statutory rate | Tax at U.S. statutory rate | | $ | 799 | | | 21 | % | | $ | (41) | | | 21 | % | | $ | 66 | | | 21 | % | Tax at U.S. statutory rate | | $ | 125 | | | 21 | | 21 | % | | $ | 377 | | | 21 | | 21 | % | | $ | 799 | | | 21 | | 21 | % |
| Increase (decrease) due to: | Increase (decrease) due to: | |
| Percentage depletion in excess of cost depletion | Percentage depletion in excess of cost depletion | | (99) | | | (3) | | | (42) | | | 22 | | | (49) | | | (16) | |
| Non-taxable income related to noncontrolling interests | | (9) | | | — | | | (9) | | | 4 | | | — | | | — | |
| | Luxembourg legal entity reduction | | — | | | — | | | — | | | — | | | 846 | | | 271 | |
| Valuation allowance release: | |
| | Luxembourg legal entity reduction | | — | | | — | | | — | | | — | | | (846) | | | (271) | |
| State taxes, net | | 86 | | | 2 | | | (11) | | | 6 | | | — | | | — | |
| Percentage depletion in excess of cost depletion | |
| Percentage depletion in excess of cost depletion | |
| | Valuation allowance | |
| | | Valuation allowance | |
| | Valuation allowance | |
| Unrecognized tax benefits | |
| State taxes, net | |
| | Federal & state provision to return | |
| Federal & state provision to return | |
| Federal & state provision to return | |
| | Income not subject to tax | |
| Income not subject to tax | |
| Income not subject to tax | |
| Goodwill impairment | |
| Other items, net | Other items, net | | (4) | | | — | | | (8) | | | 4 | | | 1 | | | 1 | |
| Provision for income tax expense (benefit) and effective income tax rate including discrete items | | $ | 773 | | | 20 | % | | $ | (111) | | | 57 | % | | $ | 18 | | | 6 | % |
| Provision for income tax expense and effective income tax rate including discrete items | | Provision for income tax expense and effective income tax rate including discrete items | | $ | 148 | | | 25 | % | | $ | 423 | | | 23 | % | | $ | 773 | | | 20 | % |
The increasedecreases in income tax expense in 2023, as compared to 2022, as well as 2022 compared to 2021 from income tax benefit in 2020 is directly correlated to the increase in pre-tax book income from the prior period for both federal and state income tax purposes.
The increase in income tax benefit from 2019 to 2020 is directly correlatedare predominately related to the decrease in the pre-tax book income from the prior period for both federal and state income tax purposes. The Luxembourg legal entity reduction relates to initiatives resulting in the dissolution of certain entities and settlement of related financial instruments in 2019. The 2019 NOL deferred tax asset reduction resulted in tax expense of $846 million, which was fully offset by a decrease in the respective valuation allowance.year-over-year.
The components of income taxes for other than continuing operations consisted of the following:
| | | | | | | | | | | | | | | | | | | | |
| | (In Millions) |
| | 2021 | | 2020 | | 2019 |
| Other comprehensive income (loss): | | | | | | |
| Pension and OPEB | | $ | (206) | | | $ | (52) | | | $ | 11 | |
| Derivative financial instruments | | (21) | | | (1) | | | — | |
| Total | | $ | (227) | | | $ | (53) | | | $ | 11 | |
| | | | | | |
| | | | | | |
| | | | | | |
| | | | | | |
| | | | | | | | | | | | | | | | | | | | |
| (In millions) | | 2023 | | 2022 | | 2021 |
| Other comprehensive income (loss): | | | | | | |
| Pension and OPEB | | $ | 10 | | | $ | (425) | | | $ | (206) | |
| Derivative financial instruments | | 47 | | | 26 | | | (21) | |
| Total | | $ | 57 | | | $ | (399) | | | $ | (227) | |
| | | | | | |
| | | | | | |
| | | | | | |
| | | | | | |
Significant components of our deferred tax assets and liabilities are as follows:
| | (In Millions) |
| 2021 | | 2020 |
| (In millions) | | (In millions) | 2023 | | 2022 |
| Deferred tax assets: | Deferred tax assets: | | | |
| Operating loss and other carryforwards | |
| Operating loss and other carryforwards | |
| Operating loss and other carryforwards | Operating loss and other carryforwards | $ | 379 | | | $ | 1,236 | |
| Pension and OPEB liabilities | Pension and OPEB liabilities | 584 | | | 228 | |
| | Environmental | |
| | Environmental | |
| | Environmental | |
| | Product inventories | |
| Product inventories | |
| Product inventories | |
| | State and local | State and local | 109 | | | 132 | |
| | State and local | |
| State and local | |
| Lease liabilities | |
| Other liabilities | Other liabilities | 287 | | | 190 | |
| Total deferred tax assets before valuation allowance | Total deferred tax assets before valuation allowance | 1,359 | | | 1,786 | |
| Deferred tax asset valuation allowance | Deferred tax asset valuation allowance | (409) | | | (836) | |
| Net deferred tax assets | Net deferred tax assets | 950 | | | 950 | |
| Deferred tax liabilities: | Deferred tax liabilities: | |
| Investment in partnerships | (191) | | | (144) | |
| Investment in ventures | |
| Investment in ventures | |
| Investment in ventures | |
| | Lease assets | |
| Lease assets | |
| Lease assets | |
| Property, plant and equipment and mineral rights | Property, plant and equipment and mineral rights | (641) | | | (246) | |
| Other assets | Other assets | (216) | | | (68) | |
| Total deferred tax liabilities | Total deferred tax liabilities | (1,048) | | | (458) | |
| Net deferred tax assets (liabilities) | Net deferred tax assets (liabilities) | $ | (98) | | | $ | 492 | |
We had gross domestic (including states) and foreign NOLs of $2,081$1,704 million and $1,407$1,452 million, respectively, at December 31, 2021.2023. We had gross domestic (including states) and foreign NOLs of $7,444$2,278 million and $1,592$1,444 million, respectively, at December 31, 2020.2022. The U.S. federal NOLs will begin to expire in 2034 and state NOLs will begin to expire in 2022.2024. The foreign NOLs can be carried forward indefinitely. Webegin to expire in 2035. For the year ended December 31, 2023, we had no gross interest expense limitation carryforwards of $18 million and $80 million forcarryforwards. For the yearsyear ended December 31, 2021 and 2020, respectively. This2022, we had $77 million gross interest expense can be carried forward indefinitely.limitation carryforwards.
The changes in the valuation allowance are presented below:
| | (In Millions) |
| 2021 | | 2020 | | 2019 |
| (In millions) | | (In millions) | 2023 | | 2022 | | 2021 |
| Balance at beginning of year | Balance at beginning of year | $ | 836 | | | $ | 441 | | | $ | 1,287 | |
| Change in valuation allowance: | Change in valuation allowance: | |
| Included in income tax benefit | (82) | | | (3) | | | (846) | |
| Included in income tax expense | |
| Included in income tax expense | |
| Included in income tax expense | |
| | Increase (decrease) from acquisitions | (345) | | | 398 | | | — | |
| Decrease from acquisitions | |
| Decrease from acquisitions | |
| Decrease from acquisitions | |
| Balance at end of year | Balance at end of year | $ | 409 | | | $ | 836 | | | $ | 441 | |
At December 31, 2023 and 2022, we have a valuation allowance recorded of $356 million and $342 million, respectively, related to foreign deferred tax assets, and an additional $40 million and $48 million, respectively, against certain state NOLs, which are expected to expire before utilization.
During 2023, we recorded a $14 million valuation allowance against a portion of our Canadian deferred tax assets due to losses in recent years. We intend to maintain a valuation allowance against these deferred tax assets, unless and until sufficient positive evidence exists to support the realization of such assets.
During 2021, we recorded a decrease to the valuation allowance of $345 million related to the election filed with our 2020 federal tax return to waive the pre-acquisition NOLs that are limited under Section 382 of the IRC. An offsetting decrease iswas recorded in the NOL deferred tax asset in the same period. These amounts relate to a portion of the $398 million valuation allowance recorded during 2020 through opening balance sheet adjustments to reflect the portion of federal and state NOLs that are limited under Section 382 of the IRC acquired through the AK Steel Merger.
During 2019, a legal entity reduction initiative was completed in Luxembourg resulting in the dissolution of certain entities and settlement of related financial instruments, triggering the utilization of $1.3 billion of NOL deferred tax asset and reversal of the intercompany notes deferred tax liability of $447 million. The total net deferred tax reduction resulted in an expense of $846 million, which was fully offset by a decrease in the valuation allowance. Our losses in Luxembourg in recent periods represent sufficient negative evidence to require a full valuation allowance against the remaining deferred tax assets in that jurisdiction. We intend to maintain a valuation allowance against the deferred tax assets related to these operating losses, unless and until sufficient positive evidence exists to support the realization of such assets.
We also have a valuation allowance recorded against certain state NOLs, which are expected to expire before utilization. At December 31, 20212023 and 2020, we had a valuation allowance recorded against certain state NOLs of $70 million and $98 million, respectively.
At December 31, 2021 and 2020,2022, we had no cumulative undistributed earnings of foreign subsidiaries included in retained earnings. Accordingly, no provision has been made for U.S. deferred taxes related to future repatriation of earnings.
A reconciliation of the beginning and ending amount of unrecognized tax benefits is as follows:
| | (In Millions) |
| 2021 | | 2020 | | 2019 |
| (In millions) | | (In millions) | 2023 | | 2022 | | 2021 |
| Unrecognized tax benefits balance as of January 1 | Unrecognized tax benefits balance as of January 1 | | $ | 107 | | | $ | 29 | | | $ | 29 | |
| | Increase for tax positions in current year | | 4 | | | 7 | | | — | |
| Increases for tax positions in current year | |
| Increases for tax positions in current year | |
| Increases for tax positions in current year | |
| | Decrease for tax positions of prior year | | (66) | | | (4) | | | — | |
| Decrease due to tax positions in prior year | |
| Decrease due to tax positions in prior year | |
| Decrease due to tax positions in prior year | |
| Lapses in statutes of limitations | Lapses in statutes of limitations | | (10) | | | — | | | — | |
| Increases from acquisitions | | — | | | 75 | | | — | |
| | Unrecognized tax benefits balance as of December 31 | Unrecognized tax benefits balance as of December 31 | | $ | 35 | | | $ | 107 | | | $ | 29 | |
| Unrecognized tax benefits balance as of December 31 | |
| Unrecognized tax benefits balance as of December 31 | |
At December 31, 20212023 and 2020,2022, we had $35 million and $107 million, respectively, of unrecognized tax benefits recorded. Of this amount, $1 million was recorded in Other current liabilities for the year ended December 31, 2021. Additionally, $34of $76 million and $2$58 million, were recordedrespectively, included in Other non-current liabilities foron the years ended December 31, 2021 and 2020, respectively. An additional $96 million was recorded in Other non-current assets for the year ended December 31, 2020.Statements of Consolidated Financial Position. If the unrecognized tax benefits were recognized, $30the full $76 million would impact the effective tax rate. Interest and penalties related to unrecognized tax benefits are $8 million for the year ended December 31, 2023. We do not expect that the amount of unrecognized benefits will change significantly within the next 12 months.
Tax years 2016 and forward remain subject to examination for the U.S., and tax years 20082018 and forward remain subject to examination for Canada.
NOTE 1312 - LEASE OBLIGATIONS
Our operating leases consist primarily of leases for land, office space, iron ore vessels, rail cars and processing equipment.storage tanks. Our finance leases consist primarily of processingmining equipment and mining equipment. Werail cars. When an implicit discount rate is not readily determinable under our leases, we use our incremental borrowing rate as the discount rate to determine the present value of the lease payments, as our leases do not have readily determinable implicit discount rates.payments. Our incremental borrowing rate is the rate of interest that we would have to borrow on a collateralized basis over a similar term and amount in a similar economic environment to pay our lease obligations. We determine the incremental borrowing rates for our leases by adjusting the local risk-free interest rate with a credit risk premium corresponding to our credit rating. From time to time, we may enter into arrangements for the construction or purchase of an asset and then enter into a financing arrangement to lease the asset. We recognize leased assets and liabilities under these arrangements when we obtain control of the asset.
Lease costs are presented below:
| | (In Millions) |
| Year Ended December 31, |
| 2021 | | 2020 |
| Year Ended December 31, | |
| Year Ended December 31, | |
| Year Ended December 31, | |
| (In millions) | |
| Operating leases | |
| Operating leases | |
| Operating leases | Operating leases | $ | 70 | | | $ | 43 | |
| Finance leases: | Finance leases: | |
| Amortization of lease cost | 94 | | | 15 | |
| Finance leases: | |
| Finance leases: | |
| Amortization of right-of-use assets | |
| Amortization of right-of-use assets | |
| Amortization of right-of-use assets | |
| Interest on lease liabilities | Interest on lease liabilities | 9 | | | 4 | |
| Interest on lease liabilities | |
| Interest on lease liabilities | |
| Short-term leases | |
| Short-term leases | |
| Short-term leases | Short-term leases | 66 | | | 13 | |
| | Total | Total | $ | 239 | | | $ | 75 | |
| | Total | |
| | Total | |
Lease terms and discount rates are shown below:
| | | | | |
| December 31, |
| (In millions) | 2023 |
| Weighted average lease term (in years): | |
| Operating leases | 8 |
| Finance leases | 7 |
| Weighted average discount rate: | |
| Operating leases | 8 | % |
| Finance leases | 6 | % |
Other information related to leases was as follows:
| | | | | | | | | | | |
| (In Millions) |
| Year Ended December 31, |
| 2021 | | 2020 |
| Cash paid for amounts included in measurement of lease liabilities: | | | |
| Operating leases within cash flows from operating activities | $ | 70 | | | $ | 43 | |
| Finance leases within cash flows from operating activities | $ | 9 | | | $ | 4 | |
| Finance leases within cash flows from financing activities | $ | 94 | | | $ | 15 | |
Right-of-use assets obtained in exchange for new finance lease liabilities1 | $ | 50 | | | $ | 44 | |
| Weighted-average remaining lease term - operating leases (in years) | 8 | | 8 |
| Weighted-average remaining lease term - finance leases (in years) | 5 | | 5 |
| Weighted-average discount rate - operating leases | 7 | % | | 8 | % |
| Weighted-average discount rate - finance leases | 4 | % | | 4 | % |
| | | |
1 Right-of-use assets obtained in acquisitions are not included in this figure. |
| | | | | | | | | | | | | | | | | |
| Year Ended December 31, |
| (In millions) | 2023 | | 2022 | | 2021 |
| Cash paid for amounts included in measurement of lease liabilities: | | | | | |
| Operating leases within cash flows from operating activities | $ | 57 | | $ | 62 | | $ | 70 |
| Finance leases within cash flows from operating activities | 11 | | 8 | | 9 |
| Finance leases within cash flows from financing activities | 92 | | 96 | | 94 |
| Right-of-use assets obtained in exchange for new finance lease liabilities | 93 | | 55 | | 50 |
Future minimum lease payments under noncancellable finance and operating leases as of December 31, 20212023 were as follows:
| | (In Millions) |
| Finance Leases | | Operating Leases |
| 2022 | $ | 105 | | | $ | 68 | |
| 2023 | 96 | | | 56 | |
| (In millions) | | (In millions) | Finance Leases | | Operating Leases |
| 2024 | 2024 | 31 | | | 47 | |
| 2025 | 2025 | 28 | | | 39 | |
| 2026 | 2026 | 19 | | | 35 | |
| 2027 | |
| 2028 | |
| Thereafter | Thereafter | 66 | | | 133 | |
| Total future minimum lease payments | Total future minimum lease payments | 345 | | | 378 | |
| Less: imputed interest | Less: imputed interest | 54 | | | 108 | |
| Total lease payments | Total lease payments | 291 | | | 270 | |
| Less: current portion of lease liabilities | Less: current portion of lease liabilities | 97 | | | 50 | |
| Long-term lease liabilities | Long-term lease liabilities | $ | 194 | | | $ | 220 | |
The current and long-term portions of our finance and operating lease liabilities are included in Other current liabilities and Other non-current liabilities, respectively.
NOTE 1413 - ASSET RETIREMENT OBLIGATIONS
The following is a summary of our asset retirement obligations:
| | | | | | | | | | | |
| (In Millions) |
| December 31, |
| 2021 | | 2020 |
Asset retirement obligations1 | $ | 449 | | | $ | 342 | |
| Less: current portion | 35 | | | 7 | |
| Long-term asset retirement obligations | $ | 414 | | | $ | 335 | |
| | | |
1 Includes $293 million and $190 million related to our active operations as of December 31, 2021 and 2020, respectively. |
The accrued closure obligation provides for contractual and legal obligations related to our indefinitely idled and closed operations and for the eventual closure of our active operations. We performed a detailed assessment of our asset retirement obligations related to our active operations most recently in 2020 in accordance with our accounting policy, which requires us to perform an in-depth evaluation of the liability every three years in addition to
routine annual assessments. In 2020, we employed third-party specialists to assist in the evaluation.
The closure date for each of our active mine sites was determined based on the exhaustion date of the remaining mineral reserves, and the amortization of the related asset and accretion of the liability is recognized over the estimated mine lives. The closure date and expected timing of the capital requirements to meet our obligations for our indefinitely idled or closed mines is determined based on the unique circumstances of each property. For indefinitely idled or closed mines, the accretion of the liability is recognized over the anticipated timing of remediation. As the majority of our assetAsset retirement obligations at our steelmaking operations have indeterminate settlement dates, assetprimarily include the closure and post-closure care for on-site landfills and other waste containment facilities. Asset retirement obligations have been recorded at present values using estimated rangessettlement dates based on when we expect these facilities to reach capacity and close.
We performed a detailed assessment of our asset retirement obligations related to our active mining operations most recently in 2023 in accordance with our accounting policy, which requires us to perform an in-depth evaluation of the economic livesliability every three years in addition to routine annual assessments. In 2023, we employed third-party specialists to assist in the evaluation.
The following is a summary of the underlying assets.our asset retirement obligations:
| | | | | | | | | | | |
| December 31, |
| (In millions) | 2023 | | 2022 |
Asset retirement obligations1 | $ | 459 | | | $ | 520 | |
| Less: current portion | 15 | | | 21 | |
| Long-term asset retirement obligations | $ | 444 | | | $ | 499 | |
| | | |
1 Includes $259 million and $277 million related to our active operations as of December 31, 2023 and 2022, respectively. |
The following is a roll-forward of our asset retirement obligation liability:obligation:
| | (In millions) | |
| (In millions) | |
| (In millions) | |
| Asset retirement obligation as of January 1 | |
| Asset retirement obligation as of January 1 | |
| Asset retirement obligation as of January 1 | |
| | (In Millions) | |
| Decrease from sale of business | |
| | 2021 | | 2020 | |
| Asset retirement obligation as of January 1 | $ | 342 | | | $ | 165 | | |
| Increase from acquisitions | 116 | | | 172 | | |
| Decrease from sale of business | |
| | Decrease from sale of business | |
| Reclassification from environmental obligations | |
| Reclassification from environmental obligations | |
| Reclassification from environmental obligations | |
| Accretion expense | |
| Accretion expense | |
| Accretion expense | Accretion expense | 18 | | | 14 | | |
| Remediation payments | Remediation payments | (29) | | | (9) | | |
| Remediation payments | |
| Remediation payments | |
| Revision in estimated cash flows | |
| Revision in estimated cash flows | |
| Revision in estimated cash flows | Revision in estimated cash flows | 2 | | | — | | |
| Asset retirement obligation as of December 31 | Asset retirement obligation as of December 31 | $ | 449 | | | $ | 342 | | |
| Asset retirement obligation as of December 31 | |
| Asset retirement obligation as of December 31 | |
During 2023, we entered into a membership interest purchase agreement for the sale of the legal entities owning, among other things, our closed coal mines in Pennsylvania, resulting in a decrease to our asset retirement obligation.
NOTE 14 - FAIR VALUE OF FINANCIAL INSTRUMENTS
The carrying values of certain financial instruments (e.g. Accounts receivable, net, Accounts payable and Other current liabilities) approximate fair value and, therefore, have been excluded from the table below. See NOTE 15 - DERIVATIVE INSTRUMENTS AND HEDGING for information on our derivative instruments, which are accounted for at fair value on a recurring basis.
A summary of the carrying value and fair value of other financial instruments were as follows:
| | | | | | | | | | | | | | | | | | | | | | | | | | | | | |
| | | December 31, 2023 | | December 31, 2022 |
| (In millions) | Classification | | Carrying
Value | | Fair Value | | Carrying
Value | | Fair Value |
| Senior notes | Level 1 | | $ | 3,137 | | | $ | 3,118 | | | $ | 2,385 | | | $ | 2,311 | |
| ABL Facility - outstanding balance | Level 2 | | — | | | — | | | 1,864 | | | 1,864 | |
| Total | | | $ | 3,137 | | | $ | 3,118 | | | $ | 4,249 | | | $ | 4,175 | |
The increase from acquisitionsvaluation of financial assets classified in Level 2 was determined using a market approach based upon quoted prices for the year ended December 31, 2021 relates to measurement period adjustments as a result of the final purchase price allocation of the AM USA Transaction.similar assets in active markets or other inputs that were observable.
NOTE 15 - DERIVATIVE INSTRUMENTS AND HEDGING
We are exposed to fluctuations in market prices of raw materials and energy sources. We may use cash-settled commodity swaps to hedge the market risk associated with the purchase of certain of our raw materials and energy requirements. Our hedging strategy is to reduce the effect on earnings from the price volatility of these various commodity exposures, including timing differences between when we incur raw material commodity costs and when we receive sales surcharges from our customers
based on those raw materials. Independent of any hedging activities, price changes in any of these commodity markets could negatively affect operating costs.
Our commodity contracts are designated as cash flow hedges for accounting purposes, and we record the gains and losses for the derivatives in Accumulated other comprehensive income until we reclassify them into Cost of goods sold when we recognize the associated underlying operating costs. Refer to NOTE 17 - ACCUMULATED OTHER COMPREHENSIVE INCOME (LOSS) for further information.
Our commodity contracts are classified as Level 2 as values were determined using a market approach based upon quoted prices for similar assets in active markets or other inputs that were observable.
The following table presents the notional amount of our outstanding hedge contracts:
| | | | | | | | | | | | | | | | | | | | | | | | | | |
| | | | | | Notional Amount |
| | | | | | December 31, |
| Commodity Contracts | | Unit of Measure | | Maturity Dates | | 2023 | | 2022 |
| Natural Gas | | MMBtu | | January 2024 - August 2026 | | 168,590,000 | | 127,790,000 |
| | | | | | | | |
| Electricity | | Megawatt hours | | January 2024 - October 2026 | | 3,501,898 | | 432,043 |
| | | | | | | | |
At December 31, 2023, we expect to reclassify $155 million of net losses related to our hedge contracts from Accumulated other comprehensive income into Cost of goods sold during the next 12 months.
The following table presents the fair value of our cash flow hedges and the classification on the Statements of Consolidated Financial Position:
| | | | | | | | | | | | | | |
| | December 31, |
| Balance Sheet Location (In millions) | | 2023 | | 2022 |
| Other current assets | | $ | — | | | $ | 15 | |
| Other non-current assets | | 1 | | | 30 | |
| Other current liabilities | | (105) | | | (87) | |
| Other non-current liabilities | | (52) | | | (10) | |
NOTE 16 - CAPITAL STOCK
Underwritten Public OfferingSHARE REPURCHASE PROGRAM
On February 10, 2022, our Board of Directors authorized a program to repurchase outstanding common shares in the open market or in privately negotiated transactions, which may include purchases pursuant to Rule 10b5-1 plans or accelerated share repurchases, up to a maximum of $1 billion. We are not obligated to make any purchases and the program may be suspended or discontinued at any time. The share repurchase program does not have a specific expiration date. For the years ended December 31, 2023 and 2022, we repurchased 10.4 million and 12.5 million common shares, respectively, at a cost of $152 million and $240 million in the aggregate, respectively. The cost of our share repurchases excludes the excise tax due under the Inflation Reduction Act. As of December 31, 2023, there was $608 million remaining under the authorization.
1.500% 2025 CONVERTIBLE SENIOR NOTES REDEMPTION
On December 1, 2021, we issued a notice of redemption for all $294 million in aggregate principal amount outstanding of our 1.500% 2025 Convertible Senior Notes. Our 1.500% 2025 Convertible Senior Notes were redeemed on January 18, 2022, through a combination settlement, with the aggregate principal amount of $294 million paid in cash, and 24 million common shares, with a fair value of $499 million, delivered to noteholders in settlement of the premium due per the terms of the indenture, plus cash in respect of the accrued and unpaid interest on the 1.500% 2025 Convertible Senior Notes to, but not including, the redemption date per the terms of the indenture.
UNDERWRITTEN PUBLIC OFFERING
On February 11, 2021, we sold 20 million of our common shares and 40 million common shares were sold by an affiliate of ArcelorMittal in an underwritten public offering. In each case, shares were sold at a price per share of $16.12. Prior to this sale, ArcelorMittal held approximately 78 million of our common shares, which were issued as a part of the consideration in connection with the AM USA Transaction. We did not receive any proceeds from the sale of the 40 million common shares sold on behalf of ArcelorMittal. We used the net proceeds from the offering, plus cash on hand, to redeem $322 million aggregate principal amount of our outstanding 9.875% 2025 Senior Secured Notes.
Acquisition of AK Steel
As more fully described in NOTE 3 - ACQUISITIONS, we acquired AK Steel on March 13, 2020. At the effective time of the AK Steel Merger, each share of AK Steel common stock issued and outstanding prior to the effective time of the AK Steel Merger was converted into, and became exchangeable for, 0.400 Cliffs common shares, par value $0.125 per share. We issued a total of 127 million common shares in connection with the AK Steel Merger at a fair value of $618 million. Following the closing of the AK Steel Merger, AK Steel's common stock was de-listed from the NYSE.
Acquisition of ArcelorMittal USA
As more fully described in NOTE 3 - ACQUISITIONS, we acquired ArcelorMittal USA on December 9, 2020. Pursuant to the terms of the AM USA Transaction Agreement, we issued 78,186,671 common shares and 583,273 shares of a new series of our Serial Preferred Stock, ClassSERIES B without par value, designated as the “Series B Participating Redeemable Preferred Stock,” in each case to an indirect, wholly owned subsidiary of ArcelorMittal as part of the consideration paid by us in connection with the closing of the AM USA Transaction.
Series B Participating Redeemable Preferred Stock RedemptionPARTICIPATING REDEEMABLE PREFERRED STOCK REDEMPTION
We had 583,273 shares of our Series B Participating Redeemable Preferred Stock issued and outstanding as of December 31, 2020. During the third quarter of 2021, we redeemed all 583,273 shares of our Series B Participating Redeemable Preferred Stock at a redemption price of $1.3 billion using borrowings under our ABL Facility.
13193 | CLF 2023 FORM 10-K
Amendment to Articles of IncorporationAMENDMENT TO ARTICLES OF INCORPORATION
On April 29, 2021, we filed a Certificate of Amendment to our Fourth Amended Articles of Incorporation, as amended, to increase the total number of authorized common shares from 600,000,000 to 1,200,000,000.
Preferred StockPREFERRED STOCK
We have 3,000,000 shares of Serial Preferred Stock, Class A, without par value, authorized, of which, none are issued or outstanding as of December 31, 2021. We also haveand 4,000,000 shares of Serial Preferred Stock, Class B, without par value, authorized, of which, none areauthorized; no preferred shares were issued or outstanding as of December 31, 2021.
Dividends
The below table summarizes our recent dividend activity:
| | | | | | | | | | | | | | | | | | | | |
Declaration Date | | Record Date | | Payment Date | | Dividend Declared per Common Share |
2/18/2020 | | 4/3/2020 | | 4/15/2020 | | $ | 0.06 | |
12/2/2019 | | 1/3/2020 | | 1/15/2020 | | 0.06 | |
Subsequent to the dividend paid on April 15, 2020, our Board suspended future dividends.
Share Repurchase Program
In 2018, our Board of Directors authorized a program to repurchase outstanding common shares in the open market or in privately negotiated transactions. The share repurchase program was effective until December 31, 2019. During 2019, we repurchased 24 million common shares at a cost of $253 million in the aggregate, including commissions and fees.2023.
NOTE 1617 - ACCUMULATED OTHER COMPREHENSIVE INCOME (LOSS)
The components of Accumulated other comprehensive income (loss) within Cliffs shareholders’ equity and related tax effects allocated to each are shown below:
| | | | | | | | | | | | | | | | | |
| (In Millions) |
| Pre-tax
Amount | | Tax Benefit
(Expense) | | After-tax
Amount |
| As of December 31, 2021: | | | | | |
| Pension and OPEB | $ | 669 | | | $ | (120) | | | $ | 549 | |
| Foreign currency translation adjustments | 1 | | | — | | | 1 | |
| Derivative financial instruments | 89 | | | (21) | | | 68 | |
| $ | 759 | | | $ | (141) | | | $ | 618 | |
| As of December 31, 2020: | | | | | |
| Pension and OPEB | $ | (221) | | | $ | 86 | | | $ | (135) | |
| Foreign currency translation adjustments | 3 | | | — | | | 3 | |
| Derivative financial instruments | (1) | | | — | | | (1) | |
| $ | (219) | | | $ | 86 | | | $ | (133) | |
| As of December 31, 2019: | | | | | |
| Pension and OPEB | $ | (454) | | | $ | 138 | | | $ | (316) | |
| Derivative financial instruments | (4) | | | 1 | | | (3) | |
| $ | (458) | | | $ | 139 | | | $ | (319) | |
The following table reflects the changes in Accumulated other comprehensive income (loss) related to Cliffs shareholders’ equity:
| | | | | | | | | | | | | | | | | | | | | | | |
| (In Millions) |
| Postretirement Benefit Liability,
net of tax | | Foreign Currency Translation | | Derivative Financial Instruments,
net of tax | | Accumulated Other Comprehensive Income (Loss) |
| December 31, 2018 | $ | (281) | | | $ | — | | | $ | (3) | | | $ | (284) | |
| Other comprehensive loss before reclassifications | (57) | | | — | | | (2) | | | (59) | |
| Net loss reclassified from AOCI | 22 | | | — | | | 2 | | | 24 | |
| December 31, 2019 | (316) | | | — | | | (3) | | | (319) | |
| Other comprehensive income (loss) before reclassifications | 163 | | | 3 | | | (6) | | | 160 | |
| Net loss reclassified from AOCI | 18 | | | — | | | 8 | | | 26 | |
| December 31, 2020 | (135) | | | 3 | | | (1) | | | (133) | |
| Other comprehensive income (loss) before reclassifications | 675 | | | (2) | | | 117 | | | 790 | |
| Net loss (gain) reclassified from AOCI | 9 | | | — | | | (48) | | | (39) | |
| December 31, 2021 | $ | 549 | | | $ | 1 | | | $ | 68 | | | $ | 618 | |
The following table reflects the details about Accumulated other comprehensive income (loss) components reclassified from Cliffs shareholders’ equity:
| | | | | | | | | | | | | | | | | | | | | | | | | | |
| | (In Millions) | | |
| Details about Accumulated Other Comprehensive Income (Loss) Components | | Amount of (Gain)/Loss
Reclassified into Income,
Net of Tax | | Affected Line Item in the Statement of Consolidated Operations |
| Year Ended December 31, | |
| 2021 | | 2020 | | 2019 | |
| Changes in pension and OPEB: | | | | | | | | |
Prior service costs1 | | $ | (1) | | | $ | (1) | | | $ | (1) | | | Net periodic benefit credits (costs) other than service cost component |
Net actuarial loss1 | | 35 | | | 30 | | | 29 | | | Net periodic benefit credits (costs) other than service cost component |
Settlements1 | | (22) | | | (6) | | | — | | | Net periodic benefit credits (costs) other than service cost component |
| Total before taxes | | 12 | | | 23 | | | 28 | | | |
| Income tax benefit | | (3) | | | (5) | | | (6) | | | Income tax benefit (expense) |
| Net of taxes | | $ | 9 | | | $ | 18 | | | $ | 22 | | | |
| | | | | | | | |
| | | | | | | | |
| | | | | | | | |
| | | | | | | | |
| Changes in derivative financial instruments: | | | | | | | | |
| Commodity contracts | | $ | (61) | | | $ | 10 | | | $ | 3 | | | Cost of goods sold |
| Income tax expense (benefit) | | 13 | | | (2) | | | (1) | | | Income tax benefit (expense) |
| Net of taxes | | $ | (48) | | | $ | 8 | | | $ | 2 | | | |
| | | | | | | | |
| Total reclassifications for the period, net of tax | | $ | (39) | | | $ | 26 | | | $ | 24 | | | |
| | | | | | | | |
1 See NOTE 10 - PENSIONS AND OTHER POSTRETIREMENT BENEFITS for further information. |
NOTE 17 - RELATED PARTIES
We have certain co-owned joint ventures with companies from the steel and mining industries, including integrated steel companies, their subsidiaries and other downstream users of steel and iron ore products.
Hibbing is a co-owned joint venture with U.S. Steel, in which, as of both December 31, 2020 and December 31, 2021, we own 85.3% and U.S. Steel owns 14.7%. As a result of the AM USA Transaction, we acquired an additional 62.3% ownership stake in the Hibbing mine and became the majority owner and mine manager. Prior to the AM USA Transaction, ArcelorMittal was a related party due to its ownership interest in Hibbing. As such, certain long-term contracts with ArcelorMittal resulted in Revenues from related parties, and are included within the below.
Revenues from related parties were as follows:
| | | | | | | | | | | | | | | | | |
| (In Millions) |
| Year Ended December 31, |
| 2021 | | 2020 | | 2019 |
| Revenue from related parties | $ | 139 | | | $ | 893 | | | $ | 1,015 | |
| Revenues | $ | 20,444 | | | $ | 5,354 | | | $ | 1,990 | |
| Related party revenues as a percent of Revenues | 0.7 | % | | 16.7 | % | | 51.0 | % |
| Purchases from related parties | $ | 94 | | | $ | 16 | | | $ | — | |
The following table presents the classification of related party assets and liabilities in the Statements of Consolidated Financial Position:
| | | | | | | | | | | | | | |
| | (In Millions) |
| | December 31, |
| Balance Sheet Location of Assets (Liabilities) | | 2021 | | 2020 |
| Accounts receivable, net | | $ | 3 | | | $ | 2 | |
| | | | |
| Accounts payable | | (7) | | | (6) | |
| | | | |
| | | | | | | | | | | | | | | | | |
| December 31, |
| (In millions) | 2023 | | 2022 | | 2021 |
| Foreign Currency Translation | | | | | |
| Beginning balance | $ | (1) | | | $ | 1 | | | $ | 3 | |
| Other comprehensive income (loss) before reclassifications | 1 | | | (2) | | | (2) | |
| Ending balance | $ | — | | | $ | (1) | | | $ | 1 | |
| | | | | |
| Derivative Instruments | | | | | |
| Beginning balance | $ | (16) | | | $ | 68 | | | $ | (1) | |
| Other comprehensive income (loss) before reclassifications | (345) | | | 146 | | | 151 | |
| Income tax | 81 | | | (33) | | | (34) | |
| Other comprehensive income (loss) before reclassifications, net of tax | (264) | | | 113 | | | 117 | |
Losses (gains) reclassified from AOCI to net income1 | 144 | | | (256) | | | (61) | |
Income tax expense (benefit)2 | (34) | | | 59 | | | 13 | |
| Net losses (gains) reclassified from AOCI to net income | 110 | | | (197) | | | (48) | |
| Ending balance | $ | (170) | | | $ | (16) | | | $ | 68 | |
| | | | | |
| Pension and OPEB | | | | | |
| Beginning balance | $ | 1,847 | | | $ | 549 | | | $ | (135) | |
Other comprehensive income before reclassifications4 | 115 | | | 1,759 | | | 878 | |
| Income tax | (39) | | | (434) | | | (203) | |
| Other comprehensive income before reclassifications, net of tax | 76 | | | 1,325 | | | 675 | |
Losses (gains) reclassified from AOCI to net income3 | (145) | | | (36) | | | 12 | |
Income tax expense (benefit)2 | 49 | | | 9 | | | (3) | |
| Net losses (gains) reclassified from AOCI to net income | (96) | | | (27) | | | 9 | |
| Ending balance | $ | 1,827 | | | $ | 1,847 | | | $ | 549 | |
| | | | | |
| Total AOCI Ending Balance | $ | 1,657 | | | $ | 1,830 | | | $ | 618 | |
|
1 Amounts recognized in Cost of goods sold in the Statements of Consolidated Operations. |
2 Amounts recognized in Income tax expense in the Statements of Consolidated Operations. |
3 Amounts recognized in Net periodic benefit credits other than service cost component in the Statements of Consolidated Operations. |
4 Refer to NOTE 9 - PENSIONS AND OTHER POSTRETIREMENT BENEFITS for further information. |
NOTE 18 - VARIABLE INTEREST ENTITIES
SunCoke MiddletownSUNCOKE MIDDLETOWN
We purchase all the coke and electrical power generated from SunCoke Middletown’s plant under long-term supply agreements and have committed to purchase all the expected production from the facility through 2032. We consolidate SunCoke Middletown as a VIE because we are the primary beneficiary despite having no ownership interest in SunCoke Middletown. SunCoke Middletown had income before income taxes of $52 million and $41$47 million for the years ended December 31, 20212023 and 2020,2022, respectively, which was included in our consolidated Income (loss) from continuing operations before income taxes. Additionally, SunCoke Middletown had cash used for capital expenditures of $25 million for the year ended December 31, 2023, compared to
$12 million for the year ended December 31, 2022, that are included in our consolidated Purchase of property, plant and equipment on the Statements of Consolidated Cash Flows.
The assets of the consolidated VIE can only be used to settle the obligations of the consolidated VIE and not obligations of the Company. The creditors of SunCoke Middletown do not have recourse to the assets or general credit of the Company to satisfy liabilities of the VIE. The Statements of Consolidated Financial Position includes the following amounts for SunCoke Middletown:
| | December 31, | | | December 31, |
| (In millions) | | (In millions) | 2023 | | 2022 |
| | (In Millions) |
| December 31, |
| 2021 | | 2020 |
| Cash and cash equivalents | $ | — | | | $ | 5 | |
| Inventories | |
| Inventories | |
| Inventories | Inventories | 20 | | | 21 | |
| Property, plant and equipment, net | Property, plant and equipment, net | 300 | | | 308 | |
| Accounts payable | Accounts payable | (12) | | | (15) | |
| Other assets (liabilities), net | Other assets (liabilities), net | (12) | | | (10) | |
| Noncontrolling interests | Noncontrolling interests | (296) | | | (309) | |
NOTE 19 - EARNINGS PER SHARE
The following table summarizes the computation of basic and diluted EPS:
| | (In Millions, Except Per Share Amounts) |
| Year Ended December 31, |
| 2021 | | 2020 | | 2019 |
| Income (loss) from continuing operations | $ | 3,030 | | | $ | (82) | | | $ | 295 | |
| Year Ended December 31, | | | Year Ended December 31, |
| (In millions, except per share amounts) | | (In millions, except per share amounts) | 2023 | | 2022 | | 2021 |
| Income from continuing operations | |
| Income from continuing operations attributable to noncontrolling interest | Income from continuing operations attributable to noncontrolling interest | (45) | | | (41) | | | — | |
| Net income (loss) from continuing operations attributable to Cliffs shareholders | 2,985 | | | (123) | | | 295 | |
| Income (loss) from discontinued operations, net of tax | 3 | | | 1 | | | (2) | |
| Net income (loss) attributable to Cliffs shareholders | $ | 2,988 | | | $ | (122) | | | $ | 293 | |
| Net income from continuing operations attributable to Cliffs shareholders | |
| Income from discontinued operations, net of tax | |
| Net income attributable to Cliffs shareholders | |
| | Weighted average number of shares: | Weighted average number of shares: | |
| Weighted average number of shares: | |
| Weighted average number of shares: | |
| Basic | |
| Basic | |
| Basic | Basic | 498 | | | 379 | | | 277 | |
| Redeemable preferred shares | Redeemable preferred shares | 33 | | | — | | | — | |
| Convertible senior notes | 22 | | | — | | | 4 | |
Convertible senior notes1 | |
| Employee stock plans | Employee stock plans | 5 | | | — | | | 3 | |
| Diluted | Diluted | 558 | | | 379 | | | 284 | |
| Earnings (loss) per common share attributable to Cliffs common shareholders - basic1: | |
Earnings per common share attributable to Cliffs common shareholders - basic2: | |
Earnings per common share attributable to Cliffs common shareholders - basic2: | |
Earnings per common share attributable to Cliffs common shareholders - basic2: | |
| Continuing operations | |
| Continuing operations | |
| Continuing operations | Continuing operations | $ | 5.62 | | | $ | (0.32) | | | $ | 1.07 | |
| Discontinued operations | Discontinued operations | 0.01 | | | — | | | (0.01) | |
| $ | 5.63 | | | $ | (0.32) | | | $ | 1.06 | |
Earnings (loss) per common share attributable to
Cliffs common shareholders - diluted: | | | | | |
| $ | |
| Earnings per common share attributable to Cliffs common shareholders - diluted: | |
| Continuing operations | |
| Continuing operations | |
| Continuing operations | Continuing operations | $ | 5.35 | | | $ | (0.32) | | | $ | 1.04 | |
| Discontinued operations | Discontinued operations | 0.01 | | | — | | | (0.01) | |
| $ | |
| | $ | 5.36 | | | $ | (0.32) | | | $ | 1.03 | |
| 1 For the year ended December 31, 2021, basic earnings per share was calculated by dividing Net income (loss) attributable to Cliffs shareholders, less $187 million of earnings attributed to Series B Participating Redeemable Preferred Stock, by the weighted average number of basic common shares outstanding during the period presented. | 1 On January 1, 2022, we adopted ASU 2020-06, Debt - Debt with Conversion and Other Options (Subtopic 470-20) and Derivatives and Hedging - Contracts in Entity's Own Equity (Subtopic 815-40). We utilized the modified retrospective method of adoption; using this approach, the guidance was applied to transactions outstanding as of the beginning of the fiscal year. | |
1 On January 1, 2022, we adopted ASU 2020-06, Debt - Debt with Conversion and Other Options (Subtopic 470-20) and Derivatives and Hedging - Contracts in Entity's Own Equity (Subtopic 815-40). We utilized the modified retrospective method of adoption; using this approach, the guidance was applied to transactions outstanding as of the beginning of the fiscal year. | |
1 On January 1, 2022, we adopted ASU 2020-06, Debt - Debt with Conversion and Other Options (Subtopic 470-20) and Derivatives and Hedging - Contracts in Entity's Own Equity (Subtopic 815-40). We utilized the modified retrospective method of adoption; using this approach, the guidance was applied to transactions outstanding as of the beginning of the fiscal year. | |
2 For the year ended December 31, 2021, basic earnings per share was calculated by dividing Net income attributable to Cliffs shareholders, less $187 million of earnings attributed to Series B Participating Redeemable Preferred Stock, by the weighted average number of basic common shares outstanding during the period presented. | | 2 For the year ended December 31, 2021, basic earnings per share was calculated by dividing Net income attributable to Cliffs shareholders, less $187 million of earnings attributed to Series B Participating Redeemable Preferred Stock, by the weighted average number of basic common shares outstanding during the period presented. |
The following table summarizes the potentially dilutive shares that have beenwere excluded from the computation of diluted earnings per share calculation for the year ended December 31, 2020, as they werebecause their effect would have been anti-dilutive:
| | | | | |
| (In Millions) |
| 2020 |
Redeemable preferred shares | 4 | |
Convertible senior notes | 2 | |
Shares related to employee stock plans | 1 | |
| | | | | | | | | | | | | | | | | |
| Year Ended December 31, |
| (In millions) | 2023 | | 2022 | | 2021 |
| Employee stock plans | 2 | | — | | | — | |
NOTE 20 - COMMITMENTS AND CONTINGENCIES
Purchase CommitmentsPURCHASE COMMITMENTS
We purchase portions of the principal raw materials required for our steel manufacturing operations under annual and multi-year agreements, some of which have minimum quantity requirements. We also use large volumes of natural gas, electricity and industrial gases in our steel manufacturing operations. We negotiate most of our purchases of chrome, industrial gases and a portion of our electricity under multi-year agreements. Our purchases of
coke are made under annual or multi-year agreements with periodic price adjustments. We typically purchase coal under annual fixed-pricefixed price agreements. We also purchase certain transportation services under multi-year contracts with minimum quantity requirements.
ContingenciesUnconditional purchase obligations, including take-or-pay agreements, are as follows (in millions):
| | | | | | | | | | | | | | | | | | | | | | | | | | | | | | | | |
| 2024 | | 2025 | | 2026 | | 2027 | | 2028 | | Thereafter |
| $ | 2,984 | | | $ | 1,707 | | | $ | 1,133 | | | $ | 1,025 | | | $ | 929 | | | $ | 5,365 | |
OTHER COMMERCIAL COMMITMENTS
We use surety bonds and letters of credit to provide financial assurance for certain obligations and statutory requirements. As of December 31, 2023, we had $260 million of surety-backed letters of credit and surety bonds outstanding. Additionally, as of December 31, 2023, we had $56 million of outstanding letters of credit issued under our ABL Facility.
CONTINGENCIES
We are currently the subject of, or party to, various claims and legal proceedings incidental to our current and historical operations. These claims and legal proceedings are subject to inherent uncertainties and unfavorable rulings could occur. An unfavorable ruling could include monetary damages, additional funding requirements or an injunction. If an unfavorable ruling were to occur, there exists the possibility of a material adverse effect on our financial position and results of operations for the period in which the ruling occurs or future periods. However, based on currently available information we do not believe that any pending claims or legal proceedings will result in a material adverse effect in relation to our consolidated financial statements.
Environmental ContingenciesENVIRONMENTAL CONTINGENCIES
Although we believe our operating practices have been consistent with prevailing industry standards, hazardous materials may have been released at operating sites or third-party sites in the past, including operating sites that we no longer own. If we reasonably can, we estimate potential remediation expenditures for those sites where future remediation efforts are probable based on identified conditions, regulatory requirements, or contractual obligations arising from the sale of a business or facility. For sites involving government required investigations, we typically make an estimate of potential remediation expenditures only after the investigation is complete and when we better understand the nature and scope of the remediation. In general, the material factors in these estimates include the costs associated with investigations, delineations, risk assessments, remedial work, governmental response and oversight, site monitoring, and preparation of reports to the appropriate environmental agencies.
The following is a summary of our environmental obligations:
| | | | | | | | | | | |
| (In Millions) |
| December 31,
2021 | | December 31,
2020 |
| Environmental obligations | $ | 207 | | | $ | 135 | |
| Less current portion | 20 | | | 18 | |
| Long-term environmental obligations | $ | 187 | | | $ | 117 | |
The increase in environmental obligations as of December 31, 2021, compared to December 31, 2020, related to measurement period adjustments as a result of the purchase price allocation of the AM USA Transaction and the preliminary purchase price allocation of the FPT Acquisition. | | | | | | | | | | | |
| December 31, |
| (In millions) | 2023 | | 2022 |
| Environmental obligations | $ | 134 | | | $ | 141 | |
| Less: current portion | 21 | | | 23 | |
| Long-term environmental obligations | $ | 113 | | | $ | 118 | |
We cannot predict the ultimate costs for each site with certainty because of the evolving nature of the investigation and remediation process. Rather, to estimate the probable costs, we must make certain assumptions. The most significant of these assumptions is for the nature and scope of the work that will be necessary to investigate and remediate a particular site and the cost of that work. Other significant assumptions include the cleanup technology that will be used, whether and to what extent any other parties will participate in paying the investigation and remediation costs, reimbursement of past response costs and future oversight costs by governmental agencies, and the reaction of the governing environmental agencies to the proposed work plans. Costs for future investigation and remediation are not discounted to their present value, unless the amount and timing of the cash disbursements are readily known. To the extent that we have been able to reasonably estimate future liabilities, we do not believe that there is a reasonable possibility that we will incur a loss or losses that exceed the amounts we accrued for the environmental matters discussed below that would, either individually or in the aggregate, have a material adverse effect on our consolidated financial condition, results of operations or cash flows. However, since we recognize amounts in the consolidated financial statements in accordance with GAAP that exclude potential losses that are not probable or that may not be currently estimable, the ultimate costs of these environmental matters may be higher than the liabilities we currently have recorded in our consolidated financial statements.
Pursuant to RCRA (Resource Conservation and Recovery Act), which governs the treatment, handling and disposal of hazardous waste, the EPA and authorized state environmental agencies may conduct inspections of RCRA-regulated facilities to identify areas where there have been releases of hazardous waste or hazardous constituents into the environment and may order the facilities to
take corrective action to remediate such releases. Likewise, the EPA or the states may require closure or post-closure care of residual, industrial and hazardous waste management units. Environmental regulators have the
authority to inspect all of our facilities. While we cannot predict the future actions of these regulators, it is possible that they may identify conditions in future inspections of these facilities that they believe require corrective action.
Pursuant to CERCLA, the EPA and state environmental authorities have conducted site investigations at some of our facilities and other third-party facilities, portions of which previously may have been used for disposal of materials that are currently regulated. The results of these investigations are still pending, and we could be directed to spend funds for remedial activities at the former disposal areas. Because of the uncertain status of these investigations, however, we cannot reasonably predict whether or when such spending might be required or its magnitude.
On April 29, 2002, AK Steel entered a mutually agreed-upon administrative order with the consent of the EPA pursuant to Section 122 of CERCLA to perform a RI/FS of the Hamilton plant site located in New Miami, Ohio. The plant ceased operations in 1990 and all of its former structures have been demolished. AK Steel submitted the investigation portion of the RI/FS and completed supplemental studies. Until the RI/FS is complete, we cannot reasonably estimate the additional costs, if any, we may incur for potentially required remediation of the site or when we may incur them.
Burns Harbor Water Issues
In August 2019, ArcelorMittal Burns Harbor LLC (n/k/a Cleveland-Cliffs Burns Harbor LLC) suffered a loss of the blast furnace cooling water recycle system, which led to the discharge of cyanide and ammonia in excess of the Burns Harbor plant's NPDES permit limits. Since that time, the facility has taken numerous steps to prevent recurrence and maintain compliance with its NPDES permit. We engaged in settlement discussions with the U.S. Department of Justice, the EPA and the State of Indiana to resolve any alleged violations of environmental laws or regulations arising out of the August 2019 event. Later stages of the settlement discussions included the Environmental Law and Policy Center (ELPC) and Hoosier Environmental Council (HEC), which had filed a lawsuit on December 20, 2019 in the U.S. District Court for the Northern District of Indiana alleging violations resulting from the August 2019 event and other Clean Water Act claims. We believe that a consent decree has been finalized and is currently pending final approvals, which requires specified enhancements to the mill's wastewater treatment systems and a $3 million civil penalty, along with other terms and conditions. ELPC and HEC are also proposed signatories to the consent decree. ArcelorMittal Burns Harbor LLC was served with a subpoena on December 5, 2019, from the United States District Court for the Northern District of Indiana, relating to the August 2019 event and has responded to the subpoena requests, including follow-up requests. With the resolution of monetary sanctions and injunctive relief requirements under the pending consent decree, we do not believe that the costs to resolve any other third-party claims, including potential natural resource damages claims, that may arise out of the August 2019 event are likely to have, individually or in the aggregate, a material adverse effect on our consolidated financial condition, results of operations or cash flows.
In addition to the foregoing matters, we are or may be involved in proceedings with various regulatory authorities that may require us to pay fines, comply with more rigorous standards or other requirements or incur capital and operating expenses for environmental compliance. We believe that the ultimate disposition of any such proceedings will not have, individually or in the aggregate, a material adverse effect on our consolidated financial condition, results of operations or cash flows.
Tax MattersTAX MATTERS
The calculation of our tax liabilities involves dealing with uncertainties in the application of complex tax regulations. We recognize liabilities for anticipated tax audit issues based on our estimate of whether, and the extent to which, additional taxes will be due. If we ultimately determine that payment of these amounts is unnecessary, we reverse the liability and recognize a tax benefit during the period in which we determine that the liability is no longer necessary. We also recognize tax benefits to the extent that it is more likely than not that our positions will be sustained when challenged by the taxing authorities. To the extent we prevail in matters for which liabilities have been established, or are required to pay amounts in excess of our liabilities, our effective tax rate in a given period could be materially affected. An unfavorable tax settlement would require use of our cash and result in an increase in our effective tax rate in the year of resolution. A favorable tax settlement would be recognized as a reduction in our effective tax rate in the year of resolution. Refer to NOTE 1211 - INCOME TAXES for further information.
Other ContingenciesOTHER CONTINGENCIES
In addition to the matters discussed above, there are various pending and potential claims against us and our subsidiaries involving product liability, personal injury, commercial, employee benefits and other matters arising in the ordinary course of business. Because of the considerable uncertainties that exist for any claim, it is difficult to reliably
or accurately estimate what the amount of a loss would be if a claimant prevails. If material assumptions or factual understandings we rely on to evaluate exposure for these contingencies prove to be inaccurate or otherwise change, we may be required to record a liability for an adverse outcome. If, however, we have reasonably evaluated potential future liabilities for all of these contingencies, including those described more specifically above, it is our opinion, unless we otherwise noted, that the ultimate liability from these contingencies, individually or in the aggregate, should not have a material adverse effect on our consolidated financial position, results of operations or cash flows.
NOTE 21 - SUBSEQUENT EVENTS
On December 1, 2021, we issued a noticeWe have evaluated subsequent events through the date of redemption for all $294 million in aggregate principal amount outstanding of the 1.500% 2025 Convertible Senior Notes. The 1.500% 2025 Convertible Senior Notes were redeemed on January 18, 2022, through a combination settlement, with the aggregate principal amount of $294 million paid in cash, and 24 million common shares, with a fair value of $499 million, delivered to noteholders in settlement of the premium due per the terms of the indenture, plus cash in respect of the accrued and unpaid interest on the 1.500% 2025 Convertible Senior Notes to, but not including, the redemption date per the terms of the indenture.
On February 10, 2022, our Board of Directors authorized a program to repurchase outstanding common shares in the open market or in privately negotiated transactions, which may include purchases pursuant to Rule 10b5-1 plans or accelerated share repurchases, up to a maximum of $1 billion. We are not obligated to make any purchases and the program may be suspended or discontinued at any time. The share repurchase program does not have a specific expiration date.financial statement issuance.
13897 | CLF 2023 FORM 10-K
REPORT OF INDEPENDENT REGISTERED PUBLIC ACCOUNTING FIRM
To the shareholders and the Board of Directors of
Cleveland-Cliffs Inc.
Opinion on the Financial StatementsOPINION ON THE FINANCIAL STATEMENTS
We have audited the accompanying statements of consolidated financial position of Cleveland-Cliffs Inc. and subsidiaries (the "Company") as of December 31, 20212023 and 2020,2022, the related statements of consolidated operations, comprehensive income, cash flows, and changes in equity, for each of the three years in the period ended December 31, 2021,2023, and the related notes (collectively referred to as the "financial statements"). In our opinion, the financial statements present fairly, in all material respects, the financial position of the Company as of December 31, 20212023 and 2020,2022, and the results of its operations and its cash flows for each of the three years in the period ended December 31, 2021,2023, in conformity with accounting principles generally accepted in the United States of America.
We have also audited, in accordance with the standards of the Public Company Accounting Oversight Board (United States) (PCAOB), the Company's internal control over financial reporting as of December 31, 2021,2023, based on criteria established in Internal Control — Integrated Framework (2013) issued by the Committee of Sponsoring Organizations of the Treadway Commission and our report dated February 11, 2022,8, 2024, expressed an unqualified opinion on the Company's internal control over financial reporting.
Basis for OpinionBASIS FOR OPINION
These financial statements are the responsibility of the Company's management. Our responsibility is to express an opinion on the Company's financial statements based on our audits. We are a public accounting firm registered with the PCAOB and are required to be independent with respect to the Company in accordance with the U.S. federal securities laws and the applicable rules and regulations of the Securities and Exchange Commission and the PCAOB.
We conducted our audits in accordance with the standards of the PCAOB. Those standards require that we plan and perform the audit to obtain reasonable assurance about whether the financial statements are free of material misstatement, whether due to error or fraud. Our audits included performing procedures to assess the risks of material misstatement of the financial statements, whether due to error or fraud, and performing procedures that respond to those risks. Such procedures included examining, on a test basis, evidence regarding the amounts and disclosures in the financial statements. Our audits also included evaluating the accounting principles used and significant estimates made by management, as well as evaluating the overall presentation of the financial statements. We believe that our audits provide a reasonable basis for our opinion.
Critical Audit MatterCRITICAL AUDIT MATTER
The critical audit matter communicated below is a matter arising from the current-period audit of the financial statements that was communicated or required to be communicated to the audit committee and that (1) relates to accounts or disclosures that are material to the financial statements and (2) involved our especially challenging, subjective, or complex judgments. The communication of critical audit matters does not alter in any way our opinion on the financial statements, taken as a whole, and we are not, by communicating the critical audit matter below, providing a separate opinion on the critical audit matter or on the accounts or disclosures to which it relates.
Mineral ReservesIRON ORE MINERAL RESERVES — Asset Retirement Obligations, Valuation of Long-Lived Assets, Depreciation, Depletion and Amortization of Property, Plant and Equipment and Valuation in Acquisition AccountingIMPACT ON ASSET RETIREMENT OBLIGATIONS — Refer to Notes 3, 5, 6 and 14 to the financial statementsREFER TO NOTE 13 TO THE FINANCIAL STATEMENTS
Critical Audit Matter Description
Iron ore mineral reserve estimates, combined with estimated annual production levels, are used to determine the iron ore mine closure dates utilized in recording the fair value liability for asset retirement obligations for active operating iron ore mines. Since the liability represents the present value of the expected future obligation, a significant change in iron ore mineral reserves or iron ore mine lives could have a substantial effect on the recorded obligation. Iron ore mineral reserve estimates are also used in evaluating potential impairments of goodwill and iron ore mine asset groups as they are indicative of future cash flows and in determining maximum useful lives utilized to calculate depreciation, depletion and amortization of long-lived iron ore mine assets. Further, iron ore mineral reserve estimates are used in estimating the fair value of mineral reserves established through the purchase price allocation in a business combination.
The Company performs an in-depth evaluation of its iron ore mineral reserve estimates by iron ore mine on a periodic basis, in addition to routine annual assessments. The determination of iron ore mineral reserves requires management, with the support of management’s experts, to make significant estimates and assumptions related to key inputs including (1) the determination of the size and scope of the iron ore body through technical modeling, (2) the estimates of future iron ore prices recognizing that the price shall not exceed the three-year trailing average index price of iron ore adjusted to the Company’s realized price, production costs and capital expenditures, and (3) management’s mine plan for the proven and probable iron ore mineral reserves (collectively “the iron ore mineral reserve inputs”). Changes in any of the judgments or assumptions related to the iron ore mineral reserve inputs can have a significant impact with respect to the accrual for asset retirement obligations, the impairment of goodwill and long-lived asset groups and the amount of depreciation, depletion, and amortization expense andexpense. The closure date utilized in the estimated fair valueCompany’s accrual for asset retirement obligations for each of their active iron ore mine operations is determined based on the exhaustion date of the remaining iron ore mineral reserves, established throughwhich is dependent on the purchase price allocation in a business combination.estimate of iron ore mineral reserves. The consolidated asset retirement obligation balance was $449$459 million as of December 31, 2021,2023, of which $208$171 million related to active iron ore mine operations. The total asset balance associated with the Company’s Steelmaking reportable segment was $18,326 million as
Given the significant judgments and assumptions made by management to estimate iron ore mineral reserves and the sensitivity of changes to iron ore mineral reserve estimatesinputs on the Company’s recorded asset retirement obligations, long-lived asset impairment considerations, calculated depreciation, depletion and amortization expense and estimated fair value of mineral reserves established through the purchase price allocation of a business combination, performing audit procedures to evaluate the reasonableness of management’s judgments and estimates related to the iron ore mineral reserve inputs required a high degree of auditor judgment and an increased extent of effort.
How the Critical Audit Matter Was Addressed in the Audit
Our audit procedures related to management’s significant judgments and assumptionsestimates related to iron ore mineral reserve quantities and the related iron ore mine closure datesreserves included the following, among others:
•We tested the operating effectiveness of internal controls related to the Company’s estimation of iron ore mineral reserve quantities and the related iron ore mine closure dates.reserves.
•We evaluated the experience, qualifications and objectivity of management’s experts, including in-house iron ore mine engineers and the third-party Qualified Person.
•For an iron ore mine subject to the Company’s routine annual assessment we evaluated management’s assessment by:
◦Understanding the process used by management to survey and analyze the geological and operational status of current year iron ore mine production.
◦Evaluating the historical accuracy of management’s technical model as compared to actual iron ore mine production results.
◦Comparing the iron ore mine plan per the most recent Technical Report Summary, updated for current year depletion, to:
▪Presentations to the Audit Committee.
▪Information by asset group, assetAsset retirement obligation valuation models, depreciation, depletion and amortization expense calculations and mineral reserve purchase price allocation valuation models.
•For an iron ore mine subject to the Company’s periodic in-depth evaluation of its iron ore mineral reserve estimate:
◦We evaluated management’s determination of the size and scope of the iron ore body, by:
▪Understanding the process used by management to complete research and exploration activities including mineralized resource drill samples.
▪Understanding the methodology utilized by management to apply the research and exploration data to the development of a technical model of the iron ore body.
▪Evaluating the historical accuracy of management’s technical model as compared to actual iron ore mine production results.
◦We evaluated management’s estimates of future iron ore prices, production costs and capital expenditures (the “financial assumptions”) as included in the Technical Report Summary, by:
▪Understanding and testing the methodology utilized by management for development of the future iron ore prices recognizing that the price shall not exceed the three-year trailing average index price of iron ore adjusted to the Company’s realized price.
▪Evaluated management’s ability to accurately forecast future iron ore prices, production costs and capital expenditures by comparing actual results to management’s historical forecasts.
▪Evaluated the reasonableness of management’s estimates of future iron ore prices to forecasted information included in analyst reports.
▪Evaluated the reasonableness of management’s forecast for production costs and capital expenditures by comparing the forecasts to: (1) historical results and (2) internal communications among management and to the Board of Directors.
◦We evaluated management’s iron ore mine plan for the proven and probable mineral reserves as included in the Technical Report Summary, by:
▪Understanding the process used by management to develop the iron ore mine plan for proven and probable iron ore mineral reserves applying key inputs such as the technical model of the iron ore body and the financial assumptions.
▪Comparing the iron ore mine plan to
•Presentations to the Audit Committee.
•Historical iron ore mine plan(s).
•Information by asset group, asset retirement obligation valuation models, depreciation, depletion and amortization expense calculations, and mineral reserve purchase price allocation valuation models.
/s/ DELOITTE & TOUCHE LLP
Cleveland, Ohio
February 11, 20228, 2024
We have served as the Company's auditor since 2004.
14199 | CLF 2023 FORM 10-K
| | |
| | |
ItemITEM 9. | Changes in and Disagreements With Accountants on Accounting and Financial Disclosure CHANGES IN AND DISAGREEMENTS WITH ACCOUNTANTS ON ACCOUNTING AND FINANCIAL DISCLOSURE |
None.
| | |
| | |
ItemITEM 9A. | Controls and Procedures CONTROLS AND PROCEDURES |
We maintain disclosure controls and procedures that are designed to ensure that information required to be disclosed in our Exchange Act reports is recorded, processed, summarized and reported within the time periods specified in the SEC’s rules and forms, and that such information is accumulated and communicated to our management, including our President and Chief Executive Officer and Chief Financial Officer, as appropriate, to allow timely decisions regarding required disclosure based solely on the definition of “disclosure controls and procedures” in Rule 13a-15(e) promulgated under the Exchange Act. In designing and evaluating the disclosure controls and procedures, management recognized that any controls and procedures, no matter how well designed and operated, can provide only reasonable assurance of achieving the desired control objectives, and management necessarily was required to apply its judgment in evaluating the cost-benefit relationship of possible controls and procedures.
As of the end of the period covered by this report, we carried out an evaluation under the supervision and with the participation of our management, including our President and Chief Executive Officer and our Chief Financial Officer, of the effectiveness of the design and operation of our disclosure controls and procedures. Based on the foregoing, our President and Chief Executive Officer and Chief Financial Officer concluded that our disclosure controls and procedures were effective.
Management's Report on Internal Control Over Financial ReportingMANAGEMENT'S REPORT ON INTERNAL CONTROL OVER FINANCIAL REPORTING
Our management is responsible for establishing and maintaining adequate internal control over financial reporting as such term is defined under Rule 13a-15(f) promulgated under the Exchange Act.
Internal control over financial reporting is a process designed to provide reasonable assurance regarding the reliability of financial reporting and the preparation of the Company's consolidated financial statements for external purposes in accordance with generally accepted accounting principles.
Internal control over financial reporting includes those policies and procedures that (i) pertain to the maintenance of records that, in reasonable detail, accurately and fairly reflect the transactions and dispositions of the assets of the Company; (ii) provide reasonable assurance that transactions are recorded as necessary to permit the preparation of the consolidated financial statements in accordance with generally accepted accounting principles, and that receipts and expenditures of the Company are being made only in accordance with appropriate authorizations of management and directors of the Company; and (iii) provide reasonable assurance regarding prevention or timely detection of unauthorized acquisition, use or disposition of the Company's assets that could have a material effect on the consolidated financial statements.
Because of its inherent limitations, internal control over financial reporting may not prevent or detect misstatements. Also, projections of any evaluation of effectiveness to future periods are subject to the risk that controls may become inadequate because of changes in conditions, or that the degree of compliance with the policies or procedures may deteriorate.
Management conducted an assessment of the Company's internal control over financial reporting as of December 31, 20212023 using the framework specified in Internal Control - Integrated Framework (2013), published by the Committee of Sponsoring Organizations of the Treadway Commission. We have excluded from our assessment the internal control over financial reporting at FPT, which was acquired on November 18, 2021, and whose assets as of December 31, 2021 constituted 5% of the Company’s consolidated total assets as of December 31, 2021, and whose revenues for the period from November 18, 2021 through December 31, 2021, inclusive, constituted less than 1% of the Company’s consolidated revenues for the year ended December 31, 2021.
Based on such assessment, management has concluded that the Company's internal control over financial reporting was effective as of December 31, 2021.
The effectiveness of the Company's internal control over financial reporting as of December 31, 20212023 has been audited by Deloitte & Touche LLP (PCAOB ID No. 34), an independent registered public accounting firm, as stated in their report that appears herein.
February 11, 20228, 2024
Changes in Internal Control Over Financial ReportingCHANGES IN INTERNAL CONTROL OVER FINANCIAL REPORTING
There have been no changes in our internal control over financial reporting or in other factors that occurred during our last fiscal quarter that have materially affected, or are reasonably likely to materially affect, our internal control over financial reporting.
143100 | CLF 2023 FORM 10-K
REPORT OF INDEPENDENT REGISTERED PUBLIC ACCOUNTING FIRM
To the shareholders and the Board of Directors of
Cleveland-Cliffs Inc.
Opinion on Internal Control over Financial ReportingOPINION ON INTERNAL CONTROL OVER FINANCIAL REPORTING
We have audited the internal control over financial reporting of Cleveland-Cliffs Inc. and subsidiaries (the "Company") as of December 31, 2021,2023, based on criteria established in Internal Control — Integrated Framework (2013) issued by the Committee of Sponsoring Organizations of the Treadway Commission (COSO). In our opinion, the Company maintained, in all material respects, effective internal control over financial reporting as of December 31, 2021,2023, based on criteria established in Internal Control — Integrated Framework (2013) issued by COSO.
We have also audited, in accordance with the standards of the Public Company Accounting Oversight Board (United States) (PCAOB), the consolidated financial statements as of and for the year ended December 31, 2021,2023, of the Company and our report dated February 11, 2022,8, 2024, expressed an unqualified opinion on those financial statements.
As described in Management’s Report on Internal Control Over Financial Reporting, management excluded from its assessment the internal control over financial reporting at FPT, which was acquired on November 18, 2021, and whose assets as of December 31, 2021 constituted 5% of the Company’s consolidated total assets as of December 31, 2021, and whose revenues for the period from November 18, 2021 through December 31, 2021, inclusive, constituted less than 1% of the Company’s consolidated revenues for the year ended December 31, 2021. Accordingly, our audit did not include the internal control over financial reporting at FPT.
Basis for OpinionBASIS FOR OPINION
The Company’s management is responsible for maintaining effective internal control over financial reporting and for its assessment of the effectiveness of internal control over financial reporting, included in the accompanying Management’s Report on Internal Control Over Financial Reporting. Our responsibility is to express an opinion on the Company’s internal control over financial reporting based on our audit. We are a public accounting firm registered with the PCAOB and are required to be independent with respect to the Company in accordance with the U.S. federal securities laws and the applicable rules and regulations of the Securities and Exchange Commission and the PCAOB.
We conducted our audit in accordance with the standards of the PCAOB. Those standards require that we plan and perform the audit to obtain reasonable assurance about whether effective internal control over financial reporting was maintained in all material respects. Our audit included obtaining an understanding of internal control over financial reporting, assessing the risk that a material weakness exists, testing and evaluating the design and operating effectiveness of internal control based on the assessed risk, and performing such other procedures as we considered necessary in the circumstances. We believe that our audit provides a reasonable basis for our opinion.
Definition and Limitations of Internal Control over Financial ReportingDEFINITION AND LIMITATIONS OF INTERNAL CONTROL OVER FINANCIAL REPORTING
A company’s internal control over financial reporting is a process designed to provide reasonable assurance regarding the reliability of financial reporting and the preparation of financial statements for external purposes in accordance with generally accepted accounting principles. A company’s internal control over financial reporting includes those policies and procedures that (1) pertain to the maintenance of records that, in reasonable detail, accurately and fairly reflect the transactions and dispositions of the assets of the company; (2) provide reasonable assurance that transactions are recorded as necessary to permit preparation of financial statements in accordance with generally accepted accounting principles, and that receipts and expenditures of the company are being made only in accordance with authorizations of management and directors of the company; and (3) provide reasonable assurance regarding prevention or timely detection of unauthorized acquisition, use, or disposition of the company’s assets that could have a material effect on the financial statements.
Because of its inherent limitations, internal control over financial reporting may not prevent or detect misstatements. Also, projections of any evaluation of effectiveness to future periods are subject to the risk that controls may become inadequate because of changes in conditions, or that the degree of compliance with the policies or procedures may deteriorate.
/s/ DELOITTE & TOUCHE LLP
Cleveland, Ohio
February 11, 20228, 2024
144101 | CLF 2023 FORM 10-K
| | |
| | |
ItemITEM 9B. | Other Information OTHER INFORMATION |
None.During the quarter ended December 31, 2023, no director or officer (as defined in Rule 16a-1(f) promulgated under the Exchange Act) of the Company adopted or terminated a "Rule 10b5-1 trading arrangement" or "non-Rule 10b5-1 trading arrangement" (as each term is defined in Item 408 of Regulation S-K).
| | |
| | |
ItemITEM 9C. | Disclosure Regarding Foreign Jurisdictions that Prevent Inspections DISCLOSURE REGARDING FOREIGN JURISDICTIONS THAT PREVENT INSPECTIONS |
Not applicable.
145102 | CLF 2023 FORM 10-K
PART III
| | |
| | |
ItemITEM 10. | Directors, Executive Officers and Corporate Governance DIRECTORS, EXECUTIVE OFFICERS AND CORPORATE GOVERNANCE |
The information required to be furnished by this Item will be set forth in the definitive proxy statement for our 20222024 Annual Meeting of Shareholders (the "Proxy Statement") under the headings "Board Meetings and Committees — Audit Committee", "Code of Business Conduct and Ethics", "Independence and Related Party Transactions", and "Information Concerning Director Nominees”, and is incorporated herein by reference and made a part hereof from the Proxy Statement. The information regarding executive officers required by this Item is set forth in Part I - Item 1. Business hereof under the heading “Information About Our Executive Officers”, which information is incorporated herein by reference and made a part hereof.
| | |
| | |
ItemITEM 11. | Executive Compensation EXECUTIVE COMPENSATION |
The information required to be furnished by this Item will be set forth in the Proxy Statement under the headings “Director Compensation”, "Compensation Discussion and Analysis", “Compensation Committee Report”, “Compensation Committee Interlocks and Insider Participation”, "Compensation-Related Risk Assessment" and “Executive Compensation” and is incorporated herein by reference and made a part hereof from the Proxy Statement.
| | |
| | |
ItemITEM 12. | Security Ownership of Certain Beneficial Owners and Management and Related Stockholder Matters SECURITY OWNERSHIP OF CERTAIN BENEFICIAL OWNERS AND MANAGEMENT AND RELATED STOCKHOLDER MATTERS |
The information required to be furnished by this Item will be set forth in the Proxy Statement under the headings "Ownership of Equity Securities of the Company" and "Equity Compensation Plan Information" and is incorporated herein by reference and made a part hereof from the Proxy Statement.
| | |
| | |
ItemITEM 13. | Certain Relationships and Related Transactions, and Director Independence CERTAIN RELATIONSHIPS AND RELATED TRANSACTIONS, AND DIRECTOR INDEPENDENCE |
The information required to be furnished by this Item will be set forth in the Proxy Statement under the heading “Independence and Related Party Transactions” and is incorporated herein by reference and made a part hereof from the Proxy Statement.
| | |
| | |
ItemITEM 14. | Principal Accountant Fees and Services PRINCIPAL ACCOUNTANT FEES AND SERVICES |
The information required to be furnished by this Item will be set forth in the Proxy Statement under the heading “Ratification of Independent Registered Public Accounting Firm” and is incorporated herein by reference and made a part hereof from the Proxy Statement.
146103 | CLF 2023 FORM 10-K
PART IV
| | | | | |
| Item
| ITEM 15. | Exhibits and Financial Statement Schedules EXHIBITS AND FINANCIAL STATEMENT SCHEDULES |
(a)(1) - List of Financial Statements
The following consolidated financial statements of Cleveland-Cliffs Inc. are included at ItemITEM 8. Financial Statements and Supplementary DataFINANCIAL STATEMENTS AND SUPPLEMENTARY DATA above:
•Statements of Consolidated Financial Position - December 31, 20212023 and 20202022
•Statements of Consolidated Operations - Years ended December 31, 2021, 20202023, 2022 and 20192021
•Statements of Consolidated Comprehensive Income - Years ended December 31, 2021, 20202023, 2022 and 20192021
•Statements of Consolidated Cash Flows - Years ended December 31, 2021, 20202023, 2022 and 20192021
•Statements of Consolidated Changes in Equity - Years ended December 31, 2021, 20202023, 2022 and 20192021
•Notes to Consolidated Financial Statements
(a)(2) - Financial Statement Schedules
All schedules for which provision is made in the applicable accounting regulation of the SEC are not required under the related instructions or are inapplicable, and therefore have been omitted or are contained in the applicable financial statements or the notes thereto.
(a)(3) List of Exhibits
All documents referenced below have been filed pursuant to the Securities Exchange Act of 1934 by Cleveland-Cliffs Inc., file number 1-09844, unless otherwise indicated.
| | | | | |
Exhibit
| Exhibit |
| Articles of Incorporation and Regulations of Cleveland-Cliffs Inc. |
| Fourth Amended Articles of Incorporation of Cliffs, as filed with the Secretary of State of the State of Ohio on September 25, 2020 (filed as Exhibit 3.2 to Cliffs’ Form 8-K on September 28, 2020 and incorporated herein by reference). |
| Certificate of Amendment to Fourth Amended Articles of Incorporation of Cliffs, as filed with the Secretary of State of the State of Ohio on December 7, 2020 (filed as Exhibit 3.1 to Cliffs' Form 8-K on December 9, 2020 and incorporated herein by reference). |
| Certificate of Amendment to Fourth Amended Articles of Incorporation of Cliffs, as amended, as filed with the Secretary of State of the State of Ohio on April 29, 2021 (filed as Exhibit 3.1 to Cliffs' Form 8-K on April 30, 2021 and incorporated herein by reference). |
| Regulations of Cliffs (filed as Exhibit 3.2 to Cliffs’ Form 10-K for the period ended December 31, 2011 and incorporated herein by reference). |
| Instruments defining rights of security holders, including indentures |
| Indenture, dated as of March 17, 2010, between Cliffs Natural Resources Inc. (n/k/a Cleveland-Cliffs Inc.) and U.S. Bank National Association, as trustee (filed as Exhibit 4.3 to Cliffs’ Registration Statement on Form S-3 (Registration No. 333-186617) on February 12, 2013 and incorporated herein by reference). |
| Third Supplemental Indenture, dated as of September 20, 2010, between Cliffs Natural Resources Inc. (n/k/a Cleveland-Cliffs Inc.) and U.S. Bank National Association, as trustee, including Form of 6.25% Notes due 2040 (filed as Exhibit 4.4 to Cliffs’ Form 8-K on September 17, 2010 and incorporated herein by reference). |
| Fifth Supplemental Indenture, dated as of March 31, 2011, between Cliffs Natural Resources Inc. (n/k/a Cleveland-Cliffs Inc.) and U.S. Bank National Association, as trustee (filed as Exhibit 4(b) to Cliffs’ Form 10-Q for the period ended June 30, 2011 and incorporated herein by reference). |
| Seventh Supplemental Indenture, dated as of May 7, 2013, between Cliffs Natural Resources Inc. (n/k/a Cleveland-Cliffs Inc.) and U.S. Bank National Association, as trustee (filed as Exhibit 4.1 to Cliffs' Form 10-Q for the period ended June 30, 2013 and incorporated herein by reference). |
| | | | | |
Exhibit
Number | Exhibit |
| Eighth Supplemental Indenture, dated as of December 19, 2017, by and between Cleveland-Cliffs Inc. and U.S. Bank National Association, as trustee, including Form of 1.50% Convertible Senior Notes due 2025 (filed as Exhibit 4.2 to Cliffs' Form 8-K on December 19, 2017 and incorporated herein by reference). |
| Indenture, dated as of May 13, 2019, among Cleveland-Cliffs Inc., the Guarantors party thereto and U.S. Bank National Association, as trustee, including Form of 5.875% Senior Notes due 2027 (filed as Exhibit 4.1 to Cliffs' Form 8-K on May 14, 2019 and incorporated herein by reference). |
| First Supplemental Indenture, dated as of March 13, 2020, among Cleveland-Cliffs Inc., the Additional Guarantors party thereto and U.S. Bank National Association, as trustee (filed as Exhibit 4.4 to Cliffs' Form 10-Q for the period ended March 31, 2020 and incorporated herein by reference). |
| | | | | |
| Exhibit Number | Exhibit |
| Second Supplemental Indenture, dated as of May 22, 2020, among Cleveland-Cliffs Inc., the Additional Guarantors party thereto and U.S. Bank National Association, as trustee (filed as Exhibit 4.6 to Cliffs’ Form 10-Q for the period ended June 30, 2020 and incorporated herein by reference). |
| Third Supplemental Indenture, dated as of December 9, 2020, among Cleveland-Cliffs Inc., the Additional Guarantors party thereto and U.S. Bank National Association, as trustee (filed as Exhibit 4.24 to Cliffs’ Form 10-K for the period ended December 31, 2020 and incorporated herein by reference). |
| Fourth Supplemental Indenture, dated as of December 18, 2020, among Cleveland-Cliffs Inc., the Additional Guarantors party thereto and U.S. Bank National Association, as trustee (filed as Exhibit 4.25 to Cliffs’ Form 10-K for the period ended December 31, 2020 and incorporated herein by reference). |
| Fifth Supplemental Indenture, dated as of December 22, 2021, among Cleveland-Cliffs Inc., the Additional Guarantor party thereto and U.S. Bank National Association, as trustee (filed herewith)as Exhibit 4.11 to Cliffs’ Form 10-K for the period ended December 31, 2021 and incorporated herein by reference). |
| Sixth Supplemental Indenture, dated as of July 31, 2023, among Cleveland-Cliffs Inc., the Additional Guarantors party thereto and U.S. Bank Trust Company, National Association (successor in interest to U.S. Bank National Association), as trustee (filed as Exhibit 4.1 to Cliffs' Form 10-Q for the period ended September 30, 2023 and incorporated herein by reference). |
| Indenture, dated as of March 13, 2020, among Cleveland-Cliffs Inc., the Guarantors party thereto and U.S. Bank National Association, as trustee and first lien notes collateral agent, including Form of 6.75% Senior Secured Notes due 2026 (filed as Exhibit 4.1 to Cliffs’ Form 10-Q for the period ended March 31, 2020 and incorporated herein by reference). |
| First Supplemental Indenture, dated as of May 22, 2020, among Cleveland-Cliffs Inc., the Additional Guarantors party thereto and U.S. Bank National Association, as trustee and first lien notes collateral agent (filed as Exhibit 4.9 to Cliffs’ Form 10-Q for the period ended June 30, 2020 and incorporated herein by reference). |
| Second Supplemental Indenture, dated as of June 19, 2020, among Cleveland-Cliffs Inc., the Guarantors party thereto and U.S. Bank National Association, as trustee and first lien notes collateral agent, including Form of 6.75% Senior Secured Notes due 2026 (filed as Exhibit 4.10 to Cliffs’ Form 10-Q for the period ended June 30, 2020 and incorporated herein by reference). |
| Third Supplemental Indenture, dated as of December 9, 2020, among Cleveland-Cliffs Inc., the Additional Guarantors party thereto and U.S. Bank National Association, as trustee and first lien notes collateral agent (filed as Exhibit 4.29 to Cliffs’ Form 10-K for the period ended December 31, 2020 and incorporated herein by reference). |
| Fourth Supplemental Indenture, dated as of December 18, 2020, among Cleveland-Cliffs Inc., the Additional Guarantors party thereto and U.S. Bank National Association, as trustee and first lien notes collateral agent (filed as Exhibit 4.30 to Cliffs’ Form 10-K for the period ended December 31, 2020 and incorporated herein by reference). |
| Fifth Supplemental Indenture, dated as of December 22, 2021, among Cleveland-Cliffs Inc., the Additional Guarantor party thereto and U.S. Bank National Association, as trustee and first lien notes collateral agent (filed herewith)as Exhibit 4.17 to Cliffs’ Form 10-K for the period ended December 31, 2021 and incorporated herein by reference). |
| Sixth Supplemental Indenture, dated as of July 31, 2023, among Cleveland-Cliffs Inc., the Additional Guarantors party thereto and U.S. Bank Trust Company, National Association and U.S. Bank National Association, as first lien notes collateral agent (successor in interest to U.S. Bank National Association), as trustee (filed as Exhibit 4.2 to Cliffs' Form 10-Q for the period ended September 30, 2023 and incorporated herein by reference). |
| Indenture, dated as of March 16, 2020, among Cleveland-Cliffs Inc., the Guarantors party thereto and U.S. Bank National Association, as trustee, including Form of 7.00% Senior Notes due 2027 (filed as Exhibit 4.7 to Cliffs’ Form 10-Q for the period ended March 31, 2020 and incorporated herein by reference). |
| First Supplemental Indenture, dated as of May 22, 2020, among Cleveland-Cliffs Inc., the Additional Guarantors party thereto and U.S. Bank National Association, as trustee (filed as Exhibit 4.7 to Cliffs’ Form 10-Q for the period ended June 30, 2020 and incorporated herein by reference). |
| Second Supplemental Indenture, dated as of December 9, 2020, among Cleveland-Cliffs Inc., the Additional Guarantors party thereto and U.S. Bank National Association, as trustee (filed as Exhibit 4.38 to Cliffs’ Form 10-K for the period ended December 31, 2020 and incorporated herein by reference). |
| Third Supplemental Indenture, dated as of December 18, 2020, among Cleveland-Cliffs Inc., the Additional Guarantors party thereto and U.S. Bank National Association, as trustee (filed as Exhibit 4.39 to Cliffs’ Form 10-K for the period ended December 31, 2020 and incorporated herein by reference). |
| Fourth Supplemental Indenture, dated as of December 22, 2021, among Cleveland-Cliffs Inc., the Additional Guarantor party thereto and U.S. Bank National Association, as trustee (filed herewith)as Exhibit 4.22 to Cliffs’ Form 10-K for the period ended December 31, 2021 and incorporated herein by reference). |
| | | | | |
Exhibit
| Exhibit |
| Indenture, dated as of April 17, 2020, among Cleveland-Cliffs Inc., the Guarantors party thereto and U.S. Bank National Association, as trustee and first lien notes collateral agent, including Form of 9.875% Senior Secured Notes due 2025 (filed as Exhibit 4.1 to Cliffs’ Form 10-Q for the period ended June 30, 2020 and incorporated herein by reference). |
| FirstFifth Supplemental Indenture, dated as of April 24, 2020, among Cleveland-Cliffs Inc., the Guarantors party thereto and U.S. Bank National Association, as trustee and first lien notes collateral agent, including Form of 9.875% Senior Secured Notes due 2025 (filed as Exhibit 4.2 to Cliffs’ Form 10-Q for the period ended June 30, 2020 and incorporated herein by reference). |
| Second Supplemental Indenture, dated as of May 22, 2020,July 31, 2023, among Cleveland-Cliffs Inc., the Additional Guarantors party thereto and U.S. Bank Trust Company, National Association (successor in interest to U.S. Bank National Association), as trustee and first lien notes collateral agent (filed as Exhibit 4.3 to Cliffs’Cliffs' Form 10-Q for the period ended JuneSeptember 30, 20202023 and incorporated herein by reference). |
| Third Supplemental Indenture, dated as of December 9, 2020, among Cleveland-Cliffs Inc., the Additional Guarantors party thereto and U.S. Bank National Association, as trustee and first lien notes collateral agent (filed as Exhibit 4.44 to Cliffs’ Form 10-K for the period ended December 31, 2020 and incorporated herein by reference) |
| Fourth Supplemental Indenture, dated as of December 18, 2020, among Cleveland-Cliffs Inc., the Additional Guarantors party thereto and U.S. Bank National Association, as trustee and first lien notes collateral agent (filed as Exhibit 4.45 to Cliffs’ Form 10-K for the period ended December 31, 2020 and incorporated herein by reference). |
| Fifth Supplemental Indenture, dated as of December 22, 2021, among Cleveland-Cliffs Inc., the Additional Guarantor party thereto and U.S. Bank National Association, as trustee and first lien notes collateral agent (filed herewith). |
| Indenture, dated as of February 17, 2021, among Cleveland-Cliffs Inc., the Guarantors party thereto and U.S. Bank National Association, as trustee, including Forms of 4.625% Senior Guaranteed Notes due 2029 and 4.875% Senior Guaranteed Notes due 2031 (filed as Exhibit 4.1 to Cliffs' Form 10-Q for the period ended March 31, 2021 and incorporated herein by reference). |
| First Supplemental Indenture, dated as of December 22, 2021, among Cleveland-Cliffs Inc., the Additional Guarantor party thereto and U.S. Bank National Association, as trustee (filed herewith)as Exhibit 4.30 to Cliffs’ Form 10-K for the period ended December 31, 2021 and incorporated herein by reference). |
| Second Supplemental Indenture, dated as of July 31, 2023, among Cleveland-Cliffs Inc., the Additional Guarantors party thereto and U.S. Bank Trust Company, National Association (successor in interest to U.S. Bank National Association), as trustee (filed as Exhibit 4.4 to Cliffs' Form 10-Q for the period ended September 30, 2023 and incorporated herein by reference). |
| Indenture, dated as of April 14, 2023, among Cleveland-Cliffs Inc., the Guarantors party thereto and U.S. Bank Trust Company, National Association, as trustee, including Form of 6.750% Senior Guaranteed Notes due 2030 (filed as Exhibit 4.1 to Cliffs' Form 10-Q for the period ended June 30, 2023 and incorporated herein by reference). |
| First Supplemental Indenture, dated as of July 31, 2023, among Cleveland-Cliffs Inc., the Additional Guarantors party thereto and U.S. Bank Trust Company, National Association, as trustee (filed as Exhibit 4.5 to Cliffs' Form 10-Q for the period ended September 30, 2023 and incorporated herein by reference). |
| Form of Common Share Certificate (filed as Exhibit 4.1 to Cliffs’ Form 10-Q for the period ended September 30, 2019 and incorporated herein by reference). |
| Description of Securities Registered under Section 12 of the Securities Exchange Act of 1934 (filed herewith)as Exhibit 4.25 to Cliffs’ Form 10-K for the period ended December 31, 2022 and incorporated herein by reference). |
| Material contracts |
| * Form of 2014 Change in Control Severance Agreement (covering newly hired officers) (filed as Exhibit 10.4 to Cliffs’ Form 8-K/A on September 16, 2014 and incorporated herein by reference). |
| * Form of 2016 Change in Control Severance Agreement (filed as Exhibit 10.1 to Cliffs’ 10-Q for the period ended September 30, 2016 and incorporated herein by reference). |
| * Cleveland-Cliffs Inc. 2012 Non-Qualified Deferred Compensation Plan (Amended and Restated effective October 26, 2021) (filed herewith)as Exhibit 10.3 to Cliffs’ Form 10-K for the period ended December 31, 2021 and incorporated herein by reference). |
| * Form of Director and Officer Indemnification Agreement between Cleveland-Cliffs Inc. and Directors and Officers (filed as Exhibit 10.2 to Cliffs’ Form 10-Q for the period ended March 31, 2019 and incorporated herein by reference). |
| * Cleveland-Cliffs Inc. 2021 Nonemployee Directors’ Compensation Plan (filed as Exhibit 10.2 to Cliffs’ Form 8-K on April 30, 2021 and incorporated herein by reference). |
| *Form of Restricted Shares Agreement for Nonemployee Directors (filed as Exhibit 10.310.1 to Cliffs’ Form 10-Q for the period ended June 30, 20212023 and incorporated herein by reference). |
| *Form of Deferred Shares Agreement for Nonemployee Directors (filed as Exhibit 10.410.2 to Cliffs’ Form 10-Q for the period ended June 30, 20212023 and incorporated herein by reference). |
| * Trust Agreement No. 1 (Amended and Restated effective June 1, 1997), dated June 12, 1997, by and between Cleveland-Cliffs Inc and KeyBank National Association, Trustee, with respect to the Cleveland-Cliffs Inc Supplemental Retirement Benefit Plan, Severance Pay Plan for Key Employees and certain executive agreements (filed as Exhibit 10.10 to Cliffs’ Form 10-K for the period ended December 31, 2011 and incorporated herein by reference). |
| * Trust Agreement No. 1 Amendments to Exhibits, effective as of January 1, 2000, by and between Cleveland-Cliffs Inc and KeyBank National Association, as Trustee (filed as Exhibit 10.11 to Cliffs’ Form 10-K for the period ended December 31, 2011 and incorporated herein by reference). |
| | | | | |
Exhibit
Number | Exhibit |
| * First Amendment to Trust Agreement No. 1, effective September 10, 2002, by and between Cleveland-Cliffs Inc and KeyBank National Association, as Trustee (filed as Exhibit 10.12 to Cliffs’ Form 10-K for the period ended December 31, 2011 and incorporated herein by reference). |
| * Second Amendment to Trust Agreement No. 1 between Cliffs Natural Resources Inc. (f/k/a Cleveland-Cliffs Inc) and KeyBank National Association, Trustee, entered into and effective as of December 31, 2008 (filed as Exhibit 10(y) to Cliffs’ Form 10-K for the period ended December 31, 2008 and incorporated herein by reference). |
| | | | | |
| Exhibit Number | Exhibit |
| * Third Amendment to Trust Agreement No. 1 between Cliffs Natural Resources Inc. (f/k/a Cleveland-Cliffs Inc) and KeyBank National Association, Trustee, entered into and effective as of July 28, 2014 (filed as Exhibit 10.15 to Cliffs’ Form 10-K for the period ended December 31, 2014 and incorporated herein by reference). |
| * Amended and Restated Trust Agreement No. 2, effective as of October 15, 2002, by and between Cleveland-Cliffs Inc and KeyBank National Association, Trustee, with respect to Executive Agreements and Indemnification Agreements with the Company’s Directors and certain Officers, the Company’s Severance Pay Plan for Key Employees, and the Retention Plan for Salaried Employees (filed as Exhibit 10.14 to Cliffs’ Form 10-K for the period ended December 31, 2011 and incorporated herein by reference). |
| * Second Amendment to Amended and Restated Trust Agreement No. 2 between Cliffs Natural Resources Inc. (f/k/a Cleveland-Cliffs Inc) and KeyBank National Association, Trustee, entered into and effective as of December 31, 2008 (filed as Exhibit 10(aa) to Cliffs’ Form 10-K for the period ended December 31, 2008 and incorporated herein by reference). |
| * Third Amendment to Amended and Restated Trust Agreement No. 2 between Cliffs Natural Resources Inc. (f/k/a Cleveland-Cliffs Inc) and KeyBank National Association, Trustee, entered into and effective as of July 28, 2014 (filed as Exhibit 10.18 to Cliffs’ Form 10-K for the period ended December 31, 2014 and incorporated herein by reference). |
| * Trust Agreement No. 7, dated as of April 9, 1991, by and between Cleveland-Cliffs Inc and KeyBank National Association, Trustee, with respect to the Cleveland-Cliffs Inc Supplemental Retirement Benefit Plan (filed as Exhibit 10.23 to Cliffs’ Form 10-K for the period ended December 31, 2011 and incorporated herein by reference). |
| * First Amendment to Trust Agreement No. 7, by and between Cleveland-Cliffs Inc and KeyBank National Association, Trustee, dated as of March 9, 1992 (filed as Exhibit 10.24 to Cliffs’ Form 10-K for the period ended December 31, 2011 and incorporated herein by reference). |
| * Second Amendment to Trust Agreement No. 7, dated November 18, 1994, by and between Cleveland-Cliffs Inc and KeyBank National Association, Trustee (filed as Exhibit 10.25 to Cliffs’ Form 10-K for the period ended December 31, 2011 and incorporated herein by reference). |
| * Third Amendment to Trust Agreement No. 7, dated May 23, 1997, by and between Cleveland-Cliffs Inc and KeyBank National Association, Trustee (filed as Exhibit 10.26 to Cliffs’ Form 10-K for the period ended December 31, 2011 and incorporated herein by reference). |
| * Fourth Amendment to Trust Agreement No. 7, dated July 15, 1997, by and between Cleveland-Cliffs Inc and KeyBank National Association, Trustee (filed as Exhibit 10.27 to Cliffs’ Form 10-K for the period ended December 31, 2011 and incorporated herein by reference). |
| * Amendment to Exhibits to Trust Agreement No. 7, effective as of January 1, 2000, by and between Cleveland-Cliffs Inc and KeyBank National Association, Trustee (filed as Exhibit 10.28 to Cliffs’ Form 10-K for the period ended December 31, 2011 and incorporated herein by reference). |
| * Sixth Amendment to Trust Agreement No. 7 between Cliffs Natural Resources Inc. (f/k/a Cleveland-Cliffs Inc) and KeyBank National Association, Trustee, entered into and effective as of December 31, 2008 (filed as Exhibit 10(oo) to Cliffs’ Form 10-K for the period ended December 31, 2008 and incorporated herein by reference). |
| * Seventh Amendment to Trust Agreement No. 7 between Cliffs Natural Resources Inc. (f/k/a Cleveland-Cliffs Inc) and KeyBank National Association, Trustee, entered into and effective as of July 28, 2014 (filed as Exhibit 10.34 to Cliffs’ Form 10-K for the period ended December 31, 2014 and incorporated herein by reference). |
| * Trust Agreement No. 10, dated as of November 20, 1996, by and between Cleveland-Cliffs Inc and KeyBank National Association, Trustee, with respect to the Cleveland-Cliffs Inc Nonemployee Directors’ Compensation Plan (filed as Exhibit 10.36 to Cliffs’ Form 10-K for the period ended December 31, 2011 and incorporated herein by reference). |
| *First Amendment to Trust Agreement No. 10 between Cliffs Natural Resources Inc. (f/k/a Cleveland-Cliffs Inc) and KeyBank National Association, Trustee, entered into and effective as of December 31, 2008 (filed as Exhibit 10(ww) to Cliffs’ Form 10-K for the period ended February 26, 2009 and incorporated herein by reference). |
| | | | | |
Exhibit
Number | Exhibit |
| * Second Amendment to Trust Agreement No. 10 between Cliffs Natural Resources Inc. (f/k/a Cleveland-Cliffs Inc) and KeyBank National Association, Trustee, entered into and effective as of July 28, 2014 (filed as Exhibit 10.45 to Cliffs’ Form 10-K for the period ended December 31, 2014 and incorporated herein by reference). |
| * Separation and Release Agreement, by and between Maurice D. Harapiak and Cleveland-Cliffs Inc., effective April 22, 2022 (filed as Exhibit 10.1 to Cliffs' Form 10-Q for the period ended June 30, 2022 and incorporated herein by reference). |
| * Letter Agreement, by and between Lourenco Goncalves and Cliffs Natural Resources Inc., signed as of September 11, 2014 (filed as Exhibit 10.1 to Cliffs’ Form 8-K/A on September 16, 2014 and incorporated herein by reference). |
| | | | | |
| Exhibit Number | Exhibit |
| * Cleveland-Cliffs Inc and Subsidiaries Management Performance Incentive Plan Summary, effective January 1, 2004 (filed as Exhibit 10.47 to Cliffs’ Form 10-K for the period ended December 31, 2011 and incorporated herein by reference). |
| * Cliffs Natural Resources Inc. 2017 Executive Management Performance Incentive Plan effective January 1, 2017 (filed as Exhibit 10.2 to Cliffs' Form 8-K on April 27, 2017 and incorporated herein by reference). |
| * Cliffs Natural Resources Inc. Amended and Restated 2012 Incentive Equity Plan (filed as Exhibit 10.1 to Cliffs’ Form 8-K on August 4, 2014 and incorporated herein by reference). |
| * Form of Cliffs Natural Resources Inc. Amended and Restated 2012 Incentive Equity Plan Non-Qualified Stock Option Award Memorandum (3-Year Vesting – January 2015 Grant) and Stock Option Award Agreement (filed as Exhibit 10.69 to Cliffs’ Form 10-K for the period ended December 31, 2014 and incorporated herein by reference). |
| * Cliffs Natural Resources Inc. 2015 Equity and Incentive Compensation Plan (filed as Exhibit 10.1 to Cliffs’ Form 8-K on May 21, 2015 and incorporated herein by reference). |
| * Cliffs Natural Resources Inc. Amended and Restated 2015 Equity and Incentive Compensation Plan (filed as Exhibit 10.1 to Cliffs’ Form 8-K on April 27, 2017 and incorporated herein by reference). |
| * Form of Cleveland-Cliffs Inc. Amended and Restated 2015 Equity and Incentive Compensation Plan Restricted Stock Unit Award Memorandum and Restricted Stock Unit Award Agreement (filed as Exhibit 10.2 to Cliffs’ Form 10-Q for the period ended March 31, 2018 and incorporated herein by reference). |
| * Form of Cleveland-Cliffs Inc. Amended and Restated 2015 Equity and Incentive Compensation Plan Performance Share Award Memorandum and Performance Share Award Agreement (filed as Exhibit 10.3 to Cliffs’ Form 10-Q for the period ended March 31, 2018 and incorporated herein by reference). |
| * Form of Cleveland-Cliffs Inc. Amended and Restated 2015 Equity and Incentive Compensation Plan Cash Incentive Award Memorandum (TSR) and Cash Incentive Award Agreement (TSR) (filed as Exhibit 10.4 to Cliffs’ Form 10-Q for the period ended March 31, 2018 and incorporated herein by reference). |
| * Cleveland-Cliffs Inc. 2021 Equity and Incentive Compensation Plan (filed as Exhibit 10.1 to Cliffs’ Form 8-K on April 30, 2021 and incorporated herein by reference). |
| * Form of Cleveland-Cliffs Inc. 2021 Equity and Incentive Compensation Plan Restricted Stock Unit Award Memorandum and Restricted Stock Unit Award Agreement (filed as Exhibit 10.1 to Cliffs’ Form 10-Q for the period ended March 31, 2022 and incorporated herein by reference). |
| * Form of Cleveland-Cliffs Inc. 2021 Equity and Incentive Compensation Plan Performance Share Award Memorandum (TSR) and Performance Share Award Agreement (filed as Exhibit 10.2 to Cliffs’ Form 10-Q for the period ended March 31, 2022 and incorporated herein by reference). |
| * Form of Cleveland-Cliffs Inc. 2021 Equity and Incentive Compensation Plan Cash Incentive Award Memorandum (TSR) and Cash Incentive Award Agreement (TSR) (filed as Exhibit 10.3 to Cliffs’ Form 10-Q for the period ended March 31, 2022 and incorporated herein by reference). |
| * Form of Cleveland-Cliffs Inc. 2021 Equity and Incentive Compensation Plan Restricted Stock Unit Award Memorandum and Restricted Stock Unit Award Agreement (filed as Exhibit 10.1 to Cliffs’ Form 10-Q for the period ended March 31, 2023 and incorporated herein by reference). |
| * Form of Cleveland-Cliffs Inc. 2021 Equity and Incentive Compensation Plan Performance Share Award Memorandum (TSR) and Performance Share Award Agreement (filed as Exhibit 10.2 to Cliffs’ Form 10-Q for the period ended March 31, 2023 and incorporated herein by reference). |
| * Form of Cleveland-Cliffs Inc. 2021 Equity and Incentive Compensation Plan Cash Incentive Award Memorandum (TSR) and Cash Incentive Award Agreement (TSR) (filed as Exhibit 10.3 to Cliffs’ Form 10-Q for the period ended March 31, 2023 and incorporated herein by reference). |
| * Cleveland-Cliffs Inc. Supplemental Retirement Benefit Plan (as Amended and Restated effective October 26, 2021) (filed as Exhibit 10.40 to Cliffs’ Form 10-K for the period ended December 31, 2021 and incorporated herein by reference). |
| * Amendment No. 1 to Cleveland-Cliffs Inc. Supplemental Retirement Benefit Plan, dated December 14, 2023 (filed herewith). |
| Asset-Based Revolving Credit Agreement, dated as of March 13, 2020, among Cleveland-Cliffs Inc., the lenders party thereto from time to time and Bank of America, N.A., as administrative agent (filed as Exhibit 10.1 to Cliffs’ Form 10-Q for the period ended March 31, 2020 and incorporated herein by reference). |
| First Amendment to Asset-Based Revolving Credit Agreement, dated as of March 27, 2020, among Cleveland-Cliffs Inc., the lenders party thereto from time to time and Bank of America, N.A., as administrative agent (filed as Exhibit 10.2 to Cliffs’ Form 10-Q for the period ended March 31, 2020 and incorporated herein by reference). |
| Second Amendment to Asset-Based Revolving Credit Agreement, dated as of December 9, 2020, among Cleveland-Cliffs Inc., the lenders party thereto from time to time and Bank of America, N.A., as administrative agent (filed as Exhibit 10.42 to Cliffs’ Form 10-K for the period ended December 31, 2020 and incorporated herein by reference). |
| Third Amendment to Asset-Based Revolving Credit Agreement, dated as of December 17, 2021, among Cleveland-Cliffs Inc., the lenders party thereto from time to time and Bank of America, N.A., as administrative agent (filed as Exhibit 10.1 to Cliffs’ Form 8-K on December 23, 2021 and incorporated herein by reference). |
| Fourth Amendment to Asset-Based Revolving Credit Agreement, dated as of June 9, 2023, among Cleveland-Cliffs Inc., the lenders party thereto from time to time and Bank of America, N.A., as administrative agent (filed as Exhibit 10.3 to Cliffs’ Form 10-Q for the period ended June 30, 2023 and incorporated herein by reference). |
| Subsidiaries of the Registrant (filed herewith). |
| Schedule of the obligated group, including the parent and issuer and the subsidiary guarantors that have guaranteed the obligations under the 6.750% 2026 Senior Secured Notes, the 5.875% 2027 Senior Notes, the 7.000% 2027 Senior Notes, the 9.875% 20254.625% 2029 Senior Secured Notes, the 4.625% 20296.750% 2030 Senior Notes and the 4.875% 2031 Senior Notes issued by Cleveland-Cliffs Inc. (filed herewith). |
| | | | | |
| Exhibit Number | Exhibit |
| Consent of Independent Registered Public Accounting Firm (filed herewith). |
| | | | | |
Exhibit
Number | Exhibit |
| Consent of SLR International Corporation regarding Hibbing Taconite Property, Minnesota, USA (filed as Exhibit 23.1 to Cliffs’ Form 8-K on February 11, 2022 and incorporated herein by reference)herewith). |
| Consent of SLR International Corporation regarding Minorca Property, Minnesota, USA (filed as Exhibit 23.2 to Cliffs’ Form 8-K on February 11, 2022 and incorporated herein by reference)herewith). |
| Consent of SLR International Corporation regarding Northshore Property, Minnesota, USA (filed as Exhibit 23.3 to Cliffs’ Form 8-K on February 11, 2022 and incorporated herein by reference)herewith). |
| Consent of SLR International Corporation regarding United Taconite Property, Minnesota, USA (filed as Exhibit 23.4 to Cliffs’ Form 8-K on February 11, 2022 and incorporated herein by reference)herewith). |
| Consent of SLR International Corporation regarding Tilden Property, Michigan, USA (filed herewith). |
| Power of Attorney (filed herewith). |
| Certification Pursuant to 15 U.S.C. Section 7241, as Adopted Pursuant to Section 302 of the Sarbanes-Oxley Act of 2002, signed and dated by Lourenco Goncalves as of February 11, 20228, 2024 (filed herewith). |
| Certification Pursuant to 15 U.S.C. Section 7241, as Adopted Pursuant to Section 302 of the Sarbanes-Oxley Act of 2002, signed and dated by Celso L. Goncalves Jr. as of February 11, 20228, 2024 (filed herewith). |
| Certification Pursuant to 18 U.S.C. Section 1350, as Adopted Pursuant to Section 906 of the Sarbanes-Oxley Act of 2002, signed and dated by Lourenco Goncalves, Chairman, President and Chief Executive Officer of Cleveland-Cliffs Inc., as of February 11, 20228, 2024 (filed herewith). |
| Certification Pursuant to 18 U.S.C. Section 1350, as Adopted Pursuant to Section 906 of the Sarbanes-Oxley Act of 2002, signed and dated by Celso L. Goncalves Jr., Executive Vice President, Chief Financial Officer of Cleveland-Cliffs Inc., as of February 11, 20228, 2024 (filed herewith). |
| Mine Safety Disclosures (filed herewith). |
| Technical Report Summary on the Hibbing Taconite Property, Minnesota, USA, prepared for the Company by SLR International Corporation with an effective date of December 31, 2021 (filed as Exhibit 96.1 to Cliffs’ Form 8-K on February 11, 2022 and incorporated herein by reference). |
| Technical Report Summary on the Minorca Property, Minnesota, USA, prepared for the Company by SLR International Corporation with an effective date of December 31, 2021 (filed as Exhibit 96.2 to Cliffs’ Form 8-K on February 11, 2022 and incorporated herein by reference). |
| Technical Report Summary on the Northshore Property, Minnesota, USA, prepared for the Company by SLR International Corporation with an effective date of December 31, 2021 (filed as Exhibit 96.3 to Cliffs’ Form 8-K on February 11, 2022 and incorporated herein by reference). |
| Technical Report Summary on the United Taconite Property, Minnesota, USA, prepared for the Company by SLR International Corporation with an effective date of December 31, 2021 (filed as Exhibit 96.4 to Cliffs’ Form 8-K on February 11, 2022 and incorporated herein by reference). |
| Technical Report Summary on the Tilden Property, Michigan, USA, prepared for the Company by SLR International Corporation with an effective date of December 31, 2021 (filed as Exhibit 96.5 to Cliffs’ Form 10-K for the period ended December 31, 2021 and incorporated herein by reference). |
| Cleveland-Cliffs Inc. Compensation Clawback Policy, effective October 2, 2023 (filed herewith). |
| 101 | The following financial information from Cleveland-Cliffs Inc.'s Annual Report on Form 10-K for the year ended December 31, 20212023 formatted in Inline XBRL (Extensible Business Reporting Language) includes: (i) the Statements of Consolidated Financial Position, (ii) the Statements of Consolidated Operations, (iii) the Statements of Consolidated Comprehensive Income, (iv) the Statements of Consolidated Cash Flows, (v) the Statements of Consolidated Changes in Equity, and (vi) Notes to the Consolidated Financial Statements. |
| 104 | The cover page from this Annual Report on Form 10-K, formatted in Inline XBRL. |
_______________
*Indicates management contract or other compensatory arrangement.
| | | | | |
| Item
| ITEM 16. | Form FORM 10-K SummarySUMMARY |
None.
SIGNATURES
Pursuant to the requirements of Section 13 or 15(d) of the Securities Exchange Act of 1934, the registrant has duly caused this report to be signed on its behalf by the undersigned, thereunto duly authorized.
| | | | | | | | | | | | | | | | | | | | |
| | | CLEVELAND-CLIFFS INC. |
| | | | |
| | | By: | | /s/ K. A. Floriani |
| | | | | Name: | Kimberly A. Floriani |
| | | | | Title: | Senior Vice President, Controller &
Chief Accounting Officer |
| Date: | February 11, 20228, 2024 | | | | | |
Pursuant to the requirements of the Securities Exchange Act of 1934, this report has been signed below by the following persons on behalf of the registrant and in the capacities and on the dates indicated.
| | | | | | | | | | | | | | | | | |
| Signatures | Title | Date |
| | |
| /s/ C. L. Goncalves | Chairman, President and
Chief Executive Officer
(Principal Executive Officer) | February 11, 20228, 2024 |
| C. L. Goncalves |
|
| /s/ C. L. Goncalves Jr. | Executive Vice President,
Chief Financial Officer
(Principal Financial Officer) | February 11, 20228, 2024 |
| C. L. Goncalves Jr. |
|
| /s/ K. A. Floriani | Senior Vice President, Controller
& Chief Accounting Officer
(Principal Accounting Officer) | February 11, 20228, 2024 |
| K. A. Floriani |
|
| * | Director | February 11, 20228, 2024 |
| J. T. Baldwin |
| Director | |
| R. A. Bloom |
| * | Director | February 11, 20228, 2024 |
| R. P. Fisher, Jr. |
| * | Director | February 11, 20228, 2024 |
| W. K. Gerber |
| * | Director | February 11, 20228, 2024 |
| S. M. Green |
| * | Director | February 11, 20228, 2024 |
| R. S. Michael, III |
| * | Director | February 11, 20228, 2024 |
| J. L. Miller |
| * | Director | February 11, 20228, 2024 |
| G. Stoliar |
| * | Director | February 11, 20228, 2024 |
| D. C. Taylor |
| * | Director | February 11, 20228, 2024 |
| A. M. Yocum |
* The undersigned, by signing his name hereto, does sign and execute this Annual Report on Form 10-K pursuant to a Power of Attorney executed on behalf of the above-indicated directors of the registrant and filed herewith as Exhibit 24 on behalf of the registrant.
| | | | | |
| By: | /s/ C. L. Goncalves Jr. |
| (C. L. Goncalves Jr., as Attorney-in-Fact) |