
UNITED STATES
SECURITIES AND EXCHANGE COMMISSION
Washington, D.C. 20549
____________________________________________________________________________
FORM 10-K
(Mark One)
x | |
ANNUAL REPORT PURSUANT TO SECTION 13 OR 15(d) OF THE SECURITIES EXCHANGE ACT OF 1934 |
For the fiscal year ended
OR
¨ | |
TRANSITION REPORT PURSUANT TO SECTION 13 OR 15(d) OF THE SECURITIES EXCHANGE ACT OF 1934 |
For the transition period from to
Commission file number
1-9595______________________________________________________________

BEST BUY CO., INC.
(Exact name of registrant as specified in its charter)
Minnesota | 41-0907483 | |
State or other jurisdiction of incorporation or organization | (I.R.S. Employer Identification No.) | |
7601 Penn Avenue South Richfield, Minnesota | 55423 (Zip Code) | |
(Address of principal executive offices) |
(612) 291-1000
(Registrant’s telephone number, including area code 612-291-1000
Securities registered pursuant to Section 12(b) of the Act:
Title of each class | Trading Symbol | Name of |
Common Stock, $0.10 par value | BBY | New York Stock Exchange |
Securities registered pursuant to Section 12(g) of the Act:
Indicate by check mark if the registrant is not required to file reports pursuant to Section 13 or Section 15(d) of the Act.
Indicate by check mark whether the registrant (1) has filed all reports required to be filed by Section 13 or 15(d) of the Securities Exchange Act of 1934 during the preceding 12 months (or for such shorter period that the registrant was required to file such reports), and (2) has been subject to such filing requirements for the past 90 days.
Indicate by check mark whether the registrant has submitted electronically and posted on its corporate website, if any, every Interactive Data File required to be submitted and posted pursuant to Rule 405 of Regulation S-T (§ 232.405 of this chapter) during the preceding 12 months (or for such shorter period that the registrant was required to submit and post such files).
Indicate by check mark whether the registrant is a large accelerated filer, an accelerated filer, a non-accelerated filer, or a smaller reporting company, or an emerging growth company. See the definitions of "large“large accelerated filer," "accelerated filer"” “accelerated filer,” “smaller reporting company,” and "smaller reporting company"“emerging growth company” in Rule 12b-2 of the Exchange Act. (Check one):
Large Accelerated Filer | Accelerated Filer | Non-accelerated Filer | |||||
Smaller Reporting Company | Emerging Growth Company | ||||||
If an emerging growth company, indicate by check mark if the registrant has elected not to use the extended transition period for complying with any new or revised financial accounting standards provided pursuant to Section 13(a) of the Exchange Act.
Indicate by check mark whether the registrant has filed a report on and attestation to its management’s assessment of the effectiveness of its internal control over financial reporting under Section 404(b) of the Sarbanes-Oxley Act (15 U.S.C. 7262(b)) by the registered public accounting firm that prepared or issued its audit report.
If securities are registered pursuant to Section 12(b) of the Act, indicate by check mark whether the financial statements of the registrant included in the filing reflect the correction of an error to previously issued financial statements.
Indicate by check mark whether any of those error corrections are restatements that required a recovery analysis of incentive-based compensation received by any of the registrant’s executive officers during the relevant recovery period pursuant to §240.10D-1(b).
Indicate by check mark whether the registrant is a shell company (as defined in Rule 12b-2 of the Act)
The aggregate market value of the voting and non-voting common equity held by non-affiliates of the registrant as of July 29, 2016,28, 2023, was approximately $7.8$14.1 billion, computed by reference to the price of $33.60$82.90 per share, the price at which the common equity was last sold on July 29, 2016,28, 2023, as reported on the New York Stock Exchange-Composite Index. (For purposes of this calculation, all of the registrant'sregistrant’s directors and executive officers are deemed affiliates of the registrant.)
As of March 20, 2017,13, 2024, the registrant had 309,110,840215,381,395 shares of its Common Stockcommon stock, $0.10 par value per share, issued and outstanding.
DOCUMENTS INCORPORATED BY REFERENCE
Portions of the registrant's definitiveDefinitive Proxy Statement relating to its 20172024 Regular Meeting of Shareholders ("Proxy Statement") are incorporated by reference into Part III. The Proxy Statement will be filed with the U.S. Securities and Exchange Commission within 120 days after the end of the fiscal year to which this report relates.
CAUTIONARY STATEMENT PURSUANT TO THE
PRIVATE SECURITIES LITIGATION REFORM ACT OF 1995
Section 27A of the Securities Act of 1933, as amended ("(“Securities Act"Act”), and Section 21E of the Securities Exchange Act of 1934, as amended ("(“Exchange Act"Act”), provide a "safe harbor"“safe harbor” for forward-looking statements to encourage companies to provide prospective information about their companies. With the exception of historical information, the matters discussed in this Annual Report on Form 10-K are forward-looking statements and may be identified by the use of words such as "anticipate," "assume," "believe," "estimate," "expect," "intend," "foresee," "outlook," "plan," "project,"“anticipate,” “appear,” “approximate,” “assume,” “believe,” “continue,” “could,” “estimate,” “expect,” “foresee,” “guidance,” “intend,” “may,” “might,” “outlook,” “plan,” “possible,” “project” “seek,” “should,” “would,” and other words and terms of similar meaning.meaning or the negatives thereof. Such statements reflect our current view with respect to future events and are subject to certain risks, uncertainties and assumptions. A variety of factors could cause our future results to differ materially from the anticipated results expressed in such forward-looking statements. Readers should review Item 1A,
BEST BUY FISCAL 20172024 FORM 10-K
TABLE OF CONTENTS
| . | . | 4 | ||
8 | ||||
18 | ||||
| . | 18 | |||
20 | ||||
20 | ||||
| . | 21 | |||
22 | ||||
| . | . | 23 | ||
23 | ||||
34 | ||||
35 | ||||
64 | ||||
64 | ||||
64 | ||||
Disclosure Regarding Foreign Jurisdictions that Prevent Inspections. | 65 | |||
65 | ||||
65 | ||||
65 | ||||
65 | ||||
65 | ||||
65 | ||||
65 | ||||
65 | ||||
67 | ||||
| . | ||||
68 | ||||
PART I
Item 1. Business.
Unless the context otherwise requires, the use of the terms "we," "us"“we,” “us” and "our"“our” in this Annual Report on Form 10-K refersrefer to Best Buy Co., Inc. and, as applicable, its consolidated subsidiaries. Any references to our website addresses do not constitute incorporation by reference of the information contained on the websites.
Description of Business
We were incorporated in the state of Minnesota in 1966. Today, weWe are driven by our purpose to enrich lives through technology and our vision to personalize and humanize technology solutions for every stage of life. We accomplish this by leveraging our unique combination of tech expertise and a leading provider of technology products, services and solutions. We offer these products and serviceshuman touch to customers whomeet our customers’ everyday needs, whether they come to us online, visit our stores engage with Geek Squad agents or use our websites or mobile applications.invite us into their homes. We have operations in the U.S., Canada and Mexico.
Segments and Geographic Areas
We have two reportable segments: Domestic and International. The Domestic segment is comprised of theour operations in all states, districts and territories of the U.S., under various and our Best Buy Health business, and includes the brand names including Best Buy, bestbuy.com, Best Buy Mobile,Ads, Best Buy Direct,Business, Best Buy Express,Health, CST, Current Health, Geek Squad, Lively, Magnolia, Home Theater and Pacific Kitchen and Home.
Operations
Our Domestic and International segments are managed by leadership teams responsible for all areas of the business. Both segments operate an omni-channelomnichannel platform that providesallows customers the ability to shop when and where they want.
Development of merchandise and servicesservice offerings, pricing and promotions, procurement and supply chain, online and mobile application operations, marketing and advertising and labor deployment across all channels are centrally managed at our corporate headquarters.managed. In addition, support capabilities (for example, human resources, finance, information technology and real estate management) are generally performed atoperate from our corporate headquarters. We also have field operations that support retail, services and in-home teams from our corporate headquarters and regional locations. Our retail stores have procedures for inventory management, asset protection, transaction processing, customer relations, store administration, product sales and services, staff training and merchandise display that are largely standardized within each store brand.standardized. All stores within each store brand generally operate under standard procedures with a degree of flexibility for store management to address certain local market characteristics.
Our Canada and Mexico store operations are similar to those in our Domestic segment.
Merchandise and Services
Our Domestic and International segments have offerings in six revenue categories: Consumer Electronics, Computing and Mobile Phones, Entertainment, Appliances, Services and Other.categories. The key components of each revenue category are as follows:
Computing and Mobile Phones
- computing (including desktops, notebooks andConsumer Electronics - digital imaging, health and fitness products, home theater (including home theater accessories, soundbars and televisions), portable audio (including headphones and portable speakers) and smart watches)home;
Appliances - large appliances (including dishwashers, laundry, ovens and e-readers;
Entertainment
- drones, gaming (including hardware, peripherals andServices - major appliances (for example, refrigeration, dishwashers, ovens, laundry, etc.) and small appliances (for example, coffee makers, blenders, etc.);
Other
-Distribution
Customers within our Domestic Segment
Suppliers and Inventory
Our Domestic and International segments purchase merchandise from a variety of suppliers. In fiscal 2017,2024, our 20 largest suppliers accounted for approximately 77%80% of the merchandise we purchased, with five suppliers – Apple, Samsung, HP, Sony Hewlett-Packard, and LG Electronics – representing approximately 53%55% of total merchandise purchased. We generally do not have long-term written contracts with our vendors that would require them to continue supplying us with merchandise or that secure any of the key terms of our arrangements.
We carefully monitor and manage our inventory levels in an effort to match quantities on hand with consumer demand as closely as possible. Key elements to our inventory management process include the following: continuous monitoring of historical and projected consumer demand, continuous monitoring and adjustment of inventory receipt levels and pricing, agreements with vendors relating to reimbursement for the cost of markdowns or sales incentives, and agreements with vendors relating to return privileges for certain products.
We also have a global sourcing operation to design, develop, test and contract-manufacture our exclusive brandbrands products.
Store Development
We had approximately 1,200 large-format and 400 small-format1,125 stores at the end of fiscal 20172024 throughout our Domestic and International segments. Our stores are a vital component of our omni-channelomnichannel strategy, and representwe believe they are an important competitive advantage. In the U.S., weWe also have the ability to ship from all of our Best Buy stores. Customers may also elect to pick up orders initiated online in any of our stores. In recent years, we have opened vendor store-within-a-store concepts to allow closer vendor partnershippartnerships and a betterhigher quality customer experience. In fiscal 2018 and beyond, we will continue toWe continuously look for opportunities to optimize our store space, renegotiatingrenegotiate leases and selectively openingopen or closingclose locations to support our operations.
Refer to Item 7,
Management's Discussion and Analysis of Financial Condition and Results of Operations, for tables reconciling our Domestic and International segment stores open at the end of each of the last three fiscal years.Intellectual Property
We own or have the right to use valuable intellectual property such as trademarks, service marks and tradenames,trade names, including, but not limited to,
We have secured domestic and international trademark and service mark registrations for many of our brands. We have also secured patents for many of our inventions. We believe our intellectual property has significant value and is an important factor in the marketing of our company, our stores, our products and our websites.
Seasonality
Our business, like that of many retailers, is seasonal. A higherlarge proportion of our revenue and earnings is generated in the fiscal fourth quarter, which includes the majority of the holiday shopping season in the U.S., Canada and Mexico.
Working Capital
We fund our business operations through a combination of available cash and cash equivalents short-term investments and cash flows generated from operations. In addition, our revolving credit facilities are available for additional working capital needs, for general corporate purposes, and investmentinvestments and growth opportunities. Our working capital needs typically increase in the months leading up to the holiday shopping season as we purchase inventory in advance of expected sales.
Competition
Our competitors are primarily multi-channel retailers, internet-basede-commerce businesses, technology service providers, traditional store-based retailers, and vendors and mobile network carriers who offer their products and services directly to customers. We believe our ability to deliver a high qualityhelp customers online, in our stores and in their homes, and to connect technology product and solutions with customer experience offersneeds, provide us a key competitive advantage.advantages. Some of our competitors have lowlower cost operating structures and seek to compete for sales primarily on price. In addition, in the U.S., online-only operators are exempt from collecting sales taxes in certain states. We believe this advantage will continue to be eroded as sales tax rules are re-evaluated at both the state and federal levels. We carefully monitor pricing offered by other retailers and service providers, as maintaining price competitiveness is one of our ongoing priorities. In addition, we have a price-matching policy in the U.S.policies that allowsallow customers to request that we match a price offered by certain retail storestores and online operators. In order to allow this, we are focused on maintaining efficient operations and leveraging the economies of scale available to us through our global vendor partnerships. We believe our dedicated and knowledgeable people,people; our integrated online, retail and retail assets,in-home assets; our broad and curated product assortment,assortment; our strong vendor relationships, range of focusedpartnerships; our service and support offerings designed to solve real customer needs; our unique ability to showcase technology in distinct store formats, brand marketing strategiesformats; and our supply chain are important ways in which we maintain our competitive advantage.
Environmental and Social
As we pursue our purpose to enrich lives through technology, we are committed to having a positive impact on the world, the environment and the communities in which we operate through interactions with all of our stakeholders, including our customers, employees, vendor partners, community partners and shareholders.
The Nominating, Corporate Governance and Public Policy Committee of our Board of Directors (“Board”) advises and oversees management regarding the effectiveness and risks of our environmental, social and governance strategy, programs and initiatives, including environmental goals and progress, social responsibility programs, initiatives and public policy positions and advocacy.
Environmental
We are committed to propelling the circular economy forward, a system that aims to reduce waste and preserve resources. We focus on our highest-impact areas, including in our operations, through the energy we procure and through the products we sell.
In our operations, we strive to reduce the use of natural resources. We believe the following focus areas will help to reduce the use of natural resources and our impact on the environment while improving our efficiency and profitability:
In our ongoing efforts to reduce carbon emissions in our operations, we support energy efficiency programs, including investments in energy efficiency improvements, deploying small-scale onsite and utility-scale renewable energy systems and neutralizing residual emissions.
We monitor our water consumption across our business to identify and manage programs that lessen our dependence on water.
To reduce waste and maximize resource efficiency, we continue our efforts to build a more sustainable supply chain by focusing on certifying our warehousing operations as TRUE zero waste.
Our focus on sustainable products is centered on helping our customers reduce their impact on the environment through the products we sell. We do this advantage.
We also support the circular economy by keeping consumer products in use for as long as possible through our repair and trade-in services. We put materials back into the manufacturing process when products reach the end of their lives through our electronics and appliance recycling program.
Social
Human Rights and Responsible Sourcing
We are committed to respecting and advancing human rights through our alignment with the United Nations Guiding Principles on Business and Human Rights. Further, across all the products and services we procure, we seek to enhance our partnership with suppliers and create value for all stakeholders through our Responsible Sourcing Program. We are active members of the Responsible Business Alliance, which allows us to partner with many of the brands we sell, including Apple, Intel, Microsoft and Samsung. Collectively, we embrace a common Supplier Code of Conduct and audit methodology that seeks to improve working and environmental conditions in the supply chain.
Community Impact
Best Buy is committed to positively impactinghelping prepare teens from disinvested communities for the environmenttech-reliant careers of the future. Employee volunteer programs like Geek Squad Academy spark excitement and interest in technology for young learners, while engaging our communities. employees’ unique technical expertise.
Best Buy also serves as a fiscal sponsor of the Best Buy Foundation™, whose signature Best Buy Teen Tech Center® program consists of a network of youth-centered community hubs where teens can engage with the latest technology, learn career skills, and interact with safe and supportive mentors. As of February 3, 2024, the Best Buy Foundation™ supported a network of 59 Best Buy Teen Tech Center® locations across the U.S. and Canada, working toward a goal of supporting 100 locations.
Human Capital Management
We believe that effectively managing our environmental impacts, setting sustainability goals and advancing energy-efficient consumer solutions create long-term value for allin the power of our stakeholders.
Inclusion, Diversity and Equity
We are proud and encouraged by what we have accomplished collectively to expand inclusion, diversity and equity at Best Buy over the past few years. Now we are evolving our sourcing officestrategic focus to advance four specific outcomes:
Employee Engagement: We want Best Buy employees to feel connected to the company’s values, vision and purpose, and have opportunities to thrive.
Retention: Best Buy seeks to establish and uphold a best-in-class retention approach across all demographics.
Representation: We aim to provide Best Buy employees from diverse backgrounds with equal opportunities at all levels in China. We considerthe organization.
Culture of Belonging: Best Buy endeavors to foster an environment where employees feel welcomed and can build strong relationships through demonstrating our employee relationsinclusive behaviors: vulnerability, empathy, courage and grace.
The Compensation and Human Resources Committee of our Board supports the development of an inclusive and diverse culture through oversight of our human resources policies and program. The Nominating, Corporate Governance and Public Policy Committee of our Board recommends criteria for the selection of individuals to be good. considered as candidates for election to the Board.
Training and Development
We offercontinue to invest in our employees and their skill development to enable customized learning experiences. This helps to create a wide arraymore adaptable and resilient workforce and enhances our competitive advantage. With the continued goal of company-paidpersonalizing learning opportunities, we transitioned to offering new types of training experiences in fiscal 2024. This included side-by-side trainings, enabling employees to learn and grow alongside their peers and leaders in condensed training formats.
Examples of enhancements include:
We evolved the onboarding experience, optimizing this for new employees. We also created new, consistent onboarding experiences in our supply chain, services teams, call centers and project teams.
We built an internal program to apply industry-leading learning methodologies and focused on building enterprise leaders who are more equipped to lead through times of uncertainty and change, while growing and transforming Best Buy for the future.
Employee Benefits
Our benefits aim to support employees’ overall well-being. In fiscal 2024, we continued our focus on:
Caregiver support benefits through Joshin, a support system for employees and their loved ones with a focus on disabilities and neurodivergence;
Caregiver support benefits that vary withinenable employees to receive personalized help in a time of great need through Wellthy, a program that helps with emergency housing, healthcare, substance abuse, complex eldercare issues and other moments of crisis;
Pay continuation (paid leave) and caregiver pay so employees can care for themselves and their loved ones;
Parental leave that provides qualifying employees up to 10 weeks at 100% pay;
Dedicated support through Included Health, a benefit that connects members to culturally competent providers who understand the unique needs of their community;
Access to physical and mental health virtual visits;
Emergency assistance through the HOPE Fund – Helping Our People in Emergencies – in equal partnership with the Richard M. Schultze Family Foundation, providing employees in hardship situations an opportunity to receive up to $2,500 in financial assistance;
Mental health, including our company duecommitment to customary localraise awareness about mental health, equipping employees with training to notice issues in themselves or others, and then find help; and
Tuition assistance, including the expansion of our partnership schools giving eligible employees the opportunity to earn a degree with no out-of-pocket costs.
The Compensation and Human Resources Committee of our Board oversees risks related to our human capital management through its regular review of our practices, policies and statutory requirements,programs, which we believeincludes overall employee wellness and engagement in these areas, employee benefit plan compliance, leadership succession planning and wage, retention and hiring programs.
For more information on environmental and social matters, as well as human capital management, please see Best Buy’s Fiscal 2024 Corporate Responsibility and Sustainability Report expected to be published later this year, at https://corporate.bestbuy.com/sustainability. This website and the report are competitive locallynot part of this Annual Report on Form 10-K and in the aggregate relative to others in our industry.are not incorporated by reference herein.
Available Information
We are subject to the reporting requirements of the Securities Exchange Act of 1934 (the "Exchange Act") and its rules and regulations. The Exchange Act requires us to file reports, proxy statements and other information with the U.S. Securities and Exchange Commission ("SEC"(“SEC”). We make available, free of charge on our website, our Annual Reports on Form 10-K, Quarterly Reports on Form 10-Q, Current Reports on Form 8-K, proxy statements and amendments to these reports filed or furnished pursuant to Section 13(a) or 15(d) of the Exchange Act, as soon as reasonably practicable after we electronically file these documents with, or furnish them to, the SEC. These documents are posted on our website at
We also make available, free of charge on our website, our Amended and Restated Articles of Incorporation, Amended and Restated By-laws, the Corporate Governance Principles of our Board of Directors ("Board") and our Code of Business Ethics adopted by our Board, as well as the charters of all of our Board's committees: Audit Committee; Compensation and Human Resources Committee; Finance and Investment Policy Committee; and Nominating, Corporate Governance and Public Policy Committee. These documents are posted on our website at
Copies of any of the above-referenced documents will also be made available, free of charge, upon written request to Best Buy Co., Inc. Investor Relations Department at 7601 Penn Avenue South, Richfield, MN 55423-3645.
Website and Social Media Disclosure
We disclose information to the public concerning Best Buy, Best Buy’s products, content and services and other items through our websites in order to achieve broad, non-exclusionary distribution of information to the public. Some of the information distributed through this channel may be considered material information. Investors and others are encouraged to review the information we make public in the locations below.* This list may be updated from time to time.
For information concerning Best Buy and its products, content and services, please visit: https://bestbuy.com.
For information provided to the investment community, including news releases, events and presentations, and filings with the SEC, please visit: https://investors.bestbuy.com.
For the latest information from Best Buy, including press releases, please visit: https://corporate.bestbuy.com/archive/.
* These corporate websites, and the contents thereof, are not incorporated by reference into this Annual Report on Form 10-K nor deemed filed with the SEC.
Item 1A. Risk Factors.
Described below are certain risks that we believe apply to our business and the industry in which we operate. You should carefully consider eachThe risks are categorized using the following headings: external, strategic, operational, regulatory and legal, and financial and market. Each of the following risk factors should be carefully considered in conjunction with other information provided in this Annual Report on Form 10-K and in our other public disclosures. The risks described below highlight potential events, trends or other circumstances that could adversely affect our business, financial condition, results of operations, cash flows, liquidity, or access to sources of financing and, consequently, the market value of our common stock and debt instruments. These risks could cause our future results to differ materially from historical results and from guidance we may provide regarding our expectations of future financial performance. The risks described below are not an exhaustive list of all the risks we face. There may be others that we have not identified or that we have deemed to be immaterial. All forward-looking statements made by us or on our behalf are qualified by the risks described below.
External Risks
Macroeconomic pressures, including, but not limited to, the current geopolitical climate, may adversely affect consumer spending and our financial results.
To varying degrees, our products and services are sensitive to changes in macroeconomic conditions that impact consumer spending. As a result, consumers may be affected in many ways, including, for example:
whether or not they make a purchase;
their choice of brand, model or price-point;
how frequently they upgrade or replace their devices; and
their appetite for complementary services (for example, My Best Buy Plus™ or My Best Buy Total™ membership).
Real GDP growth, inflation (including wage inflation), consumer confidence, phasing out of public-health-emergency supports, employment levels, oil prices, interest, tax and foreign currency exchange rates, availability of consumer financing, housing market conditions, limitations on a government’s ability to borrow and/or spend capital, cost of living (e.g., food, fuel), any recession (and resulting corresponding declines in consumer sentiment) and other macroeconomic trends can adversely affect consumer demand for the products and services that we offer. In addition to general levels of inflation, we are also subject to risks of specific inflationary pressures on product prices due to, for example, high consumer demand and supply chain disruptions. We may be unable to increase our prices sufficiently to offset these pressures.
Geopolitical issues around the world and how our markets are positioned can also impact macroeconomic conditions and could have a material adverse impact on our financial results. These issues include, but are not limited to, the following:
The conflict in Ukraine has exacerbated global geopolitical tensions, and may continue to significantly impact fuel prices, inflation, the global supply chain, cybersecurity and other macroeconomic conditions, which may further adversely affect global economic growth, consumer confidence and demand for our products and services. Russia is a significant global producer of both fuel and raw materials used in certain products we sell, including nickel, aluminum and copper. Disruptions in the markets for those inputs, or other inputs produced by Russia, whether due to sanctions, market pressure to avoid purchasing inputs from Russia or otherwise, could increase overall material costs for many of the products we sell. We cannot predict the extent or duration of sanctions in response to the conflict in Ukraine, nor can we predict the effects of legislative or other governmental actions or regulatory scrutiny of Russia, its allies or other countries with which Russia has significant trade or financial ties, including China.
Further deterioration of relations between Taiwan and China, the resulting actions taken, the response of the international community and other factors affecting trade with China or political or economic conditions in Taiwan could disrupt the manufacturing of products or hardware components in the region, such as semiconductors and television panels sourced from Taiwan or the broader array of products sourced from China.
The Israel-Hamas War has heightened geopolitical tensions in the Middle East region. Additionally, attacks on cargo ships in the Red Sea, catalyzed by the Israel-Hamas War, have disrupted Red Sea shipping lanes and may continue to disrupt global trade flows and impact shipping capacity.
One or more of these factors could have a material adverse effect on our supply chain, the cost of our products or our revenues and financial results.
Catastrophic events, including the effects of climate change, could adversely affect our operating results.
The risk or actual occurrence of various catastrophic events could have a material adverse effect on our financial performance. Events that affect our properties, supply chain, partners, workforce or customers may consist of, or be caused by, for example:
natural disasters or extreme weather events (such as earthquakes, floods, fires and droughts), including those related to, or exacerbated by, climate change;
diseases or pandemics;
power loss, telecommunications failures, or software or hardware malfunctions; or
terrorism (including related cyber threats), civil unrest, violent acts or other conflicts.
In recent years, we observed an increase in the number and severity of certain catastrophic events in many of our markets. Such events can adversely affect our workforce and prevent employees and customers from reaching our stores and properties. Additionally, heightened social unrest and violence and crime in or around our stores, customer homes or businesses where we are performing services may further jeopardize the safety and security of our workforce and customers. Catastrophic events can also disrupt or disable portions of our supply chain, distribution network and third-party business operations that may impact our ability to procure goods or services required for business operations at the quantities and levels we require. Finally, such events can also affect our information technology systems, resulting in disruption to various aspects of our operations, including our ability to transact with customers and fulfill orders. The adverse effects of any such catastrophic event would be exacerbated if experienced at the same time as another unexpected and adverse event, such as a pandemic.
Three of our largest states by total sales (California, Texas and Florida) are areas where natural disasters and extreme weather conditions have been, and could continue to be, more prevalent. Natural disasters and climate-related events in those states and other areas where our sales and operations are concentrated could result in significant physical damage to or closure of our stores, distribution centers or other facilities.
Further, current events associated with social injustice or inequality, along with the ensuing social activism, tension and potential for violence, may impact our workforce, customers, properties and the communities where we operate. If our customers and employees do not perceive our response to be appropriate or adequate for a particular region or for our company as a whole, we could suffer damage to our reputation and brand, which could adversely affect our business. As a consequence of these or other catastrophic events, we may experience interruption to our operations or losses of property, equipment and/or inventory, which could adversely affect our revenue and profitability.
Many of the products we sell are highly susceptible to technological advancement, product life cycle fluctuations and changes in consumer preferences.
We operate in a highly, increasingly dynamic industry sector fueled by constant technological innovation and disruption, including most recently by the proliferation of artificial intelligence (“AI”) technologies. These factors manifest in a variety of ways: the emergence of new products and categories, the rapid maturation of categories, cannibalization of categories, changing price points and product replacement and upgrade cycles.
This rapid pace of change can be hard to predict and manage. If we fail to interpret, predict and react to these changes in a timely and effective manner, the consequences may include, but are not limited to:
failure to offer the products and services that our customers want;
excess inventory, which may require heavy discounting or liquidation;
inability to secure adequate access to brands or products for which consumer demand exceeds supply;
delays in adapting our merchandising, marketing or supply chain capabilities to accommodate changes in product trends; and
damage to our brand and reputation.
These and other similar factors could have a material adverse impact on our revenue and profitability.
Strategic Risks
We face strong competition from multi-channel retailers, e-commerce businesses, technology service providers, traditional store-based retailers, and vendors and mobile network carriers, that offer their products and services directly to customers, which directly affects our revenue and profitability.
While we constantly strive to offer consumers the best value, the retail businesssector is highly competitive. Price is of great importance to most customers, and price transparency and comparability continues to increase, particularly as a result of digital technology. The ability ofincrease. Digital technology enables consumers to compare prices on a real-time basis, putsputting additional pressure on us to maintain competitive prices. We compete with many other local, regional, national and international retailers (both online and technology service providers,brick and mortar), as well as certainsome of our vendors and mobile network carriers that offermarket their products directly to consumers. Some of our competitors have greater financial resources than usCompetition is becoming increasingly diverse, including in the advertising revenue space and may also result from new entrants into the markets we serve, including unforeseen players that may be able to offer lower prices than us for a sustained period of time. more aggressively leverage technologies (for example AI and platform integrations).
The retail industrysector continues to experience a trend towards an increase inincreased sales initiated online and using mobile applications, and some online-only businesses have lower operating costs than us and are not required to collect and remitas well as online sales taxes in all U.S. states, which can negatively impact the ability of multi-channel retailers to be price competitive on a tax-included basis.for both in-store or curbside pick-up. Online and multi-channel retailers continue to focus on delivery services, with customers increasingly seeking faster, guaranteed delivery times and low-pricelow-cost or free shipping. Our ability to beoffer competitive on delivery times and delivery costs depends on many factors and our failure to successfully manage these factors and offer competitive delivery options could negatively impact the demand for our products and our profit margins. Because our business strategy is based on offering superior levels of customer service and a full range of services to complement the products we offer, our cost structure ismight be higher than some of our competitors, and this, in conjunction with price transparency, putscould put pressure on our margins.
If we fail to interpret, predictattract, retain and reactengage qualified employees, our operations and profitability may be negatively impacted. In addition, changes in market compensation rates could adversely affect our profitability.
Our performance is highly dependent on attracting, retaining and engaging appropriately qualified employees in our stores, service centers, distribution centers, field and corporate offices. Our strategy of offering high-quality services and assistance for our customers requires a highly trained and engaged workforce. The turnover rate in the retail sector is relatively high and there is an ongoing need to these factorsrecruit and train new employees. Factors that affect our ability to maintain sufficient numbers of qualified employees include, for example, employee engagement, our reputation, unemployment rates, competition from other employers, availability of qualified personnel and our ability to offer appropriate compensation and benefit packages. Failure to recruit or retain qualified employees may impair our efficiency and effectiveness and our ability to pursue growth opportunities. In addition, significant turnover of our executive team or other employees in key positions with specific knowledge relating to our operations and industry may negatively impact our operations.
We operate in a timelycompetitive labor market and effective manner,there is a risk that market increases in compensation and employer-provided benefits could have a material adverse effect on our profitability. We may also be subject to continued market pressure to increase employee hourly wage rates and increased cost pressure on employer-provided benefits. Our need to implement corresponding adjustments within our labor model and compensation and benefit packages could have a material adverse impact on the consequences can include:
Our strategy to expand into new products and services that our customers want;
We are introducing new products and services, particularly in the health sector, into new market areas. As these are new technologies for new markets, the first product and service iterations may require heavy discountingfurther invention and refinement. Our customers may not like our new value propositions. These offerings may present persistent technology and regulatory challenges and we may be subject to claims if customers of these offerings experience service disruptions, failures or liquidation;
This expanded risk increases the complexity of our business and places significant responsibility on our management, employees, operations, systems, technical expertise, financial resources and internal financial and regulatory control and reporting functions. Our emerging initiatives may subject us to significant laws or regulations. For example:
We navigate a regulated medical device environment, including oversight by various government and regulatory agencies including, but not limited to, the U.S. Food and Drug Administration (“FDA”).
We participate in government healthcare programs including, but not limited to, Medicaid as a provider of Personal Emergency Response System (“PERS”) devices and services.
Sales of Lively mobile phones and service plans subjects us to regulation as a telecommunications provider, including Federal Communications Commission (“FCC”) oversight.
The collection, storage, use and disclosure of personal information, subjects us to privacy and security requirements. Notably, portions of the health business are subject to the Health Insurance Portability and Accountability Act (“HIPAA”) and certain of Current Health’s international operations are subject to the UK’s General Data Protection Regulation (“GDPR,” as retained in UK law). State data privacy laws are also rapidly changing, such as Washington’s new My Health, My Data Act with a private right of action, raising new considerations and challenges.
Non-compliance with conditions imposed by regulatory authorities related to any of the above activities may lead to a range of consequences, including, but not limited to, customer complaints, individual consumer claims or class actions, product recalls, temporary bans on products, stoppages at production facilities, orders to stop providing services, remediation costs, corrective action plans, fines, penalties, regulatory enforcement actions, potential loss of business and impairment of our ability to continue participation in government healthcare programs, any of which could adversely affect our operations, financial results and reputation.
Our focus on services exposes us to certain risks that could have a material adverse impact on our revenue, profitability and reputation.
We offer a full range of services that complement our product offerings, including consultation, delivery, design, installation, memberships, protection plans, repair, set-up, technical support and health, safety and caregiving monitoring and support. Designing, marketing and executing these services is subject to incremental risks. These risks include, for example:
sustained increase in consumer desire to purchase product offerings online and through mobile applications, impacting our ability to sell ancillary services;
increased labor expense to fulfill our customer promises;
increased pressure on margins from our Best Buy membership offerings, and the risk that increased volumes will not fully compensate for lower margins, or for loss of revenue and profit from revenue streams that are now included as benefits;
pressure on traditional labor models to meet the evolving landscape of offerings and customer needs;
use of third-party services that fail to meet our standards or fail to comply with applicable labor and independent contractor regulations, leading to potential reputational damage and liability risk;
increased risk of errors or omissions in the fulfillment of services;
unpredictable extended warranty failure rates and related expenses;
employees in transit using company vehicles to visit customer locations and employees being present in customer homes, which may increase our scope of liability;
the potential for increased scope of liability relating to managed services offerings;
employees having access to customer devices, including the information held on those devices, which may increase our responsibility for the security of those devices and the privacy of the data they hold;
operational failures arising from growing demands on existing technological infrastructure;
the engagement of third parties to assist with aspects of construction and installation and the potential responsibility for their actions;
the risk that in-home services could be more adversely impacted by inclement weather, health and safety concerns and catastrophic events; and
increased risk of non-compliance with new laws and regulations applicable to these services.
Our reliance on key vendors and mobile network carriers subjects us to various risks and uncertainties which could affect our revenue and profitability.
We source the products we sell from a wide variety of domestic and international vendors. In fiscal 2017,2024, our 20 largest suppliers accounted for approximately 77%80% of the merchandise we purchased, (75% in fiscal 2016), with 5five suppliers – Apple, Samsung, HP, Sony Hewlett-Packard, and LG Electronics –- representing approximately 53%55% of total merchandise purchased (51% in fiscal 2016).purchased. We generally do not have long-term written contracts with our vendors that would require them to continue supplying us with merchandise. Our profitability depends on us securing acceptable terms with our vendors for, among other things, the price of merchandise we purchase from them, funding for various forms of promotional programs, payment terms, allocations of merchandise, development of compelling assortments of products, operation of vendor-focused shopping experiences within our stores and terms covering returns and factory warranties. ToWhile we believe we offer capabilities that these vendors value and depend upon to varying degrees, our vendors may be able to leverage their competitive advantages -- for example, their own stores or online channels, their financial strength, the strength of their brandbrands with customers their own stores or online channels or their relationships with other retailers -- to our commercial disadvantage. The potential adverse impact of these factors can be amplified by price transparency (which which can limit our flexibility to modify selling prices)prices and a highly competitive retail environment. Generally, our ability to negotiate favorable terms with our vendors is more difficult with vendors wherewhen our purchases represent a smaller proportion of their total revenues consequently impactingand/or when there is less competition for those products. In addition, vendors may decide to limit or cease allowing us to offer certain categories, focus their marketing efforts on alternative channels or make unfavorable changes to our profitability from such vendor relationships.financial or other terms.
We are also dependent on a relatively small number of mobile carriers to allow us to offer mobile devices with carrier connections. The competitive strategies utilized by mobile network carriers can have a material impact on our business.business, especially with ongoing consolidation in the mobile industry. For example, if carriers change the structure of customer contracts, customer upgrade terms, customer qualification requirements, monthly fee plans, cancellation fees or service levels, the volume of upgrades and new contracts we sign with customers may be reduced, adversely affecting our revenuesrevenue and profitability. In addition, our carriers may also may serve customers through their own stores, websites, mobile applications and call centers or through other competing retail channels. Carriers may decide to cease allowing us to offer their contracts or certain categories of their contracts, focus their marketing efforts on alternative channels or make unfavorable changes to our commissions or other terms. Each of these factors could have a materially adverse impact on our revenue and profitability.
Demand for the products and services we sell could decline if we fail to maintain positive brand perception and recognition.
We operate a portfolio of brands with a commitment to customer service and innovation. We believe that recognition and the reputation of our company and our brands are key to our success. Operational factors, such as failure to deliver high quality services, uncompetitive pricing, failure to meet delivery promises or business interruptions, could damage our reputation. External factors, such as negative public remarks or accusations, or our failure to meet enhanced expectations on corporate response to sensitive topics, could also be damaging. Third parties may commit fraud (including AI-driven fraud) while using our brand without our permission, possibly harming brand perception or reputation. The ubiquity of social media means that customer feedback and other information about our company are shared with a broad audience in a manner that is easily accessible and rapidly disseminated. Damage to the perception or reputation of our brands could result in, among other things, declines in revenues and customer loyalty, decreases in gift card and service plan sales, lower employee retention and productivity and vendor relationship issues, all of which could materially adversely affect our revenue and profitability.
Failure to effectively manage strategic ventures, alliances or acquisitions could have a highly-competitive and ever-changing commercial environment. Our success is dependentnegative impact on our abilitybusiness.
We may decide to identify, developenter into new joint ventures, partnerships, alliances or acquisitions with third parties (collectively, “new ventures”). Assessing the viability of new ventures is typically subject to significant uncertainty, and executethe success of such new ventures can be adversely affected by many factors, including, for example:
different and incremental business and other risks of the new venture not identified in our diligence assessments;
failure to attract, motivate and retain key employees of the new venture;
uncertainty of forecasting financial performance;
failure to integrate aspects of the new venture into our existing business, such as new product or service offerings or information technology systems;
failure to maintain appropriate strategies within this environment. Strategies that have proved successfulinternal controls over financial reporting;
failure to generate expected synergies, such as cost reductions;
unforeseen changes in the past may not be successfulbusiness environment of the new venture;
disputes or strategic differences with key employees or other third-party participants in the future. Our current strategy includes continuous improvementnew venture; and
adverse impacts on relationships with vendors and other key partners of our existing business or the new venture.
If our new or emerging strategic ventures are unsuccessful, our liquidity and the pursuit of new growth opportunities. It is possible that our strategies may be ineffective and that we may need to make substantial changes to them in the future. It is also possible that we will be unsuccessful in executing our strategies or that they expose us to additional risks. Our resultsprofitability could be materially adversely affected, ifand we failmay be required to developrecognize material impairments to goodwill and execute appropriate strategies. The market valueother assets acquired. New ventures may also divert our financial resources and management’s attention from other important areas of our common stock and debt instruments could be materially adversely affected if investors are uncertain about the appropriateness of our strategies or our ability to execute them.
Failure to effectively manage our real estate portfolio may negatively impact our operating results.
Effective management of our real estate portfolio is critical to our multi-channelomnichannel strategy. Failure to identify and secure suitable locations for our stores and other facilities could impair our ability to compete successfully and our profitability. Most of our properties are subject to long-term leases.leased under multi-year contracts. As such, it is essential that we effectively evaluate a range of factors that may influence the success of our long-term real estate strategy. Such factors include, for example:
changing patterns of customer consumption and behavior, particularly in light of an evolving omni-channelomnichannel environment;
our ability to adjust store operating models to adapt to these changing patterns;
the location and appropriate number of stores, supply chain and other facilities in our portfolio;
the formatsinterior layout, format and sizessize of our stores;
the locations of our stores;
the interior layouts of our stores;
the primary term lease commitment for each store;
the occupancy cost of our stores relative to market rents;
If we fail to effectively evaluate these factors or negotiate appropriate terms, or if unforeseen changes arise, the consequences could include, for example:
closing stores and abandonabandoning the related assets, while retaining the financial commitments of the leases;
incurring significant costs to remodel or transform our stores;
operating stores, supply chain or service locations that no longer meet the needs of our business; and
bearing excessive lease expenses.
These consequences could have a materiallymaterial adverse impact on our profitability, cash flows and liquidity.
For leased property, the financial impact of exiting a location can vary greatly depending on, among other factors, the terms of the lease, the condition of the local real estate market, demand for the specific property, our ability to fulfill our maintenance and repair obligations, our relationship with the landlord and the availability of potential sub-lease tenants. It is difficult for us to influence some of these factors and the costs of exiting a property can be significant. In addition to rent, we are stilltypically responsible for the maintenance, taxes, insurance and common area maintenance charges for vacant properties until the lease commitment expires or is terminated. Similarly, when we enter into a contract with a tenant to sub-lease property, we usually retain our obligations as the master lessor.lessee. This leaves us at risk for any remaining liability in the event of default by the sub-lease tenant.
Operational Risks
Interruptions and other factors affecting our stores and supply chain, including in-bound deliveries from our vendors, may adversely affect our business.
Our stores and supply chain assets are a critical part of our operations, particularly considering industry trends and initiatives, such as ship-from-store and the emphasis on fast delivery when purchasing online. We depend on our vendors’ abilities to deliver products to us at the right location, at the right time and in the right quantities. We also depend on third parties for the operation of certain aspects of our supply chain network. The factors that can adversely affect these aspects of our operations include, but are not limited to:
interruptions to our delivery capabilities;
failure of third parties to meet our standards or commitments;
disruptions to our systems and the need to implement new systems;
limitations in capacity;
global supply chain impacts that could hinder third parties’ ability to meet our demand for product volumes and timing;
increased levels of inventory loss due to organized crime, theft or damage;
risk to our employees and customers arising from burglary or robbery from our stores or other facilities;
consolidation or business failures in the transportation and distribution sectors;
labor strikes, slow-downs, labor shortages or unionization, including as a result of an increasingly competitive job market, affecting our stores or impacting ports or any other aspect of our supply chain;
diseases, pandemics, outbreaks and other health-related concerns; and
increasing transportation costs, including increases related to geopolitical, labor actions and environmental events (for example, droughts impacting Panama Canal shipping capacity).
It is important that we maintain optimal levels of inventory in each store and distribution center and respond rapidly to shifting demands. Any disruption to, or inefficiency in, our supply chain network, whether due to geopolitical conflicts or catastrophic events, could damage our revenue and profitability. The risks associated with our dependence on third parties are greater for small parcel home deliveries because of the relatively small number of carriers with the scope and capacity required by our business. The continuing growth of online purchases for delivery increases our exposure to these risks. If we fail to manage these risks effectively, we could experience a material adverse impact on our reputation, revenue and profitability.
We utilize third-party vendors for certain aspects of our operations, and any material disruption in our relationships or their services may have an adverse impact on our business.
We engage key third-party business partners to support various functions of our business, including, but not limited to, delivery and installation, customer warranty, information technology, web hosting and cloud-based services, customer loyalty programs, promotional financing and customer loyalty credit cards, gift cards, technical support, transportation, insurance programs and human resource operations. Any material disruption in our relationships with key third-party business partners or any disruption in the services or systems provided or managed by third parties could impact our revenues and cost structure and hinder our operations, particularly if a disruption occurs during peak revenue periods.
Our exclusive brands products are subject to several additional product, supply chain and legal risks that could affect our operating results.
Sales of our exclusive brands products, which include the Best Buy Essentials, Dynex, Insignia, Modal, Platinum, Rocketfish, Yardbird and Lively brands, represent an important component of our product offerings and our revenue and profitability. Most of these products are manufactured by contract manufacturers in China and Southeast Asia. This arrangement exposes us to the following additional potential risks, which could have a material adverse effect on our operating results:
we have greater exposure and responsibility to consumers for warranty replacements and repairs as a result of exclusive brands product defects, and our recourse to contract manufacturers for such warranty liabilities may be limited in foreign jurisdictions;
we may be subject to regulatory compliance and/or product liability claims relating to personal injury, death or property damage caused by exclusive brands products, some of which may require us to take significant actions, such as product recalls;
we may experience disruptions in manufacturing or logistics in the future due to inconsistent and unanticipated order patterns, our inability to develop long-term relationships with key manufacturers, diseases or pandemics, ongoing and unforeseen natural disasters or geopolitical crises;
we may not be able to locate manufacturers that meet our internal standards, whether for new exclusive brands products or for migration of the manufacturing of products from an existing manufacturer;
we may be subject to a greater risk of inventory obsolescence as we do not generally have return-to-vendor rights;
we are subject to developing and often-changing labor and environmental laws for the manufacturing of products in foreign countries, and we may be unable to conform to new rules or interpretations in a timely manner;
we may be subject to claims by technology or other intellectual property owners if we inadvertently infringe upon their patents or other intellectual property rights or if we fail to pay royalties owed on our exclusive brands products;
our operations may be disrupted by trade disputes or excessive tariffs, including any future trade disputes or future phases of trade negotiations with China and we may not be able to source alternatives quickly enough to avoid interruptions in product supply; and
we may be unable to obtain or adequately protect patents and other intellectual property rights on our exclusive brands products or manufacturing processes.
Maintaining consistent quality, availability and competitive pricing of our exclusive brands products helps us build and maintain customer loyalty, generate revenue and achieve acceptable margins. Failure to maintain these factors could have a significant adverse impact on the demand for exclusive brands products and the profits we are able to generate from them.
We are subject to risks associated with vendors that source products outside of the U.S.
Our ability to find qualified vendors who can supply products in a timely and efficient manner that meet our internal standards of quality and safety can be difficult, especially with respect to goods sourced from outside the U.S. Risks such as political or economic instability, cross-border trade restrictions or tariffs, merchandise quality issues, product safety concerns, work stoppages, human rights violations, port delays, foreign currency exchange rate fluctuations, transportation capacity and costs, inflation, civil unrest, natural disasters, outbreaks of pandemics and other factors relating to foreign trade are beyond our control. Vendors may also fail to invest adequately in design, production or distribution facilities and may reduce their customer incentives, advertising and promotional activities or change their pricing policies. These and other related issues could have a material adverse impact on our financial results.
We rely heavily on our information technology systems for our key business processes. Any failure or interruption in these systems could have a material adverse impact on our business.
The effective and efficient operation of our business is dependent on our information technology systems and those of our information technology vendors. We rely heavily on these information technology systems to manage all key aspects of our business, including demand forecasting, purchasing, supply chain management, point-of-sale processing, services fulfillment (including, for example, our Urgent Response service provided by Best Buy Health), staff planning and deployment, financial management, reporting and forecasting and safeguarding critical and sensitive information.
Our information technology systems and those of our partners are subject to damage or interruption from power outages, computer and telecommunications failures, computer viruses, worms, other malicious computer programs, denial-of-service attacks, security breaches (through cyber-attacks and other malicious actions, including ransomware and phishing attacks), the implementation of AI technologies, catastrophic events (such as fires, tornadoes, earthquakes and hurricanes) and usage errors by our employees. While we have adopted, and continue to enhance, business continuity and disaster recovery plans and strategies, there is no guarantee that such plans and strategies will be effective, which could interrupt the functionality of our information technology systems or those of third parties. The failure or interruption of these information systems, data centers, cloud platforms or their backup systems could significantly disrupt our business and cause higher costs and lost revenues and could threaten our ability to remain in operation.
As we continue to migrate more systems to the cloud, we may face additional risks that may compromise our security or disrupt our business capabilities, including ensuring the proper configuration, the unknowns of operating more workloads in the cloud, securing systems in the cloud and the types of cloud-based services we leverage.
We face a heightened risk of cybersecurity attacks or data security incidents and are more dependent on internet and telecommunications access and capabilities.
We utilize complex information technology platforms to operate our websites and mobile applications. If we fail to secure these systems against attacks, or fail to effectively upgrade and maintain our hardware, software, network, and system infrastructure and improve the efficiency and resiliency of our systems, it could cause system interruptions and delays. Disruptions to these services, such as those caused by unforeseen traffic levels, malicious attacks by governments, criminals or other non-state actors, other technical difficulties or events outside of our control, such as natural disasters, power or telecommunications failures or loss of critical data, could prevent us from accepting and fulfilling customer orders for products or services, which could cause us to forgo material revenues, incur material costs and could adversely affect our reputation.
Further, as our online interactions and sales have increased and have become critical to our growth, and as many employees now use hybrid or full-time remote-working arrangements, the risk of any interruption of our information technology system capabilities is heightened, as well as the risk that customer demand exceeds the capacity of our online operations. Any such interruption or capacity constraint could result in a deterioration of our ability to process online sales, provide customer service or perform other necessary business functions.
The integration of AI into our operations increases cybersecurity and privacy risks (including unauthorized or misuse of AI tools) and could lead to potential unauthorized access, misuse, acquisition, release, disclosure, alteration or destruction of company and customer data or other confidential or proprietary information and challenge the stability of our platforms. Further, threat actors may leverage AI to engage in automated, targeted and coordinated attacks of our systems.
Failure to prevent or effectively respond to a breach of the privacy or security of our customer, employee, vendor or company information could expose us to substantial costs and reputational damage, as well as litigation and enforcement actions.
Our business involves the collection, use and storage of personal information, including payment card information and protected health information, as well as confidential information regarding our employees, vendors and other company information. We also share personal and confidential information with suppliers and other third parties and we use third-party technology and systems that process and transmit information for a variety of activities. We have been the target of attempted cyber-attacks and other security threats and we may be subject to breaches of our information technology systems. While we engage in significant data-protection efforts, criminal activity, such as cyber-attacks, lapses in our controls or the intentional or negligent actions of employees, business associates or third parties, may undermine our privacy and security measures. As a result, unauthorized parties may obtain access to our data systems and misappropriate company, employee, third party or customer information, or authorized parties may use or share personal information in an inappropriate manner or otherwise seek to extract financial gain based on access to, or possession of, company, employee or customer information. Furthermore, because the methods used to obtain unauthorized access change frequently and may not be immediately detected, and given the potentially disruptive nature of emerging technologies (including AI), we may be unable to anticipate such attacks or promptly and effectively respond to them. Any compromise of our customer information or other confidential information could have a material adverse effect on our reputation or our relationships with our customers and partners, which may in turn, have a negative impact on our revenue and may expose us to material costs, penalties and claims.
Sensitive customer data may also be present on customer-owned devices entrusted to us for service and repair. Vulnerable code on products sold or serviced, including our exclusive brands, may also result in a compromise of customer privacy or security. If our efforts to protect against such compromises and ensure appropriate handling of customer data on devices we manufacture, sell and service are not effective, this may result in potential liability and damage to our customer relationships.
Increasing costs associated with information security and privacy, such as increased investment in technology and qualified staff, costs of compliance, costs resulting from fraud or criminal activity and costs of cyber and privacy insurance, could cause our business and results of operations to suffer materially. Additionally, newly applicable and potential new or significantly revised state, provincial and federal laws and regulations in the jurisdictions in which we do business are expanding our obligations to protect and honor the privacy and security of customer data, requiring additional resources and creating incremental risk arising from a potential breach or compliance failure. In addition, any compromise of our data security may materially increase the costs we incur to protect against such breaches and could subject us to additional legal risk.
Product safety and quality concerns could have a material adverse impact on our revenue and profitability.
If the products we sell fail to meet, or are alleged to fail to meet, applicable safety standards or our customers’ expectations regarding safety and quality, we could be exposed to increased legal risk and damage to our reputation. Failure to take appropriate actions in relation to product-related issues (for example, product recalls), could lead to violations of laws and regulations and leave us susceptible to government enforcement actions or private litigation. Recalls of products, particularly when combined with lack of available alternatives or difficulty in sourcing sufficient volumes of replacement products, could also have a material adverse impact on our revenue and profitability.
Changes to labor or employment laws or regulations could have an adverse impact on our costs and impair the viability of our operating model.
As an employer of more than 85,000 people in many jurisdictions, we are subject to risks related to employment laws and regulations including, for example:
the organization of unions and related rules that affect the nature of labor relations, which are frequently reconsidered and modified by the National Labor Relations Board;
laws that impact the relationship between the company and independent contractors and the classification of employees and independent contractors; and
laws that impact minimum wage, sick time, paid leave, non-compete covenants and scheduling requirements that could directly or indirectly increase our payroll costs and/or impact the level of service we are able to provide.
Changes to laws and regulations such as these could adversely impact our reputation, our ability to continue operations and our profitability.
Regulatory and Legal Risks
We are subject to statutory, regulatory and legal developments that could have a material adverse impact on our business.
Our statutory, regulatory and legal environments expose us to complex compliance and litigation risks that could have a material adverse effect on our operations. Some of the most significant compliance and litigation risks we face include, but are not limited to:
the difficulty of complying with sometimes conflicting statutes and regulations in local, national or international jurisdictions;
the potential for unexpected costs related to compliance with new or existing environmental legislation or international agreements affecting energy, carbon emissions, electronics recycling and water or product materials;
the challenges of ensuring compliance with applicable product compliance laws and regulations with respect to both the products we sell and the products we contract to manufacture, including laws and regulations related to product safety and product transport;
the financial, operational and business impact of evolving regulations governing data privacy and security, including limitations on the collection, use or sharing of information; consumer rights to access, delete or limit/opt-out of the use of information; or litigation arising from new private rights of action;
the impact of other new or changing statutes and regulations including, but not limited to, financial reform; National Labor Relations Board rule changes; healthcare reform; contracted worker labor laws; corporate governance matters; escheatment rules; rules governing pricing, content, distribution, copyright, mobile communications, AI deployment or usage, electronic device certification or payment services; and/or other future legislation that could affect how we operate and execute our strategies as well as alter our expense structure;
the impact of litigation, including class-action lawsuits involving consumers and shareholders and labor and employment matters;
the possibility of a federal ban on arbitration clauses in consumer and/or employee contracts, which could increase costs of dispute resolution; and
the impact of changes in the federal executive and legislative branches on the development, or changes in, laws, regulations and policies, such as economic, fiscal, tax, retail, labor and social policies.
The impact of geopolitical tensions, including the potential implementation of more restrictive trade policies, higher tariffs or the renegotiation of existing trade agreements in the U.S. or countries where we sell our products and services or procure products, could have a material adverse effect on our business. In particular, political or trade disputes, or future phases of trade negotiations with China could lead to the imposition of tariffs or other trade actions that could adversely affect our supply chain and our business and could require us to take action to mitigate those effects.
Further, the impact of potential changes in U.S., state or other countries’ tax laws and regulations or evolving interpretations of existing laws, could adversely affect our financial condition and results of operations.
Regulatory activity that affects the retail sector has grown in recent years, increasing the risk of fines and additional operating costs associated with compliance. Additionally, defending against lawsuits and other proceedings may involve significant expense and divert management’s attention and resources from other matters.
Concern over climate change may result in new or additional legal, legislative and regulatory requirements to reduce or mitigate the effects of climate change on the environment, which could result in future tax, compliance, transportation and utility cost increases. Our own climate change-oriented initiatives, such as our attempts to increase energy efficiency during store construction and remodeling, could also increase our costs. In addition, changes to the environment, both long-term and short-term, may affect consumer shopping behavior in a way that negatively impacts our revenue, revenue mix and profitability.
Our business is subject to evolving corporate governance and public disclosure regulations and expectations, including with respect to cybersecurity and corporate responsibility and sustainability matters, that could expose us to numerous risks.
We are subject to changing rules and regulations promulgated by several governmental and self-regulatory organizations, including the SEC, the New York Stock Exchange and the Financial Accounting Standards Board. These rules and regulations continue to evolve in scope and complexity, with many new requirements emerging in response to laws enacted by Congress, demanding increased attention and vigilance for compliance. In addition, regulators, customers, investors, employees and other stakeholders are increasingly focusing on cybersecurity and corporate responsibility and sustainability (“CRS”) matters and related disclosures. These changing rules, regulations and stakeholder expectations have resulted in, and are likely to continue to result in, increased general and administrative expenses and increased management time and attention spent complying with or meeting such regulations and expectations. For example, developing and acting on initiatives within the scope of CRS, and collecting, measuring and reporting CRS-related information and metrics can be costly, difficult and time-consuming and are subject to evolving reporting standards, including the SEC’s final climate-related reporting requirements issued in March 2024 and similar proposals by other international regulatory bodies. We may also communicate certain initiatives and goals regarding environmental matters, diversity, responsible sourcing, social investments and other related matters in our SEC filings or in other public disclosures. These initiatives and goals within the scope of CRS could be difficult and expensive to implement, the technologies needed to implement them may not be cost-effective and may not advance at a sufficient pace and we could be criticized for the accuracy, adequacy or completeness of the disclosure. Further, statements about our initiatives and goals and progress toward those goals, may be based on measurement standards that are still developing, internal controls and processes that continue to evolve and assumptions that are subject to change in the future. In addition, we could be criticized for the scope or nature of such initiatives or goals, or for any revisions to these goals. If our CRS-related data, processes and reporting are incomplete or inaccurate, or if we fail to achieve progress with respect to our goals on a timely basis, or at all, our reputation, business, financial performance and growth could be adversely affected.
Our international activities are subject to many of the same risks as described above, as well as to risks associated with the legislative, judicial, regulatory, political, economic and cultural factors specific to the countries or regions in which we operate.
We operate retail locations in Canada, Current Health operates in the UK, and most of our exclusive brands products are manufactured by contract manufacturers based in Southeast Asia. We also have wholly-owned legal entities registered in various other foreign countries, including Bermuda, China, Hong Kong, Luxembourg, the Republic of Mauritius and the UK. During fiscal 2024, our International segment’s operations generated approximately 8% of our revenue. In general, the risk factors identified above also have relevance to our International operations. Our International operations expose us to additional risks, including those related to, for example:
political conditions and geopolitical events, including war and terrorism;
economic conditions, including monetary and fiscal policies and tax rules, as well as foreign exchange rate risk;
rules governing international trade and potential changes to trade policies or trade agreements and ownership of foreign entities;
government-imposed travel restrictions or warnings and differing responses of governmental authorities to pandemics and other global events;
cultural differences that we may be unable to anticipate or respond to appropriately;
different rules or practices regarding employee relations, including the existence of works councils or unions;
difficulties in enforcing intellectual property rights; and
difficulties encountered in exerting appropriate management oversight to operations in remote locations.
These factors could significantly disrupt our International operations and have a material adverse effect on our revenue and profitability and could lead us to incur material impairments and other exit costs.
Financial and Market Risks
Failure to effectively manage our costs could have a material adverse effect on our profitability.
As discussed above, our revenues are susceptible to volatility from various sources, which can lead to periods of flat or declining revenues. However, some of our operating costs are fixed and/or are subject to multi-year contracts. Some elements of our costs may be higher than our competitors,competitors’ because of, for example, our differentialextended retail footprint and structure, our hourly pay structure, our differentiated service offerings or our levels of customer service. As discussed above, our revenues are susceptible to volatility from various sources, which can lead to periods of flat or declining revenues. Accordingly, our ongoing drive to reduce costcosts and increase efficiency represents a strategic imperative. Failure to successfully manage our costs could have a material adverse impact on our profitability and curtail our ability to fund our growth or other critical initiatives.
We are highly dependent on the cash flows and net earnings we generate during our fiscal fourth quarter, which includes the majority of the holiday shopping season.
A large proportion of our revenue and earnings is generated in the fiscal fourth quarter, which includes the majority of the holiday shopping season. In addition, the holiday shopping season also incorporates many other unpredictable factors, such as the level of competitive promotional activity, new product release activity and customer buying patterns, which makes it difficult to forecast and react to these factors quickly. Unexpected events or developments, such as pandemics, natural or man-made disasters, changes in consumer demand, economic factors, product sourcing issues, cyber-attacks, failure or interruption of management information systems, or disruptions in services or systems provided or managed by third-party vendors could significantly disrupt our operations. As a result of these factors, our fiscal fourth quarter and annual results could be adversely affected.
Economic, regulatory and other developments could adversely affect our ability to offer attractive promotional financing to our customers and adversely affect the profits we generate from these programs.
We offer promotional financing and credit cards issued by third-party banks that manage and directly extend credit to our customers. Customers choosing promotional financing can receive extended payment terms and low- or no-interest financing on qualifying purchases. We believe our financing programs generate incremental revenue from customers who prefer the financing terms to other available forms of payment or otherwise need access to financing in order to make purchases. Approximately 25% of our fiscal 2024 Domestic revenue was transacted using one of the company’s branded cards. In addition, we earn profit-share income and share in any losses from some of our banking partners based on the performance of the programs. Profit-sharing revenue from our credit card arrangement approximated 1.4% of Domestic revenue in fiscal 2024. The income or loss we earn in this regard is subject to numerous factors, including the volume and value of transactions, the terms of promotional financing offers, bad debt rates, credit card delinquency rates, interest rates, the regulatory and competitive environment and expenses of operating the program. Adverse changes to any of these factors could impair our ability to offer these programs to customers and reduce customer purchases and our ability to earn income from sharing in the profits of the programs.
Constraints in the capital markets or our vendor credit terms.
We need sufficient sources of liquidity to fund our working capital requirements, service our outstanding indebtedness and finance business opportunities. Without sufficient liquidity, we could be forced to curtail our operations, or we may not be able to pursue business opportunities. The principal sources of our liquidity are funds generated from operating activities, available cash and liquid investments, credit facilities, other debt arrangements and trade payables. Our liquidity could be materially adversely impacted if our vendors reduce payment terms and/or impose tighter credit limits. If our sources of liquidity do not satisfy our requirements, we may need to seek additional financing. TheWe typically hold material balances of cash, cash equivalents and/or short-term investments and are therefore reliant on banks and other financial institutions to safeguard and allow ready access to these assets. Our future availability of financingliquidity will depend on a variety of factors, such as economic and market conditions, the regulatory environment for and financial stability of banks and other financial institutions, the availability of credit, and our credit ratings and our reputation with potential lenders. These factors could materially adversely affecthave a material adverse effect on our costs of borrowing and our ability to pursue business opportunities and threaten our ability to meet our obligations as they become due.
Changes in our credit ratings may limit our access to capital and materially increase our borrowing costs.
Any future downgrades to our credit ratings and outlook could negatively impact the perception of our credit risk and thus our access to capital markets, borrowing costs, vendor terms and lease terms. Our credit ratings are based upon information furnished by us or obtained by a rating agency from its own sources and are subject to revision, suspension or withdrawal by one or more rating agencies at any time. Rating agencies may change the ratings assigned to us due to developments that are beyond our control, including the introduction of new rating practices and methodologies.
Failure to meet theany financial performance guidance or other forward-looking statements we have providedmay provide to the public could result in a decline in our stock price.
We may provide public guidance on our expected financial results or other forward-looking information for future periods. AlthoughWhen we provide guidance, we believe that this guidance provides investors and analysts with a better understanding of management'smanagement’s expectations for the future and is useful to our existing and potential stockholders,shareholders, but such guidance is comprised of forward-looking statements subject to the risks and uncertainties described in this report and in our other public filings and public statements. Our actual results may not be in line with guidance we have provided. We may not be able to accurately forecast our growth rate and profit margins. We base our expense levels and investment plans on sales estimates. A significant portion of our expenses and investments are fixed, and we may not be able to adjust our spending quickly enough if our sales are less than expected. Our revenue growth may not be sustainable and our percentage growth rates may decrease. Our revenue and operating profit growth depend on the continued growth of demand for the products and services offered by us, and our business is affected by general economic and business conditions worldwide. If our financial results for a particular period
Item 1B. Unresolved Staff Comments.
Not applicable.
Item 1C. Cybersecurity.
We rely heavily on information technology systems to operate and manage all key aspects of our business. We also process substantial volumes of confidential business information and sensitive consumer and employee personal information, which if impacted by cyber threats could result in financial and reputational harms and regulatory sanction. We have developed and implemented, and update on an ongoing basis, a risk-based information security program designed to identify, assess and manage material risks from cybersecurity threats.
Cybersecurity Risk Management and Strategy
Our information security program comprises administrative, technical and physical safeguards designed, under a risk-based approach, to reasonably mitigate cybersecurity risks to the confidentiality, integrity or availability of our information systems and information. These include safeguards designed to oversee service-provider relationships in a manner consistent with the risks presented by the engagement and use of the service provider.
The program deploys multiple layers of controls designed to identify, protect against, detect, respond to and recover from information security and cybersecurity incidents and our Cyber Security Incident Response Team, which is part of our Enterprise Information Protection (“EIP”) organization, plays a core role in detecting, mitigating and remediating cybersecurity incidents. Based on the nature and severity of the incident, our response is to be guided by documented incident response plans. These plans outline steps to be followed, functional areas to be engaged, internal escalations to be pursued (which may include, as appropriate, senior management, executive management and the Board) and stakeholders to be notified.
Third parties also play a role in our cybersecurity. We engage third parties for advice and support in the design and implementation of certain program elements and leverage third-party tools to help identify and mitigate cybersecurity risks. Certain specific, defined components of our technology environment are assessed by third-party auditors with a view to alignment with industry standards such as, for example, the Payment Card Industry Data Security Standards.
We also periodically retain outside expertise to conduct a maturity assessment of our program against industry standards and participants. Our program is informed by industry standards such as, for example, the National Institute of Standards and Technology’s Framework for Improving Critical Infrastructure Cybersecurity (“NIST CSF”), but this does not imply that we meet all technical standards, specifications or requirements under the NIST CSF or other sources.
We have combatted cybersecurity threats in the normal course of business, but prior cybersecurity incidents have not materially affected, and do not appear likely to materially affect, our operations, business strategy, results of operations or financial condition. However, our Enterprise Risk Management program has recognized that we face ongoing risks from cybersecurity threats that, if not successfully prevented or mitigated, could materially affect us, including our operations, business strategy, results of operations or financial condition. For additional information on this risk, see Item 1A, Risk Factors, of this Annual Report on Form 10-K.
Cybersecurity Governance
Our Board, with oversight by the Audit Committee, oversees management’s processes for identifying and mitigating cybersecurity risks. Executive management including our Chief Information Security Officer (“CISO”), who reports to our General Counsel & Chief Risk Officer, updates the Audit Committee on our cybersecurity posture no less frequently than quarterly and periodically update the full Board.
Our EIP organization, led by our CISO, is responsible for the design and implementation of our information security program. Our current CISO has been with the Company for more than eight years—serving as our CISO for nearly seven years—and has extensive cybersecurity experience through leadership and consulting roles. His current leadership team comprising seven individuals has over 130 years of combined cybersecurity experience. These and other EIP team members work closely with stakeholders across the Company to implement the program’s policies, standards and processes and help ensure awareness that securing customer information and honoring our privacy promises are core employee obligations, as highlighted in our Code of Ethics and reinforced through our Valuable Information Protection training program.
Item 2. Properties.
Domestic Segment
The following table summarizes the location and total square footage of our Domestic segment stores at the end of fiscal
U.S. Stores(1) | U.S. Stores(1) | |||||||
Alabama | 11 | Nebraska | 4 | |||||
Alaska | 2 | Nevada | 9 | |||||
Arizona | 21 | New Hampshire | 6 | |||||
Arkansas | 7 | New Jersey | 26 | |||||
California | 130 | New Mexico | 5 | |||||
Colorado | 22 | New York | 45 | |||||
Connecticut | 9 | North Carolina | 32 | |||||
Delaware | 3 | North Dakota | 4 | |||||
District of Columbia | 1 | Ohio | 34 | |||||
Florida | 62 | Oklahoma | 12 | |||||
Georgia | 28 | Oregon | 11 | |||||
Hawaii | 2 | Pennsylvania | 33 | |||||
Idaho | 5 | Puerto Rico | 2 | |||||
Illinois | 41 | Rhode Island | 1 | |||||
Indiana | 22 | South Carolina | 13 | |||||
Iowa | 10 | South Dakota | 2 | |||||
Kansas | 8 | Tennessee | 13 | |||||
Kentucky | 9 | Texas | 101 | |||||
Louisiana | 15 | Utah | 11 | |||||
Maine | 3 | Vermont | 1 | |||||
Maryland | 19 | Virginia | 30 | |||||
Massachusetts | 21 | Washington | 20 | |||||
Michigan | 28 | West Virginia | 5 | |||||
Minnesota | 19 | Wisconsin | 22 | |||||
Mississippi | 7 | Wyoming | 1 | |||||
Missouri | 14 | Total Domestic store count | 965 | |||||
Montana | 3 | Square footage (in thousands) | 36,771 | |||||
(1)Includes 20 Pacific Sales stores, 22 Best Buy Outlet Centers and 22 Yardbird stand-alone stores.
| U.S. Best Buy Stores | U.S. Best Buy Mobile Stand-Alone Stores | Pacific Sales Stores | |||||||
| Alabama | 15 | 3 | — | ||||||
| Alaska | 2 | — | — | ||||||
| Arizona | 23 | 2 | — | ||||||
| Arkansas | 9 | 4 | — | ||||||
| California | 118 | 18 | 28 | ||||||
| Colorado | 21 | 4 | — | ||||||
| Connecticut | 12 | 5 | — | ||||||
| Delaware | 3 | 1 | — | ||||||
| District of Columbia | 2 | — | — | ||||||
| Florida | 64 | 31 | — | ||||||
| Georgia | 28 | 10 | — | ||||||
| Hawaii | 2 | — | — | ||||||
| Idaho | 5 | 2 | — | ||||||
| Illinois | 49 | 11 | — | ||||||
| Indiana | 23 | 10 | — | ||||||
| Iowa | 11 | 1 | — | ||||||
| Kansas | 9 | 3 | — | ||||||
| Kentucky | 9 | 7 | — | ||||||
| Louisiana | 16 | 4 | — | ||||||
| Maine | 4 | — | — | ||||||
| Maryland | 21 | 10 | — | ||||||
| Massachusetts | 24 | 10 | — | ||||||
| Michigan | 32 | 9 | — | ||||||
| Minnesota | 22 | 11 | — | ||||||
| Mississippi | 8 | 1 | — | ||||||
| Missouri | 19 | 9 | — | ||||||
| Montana | 3 | — | — | ||||||
| Nebraska | 5 | 3 | — | ||||||
| Nevada | 10 | 4 | — | ||||||
| New Hampshire | 6 | 3 | — | ||||||
| New Jersey | 27 | 8 | — | ||||||
| New Mexico | 5 | 3 | — | ||||||
| New York | 53 | 13 | — | ||||||
| North Carolina | 32 | 9 | — | ||||||
| North Dakota | 4 | 1 | — | ||||||
| Ohio | 37 | 10 | — | ||||||
| Oklahoma | 13 | 4 | — | ||||||
| Oregon | 12 | 2 | — | ||||||
| Pennsylvania | 37 | 12 | — | ||||||
| Puerto Rico | 3 | — | — | ||||||
| Rhode Island | 1 | — | — | ||||||
| South Carolina | 14 | 4 | — | ||||||
| South Dakota | 2 | 1 | — | ||||||
| Tennessee | 16 | 8 | — | ||||||
| Texas | 103 | 30 | — | ||||||
| Utah | 10 | — | — | ||||||
| Vermont | 1 | — | — | ||||||
| Virginia | 34 | 8 | — | ||||||
| Washington | 19 | 8 | — | ||||||
| West Virginia | 5 | — | — | ||||||
| Wisconsin | 22 | 11 | — | ||||||
| Wyoming | 1 | 1 | — | ||||||
| Total | 1,026 | 309 | 28 | ||||||
| Square footage (in thousands) | 39,662 | 429 | 737 | ||||||
| Average square feet per store (in thousands) | 39 | 1 | 26 | ||||||
| U.S. Best Buy Stores | U.S. Best Buy Mobile Stand- Alone Stores | Pacific Sales Stores | |||||||
| Owned store locations | 25 | — | — | ||||||
| Owned buildings and leased land | 36 | — | — | ||||||
| Leased store locations | 965 | 309 | 28 | ||||||
| Square Footage (in thousands) | ||||||||
| Location | Leased | Owned | ||||||
| Distribution centers | 24 locations in 18 U.S. states | 7,844 | 3,168 | |||||
Geek Squad service centers(1) | Louisville, Kentucky | 237 | — | |||||
Principal corporate headquarters(2) | Richfield, Minnesota | — | 1,452 | |||||
| Territory field offices | 12 locations throughout the U.S. | 109 | — | |||||
| Pacific Sales corporate office space | Torrance, California | 12 | — | |||||
International Segment
The following table summarizes the location and total square footage of our International segment stores at the end of fiscal
Canada Stores(1) | |||
Alberta | 25 | ||
British Columbia | 27 | ||
Manitoba | 4 | ||
New Brunswick | 3 | ||
Newfoundland | 1 | ||
Nova Scotia | 3 | ||
Ontario | 69 | ||
Prince Edward Island | 1 | ||
Quebec | 23 | ||
Saskatchewan | 4 | ||
Total International store count | 160 | ||
Square footage (in thousands) | 3,623 | ||
| Best Buy Stores | Best Buy Mobile Stores | Best Buy Express Stores | ||||||
| Canada | ||||||||
| Alberta | 19 | 9 | — | |||||
| British Columbia | 22 | 9 | — | |||||
| Manitoba | 4 | — | — | |||||
| New Brunswick | 3 | — | — | |||||
| Newfoundland | 1 | — | — | |||||
| Nova Scotia | 3 | 1 | — | |||||
| Ontario | 54 | 29 | — | |||||
| Prince Edward Island | 1 | — | — | |||||
| Quebec | 23 | 5 | — | |||||
| Saskatchewan | 4 | — | — | |||||
| Square footage (in thousands) | 3,783 | 50 | — | |||||
| Average square feet per store (in thousands) | 28 | 1 | — | |||||
| Mexico | ||||||||
| Coahuila | — | — | 1 | |||||
| Estado de Mexico | 3 | — | — | |||||
| Distrito Federal | 7 | — | 3 | |||||
| Guanajuato | 1 | — | — | |||||
| Jalisco | 4 | — | — | |||||
| Nuevo Leon | 2 | — | 1 | |||||
| Michoacan | 1 | — | — | |||||
| Veracruz | 1 | — | — | |||||
| San Luis Potosi | 1 | — | — | |||||
| Square footage (in thousands) | 670 | — | 8 | |||||
| Average square feet per store (in thousands) | 34 | — | 2 | |||||
| Total store count | 154 | 53 | 5 | |||||
(1)
(1)Includes 32 Best Buy Mobile stores.
Ownership Status
The following table summarizes the ownership status of our International segment store locationsstores at the end of fiscal
Leased Locations | Owned Locations | Owned Buildings and Leased Land | |||||||||
Domestic | 910 | 23 | 32 | ||||||||
International | 153 | 3 | 4 | ||||||||
| Canada | Mexico | ||||||||||
| Best Buy Stores | Best Buy Mobile Stores | Best Buy Stores | Best Buy Express Stores | ||||||||
| Owned store locations | 3 | — | — | — | |||||||
| Leased store locations | 131 | 53 | 20 | 5 | |||||||
Distribution
The following table summarizes the location, ownership status and total square footage of space utilized for distribution centers and corporate offices of our International segment at the end of fiscal
Square Footage (in thousands) | |||||||||||
Leased Locations | Owned Locations | ||||||||||
Domestic | 14,987 | 3,168 | |||||||||
International | 1,496 | - | |||||||||
| Square Footage (in thousands) | Square Footage (in thousands) | ||||||||||||||
| Distribution Centers | Leased | Owned | Principal Corporate Offices | Leased | Owned | ||||||||||
| Canada | Brampton, Ontario | 1,057 | — | Burnaby, British Columbia | 141 | — | |||||||||
| Vancouver, British Columbia | 439 | — | |||||||||||||
| Mexico | Estado de Mexico, Mexico | 89 | — | Distrito Federal, Mexico | 32 | — | |||||||||
Other Properties
We own our corporate headquarters buildings located in Richfield, Minnesota. We also lease approximately 56,000 square feet ofadditional domestic and international office space in China to support and carry out our exclusive brandsbusiness operations.
Item 3. Legal Proceedings.
For additional information regarding our operating leases is available inlegal proceedings, see Note 1,
Item 4. Mine Safety Disclosures.
Not applicable.
Information about our Executive Officers of the Registrant
(As of
MarchName | Age | Position with the Company | Years with the Company | |||||
Corie S. Barry | 48 | Chief Executive Officer | 24 | |||||
Matt Bilunas | 51 | Senior Executive Vice President of Enterprise Strategy, Chief Financial Officer | 18 | |||||
Jason Bonfig | 47 | Senior Executive Vice President of Customer Offerings and Fulfillment | 25 | |||||
Damien Harmon | 45 | Senior Executive Vice President of Customer, Channel Experiences & Enterprise Services | 5 | |||||
Todd G. Hartman | 57 | General Counsel and Chief Risk Officer | 18 | |||||
Kamy Scarlett | 60 | Senior Executive Vice President of Human Resources, Corporate Affairs and Canada | 10 | |||||
Mathew R. Watson | 53 | Senior Vice President, Controller and Chief Accounting Officer | 18 | |||||
| Name | Age | Position With the Company | Years With the Company | |||
| Hubert Joly | 57 | Chairman and Chief Executive Officer | 4 | |||
| Corie Barry | 42 | Chief Financial Officer | 17 | |||
| Paula F. Baker | 49 | Chief Human Resources Officer | 13 | |||
| Shari L. Ballard | 50 | President, Multi-channel Retail and Operations | 24 | |||
| R. Michael (Mike) Mohan | 49 | Chief Merchandising and Marketing Officer | 13 | |||
| Keith J. Nelsen | 53 | General Counsel and Secretary | 11 | |||
| Asheesh Saksena | 52 | Chief Strategic Growth Officer | 1 | |||
| Trish Walker | 50 | President, Services | 1 | |||
| Mathew R. Watson | 46 | Chief Accounting Officer | 11 | |||
Corie S. Barry
was appointed our ChiefMatt Bilunasis our Senior Executive Vice President of Enterprise Strategy, Chief Financial Officer (“CFO”). In this role, he is responsible for overseeing all aspects of global finance, inclusive of audit, procurement and financial services, as well as enterprise strategy and real estate. Since joining Best Buy in 2006, Mr. Bilunas has served in a variety of financial leadership roles, both in the field and at the corporate campus. He started as a territory finance director in Los Angeles and has worked in the company’s domestic and international businesses. Mr. Bilunas has been a key finance leader during Best Buy’s transformation. Prior to becoming CFO in 2019, he was senior vice president of enterprise and merchandise finance from 2017 to 2019; vice president, finance for category, e-commerce and marketing from 2015 to 2017; and vice president, category finance from 2014 to 2015. He also has held finance roles in retail, e-commerce and marketing. Before Best Buy, he worked at Carlson Inc., NRG Energy Inc., Bandag Inc. andKPMG. Mr. Bilunas serves on the board of Genesco, Inc.
Jason Bonfig is our Senior Executive Vice President of Customer Offerings and Fulfillment. In this role, he oversees all elements of merchandising and product category management, supply chain and marketing for Best Buy’s core U.S. business. He also leads the company’s Exclusive Brands private-label team. Mr. Bonfig has served in merchant roles for the Company for over 20 years, working in and leading some of the most complex product categories. Prior to his current role, Mr. Bonfig served in the positions of chief category officer – computing, mobile, gaming, exclusive brands, printing, wearables and accessories from 2018 to 2019; senior vice president – computing, mobile, tablets, wearables, printing and accessories from 2014 to 2018. Mr. Bonfig has also held merchant-related roles since joining the company in 1999. Mr. Bonfig serves on the board of the Best Buy Foundation.
Damien Harmon is our Senior Executive Vice President of Customer, Channel Experiences & Enterprise Services. He is responsible for the end-to-end customer experience and the work that enhances every interaction with our customers and employees in his organization. His areas of responsibility include stores and operations, in-home services and sales, virtual experiences, call centers, membership, and customer strategy, relationship offerings and insights. In his role, Mr. Harmon leads Geek Squad, a national tech-support organization dedicated to helping customers learn about and enjoy their technology. Mr. Harmon previously served as executive vice president of omnichannel from 2021 to 2023. He established a dedicated operations plan to enhance the Company’s ability to create seamless experiences for our customers. He also oversaw our real estate portfolio, stores, operations, services and experiences that span from stores to virtual to in customers’ homes. Prior to that, Mr. Harmon served as president, operations from 2020 to 2021 and senior vice president of workforce design from 2019 to 2020. Mr. Harmon first joined Best Buy as a general manager in 2005 and held various leadership positions in store operations, international operations and store leadership, including vice president of retail operations and services. Before rejoining Best Buy in 2019, Mr. Harmon spent four years at Bridgestone Americas Inc., where he served as president of GCR Tires from 2017 to 2018 and chief operating officer at Bridgestone Tires from 2016 to 2017. Mr. Harmon serves on the board of Driven Brands and on the board of the Petco Love Foundation.
Todd G. Hartman was appointed General Counsel in 2019 and has also served as Chief Risk Officer since 2017. In this role, he is responsible for the company’s legal activities and its global risk and compliance program. He also serves as corporate secretary. Mr. Hartman joined Best Buy in 2006. He most recently served as chief risk and compliance officer, overseeing enterprise data security, customer data privacy, enterprise risk management, global security, business continuity/disaster recovery, internal investigations, crisis response management and compliance and ethics from 2017 to 2019. He continues to lead the risk functions in his current role. Mr. Hartman previously was Best Buy’s deputy general counsel from 2011 to 2017. Before that, he served as the company’s chief compliance officer and vice president of strategic alliances. Prior to joining Best Buy, Mr. Hartman was a partner at Minneapolis law firm Robins Kaplan. A Minnesota native, he worked for several years as a telecommunications and technology attorney in Washington, D.C., before returning to Minneapolis. Mr. Hartman sits on the advisory board of Markaaz, Inc. He serves as treasurer of the Retail Litigation Center and as chair of the Best Buy Foundation. He also sits on the board of the Guthrie Theater and on the board of Trademark Theater.
Kamy Scarlett is our ChiefSenior Executive Vice President of Human Resources, Officer in March 2016.Corporate Affairs and Canada. In herthis role, Ms. Bakershe oversees talent development and the health and well-being of our employees worldwide, communications and public affairs, and our Canadian business. Additionally, Ms. Scarlett serves as Executive Vice President of Best Buy Canada, where the Company operates more than 125,000150 stores. She was appointed executive vice president, human resources in 2017. She also assumed responsibility for Best Buy employees worldwide.Canada in 2021 and communications and public affairs in 2023. She previously served as our president of U.S. retail stores from 2019 until 2020 and was responsible for the execution and operation of all domestic Best Buy store locations. Ms. Scarlett joined Best Buy in 2014 as senior vice president of retail and chief human resources officer for Best Buy Canada, serving in that role until 2017. She was responsible for sales and profits in the Company’s stores, in addition to enacting the human resources and talent management strategies for the Canadian operations. She has served in a variety of retail, operations, marketing and human resources leadership roles since beginning her career in retail more than 30 years ago. Prior to her current role, she served as Vice President, Territory General Manager forjoining Best Buy, Ms. Scarlett was the Southeast regionchief operating officer from 2012 to 2014 at Grafton-Fraser Inc., a leading Canadian retailer of the United States, responsible for 172 stores and more than 10,000 employees, since 2012. Prior to that, Ms. Baker was a Territory Human Resources Director from 2010 to 2012.men’s apparel. She has also previously held District Managerleadership roles at Loblaw Cos., Hudson’s Bay Co. and General Manager roles from 2004 to 2010. Before joining Best Buy in 2004,Dylex Inc. Ms. Baker worked at Books-A-Million, a large chain bookstore in the southeast, Golfsmith International, a retail golf superstore, and St. Andrews Golf Company, a premier golf club manufacturer and retailer, in retail leadership roles. Ms. Baker serves as a board member on the Richard M. Schulze Foundation and on the Quality Committee of Children’s Hospital of Minnesota.
Mathew R. Michael (Mike) Mohan
PART II
Item 5. Market for Registrant's Common Equity, Related Stockholder Matters and Issuer Purchases of Equity Securities.
Market Information and Dividends
Our common stock is traded on the New York Stock Exchange (“NYSE”) under the ticker symbol BBY. In fiscal 2004, our Board of Directors (“Board”) initiated the payment of a regular quarterly cash dividend with respect to shares of our common stock. A quarterly cash dividend has been paid in each subsequent quarter. In addition, our Board approvedOn February 29, 2024, we announced the Board’s approval of a special dividend that was declared and paid2% increase in the first quarter of each of fiscal 2016 and fiscal 2017. On March 1, 2017, we announced a 21% increase in our regularregularly quarterly cash dividend to $0.34$0.94 per share. Future dividend payments will depend on our earnings, capital requirements, financial condition and other factors considered relevant by our Board. The table below sets forth the high and low sales prices of our common stock as reported on the New York Stock Exchange – Composite Index and the dividends declared and paid during the periods indicated.
| Sales Price | Dividends Declared and Paid | ||||||||||||||||||||||
| Fiscal 2017 | Fiscal 2016 | Fiscal Year | |||||||||||||||||||||
| High | Low | High | Low | 2017 | 2016 | ||||||||||||||||||
| First Quarter | $ | 34.95 | $ | 26.10 | $ | 42.00 | $ | 34.13 | $ | 0.73 | $ | 0.74 | |||||||||||
| Second Quarter | 33.63 | 28.76 | 37.18 | 31.68 | 0.28 | 0.23 | |||||||||||||||||
| Third Quarter | 40.58 | 32.02 | 39.10 | 28.32 | 0.28 | 0.23 | |||||||||||||||||
| Fourth Quarter | 49.40 | 37.10 | 36.51 | 25.31 | 0.28 | 0.23 | |||||||||||||||||
Holders
As of
MarchPurchases of Equity Securities by the Issuer and Affiliated Purchasers
On February 28, 2022, our Board approved a $5.0 billion share repurchase authorization, which replaced the $5.0 billion share repurchase program authorized up to
Information regarding our repurchases authorized by our Board in June 2011 was available for future share repurchases. In February 2017, our Board approved a new $5 billion share repurchase authorization, which superseded the authorization from 2011. On March 1, 2017, we announced our intent to repurchase $3 billion of shares over the next two years.
Period | Total Number | Average Price | Total Number of Shares | Approximate Dollar Value | |||||||||
Oct. 29, 2023 through Nov. 25, 2023 | 952,139 | $ | 66.06 | 952,139 | $ | 3,784,000,000 | |||||||
Nov. 26, 2023 through Dec. 30, 2023 | - | $ | - | - | $ | 3,784,000,000 | |||||||
Dec. 31, 2023 through Feb. 3, 2024 | - | $ | - | - | $ | 3,784,000,000 | |||||||
Total fiscal 2024 fourth quarter | 952,139 | $ | 66.06 | 952,139 | $ | 3,784,000,000 | |||||||
| Fiscal Period | Total Number of Shares Purchased | Average Price Paid per Share | Total Number of Shares Purchased as Part of Publicly Announced Program | Approximate Dollar Value of Shares that May Yet Be Purchased Under the Program(1) | |||||||||
| Oct. 30, 2016 through Nov. 26, 2016 | 1,534,476 | $ | 40.09 | 1,534,476 | $ | 2,399,000,000 | |||||||
| Nov. 27, 2016 through Dec. 31, 2016 | 1,705,027 | $ | 46.13 | 1,705,027 | $ | 2,321,000,000 | |||||||
| Jan. 1, 2017 through Jan. 28, 2017 | 1,900,057 | $ | 43.50 | 1,900,057 | $ | 2,238,000,000 | |||||||
| Total Fiscal 2017 Fourth Quarter | 5,139,560 | $ | 43.35 | 5,139,560 | $ | 2,238,000,000 | |||||||
Best Buy Stock Comparative Performance Graph
The information contained in this Best Buy Stock Comparative Performance Graph section shall not be deemed to be "soliciting material"“soliciting material” or "filed"“filed” or incorporated by reference in future filings with the SEC, or subject to the liabilities of Section 18 of the Exchange Act, except to the extent that we specifically incorporate it by reference into a document filed under the Securities Act or the Exchange Act.
The graph below compares the cumulative total shareholder return on our common stock for the last five fiscal years with the cumulative total return on the Standard & Poor's (“S&P”) 500 Index ("(“S&P 500"500”), of which we are a component, and the StandardS&P 500 Consumer Discretionary Distribution & Poor'sRetail Index (formerly the S&P 500 Retailing Group Industry Index ("S&P Retailing Group")Index), of which we are also a component. The S&P Retailing Group500 Consumer Discretionary Distribution & Retail Index is a capitalization-weighted index of domestic equities traded on the NYSE and NASDAQ and includes high-capitalization stocks representing the retail sector of the S&P 500.
The graph assumes an investment of $100 at the close of trading on March 2, 2012,February 1, 2019, the last trading day of fiscal 2012,2019, in our common stock, the S&P 500 Index and the S&P Retailing Group.
COMPARISON OF 5 YEAR CUMULATIVE TOTAL RETURN*
Among Best Buy Co., Inc., the S&P 500 Index
and the S&P Retailing Group500 Consumer Discretionary Distribution & Retail Index
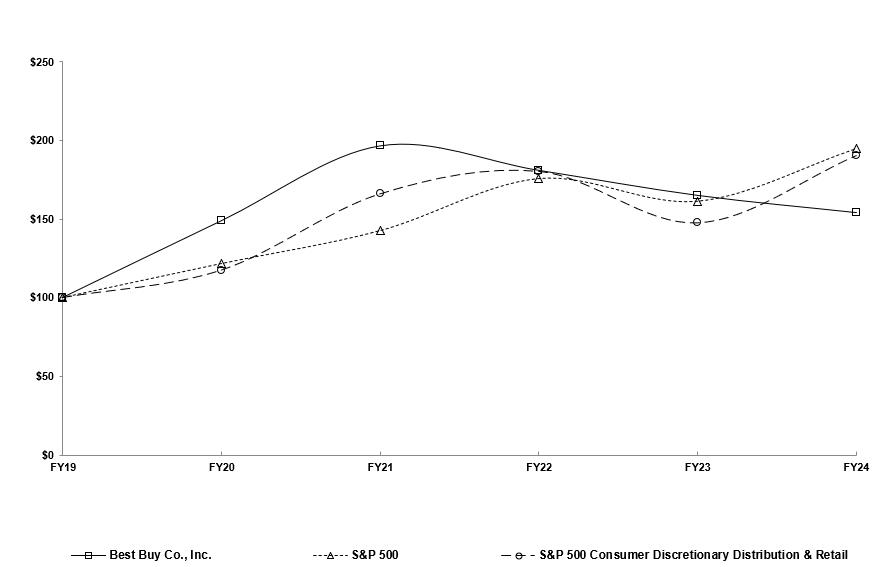
Fiscal Years Ended | February 2, 2019 | February 1, 2020 | January 30, 2021 | January 29, 2022 | January 28, 2023 | February 3, 2024 | |||||||||||||||||
Best Buy Co., Inc. | $ | 100.00 | $ | 148.97 | $ | 196.72 | $ | 181.12 | $ | 165.13 | $ | 154.14 | |||||||||||
S&P 500 | $ | 100.00 | $ | 121.68 | $ | 142.67 | $ | 175.90 | $ | 161.45 | $ | 195.06 | |||||||||||
S&P 500 Consumer Discretionary Distribution & Retail | $ | 100.00 | $ | 117.54 | $ | 166.19 | $ | 180.56 | $ | 147.66 | $ | 190.67 | |||||||||||
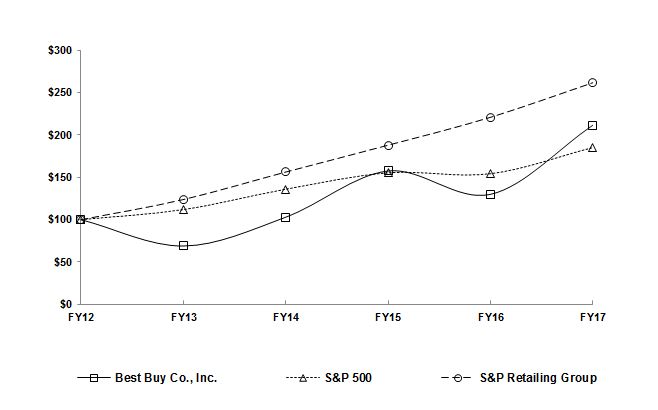
| Fiscal Year | 2012 | 2013 | 2014 | 2015 | 2016 | 2017 | |||||||||||||||||
| Best Buy Co., Inc. | $ | 100.00 | $ | 68.66 | $ | 102.94 | $ | 157.58 | $ | 129.90 | $ | 211.63 | |||||||||||
| S&P 500 | 100.00 | 111.94 | 136.02 | 155.37 | 154.34 | 185.27 | |||||||||||||||||
| S&P Retailing Group | 100.00 | 123.88 | 156.39 | 188.05 | 221.02 | 261.85 | |||||||||||||||||
*Cumulative total return assumes dividend reinvestment.
Source: Research Data Group, Inc.
Item 6. Selected Financial Data.
| 12-Month | 11-Month | |||||||||||||||||||
| Fiscal Year | 2017(1) | 2016(2) | 2015(3) | 2014(4) | 2013(5)(6) | |||||||||||||||
| Consolidated Statements of Earnings Data | ||||||||||||||||||||
| Revenue | $ | 39,403 | $ | 39,528 | $ | 40,339 | $ | 40,611 | $ | 38,252 | ||||||||||
| Operating income | 1,854 | 1,375 | 1,450 | 1,144 | 90 | |||||||||||||||
| Net earnings (loss) from continuing operations | 1,207 | 807 | 1,246 | 695 | (259 | ) | ||||||||||||||
| Gain (loss) from discontinued operations | 21 | 90 | (11 | ) | (172 | ) | (161 | ) | ||||||||||||
| Net earnings (loss) including noncontrolling interests | 1,228 | 897 | 1,235 | 523 | (420 | ) | ||||||||||||||
| Net earnings (loss) attributable to Best Buy Co., Inc. shareholders | 1,228 | 897 | 1,233 | 532 | (441 | ) | ||||||||||||||
| Per Share Data | ||||||||||||||||||||
| Net earnings (loss) from continuing operations | $ | 3.74 | $ | 2.30 | $ | 3.53 | $ | 2.00 | $ | (0.76 | ) | |||||||||
| Net gain (loss) from discontinued operations | 0.07 | 0.26 | (0.04 | ) | (0.47 | ) | (0.54 | ) | ||||||||||||
| Net earnings (loss) | 3.81 | 2.56 | 3.49 | 1.53 | (1.30 | ) | ||||||||||||||
| Cash dividends declared and paid | 1.57 | 1.43 | 0.72 | 0.68 | 0.66 | |||||||||||||||
| Common stock price: | ||||||||||||||||||||
| High | 49.40 | 42.00 | 40.03 | 44.66 | 27.95 | |||||||||||||||
| Low | 26.10 | 25.31 | 22.30 | 13.83 | 11.20 | |||||||||||||||
| Operating Statistics | ||||||||||||||||||||
Comparable sales gain (decline)(7) | 0.3 | % | 0.5 | % | 0.5 | % | (1.0 | )% | (2.7 | )% | ||||||||||
| Gross profit rate | 24.0 | % | 23.3 | % | 22.4 | % | 23.1 | % | 23.6 | % | ||||||||||
| Selling, general and administrative expenses rate | 19.2 | % | 19.3 | % | 18.8 | % | 20.0 | % | 20.7 | % | ||||||||||
| Operating income rate | 4.7 | % | 3.5 | % | 3.6 | % | 2.8 | % | 0.2 | % | ||||||||||
| Year-End Data | ||||||||||||||||||||
Current ratio(8) | 1.5 | 1.4 | 1.5 | 1.4 | 1.1 | |||||||||||||||
| Total assets | $ | 13,856 | $ | 13,519 | $ | 15,245 | $ | 13,990 | $ | 16,774 | ||||||||||
| Debt, including current portion | 1,365 | 1,734 | 1,613 | 1,647 | 2,290 | |||||||||||||||
| Total equity | 4,709 | 4,378 | 5,000 | 3,989 | 3,715 | |||||||||||||||
| Number of stores | ||||||||||||||||||||
| Domestic | 1,363 | 1,415 | 1,448 | 1,495 | 1,503 | |||||||||||||||
| International | 212 | 216 | 283 | 284 | 276 | |||||||||||||||
| Total | 1,575 | 1,631 | 1,731 | 1,779 | 1,779 | |||||||||||||||
| Retail square footage (000s) | ||||||||||||||||||||
| Domestic | 40,828 | 41,216 | 41,716 | 42,051 | 42,232 | |||||||||||||||
| International | 4,511 | 4,543 | 6,470 | 6,636 | 6,613 | |||||||||||||||
| Total | 45,339 | 45,759 | 48,186 | 48,687 | 48,845 | |||||||||||||||
Item 7. Management's Discussion and Analysis of Financial Condition and Results of Operations.
Management's Discussion and Analysis of Financial Condition and Results of Operations ("(“MD&A"&A”) is intended to provide a reader of our financial statements with a narrative from the perspective of our management on our financial condition, results of operations, liquidity and certain other factors that may affect our future results. Unless otherwise noted, transactions and other factors significantly impacting our financial condition, results of operations and liquidity are discussed in order of magnitude. Our MD&A is presented in the following sections:
Overview
We are a leading providerdriven by our purpose to enrich lives through technology and our vision to personalize and humanize technology solutions for every stage of life. We accomplish this by leveraging our combination of technology products, services and solutions. We offer these products and servicesa human touch to customers whomeet our customers’ everyday needs, whether they come to us online, visit our stores engage with Geek Squad agents or use our websites or mobile applications.invite us into their homes. We have operations in the U.S., Canada and Mexico. Canada.
We operatehave two reportable segments: Domestic and International. The Domestic segment is comprised of our operations in all operations withinstates, districts and territories of the U.S. and its districtsour Best Buy Health business, and territories.includes the brand names Best Buy, Best Buy Ads, Best Buy Business, Best Buy Health, CST, Current Health, Geek Squad, Lively, Magnolia, Pacific Kitchen and Home, TechLiquidators and Yardbird; and the domain names bestbuy.com, currenthealth.com, lively.com, techliquidators.com and yardbird.com. The International segment is comprised of all operations outsidein Canada under the U.S.brand names Best Buy, Best Buy Mobile and its territories.
Our fiscal year ends on the Saturday nearest the end of January. Fiscal 2017, 20162024, fiscal 2023 and 2015 eachfiscal 2022 ended February 3, 2024, January 28, 2023, and January 29, 2022, respectively. Unless otherwise noted, references to years in the MD&A section of this report relate to fiscal years, and not calendar years. Fiscal 2024 included 52 weeks, noting that fiscal 2018 will include 53 weeks with the additional53rd week includedoccurring in the fiscal fourth quarter. Fiscal 2023 and fiscal 2022 each included 52 weeks. Our business, like that of many
Comparable Sales
Throughout this MD&A, we refer to comparable sales. OurComparable sales is a metric used by management to evaluate the performance of our existing stores, websites and call centers by measuring the change in net sales for a particular period over the comparable prior period of equivalent length. Comparable sales calculation comparesincludes revenue from stores, websites and call centers operating for at least 14 full months, as well as revenue related to certain othermonths. Revenue from online sales is included in comparable sales channels forand represents sales initiated on a particular periodwebsite or app, regardless of whether customers choose to the corresponding periodpick up product in the prior year. Relocated stores, as well as remodeled, expanded and downsized stores closed more than 14 days, are excludedstore, curbside, at an alternative pick-up location or take delivery direct to their homes. Revenue from the comparable sales calculation until at least 14 full months after reopening. Acquisitions areacquisitions is included in the comparable sales calculation beginning with the first full quarter following the first anniversary of the date of the acquisition. The calculationComparable sales also includes credit card revenue, gift card breakage, commercial sales and sales of merchandise to wholesalers and dealers, as applicable. Revenue from stores closed more than 14 days, including but not limited to relocated, remodeled, expanded and downsized stores, or stores impacted by natural disasters, is excluded from comparable sales until at least 14 full months after reopening. Comparable sales excludes the impact of profit-share revenue, from discontinued operations and the effect of fluctuations in foreign currency exchange rates (applicable to our International segment only). The Canadian brand consolidation, which included the permanent closure of 66 Future Shop stores, the conversion of 65 Future Shop stores to Best Buy stores and the eliminationimpact of the Future Shop website, had a material impact on a year-over-year basis on the remaining Canadian retail stores and the website. As such, from the first quarter of53rd week in fiscal 2016 through the third quarter of fiscal 2017, all Canadian store and website revenue was removed from the2024. All periods presented apply this methodology consistently.
We believe comparable sales baseis a meaningful supplemental metric for investors to evaluate revenue performance resulting from growth in existing stores, websites and call centers versus the International segment no longer had a comparable metric. Therefore, Consolidated comparable sales equaled the Domestic segment comparable sales. Beginning in the fourth quarter of fiscal 2017, we resumed reporting International comparable sales as revenue in the International segment was once again deemed to be comparable and, as such, Consolidated comparable sales are once again equal to the aggregation of Domestic and International comparable sales. However, we have not provided International comparable sales for fiscal 2017 as the calculation would only include comparable revenueportion resulting from the fourth quarter of fiscal 2017 and may be misleading in future periods when used for comparison purposes.opening new stores or closing existing stores. The method of calculating comparable sales varies across the retail industry. As a result, our method of calculating comparable sales may not be the same as other retailers'retailers’ methods.
Non-GAAP Financial Measures
This MD&A includes financial information prepared in accordance with accounting principles generally accepted in the United States ("GAAP"U.S. (“GAAP”), as well as certain adjusted or non-GAAP financial measures, such as constant currency, non-GAAP operating income, non-GAAP effective tax rate non-GAAP net earnings from continuing operations,and non-GAAP diluted earnings per share ("EPS"(“EPS”) from continuing operations and non-GAAP debt to earnings before interest, income taxes, depreciation, amortization and rent ("EBITDAR") ratio.. We believe that non-GAAP financial measures, when reviewed in conjunction with GAAP financial measures, can provide moreadditional useful information to assist investors infor evaluating current period performance and in assessing future performance. For these reasons, our internal management reporting, also includesincluding budgets, forecasts and financial targets used for short-term incentives are based on non-GAAP financial measures. Generally, our non-GAAP financial measures include adjustments for items such as restructuring charges, goodwill impairments, non-restructuringand intangible asset impairments, andprice-fixing settlements, gains orand losses on investments.sales of subsidiaries and certain investments, intangible asset amortization, certain acquisition-related costs and the tax effect of all such items. In addition, certain other items may be excluded from non-GAAP financial measures when we believe thisdoing so provides greater clarity to management and our investors. We provide reconciliations of the most comparable financial measures presented in accordance with GAAP to presented non-GAAP financial measures that enable investors to understand the adjustments made in arriving at the non-GAAP financial measures and to evaluate performance using the same metrics as management. These non-GAAP financial measures should be considered in addition to, and not superior to or as a substitute for, GAAP financial measures. We strongly encourage investors and shareholders to review our financial statements and publicly-filed reports in their entirety and not to rely on any single financial measure. Non-GAAP financial measures as presented herein may not be comparable tocalculated differently from similarly titled measures used by other companies.
In our discussions of the operating results of our consolidated business and our International segment, we sometimes refer to the impact of changes in foreign currency exchange rates or the impact of foreign currency exchange rate fluctuations, which are references to the differences between the foreign currency exchange rates we use to convert the International segment’s operating results from local currencies into U.S. dollars for reporting purposes. We also may use the term "constant currency",“constant currency,” which represents results adjusted to exclude foreign currency impacts. We calculate those impacts as the difference between the current period results translated using the current period currency exchange rates and using the comparable prior period currency exchange rates. We believe the disclosure of revenue changes in constant currency provides useful supplementary information to investors in light of significant fluctuations in currency rates and our inability to report comparable store sales for the International segment in fiscal 2016 as a result of the Canadian brand consolidation.
Refer to the
Non-GAAP Financial Measures section below forBusiness Strategy Update
During fiscal 2024, our creditworthiness. Furthermore, we believe that our non-GAAP debt to EBITDAR ratio is important for understanding our financial positionteams once again delivered strong execution and provides meaningful additional information about ourshowcased their ability to service our long-term debt and other fixed obligations andnavigate through what continues to fund our future growth. We also believe our non-GAAP debt to EBITDAR ratio is relevant because it enables investors to compare our indebtedness to
In fiscal 2024, digital sales comprised 33% of our Domestic revenue compared to 19% in fiscal 2020. During these same time periods, the third priority, fiscal 2017percentage of online sales picked up in our stores by our customers was a year of exploration and experimentation, andconsistent at just over 40%. Therefore, we are continuing to test several concepts aroundadapt our omnichannel capabilities to ensure we maintain a leading position in an increasingly digital age and evolving retail landscape.
We believe our portfolio of stores are crucial assets that provide customers with differentiated experiences, services and convenient multichannel fulfillment. At the country that we believe have the potentialsame time, our stores need to be compelling customer experiences;cost and capital efficient to operate while remaining a great place to work. During fiscal 2024, we closed 24 large format stores and implemented 8 large format Experience store remodels. As we look to fiscal 2025, we plan to invest back into our store experience. Customer shopping behavior has evolved in the last four years, and in the near-term we are particularly focused on ensuring we provide the experience that customers expect to have when they take the time to come into our stores. As a result, our capital investments for fiscal 2025 are concentrated more on existing store updates and refreshes and less on major remodels or store openings.
We continue to advance our omni-channel operating model to align with the ongoing evolution of our industry and marketplace trends with two overarching goals in mind – efficiently allocating our labor cost, considering the channel shift from our physical stores to online, and providing our employees flexibility, predictability and opportunities to gain more skills. We are focused on balancing the amount of labor hours necessary to deliver the best experience possible for our customers and other stakeholders.
During fiscal 2024, we continued to grow our membership base and ended the year with a total of approximately seven million paid members. Our paid members consistently showed higher levels of interaction, with comparatively higher levels of spend at Best Buy and a shift of spend away from competitors. Last June, we successfully launched significant changes to our membership program that allow customers more freedom to choose a membership that fits their technology needs, budget and shopping preferences. In addition, we expect the changes to launch some of these conceptsprovide more flexibility to evolve our programs while resulting in fiscal 2018.
Although there continue to be macro pressures impacting retail overall and increasedconsumer electronics more specifically, we expect fiscal 2025 to be a year of increasing industry stabilization as the pace of innovation increases and consumers begin to upgrade and replace technology products bought earlier in the pandemic. Our strategy is to focus on sharpening our customer experiences and industry positioning while maintaining, if not expanding, our profitability. A little
We remain excited about our industry and our future. There are more technology products than four years later, we have now completed Renew Blue and unveiledever in people’s homes, technology is increasingly a new strategy: Best Buy 2020: Building the New Blue.
Results of Operations
Consolidated Results
Selected consolidated financial data for each of the past three fiscal yearswas as follows ($ in millions, except per share amounts):
(1)
2024 | 2023 | 2022 | |||||||||
Revenue | $ | 43,452 | $ | 46,298 | $ | 51,761 | |||||
Revenue % change | (6.1) | % | (10.6) | % | 9.5 | % | |||||
Comparable sales % change | (6.8) | % | (9.9) | % | 10.4 | % | |||||
Gross profit | $ | 9,603 | $ | 9,912 | $ | 11,640 | |||||
Gross profit as a % of revenue(1) | 22.1 | % | 21.4 | % | 22.5 | % | |||||
SG&A | $ | 7,876 | $ | 7,970 | $ | 8,635 | |||||
SG&A as a % of revenue(1) | 18.1 | % | 17.2 | % | 16.7 | % | |||||
Restructuring charges | $ | 153 | $ | 147 | $ | (34) | |||||
Operating income | $ | 1,574 | $ | 1,795 | $ | 3,039 | |||||
Operating income as a % of revenue | 3.6 | % | 3.9 | % | 5.9 | % | |||||
Net earnings | $ | 1,241 | $ | 1,419 | $ | 2,454 | |||||
Diluted earnings per share | $ | 5.68 | $ | 6.29 | $ | 9.84 | |||||
| Consolidated Performance Summary | 2017 | 2016 | 2015 | |||||||||
| Revenue | $ | 39,403 | $ | 39,528 | $ | 40,339 | ||||||
| Revenue % decline | (0.3 | )% | (2.0 | )% | (0.7 | )% | ||||||
Comparable sales % gain (1) | 0.3 | % | 0.5 | % | 0.5 | % | ||||||
Comparable sales % gain (decline), excluding estimated impact of installment billing(1)(2) | n/a | (0.1 | )% | — | % | |||||||
| Restructuring charges - cost of goods sold | $ | — | $ | 3 | $ | — | ||||||
| Gross profit | $ | 9,440 | $ | 9,191 | $ | 9,047 | ||||||
Gross profit as a % of revenue(3) | 24.0 | % | 23.3 | % | 22.4 | % | ||||||
| SG&A | $ | 7,547 | $ | 7,618 | $ | 7,592 | ||||||
| SG&A as a % of revenue | 19.2 | % | 19.3 | % | 18.8 | % | ||||||
| Restructuring charges | $ | 39 | $ | 198 | $ | 5 | ||||||
| Operating income | $ | 1,854 | $ | 1,375 | $ | 1,450 | ||||||
| Operating income as a % of revenue | 4.7 | % | 3.5 | % | 3.6 | % | ||||||
| Net earnings from continuing operations | $ | 1,207 | $ | 807 | $ | 1,246 | ||||||
Gain (loss) from discontinued operations(4) | $ | 21 | $ | 90 | $ | (13 | ) | |||||
| Net earnings attributable to Best Buy Co., Inc. shareholders | $ | 1,228 | $ | 897 | $ | 1,233 | ||||||
| Diluted earnings per share from continuing operations | $ | 3.74 | $ | 2.30 | $ | 3.53 | ||||||
| Diluted earnings per share | $ | 3.81 | $ | 2.56 | $ | 3.49 | ||||||
(1)Because retailers vary in how they record costs of operating their supply chain between cost of sales |
In fiscal 2024, we generated $43.5 billion in revenue, including approximately $735 million in revenue from the 53rd week. Our comparable sales declined 6.8% in fiscal 2017. Our2024, as we continued to operate in a consumer electronics industry that is challenged by various macroeconomic pressures, including high inflation, increased spending outside the home in areas such as travel and entertainment, the pull-forward of demand in prior years and lower levels of product innovation.
Revenue, gross profit rate, SG&A and operating income rate changes in fiscal 2024 were primarily driven by our Domestic segment contributed a rate increase of 0.5% of revenue, while our International segment contributed 0.2%.segment. For further discussion of each segment's gross profit rate changes, see Segment Performance Summary, below.
Income Tax Expense
Income tax expense increased in fiscal 20162024, primarily due to $39 millionreduced benefits from the resolution of tax matters and stock-based compensation, partially offset by the impact of decreased pre-tax earnings. Our effective tax rate increased in fiscal 2017. The fiscal 2017 activity2024, primarily relateddue to ourreduced tax benefits from the resolution of tax matters and stock-based compensation, partially offset by the impact of lower pre-tax earnings.
Segment Performance Summary
Domestic Segment
Selected financial data for the Domestic segment while ourwas as follows ($ in millions):
2024 | 2023 | 2022 | |||||||||
Revenue | $ | 40,097 | $ | 42,794 | $ | 47,830 | |||||
Revenue % change | (6.3) | % | (10.5) | % | 10.5 | % | |||||
Comparable sales % change(1) | (7.1) | % | (10.3) | % | 11.0 | % | |||||
Gross profit | $ | 8,850 | $ | 9,106 | $ | 10,702 | |||||
Gross profit as a % of revenue | 22.1 | % | 21.3 | % | 22.4 | % | |||||
SG&A | $ | 7,236 | $ | 7,332 | $ | 7,946 | |||||
SG&A as a % of revenue | 18.0 | % | 17.1 | % | 16.6 | % | |||||
Restructuring charges | $ | 147 | $ | 140 | $ | (39) | |||||
Operating income | $ | 1,467 | $ | 1,634 | $ | 2,795 | |||||
Operating income as a % of revenue | 3.7 | % | 3.8 | % | 5.8 | % | |||||
Selected Online Revenue Data | |||||||||||
Total online revenue | $ | 13,102 | $ | 14,212 | $ | 16,430 | |||||
Online revenue as a % of total segment revenue | 32.7 | % | 33.2 | % | 34.4 | % | |||||
Comparable online sales % change(1) | (7.8) | % | (13.5) | % | (12.0) | % | |||||
(1)Comparable online sales are included in the comparable sales calculation.
Domestic revenue was $40.1 billion in fiscal 2016 activity was driven by our International segment. For further discussion of each segment's SG&A restructuring charges, see
| Domestic Segment Performance Summary | 2017 | 2016 | 2015 | |||||||||
| Revenue | $ | 36,248 | $ | 36,365 | $ | 36,055 | ||||||
| Revenue % gain (decline) | (0.3 | )% | 0.9 | % | 0.6 | % | ||||||
Comparable sales % gain(1) | 0.2 | % | 0.5 | % | 1.0 | % | ||||||
Comparable sales % gain (decline), excluding the estimated impact of installment billing(1)(2) | n/a | (0.1 | )% | 0.5 | % | |||||||
| Gross profit | $ | 8,650 | $ | 8,484 | $ | 8,080 | ||||||
| Gross profit as % of revenue | 23.9 | % | 23.3 | % | 22.4 | % | ||||||
| SG&A | $ | 6,855 | $ | 6,897 | $ | 6,639 | ||||||
| SG&A as % of revenue | 18.9 | % | 19.0 | % | 18.4 | % | ||||||
| Restructuring charges | $ | 31 | $ | 2 | $ | 4 | ||||||
| Operating income | $ | 1,764 | $ | 1,585 | $ | 1,437 | ||||||
| Operating income as % of revenue | 4.9 | % | 4.4 | % | 4.0 | % | ||||||
| Selected Online Revenue Data: | ||||||||||||
| Online revenue as a % of total segment revenue | 13.4 | % | 11.0 | % | 9.8 | % | ||||||
Comparable online sales % gain(1) | 20.8 | % | 13.5 | % | 16.7 | % | ||||||
Domestic segment stores open at the end of each of the last three fiscal years:years were as follows:
2022 | 2023 | 2024 | |||||||||||||||||||
Total Stores | Stores | Stores | Total Stores | Stores | Stores | Total Stores | |||||||||||||||
Best Buy | 938 | 1 | (14) | 925 | - | (24) | 901 | ||||||||||||||
Outlet Centers | 16 | 3 | - | 19 | 5 | (2) | 22 | ||||||||||||||
Pacific Sales | 21 | - | (1) | 20 | - | - | 20 | ||||||||||||||
Yardbird | 9 | 5 | - | 14 | 9 | (1) | 22 | ||||||||||||||
Total Domestic segment stores | 984 | 9 | (15) | 978 | 14 | (27) | 965 | ||||||||||||||
| Fiscal 2015 | Fiscal 2016 | Fiscal 2017 | ||||||||||||||||||
Total Stores at End of Fiscal Year | Stores Opened | Stores Closed | Total Stores at End of Fiscal Year | Stores Opened | Stores Closed | Total Stores at End of Fiscal Year | ||||||||||||||
| Best Buy | 1,050 | — | (13 | ) | 1,037 | — | (11 | ) | 1,026 | |||||||||||
| Best Buy Mobile stand-alone | 367 | — | (17 | ) | 350 | — | (41 | ) | 309 | |||||||||||
| Pacific Sales | 29 | — | (1 | ) | 28 | — | — | 28 | ||||||||||||
| Magnolia Audio Video | 2 | — | (2 | ) | — | — | — | — | ||||||||||||
| Total Domestic segment stores | 1,448 | — | (33 | ) | 1,415 | — | (52 | ) | 1,363 | |||||||||||
We continuously monitor store performance.performance as part of a market-driven, omnichannel strategy. As we approach the expiration date of our stores leases, we evaluate various options for each location, including whether a store should remain open.
Domestic segment online revenue of $4.8 billion increased 20.8% on a comparable basis primarily due to higher conversion rates and increased traffic. As a percentage of total Domestic revenue, online revenue increased 240 basis points to 13.4% versus 11.0% last year.
Revenue Mix Summary | Comparable Sales Summary | ||||||||||
2024 | 2023 | 2024 | 2023 | ||||||||
Computing and Mobile Phones | 42 | % | 43 | % | (7.8) | % | (12.0) | % | |||
Consumer Electronics | 30 | % | 30 | % | (8.6) | % | (12.2) | % | |||
Appliances | 14 | % | 15 | % | (15.1) | % | (5.7) | % | |||
Entertainment | 7 | % | 6 | % | 9.7 | % | (5.5) | % | |||
Services | 6 | % | 5 | % | 8.7 | % | (2.5) | % | |||
Other | 1 | % | 1 | % | 6.1 | % | 1.6 | % | |||
Total | 100 | % | 100 | % | (7.1) | % | (10.3) | % | |||
| Revenue Mix Summary | Comparable Sales Summary | ||||||||||
| Year Ended | Year Ended | ||||||||||
| January 28, 2017 | January 30, 2016 | January 28, 2017 | January 30, 2016 | ||||||||
| Consumer Electronics | 34 | % | 32 | % | 5.0 | % | 4.7 | % | |||
| Computing and Mobile Phones | 45 | % | 46 | % | (1.8 | )% | (2.6 | )% | |||
| Entertainment | 7 | % | 8 | % | (13.8 | )% | (3.6 | )% | |||
| Appliances | 9 | % | 8 | % | 7.8 | % | 15.4 | % | |||
| Services | 5 | % | 5 | % | (3.3 | )% | (11.6 | )% | |||
| Other | — | % | 1 | % | n/a | n/a | |||||
| Total | 100 | % | 100 | % | 0.2 | % | 0.5 | % | |||
Notable comparable sales changes in our Domestic segment by revenue category:
• Computing and Mobile Phones:
The• Consumer Electronics: The 13.8% comparable sales decrease was driven by declines in gaming, music and movies due to continued industry declines.
• Appliances: The 15.1% comparable sales decline was driven primarily by large appliances.
• Entertainment: The 9.7% comparable sales growth was driven primarily by gaming hardware.
• Services: The 8.7% comparable sales growth was driven primarily by growth in our membership programs, as well as delivery and installation services.
Domestic gross profit rate increased in fiscal 2024, primarily due to improved financial performance from our membership offerings, which included higher services margin rates, and an improved gross profit rate from our Best Buy Health business.
Domestic SG&A decreased in fiscal 2024, primarily due to lower reimbursement revenue from our third party underwriter on extended protection plan claims. This trend, which primarily related to mobile phones, was a reflection of changes to the design of our extended protection plans in fiscal 2016, improvements to our repairstore payroll and fulfillment operations and industry trends.
Domestic segment SG&A rate slightly decreased to 18.9% of revenuerestructuring charges incurred in fiscal 2017 compared2024 were primarily comprised of employee termination benefits related to 19.0% of revenuean enterprise-wide initiative that commenced in the prior year. The decrease in rate was primarily driven by cost reductions and lower incentive compensation, partially offset by investments in growth initiatives.
| Revenue Mix Summary | Comparable Sales Summary | ||||||||||
| Year Ended | Year Ended | ||||||||||
| January 30, 2016 | January 31, 2015 | January 30, 2016 | January 31, 2015 | ||||||||
| Consumer Electronics | 32 | % | 31 | % | 4.7 | % | 3.7 | % | |||
| Computing and Mobile Phones | 46 | % | 47 | % | (2.6 | )% | (0.6 | )% | |||
| Entertainment | 8 | % | 9 | % | (3.6 | )% | 4.5 | % | |||
| Appliances | 8 | % | 7 | % | 15.4 | % | 7.5 | % | |||
| Services | 5 | % | 5 | % | (11.6 | )% | (11.1 | )% | |||
| Other | 1 | % | 1 | % | n/a | n/a | |||||
| Total | 100 | % | 100 | % | 0.5 | % | 1.0 | % | |||
Domestic operating income rate increase wasdecreased in fiscal 2024, primarily due to (1) the periodic profit-share revenue described above; (2)an unfavorable SG&A rate improvements in computing hardwarethat was driven by decreased leverage from lower sales volume on our more disciplined promotional strategy; (3) an additional positive mix shift due to significantly decreased revenue in the lower-margin tablet category; (4) the positive impact of lower repair revenue (as discussed above), which typically earns a low gross profit rate; (5) an increased mix of higher-margin large screen televisions; and (6) positive revenue impact related to our credit card portfolio. These increases werefixed expenses, partially offset by (1) lower rates related to large appliances; (2) a lower ratefavorability in the mobile category driven by increased sales of higher priced iconic mobile phones, which have higher gross profit dollars but carry a lower gross profit rate; (3)rate.
International Segment
Selected financial data for the International segment was as follows ($ in millions):
2024 | 2023 | 2022 | |||||||||
Revenue | $ | 3,355 | $ | 3,504 | $ | 3,931 | |||||
Revenue % change | (4.3) | % | (10.9) | % | (1.0) | % | |||||
Comparable sales % change | (3.2) | % | (5.4) | % | 3.3 | % | |||||
Gross profit | $ | 753 | $ | 806 | $ | 938 | |||||
Gross profit as a % of revenue | 22.4 | % | 23.0 | % | 23.9 | % | |||||
SG&A | $ | 640 | $ | 638 | $ | 689 | |||||
SG&A as a % of revenue | 19.1 | % | 18.2 | % | 17.5 | % | |||||
Restructuring charges | $ | 6 | $ | 7 | $ | 5 | |||||
Operating income | $ | 107 | $ | 161 | $ | 244 | |||||
Operating income as a % of revenue | 3.2 | % | 4.6 | % | 6.2 | % | |||||
International revenue was $3.4 billion in fiscal 2024, including approximately $60 million of revenue from the 53rd week. The decrease in margin for portable audio products; (4) a decreased mix of higher-margin digital imaging products; (5) an increased mix of lower-margin wearable devices; and (6) an investment in services pricing.
| International Segment Performance Summary | 2017 | 2016 | 2015 | |||||||||
| Revenue | $ | 3,155 | $ | 3,163 | $ | 4,284 | ||||||
| Revenue decline % | (0.3 | )% | (26.2 | )% | (10.4 | )% | ||||||
Comparable sales % decline(1) | n/a | n/a | (3.5 | )% | ||||||||
| Restructuring charges - cost of goods sold | $ | — | $ | 3 | $ | — | ||||||
| Gross profit | $ | 790 | $ | 707 | $ | 967 | ||||||
| Gross profit as % of revenue | 25.0 | % | 22.4 | % | 22.6 | % | ||||||
| SG&A | $ | 692 | $ | 721 | $ | 953 | ||||||
| SG&A as % of revenue | 21.9 | % | 22.8 | % | 22.2 | % | ||||||
| Restructuring charges | $ | 8 | $ | 196 | $ | 1 | ||||||
| Operating income (loss) | $ | 90 | $ | (210 | ) | $ | 13 | |||||
| Operating income (loss) as % of revenue | 2.9 | % | (6.6 | )% | 0.3 | % | ||||||
International segment stores open at the end of each of the last three fiscal years:years were as follows:
2022 | 2023 | 2024 | ||||||||||||||||||
Total Stores | Stores | Stores | Total Stores | Stores | Stores | Total Stores | ||||||||||||||
Canada | ||||||||||||||||||||
Best Buy | 127 | - | - | 127 | 1 | - | 128 | |||||||||||||
Best Buy Mobile | 33 | - | - | 33 | - | (1) | 32 | |||||||||||||
Total International segment stores | 160 | - | - | 160 | 1 | (1) | 160 | |||||||||||||
| Fiscal 2015 | Fiscal 2016 | Fiscal 2017 | |||||||||||||||||||||
| Total Stores at End of Fiscal Year | Stores Opened | Stores Closed | Stores Converted | Total Stores at End of Fiscal Year | Stores Opened | Stores Closed | Total Stores at End of Fiscal Year | ||||||||||||||||
| Canada | |||||||||||||||||||||||
| Future Shop | 133 | — | (68 | ) | (65 | ) | — | — | — | — | |||||||||||||
| Best Buy | 71 | 3 | (3 | ) | 65 | 136 | — | (2 | ) | 134 | |||||||||||||
| Best Buy Mobile | 56 | — | — | — | 56 | 1 | (4 | ) | 53 | ||||||||||||||
| Mexico | |||||||||||||||||||||||
| Best Buy | 18 | — | — | 18 | 2 | — | 20 | ||||||||||||||||
| Express | 5 | 1 | — | — | 6 | — | (1 | ) | 5 | ||||||||||||||
| Total International segment stores | 283 | 4 | (71 | ) | — | 216 | 3 | (7 | ) | 212 | |||||||||||||
International segment revenue of $3.2 billion in fiscal 2017 decreased 0.3% compared to the prior year. The components of the
Revenue Mix Summary | Comparable Sales Summary | ||||||||||||||
2024 | 2023 | 2024 | 2023 | ||||||||||||
Computing and Mobile Phones | 46 | % | 45 | % | (0.9) | % | (6.1) | % | |||||||
Consumer Electronics | 29 | % | 30 | % | (9.3) | % | (6.2) | % | |||||||
Appliances | 10 | % | 10 | % | (4.5) | % | 0.3 | % | |||||||
Entertainment | 9 | % | 8 | % | 13.2 | % | (8.6) | % | |||||||
Services | 5 | % | 5 | % | 1.0 | % | (2.1) | % | |||||||
Other | 1 | % | 2 | % | (33.8) | % | 1.1 | % | |||||||
Total | 100 | % | 100 | % | (3.2) | % | (5.4) | % | |||||||
Notable comparable sales changes by revenue category were as follows:
• Computing and Mobile Phones: The 0.9% comparable sales decline was driven primarily by computing, partially offset by comparable sales growth in mobile phones.
• Consumer Electronics: The 9.3% comparable sales decline was driven primarily by home theater and health and fitness.
• Appliances: The 4.5% comparable sales decline was driven primarily by large appliances.
• Entertainment: The 13.2% comparable sales growth was driven primarily by gaming hardware.
• Services: The 1.0% comparable sales growth was driven primarily by growth in our membership programs.
International gross profit rate decreased in fiscal 2017 and 2016:
| Revenue Mix Summary | |||||
| Year Ended | |||||
| January 28, 2017 | January 30, 2016 | ||||
| Consumer Electronics | 31 | % | 31 | % | |
| Computing and Mobile Phones | 48 | % | 48 | % | |
| Entertainment | 7 | % | 9 | % | |
| Appliances | 6 | % | 5 | % | |
| Services | 7 | % | 6 | % | |
| Other | 1 | % | 1 | % | |
| Total | 100 | % | 100 | % | |
International segment forSG&A increased in fiscal 2017 or 20162024, primarily due to higher incentive compensation expense and the Canadian brand consolidation. As such, it is also impractical to provide such information on a revenue category basis. However, as noted above,impact of the revenue mix53rd week, partially offset by category has not changed significantly from fiscal 2016.
International restructuring charges incurred in fiscal 2017 from 22.4%2024 were primarily comprised of revenue in fiscal 2016. This increase was primarily due to the increased promotional activity in fiscal 2016 as a result of the Canada brand consolidation which did not reoccur and to a lesser extent rate growth in computing and home theater.
International segment operating income was $90 millionrate decreased in fiscal 2017 compared2024, primarily due to a loss of $210 million in the prior-year period. The improvement in operating income was primarily driven by lower restructuring costs and gross profit andan unfavorable SG&A rate improvements.
| Revenue Mix Summary | |||||
| Year Ended | |||||
| January 30, 2016 | January 31, 2015 | ||||
| Consumer Electronics | 31 | % | 30 | % | |
| Computing and Mobile Phones | 48 | % | 49 | % | |
| Entertainment | 9 | % | 9 | % | |
| Appliances | 5 | % | 5 | % | |
| Services | 6 | % | 6 | % | |
| Other | 1 | % | 1 | % | |
| Total | 100 | % | 100 | % | |
Non-GAAP Financial Measures
Reconciliations of operating income, rate. Refereffective tax rate and diluted EPS (GAAP financial measures) to non-GAAP operating income, non-GAAP effective tax rate and non-GAAP diluted EPS (non-GAAP financial measures), respectively, were as follows ($ in millions, except per share amounts):
2024 | 2023 | 2022 | |||||||||
Operating income | $ | 1,574 | $ | 1,795 | $ | 3,039 | |||||
% of revenue | 3.6 | % | 3.9 | % | 5.9 | % | |||||
Restructuring - inventory markdowns(1) | - | - | (6) | ||||||||
Intangible asset amortization(2) | 61 | 86 | 82 | ||||||||
Restructuring charges(3) | 153 | 147 | (34) | ||||||||
Acquisition-related transaction costs(2) | - | - | 11 | ||||||||
Non-GAAP operating income | $ | 1,788 | $ | 2,028 | $ | 3,092 | |||||
% of revenue | 4.1 | % | 4.4 | % | 6.0 | % | |||||
Effective tax rate | 23.5 | % | 20.7 | % | 19.0 | % | |||||
Intangible asset amortization(2) | 0.1 | % | 0.1 | % | 0.1 | % | |||||
Restructuring charges(3) | 0.2 | % | 0.2 | % | (0.1) | % | |||||
Non-GAAP effective tax rate | 23.8 | % | 21.0 | % | 19.0 | % | |||||
Diluted EPS | $ | 5.68 | $ | 6.29 | $ | 9.84 | |||||
Restructuring - inventory markdowns(1) | - | - | (0.02) | ||||||||
Intangible asset amortization(2) | 0.28 | 0.38 | 0.33 | ||||||||
Restructuring charges(3) | 0.70 | 0.65 | (0.14) | ||||||||
Gain on sale of subsidiary, net(4) | (0.10) | - | - | ||||||||
Loss on investments | 0.05 | - | - | ||||||||
Acquisition-related transaction costs(2) | - | - | 0.04 | ||||||||
Income tax impact of non-GAAP adjustments(5) | (0.24) | (0.24) | (0.04) | ||||||||
Non-GAAP diluted EPS | $ | 6.37 | $ | 7.08 | $ | 10.01 | |||||
For additional information regarding the nature of charges discussed below, refer to Note 2, Acquisitions; Note 3, Restructuring; Note 4, Restructuring ChargesGoodwill and Intangible Assets; and Note 11, Income Taxes, of the Notes to Consolidated Financial Statements, included in Item 8, Financial Statements and Supplementary Data, of this Annual Report on Form 10-K for further information about10-K.
(1)Represents inventory markdowns and subsequent adjustments recorded within cost of sales associated with the exit from operations in Mexico.
(2)Represents charges associated with acquisitions, including: (1) the non-cash amortization of definite-lived intangible assets, including customer relationships, tradenames and developed technology; and (2) acquisition-related transaction and due diligence costs, primarily comprised of professional fees.
(3)Represents restructuring charges primarily related to the Fiscal 2024 Restructuring Initiative, the Fiscal 2023 Resource Optimization Initiative and the Mexico Exit and Strategic Realignment.
(4)Represents the gain on sale of a Mexico subsidiary subsequent to our restructuring activities.
(5)The non-GAAP adjustments primarily relate to the U.S. As such, the income tax charge on the U.S. non-GAAP adjustments is calculated using the U.S. statutory tax rate of 24.5%.
Non-GAAP operating loss was $210 millionincome rate decreased in fiscal 2016 compared2024, primarily due to income of $13 millionunfavorable SG&A rates in the prior-year period. The decline in operating income was driven primarilyour Domestic and International segments, partially offset by a decrease in revenue andfavorable gross profit rate in our Domestic segment.
Non-GAAP effective tax rate increased in fiscal 2024, primarily due to reduced tax benefits from the resolution of tax matters and restructuring charges,stock-based compensation, partially offset by the impact of lower pre-tax earnings.
Non-GAAP diluted EPS decreased in fiscal 2024, primarily driven by the decrease in non-GAAP operating income, partially offset by lower SG&A expenses as described above.
| Fiscal Year | |||||||||||
| 2017 | 2016 | 2015 | |||||||||
| Operating income | $ | 1,854 | $ | 1,375 | $ | 1,450 | |||||
Net CRT/LCD settlements(1) | (161 | ) | (77 | ) | — | ||||||
Restructuring charges - COGS(2) | — | 3 | — | ||||||||
Other Canada brand consolidation charges - SG&A(3) | 1 | 6 | — | ||||||||
Non-restructuring asset impairments - SG&A(4) | 26 | 61 | 42 | ||||||||
Restructuring charges(2) | 39 | 198 | 5 | ||||||||
| Non-GAAP operating income | $ | 1,759 | $ | 1,566 | $ | 1,497 | |||||
| Income tax expense | $ | 609 | $ | 503 | $ | 141 | |||||
Effective tax rate | 33.5 | % | 38.4 | % | 10.1 | % | |||||
Income tax impact of Europe legal entity reorganization(5) | — | — | 353 | ||||||||
Income tax impact of Non-GAAP adjustments(6) | (38 | ) | 30 | 11 | |||||||
| Non-GAAP income tax expense | $ | 571 | $ | 533 | $ | 505 | |||||
Non-GAAP effective tax rate | 33.2 | % | 35.4 | % | 35.5 | % | |||||
| Net earnings from continuing operations | $ | 1,207 | $ | 807 | $ | 1,246 | |||||
Net CRT/LCD settlements(1) | (161 | ) | (77 | ) | — | ||||||
Restructuring charges - COGS(2) | — | 3 | — | ||||||||
Other Canada brand consolidation charges - SG&A(3) | 1 | 6 | — | ||||||||
Non-restructuring asset impairments - SG&A(4) | 26 | 61 | 42 | ||||||||
Restructuring charges(2) | 39 | 198 | 5 | ||||||||
| (Gain) loss on sale of investments | (2 | ) | 5 | (11 | ) | ||||||
Income tax impact of Europe legal entity reorganization(5) | — | — | (353 | ) | |||||||
Income tax impact of Non-GAAP adjustments(6) | 38 | (30 | ) | (11 | ) | ||||||
| Non-GAAP net earnings from continuing operations | $ | 1,148 | $ | 973 | $ | 918 | |||||
| Diluted earnings per share from continuing operations | $ | 3.74 | $ | 2.30 | $ | 3.53 | |||||
Per share impact of net CRT/LCD settlements(1) | (0.50 | ) | (0.22 | ) | — | ||||||
Per share impact of restructuring charges - COGS(2) | — | 0.01 | — | ||||||||
Per share impact of other Canada brand consolidation charges - SG&A(3) | 0.01 | 0.02 | — | ||||||||
Per share impact of non-restructuring asset impairments - SG&A(4) | 0.08 | 0.17 | 0.12 | ||||||||
Per share impact of restructuring charges(2) | 0.12 | 0.58 | 0.01 | ||||||||
| Per share impact of (gain) loss on sale of investments | (0.01 | ) | 0.01 | (0.03 | ) | ||||||
Per share income tax effect of Europe legal entity reorganization(5) | — | — | (1.00 | ) | |||||||
Per share income tax impact of Non-GAAP adjustments(6) | 0.12 | (0.09 | ) | (0.03 | ) | ||||||
| Non-GAAP diluted earnings per share from continuing operations | $ | 3.56 | $ | 2.78 | $ | 2.60 | |||||
Liquidity and Capital Resources
We closely manage our liquidity and capital resources. Our liquidity requirements depend on key variables, including the level of investment required to support our business strategies, the performance of our business, capital expenditures, dividends, credit facilities, and short-term borrowing arrangements and working capital management. CapitalWe modify our approach to managing these variables as changes in our operating environment arise. For example, capital expenditures and share repurchases are a component of our cash flow and capital management strategy, which, to a large extent, we can adjust in response to economic and other changes in our business environment. We have a disciplined approach to capital allocation, which focuses on investing
Cash and cash equivalents were as follows ($ in key priorities that support our Renew Blue and Best Buy 2020: Building the New Blue strategies.millions):
February 3, 2024 | January 28, 2023 | ||||||
Cash and cash equivalents | $ | 1,447 | $ | 1,874 | |||
The following table summarizes ourdecrease in cash and cash equivalents in fiscal 2024 was primarily driven by dividend payments, capital expenditures and short-term investmentsshare repurchases. These decreases were partially offset by positive cash flows from operations, primarily driven by earnings.
Our cash deposits held at January 28, 2017,financial institutions may exceed the amount of insurance provided on such deposits. Generally, these deposits may be redeemed upon demand and January 30, 2016are maintained with financial institutions with reputable credit. We limit exposure relating to financial instruments by diversifying the financial instruments among various counterparties, which consist primarily of major financial institutions.
Cash Flows
Cash flows were as follows ($ in millions):
2024 | 2023 | 2022 | |||||||||
Total cash provided by (used in): | |||||||||||
Operating activities | $ | 1,470 | $ | 1,824 | $ | 3,252 | |||||
Investing activities | (781) | (962) | (1,372) | ||||||||
Financing activities | (1,144) | (1,806) | (4,297) | ||||||||
Effect of exchange rate changes on cash | (5) | (8) | (3) | ||||||||
Decrease in cash, cash equivalents and restricted cash | $ | (460) | $ | (952) | $ | (2,420) | |||||
| January 28, 2017 | January 30, 2016 | ||||||
| Cash and cash equivalents | $ | 2,240 | $ | 1,976 | |||
| Short-term investments | 1,681 | 1,305 | |||||
| Total cash and cash equivalents and short-term investments | $ | 3,921 | $ | 3,281 | |||
| 2017 | 2016 | 2015 | |||||||||
| Total cash provided by (used in): | |||||||||||
| Operating activities | $ | 2,545 | $ | 1,322 | $ | 1,935 | |||||
| Investing activities | (887 | ) | (419 | ) | (1,712 | ) | |||||
| Financing activities | (1,404 | ) | (1,515 | ) | (223 | ) | |||||
| Effect of exchange rate changes on cash | 10 | (38 | ) | (52 | ) | ||||||
| Increase (decrease) in cash and cash equivalents | $ | 264 | $ | (650 | ) | $ | (52 | ) | |||
Operating Activities
The decrease in cash provided by operating activities in fiscal 2016 compared to fiscal 20152024 was primarily due to the timing and volume of inventory receiptspurchases and payments, higher income tax payments. Duringpayments and lower earnings. This was partially offset by lower incentive compensation payments in the current year as a result of less favorable fiscal 2016, we decided to bring Holiday inventory in early2023 results, and the Super Bowl shifted to the first quarter of fiscal 2016, which caused us to hold our inventory longer and settle our accounts payable related to that inventory prior to year-end. In addition, we paid more income taxes in fiscal 2016 primarily due to the timing of when payments were made.
Investing Activities
Cash used in investing activities decreased in fiscal 2017 compared to fiscal 2016 was2024, primarily due to an increase in the net investment into short-term investments in fiscal 2017.
Financing Activities
The decrease in cash used in financing activities in fiscal 2017 compared to fiscal 20162024 was primarily due to a decline in the number of shares repurchased, which was substantially offsetdriven by the repayment of our $350 million principal amount of notes due March 15, 2016.
Sources of Liquidity
Funds generated by operating activities, available cash and cash equivalents, short-term investments, our credit facilities, and other debt arrangements and trade payables are our most significant sources of liquidity. We believe our sources of liquidity will be sufficient to fund operations and anticipated capital expenditures, share repurchases, dividends and strategic initiatives, share repurchases and dividends.including business combinations. However, in the event our liquidity is insufficient, we may be required to limit our spending. There can be no assurance that we will continue to generate cash flows at or above current levels or that we will be able to maintain our ability to borrow under our existing credit facilities or obtain additional financing, if necessary, on favorable terms.
On June 26, 2016,April 12, 2023, we entered into a $1.25 billion five-year senior unsecured revolving credit facility agreement (the "Five-Year“Five-Year Facility Agreement"Agreement”) with a syndicate of banks. The Five-Year Facility Agreement replaced the previous $1.25 billion senior unsecured revolving credit facility (the "Previous Facility"“Previous Facility”), with a syndicate of banks, which was originallyentered into in May 2021 and scheduled to expire in June 2019,May 2026, but was terminated on June 27, 2016.April 12, 2023. The Five-Year Facility Agreement permits borrowings of up to $1.25 billion and expires in June 2021. At January
Our ability to continue to access our revolving credit facility under the Five-Year Facility Agreement is subject to our compliance with theits terms and conditions, of the facility, including financial covenants. The financial covenants require us to maintain certain financial ratios. At January 28, 2017,As of February 3, 2024, we were in compliance with all such financial covenants. If an event of default were to occur with respect to any of our other debt, it would likely constitute an event of default under our facilitiesthe Five-Year Facility Agreement as well.
Our credit ratings and outlook as of pre-tax earnings before fixed charges (interest expense and the interest portion of rent expense) to fixed charges. Our interest coverage ratio, calculated as reportedMarch 13, 2024, remained unchanged from those disclosed in Exhibit No. 12.1 of thisour Annual Report on Form 10-K was 6.97for the fiscal year ended January 28, 2023, and 5.16 in fiscal 2017 and fiscal 2016, respectively.
Rating Agency | Rating | Outlook | ||
Standard & Poor's | BBB+ | Stable | ||
Moody's | A3 | Stable | ||
Credit rating agencies review their ratings periodically, and, therefore, the credit rating assigned to us by each agency may be subject to revision at any time. Accordingly, we are not able to predict whether our current credit ratings will remain as disclosed above. Factors that can affect our credit ratings include changes in our operating performance, the economic environment, conditions in the retail and consumer electronics industries, our financial position and changes in our business strategy. If further changes in our credit ratings were to occur, they could impact, among other things, interest costs for certain of our credit facilities, our future borrowing costs, access to capital markets, vendor financing terms and future new-store leasing costs.
Restricted Cash
Our liquidity is also affected by restricted cash balances that are pledged as collateral orprimarily restricted to use for general liability insurancecover product protection plans provided under our membership offerings and workers' compensation insurance.other self-insurance liabilities. Restricted cash, and cash equivalents related to our continuing operations, which areis included in otherOther current assets on our Consolidated Balance Sheets, remained relatively flat at $193stable in fiscal 2024, with balances of $346 million and $185$379 million atas of February 3, 2024, and January 28, 2017, and January 30, 2016,2023, respectively.
Capital Expenditures
Capital expenditures typically include investments in our stores, distribution capabilities and information technology enhancements (including e-commerce). During fiscal 2017, we invested $582 million in property and equipment, primarily related to upgrading our information technology systems and capabilities and store-related projects.
2024 | 2023 | 2022 | |||||||||
E-commerce and information technology | $ | 496 | $ | 540 | $ | 549 | |||||
Store-related projects(1) | 278 | 355 | 178 | ||||||||
Supply chain | 21 | 35 | 10 | ||||||||
Total capital expenditures | $ | 795 | $ | 930 | $ | 737 | |||||
| 2017 | 2016 | 2015 | |||||||||
| New stores | $ | 3 | $ | 5 | $ | 3 | |||||
Store-related projects(1) | 208 | 241 | 177 | ||||||||
| E-commerce and information technology | 371 | 390 | 355 | ||||||||
| Other | — | 13 | 16 | ||||||||
Total capital expenditures(2)(3) | $ | 582 | $ | 649 | $ | 551 | |||||
(1)Store-related projects are primarily comprised of store remodels and various merchandising projects.
We currently expect capital expenditures in fiscal 2025 of approximately $650$750 million to $700 million, with the focus on retail store, e-commerce and information technology projects.
Debt and Capital
As of February 3, 2024, we repaid our $350had $500 million of principal amount of notes due March 15, 2016 (the "2016 Notes"October 1, 2028 (“2028 Notes”), using existing cash resources. As and $650 million of January 28, 2017, we have $500 million principal amount of notes due AugustOctober 1, 2018 (the "2018 Notes"2030 (“2030 Notes”) and $650 million principal amount of notes due March 15, 2021 (the "2021 Notes") outstanding. . Refer to Note 5,
Share Repurchases and Dividends
We repurchase our common stock and pay dividends pursuant to programs approved by our BoardBoard. The payment of Directors ("Board").cash dividends is also subject to customary legal and contractual restrictions. Our long-term capital allocation strategy is to first fund operations and investments in growth and then return excess cash over time to shareholders through dividends and share repurchases while maintaining investment gradeinvestment-grade credit metrics.
On March 1, 2017, we announced our intent to repurchase $3.0 billion shares over the next two years. In order to execute this plan,February 28, 2022, our Board approved a new $5.0 billion share repurchase authorization in February 2017. Thisprogram, which replaced the $5.0 billion share repurchase program supersedes the previous $5.0 billion authorization dated June 2011, which had $2.2 billion remaining as of January 28, 2017.authorized on February 16, 2021. There is no expiration date governing the period over which we can repurchase shares under the February 2017 sharethis authorization.
Share repurchase program. Repurchasedand dividend activity were as follows ($ and shares are retired and constitute authorized but unissued shares.
2024 | 2023 | 2022 | |||||||||
Total cost of shares repurchased | $ | 340 | $ | 1,001 | $ | 3,504 | |||||
Average price per share | $ | 72.52 | $ | 84.78 | $ | 108.97 | |||||
Total number of shares repurchased | 4.7 | 11.8 | 32.2 | ||||||||
Regular quarterly cash dividends per share | $ | 3.68 | $ | 3.52 | $ | 2.80 | |||||
Cash dividends declared and paid | $ | 801 | $ | 789 | $ | 688 | |||||
| 2017 | 2016(1) | 2015 | |||||||||
| Total cost of shares repurchased | $ | 751 | $ | 1,000 | $ | — | |||||
| Average price per share | $ | 35.54 | $ | — | $ | — | |||||
| Number of shares repurchased | 21.1 | 32.8 | — | ||||||||
The total cost of shares repurchased decreased in |
Cash dividends is subject to customary legal and contractual restrictions. The following table presents our dividend activity for each of the past three fiscal years (in millions, except per share amounts):
| 2017 | 2016 | 2015 | |||||||||
| Regular quarterly cash dividends per share | $ | 1.12 | $ | 0.92 | $ | 0.72 | |||||
Special cash dividends per share(1) | 0.45 | 0.51 | — | ||||||||
| Total cash dividends per share | $ | 1.57 | $ | 1.43 | $ | 0.72 | |||||
| Cash dividends declared and paid | $ | 505 | $ | 499 | $ | 251 | |||||
Other Financial Measures
Our current ratio, calculated as current assets divided by current liabilities, was 1.5remained unchanged at 1.0 as of February 3, 2024, and January 28, 2017, compared to 1.4 at the end of fiscal 2016. The higher current ratio in fiscal 2017 was driven by an increase in cash and short-term investments, related to our higher earnings, and a decrease in current portion of long-term debt related to the payment of our 2016 Notes, partially offset by an increase in accounts payable related to the timing of our inventory purchases.
Our debt to earnings ratio, was 1.1calculated as total debt (including current portion) divided by net earnings over the trailing twelve months increased to 0.9 as of February 3, 2024, compared to 0.8 at January 28, 2017, compared to 2.1 as of January 30, 2016,2023, primarily due to higher earnings in the current year and a reduction in debt related to the payment of our 2016 Notes. Our non-GAAP debt to EBITDAR ratio, which includes capitalized operating lease obligations in its calculation, was 1.6 and 1.8 as of January 28, 2017, and January 30, 2016, respectively. The decrease in the ratio was due to a decrease in debt and capitalized operating lease obligations and an increase inlower net earnings.
2017(1) | 2016(1) | ||||||
| Debt (including current portion) | $ | 1,365 | $ | 1,734 | |||
Capitalized operating lease obligations (5 times rental expense)(2) | 3,872 | 3,916 | |||||
| Non-GAAP debt | $ | 5,237 | $ | 5,650 | |||
| Net earnings from continuing operations | $ | 1,207 | $ | 807 | |||
| Other income (expense) (including interest expense, net) | 38 | 65 | |||||
| Income tax expense | 609 | 503 | |||||
| Depreciation and amortization expense | 654 | 656 | |||||
| Rental expense | 774 | 783 | |||||
Restructuring charges and other(3) | 65 | 263 | |||||
| Non-GAAP EBITDAR | $ | 3,347 | $ | 3,077 | |||
| Debt to net earnings ratio | 1.1 | 2.1 | |||||
| Non-GAAP debt to EBITDAR ratio | 1.6 | 1.8 | |||||
Off-Balance-Sheet Arrangements and Contractual Obligations
We do not have anyoutstanding off-balance-sheet financing. A summaryarrangements. Contractual obligations as of our operating lease obligations by fiscal year is includedFebruary 3, 2024, were as follows ($ in the "Contractual Obligations" table below. Additionalmillions):
Payments Due by Period | |||||||||||||||||||
Contractual Obligations | Total | Less Than | 1-3 Years | 3-5 Years | More Than | ||||||||||||||
Purchase obligations(1) | $ | 3,181 | $ | 2,643 | $ | 337 | $ | 199 | $ | 2 | |||||||||
Operating lease obligations(2)(3) | 3,122 | 708 | 1,234 | 720 | 460 | ||||||||||||||
Long-term debt obligations(4) | 1,150 | - | - | 500 | 650 | ||||||||||||||
Interest payments(5) | 218 | 46 | 81 | 70 | 21 | ||||||||||||||
Finance lease obligations(2) | 39 | 16 | 16 | 4 | 3 | ||||||||||||||
Total | $ | 7,710 | $ | 3,413 | $ | 1,668 | $ | 1,493 | $ | 1,136 | |||||||||
For additional information regarding our operating leases is available in Item 2,
(1)Purchase obligations include agreements to purchase goods or services that are enforceable, are legally binding and specify all significant terms, including fixed or minimum quantities to be purchased; fixed, minimum or variable price provisions; and the approximate timing of the transaction. Purchase obligations do not include agreements that are cancelable without penalty. Additionally, although they do not contain legally binding purchase commitments, we included open purchase orders in the table presents information regarding our contractualabove. Substantially all open purchase orders are fulfilled within 30 days.
(2)Lease obligations exclude $118 million of legally binding fixed costs for leases signed but not yet commenced.
(3)Operating lease obligations exclude payments to landlords covering real estate taxes and common area maintenance. These charges, if included, would increase total operating lease obligations by $0.7 billion as of January 28, 2017, withFebruary 3, 2024.
(4)Long-term debt obligations represent principal amounts only and exclude interest rate swap valuation adjustments.
(5)Interest payments due by period ($ in millions):
| Payments Due by Period | ||||||||||||||||||||
| Contractual Obligations | Total | Less Than 1 Year | 1-3 Years | 3-5 Years | More Than 5 Years | |||||||||||||||
Long-term debt obligations(1) | $ | 1,150 | $ | — | $ | 500 | $ | 650 | $ | — | ||||||||||
| Capital lease obligations | 36 | 9 | 11 | 5 | 11 | |||||||||||||||
| Financing lease obligations | 226 | 46 | 76 | 48 | 56 | |||||||||||||||
Interest payments(2) | 192 | 60 | 87 | 45 | — | |||||||||||||||
Operating lease obligations(3) | 3,125 | 803 | 1,222 | 696 | 404 | |||||||||||||||
Purchase obligations(4) | 1,797 | 1,752 | 43 | 2 | — | |||||||||||||||
Unrecognized tax benefits(5) | 374 | |||||||||||||||||||
Deferred compensation(6) | 31 | |||||||||||||||||||
| Total | $ | 6,931 | $ | 2,670 | $ | 1,939 | $ | 1,446 | $ | 471 | ||||||||||
Additionally, we have $1.25 billion in undrawn capacity on our credit facilities at January 28, 2017,Five-Year Facility Agreement as of February 3, 2024, which, if drawn upon, would be included asin either short-term or long-term debt inon our Consolidated Balance Sheets.
Critical Accounting Estimates
The preparation of our financial statements requires us to make assumptions and estimates about future events and apply judgments that affect the reported amounts of assets, liabilities, revenue, expenses and the related disclosures. We base our assumptions, estimates and judgments on historical experience, current trends and other factors that management believesbelieved to be relevant at the time our consolidated financial statements are prepared. On a regular basis, we review the accounting policies, assumptions, estimates and judgments to ensure that our financial statements are presented fairly and in accordance with GAAP. However, becauseBecause future events and their effects cannot be determined with certainty, actual results could differ from our assumptions and estimates, and such differences could be material.
Our significant accounting policies are discussed in Note 1,
Summary of Significant Accounting Policies, of the Notes to Consolidated Financial Statements, included in Item 8, Financial Statements and Supplementary Data, of this Annual Report on Form 10-K. We have not made any material changes to our accounting policies or methodologies during the past three fiscal years. We believe that the following accounting estimates are the most critical to aid in fully understanding and evaluating our reported financial results. These estimates require our most difficult, subjective or complex judgmentsVendor Allowances
Description
We receive funds from our merchandise vendors through a variety of programs and arrangements, primarily in the form of purchases-based or sales-based volumes and for product advertising and placement. We recognize allowances based on purchases and sales as a reduction of cost of sales when the associated inventory is sold. Allowances for advertising and placement are recognized as a reduction of cost of sales ratably over the corresponding performance period. Funds that are inherently uncertain. determined to be a reimbursement of specific, incremental and identifiable costs incurred to sell a vendor's products are recorded as an offset to the related expense within SG&A when incurred.
Judgments and uncertainties involved in the estimate
Due to the quantity and diverse nature of our vendor agreements, estimates are made to determine the amount of funding to be recognized in earnings or deferred as an offset to inventory. These estimates require a detailed analysis of complex factors, including proper classification of the type of funding received and the methodology to estimate the portion of purchases-based funding that should be recognized in cost of sales in each period, which considers factors such as inventory turn by product category and actual sell-through of inventory.
Effect if actual results differ from assumptions
A 10% change in our vendor funding deferral as of February 3, 2024, would have affected net earnings by approximately $44 million in fiscal 2024. The level of vendor funding deferral has remained relatively stable over the last three fiscal years.
Goodwill
Description
Goodwill is evaluated for impairment annually in the fiscal fourth quarter or whenever events or circumstances indicate the carrying value may not be recoverable. The impairment test involves a comparison of the fair value of each reporting unit with its carrying value. Fair value reflects our estimate of the price a potential market participant would be willing to pay for the reporting unit in an arms-length transaction.
We have reviewed these critical accountinggoodwill in two reporting units – Best Buy Domestic (comprising our core U.S. Best Buy business) and Best Buy Health – with carrying values of $492 million and $891 million, respectively, as of February 3, 2024.
Judgments and uncertainties involved in the estimate
Determining the fair value of a reporting unit requires complex analysis and judgment. We use a combination of discounted cash flow (“DCF”) models and market data, such as revenue multiples and quoted market prices, for observable comparable companies. DCF models require detailed forecasts of cash flow drivers, such as revenue growth rates, margin rates and capital investments and estimates and related disclosures withof weighted-average cost of capital rates. These estimates incorporate many uncertain factors, such as the Audit Committeeeffectiveness of our Board.
Effects if actual results differ from assumptions
For our Best Buy Domestic reporting unit, fair value exceeded book value by a substantial margin in fiscal 2024 and fiscal 2023. Barring a fundamental, material deterioration of macroeconomic factors, we have not made any material changesbelieve the risk of future goodwill impairment within our Best Buy Domestic reporting unit is remote.
Our Best Buy Health reporting unit is subject to a greater level of uncertainty, since it operates in a less mature, rapidly-changing and high-growth environment. For fiscal 2024, the accounting methodologiesfair value of the Best Buy Health reporting unit exceeded its book value by approximately 30%, compared to approximately 40% in fiscal 2023. The primary reason for the areas described below.
Inventory
Description
We value our inventory at the lower of cost or marketnet realizable value through the establishment of markdown and inventory lossmarkdown adjustments. Markdown adjustments reflect the excess of cost over the net proceedsrecovery we expect to realize from the ultimate sale or other disposal of inventory and establish a new cost basis. Subsequent changes in facts or circumstances do not resultNo adjustment is recorded for inventory that we expect to return to our vendors for full credit.
Judgments and uncertainties involved in the reversal of previously recorded markdowns or an increase in that newly established cost basis. estimate
Markdown adjustments involve uncertainty because the calculations require management to make assumptions and to apply judgment regardingabout the expected revenue and incremental costs we will generate for selling current inventory. Such estimates include the evaluation of historical recovery rates, as well as factors such as forecastproduct type and condition, forecasted consumer demand, theproduct lifecycles, promotional environment, vendor return rights and technological obsolescence.
Effect if actual outcomes are different than we anticipated, we may be exposed to losses or gains that could be material. results differ from assumptions
A 10% change in our markdown adjustment at January 28, 2017,as of February 3, 2024, would have affected net earnings by approximately $8$11 million in fiscal 2017.
Tax Contingencies
Description
Our income tax returns like those of most companies, are periodically auditedroutinely examined by domestic and foreign tax authorities. These audits include questions regardingTaxing authorities audit our tax filing positions, including the timing and amount of income and deductions and the allocation of income among various tax jurisdictions. At any one time, manymultiple tax years are subject to audit by the various taxtaxing authorities. In evaluating the exposures associated with our various tax filing positions, we may record a liability for such exposures. A number of years may elapse before a particular matter, for which we have established a liability, is audited and fully resolved or clarified. We adjust our liability for unrecognized tax benefits and income tax provisions in the period in which an uncertain tax position is effectively settled, the statute of limitations expires for the relevant taxing authority to examine the tax position or when more information becomes available.
Judgments and uncertainties involved in the estimate
Our liability for unrecognized tax benefits contains uncertainties because management is required to make assumptions and apply judgment to estimate the exposures associated with our various tax filing positions. Such assumptions can include complex and uncertain external factors, such as changes in tax law, interpretations of tax law and the timing of such changes, and uncertain internal factors such as taxable earnings by jurisdiction, the magnitude and timing of certain transactions and capital spending.
Effect if actual results differ from assumptions
Although we believe that the judgments and estimates discussed herein are reasonable, actual results could differ, and we may be exposed to losses or gains that could be material.
Service Revenue
Description
We sell membership plans that include access to benefits such as technical support, price discounts on certain products and services and product protection plans. We allocate the transaction price to all performance obligations identified in the contract based on their relative fair value. For performance obligations provided over the term of the contract, we typically recognize revenue on a usage basis, an input method of measuring progress over the related contract term. This method involves the estimation of expected usage patterns, primarily derived from historical information.
Judgments and uncertainties involved in the estimate
Estimates involve complex calculations and judgment, for example, in estimating the relative standalone selling price for bundled performance obligations; the appropriate recognition methodology for each performance obligation; and, for those based on usage, the expected pattern of consumption across a large portfolio of customers. When insufficient reliable and relevant history is available to estimate usage, we generally recognize revenue ratably over the life of the contract until such history has accumulated.
Effect if actual results differ from assumptions
A 10% change in the amount of services membership deferred revenue as of February 3, 2024, would have affected net earnings by approximately $44 million in fiscal 2024. The amount of services membership deferred revenue has increased over the last three fiscal years, primarily driven by the national launch of our Best Buy Total membership offering, which resulted in higher membership sales and the initial deferral of more revenue than under the previous offerings.
New Accounting Pronouncements
For a description of applicable new accounting pronouncements, including our assessment of the impact on our financial statements, see Note 1, Summary of Significant Accounting Policies, of the Notes to Consolidated Financial Statements, included in Item 8, Financial Statements and Supplementary Data, of this Annual Report on Form 10-K.
Item 7A. Quantitative and Qualitative Disclosures About Market Risk.
In addition to the risks inherent in our operations, we are exposed to certain market risks.
Interest Rate Risk
We are exposed to changes in short-term market interest rates and these changes in rates will impact our net interest expense. Our cash, cash equivalents and short-term investmentsrestricted cash generate interest income that will vary based on changes in short-term interest rates. In addition, we have swapped a portion of our fixed-rate debt to floating-ratefloating rate such that the interest expense on this debt will vary with short-term interest rates. Refer to Note 5,
As of January 28, 2017,February 3, 2024, we had $3.9$1.8 billion of cash, cash equivalents and short-term investmentsrestricted cash and $750 million$0.5 billion of debt that has been swapped to floating rate. Therefore, we hadrate, and therefore the net cash and short-term investments of $3.2 billion generating income, which isasset balance exposed to interest rate changes.changes was $1.3 billion. As of January 28, 2017,February 3, 2024, a 50 basis50-basis point increase in short-term interest rates would leadhave led to an estimated $16$6 million reductionincrease in net interest expense,income, and conversely a 50 basis50-basis point decrease in short-term interest rates would leadhave led to an estimated $16$6 million increasedecrease in net interest expense.
Foreign Currency Exchange Rate Risk
We have market risk arising from changes in foreign currency exchange rates related to operations in our International segment operations.segment. On a limited basis, we utilize foreign exchangecurrency forward contracts to manage foreign currency exposure to certain forecasted inventory purchases, recognized receivable and payable balances and our investment in our Canadian operations. Our primary objective in holding derivatives is to reduce the volatility of net earnings and cash flows, as well as net asset value associated with changes in foreign currency exchange rates. Our foreign currency risk management strategy includes both hedging instruments and derivatives that are not designated as hedging instruments, which generally have terms of up to 12 months.instruments. Refer to Note 6,
During fiscal 2024, foreign currency exchange rate fluctuations were primarily driven by the strength of the U.S. dollar compared to the Canadian dollar and Mexican peso compared to the prior-year period, which had a negative overall impact on our revenue as these currenciesthis foreign currency revenue translated into fewerless U.S. dollars. We estimate that foreign currency exchange rate fluctuations had a net unfavorable impact on our revenue in fiscal 2017 of approximately $76 million and a net favorable impact on earnings of $4 million. In fiscal 2016, the impact of foreign currency exchange rate fluctuations had a netan unfavorable impact on our revenue of approximately $534 million and a$90 million. The impact of foreign exchange rate fluctuations on our net favorable impact on earnings of $20 million.in fiscal 2024 was not significant.
Item 8. Financial Statements and Supplementary Data.
Management's Report on the Consolidated Financial Statements
Our management is responsible for the preparation, integrity and objectivity of the accompanying consolidated financial statements and the related financial information. The consolidated financial statements have been prepared in conformity with GAAP and necessarily include certain amounts that are based on estimates and informed judgments. Our management also prepared the related financial information included in this Annual Report on Form 10-K and is responsible for its accuracy and consistency with the consolidated financial statements.
The accompanying consolidated financial statements have been audited by Deloitte & Touche LLP, an independent registered public accounting firm, which conducted its audits in accordance with the standards of the Public Company Accounting Oversight Board (United States). The independent registered public accounting firm's responsibility is to express an opinion as to whether such consolidated financial statements present fairly, in all material respects, our financial position, results of operations and cash flows in accordance with GAAP.
Management's Report on Internal Control Over Financial Reporting
Our management is responsible for establishing and maintaining adequate internal control over financial reporting (as defined in Rule 13a-15(f) under the Exchange Act). Our internal control over financial reporting is designed under the supervision of our principal executive officer and principal financial officer, and effected by our Board, management and other personnel, to provide reasonable assurance regarding the reliability of financial reporting and the preparation of financial statements for external purposes in accordance with GAAP, and includes those policies and procedures that:
(1)pertain to the maintenance of records that in reasonable detail accurately and fairly reflect our transactions and the dispositions of our assets;
(2)provide reasonable assurance that our transactions are recorded as necessary to permit preparation of financial statements in accordance with GAAP and that our receipts and expenditures are being made only in accordance with authorizations of our management and Board; and
(3)provide reasonable assurance regarding prevention or timely detection of unauthorized acquisition, use or disposition of our assets that could have a material effect on our financial statements.
Because of its inherent limitations, internal control over financial reporting may not prevent or detect misstatements. Therefore, even those systems determined to be effective can provide only reasonable assurance with respect to financial statement preparation and presentation.
Under the supervision and with the participation of our management, including our principal executive officer and principal financial officer, we assessed the effectiveness of our internal control over financial reporting as of
 |  | |
REPORT OF INDEPENDENT REGISTERED PUBLIC ACCOUNTING FIRM
To the shareholders and the Board of Directors and Shareholders of
Best Buy Co., Inc.
Richfield, Minnesota
Opinion on the Financial Statements
We have audited the accompanying consolidated balance sheets of Best Buy Co., Inc. and subsidiaries (the “Company”"Company") as of February 3, 2024 and January 28, 2017 and January 30, 2016, and2023, the related consolidated statements of earnings, comprehensive income, cash flows and changes in shareholders’ equity for each of the three years in the period ended February 3, 2024, and the related notes (collectively referred to as the "financial statements"). In our opinion, the financial statements present fairly, in all material respects, the financial position of the Company as of February 3, 2024 and January 28, 2023, and the results of its operations and its cash flows for each of the three years in the period ended January 28, 2017. Our audits also included the financial statement schedule listedFebruary 3, 2024, in conformity with accounting principles generally accepted in the Index at Item 15. These financial statements and financial statement schedule are the responsibilityUnited States of the Company’s management. Our responsibility is to express an opinion on the financial statements and financial statement schedule based on our audits.
We conducted our auditshave also audited, in accordance with the standards of the Public Company Accounting Oversight Board (United States). (PCAOB), the Company's internal control over financial reporting as of February 3, 2024, based on criteria established in Internal Control — Integrated Framework (2013) issued by the Committee of Sponsoring Organizations of the Treadway Commission and our report dated March 15, 2024, expressed an unqualified opinion on the Company's internal control over financial reporting.
Basis for Opinion
These financial statements are the responsibility of the Company's management. Our responsibility is to express an opinion on the Company's financial statements based on our audits. We are a public accounting firm registered with the PCAOB and are required to be independent with respect to the Company in accordance with the U.S. federal securities laws and the applicable rules and regulations of the Securities and Exchange Commission and the PCAOB.
We conducted our audits in accordance with the standards of the PCAOB. Those standards require that we plan and perform the audit to obtain reasonable assurance about whether the financial statements are free of material misstatement. An audit includesmisstatement, whether due to error or fraud. Our audits included performing procedures to assess the risks of material misstatement of the financial statements, whether due to error or fraud, and performing procedures that respond to those risks. Such procedures included examining, on a test basis, evidence supportingregarding the amounts and disclosures in the financial statements. An auditOur audits also includes assessingincluded evaluating the accounting principles used and significant estimates made by management, as well as evaluating the overall presentation of the financial statement presentation.statements. We believe that our audits provide a reasonable basis for our opinion.
Critical Audit Matters
The critical audit matters communicated below are matters arising from the current-period audit of the financial statements that were communicated or required to be communicated to the audit committee and that (1) relate to accounts or disclosures that are material to the financial statements and (2) involved our especially challenging, subjective, or complex judgments. The communication of critical audit matters does not alter in any way our opinion such consolidated financial statements present fairly, in all material respects,on the financial position of Best Buy Co., Inc. and subsidiaries as of January 28, 2017 and January 30, 2016, and the results of their operations and their cash flows for each of the three years in the period ended January 28, 2017, in conformity with accounting principles generally accepted in the United States of America. Also, in our opinion, such financial statement schedule, when considered in relation to the basic consolidated financial statements, taken as a whole, present fairly, in all material respects,and we are not, by communicating the information set forth therein.
Vendor Allowances – Domestic Reporting Segment — Refer to Note 1 to the financial statements
Critical Audit Matter Description
The Company receives vendor allowances from certain merchandise vendors through a variety of programs intended to offset the invoice cost of inventory and for promoting and selling merchandise inventory. Allowances based on purchases are initially deferred and recorded as a reduction of merchandise inventory and are recognized as a reduction to cost of sales when the associated inventory is sold. Allowances based on sales volumes are based on merchandise sold and are calculated using an agreed upon amount for each unit sold and recognized as a reduction to cost of sales when the associated inventory is sold. Other promotional allowances not specifically related to volume of purchases or sales, such as advertising and placement, are recognized as a reduction to cost of sales ratably over the corresponding performance period.
Given the significance of vendor allowances recorded by the Domestic Reporting Segment to the financial statements and the volume and diversity of individual vendor agreements, auditing these vendor allowances was complex and subjective due to the extent of effort required to evaluate whether these vendor allowances were recorded in accordance with the standardsterms of the Public Company Accounting Oversight Board (United States),vendor agreements and that these allowances deferred as an offset to inventory were complete and accurate.
How the Company’s internal controlCritical Audit Matter Was Addressed in the Audit
Our audit procedures related to evaluating whether these vendor allowances were recorded in accordance with the terms of the vendor agreements and the completeness and accuracy of deferred vendor allowances included the following, among others:
We tested the effectiveness of controls over financial reportingthe recording of these vendor allowances, including management's controls over the establishment of vendor arrangements, the calculation of vendor allowances earned, and the determination of the deferred vendor allowances recorded as a reduction to inventory.
We selected a sample of January 28, 2017,these vendor allowances recorded as a reduction of cost of sales and (1) recalculated the amount recognized using the terms of the vendor agreement; (2) evaluated, based on the criteria established in Internal Control-Integrated Framework (2013) issued by the Committee of Sponsoring Organizationsterms of the Treadway Commissionagreement, if the amount should be deferred and recorded as a reduction of merchandise inventory; and (3) tested the settlement of the arrangement.
We tested the amount of these deferred vendor allowances recorded as a reduction to inventory by developing an expectation for the amount and comparing our report dated March 24, 2017, expressedexpectation to the amount recorded by management.
Goodwill – Best Buy Health Reporting Unit — Refer to Note 1 to the financial statements
Critical Audit Matter Description
The Company’s evaluation of goodwill for impairment involves the comparison of the fair value of each reporting unit to its carrying value. The goodwill balance was $1,383 million as of February 3, 2024, of which $891 million was related to the Best Buy Health reporting unit. The Company uses a combination of the discounted cash flow model and market data to estimate the fair value of the Best Buy Health reporting unit. The discounted cash flow model requires management to make subjective estimates and assumptions related to forecasts of cash flows, such as revenue growth rates and margin rates, and estimates of the weighted average cost of capital rate. Changes in these assumptions could have a significant impact on either the fair value, the amount of any goodwill impairment charge, or both. The fair value of the Best Buy Health reporting unit exceeded its carrying value as of the measurement date and, therefore, no impairment was recognized.
Given the significant judgments made by management to estimate the fair value of the Best Buy Health reporting unit, performing audit procedures to evaluate the reasonableness of management’s estimates and assumptions related to the forecasts of cash flows, such as revenue growth rates and margin rates, and estimates of the weighted average cost of capital rate, required a high degree of auditor judgment and an unqualified opinion onincreased extent of effort, including the need to involve our fair value specialists.
How the Critical Audit Matter Was Addressed in the Audit
Our audit procedures related to the forecasts of cash flows, such as revenue growth rates and margin rates, and estimates of the weighted average cost of capital rate used by management to estimate the fair value of the Best Buy Health reporting unit included the following, among others:
We tested the effectiveness of controls over management’s goodwill impairment evaluation, including those over the determination of the fair value of the Best Buy Health reporting unit, such as controls related to management’s forecasts of future revenue and margin rates, and estimates of the weighted average cost of capital rate.
We evaluated management’s ability to accurately forecast future revenues and margin rates by comparing actual results to management’s historical forecasts.
We evaluated the reasonableness of management’s revenue forecasts and margin rates by comparing the forecasts to: (1) the Company’s historical revenue growth rates, including, for new products and services, similar existing products and services; (2) internal control over financial reporting.

We inquired of operating and sales management teams to determine whether the judgments and assumptions used in the future revenue projections were consistent with the strategy and long-range plans for the Best Buy Health reporting unit.
With the assistance of our fair value specialists, we evaluated the reasonableness of the weighted average cost of capital rate by: (1) testing the mathematical accuracy of the calculations; and (2) developing a range based upon our independent estimate and comparing the rate selected by management to that range.
/s/ Deloitte & Touche LLP
Minneapolis, Minnesota
March 15, 2024
We have served as the Company's auditor since 2005.
REPORT OF INDEPENDENT REGISTERED PUBLIC ACCOUNTING FIRM
To the shareholders and the Board of Directors and Shareholders of
Best Buy Co., Inc.
Richfield, Minnesota
Opinion on Internal Control over Financial Reporting
We have audited the internal control over financial reporting of Best Buy Co., Inc. and subsidiaries (the “Company”), as of January 28, 2017,February 3, 2024, based on criteria established in
We have also audited, in accordance with the standards of the Public Company Accounting Oversight Board (United States) (PCAOB), the consolidated financial statements as of and for the year ended February 3, 2024, of the Company and our report dated March 15, 2024, expressed an unqualified opinion on those financial statements.
Basis for Opinion
The Company’s management is responsible for maintaining effective internal control over financial reporting and for its assessment of the effectiveness of internal control over financial reporting, included in the accompanying
We conducted our audit in accordance with the standards of the Public Company Accounting Oversight Board (United States).PCAOB. Those standards require that we plan and perform the audit to obtain reasonable assurance about whether effective internal control over financial reporting was maintained in all material respects. Our audit included obtaining an understanding of internal control over financial reporting, assessing the risk that a material weakness exists, testing and evaluating the design and operating effectiveness of internal control based on the assessed risk, and performing such other procedures as we considered necessary in the circumstances. We believe that our audit provides a reasonable basis for our opinion.
Definition and Limitations of Internal Control over Financial Reporting
A company’s internal control over financial reporting is a process designed by, or under the supervision of, the company’s principal executive and principal financial officers, or persons performing similar functions, and effected by the company’s board of directors, management, and other personnel to provide reasonable assurance regarding the reliability of financial reporting and the preparation of financial statements for external purposes in accordance with generally accepted accounting principles. A company’s internal control over financial reporting includes those policies and procedures that (1) pertain to the maintenance of records that, in reasonable detail, accurately and fairly reflect the transactions and dispositions of the assets of the company; (2) provide reasonable assurance that transactions are recorded as necessary to permit preparation of financial statements in accordance with generally accepted accounting principles, and that receipts and expenditures of the company are being made only in accordance with authorizations of management and directors of the company; and (3) provide reasonable assurance regarding prevention or timely detection of unauthorized acquisition, use, or disposition of the company’s assets that could have a material effect on the financial statements.
Because of theits inherent limitations, of internal control over financial reporting including the possibility of collusion or improper management override of controls, material misstatements due to error or fraud may not be preventedprevent or detected on a timely basis.detect misstatements. Also, projections of any evaluation of the effectiveness of the internal control over financial reporting to future periods are subject to the risk that the controls may become inadequate because of changes in conditions, or that the degree of compliance with the policies or procedures may deteriorate.
/s/ Deloitte & Touche LLP
Minneapolis, Minnesota
March 15, 2024
Consolidated Balance Sheets
$ in millions, except per share and share amounts
February 3, 2024 | January 28, 2023 | ||||||
Assets | |||||||
Current assets | |||||||
Cash and cash equivalents | $ | 1,447 | $ | 1,874 | |||
Receivables, net | 939 | 1,141 | |||||
Merchandise inventories | 4,958 | 5,140 | |||||
Other current assets | 553 | 647 | |||||
Total current assets | 7,897 | 8,802 | |||||
Property and equipment | |||||||
Land and buildings | 702 | 688 | |||||
Leasehold improvements | 2,275 | 2,260 | |||||
Fixtures and equipment | 4,002 | 3,928 | |||||
Property under finance leases | 97 | 100 | |||||
Gross property and equipment | 7,076 | 6,976 | |||||
Less accumulated depreciation | 4,816 | 4,624 | |||||
Net property and equipment | 2,260 | 2,352 | |||||
Operating lease assets | 2,758 | 2,746 | |||||
Goodwill | 1,383 | 1,383 | |||||
Other assets | 669 | 520 | |||||
Total assets | $ | 14,967 | $ | 15,803 | |||
Liabilities and equity | |||||||
Current liabilities | |||||||
Accounts payable | $ | 4,637 | $ | 5,687 | |||
Unredeemed gift card liabilities | 253 | 274 | |||||
Deferred revenue | 1,000 | 1,116 | |||||
Accrued compensation and related expenses | 486 | 405 | |||||
Accrued liabilities | 902 | 843 | |||||
Current portion of operating lease liabilities | 618 | 638 | |||||
Current portion of long-term debt | 13 | 16 | |||||
Total current liabilities | 7,909 | 8,979 | |||||
Long-term operating lease liabilities | 2,199 | 2,164 | |||||
Long-term liabilities | 654 | 705 | |||||
Long-term debt | 1,152 | 1,160 | |||||
Contingencies and commitments (Note 13) |
|
| |||||
Equity | |||||||
Best Buy Co., Inc. Shareholders' Equity | |||||||
Preferred stock, $1.00 par value: Authorized - 400,000 shares; Issued and outstanding - none | - | - | |||||
Common stock, $0.10 par value: Authorized - 1.0 billion shares; Issued and outstanding - 215.4 million and 218.1 million shares, respectively | 22 | 22 | |||||
Additional paid-in capital | 31 | 21 | |||||
Retained earnings | 2,683 | 2,430 | |||||
Accumulated other comprehensive income | 317 | 322 | |||||
Total equity | 3,053 | 2,795 | |||||
Total liabilities and equity | $ | 14,967 | $ | 15,803 | |||
| January 28, 2017 | January 30, 2016 | |||||||
| Assets | ||||||||
| Current Assets | ||||||||
| Cash and cash equivalents | $ | 2,240 | $ | 1,976 | ||||
| Short-term investments | 1,681 | 1,305 | ||||||
| Receivables, net | 1,347 | 1,162 | ||||||
| Merchandise inventories | 4,864 | 5,051 | ||||||
| Other current assets | 384 | 392 | ||||||
| Total current assets | 10,516 | 9,886 | ||||||
| Property and Equipment | ||||||||
| Land and buildings | 618 | 613 | ||||||
| Leasehold improvements | 2,227 | 2,220 | ||||||
| Fixtures and equipment | 4,998 | 5,002 | ||||||
| Property under capital and financing leases | 300 | 272 | ||||||
| 8,143 | 8,107 | |||||||
| Less accumulated depreciation | 5,850 | 5,761 | ||||||
| Net property and equipment | 2,293 | 2,346 | ||||||
| Goodwill | 425 | 425 | ||||||
| Other Assets | 622 | 831 | ||||||
| Non-current assets held for sale | — | 31 | ||||||
| Total Assets | $ | 13,856 | $ | 13,519 | ||||
| Liabilities and Equity | ||||||||
| Current Liabilities | ||||||||
| Accounts payable | $ | 4,984 | $ | 4,450 | ||||
| Unredeemed gift card liabilities | 427 | 409 | ||||||
| Deferred revenue | 418 | 357 | ||||||
| Accrued compensation and related expenses | 358 | 384 | ||||||
| Accrued liabilities | 865 | 802 | ||||||
| Accrued income taxes | 26 | 128 | ||||||
| Current portion of long-term debt | 44 | 395 | ||||||
| Total current liabilities | 7,122 | 6,925 | ||||||
| Long-Term Liabilities | 704 | 877 | ||||||
| Long-Term Debt | 1,321 | 1,339 | ||||||
| Contingencies and Commitments (Note 12) | ||||||||
| Equity | ||||||||
| Best Buy Co., Inc. Shareholders' Equity | ||||||||
| Preferred stock, $1.00 par value: Authorized — 400,000 shares; Issued and outstanding — none | — | — | ||||||
| Common stock, $0.10 par value: Authorized — 1.0 billion shares; Issued and outstanding — 311,108,000 and 323,779,000 shares, respectively | 31 | 32 | ||||||
| Prepaid share repurchase | — | (55 | ) | |||||
| Additional paid-in capital | — | — | ||||||
| Retained earnings | 4,399 | 4,130 | ||||||
| Accumulated other comprehensive income | 279 | 271 | ||||||
| Total equity | 4,709 | 4,378 | ||||||
| Total Liabilities and Equity | $ | 13,856 | $ | 13,519 | ||||
See Notes to Consolidated Financial Statements.
Consolidated Statements of Earnings
$ and shares in millions, except per share amounts
Fiscal Years Ended | February 3, 2024 | January 28, 2023 | January 29, 2022 | ||||||||
Revenue | $ | 43,452 | $ | 46,298 | $ | 51,761 | |||||
Cost of sales | 33,849 | 36,386 | 40,121 | ||||||||
Gross profit | 9,603 | 9,912 | 11,640 | ||||||||
Selling, general and administrative expenses | 7,876 | 7,970 | 8,635 | ||||||||
Restructuring charges | 153 | 147 | (34) | ||||||||
Operating income | 1,574 | 1,795 | 3,039 | ||||||||
Other income (expense): | |||||||||||
Gain on sale of subsidiary, net | 21 | - | - | ||||||||
Investment income and other | 78 | 28 | 10 | ||||||||
Interest expense | (52) | (35) | (25) | ||||||||
Earnings before income tax expense and equity in income of affiliates | 1,621 | 1,788 | 3,024 | ||||||||
Income tax expense | 381 | 370 | 574 | ||||||||
Equity in income of affiliates | 1 | 1 | 4 | ||||||||
Net earnings | $ | 1,241 | $ | 1,419 | $ | 2,454 | |||||
Basic earnings per share | $ | 5.70 | $ | 6.31 | $ | 9.94 | |||||
Diluted earnings per share | $ | 5.68 | $ | 6.29 | $ | 9.84 | |||||
Weighted-average common shares outstanding: | |||||||||||
Basic | 217.7 | 224.8 | 246.8 | ||||||||
Diluted | 218.5 | 225.7 | 249.3 | ||||||||
| Fiscal Years Ended | January 28, 2017 | January 30, 2016 | January 31, 2015 | |||||||||
| Revenue | $ | 39,403 | $ | 39,528 | $ | 40,339 | ||||||
| Cost of goods sold | 29,963 | 30,334 | 31,292 | |||||||||
| Restructuring charges — cost of goods sold | — | 3 | — | |||||||||
| Gross profit | 9,440 | 9,191 | 9,047 | |||||||||
| Selling, general and administrative expenses | 7,547 | 7,618 | 7,592 | |||||||||
| Restructuring charges | 39 | 198 | 5 | |||||||||
| Operating income | 1,854 | 1,375 | 1,450 | |||||||||
| Other income (expense) | ||||||||||||
| Gain on sale of investments | 3 | 2 | 13 | |||||||||
| Investment income and other | 31 | 13 | 14 | |||||||||
| Interest expense | (72 | ) | (80 | ) | (90 | ) | ||||||
| Earnings from continuing operations before income tax expense | 1,816 | 1,310 | 1,387 | |||||||||
| Income tax expense | 609 | 503 | 141 | |||||||||
| Net earnings from continuing operations | 1,207 | 807 | 1,246 | |||||||||
| Gain (loss) from discontinued operations (Note 2), net of tax expense of $7, $1 and $0 | 21 | 90 | (11 | ) | ||||||||
| Net earnings including noncontrolling interests | 1,228 | 897 | 1,235 | |||||||||
| Net earnings from discontinued operations attributable to noncontrolling interests | — | — | (2 | ) | ||||||||
| Net earnings attributable to Best Buy Co., Inc. shareholders | $ | 1,228 | $ | 897 | $ | 1,233 | ||||||
| Basic earnings (loss) per share attributable to Best Buy Co., Inc. shareholders | ||||||||||||
| Continuing operations | $ | 3.79 | $ | 2.33 | $ | 3.57 | ||||||
| Discontinued operations | 0.07 | 0.26 | (0.04 | ) | ||||||||
| Basic earnings per share | $ | 3.86 | $ | 2.59 | $ | 3.53 | ||||||
| Diluted earnings (loss) per share attributable to Best Buy Co., Inc. shareholders | ||||||||||||
| Continuing operations | $ | 3.74 | $ | 2.30 | $ | 3.53 | ||||||
| Discontinued operations | 0.07 | 0.26 | (0.04 | ) | ||||||||
| Diluted earnings per share | $ | 3.81 | $ | 2.56 | $ | 3.49 | ||||||
| Weighted-average common shares outstanding | ||||||||||||
| Basic | 318.5 | 346.5 | 349.5 | |||||||||
| Diluted | 322.6 | 350.7 | 353.6 | |||||||||
See Notes to Consolidated Financial Statements.
Consolidated Statements of Comprehensive Income
$ in millions
Fiscal Years Ended | February 3, 2024 | January 28, 2023 | January 29, 2022 | ||||||||
Net earnings | $ | 1,241 | $ | 1,419 | $ | 2,454 | |||||
Foreign currency translation adjustments, net of tax | (5) | (7) | 1 | ||||||||
Comprehensive income | $ | 1,236 | $ | 1,412 | $ | 2,455 | |||||
| Fiscal Years Ended | January 28, 2017 | January 30, 2016 | January 31, 2015 | |||||||||
| Net earnings including noncontrolling interests | $ | 1,228 | $ | 897 | $ | 1,235 | ||||||
| Foreign currency translation adjustments | 10 | (44 | ) | (103 | ) | |||||||
| Unrealized loss on available-for-sale investments | — | — | (3 | ) | ||||||||
| Reclassification of foreign currency translations adjustments into earnings due to sale of business | (2 | ) | (67 | ) | — | |||||||
| Reclassification of gains on available-for-sale investments into earnings | — | — | (4 | ) | ||||||||
| Comprehensive income including noncontrolling interests | 1,236 | 786 | 1,125 | |||||||||
| Comprehensive income attributable to noncontrolling interests | — | — | (2 | ) | ||||||||
| Comprehensive income attributable to Best Buy Co., Inc. shareholders | $ | 1,236 | $ | 786 | $ | 1,123 | ||||||
See Notes to Consolidated Financial Statements.
Consolidated Statements of Cash Flows
$ in millions
Fiscal Years Ended | February 3, 2024 | January 28, 2023 | January 29, 2022 | ||||||||
Operating activities | |||||||||||
Net earnings | $ | 1,241 | $ | 1,419 | $ | 2,454 | |||||
Adjustments to reconcile net earnings to total cash provided by operating activities: | |||||||||||
Depreciation and amortization | 923 | 918 | 869 | ||||||||
Restructuring charges | 153 | 147 | (34) | ||||||||
Stock-based compensation | 145 | 138 | 141 | ||||||||
Deferred income taxes | (214) | 51 | 14 | ||||||||
Gain on sale of subsidiary, net | (21) | - | - | ||||||||
Other, net | 26 | 12 | 11 | ||||||||
Changes in operating assets and liabilities, net of acquired assets and liabilities: | |||||||||||
Receivables | 204 | (103) | 17 | ||||||||
Merchandise inventories | 178 | 809 | (328) | ||||||||
Other assets | (18) | (21) | (14) | ||||||||
Accounts payable | (1,025) | (1,099) | (201) | ||||||||
Income taxes | 52 | 36 | (156) | ||||||||
Other liabilities | (174) | (483) | 479 | ||||||||
Total cash provided by operating activities | 1,470 | 1,824 | 3,252 | ||||||||
Investing activities | |||||||||||
Additions to property and equipment | (795) | (930) | (737) | ||||||||
Purchases of investments | (9) | (46) | (233) | ||||||||
Net proceeds from sale of subsidiary | 14 | - | - | ||||||||
Sales of investments | 7 | 7 | 66 | ||||||||
Acquisitions, net of cash acquired | - | - | (468) | ||||||||
Other, net | 2 | 7 | - | ||||||||
Total cash used in investing activities | (781) | (962) | (1,372) | ||||||||
Financing activities | |||||||||||
Repurchase of common stock | (340) | (1,014) | (3,502) | ||||||||
Issuance of common stock | 19 | 16 | 29 | ||||||||
Dividends paid | (801) | (789) | (688) | ||||||||
Repayments of debt | (19) | (19) | (133) | ||||||||
Other, net | (3) | - | (3) | ||||||||
Total cash used in financing activities | (1,144) | (1,806) | (4,297) | ||||||||
Effect of exchange rate changes on cash | (5) | (8) | (3) | ||||||||
Decrease in cash, cash equivalents and restricted cash | (460) | (952) | (2,420) | ||||||||
Cash, cash equivalents and restricted cash at beginning of period | 2,253 | 3,205 | 5,625 | ||||||||
Cash, cash equivalents and restricted cash at end of period | $ | 1,793 | $ | 2,253 | $ | 3,205 | |||||
Supplemental cash flow information | |||||||||||
Income taxes paid (includes payments for purchased tax credits of $103 million, $2 million and $4 million, respectively) | $ | 543 | $ | 283 | $ | 716 | |||||
Interest paid | $ | 51 | $ | 31 | $ | 22 | |||||
| Fiscal Years Ended | January 28, 2017 | January 30, 2016 | January 31, 2015 | |||||||||
| Operating Activities | ||||||||||||
| Net earnings including noncontrolling interests | $ | 1,228 | $ | 897 | $ | 1,235 | ||||||
| Adjustments to reconcile net earnings to total cash provided by operating activities: | ||||||||||||
| Depreciation | 654 | 657 | 656 | |||||||||
| Restructuring charges | 39 | 201 | 23 | |||||||||
| Gain on sale of business | — | (99 | ) | (1 | ) | |||||||
| Stock-based compensation | 108 | 104 | 87 | |||||||||
| Deferred income taxes | 201 | 49 | (297 | ) | ||||||||
| Other, net | (31 | ) | 38 | 8 | ||||||||
| Changes in operating assets and liabilities: | ||||||||||||
| Receivables | (185 | ) | 123 | (19 | ) | |||||||
| Merchandise inventories | 193 | 86 | (141 | ) | ||||||||
| Other assets | 10 | 36 | 29 | |||||||||
| Accounts payable | 518 | (536 | ) | 434 | ||||||||
| Other liabilities | 23 | (140 | ) | (164 | ) | |||||||
| Income taxes | (213 | ) | (94 | ) | 85 | |||||||
| Total cash provided by operating activities | 2,545 | 1,322 | 1,935 | |||||||||
| Investing Activities | ||||||||||||
| Additions to property and equipment, net of $48, $92 and $14 of non-cash capital expenditures | (582 | ) | (649 | ) | (561 | ) | ||||||
| Purchases of investments | (3,045 | ) | (2,281 | ) | (2,804 | ) | ||||||
| Sales of investments | 2,689 | 2,427 | 1,580 | |||||||||
| Proceeds from sale of business, net of cash transferred | — | 103 | 39 | |||||||||
| Proceeds from property disposition | 56 | — | — | |||||||||
| Change in restricted assets | (8 | ) | (47 | ) | 29 | |||||||
| Other, net | 3 | 28 | 5 | |||||||||
| Total cash used in investing activities | (887 | ) | (419 | ) | (1,712 | ) | ||||||
| Financing Activities | ||||||||||||
| Repurchase of common stock | (698 | ) | (1,000 | ) | — | |||||||
| Prepayment of accelerated share repurchase | — | (55 | ) | — | ||||||||
| Issuance of common stock | 171 | 47 | 50 | |||||||||
| Dividends paid | (505 | ) | (499 | ) | (251 | ) | ||||||
| Repayments of debt | (394 | ) | (28 | ) | (24 | ) | ||||||
| Other, net | 22 | 20 | 2 | |||||||||
| Total cash used in financing activities | (1,404 | ) | (1,515 | ) | (223 | ) | ||||||
| Effect of Exchange Rate Changes on Cash | 10 | (38 | ) | (52 | ) | |||||||
| Increase (Decrease) in Cash and Cash Equivalents | 264 | (650 | ) | (52 | ) | |||||||
| Cash and Cash Equivalents at Beginning of Period, excluding held for sale | 1,976 | 2,432 | 2,678 | |||||||||
| Cash and Cash Equivalents at Beginning of Period - held for sale | — | 194 | — | |||||||||
| Cash and Cash Equivalents at End of Period | 2,240 | 1,976 | 2,626 | |||||||||
| Cash and Cash Equivalents at End of Period - held for sale | — | — | (194 | ) | ||||||||
| Cash and Cash Equivalents at End of Period, excluding held for sale | $ | 2,240 | $ | 1,976 | $ | 2,432 | ||||||
| Supplemental Disclosure of Cash Flow Information | ||||||||||||
| Income taxes paid | $ | 628 | $ | 550 | $ | 355 | ||||||
| Interest paid | 76 | 77 | 81 | |||||||||
See Notes to Consolidated Financial Statements.
Consolidated Statements of Changes in Shareholders' Equity
$ and shares in millions, except per share amounts
Common | Common | Additional | Retained | Accumulated | Total | ||||||||||||||||||
Balances as of January 30, 2021 | 256.9 | $ | 26 | $ | - | $ | 4,233 | $ | 328 | $ | 4,587 | ||||||||||||
Net earnings | - | - | - | 2,454 | - | 2,454 | |||||||||||||||||
Other comprehensive income: | |||||||||||||||||||||||
Foreign currency translation adjustments, net of tax | - | - | - | - | 1 | 1 | |||||||||||||||||
Stock-based compensation | - | - | 141 | - | - | 141 | |||||||||||||||||
Issuance of common stock | 2.7 | - | 29 | - | - | 29 | |||||||||||||||||
Common stock dividends, $2.80 per share | - | - | 14 | (702) | - | (688) | |||||||||||||||||
Repurchase of common stock | (32.2) | (3) | (184) | (3,317) | - | (3,504) | |||||||||||||||||
Balances as of January 29, 2022 | 227.4 | 23 | - | 2,668 | 329 | 3,020 | |||||||||||||||||
Net earnings | - | - | - | 1,419 | - | 1,419 | |||||||||||||||||
Other comprehensive loss: | |||||||||||||||||||||||
Foreign currency translation adjustments, net of tax | - | - | - | - | (7) | (7) | |||||||||||||||||
Stock-based compensation | - | - | 138 | - | - | 138 | |||||||||||||||||
Issuance of common stock | 2.5 | - | 16 | - | - | 16 | |||||||||||||||||
Common stock dividends, $3.52 per share | - | - | 14 | (804) | - | (790) | |||||||||||||||||
Repurchase of common stock | (11.8) | (1) | (147) | (853) | - | (1,001) | |||||||||||||||||
Balances as of January 28, 2023 | 218.1 | 22 | 21 | 2,430 | 322 | 2,795 | |||||||||||||||||
Net earnings | - | - | - | 1,241 | - | 1,241 | |||||||||||||||||
Other comprehensive loss: | |||||||||||||||||||||||
Foreign currency translation adjustments, net of tax | - | - | - | - | (5) | (5) | |||||||||||||||||
Stock-based compensation | - | - | 145 | - | - | 145 | |||||||||||||||||
Issuance of common stock | 2.0 | - | 19 | - | - | 19 | |||||||||||||||||
Common stock dividends, $3.68 per share | - | - | 14 | (816) | - | (802) | |||||||||||||||||
Repurchase of common stock | (4.7) | - | (168) | (172) | - | (340) | |||||||||||||||||
Balances as of February 3, 2024 | 215.4 | $ | 22 | $ | 31 | $ | 2,683 | $ | 317 | $ | 3,053 | ||||||||||||
Common Shares | Common Stock | Prepaid Share Repurchase | Additional Paid-In Capital | Retained Earnings | Accumulated Other Comprehensive Income (Loss) | Total Best Buy Co., Inc. Shareholders' Equity | Non controlling Interests | Total Equity | ||||||||||||||||||||||||||
| Balances at February 1, 2014 | 347 | 35 | — | 300 | 3,159 | 492 | 3,986 | 3 | 3,989 | |||||||||||||||||||||||||
| Net earnings | — | — | — | — | 1,233 | — | 1,233 | 2 | 1,235 | |||||||||||||||||||||||||
| Other comprehensive loss, net of tax: | ||||||||||||||||||||||||||||||||||
| Foreign currency translation adjustments | — | — | — | — | — | (103 | ) | (103 | ) | — | (103 | ) | ||||||||||||||||||||||
| Unrealized losses on available-for-sale investments | — | — | — | — | — | (3 | ) | (3 | ) | — | (3 | ) | ||||||||||||||||||||||
| Reclassification of gains on available-for-sale investments into earnings | — | — | — | — | — | (4 | ) | (4 | ) | — | (4 | ) | ||||||||||||||||||||||
| Issuance of common stock under employee stock purchase plan | — | — | — | 8 | — | — | 8 | — | 8 | |||||||||||||||||||||||||
| Stock-based compensation | — | — | — | 87 | — | — | 87 | — | 87 | |||||||||||||||||||||||||
| Restricted stock vested and stock options exercised | 5 | — | — | 42 | — | — | 42 | — | 42 | |||||||||||||||||||||||||
| Common stock dividends, $0.72 per share | — | — | — | — | (251 | ) | — | (251 | ) | — | (251 | ) | ||||||||||||||||||||||
| Balances at January 31, 2015 | 352 | 35 | — | 437 | 4,141 | 382 | 4,995 | 5 | 5,000 | |||||||||||||||||||||||||
| Net earnings | — | — | — | — | 897 | — | 897 | — | 897 | |||||||||||||||||||||||||
| Other comprehensive loss, net of tax: | ||||||||||||||||||||||||||||||||||
| Foreign currency translation adjustments | — | — | — | — | — | (44 | ) | (44 | ) | — | (44 | ) | ||||||||||||||||||||||
| Reclassification of foreign currency translation adjustments into earnings | — | — | — | — | — | (67 | ) | (67 | ) | — | (67 | ) | ||||||||||||||||||||||
| Sale of noncontrolling interest | — | — | — | — | — | — | — | (5 | ) | (5 | ) | |||||||||||||||||||||||
| Prepaid repurchase of common stock | — | — | (55 | ) | — | — | — | (55 | ) | — | (55 | ) | ||||||||||||||||||||||
| Issuance of common stock under employee stock purchase plan | — | — | — | 7 | — | — | 7 | — | 7 | |||||||||||||||||||||||||
| Stock-based compensation | — | — | — | 104 | — | — | 104 | — | 104 | |||||||||||||||||||||||||
| Restricted stock vested and stock options exercised | 5 | — | — | 40 | — | — | 40 | — | 40 | |||||||||||||||||||||||||
| Tax benefits from stock options exercised, restricted stock vesting and employee stock purchase plan | — | — | — | 2 | — | — | 2 | — | 2 | |||||||||||||||||||||||||
| Common stock dividends, $1.43 per share | — | — | — | 3 | (504 | ) | — | (501 | ) | — | (501 | ) | ||||||||||||||||||||||
| Repurchase of common stock | (33 | ) | (3 | ) | — | (593 | ) | (404 | ) | — | (1,000 | ) | — | (1,000 | ) | |||||||||||||||||||
| Balances at January 30, 2016 | 324 | 32 | (55 | ) | — | 4,130 | 271 | 4,378 | — | 4,378 | ||||||||||||||||||||||||
| Net earnings | — | — | — | — | 1,228 | — | 1,228 | — | 1,228 | |||||||||||||||||||||||||
| Other comprehensive income (loss), net of tax: | ||||||||||||||||||||||||||||||||||
| Foreign currency translation adjustments | — | — | — | — | — | 10 | 10 | — | 10 | |||||||||||||||||||||||||
| Reclassification of foreign currency translation adjustments into earnings | — | — | — | — | — | (2 | ) | (2 | ) | — | (2 | ) | ||||||||||||||||||||||
| Settlement of accelerated share repurchase | — | — | 55 | — | — | — | 55 | — | 55 | |||||||||||||||||||||||||
| Issuance of common stock under employee stock purchase plan | — | — | — | 7 | — | — | 7 | — | 7 | |||||||||||||||||||||||||
| Stock-based compensation | — | — | — | 108 | — | — | 108 | — | 108 | |||||||||||||||||||||||||
| Restricted stock vested and stock options exercised | 8 | 1 | — | 163 | — | — | 164 | — | 164 | |||||||||||||||||||||||||
| Tax benefits from stock options exercised, restricted stock vesting and employee stock purchase plan | — | — | — | 17 | — | — | 17 | — | 17 | |||||||||||||||||||||||||
| Common stock dividends, $1.57 per share | — | — | — | — | (505 | ) | — | (505 | ) | — | (505 | ) | ||||||||||||||||||||||
| Repurchase of common stock | (21 | ) | (2 | ) | — | (295 | ) | (454 | ) | — | (751 | ) | — | (751 | ) | |||||||||||||||||||
| Balances at January 28, 2017 | 311 | $ | 31 | $ | — | $ | — | $ | 4,399 | $ | 279 | $ | 4,709 | $ | — | $ | 4,709 | |||||||||||||||||
See Notes to Consolidated Financial Statements.
Notes to Consolidated Financial Statements
1. Summary of Significant Accounting Policies
Unless the context otherwise requires, the use of the terms "Best“Best Buy," "we," "us"” “we,” “us” and "our"“our” in these Notes to Consolidated Financial Statements refers to Best Buy Co., Inc. and, as applicable, its consolidated subsidiaries.
Description of Business
We are a leading providerdriven by our purpose to enrich lives through technology and our vision to personalize and humanize technology solutions for every stage of life. We accomplish this by leveraging our combination of technology products, services and solutions. We offer these products and servicesa human touch to the customers whomeet our customers’ everyday needs, whether they come to us online, visit our stores engage with Geek Squad agents or use our websites or mobile applications.invite us into their homes. We have operations in the U.S., Canada and Mexico. Canada.
We have two reportable segments: Domestic and International. The Domestic segment is comprised of theour operations in all states, districts and territories of the U.S., under various and our Best Buy Health business, and includes the brand names including Best Buy, bestbuy.com, Best Buy Mobile,Ads, Best Buy Direct,Business, Best Buy Express,Health, CST, Current Health, Geek Squad, Lively, Magnolia, Home Theater and Pacific Kitchen and Home. TheHome, TechLiquidators and Yardbird and the domain names bestbuy.com, currenthealth.com, lively.com, techliquidators.com and yardbird.com. Our International segment is comprised of all operations in Canada and Mexico under the brand names Best Buy, bestbuy.com.ca, bestbuy.com.mx, Best Buy Express, Best Buy Mobile and Geek Squad.
In fiscal 2022, we acquired all of the outstanding shares of Current Health Ltd. (“Current Health”) and Two Peaks, LLC d/b/a Yardbird Furniture (“Yardbird”). Refer to Note 2, Acquisitions, for additional information.
In fiscal 2024, we completed the sale of a Mexico subsidiary subsequent to our exit from operations in Mexico and recognized a $21 million gain within Gain on sale of subsidiary, net on our Consolidated Statements of Earnings. Refer to Note 3, Restructuring, for additional information regarding our exit from operations in Mexico.
Basis of Presentation
The consolidated financial statements include the accounts of Best Buy Co., Inc. and its consolidated subsidiaries. All intercompany balances and transactions are eliminated upon consolidation.
Use of Estimates in the Preparation of Financial Statements
The preparation of financial statements in conformity with accounting principles generally accepted in the U.S. ("GAAP") requires us to make estimates and assumptions. These estimates and assumptions affect the reported amounts in the consolidated financial statements, as well as the disclosure of contingent liabilities. Future results could be materially affected if actual results were to differ from these estimates and assumptions.
Fiscal Year
Our fiscal year ends on the Saturday nearest the end of January. Fiscal 2017, 20162024, fiscal 2023 and 2015fiscal 2022 ended February 3, 2024, January 28, 2023, and January 29, 2022, respectively. Unless otherwise noted, references to years in these notes to consolidated financial statements relate to fiscal years, and not calendar years. Fiscal 2024 included 53 weeks with the 53rd week occurring in the fiscal fourth quarter. Fiscal 2023 and fiscal 2022 each included 52 weeks.
Adopted Accounting Pronouncements
In the first quarter of fiscal 2024, we adopted the Accounting Standards Update (“ASU”) 2022-04, Supplier Finance Programs (Subtopic 405-50): Disclosure of Supplier Finance Program Obligations. ASU 2022-04 requires entities to disclose the key terms of the supplier finance programs they use in connection with the purchase of goods and services, along with the amount of obligations outstanding at the end of each period. Beginning in fiscal 2025, an annual roll-forward of such obligations is also required. Below are the applicable disclosures as a result of ASU 2022-04.
Supply Chain Financing
We have a supply chain financing program with an independent financial institution, whereby some of our suppliers have the opportunity to receive accounts payable settlements early, at a discount, facilitated by the financial institution. Under this program, the financial institution agrees to terms with our suppliers, including amounts that are eligible for early payment, the timing of such payments and the discounts. The financial institution then pays the supplier based on the payment terms agreed to. Suppliers’ participation in this program is at their own option. The financial institution can vary discounts offered at their own discretion. Our rights and obligations to our suppliers – which are typically formalized in standardized agreements – are not affected by the existence of the program. Our liability associated with the funded participation in the program, which is included in Accounts payable on our Consolidated Balance Sheets, was $426 million and $386 million as of February 3, 2024, and January 28, 2023, respectively.
New Accounting Pronouncements
In May 2014,November 2023, the Financial Accounting Standards Board ("FASB"(“FASB”) issued Accounting Standards Update ("ASU") 2014-09,
In July 2015,December 2023, the FASB issued ASU 2015-11,
In March 2024, the U.S. Securities and Exchange Commission issued its final climate disclosure rule, which requires the disclosure of Scope 1 and Scope 2 greenhouse gas emissions and other climate-related topics in annual reports and registration statements, when material. Disclosure requirements will begin phasing in for fiscal years beginning on or after January 1, 2025. We are currently evaluating the impact of the new rule and expect to include updated climate-related disclosures in our fiscal 2026 Form 10-K.
Segment Information
Our business is organized into two reportable segments: Domestic (which is comprised of all states, districts and territories of the U.S. and our Best Buy Health business) and International (which is comprised of all operations in Canada). Our chief operating decision maker (“CODM”) is our Chief Executive Officer. Our CODM has ultimate responsibility for enterprise decisions, including determining resource allocation for, and monitoring the performance of, the consolidated enterprise, the Domestic reportable segment and the International reportable segment.
Business Combinations
We account for business combinations under the acquisition method of accounting. This method requires the recording of acquired assets and assumed liabilities at their acquisition date fair values. The new guidance replacesexcess of the current inventory measurement requirementpurchase price over the fair value of lowerassets acquired and liabilities assumed is recorded as goodwill. Results of cost or marketoperations related to business combinations are included prospectively beginning with the lowerdate of cost or net realizable value. Based on the effective dates, we will prospectively adopt this standard in the first quarter of our fiscal 2018. We do not expect a material impactacquisition and transaction costs related to our financial statements.
Cash, Cash Equivalents and Restricted Cash
Cash, cash equivalents and restricted cash reported on our financial statements.
February 3, 2024 | January 28, 2023 | January 29, 2022 | |||||||||
Cash and cash equivalents | $ | 1,447 | $ | 1,874 | $ | 2,936 | |||||
Restricted cash included in Other current assets | 346 | 379 | 269 | ||||||||
Total cash, cash equivalents and restricted cash | $ | 1,793 | $ | 2,253 | $ | 3,205 | |||||
Cash equivalents consist of money market funds, commercial paper, corporate bonds and time depositshighly liquid investments with an original maturitymaturities of 3three months or less when purchased. The amounts ofless.
Amounts included in restricted cash equivalents at January 28, 2017,are primarily restricted to cover product protection plans provided under our membership offerings and January 30, 2016, were $1,531 million and $1,208 million, respectively, and the weighted-average interest rates were 0.5% and 0.5%, respectively.
Receivables
Receivables consist principallyprimarily of amounts due from banks for customer credit card and debit card transactions, vendors for various vendor funding programs, mobile phone network operators for device sales and commissions; bankscommissions, and online marketplace partnerships. Receivables are stated at their carrying values, net of a reserve for customerexpected credit card and debit card transactions; and vendors for various vendor funding programs.
Merchandise Inventories
Merchandise inventories are recorded at the lower of cost usingor net realizable value. The weighted-average method is used to determine the average cost or market. In-bound freight-relatedof inventory which includes costs fromof in-bound freight to move inventory into our vendors aredistribution centers. Also included as part of the net cost of merchandise inventories. Also included ina reduction to the cost of inventory are certain vendor allowances that are not a reimbursement of specific, incremental and identifiable costs to promote a vendor's products. Other costsallowances. Costs associated with acquiring, storing and transporting merchandise inventories to our retail stores are expensed as incurred and included in costwithin Cost of goods sold.sales on our Consolidated Statements of Earnings.
Our inventory valuation also reflects markdownsmarkdown adjustments for the excess of the cost over the amountnet recovery we expect to realize from the ultimate sale or other disposaldisposition of the inventory. Markdowns establishinventory, including consideration of any rights we may have to return inventory to vendors for a refund, and establishes a new cost basis for our inventory.basis. Subsequent changes in facts or circumstances do not result in the reversal of previously recorded markdownsmarkdown adjustments or an increase in the newly established cost basis.
Our inventory valuation reflects adjustments for physical inventory losses (resulting from, for example, theft). Physical inventory is maintained through a combination of full location counts and $185 million at January 28, 2017, and January 30, 2016, respectively, and is included in other current assets in our Consolidated Balance Sheet. Such balances are pledged as collateral or restricted to use for general liability insurance and workers' compensation insurance.
Property and Equipment
Property and equipment areis recorded at cost. We compute depreciationdepreciate property and equipment to its residual value using the straight-line method over the estimated useful lives of the assets. Leasehold improvements are depreciated over the shorter of their estimated useful lives or the period from the date the assets are placed in service to the end of the lease term, which includes optional renewal periods if they are reasonably assured.certain. Accelerated depreciation methods are generally used for income tax purposes.
When property is retired or otherwise disposed of, the cost and accumulated depreciation are removed from our Consolidated Balance Sheets and any resulting gain or loss is reflected inon our Consolidated Statements of Earnings.
Repairs and maintenance costs are charged directly to expenseexpensed as incurred. Major renewals or replacements that substantially extend the useful life of an asset are capitalized and depreciated.
Costs associated with the acquisition or development of software for internal use are capitalized and amortized over the expected useful life of the software, generally from two years to sevenfive years. A subsequent addition, modification or upgrade to internal-use software is capitalized to the extent that it enhances the software's functionality or extends its useful life.functionality. Capitalized software is included in fixturesFixtures and equipment.equipment on our Consolidated Balance Sheets. Software maintenance and training costs are expensed in the period incurred.
Costs associated with implementing cloud computing arrangements that are service contracts are capitalized using methodology similar to internal-use software, but are included in Other assets on our operations. These assets are typically depreciated over the shorter of the useful life of the asset or the term of the lease. The carrying value of property under capital and financing leases was $166 million and $165 million at January 28, 2017, and January 30, 2016, respectively, net of accumulated depreciation of $134 million and $107 million, respectively.
Estimated useful lives by major asset category are as follows:
Asset Category | Useful Life | |
Buildings | 5-35 | |
Leasehold improvements | 5-10 | |
Fixtures and equipment | 2-15 | |
Impairment of Long-Lived Assets and Costs Associated With Exit Activities
Long-lived assets are evaluated for impairment whenever events or changes in circumstances indicate that the carrying value may not be recoverable. When evaluating long-lived assets with impairment indicators for potential impairment, we first compare the carrying value of the asset to its estimated undiscounted future cash flows. If the sum of the estimated undiscounted future cash flows is less than the carrying value of the asset, we calculate an impairment loss. The impairment loss calculation compares the carrying value of the asset to its estimated fair value, which is typically based on estimated discounted future cash flows. We recognize an impairment loss if the amount of the asset’s carrying value exceeds the asset’s estimated fair value.
We evaluate locations for triggering events on a quarterly basis. For store locations, our primary indicator that asset carrying values may not be recoverable. Factors considered important that could result in anrecoverable is negative store operating income for the most recent 12-month period. We also monitor other factors when evaluating store locations for impairment, review include, but are not
When reviewing long-lived assets for impairment, we group long-lived assets with other assets and liabilities at the lowest level for which identifiable cash flows are largely independent of the cash flows of other assets and liabilities. For example, long-lived assets deployed at store locations are reviewed for impairment at either the individual store level which involvesor at the local market level. Such reviews involve comparing the net carrying value of all land, buildings, leasehold improvements, fixtures and equipment located at each storeassets to the net cash flow projections for each store.store or market. In addition, we conduct separate impairment reviews at other levels as appropriate, for example, to evaluate the potential impairment of assets shared by several areas of operations, such as information technology systems. Refer to Note 3,
Leases
The majority of our lease obligations are real estate operating leases used in our retail and distribution operations. Our finance leases are primarily equipment-related. For any lease with an initial term in excess of 12 months, the long-livedrelated lease assets impairments, including valuation techniques used, impairment charges incurred and remaining carrying values.
Operating lease assets represent the right to use an underlying asset for the lease term and $54 million, respectively. Theoperating lease liabilities represent the obligation associated with vacant propertiesto make lease payments arising from the lease. These assets and liabilities are recognized based on the present value of future payments over the lease term at January 28, 2017, and January 30, 2016, included amounts associated with our restructuring activities as further described in Note 4, Restructuring Charges.
Goodwill and Intangible Assets
Goodwill
Goodwill is the excess of the purchase price over the fair value of identifiable net assets acquired in business combinations. We test goodwill for impairment annually as of the first day ofin the fiscal fourth quarter or when indications of potential impairment exist.whenever events or circumstances indicate the carrying value may not be recoverable. We monitor the existence of potential impairment indicators throughout the fiscal year. We test for goodwill impairment at the reporting unit level and our reportinglevel. Reporting units are thedetermined by identifying components of operating segments which constitute businesses for which discrete financial information is available and is regularly reviewed by segment management. No components were aggregatedWe have goodwill in arriving at ourtwo reporting units. Our only reporting unitunits – Best Buy Domestic and Best Buy Health – with a goodwill balance at the beginningcarrying values of fiscal 2017 was our Domestic segment.
Our detailed impairment testing involves comparing the fair value of each reporting unit towith its carrying value, including goodwill. Fair value reflects the price a potential market participant would be willing to pay in a potential sale offor the reporting unit in an arms-length transaction and is based ontypically requires analysis of discounted cash flows or relative market-based approaches.and market data, such as revenue multiples and quoted market prices. If the fair value of a reporting unit exceeds its carrying value, then it is concludedwe conclude that no goodwill impairment has occurred. If the carrying value of thea reporting unit exceeds its fair value, a second step is required to measure possible goodwill impairment loss. The second step includes hypothetically valuing the tangible and intangible assets and liabilities of the reporting unit as if the reporting unit had been acquired in a business combination. Then, the implied fair value of the reporting unit's goodwill is compared to the carrying value of that goodwill. If the carrying value of the reporting unit's goodwill exceeds the implied fair value of the goodwill, we recognize an impairment loss in an amount equal to the excess, not to exceed the carrying value. In fiscal 2017, we determinedtotal amount of goodwill allocated to that the fair value of the Best Buy Domestic reporting unit exceeded its carrying value, and as a result, no goodwill impairment was recorded in fiscal 2017. No goodwill impairment was recorded in fiscal 2016.
Intangible Assets
Our valuation of identifiable intangible assets acquired is based on information and assumptions available to us at the time of acquisition, using income and market approaches to determine fair value. value, as appropriate.
We do not amortize our indefinite-lived tradenames, but testdefinite-lived intangible assets over the estimated useful lives of the assets. We review these assets for impairment annually,whenever events or when indications of potential impairment exist. We utilize the relief from royalty method to determine the fair value of each of our indefinite-lived tradenames. If the carrying value exceeds the fair value, we recognize an impairment losschanges in an amount equal to the excess. In fiscal 2017, we determinedcircumstances indicate that the fair value of the tradename exceeded its carrying value, and as a result, no impairment was recorded in fiscal 2017. In fiscal 2016, as a part of the Canada brand restructuring, we fully impaired the indefinite-lived Future Shop tradename. Refer to Note 4,
| Goodwill | Indefinite-Lived Tradenames | ||||||||||||||
| Domestic | Domestic | International | Total | ||||||||||||
| Balances at February 1, 2014 | $ | 425 | $ | 19 | $ | 82 | $ | 101 | |||||||
Sale of business(1) | — | — | (37 | ) | (37 | ) | |||||||||
| Impairments | — | (1 | ) | — | (1 | ) | |||||||||
| Changes in foreign currency exchange rates | — | — | (6 | ) | (6 | ) | |||||||||
| Balances at January 31, 2015 | 425 | 18 | 39 | 57 | |||||||||||
Canada brand restructuring(2) | — | — | (40 | ) | (40 | ) | |||||||||
| Changes in foreign currency exchange rates | — | — | 1 | 1 | |||||||||||
| Balances at January 30, 2016 | 425 | 18 | — | 18 | |||||||||||
| Balances at January 28, 2017 | $ | 425 | $ | 18 | $ | — | $ | 18 | |||||||
| January 28, 2017 | January 30, 2016 | ||||||||||||||
Gross Carrying Amount | Cumulative Impairment | Gross Carrying Amount | Cumulative Impairment | ||||||||||||
| Goodwill | $ | 1,100 | $ | (675 | ) | $ | 1,100 | $ | (675 | ) | |||||
| January 28, 2017 | January 30, 2016 | ||||||
| Accrued liabilities | $ | 65 | $ | 62 | |||
| Long-term liabilities | 63 | 54 | |||||
| Total | $ | 128 | $ | 116 | |||
| 2017 | 2016 | 2015 | |||||||||
| Revenue | $ | — | $ | 217 | $ | 1,564 | |||||
Restructuring charges(1) | — | 1 | 18 | ||||||||
| Gain (loss) from discontinued operations before income tax expense | 28 | (8 | ) | (12 | ) | ||||||
| Income tax expense | (7 | ) | (1 | ) | — | ||||||
| Gain on sale of discontinued operations | — | 99 | 1 | ||||||||
| Net earnings (loss) from discontinued operations including noncontrolling interests | 21 | 90 | (11 | ) | |||||||
| Net earnings from discontinued operations attributable to noncontrolling interests | — | — | (2 | ) | |||||||
| Net earnings (loss) from discontinued operations attributable to Best Buy Co., Inc. shareholders | $ | 21 | $ | 90 | $ | (13 | ) | ||||
| Fair Value at | |||||||||
| Fair Value Hierarchy | January 28, 2017 | January 30, 2016 | |||||||
| Assets | |||||||||
| Cash and cash equivalents | |||||||||
| Money market funds | Level 1 | $ | 290 | $ | 51 | ||||
| Commercial paper | Level 2 | — | 265 | ||||||
| Time deposits | Level 2 | 15 | 306 | ||||||
| Short-term investments | |||||||||
| Corporate bonds | Level 2 | — | 193 | ||||||
| Commercial paper | Level 2 | 349 | 122 | ||||||
| Time deposits | Level 2 | 1,332 | 990 | ||||||
| Other current assets | |||||||||
| Money market funds | Level 1 | 7 | — | ||||||
| Commercial paper | Level 2 | 60 | — | ||||||
| Foreign currency derivative instruments | Level 2 | 2 | 18 | ||||||
| Time deposits | Level 2 | 100 | 79 | ||||||
| Other assets | |||||||||
| Interest rate swap derivative instruments | Level 2 | 13 | 25 | ||||||
| Auction rate securities | Level 3 | — | 2 | ||||||
| Marketable securities that fund deferred compensation | Level 1 | 96 | 96 | ||||||
| Liabilities | |||||||||
| Accrued Liabilities | |||||||||
| Foreign currency derivative instruments | Level 2 | 3 | 1 | ||||||
| 2017 | 2016 | ||||||||||||||
| Impairments | Remaining Net Carrying Value(1) | Impairments | Remaining Net Carrying Value (1) | ||||||||||||
| Property and equipment (non-restructuring) | $ | 28 | $ | — | $ | 61 | $ | 15 | |||||||
Restructuring activities(2) | |||||||||||||||
| Property and equipment | 8 | — | 30 | — | |||||||||||
| Tradename | — | — | 40 | — | |||||||||||
| Total | $ | 36 | $ | — | $ | 131 | $ | 15 | |||||||
| 2017 | 2016 | 2015 | |||||||||
| Continuing operations | |||||||||||
| Renew Blue Phase 2 | $ | 26 | $ | — | $ | — | |||||
| Canadian brand consolidation | 3 | 200 | — | ||||||||
Renew Blue(1) | 5 | (2 | ) | 11 | |||||||
Other restructuring activities(2) | 5 | 3 | (6 | ) | |||||||
| Total continuing operations | 39 | 201 | 5 | ||||||||
| Discontinued operations | |||||||||||
Renew Blue(1) | — | — | 18 | ||||||||
| Total | $ | 39 | $ | 201 | $ | 23 | |||||
| Domestic | |||
| 2017 | |||
| Property and equipment impairments | $ | 8 | |
| Termination benefits | 18 | ||
| Total Renew Blue Phase 2 restructuring charges | $ | 26 | |
| International | |||||||||||
| 2017 | 2016 | Cumulative Amount | |||||||||
| Continuing operations | |||||||||||
| Inventory write-downs | $ | — | $ | 3 | $ | 3 | |||||
| Property and equipment impairments | — | 30 | 30 | ||||||||
| Tradename impairment | — | 40 | 40 | ||||||||
| Termination benefits | — | 25 | 25 | ||||||||
| Facility closure and other costs | 3 | 102 | 105 | ||||||||
| Total continuing operations | $ | 3 | $ | 200 | $ | 203 | |||||
Termination Benefits | Facility Closure and Other Costs | Total | |||||||||
| Balances at January 31, 2015 | $ | — | $ | — | $ | — | |||||
| Charges | 28 | 113 | 141 | ||||||||
| Cash payments | (24 | ) | (47 | ) | (71 | ) | |||||
Adjustments(1) | (2 | ) | 5 | 3 | |||||||
| Changes in foreign currency exchange rates | — | (7 | ) | (7 | ) | ||||||
| Balances at January 30, 2016 | $ | 2 | $ | 64 | $ | 66 | |||||
| Charges | — | 1 | 1 | ||||||||
| Cash payments | (2 | ) | (37 | ) | (39 | ) | |||||
Adjustments(1) | — | 2 | 2 | ||||||||
| Changes in foreign currency exchange rates | — | 4 | 4 | ||||||||
| Balances at January 28, 2017 | $ | — | $ | 34 | $ | 34 | |||||
| January 28, 2017 | January 30, 2016 | ||||||
| 2016 Notes | $ | — | $ | 350 | |||
| 2018 Notes | 500 | 500 | |||||
| 2021 Notes | 650 | 650 | |||||
| Interest rate swap valuation adjustments | 13 | 25 | |||||
| Subtotal | 1,163 | 1,525 | |||||
| Debt discounts and issuance costs | (5 | ) | (7 | ) | |||
| Financing lease obligations | 177 | 178 | |||||
| Capital lease obligations | 30 | 38 | |||||
| Total long-term debt | 1,365 | 1,734 | |||||
| Less: current portion | (44 | ) | (395 | ) | |||
| Total long-term debt, less current portion | $ | 1,321 | $ | 1,339 | |||
| Fiscal Year | |||
| 2018 | $ | — | |
| 2019 | 511 | ||
| 2020 | — | ||
| 2021 | — | ||
| 2022 | 652 | ||
| Thereafter | — | ||
| Total long-term debt | $ | 1,163 | |
Derivatives
Net Investment Hedges
We use foreign exchangecurrency forward contracts to hedge against the effect of Canadian dollar exchange rate fluctuations on a portion of our net investment in our Canadian operations. The contracts have terms of up to 12 months. For a net investment hedge, we recognize changes in the fair value of the derivative as a component of foreign currency translation within other comprehensive income to offset a portion of the change in translated value of the net investment being hedged, until the investment is sold or liquidated. We limit recognition in net earnings of amounts previously recorded in other comprehensive income to circumstances such as complete or substantially complete liquidation of the net investment in the hedged foreign operation. We report the ineffective portion of the gain or loss,gains and losses, if any, related to the amount excluded from the assessment of hedge effectiveness in net earnings.
Interest Rate Swaps
We use "receiveutilize “receive fixed-rate, pay variable-rate"variable-rate” interest rate swaps to mitigate the effect of interest rate fluctuations on a portionour $500 million principal amount of our 2018 Notes and 2021 Notes.notes due October 1, 2028 (“2028 Notes”). Our interest rate swap contracts are considered perfect hedges because the critical terms and notional amounts match those of our fixed-rate debt being hedged and are, therefore, accounted for as a fair value hedgehedges using the shortcut method. Under the shortcut method, we recognize the change in the fair value of the derivatives with an offsetting change to the carrying value of the debt. Accordingly, there is no impact on our Consolidated Statements of Earnings from the fair value of the derivatives.
Derivatives Not Designated as Hedging Instruments
We use foreign currency forward contracts to manage the impact of fluctuations in foreign currency exchange rates relative to recognized receivable and payable balances denominated in non-functional currencies. The contracts generally have terms of up to 12 months. These derivative instruments are not designated in hedging relationships and, therefore, we record gains and losses on these contracts directly to net earnings.our Consolidated Statements of Earnings.
Fair Value
Fair value is the price that would be received to sell an asset or paid to transfer a liability (an exit price) in the principal or most advantageous market for the asset or liability in an orderly transaction between market participants on the measurement date. To measure fair value, we use a three-tier valuation hierarchy based upon observable and non-observable inputs:
Level 1 — Unadjusted quoted prices that are available in active markets for identical assets or liabilities at the measurement date.
Level 2 — Significant other observable inputs available at the measurement date, other than quoted prices included in Level 1, either directly or indirectly, including:
• Quoted prices for similar assets or liabilities in active markets;
• Quoted prices for identical or similar assets or liabilities in non-active markets;
• Inputs other than quoted prices that are observable for the asset or liability; and
• Inputs that are derived principally from or corroborated by other observable market data.
Level 3 — Significant unobservable inputs that cannot be corroborated by observable market data and reflect the use of Derivative Balances
The following table presentsfair value hierarchy requires the grossuse of observable market data when available. In instances where the inputs used to measure fair value fall into different levels of the fair value hierarchy, the fair value measurement has been determined based on the lowest level input that is significant to the fair value measurement in its entirety. Our assessment of the significance of a particular item to the fair value measurement in its entirety requires judgment, including the consideration of inputs specific to the asset or liability.
Fair value remeasurements are based on significant unobservable inputs (Level 3). Fixed asset fair values for outstanding derivative instrumentsare primarily derived using a discounted cash flow (“DCF”) model to estimate the present value of net cash flows that the asset or asset group was expected to generate. The key inputs to the DCF model generally include our forecasts of net cash generated from investment operations, as well as an appropriate discount rate.
Assets and liabilities that are measured at fair value on a nonrecurring basis relate primarily to our tangible fixed assets, goodwill and other intangible assets, which are remeasured when the derived fair value is below carrying value on our Consolidated Balance Sheets. For these assets, we do not periodically adjust carrying value to fair value, except in the event of impairment. When we determine that impairment has occurred, the carrying value of the asset is reduced to fair value and the corresponding classification at January 28, 2017,difference is recorded within SG&A and January 30, 2016:
| January 28, 2017 | January 30, 2016 | ||||||||||||
| Contract Type | Assets | Liabilities | Assets | Liabilities | |||||||||
Derivatives designated as net investment hedges(1) | $ | 2 | $ | 2 | $ | 15 | $ | 1 | |||||
Derivatives designated as interest rate swaps(2) | 13 | — | 25 | — | |||||||||
No hedge designation (foreign exchange forward contracts)(1) | — | 1 | 3 | — | |||||||||
| Total | $ | 15 | $ | 3 | $ | 43 | $ | 1 | |||||
Insurance
We are self-insured for certain losses related to workers’ compensation, medical, general liability and auto claims; however, we obtain third-party excess insurance coverage to limit our exposure to certain claims. Some of these self-insured losses are managed through a wholly-owned insurance captive. Liabilities associated with these losses include estimates of both claims filed and losses incurred but not yet reported. We utilize valuations provided by qualified, independent third-party actuaries as well as internal insurance and risk expertise. Our net self-insured liabilities included on our Consolidated Balance Sheets were as follows ($ in millions):
February 3, 2024 | January 28, 2023 | ||||||
Short-term liabilities | $ | 111 | $ | 111 | |||
Long-term liabilities | 57 | 53 | |||||
Total | $ | 168 | $ | 164 | |||
Income Taxes
We account for income taxes using the asset and liability method. Under this method, deferred tax assets and liabilities are recognized for the estimated future tax consequences attributable to differences between the financial statement carrying amounts of existing assets and liabilities and their respective tax bases and operating loss and tax credit carry-forwards. We record a valuation allowance to reduce the carrying amounts of deferred tax assets if it is more likely than not that such assets will not be realized.
In determining our provision for income taxes, we use an annual effective income tax rate based on annual income, permanent differences between book and tax income and statutory income tax rates. The effective income tax rate also reflects our assessment of the ultimate outcome of tax audits. We adjust our annual effective income tax rate as additional information on outcomes or events becomes available. Discrete events, such as audit settlements or changes in tax laws, are recognized in the period in which they occur.
Our income tax returns are routinely examined by domestic and foreign tax authorities. At any one time, multiple tax years are subject to audit by the various taxing authorities. In evaluating the exposures associated with our various tax filing positions, we may record a liability for such exposures. A number of years may elapse before a particular matter, for which we have established a liability, is audited and fully resolved or clarified. We adjust our liability for unrecognized tax benefits and income tax provisions in the period in which an uncertain tax position is effectively settled, the statute of limitations expires for the relevant taxing authority to examine the tax position or when more information becomes available. We include our liability for unrecognized tax benefits, including accrued penalties and interest, in Long-term liabilities on our Consolidated Balance Sheets and in Income tax expense on our Consolidated Statements of Earnings.
| 2017 | 2016 | ||||||||||||||
| Contract Type | Pre-tax Gain (Loss) Recognized in OCI | Gain(Loss) Reclassified from Accumulated OCI to Earnings (Effective Portion) | Pre-tax Gain (Loss) Recognized in OCI | Gain(Loss) Reclassified from Accumulated OCI to Earnings (Effective Portion) | |||||||||||
| Derivatives designated as net investment hedges | $ | (14 | ) | $ | — | $ | 21 | $ | — | ||||||
Accrued Liabilities
The following table presentsmajor components of accrued liabilities are sales tax liabilities, advertising accruals, accrued income taxes, sales return reserves and insurance liabilities.
Long-Term Liabilities
The major components of long-term liabilities are deferred revenue from our private label and co-branded credit card arrangement and unrecognized tax benefits.
Foreign Currency
Foreign currency denominated assets and liabilities are translated into U.S. dollars using the effectsexchange rates in effect at our Consolidated Balance Sheet dates. Results of derivativesoperations and cash flows are translated using the average exchange rates throughout the periods. The effect of exchange rate fluctuations on the translation of assets and liabilities is included as a component of shareholders' equity in accumulated other comprehensive income. Gains and losses from foreign currency transactions, which are included in SG&A on our Consolidated Statements of Earnings, have not been significant in any period presented.
Revenue Recognition
We generate revenue from the sale of products and services, both as a principal and as an agent. Revenue is recognized when control of the promised goods or services is transferred to our customers, in an amount that reflects the consideration that we expect to receive in exchange for fiscal
Product Revenue
Product revenue is recognized when the customer takes physical control, either in our stores or at their home. Any fees charged to customers for delivery are recognized when delivery has been completed. We use delivery information to determine when to recognize revenue for delivered products and any related delivery fee revenue.
In most cases, we are the principal to product contracts as we have control of the physical products prior to transfer to the customer. Accordingly, revenue is recognized on a gross basis.
For certain sales, primarily activation-based software licenses and third-party stored-value cards, we are the sales agent providing access to the content and recognize commission revenue net of amounts due to third parties who fulfill the performance obligation. For these transactions, commission revenue is typically recorded once customers have taken possession of licenses or cards and can access their benefits.
Warranty obligations associated with the sale of our exclusive brands products are assurance-type warranties that are a guarantee of the product’s intended functionality and, therefore, do not represent a distinct performance obligation within the context of the contract.
Services - When we are the principal
We recognize revenue for services, such as delivery, installation, set-up, software troubleshooting, product repair, and data services once the service is completed, as this is when the customer has the ability to direct the use of and obtain the benefits of the service or serviced product. Payment terms are typically at the point of sale, but may also occur upon completion of the service. Our service contracts are primarily with retail customers, merchandise vendors (for factory warranty repairs) and extended warranty underwriters.
For technical support membership contracts (for example, our Best Buy Total membership offering), we are responsible for providing support services to customers. These contracts have terms ranging from one month to one year and typically contain several performance obligations. Payment for the membership contracts is typically due at the start of the contract period. We have determined that our contracts do not include a significant financing component. For performance obligations provided over time, we recognize revenue primarily on a usage basis, an input method of measuring progress over the related contract term. This method is derived by analysis of historical utilization patterns as this depicts when customers use the services and, accordingly, when delivery of the performance obligation occurs. There is judgment in, for example, estimating the relative standalone selling price for bundled performance obligations; the appropriate recognition methodology for each performance obligation; and, for those based on usage, the expected pattern of consumption across a large portfolio of customers. When insufficient reliable and relevant history is available to estimate usage, we generally recognize revenue ratably over the life of the contract until such history has accumulated.
| Gain (Loss) Recognized within SG&A | |||||||
| Contract Type | 2017 | 2016 | |||||
| No hedge designation (foreign exchange forward contracts) | $ | (3 | ) | $ | 4 | ||
Services - When we are the agent
On behalf of third-party underwriters, we sell various hardware protection plans to customers that provide extended warranty coverage on their device purchases. Such plans have terms ranging from one month to five years. Payment is due at the point of sale. Third-party underwriters assume the risk associated with the coverage and are primarily responsible for fulfillment. We record the net commissions (the amount charged to the customer less the premiums remitted to the underwriter) as revenue once the corresponding product revenue is recognized. In addition, in some cases we are eligible to receive profit-sharing payments, a form of variable consideration, which are dependent upon the financial performance of the underwriter’s protection plan portfolio. We do not share in any losses of the portfolio. We record any profit share as revenue once the uncertainty associated with the portfolio period, which is calendar-year based, is no longer constrained using the expected value method. This typically occurs during our fiscal fourth quarter, with payment of the profit share occurring in the subsequent fiscal year. Net commissions and profit-sharing revenue earned from the sale of extended warranties represented 0.8%, 0.9% and 1.4% of revenue in fiscal 2024, fiscal 2023 and fiscal 2022, respectively.
We earn commissions from mobile network carriers to sell service contracts on their platforms. Revenue is recognized upon sale of the contract and activation of the customer on the provider’s platform. The time between when we activate the service with the customer and when we receive payment from the content provider is generally 30 to 60 days, which is after control has passed. Activation commissions are subject to repayment to the carrier primarily in the event of customer cancellation for specified time periods after the sale. Commission revenue from mobile network carriers is reported net of the expected cancellations, which we estimate based on historical cancellation rates.
Credit Card Revenue
We offer promotional financing and credit cards issued by third-party banks that manage and directly extend credit to our customers. Approximately 25% of Domestic revenue in fiscal 2024, fiscal 2023 and fiscal 2022 was transacted using one of our branded cards. We provide a license to our brand and marketing services, and we facilitate credit applications in our stores and online. The banks are the sole owners of the accounts receivable generated under the program and, accordingly, we do not hold any customer receivables related to these programs and act as an agent in the financing transactions with customers. We are eligible to receive a profit share from certain of our banking partners based on the annual performance of their corresponding portfolio, and we receive quarterly payments based on forecasts of full-year performance. This is a form of variable consideration. We record such profit share as revenue over time using the most likely amount method, which reflects the amount earned each quarter when it is determined that the likelihood of a significant revenue reversal is not probable, which is typically quarterly. Profit-share payments occur quarterly, shortly after the end of each program quarter. Profit-sharing revenue from our credit card arrangement approximated 1.4%, 1.4% and 0.9% of Domestic revenue in fiscal 2024, fiscal 2023 and fiscal 2022, respectively.
Best Buy Gift Cards
We sell Best Buy gift cards to our customers in our retail stores, online and through select third parties. Our gift cards do not expire. We recognize revenue from gift cards when the card is redeemed by the customer. We also recognize revenue for the portion of gift card values that is not expected to be redeemed (“breakage”). We estimate breakage based on historical patterns and other factors, such as laws and regulations applicable to each jurisdiction. We recognize breakage revenue using a method that is consistent with customer redemption patterns. Typically, over 90% of gift card redemptions (and therefore recognition of over 90% of gift card breakage revenue) occur within one year of issuance. There is judgment in assessing the level at which we group gift cards for analysis of breakage rates, redemption patterns and the ultimate value of gift cards which we do not expect to be redeemed. Gift card breakage income was $40 million, $59 million and $49 million in fiscal 2024, fiscal 2023 and fiscal 2022, respectively.
Sales Incentives
We frequently offer sales incentives that entitle our customers to receive a gift card at the time of purchase or an instant savings coupon that can be redeemed towards a future purchase. For sales incentives issued to customers that are only earned in conjunction with the purchase of products or services, the sales incentives represent an option that is a material right and, accordingly, is a performance obligation in the contract. The revenue allocated to these sales incentives is deferred as a contract liability and is based on the cards that are projected to be redeemed. We recognize revenue for this performance obligation when it is redeemed by the customer or when it is not expected to be redeemed. There is judgment in determining the level at which we group incentives based on similar redemption patterns, future redemption patterns and the ultimate number of incentives that we do not expect to be redeemed.
We also issue coupons that are not earned in conjunction with a purchase of a product or service, typically as part of targeted marketing activities. This is not a performance obligation, but is recognized as a reduction of the transaction price when redeemed by the customer.
Customer Loyalty Programs
We have customer loyalty programs which allow members to earn points when using our private label and co-branded credit cards. Points earned enable members to receive a certificate that may be redeemed on future purchases. Certificate expirations are typically two months from the date of issuance. Our loyalty programs represent customer options that provide a material right and, accordingly, are performance obligations for each applicable contract. The relative standalone selling price of points earned by our loyalty program members is deferred and included in Deferred revenue on our Consolidated Balance Sheets based on the percentage of points that are projected to be redeemed. We recognize revenue for this performance obligation over time when a certificate is redeemed by the customer. There is inherent judgment in estimating the value of our customer loyalty programs as they are susceptible to factors outside of our influence, particularly customer redemption activity. However, we have significant experience in estimating the amount and timing of redemptions of certificates, based primarily on historical data.
Cost of Sales and Selling, General and Administrative Expenses
The following table presentstables illustrate the effectsprimary costs classified in each major expense category.
Cost of Sales |
Cost of products sold, including: |
Freight expenses associated with moving merchandise inventories from our vendors to our distribution centers |
Vendor allowances that are not a reimbursement of specific, incremental and identifiable costs |
Cash discounts on payments to merchandise vendors |
Physical inventory losses |
Markdowns |
Customer shipping and handling expenses |
Costs associated with operating our distribution network, including payroll and benefit costs, occupancy costs and depreciation |
Freight expenses associated with moving merchandise inventories from our distribution centers to our retail stores |
Cost of services provided, including: |
Payroll and benefit costs for services employees associated with providing the service |
Cost of replacement parts and related freight expenses |
Selling, General and Administrative Expenses |
Payroll and benefit costs for retail and corporate employees, including termination benefits incurred as part of normal operations |
Occupancy and maintenance costs of retail, services and corporate facilities |
Depreciation and amortization related to retail, services and corporate assets |
Advertising costs |
Vendor allowances that are a reimbursement of specific, incremental and identifiable costs |
Tender costs, including bank charges and costs associated with credit card and debit card interchange fees |
Charitable contributions |
Outside and outsourced service fees |
Long-lived asset impairment charges |
Other administrative costs, such as supplies, travel and lodging |
Vendor Allowances
We receive funds from our merchandise vendors through a variety of interest rate derivativesprograms and arrangements, primarily in the form of purchases-based or sales-based volumes and for product advertising and placement. We recognize allowances based on purchases and sales as a reduction of cost of sales when the associated inventory is sold. Allowances for advertising and placement are recognized as a reduction of cost of sales ratably over the corresponding performance period. Funds that are determined to be a reimbursement of specific, incremental and identifiable costs incurred to sell a vendor’s products are recorded as an offset to the related expense within SG&A on our Consolidated Statements of Earnings when incurred.
Advertising Costs
Advertising costs, which are included in SG&A on our Consolidated Statements of Earnings, are expensed the first time the advertisement runs and consist primarily of digital advertisements. Advertising expenses were $794 million, $864 million and $915 million in fiscal 2024, fiscal 2023 and fiscal 2022, respectively.
Stock-Based Compensation
We recognize stock-based compensation expense for the fair value of our stock-based compensation awards, which is determined based on the closing market price of our stock at the date of grant for time-based and performance-based share awards, and Monte-Carlo simulation for market-based share awards. Compensation expense is recognized on a straight-line basis over the period in which services are required, except for certain performance-based share awards that vest on a graded basis, in which case the expense is front-loaded using the graded-attribution basis. Forfeitures are expensed as incurred or upon termination.
Comprehensive Income (Loss)
Comprehensive income (loss) is computed as net earnings plus certain other items that are recorded directly to shareholders’ equity.
2. Acquisitions
Current Health Ltd.
In fiscal 2022, we acquired all outstanding shares of Current Health, a care-at-home technology platform, on November 2, 2021, for net cash consideration of $389 million. The acquisition resulted in $351 million of goodwill that was assigned to our Best Buy Health reporting unit and was deductible for income tax purposes. The acquisition is aligned with our focus in virtual care to enable people in their homes to connect seamlessly with their health care providers and is included in our Domestic reportable segment and Services revenue category. The acquisition was not material to the results of our operations.
Two Peaks, LLC d/b/a Yardbird Furniture
In fiscal 2022, we acquired all outstanding shares of Yardbird, a direct-to-consumer outdoor furniture company, on November 4, 2021, for net cash consideration of $79 million. The acquisition resulted in $47 million of goodwill that was assigned to our Best Buy Domestic reporting unit and was deductible for income tax purposes. The acquisition expands our assortment in categories like outdoor living and was not material to the results of our operations.
3. Restructuring
Restructuring charges were as follows ($ in millions):
2024 | 2023 | 2022 | ||||||||||||||
Fiscal 2024 Restructuring Initiative | $ | 171 | $ | - | $ | - | ||||||||||
Fiscal 2023 Resource Optimization Initiative | (18) | 145 | - | |||||||||||||
Mexico Exit and Strategic Realignment(1) | - | 2 | (41) | |||||||||||||
Fiscal 2020 U.S. Retail Operating Model Changes | - | - | 1 | |||||||||||||
Total | $ | 153 | $ | 147 | $ | (40) | ||||||||||
(1)Includes ($6) million related to inventory markdowns recorded in Cost of sales on our Consolidated Statements of Earnings in fiscal 2022.
Fiscal 2024 Restructuring Initiative
During the fourth quarter of fiscal 2024, we commenced an enterprise-wide restructuring initiative intended to accomplish the following: (1) align field labor resources with where customers want to shop to optimize the customer experience; (2) redirect corporate resources for better alignment with our strategy; and (3) right-size resources to better align with our revenue outlook for fiscal 20172025.
All charges incurred related to this plan were comprised of employee termination benefits from continuing operations, including $163 million and 2016:$8 million within our Domestic and International segments, respectively, and were presented within Restructuring charges on our Consolidated Statements of Earnings. We currently expect to incur additional charges in fiscal 2025, primarily within our Domestic segment, of approximately $10 million to $30 million related to this plan.
There were no cash payments related to this plan during fiscal 2024 and our termination benefits liability as of February 3, 2024, was $171 million, comprised of $163 million in our Domestic segment and $8 million in our International segment. We expect to pay up to $135 million of employee termination benefits during fiscal 2025, with the remainder being paid in fiscal 2026.
Fiscal 2023 Resource Optimization Initiative
During the second quarter of fiscal 2023, we commenced an enterprise-wide initiative to better align our spending with critical strategies and operations, as well as to optimize our cost structure. We do not expect to incur material future restructuring charges related to this plan.
All charges incurred related to this plan were comprised of employee termination benefits from continuing operations and were presented within Restructuring charges on our Consolidated Statements of Earnings as follows ($ in millions):
2024 | 2023 | Cumulative Amount as of | ||||||||||||||
Domestic | $ | (16) | $ | 140 | $ | 124 | ||||||||||
International | (2) | 5 | 3 | |||||||||||||
Total | $ | (18) | $ | 145 | $ | 127 | ||||||||||
| Gain (Loss) Recognized within Interest Expense | |||||||
| Contract Type | 2017 | 2016 | |||||
| Interest rate swap gain (loss) | $ | (12 | ) | $ | 23 | ||
| Adjustments to carrying value of long-term debt | 12 | (23 | ) | ||||
| Net impact on consolidated statement of earnings | $ | — | $ | — | |||
Restructuring accrual activity related to this plan was as follows ($ in millions):
Domestic | International | Total | ||||||||||||||
Balances as of January 29, 2022 | $ | - | $ | - | $ | - | ||||||||||
Charges | 145 | 5 | 150 | |||||||||||||
Cash payments | (38) | - | (38) | |||||||||||||
Adjustments(1) | (5) | - | (5) | |||||||||||||
Balances as of January 28, 2023 | 102 | 5 | 107 | |||||||||||||
Cash payments | (70) | (3) | (73) | |||||||||||||
Adjustments(1) | (16) | (2) | (18) | |||||||||||||
Balances as of February 3, 2024 | $ | 16 | $ | - | $ | 16 | ||||||||||
(1)Represents adjustments primarily related to higher-than-expected employee retention from previously planned organizational changes.
Mexico Exit and Strategic Realignment
In the third quarter of fiscal 2021, we made the decision to exit our operations in Mexico and began taking other actions to more broadly align our organizational structure in support of our strategy. Charges incurred in our International segment primarily related to our decision to exit our operations in Mexico. All of our former stores in Mexico were closed as of the end of the first quarter of fiscal 2022. Charges incurred in our Domestic segment primarily related to actions taken to align our organizational structure in support of our strategy. We do not expect to incur material future restructuring charges related to this initiative and no material liability remains as of February 3, 2024.
All charges incurred related to this plan were from continuing operations and presented as follows ($ in millions):
Statement of | 2022 | Cumulative Amount as of | ||||||||||||||||||||||||||
Earnings Location | Domestic | International | Total | Domestic | International | Total | ||||||||||||||||||||||
Inventory markdowns | Cost of sales | $ | - | $ | (6) | $ | (6) | $ | - | $ | 17 | $ | 17 | |||||||||||||||
Asset impairments(1) | Restructuring charges | - | 6 | 6 | 10 | 63 | 73 | |||||||||||||||||||||
Termination benefits | Restructuring charges | (40) | (1) | (41) | 83 | 20 | 103 | |||||||||||||||||||||
Currency translation adjustment | Restructuring charges | - | - | - | - | 39 | 39 | |||||||||||||||||||||
Other(2) | Restructuring charges | - | - | - | - | 6 | 6 | |||||||||||||||||||||
$ | (40) | $ | (1) | $ | (41) | $ | 93 | $ | 145 | $ | 238 | |||||||||||||||||
(1)Remaining net carrying value of asset impairments approximates fair value and was immaterial as of February 3, 2024.
(2)Other charges are primarily comprised of contract termination costs.
No material restructuring accrual activity occurred in fiscal 2024 or fiscal 2023 related to this plan.
4. Goodwill and Intangible Assets
Goodwill
Goodwill balances by reportable segment were as follows ($ in millions):
February 3, 2024 | January 28, 2023 | ||||||||||||||
Gross Carrying Amount | Cumulative Impairment | Gross Carrying Amount | Cumulative Impairment | ||||||||||||
Domestic | $ | 1,450 | $ | (67) | $ | 1,450 | $ | (67) | |||||||
International | 608 | (608) | 608 | (608) | |||||||||||
Total | $ | 2,058 | $ | (675) | $ | 2,058 | $ | (675) | |||||||
No impairment charges were recorded for the periods presented.
Definite-Lived Intangible Assets
We have definite-lived intangible assets which are recorded within Other assets on our Consolidated Balance Sheets as follows ($ in millions):
February 3, 2024 | January 28, 2023 | Weighted-Average | |||||||||||||||||
Gross Carrying Amount | Accumulated Amortization | Gross Carrying Amount | Accumulated Amortization | Useful Life Remaining as of February 3, 2024 (in years) | |||||||||||||||
Customer relationships | $ | 360 | $ | 276 | $ | 360 | $ | 236 | 10.1 | ||||||||||
Tradenames | 108 | 69 | 108 | 56 | 4.8 | ||||||||||||||
Developed technology | 64 | 59 | 64 | 51 | 3.8 | ||||||||||||||
Total | $ | 532 | $ | 404 | $ | 532 | $ | 343 | 8.2 | ||||||||||
Amortization expense was as follows ($ in millions):
Statement of Earnings Location | 2024 | 2023 | 2022 | ||||||||||
Amortization expense | SG&A | $ | 61 | $ | 86 | $ | 82 | ||||||
Amortization expense expected to be recognized in future periods is as follows ($ in millions):
Fiscal Year | Amount | ||||||||||||||
Fiscal 2025 | $ | 21 | |||||||||||||
Fiscal 2026 | 21 | ||||||||||||||
Fiscal 2027 | 18 | ||||||||||||||
Fiscal 2028 | 12 | ||||||||||||||
Fiscal 2029 | 11 | ||||||||||||||
Thereafter | 45 |
5. Fair Value Measurements
Fair value measurements are reported in one of three levels based on the lowest level of significant input used: Level 1 (unadjusted quoted prices in active markets); Level 2 (observable market inputs, other than quoted prices included in Level 1); and Level 3 (unobservable inputs that cannot be corroborated by observable market data).
Recurring Fair Value Measurements
Financial assets accounted for at fair value were as follows ($ in millions):
Fair Value | Fair Value at | |||||||||||
Assets | Balance Sheet Location(1) | Hierarchy | February 3, 2024 | January 28, 2023 | ||||||||
Money market funds(2) | Cash and cash equivalents | Level 1 | $ | 330 | $ | 280 | ||||||
Time deposits(3) | Cash and cash equivalents | Level 2 | 60 | 203 | ||||||||
Money market funds(2) | Other current assets | Level 1 | 182 | 178 | ||||||||
Time deposits(3) | Other current assets | Level 2 | 50 | - | ||||||||
Marketable securities that fund deferred compensation(4) | Other assets | Level 1 | 48 | 47 | ||||||||
(1)Balance sheet location is determined by the length to maturity at date of purchase and whether the assets are restricted for particular use.
(2)Valued at quoted market prices in active markets at period end.
(3)Valued at face value plus accrued interest at period end, which approximates fair value.
(4)Valued using the performance of mutual funds that trade with sufficient frequency and volume to obtain pricing information on an ongoing basis.
Nonrecurring Fair Value Measurements
In fiscal 2022, we recorded asset impairments related to our exit from operations in Mexico. See Note 3, Restructuring, for additional information regarding the charges incurred and the net carrying value of assets remaining.
Fair Value of Financial Instruments
The following table presentsfair values of cash, certain restricted cash, receivables, accounts payable and other payables approximated their carrying values because of the notionalshort-term nature of these instruments. If these instruments were measured at fair value in the financial statements, they would be classified as Level 1 in the fair value hierarchy. Fair values for other investments held at cost are not readily available, but we estimate that the carrying values for these investments approximate their fair values.
Long-term debt is presented at carrying value on our Consolidated Balance Sheets. If our long-term debt were recorded at fair value, it would be classified as Level 2 in the fair value hierarchy. Long-term debt balances were as follows ($ in millions):
February 3, 2024 | January 28, 2023 | ||||||||||||||
Fair Value | Carrying Value | Fair Value | Carrying Value | ||||||||||||
Long-term debt(1) | $ | 1,022 | $ | 1,139 | $ | 1,019 | $ | 1,143 | |||||||
(1)Excludes debt discounts, issuance costs and finance lease obligations.
6. Derivative Instruments
We manage our economic and transaction exposure to certain risks by using foreign currency forward contracts to hedge against the effect of Canadian dollar exchange rate fluctuations on a portion of our net investment in our Canadian operations and by using interest rate swaps to mitigate the effect of interest rate fluctuations on our 2028 Notes. In addition, we use foreign currency forward contracts not designated as hedging instruments to manage the impact of fluctuations in foreign currency exchange rates relative to recognized receivable and payable balances denominated in non-functional currencies.
Our derivative instruments designated as net investment hedges and interest rate swaps are recorded on our Consolidated Balance Sheets at fair value. See Note 5, Fair Value Measurements, for gross fair values of our outstanding derivative instruments and corresponding fair value classifications.
Notional amounts of our derivative instruments atwere as follows ($ in millions):
Notional Amount | |||||||
Contract Type | February 3, 2024 | January 28, 2023 | |||||
Derivatives designated as net investment hedges | $ | 100 | $ | 114 | |||
Derivatives designated as interest rate swap contracts | 500 | 500 | |||||
No hedging designation (foreign currency forward contracts) | 66 | 56 | |||||
Total | $ | 666 | $ | 670 | |||
Effects of our derivative instruments on our Consolidated Statements of Earnings were as follows ($ in millions):
Gain (Loss) Recognized | ||||||||||||
Contract Type | Statement of Earnings Location | 2024 | 2023 | 2022 | ||||||||
Interest rate swap contracts | Interest expense | $ | (4) | $ | (57) | $ | (41) | |||||
Adjustments to carrying value of long-term debt | Interest expense | 4 | 57 | 41 | ||||||||
Total | $ | - | $ | - | $ | - | ||||||
7. Leases
Supplemental balance sheet information related to our leases was as follows ($ in millions):
Balance Sheet Location | February 3, 2024 | January 28, 2023 | |||||||
Assets | |||||||||
Operating leases | Operating lease assets | $ | 2,758 | $ | 2,746 | ||||
Finance leases | Property under finance leases, net(1) | 43 | 50 | ||||||
Total lease assets | $ | 2,801 | $ | 2,796 | |||||
Liabilities | |||||||||
Current: | |||||||||
Operating leases | Current portion of operating lease liabilities | $ | 618 | $ | 638 | ||||
Finance leases | Current portion of long-term debt | 13 | 16 | ||||||
Non-current: | |||||||||
Operating leases | Long-term operating lease liabilities | 2,199 | 2,164 | ||||||
Finance leases | Long-term debt | 21 | 26 | ||||||
Total lease liabilities | $ | 2,851 | $ | 2,844 | |||||
(1)
(1)Finance leases were recorded net of accumulated depreciation of $54 million and $50 million as of February 3, 2024, and January 28, 2017, and January 30, 2016:2023, respectively.
Components of our total lease cost were as follows ($ in millions):
Statement of Earnings Location | 2024 | 2023 | 2022 | ||||||||||
Operating lease cost(1) | Cost of sales and SG&A(2) | $ | 777 | $ | 780 | $ | 770 | ||||||
Finance lease cost: | |||||||||||||
Depreciation of lease assets | Cost of sales and SG&A(2) | 16 | 15 | 13 | |||||||||
Interest on lease liabilities | Interest expense | 1 | 1 | 1 | |||||||||
Variable lease cost | Cost of sales and SG&A(2) | 239 | 233 | 238 | |||||||||
Sublease income | SG&A | (11) | (12) | (13) | |||||||||
Total lease cost | $ | 1,022 | $ | 1,017 | $ | 1,009 | |||||||
(1)
(1)Includes short-term leases, which are immaterial.
(2)Supply chain-related amounts are included in Cost of sales.
| Notional Amount | |||||||
| Contract Type | January 28, 2017 | January 30, 2016 | |||||
| Derivatives designated as net investment hedges | $ | 205 | $ | 208 | |||
| Derivatives designated as interest rate swaps | 750 | 750 | |||||
| No hedge designation (foreign exchange forward contracts) | 43 | 94 | |||||
| Total | $ | 998 | $ | 1,052 | |||
Other information related to our leases was as follows ($ in millions):
2024 | 2023 | ||||||||
Cash paid for amounts included in the measurement of lease liabilities: | |||||||||
Operating cash flows from operating leases | $ | 772 | $ | 781 | |||||
Operating cash flows from finance leases | 1 | 1 | |||||||
Financing cash flows from finance leases | 14 | 18 | |||||||
Lease assets obtained in exchange for new lease liabilities: | |||||||||
Operating leases | 717 | 809 | |||||||
Finance leases | 11 | 18 | |||||||
Weighted average remaining lease term (in years): | |||||||||
Operating leases | 5.2 | 5.1 | |||||||
Finance leases | 5.9 | 5.5 | |||||||
Weighted average discount rate: | |||||||||
Operating leases | 3.6 | % | 3.0 | % | |||||
Finance leases | 3.9 | % | 3.2 | % | |||||
Future lease payments under our non-cancellable leases as of February 3, 2024, were as follows ($ in millions):
Operating Leases(1) | Finance Leases(1) | ||||||||||
Fiscal 2025 | $ | 708 | $ | 16 | |||||||
Fiscal 2026 | 675 | 10 | |||||||||
Fiscal 2027 | 559 | 6 | |||||||||
Fiscal 2028 | 432 | 3 | |||||||||
Fiscal 2029 | 288 | 1 | |||||||||
Thereafter | 460 | 3 | |||||||||
Total future undiscounted lease payments | 3,122 | 39 | |||||||||
Less imputed interest | 305 | 5 | |||||||||
Total reported lease liability | $ | 2,817 | $ | 34 | |||||||
(1)Lease payments exclude $118 million of legally binding fixed costs for leases signed but not yet commenced.
8. Debt
Short-Term Debt
U.S. Revolving Credit Facility
On April 12, 2023, we entered into a $1.25 billion five-year senior unsecured revolving credit facility agreement (the “Five-Year Facility Agreement”) with a syndicate of banks. The Five-Year Facility Agreement replaced the previous $1.25 billion senior unsecured revolving credit facility (the “Previous Facility”) with a syndicate of banks, which was entered into in May 2021 and scheduled to expire in May 2026, but was terminated on April 12, 2023. The Five-Year Facility Agreement permits borrowings of up to $1.25 billion and expires in April 2028. There were no borrowings outstanding under the Five-Year Facility Agreement as of February 3, 2024, or the Previous Facility as of January 28, 2023.
The interest rate under the Five-Year Facility Agreement is variable and, absent certain events of default, is determined at our option as: (i) the sum of (a) the greatest of (1) JPMorgan Chase Bank, N.A.’s prime rate, (2) the greater of the federal funds effective rate and the overnight bank funding rate plus, in each case, 0.5%, and (3) Adjusted Term Secured Overnight Financing Rate (the “Adjusted Term SOFR” as defined in the Five-Year Facility Agreement) for an interest period of one month plus 1%, and (b) a variable margin rate (the “ABR Margin”); or (ii) Adjusted Term SOFR for the applicable interest period plus a variable margin rate (the “Term SOFR Margin”). In addition, a facility fee is assessed on the commitment amount. The ABR Margin, Term SOFR Margin and the facility fee are based upon our current senior unsecured debt rating. Under the Five-Year Facility Agreement, the ABR Margin ranges from 0.00% to 0.100%, the Term SOFR Margin ranges from 0.680% to 1.100%, and the facility fee ranges from 0.070% to 0.150%.
The Five-Year Facility Agreement is guaranteed by certain of our subsidiaries and contains customary affirmative and negative covenants. Among other things, these covenants restrict our and certain of our subsidiaries’ abilities to incur liens on certain assets, make material changes in corporate structure or materially alter the nature of our business, dispose of material assets, engage in mergers, consolidations and certain other fundamental changes, or engage in certain transactions with affiliates.
The Five-Year Facility Agreement also contains a covenant that requires the registrant to maintain a maximum quarterly cash flow leverage ratio. The Five-Year Facility Agreement contains customary default provisions, including, but not limited to, failure to pay interest or principal when due and failure to comply with covenants.
Long-Term Debt
Long-term debt consisted of the following ($ in millions):
February 3, 2024 | January 28, 2023 | |||||||||
2028 Notes | $ | 500 | $ | 500 | ||||||
2030 Notes | 650 | 650 | ||||||||
Interest rate swap valuation adjustments | (11) | (7) | ||||||||
Subtotal | 1,139 | 1,143 | ||||||||
Debt discounts and issuance costs | (8) | (9) | ||||||||
Finance lease obligations | 34 | 42 | ||||||||
Total long-term debt | 1,165 | 1,176 | ||||||||
Less: current portion | 13 | 16 | ||||||||
Total long-term debt, less current portion | $ | 1,152 | $ | 1,160 | ||||||
2028 Notes
In September 2018, we issued $500 million principal amount of notes due October 1, 2028 (the “2028 Notes”). The 2028 Notes bear interest at a fixed rate of 4.45% per year, payable semi-annually on April 1 and October 1 of each year, beginning on April 1, 2019. Net proceeds from the issuance were $495 million after underwriting and issuance discounts totaling $5 million.
We may redeem some or all of the 2028 Notes at any time at a redemption price equal to the greater of (i) 100% of the principal amount, and (ii) the sum of the present values of each remaining scheduled payment of principal and interest discounted to the redemption date on a semiannual basis, plus accrued and unpaid interest on the principal amount to the redemption date as described in the indenture (including the supplemental indenture) relating to the 2028 Notes. Furthermore, if a change of control triggering event occurs, we will be required to offer to purchase the remaining unredeemed 2028 Notes at a price equal to 101% of their principal amount, plus accrued and unpaid interest to the purchase date.
The 2028 Notes are unsecured and unsubordinated obligations and rank equally with all of our other unsecured and unsubordinated debt. The 2028 Notes contain covenants that, among other things, limit our ability to incur debt secured by liens or to enter into sale and lease-back transactions.
2030 Notes
In October 2020, we issued $650 million principal amount of notes due October 1, 2030, (the “2030 Notes”) that bear interest at a fixed rate of 1.95% per year, payable semi-annually on April 1 and October 1 of each year, beginning on April 1, 2021. Net proceeds from the issuance were $642 million after underwriting and issuance discounts totaling $8 million.
We may redeem some or all of the 2030 Notes at any time at a redemption price equal to the greater of (i) 100% of the principal amount, and (ii) the sum of the present values of each remaining scheduled payment of principal and interest discounted to the redemption date on a semiannual basis, plus accrued and unpaid interest on the principal amount to the redemption date as described in the indenture (including the supplemental indenture) relating to the 2030 Notes. Furthermore, if a change of control triggering event occurs, we will be required to offer to purchase the remaining unredeemed 2030 Notes at a price equal to 101% of their principal amount, plus accrued and unpaid interest to the purchase date.
The 2030 Notes are unsecured and unsubordinated obligations and rank equally with all of our other unsecured and unsubordinated debt. The 2030 Notes contain covenants that, among other things, limit our ability to incur debt secured by liens or to enter into sale and lease-back transactions.
Fair Value and Future Maturities
See Note 5, Fair Value Measurements, for the fair value of long-term debt.
Other than our 2028 Notes, we do not have any future maturities of long-term debt within the next five fiscal years.
9. Shareholders’ Equity
Stock Compensation Plans
The Best Buy Co., Inc. 2020 Omnibus Incentive Plan (the “2020 Plan”) approved by shareholders in June 2020 authorizes us to issue up to 18.6 million shares plus the remaining unused shares available for issuance under the Best Buy Co., Inc. Amended and Restated 2014 Omnibus Incentive Plan (the "Omnibus Plan"“2014 Plan”). In addition, shares subject to any outstanding awards under our prior stock incentive plans that are forfeited, cancelled or reacquired by the Company are available for reissuance under the 2020 Plan. The 2014 Plan was terminated as to the grant of any additional awards, but prior awards remain outstanding and continue to vest in accordance with the original terms of such plan.
The 2020 Plan authorizes us to grant or issue non-qualified stock options, incentive stock options, stock appreciation rights, restricted stock, restricted stock units and other equity awards up to a total of 22.5 million shares.awards. We have not granted incentive stock options under the Omnibus Plan.options. Under the terms of the Omnibus2020 Plan, awards may be granted to our employees, officers, advisers, consultants and directors. Awards issued under the Omnibus2020 Plan vest as determined by the Compensation and Human Resources Committee of our Board of Directors (“Board”) at the time of grant. Awards granted, forfeitedDividend equivalents accrue on restricted stock and restricted stock units during the vesting period, are forfeitable prior to the vesting date and are settled in shares of our common stock at the vesting or canceled under the previous plan, the 2004 Omnibus Stock and Incentive Plan, afterdistribution date. As of February 1, 2014, adjust the amount available under the Omnibus Plan. At January 28, 2017,3, 2024, a total of 14.613.0 million shares were available for future grants under the Omnibus2020 Plan.
Stock-based compensation plans were terminated. However, existing awards under those plans continued to vestexpense was as follows ($ in accordance with the original vesting schedule and will expire at the end of their original term.millions):
2024 | 2023 | 2022 | |||||||||
Share awards: | |||||||||||
Time-based | $ | 126 | $ | 121 | $ | 109 | |||||
Market-based | 19 | 14 | 12 | ||||||||
Performance-based | - | - | 17 | ||||||||
Stock options | - | 3 | 3 | ||||||||
Stock-based compensation expense | 145 | 138 | 141 | ||||||||
Income tax benefits | 27 | 27 | 26 | ||||||||
Stock-based compensation expense, net of tax | $ | 118 | $ | 111 | $ | 115 | |||||
Time-Based Share Awards
Time-based share awards vest based either upon attainment of specified goals or solely upon continued employment, ("time-based"). Outstandinggenerally 33% on each of the three annual anniversary dates following the grant date. Time-based share awards to directors vest one year from the date of grant. Information on our time-based share awards was as follows (shares in thousands):
Time-Based Share Awards | Shares | Weighted-Average Fair Value per Share | ||||
Outstanding as of January 28, 2023 | 3,046 | $ | 90.96 | |||
Granted | 2,003 | $ | 77.70 | |||
Vested and distributed | (1,476) | $ | 85.71 | |||
Forfeited | (307) | $ | 91.83 | |||
Outstanding as of February 3, 2024 | 3,266 | $ | 85.71 | |||
The total fair value vested and distributed during fiscal 2024, fiscal 2023 and fiscal 2022 was $114 million, $159 million and $194 million, respectively. The actual tax benefits realized for the tax deductions related to vesting in fiscal 2024, fiscal 2023 and fiscal 2022 were $24 million, $33 million and $41 million, respectively. As of February 3, 2024, there was $140 million of unrecognized compensation expense related to non-vested time-based share awards that are not time-basedwe expect to recognize over a weighted-average period of 1.8 years.
Market-Based Share Awards
Market-based share awards vest at the end of a three-year incentive period based upon our total shareholder return ("TSR") compared to the TSR of companies that comprise Standard & Poor's 500 Index
Market-Based Share Awards | Shares | Weighted-Average Fair Value per Share | ||||
Outstanding as of January 28, 2023 | 514 | $ | 96.61 | |||
Granted | 267 | $ | 86.95 | |||
Adjustment for performance achievement | (178) | $ | 53.18 | |||
Forfeited | (24) | $ | 98.03 | |||
Outstanding as of February 3, 2024 | 579 | $ | 106.38 | |||
Distributions of market-based share awards in fiscal 2024 were not significant. The total fair value distributed during fiscal 2023 and fiscal 2022 was $18 million and $27 million, respectively. The actual tax benefits realized for the tax deductions related to distributions were $2 million and $3 million in fiscal 2023 and fiscal 2022, respectively. As of February 3, 2024, there was $21 million of unrecognized compensation expense related to non-vested market-based share awards that we expect to recognize over a weighted-average period of 1.7 years.
Performance-Based Share Awards
Performance-based share awards generally vest upon the achievement of company performance goals ("performance-based"). We have time-based sharebased upon certain revenue or profitability measures. For revenue-based performance awards, the number of shares of common stock that vest in their entiretycould be distributed at the end of
Performance-Based Share Awards | Shares | Weighted-Average Fair Value per Share | ||||
Outstanding as of January 28, 2023 | 288 | $ | 67.36 | |||
Granted | 2 | $ | 111.87 | |||
Adjustment for performance achievement | (46) | $ | 51.79 | |||
Distributed | (195) | $ | 61.07 | |||
Forfeited | (4) | $ | 77.40 | |||
Outstanding as of February 3, 2024 | 45 | $ | 111.68 | |||
The total fair value distributed during fiscal 2024, fiscal 2023 and fiscal 2022 was $15 million, $37 million and $43 million, respectively. The actual tax benefits realized for the tax deductions related to distributions in fiscal
| 2017 | 2016 | 2015 | |||||||||
| Stock options | $ | 9 | $ | 15 | $ | 17 | |||||
| Share awards | |||||||||||
| Market-based | 15 | 16 | 10 | ||||||||
| Performance-based | 6 | — | — | ||||||||
| Time-based | 78 | 73 | 60 | ||||||||
| Total | $ | 108 | $ | 104 | $ | 87 | |||||
Stock Options
Our outstanding stock options have a 10-year term and generally vest 33% on each of the three annual anniversary dates following the grant date. All outstanding stock options were vested and exercisable as of February 3, 2024. Information on our stock options was as follows in fiscal
Stock Options | Weighted-Average | Weighted-Average | Aggregate | |||||||||||
Outstanding as of January 28, 2023 | 720 | $ | 60.91 | |||||||||||
Exercised | (152) | $ | 62.97 | |||||||||||
Forfeited | (39) | $ | 69.11 | |||||||||||
Outstanding as of February 3, 2024 | 529 | $ | 59.71 | 4.9 | $ | 8 | ||||||||
Stock Options | Weighted-Average Exercise Price per Share | Weighted-Average Remaining Contractual Term (in years) | Aggregate Intrinsic Value (in millions) | |||||||||
| Outstanding at January 30, 2016 | 14,242,000 | $ | 36.51 | |||||||||
| Granted | 224,000 | $ | 31.79 | |||||||||
| Exercised | (5,273,000 | ) | $ | 31.29 | ||||||||
| Forfeited/Canceled | (2,206,000 | ) | $ | 48.13 | ||||||||
| Outstanding at January 28, 2017 | 6,987,000 | $ | 36.61 | 4.3 | $ | 54 | ||||||
| Vested or expected to vest at January 28, 2017 | 6,987,000 | $ | 36.61 | 4.3 | $ | 54 | ||||||
| Exercisable at January 28, 2017 | 5,858,000 | $ | 36.63 | 3.5 | $ | 46 | ||||||
No stock options were granted duringin the fiscal
Net cash proceeds from the exercise of stock options were
Valuation Assumptions(1) | 2017 | 2016 | 2015 | ||||||
Risk-free interest rate(2) | 0.5% – 2.0% | 0.1% – 2.1% | 0.1% – 2.4% | ||||||
| Expected dividend yield | 3.5 | % | 2.3 | % | 2.5 | % | |||
Expected stock price volatility(3) | 37 | % | 37 | % | 40 | % | |||
Expected life of stock options (in years)(4) | 6.0 | 6.0 | 6.0 | ||||||
| Market-Based Share Awards | Shares | Weighted-Average Fair Value per Share | |||||
| Outstanding at January 30, 2016 | 1,462,000 | $ | 32.33 | ||||
| Granted | 1,088,000 | $ | 29.52 | ||||
| Vested | (781,000 | ) | $ | 26.84 | |||
| Forfeited/Canceled | (217,000 | ) | $ | 33.27 | |||
| Outstanding at January 28, 2017 | 1,552,000 | $ | 32.99 | ||||
| Time-Based Share Awards | Shares | Weighted-Average Fair Value per Share | |||||
| Outstanding at January 30, 2016 | 5,103,000 | $ | 31.89 | ||||
| Granted | 2,979,000 | $ | 30.68 | ||||
| Vested | (2,202,000 | ) | $ | 30.83 | |||
| Forfeited/Canceled | (515,000 | ) | $ | 32.76 | |||
| Outstanding at January 28, 2017 | 5,365,000 | $ | 31.57 | ||||
| Performance-Based Share Awards | Shares | Weighted-Average Fair Value per Share | |||||
| Outstanding at January 30, 2016 | — | $ | — | ||||
| Granted | 513,000 | $ | 29.08 | ||||
| Forfeited/Canceled | (75,000 | ) | $ | 29.66 | |||
| Outstanding at January 28, 2017 | 438,000 | $ | 28.98 | ||||
Earnings per Share
We compute our basic earnings per share based on the weighted-average number of common shares outstanding, and our diluted earnings per share based on the weighted-average number of common shares outstanding adjusted by the number of additional shares that would have been outstanding had the potentially dilutive common shares been issued. Potentially dilutive securities include stock options nonvestedand non-vested share awards and shares issuable under our employee stock purchase plan. Nonvestedawards. Non-vested market-based share awards and nonvestednon-vested performance-based share awards are included in the average diluted shares outstanding each period if established market or performance criteria have been met at the end of the respective periods.
As of February 3, 2024, all outstanding options to purchase
| Exercisable | Unexercisable | Total | |||||||||||||||||||||||||||
| Shares | % | Weighted- Average Price per Share | Shares | % | Weighted- Average Price per Share | Shares | % | Weighted- Average Price per Share | |||||||||||||||||||||
| In-the-money | 2.3 | 39 | % | $ | 26.38 | 0.5 | 45 | % | $ | 30.84 | 2.8 | 40 | % | $ | 27.13 | ||||||||||||||
| Out-of-the-money | 3.6 | 61 | % | $ | 43.45 | 0.6 | 55 | % | $ | 40.66 | 4.2 | 60 | % | $ | 43.01 | ||||||||||||||
| Total | 5.9 | 100 | % | $ | 36.64 | 1.1 | 100 | % | $ | 36.54 | 7.0 | 100 | % | $ | 36.61 | ||||||||||||||
Reconciliations of the numerators and denominators of basic and diluted earnings per share from continuing operations attributable to Best Buy Co., Inc. in fiscal
2024 | 2023 | 2022 | |||||||||
Numerator | |||||||||||
Net earnings | $ | 1,241 | $ | 1,419 | $ | 2,454 | |||||
Denominator | |||||||||||
Weighted-average common shares outstanding | 217.7 | 224.8 | 246.8 | ||||||||
Dilutive effect of stock compensation plan awards | 0.8 | 0.9 | 2.5 | ||||||||
Weighted-average common shares outstanding, assuming dilution | 218.5 | 225.7 | 249.3 | ||||||||
Potential shares which were anti-dilutive and excluded from weighted-average share computations | - | 0.7 | 0.1 | ||||||||
Basic earnings per share | $ | 5.70 | $ | 6.31 | $ | 9.94 | |||||
Diluted earnings per share | $ | 5.68 | $ | 6.29 | $ | 9.84 | |||||
| 2017 | 2016 | 2015 | |||||||||
| Numerator (in millions): | |||||||||||
| Net earnings from continuing operations attributable to Best Buy Co., Inc., shareholders | $ | 1,207 | $ | 807 | $ | 1,246 | |||||
| Denominator (in millions): | |||||||||||
| Weighted-average common shares outstanding | 318.5 | 346.5 | 349.5 | ||||||||
| Effect of potentially dilutive securities: | |||||||||||
| Stock options and other | 4.1 | 4.2 | 4.1 | ||||||||
| Weighted-average common shares outstanding, assuming dilution | 322.6 | 350.7 | 353.6 | ||||||||
| Net earnings per share from continuing operations attributable to Best Buy Co., Inc. shareholders | |||||||||||
| Basic | $ | 3.79 | $ | 2.33 | $ | 3.57 | |||||
| Diluted | $ | 3.74 | $ | 2.30 | $ | 3.53 | |||||
Repurchase of Common Stock
On February 28, 2022, our Board of Directors authorizedapproved a
Information regarding the shares we repurchased and retired in fiscal 2017 and 2016, noting that we had no repurchases and retirements in fiscal
2024 | 2023 | 2022 | |||||||||
Total cost of shares repurchased | $ | 340 | $ | 1,001 | $ | 3,504 | |||||
Average price per share | $ | 72.52 | $ | 84.78 | $ | 108.97 | |||||
Number of shares repurchased and retired | 4.7 | 11.8 | 32.2 | ||||||||
| 2017 | 2016 | ||||||
| Total cost of shares repurchased | |||||||
Open market(1) | $ | 706 | $ | 880 | |||
| January 2016 ASR | 45 | 120 | |||||
| Total | $ | 751 | $ | 1,000 | |||
| Average price per share | |||||||
| Open market | $ | 36.11 | $ | 31.03 | |||
| January 2016 ASR | $ | 28.55 | $ | 27.28 | |||
| Average | $ | 35.54 | $ | 30.53 | |||
| Number of shares repurchased and retired | |||||||
Open market(1) | 19.5 | 28.4 | |||||
| January 2016 ASR | 1.6 | 4.4 | |||||
| Total | 21.1 | 32.8 | |||||
We currently expect to spend approximately $350 million on share repurchase program. In February 2017, our Board of Directors authorized a new $5.0 billion share repurchase plan, which supersedes the June 2011 share repurchase program. There is no expiration date governing the period over which we can repurchase shares under the February 2017 share repurchase program. Repurchased shares have been retired and constitute authorized but unissued shares.
| Foreign Currency Translation | Available-For-Sale Investments(1) | Total | |||||||||
| Balances at February 1, 2014 | $ | 485 | $ | 7 | $ | 492 | |||||
| Foreign currency translation adjustments | (103 | ) | — | (103 | ) | ||||||
| Unrealized gains on available-for-sale investments | — | (3 | ) | (3 | ) | ||||||
| Reclassification of losses on available-for-sale investments into earnings | — | (4 | ) | (4 | ) | ||||||
| Balances at January 31, 2015 | 382 | — | 382 | ||||||||
| Foreign currency translation adjustments | (44 | ) | — | (44 | ) | ||||||
| Reclassification of foreign currency translation adjustments into earnings due to sale of business | (67 | ) | — | (67 | ) | ||||||
| Balances at January 30, 2016 | 271 | — | 271 | ||||||||
| Foreign currency translation adjustments | 10 | — | 10 | ||||||||
| Reclassification of foreign currency translation adjustments into earnings | (2 | ) | — | (2 | ) | ||||||
| Balances at January 28, 2017 | $ | 279 | $ | — | $ | 279 | |||||
10. Revenue
We generate substantially all of our revenue from contracts with customers from the sale of products and
| 2017 | 2016 | 2015 | |||||||||
| Minimum rentals | $ | 789 | $ | 797 | $ | 848 | |||||
| Contingent rentals | 1 | 1 | 2 | ||||||||
| Total rent expense | 790 | 798 | 850 | ||||||||
| Less: sublease income | (16 | ) | (15 | ) | (18 | ) | |||||
| Net rent expense | $ | 774 | $ | 783 | $ | 832 | |||||
February 3, 2024 | January 28, 2023 | ||||||
Receivables(1) | $ | 512 | $ | 581 | |||
Short-term contract liabilities included in: | |||||||
Unredeemed gift cards | 253 | 274 | |||||
Deferred revenue | 1,000 | 1,116 | |||||
Accrued liabilities | 53 | 66 | |||||
Long-term contract liabilities included in: | |||||||
Long-term liabilities | 245 | 265 | |||||
| Fiscal Year | Capital Leases | Financing Leases | Operating Leases(1) | |||||||||
| 2018 | $ | 9 | $ | 46 | $ | 803 | ||||||
| 2019 | 7 | 41 | 676 | |||||||||
| 2020 | 4 | 35 | 546 | |||||||||
| 2021 | 3 | 28 | 411 | |||||||||
| 2022 | 2 | 20 | 285 | |||||||||
| Thereafter | 11 | 56 | 404 | |||||||||
| Total minimum lease payments | 36 | 226 | $ | 3,125 | ||||||||
| Less amount representing interest | (6 | ) | (49 | ) | ||||||||
| Present value of minimum lease payments | 30 | 177 | ||||||||||
| Less current maturities | (8 | ) | (36 | ) | ||||||||
| Present value of minimum lease payments, less current maturities | $ | 22 | $ | 141 | ||||||||
(1)Receivables are recorded net of approximately
During fiscal 2024 and fiscal 2023, $1,283 million and $1,346 million of their eligible compensation annually as defined byrevenue was recognized, respectively, that was included in the plan document, subject to Internal Revenue Service limitations. We match
Estimated revenue from our contract liability balances expected to be recognized in fiscal
Fiscal Year | Amount | ||||||
Fiscal 2025 | $ | 33 | |||||
Fiscal 2026 | 33 | ||||||
Fiscal 2027 | 25 | ||||||
Fiscal 2028 | 25 | ||||||
Fiscal 2029 | 25 | ||||||
Thereafter | 137 |
See Note 14, Segment and electedGeographic Information, for information on our revenue by the participants. In the event of bankruptcy, the assets of the plan are available to satisfy the claims of general creditors. The liability for compensation deferred under the plan was
11. Income Taxes
Reconciliations of the federal statutory income tax rate to income tax expense in fiscal
2024 | 2023 | 2022 | |||||||||
Federal income tax at the statutory rate | $ | 340 | $ | 376 | $ | 635 | |||||
State income taxes, net of federal benefit | 57 | 63 | 88 | ||||||||
Change in unrecognized tax benefits | (6) | (45) | (88) | ||||||||
Benefit from foreign operations | (8) | (4) | (8) | ||||||||
Other | (2) | (20) | (53) | ||||||||
Income tax expense | $ | 381 | $ | 370 | $ | 574 | |||||
Effective income tax rate | 23.5 | % | 20.7 | % | 19.0 | % | |||||
| 2017 | 2016 | 2015 | |||||||||
| Federal income tax at the statutory rate | $ | 635 | $ | 458 | $ | 485 | |||||
| State income taxes, net of federal benefit | 38 | 38 | 43 | ||||||||
| (Benefit) expense from foreign operations | (46 | ) | 5 | (23 | ) | ||||||
| Other | (18 | ) | 2 | (11 | ) | ||||||
| Legal entity reorganization | — | — | (353 | ) | |||||||
| Income tax expense | $ | 609 | $ | 503 | $ | 141 | |||||
| Effective income tax rate | 33.5 | % | 38.4 | % | 10.1 | % | |||||
Earnings from continuing operations before income tax expense and equity in income of affiliates by jurisdiction waswere as follows in fiscal
2024 | 2023 | 2022 | |||||||||
United States | $ | 1,389 | $ | 1,533 | $ | 2,677 | |||||
Foreign | 232 | 255 | 347 | ||||||||
Earnings before income tax expense and equity in income of affiliates | $ | 1,621 | $ | 1,788 | $ | 3,024 | |||||
| 2017 | 2016 | 2015 | |||||||||
| United States | $ | 1,507 | $ | 1,310 | $ | 1,201 | |||||
| Outside the United States | 309 | — | 186 | ||||||||
| Earnings from continuing operations before income tax expense | $ | 1,816 | $ | 1,310 | $ | 1,387 | |||||
Income tax expense (benefit) was comprised of the following in fiscal
2024 | 2023 | 2022 | |||||||||
Current: | |||||||||||
Federal | $ | 452 | $ | 213 | $ | 367 | |||||
State | 104 | 64 | 132 | ||||||||
Foreign | 39 | 42 | 61 | ||||||||
595 | 319 | 560 | |||||||||
Deferred: | |||||||||||
Federal | (177) | 33 | 22 | ||||||||
State | (37) | 19 | (9) | ||||||||
Foreign | - | (1) | 1 | ||||||||
(214) | 51 | 14 | |||||||||
Income tax expense | $ | 381 | $ | 370 | $ | 574 | |||||
| 2017 | 2016 | 2015 | |||||||||
| Current: | |||||||||||
| Federal | $ | 317 | $ | 347 | $ | 354 | |||||
| State | 37 | 48 | 51 | ||||||||
| Foreign | 54 | 60 | 33 | ||||||||
| 408 | 455 | 438 | |||||||||
| Deferred: | |||||||||||
| Federal | 163 | 65 | (275 | ) | |||||||
| State | 21 | 10 | (26 | ) | |||||||
| Foreign | 17 | (27 | ) | 4 | |||||||
| 201 | 48 | (297 | ) | ||||||||
| Income tax expense | $ | 609 | $ | 503 | $ | 141 | |||||
Deferred taxes are the result of differences between the bases of assets and liabilities for financial reporting and income tax purposes. Deferred tax assets and liabilities were comprised of the following ($ in millions):
February 3, 2024 | January 28, 2023 | ||||||
Deferred revenue | $ | 127 | $ | 67 | |||
Compensation and benefits | 91 | 41 | |||||
Stock-based compensation | 32 | 29 | |||||
Other accrued expenses | 45 | 47 | |||||
Operating lease liabilities | 730 | 729 | |||||
Loss and credit carryforwards | 173 | 161 | |||||
Other | 42 | 43 | |||||
Total deferred tax assets | 1,240 | 1,117 | |||||
Valuation allowance | (175) | (150) | |||||
Total deferred tax assets after valuation allowance | 1,065 | 967 | |||||
Inventory | (45) | (37) | |||||
Property and equipment | (49) | (169) | |||||
Operating lease assets | (701) | (698) | |||||
Goodwill and intangibles | (81) | (71) | |||||
Other | (22) | (39) | |||||
Total deferred tax liabilities | (898) | (1,014) | |||||
Net deferred tax assets (liabilities) | $ | 167 | $ | (47) | |||
Deferred taxes were presented as follows ($ in millions):
Balance Sheet Location | February 3, 2024 | January 28, 2023 | |||||
Other assets | $ | 167 | $ | 4 | |||
Long-term liabilities | - | (51) | |||||
Net deferred tax assets (liabilities) | $ | 167 | $ | (47) | |||
| January 28, 2017 | January 30, 2016 | ||||||
| Accrued property expenses | $ | 91 | $ | 175 | |||
| Other accrued expenses | 76 | 78 | |||||
| Deferred revenue | 104 | 99 | |||||
| Compensation and benefits | 43 | 99 | |||||
| Stock-based compensation | 64 | 86 | |||||
| Goodwill and intangibles | 210 | 253 | |||||
| Loss and credit carryforwards | 123 | 133 | |||||
| Other | 59 | 86 | |||||
| Total deferred tax assets | 770 | 1,009 | |||||
| Valuation allowance | (94 | ) | (108 | ) | |||
| Total deferred tax assets after valuation allowance | 676 | 901 | |||||
| Property and equipment | (240 | ) | (296 | ) | |||
| Inventory | (97 | ) | (69 | ) | |||
| Other | (22 | ) | (26 | ) | |||
| Total deferred tax liabilities | (359 | ) | (391 | ) | |||
| Net deferred tax assets | $ | 317 | $ | 510 | |||
As of February 3, 2024, we had deferred tax assets are included in our Consolidated Balance Sheets as other assets as of January 28, 2017, and January 30, 2016.
As of February 3, 2024, a valuation allowance of
Reconciliations of changes in unrecognized tax benefits for fiscal
(1)
(1)
2024 | 2023 | 2022 | |||||||||
Balances at beginning of period | $ | 163 | $ | 235 | $ | 327 | |||||
Gross increases related to prior period tax positions | 10 | 28 | 3 | ||||||||
Gross decreases related to prior period tax positions(1) | (11) | (75) | (103) | ||||||||
Gross increases related to current period tax positions | 20 | 21 | 28 | ||||||||
Settlements with taxing authorities | (3) | - | (7) | ||||||||
Lapse of statute of limitations | (39) | (46) | (13) | ||||||||
Balances at end of period | $ | 140 | $ | 163 | $ | 235 | |||||
| 2017 | 2016 | 2015 | |||||||||
| Balance at beginning of period | $ | 469 | $ | 410 | $ | 370 | |||||
| Gross increases related to prior period tax positions | 11 | 30 | 33 | ||||||||
| Gross decreases related to prior period tax positions | (144 | ) | (13 | ) | (88 | ) | |||||
| Gross increases related to current period tax positions | 55 | 59 | 114 | ||||||||
| Settlements with taxing authorities | (12 | ) | (9 | ) | (9 | ) | |||||
| Lapse of statute of limitations | (5 | ) | (8 | ) | (10 | ) | |||||
| Balance at end of period | $ | 374 | $ | 469 | $ | 410 | |||||
(1)Represents multi-jurisdiction, multi-year resolutions of certain discrete tax matters.
Unrecognized tax benefits of
We recognize interest and penalties (not included in the "unrecognized“unrecognized tax benefits"benefits” above), as well as interest received from favorable tax settlements, as components of income tax expense. Interest expense of $3 million, interest income of
We file a consolidated U.S. federal income tax return, as well as income tax returns in various states and foreign jurisdictions. With few exceptions, we are no longer subject to U.S. federal, state and local, or non-U.S. income tax examinations by taxtaxing authorities for years before fiscal
Changes in state, federal and foreign tax positions will continue to generate increased liabilities for us for unrecognizedlaws may increase or decrease our tax benefits overcontingencies. The timing of the resolution of income tax examinations and controversies is highly uncertain, and the amounts ultimately paid, if any, upon resolution of the issues raised by the taxing authorities may differ from the amounts accrued. It is reasonably possible that within the next
12. Benefit Plans
We sponsor retirement savings plans for employees meeting certain eligibility requirements. Participants may choose from various investment options, including a fund comprised of our company stock. Participants can contribute up to 50% of their eligible compensation annually as defined by the change, if any,plan document, subject to haveInternal Revenue Service limitations. We match 100% of the first 3% of participating employees’ contributions and 50% of the next 2%. Employer contributions vest immediately. Total employer contributions were $76 million, $77 million and $77 million in fiscal 2024, fiscal 2023 and fiscal 2022, respectively.
We offer a material effectnon-qualified, unfunded deferred compensation plan for highly-compensated employees and members of our Board. Amounts contributed and deferred under the plan are invested in options offered under the plan and elected by the participants. The liability for compensation deferred under the plan was $24 million and $20 million as of February 3, 2024, and January 28, 2023, respectively, and is included in Long-term liabilities on our consolidated financial condition, resultsConsolidated Balance Sheets. See Note 5, Fair Value Measurements, for the fair value of operations or cash flows within the next
| 2017 | 2016 | 2015 | |||||||||
| Revenue | |||||||||||
| Domestic | $ | 36,248 | $ | 36,365 | $ | 36,055 | |||||
| International | 3,155 | 3,163 | 4,284 | ||||||||
| Total revenue | $ | 39,403 | $ | 39,528 | $ | 40,339 | |||||
| Percentage of revenue, by revenue category | |||||||||||
| Domestic | |||||||||||
| Consumer Electronics | 34 | % | 32 | % | 31 | % | |||||
| Computing and Mobile Phones | 45 | % | 46 | % | 47 | % | |||||
| Entertainment | 7 | % | 8 | % | 9 | % | |||||
| Appliances | 9 | % | 8 | % | 7 | % | |||||
| Services | 5 | % | 5 | % | 5 | % | |||||
| Other | — | % | 1 | % | 1 | % | |||||
| Total | 100 | % | 100 | % | 100 | % | |||||
| International | |||||||||||
| Consumer Electronics | 31 | % | 31 | % | 30 | % | |||||
| Computing and Mobile Phones | 48 | % | 48 | % | 49 | % | |||||
| Entertainment | 7 | % | 9 | % | 9 | % | |||||
| Appliances | 6 | % | 5 | % | 5 | % | |||||
| Services | 7 | % | 6 | % | 6 | % | |||||
| Other | 1 | % | 1 | % | 1 | % | |||||
| Total | 100 | % | 100 | % | 100 | % | |||||
| Operating income (loss) | |||||||||||
Domestic(1) | $ | 1,764 | $ | 1,585 | $ | 1,437 | |||||
| International | 90 | (210 | ) | 13 | |||||||
| Total operating income | 1,854 | 1,375 | 1,450 | ||||||||
| Other income (expense) | |||||||||||
| Gain on sale of investments | 3 | 2 | 13 | ||||||||
| Investment income and other | 31 | 13 | 14 | ||||||||
| Interest expense | (72 | ) | (80 | ) | (90 | ) | |||||
| Earnings from continuing operations before income tax expense | $ | 1,816 | $ | 1,310 | $ | 1,387 | |||||
Assets(2) | |||||||||||
| Domestic | $ | 12,496 | $ | 12,318 | $ | 12,987 | |||||
| International | 1,360 | 1,201 | 2,258 | ||||||||
| Total assets | $ | 13,856 | $ | 13,519 | $ | 15,245 | |||||
Capital expenditures(2) | |||||||||||
| Domestic | $ | 526 | $ | 602 | $ | 519 | |||||
| International | 56 | 47 | 42 | ||||||||
| Total capital expenditures | $ | 582 | $ | 649 | $ | 561 | |||||
Depreciation(2) | |||||||||||
| Domestic | $ | 613 | $ | 613 | $ | 575 | |||||
| International | 41 | 44 | 81 | ||||||||
| Total depreciation | $ | 654 | $ | 657 | $ | 656 | |||||
| 2017 | 2016 | 2015 | |||||||||
| Net sales to customers | |||||||||||
| United States | $ | 36,248 | $ | 36,365 | $ | 36,055 | |||||
| Canada | 2,899 | 2,917 | 4,047 | ||||||||
| Other | 256 | 246 | 237 | ||||||||
| Total revenue | $ | 39,403 | $ | 39,528 | $ | 40,339 | |||||
| Long-lived assets | |||||||||||
| United States | $ | 2,120 | $ | 2,189 | $ | 2,100 | |||||
| Canada | 156 | 140 | 174 | ||||||||
| Other | 17 | 17 | 21 | ||||||||
| Total long-lived assets | $ | 2,293 | $ | 2,346 | $ | 2,295 | |||||
13. Contingencies and Commitments
We are involved in a number of legal proceedings. Where appropriate, we have made accruals with respect to these matters, which are reflected inon our Consolidated Financial Statements. However, there are cases where liability is not probable or the amount cannot be reasonably estimated and, therefore, accruals have not been made. We provide disclosure of matters where we believe it is reasonably possible the impact may be material to our Consolidated Financial Statements.
We had outstanding letters of credit with an aggregate fair valuetotaling $71 million as of $89 million at January 28, 2017.
14. Segment and Geographic Information (Unaudited)
Reportable segment and full year of fiscal
2024 | 2023 | 2022 | |||||||||
Revenue by reportable segment | |||||||||||
Domestic | $ | 40,097 | $ | 42,794 | $ | 47,830 | |||||
International | 3,355 | 3,504 | 3,931 | ||||||||
Total revenue | $ | 43,452 | $ | 46,298 | $ | 51,761 | |||||
2024 | 2023 | 2022 | |||||||||
Revenue by product category | |||||||||||
Domestic: | |||||||||||
Computing and Mobile Phones | $ | 16,930 | $ | 18,191 | $ | 20,693 | |||||
Consumer Electronics | 12,014 | 13,040 | 15,009 | ||||||||
Appliances | 5,469 | 6,381 | 6,784 | ||||||||
Entertainment | 3,063 | 2,786 | 2,963 | ||||||||
Services | 2,357 | 2,149 | 2,190 | ||||||||
Other | 264 | 247 | 191 | ||||||||
Total Domestic revenue | $ | 40,097 | $ | 42,794 | $ | 47,830 | |||||
International: | |||||||||||
Computing and Mobile Phones | $ | 1,552 | $ | 1,575 | $ | 1,785 | |||||
Consumer Electronics | 955 | 1,054 | 1,194 | ||||||||
Appliances | 335 | 355 | 383 | ||||||||
Entertainment | 300 | 267 | 312 | ||||||||
Services | 173 | 183 | 190 | ||||||||
Other | 40 | 70 | 67 | ||||||||
Total International revenue | $ | 3,355 | $ | 3,504 | $ | 3,931 | |||||
Operating income by reportable segment and the reconciliation to consolidated earnings before income tax expense and equity in income of affiliates, as well as asset information by reportable segment, were as follows ($ in millions):
2024 | 2023 | 2022 | |||||||||
Operating income by reportable segment | |||||||||||
Domestic(1) | $ | 1,467 | $ | 1,634 | $ | 2,795 | |||||
International | 107 | 161 | 244 | ||||||||
Total operating income | 1,574 | 1,795 | 3,039 | ||||||||
Other income (expense): | |||||||||||
Gain on sale of subsidiary, net | 21 | - | - | ||||||||
Investment income and other | 78 | 28 | 10 | ||||||||
Interest expense | (52) | (35) | (25) | ||||||||
Earnings before income tax expense and equity in income of affiliates | $ | 1,621 | $ | 1,788 | $ | 3,024 | |||||
Assets | |||||||||||
Domestic | $ | 13,660 | $ | 14,549 | $ | 16,016 | |||||
International | 1,307 | 1,254 | 1,488 | ||||||||
Total assets | $ | 14,967 | $ | 15,803 | $ | 17,504 | |||||
Capital expenditures | |||||||||||
Domestic | $ | 760 | $ | 891 | $ | 691 | |||||
International | 35 | 39 | 46 | ||||||||
Total capital expenditures | $ | 795 | $ | 930 | $ | 737 | |||||
Depreciation | |||||||||||
Domestic | $ | 819 | $ | 787 | $ | 738 | |||||
International | 43 | 45 | 49 | ||||||||
Total depreciation | $ | 862 | $ | 832 | $ | 787 | |||||
(1)Domestic operating income includes certain operations that are based in foreign tax jurisdictions and primarily relate to sourcing products into the U.S.
| Quarter | 12-Month | ||||||||||||||||||
| 1st | 2nd | 3rd | 4th | 2017 | |||||||||||||||
| Revenue | $ | 8,443 | $ | 8,533 | $ | 8,945 | $ | 13,482 | $ | 39,403 | |||||||||
Comparable sales % change(1) | (0.1 | )% | 0.8 | % | 1.8 | % | (0.7 | )% | 0.3 | % | |||||||||
Gross profit(2) | $ | 2,145 | $ | 2,062 | $ | 2,203 | $ | 3,030 | $ | 9,440 | |||||||||
Operating income(3) | 372 | 289 | 312 | 881 | 1,854 | ||||||||||||||
| Net earnings from continuing operations | 226 | 182 | 192 | 607 | 1,207 | ||||||||||||||
| Gain from discontinued operations, net of tax | 3 | 16 | 2 | — | 21 | ||||||||||||||
| Net earnings attributable to Best Buy Co., Inc. shareholders | 229 | 198 | 194 | 607 | 1,228 | ||||||||||||||
Diluted earnings per share(4) | |||||||||||||||||||
| Continuing operations | $ | 0.69 | $ | 0.56 | $ | 0.60 | $ | 1.91 | $ | 3.74 | |||||||||
| Discontinued operations | 0.01 | 0.05 | 0.01 | — | 0.07 | ||||||||||||||
| Diluted earnings per share | $ | 0.70 | $ | 0.61 | $ | 0.61 | $ | 1.91 | $ | 3.81 | |||||||||
Geographic information was as follows ($ in millions):
2024 | 2023 | 2022 | |||||||||
Revenue from external customers | |||||||||||
U.S. | $ | 40,097 | $ | 42,794 | $ | 47,830 | |||||
Canada | 3,355 | 3,504 | 3,911 | ||||||||
Other | - | - | 20 | ||||||||
Total revenue from external customers | $ | 43,452 | $ | 46,298 | $ | 51,761 | |||||
Property and equipment, net | |||||||||||
U.S. | $ | 2,157 | $ | 2,243 | $ | 2,128 | |||||
Canada | 102 | 107 | 120 | ||||||||
Other | 1 | 2 | 2 | ||||||||
Total property and equipment, net | $ | 2,260 | $ | 2,352 | $ | 2,250 | |||||
| Quarter | 12-Month | ||||||||||||||||||
| 1st | 2nd | 3rd | 4th | 2016 | |||||||||||||||
| Revenue | $ | 8,558 | $ | 8,528 | $ | 8,819 | $ | 13,623 | $ | 39,528 | |||||||||
Comparable sales % change(1) | 0.6 | % | 3.8 | % | 0.8 | % | (1.7 | )% | 0.5 | % | |||||||||
Gross profit(5) | $ | 2,030 | $ | 2,098 | $ | 2,112 | $ | 2,951 | $ | 9,191 | |||||||||
Operating income(6) | 86 | 288 | 230 | 771 | 1,375 | ||||||||||||||
| Net earnings from continuing operations | 37 | 164 | 129 | 477 | 807 | ||||||||||||||
| Gain (loss) from discontinued operations, net of tax | 92 | — | (4 | ) | 2 | 90 | |||||||||||||
| Net earnings attributable to Best Buy Co., Inc. shareholders | 129 | 164 | 125 | 479 | 897 | ||||||||||||||
Diluted earnings (loss) per share(4) | |||||||||||||||||||
| Continuing operations | $ | 0.10 | $ | 0.46 | $ | 0.37 | $ | 1.39 | $ | 2.30 | |||||||||
| Discontinued operations | 0.26 | — | (0.01 | ) | 0.01 | 0.26 | |||||||||||||
| Diluted earnings per share | $ | 0.36 | $ | 0.46 | $ | 0.36 | $ | 1.40 | $ | 2.56 | |||||||||
Item 9. Changes in and Disagreements With Accountants on Accounting and Financial Disclosure.
None.
Item 9A. Controls and Procedures.
Disclosure Controls and Procedures
We maintain disclosure controls and procedures that are designed to ensure that information required to be disclosed by us in the reports we file or submit under the Exchange Act is recorded, processed, summarized and reported within the time periods specified in the SEC'sU.S. Securities and Exchange Commission’s (“SEC”) rules and forms, and that such information is accumulated and communicated to our management, including our Chief Executive Officer (principal executive officer) and Chief Financial Officer (principal financial officer), to allow timely decisions regarding required disclosure. We have established a Disclosure Committee, consisting of certain members of management, to assist in this evaluation. Our Disclosure Committee meets on a quarterly basis and more often if necessary.
Our management, including our Chief Executive Officer and Chief Financial Officer, evaluated the effectiveness of our disclosure controls and procedures (as defined in Rules 13a-15(e) and 15d-15(e) promulgated under the Exchange Act), as of
Management's Report on Internal Control Over Financial Reporting
Management’s report on our internal control over financial reporting is included in Item 8,
Financial Statements and Supplementary Data, of this Annual Report on Form 10-K.Attestation Report of the Independent Registered Public Accounting Firm
The attestation report of Deloitte & Touche LLP, our independent registered public accounting firm, on the effectiveness of our internal control over financial reporting is included in Item 8,
Financial Statements and Supplementary Data, of this Annual Report on Form 10-K.Changes in Internal Control Over Financial Reporting
There were no changes in internal control over financial reporting during the fiscal fourth quarter ended
Item 9B. Other Information.
Rule 10b5-1 Plan Elections
Set forth below are developments regarding trading plan arrangements among our directors and officers (as defined in Rule 16a-1(f) of the Securities Exchange Act of 1934, as amended (the “Exchange Act”)) for the quarter ended February 3, 2024.
On December 6, 2023, Jason Bonfig, the Company’s Senior Executive Vice President of Customer Offerings and Fulfillment, entered into a trading plan intended to satisfy the affirmative defense conditions of Rule 10b5-1(c) under the Exchange Act, providing for the potential sale of up to 28,500 shares of our common stock through February 28, 2025.
Other Information
There was no information required to be disclosed in a Current Report on Form 8-K during the fourth quarter of the fiscal year covered by this Annual Report on Form 10-K that was not reported.
Item 9C. Disclosure Regarding Foreign Jurisdictions that Prevent Inspections.
Not applicable.
PART III
Item 10. Directors, Executive Officers and Corporate Governance.
The information provided underrequired by this Item is incorporated by reference to the caption "Director Nominees"applicable information in the Company’s Proxy Statement for the 2024 Regular Meeting of Shareholders (the “2024 Proxy Statement”), which is incorporated herein by reference.
Code of Ethics
We adopted a Code of Business Ethics that applies to our directors and all of our employees, including our principal executive officer, our principal financial officer and our principal accounting officer. Our Code of Business Ethics is available on our website
We intend to satisfy the disclosure requirement under Item 5.05 of Form 8-K regarding an amendment to, or a waiver from, a provision of our Code of Business Ethics that applies to our principal executive officer, principal financial officer or principal accounting officer by posting such information within two business days of any such amendment or waiver on our website
Item 11. Executive Compensation.
The information set forth underrequired by this Item is incorporated by reference to the caption "Executive and Director Compensation"applicable information in the 2024 Proxy Statement is incorporated herein by reference.
Item 12. Security Ownership of Certain Beneficial Owners and Management and Related Stockholder Matters.
| Plan Category | Securities to Be Issued Upon Exercise of Outstanding Options and Rights(1) (a) | Weighted Average Exercise Price per Share of Outstanding Options and Rights(2) (b) | Securities Available for Future Issuance Under Equity Compensation Plans (Excluding Securities Reflected in Column (a))(3) (c) | ||||||
| Equity compensation plans approved by security holders | 10,109,395 | $ | 36.61 | 18,722,125 | |||||
The information provided underrequired by this Item is incorporated by reference to the caption "Security Ownership of Certain Beneficial Owners and Management"applicable information in the 2024 Proxy Statement is incorporated herein by reference.
Item 13. Certain Relationships and Related Transactions, and Director Independence.
The information provided underrequired by this Item is incorporated by reference to the captions "Director Independence," "Director Nominees" and "Certain Relationships and Related Party Transactions"applicable information in the 2024 Proxy Statement is incorporated herein by reference.
Item 14. Principal Accountant Fees and Services.
The information provided underrequired by this Item related to our principal accountant, Deloitte & Touche LLP (PCAOB ID No. 34) is incorporated by reference to the caption "Ratification of Appointment of our Independent Registered Public Accounting Firm — Principal Accountant Services and Fees"applicable information in the 2024 Proxy Statement is incorporated herein by reference.
PART IV
Item 15. Exhibits,Exhibit and Financial Statement Schedules.
(a) The following documents are filed as part of this report:
1. Financial Statements:
All financial statements as set forth under Item 8 of this report.
2. Supplementary Financial Statement Schedules:
Certain schedules have been omitted because the required information is not been included because they arepresent or is not applicablepresent in amounts sufficient to require submission of the schedule, or because the information required is included elsewhere in this report.the Consolidated Financial Statements, including the notes thereto.
| Exhibit | Incorporated by Reference | Filed | ||||||||||
| No. | Exhibit Description | Form | Exhibit | Filing Date | Herewith | |||||||
| 2.1 | Implementation Agreement, dated April 29, 2013, by and among Best Buy Co., Inc. , Best Buy UK Holdings LP, Best Buy Distributions Limited, New BBED Limited and Carphone Warehouse Group, plc | 8-K | 2.1 | 4/30/2013 | ||||||||
| 3.1 | Amended and Restated Articles of Incorporation | DEF 14A | n/a | 5/12/2009 | ||||||||
| 3.2 | Amended and Restated By-Laws | 8-K | 3.1 | 9/26/2013 | ||||||||
| 4.1 | Form of Indenture, to be dated as of March 11, 2011, between Best Buy Co., Inc. and U.S. Bank National Association, as successor trustee | S-3ASR | 4.1 | 3/8/2011 | ||||||||
| 4.2 | Form of First Supplemental Indenture, to be dated as of March 11, 2011, between Best Buy Co., Inc. and U.S. Bank National Association, as successor trustee | 8-K | 4.2 | 3/11/2011 | ||||||||
| 4.3 | Second Supplement Indenture, dated as of July 16, 2013, to the Indenture dated as of March 11, 2011, between Best Buy Co., Inc. and U.S. Bank National Association, as successor trustee | 8-K | 4.1 | 7/16/2013 | ||||||||
| 10.1 | Five-Year Credit Agreement dated as of June 27, 2016, among Best Buy Co., Inc., the Subsidiary Guarantors, the Lenders and JPMorgan Chase Bank, N.A., as administrative agent | 8-K | 10.1 | 6/30/2016 | ||||||||
| *10.2 | Best Buy Co., Inc. 2004 Omnibus Stock and Incentive Plan, as amended | S-8 | 99 | 7/15/2011 | ||||||||
| *10.3 | Best Buy Co., Inc. Short Term Incentive Plan, as approved by the Board of Directors | DEF 14A | n/a | 5/26/2011 | ||||||||
| *10.4 | 2010 Long-Term Incentive Program Award Agreement, as approved by the Board of Directors | 10-K | 10.7 | 4/28/2010 | ||||||||
| *10.5 | Form of Long-Term Incentive Program Buy-Out Award Agreement dated September 4, 2012, between Hubert Joly and Best Buy Co., Inc. | 10-Q | 10.3 | 9/6/2012 | ||||||||
| *10.6 | Employment Agreement, dated November 9, 2012, between Sharon McCollam and Best Buy Co., Inc. | 8-K | 10.1 | 11/15/2012 | ||||||||
| *10.7 | Employment Agreement, dated August 19, 2012, between Hubert Joly and Best Buy Co., Inc. | 8-K | 10.1 | 8/21/2012 | ||||||||
| *10.8 | Letter Agreement, dated March 25, 2013, between Best Buy Co., Inc. and Richard M. Schulze | 8-K | 99.2 | 3/25/2013 | ||||||||
* Management contracts or compensatory plans or arrangements required to be filed as exhibits pursuant to Item 15(b) of Form 10-K.
Pursuant to Item 601(b)(4)(iii) of Regulation S-K under the Securities Act of 1933, as amended, the registrant has not filed as exhibits to this Annual Report on Form 10-K certain instruments with respect to long-term debt under which the amount of securities authorized does not exceed 10% of the total assets of the registrant. The registrant hereby agrees to furnish copies of all such instruments to the SEC upon request.
The agreements and other documents filed as exhibits to this report are not intended to provide factual information or other disclosure other than with respect to the terms of the agreements or other documents themselves, and you should not rely on them for that purpose. In particular, any representations and warranties made by us in these agreements or other documents were made solely within the specific context of the relevant agreement or document and may not describe the actual state of affairs as of the date they were made or at any other time.
Item 16. Form 10-K Summary.
None.
SIGNATURES
Pursuant to the requirements of Section 13 or 15(d) of the Securities Exchange Act of 1934, the registrant has duly caused this report to be signed on its behalf by the undersigned, thereunto duly authorized.
Best Buy Co., Inc. | |||
(Registrant) | |||
By: | /s/ Corie Barry | ||
Corie Barry | |||
Chief Executive Officer | |||
Pursuant to the requirements of the Securities Exchange Act of 1934, this report has been signed below by the following persons on behalf of the registrant and in the capacities and on the dates indicated.
Signature | Title | Date | ||||||
/s/ | Chief Executive Officer | March | ||||||
Corie Barry | (principal executive officer) | |||||||
/s/ | Senior Executive Vice President of Enterprise Strategy, Chief Financial Officer | March | ||||||
Matthew Bilunas | (principal financial officer) | |||||||
/s/ Mathew R. Watson | Senior Vice President, | March | ||||||
Mathew R. Watson | (principal accounting officer) | |||||||
/s/ J. Patrick Doyle | Chairman | March 15, 2024 | ||||||
J. Patrick Doyle | ||||||||
/s/ Lisa M. Caputo | Director | March | ||||||
Lisa M. Caputo | ||||||||
/s/ David W. Kenny | Director | March | ||||||
David W. Kenny | ||||||||
/s/ David C. Kimbell | Director | March 15, 2024 | ||||||
David C. Kimbell | ||||||||
/s/ Mario J. Marte | Director | March 15, 2024 | ||||||
Mario J. Marte | ||||||||
/s/ Karen A. McLoughlin | Director | March | ||||||
Karen A. McLoughlin | ||||||||
/s/ Claudia F. Munce | Director | March | ||||||
Claudia F. Munce | ||||||||
/s/ | Director | March | ||||||
Richelle P. Parham | ||||||||
/s/ Steven E. Rendle | Director | March 15, 2024 | ||||||
Steven E. Rendle | ||||||||
/s/ Sima D. Sistani | Director | March 15, 2024 | ||||||
Sima D. Sistani | ||||||||
/s/ Melinda D. Whittington | Director | March 15, 2024 | ||||||
Melinda D. Whittington | ||||||||
/s/ Eugene A. Woods | Director | March 15, 2024 | ||||||
Eugene A. Woods | ||||||||
Balance at Beginning of Period | Charged to Expenses or Other Accounts | Other(1) | Balance at End of Period | ||||||||||||
| Year ended January 28, 2017 | |||||||||||||||
| Allowance for doubtful accounts | $ | 49 | $ | 44 | $ | (41 | ) | $ | 52 | ||||||
| Year ended January 30, 2016 | |||||||||||||||
| Allowance for doubtful accounts | $ | 59 | $ | 30 | $ | (40 | ) | $ | 49 | ||||||
| Year ended January 31, 2015 | |||||||||||||||
| Allowance for doubtful accounts | $ | 104 | $ | 1 | $ | (46 | ) | $ | 59 | ||||||
