| | | | | | | | | | | | | | | | | | | | |
UNITED STATES
SECURITIES AND EXCHANGE COMMISSION
Washington, D.C. 20549 |
|
FORM 10-K |
| (Mark One) | | |
| | ☒ | | ANNUAL REPORT PURSUANT TO SECTION 13 OR 15(d) OF THE SECURITIES EXCHANGE ACT OF 1934 For the fiscal year ended December 31, 20202022 |
| |
| |
OR |
| | ☐ | | TRANSITION REPORT PURSUANT TO SECTION 13 OR 15(d) OF THE SECURITIES EXCHANGE ACT OF 1934 For the transition period from __________ to __________. |
|
| Commission File No. 001-11241 |
|
CATERPILLAR FINANCIAL SERVICES CORPORATION (Exact name of Registrant as specified in its charter) |
Delaware (State or other jurisdiction of incorporation or organization) | 37-1105865 (I.R.S. Employer Identification No.) |
2120 West End Ave., Nashville, Tennessee (Address of principal executive offices) | 37203-0001 (Zip Code) |
Registrant'sRegistrant’s telephone number, including area code: (615) 341-1000
|
| | | | | | | | | | | |
Securities registered pursuant to Section 12(b) of the Act: |
| | | |
Title of each class | Trading Symbol(s) | Name of each exchange on which registered |
| | Medium-Term Notes, Series H,
3.300% Notes Due 2024 | CAT/24 | New York Stock Exchange
|
| Securities registered pursuant to Section 12(g) of the Act: None |
The Registrant is a wholly-owned subsidiary of Caterpillar Inc. and meets the conditions set forth in General Instruction (I)(1)(a) and (b) of Form 10-K, and is therefore filing this Form with the reduced disclosure format.
Indicate by check mark if the registrant is a well-known seasoned issuer, as defined in Rule 405 of the Securities Act.
Yes ☒ No ☐
Indicate by check mark if the registrant is not required to file reports pursuant to Section 13 or Section 15(d) of the Act.
Yes ☐ No ☒
Indicate by check mark whether the registrant (1) has filed all reports required to be filed by Section 13 or 15(d) of the Securities Exchange Act of 1934 during the preceding 12 months (or for such shorter period that the registrant was required to file such reports), and (2) has been subject to such filing requirements for the past 90 days.
Yes ☒ No ☐
Indicate by check mark whether the registrant has submitted electronically every Interactive Data File required to be submitted pursuant to Rule 405 of Regulation S-T (§232.405 of this chapter) during the preceding 12 months (or for such shorter period that the registrant was required to submit such files).
Yes ☒ No ☐
Indicate by check mark whether the registrant is a large accelerated filer, an accelerated filer, a non-accelerated filer, a smaller reporting company, or an emerging growth company. See the definitions of "large“large accelerated filer," "accelerated” “accelerated filer," "smaller” “smaller reporting company"company” and "emerging“emerging growth company"company” in Rule 12b-2 of the Exchange Act.
| | | | | | | | | | | | | | |
| Large accelerated filer | ☐ | | Accelerated filer | ☐ |
| Non-accelerated filer | ☒ | | Smaller reporting company | ☐ |
| | | Emerging growth company | ☐ |
If an emerging growth company, indicate by check mark if the registrant has elected not to use the extended transition period for complying with any new or revised financial accounting standards provided pursuant to Section 13(a) of the Exchange Act. ☐
Indicate by check mark whether the registrant has filed a report on and attestation to its management'smanagement’s assessment of the effectiveness of its internal control over financial reporting under Section 404(b) of the Sarbanes-Oxley Act (15 U.S.C. 7262(b)) by the registered public accounting firm that prepared or issued its audit report. ☒
Indicate by check mark whether the registrant is a shell company (as defined in Rule 12b-2 of the Act).
Yes ☐ No ☒
As of February 17, 2021, 115, 2023, one share of common stock of the registrant was outstanding, which is owned by Caterpillar Inc.
| | | | | | | | | | | |
| TABLE OF CONTENTS |
| | | | Page |
| | Business | 4 |
| | | Risk Factors | 7 |
| | | Unresolved Staff Comments | 14 |
| | | Properties | 14 |
| | | Legal Proceedings | 14 |
| | | Mine Safety Disclosures | 14 |
| | Market for Registrant'sRegistrant’s Common Equity, Related Stockholder Matters
and Issuer Purchases of Equity Securities | 14 |
| Item 6. | [Reserved] | |
| | | Management'sManagement’s Discussion and Analysis of Financial
Condition and Results of Operations | 15 |
| | | Quantitative and Qualitative Disclosures About Market Risk | 27 |
| | | Financial Statements and Supplementary Data | 2827 |
| | | Changes in and Disagreements With Accountants on Accounting and
Financial Disclosure | 2827 |
| | | Controls and Procedures | 28 |
| | | Other Information | 28 |
| Item 9C. | Disclosure Regarding Foreign Jurisdictions that Prevent Inspections | 28 |
| Item 10. | Directors, Executive Officers and Corporate Governance | * |
| Item 11. | Executive Compensation | * |
| Item 12. | Security Ownership of Certain Beneficial Owners and Management and Related Stockholder Matters | * |
| Item 13. | Certain Relationships and Related Transactions, and Director Independence | * |
| | Principal Accounting Fees and Services | 29 |
| | Exhibits and Financial Statement Schedules | 29 |
| Item 16. | Form 10-K Summary | 31 |
* Item omitted because no answer is called for or item is not applicable.
CAUTIONARY STATEMENT REGARDING FORWARD-LOOKING STATEMENTS
Certain statements contained in this Annual Report on Form 10-K may be considered "forward-looking statements"“forward-looking statements” as that term is defined in the Private Securities Litigation Reform Act of 1995. These statements may relate to future events or our future financial performance, which may involve known and unknown risks and uncertainties and other factors that may cause our actual results, levels of activity, performance or achievement to be materially different from those expressed or implied by any forward-looking statements. From time to time, we may also provide forward-looking statements in oral presentations to the public or in other materials we issue to the public. Forward-looking statements give current expectations or forecasts of future events about the company. You may identify these statements by the fact that they do not relate to historical or current facts and may use words such as "believes," "expects," "estimates," "anticipates," "will," "should," "plan," "forecast," "target," "guide," "project," "intend," "could"“believes,” “expects,” “estimates,” “anticipates,” “will,” “should,” “plan,” “forecast,” “target,” “guide,” “project,” “intend,” “could” and similar words or phrases. These statements are only predictions. Actual events or results may differ materially due to factors that affect international businesses, including the challenges of the ongoing COVID-19 pandemic, changes in economic conditions including but not limited to inflation, disruptions in the global financial and credit markets, and changes in laws, regulations and political stability, as well as factors specific to Caterpillar Financial Services Corporation (“Cat FinancialFinancial”) and the markets we serve, including the market’s acceptance of our products and services, the creditworthiness of our customers, interest rate and currency rate fluctuations and estimated residual values of leased equipment. These risk factors may not be exhaustive. We operate in a continually changing business environment, and new risk factors emerge from time to time. We cannot predict these new risk factors, nor can we assess the impact, if any, of these new risk factors on our businesses or the extent to which any factor, or combination of factors, may cause actual results to differ materially from those projected in any forward-looking statements. Accordingly, forward-looking statements should not be relied upon as a prediction of actual results. All of the forward-looking statements are qualified in their entirety by reference to the factors discussed under the captions "Risk Factors"“Risk Factors” and "Management’s“Management’s Discussion and Analysis of Financial Condition and Results of Operations"Operations” in this Form 10-K and could cause results to differ materially from those projected in the forward-looking statements. Cat Financial undertakes no obligation to publicly update forward-looking statements, whether as a result of new information, future events or otherwise. You may, however, consult any related disclosures we may make in our subsequent Form 10-Q and Form 8-K reports filed with the Securities and Exchange Commission ("SEC"(“SEC”).
General
Caterpillar Financial Services Corporation was organized in 1981 in the State of Delaware (together with its subsidiaries, "Cat“Cat Financial," "the” “the Company," "we"” “we” or "our"“our”). We are a wholly-owned finance subsidiary of Caterpillar Inc. (together with its other subsidiaries, "Caterpillar"“Caterpillar” or "Cat"“Cat”) and our corporate headquarters is located in Nashville, Tennessee.
Nature of Operations
We provide retail and wholesale financing to customers and dealers around the world for Caterpillar products and services, as well as financing for vehicles and power generation facilities and marine vessels that, in most cases, incorporate Caterpillar products. Retail financing is primarily comprised of installment sale contracts and other equipment-related loans, working capital loans, finance leases and operating leases. Wholesale financing to Caterpillar dealers consists primarily of inventory and rental fleet financing. In addition, we purchase short-term wholesale trade receivables from Caterpillar. The various financing plans offered by Cat Financial are designed to support sales of Caterpillar products and generate financing income for Cat Financial. A significant portion of our activity is conducted in North America, withand we have additional offices and subsidiaries in Latin America, Asia/Pacific, Europe Africa and the Middle East.Africa. Cat Financial has almostover 40 years of experience providing financing for Caterpillar products and services, contributing to our knowledge of asset values, industry trends, financing structures and customer needs.
The Company’s retail loans (totaling 49 percent*) include:
•Loans that allow customers and dealers to use their Caterpillar equipment or other assets as collateral to obtain financing.
•Installment sale contracts, which are equipment loans that enable customers to purchase equipment with a down payment or trade-in and structurestructured payments over time.
The Company’s retail leases (totaling 37 percent*) include:
•Finance (non-tax) leases, where the lessee for tax purposes is considered to be the owner of the equipment during the term of the lease, that either require or allow the customer to purchase the equipment for a fixed price at the end of the term.
•Tax leases that are classified as either operating or finance leases for financial accounting purposes, depending on the characteristics of the lease. For tax purposes, we are considered the owner of the equipment.
•Governmental lease-purchase plans in the U.S. that offer low interest rates and flexible terms to qualified non-federal government agencies.
The Company purchases short-term trade receivables from Caterpillar (12 percent*).Caterpillar.
The Company’s wholesale loans and leases (2 percent*) include inventory/rental programs, which provide assistance to dealers by financing their new Caterpillar inventory and rental fleets.
*Indicates the percentage of total portfolio as of December 31, 2020. We define total portfolio as Finance receivables, net plus Equipment on operating leases, net.
Competitive Environment
We operate in a highly competitive environment, with financing for users of Caterpillar equipment and services available through a variety of sources, principally commercial banks and finance and leasing companies. Our competitors include Wells FargoEquipment Finance Inc., Banc of America Leasing & Capital LLC, BNP Paribas Leasing Solutions Limited, Australia and New Zealand Banking Group Limited, Societe GeneralSociété Générale S.A. and various other banks and finance companies. In addition, many of the manufacturers that compete with Caterpillar also own financial subsidiaries, such as John Deere Capital Corporation, Komatsu Financial L.P., Volvo Financial Services and Kubota Credit Corporation, which utilize many below-market interest rate programs (funded by the manufacturer) to support machine sales. We and Caterpillar work together with Caterpillar to provide a broad array of financial merchandising programs to compete around the world.
We provide financing only when certain criteria are met. Credit decisions are based on a variety of credit quality factors, including prior payment experience, customer financial information, credit ratings, loan-to-value ratios and other internal metrics. We typically maintain a security interest in retail-financed equipment and require physical damage insurance coverage on financed equipment. We finance a significant portion of Caterpillar dealers'dealers’ sales and inventory of Caterpillar equipment throughout the world (see Note 1514 of Notes to Consolidated Financial Statements for more information regarding our segments and geographic areas). Our competitive position is improved by marketing programs offered in conjunction with Caterpillar and/or Caterpillar dealers. Under these programs, Caterpillar, or the dealer, funds an amount at the outset of the transaction, which we then recognize as revenue over the term of the financing. We believe that these marketing programs provide Cat Financial a significant competitive advantage in financing Caterpillar products.
In certain instances, our operations are subject to supervision and regulation by state, federal and various foreign governmental authorities and may be subject to various laws and judicial and administrative decisions imposing various requirements and restrictions which, among other things, (i) regulate credit granting activities and the administration of loans, (ii) establish maximum interest rates, finance charges and other charges, (iii) require disclosures to customers and investors, (iv) govern secured transactions, (v) set collection, foreclosure, repossession and other trade practices and (vi) regulate the use and reporting of information related to a borrower'sborrower’s credit experience. Our ability to comply with these and other governmental and legal requirements and restrictions affects our operations.
We also have agreements with Caterpillar that are significant to our operations. These agreements provide us with certain types of operational and administrative support from Caterpillar such as the administration of employee benefit plans, financial support, funding support and various forms of corporate services that are integral to the conduct of our business. For more information on these agreements, please refer to Note 1413 of Notes to Consolidated Financial Statements.
Human Capital
Core Values
Caterpillar’s global workforce is united by Our Values in Action, Caterpillar’s Code of Conduct. Integrity, Excellence, Teamwork, Commitment and Sustainability provide the foundation for our values-based culture. Our diversity and inclusion principles are embedded in our values. Our values unite and reflect our diverse cultures, languages, geographies and business.businesses.
Health and Safety
The health and safety of our employees is an important focus at Cat Financial and we strive to continually reduce our recordable injuries. In 2020,2022, the Company achieved a recordable injury frequency rate of 0.08,0.00, compared to the 20192021 recordable injury frequency rate of 0.04.
The COVID-19 pandemic has further reinforced the importance of a safe and healthy workforce. In response to the pandemic, the Company implemented safeguards to protect our essential employees, including increased frequency of cleaning and disinfecting, social distancing practices, face coverings, temperature screening and other measures consistent with specific regulatory requirements and guidance from health authorities. We also instituted travel restrictions and remote work for employees who were able to work from home.
Talent Development and Training
In addition to our focus on values and safety, we strive to continually attract, develop, engage, and retain a high-performing diverse global team that executes our enterprise strategy of long-term profitable growth.
We are committed to employee development and helping employees reach their full potential by making on-going investments in our team. Our global internships and finance and information services career programs provide development opportunities for early career employees. We also have a continual focus on strengthening technical, professional and leadership capabilities at every level. Strategic talent reviews and succession planning occur at a minimum, annually, across our business.
Our leadership development programs and our focus on encouraging a variety of experiences help employees broaden understanding and increase perspective. For example, we conduct a bi-annual leadership experience for global leaders to strengthen Caterpillar leadership attributes and utilize our global learning platform to build speed to competency by job role.
Diversity and Inclusion
We are committed to fostering a diverse workforce and an inclusive environment. Our 9 Employee Resource Groups (ERGs)(“ERGs”), sponsored and supported by leadership, are integral to ensuring different voices and perspectives contribute to our strategy for long term profitable growth. Our ERGs partner with recruiters to help build relationships and recruit diverse talent through campus relationships and the Thurgood Marshall College Fund.
Our ERGs further engage our employees, helping contribute to development and retention. For example, Caterpillar’s Latino Connection sponsors a mentoring program that connects diverse employees with senior leaders who can support their career goals through on-the-job project experience and leadership development. Additionally, WE Lead, Women Enabling Leadership, is sponsored by our Women’s Initiative Network and engages female employees in early to mid-level management to help strengthen our female leader pipeline.
Compensation, Benefits and Employee Insights
Providing competitive benefits and compensation underpins our commitment to our engaged and productive employees. Our pay-for-performance philosophy aligns employee’s individual contributions, behaviorsattributes and business results with individual rewards. Our comprehensive Total Health programs focus on purpose, as well as physical, emotional, financial, and social health. The annual Employee Insights Survey provides all employees the opportunity to confidentially share their perspectives and engages leaders to listen, learn and respond to employee feedback.
Employment
Management aligns employment levels with the needs of the business. We believe we have the appropriate human capital resources to successfully operate and deliver our enterprise strategy. As of December 31, 2020,2022, we employed about 2,0002,100 full-time persons of whom approximately half were located outside the United States.In the United States, most employees are at-will employees and, therefore, not subject to any type of employment contract or agreement. Outside the United States, the Company enters into employment contracts and agreements in those countries in which such relationships are mandatory or customary. The provisions of these agreements generally correspond in each case with the required or customary terms in the subject jurisdiction.
Available Information
The Company files electronically with the SEC required reports on Form 8-K, Form 10-Q, Form 10-K and registration statements on Form S-3 and other forms or reports as required. The SEC maintains a website (www.sec.gov) that contains reports, proxy and information statements and other information regarding issuers that file electronically with the SEC. Copies of our annual report on Form 10-K, quarterly reports on Form 10-Q, current reports on Form 8-K and any amendments to these reports filed or furnished with the SEC are available free of charge through Caterpillar Inc.’s website (www.caterpillar.com/secfilings) as soon as reasonably practicable after filing with the SEC. Copies may also be obtained free of charge by writing to: Legal Dept., Caterpillar Financial Services Corporation, 2120 West End Ave., Nashville, Tennessee 37203-0001. In addition, the public may obtain more detailed information about our parent company, Caterpillar Inc., by visiting its website (www.caterpillar.com). None of the information contained at any time on our website, Caterpillar’s website or the SEC’s website is incorporated by reference into this document.
The statements in this section describe material risks to our business and may contain "forward-looking statements"“forward-looking statements” that are subject to the caption "CAUTIONARY“CAUTIONARY STATEMENT REGARDING FORWARD-LOOKING STATEMENTS"STATEMENTS” presented prior to Item 1 of this report. The statements in this section should also be considered carefully in conjunction with "Management’s“Management’s Discussion and Analysis of Financial Condition and Results of Operations"Operations” and the "Notes“Notes to Consolidated Financial Statements"Statements” to this Form 10-K. The risk factors described below are a cautionary discussion of risks, uncertainties and assumptions that we believe are significant to our business. These are factors that, individually or in the aggregate, we believe could make our actual results differ materially from expected or past results. Because it is impossible to predict or identify all such factors, the following factors should not be considered to be a complete discussion of risks, uncertainties and assumptions.
RISKS RELATED TO COVID-19
The COVID-19 pandemic could materially adversely affect our business, results of operations and/or financial condition
COVID-19 was identified in late 2019 and has spread globally. The rapid spread has resulted in weaker demand and constrained supply and the implementation of numerous measures to try to contain the virus, such as travel bans and restrictions, quarantines, shelter in place orders and shutdowns. These factors have impacted and may continue to impact all or portions of Caterpillar’s workforce and operations.
The COVID-19 pandemic caused a global recession and it is uncertain when a sustained economic recovery may occur. The COVID-19 pandemic has also significantly increased economic and demand uncertainty and has led to a decrease in demand for Caterpillar’s products and services and caused supply chain disruptions. Economic uncertainties could continue to affect demand for Caterpillar’s products and services, the value of equipment financed or leased and the demand for financing and the financial condition and credit risk of our dealers and customers.
Uncertainties related to the magnitude and duration of the COVID-19 pandemic, including new strains, may significantly adversely affect Caterpillar’s and our business. These uncertainties include: the duration and impact of the resurgence in COVID-19 cases in any country, state, or region; prolonged reduction or closure of the Caterpillar’s operations, or a delayed recovery in Caterpillar’s operations; disruptions in its supply chain; increased logistics costs; the impact of the pandemic on our customers and dealers; requests by our customers or dealers for payment deferrals and contract modifications; and the impact of disruptions in the global capital markets and/or declines in our financial performance or credit ratings, which could impact our ability to obtain funding in the future. It is unclear when a sustained economic recovery could occur and what a recovery may look like. All of these factors could materially and adversely affect our business, results of operations and/or financial condition.
The ultimate impact of the COVID-19 pandemic on the Company’s financial and operational results will be determined by the length of time that the pandemic continues, its effect on the demand for the Caterpillar’s products and services, as well as the effect of governmental regulations imposed in response to the pandemic. The overall magnitude of the COVID-19 pandemic and the continued fluidity of the situation could materially and adversely impact our business, results of operations and/or financial condition.
FINANCIAL RISKS
Disruptions or volatility in global financial markets could adversely impact the industries and markets in which we serve and operate
Continuing to meet our cash requirements over the long-term could require substantial liquidity and access to varied sources of funds, including capital and credit markets. Global economic conditions have caused and may cause volatility and disruptions in the capital and credit markets. While we have continued to maintain access to key global medium-term note and commercial paper markets, there can be no assurance that such markets will continue to represent a reliable source of financing. If global economic conditions were to deteriorate, we could face materially higher financing costs, become unable to access adequate funding to operate and grow our business and/or meet our debt service obligations as they mature, and we could be required to draw upon contractually committed lending agreements primarily provided by global banks and/or by seeking other funding sources. However, under extreme market conditions, there can be no assurance that such agreements and other funding sources would be availablesufficient or sufficient.even available. Any of these events could negatively impact our business, results of operations and financial condition.
The extent of any impact on our ability to meet our funding or liquidity needs would depend on several factors, including our operating cash flows, the duration of any market disruptions, changes in counterparty credit risk, the impact of government intervention in financial markets, including the effects of any programs or legislation designed to increase or restrict liquidity for certain areas of the market, general credit conditions, the volatility of equity and debt markets, our credit ratings and credit capacity and the cost of financing and other general economic and business conditions. Market disruption and volatility may also lead to a number ofnumerous other risks in connection with these events, including but not limited to:
•Market developments that may affect the demand for Caterpillar products and/or customer confidence levels and may cause declines in the demand for financing and adverse changes in payment patterns, causing increases in delinquencies and default rates, which could impactincrease our write-offs and provision for credit losses;
•The process we use to estimate losses inherent in our credit exposure requires a high degree of management’s judgment regarding numerous subjective, qualitative factors, including forecasts of economic conditions and how economic predictors might impair the ability of our borrowers to repay their loans. If financial market disruption and volatility is experienced, the accuracy of these judgments may be impacted;
•Our ability to engage in routine funding transactions or borrow from other financial institutions on acceptable terms or at all could be adversely affected by disruptions in the capital markets or other events, including actions by rating agencies and deteriorating investor expectations; and
•Because our lending agreements are primarily with financial institutions, their ability to perform in accordance with any of our underlying agreements could be adversely affected by market volatility and/or disruptions in the equity and credit markets.
Failure to maintain our credit ratings wouldcould increase our cost of borrowing and could adversely affect our cost of funds, liquidity, competitive position and access to capital markets
Each of CaterpillarCaterpillar’s and Cat Financial'sFinancial’s costs of borrowing and their respective ability to access the capital markets are affected not only by market conditions but also by the short-termshort- and long-term credit ratings assigned to ourtheir respective debt by the major credit rating agencies. These ratings are based, in significant part, on each of Caterpillar'sCaterpillar’s and Cat Financial'sFinancial’s performance as measured by financial metrics such as net worth, interest coverage and leverage ratios, as well as transparency with rating agencies and timeliness of financial reporting. There can be no assurance that Caterpillar and Cat Financial will be able to maintain their credit ratings. We receive debt ratings from the major credit rating agencies. Moody's long- and short-term ratings of Caterpillar and Cat Financial are A3 and Prime-2 ("low-A"), while other major credit rating agencies maintain a "mid-A" debt rating. A downgrade of our credit rating by any of the major credit rating agencies wouldcould result in increased borrowing costs and could adversely affect Caterpillar'sCaterpillar’s and ourCat Financial’s liquidity, competitive position and access to the capital markets, including restricting, in whole or in part, access to the commercial paper market.market and other sources of funding. There can be no assurance that the commercial paper market will continue to be a reliable source of short-term financing for Cat Financial or an available source of short-term financing for Caterpillar. An inability to access the capital markets could have a materialan adverse effect on our cash flows,flow, results of operations and financial condition.
Changes in interest rates, foreign currency exchange rates or market liquidity conditions could adversely affect our earnings and/or cash flows
ChangesThe Federal Reserve Bank of United States began to increase benchmark interest rates in March 2022 and has indicated it may continue to raise benchmark interest rates in an effort to curb the upward inflationary pressure on the cost of goods and services across the United States. Such increases in interest rates foreign currency exchange rates and other changes to market liquidity conditions could have a materialan adverse impact on Caterpillar's and our earnings and cash flows. Because our financial results are reported in U.S. dollars, but our operations are conducted internationally, currency exchange rates can have a significant impact on our business results. Additionally, because a significant number of ourthe loans made by us are made at fixed interest rates, our business results are subject to fluctuations in interest rates. Certain loans made by us and various financing extended to us are made at variable rates that use LIBOR as a benchmark for establishing the interest rate. Changes in interest rates and market liquidity conditions could have an adverse impact on our earnings and cash flows. Because a significant number of the loans made by us are made at fixed interest rates, our business results are subject to fluctuations in interest rates.
Certain loans made by us and various financing extended to us are made at variable rates that use LIBOR as a benchmark for establishing the interest rate. LIBOR is the subject of recent proposals for reform. On July 27, 2017, the United Kingdom’s Financial Conduct Authority ("FCA"(“FCA”) announced that it intends to stop persuading or compelling banks to submit LIBOR rates after 2021. On November 18, 2020,Immediately following the LIBOR publication on December 31, 2021, ICE Benchmark Administration ("IBA"(“IBA”), the administrator of USD LIBOR, announced plans to consult on its intention to cease ceased the publication of all GBP, EUR, CHF and JPY LIBOR settings, immediately followingas well as the one-week and two-month USD LIBOR publication on December 31, 2021.tenors. On November 30, 2020, IBA, with the support of the United States Federal Reserve and the FCA, announced plans to consult on ceasing publication of USD LIBOR on December 31, 2021 for only the one week and two monthall other remaining USD LIBOR tenors and on June 30, 2023 for all other USD LIBOR tenors.2023. While the November 30th30 announcement extendsextended the transition period to June 2023, the United States Federal Reserve concurrently issued a statement advising banks to stop new USD LIBOR issuances by the end of 2021. These reforms may causeFurther, on March 15, 2022, the Consolidated Appropriations Act of 2022, which includes the Adjustable Interest Rate (LIBOR) Act, was signed into law in the U.S. This legislation establishes a uniform benchmark replacement process for financial contracts maturing after June 30, 2023 that do not contain clearly defined or practicable fallback provisions. The legislation also creates a safe harbor that shields lenders from litigation if they choose to utilize a replacement rate recommended by the Federal Reserve. The Alternative Reference Rate Committee, a committee convened by the Federal Reserve that includes major market participants, has identified the Secured Overnight Financing Rate, or SOFR, a new index calculated by short-term repurchase agreements, backed by Treasury securities, as its preferred alternative rate for LIBOR. At this time, it is not possible to predict how markets will respond to SOFR or other alternative reference rates as the transition away from the LIBOR to cease to exist, new methods of calculating LIBORbenchmarks is anticipated in coming years. There continue to be establisheduncertainties regarding the transition from LIBOR, including but not limited to the need to renegotiate certain terms of our loan agreements with LIBOR as the referenced rate, which could require us to incur significant expense and may subject us to disputes or litigation over the establishmentappropriateness or comparability to LIBOR of an alternativethe replacement reference rate(s). Several offerings of securities that include such an alternative reference rate have now been completed by other companies.rates. The consequences of these developments are uncertaincannot be entirely predicted and could have an adverse impact on the market value for or value of LIBOR-linked securities, loans, derivatives, and other financial obligations or extensions of credit held by or due to us, as well as the revenue and expenses associated with those securities, loans and financial instruments. Cat Financial has
We created a cross-functional team that will assessassesses risk across multiple categories as it relates to the use of LIBOR in securities, loans, derivatives, and other financial obligations or extensions of credit held by or due to us. Other changes in market interest rates may influence our borrowing costs and could reduce our earnings and cash flows, our returns on financial investments and the valuation of derivative contracts. We manage interest rate and market liquidity risks through a variety of techniques that include a match funding strategy, the selective use of derivatives and a broadly diversified funding program. There can be no assurance, however, that fluctuations in interest rates and market liquidity conditions will not have an adverse impact on Caterpillar and our earnings and cash flows. If any of the variety of instruments and strategies we use to hedge our exposure to these types of risk is ineffective, this may have an adverse impact on our earnings and cash flows. Please see "-Macroeconomic“-Macroeconomic Risks - Changes in Government Monetary or Fiscal Policies May Negatively Impact Results"Results” below for further discussion of changes in interest rates.
In addition, because we make a significant number of loans in currencies other than the U.S. dollar, fluctuations in foreign currency exchange rates could also reduce our earnings and cash flows. There has been, and may continue to be, volatility in currency exchange rates as a result of the United Kingdom’s withdrawal from the European Union (commonly known as "Brexit"“Brexit”), especially between the U.S. dollar and the British pound.
We also rely on a number ofnumerous diversified global debt capital markets and funding programs to provide liquidity for our global operations, including commercial paper, medium-term notes, retail notes, variable denomination floating rate demand notes and bank loans. Significant changes in market liquidity conditions could impact our access to funding and the associated funding cost and reduce our earnings and cash flows.
We manage interest rate, foreign currency exchange rate and market liquidity risks with a variety of techniques that include a match-funding strategy that addresses interest rate risk by aligning the interest rate profile (fixed or floating rate and duration) of our debt portfolio with the interest rate profile of our receivables portfolio within predetermined ranges on an ongoing basis, the selective use of derivatives and a broadly diversified funding program. There can be no assurance, however, that fluctuations in interest rates, currency exchange rates and market liquidity conditions will not have a material adverse impact on our earnings and cash flows. If any of the variety of instruments and strategies we use to hedge our exposure to these various types of risk is ineffective, we may experience an adverse impact on our earnings and cash flows.
Our business is significantly influenced by the credit risk associated with our customers and an increase in delinquencies, repossessions or net losses could adversely affect our results
Our business is significantly influenced by the credit risk associated with our customers. The creditworthiness of each customer and the rate of delinquencies, repossessions and net losses on customer obligations are directly impacted by several factors, including, but not limited to, relevant industry (particularly construction-related industries) and economic conditions, the availability of capital, the experience and expertise of the customer'scustomer’s management team, commodity prices, interest rates, political events and the sustained value of the underlying collateral. Any increase in delinquencies, repossessions and net losses on customer obligations could have a material adverse effect on our earnings and cash flows.
In addition, although we evaluate and adjust our allowance for credit losses related to past due and non-performing receivables on a regular basis, adverse economic conditions or other factors that might cause deterioration of the financial health of our customers could change the timing and level of payments received and necessitate an increase in our estimated losses, which could also have a material adverse effect on our earnings and cash flows.
A decrease in the residual value of the equipment that we finance could adversely affect our results
Declines in the residual value of equipment financed by us may reduce our earnings. The residual value of leased equipment is determined based on its estimated end-of-term market value at the time of the expiration of the lease term. We estimate the residual value of leased equipment at the inception of the lease based on a number ofnumerous factors, including historical wholesale market sales prices, past remarketing experience and any known significant market/product trends. If estimated end-of-term market values significantly decline due to economic factors, obsolescence or other adverse circumstances, we may not realize such residual value, which could reduce our earnings.
Restrictive covenants in our debt agreements could limit our financial and operating flexibility
Cat Financial and certain subsidiaries have credit agreements under which we borrow or have the ability tocan borrow funds for use in our respective businesses that are utilized primarily for general corporate purposes. Certain of these agreements include covenants relating to our financial performance and financial position. The two most significant financial covenants included in these agreements are: (1) a leverage ratio covenant that requires us to maintain a ratio of consolidated debt to consolidated net worth of not greater than 10 to 1, calculated (i) on a monthly basis as the average of the leverage ratios determined on the last day of each of the six preceding calendar months and (ii) at each December 31; and (2) an interest coverage ratio that requires us to maintain a ratio of (i) profit excluding income taxes, interest expense and net gain/(loss) from interest rate derivatives to (ii) interest expense of not less than 1.15 to 1, in each case, calculated at the end of each calendar quarter for the rolling four-quarter period then most recently ended for us and our subsidiaries on a consolidated basis in accordance with generally accepted accounting principles. In addition, we are restricted in several of our agreements from terminating, amending or modifying our support agreement with Caterpillar. We are also restricted in our ability to incur secured indebtedness or consolidate, merge or sell assets. Similarly, we are also bound by covenants in various agreements that involve Caterpillar and its obligation to maintain a consolidated net worth of not less than $9 billion at all times during each fiscal year.
Although we do not believe any of these covenants presently materially restrict our operations, our ability to meet any one particular financial covenant may be affected by events that could be beyond our control and could result in material adverse consequences that negatively impact our business, results of operations and financial condition. These consequences may include the acceleration of repayment of amounts outstanding under certain of our credit agreements, the triggering of an obligation to redeem certain debt securities, the termination of existing unused credit commitments by our lenders, the refusal by our lenders to extend further credit under one or more of our credit agreements or the lowering or modification of our credit ratings, including those of any of our subsidiaries. We cannot provide assurance that we will continue to comply with each credit covenant, particularly if we were to encounter challenging and volatile market conditions.
MACROECONOMIC RISKS
Changes in government monetary or fiscal policies may negatively impact our results
Most countries where Caterpillar products and services are sold have established central banks to regulate monetary systems and influence economic activities, generally by adjusting interest rates. Interest rate changes affect overall economic growth, which in turn affects Caterpillar'sCaterpillar’s sales and our financing activities. Interest rate changes may also affect customers'customers’ ability to finance machine purchases, can change the optimal time to keep machines in a fleet and can impact the ability of Caterpillar'sCaterpillar’s suppliers to finance the production of parts and components necessary to manufacture and support Caterpillar products.
Central banks and other policy arms of many countries may take actions to vary the amount of liquidity and credit available in an economy. The impact from a change in liquidity and credit policies could negatively affect the customers and markets we serve or our suppliers, create supply chain inefficiencies and could adversely impact our business, results of operations and financial condition.
Government policies on taxes and spending also affect our business. Throughout the world, government spending finances a significant portion of infrastructure development, such as highways, rail systems, airports, sewer and water systems, waterways and dams. Tax regulations determine asset depreciation lives and impact the after-tax returns on business activity and investment, both of which influence investment decisions. Unfavorable developments, such as decisions to reduce public spending or to increase taxes, could negatively impact our results.
Our global operations are exposed to political and economic risks, commercial instability and global events beyond our control in the countries in which we operate
Our global operations are dependent upon products manufactured, purchased, sold and financed in the U.S. and internationally, including in countries with political and economic instability or uncertainty. Some countries have greater political and economic volatility and greater vulnerability to infrastructure and labor disruptions than others. Operating in different regions and countries exposes us to a number ofnumerous risks, including:
•Multiple and potentially conflicting legal and regulatory requirements that are subject to change, including but not limited to, those legal and regulatory requirements described in Item 1 of this report under the heading Competitive Environment;
•Imposition of currency restrictions, restrictions on repatriation of earnings or other restraints;
•Imposition of new or additional tariffs or quotas;
•Difficulty of enforcing agreements and collecting receivables through foreign legal systems;
•Withdrawal from or modification of trade agreements or the negotiation of new trade agreements;
•Imposition of new or additional trade and economic sanctions laws imposed by the U.S. or foreign governments;
•WarThe occurrence of catastrophic events, including fire, flood, tsunami or acts of terrorism;other weather event, power loss, telecommunications failure, software or hardware malfunctions, pandemics (including the COVID-19 pandemic), cyber-attack, war, terrorist attack or other catastrophic events that our disaster recovery plans do not adequately address; and
•Political and economic instability or civil unrest that may severely disrupt economic activity in affected countries.
The occurrence of one or more of these events may negatively impact our business, results of operations and financial condition. For example, the COVID-19 pandemic has had, and continues to have, a significant impact around the world, prompting governments and businesses to take unprecedented measures in response. Such measures have included travel bans and restrictions, quarantines, shelter in place orders and shutdowns. These measures have impacted and may continue to impact all or portions of each of Caterpillar's and our workforce and operations and the operations of our customers, dealers and suppliers. Although certain restrictions related to the COVID-19 pandemic have eased, uncertainty continues to exist regarding such measures and potential future measures. Current material and component shortages, logistics constraints and labor inefficiencies have limited and could continue to limit Caterpillar's and our ability to meet customer demand, which could have a material adverse effect on our business, results of operations and/or financial condition. In addition, the COVID-19 pandemic has significantly increased economic and customer demand uncertainty, has caused inflationary pressure in the U.S. and elsewhere and has led to volatility in customer demand for Caterpillar's and our products and services and caused supply chain disruptions. Economic uncertainties could continue to affect customer demand for Caterpillar's and our products and services, the value of the equipment financed or leased, the demand for financing and the financial condition and credit risk of our customers and dealers.
OPERATIONAL RISKS
The success of our business depends upon the demand for Caterpillar’s products
Our primary business is to provide retail and wholesale financing alternatives for Caterpillar products to customers and dealers and is therefore largely dependent upon the demand for Caterpillar'sCaterpillar’s products and customers'customers’ willingness to enter into financing or leasing agreements, which may be negatively affected by challenging global economic conditions. As a result, a significant or prolonged decrease in demand could have a material adverse effect on our business, financial condition, results of operations and cash flows. The demand for Caterpillar'sCaterpillar’s products and our products and services is influenced by a number ofnumerous factors, including:
•General world economic conditions and the level of energy, mining, construction and manufacturing activity;
•Changes and uncertainties in the monetary and fiscal policies of various governmental and regulatory entities;
•Fluctuations in demand and prices for certain commodities;
•Fluctuations in currency exchange rates and interest rates;
•Political, economic and legislative changes;
•Caterpillar’s ability to produce products that meet customers'customers’ needs;
•Caterpillar’s ability to maintain key dealer relationships;
•The ability of Caterpillar dealers to sell Caterpillar products and their practices regarding inventory control; and
•Changes in pricing policies by Caterpillar or its competitors.
Any significant adverse changes to these factors could negatively impact our results.
Changes in the marketing, operational or administrative support that we receive from Caterpillar could adversely affect our results
We participate in certain marketing programs offered in conjunction with Caterpillar and/or Caterpillar dealers that allow us to offer financing to customers at interest rates that are below market rates. These marketing programs provide us with a significant competitive advantage in financing Caterpillar products. Any change in these marketing programs or reduction in our ability to offer competitively priced financing to customers could reduce the percentage of Caterpillar products financed by us, which could have a material adverse effect on our business, financial condition, results of operations and cash flows. Caterpillar also provides us with other types of operational and administrative support, such as the administration of employee benefit plans, which is integral to the conduct of our business. Any changes in the levels of support from Caterpillar could also negatively impact our results.
The success of our business depends on our ability to develop, produce and market quality products and services that meet our customers’ needs
We operate in a highly competitive environment, with financing for users of Caterpillar equipment available through a variety of sources, principally commercial banks and finance and leasing companies. Increasing competition may adversely affect our business if we are unable to match the products and services of our competitors. Also, as noted above, any changes to the marketing programs offered in conjunction with Caterpillar and/or Caterpillar dealers, which allow us to offer financing to customers at interest rates that are below market rates, could have a materially adverse effect on our business.
Increased information technology security threats and more sophisticated computer crime pose a risk to our systems, networks, products and services
We rely upon information technology systems and networks, some of which are managed by third parties, in connection with a variety of business activities. Additionally, we collect and store sensitive information relating to our business, customers, dealers, suppliers and employees. Operating these information technology systems and networks and processing and maintaining this data in a secure manner, is critical to our business operations and strategy. Information technology security threats -- from user error to cybersecurity attacks designed to gain unauthorized access to our systems, networks and data -- are increasing in frequency and sophistication. Cybersecurity attacks may range from random attempts to coordinated and targeted attacks, including sophisticated computer crime and advanced persistent threats. These threats pose a risk to the security of our systems and networks and the confidentiality, availability and integrity of our data. Cybersecurity attacks could also include attacks targeting customer data or the security, integrity and/or reliability of the hardware and software installed in our products. It is possible that our information technology systems and networks, or those managed or provided by third parties, could have vulnerabilities, which could go unnoticed for a period of time. While various procedures and controls have been and are being utilized to mitigate such risks, there can be no guarantee that the actions and controls we have implemented and are implementing, or which we cause or have caused third party service providers to implement, will be sufficient to protect our systems, information or other property.
We have experienced cyber security threats and vulnerabilities in our systems and those of our third-party providers, and we have experienced viruses and attacks targeting our information technology systems and networks. Such prior events, to date, have not had a material impact on our financial condition, results of operations or liquidity. However, the potential consequences of a future material cybersecurity attack include reputational damage, litigation with third parties, government enforcement actions, penalties, disruption to systems, unauthorized release of confidential or otherwise protected information, corruption of data and increased cybersecurity protection and remediation costs, which in turn could adversely affect our competitiveness, results of operations and financial condition. Due to the evolving nature of such security threats, the potential impact of any future incident cannot be predicted. Further, the amount of insurance coverage we maintain may be inadequate to cover claims or liabilities relating to a cybersecurity attack.
In addition, data we collect, store and process isare subject to a variety of U.S. and international laws and regulations, such as the European Union'sUnion’s General Data Protection Regulation that became effective in May 2018 and the California Consumer Privacy Act that became effective in January 2020, each of which carry, in many cases, significant potential penalties for noncompliance.
LEGAL & REGULATORY RISKS
Our global operations are subject to a wide-range of trade and anti-corruption laws and regulations
Due to the international scope of our operations, we are subject to a complex system of laws and regulations, including U.S. regulations issued by the Office of Foreign Assets Control. Any alleged or actual violations may subject us to increased government scrutiny, investigation and civil and criminal penalties and may limit our ability to provide financing outside the U.S. and/or potentially require us to divest portions of our existing portfolio under certain circumstances. Furthermore, embargoes and sanctions imposed by the U.S. and other governments prohibiting providing financing to specific persons or countries may expose us to potential criminal and civil sanctions. We cannot predict the nature, scope or effect of future regulatory requirements to which our operations might be subject or, in certain locations, the way existing laws might be administered or interpreted.
In addition, the U.S. Foreign Corrupt Practices Act and similar anti-corruption laws of other countries generally prohibit companies and their intermediaries from making improper payments or providing anything of value to improperly influence foreign government officials for the purpose of obtaining or retaining business or obtaining an unfair advantage. Recent years have seen a substantial increase in the global enforcement of anti-corruption laws. Our continued operation and expansion outside the U.S., including in developing countries, expose us to the risk of such violations. Violations of anti-corruption laws by our employees or intermediaries acting on our behalf may result in severe criminal or civil sanctions, could disrupt our business, and could result in an adverse effect on our reputation, business, results of operations or financial condition.
New regulations or changes in financial services regulation could adversely impact our results of operations and financial condition
Our operations are highly regulated by governmental authorities in the locations where we operate, which can impose significant additional costs and/or restrictions on our business. In the U.S. for example, certain of our activities are subject to the U.S. Dodd-Frank Wall Street Reform and Consumer Protection Act, which includes extensive provisions regulating the financial services industry. As a result, we have become and could continue to become subject to additional regulatory costs that could be significant and could have an adverse effect on our results of operations and financial condition. Changes in or additional regulations in the U.S. or internationally impacting the financial services industry could also add significant cost or operational constraints that might have an adverse effect on our results of operations and financial condition.
We may incur additional tax expense or become subject to additional tax exposure
We are subject to income taxes in the U.S. and numerous other jurisdictions. Our future results of operations could be adversely affected by changes in the effective tax rate as a result of a change in the mix of earnings between U.S. and non-U.S. jurisdictions or among jurisdictions with differing statutory tax rates, changes in our overall profitability, changes in tax laws or treaties or in their application or interpretation, changes in tax rates, changes in generally accepted accounting principles, changes in the valuation of deferred tax assets and liabilities, changes in the amount of earnings indefinitely reinvested in certain non-U.S. jurisdictions, the results of audits and examinations of previously filed tax returns and continuing assessments of our tax exposures. We are also subject to the continuous examination of our income tax returns by the U.S. Internal Revenue Service and other tax authorities. We regularly assess the likelihood of an adverse outcome resulting from these examinations. If our effective tax rates were to increase or if the ultimate determination of our taxes owed is for an amount in excess of amounts previously accrued, our operating results, cash flows and financial condition could be adversely affected.
Changes in accounting guidance could have an adverse effect on our results of operations
Our consolidated financial statements are subject to the application of generally accepted accounting principles, which is periodically revised and/or expanded. Accordingly, from time to time we are required to adopt new or revised accounting guidance and related interpretations issued by recognized authoritative bodies, including the Financial Accounting Standards Board and the SEC. Market conditions have prompted accounting standard setters to issue new guidance, which further interprets or seeks to revise accounting pronouncements related to various transactions, as well as to issue new guidance expanding disclosures. The impact of accounting pronouncements that have been issued but not yet implemented is disclosed in our annual and quarterly reports on Form 10-K and quarterly reports on Form 10-Q. An assessment of proposed guidance is not provided, as such proposals are subject to change through the exposure process and, therefore, their effects on our financial statements cannot be meaningfully assessed. It is possible that future accounting guidance we are required to adopt or future changes in accounting principles could change the current accounting treatment that we apply to our consolidated financial statements and that such changes could have a material adverse effect on our business, results of operations and financial condition.
| | | | | |
| Item 1B. | Unresolved Staff Comments. |
None.
Our corporate headquarters are located in Nashville, Tennessee. We maintain forty-sixAdditional offices in total, of which nine are located in North America (eight ininside and outside the U.S. and one in Canada), twenty-one are located in Europe, one is located in Africa, one is located in the Middle East, nine are located in Asia/Pacific and five are located in Latin America (see Note 15 of Notes to Consolidated Financial Statements for more information regarding our segments and geographic areas).United States. All of our offices, are leased, except forother than our corporate headquarters building.building, are leased.
| | | | | |
| Item 3. | Legal Proceedings. |
We are involved in unresolved legal actions that arise in the normal course of business. Although it is not possible to predict with certainty the outcome of our unresolved legal actions, we believe that these unresolved legal actions will neither individually nor in the aggregate have a material adverse effect on our consolidated results of operations, financial position or liquidity.
| | | | | |
| Item 4. | Mine Safety Disclosures. |
Not applicable.
| | | | | |
| Item 5. | Market for Registrant'sRegistrant’s Common Equity, Related Stockholder Matters and
Issuer Purchases of Equity Securities. |
Our stock is not publicly traded. Caterpillar Inc. is the owner of our one outstanding share. Cash dividends of $300$275 million, $25$850 million and $400$300 million were paid to Caterpillar in 2022, 2021 and 2020, 2019 and 2018, respectively.
| | | | | |
| Item 7. | Management'sManagement’s Discussion and Analysis of Financial Condition and Results of Operations. |
This Management’s Discussion and Analysis of Financial Condition and Results of Operations should be read in conjunction with our audited financial statements and related notes included elsewhere in this report and our discussion of significant risks to the company’s business under Part I, Item 1A. Risk Factors of this report.
OVERVIEW
We reported revenues of $2.55$2.73 billion for 2020, a decrease2022, an increase of $416$172 million, or 147 percent, compared with 2019.$2.56 billion for 2021. Profit was $293$535 million for 2020, a $1172022, an increase of $30 million, or 296 percent, decrease from 2019.compared with $505 million for 2021.
The decreaseincrease in revenues was primarily due to a $190$151 million unfavorablefavorable impact from lowerhigher average financing rates and a $151$55 million favorable impact from returned or repossessed equipment, partially offset by a $38 million unfavorable impact from lower average earning assets.
Profit before income taxes was $434$731 million for 2020, a $1942022, an increase of $36 million, or 315 percent, decrease from 2019.compared with $695 million for 2021. The decreaseincrease was primarily due to a $104$55 million increase in provision for credit losses,favorable impact from returned or repossessed equipment, partially offset by a $69$19 million unfavorable impact from lower average earning assets, a $52 million decrease in net yield on average earning assets and a $36 million unfavorable impact from returned or repossessed equipment. These unfavorable impacts were partially offset by an $82 million decrease in general, operating and administrative expenses, primarily due to lower incentive compensation.assets.
The provision for income taxes reflected an annual tax rate of 2926 percent for 2020, compared with 31 percent for 2019. The decrease in the annual tax rate was primarily due to changes in the geographic mix of profits.both 2022 and 2021.
During 2020,2022, retail new business volume was $10.76$11.36 billion, a decrease of $1.13$1.74 billion, or 913 percent, from 2019.compared with $13.10 billion for 2021. The decrease was driven by lower volume across all segments with the exception of an increase in Asia/Pacific.Latin America.
At the end of 2020,2022, past dues were 3.491.89 percent, compared with 3.141.95 percent at the end of 2019. Past dues increased primarily due to the impact of the COVID-19 pandemic, partially offset by decreases in the Caterpillar Power Finance, EAME and Latin American portfolios.2021. Write-offs, net of recoveries, were $222$46 million for 2020,2022, compared with $237$205 million for 2019.2021. As of December 31, 2020,2022, the allowance for credit losses totaled $479$346 million, or 1.771.29 percent of finance receivables, compared with $424$337 million, or 1.501.22 percent of finance receivables at December 31, 2019.2021.
Response to COVID-19 and Global Business Conditions
We continue to implement safeguards in our facilities to protect team members, including increased frequency of cleaning and disinfecting, social distancing practices and other measures consistent with specific governmental requirements and guidance from health authorities and continue
Caterpillar continues to monitor a variety of external factors around the situation closely.world, such as supply chain disruptions, inflationary cost and labor pressures. We remainare monitoring the potential downstream impacts from these factors on our business, while remaining focused on portfolio health and continuecontinuing to provide qualified customers and dealers with new loans and leases to support their current and future business needs.
We continue to closely monitor the events in Russia and Ukraine and have evaluated our exposure in these countries.
20202022 COMPARED WITH 20192021
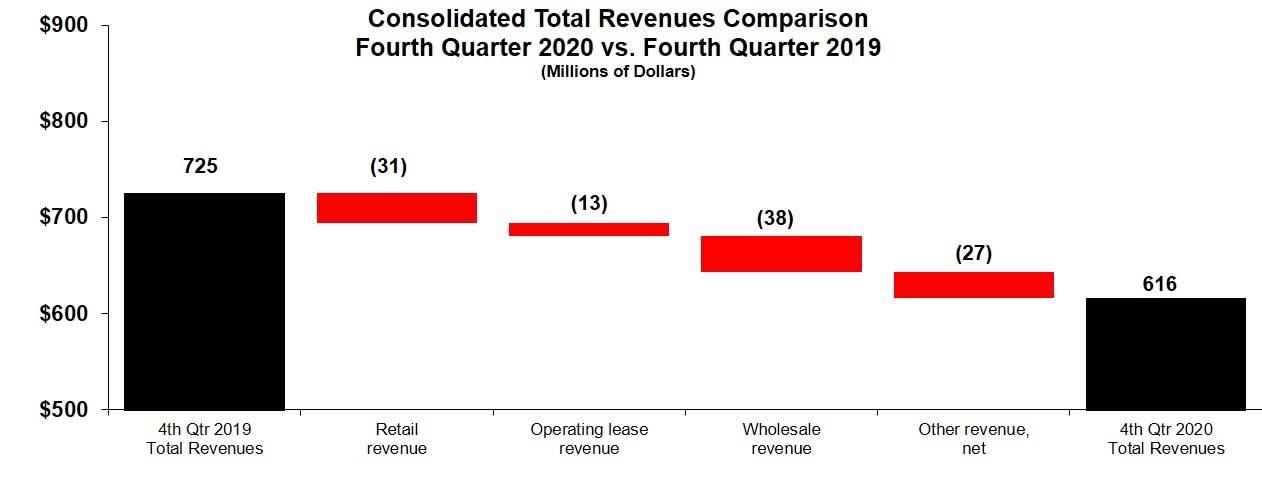
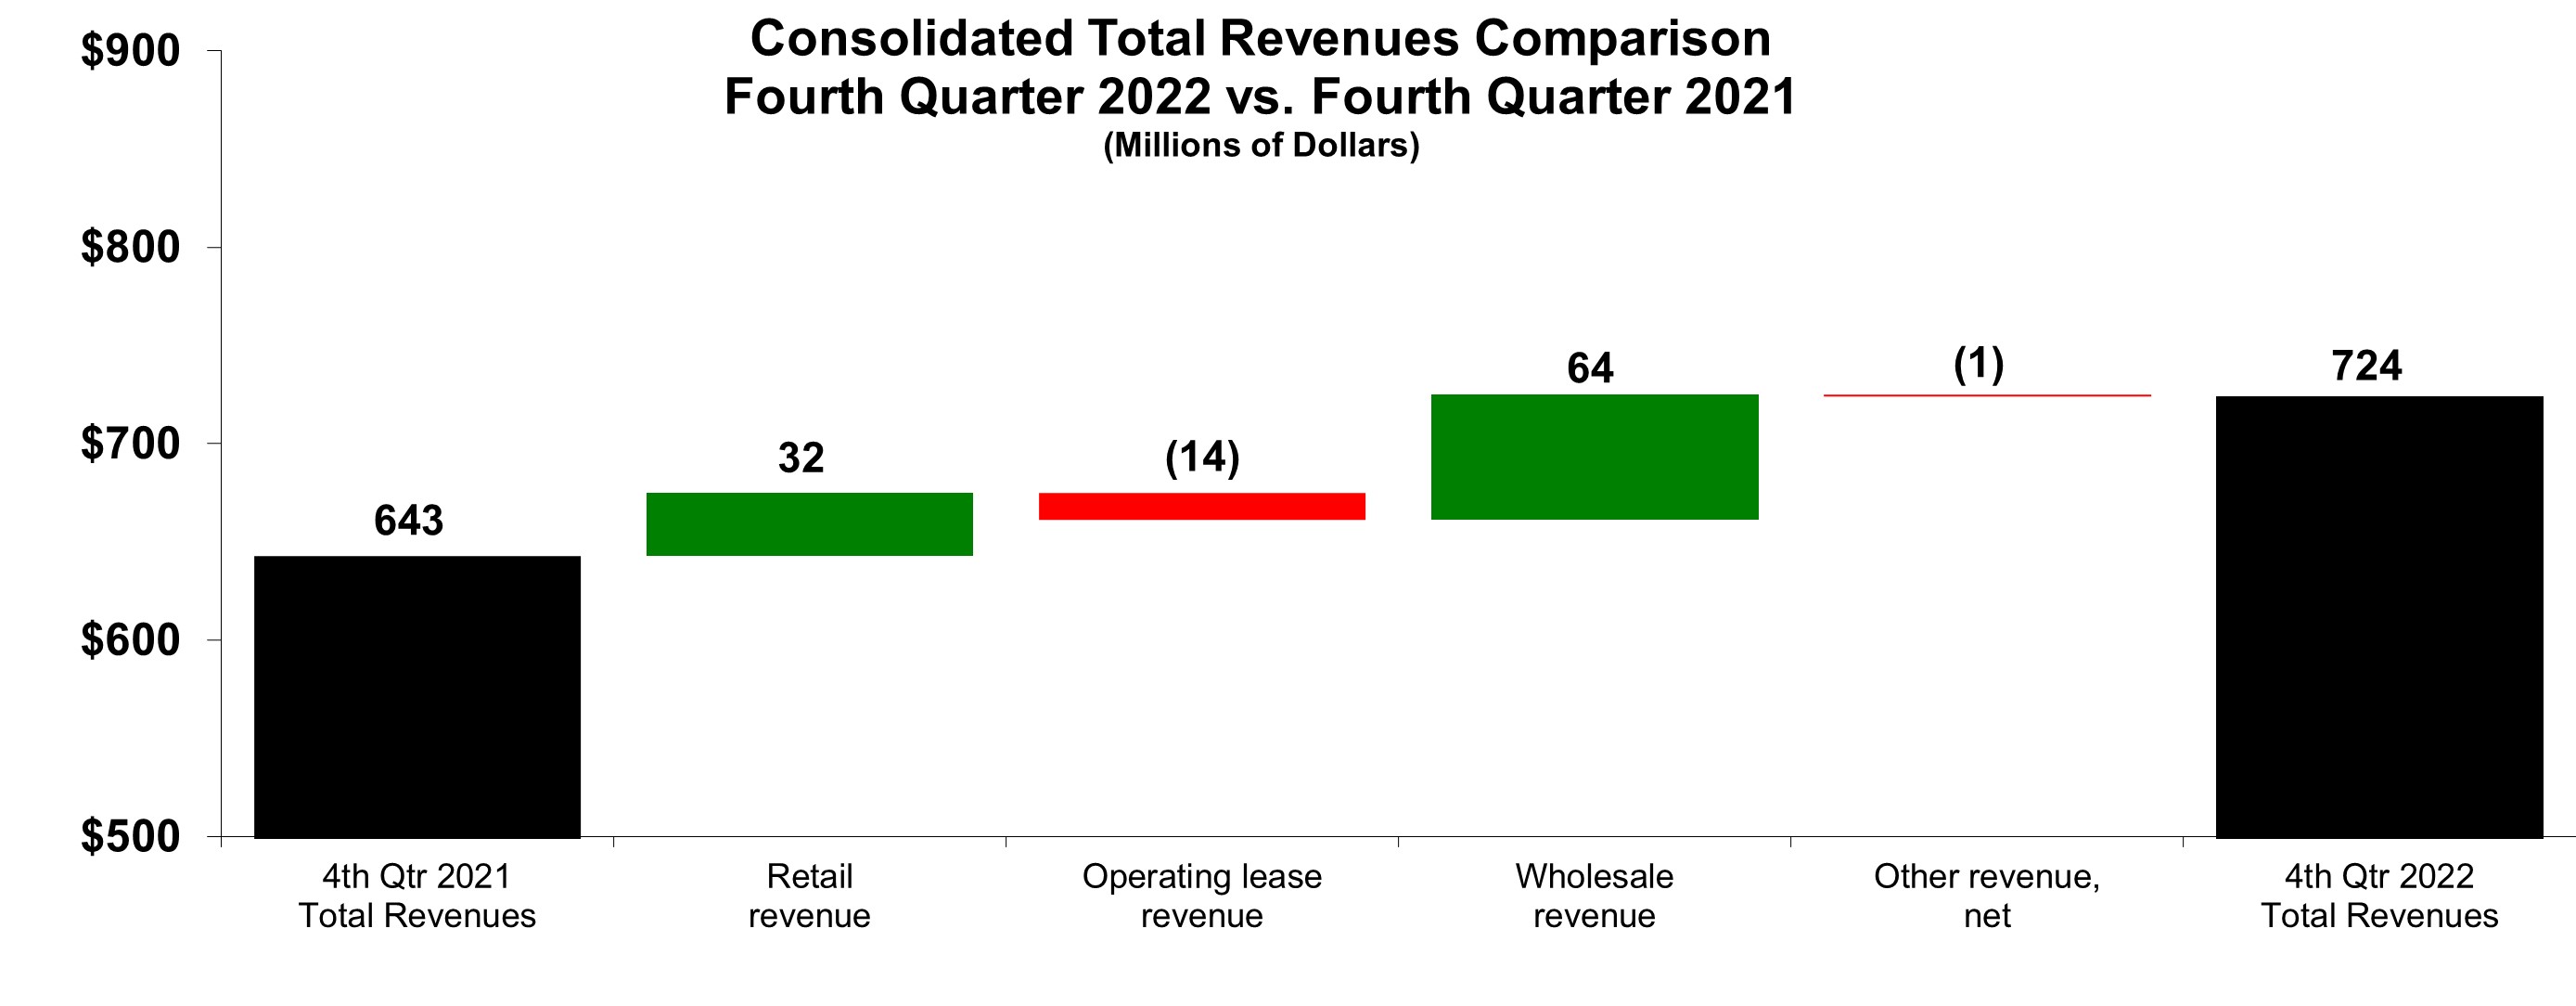
Consolidated Total Revenues
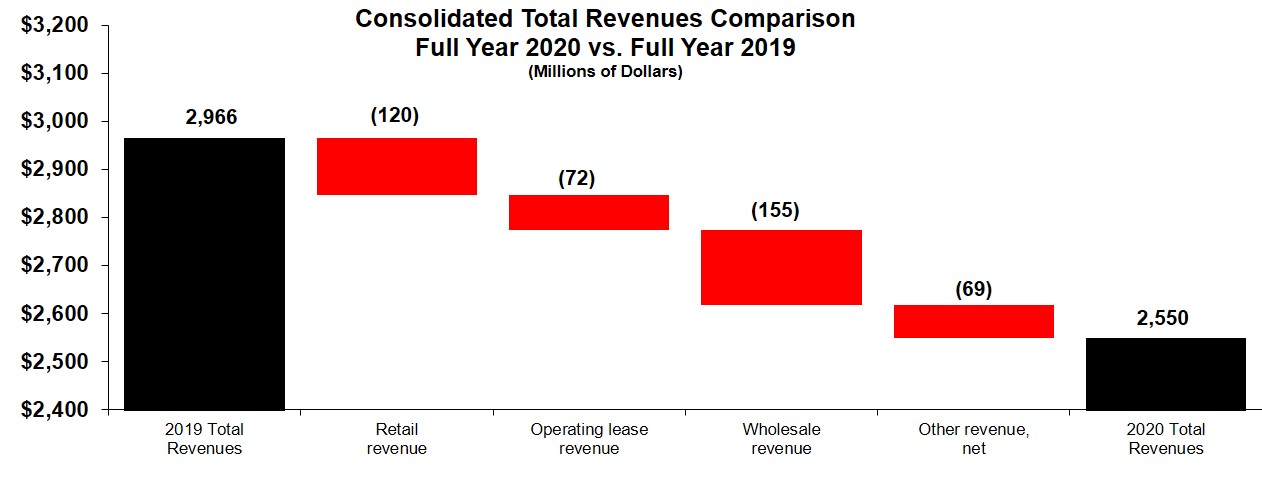
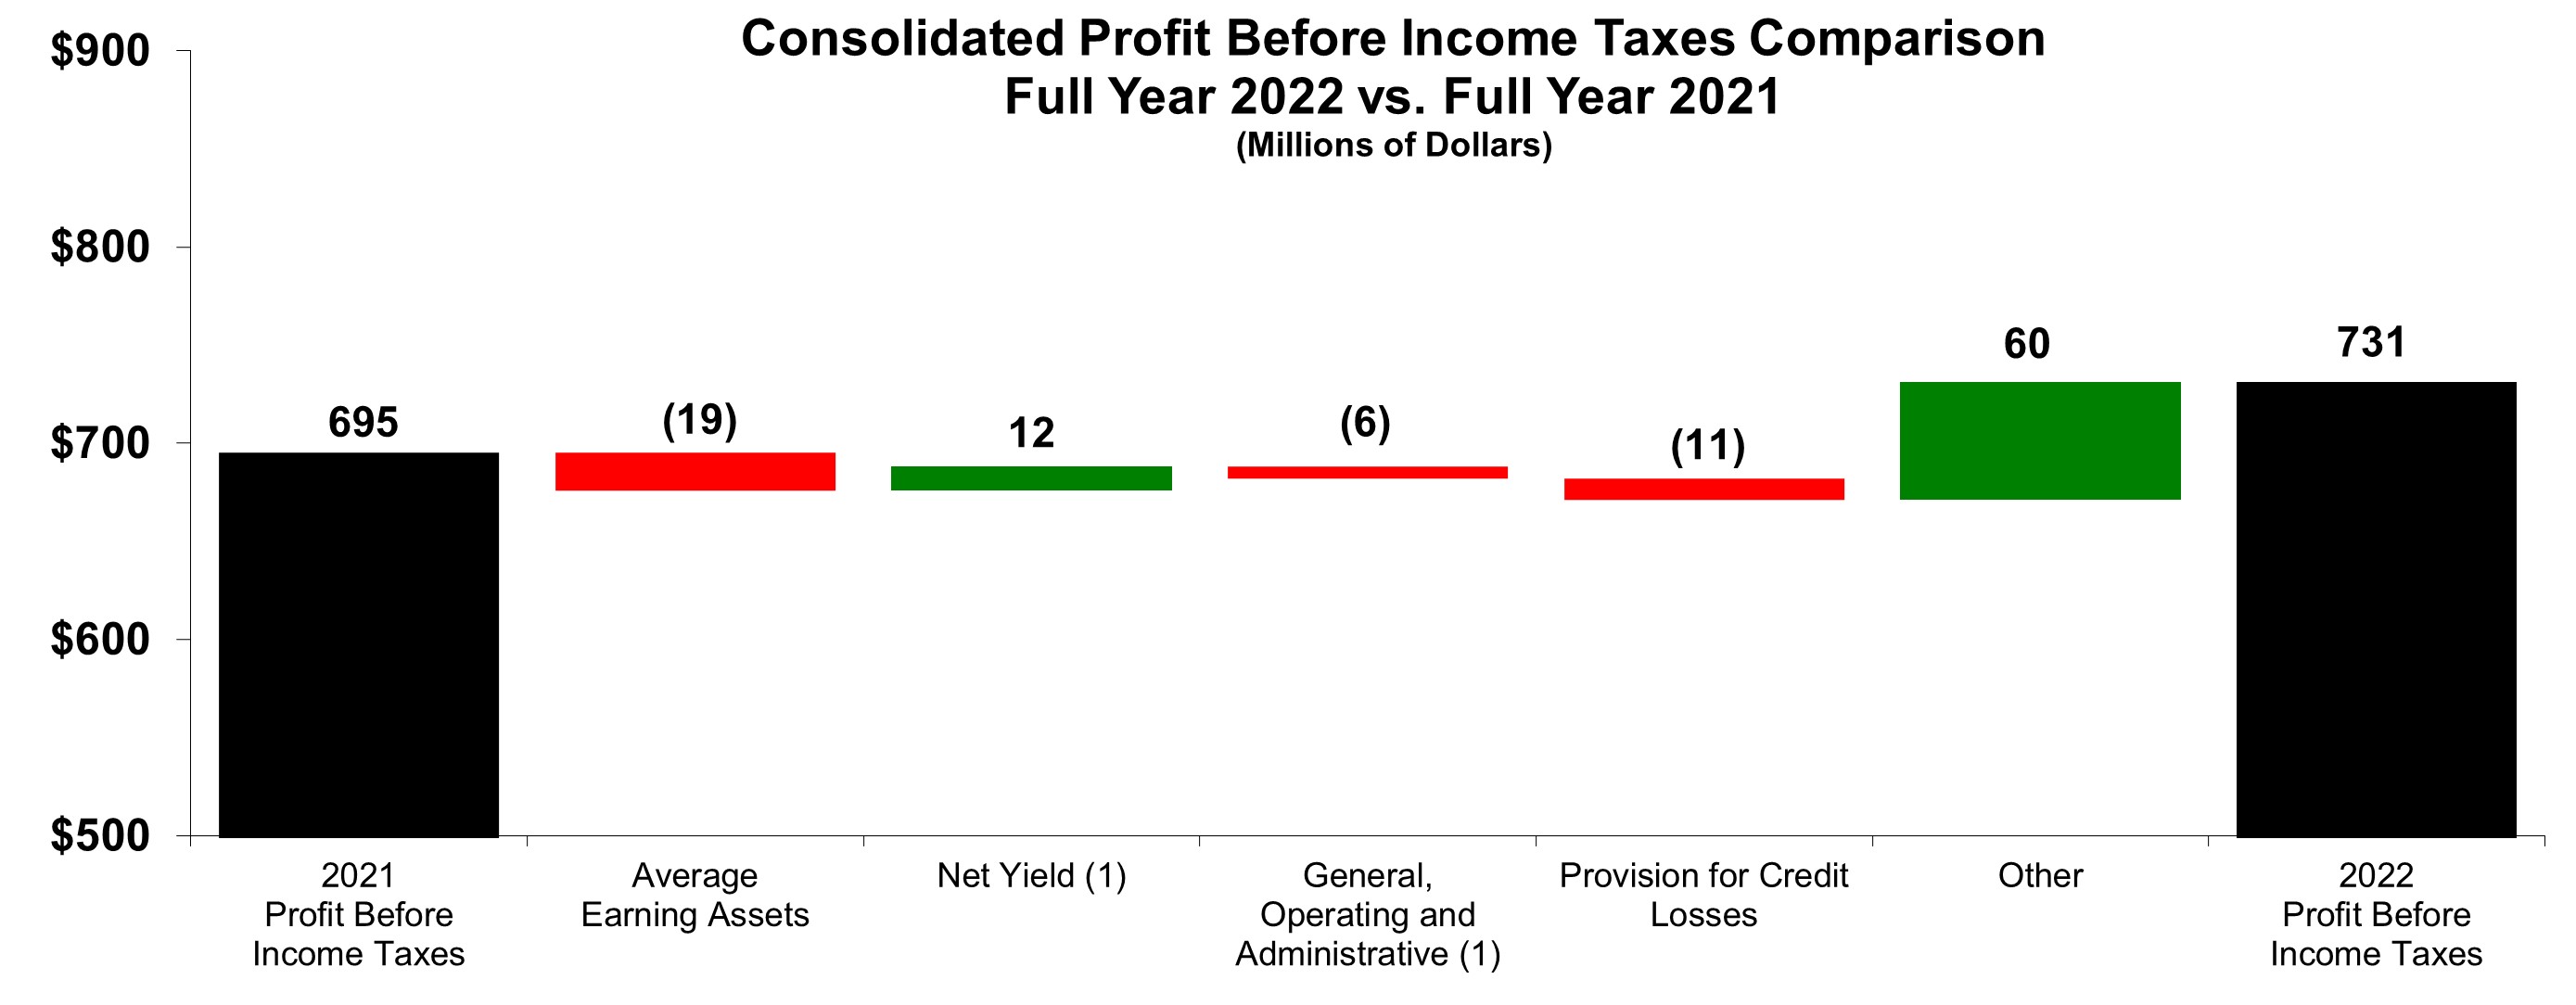
The chart above graphically illustrates reasons for the change in Consolidated Total Revenuesconsolidated total revenues between 20192021 (at left) and 20202022 (at right). Items favorably impacting total revenues appear as upward stair steps with corresponding dollar amounts above each bar, while items negatively impacting total revenues appear as downward stair steps with dollar amounts reflected in parentheses above each bar. Management utilizes these charts internally to visually communicate results.
Retail revenue for 20202022 was $1.25$1.23 billion, a decreasean increase of $120$32 million from 2019.2021. The decreaseincrease was due to a $101$62 million unfavorablefavorable impact from lowerhigher interest rates on retail finance receivables, andpartially offset by a $19$30 million unfavorable impact from lower average earning assets. For the year ended December 31, 2020,2022, retail average earning assets were $22.57$22.18 billion, a decrease of $317$581 million from 2019.2021. The average yield was 5.535.54 percent for 2020,2022, compared with 5.985.26 percent in 2019.2021.
Operating lease revenue for 20202022 was $965$888 million, a decrease of $72$54 million from 2019.2021. The decrease was primarily due to a $38 million unfavorable impact from lower average earning assets. Additionally, during the third quarter of 2020, we updated our accounting convention for recognizing revenue and depreciation on operating leases from a monthly to a daily basis. This update resulted in a $29 million unfavorable impact to operating lease revenue which was mostly offset by a $24 million favorable impact to depreciation on equipment leased to others.
Wholesale revenue for 2020 was $336 million, a decrease of $155 million from 2019. The decrease was due to an $87$66 million unfavorable impact from lower average earning assets, andpartially offset a $68$15 million unfavorablefavorable impact from lowerhigher rental rates on operating leases.
Wholesale revenue for 2022 was $441 million, an increase of $127 million from 2021. The increase was due to a $110 million favorable impact from higher interest rates on wholesale finance receivables.receivables and a $17 million favorable impact from higher average earning assets. For the year ended December 31, 2020,2022, wholesale average earning assets were $4.44$4.51 billion, a decreasean increase of $954$232 million from 2019.2021. The average yield was 7.589.77 percent for 2020,2022, compared with 9.107.34 percent in 2019.2021.
Other revenue, net items were as follows:
| | (Millions of dollars) | (Millions of dollars) | | (Millions of dollars) | |
| | 2020 | | 2019 | | Change | | 2022 | | 2021 | | Change |
| Finance receivable and operating lease fees (including late charges) | Finance receivable and operating lease fees (including late charges) | | $ | 49 | | | $ | 61 | | | $ | (12) | | Finance receivable and operating lease fees (including late charges) | | $ | 58 | | | $ | 56 | | | $ | 2 | |
| Fees on committed credit facility extended to Caterpillar | | — | | | 5 | | | (5) | | |
| | Net gain (loss) on returned or repossessed equipment | | Net gain (loss) on returned or repossessed equipment | | 81 | | | 26 | | | 55 | |
| Interest income on Notes receivable from Caterpillar | Interest income on Notes receivable from Caterpillar | | 14 | | | 26 | | | (12) | | Interest income on Notes receivable from Caterpillar | | 17 | | | 14 | | | 3 | |
| Net loss on returned or repossessed equipment | | (74) | | | (38) | | | (36) | | |
| Miscellaneous other revenue, net | Miscellaneous other revenue, net | | 11 | | | 15 | | | (4) | | Miscellaneous other revenue, net | | 20 | | | 13 | | | 7 | |
| Total Other revenue, net | Total Other revenue, net | | $ | — | | | $ | 69 | | | $ | (69) | | Total Other revenue, net | | $ | 176 | | | $ | 109 | | | $ | 67 | |
|
There was a $19$47 million unfavorable impact from currency on revenues in 2020.2022. Currency represents the net translation impact resulting from changes in foreign currency exchange rates versus the U.S. dollar and is included in all financial statement line items and each of the items included in the above analysis.
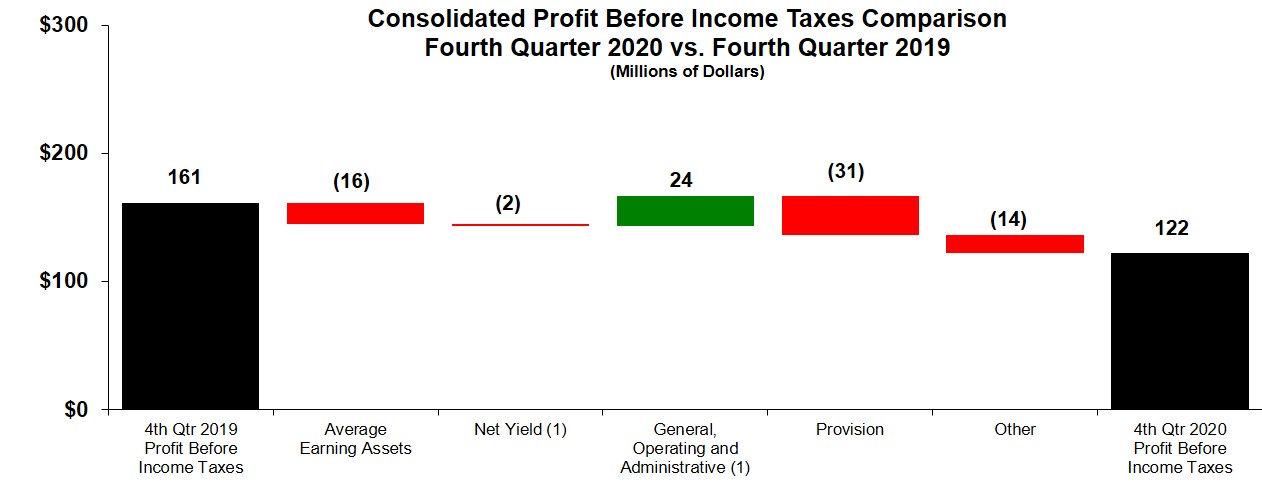
Consolidated Profit Before Income Taxes
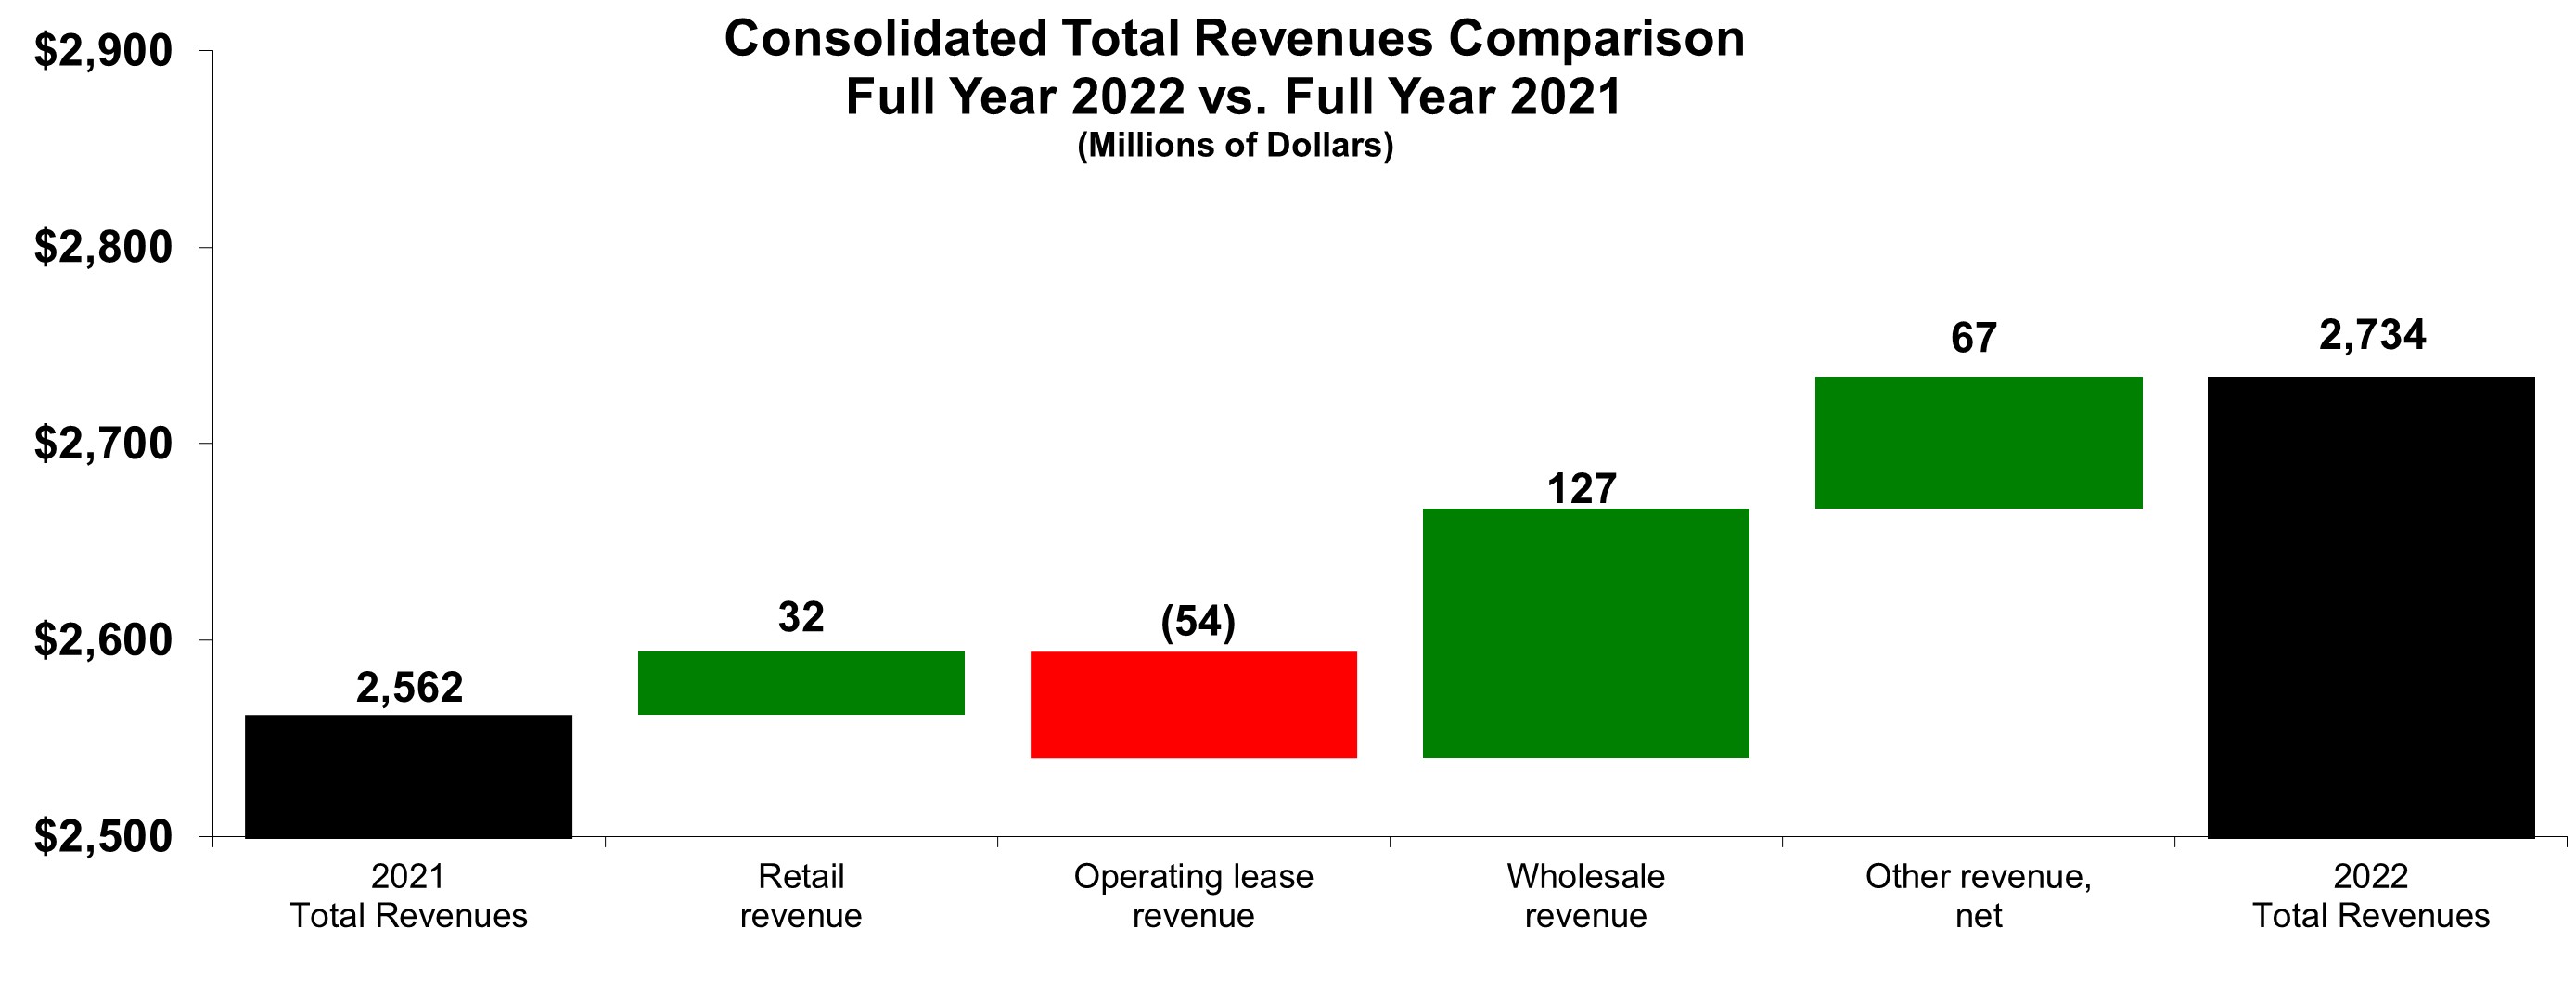
(1) Analysis excludes $19$15 million and $20$18 million in offsetting revenues and expenses for property taxes on operating leases for 20202022 and 2019,2021, respectively.
The chart above graphically illustrates reasons for the change in Consolidated Profit Before Income Taxesconsolidated profit before income taxes between 20192021 (at left) and 20202022 (at right). Items favorably impacting profit before income taxes appear as upward stair steps with corresponding dollar amounts above each bar, while items negatively impacting profit before income taxes appear as downward stair steps with dollar amounts reflected in parentheses above each bar. Management utilizes these charts internally to visually communicate results.
Profit before income taxes was $434$731 million for 2020,2022, an increase of 36 million, or 5 percent, compared with $628$695 million for 2019.2021. The decreaseincrease was primarily due to a $104$55 million increase in provision for credit losses,favorable impact from returned or repossessed equipment, partially offset by a $69$19 million unfavorable impact from lower average earning assets, a $52 million decrease in net yield on average earning assets and a $36 million unfavorable impact from returned or repossessed equipment. These unfavorable impacts were partially offset by an $82 million decrease in general, operating and administrative expenses, primarily due to lower incentive compensation.assets.
There was an $8a $13 million unfavorable impact from currency on profit before income taxes in 2020.2022. Currency represents the net translation impact resulting from changes in foreign currency exchange rates versus the U.S. dollar and is included in all financial statement line items and each of the items included in the above analysis.
Provision for Income Taxes
The provision for income taxes reflected an annual tax rate of 2926 percent for 2020, compared with 31 percent for 2019. The decrease in the annual tax rate was primarily due to changes in the geographic mix of profits.both 2022 and 2021.
Finance Receivables and Equipment on Operating Leases
New Business Volume
| | (Millions of dollars) | (Millions of dollars) | | (Millions of dollars) | |
| | 2020 | | 2019 | | Change | | 2022 | | 2021 | | Change |
| New retail financing | New retail financing | | $ | 9,645 | | | $ | 10,320 | | | $ | (675) | | New retail financing | | $ | 10,211 | | | $ | 11,867 | | | $ | (1,656) | |
| New operating lease activity | New operating lease activity | | 1,114 | | | 1,571 | | | (457) | | New operating lease activity | | 1,144 | | | 1,230 | | | (86) | |
| New wholesale financing | New wholesale financing | | 33,485 | | | 43,714 | | | (10,229) | | New wholesale financing | | 47,749 | | | 40,393 | | | 7,356 | |
| Total | Total | | $ | 44,244 | | | $ | 55,605 | | | $ | (11,361) | | Total | | $ | 59,104 | | | $ | 53,490 | | | $ | 5,614 | |
|
New retail financing decreased due to lower volume across all segments with the exception of North America and Asia/Pacific.an increase in Latin America. New operating lease activity (which is substantially related to retail) decreased due to lower rentals of Cat equipment mostly in North America and Mining.equipment. New wholesale financing decreasedincreased primarily due to lowerhigher purchases of trade receivables from Caterpillar.
Total Managed Portfolio
We define total portfolio as Finance receivables, net plus Equipment on operating leases, net. We also manage and service receivables and leases that have been sold by us to third parties with limited or no recourse in order to mitigate our concentration of credit risk with certain customers. These assets are not available to pay our creditors. Total managed portfolio as of December 31, was as follows:
| | (Millions of dollars) | (Millions of dollars) | | (Millions of dollars) | |
| | 2020 | | 2019 | | Change | | 2022 | | 2021 | | Change |
| Finance receivables, net | Finance receivables, net | | $ | 26,575 | | | $ | 27,832 | | | $ | (1,257) | | Finance receivables, net | | $ | 26,441 | | | $ | 27,177 | | | $ | (736) | |
| Equipment on operating leases, net | Equipment on operating leases, net | | 3,366 | | | 3,583 | | | (217) | | Equipment on operating leases, net | | 2,911 | | | 3,123 | | | (212) | |
| Total portfolio | Total portfolio | | $ | 29,941 | | | $ | 31,415 | | | $ | (1,474) | | Total portfolio | | $ | 29,352 | | | $ | 30,300 | | | $ | (948) | |
| | Retail loans, net | Retail loans, net | | $ | 139 | | | $ | 186 | | | $ | (47) | | Retail loans, net | | $ | 68 | | | $ | 107 | | | $ | (39) | |
| Operating leases | | Operating leases | | 21 | | | 23 | | | (2) | |
| Retail leases, net | Retail leases, net | | 56 | | | 81 | | | (25) | | Retail leases, net | | 23 | | | 19 | | | 4 | |
| Operating leases | | 24 | | | 26 | | | (2) | | |
| Total off-balance sheet managed assets | Total off-balance sheet managed assets | | $ | 219 | | | $ | 293 | | | $ | (74) | | Total off-balance sheet managed assets | | $ | 112 | | | $ | 149 | | | $ | (37) | |
| | Total managed portfolio | Total managed portfolio | | $ | 30,160 | | | $ | 31,708 | | | $ | (1,548) | | Total managed portfolio | | $ | 29,464 | | | $ | 30,449 | | | $ | (985) | |
|
Total Portfolio Metrics
At the end of 2020,2022, past dues were 3.491.89 percent, compared with 3.141.95 percent at the end of 2019. Past dues increased primarily due to the impact of the COVID-19 pandemic, partially offset by decreases in the Caterpillar Power Finance, EAME and Latin American portfolios.2021. Total non-performing finance receivables, which represent finance receivables currently on non-accrual status, were $567$234 million and $805$288 million at December 31, 20202022 and 2019,2021, respectively. Total non-performing finance receivables as a percentage of our finance receivables were 2.100.87 percent and 2.851.05 percent at December 31, 20202022 and 2019,2021, respectively.
As it relates to COVID-19, we provided payment relief through Cat Financial Customer Care Programs launched globally, including account modifications to accommodate customer needs. Generally, the Customer Care Programs provided payment relief for customers that were current in their payment obligations and included payment deferrals of three months, with the option to extend for an additional three months. Additionally, we continue to respond to government requirements to adjust the repayment terms for customers, as required. Since the start of the pandemic, modification requests were received from customers representing approximately 25 percent of the customer portfolio. Most customers who have exited the modification period have resumed payments and have not requested additional relief.
Our allowance for credit losses as of December 31, 20202022 was $479$346 million, or 1.771.29 percent of finance receivables, compared with $424$337 million, or 1.501.22 percent, as of December 31, 2019.2021. The allowance is subject to an ongoing evaluation based on many quantitative and qualitative factors, including past loss experience, known and inherent risks in the portfolio, adverse situations that may affect the borrower’s ability to repay, estimated value of underlying collateral and economic forecasts. We believe our allowance is sufficient to provide for losses over the remaining life of our finance receivable portfolio as of December 31, 2020.2022.
FOURTH QUARTER 2020 VS.2022 COMPARED WITH FOURTH QUARTER 20192021
CONSOLIDATED STATEMENTS OF PROFIT (UNAUDITED)
(Dollars in Millions)
| | | | | | | | | | | | | | |
| | Three Months Ended
December 31, |
| | | 2020 | | 2019 |
| Revenues: | | | | |
| Retail finance | | $ | 307 | | | $ | 338 | |
| Operating lease | | 247 | | | 260 | |
| Wholesale finance | | 78 | | | 116 | |
| Other, net | | (16) | | | 11 | |
| Total revenues | | 616 | | | 725 | |
| | | | |
| Expenses: | | | | |
| Interest | | 129 | | | 188 | |
| Depreciation on equipment leased to others | | 194 | | | 202 | |
| General, operating and administrative | | 113 | | | 138 | |
| Provision for credit losses | | 49 | | | 18 | |
| Other | | 10 | | | 8 | |
| Total expenses | | 495 | | | 554 | |
| | | | |
| Other income (expense) | | 1 | | | (10) | |
| | | | |
| Profit before income taxes | | 122 | | | 161 | |
| | | | |
| Provision for income taxes | | 24 | | | 52 | |
| | | | |
| Profit of consolidated companies | | 98 | | | 109 | |
| | | | |
| Less: Profit attributable to noncontrolling interests | | 2 | | | 5 | |
| | | | |
Profit(1) | | $ | 96 | | | $ | 104 | |
| | | | |
| | | | |
(1) Profit attributable to Caterpillar Financial Services Corporation. | | | | | | | | | | | | | | |
| | Three Months Ended
December 31, |
| | | 2022 | | 2021 |
| Revenues: | | | | |
| Retail finance | | $ | 326 | | | $ | 294 | |
| Operating lease | | 217 | | | 231 | |
| Wholesale finance | | 141 | | | 77 | |
| Other, net | | 40 | | | 41 | |
| Total revenues | | 724 | | | 643 | |
| | | | |
| Expenses: | | | | |
| Interest | | 189 | | | 104 | |
| Depreciation on equipment leased to others | | 174 | | | 185 | |
| General, operating and administrative | | 134 | | | 146 | |
| Provision for credit losses | | 47 | | | 10 | |
| Other | | 4 | | | 12 | |
| Total expenses | | 548 | | | 457 | |
| | | | |
| Other income (expense) | | (25) | | | (7) | |
| | | | |
| Profit before income taxes | | 151 | | | 179 | |
| | | | |
| Provision for income taxes | | 32 | | | 54 | |
| | | | |
| Profit of consolidated companies | | 119 | | | 125 | |
| | | | |
| Less: Profit attributable to noncontrolling interests | | 1 | | | 3 | |
| | | | |
| Profit attributable to Caterpillar Financial Services Corporation | | $ | 118 | | | $ | 122 | |
| | | | |
Consolidated Total Revenues
The chart above graphically illustrates reasons for the change in Consolidated Total Revenuesconsolidated total revenues between fourth quarter 20192021 (at left) and fourth quarter 20202022 (at right). Items favorably impacting total revenues appear as upward stair steps with corresponding dollar amounts above each bar, while items negatively impacting total revenues appear as downward stair steps with dollar amounts reflected in parentheses above each bar. Management utilizes these charts internally to visually communicate results.
Retail revenue for the fourth quarter of 20202022 was $307$326 million, a decreasean increase of $31$32 million from the same period in 2019.2021. The decreaseincrease was mostly due to a $27$43 million unfavorablefavorable impact from lowerhigher interest rates on retail finance receivables, and a $4partially offset by an $11 million unfavorable impact from lower average earning assets. For the quarter ended December 31, 2020,2022, retail average earning assets were $22.50$21.71 billion, a decrease of $305$918 million from the same period in 2019.2021. The annualized average yield was 5.456.00 percent for the fourth quarter of 2020,2022, compared with 5.925.19 percent for the fourth quarter of 2019.2021.
Operating lease revenue for the fourth quarter of 20202022 was $247$217 million, a decrease of $13$14 million from the same period in 2019.2021. The decrease was primarily due to a $14$17 million unfavorable impact from lower average earning assets.assets, partially offset by a $3 million favorable impact from higher rental rates on operating leases.
Wholesale revenue for the fourth quarter of 20202022 was $78$141 million, a decreasean increase of $38$64 million from the same period in 2019.2021. The decreaseincrease was due to a $22$59 million unfavorablefavorable impact from lower average earning assets and a $16 million unfavorable impact from lowerhigher interest rates on wholesale finance receivables.receivables and a $5 million favorable impact from higher average earning assets. For the quarter ended December 31, 2020,2022, wholesale average earning assets were $4.15$4.67 billion, a decreasean increase of $912$311 million from the same period in 2019.2021. The annualized average yield was 7.5312.08 percent for the fourth quarter of 2020,2022, compared with 9.207.10 percent for the fourth quarter of 2019.2021.
Other revenue, net items were as follows:
| (Millions of dollars) | (Millions of dollars) | | Three Months Ended
December 31, | (Millions of dollars) | | Three Months Ended
December 31, |
| | | | 2020 | | 2019 | | Change | | | 2022 | | 2021 | | Change |
| Finance receivable and operating lease fees (including late charges) | Finance receivable and operating lease fees (including late charges) | | $ | 12 | | | $ | 15 | | | $ | (3) | | Finance receivable and operating lease fees (including late charges) | | $ | 14 | | | $ | 14 | | | $ | — | |
| | Net gain (loss) on returned or repossessed equipment | | Net gain (loss) on returned or repossessed equipment | | 14 | | | 18 | | | (4) | |
| Interest income on Notes receivable from Caterpillar | Interest income on Notes receivable from Caterpillar | | 4 | | | 4 | | | — | | Interest income on Notes receivable from Caterpillar | | 4 | | | 4 | | | — | |
| Net loss on returned or repossessed equipment | | (35) | | | (11) | | | (24) | | |
| Miscellaneous other revenue, net | Miscellaneous other revenue, net | | 3 | | | 3 | | | — | | Miscellaneous other revenue, net | | 8 | | | 5 | | | 3 | |
| Total Other revenue, net | Total Other revenue, net | | $ | (16) | | | $ | 11 | | | $ | (27) | | Total Other revenue, net | | $ | 40 | | | $ | 41 | | | $ | (1) | |
|
There was a $2an $18 million favorableunfavorable impact from currency on revenues in the fourth quarter of 2020.2022. Currency represents the net translation impact resulting from changes in foreign currency exchange rates versus the U.S. dollar and is included in all financial statement line items and each of the items included in the above analysis.
Consolidated Profit Before Income Taxes
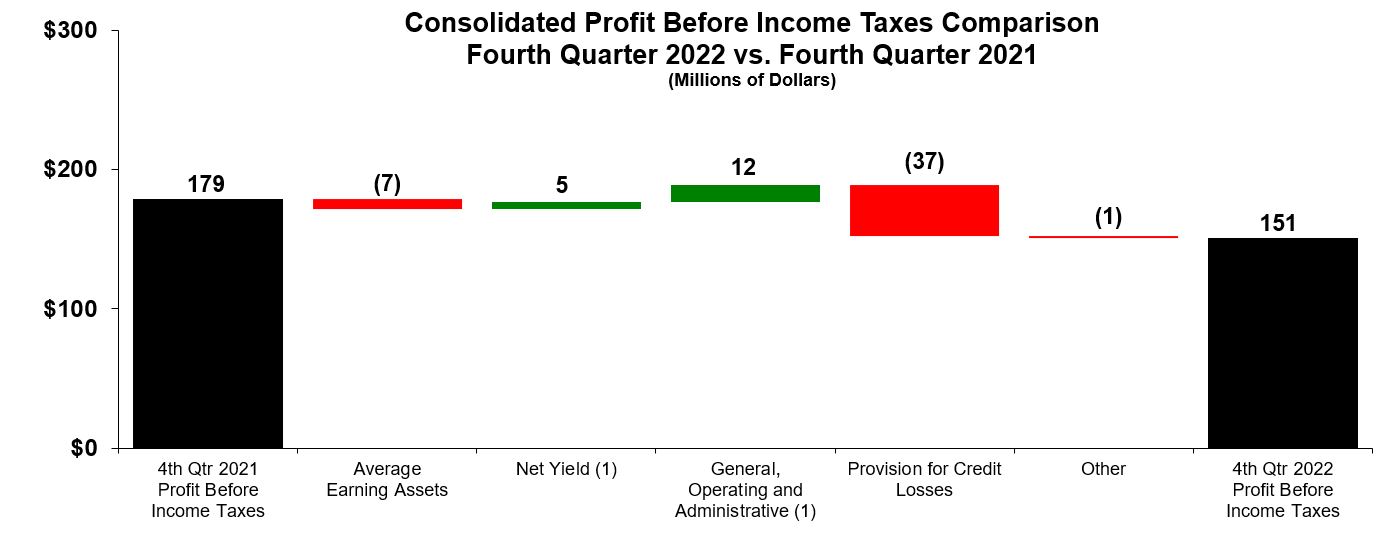 (1) Analysis excludes $4
 million and $5 million in offsetting revenues and expenses for property taxes on operating leases for both the fourth quarter of 20202022 and 2019,2021, respectively.The chart above graphically illustrates reasons for the change in Consolidated Profit Before Income Taxesconsolidated profit before income taxes between fourth quarter 20192021 (at left) and fourth quarter 20202022 (at right). Items favorably impacting profit before income taxes appear as upward stair steps with corresponding dollar amounts above each bar, while items negatively impacting profit before income taxes appear as downward stair steps with dollar amounts reflected in parentheses above each bar. Management utilizes these charts internally to visually communicate results.
Fourth-quarter 20202022 profit before income taxes was $122$151 million, a decrease of $28 million, or 16 percent, compared with $161$179 million forin the fourth quarter of 2019.2021. The decrease was primarilymainly due to a $31$37 million increase inunfavorable impact from a higher provision for credit losses, a $24 million unfavorable impact from returned or repossessed equipment and a $16 million unfavorable impact from lower average earning assets. These unfavorable impacts were partially offset by a $24$12 million favorable impact from a decrease in general, operating and administrative expenses, primarily due to lower incentive compensation.expenses.
There was a $1$4 million favorableunfavorable impact from currency on profit before income taxes in the fourth quarter of 2020.2022. Currency represents the net translation impact resulting from changes in foreign currency exchange rates versus the U.S. dollar and is included in all financial statement line items and each of the items included in the above analysis.
Provision for Income Taxes2021 COMPARED WITH 2020
The provision for income taxes reflected an effective tax rate of 20 percent in the fourth quarter of 2020, compared with 32 percent in the fourth quarter of 2019. The decrease in the effective tax rate was primarily due to changes in the geographic mix of profits.
2019 COMPARED WITH 2018
CAPITAL RESOURCES AND LIQUIDITY
Capital resources and liquidity provide us with the ability to meet our financial obligations on a timely basis. Maintaining and managing adequate capital and liquidity resources includes management of funding sources and their utilization based on current, future and contingent needs. Throughout 2020,2022, we experienced favorable liquidity conditions. We ended 20202022 with $411$868 million of cash, a decreasean increase of $279$258 million from year-end 2019.2021. Our cash balances are held in numerous locations throughout the world with approximately $192$716 million held by our non-U.S. subsidiaries. Amounts held by non-U.S. subsidiaries, are available for general corporate use and could be usedincluding $158 million in Russia which is currently subject to local government restrictions that substantially limit transfer outside of the U.S. without incurring significant additional U.S. taxes.country. We expect to meet our U.S. funding needs without repatriating undistributed profits that are indefinitely reinvested outside the U.S.
BORROWINGS
Borrowings consist primarily of medium-term notes and commercial paper, the combination of which is used to manage interest rate risk and funding requirements. (Please refer to Notes 5, 6 7 and 87 of Notes to Consolidated Financial Statements for additional discussion.)
We receive debt ratings from the major credit rating agencies. Moody’s, long- and short-term ratings of our debt are A3 and Prime-2, while Fitch and S&P maintain a "mid-A"“mid-A” debt rating. This split rating has not had a material impact on our borrowing costs or our overall financial health. However, aA downgrade of our credit ratings by any of the major credit rating agencies wouldcould result in increased borrowing costs and could make access to certain credit markets more difficult. In the event economic conditions deteriorate such that access to debt markets becomes unavailable, we would rely on cash flows from our existing portfolio, existing cash balances, access to our committed credit facilities and other credit line facilities, commercial paper support facilities sponsored by the U.S. Federal Reserve and the Bank of Canada, and potential borrowings from Caterpillar. In addition, Caterpillar maintains a support agreement with us, which requires Caterpillar to remain our sole owner and may, under certain circumstances, require Caterpillar to make payments to us should we fail to maintain certain financial ratios.
Total borrowings outstanding as of December 31, 20202022 were $27.01$27.40 billion, a decrease of $2.11 billion over$616 million from December 31, 2019 primarily due to lower portfolio funding requirements.2021. Outstanding borrowings as of December 31 were as follows:
| (Millions of dollars) | (Millions of dollars) | | 2020 | | 2019 | (Millions of dollars) | | 2022 | | 2021 |
| Medium-term notes, net | Medium-term notes, net | | $ | 23,550 | | | $ | 22,692 | | Medium-term notes, net | | $ | 20,672 | | | $ | 22,246 | |
| Commercial paper, net of unamortized discount | Commercial paper, net of unamortized discount | | 1,321 | | | 4,168 | | Commercial paper, net of unamortized discount | | 5,455 | | | 4,896 | |
| Bank borrowings and other – long-term | Bank borrowings and other – long-term | | 429 | | | 642 | | Bank borrowings and other – long-term | | 746 | | | 348 | |
| Bank borrowings and other – short-term | Bank borrowings and other – short-term | | 307 | | | 605 | | Bank borrowings and other – short-term | | 234 | | | 213 | |
| Variable denomination floating rate demand notes | Variable denomination floating rate demand notes | | 377 | | | 388 | | Variable denomination floating rate demand notes | | 265 | | | 286 | |
| Notes payable to Caterpillar | Notes payable to Caterpillar | | 1,022 | | | 618 | | Notes payable to Caterpillar | | 23 | | | 22 | |
| Total outstanding borrowings | Total outstanding borrowings | | $ | 27,006 | | | $ | 29,113 | | Total outstanding borrowings | | $ | 27,395 | | | $ | 28,011 | |
|
Medium-term notes
We issue medium-term unsecured notes through securities dealers or underwriters in the U.S., Canada, Europe, Australia, Japan, Hong Kong, and China to both retail and institutional investors.other international capital markets. These notes are offered in several currencies and with a variety of maturities. These notes are senior unsecured obligations of the Company. Medium-term notes issued totaled $8.26$6.01 billion and redeemed totaled $7.48$7.46 billion for the year ended December 31, 2020.2022. Medium-term notes, net outstanding as of December 31, 20202022 mature as follows:
| | | | | |
| (Millions of dollars) | |
| 2023 | $ | 4,731 | |
| 2024 | 7,248 | |
| 2025 | 4,408 | |
| 2026 | 2,452 | |
| 2027 | 1,945 | |
| Thereafter | — | |
| Fair value adjustments | (112) | |
| Total | $ | 20,672 | |
| |
| | | | | |
| (Millions of dollars) | |
| 2021 | $ | 7,539 | |
| 2022 | 6,479 | |
| 2023 | 4,148 | |
| 2024 | 2,656 | |
| 2025 | 1,613 | |
| Thereafter | 1,055 | |
| Fair value adjustments | 60 | |
| Total | $ | 23,550 | |
| |
Commercial paper
We issue unsecured commercial paper in the U.S., Europe, and other international capital markets. These short-term promissory notes are issued on a discounted basis and are payable at maturity. As of December 31, 2020,2022, there was $1.32$5.46 billion outstanding in commercial paper.
Revolving credit facilities
As of December 31, 2020,2022, we had three global credit facilities with a syndicate of banks totaling $10.50 billion (Credit Facility) available in the aggregate to both Caterpillar and us for general liquidity purposes. Based on management'smanagement’s allocation decision, which can be revised from time to time, the portion of the Credit Facility available to us as of December 31, 20202022 was $7.75 billion. Information on our Credit Facility is as follows:
•The 364-day facility of $3.15 billion (of which $2.33 billion is available to us) expires in September 2021.August 2023.
•The three-year facility, as amended and restated in September 2019,2022, of $2.73 billion (of which $2.01 billion is available to us) expires in September 2022.August 2025.
•The five-year facility, as amended and restated in September 2019,2022, of $4.62 billion (of which $3.41 billion is available to us) expires in September 2024.2027.
At December 31, 2020,2022, Caterpillar’s consolidated net worth was $15.41$15.93 billion, which was above the $9.00 billion required under the Credit Facility. The consolidated net worth is defined in the Credit Facility as the consolidated shareholders'shareholders’ equity including preferred stock but excluding the pension and other postretirement benefits balance within Accumulated other comprehensive income (loss).
At December 31, 2020,2022, our covenant interest coverage ratio was 1.722.36 to 1. This was above the 1.15 to 1 minimum ratio, calculated as (1) profit excluding income taxes, interest expense and net gain/(loss) from interest rate derivatives to (2) interest expense, calculated at the end of each calendar quarter for the rolling four quarter period then most recently ended, required by the Credit Facility.
In addition, at December 31, 2020,2022, our six-month covenant leverage ratio was 6.747.05 to 1 and our year-end covenant leverage ratio was 6.957.21 to 1. This was below the maximum ratio of debt to net worth of 10 to 1, calculated (1) on a monthly basis as the average of the leverage ratios determined on the last day of each of the six preceding calendar months and (2) at each December 31, required by the Credit Facility.
In the event that either Caterpillar or we do not meet one or more of our respective financial covenants under the Credit Facility in the future (and are unable to obtain a consent or waiver), the syndicate of banks may terminate the commitments allocated to the party that does not meet its covenants. Additionally, in such event, certain of our other lenders under other loan agreements where similar financial covenants or cross default provisions are applicable, may, at their election, choose to pursue remedies under those loan agreements, including accelerating the repayment of outstanding borrowings. At December 31, 2020,2022, there were no borrowings under the Credit Facility.
Bank borrowings
Available credit lines with banks as of December 31, 20202022 totaled $3.03$3.49 billion. These committed and uncommitted credit lines, which may be eligible for renewal at various future dates or have no specified expiration date, are used primarily by our non-U.S. subsidiaries for local funding requirements. We may guarantee subsidiary borrowings under these lines. As of December 31, 2020,2022, we had $734$979 million outstanding against these credit lines and were in compliance with all debt covenants under these credit lines. The remaining available credit commitments may be withdrawn any time at the lenders' discretion.
Variable denomination floating rate demand notes
We obtain funding from the sale of variable denomination floating rate demand notes, which may be redeemed at any time at the option of the holder without any material restriction. We do not hold reserves to fund the payment of the demand notes. The notes are offered on a continuous basis. As of December 31, 2020,2022, there were $377$265 million of variable denomination floating rate demand notes outstanding. The maximum amount of variable denomination floating rate demand notes that we may have outstanding at any time may not exceed $1.25 billion.
Notes receivable from/payable to Caterpillar
Under our variable amount and term lending agreements and other notes receivable with Caterpillar, we may borrow up to $2.41$2.38 billion from Caterpillar and Caterpillar may borrow up to $1.74$1.75 billion from us. The variable amount lending agreements are in effect for indefinite periods of time and may be changed or terminated by either party with 30 days notice. The term lending agreements have remaining maturities ranging up to ten years. We had notes payable of $1.02 billion$23 million and notes receivable of $356$482 million outstanding under these agreements as of December 31, 2020.
Impact from COVID-19 on liquidity
Since the outbreak of the COVID-19 global pandemic, we continue to take actions to maintain our strong financial position and increase liquidity. In April 2020, we registered for $4.2 billion in commercial paper support programs available in the United States and Canada. In addition, we also benefited from the incremental $3.9 billion short-term credit facility that was arranged by Caterpillar which was set to expire on December 31, 2020. Due to our strong liquidity position, the $3.9 billion short-term credit facility was early terminated by Caterpillar on September 2, 2020. We have not made any drawings on our existing global credit facilities nor do we have any outstanding borrowings under either commercial paper support program as of the date of this filing. In addition, during the third quarter of 2020, we issued $3.25 billion of medium-term notes to refinance maturing medium-term notes and supplement our liquidity position. 2022.
OFF-BALANCE SHEET ARRANGEMENTS
We have potential payment exposure for guarantees issuedare a party to third parties totaling $40 million ascertain off-balance sheet arrangements, primarily in the form of December 31, 2020.guarantees. Please refer to Note 1110 of Notes to Consolidated Financial Statements for further information.
Managed assets
Certain finance receivables and equipment on operating leases are sold by us to third parties with limited or no recourse in order to mitigate our concentration of credit risk with certain customers. In 2020,2022, we received $51$63 million of cash proceeds from the sale of such assets. We typically maintain servicing responsibilities for these assets.
MATERIAL CASH REQUIREMENTS FROM CONTRACTUAL OBLIGATIONS
We believe our balances of cash and cash equivalents of $868 million as of December 31, 2022, along with cash generated by ongoing operations and continued access to debt markets, will be sufficient to satisfy our cash requirements over the next 12 months and beyond.
We have committed cash outflow related to short-term borrowings and long-term debt, operating lease agreementsdebt. See Notes 6 and purchase obligations. Minimum payments for these obligations are:
| | | | | | | | | | | | | | | | | | | | | | | | | | | | | | | | |
| (Millions of dollars) | | | | | | | | | | |
| | 2021 | | 2022-2023 | | 2024-2025 | | After 2025 | | Total |
Long-term debt(1) | | $ | 7,738 | | | $ | 10,866 | | | $ | 4,298 | | | $ | 1,063 | | | $ | 23,965 | |
| Interest payable on long-term debt | | 381 | | | 412 | | | 112 | | | 26 | | | 931 | |
| Operating leases | | 7 | | | 9 | | | 6 | | | 4 | | | 26 | |
Purchase obligations(2) | | 16 | | | 5 | | | — | | | — | | | 21 | |
| Total contractual obligations | | $ | 8,142 | | | $ | 11,292 | | | $ | 4,416 | | | $ | 1,093 | | | $ | 24,943 | |
| | | | | | | | | | |
(1)Excludes debt issuance costs, unamortized discounts and fair value adjustments.
(2)Represents short-term contractual obligations made in the ordinary course of business for contracted services at December 31, 2020.
These contractual obligations do not include unused commitments for dealers and customers discussed in Note 117, respectively, of Notes to Consolidated Financial Statements.
We also have contractual obligations to suppliers and service providers primarily for software user licenses, extended technical support and data processing services. These obligations total $28 million, with $15 million due in the next 12 months.
CASH FLOWS
Operating cash flow for 2020 was $1.15$1.26 billion in 2022, compared with $1.21$1.19 billion for 2019.in 2021. Net cash provided by investing activities in 2020 was $1.06 billion, compared with net cash used for investing activities of $288was $172 million in 2019.2022, compared with $1.26 billion in 2021. The change was primarily due to lower additions to finance receivables and other portfolio related activity.activity and lower proceeds from disposals of equipment. Net cash used for financing activities was $2.48 billion$764 million in 2020,2022, compared with $991net cash provided of $257 million in 2019.2021. The change was primarily due to lower portfolio funding requirements partially offset by the Net change in variable lending from Caterpillar.related to Caterpillar purchased receivables.
CRITICAL ACCOUNTING ESTIMATES
The preparation of financial statements in conformity with generally accepted accounting principles ("U.S. GAAP" or "GAAP") requires management to make estimates and assumptions that affect reported amounts. Significant estimates include residual values for leasedamounts of assets, allowance for credit lossesliabilities, revenues and income taxes. We have incorporated many years of data into the determination of each ofexpenses. Changes in these estimates and weassumptions could have not historically experienceda significant adjustments. effect on the financial statements. Our critical accounting estimates, which require management assumptions and complex judgments, are summarized below.
We review theseour critical accounting estimates and assumptions at least annually with the Audit Committee of the Caterpillar Inc. Board of Directors. Following are the methods and assumptions used in determining our estimates and an indication of the risks inherent in each.
Residual values for leased assets
We determine the residual value of leased equipment based on its estimated end-of-term market value. We estimate the residual value of leased equipment at the inception of the lease based on a number of factors, including historical wholesale market sales prices, past remarketing experience and any known significant market/product trends. We also consider the following critical factors in our residual value estimates: lease term, market size and demand, total expected hours of usage, machine configuration, application, location, model changes, quantities, third-party residual guarantees and contractual customer purchase options.
Upon termination of the lease, the equipment is either purchased by the lessee or sold to a third party,third-party, in which case we may record a gain or a loss for the difference between the estimated residual value and the sale price.proceeds.
During the term of our leases, we monitor residual values. For operating leases, we record adjustments to depreciation expense reflecting changes in residual value estimates prospectively on a straight-line basis. For finance leases, we recognize residual value adjustments through a reduction of finance revenue over the remaining lease term.
We evaluate the carrying value of equipment on operating leases for potential impairment when we determine a triggering event has occurred. When a triggering event occurs, we perform a test for recoverability by comparing projected undiscounted future cash flows to the carrying value of the equipment on operating leases. If the test for recoverability identifies a possible impairment, we measure the fair value of the equipment on operating leases in accordance with the fair value measurement framework. We recognize an impairment charge for the amount by which the carrying value of the equipment on operating leases exceeds its estimated fair value.
At December 31, 2020,2022, the aggregate residual value of equipment on operating leases was $2.07$1.71 billion. Without consideration of other factors such as third-party residual guarantees or contractual customer purchase options, a 10 percent non-temporary decrease in the market value of our equipment subject to operating leases would reduce residual value estimates and result in the recognition of approximately $95$80 million of additional annual depreciation expense.
Allowance for credit losses
The allowance for credit losses is management’s estimate of expected losses over the life of our finance receivable portfolio calculated using loss forecast models that take into consideration historical credit loss experience, current economic conditions and forecasts and scenarios that capture country and industry-specific economic factors. In addition, we consider qualitative factors not able to be fully captured in our loss forecast models, including borrower-specific and company-specific factors. These qualitative factors are subjective and require a degree of management judgment.
We measure the allowance for credit losses on a collective (pool) basis when similar risk characteristics exist and on an individual basis when we determine that similar risk characteristics do not exist. We identify finance receivables for individual evaluation based on past-duepast due status and information available about the customer, such as financial statements, news reports and published credit ratings, as well as general information regarding industry trends and the economic environment in which our customers operate. The allowance for credit losses attributable to finance receivables that are individually evaluated is based on the present value of expected future cash flows discounted at the receivables'receivables’ effective interest rate, the fair value of the collateral for collateral-dependent receivables or the observable market price of the receivable. In determining collateral value, we estimate the current fair market value of the collateral less selling costs. We also consider credit enhancements such as additional collateral and contractual third-party guarantees.
While management believes it has exercised prudent judgment and applied reasonable assumptions, there can be no assurance that in the future, changes in economic conditions or other factors would not cause changes in the financial health of our customers. If the financial health of our customers deteriorates, the timing and level of payments received could be impacted and therefore, could result in a change to our estimated losses. Holding other variables constant, a 10 percent increase in estimated loss given default would result in an $18 million increase to the allowance for credit losses related to our customer finance receivables as of December 31, 2022. Holding other variables constant, a 10 percent increase in estimated probabilities of default would result in a $17 million increase to the allowance for credit losses related to our customer finance receivables as of December 31, 2022.
Income taxes
We are subject to the income tax laws of the many jurisdictions in which we operate. These tax laws are complex, and the manner in which they apply to our facts is sometimes open to interpretation. In establishing the provision for income taxes, we must make judgments about the application of these inherently complex tax laws. Our income tax positions and analysis are based on currently enacted tax law. Future changes in tax law or related interpretations could significantly impact the provision for income taxes, the amount of taxes payable, and the deferred tax asset and liability balances. Changes in tax law are reflected in the period of enactment with related interpretations considered in the period received.
Despite our belief that our tax return positions are consistent with applicable tax laws, we believe that taxing authorities could challenge certain positions. Settlement of any challenge can result in no change, a complete disallowance, or some partial adjustment reached through negotiations or litigation. We record tax benefits for uncertain tax positions based upon management'smanagement’s evaluation of the information available at the reporting date. To be recognized in the financial statements, a tax benefit must be at least more likely than not of being sustained based on technical merits. The benefit for positions meeting the recognition threshold is measured as the largest benefit more likely than not of being realized upon ultimate settlement with a taxing authority that has full knowledge of all relevant information. Significant judgment is required in making these determinations and adjustments to unrecognized tax benefits may be necessary to reflect actual taxes payable upon settlement. Adjustments related to positions impacting the effective tax rate affect the provision for income taxes. Adjustments related to positions impacting the timing of deductions impact deferred tax assets and liabilities.
Deferred tax assets generally represent tax benefits for tax deductions or credits available in future tax returns. Certain estimates and assumptions are required to determine whether it is more likely than not that all or some portion of the benefit of a deferred tax asset will not be realized. In making this assessment, management analyzes the trend of U.S. GAAP earnings and estimates the impact of future taxable income, reversing temporary differences and available prudent and feasible tax planning strategies. Should a change in facts or circumstances lead to a change in judgment about the ultimate realizability of a deferred tax asset, we record or adjust the related valuation allowance in the period that the change in facts and circumstances occurs, along with a corresponding increase or decrease in the provision for income taxes.
Income taxes are based on the statutory tax rate of the jurisdiction in which earnings are subject to taxation. That statutory rate may differ from the statutory rate of the jurisdiction in which that entity is incorporated. Taxes are paid in the jurisdictions where earnings are subject to taxation.
Additional information related to income taxes is included in Note 1211 in the Notes to Consolidated Financial Statements.
| | | | | |
| Item 7A. | Quantitative and Qualitative Disclosures About Market Risk. |
Our earnings and cash flow are subject to fluctuations due to changes in foreign currency exchange rates and interest rates. Our Risk Management Policy (policy) allows for the use of derivative financial instruments to prudently manage foreign currency exchange rate and interest rate exposures. Our policy specifies that derivatives are not to be used for speculative purposes.
Interest rate risk
Interest rate movements create a degree of risk by affecting the amount of interest receipts and payments on our interest paymentsfinance receivables and the value of our fixed-rate debt.debt portfolios. Our practice is to use interest rate contracts to manage our exposure to interest rate changes.
We have a match-funding policy that addresses interest rate risk by aligning the interest rate profile (fixed or floating rate and duration) of our debt portfolio with the interest rate profile of our finance receivablereceivables portfolio within predetermined ranges on an ongoing basis. In connection with that policy, we use interest rate derivative instruments to modify the debt structure to match assets within the finance receivablereceivables portfolio. This matched funding reduces the volatility of margins between interest-bearing assets and interest-bearing liabilities, regardless of which direction interest rates move.
In order to properly manage sensitivity to changes in interest rates, we measure the potential impact of different interest rate assumptions on pre-tax earnings. All on-balance sheet positions, including derivative financial instruments, are included in the analysis. The primary assumptions included in the analysis are that there are no new fixed rate assets or liabilities, the proportion of fixed rate debt to fixed rate assets remains unchanged and the level of floating rate assets and debt remain constant. We estimate a 100 basis point immediate and sustained adverse change in interest rates to have an $18a $12 million adverse impact on 2022 pre-tax earnings in both 2020 and 2019 based on these assumptions and the balance sheet analysis as of December 31, 20202022. Last year, similar assumptions and 2019.calculations yielded a potential $8 million adverse impact to 2021 pre-tax earnings.
This analysis does not necessarily represent our current outlook of future market interest rate movement, nor does it consider any actions management could undertake in response to changes in interest rates. Accordingly, no assurance can be given that actual results would be consistent with the results of our estimate.
Foreign currency exchange rate risk
We have balance sheet positions and expected future transactions denominated in foreign currencies, thereby creating exposure to movements in exchange rates. In managing foreign currency risk, our objective is to minimize earnings volatility resulting from conversion and the remeasurement of net foreign currency balance sheet positions and future transactions denominated in foreign currencies. Since ourOur policy allows the use of foreign currency forward, option and cross currency contracts to offset the risk of currency mismatch between our assets and liabilities and exchange rate risk associated with future transactions denominated in foreign currencies,currencies. As a result of this policy, the potential loss in fair value from such financial instruments from a 10 percent adverse change in the value of the U.S. dollar relative to all other currencies would not have a material effect on our consolidated financial position, profit or cash flow.be largely offset by changes in the values of the underlying hedged exposures. Neither our policy nor the effect of a 10 percent change in the value of the U.S. dollar has changed from that reported at the end of last year.
This analysis does not necessarily represent our current outlook for the U.S. dollar relative to all other currencies, nor does it consider any actions management could undertake in response to changes in the foreign currency markets. Accordingly, no assurance can be given that actual results would be consistent with the results of our estimate.
| | | | | |
| Item 8. | Financial Statements and Supplementary Data. |
Information required by Item 8 is included following the Report of Independent Registered Public Accounting Firm.
| | | | | |
| Item 9. | Changes in and Disagreements With Accountants on Accounting and Financial Disclosure. |
None.
| | | | | |
| Item 9A. | Controls and Procedures. |
Evaluation of Disclosure Controls and Procedures
An evaluation was performed under the supervision and with the participation of ourthe company’s management, including ourthe Chief Executive Officer (CEO) and our Chief Financial Officer (CFO), of the effectiveness of the design and operation of ourthe company's disclosure controls and procedures, as suchthat term is defined underin Rule 13a-15(e) under the Exchange Act, as of the Securities Exchange Actend of 1934, as amended, as of December 31, 2020.the period covered by this annual report. Based on that evaluation, ourthe CEO and CFO concluded that ourthe company’s disclosure controls and procedures were effective as of December 31, 2020.the end of the period covered by this annual report.
Management’s Report on Internal Control over Financial Reporting
The management of Cat Financial is responsible for establishing and maintaining adequate internal control over financial reporting, as such term is defined under Exchange Act Rule 13a-15(f). Our internal control over financial reporting is a process designed to provide reasonable assurance regarding the reliability of our financial reporting and the preparation of financial statements for external purposes in accordance with generally accepted accounting principles. Our internal control over financial reporting includes those policies and procedures that (i) pertain to the maintenance of records that, in reasonable detail, accurately and fairly reflect the transactions and dispositions of our assets; (ii) provide reasonable assurance that transactions are recorded as necessary to permit preparation of financial statements in accordance with generally accepted accounting principles, and that our receipts and expenditures are being made only in accordance with authorizations of our management and directors and (iii) provide reasonable assurance regarding prevention or timely detection of unauthorized acquisition, use or disposition of our assets that could have a material effect on the financial statements.
Because of its inherent limitations, internal control over financial reporting may not prevent or detect misstatements. Also, projections of any evaluation of effectiveness to future periods are subject to the risk that controls may become inadequate because of changes in conditions, or that the degree of compliance with the policies or procedures may deteriorate.
Management assessed the effectiveness of our internal control over financial reporting as of December 31, 2020.2022. In making this assessment, we used the criteria set forth by the Committee of Sponsoring Organizations of the Treadway Commission (COSO) in Internal Control - Integrated Framework (2013). Based on our assessment, we concluded that, as of December 31, 2020,2022, our internal control over financial reporting was effective based on those criteria.
The effectiveness of our internal control over financial reporting as of December 31, 20202022 has been audited by PricewaterhouseCoopers LLP, an independent registered public accounting firm, as stated in their report which appears herein.
Changes in Internal Control over Financial Reporting
There haveDuring the last fiscal quarter, there has been no changessignificant change in the Company'scompany’s internal control over financial reporting during the fourth quarter of 2020 covered by this Annual Report on Form 10-K that has materially affected, or areis reasonably likely to materially affect, the Company’scompany’s internal control over financial reporting.
| | | | | |
| Item 9B. | Other Information. |
None.Disclosures Required Pursuant to Section 13(r) of the Securities Exchange Act of 1934
During the three months ended March 31, 2022, Caterpillar Eurasia LLC, one of our affiliates, engaged in limited transactions or dealings with the Federal Security Service of Russia (the “FSB”). Specifically, Caterpillar Eurasia LLC, from time to time, directly or indirectly, makes required submissions to and receives regulatory authorizations from the FSB related to the importation of software used in the on-board telematics and control systems of Caterpillar machines that are imported into Russia. Caterpillar Eurasia LLC did not generate any net revenue or net profits from such approval activity and does not make any sales to or have other dealings with the FSB. Caterpillar Eurasia LLC plans to continue these activities as long as it remains lawful to do so.
| | | | | |
| Item 9C. | Disclosure Regarding Foreign Jurisdictions that Prevent Inspections. |
Not applicable.
| | | | | |
| Item 14. | Principal Accounting Fees and Services. |
Our independent registered public accounting firm is PricewaterhouseCoopers LLP, Nashville, Tennessee, Auditor Firm ID: 238.
As a wholly-owned subsidiary of Caterpillar, our principal accounting fees and services are subject to Caterpillar’s Audit Committee pre-approval as described in its Annual Meeting Proxy Statement, which is available on Caterpillar’s website (www.caterpillar.com), under Investors, Financial Information, Proxy Statement.
Fees for professional services provided by our independent auditor included the following:
| | (Millions of dollars) | (Millions of dollars) | | 2020 | | 2019 | (Millions of dollars) | | 2022 | | 2021 |
Audit fees(1) | Audit fees(1) | | $ | 7.2 | | | $ | 6.8 | | Audit fees(1) | | $ | 7.0 | | | $ | 7.4 | |
Audit-related fees(2) | Audit-related fees(2) | | 0.9 | | 0.5 | Audit-related fees(2) | | — | | | — | |
Tax fees(3) | Tax fees(3) | | — | | | — | | Tax fees(3) | | 0.1 | | 0.1 |
| Total | Total | | $ | 8.1 | | | $ | 7.3 | | Total | | $ | 7.1 | | | $ | 7.5 | |
|
(1) "“Audit fees"fees” principally includes audit and review of financial statements (including internal control over financial reporting), statutory and subsidiary audits, SEC registration statements, comfort letters and consents.
(2) "“Audit-related fees"fees” principally includes attestation services requested by management, accounting consultations and pre- or post- implementation reviews of processes or systems.
(3) "“Tax fees"fees” includes fees related to tax compliance, tax advice and tax planning.
| | | | | |
| Item 15. | Exhibits and Financial Statement Schedules. |
| | | | | | | | | | | | | | | | |
| | The following documents are filed as part of this report. |
| | 1 | | | Financial Statements: |
| | | | · | | Report of Independent Registered Public Accounting Firm |
| | | | · | | Consolidated Statements of Profit |
| | | | · | | Consolidated Statements of Comprehensive Income |
| | | | · | | Consolidated Statements of Financial Position |
| | | | · | | Consolidated Statements of Changes in Shareholder’s Equity |
| | | | · | | Consolidated Statements of Cash Flows |
| | | | · | | Notes to Consolidated Financial Statements |
| | 2 | | Financial Statement Schedules: |
| | | | · | | All schedules are omitted because the required information is shown in the financial statements or the notes thereto or considered to be immaterial. |
| | |
| | 3 | | ExhibitsExhibits: |
| | | | | |
| 3.1 | Certificate of Incorporation of the Company, as amended (incorporated by reference from Exhibit 3.1 to the Company’s Form 10 for the year ended December 31, 1984). |
| |
| 3.2 | |
| |
| 4.1 | Indenture, dated as of April 15, 1985, between the Company and Morgan Guaranty Trust Company of New York, as Trustee (incorporated by reference from Exhibit 4.1 to the Company’s Registration Statement on Form S-3). |
| |
| 4.2 | First Supplemental Indenture, dated as of May 22, 1986, amending the Indenture dated as of April 15, 1985, between the Company and Morgan Guaranty Trust Company of New York, as Trustee (incorporated by reference from Exhibit 4.1 to the Company’s Quarterly Report on Form 10-Q, for the quarter ended June 20, 1986). |
| |
| 4.3 | Second Supplemental Indenture, dated as of March 15, 1987, amending the Indenture dated as of April 15, 1985, between the Company and Morgan Guaranty Trust Company of New York, as Trustee (incorporated by reference from Exhibit 4.3 to the Company’s Current Report on Form 8-K, dated April 24, 1987). |
| |
| | | | | |
| 4.4 | Third Supplemental Indenture, dated as of October 2, 1989, amending the Indenture dated as of April 15, 1985, between the Company and Morgan Guaranty Trust Company of New York, as Trustee (incorporated by reference from Exhibit 4.3 to the Company’s Current Report on Form 8-K, dated October 16, 1989). |
| | | | | |
| 4.5 | Fourth Supplemental Indenture, dated as of October 1, 1990, amending the Indenture dated April 15, 1985, between the Company and Morgan Guaranty Trust Company of New York, as Trustee (incorporated by reference from Exhibit 4.3 to the Company’s Current Report on Form 8-K, dated October 29, 1990). |
| |
| 4.6 | Indenture, dated as of July 15, 1991, between the Company and Continental Bank, National Association, as Trustee (incorporated by reference from Exhibit 4.1 to the Company'sCompany’s Current Report on Form 8-K, dated July 25, 1991). |
| |
| 4.7 | |
| |
| 4.8 | Support Agreement, dated as of December 21, 1984, between the Company and Caterpillar (incorporated by reference from Exhibit 10.2 to the Company’s amended Form 10, for the year ended December 31, 1984). |
| |
| 4.9 | |
| |
| 4.10 | |
| |
| The registrant hereby undertakes upon request to furnish the Commission with a copy of any instrument with respect to long-term debt where the total amount of securities authorized thereunder does not exceed 10% of the total assets of the registrant and its subsidiaries on a consolidated basis. |
| |
| 10.1 | |
| |
| 10.2 | Credit Agreement (2020(2022 364-Day Facility), dated as as of September 3, 2020, 1, 2022, by and among Caterpillar Inc., the Company Caterpillar,, Caterpillar International Finance Designated Activity Company and Caterpillar Finance Kabushiki Kaisha, certain financial institutions named therein, Citibank, N.A., as Agent,agent, Citibank Europe plc, UK Branch, as Local Currency Agent, and MUFG Bank, Ltd., as Japan Local Currency Agent (incorporated by reference from Exhibit 10.1 to the Company’sCompany's Current Report on Form 8-K filed on September 8, 2020).6, 2022) |
| |
| 10.3 | Local Currency Addendumto the Credit Agreement (2020(2022 364-Day Facility), dated as of September 31, 20202202, among the Company, Caterpillar International Finance Designated Activity Company, the Local Currency Banks named therein, Citibank, N.A., as Agent and Citibank Europe plc, UK Branch, as Local Currency Agent (incorporated by reference from Exhibit 10.2 to the Company's Current Report on Form 8-K filed on September 86, 20202202). |
| |
| 10.4 | Japan Local Currency Addendum to the Credit Agreement (2020 364-Day(2022 364-Day Facility), dated as of September 3, 2020,1, 2022, among the Company, Caterpillar Finance Kabushiki Kaisha, the Japan Local Currency Banks named therein, Citibank, N.A., as Agent and MUFG Bank, Ltd., as Local Currency Agent (incorporated by reference from Exhibit 10.310.3 to the Company'sCompany’s Current Report on Form 8-K filed on September 8, 2020).6, 2022) |
| |
| 10.5 | SecondThird Amended and Restated Credit Agreement (Three-Year Facility), dated as of September 5, 2019,1, 2022, by and among the Company, Caterpillar Inc., Caterpillar International Finance Designated Activity Company and Caterpillar Finance Kabushiki Kaisha, certain financial institutions named therein, Citibank, N.A., as Agent, Citibank Europe plc, UK Branch, as Local Currency Agent, and MUFG Bank, Ltd., as Japan Local Currency Agent (incorporated by reference from Exhibit 10.4 to the Company’s Current Report on Form 8-K filed September 10, 2019).6, 2022) |
| |
| 10.6 | Local Currency Addendum to the SecondThird Amended and Restated Credit Agreement (Three-Year Facility), dated as of September 5, 2019,1, 2022, among the Company, Caterpillar International Finance Designated Activity Company, the Local Currency Banks named therein, Citibank, N.A., as Agent and Citibank Europe plc, UK Branch, as Local Currency Agent (incorporated by reference from Exhibit 10.5 to the Company'sCompany’s Current Report on Form 8-K filed on September 10, 2019).January 6, 2022) |
| |
| 10.7 | Japan Local Currency Addendum to the SecondThird Amended and Restated Credit Agreement (Three-Year Facility), dated as of September 5, 2019,1, 2022, among the Company, Caterpillar Finance Kabushiki Kaisha, the Japan Local Currency Banks named therein, Citibank, N.A., as Agent and MUFG Bank, Ltd., as Local Currency Agent (incorporated by reference from Exhibit 10.6 to the Company'sCompany’s Current Report on Form 8-K filed on September 10, 2019).6, 2022) |
| |
| | | | | |
| 10.8 | Second Third Amended and Restated Credit Agreement (Five-Year Facility), dated as of September 5, 2019,1, 2022, by and among the Company, Caterpillar Inc., Caterpillar International Finance Designated Activity Company and Caterpillar Finance Kabushiki Kaisha, certain financial institutions named therein, Citibank, N.A., as Agent, Citibank Europe plc, UK Branch, as Local Currency Agent, and MUFG Bank, Ltd., as Japan Local Currency Agent (incorporated by reference from Exhibit 10.7 to the Company’s Current Report on Form 8-K filed September 10, 2019).6, 2022) |
| |
| 10.9 | Local Currency Addendum to the SecondThird Amended and Restated Credit Agreement (Five-Year(Five-Year Facility), dated as of September 5, 2019,1, 2022, among the Company, Caterpillar International Finance Designated Activity Company, the Local Currency Banks named therein, Citibank, N.A., as Agent and Citibank Europe plc, UK Branch, as Local Currency Agent (incorporated by reference from Exhibit 10.8 10.8 to the Company'sCompany’s Current Report on Form 8-K filed on September 10, 2019).January 6, 2022) |
| |
| 10.10 | Japan Local Currency Addendum to the SecondThird Amended and Restated Credit Agreement (Five-Year(Five-Year Facility), dated as of September 5, 2019,1, 2022, among the Company, Caterpillar Finance Kabushiki Kaisha, the Japan Local Currency Banks named therein, Citibank, N.A., as Agent and MUFG Bank, Ltd., as Local Currency Agent (incorporated by reference from Exhibit 10.910.9 to the Company'sCompany’s Current Report on Form 8-K filed on September 10, 2019).6, 2022) |
| |
| 23 | |
| | | | | |
| 31.1 | |
| |
| 31.2 | |
| |
| 32 | |
| |
| 101.INS | Inline XBRL Instance Document (the instance document does not appear in the Interactive Data File because its XBRL tags are embedded within the Inline XBRL document) |
| |
| 101.SCH | Inline XBRL Taxonomy Extension Schema Document |
| |
| 101.CAL | Inline XBRL Taxonomy Extension Calculation Linkbase Document |
| |
| 101.DEF | Inline XBRL Taxonomy Extension Definition Linkbase Document |
| |
| 101.LAB | Inline XBRL Taxonomy Extension Label Linkbase Document |
| |
| 101.PRE | Inline XBRL Taxonomy Extension Presentation Linkbase Document |
| |
| 104 | Cover Page Interactive File (embedded within the Inline XBRL document and included in Exhibit 101) |
| | | | | |
| Item 16. | Form 10-K Summary |
Not applicable.
SIGNATURES
Pursuant to the requirements of Section 13 or 15(d) of the Securities Exchange Act of 1934, the Registrant has duly caused this report to be signed on its behalf by the undersigned, thereunto duly authorized.
| | | | | | | | | | | | | | |
| | | Caterpillar Financial Services Corporation | |
| | | | |
Date: | February 17, 202115, 2023 | | /s/Jennifer K. Schott James M, Rooney | |
| | | Jennifer K. Schott,James M. Rooney, Secretary |
| | | | |
Pursuant to the requirements of the Securities Exchange Act of 1934, this report has been signed below by the following persons on behalf of the Registrant and in the capacities and on the dates indicated.
| | | | | | | | | | | | | | |
Date | | Signature | | Title |
| | | | |
February 17, 202115, 2023 | | /s/David T. Walton | | President, Director and Chief
Executive Officer |
| | David T. Walton | | |
| | | | |
February 17, 202115, 2023 | | /s/Andrew R.J. Bonfield | | Director |
| | Andrew R.J. Bonfield | | |
| | | | |
February 17, 202115, 2023 | | /s/Patrick T. McCartan Kristen R. Covey | | Executive Vice President and
Chief Financial Officer
(Principal Financial Officer) |
| | Patrick T. McCartanKristen R. Covey | | |
| | | | |
February 17, 202115, 2023 | | /s/Jeffry D. Everett Sumeet Puri | | Controller
(Principal Accounting Officer) |
| | Jeffry D. EverettSumeet Puri | | |
| | | | |
REPORT OF INDEPENDENT REGISTERED PUBLIC ACCOUNTING FIRM
To the Board of Directors and Shareholder of Caterpillar Financial Services Corporation
Opinions on the Financial Statements and Internal Control over Financial Reporting
We have audited the accompanying consolidated statements of financial position of Caterpillar Financial Services Corporation and its subsidiaries (the “Company”) as of December 31, 20202022 and 2019,2021, and the related consolidated statements of profit, comprehensive income, changes in shareholder’s equity and cash flows for each of the three years in the period ended December 31, 2020,2022, including the related notes (collectively referred to as the “consolidated financial statements”). We also have audited the Company's internal control over financial reporting as of December 31, 2020,2022, based on criteria established in Internal Control - Integrated Framework (2013) issued by the Committee of Sponsoring Organizations of the Treadway Commission (COSO).
In our opinion, the consolidated financial statements referred to above present fairly, in all material respects, the financial position of the Company as of December 31, 20202022 and 2019,2021, and the results of its operations and its cash flows for each of the three years in the period ended December 31, 20202022 in conformity with accounting principles generally accepted in the United States of America. Also in our opinion, the Company maintained, in all material respects, effective internal control over financial reporting as of December 31, 2020,2022, based on criteria established in Internal Control - Integrated Framework (2013) issued by the COSO.
Change in Accounting Principle
As discusseddisclosed in Note 1 to the consolidated financial statements of changes in shareholder's equity, the Company changed the manner in which it accounts for credit losses in 2020.
Basis for Opinions
The Company's management is responsible for these consolidated financial statements, for maintaining effective internal control over financial reporting, and for its assessment of the effectiveness of internal control over financial reporting, included in Management’s Report on Internal Control over Financial Reporting appearing under Item 9A. Our responsibility is to express opinions on the Company’s consolidated financial statements and on the Company's internal control over financial reporting based on our audits. We are a public accounting firm registered with the Public Company Accounting Oversight Board (United States) (PCAOB) and are required to be independent with respect to the Company in accordance with the U.S. federal securities laws and the applicable rules and regulations of the Securities and Exchange Commission and the PCAOB.
We conducted our audits in accordance with the standards of the PCAOB. Those standards require that we plan and perform the audits to obtain reasonable assurance about whether the consolidated financial statements are free of material misstatement, whether due to error or fraud, and whether effective internal control over financial reporting was maintained in all material respects.
Our audits of the consolidated financial statements included performing procedures to assess the risks of material misstatement of the consolidated financial statements, whether due to error or fraud, and performing procedures that respond to those risks. Such procedures included examining, on a test basis, evidence regarding the amounts and disclosures in the consolidated financial statements. Our audits also included evaluating the accounting principles used and significant estimates made by management, as well as evaluating the overall presentation of the consolidated financial statements. Our audit of internal control over financial reporting included obtaining an understanding of internal control over financial reporting, assessing the risk that a material weakness exists, and testing and evaluating the design and operating effectiveness of internal control based on the assessed risk. Our audits also included performing such other procedures as we considered necessary in the circumstances. We believe that our audits provide a reasonable basis for our opinions.
Definition and Limitations of Internal Control over Financial Reporting
A company’s internal control over financial reporting is a process designed to provide reasonable assurance regarding the reliability of financial reporting and the preparation of financial statements for external purposes in accordance with generally accepted accounting principles. A company’s internal control over financial reporting includes those policies and procedures that (i) pertain to the maintenance of records that, in reasonable detail, accurately and fairly reflect the transactions and dispositions of the assets of the company; (ii) provide reasonable assurance that transactions are recorded as necessary to permit preparation of financial statements in accordance with generally accepted accounting principles, and that receipts and
expenditures of the company are being made only in accordance with authorizations of management and directors of the company; and (iii) provide reasonable assurance regarding prevention or timely detection of unauthorized acquisition, use, or disposition of the company’s assets that could have a material effect on the financial statements.
Because of its inherent limitations, internal control over financial reporting may not prevent or detect misstatements. Also, projections of any evaluation of effectiveness to future periods are subject to the risk that controls may become inadequate because of changes in conditions, or that the degree of compliance with the policies or procedures may deteriorate.
Critical Audit Matters
The critical audit matter communicated below is a matter arising from the current period audit of the consolidated financial statements that was communicated or required to be communicated to the audit committee and that (i) relates to accounts or disclosures that are material to the consolidated financial statements and (ii) involved our especially challenging, subjective, or complex judgments. The communication of critical audit matters does not alter in any way our opinion on the consolidated financial statements, taken as a whole, and we are not, by communicating the critical audit matter below, providing a separate opinion on the critical audit matter or on the accounts or disclosures to which it relates.
Customer Finance Receivables Allowance for Credit Losses
As described in Notes 1 and 2 to the consolidated financial statements, as of December 31, 2020,2022, the collectively evaluated customer finance receivables allowance for credit losses was $244makes up a significant portion of total customer finance receivable allowance for credit losses of $277 million. As disclosed by management, the allowance for credit losses is management’s estimate of expected credit losses over the life of the customer finance receivables portfolio measured on a collective (pool) basis calculated using loss forecast models utilizing probabilities of default and management’s estimated loss given default based on past loss experience adjusted for current economic conditions and reasonable and supportable forecasts and scenarios capturing country and industry-specific economic factors. In addition, qualitative factors not able to be fully captured in management’s loss forecast models, including borrower-specific and company-specific factors, are considered in the evaluation of the adequacy of management’s allowance for credit losses.
The principal considerations for our determination that performing procedures relating to the customer finance receivables allowance for credit losses is a critical audit matter are the significant judgment by management in determining the probabilities of default adjusted for country and industry-specific economic factors utilized in their models and associated qualitative factors;models; this in turn led to a high degree of auditor judgment, subjectivity and effort in performing audit procedures and evaluating audit evidence related to probabilities of default adjusted for country and industry-specific economic factors, and qualitative factors, and the audit effort involved the use of professionals with specialized skill and knowledge.
Addressing the matter involved performing procedures and evaluating audit evidence in connection with forming our overall opinion on the consolidated financial statements. These procedures included testing the effectiveness of controls relating to the determination of the allowance for credit losses, including controls relating to management’s consideration of probabilities of default and country and industry-specific economic factors and qualitative factors. These procedures also included, among others, (i) testing management’s process for determining the allowance for credit losses estimate, (ii) testing the data used by management, including underlying customer finance receivable data and country and industry-specific economic factors, and (iii) involving professionals with specialized skill and knowledge to assist in evaluating the appropriateness of the models used in the allowance for credit losses, the reasonableness of probabilities of default assumptions, and the selection of country and industry-specific economic factors, and qualitative factors.
/s/PricewaterhouseCoopers LLP
Nashville, Tennessee
February 17, 202115, 2023
We have served as the Company’s auditor since 1984.
Caterpillar Financial Services Corporation
CONSOLIDATED STATEMENTS OF PROFIT
For the Years Ended December 31,
(Dollars in Millions)
| | | | | | | | | | | | | | | | | | | | |
| | | 2020 | | 2019 | | 2018 |
| Revenues: | | | | | | |
| Retail finance | | $ | 1,249 | | | $ | 1,369 | | | $ | 1,308 | |
| Operating lease | | 965 | | | 1,037 | | | 1,011 | |
| Wholesale finance | | 336 | | | 491 | | | 415 | |
| Other, net | | 0 | | | 69 | | | 113 | |
| Total revenues | | 2,550 | | | 2,966 | | | 2,847 | |
| | | | | | |
| Expenses: | | | | | | |
| Interest | | 591 | | | 787 | | | 757 | |
| Depreciation on equipment leased to others | | 758 | | | 813 | | | 819 | |
| General, operating and administrative | | 433 | | | 516 | | | 423 | |
| Provision for credit losses | | 266 | | | 162 | | | 354 | |
| Other | | 43 | | | 36 | | | 38 | |
| Total expenses | | 2,091 | | | 2,314 | | | 2,391 | |
| | | | | | |
| Other income (expense) | | (25) | | | (24) | | | (23) | |
| | | | | | |
| Profit before income taxes | | 434 | | | 628 | | | 433 | |
| | | | | | |
| Provision for income taxes | | 126 | | | 196 | | | 108 | |
| | | | | | |
| Profit of consolidated companies | | 308 | | | 432 | | | 325 | |
| | | | | | |
| Less: Profit attributable to noncontrolling interests | | 15 | | | 22 | | | 20 | |
| | | | | | |
Profit(1) | | $ | 293 | | | $ | 410 | | | $ | 305 | |
| | | | | | |
| | | | | | |
(1) Profit attributable to Caterpillar Financial Services Corporation.
| | | | | | | | | | | | | | | | | | | | |
| | | 2022 | | 2021 | | 2020 |
| Revenues: | | | | | | |
| Retail finance | | $ | 1,229 | | | $ | 1,197 | | | $ | 1,249 | |
| Operating lease | | 888 | | | 942 | | | 965 | |
| Wholesale finance | | 441 | | | 314 | | | 336 | |
| Other, net | | 176 | | | 109 | | | — | |
| Total revenues | | 2,734 | | | 2,562 | | | 2,550 | |
| | | | | | |
| Expenses: | | | | | | |
| Interest | | 566 | | | 455 | | | 591 | |
| Depreciation on equipment leased to others | | 718 | | | 755 | | | 758 | |
| General, operating and administrative | | 531 | | | 528 | | | 433 | |
| Provision for credit losses | | 81 | | | 70 | | | 266 | |
| Other | | 24 | | | 36 | | | 43 | |
| Total expenses | | 1,920 | | | 1,844 | | | 2,091 | |
| | | | | | |
| Other income (expense) | | (83) | | | (23) | | | (25) | |
| | | | | | |
| Profit before income taxes | | 731 | | | 695 | | | 434 | |
| | | | | | |
| Provision for income taxes | | 189 | | | 178 | | | 126 | |
| | | | | | |
| Profit of consolidated companies | | 542 | | | 517 | | | 308 | |
| | | | | | |
| Less: Profit attributable to noncontrolling interests | | 7 | | | 12 | | | 15 | |
| | | | | | |
| Profit attributable to Caterpillar Financial Services Corporation | | $ | 535 | | | $ | 505 | | | $ | 293 | |
| | | | | | |
See Notes to Consolidated Financial Statements.
Caterpillar Financial Services Corporation
CONSOLIDATED STATEMENTS OF COMPREHENSIVE INCOME
For the Years Ended December 31,
(Dollars in Millions)
| | | 2020 | | 2019 | | 2018 | | 2022 | | 2021 | | 2020 |
| | Profit of consolidated companies | Profit of consolidated companies | | $ | 308 | | | $ | 432 | | | $ | 325 | | Profit of consolidated companies | | $ | 542 | | | $ | 517 | | | $ | 308 | |
| | Other comprehensive income (loss), net of tax (Note 10): | | |
| Other comprehensive income (loss), net of tax (Note 9): | | Other comprehensive income (loss), net of tax (Note 9): | |
| Foreign currency translation | Foreign currency translation | | 236 | | | 11 | | | (309) | | Foreign currency translation | | (318) | | | (209) | | | 236 | |
| Derivative financial instruments | Derivative financial instruments | | 24 | | | (31) | | | (31) | | Derivative financial instruments | | 33 | | | 32 | | | 24 | |
| | Total Other comprehensive income (loss), net of tax | Total Other comprehensive income (loss), net of tax | | 260 | | | (20) | | | (340) | | Total Other comprehensive income (loss), net of tax | | (285) | | | (177) | | | 260 | |
| | Comprehensive income (loss) | Comprehensive income (loss) | | 568 | | | 412 | | | (15) | | Comprehensive income (loss) | | 257 | | | 340 | | | 568 | |
| | Less: Comprehensive income (loss) attributable to the noncontrolling interests | | 25 | | | 19 | | | 13 | | |
| Less: Comprehensive income (loss) attributable to noncontrolling interests | | Less: Comprehensive income (loss) attributable to noncontrolling interests | | (5) | | | 14 | | | 25 | |
| Comprehensive income (loss) attributable to Caterpillar Financial Services
Corporation | Comprehensive income (loss) attributable to Caterpillar Financial Services
Corporation | | $ | 543 | | | $ | 393 | | | $ | (28) | | Comprehensive income (loss) attributable to Caterpillar Financial Services
Corporation | | $ | 262 | | | $ | 326 | | | $ | 543 | |
|
See Notes to Consolidated Financial Statements.
Caterpillar Financial Services Corporation
CONSOLIDATED STATEMENTS OF FINANCIAL POSITION
At December 31,
(Dollars in Millions, except share data)
| | | | | 2020 | | 2019 | | | | 2022 | | 2021 | |
| Assets: | Assets: | | | | | | Assets: | | | | | |
| Cash and cash equivalents | Cash and cash equivalents | | $ | 411 | | | $ | 690 | | | Cash and cash equivalents | | $ | 868 | | | $ | 610 | | |
| Finance receivables, net of Allowance for credit losses of $479 and $424 | | 26,575 | | | 27,832 | | | |
| Finance receivables, net of Allowance for credit losses of $346 and $337 | | Finance receivables, net of Allowance for credit losses of $346 and $337 | | 26,441 | | | 27,177 | | |
| Notes receivable from Caterpillar | Notes receivable from Caterpillar | | 356 | | | 296 | | | Notes receivable from Caterpillar | | 482 | | | 389 | | |
| Equipment on operating leases, net | Equipment on operating leases, net | | 3,366 | | | 3,583 | | | Equipment on operating leases, net | | 2,911 | | | 3,123 | | |
| | Other assets | Other assets | | 1,283 | | | 1,292 | | | Other assets | | 1,255 | | | 1,088 | | |
| Total assets | Total assets | | $ | 31,991 | | | $ | 33,693 | | | Total assets | | $ | 31,957 | | | $ | 32,387 | | |
| | Liabilities and shareholder’s equity: | Liabilities and shareholder’s equity: | | | | | | Liabilities and shareholder’s equity: | | | | | |
| Payable to dealers and others | Payable to dealers and others | | $ | 144 | | | $ | 135 | | | Payable to dealers and others | | $ | 163 | | | $ | 163 | | |
| Payable to Caterpillar – borrowings and other | Payable to Caterpillar – borrowings and other | | 1,087 | | | 693 | | | Payable to Caterpillar – borrowings and other | | 124 | | | 95 | | |
| Accrued expenses | Accrued expenses | | 400 | | | 241 | | | Accrued expenses | | 380 | | | 233 | | |
| | Short-term borrowings | Short-term borrowings | | 2,005 | | | 5,161 | | | Short-term borrowings | | 5,954 | | | 5,395 | | |
| Current maturities of long-term debt | Current maturities of long-term debt | | 7,729 | | | 6,194 | | | Current maturities of long-term debt | | 5,202 | | | 6,307 | | |
| Long-term debt | Long-term debt | | 16,250 | | | 17,140 | | | Long-term debt | | 16,216 | | | 16,287 | | |
| Other liabilities | Other liabilities | | 885 | | | 893 | | | Other liabilities | | 955 | | | 926 | | |
| Total liabilities | Total liabilities | | 28,500 | | | 30,457 | | | Total liabilities | | 28,994 | | | 29,406 | | |
| | Commitments and contingent liabilities (Note 11) | | 0 | | 0 | | |
| Commitments and contingent liabilities (Note 10) | | Commitments and contingent liabilities (Note 10) | | |
| | Common stock - $1 par value | Common stock - $1 par value | | | | | | Common stock - $1 par value | | | | | |
| Authorized: 2,000 shares; Issued and | Authorized: 2,000 shares; Issued and | | | | | | Authorized: 2,000 shares; Issued and | | | | | |
| outstanding: 1 share (at paid-in amount) | | 745 | | | 745 | | | |
| outstanding: one share (at paid-in amount) | | outstanding: one share (at paid-in amount) | | 745 | | | 745 | | |
| Additional paid-in capital | Additional paid-in capital | | 2 | | | 2 | | | Additional paid-in capital | | 2 | | | 2 | | |
| Retained earnings | Retained earnings | | 3,142 | | | 3,162 | | | Retained earnings | | 3,057 | | | 2,797 | | |
| Accumulated other comprehensive income (loss) | Accumulated other comprehensive income (loss) | | (595) | | | (845) | | | Accumulated other comprehensive income (loss) | | (1,047) | | | (774) | | |
| Noncontrolling interests | Noncontrolling interests | | 197 | | | 172 | | | Noncontrolling interests | | 206 | | | 211 | | |
| Total shareholder’s equity | Total shareholder’s equity | | 3,491 | | | 3,236 | | | Total shareholder’s equity | | 2,963 | | | 2,981 | | |
| | Total liabilities and shareholder’s equity | Total liabilities and shareholder’s equity | | $ | 31,991 | | | $ | 33,693 | | | Total liabilities and shareholder’s equity | | $ | 31,957 | | | $ | 32,387 | | |
|
See Notes to Consolidated Financial Statements.
Caterpillar Financial Services Corporation
CONSOLIDATED STATEMENTS OF CHANGES IN SHAREHOLDER’S EQUITY
For the Years Ended December 31,
(Dollars in Millions)
| | | | | Common
stock | | Additional
paid-in
capital | | Retained
earnings | | Accumulated
other
comprehensive
income (loss) | | Noncontrolling
interests | | Total | | | Common
stock | | Additional
paid-in
capital | | Retained
earnings | | Accumulated
other
comprehensive
income (loss) | | Noncontrolling
interests | | Total |
| Balance at December 31, 2017 | | $ | 745 | | | $ | 2 | | | $ | 2,969 | | | $ | (592) | | | $ | 140 | | | $ | 3,264 | | |
| Profit of consolidated companies | | | | | | 305 | | | | | 20 | | | 325 | | |
| Dividend paid to Caterpillar | | | | | | (400) | | | | | | | (400) | | |
| Foreign currency translation, net of tax | | | | | | | | (302) | | | (7) | | | (309) | | |
| Derivative financial instruments, net of tax | | | | | | | | (31) | | | (31) | | |
| | Balance at December 31, 2018 | | $ | 745 | | | $ | 2 | | | $ | 2,874 | | | $ | (925) | | | $ | 153 | | | $ | 2,849 | | |
| Balance at December 31, 2019 | | Balance at December 31, 2019 | | $ | 745 | | | $ | 2 | | | $ | 3,162 | | | $ | (845) | | | $ | 172 | | | $ | 3,236 | |
| Profit of consolidated companies | Profit of consolidated companies | | | | | | 410 | | | | | 22 | | | 432 | | Profit of consolidated companies | | | | | | 293 | | | | | 15 | | | 308 | |
| Dividend paid to Caterpillar | Dividend paid to Caterpillar | | | | | | (25) | | | | | | | (25) | | Dividend paid to Caterpillar | | | | | | (300) | | | | | | | (300) | |
| Foreign currency translation, net of tax | Foreign currency translation, net of tax | | | | | | | | 14 | | | (3) | | | 11 | | Foreign currency translation, net of tax | | | | | | | | 226 | | | 10 | | | 236 | |
| Derivative financial instruments, net of tax | Derivative financial instruments, net of tax | | | | | | | | (31) | | | | | (31) | | Derivative financial instruments, net of tax | | | | | | | | 24 | | | 24 | |
Adjustment to adopt new accounting guidance(1) | Adjustment to adopt new accounting guidance(1) | | (97) | | | 97 | | | 0 | | Adjustment to adopt new accounting guidance(1) | | (13) | | | (13) | |
| | Balance at December 31, 2019 | | $ | 745 | | | $ | 2 | | | $ | 3,162 | | | $ | (845) | | | $ | 172 | | | $ | 3,236 | | |
| Balance at December 31, 2020 | | Balance at December 31, 2020 | | $ | 745 | | | $ | 2 | | | $ | 3,142 | | | $ | (595) | | | $ | 197 | | | $ | 3,491 | |
| Profit of consolidated companies | Profit of consolidated companies | | | | | | 293 | | | | | 15 | | | 308 | | Profit of consolidated companies | | | | | | 505 | | | | | 12 | | | 517 | |
| Dividend paid to Caterpillar | Dividend paid to Caterpillar | | | | | | (300) | | | (300) | | Dividend paid to Caterpillar | | | | | | (850) | | | | | | | (850) | |
| Foreign currency translation, net of tax | Foreign currency translation, net of tax | | | | | | 226 | | | 10 | | | 236 | | Foreign currency translation, net of tax | | | | | | | | (211) | | | 2 | | | (209) | |
| Derivative financial instruments, net of tax | Derivative financial instruments, net of tax | | | | | | | | 24 | | | 24 | | Derivative financial instruments, net of tax | | | | | | | | 32 | | | | | 32 | |
Adjustment to adopt new accounting guidance(2) | | (13) | | | (13) | | |
| Balance at December 31, 2020 | | $ | 745 | | | $ | 2 | | | $ | 3,142 | | | $ | (595) | | | $ | 197 | | | $ | 3,491 | | |
| | | Balance at December 31, 2021 | | Balance at December 31, 2021 | | $ | 745 | | | $ | 2 | | | $ | 2,797 | | | $ | (774) | | | $ | 211 | | | $ | 2,981 | |
| Profit of consolidated companies | | Profit of consolidated companies | | | | | | 535 | | | | | 7 | | | 542 | |
| Dividend paid to Caterpillar | | Dividend paid to Caterpillar | | | | | | (275) | | | (275) | |
| Foreign currency translation, net of tax | | Foreign currency translation, net of tax | | | | | | (306) | | | (12) | | | (318) | |
| Derivative financial instruments, net of tax | | Derivative financial instruments, net of tax | | | | | | | | 33 | | | 33 | |
| | Balance at December 31, 2022 | | Balance at December 31, 2022 | | $ | 745 | | | $ | 2 | | | $ | 3,057 | | | $ | (1,047) | | | $ | 206 | | | $ | 2,963 | |
|
(1) Adjustment to adopt new accounting guidance related to reclassification of certain tax effects from accumulated other comprehensive income (loss).credit losses.
(2) Adjustment to adopt new accounting guidance related to credit losses (See Note 1).
See Notes to Consolidated Financial Statements.
Caterpillar Financial Services Corporation
CONSOLIDATED STATEMENTS OF CASH FLOWS
For the Years Ended December 31,
(Dollars in Millions)
| | | | | 2020 | | 2019 | | 2018 | | | 2022 | | 2021 | | 2020 |
| Cash flows from operating activities: | Cash flows from operating activities: | | | | | | | Cash flows from operating activities: | | | | | | |
| Profit of consolidated companies | Profit of consolidated companies | | $ | 308 | | | $ | 432 | | | $ | 325 | | Profit of consolidated companies | | $ | 542 | | | $ | 517 | | | $ | 308 | |
| Adjustments for non-cash items: | Adjustments for non-cash items: | | | | | | | Adjustments for non-cash items: | | | | | | |
| Depreciation and amortization | Depreciation and amortization | | 772 | | | 827 | | | 832 | | Depreciation and amortization | | 732 | | | 770 | | | 772 | |
| Amortization of receivables purchase discount | | (308) | | | (455) | | | (375) | | |
| Accretion of Caterpillar purchased receivable revenue | | Accretion of Caterpillar purchased receivable revenue | | (417) | | | (301) | | | (308) | |
| Provision for credit losses | Provision for credit losses | | 266 | | | 162 | | | 354 | | Provision for credit losses | | 81 | | | 70 | | | 266 | |
| Other, net | Other, net | | 147 | | | 131 | | | 164 | | Other, net | | 130 | | | 90 | | | 147 | |
| Changes in assets and liabilities: | Changes in assets and liabilities: | | | | | | | Changes in assets and liabilities: | | | | | | |
| | Other assets | Other assets | | 39 | | | 99 | | | 44 | | Other assets | | 148 | | | 59 | | | 39 | |
| Payable to dealers and others | Payable to dealers and others | | 34 | | | 18 | | | (57) | | Payable to dealers and others | | 38 | | | 32 | | | 34 | |
| Accrued expenses | Accrued expenses | | (83) | | | (93) | | | (6) | | Accrued expenses | | 20 | | | (86) | | | (83) | |
| Other payables with Caterpillar | Other payables with Caterpillar | | (13) | | | (9) | | | (10) | | Other payables with Caterpillar | | 27 | | | 8 | | | (13) | |
| Other liabilities | Other liabilities | | (14) | | | 93 | | | 16 | | Other liabilities | | (46) | | | 30 | | | (14) | |
| | Net cash provided by operating activities | Net cash provided by operating activities | | 1,148 | | | 1,205 | | | 1,287 | | Net cash provided by operating activities | | 1,255 | | | 1,189 | | | 1,148 | |
| Cash flows from investing activities: | Cash flows from investing activities: | | | | | | | Cash flows from investing activities: | | | | | | |
| Expenditures for equipment on operating leases | Expenditures for equipment on operating leases | | (1,086) | | | (1,514) | | | (1,451) | | Expenditures for equipment on operating leases | | (1,121) | | | (1,202) | | | (1,086) | |
| Capital expenditures - excluding equipment on operating leases | Capital expenditures - excluding equipment on operating leases | | (14) | | | (20) | | | (108) | | Capital expenditures - excluding equipment on operating leases | | (18) | | | (14) | | | (14) | |
| Proceeds from disposals of equipment | Proceeds from disposals of equipment | | 633 | | | 769 | | | 793 | | Proceeds from disposals of equipment | | 756 | | | 1,041 | | | 633 | |
| Additions to finance receivables | Additions to finance receivables | | (13,525) | | | (14,270) | | | (13,595) | | Additions to finance receivables | | (14,217) | | | (13,836) | | | (13,525) | |
| Collections of finance receivables | Collections of finance receivables | | 14,084 | | | 13,531 | | | 12,511 | | Collections of finance receivables | | 14,061 | | | 13,342 | | | 14,084 | |
| Net changes in Caterpillar purchased receivables | Net changes in Caterpillar purchased receivables | | 1,043 | | | 640 | | | (1,046) | | Net changes in Caterpillar purchased receivables | | 492 | | | (609) | | | 1,043 | |
| Proceeds from sales of receivables | Proceeds from sales of receivables | | 42 | | | 235 | | | 477 | | Proceeds from sales of receivables | | 57 | | | 51 | | | 42 | |
| Net change in variable lending to Caterpillar | Net change in variable lending to Caterpillar | | (12) | | | 69 | | | (58) | | Net change in variable lending to Caterpillar | | (2) | | | 13 | | | (12) | |
| Additions to other notes receivable with Caterpillar | | (75) | | | (80) | | | (390) | | |
| Collections on other notes receivable with Caterpillar | | 27 | | | 377 | | | 345 | | |
| Additions to other notes receivable from Caterpillar | | Additions to other notes receivable from Caterpillar | | (139) | | | (115) | | | (75) | |
| Collections of other notes receivable from Caterpillar | | Collections of other notes receivable from Caterpillar | | 46 | | | 69 | | | 27 | |
| | Settlements of undesignated derivatives | Settlements of undesignated derivatives | | (56) | | | (25) | | | 10 | | Settlements of undesignated derivatives | | (87) | | | (3) | | | (56) | |
| Other, net | Other, net | | 1 | | | 0 | | | 0 | | Other, net | | — | | | 1 | | | 1 | |
| Net cash provided by (used for) investing activities | Net cash provided by (used for) investing activities | | 1,062 | | | (288) | | | (2,512) | | Net cash provided by (used for) investing activities | | (172) | | | (1,262) | | | 1,062 | |
| Cash flows from financing activities: | Cash flows from financing activities: | | | | | | | Cash flows from financing activities: | | | | | | |
| Net change in variable lending from Caterpillar | Net change in variable lending from Caterpillar | | 403 | | | (807) | | | (109) | | Net change in variable lending from Caterpillar | | — | | | (1,000) | | | 403 | |
| | Payments on borrowings with Caterpillar | | 0 | | | (93) | | | 0 | | |
| | Proceeds from debt issued (original maturities greater than three months) | Proceeds from debt issued (original maturities greater than three months) | | 8,440 | | | 8,362 | | | 8,850 | | Proceeds from debt issued (original maturities greater than three months) | | 6,674 | | | 6,495 | | | 8,440 | |
| Payments on debt issued (original maturities greater than three months) | Payments on debt issued (original maturities greater than three months) | | (8,211) | | | (8,285) | | | (7,822) | | Payments on debt issued (original maturities greater than three months) | | (7,703) | | | (7,877) | | | (8,211) | |
| Short-term borrowings, net (original maturities three months or less) | Short-term borrowings, net (original maturities three months or less) | | (2,809) | | | (143) | | | 762 | | Short-term borrowings, net (original maturities three months or less) | | 540 | | | 3,489 | | | (2,809) | |
| Dividend paid to Caterpillar | Dividend paid to Caterpillar | | (300) | | | (25) | | | (400) | | Dividend paid to Caterpillar | | (275) | | | (850) | | | (300) | |
| | Net cash provided by (used for) financing activities | Net cash provided by (used for) financing activities | | (2,477) | | | (991) | | | 1,281 | | Net cash provided by (used for) financing activities | | (764) | | | 257 | | | (2,477) | |
| Effect of exchange rate changes on cash, cash equivalents and restricted cash | Effect of exchange rate changes on cash, cash equivalents and restricted cash | | (3) | | | (4) | | | (15) | | Effect of exchange rate changes on cash, cash equivalents and restricted cash | | (63) | | | 5 | | | (3) | |
| Increase (decrease) in cash, cash equivalents and restricted cash | Increase (decrease) in cash, cash equivalents and restricted cash | | (270) | | | (78) | | | 41 | | Increase (decrease) in cash, cash equivalents and restricted cash | | 256 | | | 189 | | | (270) | |
Cash, cash equivalents and restricted cash at beginning of year (1) | Cash, cash equivalents and restricted cash at beginning of year (1) | | 695 | | | 773 | | | 732 | | Cash, cash equivalents and restricted cash at beginning of year (1) | | 614 | | | 425 | | | 695 | |
Cash, cash equivalents and restricted cash at end of year (1) | Cash, cash equivalents and restricted cash at end of year (1) | | $ | 425 | | | $ | 695 | | | $ | 773 | | Cash, cash equivalents and restricted cash at end of year (1) | | $ | 870 | | | $ | 614 | | | $ | 425 | |
| | Cash paid for interest | Cash paid for interest | | $ | 613 | | | $ | 810 | | | $ | 743 | | Cash paid for interest | | $ | 544 | | | $ | 472 | | | $ | 613 | |
| Cash paid for taxes | | $ | 108 | | | $ | 79 | | | $ | 79 | | |
| Cash paid for taxes, net | | Cash paid for taxes, net | | $ | 254 | | | $ | 143 | | | $ | 108 | |
| All short-term investments, which consist primarily of highly liquid investments with original maturities of three months or less, are considered to be cash equivalents. | All short-term investments, which consist primarily of highly liquid investments with original maturities of three months or less, are considered to be cash equivalents. | All short-term investments, which consist primarily of highly liquid investments with original maturities of three months or less, are considered to be cash equivalents. |
(1) As of December 31, 2020, 2019 and 2018 restricted cash, which is included in Other assets in the Consolidated Statements of Financial Position, was $14 million, $5 million and $7 million, respectively. Restricted cash primarily includes cash related to syndication activities. | |
(1) As of December 31, 2022, 2021 and 2020 restricted cash, which is included in Other assets in the Consolidated Statements of Financial Position, was $2 million, $4 million and $14 million, respectively. Restricted cash primarily includes cash related to syndication activities. | | (1) As of December 31, 2022, 2021 and 2020 restricted cash, which is included in Other assets in the Consolidated Statements of Financial Position, was $2 million, $4 million and $14 million, respectively. Restricted cash primarily includes cash related to syndication activities. |
See Notes to Consolidated Financial Statements.
NOTES TO CONSOLIDATED FINANCIAL STATEMENTS
NOTE 1 – SUMMARY OF SIGNIFICANT ACCOUNTING POLICIES
A. Nature of Operations
Caterpillar Financial Services Corporation was organized in 1981 in the State of Delaware (together with its subsidiaries, "Cat“Cat Financial," "the” “the Company," "we"” “we” or "our"“our”). We are a wholly-owned finance subsidiary of Caterpillar Inc. (together with its other subsidiaries, "Caterpillar"“Caterpillar” or "Cat"“Cat”).
We provide retail and wholesale financing alternatives to customers and dealers around the world for Caterpillar products and services, as well as financing for vehicles and power generation facilities and marine vessels that, in most cases, incorporate Caterpillar products. Retail financing is primarily comprised of installment sale contracts and other equipment-related loans, working capital loans, finance leases and operating leases. Wholesale financing to Caterpillar dealers consists primarily of inventory and rental fleet financing. In addition, we purchase short-term wholesale trade receivables from Caterpillar. The various financing plans offered by Cat Financial are designed to support sales of Caterpillar products and generate financing income for Cat Financial. We conduct a significant portion of our activities in North America with additional offices and subsidiaries in Latin America, Asia/Pacific, Europe Africa and the Middle East.Africa.
B. Basis of Presentation
The accompanying consolidated financial statements include the accounts of Cat Financial and consolidated variable interest entities (VIEs) in which Cat Financial is the primary beneficiary.
We consolidate all VIEs where we are the primary beneficiary. For VIEs, we assess whether we are the primary beneficiary as prescribed by the accounting guidance on the consolidation of VIEs. The primary beneficiary of a VIE is the party that has both the power to direct the activities that most significantly impact the entity’s economic performance and the obligation to absorb losses or the right to receive benefits that could potentially be significant to the entity. Please refer to Note 1110 for more information.
We have customers and dealers that are VIEs of which we are not the primary beneficiary. Although we have provided financial support to these entities and therefore have a variable interest, we do not have the power to direct the activities that most significantly impact their economic performance. Our maximum exposure to loss from our involvement with these VIEs is limited to the credit risk inherently present in the financial support that we have provided. Credit risk was evaluated and reflected in our financial statements as part of our overall portfolio of finance receivables and related allowance for credit losses.
Certain amounts for prior periods have been reclassified to conform to the current period financial statement presentation.
C. Finance Receivables
Finance receivables are generally classified as held for investment and recorded at amortized cost given that we have the intent and ability to hold them for the foreseeable future. Amortized cost is the principal balance outstanding plus accrued interest less write-downs, net of unamortized purchase discounts and deferred fees and costs.
D. Revenue Recognition
We record finance revenue over the life of the related finance receivablereceivables using the interest method, including the accretion of purchased receivables discount and related fee revenue, upfront fees and certain direct origination costs that are deferred. We recognize revenue from rental payments received on operating leases on a straight-line basis over the term of the lease.
We suspend recognition of finance revenue and operating lease revenue and place the account on non-accrual status when management determines that collection of future income is not probable (generally after 120 days past due). We resume recognition of revenue and recognize previously suspended income when the account becomes current and we consider collection of remaining amounts to be probable. We write off interest earned but uncollected prior to the receivablereceivables being placed on non-accrual status through Provision for credit losses when, in the judgment of management, we consider it to be uncollectible.
We participate in certain marketing programs offered in conjunction with Caterpillar and/or Caterpillar dealers that allow us to periodically offer financing to customers at interest rates that are below market rates. Under these marketing programs, Caterpillar and/or the dealer funds an amount at the outset of the transaction, which we then recognize as finance revenue over the term of the financing. The funds we receive from Caterpillar and/or the dealer equal an amount that when combined with the customer’s contractual interest provides us with a market interest rate.
Other revenue includes: (1) late charges, (2) fee revenue, primarily commitment fees and fees on committed lines of credit or letters of credit, (3) gains and losses on sales of returned or repossessed equipment, (4) impairments on returned or repossessed equipment held for sale, (5) gains and losses on loan and lease sales and (6) other miscellaneous revenues. Other revenue items are recognized in accordance with relevant authoritative pronouncements.
E.Equipment on Operating Leases
We typically pay property taxes on operating leases directly to the taxing authorities and invoice the lessee for reimbursement. These property tax reimbursements are accounted for as variable lease payments and are included in Operating lease revenues in the Consolidated Statements of Profit. We individually assess our operating lease receivables for impairment. If collectability of a recorded operating lease receivable is not considered probable, we recognize a current-period adjustment against operating lease revenue.
F. Depreciation
We recognize depreciation for equipment on operating leases using the straight-line method over the lease term, typically one to seven years. The depreciable basis is the original cost of the equipment less the estimated residual value of the equipment at the end of the lease term.
F.G. Residual Values
The residualsresidual values for operating leases are included in Equipment on operating leases, net in the Consolidated Statements of Financial Position. The residualsresidual values for finance leases are included in Finance receivables, net in the Consolidated Statements of Financial Position.
During the term of our leases, we monitor residual values. For operating leases, we record adjustments to depreciation expense reflecting changes in residual value estimates prospectively on a straight-line basis. For finance leases, we recognize residual value adjustments through a reduction of finance revenue over the remaining lease term.
We evaluate the carrying value of equipment on operating leases for potential impairment when we determine a triggering event has occurred. When a triggering event occurs, we perform a test for recoverability by comparing projected undiscounted future cash flows to the carrying value of the equipment on operating leases. If the test for recoverability identifies a possible impairment, we measure the fair value of the equipment on operating leases in accordance with the fair value measurement framework. We recognize an impairment charge for the amount by which the carrying value of the equipment on operating leases exceeds its estimated fair value.
G.H. Derivative Financial Instruments
Our earnings and cash flow are subject to fluctuations due to changes in foreign currency exchange rates and interest rates. Our Risk Management Policy (policy) allows for the use of derivative financial instruments to prudently manage foreign currency exchange rate and interest rate exposures. Our policy specifies that derivatives are not to be used for speculative purposes. Derivatives that we use are primarily foreign currency forward, option and cross currency contracts and interest rate contracts. All derivatives are recorded at fair value. See Note 98 for additional information.
H.I. Allowance for Credit Losses
The allowance for credit losses is management’s estimate of expected losses over the life of our finance receivablereceivables portfolio calculated using loss forecast models that take into consideration historical credit loss experience, current economic conditions and forecasts and scenarios that capture country and industry-specific economic factors. In addition, we consider qualitative factors not able to be fully captured in our loss forecast models, including borrower-specific and company-specific factors. These qualitative factors are subjective and require a degree of management judgment.
We measure the allowance for credit losses on a collective (pool) basis when similar risk characteristics exist and on an individual basis when we determine that similar risk characteristics do not exist. We identify finance receivables for individual evaluation based on past-due status and information available about the customer, such as financial statements, news reports and published credit ratings, as well as general information regarding industry trends and the economic environment in which our customers operate. The allowance for credit losses attributable to finance receivables that are individually evaluated is based on the present value of expected future cash flows discounted at the receivables'receivables’ effective interest rate, the fair value of the collateral for collateral-dependent receivables or the observable market price of the receivable.receivables. In determining collateral value, we estimate the current fair market value of the collateral less selling costs. We also consider credit enhancements such as additional collateral and contractual third-party guarantees. See Note 2 for a description of our portfolio segments and allowance methodologies.
Receivable balances, including accrued interest, are written off against the allowance for credit losses when, in the judgment of management, they are considered uncollectible (generally upon repossession of the collateral). TheGenerally, the amount of the write-off is determined by comparing the fair value of the collateral, less cost to sell, to the amortized cost. Subsequent recoveries, if any, are credited to the allowance for credit losses when received.
I.J. Income Taxes
We determine the provision for income taxes using the asset and liability approach taking into account guidance related to uncertain tax positions. Tax laws require items to be included in tax filings at different times than the items are reflected in the financial statements. We recognize a current liability for the estimated taxes payable for the current year. Deferred taxes represent the future tax consequences expected to occur when the reported amounts of assets and liabilities are recovered or paid. We adjust deferred taxes for enacted changes in tax rates and tax laws. We record valuation allowances to reduce deferred tax assets when it is more likely than not that a tax benefit will not be realized. See Note 1211 for further discussion.
We join Caterpillar in the filing of a consolidated U.S. Federal income tax return and certain state income tax returns. In accordance with our tax sharing agreement with Caterpillar, we generally pay to or receive from Caterpillar our allocated share of income taxes or credits reflected in these consolidated filings. This amount is calculated on a separate return basis by taking taxable income times the applicable statutory tax rate and includes payment for certain tax attributes earned during the year.
J.K. Foreign Currency Translation
The functional currency for most of our subsidiaries is the respective local currency. We include gains and losses resulting from the remeasurement of foreign currency amounts to the functional currency in Other income (expense) in the Consolidated Statements of Profit. We include gains and losses resulting from translating assets and liabilities from the functional currency to U.S. dollars in Accumulated other comprehensive income (loss) in the Consolidated Statements of Financial Position.
K.L. Estimates in Financial Statements
The preparation of financial statements, in conformity with generally accepted accounting principles, requires management to make estimates and assumptions that affect the reported amounts. Significant estimates include residual values for leased assets, allowance for credit losses and income taxes. Actual results may differ from these estimates.
L.M. New Accounting Pronouncements
Adoption of New Accounting Standards
Credit losses (We consider the applicability and impact of all Accounting Standards Update (ASU) 2016-13) – In June 2016, the Financial Accounting Standards Board (FASB) issued new accounting guidance to introduce a new model for recognizing credit losses on financial instruments based on an estimate of current expected credit losses. The new guidance applies to loans, accounts receivable, trade receivables, other financial assets measured at amortized cost, loan commitments and other off-balance sheet credit exposures. The new guidance also applies to debt securities and other financial assets measured at fair value through other comprehensive income. The new guidance was effective January 1, 2020. We applied the new guidance using a modified retrospective approach through a cumulative effect adjustment to retained earnings as of January 1, 2020. We have not recast prior period comparative information, which we continue to report under the accounting guidance in effect for those periods.
The most significant effects of adoption relate to the change in methodology for estimating our Allowance for credit losses from an incurred loss model to a current expected credit loss model. We elected to present accrued interest receivable related to our finance receivables in Finance receivables, net. In prior period comparative information, accrued interest receivable continues to be reported in Other assets. Our adoption of the new guidance did not have a material impact on our financial statements.
The cumulative effect of initially applying the new credit loss guidance to our consolidated financial statements on January 1, 2020 was as follows:
| | | | | | | | | | | | | | | | | |
Consolidated Statement of Financial Position
(Millions of dollars) | Balance as of
December 31, 2019 | | Cumulative Impact
from Adopting New
Credit Loss Standard | | Balance as of
January 1, 2020 |
| Assets: | | | | | |
| Finance receivables, net | $ | 27,832 | | | $ | 42 | | | $ | 27,874 | |
| Other assets | $ | 1,292 | | | $ | (53) | | | $ | 1,239 | |
| | | | | |
| Liabilities: | | | | | |
| Other liabilities | $ | 893 | | | $ | 2 | | | $ | 895 | |
| | | | | |
| Shareholder's equity | | | | | |
| Retained earnings | $ | 3,162 | | | $ | (13) | | | $ | 3,149 | |
| | | | | |
| | | | | |
See Note 2 for additional information.
Updates (ASUs). We adopted the following ASUsASU effective January 1, 2020, none of2022, which haddid not have a material impact on our financial statements:
| | | | | |
| ASU | Description |
2018-13 | Fair value measurement |
2018-152021-05 | Internal-use software |
2018-19 | Codification improvements - Credit losses |
2019-04 | Codification improvements - Credit losses, Derivatives & hedging, and Financial instruments |
2019-05 | Financial instruments - Credit losses |
2019-11 | Codification improvements - Credit losses |
2019-12 | Simplifying accounting for income taxes |
2020-02 | Financial instruments - Credit losses |
2020-03 | Codification improvements - Financial instrumentsLessor – Variable lease payments |
Accounting Standards Issued But Not Yet Adopted
Reference rate reformCredit Losses (ASU 2020-04)(ASU 2022-02) – In March 2020,2022, the FASBFinancial Accounting Standards Board issued ASU No. 2022-02 related to Troubled Debt Restructurings (TDRs) by Creditors and Vintage Disclosures for Gross Write-offs. The ASU eliminates accounting guidance for TDRs, enhances disclosures for certain receivable modifications related to easeborrowers experiencing financial difficulty, and requires disclosure of current period gross write-offs by year of origination. The ASU is effective for fiscal years, and interim periods within those fiscal years, beginning after December 15, 2022. We do not expect the potential burden in accounting for reference rate reform related activities thatadoption to have a material impact debt, leases, derivatives and other contracts. The guidance is optional and may be elected over time as reference rate reform activities occur between March 12, 2020 through December 31, 2022. In January 2021, we elected to adopt optional expedients impacting our derivative instruments. We continue to evaluate the impact of reference rate reform on our other contracts and assess the impacts of adopting this guidance on our financial statements.
We consider the applicability and impact of all ASUs. We assessed ASUs not listed above and determined that they either were not applicable or were not expected to have a material impact on our financial statements.
NOTE 2 – FINANCE RECEIVABLES
Effective January 1, 2020, we implemented the new credit loss guidance using a modified retrospective approach. Prior period comparative information has not been recast and continues to be reported under the accounting guidance in effect for those periods. See Note 1 for additional information.
A summary of finance receivables included in the Consolidated Statements of Financial Position as of December 31, was as follows:
| | (Millions of dollars) | (Millions of dollars) | | 2020 | | 2019 | | (Millions of dollars) | | 2022 | | 2021 | |
Retail loans, net(1) | Retail loans, net(1) | | $ | 15,037 | | | $ | 15,424 | | | Retail loans, net(1) | | $ | 14,973 | | | $ | 14,817 | | |
| Retail leases, net | Retail leases, net | | 7,812 | | | 7,660 | | | Retail leases, net | | 6,965 | | | 7,818 | | |
| Caterpillar purchased receivables, net | Caterpillar purchased receivables, net | | 3,646 | | | 4,448 | | | Caterpillar purchased receivables, net | | 4,297 | | | 4,462 | | |
Wholesale loans, net(1) | Wholesale loans, net(1) | | 533 | | | 664 | | | Wholesale loans, net(1) | | 545 | | | 406 | | |
| Wholesale leases, net | Wholesale leases, net | | 26 | | | 60 | | | Wholesale leases, net | | 7 | | | 11 | | |
| Total finance receivables | Total finance receivables | | 27,054 | | | 28,256 | | | Total finance receivables | | 26,787 | | | 27,514 | | |
| Less: Allowance for credit losses | Less: Allowance for credit losses | | (479) | | | (424) | | | Less: Allowance for credit losses | | (346) | | | (337) | | |
| Total finance receivables, net | Total finance receivables, net | | $ | 26,575 | | | $ | 27,832 | | | Total finance receivables, net | | $ | 26,441 | | | $ | 27,177 | | |
|
(1) Includes failed sale leasebacks.
Maturities of our finance receivables, as of December 31, 2020,2022, reflect contractual repayments due from borrowers and were as follows:
| | (Millions of dollars) | (Millions of dollars) | | | | | | | | | | | | | (Millions of dollars) | | | | | | | | | | | | |
| Amounts due in | Amounts due in | | Retail
loans | | Retail
leases | | Caterpillar
purchased
receivables | | Wholesale
loans | | Wholesale
leases | | Total | Amounts due in | | Retail
loans | | Retail
leases | | Caterpillar
purchased
receivables | | Wholesale
loans | | Wholesale
leases | | Total |
| 2021 | | $ | 6,521 | | | $ | 3,270 | | | $ | 3,674 | | | $ | 300 | | | $ | 8 | | | $ | 13,773 | | |
| 2022 | | 3,740 | | | 2,068 | | | 0 | | | 118 | | | 4 | | | 5,930 | | |
| 2023 | 2023 | | 2,712 | | | 1,135 | | | 0 | | | 50 | | | 2 | | | 3,899 | | 2023 | | $ | 6,521 | | | $ | 2,865 | | | $ | 4,334 | | | $ | 343 | | | $ | 3 | | | $ | 14,066 | |
| 2024 | 2024 | | 1,432 | | | 489 | | | 0 | | | 8 | | | 1 | | | 1,930 | | 2024 | | 3,864 | | | 1,818 | | | — | | | 74 | | | 1 | | | 5,757 | |
| 2025 | 2025 | | 484 | | | 185 | | | 0 | | | 3 | | | 1 | | | 673 | | 2025 | | 2,733 | | | 1,027 | | | — | | | 56 | | | 1 | | | 3,817 | |
| 2026 | | 2026 | | 1,518 | | | 547 | | | — | | | 18 | | | — | | | 2,083 | |
| 2027 | | 2027 | | 545 | | | 176 | | | — | | | 2 | | | — | | | 723 | |
| Thereafter | Thereafter | | 391 | | | 62 | | | 0 | | | 3 | | | 0 | | | 456 | | Thereafter | | 117 | | | 40 | | | — | | | 1 | | | — | | | 158 | |
| Total | Total | | 15,280 | | | 7,209 | | | 3,674 | | | 482 | | | 16 | | | 26,661 | | Total | | 15,298 | | | 6,473 | | | 4,334 | | | 494 | | | 5 | | | 26,604 | |
Guaranteed residual value(1) | Guaranteed residual value(1) | | 44 | | | 438 | | | 0 | | | 51 | | | 10 | | | 543 | | Guaranteed residual value(1) | | 12 | | | 399 | | | — | | | 57 | | | 1 | | | 469 | |
Unguaranteed residual value | Unguaranteed residual value | | 2 | | | 802 | | | 0 | | | 2 | | | 2 | | | 808 | | Unguaranteed residual value | | 2 | | | 665 | | | — | | | 2 | | | 2 | | | 671 | |
| Unearned income | Unearned income | | (289) | | | (637) | | | (28) | | | (2) | | | (2) | | | (958) | | Unearned income | | (339) | | | (572) | | | (37) | | | (8) | | | (1) | | | (957) | |
| Total | Total | | $ | 15,037 | | | $ | 7,812 | | | $ | 3,646 | | | $ | 533 | | | $ | 26 | | | $ | 27,054 | | Total | | $ | 14,973 | | | $ | 6,965 | | | $ | 4,297 | | | $ | 545 | | | $ | 7 | | | $ | 26,787 | |
|
(1) For Retail loans and Wholesale loans, represents residual value on failed sale leasebacks.
Our finance receivables generally may be repaid or refinanced without penalty prior to contractual maturity and we also sell finance receivables to third parties to mitigate the concentration of credit risk with certain customers.
Finance leases
Revenues from finance leases were $491$429 million, $481 million and $518$491 million for the years ended December 31, 20202022, 2021, and 2019,2020 respectively, and are included in retail and wholesale finance revenue in the Consolidated Statements of Profit. The residual values for finance leases are included in Finance receivables, net in the Consolidated Statements of Financial Position. Residual value adjustments are recognized through a reduction of finance revenue over the remaining lease term.
Allowance for credit losses
Portfolio segments
A portfolio segment is the level at which we develop a systematic methodology for determining our allowance for credit losses. Our portfolio segments and related methods for estimating expected credit losses are as follows:
Customer
We provide loans and finance leases to end-user customers primarily for the purpose of financing new and used Caterpillar machinery, engines and equipment for commercial use, the majority of which operate in construction-related industries.use. We also provide financing for vehicles, power generation facilities and marine vessels that, in most cases, incorporate Caterpillar products. The average original term of our customer finance receivable portfolio was approximately 4650 months with an average remaining term of approximately 2627 months as of December 31, 2020.2022.
We typically maintain a security interest in financed equipment and we require physical damage insurance coverage on the financed equipment, both of which provide us with certain rights and protections. If our collection efforts fail to bring a defaulted account current, we generally can repossess the financed equipment, after satisfying local legal requirements, and sell it within the Caterpillar dealer network or through third-party auctions.
We estimate the allowance for credit losses related to our customer finance receivables based on loss forecast models utilizing probabilities of default and our estimated loss given default based on past loss experience adjusted for current conditions and reasonable and supportable forecasts capturing country and industry-specific economic factors.
During the year ended December 31, 2020,2022, our forecasts for the markets in which we operate reflected an overall decline in economic conditions resulting from a contracting economy, elevatedcontinuation of the trend of relatively low unemployment rates and an increase in delinquencies due to the COVID-19 pandemic.delinquencies. However, high inflation rates and consequent central bank actions are weakening global economic growth. We believe the economic forecasts employed represent reasonable and supportable forecasts, followed by a reversion to long-term trends.
Dealer
We provide financing to Caterpillar dealers in the form of wholesale financing plans. Our wholesale financing plans provide assistance to dealers by financing their mostly new Caterpillar equipment inventory and rental fleets on a secured and unsecured basis. In addition, we provide a variety of secured and unsecured loans to Caterpillar dealers for working capital.dealers.
We estimate the allowance for credit losses for dealer finance receivables based on historical loss rates with consideration of current economic conditions and reasonable and supportable forecasts.
Although our forecasts continued to indicate a decline in economic conditions,In general, our Dealer portfolio segment has not historically experienced increasedlarge increases or decreases in credit losses during priorbased on changes in economic downturnsconditions due to our close working relationships with the dealers and their financial strength. Therefore, we made no adjustments to historical loss rates during the year ended December 31, 2020.2022.
Caterpillar Purchased Receivables
We purchase receivables from Caterpillar, primarily related to the sale of equipment and parts to dealers. Caterpillar purchased receivables are non-interest-bearing short-term trade receivables that are purchased at a discount.
We estimate the allowance for credit losses for Caterpillar purchased receivables based on historical loss rates with consideration of current economic conditions and reasonable and supportable forecasts.
Although our forecasts continued to indicate a decline in economic conditions,In general, our Caterpillar Purchased Receivables portfolio segment has not historically experienced increasedlarge increases or decreases in credit losses during priorbased on changes in economic downturnsconditions due to the short-term maturities of the receivables, our close working relationships with the dealers and their financial strength. Therefore, we made no adjustments to historical loss rates during the year ended December 31, 2020.2022.
Classes of finance receivables
We further evaluate our portfolio segments by the class of finance receivables, which is defined as a level of information (below a portfolio segment) in which the finance receivables have the same initial measurement attribute and a similar method for assessing and monitoring credit risk. Typically, our finance receivables within a geographic area have similar credit risk profiles and methods for assessing and monitoring credit risk. Our classes, which align with management reporting for credit losses, are as follows:
•North America - Finance receivables originated in the United States and Canada.
•EAME - Finance receivables originated in Europe, Africa, the Middle East and the Commonwealth of Independent States.
•Asia/Pacific - Finance receivables originated in Australia, New Zealand, China, Japan, Southeast Asia and India.
•Mining - Finance receivables related to large mining customers worldwide.
•Latin America - Finance receivables originated in Mexico and Central and South American countries.
•Caterpillar Power Finance - Finance receivables originated worldwide related to marine vessels with Caterpillar engines and Caterpillar electrical power generation, gas compression and co-generation systems and non-Caterpillar equipment that is powered by these systems.
An analysis of the allowance for credit losses was as follows:
| | | | | | | | | | | | | | | | | | | | | | | | | | |
| (Millions of dollars) | | December 31, 2020 |
| Allowance for Credit Losses: | | Customer | | Dealer | | Caterpillar
Purchased
Receivables | | Total |
| Balance at beginning of year | | $ | 375 | | | $ | 45 | | | $ | 4 | | | $ | 424 | |
Adjustment to adopt new accounting guidance(1) | | 12 | | | 0 | | | 0 | | | 12 | |
| Receivables written off | | (263) | | | 0 | | | 0 | | | (263) | |
| Recoveries on receivables previously written off | | 41 | | | 0 | | | 0 | | | 41 | |
| Provision for credit losses | | 262 | | | (1) | | | 0 | | | 261 | |
| | | | | | | | |
| Foreign currency translation adjustment | | 4 | | | 0 | | | 0 | | | 4 | |
| Balance at end of year | | $ | 431 | | | $ | 44 | | | $ | 4 | | | $ | 479 | |
| | | | | | | | |
| Individually evaluated | | $ | 187 | | | $ | 39 | | | $ | 0 | | | $ | 226 | |
| Collectively evaluated | | 244 | | | 5 | | | 4 | | | 253 | |
| Ending Balance | | $ | 431 | | | $ | 44 | | | $ | 4 | | | $ | 479 | |
| | | | | | | | |
| Finance Receivables: | | | | | | | | |
| Individually evaluated | | $ | 594 | | | $ | 78 | | | $ | 0 | | | $ | 672 | |
| Collectively evaluated | | 19,333 | | | 3,403 | | | 3,646 | | | 26,382 | |
| Ending Balance | | $ | 19,927 | | | $ | 3,481 | | | $ | 3,646 | | | $ | 27,054 | |
| | | | | | | | |
| | | | | | | | | | | | | | | | | | | | | | | | | | | | | | | | | | | | | | | | | | | | | | | |
| (Millions of dollars) | December 31, 2022 | | December 31, 2021 |
| Allowance for Credit Losses: | Customer | | Dealer | | Caterpillar
Purchased
Receivables | | Total | | Customer | | Dealer | | Caterpillar
Purchased
Receivables | | Total |
| Beginning Balance | $ | 251 | | | $ | 82 | | | $ | 4 | | | $ | 337 | | | $ | 431 | | | $ | 44 | | | $ | 4 | | | $ | 479 | |
| | | | | | | | | | | | | | | |
| Write-offs | (108) | | | — | | | — | | | (108) | | | (256) | | | — | | | — | | | (256) | |
| Recoveries | 62 | | | — | | | — | | | 62 | | | 51 | | | — | | | — | | | 51 | |
Provision for credit losses(1) | 75 | | | (17) | | | — | | | 58 | | | 30 | | | 38 | | | — | | | 68 | |
| Other | (3) | | | — | | | — | | | (3) | | | (5) | | | — | | | — | | | (5) | |
Ending Balance(2) | $ | 277 | | | $ | 65 | | | $ | 4 | | | $ | 346 | | | $ | 251 | | | $ | 82 | | | $ | 4 | | | $ | 337 | |
| | | | | | | | | | | | | | | |
| | | | | | | | | | | | | | | |
| | | | | | | | | | | | | | | |
| | | | | | | | | | | | | | | |
| | | | | | | | | | | | | | | |
| | | | | | | | | | | | | | | |
| | | | | | | | | | | | | | | |
| | | | | | | | | | | | | | | |
| Finance Receivables | $ | 20,353 | | | $ | 2,137 | | | $ | 4,297 | | | $ | 26,787 | | | $ | 20,842 | | | $ | 2,210 | | | $ | 4,462 | | | $ | 27,514 | |
| | | | | | | | | | | | | | | |
(1) See Note 1 regarding new accounting guidance related toExcludes provision for credit losses.losses on unfunded commitments and other miscellaneous receivables.
| | | | | | | | | | | | | | | | | | | | | | | | | | |
| (Millions of dollars) | | December 31, 2019 |
| Allowance for Credit Losses: | | Customer | | Dealer | | Caterpillar
Purchased
Receivables | | Total |
| Balance at beginning of year | | $ | 486 | | | $ | 21 | | | $ | 4 | | | $ | 511 | |
| Receivables written off | | (281) | | | 0 | | | 0 | | | (281) | |
| Recoveries on receivables previously written off | | 44 | | | 0 | | | 0 | | | 44 | |
| Provision for credit losses | | 138 | | | 24 | | | 0 | | | 162 | |
| Adjustment due to sale of receivables | | (11) | | | 0 | | | 0 | | | (11) | |
| Foreign currency translation adjustment | | (1) | | | 0 | | | 0 | | | (1) | |
| Balance at end of year | | $ | 375 | | | $ | 45 | | | $ | 4 | | | $ | 424 | |
| | | | | | | | |
| Individually evaluated | | $ | 178 | | | $ | 39 | | | $ | 0 | | | $ | 217 | |
| Collectively evaluated | | 197 | | | 6 | | | 4 | | | 207 | |
| Ending Balance | | $ | 375 | | | $ | 45 | | | $ | 4 | | | $ | 424 | |
| | | | | | | | |
| Finance Receivables: | | | | | | | | |
| Individually evaluated | | $ | 594 | | | $ | 78 | | | $ | 0 | | | $ | 672 | |
| Collectively evaluated | | 18,770 | | | 4,366 | | | 4,448 | | | 27,584 | |
| Ending Balance | | $ | 19,364 | | | $ | 4,444 | | | $ | 4,448 | | | $ | 28,256 | |
| | | | | | | | |
Credit quality of finance receivables
At origination, we evaluate credit risk based on a variety of credit quality factors including prior payment experience, customer financial information, credit ratings, loan-to-value ratios, probabilities of default, industry trends, macroeconomic factors and other internal metrics. On an ongoing basis, we monitor credit quality based on past-due status as there is a meaningful correlation between the past-due status of customers and the risk of loss. In determining past-due status, we consider the entire finance receivable past due when any installment is over 30 days past due.
Customer
The tabletables below summarizessummarize the aging category of our amortized cost of finance receivables in the Customer portfolio segment by origination year.
| | (Millions of dollars) | (Millions of dollars) | December 31, 2020 | (Millions of dollars) | December 31, 2022 | |
| | 2020 | | 2019 | | 2018 | | 2017 | | 2016 | | Prior | | Revolving
Finance
Receivables | | | Total
Finance
Receivables | | 2022 | | 2021 | | 2020 | | 2019 | | 2018 | | Prior | | Revolving
Finance
Receivables | | | Total
Finance
Receivables | |
| North America | North America | | | | | | | | | | | | | | | | | North America | | | | | | | | | | | | | | | | | |
| Current | Current | $ | 3,780 | | | $ | 2,423 | | | $ | 1,344 | | | $ | 522 | | | $ | 212 | | | $ | 27 | | | $ | 89 | | | | $ | 8,397 | | Current | $ | 3,915 | | | $ | 3,276 | | | $ | 1,525 | | | $ | 653 | | | $ | 206 | | | $ | 34 | | | $ | 240 | | | | $ | 9,849 | | |
| 31-60 days past due | 31-60 days past due | 52 | | | 49 | | | 33 | | | 16 | | | 7 | | | 2 | | | 0 | | | | 159 | | 31-60 days past due | 25 | | | 26 | | | 18 | | | 12 | | | 4 | | | 1 | | | 4 | | | | 90 | | |
| 61-90 days past due | 61-90 days past due | 22 | | | 25 | | | 16 | | | 9 | | | 2 | | | 1 | | | 0 | | | | 75 | | 61-90 days past due | 9 | | | 15 | | | 7 | | | 3 | | | 1 | | | — | | | 3 | | | | 38 | | |
| 91+ days past due | 91+ days past due | 14 | | | 35 | | | 31 | | | 20 | | | 9 | | | 4 | | | 2 | | | | 115 | | 91+ days past due | 11 | | | 16 | | | 12 | | | 6 | | | 4 | | | 3 | | | 4 | | | | 56 | | |
| | EAME | EAME | | | | EAME | | | | |
| Current | Current | 1,605 | | | 931 | | | 501 | | | 203 | | | 60 | | | 18 | | | 0 | | | | 3,318 | | Current | 1,270 | | | 953 | | | 477 | | | 280 | | | 155 | | | 68 | | | — | | | | 3,203 | | |
| 31-60 days past due | 31-60 days past due | 5 | | | 15 | | | 3 | | | 2 | | | 0 | | | 0 | | | 0 | | | | 25 | | 31-60 days past due | 10 | | | 12 | | | 7 | | | 1 | | | 1 | | | — | | | — | | | | 31 | | |
| 61-90 days past due | 61-90 days past due | 1 | | | 1 | | | 2 | | | 1 | | | 0 | | | 0 | | | 0 | | | | 5 | | 61-90 days past due | 8 | | | 4 | | | 3 | | | 1 | | | — | | | — | | | — | | | | 16 | | |
| 91+ days past due | 91+ days past due | 7 | | | 7 | | | 12 | | | 4 | | | 39 | | | 43 | | | 0 | | | | 112 | | 91+ days past due | 6 | | | 25 | | | 16 | | | 4 | | | 1 | | | 1 | | | — | | | | 53 | | |
| | Asia/Pacific | Asia/Pacific | | | | Asia/Pacific | | | | |
| Current | Current | 1,583 | | | 933 | | | 412 | | | 115 | | | 32 | | | 6 | | | 32 | | | | 3,113 | | Current | 1,174 | | | 805 | | | 393 | | | 124 | | | 37 | | | 5 | | | 40 | | | | 2,578 | | |
| 31-60 days past due | 31-60 days past due | 13 | | | 23 | | | 13 | | | 6 | | | 0 | | | 0 | | | 0 | | | | 55 | | 31-60 days past due | 10 | | | 12 | | | 8 | | | 1 | | | 1 | | | — | | | — | | | | 32 | | |
| 61-90 days past due | 61-90 days past due | 7 | | | 11 | | | 7 | | | 1 | | | 0 | | | 0 | | | 0 | | | | 26 | | 61-90 days past due | 2 | | | 5 | | | 4 | | | 2 | | | — | | | — | | | — | | | | 13 | | |
| 91+ days past due | 91+ days past due | 4 | | | 10 | | | 9 | | | 3 | | | 0 | | | 0 | | | 0 | | | | 26 | | 91+ days past due | 2 | | | 6 | | | 6 | | | 4 | | | — | | | — | | | — | | | | 18 | | |
| | Mining | Mining | | | | Mining | | | | |
| Current | Current | 515 | | | 574 | | | 289 | | | 181 | | | 92 | | | 151 | | | 137 | | | | 1,939 | | Current | 875 | | | 627 | | | 227 | | | 193 | | | 94 | | | 108 | | | 80 | | | | 2,204 | | |
| 31-60 days past due | 31-60 days past due | 5 | | | 0 | | | 5 | | | 1 | | | 0 | | | 0 | | | 0 | | | | 11 | | 31-60 days past due | — | | | 1 | | | — | | | — | | | — | | | — | | | — | | | | 1 | | |
| 61-90 days past due | 61-90 days past due | 0 | | | 0 | | | 0 | | | 0 | | | 0 | | | 0 | | | 0 | | | | 0 | | 61-90 days past due | — | | | — | | | — | | | — | | | — | | | — | | | — | | | | — | | |
| 91+ days past due | 91+ days past due | 0 | | | 11 | | | 8 | | | 2 | | | 0 | | | 0 | | | 1 | | | | 22 | | 91+ days past due | — | | | — | | | — | | | — | | | — | | | 1 | | | — | | | | 1 | | |
| | Latin America | Latin America | | | | Latin America | | | | |
| Current | Current | 561 | | | 348 | | | 151 | | | 48 | | | 13 | | | 34 | | | 0 | | | | 1,155 | | Current | 770 | | | 400 | | | 150 | | | 69 | | | 26 | | | 20 | | | — | | | | 1,435 | | |
| 31-60 days past due | 31-60 days past due | 3 | | | 6 | | | 4 | | | 3 | | | 0 | | | 0 | | | 0 | | | | 16 | | 31-60 days past due | 7 | | | 8 | | | 4 | | | 2 | | | — | | | 1 | | | — | | | | 22 | | |
| 61-90 days past due | 61-90 days past due | 1 | | | 7 | | | 6 | | | 3 | | | 2 | | | 0 | | | 0 | | | | 19 | | 61-90 days past due | 2 | | | 5 | | | 1 | | | 1 | | | — | | | — | | | — | | | | 9 | | |
| 91+ days past due | 91+ days past due | 2 | | | 14 | | | 11 | | | 24 | | | 5 | | | 4 | | | 0 | | | | 60 | | 91+ days past due | 2 | | | 13 | | | 11 | | | 2 | | | 1 | | | — | | | — | | | | 29 | | |
| | Caterpillar Power Finance | Caterpillar Power Finance | | | | Caterpillar Power Finance | | | | |
| Current | Current | 217 | | | 199 | | | 111 | | | 273 | | | 99 | | | 117 | | | 119 | | | | 1,135 | | Current | 82 | | | 87 | | | 146 | | | 51 | | | 18 | | | 161 | | | 125 | | | | 670 | | |
| 31-60 days past due | 31-60 days past due | 0 | | | 0 | | | 6 | | | 0 | | | 0 | | | 0 | | | 0 | | | | 6 | | 31-60 days past due | — | | | — | | | — | | | — | | | — | | | — | | | — | | | | — | | |
| 61-90 days past due | 61-90 days past due | 0 | | | 0 | | | 0 | | | 0 | | | 0 | | | 9 | | | 0 | | | | 9 | | 61-90 days past due | — | | | — | | | — | | | — | | | — | | | — | | | — | | | | — | | |
| 91+ days past due | 91+ days past due | 2 | | | 0 | | | 20 | | | 3 | | | 25 | | | 79 | | | 0 | | | | 129 | | 91+ days past due | — | | | — | | | — | | | — | | | — | | | 5 | | | — | | | | 5 | | |
| | Totals by Aging Category | | Totals by Aging Category | | | | |
| Current | | Current | 8,086 | | | 6,148 | | | 2,918 | | | 1,370 | | | 536 | | | 396 | | | 485 | | | | 19,939 | | |
| 31-60 days past due | | 31-60 days past due | 52 | | | 59 | | | 37 | | | 16 | | | 6 | | | 2 | | | 4 | | | | 176 | | |
| 61-90 days past due | | 61-90 days past due | 21 | | | 29 | | | 15 | | | 7 | | | 1 | | | — | | | 3 | | | | 76 | | |
| 91+ days past due | | 91+ days past due | 21 | | | 60 | | | 45 | | | 16 | | | 6 | | | 10 | | | 4 | | | | 162 | | |
| Total | Total | $ | 8,399 | | | $ | 5,622 | | | $ | 2,994 | | | $ | 1,440 | | | $ | 597 | | | $ | 495 | | | $ | 380 | | | | $ | 19,927 | | Total | $ | 8,180 | | | $ | 6,296 | | | $ | 3,015 | | | $ | 1,409 | | | $ | 549 | | | $ | 408 | | | $ | 496 | | | | $ | 20,353 | | |
|
| | | | | | | | | | | | | | | | | | | | | | | | | | | | | | | | | | | | | | | | | | | | | | | | | |
| (Millions of dollars) | December 31, 2021 |
| 2021 | | 2020 | | 2019 | | 2018 | | 2017 | | Prior | | Revolving
Finance
Receivables | | | | Total
Finance
Receivables |
| North America | | | | | | | | | | | | | | | | | |
| Current | $ | 4,792 | | | $ | 2,596 | | | $ | 1,426 | | | $ | 630 | | | $ | 182 | | | $ | 32 | | | $ | 182 | | | | | $ | 9,840 | |
| 31-60 days past due | 27 | | | 32 | | | 20 | | | 12 | | | 4 | | | 1 | | | 5 | | | | | 101 | |
| 61-90 days past due | 7 | | | 8 | | | 5 | | | 3 | | | 1 | | | 1 | | | 5 | | | | | 30 | |
| 91+ days past due | 9 | | | 17 | | | 12 | | | 13 | | | 5 | | | 4 | | | 5 | | | | | 65 | |
| | | | | | | | | | | | | | | | | |
| EAME | | | | | | | | | | | | | | | | | |
| Current | 1,499 | | | 836 | | | 577 | | | 352 | | | 140 | | | 26 | | | — | | | | | 3,430 | |
| 31-60 days past due | 5 | | | 4 | | | 3 | | | 1 | | | 1 | | | — | | | — | | | | | 14 | |
| 61-90 days past due | 3 | | | 3 | | | 3 | | | 1 | | | — | | | — | | | — | | | | | 10 | |
| 91+ days past due | 3 | | | 11 | | | 2 | | | 2 | | | — | | | 2 | | | — | | | | | 20 | |
| | | | | | | | | | | | | | | | | |
| Asia/Pacific | | | | | | | | | | | | | | | | | |
| Current | 1,456 | | | 943 | | | 420 | | | 119 | | | 40 | | | 3 | | | 36 | | | | | 3,017 | |
| 31-60 days past due | 10 | | | 14 | | | 10 | | | 2 | | | — | | | — | | | — | | | | | 36 | |
| 61-90 days past due | 3 | | | 7 | | | 4 | | | 1 | | | — | | | — | | | — | | | | | 15 | |
| 91+ days past due | 2 | | | 10 | | | 10 | | | 3 | | | — | | | — | | | — | | | | | 25 | |
| | | | | | | | | | | | | | | | | |
| Mining | | | | | | | | | | | | | | | | | |
| Current | 944 | | | 356 | | | 332 | | | 194 | | | 36 | | | 161 | | | 36 | | | | | 2,059 | |
| 31-60 days past due | 6 | | | — | | | — | | | — | | | — | | | — | | | — | | | | | 6 | |
| 61-90 days past due | 1 | | | — | | | — | | | — | | | 4 | | | — | | | — | | | | | 5 | |
| 91+ days past due | — | | | 1 | | | 8 | | | 9 | | | 3 | | | 1 | | | — | | | | | 22 | |
| | | | | | | | | | | | | | | | | |
| Latin America | | | | | | | | | | | | | | | | | |
| Current | 617 | | | 299 | | | 160 | | | 70 | | | 17 | | | 18 | | | — | | | | | 1,181 | |
| 31-60 days past due | 4 | | | 7 | | | 3 | | | 3 | | | 1 | | | — | | | — | | | | | 18 | |
| 61-90 days past due | 3 | | | 3 | | | 1 | | | 1 | | | — | | | — | | | — | | | | | 8 | |
| 91+ days past due | 4 | | | 9 | | | 9 | | | 7 | | | 7 | | | 14 | | | — | | | | | 50 | |
| | | | | | | | | | | | | | | | | |
| Caterpillar Power Finance | | | | | | | | | | | | | | | | | |
| Current | 120 | | | 152 | | | 119 | | | 70 | | | 180 | | | 104 | | | 101 | | | | | 846 | |
| 31-60 days past due | — | | | — | | | — | | | — | | | — | | | — | | | — | | | | | — | |
| 61-90 days past due | — | | | — | | | — | | | — | | | — | | | — | | | — | | | | | — | |
| 91+ days past due | — | | | — | | | — | | | — | | | — | | | 44 | | | — | | | | | 44 | |
| | | | | | | | | | | | | | | | | |
| Totals by Aging Category | | | | | | | | | | | | | | | | | |
| Current | 9,428 | | | 5,182 | | | 3,034 | | | 1,435 | | | 595 | | | 344 | | | 355 | | | | | 20,373 | |
| 31-60 days past due | 52 | | | 57 | | | 36 | | | 18 | | | 6 | | | 1 | | | 5 | | | | | 175 | |
| 61-90 days past due | 17 | | | 21 | | | 13 | | | 6 | | | 5 | | | 1 | | | 5 | | | | | 68 | |
| 91+ days past due | 18 | | | 48 | | | 41 | | | 34 | | | 15 | | | 65 | | | 5 | | | | | 226 | |
| Total | $ | 9,515 | | | $ | 5,308 | | | $ | 3,124 | | | $ | 1,493 | | | $ | 621 | | | $ | 411 | | | $ | 370 | | | | | $ | 20,842 | |
| | | | | | | | | | | | | | | | | |
Finance receivables in the Customer portfolio segment are substantially secured by collateral, primarily in the form of Caterpillar and other machinery.equipment. For those contracts where the borrower is experiencing financial difficulty, repayment of the outstanding amounts is generally expected to be provided through the operation or repossession and sale of the machinery.equipment.
Dealer
As of December 31, 2020,2022 and 2021, our total amortized cost of finance receivables within the Dealer portfolio segment was current, with the exception of $81$62 million and $78 million, respectively, that was 91+ days past due in Latin America. Of these past due receivables, $78 million wereAmerica, all of which was originated in 2017 and $3 million were originated prior to 2016.2017.
Caterpillar Purchased Receivables
The tabletables below summarizessummarize the aging category of our amortized cost of finance receivables in the Caterpillar Purchased Receivables portfolio segment.
| | (Millions of dollars) | (Millions of dollars) | | | | | | | | | | | | | | (Millions of dollars) | | | | | | | | | | | | | |
| | | December 31, 2020 | |
| | | 31-60
Days
Past Due | | 61-90
Days
Past Due | | 91+
Days
Past Due | | Total
Past Due | | Current | | Total Finance
Receivables | | |
| | | | | December 31, 2022 |
| | | | 31-60
Days
Past Due | | 61-90
Days
Past Due | | 91+
Days
Past Due | | Total
Past Due | | Current | | Total Finance
Receivables | |
| North America | North America | | $ | 14 | | | $ | 11 | | | $ | 6 | | | $ | 31 | | | $ | 1,889 | | | $ | 1,920 | | | North America | | $ | 11 | | | $ | 7 | | | $ | 4 | | | $ | 22 | | | $ | 2,458 | | | $ | 2,480 | | |
| EAME | EAME | | 1 | | | 0 | | | 1 | | | 2 | | | 632 | | | 634 | | | EAME | | 1 | | | — | | | 2 | | | 3 | | | 812 | | | 815 | | |
| Asia/Pacific | Asia/Pacific | | 2 | | | 1 | | | 1 | | | 4 | | | 581 | | | 585 | | | Asia/Pacific | | 6 | | | 2 | | | 2 | | | 10 | | | 555 | | | 565 | | |
| Mining | | 0 | | | 0 | | | 0 | | | 0 | | | 0 | | | 0 | | | |
| | Latin America | Latin America | | 0 | | | 0 | | | 0 | | | 0 | | | 501 | | | 501 | | | Latin America | | 9 | | | 2 | | | 14 | | | 25 | | | 406 | | | 431 | | |
| Caterpillar Power Finance | Caterpillar Power Finance | | 0 | | | 0 | | | 0 | | | 0 | | | 6 | | | 6 | | | Caterpillar Power Finance | | 1 | | | — | | | — | | | 1 | | | 5 | | | 6 | | |
| Total | Total | | $ | 17 | | | $ | 12 | | | $ | 8 | | | $ | 37 | | | $ | 3,609 | | | $ | 3,646 | | | Total | | $ | 28 | | | $ | 11 | | | $ | 22 | | | $ | 61 | | | $ | 4,236 | | | $ | 4,297 | | |
|
The table below summarizes our recorded investment in finance receivables by aging category.
| | | | | | | | | | | | | | | | | | | | | | | | | | | | | | | | | | | | | | | | |
| (Millions of dollars) | | | | | | | | | | | | | | |
| | | December 31, 2019 |
| | | 31-60
Days
Past Due | | 61-90
Days
Past Due | | 91+
Days
Past Due | | Total
Past Due | | Current | | Total Finance
Receivables | | |
| Customer | | | | | | | | | | | | | | |
| North America | | $ | 72 | | | $ | 23 | | | $ | 55 | | | $ | 150 | | | $ | 8,085 | | | $ | 8,235 | | | |
| EAME | | 30 | | | 31 | | | 141 | | | 202 | | | 2,882 | | | 3,084 | | | |
| Asia/Pacific | | 40 | | | 14 | | | 29 | | | 83 | | | 2,733 | | | 2,816 | | | |
| Mining | | 5 | | | 0 | | | 19 | | | 24 | | | 2,266 | | | 2,290 | | | |
| Latin America | | 41 | | | 23 | | | 80 | | | 144 | | | 1,131 | | | 1,275 | | | |
| Caterpillar Power Finance | | 10 | | | 10 | | | 225 | | | 245 | | | 1,419 | | | 1,664 | | | |
| Dealer | | | | | | | | | | | | | | |
| North America | | 0 | | | 0 | | | 0 | | | 0 | | | 2,514 | | | 2,514 | | | |
| EAME | | 0 | | | 0 | | | 0 | | | 0 | | | 600 | | | 600 | | | |
| Asia/Pacific | | 0 | | | 0 | | | 0 | | | 0 | | | 487 | | | 487 | | | |
| Mining | | 0 | | | 0 | | | 0 | | | 0 | | | 4 | | | 4 | | | |
| Latin America | | 0 | | | 0 | | | 78 | | | 78 | | | 758 | | | 836 | | | |
| Caterpillar Power Finance | | 0 | | | 0 | | | 0 | | | 0 | | | 3 | | | 3 | | | |
| Caterpillar Purchased Receivables | | | | | | | | | | | | | | |
| North America | | 15 | | | 6 | | | 18 | | | 39 | | | 2,450 | | | 2,489 | | | |
| EAME | | 1 | | | 0 | | | 2 | | | 3 | | | 574 | | | 577 | | | |
| Asia/Pacific | | 1 | | | 0 | | | 0 | | | 1 | | | 891 | | | 892 | | | |
| Mining | | 0 | | | 0 | | | 0 | | | 0 | | | 0 | | | 0 | | | |
| Latin America | | 0 | | | 0 | | | 0 | | | 0 | | | 475 | | | 475 | | | |
| Caterpillar Power Finance | | 0 | | | 0 | | | 0 | | | 0 | | | 15 | | | 15 | | | |
| Total | | $ | 215 | | | $ | 107 | | | $ | 647 | | | $ | 969 | | | $ | 27,287 | | | $ | 28,256 | | | |
| | | | | | | | | | | | | | |
Impaired finance receivables
A finance receivable is considered impaired, based on current information and events, if it is probable that we will be unable to collect all amounts due according to the contractual terms. Impaired finance receivables include finance receivables that have been restructured and are considered to be troubled debt restructurings.
In our Customer portfolio segment, impaired finance receivables and the related unpaid principal balances and allowance were as follows:
| | | | | | | | | | | | | | | | | | | | | | | | |
| (Millions of dollars) | | | | | | | | | | | | |
| | | | | As of December 31, 2019 |
Impaired Finance Receivables With
No Allowance Recorded | | | | | | | | Recorded
Investment | | Unpaid
Principal
Balance | | Related
Allowance |
| North America | | | | | | | | $ | 6 | | | $ | 6 | | | $ | 0 | |
| EAME | | | | | | | | 0 | | | 0 | | | 0 | |
| Asia/Pacific | | | | | | | | 0 | | | 0 | | | 0 | |
| Mining | | | | | | | | 22 | | | 22 | | | 0 | |
| Latin America | | | | | | | | 8 | | | 8 | | | 0 | |
| Caterpillar Power Finance | | | | | | | | 58 | | | 58 | | | 0 | |
| Total | | | | | | | | $ | 94 | | | $ | 94 | | | $ | 0 | |
Impaired Finance Receivables With
An Allowance Recorded | | | | | | | | | | | | |
| North America | | | | | | | | $ | 30 | | | $ | 30 | | | $ | 11 | |
| EAME | | | | | | | | 61 | | | 61 | | | 29 | |
| Asia/Pacific | | | | | | | | 8 | | | 8 | | | 2 | |
| Mining | | | | | | | | 37 | | | 36 | | | 9 | |
| Latin America | | | | | | | | 58 | | | 58 | | | 20 | |
| Caterpillar Power Finance | | | | | | | | 306 | | | 319 | | | 107 | |
| Total | | | | | | | | $ | 500 | | | $ | 512 | | | $ | 178 | |
| Total Impaired Finance Receivables | | | | | | | | | | | | |
| North America | | | | | | | | $ | 36 | | | $ | 36 | | | $ | 11 | |
| EAME | | | | | | | | 61 | | | 61 | | | 29 | |
| Asia/Pacific | | | | | | | | 8 | | | 8 | | | 2 | |
| Mining | | | | | | | | 59 | | | 58 | | | 9 | |
| Latin America | | | | | | | | 66 | | | 66 | | | 20 | |
| Caterpillar Power Finance | | | | | | | | 364 | | | 377 | | | 107 | |
| Total | | | | | | | | $ | 594 | | | $ | 606 | | | $ | 178 | |
| | | | | | | | | | | | |
| | | | | | | | | | | | | | | | | | | | | | | | | | | | |
| (Millions of dollars) | | | | | | | | | | | | |
| | | | | Year Ended
December 31, 2019 | | Year Ended
December 31, 2018 |
Impaired Finance Receivables With
No Allowance Recorded | | | | | | Average
Recorded
Investment | | Interest
Income
Recognized | | Average
Recorded
Investment | | Interest
Income
Recognized |
| North America | | | | | | $ | 9 | | | $ | 0 | | | $ | 16 | | | $ | 1 | |
| EAME | | | | | | 6 | | | 0 | | | 14 | | | 0 | |
| Asia/Pacific | | | | | | 0 | | | 0 | | | 28 | | | 3 | |
| Mining | | | | | | 27 | | | 1 | | | 57 | | | 2 | |
| Latin America | | | | | | 21 | | | 1 | | | 38 | | | 2 | |
| Caterpillar Power Finance | | | | | | 54 | | | 3 | | | 130 | | | 7 | |
| Total | | | | | | $ | 117 | | | $ | 5 | | | $ | 283 | | | $ | 15 | |
Impaired Finance Receivables With
An Allowance Recorded | | | | | | | | | | | | |
| North America | | | | | | $ | 34 | | | $ | 2 | | | $ | 49 | | | $ | 2 | |
| EAME | | | | | | 81 | | | 2 | | | 53 | | | 2 | |
| Asia/Pacific | | | | | | 9 | | | 1 | | | 5 | | | 0 | |
| Mining | | | | | | 48 | | | 2 | | | 46 | | | 3 | |
| Latin America | | | | | | 72 | | | 5 | | | 67 | | | 3 | |
| Caterpillar Power Finance | | | | | | 396 | | | 11 | | | 378 | | | 12 | |
| Total | | | | | | $ | 640 | | | $ | 23 | | | $ | 598 | | | $ | 22 | |
| Total Impaired Finance Receivables | | | | | | | | | | | | |
| North America | | | | | | $ | 43 | | | $ | 2 | | | $ | 65 | | | $ | 3 | |
| EAME | | | | | | 87 | | | 2 | | | 67 | | | 2 | |
| Asia/Pacific | | | | | | 9 | | | 1 | | | 33 | | | 3 | |
| Mining | | | | | | 75 | | | 3 | | | 103 | | | 5 | |
| Latin America | | | | | | 93 | | | 6 | | | 105 | | | 5 | |
| Caterpillar Power Finance | | | | | | 450 | | | 14 | | | 508 | | | 19 | |
| Total | | | | | | $ | 757 | | | $ | 28 | | | $ | 881 | | | $ | 37 | |
| | | | | | | | | | | | |
There were $78 million in impaired finance receivables with a related allowance of $39 million as of December 31, 2019 for the Dealer portfolio segment, all of which was in Latin America. There were 0 impaired finance receivables as of December 31, 2019 for the Caterpillar Purchased Receivables portfolio segment. | | | | | | | | | | | | | | | | | | | | | | | | | | | | | | | | | | | | | | | | |
| (Millions of dollars) | | | | | | | | | | | | | | |
| | | December 31, 2021 |
| | | 31-60
Days
Past Due | | 61-90
Days
Past Due | | 91+
Days
Past Due | | Total
Past Due | | Current | | Total Finance
Receivables | | |
| North America | | $ | 8 | | | $ | 6 | | | $ | 5 | | | $ | 19 | | | $ | 2,499 | | | $ | 2,518 | | | |
| EAME | | 1 | | | — | | | 1 | | | 2 | | | 844 | | | 846 | | | |
| Asia/Pacific | | — | | | — | | | 1 | | | 1 | | | 620 | | | 621 | | | |
| | | | | | | | | | | | | | |
| Latin America | | 1 | | | 1 | | | — | | | 2 | | | 472 | | | 474 | | | |
| Caterpillar Power Finance | | — | | | — | | | — | | | — | | | 3 | | | 3 | | | |
| Total | | $ | 10 | | | $ | 7 | | | $ | 7 | | | $ | 24 | | | $ | 4,438 | | | $ | 4,462 | | | |
| | | | | | | | | | | | | | |
Non-accrual finance receivables
Recognition of income is suspended and the finance receivable is placed on non-accrual status when management determines that collection of future income is not probable. Contracts on non-accrual status are generally more than 120 days past due or have been restructured in a troubled debt restructuring (TDR). Recognition is resumed and previously suspended income is recognized when the finance receivable becomes current and collection of remaining amounts is considered probable. Payments received while the finance receivable is on non-accrual status are applied to interest and principal in accordance with the contractual terms. Interest earned but uncollected prior to the receivable being placed on non-accrual status is written off through Provision for credit losses when, in the judgment of management, it is considered uncollectible.
In our Customer portfolio segment, finance receivables which were on non-accrual status and finance receivables over 90 days past due and still accruing income were as follows:
| | (Millions of dollars) | (Millions of dollars) | December 31, 2020 | | (Millions of dollars) | December 31, 2022 | | December 31, 2021 |
| | Amortized Cost | | | Amortized Cost | | Amortized Cost |
| | Non-accrual
With an
Allowance | | Non-accrual
Without an
Allowance | | 91+ Still
Accruing | | | Non-accrual
With an
Allowance | | Non-accrual
Without an
Allowance | | 91+ Still
Accruing | | Non-accrual
With an
Allowance | | Non-accrual
Without an
Allowance | | 91+ Still
Accruing |
| North America | North America | $ | 86 | | | $ | 1 | | | $ | 34 | | | North America | $ | 52 | | | $ | 4 | | | $ | 11 | | | $ | 47 | | | $ | 9 | | | $ | 12 | |
| EAME | EAME | 113 | | | 1 | | | 1 | | | EAME | 43 | | | — | | | 10 | | | 18 | | | 1 | | | 2 | |
| Asia/Pacific | Asia/Pacific | 13 | | | 0 | | | 13 | | | Asia/Pacific | 11 | | | — | | | 7 | | | 19 | | | — | | | 7 | |
| Mining | Mining | 21 | | | 1 | | | 0 | | | Mining | — | | | 1 | | | — | | | 8 | | | 1 | | | 14 | |
| Latin America | Latin America | 63 | | | 0 | | | 1 | | | Latin America | 45 | | | — | | | — | | | 52 | | | 4 | | | 1 | |
| Caterpillar Power Finance | Caterpillar Power Finance | 170 | | | 17 | | | 0 | | | Caterpillar Power Finance | 5 | | | 11 | | | — | | | 40 | | | 11 | | | — | |
| Total | Total | $ | 466 | | | $ | 20 | | | $ | 49 | | | Total | $ | 156 | | | $ | 16 | | | $ | 28 | | | $ | 184 | | | $ | 26 | | | $ | 36 | |
|
There was $17 million, $12 million and $12 million of interest income recognized during the yearyears ended December 31, 2022, 2021 and 2020, respectively, for customer finance receivables on non-accrual status.
| | | | | | | | | | | | | | | | |
| (Millions of dollars) | | | | December 31, 2019 | | |
| | | | Recorded Investment | | |
| | | | | Non-accrual
Finance
Receivables | | 91+ Still
Accruing | | |
| North America | | | | $ | 44 | | | $ | 15 | | | |
| EAME | | | | 165 | | | 4 | | | |
| Asia/Pacific | | | | 21 | | | 8 | | | |
| Mining | | | | 47 | | | 0 | | | |
| Latin America | | | | 89 | | | 2 | | | |
| Caterpillar Power Finance | | | | 361 | | | 0 | | | |
| Total | | | | $ | 727 | | | $ | 29 | | | |
| | | | | | | | |
As of December 31, 20202022 and 2019,2021, finance receivables in our Dealer portfolio segment on non-accrual status were $81$62 million and $78 million, respectively, all of which was in Latin America. There were 0 finance receivables in our Dealer portfolio segment more than 90 days past due and still accruing income as of December 31, 2020 and 2019 and 0 interest income was recognized on dealer finance receivables on non-accrual status during the years ended December 31, 2020 and 2019.
Troubled debt restructurings
A restructuring of a finance receivable constitutes a TDR when the lender grants a concession it would not otherwise consider to a borrower experiencing financial difficulties. Concessions granted may include extended contract maturities, inclusion of interest only periods, below market interest rates, payment deferrals and reduction of principal and/or accrued interest. We individually evaluate TDR contracts and establish an allowance based on the present value of expected future cash flows discounted at the receivable’s effective interest rate, the fair value of the collateral for collateral-dependent receivables or the observable market price of the receivable.
There were 0no finance receivables modified as TDRs during the years ended December 31, 2020, 20192022, 2021 and 20182020 for the Dealer or Caterpillar Purchased Receivables portfolio segments. Finance receivables in the Customer portfolio segment modified as TDRs for the years ended December 31, were as follows:
| | | | | | | | | | | | | | | | | | | | |
| (Dollars in millions) | | Year Ended
December 31, 2020 |
| | | Number of
Contracts | | Pre-TDR
Amortized
Cost | | Post-TDR
Amortized
Cost |
| North America | | 40 | | | $ | 13 | | | $ | 13 | |
| EAME | | 4 | | | 0 | | | 0 | |
Asia/Pacific(1) | | 183 | | | 12 | | | 12 | |
Mining(2) | | 63 | | | 35 | | | 35 | |
Latin America(3) | | 77 | | | 45 | | | 45 | |
| Caterpillar Power Finance | | 22 | | | 115 | | | 115 | |
| Total | | 389 | | | $ | 220 | | | $ | 220 | |
| | | | | | |
| | Year Ended
December 31, 2019 |
| | Number of
Contracts | | Pre-TDR Recorded Investment | | Post-TDR Recorded Investment |
| North America | | 15 | | | $ | 11 | | | $ | 11 | |
| EAME | | 19 | | | 17 | | | 17 | |
| Asia/Pacific | | 0 | | | 0 | | | 0 | |
| Mining | | 2 | | | 8 | | | 8 | |
| Latin America | | 5 | | | 5 | | | 3 | |
| Caterpillar Power Finance | | 21 | | | 168 | | | 165 | |
| Total | | 62 | | | $ | 209 | | | $ | 204 | |
| | | | | | |
| | Year Ended
December 31, 2018 |
| | Number of
Contracts | | Pre-TDR Recorded Investment | | Post-TDR Recorded Investment |
| North America | | 38 | | | $ | 21 | | | $ | 21 | |
| EAME | | 0 | | | 0 | | | 0 | |
| Asia/Pacific | | 0 | | | 0 | | | 0 | |
| Mining | | 1 | | | 29 | | | 29 | |
| Latin America | | 1 | | | 3 | | | 3 | |
| Caterpillar Power Finance | | 12 | | | 133 | | | 99 | |
| Total | | 52 | | | $ | 186 | | | $ | 152 | |
| | | | | | |
(1) During the year ended December 31, 2020, 183 contracts with a pre-TDR and post-TDR amortized cost of $12 million were related to seven customers.
(2) During the year ended December 31, 2020, 63 contracts with a pre-TDR and post-TDR amortized cost of $35 million were related to five customers.
(3) During the year ended December 31, 2020, 77 contracts with a pre-TDR and post-TDR amortized cost of $45 million were related to ten customers. | | | | | | | | | | | | | | | | | | | | | | | | | | | | | | | | | | | |
| (Dollars in millions) | 2022 | | 2021 | | 2020 |
| | Pre-TDR
Amortized
Cost | | Post-TDR
Amortized
Cost | | Pre-TDR
Amortized
Cost | | Post-TDR
Amortized
Cost | | Pre-TDR Amortized Cost | | Post-TDR
Amortized Cost |
| North America | $ | 6 | | | $ | 6 | | | $ | 6 | | | $ | 6 | | | $ | 13 | | | $ | 13 | |
| EAME | 1 | | | 1 | | | 3 | | | 3 | | | — | | | — | |
| Asia/Pacific | — | | | — | | | 4 | | | 4 | | | 12 | | | 12 | |
| Mining | 16 | | | 16 | | | 11 | | | 5 | | | 35 | | | 35 | |
| Latin America | 22 | | | 22 | | | 12 | | | 12 | | | 45 | | | 45 | |
| Caterpillar Power Finance | 20 | | | 19 | | | 26 | | | 22 | | | 115 | | | 115 | |
| Total | $ | 65 | | | $ | 64 | | | $ | 62 | | | $ | 52 | | | $ | 220 | | | $ | 220 | |
| | | | | | | | | | | |
TDRs in the Customer portfolio segment with a payment default (defined as 91+ days past due) which had been modified within twelve months prior to the default date for the years ended December 31, were as follows:
| | (Dollars in millions) | (Dollars in millions) | | Year Ended
December 31, 2020 | | Year Ended
December 31, 2019 | | Year Ended
December 31, 2018 | (Dollars in millions) | | 2022 | | 2021 | | 2020 |
| | | | Number of
Contracts | | Post-TDR
Amortized
Cost | | Number of
Contracts | | Post-TDR
Recorded
Investment | | Number of
Contracts | | Post-TDR
Recorded
Investment | | Post-TDR
Amortized
Cost | | Post-TDR
Amortized
Cost | | Post-TDR
Amortized Cost |
| North America | North America | | 4 | | | $ | 8 | | | 11 | | | $ | 5 | | | 10 | | | $ | 10 | | North America | | $ | — | | | $ | 1 | | | $ | 8 | |
| EAME | EAME | | 2 | | | 10 | | | 0 | | | 0 | | | 0 | | | 0 | | EAME | | — | | | — | | | 10 | |
| Asia/Pacific | Asia/Pacific | | 27 | | | 2 | | | 0 | | | 0 | | | 0 | | | 0 | | Asia/Pacific | | — | | | 6 | | | 2 | |
| Mining | Mining | | 21 | | | 10 | | | 0 | | | 0 | | | 0 | | | 0 | | Mining | | 5 | | | — | | | 10 | |
| Latin America | Latin America | | 4 | | | 1 | | | 0 | | | 0 | | | 3 | | | 1 | | Latin America | | — | | | 15 | | | 1 | |
| Caterpillar Power Finance | Caterpillar Power Finance | | 2 | | | 18 | | | 1 | | | 10 | | | 3 | | | 33 | | Caterpillar Power Finance | | — | | | 7 | | | 18 | |
| Total | Total | | 60 | | | $ | 49 | | | 12 | | | $ | 15 | | | 16 | | | $ | 44 | | Total | | $ | 5 | | | $ | 29 | | | $ | 49 | |
|
Concentration of Credit Risk
As of December 31, 2022 and 2021, receivables from customers in construction-related industries made up approximately 40 percent of our total portfolio of which customers in North America were approximately 60 percent. No single customer or dealer represented a significant concentration of credit risk. We typically maintain a security interest in retail financed equipment and, in some instances, wholesale financed equipment. We also require physical damage insurance coverage on all financed equipment.
NOTE 3 – EQUIPMENT ON OPERATING LEASES
The carrying amount of Equipment on operating leases, net in the Consolidated Statements of Financial Position as of December 31, was as follows:
| | (Millions of dollars) | (Millions of dollars) | | | (Millions of dollars) | | |
| | 2020 | | 2019 | | | 2022 | | 2021 | |
| Equipment on operating leases, at cost | Equipment on operating leases, at cost | | $ | 4,984 | | | $ | 5,171 | | | Equipment on operating leases, at cost | | $ | 4,321 | | | $ | 4,589 | | |
| Less: Accumulated depreciation | Less: Accumulated depreciation | | (1,618) | | | (1,588) | | | Less: Accumulated depreciation | | (1,410) | | | (1,466) | | |
| Equipment on operating leases, net | Equipment on operating leases, net | | $ | 3,366 | | | $ | 3,583 | | | Equipment on operating leases, net | | $ | 2,911 | | | $ | 3,123 | | |
|
Our lease agreements may include options for the lessee to purchase the underlying asset at the end of the lease term for either a stated fixed price or fair market value.
We determine the residual value of leased equipment based on its estimated end-of-term market value. We estimate the residual value of leased equipment at the inception of the lease based on a number of factors, including historical wholesale market sales prices, past remarketing experience and any known significant market/product trends. We also consider the following critical factors in our residual value estimates: lease term, market size and demand, total expected hours of usage, machine configuration, application, location, model changes, quantities, third-party residual guarantees and contractual customer purchase options. The residuals for leases classified as operating leases are included in Equipment on operating leases, net in the Consolidated Statements of Financial Position.
During the term of our leases, we monitor residual values. For operating leases, we record adjustments to depreciation expense reflecting changes in residual value estimates prospectively on a straight-line basis.
The carrying amount of residual assets covered by residual value guarantees and subject to operating leases was $4 million and $11$3 million as of December 31, 20202022 and 2019, respectively.2021.
At December 31, 2020,2022, rental payments dueto be received for equipment on operating leases were as follows:
| | (Millions of dollars) | (Millions of dollars) | (Millions of dollars) |
| 2021 | | 2022 | | 2023 | | 2024 | | 2025 | | Thereafter | | Total | |
| 2023 | | 2023 | | 2024 | | 2025 | | 2026 | | 2027 | | Thereafter | | Total |
| $ | 778 | | | $ | 456 | | | $ | 236 | | | $ | 114 | | | $ | 50 | | | $ | 15 | | | $ | 1,649 | | 680 | | | $ | 446 | | | $ | 254 | | | $ | 110 | | | $ | 30 | | | $ | 8 | | | $ | 1,528 | |
50
We sell operating lease receivables to third parties to mitigate the concentration of credit risk with certain customers.
Revenues from operating leases were $965 million and $1.04 billion for the years ended December 31, 2020 and 2019, respectively. We typically pay property taxes on tax leases directly to the taxing authorities and invoice the lessee for reimbursement. These property tax reimbursements are accounted for as variable lease payments and are included in Operating lease revenues in the Consolidated Statements of Profit. We individually assess our operating lease receivables for impairment. If collectability of a recorded operating lease receivable is not considered probable, we recognize a current-period adjustment against operating lease revenue.
NOTE 4 – OTHER ASSETS
The components of Other assets as of December 31, were as follows:
| | (Millions of dollars) | (Millions of dollars) | | | (Millions of dollars) | | |
| | 2020 | | 2019 | | | 2022 | | 2021 | |
| Customer and other miscellaneous receivables | Customer and other miscellaneous receivables | | $ | 457 | | | $ | 494 | | | Customer and other miscellaneous receivables | | $ | 419 | | | $ | 400 | | |
| Collateral held for resale, at net realizable value | Collateral held for resale, at net realizable value | | 380 | | | 383 | | | Collateral held for resale, at net realizable value | | 102 | | | 168 | | |
| Deferred and refundable income taxes | Deferred and refundable income taxes | | 168 | | | 142 | | | Deferred and refundable income taxes | | 148 | | | 126 | | |
| Property and equipment, net | Property and equipment, net | | 134 | | | 135 | | | Property and equipment, net | | 132 | | | 133 | | |
Other | Other | | 144 | | | 138 | | | Other | | 454 | | | 261 | | |
| Total Other assets | Total Other assets | | $ | 1,283 | | | $ | 1,292 | | | Total Other assets | | $ | 1,255 | | | $ | 1,088 | | |
|
(1) Includes Derivative financial instruments. See Note 8 for additional information.
NOTE 5 – CONCENTRATION OF CREDIT RISK
Financial instruments with potential credit risk consist primarily of finance receivables. Additionally, to a lesser extent, we have potential credit risk associated with counterparties to derivative contracts.
As of December 31, 2020, receivables from customers in construction-related industries made up approximately 40 percent of our total portfolio of which customers in North America were approximately 50 percent. As of December 31, 2019, receivables from customers in construction-related industries made up approximately one-third of our total portfolio of which customers in North America were approximately 60 percent. No single customer or dealer represented a significant concentration of credit risk. We typically maintain a security interest in retail financed equipment and, in some instances, wholesale financed equipment. We also require physical damage insurance coverage on all financed equipment. See Note 15 for further information concerning business segments.
For derivative contracts, collateral is generally not required of the counterparties or of us. We enter into International Swaps and Derivatives Association (ISDA) master netting agreements that permit the net settlement of amounts owed under their respective derivative contracts. Our exposure to credit loss in the event of nonperformance by the counterparties is limited to only those gains that we have recorded, but for which we have not yet received cash payment. The master netting agreements reduce the amount of loss the company would incur should the counterparties fail to meet their obligations. At December 31, 2020 and 2019, the maximum exposure to credit loss, was $85 million and $84 million, respectively, before the application of any master netting agreements. See Note 9 for further information concerning derivatives.
NOTE 65 – CREDIT COMMITMENTS
Revolving credit facilities
As of December 31, 2020,2022, we had 3three global credit facilities with a syndicate of banks totaling $10.50 billion (Credit Facility) available in the aggregate to both Caterpillar and us for general liquidity purposes. Based on management'smanagement’s allocation decision, which can be revised from time to time, the portion of the Credit Facility available to us as of December 31, 20202022 was $7.75 billion. Information on our Credit Facility is as follows:
•The 364-day facility of $3.15 billion (of which $2.33 billion is available to us) expires in September 2021.August 2023.
•The three-year facility, as amended and restated in September 2019,2022, of $2.73 billion (of which $2.01 billion is available to us) expires in September 2022.August 2025.
•The five-year facility, as amended and restated in September 2019,2022, of $4.62 billion (of which $3.41 billion is available to us) expires in September 2024.2027.
At December 31, 2020,2022, Caterpillar’s consolidated net worth was $15.41$15.93 billion, which was above the $9.00 billion required under the Credit Facility. The consolidated net worth is defined in the Credit Facility as the consolidated shareholders'shareholders’ equity including preferred stock but excluding the pension and other postretirement benefits balance within Accumulated other comprehensive income (loss).
At December 31, 2020,2022, our covenant interest coverage ratio was 1.722.36 to 1. This was above the 1.15 to 1 minimum ratio, calculated as (1) profit excluding income taxes, interest expense and net gain/(loss) from interest rate derivatives to (2) interest expense, calculated at the end of each calendar quarter for the rolling four quarter period then most recently ended, required by the Credit Facility.
In addition, at December 31, 2020,2022, our six-month covenant leverage ratio was 6.747.05 to 1 and our year-end covenant leverage ratio was 6.957.21 to 1. This was below the maximum ratio of debt to net worth of 10 to 1, calculated (1) on a monthly basis as the average of the leverage ratios determined on the last day of each of the six preceding calendar months and (2) at each December 31, required by the Credit Facility.
In the event that either Caterpillar or we do not meet one or more of our respective financial covenants under the Credit Facility in the future (and are unable to obtain a consent or waiver), the syndicate of banks may terminate the commitments allocated to the party that does not meet its covenants. Additionally, in such event, certain of our other lenders under other loan agreements where similar financial covenants or cross default provisions are applicable, may, at their election, choose to pursue remedies under those loan agreements, including accelerating the repayment of outstanding borrowings. At December 31, 2020,2022, there were 0no borrowings under the Credit Facility.
Bank borrowings
Available credit lines with banks as of December 31, 20202022 totaled $3.03$3.49 billion. These committed and uncommitted credit lines, which may be eligible for renewal at various future dates or have no specified expiration date, are used primarily by our non-U.S. subsidiaries for local funding requirements. We may guarantee subsidiary borrowings under these lines. As of December 31, 20202022 and 2019,2021, we had $734$979 million and $1.25 billion,$559 million, respectively, outstanding against these credit lines and were in compliance with all debt covenants under these credit lines. The remaining available credit commitments may be withdrawn any time at the lenders' discretion.
Variable denomination floating rate demand notes
We obtain funding from the sale of variable denomination floating rate demand notes, which may be redeemed at any time at the option of the holder without any material restriction. We do not hold reserves to fund the payment of the demand notes. The notes are offered on a continuous basis. As of December 31, 2020 and 2019, there was $377 million and $388 million of variable denomination floating rate demand notes outstanding, respectively. The maximum amount of variable denomination floating rate demand notes that we may have outstanding at any time may not exceed $1.25 billion.
Notes receivable from/payable to Caterpillar
Under our variable amount and term lending agreements and other notes receivable with Caterpillar, we may borrow up to $2.41$2.38 billion from Caterpillar and Caterpillar may borrow up to $1.74$1.75 billion from us. The variable amount lending agreements are in effect for indefinite periods of time and may be changed or terminated by either party with 30 days notice. The term lending agreements have remaining maturities ranging up to ten years. We had notes payable of $1.02 billion$23 million and notes receivable of $356$482 million outstanding under these agreements as of December 31, 2020,2022, compared with notes payable of $618$22 million and notes receivable of $296$389 million as of December 31, 2019.2021.
NOTE 76 – SHORT-TERM BORROWINGS
Short-term borrowings outstanding as of December 31, were comprised of the following:
| | (Millions of dollars) | (Millions of dollars) | | | | | | (Millions of dollars) | | | | | |
| | 2020 | | 2019 | | | 2022 | | 2021 | |
| | | | Balance | | Avg. Rate | | Balance | | Avg. Rate | | | | Balance | | Weighted Avg. Rate | | Balance | | Weighted Avg. Rate | |
| Commercial paper, net | Commercial paper, net | | $ | 1,321 | | | 0.1 % | | $ | 4,168 | | | 1.3% | | Commercial paper, net | | $ | 5,455 | | | 4.2% | | $ | 4,896 | | | 0.1% | |
| Bank borrowings and other | Bank borrowings and other | | 307 | | | 3.5 % | | 605 | | | 5.0% | | Bank borrowings and other | | 234 | | | 11.4% | | 213 | | | 4.5% | |
| Variable denomination floating rate demand notes | Variable denomination floating rate demand notes | | 377 | | | 0.3 % | | 388 | | | 1.7% | | Variable denomination floating rate demand notes | | 265 | | | 3.4% | | 286 | | | 0.2% | |
| Total | Total | | $ | 2,005 | | | | | $ | 5,161 | | | | | Total | | $ | 5,954 | | | | | $ | 5,395 | | | | |
|
NOTE 87 – LONG-TERM DEBT
During 2020,2022, we issued $8.26$6.01 billion of medium-term notes, of which $6.71$5.21 billion were at fixed interest rates and $1.55 billion$800 million were at floating interest rates primarily indexedlinked to LIBOR.SOFR. At December 31, 2020,2022, the outstanding medium-term notes had remaining maturities ranging up to 75 years. Debt issuance costs are capitalized and amortized to Interest expense using the effective yield method over the term of the debt issuance. Medium-term notes, net contain fair value adjustments for debt in a fair value hedge relationship.
Long-term debt outstanding as of December 31, was comprised of the following:
| | (Millions of dollars) | (Millions of dollars) | | | | | | (Millions of dollars) | | | | | |
| | 2020 | | 2019 | | | 2022 | | 2021 | |
| | | | Balance | | Avg. Rate | | Balance | | Avg. Rate | | | | Balance | | Weighted Avg. Rate | | Balance | | Weighted Avg. Rate | |
| Medium-term notes | Medium-term notes | | $ | 23,536 | | | 2.2% | | $ | 22,739 | | | 2.6% | | Medium-term notes | | $ | 20,821 | | | 2.2% | | $ | 22,283 | | | 1.6% | |
| Unamortized discount and debt issuance costs | Unamortized discount and debt issuance costs | | (46) | | | | | (47) | | | | | Unamortized discount and debt issuance costs | | (37) | | | | | (40) | | | | |
| Fair value adjustments | Fair value adjustments | | 60 | | | 0 | | | | Fair value adjustments | | (112) | | | 3 | | | |
| Medium-term notes, net | Medium-term notes, net | | 23,550 | | | | | 22,692 | | | | | Medium-term notes, net | | 20,672 | | | | | 22,246 | | | | |
| Bank borrowings and other | Bank borrowings and other | | 429 | | | 6.0% | | 642 | | | 6.6% | | Bank borrowings and other | | 746 | | | 5.3% | | 348 | | | 4.1% | |
| | Total | Total | | $ | 23,979 | | | | | $ | 23,334 | | | | | Total | | $ | 21,418 | | | | | $ | 22,594 | | | | |
|
Maturities of Long-term debt outstanding (excluding fair value adjustments) as of December 31, 2020,2022, in each of the next five years, are as follows:
| (Millions of dollars) | (Millions of dollars) | | (Millions of dollars) | |
| 2021 | $ | 7,729 | | |
| 2022 | 6,679 | | |
| 2023 | 2023 | 4,168 | | 2023 | $ | 5,202 | |
| 2024 | 2024 | 2,664 | | 2024 | 7,398 | |
| 2025 | 2025 | 1,621 | | 2025 | 4,511 | |
| 2026 | | 2026 | 2,469 | |
| 2027 | | 2027 | 1,948 | |
| |
Long-term debt outstanding as of December 31, 20202022 included $101$14 million of medium-term notes that could be called by us at some point in the future at par.
57Medium-term notes of $900 million maturing in the first quarter of 2023 were excluded from Current maturities of long-term debt in the Consolidated Statements of Financial Position as of December 31, 2022 due to a $900 million issuance of medium-term notes on January 6, 2023 which mature in 2026. The preceding maturity table reflects the reclassification of $900 million from maturities in 2023 to 2026.
NOTE 98 – DERIVATIVE FINANCIAL INSTRUMENTS AND RISK MANAGEMENT
Our earnings and cash flow are subject to fluctuations due to changes in foreign currency exchange rates and interest rates. Our Risk Management Policy (policy) allows for the use of derivative financial instruments to prudently manage foreign currency exchange rate and interest rate exposures. Our policy specifies that derivatives are not to be used for speculative purposes. Derivatives that we use are primarily foreign currency forward, option and cross currency contracts and interest rate contracts. Our derivative activities are subject to the management, direction and control of our senior financial officers. We present at least annually to our Board of Directors and the Audit Committee of the Caterpillar Inc. Board of Directors on our risk management practices, including our use of financial derivative instruments.
We recognize allAll derivatives at their fair valueare recognized on the Consolidated Statements of Financial Position.Position at their fair value. On the date the derivative contract is entered into, we designate the derivative instrument is (1) designated as (1) a hedge of the fair value of a recognized asset or liability (fair value hedge), (2) designated as a hedge of a forecasted transaction or the variability of cash flowflows (cash flow hedge) or (3) an undesignated instrument.undesignated. We record in current earnings changes in the fair value of a derivative that is qualified, designated and highly effective as a fair value hedge, along with the gain or loss on the hedged recognized asset or liability that is attributable to the hedged risk. We record in Accumulated other comprehensive income (loss) (AOCI) changes in the fair value of a derivative that is qualified, designated and highly effective as a cash flow hedge, to the extent effective, on the Consolidated Statements of Financial Position until we reclassify them to earnings in the same period or periods during which the hedged transaction affects earnings. We report changes in the fair value of undesignated derivative instruments in current earnings. We classify cash flows from designated derivative financial instruments within the same category as the item being hedged on the Consolidated Statements of Cash Flows. We include cash flows from undesignated derivative financial instruments in the investing category on the Consolidated Statements of Cash Flows.
We formally document all relationships between hedging instruments and hedged items, as well as the risk-management objective and strategy for undertaking various hedge transactions. This process includes linking all derivatives that are designated as fair value hedges to specific assets and liabilities on the Consolidated Statements of Financial Position and linking cash flow hedges to specific forecasted transactions or variability of cash flow.
We also formally assess, both at the hedge’s inception and on an ongoing basis, whether the designated derivatives that are used in hedging transactions are highly effective in offsetting changes in fair value or cash flow of hedged items. When a derivative is determined not to be highly effective as a hedge or the underlying hedged transaction is no longer probable, we discontinue hedge accounting prospectively, in accordance with the derecognition criteria for hedge accounting.
Foreign currency exchange rate risk
We have balance sheet positions and expected future transactions denominated in foreign currencies, thereby creating exposure to movements in exchange rates. In managing foreign currency risk, our objective is to minimize earnings volatility resulting from conversion and the remeasurement of net foreign currency balance sheet positions and future transactions denominated in foreign currencies. Our policy allows the use of foreign currency forward, option and cross currency contracts to offset the risk of currency mismatch between our assets and liabilities and exchange rate risk associated with future transactions denominated in foreign currencies. Our foreign currency forward and option contracts are primarily undesignated. We designate fixed-to-fixed cross currency contracts as cash flow hedges to protect against movements in exchange rates on foreign currency fixed-rate assets and liabilities.
Interest rate risk
Interest rate movements create a degree of risk by affecting the amount of our interest receipts and payments on our finance receivables and the value of our fixed-rate debt.debt portfolios, respectively. Our practice is to use interest rate contracts to manage our exposure to interest rate changes.
We have a match-funding policy that addresses interest rate risk by aligning the interest rate profile (fixed or floating rate and duration) of our debt portfolio with the interest rate profile of our finance receivable portfolio within predetermined ranges on an ongoing basis. In connection with that policy, we use interest rate derivative instruments to modify the debt structure to match assets within the finance receivable portfolio. This matched funding reduces the volatility of margins between interest-bearing assets and interest-bearing liabilities, regardless of which direction interest rates move.
Our policy allows us to use fixed-to-floating, floating-to-fixed and floating-to-floating interest rate contracts to meet the match-funding objective. We designate fixed-to-floating interest rate contracts as fair value hedges to protect debt against changes in fair value due to changes in the benchmark interest rate. We designate most floating-to-fixed interest rate contracts as cash flow hedges to protect against the variability of cash flows due to changes in the benchmark interest rate.
As of December 31, 2020, the cumulative amount of fair value hedging adjustments related to our fixed-to-floating interest rate contracts included in the carrying amount of Long-term debt was $60 million. Fair value gains and losses on these interest rate contracts and the related hedged items generally offset within interest expense. We have, at certain times, liquidated fixed-to-floating and floating-to-fixed interest rate contracts. We amortize the gains or losses associated with these contracts that resulted in deferred gains at the time of liquidation. The deferred gains associated with these interest rate contracts are included in Long-term debt in the Consolidated Statements of Financial Position and are being amortized to Interest expenseliquidation into earnings over the remainingoriginal term of the previously designated hedged item.
The location and fair value of derivative instruments reported in the Consolidated Statements of Financial Position as of December 31, were as follows:
| | | | | | | | | | | | | | | | | | | |
| (Millions of dollars) | | | Asset (Liability) Fair Value |
| | Consolidated Statements of
Financial Position Location | | 2020 | | 2019 | | |
| Designated derivatives | | | | | | | |
| Interest rate contracts | Other assets | | $ | 59 | | | $ | 5 | | | |
| Interest rate contracts | Accrued expenses | | (5) | | | (25) | | | |
| Cross currency contracts | Other assets | | 2 | | | 67 | | | |
| Cross currency contracts | Accrued expenses | | (148) | | | (3) | | | |
| | | | $ | (92) | | | $ | 44 | | | |
| Undesignated derivatives | | | | | | | |
| Foreign exchange contracts | Other assets | | $ | 17 | | | $ | 7 | | | |
| Foreign exchange contracts | Accrued expenses | | (107) | | | (21) | | | |
| Cross currency contracts | Other assets | | 7 | | | 5 | | | |
| Cross currency contracts | Accrued expenses | | 0 | | | (1) | | | |
| | | | | | | |
| | | | | | | |
| | | | $ | (83) | | | $ | (10) | | | |
| | | | | | | |
| | | | | | | | | | | | | | | | | | | | | | | | | | |
| (Millions of dollars) | | | | | | | | |
| | December 31, 2022 | | December 31, 2021 |
| | Assets1 | | Liabilities2 | | Assets1 | | Liabilities2 |
| Designated derivatives | | | | | | | | |
| Foreign exchange contracts | | $ | 305 | | | $ | (44) | | | $ | 142 | | | $ | (32) | |
| Interest rate contracts | | 87 | | | (113) | | | 38 | | | (15) | |
| | $ | 392 | | | $ | (157) | | | $ | 180 | | | $ | (47) | |
| Undesignated derivatives | | | | | | | | |
| Foreign exchange contracts | | $ | 25 | | | $ | (42) | | | $ | 28 | | | $ | (36) | |
| | $ | 25 | | | $ | (42) | | | $ | 28 | | | $ | (36) | |
| | | | | | | | |
(1) Assets are classified on the Consolidated Statements of Financial Position as Other assets.
(2) Liabilities are classified on the Consolidated Statements of Financial Position as Accrued expenses.
The total notional amount of our derivative instruments was $11.26$13.18 billion and $8.93$13.85 billion as of December 31, 20202022 and 2019,2021, respectively. The notional amounts of derivative financial instruments do not represent amounts exchanged by the parties. We calculate the amounts exchanged by the parties by referencing the notional amounts and by other terms of the derivatives, such as foreign currency exchange rates and interest rates.
Gains (Losses) on derivative instruments are categorized as follows:
| | | | | | | | | | | | | | | | | | | | | | | | | | | | | | | | | | | | | | | | | | | | | | | | | | | | | | | | |
| (Millions of dollars) | | | | | | | | | | | | | | | | | | |
| | Fair Value /
Undesignated Hedges | | Cash Flow Hedges |
| | Gains (Losses) Recognized1 | | Gains (Losses)
Recognized in AOCI | | Gains (Losses) Reclassified from AOCI2 |
| | | | | | | | | | | | | | | | | | |
| | Year Ended December 31, |
| | 2022 | | 2021 | | 2020 | | 2022 | | 2021 | | 2020 | | 2022 | | 2021 | | 2020 |
| Foreign exchange contracts | | $ | (111) | | | $ | 89 | | | $ | (112) | | | $ | 310 | | | $ | 190 | | | $ | (130) | | | $ | 370 | | | $ | 194 | | | $ | (132) | |
| Interest rate contracts | | (7) | | | 24 | | | 15 | | | 111 | | | 19 | | | (23) | | | 14 | | | (28) | | | (52) | |
| | $ | (118) | | | $ | 113 | | | $ | (97) | | | $ | 421 | | | $ | 209 | | | $ | (153) | | | $ | 384 | | | $ | 166 | | | $ | (184) | |
| | | | | | | | | | | | | | | | | | |
(1) Foreign exchange contract gains (losses) are primarily from undesignated forward contracts and are included in Other income (expense). Interest rate contract gains (losses) are from designated fair value hedges and are included in Interest expense.
(2) Foreign exchange contract gains (losses) are primarily included in Other income (expense). Interest rate contract gains (losses) are included in Interest expense.
The effect of derivatives designated as hedging instruments onfollowing amounts were recorded in the Consolidated Statements of Profit was as follows: Financial Position related to cumulative basis adjustments for fair value hedges:
| | | | | | | | | | | | | | | | | | | | |
| Cash Flow Hedges |
| (Millions of dollars) | Year Ended December 31, 2020 |
| | Recognized in Earnings |
| | Amount of
Gains (Losses)
Recognized
in AOCI | Classification | | Amount of
Gains (Losses)
Reclassified
from AOCI | | Amount of the line
items in the
Consolidated
Statements of Profit |
| Interest rate contracts | $ | (23) | | Interest expense | | $ | (52) | | | $ | 591 | |
| Cross currency contracts | (130) | | Other income (expense) | | (164) | | | (25) | |
| | Interest expense | | 32 | | | 591 | |
| | $ | (153) | | | | $ | (184) | | | |
| | | | | | |
| | Year Ended December 31, 2019 |
| | Recognized in Earnings |
| | Amount of
Gains (Losses)
Recognized
in AOCI | Classification | | Amount of
Gains (Losses)
Reclassified
from AOCI | | Amount of the line
items in the
Consolidated
Statements of Profit |
| Interest rate contracts | $ | (70) | | Interest expense | | $ | (8) | | | $ | 787 | |
| Cross currency contracts | 93 | | Other income (expense) | | 37 | | | (24) | |
| | Interest expense | | 33 | | | 787 | |
| | $ | 23 | | | | $ | 62 | | | |
| | | | | | |
| | Year Ended December 31, 2018 |
| | Recognized in Earnings |
| | Amount of Gains
(Losses) Recognized in
AOCI (Effective Portion) | Classification | | Reclassified from
AOCI to Earnings
(Effective Portion) | | Recognized in
Earnings
(Ineffective Portion) |
| Interest rate contracts | $ | (38) | | Interest expense | | $ | 0 | | | $ | 0 | |
| Cross currency contracts | 165 | | Other income (expense) | | 148 | | | 0 | |
| | Interest expense | | 19 | | | 0 | |
| $ | 127 | | | | $ | 167 | | | $ | 0 | |
| | | | | | |
| | | | | | | | | | | | | | | | | | | | | | | | | | |
| (Millions of dollars) | | | | | | | | |
| | Carry Value of
the Hedged Liabilities | | Cumulative Amount of Fair Value
Hedging Adjustment Included in the
Carrying Value of the Hedged
Liabilities |
| | December 31, 2022 | | December 31, 2021 | | December 31, 2022 | | December 31, 2021 |
| Current maturities of long-term debt | | $ | — | | | $ | 755 | | | $ | — | | | $ | 5 | |
| Long-term debt | | 2,091 | | | 1,304 | | | (112) | | | (2) | |
| Total | | $ | 2,091 | | | $ | 2,059 | | | $ | (112) | | | $ | 3 | |
| | | | | | | | |
As of December 31, 2020, $152022, $39 million of deferred net losses,gains, net of tax, included in equity (AOCI in the Consolidated Statements of Financial Position), related to our cash flow hedges, are expected to be reclassified to earnings over the next twelve months. The actual amount recorded in earnings will vary based on interest rates and exchange rates at the time the hedged transactions impact earnings.
The effect of derivatives not designated as hedging instruments on the Consolidated Statements of Profit was as follows for the years ended December 31:
| | | | | | | | | | | | | | | | | | | | | | | | | | |
| (Millions of dollars) | | | | | | | | |
| | | Classification | | 2020 | | 2019 | | 2018 |
| Foreign exchange contracts | | Other income (expense) | | $ | (121) | | | $ | (38) | | | $ | 16 | |
| Cross currency contracts | | Other income (expense) | | 9 | | | 1 | | | 3 | |
| | | | | | | | |
| | | | | $ | (112) | | | $ | (37) | | | $ | 19 | |
| | | | | | | | |
We enter into International Swaps and Derivatives Association (ISDA) master netting agreements that permit the net settlement of amounts owed under their respective derivative contracts. Under these master netting agreements, net settlement generally permits us or the counterparty to determine the net amount payable for contracts due on the same date and in the same currency for similar types of derivative transactions. The master netting agreements generallymay also provide for net settlement of all outstanding contracts with a counterparty in the case of an event of default or a termination event.
Collateral is generallytypically not required of the counterparties or us under the master netting agreements. As of December 31, 20202022 and 2019,2021, no cash collateral was received or pledged under the master netting agreements.
The effect of net settlement provisions of the master netting agreements on our derivative balances upon an event of default or a termination event as of December 31, was as follows:
| | | | | | | | | | | | | | | | | | | |
| (Millions of dollars) | | | | | | |
| | 2020 | | 2019 | | |
| Derivative Assets | | | | | | |
| Gross Amount of Recognized Assets | | $ | 85 | | | $ | 84 | | | |
| Gross Amounts Offset | | 0 | | | 0 | | | |
Net Amount of Assets(1) | | 85 | | | 84 | | | |
| | | | | | |
| Gross Amounts Not Offset | | (57) | | | (21) | | | |
| | | | | | |
| Net Amount | | $ | 28 | | | $ | 63 | | | |
| | | | | | |
| Derivative Liabilities | | | | | | |
| Gross Amount of Recognized Liabilities | | $ | (260) | | | $ | (50) | | | |
| Gross Amounts Offset | | 0 | | | 0 | | | |
Net Amount of Liabilities(1) | | (260) | | | (50) | | | |
| | | | | | |
| Gross Amounts Not Offset | | 57 | | | 21 | | | |
| | | | | | |
| Net Amount | | $ | (203) | | | $ | (29) | | | |
| | | | | | |
(1) As presented in the Consolidated Statements of Financial Position. | | | | | | | | | | | | | | | | | | | | | | | | | | |
| (Millions of dollars) | | | | | | | | |
| | December 31, 2022 | | December 31, 2021 |
| | Assets | | Liabilities | | Assets | | Liabilities |
| Gross amounts recognized | | $ | 417 | | | $ | (199) | | | $ | 208 | | | $ | (83) | |
| Financial instruments not offset | | (108) | | | 108 | | | (67) | | | 67 | |
| | | | | | | | |
| Net amount | | $ | 309 | | | $ | (91) | | | $ | 141 | | | $ | (16) | |
| | | | | | | | |
Concentration of Credit Risk
Our exposure to credit loss in the event of nonperformance by the counterparties is limited to only those gains that we have recorded, but for which we have not yet received cash payment. The master netting agreements reduce the amount of loss the company would incur should the counterparties fail to meet their obligations. At December 31, 2022 and 2021, the maximum exposure to credit loss, was $417 million and $208 million, respectively, before the application of any master netting agreements.
NOTE 109 – ACCUMULATED OTHER COMPREHENSIVE INCOME (LOSS)
We present Comprehensive income (loss) and its components in the Consolidated Statements of Comprehensive Income. Changes in Accumulated other comprehensive income (loss), net of tax, included in the Consolidated Statements of Changes in Shareholder'sShareholder’s Equity consisted of the following:
| | | | | | | | | | | | | | | | | |
| (Millions of dollars) | 2020 | | 2019 | | 2018 |
| Foreign currency translation | | | | | |
| Balance at beginning of year | $ | (777) | | | $ | (889) | | | $ | (587) | |
Adjustment to adopt new accounting guidance(1) | 0 | | | 98 | | | 0 | |
| Balance at January 1 | (777) | | | (791) | | | (587) | |
| Gains (losses) on foreign currency translation | 179 | | | 18 | | | (277) | |
| Less: Tax provision/(benefit) | (47) | | | 4 | | | 25 | |
| Net gains (losses) on foreign currency translation | 226 | | | 14 | | | (302) | |
| | | | | |
| | | | | |
| | | | | |
| Other comprehensive income (loss), net of tax | 226 | | | 14 | | | (302) | |
| Balance at end of year | $ | (551) | | | $ | (777) | | | $ | (889) | |
| | | | | |
| Derivative financial instruments | | | | | |
| Balance at beginning of year | $ | (68) | | | $ | (36) | | | $ | (5) | |
Adjustment to adopt new accounting guidance(1) | 0 | | | (1) | | | 0 | |
| Balance at January 1 | (68) | | | (37) | | | (5) | |
| Gains (losses) deferred | (153) | | | 23 | | | 127 | |
| Less: Tax provision/(benefit) | (33) | | | 6 | | | 29 | |
| Net gains (losses) deferred | (120) | | | 17 | | | 98 | |
| (Gains) losses reclassified to earnings | 184 | | | (62) | | | (167) | |
| Less: Tax (provision)/benefit | 40 | | | (14) | | | (38) | |
| Net (gains) losses reclassified to earnings | 144 | | | (48) | | | (129) | |
| Other comprehensive income (loss), net of tax | 24 | | | (31) | | | (31) | |
| Balance at end of year | $ | (44) | | | $ | (68) | | | $ | (36) | |
| | | | | |
| Total Accumulated Other Comprehensive Income (Loss) at end of year | $ | (595) | | | $ | (845) | | | $ | (925) | |
| | | | | |
(1) Adjustment to adopt new accounting guidance related to reclassification of certain tax effects from Accumulated other comprehensive income (loss). | | | | | | | | | | | | | | | | | |
| (Millions of dollars) | 2022 | | 2021 | | 2020 |
| Foreign currency translation | | | | | |
| Balance at beginning of year | $ | (762) | | | $ | (551) | | | $ | (777) | |
| | | | | |
| | | | | |
| Gains (losses) on foreign currency translation | (276) | | | (169) | | | 179 | |
| Less: Tax provision/(benefit) | 30 | | | 42 | | | (47) | |
| Net gains (losses) on foreign currency translation | (306) | | | (211) | | | 226 | |
| | | | | |
| | | | | |
| | | | | |
| Other comprehensive income (loss), net of tax | (306) | | | (211) | | | 226 | |
| Balance at end of year | $ | (1,068) | | | $ | (762) | | | $ | (551) | |
| | | | | |
| Derivative financial instruments | | | | | |
| Balance at beginning of year | $ | (12) | | | $ | (44) | | | $ | (68) | |
| | | | | |
| | | | | |
| Gains (losses) deferred | 421 | | | 209 | | | (153) | |
| Less: Tax provision/(benefit) | 97 | | | 24 | | | (33) | |
| Net gains (losses) deferred | 324 | | | 185 | | | (120) | |
| (Gains) losses reclassified to earnings | (384) | | | (166) | | | 184 | |
| Less: Tax (provision)/benefit | (93) | | | (13) | | | 40 | |
| Net (gains) losses reclassified to earnings | (291) | | | (153) | | | 144 | |
| Other comprehensive income (loss), net of tax | 33 | | | 32 | | | 24 | |
| Balance at end of year | $ | 21 | | | $ | (12) | | | $ | (44) | |
| | | | | |
| Total Accumulated other comprehensive income (loss) at end of year | $ | (1,047) | | | $ | (774) | | | $ | (595) | |
| | | | | |
The effect of the reclassifications out of Accumulated other comprehensive income (loss) on the Consolidated Statements of Profit during the years ended December 31, 2020, 2019 and 2018 was as follows:
| | | | | | | | | | | | | | | | | | | | | | | |
| (Millions of dollars) | | | | | | | |
| Derivative financial instruments | Classification of
income (expense) | | 2020 | | 2019 | | 2018 |
| Cross currency contracts | Other income (expense) | | $ | (164) | | | $ | 37 | | | $ | 148 | |
| Cross currency contracts | Interest expense | | 32 | | | 33 | | | 19 | |
| Interest rate contracts | Interest expense | | (52) | | | (8) | | | 0 | |
| Reclassifications before tax | | | (184) | | | 62 | | | 167 | |
| Tax (provision) benefit | | | 40 | | | (14) | | | (38) | |
| Total reclassifications from Accumulated other comprehensive income (loss) | | $ | (144) | | | $ | 48 | | | $ | 129 | |
| | | | | | | |
NOTE 1110 – COMMITMENTS AND CONTINGENT LIABILITIES
Guarantees
We provide loancredit guarantees to third-party lenders for financing associated with machinery purchased by customers. These guarantees have varying terms and are secured by the machinery being financed. We also provide residual value guarantees to third-party lendersthird parties for financing and leasing associated with machinery leased to customers. These guarantees have varying terms.Caterpillar machinery. In addition, we participate inprovide standby letters of credit issued to third parties on behalf of our customers. These guarantees and standby letters of credit have varying terms and beneficiaries and are generally secured by customer assets.
No significant loss has been experienced or is anticipated under any of these guarantees. At December 31, 20202022 and 2019,2021, the related recorded liability was less than $1 million. The maximum potential amount of future payments (undiscounted and without reduction for any amounts that may possibly be recovered under recourse or collateralized provisions) we could be required to make under the guarantees was $40$26 million and $65$36 million at December 31, 20202022 and 2019,2021, respectively.
We provide guarantees to repurchasepurchase certain loans of Caterpillar dealers from a special-purpose corporation (SPC) that qualifies as a VIE (see Note 1 for additional information regarding the accounting guidance on the consolidation of VIEs). The purpose of the SPC is to provide short-term working capital loans to Caterpillar dealers. This SPC issues commercial paper and uses the proceeds to fund its loan program. We have a loan purchase agreement with the SPC that obligates us to purchase certain loans that are not paid at maturity. We receive a fee for providing this guarantee, which provides a source of liquidity for the SPC.guarantee. We are the primary beneficiary of the SPC as our guarantees result in us having both the power to direct the activities that most significantly impact the SPC'sSPC’s economic performance and the obligation to absorb losses and therefore we have consolidated the financial statements of the SPC. As of December 31, 20202022 and 2019,2021, the SPC’s assets of $1.03 billion$971 million and $1.45 billion,$888 million, respectively, were primarily comprised of loans to dealers, which are included in Finance receivables, net in the Consolidated Statements of Financial Position, and the SPC'sSPC’s liabilities of $1.03 billion$970 million and $1.45 billion,$888 million, respectively, were primarily comprised of commercial paper, which is included in Short-term borrowings in the Consolidated Statements of Financial Position. The assets of the SPC are not available to pay our creditors. We may be obligated to perform under the guarantee if the SPC experiences losses. No loss has been experienced or is anticipated under this loan purchase agreement.
Lending commitments
We have commitments to extend credit to customers and Caterpillar dealers through lines of credit and other pre-approved credit arrangements. We apply the same credit policies and approval process for these commitments to extend credit as we do for other financing. Collateral is not required for these commitments, but if credit is extended, collateral may be required upon funding. The amount of unused commitments to extend credit to Caterpillar dealers was $11.67$11.39 billion at December 31, 20202022. We generally have the right to unconditionally cancel, alter, or amend the terms of these dealer commitments at any time. The amount of unused commitments to extend credit to customers was $675$888 million at December 31, 20202022. A significant portion of these commitments is not expected to be fully drawn upon; therefore, the total commitment amounts do not represent a future cash requirement. We generally have the right to unconditionally cancel, alter, or amend the terms of these commitments at any time.
Lease commitments
We lease certain property, vehicles and other equipment through operating leases. We recognize a lease liability and corresponding right-of-use asset based on the present value of lease payments. To determine the present value of lease payments for most of our leases, we use our incremental borrowing rate based on information available on the lease commencement date. We have elected not to separate payments for lease components from non-lease components. Our lease agreements may include options to extend or terminate the lease. When it is reasonably certain that we will exercise that option, we have included the option in the recognition of right-of-use assets and lease liabilities. Our variable lease costs primarily include maintenance, taxes and insurance. We have elected not to recognize right-of-use assets or lease liabilities for leases with a term of twelve months or less.
The components of lease cost were as follows for the years ended December 31:
| | | | | | | | | | | | | | |
| (Millions of dollars) | | 2020 | | 2019 |
| Operating lease cost | | $ | 8 | | | $ | 9 | |
| Short-term lease cost | | $ | 1 | | | $ | 1 | |
| Variable lease cost | | $ | 0 | | | $ | 1 | |
| | | | |
Operating lease right-of-use assets are recognized in Other assets in the Consolidated Statements of Financial Position. The operating lease liabilities are recognized in Other liabilities in the Consolidated Statements of Financial Position. Supplemental information related to operating leases as of December 31, was as follows:
| | | | | | | | | | | | | | | | | |
| (Millions of dollars) | | | 2020 | | 2019 |
| Other assets | | | $ | 23 | | | $ | 21 | |
| Other liabilities | | | $ | 24 | | | $ | 21 | |
| Weighted average remaining lease term | | | 5 years | | 5 years |
| Weighted average discount rates | | | 1.9 | % | | 2.4 | % |
| | | | | |
At December 31, 2020, maturities of operating lease liabilities were as follows:
| | | | | | | | |
| (Millions of dollars) | | |
| 2021 | | $ | 7 | |
| 2022 | | 5 | |
| 2023 | | 4 | |
| 2024 | | 3 | |
| 2025 | | 3 | |
| Thereafter | | 4 | |
| Total lease payments | | 26 | |
| Less: imputed interest | | (2) | |
| Total | | $ | 24 | |
| | |
Supplemental cash flow information related to operating leases was as follows for the years ended December 31:
| | | | | | | | | | | |
| (Millions of dollars) | 2020 | | 2019 |
| Cash paid for amounts included in the measurement of operating lease liabilities | $ | 8 | | | $ | 8 | |
| Right-of-use assets obtained in exchange for operating lease obligations | $ | 8 | | | $ | 2 | |
| | | |
Litigation and claims
We are involved in unresolved legal actions that arise in the normal course of business. Although it is not possible to predict with certainty the outcome of our unresolved legal actions, we believe that these unresolved legal actions will neither individually nor in the aggregate have a material adverse effect on our consolidated results of operations, financial position or liquidity.
NOTE 1211 – INCOME TAXES
A reconciliation of the U.S. federal statutory rate to the effective rate for the years ended December 31, was as follows:
| | (Millions of dollars) | (Millions of dollars) | | | | | | | (Millions of dollars) | | | | | | |
| | 2020 | | 2019 | | 2018 | | 2022 | | 2021 | | 2020 |
| Taxes computed at U.S. statutory rates | Taxes computed at U.S. statutory rates | | $ | 91 | | | 21.0 | % | | $ | 132 | | | 21.0 | % | | $ | 91 | | | 21.0 | % | Taxes computed at U.S. statutory rates | | $ | 154 | | | 21.0 | % | | $ | 146 | | | 21.0 | % | | $ | 91 | | | 21.0 | % |
| (Decreases) increases in taxes resulting from: | (Decreases) increases in taxes resulting from: | | | | | | | | | (Decreases) increases in taxes resulting from: | | | | | | | | |
| State Income Tax, net of Federal Tax | | (1) | | | (0.2) | % | | 1 | | | 0.2 | % | | 1 | | | 0.2 | % | |
| State income tax, net of federal Tax | | State income tax, net of federal Tax | | 4 | | | 0.5 | % | | 3 | | | 0.4 | % | | (1) | | | (0.2) | % |
| | Non- U.S. Subsidiaries taxed at other than the U.S. rate | | 26 | | | 6.0 | % | | 34 | | | 5.4 | % | | 28 | | | 6.5 | % | |
| Non-U.S. subsidiaries taxed at other than the U.S. rate | | Non-U.S. subsidiaries taxed at other than the U.S. rate | | 19 | | | 2.6 | % | | 22 | | | 3.2 | % | | 29 | | | 6.7 | % |
| | U.S. deferred tax rate change | | — | | | — | % | | — | | | — | % | | (7) | | | (1.6) | % | |
Mandatory deemed repatriation of non-U.S.
earnings | | 0 | | | — | % | | 0 | | | — | % | | (5) | | | (1.2) | % | |
| Prior year tax adjustments | | 3 | | | 0.7 | % | | 9 | | | 1.4 | % | | 11 | | | 2.5 | % | |
| | Valuation allowances | Valuation allowances | | 10 | | | 2.3 | % | | 21 | | | 3.4 | % | | (7) | | | (1.6) | % | Valuation allowances | | 15 | | | 2.1 | % | | 5 | | | 0.7 | % | | 10 | | | 2.3 | % |
| | Other, net | Other, net | | (3) | | | (0.7) | % | | (1) | | | (0.2) | % | | (4) | | | (0.9) | % | Other, net | | (3) | | | (0.4) | % | | 2 | | | 0.3 | % | | (3) | | | (0.7) | % |
| Provision for income taxes | Provision for income taxes | | $ | 126 | | | 29.1 | % | | $ | 196 | | | 31.2 | % | | $ | 108 | | | 24.9 | % | Provision for income taxes | | $ | 189 | | | 25.8 | % | | $ | 178 | | | 25.6 | % | | $ | 126 | | | 29.1 | % |
|
Included in the line item above labeled “Non-U.S. subsidiaries taxed at other than the U.S. rate” are the effects of local and U.S. taxes related to earnings of non-U.S. subsidiaries and other permanent differences between tax and U.S. GAAP results.
The provision for income taxes includes a prior year net tax charge of $3 million for 2020, $9 million for 20192022, 2021 and $11 million for 2018 to reduce non-U.S. deferred tax assets in certain jurisdictions to balances supporting the expected reversal of temporary differences between tax and U.S. GAAP balances.
The provision for income taxes for 2020 and 2019 also includes an increase in valuation allowance for non-U.S. deferred tax assets due to a decrease in consistent and/or sustainable profitability to support their recognition in certain jurisdictions, resulting in a $10$15 million, $5 million and $21$10 million non-cash expense, respectively.
The provision for income taxes for 2018 included a decrease in the valuation allowance for non-U.S. deferred tax assets due to improved U.S. GAAP profits expected to recur in certain jurisdictions, resulting in a $7 million non-cash benefit.
On December 22, 2017, U.S. tax legislation was enacted containing a broad range of tax reform provisions including a corporate tax rate reduction and changes in the U.S. taxation of non-U.S. earnings. In 2018, measurement period adjustments of $12 million increased the provisionally estimated net benefit of $151 million recognized during the fourth quarter of 2017. A $7 million benefit, resulting from the 2017 tax year return to provision adjustments, revised the estimated impact of the write-down of U.S. net deferred tax liabilities to reflect the reduction in the U.S. corporate tax rate from 35 percent to 21 percent. A $5 million benefit revised the estimated cost of a mandatory deemed repatriation of non-U.S. earnings.
As a result of U.S. tax reform legislation, distributionsDistributions of profits from non-U.S. subsidiaries are not expected to cause a significant incremental U.S. tax impact in the future. However, these distributions may be subject to non-U.S. withholding taxes if profits are distributed from certain jurisdictions. We have not recorded a deferred tax liability for withholding taxes in non-U.S. jurisdictions where earnings are considered indefinitely reinvested. Undistributed profits of non-U.S. subsidiaries of approximately $4 billion are considered indefinitely reinvested. Determination of the amount of unrecognized deferred tax liability related to indefinitely reinvested
profits is not feasible primarily due to our legal entity operating structure and the complexity of U.S. and local tax laws. If management intentions or U.S. tax law changes in the future, there could be an impact on the provision for income taxes to record an incremental tax liability in the period the change occurs.
The components of Profit before income taxes for the years ended December 31, were as follows:
| | (Millions of dollars) | (Millions of dollars) | | (Millions of dollars) | |
| | 2020 | | 2019 | | 2018 | | 2022 | | 2021 | | 2020 |
| U.S. | U.S. | | $ | 99 | | | $ | 257 | | | $ | 213 | | U.S. | | $ | 439 | | | $ | 288 | | | $ | 99 | |
| Non-U.S. | Non-U.S. | | 335 | | | 371 | | | 220 | | Non-U.S. | | 292 | | | 407 | | | 335 | |
| Total | Total | | $ | 434 | | | $ | 628 | | | $ | 433 | | Total | | $ | 731 | | | $ | 695 | | | $ | 434 | |
|
Profit before income taxes, as shown above, is based on the location of the entity to which such earnings are attributable. Where an entity’s earnings are subject to taxation, however, may not correlate solely to where an entity is located. Thus, the income tax provision shown below as U.S. or non-U.S. may not correspond to the earnings shown above.
The components of the Provision for income taxes were as follows for the years ended December 31:
| | (Millions of dollars) | (Millions of dollars) | | (Millions of dollars) | |
| | 2020 | | 2019 | | 2018 | | 2022 | | 2021 | | 2020 |
| Current income tax provision: | Current income tax provision: | | | | | | | Current income tax provision: | | | | | | |
| U.S. | U.S. | | $ | 46 | | | $ | 13 | | | $ | (46) | | U.S. | | $ | 116 | | | $ | 101 | | | $ | 46 | |
| Non-U.S. | Non-U.S. | | 80 | | | 161 | | | 112 | | Non-U.S. | | 95 | | | 162 | | | 80 | |
| State (U.S.) | State (U.S.) | | 1 | | | 2 | | | 1 | | State (U.S.) | | 5 | | | 5 | | | 1 | |
| | | | 127 | | | 176 | | | 67 | | | | 216 | | | 268 | | | 127 | |
| | Deferred income tax provision: | | | | | | | |
| Deferred income tax provision (benefit): | | Deferred income tax provision (benefit): | | | | | | |
| U.S. | U.S. | | (45) | | | 32 | | | 67 | | U.S. | | (36) | | | (56) | | | (45) | |
| Non-U.S. | Non-U.S. | | 46 | | | (11) | | | (26) | | Non-U.S. | | 8 | | | (33) | | | 46 | |
| State (U.S.) | State (U.S.) | | (2) | | | (1) | | | 0 | | State (U.S.) | | 1 | | | (1) | | | (2) | |
| | | | (1) | | | 20 | | | 41 | | | | (27) | | | (90) | | | (1) | |
| | Total Provision for income taxes | Total Provision for income taxes | | $ | 126 | | | $ | 196 | | | $ | 108 | | Total Provision for income taxes | | $ | 189 | | | $ | 178 | | | $ | 126 | |
|
Current income tax provision is the amount of income taxes reported or expected to be reported on our income tax returns. We join Caterpillar in the filing of a consolidated U.S. Federal income tax return and certain state income tax returns. In accordance with our tax sharing agreement with Caterpillar, we generally pay to or receive from Caterpillar our allocated share of income taxes or credits reflected in these consolidated filings. This amount is calculated on a separate return basis by taking taxable income times the applicable statutory tax rate and includes payment for certain tax attributes earned during the year.
Income taxes payable were $198$275 million and $160$279 million as of December 31, 20202022 and 2019,2021, respectively, and are included in Other liabilities in the Consolidated Statements of Financial Position.
Accounting for income taxes under generally accepted accounting principlesU.S. GAAP requires individual tax-paying entities of the Company to offset deferred income tax assets and liabilities within each particular tax jurisdiction and present them as a single amount in the Consolidated Statements of Financial Position. Amounts in different tax jurisdictions cannot be offset against each other. The amounts of deferred income taxes at December 31, included in the following lines in our Consolidated Statements of Financial Position were:
| | | | | | | | | | | | | | | | |
| (Millions of dollars) | | | | | | |
| | 2020 | | 2019 | | |
| Assets: | | | | | | |
| Other assets | | $ | 102 | | | $ | 118 | | | |
| Liabilities: | | | | | | |
| Other liabilities | | (629) | | | (680) | | | |
| Deferred income taxes, net | | $ | (527) | | | $ | (562) | | | |
| | | | | | |
58
| | | | | | | | | | | | | | | | |
| (Millions of dollars) | | | | | | |
| | 2022 | | 2021 | | |
| Assets: | | | | | | |
| Other assets | | $ | 115 | | | $ | 107 | | | |
| Liabilities: | | | | | | |
| Other liabilities | | (610) | | | (592) | | | |
| Deferred income taxes, net | | $ | (495) | | | $ | (485) | | | |
| | | | | | |
Our consolidated deferred income taxes consisted of the following components as of December 31:
| | (Millions of dollars) | (Millions of dollars) | | | (Millions of dollars) | | |
| | 2020 | | 2019 | | | 2022 | | 2021 | |
| Deferred income tax assets: | Deferred income tax assets: | | | | | | Deferred income tax assets: | | | | | |
| Allowance for credit losses | Allowance for credit losses | | $ | 100 | | | $ | 124 | | | Allowance for credit losses | | $ | 97 | | | $ | 90 | | |
| | Tax carryforwards | Tax carryforwards | | 61 | | | 39 | | | Tax carryforwards | | 93 | | | 83 | | |
| Revenue timing differences | | Revenue timing differences | | 20 | | | 38 | | |
| Other, net | | Other, net | | 28 | | | 33 | | |
| | | | | 238 | | | 244 | | |
| Deferred income tax liabilities: | | Deferred income tax liabilities: | | | | | |
| Capital assets, including lease basis differences | | Capital assets, including lease basis differences | | (461) | | | (501) | | |
| Deferred income tax on translation adjustment | | Deferred income tax on translation adjustment | | (219) | | | (189) | | |
| | | | 161 | | | 163 | | | | (680) | | | (690) | | |
| | Deferred income tax liabilities (primarily lease basis differences) | | (508) | | | (508) | | | |
| | Valuation allowance for deferred income tax assets | Valuation allowance for deferred income tax assets | | (33) | | | (23) | | | Valuation allowance for deferred income tax assets | | (53) | | | (39) | | |
| | Deferred income tax on translation adjustment | | (147) | | | (194) | | | |
| | Deferred income taxes, net | Deferred income taxes, net | | $ | (527) | | | $ | (562) | | | Deferred income taxes, net | | $ | (495) | | | $ | (485) | | |
|
As of December 31, 2020, amounts and expiration dates2022, approximately $73 million of U.S. state tax net operating losslosses (NOL) were available. These carryforwards in various U.S. state taxing jurisdictions were:
| | | | | | | | | | | | | | | | | | | | | | | | | | | | | | | | | | | | | | |
| (Millions of dollars) | | | | | | | | | | |
| 2021 | | 2022 | | 2023 | | 2024 | | 2024-2039 | | Unlimited | | Total |
| $ | 0 | | | $ | 5 | | | $ | 6 | | | $ | 2 | | | $ | 102 | | | $ | 10 | | | $ | 125 | |
primarily expire over the next eighteen years. The grosstotal deferred income tax asset associated with these NOL carryforwards is $9$5 million as of December 31, 2020,2022, partially offset by a valuation allowance of $2$1 million.
In some U.S. state income tax jurisdictions, we join with other Caterpillar entities in filing combined income tax returns. In other U.S. state income tax jurisdictions, we file on a separate, stand-alone basis.
AtAs of December 31, 2020,2022, NOL carryforwards in various non-U.S. taxing jurisdictions were approximately $6$363 million. Of these, $41 million of U.S. foreign tax credits from 2017expire between 2023 and $5 million from 2020 were available for carryforward. These credits expire in 2028 and 2031, respectively.2033. The remaining carryforwards do not expire.
As of December 31, 2020, amounts and expiration dates of NOL carryforwards in various non-U.S. taxing jurisdictions were:
| | | | | | | | | | | | | | | | | | | | | | | | | | | | | | | | | | | | | | |
| (Millions of dollars) | | | | | | | | | | |
| 2021 | | 2022 | | 2023 | | 2024 | | 2024-2034 | | Unlimited | | Total |
| $ | 9 | | | $ | 2 | | | $ | 6 | | | $ | 3 | | | $ | 5 | | | $ | 239 | | | $ | 264 | |
Valuation2022, valuation allowances of $31$51 million and $1 million have been recorded at certain non-U.S. subsidiaries and U.S. subsidiaries, respectively, that have not yet demonstrated consistent and/or sustainable profitability to support the recognition of net deferred income tax assets.
As a result of improving profit before tax in one of our non-U.S. entities, we believe there is a reasonable possibility that a significant portion of the $23 million valuation allowance at December 31, 2022 recorded against the entity’s deferred tax assets may no longer be needed in 2023. Due to the uncertainty of inflation impacts on taxable income for one of our non-U.S. entities, we believe there is a reasonable possibility that we will need to record a valuation allowance in 2023 against some or all of the $36 million deferred tax asset at December 31, 2022. The potential amounts of the valuation allowance changes are dependent on each entity’s future taxable income.
A reconciliation of the beginning and ending amounts of gross unrecognized income tax benefits for uncertain income tax positions, including positions impacting only the timing of income tax benefits was as follows:
| | (Millions of dollars) | (Millions of dollars) | | (Millions of dollars) | |
| | 2020 | | 2019 | | 2018 | | 2022 | | 2021 | | 2020 |
Reconciliation of unrecognized income tax benefits(1): | Reconciliation of unrecognized income tax benefits(1): | | | | | | | Reconciliation of unrecognized income tax benefits(1): | | | | | | |
| Balance at beginning of year | Balance at beginning of year | | $ | 119 | | | $ | 119 | | | $ | 0 | | Balance at beginning of year | | $ | 131 | | | $ | 119 | | | $ | 119 | |
| Additions for income tax positions related to current year | Additions for income tax positions related to current year | | 0 | | | 0 | | | 119 | | Additions for income tax positions related to current year | | — | | | 2 | | | — | |
| Additions for income tax positions related to prior year | | Additions for income tax positions related to prior year | | — | | | 10 | | | — | |
| | Reductions for income tax positions related to settlements | | Reductions for income tax positions related to settlements | | (4) | | | — | | | — | |
| Balance at end of year | Balance at end of year | | $ | 119 | | | $ | 119 | | | $ | 119 | | Balance at end of year | | $ | 127 | | | $ | 131 | | | $ | 119 | |
| | Amount that, if recognized, would impact the effective tax rate | Amount that, if recognized, would impact the effective tax rate | | $ | 119 | | | $ | 119 | | | $ | 119 | | Amount that, if recognized, would impact the effective tax rate | | $ | 127 | | | $ | 131 | | | $ | 119 | |
|
(1) Foreign currency translation amounts are included within each line as applicable.
We classify interest and penalties on income taxes as a component of the provision for income taxes. During the years ended December 31, 2020, 20192022, 2021 and 2018,2020, we recognized a benefit of less than $1 million, an expense of less than $1 million and a benefit of less than $1 million in interest and penalties, respectively. As of December 31, 20202022 and 2019,2021, the total amount of accrued interest and penalties was less than$2 million and $1 million.million, respectively.
On January 31, 2018, Caterpillar received a Revenue Agent's Report (RAR) fromWe are subject to the IRS indicating the end of fieldcontinuous examination of our U.S. federal income tax returns for 2010by the IRS, and tax years 2017 to 2012. Tax years prior to 20072019 are generally no longer subject to U.S. tax assessment.currently under examination. In our major non-U.S. jurisdictions, tax years are typically subject to examination for three to ten years. Due to the uncertainty related to the timing and potential outcome of audits, we cannot estimate the range of reasonably possible change in unrecognized tax benefits in the next 12 months.
NOTE 1312 – FAIR VALUE MEASUREMENTS
A.Fair Value Measurements
The guidance on fair value measurements defines fair value as the exchange price that would be received for an asset or paid to transfer a liability (an exit price) in the principal or most advantageous market for the asset or liability in an orderly transaction between market participants. This guidance also specifies a fair value hierarchy based upon the observability of inputs used in valuation techniques. Observable inputs (highest level) reflect market data obtained from independent sources, while unobservable inputs (lowest level) reflect internally developed market assumptions. In accordance with this guidance, fair value measurements are classified under the following hierarchy:
•Level 1 – Quoted prices for identical instruments in active markets.
•Level 2 – Quoted prices for similar instruments in active markets; quoted prices for identical or similar instruments in markets that are not active; and model-derived valuations in which all significant inputs or significant value-drivers are observable in active markets.
•Level 3 – Model-derived valuations in which one or more significant inputs or significant value-drivers are unobservable.
When available, we use quoted market prices to determine fair value and we classify such measurements within Level 1. In some cases where market prices are not available, we make use of observable market-based inputs to calculate fair value, in which case the measurements are classified within Level 2. If quoted or observable market prices are not available, fair value is based upon valuations in which one or more significant inputs are unobservable, including internally developed models that use, where possible, current market-based parameters such as interest rates, yield curves and currency rates. These measurements are classified within Level 3.
We classify fair value measurements according to the lowest level input or value-driver that is significant to the valuation. We may therefore classify a measurement within Level 3 even though there may be significant inputs that are readily observable.
Fair value measurement includes the consideration of nonperformance risk. Nonperformance risk refers to the risk that an obligation (either by a counterparty or us) will not be fulfilled. For financial assets traded in an active market, (Level 1), the nonperformance risk is included in the market price. For certain other financial assets and liabilities, (Level 2 and 3), our fair value calculations have been adjusted accordingly.
60
Derivative financial instruments
The fair value of interest rate contracts is primarily based on a standard industry accepted valuation modelsmodel that utilizeutilizes the appropriate market-based forward swap curves and zero-coupon interest rates to determine discounted cash flows. The fair value of foreign currency forward and cross currency contracts is based on standard industry accepted valuation models that discount cash flows resulting from the differential between the contract price and the market-based forward rate.
Derivative financial instruments are measured on a recurring basis at fair value and are classified as Level 2 measurements. We had derivative financial instruments included in our Consolidated Statements of Financial Position in a net liability position of $175 million and a net asset position of $34$218 million and $125 million as of December 31, 20202022 and 2019,2021, respectively.
Impaired loansSee Note 8 for additional information.
Our impaired
Loans measured at fair value
Certain loans are subject to measurement at fair value on a nonrecurring basis and are classified as Level 3 measurements. A loan is considered impairedmeasured at fair value when management determines that collection of contractual amounts due is not probable.probable and the loan is individually evaluated. In these cases, an allowance for credit losses may be established based either on the present value of expected future cash flows discounted at the receivables'receivables’ effective interest rate, the fair value of the collateral for collateral-dependent receivables or the observable market price of the receivable. In determining collateral value, we estimate the current fair market value of the collateral less selling costs. We had impaired loans carried at the fair value of $243$68 million and $343$100 million as of December 31, 20202022 and 2019,2021, respectively.
B.Fair Values of Financial Instruments
In addition to the methodsCash and assumptions we use to record the fair value of financial instruments as discussedcash equivalents, Restricted cash and cash equivalents (included in Other assets in the Fair Value Measurements section above, weConsolidated Statements of Financial Position) and Short-term borrowings (see Note 6) are classified as Level 1 measurements and carrying amount approximates fair value. We use the following methods and assumptions to estimate the fair value of our financial instruments:instruments not carried at fair value:
Cash and cash equivalents – carrying amount approximates fair value.
Restricted cash and cash equivalents – carrying amount approximates fair value.
Finance receivables, net – we estimate fair value by discounting the future cash flows using current rates representative of receivables with similar remaining maturities.
Short-term borrowings – carrying amount approximates fair value.
Long-term debt – we estimate fair value for fixed and floating-rate debt based on quoted market prices.
Fair values of our financial instruments not carried at fair value as of December 31, were as follows:
| | | | | | | | | | | | | | | | | | | | | | | | | | | | | | | | | | | | |
| (Millions of dollars) | | 2020 | | 2019 | | | | |
| | | Carrying
Amount | | Fair
Value | | Carrying
Amount | | Fair
Value | | | | | Fair
Value
Levels | Reference |
| Cash and cash equivalents | | $ | 411 | | | $ | 411 | | | $ | 690 | | | $ | 690 | | | | | | 1 | |
Restricted cash and cash equivalents(1) | | $ | 14 | | | $ | 14 | | | $ | 5 | | | $ | 5 | | | | | | 1 | |
Finance receivables, net (excluding finance leases(2)) | | $ | 18,599 | | | $ | 18,910 | | | $ | 20,022 | | | $ | 20,133 | | | | | | 3 | Note 2 |
| Interest rate contracts: | | | | | | | | | | | | | | |
| In a receivable position | | $ | 59 | | | $ | 59 | | | $ | 5 | | | $ | 5 | | | | | | 2 | Note 9 |
| In a payable position | | $ | (5) | | | $ | (5) | | | $ | (25) | | | $ | (25) | | | | | | 2 | Note 9 |
| Cross currency contracts | | | | | | | | | | | | | | |
| In a receivable position | | $ | 9 | | | $ | 9 | | | $ | 72 | | | $ | 72 | | | | | | 2 | Note 9 |
| In a payable position | | $ | (148) | | | $ | (148) | | | $ | (4) | | | $ | (4) | | | | | | 2 | Note 9 |
| Foreign exchange contracts: | | | | | | | | | | | | | | |
| In a receivable position | | $ | 17 | | | $ | 17 | | | $ | 7 | | | $ | 7 | | | | | | 2 | Note 9 |
| In a payable position | | $ | (107) | | | $ | (107) | | | $ | (21) | | | $ | (21) | | | | | | 2 | Note 9 |
| | | | | | | | | | | | | | |
| Short-term borrowings | | $ | (2,005) | | | $ | (2,005) | | | $ | (5,161) | | | $ | (5,161) | | | | | | 1 | Note 7 |
| Long-term debt | | $ | (23,979) | | | $ | (24,614) | | | $ | (23,334) | | | $ | (23,655) | | | | | | 2 | Note 8 |
| | | | | | | | | | | | | | |
| | | | | | | | | | | | | | |
| | | | | | | | | | | | | | | | | | | | | | | | | | | | | | | | | | | | | | | | | |
| (Millions of dollars) | | 2022 | | 2021 | | | | | |
| | | Carrying
Amount | | Fair
Value | | Carrying
Amount | | Fair
Value | | | | | Fair
Value
Levels | | Reference |
| Assets | | | | | | | | | | | | | | | |
| | | | | | | | | | | | | | | |
| | | | | | | | | | | | | | | |
Finance receivables, net (excluding finance leases(1)) | | $ | 19,085 | | | $ | 18,448 | | | $ | 19,068 | | | $ | 19,047 | | | | | | 3 | | Note 2 |
| | | | | | | | | | | | | | | |
| | | | | | | | | | | | | | | |
| | | | | | | | | | | | | | | |
| | | | | | | | | | | | | | | |
| | | | | | | | | | | | | | | |
| | | | | | | | | | | | | | | |
| | | | | | | | | | | | | | | |
| | | | | | | | | | | | | | | |
| | | | | | | | | | | | | | | |
| | | | | | | | | | | | | | | |
| | | | | | | | | | | | | | | |
| | | | | | | | | | | | | | | |
| Liabilities | | | | | | | | | | | | | | | |
| Long-term debt | | $ | 21,418 | | | $ | 20,686 | | | $ | 22,594 | | | $ | 22,797 | | | | | | 2 | | Note 7 |
| | | | | | | | | | | | | | | |
| | | | | | | | | | | | | | | |
(1)Included in Other assets in the Consolidated Statements of Financial Position.
(2) Represents finance leases and failed sale leasebacks of $7.98$7.36 billion and $7.81$8.11 billion as of December 31, 20202022 and 2019,2021, respectively.
NOTE 1413 – TRANSACTIONS WITH RELATED PARTIES
We have a Support Agreement with Caterpillar, which provides that Caterpillar will (1) remain, directly or indirectly, our sole owner; (2) cause us to maintain a tangible net worth of at least $20 million and (3) ensure that we maintain a ratio of profit before income taxes and interest expense to interest expense (as defined by the Support Agreement) of not less than 1.15 to 1, calculated on an annual basis. Although this agreement can be modified or terminated by either party, any termination or any modification which would adversely affect holders of our debt requires the consent of holders of 66-2/3 percent in principal amount of outstanding debt of each series so affected. Any modification or termination which would adversely affect the lenders under the Credit Facility requires their consent. Caterpillar'sCaterpillar’s obligation under this agreement is not directly enforceable by any of our creditors and does not constitute a guarantee of any of our obligations. Cash dividends of $300$275 million, $25$850 million and $400$300 million were paid to Caterpillar in 2020, 20192022, 2021 and 2018,2020, respectively.
We have variable amount and term lending agreements and other notes receivable with Caterpillar. Under these agreements, we may borrow up to $2.41$2.38 billion from Caterpillar, and Caterpillar may borrow up to $1.74$1.75 billion from us. The variable amount lending agreements are in effect for indefinite periods of time and may be changed or terminated by either party with 30 days notice. The term lending agreements have remaining maturities ranging up to ten years. We extended a $2 billion committed credit facility to Caterpillar, which expired in February 2019. Under this agreement, we received a fee from Caterpillar based on amounts drawn under the credit facility and a commitment fee for the undrawn amounts under the credit facility. Information concerning these agreements was as follows:
| | (Millions of dollars) | (Millions of dollars) | | 2020 | | 2019 | | 2018 | (Millions of dollars) | | 2022 | | 2021 | | 2020 |
| Payable to Caterpillar - borrowings as of December 31, | Payable to Caterpillar - borrowings as of December 31, | | $ | 1,022 | | | $ | 618 | | | $ | 1,518 | | Payable to Caterpillar - borrowings as of December 31, | | $ | 23 | | | $ | 22 | | | $ | 1,022 | |
| Payable to Caterpillar - other as of December 31, | Payable to Caterpillar - other as of December 31, | | $ | 65 | | | $ | 75 | | | $ | 83 | | Payable to Caterpillar - other as of December 31, | | 101 | | | 73 | | | 65 | |
| Notes receivable from Caterpillar as of December 31, | Notes receivable from Caterpillar as of December 31, | | $ | 356 | | | $ | 296 | | | $ | 662 | | Notes receivable from Caterpillar as of December 31, | | 482 | | | 389 | | | 356 | |
Other receivables from Caterpillar as of December 31,(2) | Other receivables from Caterpillar as of December 31,(2) | | $ | 65 | | | $ | 64 | | | $ | 33 | | Other receivables from Caterpillar as of December 31,(2) | | 133 | | | 70 | | | 65 | |
| Interest expense | Interest expense | | $ | 2 | | | $ | 32 | | | $ | 35 | | Interest expense | | 1 | | | — | | | 2 | |
Interest income on Notes Receivable with Caterpillar(1) | Interest income on Notes Receivable with Caterpillar(1) | | $ | 14 | | | $ | 26 | | | $ | 30 | | Interest income on Notes Receivable with Caterpillar(1) | | 17 | | | 14 | | | 14 | |
Fees on committed credit facility extended to Caterpillar(1) | | $ | 0 | | | $ | 5 | | | $ | 40 | | |
| |
(1) Included in Other revenues, net in the Consolidated Statements of Profit.
(2) Included in Other assets in the Consolidated Statements of Financial Position.
We have agreements with Caterpillar to purchase certain trade receivables at a discount. In addition, we receive fee revenue from Caterpillar for our centralized activities benefiting the global factoring program. InCash flows related to our factoring programs with Caterpillar are included in Net changes in Caterpillar purchased receivables within investing activities in the Consolidated Statements of Cash Flows, collection of the discount is included in investing activities as the receivables are collected.Flows. Information pertaining to these purchases was as follows:
| | (Millions of dollars) | (Millions of dollars) | | (Millions of dollars) | |
| | 2020 | | 2019 | | 2018 | | 2022 | | 2021 | | 2020 |
| Purchases made | Purchases made | | $ | 32,937 | | | $ | 42,817 | | | $ | 42,961 | | Purchases made | | $ | 47,158 | | | $ | 40,140 | | | $ | 32,937 | |
| Revenue earned | Revenue earned | | $ | 308 | | | $ | 455 | | | $ | 375 | | Revenue earned | | 417 | | | 301 | | | 308 | |
| Purchased Receivables as of December 31, | Purchased Receivables as of December 31, | | $ | 3,646 | | | $ | 4,448 | | | $ | 4,691 | | Purchased Receivables as of December 31, | | 4,297 | | | 4,462 | | | 3,646 | |
|
We participate in certain marketing programs offered in conjunction with Caterpillar that allow us to periodically offer financing to customers at interest rates that are below market rates. Under these marketing programs, Caterpillar funds an amount at the outset of the transaction, which we then recognize as revenue over the term of the financing. During 2020, 20192022, 2021 and 2018,2020, relative to such programs, we received $353$339 million, $351 million and $335$353 million, respectively. We have Finance receivables, net and Equipment on operating leases, net with Caterpillar of $141$143 million and $139$147 million as of December 31, 20202022 and 2019,2021, respectively. For the years ended December 31, 2020, 20192022, 2021 and 2018,2020, we recognized revenues of $22$24 million, $16$25 million and $9$22 million, respectively, related to these finance receivables and operating leases. For the years ended December 31, 2020, 20192022, 2021 and 2018,2020, we recognized depreciation related to these operating leases of $15$17 million, $11$17 million and $5$15 million, respectively. At December 31, 20202022 and 2019, $5962021, $448 million and $562$568 million, respectively, of our portfolio was subject to guarantees by Caterpillar and affiliates.
We participate in variousCaterpillar provides defined benefit pension plans, defined contribution plans and other postretirement benefit plans which are administered by Caterpillar. These plans include employee medical plans and postretirement benefit plans.to employees. We reimburse Caterpillar for these charges. During 2020, 2019charges and 2018, these charges amounted to $33 million, $35 million and $34 million, respectively. Included in these charges are contributions to defined benefit plans in the amount of $4 million, $9 million and $9 million in 2020, 2019 and 2018, respectively. These contributions areother employee benefits paid by Caterpillar related to our participation in the following defined benefit plans that are administered by Caterpillar: the Caterpillar Inc. Retirement Income Plan, the Caterpillar Inc. Supplemental Retirement Plan and the Caterpillar Inc. Retiree Benefit Program. The total cost of the defined benefit plans is determined by actuarial valuation and we receive an allocation of the service and prior service cost based on headcount. We participate in the Caterpillar stock incentive plans. In 2020, 2019 and 2018, Caterpillar allocated to us $8 million annually in expenses related to stock based compensation.employees. Further information about these plans is available in Caterpillar’s 20202022 Annual Report on Form 10-K filed separately with the Securities and Exchange Commission.
Caterpillar provides operational and administrative support, which is integral to the conduct of our business. In 2020, 20192022, 2021 and 2018,2020, these operational and support charges for which we reimburse Caterpillar amounted to $46$52 million, $46$52 million and $35$46 million, respectively. In addition, we provide administrative support services to certain Caterpillar subsidiaries. Caterpillar reimburses us for these charges. During 2020, 20192022, 2021 and 2018,2020, these charges amounted to $10 million, $13 million, $12 million and $11$10 million, respectively.
We join Caterpillar in the filing of a consolidated U.S. Federal income tax return and certain state income tax returns. In accordance with our tax sharing agreement with Caterpillar, we generally pay to or receive from Caterpillar our allocated share of income taxes or credits reflected in these consolidated filings. This amount is calculated on a separate return basis by taking taxable income times the applicable statutory tax rate and includes payment for certain tax attributes earned during the year.
NOTE 1514 – SEGMENT AND GEOGRAPHIC INFORMATION
A. Basis for Segment Information
We report information internallyThe Chief Operating Decision Maker (the CEO) allocates resources and manages performance for our six operating segments based on management responsibility.described as follows. Our operating segments provide financing alternatives to customers and dealers around the world for Caterpillar products and provide financing forservices and vehicles, and power generation facilities and marine vessels that, in most cases, incorporate Caterpillar products. Financing plans include operating and finance leases, retail loans, working capital loans to Caterpillar dealers and wholesale financing plans within each of the operating segments. Certain operating segments also purchase short-term trade receivables from Caterpillar.
B. Description of Segments
We have six operating segments that offer financing services. Following is a brief description of our segments:
•North America - Includes our operations in the United States and Canada.
•EAME - Includes our operations in Europe, Africa, the Middle East and the Commonwealth of Independent States.
•Asia/Pacific - Includes our operations in Australia, New Zealand, China, Japan, Southeast Asia and India.
•Latin America - Includes our operations in Mexico and Central and South American countries.
•Mining - Provides financing for large mining customers worldwide.
•Caterpillar Power Finance - Provides financing worldwide for marine vessels with Caterpillar engines and for Caterpillar electrical power generation, gas compression and co-generation systems and non-Caterpillar equipment that is powered by these systems.
•Mining - Providessystems and has previously provided financing for large mining customers worldwide.marine vessels.
To align with changes in executive management responsibilities and measurement of segment performance, our management reporting was updated effective January 1, 2020. Prior year data has been revised to conform to the 2020 presentation.
C. Segment Measurement and Reconciliations
Cash, debt and other expenses are allocated to our segments based on their respective portfolios. The related Interest expense is calculated based on the amount of allocated debt and the rates associated with that debt. The performance of each segment is assessed based on a consistent leverage ratio. The Provision for credit losses is based on each segment'ssegment’s respective finance receivable portfolio. Capital expenditures include expenditures for equipment on operating leases and other miscellaneous capital expenditures.
Reconciling items are created based on accounting differences between segment reporting and consolidated external reporting. For the reconciliation of Profit before income taxes, we have grouped the reconciling items as follows:
•Unallocated - This item is related to corporate requirements and strategies that are considered to be for the benefit of the entire organization. Also included are the consolidated results of the special purpose corporation (see Note 11 for additional information) and other miscellaneous items.
•Timing - Timing differences in the recognition of costs between segment reporting and consolidated external reporting.
•Methodology - Methodology differences between segment reporting and consolidated external reporting are as follows:
◦Segment assets include off-balance sheet managed assets for which we maintain servicing responsibilities.
◦The impact of differences between the actual leverage and the segment leverage ratios.
◦Interest expense includes realized forward points on foreign currency forward contracts.
◦The net gain or loss from interest rate derivatives is excluded from segment reporting.
Supplemental segment data and reconciliations to consolidated external reporting for the years ended December 31:31 was as follows:
| (Millions of dollars)
2020 | External
Revenues | | Profit
before
income
taxes | | Interest
Expense | | Depreciation
on equipment
leased to
others | | Provision
for
credit
losses | | Assets at December 31, 2020 | | Capital
expenditures | |
(Millions of dollars)
2022 | | (Millions of dollars)
2022 | External
Revenues | | Profit
before
income
taxes | | Interest
Expense | | Depreciation
on equipment
leased to
others | | Provision
for
credit
losses | | Assets at December 31, 2022 | | Capital
expenditures |
| North America | North America | $ | 1,401 | | | $ | 312 | | | $ | 322 | | | $ | 538 | | | $ | 69 | | | $ | 14,749 | | | $ | 864 | | North America | $ | 1,512 | | | $ | 550 | | | $ | 263 | | | $ | 503 | | | $ | 25 | | | $ | 15,229 | | | $ | 862 | |
| EAME | EAME | 271 | | | 44 | | | 37 | | | 62 | | | 50 | | | 4,981 | | | 37 | | EAME | 285 | | | 12 | | | 79 | | | 55 | | | 49 | | | 5,067 | | | 117 | |
| Asia/Pacific | Asia/Pacific | 338 | | | 145 | | | 94 | | | 9 | | | 38 | | | 4,585 | | | 7 | | Asia/Pacific | 283 | | | 134 | | | 73 | | | 5 | | | 6 | | | 3,921 | | | 6 | |
| Latin America | Latin America | 201 | | | 41 | | | 70 | | | 11 | | | 33 | | | 2,621 | | | 7 | | Latin America | 284 | | | 85 | | | 136 | | | 10 | | | 7 | | | 2,636 | | | 25 | |
| Mining | | Mining | 294 | | | 63 | | | 42 | | | 143 | | | 9 | | | 2,700 | | | 120 | |
| Caterpillar Power Finance | Caterpillar Power Finance | 54 | | | (38) | | | 25 | | | 1 | | | 50 | | | 1,308 | | | 23 | | Caterpillar Power Finance | 53 | | | 37 | | | 15 | | | 2 | | | (15) | | | 704 | | | — | |
| Mining | 279 | | | 33 | | | 53 | | | 137 | | | 27 | | | 2,575 | | | 151 | | |
| Total Segments | Total Segments | 2,544 | | | 537 | | | 601 | | | 758 | | | 267 | | | 30,819 | | | 1,089 | | Total Segments | 2,711 | | | 881 | | | 608 | | | 718 | | | 81 | | | 30,257 | | | 1,130 | |
| Unallocated | Unallocated | 25 | | | (287) | | | 207 | | | 0 | | | (1) | | | 1,576 | | | 11 | | Unallocated | 35 | | | (312) | | | 204 | | | — | | | — | | | 1,628 | | | 9 | |
| Timing | Timing | (19) | | | (3) | | | 0 | | | 0 | | | 0 | | | 12 | | | 0 | | Timing | (12) | | | 4 | | | — | | | — | | | — | | | 18 | | | — | |
| Methodology | Methodology | 0 | | | 187 | | | (217) | | | 0 | | | 0 | | | (152) | | | 0 | | Methodology | — | | | 158 | | | (246) | | | — | | | — | | | 278 | | | — | |
Inter-segment Eliminations (1) | Inter-segment Eliminations (1) | 0 | | | 0 | | | 0 | | | 0 | | | 0 | | | (264) | | | 0 | | Inter-segment Eliminations (1) | — | | | — | | | — | | | — | | | — | | | (224) | | | — | |
| Total | Total | $ | 2,550 | | | $ | 434 | | | $ | 591 | | | $ | 758 | | | $ | 266 | | | $ | 31,991 | | | $ | 1,100 | | Total | $ | 2,734 | | | $ | 731 | | | $ | 566 | | | $ | 718 | | | $ | 81 | | | $ | 31,957 | | | $ | 1,139 | |
|
2019 | External
Revenues | | Profit
before
income
taxes | | Interest
Expense | | Depreciation
on equipment
leased to
others | | Provision
for
credit
losses | | Assets at December 31, 2019 | | Capital
expenditures | |
2021 | |
2021 | External
Revenues | | Profit
before
income
taxes | | Interest
Expense | | Depreciation
on equipment
leased to
others | | Provision
for
credit
losses | | Assets at December 31, 2021 | | Capital
expenditures |
| North America | North America | $ | 1,627 | | | $ | 492 | | | $ | 389 | | | $ | 580 | | | $ | 19 | | | $ | 15,496 | | | $ | 1,105 | | North America | $ | 1,401 | | | $ | 419 | | | $ | 250 | | | $ | 542 | | | $ | 15 | | | $ | 15,755 | | | $ | 888 | |
| EAME | EAME | 281 | | | 72 | | | 54 | | | 65 | | | 4 | | | 4,918 | | | 92 | | EAME | 274 | | | 73 | | | 21 | | | 60 | | | 30 | | | 5,192 | | | 92 | |
| Asia/Pacific | Asia/Pacific | 363 | | | 167 | | | 106 | | | 11 | | | 16 | | | 4,540 | | | 11 | | Asia/Pacific | 340 | | | 170 | | | 84 | | | 7 | | | 9 | | | 4,117 | | | 10 | |
| Latin America | Latin America | 239 | | | 42 | | | 94 | | | 16 | | | 29 | | | 2,809 | | | 11 | | Latin America | 202 | | | 24 | | | 68 | | | 8 | | | 52 | | | 2,405 | | | 12 | |
| Mining | | Mining | 289 | | | 98 | | | 37 | | | 136 | | | (15) | | | 2,672 | | | 206 | |
| Caterpillar Power Finance | Caterpillar Power Finance | 101 | | | (41) | | | 42 | | | 3 | | | 71 | | | 1,673 | | | 0 | | Caterpillar Power Finance | 52 | | | 41 | | | 13 | | | 2 | | | (21) | | | 957 | | | — | |
| Mining | 326 | | | 56 | | | 73 | | | 138 | | | 23 | | | 2,966 | | | 299 | | |
| Total Segments | Total Segments | 2,937 | | | 788 | | | 758 | | | 813 | | | 162 | | | 32,402 | | | 1,518 | | Total Segments | 2,558 | | | 825 | | | 473 | | | 755 | | | 70 | | | 31,098 | | | 1,208 | |
| Unallocated | Unallocated | 59 | | | (342) | | | 256 | | | 0 | | | 0 | | | 1,896 | | | 16 | | Unallocated | 15 | | | (295) | | | 179 | | | — | | | — | | | 1,458 | | | 8 | |
| Timing | Timing | (30) | | | (17) | | | 0 | | | 0 | | | 0 | | | 16 | | | 0 | | Timing | (11) | | | 6 | | | — | | | — | | | — | | | 15 | | | — | |
| Methodology | Methodology | 0 | | | 199 | | | (227) | | | 0 | | | 0 | | | (216) | | | 0 | | Methodology | — | | | 159 | | | (197) | | | — | | | — | | | 18 | | | — | |
Inter-segment Eliminations (1) | Inter-segment Eliminations (1) | 0 | | | 0 | | | 0 | | | 0 | | | 0 | | | (405) | | | 0 | | Inter-segment Eliminations (1) | — | | | — | | | — | | | — | | | — | | | (202) | | | — | |
| Total | Total | $ | 2,966 | | | $ | 628 | | | $ | 787 | | | $ | 813 | | | $ | 162 | | | $ | 33,693 | | | $ | 1,534 | | Total | $ | 2,562 | | | $ | 695 | | | $ | 455 | | | $ | 755 | | | $ | 70 | | | $ | 32,387 | | | $ | 1,216 | |
|
2018 | External
Revenues | | Profit
before
income
taxes | | Interest
Expense | | Depreciation
on equipment
leased to
others | | Provision
for
credit
losses | | Assets at December 31, 2018 | | Capital
expenditures | |
2020 | |
2020 | External
Revenues | | Profit
before
income
taxes | | Interest
Expense | | Depreciation
on equipment
leased to
others | | Provision
for
credit
losses | | Assets at December 31, 2020 | | Capital
expenditures |
| North America | North America | $ | 1,531 | | | $ | 435 | | | $ | 362 | | | $ | 571 | | | $ | 42 | | | $ | 15,592 | | | $ | 1,102 | | North America | $ | 1,401 | | | $ | 312 | | | $ | 322 | | | $ | 538 | | | $ | 69 | | | $ | 14,749 | | | $ | 864 | |
| EAME | EAME | 273 | | | 13 | | | 47 | | | 71 | | | 58 | | | 4,785 | | | 108 | | EAME | 271 | | | 44 | | | 37 | | | 62 | | | 50 | | | 4,981 | | | 37 | |
| Asia/Pacific | Asia/Pacific | 336 | | | 159 | | | 105 | | | 18 | | | (5) | | | 4,297 | | | 14 | | Asia/Pacific | 338 | | | 145 | | | 94 | | | 9 | | | 38 | | | 4,585 | | | 7 | |
| Latin America | Latin America | 246 | | | (6) | | | 99 | | | 24 | | | 72 | | | 2,883 | | | 19 | | Latin America | 201 | | | 41 | | | 70 | | | 11 | | | 33 | | | 2,621 | | | 7 | |
| Mining | | Mining | 279 | | | 33 | | | 53 | | | 137 | | | 27 | | | 2,575 | | | 151 | |
| Caterpillar Power Finance | Caterpillar Power Finance | 110 | | | (143) | | | 55 | | | 2 | | | 171 | | | 2,259 | | | 0 | | Caterpillar Power Finance | 54 | | | (38) | | | 25 | | | 1 | | | 50 | | | 1,308 | | | 23 | |
| Mining | 293 | | | 47 | | | 71 | | | 132 | | | 9 | | | 2,782 | | | 211 | | |
| Total Segments | Total Segments | 2,789 | | | 505 | | | 739 | | | 818 | | | 347 | | | 32,598 | | | 1,454 | | Total Segments | 2,544 | | | 537 | | | 601 | | | 758 | | | 267 | | | 30,819 | | | 1,089 | |
| Unallocated | Unallocated | 92 | | | (267) | | | 248 | | | 1 | | | 0 | | | 1,957 | | | 104 | | Unallocated | 25 | | | (287) | | | 207 | | | — | | | (1) | | | 1,576 | | | 11 | |
| Timing | Timing | (34) | | | (1) | | | 0 | | | 0 | | | 7 | | | 55 | | | 1 | | Timing | (19) | | | (3) | | | — | | | — | | | — | | | 12 | | | — | |
| Methodology | Methodology | 0 | | | 196 | | | (230) | | | 0 | | | 0 | | | (159) | | | 0 | | Methodology | — | | | 187 | | | (217) | | | — | | | — | | | (152) | | | — | |
Inter-segment Eliminations (1) | Inter-segment Eliminations (1) | 0 | | | 0 | | | 0 | | | 0 | | | 0 | | | (270) | | | 0 | | Inter-segment Eliminations (1) | — | | | — | | | — | | | — | | | — | | | (264) | | | — | |
| Total | Total | $ | 2,847 | | | $ | 433 | | | $ | 757 | | | $ | 819 | | | $ | 354 | | | $ | 34,181 | | | $ | 1,559 | | Total | $ | 2,550 | | | $ | 434 | | | $ | 591 | | | $ | 758 | | | $ | 266 | | | $ | 31,991 | | | $ | 1,100 | |
|
(1) Elimination is primarily related to intercompany loans.
64
Geographic information:
| | (Millions of dollars) | (Millions of dollars) | | (Millions of dollars) | |
| | 2020 | | 2019 | | 2018 | | 2022 | | 2021 | | 2020 |
| Revenues | Revenues | | | | | | | Revenues | | | | | | |
| Inside U.S. | Inside U.S. | | $ | 1,443 | | | $ | 1,756 | | | $ | 1,684 | | Inside U.S. | | $ | 1,551 | | | $ | 1,422 | | | $ | 1,443 | |
| | All other | All other | | 1,107 | | | 1,210 | | | 1,163 | | All other | | 1,183 | | | 1,140 | | | 1,107 | |
| Total | Total | | $ | 2,550 | | | $ | 2,966 | | | $ | 2,847 | | Total | | $ | 2,734 | | | $ | 2,562 | | | $ | 2,550 | |
| Equipment on operating leases, net and property
and equipment, net (included in Other assets) | Equipment on operating leases, net and property
and equipment, net (included in Other assets) | | 2020 | | 2019 | | Equipment on operating leases, net and property
and equipment, net (included in Other assets) | | 2022 | | 2021 | |
| Inside U.S. | Inside U.S. | | $ | 2,482 | | | $ | 2,686 | | | Inside U.S. | | $ | 2,036 | | | $ | 2,179 | | |
| Inside Canada | Inside Canada | | 521 | | | 479 | | | Inside Canada | | 507 | | | 545 | | |
| | All other | All other | | 497 | | | 553 | | | All other | | 500 | | | 532 | | |
| Total | Total | | $ | 3,500 | | | $ | 3,718 | | | Total | | $ | 3,043 | | | $ | 3,256 | | |
|
NOTE 16 – SELECTED QUARTERLY FINANCIAL DATA (UNAUDITED)
| | | | | | | | | | | | | | | | | | | | | | | | | | |
| (Millions of dollars) | | | | | | |
| 2020 | | First quarter | | Second quarter | | Third quarter | | Fourth quarter |
| Total revenues | | $ | 695 | | | $ | 641 | | | $ | 598 | | | $ | 616 | |
| Profit before income taxes | | $ | 127 | | | $ | 89 | | | $ | 96 | | | $ | 122 | |
| Profit | | $ | 90 | | | $ | 59 | | | $ | 48 | | | $ | 96 | |
| | | | | | | | |
| 2019 | | First quarter | | Second quarter | | Third quarter | | Fourth quarter |
| Total revenues | | $ | 736 | | | $ | 757 | | | $ | 748 | | | $ | 725 | |
| Profit before income taxes | | $ | 142 | | | $ | 141 | | | $ | 184 | | | $ | 161 | |
| Profit | | $ | 98 | | | $ | 79 | | | $ | 129 | | | $ | 104 | |
| | | | | | | | |
| | | | | | | | |
| | | | | | | | |
| | | | | | | | |
| | | | | | | | |
| | | | | | | | |