UNITED STATES
SECURITIES AND EXCHANGE COMMISSION
Washington, D.C. 20549
FORM 10-K10-K/A
(Amendment No.1)
| | | | | |
| ☒ | ANNUAL REPORT PURSUANT TO SECTION 13 OR 15(d) OF THE SECURITIES EXCHANGE ACT OF 1934 |
For the fiscal year ended December 31, 2023
OR | | | | | |
| ☐ | TRANSITION REPORT PURSUANT TO SECTION 13 OR 15(d) OF THE SECURITIES EXCHANGE ACT OF 1934 |
For the Transition period from _____ to _____
Commission file number 1-08951
M.D.C. HOLDINGS, INC.
(Exact name of Registrant as specified in its charter) | | | | | | | | |
| Delaware | 84-0622967 |
(State or other jurisdiction of incorporation or organization) | (I.R.S. Employer Identification No.) |
| | |
| 4350 South Monaco Street, Suite 500 | 80237 |
| Denver, Colorado | (Zip code) |
| (Address of principal executive offices) | |
(303) 773-1100
(Registrant's telephone number, including area code)
Securities registered pursuant to Section 12(b) of the Act: | | | | | | | | | | | |
| Title of each class | Trading Symbol(s) | Name of each exchange on which registered |
| Common Stock, $.01 par value | MDC | New York Stock Exchange |
| 6% Senior Notes due January 2043 | MDC 43 | New York Stock Exchange |
Securities registered pursuant to Section 12(g) of the Act: None
Indicate by check mark if the Registrant is a well-known seasoned issuer, as defined in Rule 405 of the Securities Act. Yes ☒ No ☐
Indicate by check mark if the Registrant is not required to file reports pursuant to Section 13 or Section 15(d) of the Exchange Act. Yes ☐ No ☒
Indicate by check mark whether the Registrant (1) has filed all reports required to be filed by Section 13 or 15(d) of the Securities Exchange Act of 1934 during the preceding 12 months (or for such shorter period that the Registrant was required to file such reports) and (2) has been subject to such filing requirements for the past 90 days. Yes x No o
Indicate by check mark whether the Registrant has submitted electronically every Interactive Data File required to be submitted pursuant to Rule 405 of Regulation S-T (§232.405 of this chapter) during the preceding 12 months (or for such shorter period that the Registrant was required to submit such files). Yes x No o
Indicate by check mark whether the Registrant is a large accelerated filer, an accelerated filer, a non-accelerated filer, a smaller reporting company or an emerging growth company. See the definitions of "large accelerated filer," "accelerated filer," "smaller reporting company," and “emerging growth company” in Rule 12b-2 of the Exchange Act. | | | | | | | | | | | | | | | | | |
| Large Accelerated Filer | ☒ | Accelerated Filer | ☐ | Emerging Growth Company | ☐ |
| Non-Accelerated Filer | ☐ | Smaller Reporting Company | ☐ | | |
If an emerging growth company, indicate by check mark if the Registrant has elected not to use the extended transition period for complying with any new or revised financial accounting standards provided pursuant to Section 13(a) of the Exchange Act. ☐
Indicate by check mark whether the Registrant has filed a report on and attestation to its management's assessment of the effectiveness of its internal control over financial reporting under Section 404(b) of the Sarbanes-Oxley Act (15 U.S.C. 726(b)) by the registered public accounting firm that prepared or issued its audit report. ☒
If securities are registered pursuant to Section 12(b) of the Act, indicate by check mark whether the financial statements of the registrant included in the filing reflect the correction of an error to previously issued financial statements. ☐
Indicate by check mark whether any of those error corrections are restatements that required a recovery analysis of incentive-based compensation received by any of the registrant’s executive officers during the relevant recovery period pursuant to §240.10D-1(b). ☐
Indicate by check mark whether the Registrant is a shell company (as defined in Rule 12b-2 of the Exchange Act). Yes ☐ No ☒
As of June 30, 2023, the aggregate market value of the Registrant's common stock held by non-affiliates of the Registrant was $2.80 billion based on the closing sales price of $46.77 per share as reported on the New York Stock Exchange on June 30, 2023.
As of DecemberMarch 31, 2023,2024, the number of shares outstanding of Registrant's common stock was 74,661,479.75,047,701.
DOCUMENTS INCORPORATED BY REFERENCE
Portions of part III of this Form 10-K are incorporated by reference from the Registrant's2024definitive proxy statement to be filed with the Securities and Exchange Commission no later than 120 days after the end of the Registrant's fiscal year.None.
EXPLANATORY NOTE
On January 30, 2024, M.D.C. Holdings, Inc. (the "Company," "MDC," "we," or "our,") filed its Annual Report on Form 10-K for the fiscal year ended December 31, 2023, (the "Original Form 10-K"). The Original Form 10-K omitted Part III, Items 10 (Directors, Executive Officers and Corporate Governance), 11 (Executive Compensation), 12 (Security Ownership of Certain Beneficial Owners and Management and Related Stockholder Matters), 13 (Certain Relationships and Related Transactions, and Director Independence) and 14 (Principal Accounting Fees and Services) in reliance on the General Instructions to Form 10-K, which provides that such information may be either incorporated by reference from the registrant’s definitive proxy statement or included in an amendment to Form 10-K, in either case filed with the Securities and Exchange Commission (the "SEC") not later than 120 days after the end of the fiscal year.
We currently do not expect that a definitive proxy statement for a 2024 annual meeting of stockholders will be filed within 120 days after the end of the last fiscal year. Accordingly, this Amendment No. 1 to Form 10-K (this "Amendment") is being filed solely to:
•amend Part III, Items 10, 11, 12, 13 and 14 of the Original Form 10-K to include the information required by such Items; and
•in accordance with Rule 12b-15 under the Securities Exchange Act of 1934, as amended (the"Exchange Act"), file new certifications of the Company’s principal executive officer and principal financial officer required by Rule 13a-14(a) under the Exchange Act as exhibits to this Amendment under Item 15 of Part IV hereof.
The cover page of the Form 10-K is also amended to delete the reference to incorporation by reference of the Company’s definitive proxy statement.
This Amendment does not otherwise change or update any of the disclosures set forth in the Original Form 10-K and does not otherwise reflect any events relating to the previously announced Agreement and Plan of Merger, dated as of January 17, 2024 (the "Merger Agreement") pursuant to which the Company will become an indirect wholly-owned subsidiary of Sekisui House, Ltd. and any events occurring after the filing of the Original Form 10-K. Accordingly, this Amendment should be read in conjunction with the Original Form 10-K, and our other SEC filings subsequent to the date of the Original Form 10-K.
M.D.C. HOLDINGS, INC.
FORM 10-K10-K/A
For the Year Ended December 31, 2023
M.D.C. HOLDINGS, INC.PART III
FORM
Item 10. Directors,Executive Officers and Corporate Governance.
Directors of the Registrant
The Company's Certificate of Incorporation provides for three classes of directors (“Directors”) with staggered terms of office, to be divided as equally as possible. Directors of each class serve for terms of three years until election and qualification of their successors or until their resignation, death, disqualification or removal from office. Our Board of Directors ("Board") has eleven members, consisting of four Class I Directors whose terms expire in 2025, four Class II Directors whose terms expire in 2026 and three Class III Directors whose terms expire in 2024. The following is a brief description of the names, ages, and business experience during at least the past five years of each Director of the Company. Their experience, qualifications, attributes or skills, set forth below, have led to the Board's conclusion that each person should serve as a Director, in light of the Company’s business and structure. None of the business organizations identified below (excluding HomeAmerican Mortgage Corporation) are affiliates of the Company. None of the Directors holds, or has held during the past five years, any directorship in any company with a class of securities registered pursuant to Section 12 of the Exchange Act, subject to the requirements of Section 15(d) of the Exchange Act or registered as an investment company under the Investment Company Act of 1940. The ages of the directors set forth below are given as of December 31, 2023.
Class I Directors
Michael A. Berman, 73, has over thirty-five years of experience in the financial services industry. He is a member of Applied Capital Management, a private investment management firm located in Scottsdale, Arizona, and has served as its chairman from 2002 to present. From 2005 to 2006, he also served as the chief executive officer of First Ascent Capital, a financial services firm located in New York. From July 2006 until December 2008, he served as president and Chief Executive Officer of Real Estate Equity Exchange, Inc. (Rex & Co.), a financial services firm located in San Francisco, California. From January 1990 to March 1999, Mr. Berman was employed by The Nomura Securities Co., Ltd. (Tokyo) group of companies, where he held several senior executive positions, including that of President and CEO of Nomura Holding America Inc. and Chairman of Capital America, Nomura's commercial real estate lending subsidiary. In April 2006, Mr. Berman became a Director of the Company. Since 2006, he has been a director of HomeAmerican Mortgage Corporation, the Company’s mortgage lending subsidiary. Mr. Berman’s experience as a senior executive in corporate finance, in general, and the residential mortgage market, in particular, provide the Company with a valuable resource.
Herbert T. Buchwald, 92, is a principal in the law firm of Herbert T. Buchwald, P.A. and president and chairman of the Board of Directors of BPR Management Corporation, a property management company located in Denver, Colorado, positions he has held for more than the past five years. Mr. Buchwald has been engaged in the acquisition, development and management of residential and commercial real estate in Florida, Arizona, New Jersey and Colorado, through both publicly and privately held ventures for more than forty years. As an attorney, he has been admitted to practice before federal and state trial and appellate courts in Florida and Colorado. In addition, he holds an accounting degree and formerly was a practicing Certified Public Accountant. He has been a member of the Company's Board of Directors since March 1994. The combination of his knowledge, experience and skills provide the Company with strong oversight of accounting, financial, regulatory and legal matters, as well as the operation of the Company's real estate businesses. Mr. Buchwald is a veteran of the United States Navy.
Larry A. Mizel, 81, founded the Company in 1972 and has served as a Director since its inception. He was appointed Chairman of the Board in 1972 and Chief Executive Officer of the Company in 1988. Then, in October 2020, he was appointed as Executive Chairman. Mr. Mizel has provided the Company with leadership and judgment, previously serving as the Chief Executive Officer and Chairman of the Board of Directors, and now as Executive Chairman, while advancing the long-term interests of the Company's shareholders. One of the most experienced leaders in the homebuilding industry, his knowledge and foresight provide the Board with invaluable guidance.
Janice Sinden, 51, has served as President and Chief Executive Officer of the Denver Center for the Performing Arts since 2016. Past positions include Chief of Staff for Denver Mayor Michael B. Hancock, where she managed 60 appointees and 26 departments. She currently serves on the non-profit boards of Citizens for Arts to Zoo, University of Northern Colorado, VISIT Denver, the American Transplant Foundation, Colorado Inclusive Economy and Denver Preschool Program. Ms. Sinden has been recognized by Titan 100 as one of Colorado's Top 100 CEO's, the Denver Business Journal as an Outstanding Woman in Business, 5280 Magazine as one of the 50 most influential persons in Denver, by the Colorado Women’s Foundation as one of the 25 most influential women in Colorado, by the Girl Scouts of Colorado as a Woman of Distinction, and by the University of Northern Colorado Department of Political Science and International Affairs as Distinguished Alumnus of the Year. Ms. Sinden has been a member of the Company's Board of Directors since January 2022. Her operational and business knowledge, rich
cultural experiences and community involvement provide the Company with a valuable resource and contribute to the business perspectives of the Board.
Class II Directors
Rafay Farooqui, 47, is the Founder & CEO of Strategic Alternative Funds Group, LLC d/b/a +SUBSCRIBE, a fintech leader providing a unified private markets platform for alternative investment fund investors, fund managers, and service providers. Prior to founding +SUBSCRIBE in 2015, he also co-founded CAIS in 2009, a fintech technology company offering an investable menu of leading alternative investment funds to wealth management firms. Prior to forming CAIS, Mr. Farooqui was the Head of the Middle East & North African Equities division for UBS Investment Bank and was based in Dubai, U.A.E. Between 2003 and 2008, he was Head of UBS Investment Bank's U.S. Institutional Equities Sales Group, based in New York City. Prior to UBS, from 1998 to 2003, Mr. Farooqui was Head of Global Institutional International Sales-Trading in the New York City offices of Goldman Sachs & Co., where he advised alternative investment management clients on research and trading in the global securities markets. Mr. Farooqui began his career in 1998 at Goldman Sachs & Co. within the Equity Division's International Department as a global equity securities sales-trader. He joined the Company's Board of Directors in December 2022. Mr. Farooqui’s focus and experience in technology and finance provide the Company with both technology information architecture and financial expertise.
David D. Mandarich, 76, has been associated with the Company since 1977. He was a Director from September 1980 until April 1989, and has been a Director continuously since March 1994. He was appointed President and Chief Operating Officer of the Company in June 1999. Then, in October 2020, he was appointed President and Chief Executive Officer. A skilled and experienced leader in the homebuilding industry, Mr. Mandarich provides the Board with the benefit of his judgment and his knowledge and understanding of the Company's homebuilding business and operations. Mr. Mandarich is a veteran of the United States Army.
Paris G. Reece III, 69, was formerly the Company’s Chief Financial Officer and Principal Accounting Officer, and retired on August 1, 2008. Since his retirement, Mr. Reece has performed consulting work and served in a volunteer position as the President of Cancer League of Colorado, a leading non-profit organization that was established over fifty years ago to raise money for cancer research and patient care. He joined the Company's Board of Directors in May 2013. As a Certified Public Accountant (Texas, non-practicing), a former Chief Financial Officer and a highly respected person within the homebuilding industry, Mr. Reece is uniquely qualified to provide the Company with strong oversight of accounting and financial matters, as well as the operation of the Company's homebuilding and financial services businesses.
David Siegel, 67, was a partner in the law firm of Irell & Manella LLP for more than thirty years, where he led that firm's securities litigation practice and was the firm's Managing Partner. He retired from the active practice of law in 2019. Mr. Siegel's law practice, for which he is nationally recognized, was concentrated on securities class actions, corporate governance, risk management, SEC reporting standards and regulatory compliance. Mr. Siegel has chaired and has been a frequent speaker at various seminars on securities litigation, class actions, and trial techniques. He has been named by his peers as one of the "Best Lawyers in Commercial Litigation" in The Best Lawyers in America guide. Mr. Siegel has been a member of the Company's Board of Directors since June 2009. Mr. Siegel's knowledge and experience in corporate governance and litigation matters provide the Company with significant guidance and oversight.
Class III Directors
Raymond T. Baker, 73, has served as President of Gold Crown Management Company, a real estate asset management company, from 1978 to 2013, then as Vice President and Secretary from 2013 to present. He is the founder and has served as Co-Director of the Gold Crown Foundation since 1986. He also is a member of the Board of Directors of Alpine Banks of Colorado and Land Title Guarantee Company. Mr. Baker is currently serving as Chairman of the Board of the Metropolitan Football Stadium District (Denver). From February 2004 until May 2007, he served as a director of Central Parking Corporation. He has over thirty-five years of experience in the real estate and banking industries. Mr. Baker became a member of the Company's Board of Directors in January 2012. His experience and knowledge of the real estate and banking industries directly complement and support the Company’s real estate activities and the financing of those activities.
David E. Blackford, 75, has over forty-five years experience in the banking industry. He is employed by California Bank & Trust (CB&T), a leading California banking institution and a division of Zions Bancorporation, National Association. Between 1998 and 2001, he was CB&T’s managing director, serving on the Board of Directors and the Senior Loan Committee for Real Estate Finance. In May 2001 he was appointed chairman, president and chief executive officer of CB&T, and currently serves as executive chairman. He also is an executive vice president of Zions Bancorporation, National Association. Prior to 1998, he served as an executive officer in several financial institutions, including Bank One and Valley National Bank. He joined the
Company's Board of Directors in April 2001. His experience and knowledge of historic and current institutional real estate lending practices, the regulatory process and the volatility of the credit markets provide a unique perspective to the Board.
Courtney L. Mizel, 51, is a Principal at Mizel Consulting where she has worked for over twenty years. In this role, Ms. Mizel consults with companies in various industries on matters relating to their business management and strategy, including operations, business development, marketing, as well as legal matters. She is also a Founding Director of The Counterterrorism Education Learning Lab, an organization dedicated to preventing terrorism through education, empowerment, and engagement. She is active in a number of other non-profit activities, including serving on the Boards of Directors of Zimmer Children’s Museum, Sharsheret National, and JQ International. Ms. Mizel received her Bachelor of Science in Economics with honors from The Wharton School of the University of Pennsylvania and her Juris Doctor from the University of Southern California Gould School of Law. Ms. Mizel became a member of the Company's Board of Directors in June 2017. She is the daughter of the Company’s Executive Chairman, Larry A. Mizel. Ms. Mizel’s professional and business achievements, intellect and diverse experiences contribute to the business, governance and legal perspectives of the Board.
The following table provides the membership of each standing committee of the Board in 2023:
| | | | | | | | | | | | | | | | | | | | | | | | | | | | | |
| Name | | Audit | | Compensation | | Corporate Governance / Nominating | | Legal | |
| Raymond T. Baker | | | | C | | | | | |
| Michael A. Berman | | | | | | | | | |
| David E. Blackford | | | | | | M | | M | |
| Herbert T. Buchwald | | M | | M | | M | | C | |
| Rafay Farooqui | | | | | | | | | |
| David D. Mandarich | | | | | | | | | |
| Courtney L. Mizel | | | | | | | | M | |
| Larry A. Mizel | | | | | | | | | |
| Paris G. Reece III | | C | | | | | | | |
| David Siegel | | | | | | C | | M | |
| Janice Sinden | | M | | | | | | | |
C = Chair; M = Member
Executive Officers of the Registrant
Set forth below are the names and offices held by the executive officers of the Company as of December 31, 2023. The Board, after reviewing the functions performed by the Company's officers, has determined that, for purposes of Item 401 of SEC Regulation S-K, only these officers are deemed to be executive officers of the Company. These officers also constitute our Named Executive Officers ("NEOs").
The executive officers of the Company hold office until their successors are duly elected and qualified or until their resignation, retirement, death or removal from office. Biographical information on Messrs. Mizel and Mandarich, who serve as Directors and executive officers of the Company, is set forth under "Directors of the Registrant" above. Biographical information for Mr. Martin and Mr. Kaplan is set forth below.
| | | | | | | | | | | |
| Name | | Other Business Experience | |
| David D. Mandarich | | Biographical information regarding Mr. Mandarich is set forth in the section entitled “Directors of the Registrant” above. | |
| President and Chief Executive Officer | | |
| Age: 76 | | |
| | |
| Larry A. Mizel | | Biographical information regarding Mr. Mizel is set forth in the section entitled “Directors of the Registrant” above. | |
| Executive Chairman | | |
| Age: 81 | | |
| | |
| Robert N. Martin | | Robert N. Martin was appointed Senior Vice President and Chief Financial Officer in May 2015. He also served as the principal accounting officer from May 2015 until August 2020 and resumed that role in June 2021 through January 2023. He previously served as Vice President – Finance and Business Development. In April 2013, he was promoted to the position of Vice President of Finance and Corporate Controller. In his current role, Mr. Martin has direct oversight of the Company's division and corporate accounting, tax, treasury, investor relations, information technology and finance, planning and analysis functions. Additionally, he has served on all of the Company’s Asset Management Committees ("AMCs") and has performed a key role in the Company's capital markets activities. He is an officer, director or both of many of the Company’s subsidiaries. Mr. Martin received a bachelor’s degree in Accounting and Computer Applications from the University of Notre Dame and is both a Certified Public Accountant and a CFA charterholder.
| |
| Senior Vice President and Chief Financial Officer | | |
| Age: 45 | | |
| | |
| Michael L. Kaplan | | Michael L. Kaplan joined the Company in October 2022 as Senior Vice President and General Counsel and has direct oversight of the Company’s legal, corporate governance, regulatory compliance, and insurance and risk management functions. From February 2020 until October 2022, Mr, Kaplan was the Executive Vice President, Chief Legal Officer (CLO), Chief Compliance Officer (CCO) and Secretary for Red Robin Gourmet Burgers, Inc. (Nasdaq: RRGB) and from September 2013 until February 2020, he was the Senior Vice President, CLO, CCO and Secretary for that company. Prior to RRGB, Mr. Kaplan was Senior Vice President, General Counsel, Chief Security Officer and Secretary for StandardAero from January 2010 until July 2013, and from January 2000 until January 2010 he was an attorney with Greenberg Traurig, LLP. Mr. Kaplan received an A.B. degree in economics and government from the College of William and Mary and a J.D. degree from the Stanford Law School. | |
| Senior Vice President and General Counsel | | |
| Age: 55 | | |
| | |
Delinquent Section 16(a) Reports
The Company's executive officers and Directors and certain owners of more than ten percent of the Company's common stock are required under Section 16(a) of the Securities Exchange Act, as amended, to file initial reports of ownership and reports of changes in ownership of common stock of the Company with the SEC. Based upon a review of the reports filed electronically with the SEC, and, in certain cases, written representations, the Company believes that during the year ended December 31, 2023, all such reports were filed on a timely basis.
Audit Committee
The Audit Committee of the Board of Directors ("Audit Committee"), which has been established in accordance with Section 3(a)(58)(A) of the Exchange Act, consists of Mr. Reece, who serves as Chairman, Mr. Buchwald and Ms. Sinden. Each member of the Audit Committee is "independent" and "financially literate" in the judgment of the Board, as defined in the listing standards of the NYSE and the rules of the SEC. In addition, the Board has determined that Mr. Buchwald is an "audit committee financial expert" as defined by applicable SEC regulations. The Board believes that his experience and qualifications described above under "Directors of the Registrant" qualify him to act as the Audit Committee's audit committee financial expert. The Audit Committee met eleven times during 2023. The organization, functions and responsibilities of the Audit Committee are described in the restated charter for the Audit Committee, which is posted on the investor relations section of the Company's website, www.mdcholdings.com.
Code of Ethics
We will provide to any shareholders or other person without charge, upon request, a copy of our Corporate Code of Conduct, Corporate Governance Guidelines, code of ethics applicable to our principal executive officer, principal financial officer, principal accounting officer or controller, or persons performing similar functions (collectively “senior financial officers”) and the charters for our Audit Committee, The Compensation Committee of the Board of Directors ("Compensation Committee"), The Legal Committee of the Board of Directors ("Legal Committee"), and the Corporate Governance/Nominating Committee of the Board of Directors ("Corporate Governance/Nominating Committee"). You may obtain these documents on our website at www.mdcholdings.com, under our Investor Relations section or by contacting our Investor Relations department at 1-866-424-3395. Our intention is to post on our website any amendments to or waivers from our code of ethics applicable to our senior financial officers if such disclosure is required.
Corporate Governance/Nominating Committee
Procedures for nominating persons for election to the Board are contained in the Company's By-Laws and, accordingly, those procedures constitute the Company's policy with regard to the nomination and consideration of Director candidates recommended by shareholders. The Corporate Governance/Nominating Committee will consider candidates identified by shareholders following the procedures set forth in the By-Laws. There have been no changes to these procedures in the last year.
Item 11. Executive Compensation.
Executive Compensation - Compensation Discussion and Analysis
Executive Summary
For fiscal 2023, our named executive officers were:
| | | | | |
| Named Executive Officers |
| Larry A. Mizel | Executive Chairman |
| David D. Mandarich | President and Chief Executive Officer (“CEO”) |
| Robert N. Martin | Senior Vice President and Chief Financial Officer (“CFO”) |
| Michael L. Kaplan | Senior Vice President and General Counsel (“CLO”) |
Our compensation program is designed to align executive pay with the drivers of long-term value creation and reward execution of our strategic initiatives.
The annual incentive and long-term compensation programs for our Executive Chairman and CEO are 100% performance-based utilizing our annual and long term business goals, predetermined challenging metrics tied to the drivers of long-term shareholder value.
The Compensation Committee aims to design a compensation program that rewards and retains talented executives while motivating them to drive short-term and long-term performance. We believe that our ability to retain and motivate our executive officers with their exceptional skills, experience and capacity to succeed in our competitive industry has been essential to the success of our Company and a significant factor in creating long-term value for our shareholders.
Our compensation program reflects the above philosophy and, additionally, prioritizes the following:
•Attracting and retaining talented executives and encouraging their long-term service and loyalty
•Supporting our long-term business goals and driving performance by closely aligning our compensation metrics and goals with our long-term growth strategy
•Maintaining a firm link between our executives’ and shareholders’ long-term interests
•Prioritizing growth, risk management and financial stability
•Reflecting shareholder feedback in the compensation program design and related considerations, through regular, ongoing shareholder engagement
Compensation Governance Best Practices
In order to continue to provide long-term value to our shareholders, our Compensation Committee is committed to maintaining independent and thorough oversight of our executive compensation program and the following governance best practices are key to achieving this goal. These Compensation Governance best practices include:
•Executive compensation program design and refinements incorporate shareholder feedback
•Significant portion of Executive Chairman and CEO pay is performance based
•Compensation Committee sets rigorous targets and metrics
•Compensation Committee performs thorough assessment of Company and individual performance
•100% of Compensation Committee is independent
•Compensation Committee works with an independent compensation consultant
•Executives are subject to significant stock ownership guidelines
•Company maintains policies prohibiting hedging Company stock
•Clawback policy authorizes Company to recover compensation under specified circumstances
•Vesting of cash remuneration under Executive Chairman and CEO employment agreements is subject to double trigger change-in-control provisions
2023Say-on-Pay Vote
Our Compensation Committee is committed to improving our executive compensation programs and modifying them as necessary to maintain the alignment of our executives and shareholders. We continue to engage investors on executive compensation topics and will continue to seek their feedback. We received a negative vote at the 2023 annual shareholders meeting, where our say-on-pay proposal received 44.8% support. In response to the feedback received, in 2023 the Compensation Committee reduced the bonus opportunity and bonus payment cap by $4 million and $3 million, respectively, for both our Executive Chairman and CEO as further discussed below. In addition, the Compensation Committee granted PSU awards under the Long-Term Incentive Program in 2023, for both our Executive Chairman and CEO, instead of the stock options that were awarded in 2022.
Components of Executive Compensation
The Compensation Committee designed our compensation program to support the drivers of value and shareholder return over the long term. It is comprised of three primary elements: (i) base salary, (ii) annual incentive award; and (iii) long-term incentive award.
| | | | | | | | | | | |
| Compensation Component | Description | Purpose | Key
Characteristic |
| Base Salary | Cash compensation based on executive officer’s role and employment agreement, if any. Salary levels are evaluated annually and may be adjusted for length of service, competitive considerations or recognition of a change in responsibilities. | ● Provide financial certainty and stability
● Attract and retain executive talent
● Recognize experience, length of service, competitive market conditions and individual performance | Fixed |
Annual
Incentive Award | Each year the Compensation Committee approves performance goals for the Executive Chairman and CEO, and establishes Key Performance Indicators (“KPIs”) for the CFO and CLO. The Compensation Committee determines the extent to which an award is earned and the amount of such award is based on individual and Company performance against the pre-established goals. | ● Motivate executive officer to achieve key annual goals and position the Company for long-term success
● Reward executive officer for individual performance and overall Company performance | Performance Based |
Long-Term
Incentive Award | Each executive officer is eligible to receive an award at the discretion of the Compensation Committee based upon long-term performance potential. | ● Provide an incentive for executive officers to achieve long-term sustainable success for the Company and to promote shareholder value
● Attract, motivate, reward and retain executive talent | Performance Based |
The net effect of our pay design is that both for the CEO and the other NEOs, a large majority of total direct compensation is performance based, and dependent on Company, individual, or stock performance.
Fixed Compensation - Base Salary
The Compensation Committee sets executive officer base salaries at a level that reflects the competitive market for these roles as well as each individual’s performance, skills and experience. Base salaries remained unchanged during the year for our Executive Chairman, CEO, CFO and CLO.
Performance-Based Compensation
2023 Executive Chairman and Chief Executive Officer Annual Incentive Bonus
Our annual incentive compensation program is designed to retain, motivate and reward the Executive Chairman and CEO for their respective contributions in achieving the Company’s annual financial goals by focusing their attention on the following key economic drivers: return on equity, home sale revenues, homebuilding operating margin, pre-tax earnings per diluted share and EBITDA. Focus on these key economic drivers is essential to our short-term financial results and, ultimately, our long-term success.
Annual Bonus Calculation Formula: Links to Key Metrics
The 2023 performance goal included a threshold performance objective that must be met prior to any bonus being earned. The threshold performance objective for 2023 was a 7.0% consolidated adjusted pre-tax return on beginning equity (the “ROE Condition”). This was a decrease compared to the prior year threshold performance objective given the instability of the housing market, but is consistent with 2021 and prior thresholds of 6.0%. The actual consolidated adjusted pre-tax return on beginning equity in 2023 was 18.0%, satisfying the ROE Condition, and as such, the Executive Chairman and CEO earned a $2.0 million bonus.
Once the ROE Condition was met, the Executive Chairman and CEO had the opportunity to earn an additional bonus (the “Additional Bonus Opportunity”) of $6.0 million and $5.0 million, respectively. The Additional Bonus Opportunity is described in more detail below. Both the Executive Chairman and CEO's Additional Bonus Opportunity was decreased compared to 2022 by $4.0 million from $10.0 million and $9.0 million, respectively.
Outcomes Reflect Alignment with Performance
Consistent with prior years and based in part on previous shareholder feedback, the Additional Bonus Opportunity for the Executive Chairman and CEO for 2023 was based on four distinct sets of financial goals, as set forth below. The Compensation Committee believes that achievement of these goals, in concert, is important for long term shareholder value creation.
| | | | | | | | | | | | | | | | | | | | | | | | | | |
| Home Sale Revenues | Executive Chairman Bonus
(thousands) | CEO Bonus (thousands) | Goal
(millions) | | Adjusted Homebuilding Operating Margin | Executive Chairman Bonus
(thousands) | CEO Bonus (thousands) | Goal |
| Target | $ | 1,500 | | $ | 1,250 | | $ | 3,754 | | | Target | $ | 1,500 | | $ | 1,250 | | 6.2 | % |
| Threshold | $ | 800 | | $ | 800 | | $ | 3,271 | | | Threshold | $ | 800 | | $ | 800 | | 4.5 | % |
| | | | | | | | | | | | | | | | | | | | | | | | | | |
Diluted Adjusted
Pre-Tax EPS | Executive Chairman Bonus
(thousands) | CEO Bonus (thousands) | Goal | | Adjusted
EBITDA | Executive Chairman Bonus
(thousands) | CEO Bonus (thousands) | Goal
(millions) |
| Target | $ | 1,500 | | $ | 1,250 | | $ | 4.48 | | | Target | $ | 1,500 | | $ | 1,250 | | $ | 446 | |
| Threshold | $ | 800 | | $ | 800 | | $ | 2.98 | | | Threshold | $ | 1,000 | | $ | 1,000 | | $ | 340 | |
The appropriateness of the categories selected for 2023, along with target and threshold goal amounts, were carefully considered by the Compensation Committee given the Company’s emphasis on prioritizing long-term growth, risk management, financial stability and pursuit of long-term value. Specifically, with respect to the Home Sale Revenues, Adjusted Homebuilding Operating Margin, Adjusted Pre-Tax Diluted EPS and Adjusted EBITDA goals, the Compensation Committee considered prior year results, the 2023 Business Plan as well as current market conditions in setting the threshold and target performance goals.
The 2023 Business Plan was developed by the Executive Chairman, CEO, CFO and other senior leaders from the “ground up” utilizing (i) forecasts submitted by the presidents for each of the Company’s homebuilding divisions detailing their operational projections for each of their divisions’ communities, (ii) the forecast submitted for the mortgage company by its leadership team; and (iii) forecasts from the CFO regarding the insurance companies, any other income producing divisions of the Company, and all the corporate general and administrative departments. The 2023 Business Plan was reviewed by the Board. The process of developing the business plan incorporates a disciplined evaluation of risks identified by management and the Board to establish a reasonable range of potential performance goals for the year including general economic conditions, fluctuations in interest rates, variations in projected mortgage lending programs, the availability and cost of capital, the availability and acquisition cost of land, materials and contractors in the homebuilding operations, potential for shortages and the increased cost of labor, and increased governmental regulation, including the adverse interpretation of tax, labor and environmental laws.
Target performance goals were established to reflect outstanding performance in light of the risks and market conditions anticipated for 2023.
Based on the achievements in these categories, the Executive Chairman and CEO earned an additional bonus of $6.0 million and $5.0 million, respectively, (subject to the bonus cap discussed below) related to the Additional Bonus Opportunity as shown below.
| | | | | | | | | | | | | | | | | |
| 2023 Short-Term Incentive Program |
| Performance Goal | Performance Required at Threshold | Performance Required at Target | Actual Performance | Bonus Earned |
| Executive Chairman | CEO |
| Adjusted pre-tax return* on equity | 7% hurdle achieved at 18.0% | $ | 2,000,000 | | $ | 2,000,000 | |
Additional Bonus Opportunity |
| Home Sales Revenue | $3.27 billion | $3.75 billion | $4.52 billion | $ | 1,500,000 | | $ | 1,250,000 | |
| Adjusted homebuilding operating margin** | 4.5% | 6.2% | 9.0% | $ | 1,500,000 | | $ | 1,250,000 | |
| Diluted adjusted pre-tax EPS* | $2.98 | $4.48 | $7.38 | $ | 1,500,000 | | $ | 1,250,000 | |
| Adjusted EBITDA*** | $340 million | $446 million | $668.6 million | $ | 1,500,000 | | $ | 1,250,000 | |
| Total Additional Bonus | $ | 8,000,000 | | $ | 7,000,000 | |
| | | | | |
| Total Incentive Bonus (Lesser of $7 million and $6 million for the Executive Chairman and CEO, respectively, or the calculated amount) | $ | 7,000,000 | | $ | 6,000,000 | |
* Adjusted pre-tax return / income is a non-GAAP financial measure and is defined as pre-tax income before expenses derived from impairments,executivestock-based compensation expenseabove the budgeted amount, warranty reserve adjustments, non-recurring or out-of-period charges and the effect of changes in laws, regulations or accounting principles divided by diluted weighted shares outstanding.
** Adjusted homebuilding operating margin is a non-GAAPfinancial measure and is defined as gross margin from home sales less homebuilding SG&A expense, before expenses derived from impairments,executivestock-based compensation expenseabove the budgeted amount, warranty reserve adjustments, non-recurring or out-of-period charges and the effect of changes in laws, regulations or accounting principles divided by home sale revenues.
*** Adjusted EBITDA is a non-GAAPfinancial measureand is defined as earnings before interest, taxes, depreciation, amortization, non-cash charges derived from impairments, stock-based compensation expense, abandoned project costs, warranty reserve adjustments, non-recurring or out-of-period charges and the effect of changes in laws, regulations or accounting principles.
Bonus Payment Cap
The 2023 annual incentive bonus for the Executive Chairman and CEO (the ROE Condition Bonus plus the Additional Bonus Opportunity) was subject to a $7.0 million and $6.0 million cap (the “Bonus Cap”), respectively. The Bonus Cap was established by the Compensation Committee based on guidance from its Compensation Consultant taking into account each executive’s historic compensation, reference to executive compensation being awarded to the Company’s peer group and feedback from the Company's shareholders. The Bonus Cap was decreased during 2023 for both the Executive Chairman and CEO, consistent with the decrease in the Additional Bonus Opportunity discussed above.
This year, in light of the Company’s superior performance under the direction of Mr. Mizel and Mr. Mandarich, the Committee determined that an exercise of its discretion under the 2018 Performance-Based Plan was warranted to increase the bonus to be paid to each of Mr. Mizel and Mr. Mandarich by $1.0 million. Accordingly, the Committee awarded a total cash bonus for 2023 to Mr. Mizel of $8.0 million and a total cash bonus for 2023 to Mr. Mandarich of $7.0 million. The Committee made no award of restricted stock.
2023 CFO and General Counsel (CLO) Annual Incentive Bonus
The CFO and CLO positions are primarily responsible for accounting, finance, legal and regulatory compliance and, in the judgment of the Compensation Committee, their incentive compensation should not directly depend on the Company’s financial performance. Instead, the CFO and CLO were awarded a bonus opportunity measured by specific Key Performance Indicators (“KPIs”) established by the Compensation Committee, their attainment and a bonus payment commensurate with a percentage of their base pay. The Compensation Committee consults with the Executive Chairman and CEO with regard to their achievements. For 2023, the Compensation Committee established the following KPIs with the associated weighting:
Chief Financial Officer
•Shareholder relations management and oversight (15%)
•Timely and accurate handling of financial regulatory filings (30%)
•Oversight of accounting, finance, information technology and treasury functions, including capital markets and bank financing transactions, if applicable (40%)
•Successful completion of special projects - including ESG (15%)
General Counsel
•Litigation management (20%)
•Regulatory compliance (20%)
•Successful completion of special projects - including ESG (15%)
•Successful supervision of all real estate transactions (25%)
•Oversight of risk management (20%)
The actual bonus amounts were based on the level of the performance achieved:
•A target bonus of 100% of base salary if the Compensation Committee determined that each KPI was achieved.
•A maximum bonus of 200% of base salary if the Compensation Committee determined that each KPI has been exceeded at a level doubling the targeted performance.
•Proportionate bonus levels as a percentage of base salary to the extent some KPIs were partially achieved or exceeded.
Based on its evaluation of performance relative to the established KPIs, the Compensation Committee awarded Mr. Martin and Mr. Kaplan annual incentive bonuses for 2023 of $1,500,000 and $475,000, respectively, payable in cash. The Compensation Committee also awarded Mr. Martin $2.0 million in cash in lieu of a restricted stock award, for a total cash payment of $3.5 million.
Long-Term Incentive Compensation
For our Executive Chairman and CEO, the 2023 long-term equity grants were entirely in performance share units in order to objectively align the incentives of the Company’s management team with the interests of our shareholders. This was a change from prior year, based in part on shareholder feedback, where the long-term equity grants were comprised of stock options.
For our CFO, a portion of the 2023 long-term equity grant was delivered in performance share units with the remainder paid in cash in lieu of a restricted stock award as noted above. The Compensation Committee believes this is an appropriate balance of long-term incentive compensation to encourage the continued retention of the CFO and align his interests with the interests of our shareholders.
The long-term incentive program in 2023 includes metrics that measure the Company’s long-term value drivers related to the Company’s core business. The program is performance-based and designed to retain, motivate and reward our executive officers for achieving our strategic and financial long-term objectives through the use of performance share units.
| | | | | | | | | | | |
| Executive | Target | Threshold | Maximum |
| Executive Chairman | 200,000 shares | 50% of Target | 200% of Target |
| CEO | 180,000 shares | 50% of Target | 200% of Target |
| CFO | 17,500 shares | 50% of Target | 200% of Target |
The performance share units vest based on increasing average home sale revenues compared to home sale revenues over a base period, while maintaining a minimum average gross margin from home sales (excluding impairments) of at least fifteen percent (15%).
| | | | | | | | | | | | | | |
| Long-Term Incentive Program |
| Performance Metric | Base | Threshold | Target | Maximum |
| Gross Margin from Home Sales (Excluding Impairments) | 15% Average Gross Margin from Home Sales requirement |
| Home Sale Revenues (in billions) | $4.52 | $4.75* | $4.97* | $5.42* |
* Average over Performance Period
Peer Data
The Compensation Committee utilized peer data as a reference when it considered the incentives and compensation plan design. It was not employed for benchmarking purposes. Rather, the peer group information was considered for broad subjective comparisons and not as an objective metric.
| | | | | | | | |
| Homebuilder Peer Group Companies (the “Peer Group”) |
Beazer Homes USA, Inc.
D.R. Horton, Inc.
Hovnanian Enterprises, Inc.
KB Home | Lennar Corporation
Meritage Homes Corporation
M/I Homes Inc. | NVR, Inc.
PulteGroup, Inc.
Toll Brothers, Inc. |
The Compensation Committee chose these companies for their parallels to MDC's core business and markets, recognizing that their corporate structure, business strategies and risk profile may significantly vary from those of our Company.
The Compensation Committee refers to the Peer Group not only for compensation purposes, but also for business model and risk evaluation purposes, as discussed in more detail, below.
Role of Compensation Committee and Management
The Compensation Committee conducted a series of meetings beginning in March 2023 and continuing into February 2024, at which time the Compensation Committee developed its determinations regarding 2023 executive officer compensation. The following table summarizes the roles of the Compensation Committee, the Consultant and management in formulating their decisions on executive officer compensation:
| | | | | |
| Responsible Party | Roles and Responsibilities |
Compensation Committee of the Board of Directors TheCompensationCommittee currently is comprised of Independent Directors and reports to the Board. | ● Oversees all executive officer compensation levels, including benefits, having a goal to maintain compensation levels that are comparable to the marketplace and in conformity with shareholder interests. ● Administers the Company's current equity and other compensation plans and any additional plans adopted by the Company. ● Reviews and approves corporate goals and objectives relevant to Executive Chairman and CEO compensation. ● Evaluates the Executive Chairman and CEO's performance in light of set goals and objectives, and determines and approves the Executive Chairman and CEO's compensation level based on this evaluation. ● Has authority to determine and approve non-CEO compensation. ● Makes recommendations to the Board with respect to incentive-compensation plans and equity-based plans. ● Develops a compensation committee report on executive compensation as required by the SEC to be included in the Company's annual proxy statement or annual report on Form 10-K filed with the SEC. |
Consultant to the Compensation Committee WealthPoint, LLC, as anindependent Consultant, retained directly by the Compensation Committee, that provides consulting advice on matters of governance and executive compensation. | ● Provides advice and guidance on the appropriateness and competitiveness of our compensation programs relative to Company performance and market practice. ● Performs all functions at the direction of the Compensation Committee. ● Attends Compensation Committee meetings (including executive sessions, as required). ● Provides advice and guidance regarding governance issues bearing on the executive compensation determinations. ● Provides market data, as requested. ● Consults on various compensation matters and compensation program designs and practices. ● Conducts an assessment of the risks arising from our compensation programs. ● Confers with the Executive Chairman and CEO on behalf of the Compensation Committee concerning compensation, incentives and goals for other NEOs. ● Assists in selection of the Company’s peers. |
Executive Chairman and CEO With the support of other members of the management team. | ● Review performance of the CFO and CLO and makes recommendations to the Compensation Committee with respect to their compensation. ● Confer with the Compensation Committee concerning design and development of compensation and benefit plans for Company employees. |
Role of the Independent Compensation Consultant
The Compensation Committee has the authority to retain outside counsel, consultants and other advisors to assist it in evaluating compensation or in otherwise discharging its duties and responsibilities. After consideration of independence factors as required by the NYSE, the Compensation Committee engaged WealthPoint, LLC to advise the Committee in connection with year-end 2023 compensation determinations, the structuring of executive compensation for 2024 and the compensation
disclosures to be included in this Form 10-K/A. This consultant also assisted the Compensation Committee in determining appropriate peers for purposes of comparing (but not benchmarking) market compensation, and provided other related services.
WealthPoint, LLC has not provided any services to the Company or its affiliates other than the services provided to the Compensation Committee. After considering, among other matters, the absence of any business or personal relationship between the consultants and any member of the Compensation Committee or any executive officer of the Company, the Compensation Committee has concluded the consultant's services do not raise any conflicts of interest.
Other Compensation Considerations
Stock Ownership Guidelines
The Company has adopted formal equity ownership guidelines for the executive officers in order to expressly promote their continued short and long term financial alignment with the interests of the shareholders of the Company. Under the guidelines, each executive officer is encouraged to acquire and maintain ownership of common stock of the Company having an acquisition value of not less than the following multiple of the executive officer’s base annual salary:
| | | | | |
| Executive Officer | Multiple |
| Executive Chairman | 5X |
| CEO | 5X |
| All Others | 1X |
To expedite achievement of the goal set forth above, each executive officer who has not yet achieved the goal agrees to retain the shares they acquire through restricted stock awards, performance share units and the future exercise of employee stock options, net of taxes and any option exercise price, up to the number of shares necessary to achieve the goal. Messrs. Mizel, Mandarich and Martin have all achieved and maintain the stock ownership goal.
Anti-Hedging and Anti-Pledging Policies
Our executive officers (but not other employees) and our Directors are prohibited from acquiring an interest in financial instruments intended to hedge or offset any decrease in the market value of the Company’s stock held directly or indirectly by that person. They also are required to inform the Company’s compliance committee and obtain pre-clearance prior to purchasing Company stock on margin, margining Company stock or pledging Company stock as collateral for a loan.
Clawback Policy
On July 24, 2023, our Board adopted a Clawback Recovery Policy in compliance with NYSE listing standard Section 303A.14 and SEC Rule 10D-1. The policy requires the Company to recover the amount of "erroneously awarded" incentive-based compensation received by current or former executive officers in the event that the Company is required to prepare an accounting restatement due to material noncompliance with any financial reporting requirements under the securities laws.
Medical Insurance Benefits
Under the terms of their respective employment agreements, each of the Executive Chairman and CEO is entitled to medical insurance benefits for the duration of his life (described in more detail below under “Employment Agreements”).
Other Compensation
In 2023, our executive officers also received compensation in the form of 401(k) employer contributions, incremental travel expenses incurred by the Company in support of not-for-profit organizations (as approved by the Board), legal expenses associated with employment related matters and cell phone allowances.
The Board has determined that it is in the best interests of the Company for its Executive Chairman and its CEO to use the Company's aircraft for non-Company purposes, when the aircraft is not being employed in the ordinary course of Company business. These executive officers reimburse the Company for their non-Company use of the aircraft by paying the incremental cost incurred by the Company for each non-business use, defined as the total variable operating costs directly associated with non-business trips, which include fuel, pilot travel related costs, catering, landing fees, flight communications and trip-related maintenance (the “Incremental Cost”). For their non-business use of the aircraft in 2023, Messrs. Mizel and Mandarich reimbursed the Company for Incremental Cost of$550,291 and $51,631, respectively.
The objective of these benefits is to provide amenities to the Executive Chairman and CEO that allow them to more efficiently utilize their time and to support them in effectively contributing to the success of the Company.
Executive Compensation Tables
Summary Compensation Table
For the fiscal years ended December 31, 2023, 2022 and 2021, the following table summarizes the compensation of the Company’s named executive officers.
| | | | | | | | | | | | | | | | | | | | | | | | | | | | | |
Name and
Principal Position | Year | Salary
($) | Bonus
($) | Stock Awards ($) 1 | Option Awards ($) 2 | Non-Equity Incentive Plan Comp ($) 3 | Change in Pension and Nonqualified Deferred Comp Earnings ($) | All Other Comp
($) | Total
($) |
Larry A. Mizel, Executive Chairman | 2023 | $ | 1,000,000 | | N/A | $ | 11,436,609 | | $ | — | | $ | 8,000,000 | | $ | — | | $ | 294,210 | | $ | 20,730,819 | |
| 2022 | $ | 1,000,000 | | N/A | $ | 1,999,966 | | $ | 8,342,900 | | $ | 7,000,000 | | $ | — | | $ | 169,570 | | $ | 18,512,436 | |
| 2021 | $ | 1,000,000 | | N/A | $ | 10,869,266 | | $ | — | | $ | 8,000,000 | | $ | — | | $ | 80,990 | | $ | 19,950,256 | |
David D. Mandarich, President and Chief Executive Officer | 2023 | $ | 1,000,000 | | N/A | $ | 10,592,946 | | $ | — | | $ | 7,000,000 | | $ | — | | $ | 25,939 | | $ | 18,618,885 | |
| 2022 | $ | 1,000,000 | | N/A | $ | 1,999,966 | | $ | 6,674,320 | | $ | 6,000,000 | | $ | — | | $ | 9,060 | | $ | 15,683,346 | |
| 2021 | $ | 1,000,000 | | N/A | $ | 9,982,336 | | $ | — | | $ | 6,000,000 | | $ | — | | $ | 10,279 | | $ | 16,992,615 | |
Robert N. Martin, Senior Vice President and Chief Financial Officer | 2023 | $ | 850,000 | | $ | 3,500,000 | | $ | 2,738,169 | | N/A | N/A | N/A | $ | 9,870 | | $ | 7,098,039 | |
| 2022 | $ | 850,000 | | $ | 1,500,000 | | $ | 1,999,966 | | N/A | N/A | N/A | $ | 9,420 | | $ | 4,359,386 | |
| 2021 | $ | 850,000 | | $ | 1,500,000 | | $ | 1,276,042 | | N/A | N/A | N/A | $ | 9,420 | | $ | 3,635,462 | |
Michael L. Kaplan,, Senior Vice President and General Counsel 4 | 2023 | $ | 475,000 | | $ | 475,000 | | $ | 99,978 | | N/A | N/A | N/A | $ | 727 | | $ | 1,050,705 | |
| 2022 | $ | 91,346 | | $ | 125,000 | | $ | 299,973 | | N/A | N/A | N/A | $ | 136 | | $ | 516,455 | |
1 The amounts shown in the "Stock Awards" column are based on the aggregate grant date fair value computed in accordance with FASB ASC Topic 718 of the following:
2023
–For Messrs. Mizel, Mandarich and Martin, Performance Share Units ("PSUs") were granted to each individual on August 23, 2023. These awards are performance based, and, therefore, the amounts in the table above include $8,436,621, $7,592,959 and $738,204 for Messrs. Mizel, Mandarich and Martin, respectively, reflecting the aggregate grant date fair value of the awards ($42.18) multiplied by the target number of shares. Assuming achievement of the highest level of performance for these awards, the grant date fair value of the performance-based equity awards for Messrs. Mizel, Mandarich and Martin total $16,873,242, $15,185,918 and $1,476,409, respectively.
–For each of Messrs. Mizel and Mandarich, this column includes $2,999,987 in Restricted Stock Awards ("RSAs") that were granted February 3, 2023 pursuant to the 2022 performance goals established under the terms of the 2018 Performance-Based Plan.
–For Mr. Martin and Mr. Kaplan, this column includes $1,999,965 and $99,978, respectively, in RSAs that were granted February 3, 2023 based on their 2022 performance.
2022
–For each of Messrs. Mizel and Mandarich, this column includes $1,999,966 in Restricted Stock Awards ("RSAs") that were granted February 3, 2022 pursuant to the 2021 performance goals established under the terms of the 2018 Performance-Based Plan.
–For Mr. Martin, this column includes $1,999,966 in a RSA that were granted February 3, 2022 based on his 2021 performance.
– For Mr. Kaplan, this column includes $299,973 in a RSA that were granted October 10, 2022 in connection with his hiring.
2021
–For Messrs. Mizel, Mandarich and Martin, Performance Share Units ("PSUs") were granted to each individual on July 14, 2021. These awards are performance based, and, therefore, the amounts in the table above include $8,869,300, $7,982,370 and $776,064 for Messrs. Mizel, Mandarich and Martin, respectively, reflecting the aggregate grant date fair value of the awards ($44.35) multiplied by the target number of shares. Assuming achievement of the highest level of performance for these awards, the grant date fair value of the performance-based equity awards for Messrs. Mizel, Mandarich and Martin total $17,738,601, $15,964,741 and $1,552,128, respectively.
–For each of Messrs. Mizel and Mandarich, this column also includes $1,999,966 in Restricted Stock Awards ("RSAs") that were granted February 4, 2021 pursuant to the 2020 performance goals established under the terms of the 2018 Performance-Based Plan.
–For Mr. Martin this column also includes $499,978 in RSAs that were granted February 4, 2021 based on his 2020 performance.
For a description of assumptions used in valuing the awards, please see Note 22(Stock Based Compensation) to the Consolidated Financial Statements in the Company's Original Form 10-K, for the year ended December 31,2023.
PART I
Forward-Looking2 The amounts shown in the "Option Awards" column are based on the aggregate grant date fair value computed in accordance with FASB ASC Topic 718. For Messrs. Mizel and Mandarich, the option awards granted in 2022 was service based, was assigned a fair value of $8.34 per share on the date of grant using the Black-Scholes option pricing model. For a description of the assumptions used in valuing the awards, please see Note 22 (Stock Based Compensation) to the Consolidated Financial Statements in the Company's Original Form 10-K for the year ended December 31, 2023.
3 These non-equity incentive plan compensation amounts were paid in cash in accordance with the terms of the 2018 Performance-Based Plan, as in effect for the year indicated, as compensation for that year's performance. The amounts were paid in the subsequent year. In the year ended 2023, the Committee determined that the 2023 goal established under the 2018 Performance-Based Plan for each executive had been achieved at the maximum level, thereby qualifying Mr. Mizel for a total bonus of $7.0 million and Mr. Mandarich for a total bonus of $6.0 million. The prior year, in light of economic conditions, the Committee exercised its discretion and reduced the cash awards to Mr. Mizel and Mr. Mandarich. This year, in light of the Company’s superior performance under the direction of Mr. Mizel and Mr. Mandarich, the Committee determined that an exercise of its discretion under the 2018 Performance-Based Plan was warranted to increase the bonus to be paid to each of Mr. Mizel and Mr. Mandarich by $1.0 million. Accordingly, the Committee awarded a total cash bonus for 2023 to Mr. Mizel of $8.0 million and a total cash bonus for 2023 to Mr. Mandarich of $7.0 million. The Committee made no award of restricted stock.
4 Mr. Kaplan was appointed as Senior Vice President and General Counsel effective as of October 10, 2022. On October 24, 2022, Mr. Kaplan was designated as an executive officer and a named executive officer of the Company.
All Other Compensation
The table below provides a breakdown of all other compensation for 2023 for the named executive officers:
| | | | | | | | | | | | | | | | | |
| Name | Non-
Business
Use of
Aircraft | | 401(k) Match 2 | Other 3 | Total |
| Larry A. Mizel | — | | 1 | $ | 9,150 | | $ | 285,060 | | $ | 294,210 | |
| David D. Mandarich | — | | 1 | $ | 9,150 | | $ | 16,789 | | $ | 25,939 | |
| Robert N. Martin | N/A | | $ | 9,150 | | $ | 720 | | $ | 9,870 | |
| Michael L. Kaplan | N/A | | $ | — | | $ | 727 | | $ | 727 | |
1The incremental costs of non-business use of the Company's aircraft are calculated as the total variable operating costs directly associated with non-business trips, which include fuel, pilot travel related costs, catering, landing fees, flight communications and trip-related maintenance (the “Incremental Cost”). For theirnon-businessuse of the aircraft in 2023, Messrs.Mizeland Mandaricheachreimbursed the Companyfor the Incremental Cost.
2401(k) match represents amounts paid in 2024based on 2023401(k) deferrals.
3For Mr. Mizel, the amounts shown for “Other” consists of $267,911of Incremental Costs incurred by the Company in support of Mr. Mizel's service to not-for-profit organizations, consistent with the Company’s commitment to sustainability andas approved by the Company's Board. For both Mr. Mizel and Mr. Mandarich, "Other" also consists of $16,429 for legal
expenses in connection with employment related matters. The remainder of the amount shown for Mr. Mizel and Mr. Mandarich and all of the amounts shown for the other NEOs represent cell phone allowances.
Grants of Plan-Based Awards in 2023
The following table sets forth certain information with respect to awards granted during 2023 to our named executive officers. All equity awards were made under the 2021 Equity Incentive Plan.
| | | | | | | | | | | | | | | | | | | | | | | | | | | | | | | | | | | | | | |
| | | Estimated possible payouts under non-equity incentive plan awards | | Estimated payouts under equity incentive plan awards 3 | | All other stock
awards: Number
of shares of stock or units
(#) | | Exercise or
Base Price
of Option Awards
($/Sh) | Grant Date
Fair Value of
Stock and Option Award
($) |
| Name | Grant Date | Threshold ($) | Target ($) | Threshold (#) | Target (#) | Maximum (#) | |
| Larry A. Mizel | — | 5,400,000 | | 7,000,000 | | 1 | | | | | | | | $ | — | |
| Larry A. Mizel | 2/3/2023 | | | | | | | | 74,386 | | 2 | | $ | 2,999,987 | |
| Larry A. Mizel | 8/23/2023 | | | | 100,000 | 200,000 | 400,000 | | | | | $ | 8,436,621 | |
| David D. Mandarich | — | 5,400,000 | 6,000,000 | 1 | | | | | | | | $ | — | |
| David D. Mandarich | 2/3/2023 | | | | | | | | 74,386 | 2 | | $ | 2,999,987 | |
| David D. Mandarich | 8/23/2023 | | | | 90,000 | 180,000 | 360,000 | | | | | $ | 7,592,959 | |
| Robert N. Martin | 2/3/2023 | | | | | | | | 49,590 | | 2 | | $ | 1,999,965 | |
| Robert N. Martin | 8/23/2023 | | | | 8,750 | 17,500 | 35,000 | | | | | $ | 738,204 | |
| Michael L. Kaplan | 2/3/2023 | | | | | | | | 2,479 | 2 | | $ | 99,978 | |
1Messrs. Mizel and Mandarich had the opportunity to earn a threshold award of up to $5,400,000 based on specified performance criteria, and to receive a total cash bonus up to $7,000,000 and $6,000,000, respectively, based on the Company's outperformance of goals. As discussed above, the Committee determined that an exercise of its discretion under the 2018 Performance-Based Plan was warranted to increase the bonus to be paid to each of Mr. Mizel and Mr. Mandarich by $1.0 million. Accordingly, the Committee awarded a total cash bonus for 2023 to Mr. Mizel of $8.0 million and a total cash bonus for 2023 to Mr. Mandarich of $7.0 million. The Committee made no award of restricted stock.
2The restricted stock award vests equally over three years, starting with February 3, 2024. Dividends are paid on the restricted stock. The restricted stock granted in 2023 was based on 2022 performance.
3The PSUs will be earned based upon the Company’s performance, over a three year period commencing January 1, 2023 and ending December 31, 2025 (the “Performance Period”), measured by increasing average home sale revenues over the Base Period. The “Base Period” for the awards is January 1, 2023 to December 31, 2023. The awards are conditioned upon the Company achieving a minimum average gross margin from home sales percentage (excluding impairments) of at least fifteen percent (15%) over the Performance Period. If average home sale revenues over the Performance Period ("Performance Revenues") exceed the Base Revenues by at least 5% but less than 10% (“Threshold Goals”), 50% of the Target Goals will be earned. If Performance Revenues exceed the Base Revenues by at least 20%, 200% of the Target Goals will be earned (“Maximum Goals”). The number of PSUs earned under these grants shall be adjusted to be proportional to the partial performance between the Threshold Goals, Target Goals and Maximum Goals.
Outstanding Equity Awards at December 31, 2023
The table below sets forth information with respect to all unexercised options, unvested restricted stock and unvested performance share units awarded to our named executive officers that were outstanding as of December 31, 2023.
| | | | | | | | | | | | | | | | | | | | | | | | | | | | | | | | | | | | | | |
| | Option Awards | | Stock Awards |
| Name | Number of
Securities Underlying Unexercised
Options (#) Exercisable | Number of
Securities Underlying Unexercised
Options (#) Unexercisable | | Option
Exercise
Price
($) | Option
Expiration
Date | | Number of
Shares or
Units of
Stock
That Have
Not Vested
(#) | | Market
Value of
Shares or
Units of
Stock That
Have Not
Vested
($) | Equity
Incentive
Plan
Awards:
Number of
Unearned
Units That
Have Not
Vested
(#) | | Equity
Incentive
Plan
Awards:
Market
Value of
Unearned
Units That
Have Not
Vested ($) |
| Larry A. Mizel | 233,280 | | — | | | 26.40 | | 5/23/2028 | | — | | | — | | — | | | — | |
| | 216,000 | | — | | | 32.92 | | 8/5/2029 | | — | | | — | | — | | | — | |
| | 216,000 | | — | |
| 23.90 | | 4/27/2030 | | — | | | — | | — | | | — | |
| | 333,400 | | 666,600 | | 1 | 28.78 | | 9/28/2032 | | — | | | — | | — | | | — | |
| | — | | — | | | — | | — | | | 12,770 | | 2 | 705,543 | | — | | | — | |
| | — | | — | | | — | | — | | | 28,556 | | 3 | 1,577,719 | | — | | | — | |
| | — | | — | | | — | | — | | | 74,386 | | 4 | 4,109,827 | | — | | | — | |
| | — | | — | | | — | | — | | | — | | | — | | 400,000 | | 5 | 22,100,000 | |
| | — | | — | | | — | | — | | | — | | | — | | 100,000 | | 6 | 5,525,000 | |
| David D. Mandarich | 233,280 | | — | | | 26.40 | | 5/23/2028 | | — | | | — | | — | | | — | |
| | 216,000 | | — | | | 32.92 | | 8/5/2029 | | — | | | — | | — | | | — | |
| | 216,000 | | — | | | 23.90 | | 4/27/2030 | | — | | | — | | — | | | — | |
| | 266,720 | | 533,280 | | 1 | 28.78 | | 9/28/2032 | | — | | | — | | — | | | — | |
| | — | | — | | | — | | — | | | 12,770 | | 2 | 705,543 | | — | | | — | |
| | — | | — | | | — | | — | | | 28,556 | | 3 | 1,577,719 | | — | | | — | |
| | — | | — | | | — | | — | | | 74,386 | | 4 | 4,109,827 | | — | | | — | |
| | — | | — | | | — | | — | | | — | | | — | | 360,000 | | 5 | 19,890,000 | |
| | — | | — | | | — | | — | | | — | | | — | | 90,000 | | 6 | 4,972,500 | |
| Robert N. Martin | — | | — | | | — | | — | | | — | | | — | | — | | | — | |
| — | | — | | | — | | — | | | — | | | — | | — | | | — | |
| — | | — | | | — | | — | | | 3,193 | | 2 | 176,413 | | — | | | — | |
| — | | — | | | — | | — | | | 28,556 | | 3 | 1,577,719 | | — | | | — | |
| — | | — | | | — | | — | | | 49,590 | | 4 | 2,739,848 | | — | | | — | |
| — | | — | | | — | | — | | | — | | | — | | 35,000 | | 5 | 1,933,750 | |
| — | | — | | | — | | — | | | — | | | — | | 8,750 | | 6 | 483,438 | |
| Michael L. Kaplan | — | | — | | | — | | — | | | 6,879 | | 7 | 380,065 | | — | | | — | |
| — | | — | | | — | | — | | | 2,479 | | 4 | 136,965 | | — | | | — | |
1 This option vested immediately and will become exercisable as to 50% of the shares on each of September 28, 2024 and 2025.
2 Therestrictions on these shares lapse as to 100% of the remaining shares on February 4, 2024.
3The restrictions on these shares lapse as to 50% of the remaining shares on each of February 3, 2024 and 2025.
4The restrictions on these shares lapse as to 33-1/3% of the shares on each of February 3, 2024, 2025 and 2026.
5The PSUs will be earned based upon the Company’s performance, over a three year period commencingJanuary 1, 2021and endingDecember31, 2023. For more detail of the vesting terms see Note 22(Stock Based Compensation) to the Consolidated Financial Statements in the Company's Original Form 10-K for the year ended December 31, 2023.
6 The PSUs will be earned based upon the Company’s performance, over a three year period commencingJanuary 1, 2023and endingDecember31, 2025. For more detail of the vesting terms see Note 22(Stock Based Compensation) to the Consolidated Financial Statements in the Company's Original Form 10-K for the year ended December 31, 2023.
7 The restrictions on these shares lapse as to50%of theremainingshareson each of October 10, 2024 and 2025.
Option Exercises and Stock Vested in 2023
The following table provides additional information about value realized by the named executive officers on option award exercises and restricted stock award vestings during the year ended December 31, 2023.
| | | | | | | | | | | | | | | | | | | | | | | |
| | Option Awards | | Stock Awards |
| | Number of
Shares Acquired
on Excercise
(#) | | Value
Realized on
Exercise
($) | | Number of
Shares Acquired
on Vesting
(#) | | Value
Realized on
Vesting
($) |
| Larry A. Mizel | 1,322,697 | | | 30,090,166 | | | 302,774 | | | 12,210,875 | |
| David D. Mandarich | — | | | — | | | 302,774 | | | 12,210,875 | |
| Robert N. Martin | 33,065 | | | 805,453 | | | 85,369 | | | 3,442,932 | |
| Michael L. Kaplan | — | | | — | | | 3,440 | | | 138,873 | |
Pension Benefits at December 31, 2023
The following table shows, as of December 31, 2023, the present value of accumulated post-retirement medical insurance benefits under the current employment agreements of Mr. Mizel and Mr. Mandarich.
| | | | | | | | | | | | | | | | | | | | | | | |
| Name | Plan Name | | Number of
Years Credited
Service (#) | | Present Value of
Accumulated
Medical Insurance
Benefits
($) | | Payments During
Last Fiscal Year
($) |
| Larry A. Mizel | Employment Agreement 1 | | N/A | | $ | 222,032 | | | N/A |
| David D. Mandarich | Employment Agreement 1 | | N/A | | $ | 297,968 | | | N/A |
| Robert N. Martin | N/A | | N/A | | N/A | | N/A |
| Michael L. Kaplan | N/A | | N/A | | N/A | | N/A |
1 Mr. Mizel is eligible to receive a Termination Payment, as described below under "Employment Agreements" upon Retirement, as described in his Employment Agreement, as his original Employment Term has been successfully completed. Mr. Mandarich will be eligible to receive a Termination Payment, as described below under "Employment Agreements" upon Retirement, as described in his Employment Agreement, following the successful completion of his current Employment Term.
Pay Versus Performance
| | | | | | | | | | | | | | | | | | | | | | | | | | | | | | | | |
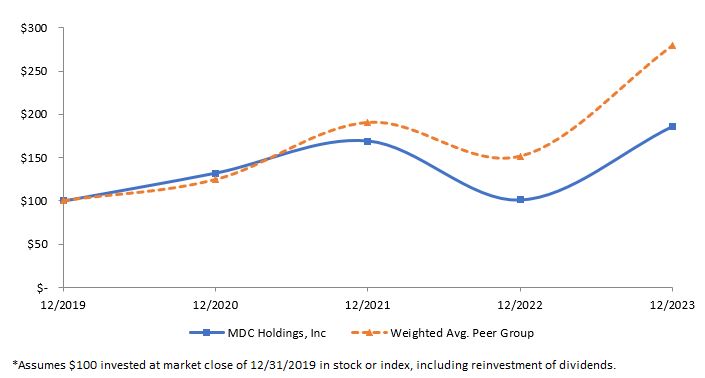
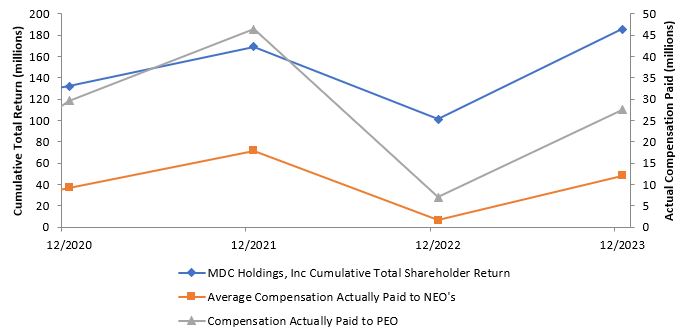
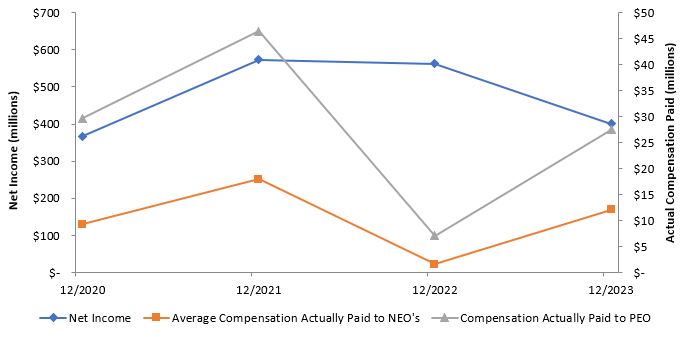
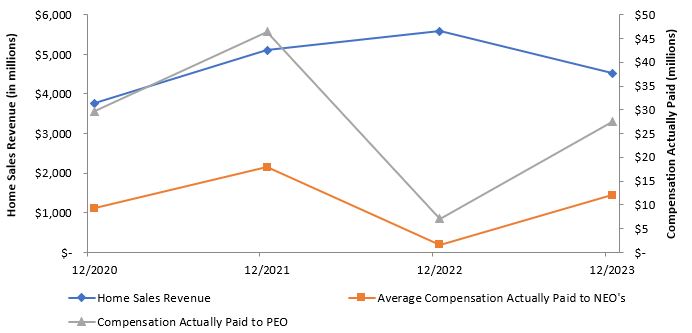
| Year | Summary Compensation Table total For PEO 1 | Compensation Actually Paid to PEO 12 | Average Summary Compensation Table Total for Non-PEO NEOs 1 | Average Compensation Actually Paid to Non-PEO NEOs 12 | Value of Initial Fixed $100 Investment Based On: 11 | Net Income (Dollars in thousands) | Home Sale Revenues (Dollars in thousands) |
| Total Shareholder Return | Peer Group Total Shareholder Return 10 |
| 2023 | $ | 20,730,819 | | $ | 27,508,707 | | 2 | $ | 8,922,543 | | $ | 12,061,539 | | 6 | $ | 186 | | $ | 279 | | $ | 401,005 | | $ | 4,520,296 | |
| 2022 | $ | 18,512,436 | | $ | 7,050,930 | | 3 | $ | 5,207,073 | | $ | 1,591,502 | | 7 | $ | 101 | | $ | 151 | | $ | 562,139 | | $ | 5,586,264 | |
| 2021 | $ | 19,950,256 | | $ | 46,427,292 | | 4 | $ | 7,212,486 | | $ | 17,912,881 | | 8 | $ | 169 | | $ | 190 | | $ | 573,657 | | $ | 5,102,456 | |
| 2020 | $ | 14,150,011 | | $ | 29,684,799 | | 5 | $ | 4,762,382 | | $ | 9,243,394 | | 9 | $ | 132 | | $ | 124 | | $ | 367,582 | | $ | 3,765,379 | |
1The PEO for each of the years presented within this table is Larry A. Mizel, Executive Chairman. The NEO's for 2023 were David D. Mandarich, CEO; Robert N. Martin, CFO; Michael L. Kaplan, CLO. The NEO's for 2022 were David D. Mandarich, CEO; Robert N. Martin, CFO; Michael L. Kaplan, CLO (hired in 2022); and Rebecca B. Givens, CLO (resigned in 2022). The NEO's for 2021 were David D. Mandarich, CEO; Robert N. Martin, CFO; and Rebecca B. Givens, CLO. The NEO's for 2020 were David D. Mandarich, CEO; Robert N. Martin, CFO; Rebecca B. Givens, CLO (hired in 2020); and Michael Touff, CLO (retired in 2020).
2 For compensation actually paid to the PEO in 2023, the Summary Compensation Table total for the PEO is adjusted to reflect the changes in the value of equity awards and pension benefits, described in the following: (1) $11,436,609 was deducted from the total, representing the amount reported in the Stock Awards and Option Awards columns of the Summary Compensation Table; (2) $4,109,827 was added representing the year-end 2023 valuation of the equity awards granted in 2023 that remained outstanding and unvested as of December 31, 2023; (3) $11,218,458 was added representing the increase in fair value between the year end 2023 and 2022 for equity awards granted in prior years that remain outstanding and unvested at the end of 2023; (4) $2,643,217 was added representing the increase in fair value for equity awards granted in prior years that vested during 2023, and; (5) $242,995 was added related to dividends paid on outstanding and unvested RSA awards in 2023.
3 For compensation actually paid to the PEO in 2022, the Summary Compensation Table total for the PEO is adjusted to reflect the changes in the value of equity awards and pension benefits, described in the following: (1) $10,342,866 was deducted from the total, representing the amount reported in the Stock Awards and Option Awards columns of the Summary Compensation Table; (2) $1,353,586 was added representing the year-end 2022 valuation of the equity awards granted in 2022 that remained outstanding and unvested as of December 31, 2022; (3) $8,342,900 was added representing the vesting date fair value of equity awards granted and vested in 2022; (4) $6,380,450 was deducted representing the decrease in fair value between the year end 2022 and 2021 for equity awards granted in prior years that remain outstanding and unvested at the end of 2022; (5) $4,604,476 was deducted representing the decrease in fair value for equity awards granted in prior years that vested during 2022, and; (6) $169,800 was added related to dividends paid on outstanding and unvested RSA awards in 2022.
4 For compensation actually paid to the PEO in 2021, the Summary Compensation Table total for the PEO is adjusted to reflect the changes in the value of equity awards and pension benefits, described in the following: (1) $10,869,266 was deducted from the total, representing the amount reported in the Stock Awards and Option Awards columns of the Summary Compensation Table; (2) $12,510,757 was added representing the year-end 2021 valuation of the equity awards granted in 2021 that remained outstanding and unvested as of December 31, 2021; (3) $18,561,666 was added representing the increase in fair value between the year end 2021 and 2020 for equity awards granted in prior years that remain outstanding and unvested at the end of 2021; (4) $6,134,932 was added representing the increase in fair value for equity awards granted in prior years that vested during 2021, and; (5) $138,947 was added related to dividends paid on outstanding and unvested RSA awards in 2021.
5 For compensation actually paid to the PEO in 2020, the Summary Compensation Table total for the PEO is adjusted to reflect the changes in the value of equity awards and pension benefits, described in the following: (1) $9,002,603 was deducted from the total, representing the amount reported in the Stock Awards and Option Awards columns of the Summary Compensation Table; (2) $6,701,731 was added representing the year-end 2020 valuation of the equity awards granted in 2020 that remained outstanding and unvested as of December 31, 2020; (3) $19,208,132 was added representing the increase in fair value between the year end 2020 and 2019 for equity awards granted in prior years that remain outstanding and unvested at the end of 2020; (4) $1,495,366 was deducted representing the decrease in fair value for equity awards granted in prior years that vested during 2020, and; (5) $122,894 was added related to dividends paid on outstanding and unvested RSA awards in 2020.
6For average compensation actually paid to the NEO's in 2023, the average of the Summary Compensation Table total for the NEO's is adjusted to reflect average changes in the value of equity awards and pension benefits, described in the following: (1) $4,477,031 was deducted from the total, representing the average amount reported in the Stock Awards and Option Awards columns of the Summary Compensation Table; (2) $2,328,880 was added representing the average year-end 2023 valuation of the equity awards granted in 2023 that remained outstanding and unvested as of December 31, 2023; (3) $4,001,332 was added representing the average increase in fair value between the year end 2023 and 2022 for equity awards granted in prior years that remain outstanding and unvested at the end of 2023; (4) $1,139,552 was added representing the average increase in fair value for equity awards granted in prior years that vested during 2023, and; (5) $146,263 was added related to the average dividends paid on outstanding and unvested RSA awards in 2023.
7For average compensation actually paid to the NEO's in 2022, the average of the Summary Compensation Table total for the NEO's is adjusted to reflect average changes in the value of equity awards and pension benefits, described in the following: (1) $2,743,556 was deducted from the total, representing the average amount reported in the Stock Awards and Option Awards columns of the Summary Compensation Table; (2) $758,313 was added representing the average year-end 2022 valuation of the equity awards granted in 2022 that remained outstanding and unvested as of December 31, 2022; (3) $1,668,580 was added representing the average vesting date fair value of equity awards granted and vested in 2022; (4) $2,017,419 was deducted representing the average decrease in fair value between the year end 2022 and 2021 for equity awards granted in prior years that remain outstanding and unvested at the end of 2022; (5) $1,351,388 was deducted representing the average decrease in fair value for equity awards granted in prior years that vested during 2022, and; (6) $69,899 was added related to the average dividends paid on outstanding and unvested RSA awards in 2022.
8 For average compensation actually paid to the NEO's in 2021, the average of the Summary Compensation Table total for the NEO's is adjusted to reflect average changes in the value of equity awards and pension benefits, described in the following: (1) $3,786,113 was deducted from the total, representing the average amount reported in the Stock Awards and Option Awards columns of the Summary Compensation Table; (2) $4,340,884 was added representing the average year-end 2021 valuation of the equity awards granted in 2021 that remained outstanding and unvested as of December 31, 2021; (3) $7,665,139 was added representing the average increase in fair value between the year end 2021 and 2020 for equity awards granted in prior years that remain outstanding and unvested at the end of 2021; (4) $2,420,193 was added representing the average increase in fair value for equity awards granted in prior years that vested during 2021, and; (5) $60,293 was added related to the average dividends paid on outstanding and unvested RSA awards in 2021.
9 For average compensation actually paid to the NEO's in 2020, the average of the Summary Compensation Table total for the NEO's is adjusted to reflect average changes in the value of equity awards and pension benefits, described in the following:(1) $2,754,950 was deducted from the total, representing the average amount reported in the Stock Awards and Option Awards columns of the Summary Compensation Table; (2) $1,863,381 was added representing the average year-end 2020 valuation of the equity awards granted in 2020 that remained outstanding and unvested as of December 31, 2020; (3) $5,870,248 was added representing the average increase in fair value between the year end 2020 and 2019 for equity awards granted in prior years that remain outstanding and unvested at the end of 2020; (4) $536,641 was deducted representing the average decrease in fair value for equity awards granted in prior years that vested during 2020, and; (5) $38,973 was added related to the average dividends paid on outstanding and unvested RSA awards in 2020.
10The peer group used in this calculation is defined as the "Peer Group" in the "Peer Data" section above. The returns of each issuer of the group was weighted according to the respective issuers' stock market capitalization at the beginning of each period for which a return is indicated.
11For purposes of calculating the cumulative total shareholder return, the measurement period is the market close on the last trading day before fiscal year 2020, through and including the end of the fiscal year for which cumulative total shareholder return is being calculated.
12Equity award fair values were computed in a manner consistent with the fair value methodology used to account for share-based payments in the financial statements under generally accepted accounting principles. For awards subject to performance conditions, the fair value as of the end of the covered fiscal year is based upon the probable outcome of such conditions as of the last day of the covered fiscal year under ASC 718, Compensation - Stock Compensation.
Comparison of Total Shareholder Return to Peer Group Total Shareholder Return
Relationship Between Executive Compensation Actually Paid to Executives and Financial Performance
Comparison of Total Shareholder Return to Compensation Actually Paid to Executives
Comparison of Net Income to Compensation Actually Paid to Executives
Comparison of Home Sale Revenues to Compensation Actually Paid to Executives
Key Financial and Non-Financial Performance Measures
The following table shows, as of December 31, 2023, the key financial and non-financial performance measures used by the Company to link compensation actually paid to executive officers to Company Performance.
| | | | | | | | |
| Executive Chairman and CEO | Chief Financial Officer | Chief Legal Officer |
| Adjusted EBITDA | Adjusted homebuilding operating margin | Adjusted homebuilding operating margin |
| Adjusted homebuilding operating margin | Adjusted pre-tax return on equity | Adjusted pre-tax return on equity |
| Adjusted pre-tax diluted EPS | Home sale revenues | Home sale revenues |
| Adjusted pre-tax return on equity | Net debt-to-capital | Litigation management |
| Home sale revenues | Oversight of accounting, finance, information technology and treasury functions, including capital markets and bank financing transactions | Oversight of risk management |
| Net debt-to-capital | Shareholder relations management and oversight | Regulatory compliance |
| Operating cash flow | Successful completion of special projects | Successful completion of special projects |
| Timely and accurate handling of financial regulatory filings | Successful supervision of all real estate transactions |
Nonqualified Defined Contribution and Other Nonqualified Deferred Compensation Plans
Mr. Mizel is eligible to receive a Termination Payment, as described below under "Employment Agreements" upon Retirement, as described his Employment Agreement, as his original Employment Term has been successfully completed. Mr. Mandarich will be eligible to receive a Termination Payment, as described below under "Employment Agreements" upon Retirement, as described in his Employment Agreement, following the successful completion of his current Employment Term.
EMPLOYMENT AGREEMENTS
Messrs. Mizel and Mandarich
On October 26, 2020, the Board appointed Larry A. Mizel (previously, Chairman and Chief Executive Officer) as Executive Chairman and David D. Mandarich (previously President and Chief Operating Officer) as President and Chief Executive Officer. In connection with these changing roles, as of October 26, 2020, the Company and each of Messrs. Mizel and Mandarich (each, an “Executive”) entered into new employment agreements that replaced the prior employment agreements with each of the Executives. As of June 28, 2021, the Company and each of the Executives executed amendments to their new employment agreements. The material terms of the existing employment agreements as amended (“Employment Agreements”) are summarized below. As discussed in the Company's Definitive Proxy Statement filed with the SEC on March 4, 2024, it is expected that Messrs. Mizel and Mandarich will enter into the New Employment Agreements, subject to the completion of the Merger Agreement, to be effective as of immediately prior to the completion of the merger, which will provide for the terms of their prospective employment with the Company.
Employment Term: Mr. Mizel’s Employment Agreement has an initial term of December 31, 2022 and Mr. Mandarich’s Employment Agreement has an initial term of December 31, 2024. The Employment Agreements automatically extend for two-year terms unless (i) the Company or the Executive elects to terminate by six months written notice, or (ii) the Executive is terminated earlier.
Base Salaries: The Employment Agreements retain the Executives’ base salaries specified by the prior employment agreements. Mr. Mizel's base salary may not be less than $1,000,000 per year. Mr. Mandarich's base salary may not be less than $830,000 per year. In 2021, Mr. Mandarich's base salary was increased to $1,000,000 per year. The base salary for the Executive may only be reduced below his prior year's base salary with the consent of the Executive and the Company.
Incentive Compensation: Messrs. Mizel and Mandarich participate in the Company’s annual and long-term incentive compensation plans (“Performance Plans”).
Group Medical Insurance Benefits: The Company provides group medical, dental and vision insurance benefits to Messrs. Mizel and Mandarich. This applies to each of them while they are employed and for the rest of their life after employment. The group medical insurance benefits also provide comparable coverage for the Executive’s spouse for the duration of the Executive’s life and, if they survive the Executive, for an additional sixty months after the Executive's death.
Long-Term Disability Benefits: The Company will provide the Executive with long-term disability benefits. Under the benefits, the annual after-tax amount received by the Executive would equal the after-tax amount of his base salary for the year in which he becomes disabled. This long-term disability benefit would be paid monthly until the earlier of the end of the Executive's disability or prior to his becoming totally disabled.
Vacation: The Executive is entitled to receive not less than six weeks of vacation each year without carryover from year to year.
Termination for Cause: An Executive may be terminated for “Cause,” as defined in the Employment Agreements. If terminated for Cause, he will only be entitled to his “Accrued Benefits” of base salary through the termination date, annual incentive compensation earned but unpaid with respect to the year prior to the year of termination and any long-term incentive compensation earned but unpaid with respect to performance periods that ended in the year preceding the year of termination.
“Cause” is defined in the Employment Agreements as: (1) the Executive’s willful refusal to perform material duties reasonably required or requested of him by the Board for thirty days after having received written notice of such refusal from the Board and having failed to commence to perform such duties within such period, (2) the Executive’s commission of material acts of fraud, dishonesty or misrepresentation in the performance of his duties, (3) any final, non-appealable conviction of the Executive for an act or acts on the Executive’s part constituting a felony under the laws of the United States or any state thereof, or (4) any material uncured breach of the provisions of the confidentiality and non-competition provisions of the Employment Agreement which continues for thirty days after the Executive has received written notice of such breach from the Company.
Termination by the Company without Cause or Termination by the Executive for “Good Reason”: An Executive’s employment may be terminated by the Company at any time without Cause. If so, the Executive, in addition to Accrued Benefits, is entitled to a lump sum “Termination Payment” of (i) an amount equal to his aggregate base salary during the 36 months prior to the termination, (ii) an amount equal to 300%, for Mr. Mizel, and 200%, for Mr. Mandarich, of the annual incentive compensation paid for the year prior to termination, and (iii) the lifetime group medical insurance benefits described above. The Termination Payment includes the vesting of all unvested options, restricted stock and other equity awards and rights as described under Auto-Acceleration of Awards below. In the event that the fair market value of restricted stock units on the date of full vesting is less than the fair market value of the restricted stock units on the date of award, the Termination Payment provides for additional shares of stock to be granted on the date of full vesting so as to equalize the award value to the fair market value of the award on the date of grant. Under the Employment Agreements, termination without Cause includes the Company's election not to extend the term of the Employment Agreement. If the Executive terminates his employment for “Good Reason” as defined in the Employment Agreements, he is entitled to the same Accrued Benefits and Termination Payment.
“Good Reason” is defined in the Employment Agreements as: (i) a material diminution or change, adverse to the Executive, in the Executive’s positions, titles, status, rank, nature of responsibilities, or authority with the Company, including the Executive’s removal as a member of the Board or if the Executive is not nominated for re-election by the Board, (ii) Mr. Mizel having to report to anyone other than the Board or Mr. Mandarich having to report to anyone other than Mr. Mizel or the Board, (iii) a decrease in the Executive’s annual base salary, annual incentive compensation or long-term incentive compensation opportunity, including the Company’s termination of the Performance Plans or the Company’s amendment of the Performance Plans to provide for payments to the Executive in any calendar year which are less than the amount calculated in accordance with Article III of the Performance Plans, as the same may be amended from time to time, without the Executive’s written consent, (iv) a material reduction in the aggregate benefits for which the Executive is eligible under the Company’s benefit plans, (v) the Company requiring the Executive to relocate to another place of employment more than fifty miles from his primary residence, or (vi) a material breach by the Company of the Employment Agreement or any equity award agreement.
Change in Control Provisions: If the Executive’s employment is terminated by the Company within two years following a “Change in Control” (as defined in the Performance Plan) of the Company occurs, the Executive will receive his Accrued Benefits and the Termination Payment.
“Change in Control” is defined in the Performance Plan as the occurrence of:
(a) the acquisition by any individual, entity, or group (within the meaning of Sections 13(d)(3) or 14(d)(2) of the Exchange Act (a “Person”) of “beneficial ownership” (within the meaning of Rule 13d-3 promulgated under the Exchange Act) of more than 50% of the combined voting power of the Company’s then outstanding securities entitled to vote generally in the election of directors; (b) the individual directors of the Board as of the Effective Date (the “Incumbent Directors”) cease to constitute at
least half of the Board within a twelve-month period; provided, however, that for purposes of this paragraph, any new director whose election by the Board or nomination for election by the Company’s stockholders was approved by a vote of at least a of two-thirds of the Incumbent Directors at the beginning of such twelve-month period shall be considered an Incumbent Director;
(c) consummation, in one transaction or a series of related transactions, of a reorganization, merger, or consolidation of the Company or sale or other disposition, direct or indirect, of all or substantially all of the assets of the Company (a “Business Combination”), in each case, unless, following such Business Combination, the Persons who were the “beneficial owners” of outstanding voting securities of the Company immediately prior to such Business Combination “beneficially own,” by reason of such ownership of the Company’s voting securities immediately before the Business Combination, more than 50% of the combined voting power of the company resulting from such Business Combination (including, without limitation, a company which as a result of such transaction owns the Company or all or substantially all of the Company’s assets either directly or through one or more subsidiaries) in substantially the same proportions as their ownership of the outstanding voting securities of the Company immediately prior to such Business Combination; or (d) approval by those Persons holding the voting securities of the Company of a complete liquidation or dissolution of the Company.
The June 28, 2021 amendments to the employment agreements provide that, in the event of a Change in Control following which the employment of the Executive is terminated by the Company, all unvested PSUs granted to the executive will vest, but the amount, if any, payable with respect to such PSUs will be conditioned on the actual achievement of the specified performance criteria and would not be paid until the end of the applicable performance period. The 2019 and 2020 PSU grant agreements for Messrs. Mizel and Mandarich have been amended to correspond to the provisions of the Amendments.
Termination due to Retirement, Death, Presumed Death or Disability: If the Executive’s employment hereunder is terminated due to the Executive’s “Retirement” as defined in the Employment Agreement, death, presumed death or total disability, the Executive, or the Executive’s beneficiary or estate, as applicable, will receive the Accrued Benefits and the Termination Payment. Retirement means the termination at the election of the Executive of the Executive’s employment after December 31, 2022 in the case of Mr. Mizel and December 31, 2024 in the case of Mr. Mandarich or the non-renewal by the Executive of the Employment Agreement after his respective initial term.
Auto-Acceleration of Awards: The Employment Agreements provide that in the event of death, presumed death, total disability, termination of the Executive’s employment by the Company without Cause (which includes a non-renewal by the Company of the Employment Agreement for each additional term) or termination by the employee for Good Reason, all outstanding unvested awards under the Company’s equity incentive plans will be fully vested, exercisable, and/or payable at the maximum level (auto-accelerated) regardless of whether all vesting conditions relating to length of service, attainment of performance goals, or otherwise have been satisfied. In the event of a Retirement or in the event of a Change in Control following which the employment of the Executive is terminated by the Company, all outstanding unvested awards other than performance share unit (“PSU”) awards will be auto-accelerated and, with respect to all unvested PSU awards that are outstanding on a termination date, the number of shares to be earned, issued and delivered to the Executive, if any, for such outstanding PSUs will be determined at the end of the performance periods in which such Retirement or termination of employment following a Change in Control occurs and will be issued and paid to the Executive as though he continued to be employed through the end of the performance period. The Company amended the Executives’ existing PSU and other award agreements, as necessary, to conform them to the terms of the Employment Agreements.
Excess Parachute Payments: Certain payments that Messrs. Mizel and Mandarich may receive could be subject to an excise tax as an “excess parachute payment” under the Internal Revenue Code. This could occur following a Change in Control or through other payments made to the Executives. The Employment Agreements provide for calculations to compare the after-tax effect to the Executive of (a) automatically reducing the amount of the payment sufficient to avoid triggering any excise tax or, in the alternative, (b) paying the full awarded payment, requiring the executive to be fully responsible for payment of the excise tax, whichever alternative results in the greatest after-tax benefit to the executive.
See "Potential Payments Upon Termination or Change in Control" below for additional information.
Option to Purchase Aircraft: Mr. Mizel’s Employment Agreement provides that, upon Mr. Mizel’s termination of employment with the Company, other than a termination “for cause,” he is granted a 90-day option to purchase the Company’s aircraft and associated equipment and parts (collectively, the “Aircraft"). The purchase price, in cash, will be at the fair market value of the Aircraft, as determined by expert valuation in the event Mr. Mizel and the Company are unable to agree upon the amount of the fair market value.
Certain statementsOther Change in Control Agreements
Mr. Martin and Mr. Kaplan entered into change in control agreements with the Company effective May 23, 2015 and October 10, 2022, respectively. Each agreement will terminate on the earlier of termination of employment or the end of the current term of the agreement (December 31, 2023 for Mr. Martin and December 31, 2024 for Mr. Kaplan). However, unless either party to the agreement elects by notice in writing delivered to the other at least 90 days prior to December 31 of the current term, the term of the agreement will be renewed automatically for successive one-year terms. In addition, if the agreement has not been terminated prior to a change in control (as defined below), upon a change in control, the term of the agreement will extend automatically following such change in control for two years. As discussed in the Company's Definitive Proxy Statement filed with the SEC on March 4, 2024, it is expected that these executives will enter into amendments to their Change in Control Agreements, dependent on the completion of the merger, discussed below.
A “change in control” occurs if:
•a report on Schedule 13D is filed with the SEC disclosing that any person other than the Company (or one of its subsidiaries or one of their employee benefit plans), or any director of the Company or an affiliate of the director, is the beneficial owner of 50 percent or more of the combined voting power of the outstanding securities of the Company;
•any person other than the Company (or one of its subsidiaries or one of their employee benefit plans), or any director of the Company or an affiliate of the director, purchases securities, pursuant to a tender offer or exchange offer such that, after consummation of the offer, the person is the beneficial owner of 50 percent or more of the combined voting power of the outstanding securities of the Company;
•the shareholders of the Company approve (A) any consolidation or merger of the Company (1) in which the Company is not the continuing or surviving corporation, or (2) pursuant to which shares of common stock of the Company would be converted into cash, securities or other property, or (B) any sale, lease, exchange or other transfer of all or substantially all the assets of the Company; or
•there is a change in a majority of the members of the Board within a twelve month period, unless the election or nomination for election by the Company's shareholders of each new director during such twelve month period was approved by the vote of two-thirds of the directors then still in office who were directors at the beginning of such twelve month period.
For purposes of Mr. Martin’s and Mr. Kaplan's agreements, a “change in control event” occurs if a change in control is followed by a material change within two years. A material change is defined in the agreements to occur if:
•employment is terminated without cause (as defined in the agreements);
•the Company makes certain adverse changes in the employee's reporting relationship, titles, functions or duties;
•the Company assigns or reassigns the employee, without the employee's written permission, to another place of employment more than fifty miles from the current place of employment;
•the Company reduces the employee's base salary, annual or long-term incentive compensation, or the manner in which the compensation is determined unless the reduction applies to other officers of the Company; or
•a purchaser of all or substantially all of the Company's assets or any successor or assignee of the Company fails to assume the agreement.
Pursuant to each agreement, if a change in control event occurs, the employee may elect within 90 days after the change in control event to terminate their employment, if not previously terminated by the Company, and to receive a change in control payment. The change in control payment (to be paid upon termination of employment by either the Company or the employee) equals two times the sum of: (i) the employee’s annual base salary in effect immediately prior to the change in control event, plus (ii) the amount of the employee’s last regular annual bonus, provided that the amount of the annual bonus shall not exceed 50% of the annual base salary in effect immediately prior to the change in control event.
If a change in control event occurs, the employee also would be entitled to continue to participate in the Company's employee benefit plans, policies and arrangements that provide insurance and medical benefits on the same basis as provided prior to the change in control event for a period of twelve months after the date of termination of employment.
If a change in control as defined above occurs, all options, dividend equivalents and other rights granted to the employee under any Company equity incentive plan will be accelerated and become exercisable immediately prior to the closing of the change in control. If the change in control is not concluded, the election to exercise such options and other rights shall be of no effect and the options shall remain subject to their original restrictions.
Any amounts payable pursuant to the change in control agreement are in addition to any payments otherwise payable to the employee pursuant to any agreement, plan or policy of the Company. Certain payments that the employee may receive could be
subject to an excise tax as an "excess parachute payment" under the Internal Revenue Code. This could occur following a change in control or a change in control event, either alone or together with other payments made to the employee. In the agreement, the employee has agreed to be paid those amounts, if any, in annual installments and over the shortest period of time in which they may be paid and not be treated as "excess parachute payments."
See "Potential Payments Upon Termination or Change in Control" below for additional information.
The Compensation Committee believes that the potential payments in these limited change in control circumstances fit well within the Company's overall compensation philosophy. The termination and change in control payments are calculated based on the base salaries and the annual bonuses paid to the executives. The Committee believes that the long-term interests of our shareholders are aligned with the executives in that their compensation is, in turn, aligned with the success of the Company. The potential change of control compensation varies with the compensation previously paid to the executive, affords stability to the Company's leadership and is consistent with the philosophy of the Committee to provide compensation that assures retention, incentive and reward to the executive team.
Potential Payments Upon Termination or Change in Control
The following table shows potential payments to our named executive officers under existing contracts for various scenarios involving a change in control or termination of employment, assuming a triggering event on the last business day of 2023. Please see the narrative above under "Employment Agreements" and "Certain Other Change in Control Agreements" for a description of payments contemplated by these agreements. In addition, Messrs. Mizel and Mandarich will be eligible to receive a payment upon Retirement, as defined in their respective Employment Agreements, following the successful completion of their current Employment Term.
| | | | | | | | | | | | | | | | | | | | | | | | | | | | | | | | | | | | | | | | | | | | | | | |
| Name | Benefit | Termination
w/o Cause or
Material
Change | | Change in
Control | | After Change in Control – Material Change or w/o Cause1 | | Voluntary
Termination w/o Good Reason | | Retirement 13 | | Death | | Disability | |
| Larry A. Mizel | Severance Pay | $ | 3,000,000 | | 2 | | | $ | 3,000,000 | | 2 | | | $ | 3,000,000 | | 2 | $ | 3,000,000 | | 2 | $ | 3,000,000 | | 2 |
| Ann. Incentive Comp. | $ | 30,000,000 | | 3 | | | $ | 30,000,000 | | 3 | | | $ | 30,000,000 | | 3 | $ | 30,000,000 | | 3 | $ | 30,000,000 | | 3 |
| | Stock/Option Vesting | $ | 68,252,410 | | 4 | | | $ | 51,677,410 | | 5 | | | $ | 51,677,410 | | 4 | $ | 68,252,410 | | 4 | $ | 68,252,410 | | 4 |
| | Health Care Benefits | $ | 222,032 | | 6 | | | $ | 222,032 | | 6 | $ | 222,032 | | 6 | $ | 222,032 | | 6 | $ | 106,681 | | 6 | $ | 222,032 | | 6 |
| David D. Mandarich | Severance Pay | $ | 3,000,000 | | 2 | | | $ | 3,000,000 | | 2 | | | | | $ | 3,000,000 | | 2 | $ | 3,000,000 | | 2 |
| Ann. Incentive Comp. | $ | 18,000,000 | | 3 | | | $ | 18,000,000 | | 3 | | | | | $ | 18,000,000 | | 3 | $ | 18,000,000 | | 3 |
| | Stock/Option Vesting | $ | 60,303,430 | | 4 | | | $ | 45,385,930 | | 5 | | | | | $ | 60,303,430 | | 4 | $ | 60,303,430 | | 4 |
| | Health Care Benefits | $ | 297,968 | | 6 | | | $ | 297,968 | | 6 | $ | 297,968 | | 6 | | | $ | 106,681 | | 6 | $ | 297,968 | | 6 |
| Robert N. Martin | Severance Pay | | | | | $ | 1,700,000 | | 7 | | | | | | | | |
| Bonus Payment | | | | | $ | 850,000 | | 8 | | | | | | | | |
| | Stock/Option Vesting | $ | 8,361,480 | | 9 | $ | 4,493,980 | | 10 | $ | 2,417,188 | | 11 | | | | | $ | 8,361,480 | | 9 | $ | 8,361,480 | | 9 |
| | Health Care Benefits | | | | | $ | 33,402 | | 12 | | | | | | | | |
| Michael L. Kaplan | Severance Pay | | | | | $ | 950,000 | | 7 | | | | | | | | |
| Bonus Payment | | | | | $ | 250,000 | | 8 | | | | | | | | |
| | Stock/Option Vesting | $ | 517,030 | | 9 | $ | 517,030 | | 10 | | | | | | | $ | 517,030 | | 9 | $ | 517,030 | | 9 |
| | Health Care Benefits | | | | | $ | 23,806 | | 12 | | | | | | | | |
1Following both a change in control and termination without cause or a material change, Messrs. Mizel, Mandarich, Martin and Kaplan may elect to terminate employment and receive the identified benefits.
2Under the executive's employment agreement, this is calculated as the aggregate base salary earned by the executive during the prior three years. This amount does not include any amount that may be payable upon a two-tier tender offer that results in a change of control. See footnote 5 below.
3Under the executive's employment agreement, this is calculated as of December 31, 2023at 300% for Mr. Mizel and 200% for Mr. Mandarich of the "Annual Incentive Compensation" paid for 2022. To the extent a portion of the Annual Incentive Compensation is paid in restricted stock, that portion of the Annual Incentive Compensation is included and considered in addition to the cash portion.
4Represents the value of unvested restricted stock and performance share units (valued at the Maximum level in accordance with their respective employment agreeements) at December 31, 2023plus an amount representing the difference between MDC’sstock price at December31, 2023and the exercise price of unvested options, to the extent that the stock price exceeds the exercise price. In the event a change in control involves a two-tier tender offer, the Company would pay the executive (at the executive's election) the difference between the exercise price of the otherwise unvested options and the price offered in the first tier, or adjust the option terms to provide the executive with an equivalent value. In the event that the fair market value of restricted stock units on the date of full vesting is less than the fair market value of the restricted stock units on the date of award, additional shares of stock will be granted on the date of full vesting so as to equalize the award value to the fair market value of the award on the date of grant pursuant to the terms of the executive's employment agreement.
5 Represents the value of unvested restricted stock at December 31, 2023plus an amount representing the difference between MDC’sstock price at December31, 2023and the exercise price of unvested options, to the extent that the stock price exceeds the exercise price, pursuant to the terms of the respective agreement. In the event that the fair market value of restricted stock units on the date of full vesting is less than the fair market value of the restricted stock units on the date of award, additional shares of stock will be granted on the date of full vesting so as to equalize the award value to the fair market value of the award on the date of grant pursuant to the terms of the executive's employment agreement. In addition, this includes the value of unvested performance share units at December 31, 2023. Under the executive's employment agreement, the PSUs will become 100% vested as of the date of such Change in Control Event, with the number of shares of stock to be earned, issued and delivered to the Employee, if any, for such vested PSUs to be determined at the end of the Performance Period and to be issued and paid to the Employee as though he continued to be employed through the end of the Performance Period. Under the Merger Agreement, upon completion of the merger, PSUs will become 100% vested, cancelled and automatically converted into the right to receive an amount in cash, without interest, based upon maximum performance. The 2021 PSU value has been estimated at the maximum goal at 12/31/2023. The 2023 PSU value has been estimated below threshold goal at 12/31/2023. For more details seeNote 22(Stock Based Compensation) to the Consolidated Financial Statements in the Company's Original Form 10-K for the year ended December 31, 2023.
6Represents the total projected medical insurance benefit obligation for the executive, which would provide medical benefits that are at least comparable to those provided to the executive at the time his employment agreement was signed. The Company will pay the medical insurance benefit for the duration of the executive's life. The medical insurance benefit also provides comparable coverage for the executive's spouse for duration of the executive's life and, if she survives him, for an additional 60 months after his death. Thisamount is estimated based on 2023costs incurred by the Company.
7 Under the executive's change in control agreement, this is calculated as 200% of the executive's annual base salary.
8Under the executive's change in control agreement, this is calculated as two times the amount of the executive’s last regular annual bonus, provided that for these purposes, such regular annual bonus amount shall not exceed 50% of the executive's annual base salary at the rate in effect immediately before the change in control event.
9Represents the value of all unvested restricted stockand performance share unitawards at December 31, 2023, which would become fully vested pursuant to the terms of the respective agreement.
10Represents the value of all unvested restricted stock at December 31, 2023. If a change in control occurs, all options, dividend equivalents and other rights granted to the employee under any Company equity incentive plans shall be accelerated and shall become exercisable immediately prior to the closing of the change in control so as to permit the employee fully to exercise all outstanding options and rights.
11Represents the value of all unvested performance share units at December 31, 2023 pursuant to the terms of the performance share unit grant agreement. Under the 2021 and 2023 PSU agreements, the PSUs will become 100% vested as of the date of such Change in Control Event, with the number of shares of stock to be earned, issued and delivered to the Employee, if any, for such vested PSUs to be determined at the end of the Performance Period and to be issued and paid to the Employee as though he continued to be employed through the end of the Performance Period. Under the Merger Agreement, upon completion of the merger, PSUs will become 100% vested, cancelled and automatically converted into the right to receive an amount in cash, without interest, based upon maximum performance. The 2021 PSU value has been estimated at the maximum goal at 12/31/2023. The 2023 PSU value has been estimated below threshold goal at 12/31/2023. For more details seeNote 22(Stock Based Compensation) to the Consolidated Financial Statements in the Company's Original Form 10-K for the year ended December 31, 2023.
12Under the executive's change in control agreement, the executive shall be entitled to continue to participate in each of the Company's employee benefit plans, policies or arrangements which provide insurance and medical benefits on the same
basis as was provided to the executive prior to the change in control event for a period of 12 months after the date of termination of executive's employment. This amount is estimated based on 2023 costs incurred by the Company.
13Under the executive's employment agreement, the executive will receive these benefits upon retirement following completion of their initial employment term. As Mr. Mandarich has not yet completed his initial employment term, no amounts have been reflected.
2023 Director Compensation
Compensation Structure
The compensation program for the non-employee members of the Board is comprised of two elements:
(i) a monthly cash fee consisting of a proportionate payment of an annual retainer and specified fees for attendance at various monthly meetings, and (ii) stock options or their equivalent value in the form of restricted stock ("Equity Benefit").The Lead Director earns an annual cash retainer payable monthly and the Equity Benefit and does not receive attendance fees.
•The cash element of the Directors' annual compensation (including the Lead Director retainer) was last adjusted ten years ago and has not been modified.
•The Equity Benefit remained at 33,067 option shares, in accordance with the shareholder approved equity plan. With the exception of adjustments to reflect the issuance of corporate stock dividends, the Equity Benefit has remained the same for over twenty years.
•Each Director has the choice to receive the stock options or a restricted stock award of equivalent value. The value of the stock option and its equivalent is computed in accordance with FASB ASC Topic 718.
In order to strengthen the financial alignment of the Company's Directors with the interests of the Company's shareholders, the Corporate Governance/Nominating Committee and the Board have established Equity Ownership Guidelines for Directors who are not employees of the Company. Under these guidelines, each Director is encouraged to acquire and maintain ownership of common stock with an acquisition value, measured at the time of acquisition, of not less than ten times the annual amount of the retainer paid for serving on the Board determined as of the time the Director joins the Board. The annual amount of the retainer currently is $60,000 resulting in a current stock ownership goal of $600,000 for new Directors. The Directors who have not yet achieved the goal have agreed to retain 100% of the shares they acquire through restricted stock awards and the future exercise of stock options, net of taxes and any option exercise price, up to the number of shares necessary to achieve the goal.
Our Board reviews Director compensation annually in collaboration with the Compensation Committee and the Committee's compensation consultant with reference to comparable individual and peer group director fees and prevailing market practices. The Board takes into consideration a number of specific factors attributable to the Directors’ service on the Board, including the Company’s higher-than-usual frequency of Board, Audit and Legal Committee meetings (the Board, Audit and Legal Committee meetings are generally conducted on a regular monthly basis, Corporate Governance/Nominating and Compensation Committee meetings are held periodically, as required, with interim communications arising, as necessary) and the extraordinary level of engagement of our Non-Employee Directors. The Board believes that our Non-Employee Director compensation (1) should be competitive with companies in our Peer Group, taking into account (i) the value of their seasoned experience and expertise and (ii) the comparative level of engagement and time commitment to prepare for and attend monthly Board meetings, and (2) should include a combination of cash and equity-based compensation that align their interests with our shareholders.
2023 Compensation
Director compensation for 2023 was paid in accordance with the in-place structure outlined above.
The following table sets forth information regarding the compensation of the Company's Non-Employee Directors for the fiscal year ended December 31, 2023. The two Directors (Messrs. Mizel and Mandarich) who are executive officers receive no compensation for serving as Directors in addition to the compensation received as executive officers.
| | | | | | | | | | | | | | | | | |
| Name | Fees Earned or
Paid in Cash
($) | Stock Awards ($) 1, 2, 3 | All Other Compensation ($) 4 | | Total
($) |
| Raymond T. Baker | $ | 134,500 | | $ | 390,816 | | $ | 42,247 | | | $ | 567,563 | |
| Michael Berman | $ | 123,000 | | $ | 390,816 | | N/A | | $ | 513,816 | |
| David E. Blackford | $ | 143,500 | | $ | 390,816 | | $ | 33,986 | | | $ | 568,302 | |
Herbert T. Buchwald 5 | $ | 390,000 | | $ | 390,816 | | $ | 30,630 | | | $ | 811,446 | |
| Rafay Farooqui | $ | 110,000 | | $ | 390,816 | | $ | 21,125 | | | $ | 521,941 | |
| Courtney L. Mizel | $ | 123,000 | | $ | 390,816 | | $ | 23,710 | | | $ | 537,526 | |
| Paris G. Reece III | $ | 150,000 | | $ | 390,816 | | $ | 33,035 | | | $ | 573,851 | |
| David Siegel | $ | 158,500 | | $ | 390,816 | | N/A | | $ | 549,316 | |
| Janice Sinden | $ | 132,000 | | $ | 390,816 | | $ | 19,757 | | | $ | 542,573 | |
1 Each Non-Employee Director was entitled to a vested option to purchase 33,067 shares of common stock or 7,552 shares of restricted stock on August 1, 2023. The dollar amount shown for each Director is the aggregate grant date fair value computed in accordance with FASB ASC Topic 718. For details on the assumptions used to calculate the fair value of options, see Note 22 (Stock Based Compensation) to the Consolidated Financial Statements in the Company's Original Form 10-K for the year ended December 31, 2023. The annual Black-Scholes-Merton calculation for the value of the stock options was performed by AON Equity Services, an independent valuation services firm.
2 The Company does not experience any actual cash cost of the award but is required to report the value of the “benefit conferred" to the directors as an expense. The result of the award of restricted stock in lieu of stock options reduces the dilution to shareholders of the Company by approximately 75% in the event options were awarded and exercised.
3 As of December 31, 2023, Messrs. Baker and Berman and Ms. Mizel had outstanding option grants of 7,500, 15,000 and 16,534 shares, respectively. All directors each had unvested restricted stock awards of 7,552 shares.
4 For each of Messrs. Baker, Blackford, Buchwald, Farooqui, Reece and Ms. Mizel and Ms. Sinden, the amounts shown for "All Other Compensation" consist of Incremental Costs incurred by the Company in support of service to not-for-profit organizations, consistent with the Company’s commitment to sustainability.
5The incremental costs of non-business use of the Company's aircraft are calculated as the total variable operating costs directly associated with non-business trips, which include fuel, pilot travel related costs, catering, landing fees, flight communications and trip-related maintenance (the “Incremental Cost”). For theuse of the aircraft in 2023, Mr. Buchwaldreimbursed the Company for the Incremental Cost of $16,253.
During 2023, each Non-Employee Director (excluding the Lead Director) earned a retainer in the amount of $5,000 per month and the amount of $3,000 for each Board meeting attended. Committee members (excluding the Lead Director) earned $3,000 for each Audit Committee meeting attended and $2,500 for each Compensation and/or Corporate Governance/Nominating Committee meeting attended. The members of the Legal Committee (also excluding the Lead Director) earned a retainer in the amount of $2,000 per month. In addition, the chairmen of the Audit Committee, Compensation Committee and Corporate Governance/Nominating Committee each received a retainer in the amount of $1,250 per month. Mr. Berman received a retainer of $2,000 per month for his service as a director on the Board of HomeAmerican Mortgage Corporation, which conducted four meetings during the year. The Lead Director earned $32,500 per month for performance of the duties and responsibilities established by the Board and his leadership as a member on all of the committees. Each Director is also reimbursed for expenses related to their attendance at Board and committee meetings. For the health and safety of the Company's lead director, Mr. Buchwald, the independent directors approved his use of the Company's aircraft (when not otherwise used by Company employees) on a limited basis with his reimbursement to the Company consistent with the Company's policy for its executive officers' use of the aircraft (the Incremental Cost).
Pursuant to the M.D.C. Holdings, Inc. 2020 Equity Plan for Non-Employee Directors, approved by the shareholders at the annual meeting on April 20, 2020, each Non-Employee Director obtained an Equity Benefit in the form of a vested option to purchase 33,067 shares of common stock (adjusted for the stock dividend in March 2021). The stock options are not exercisable until six months after the date of the grant. In lieu of acceptance of the stock option, each Non-Employee Director has the opportunity to elect, in advance and instead of the option grant, to receive an award of restricted stock in an amount valued at the equivalent reportable expense to the Company of the option grant. The restricted stock awards vest on March 1st of the following year.
Compensation Committee Interlocks and Insider Participation
The following persons served as members of the Compensation Committee during 2023: Raymond T. Baker and Herbert T. Buchwald. None of the Committee members were, during the last fiscal year, officers or employees of the Company, none were formerly officers of the Company and none had a material interest in a "related person" transaction since the beginning of 2023. During 2023, none of our executive officers served as a member of the board of directors or compensation committee of any other company that has one or more executive officers serving as a member of our Board or Compensation Committee.
Compensation Committee Report
The Compensation Committee met seven times during 2023. The Compensation Committee hereby confirms that it has reviewed and discussed the Compensation Discussion and Analysis with management and, based on the review and discussions, the Compensation Committee recommended to the Board that the Compensation Discussion and Analysis be included in the 2023 Annual Report on Form 10-K as well as statements made by usamended.
| | | | | |
| COMPENSATION COMMITTEE Raymond T. Baker, Chairman Herbert T. Buchwald |
PEO Pay Ratio Disclosure
Pursuant to SEC rules, to determine our median employee, we used W-2 compensation for our entire employee population, all of whom are located within the United States. As of December 31, 2023, we identified our median employee (excluding our Executive Chairman, who is our principal executive officer, from the calculation). For the fiscal year ended December 31, 2023, we calculated that median employee’s total compensation using the same methodology that we used to calculate the total compensation for our Executive Chairman. The 2023 annual total compensation of the median employee and our Executive Chairman, respectively, were $104,193 and $20,730,819. The ratio of the 2023 annual total compensation for our Executive Chairman to that of our median employee was 199 to 1.
Compensation Policies and Practices and Risk Management
The Company believes that its compensation policies and practices for its employees, including executive officers, do not create risks that are reasonably likely to have a material adverse effect on the Company.
As part of its annual processes, the Compensation Committee reviews the Company’s compensation policies and practices to confirm that the programs are designed in periodic press releases, oral statements made by our officials ina manner that does not motivate individuals or groups to take risks reasonably likely to have a material adverse effect on the courseCompany. Based on the Compensation Committee’s assessment of presentations aboutrisk, the Company believes that its compensation policies and practices for its employees, including executive officers, do not create risks that are reasonably likely to have a material adverse effect on the Company, and conference callsthat such policies and practices are designed with strong oversight mechanisms in connectionplace.
Item 12. Security Ownership of Certain Beneficial Owners and Management and Related Stockholder Matters.
Securities Authorized for Issuance Under Equity Compensation Plans
The following table provides information, as of December 31, 2023, with quarterly earnings releases, constitute “forward-looking statements” withinrespect to the meaningCompany’s existing equity compensation plans.
| | | | | | | | | | | | | | | | | |
| Plan category | (a) Shares to be issued upon exercise of outstanding options, warrants and rights 1 | | (b) Weighted-average exercise price of outstanding options, warrants and rights 2 | | (c) Number of shares remaining available for future issuance under equity compensation plans (excluding shares reflected in column (a)) 3 |
| Equity compensation plans approved by shareholders | 5,219,122 | | 28.45 | | 2,476,670 |
| Equity compensation plans not approved by shareholders | -- | | -- | | -- |
| Total | 5,219,122 | | 28.45 | | 2,476,670 |
1Consists of the Private2011 Equity Incentive Plan (1,345,439 shares under outstanding stock options and 38,708 shares of unvested RSA's), the 2020 Equity Plan for Non-Employee Directors (39,034 shares under outstanding stock options, 67,968 shares of unvested RSA's) and the 2021 Equity Incentive Plan (1,800,000 shares under outstanding stock options, 1,590,000 shares under outstanding PSU's, assuming achievement of the performance goals at the maximum level, and 337,973 shares of unvested RSA's).
2The weighted average exercise price relates to the stock options granted under the 2011 Equity Inventive Plan, the 2020 Equity Plan for Non-Employee Directors and the 2021 Equity Incentive Plan. The weighted average exercise price does not take into account the RSA's granted under each plan and the PSU's granted under the 2021 Equity Incentive Plan as they are full value awards and have no exercise price.
3Represents the aggregate number of Common Shares remaining available for issuance under the 2020 Equity Plan for Non-Employee Directors (250,177) and the 2021 Equity Incentive Plan (2,226,493). There are no remaining available Common Shares for issuance under the 2011 Equity Incentive Plan as it automatically terminated on April 27, 2021.
Ownership of Directors and Officers
Certain information, as of February 26, 2024, with respect to common stock beneficially owned by the Company's named executive officers and the Directors of the Company, furnished in part by each such person, appears below (unless stated otherwise, the named beneficial owner possesses the sole voting and investment power with respect to such shares). None of the shares beneficially owned by the executive officers and Directors have been pledged as security.
| | | | | | | | | | | | | | |
| Name of Executive Officer/Director | Number of Shares of Common Stock Owned Beneficially 1 | | Percent of Class 2 |
| Raymond T. Baker | 63,578 | | | | * |
| Michael A. Berman | 44,637 | | | | * |
| David E. Blackford | 19,734 | | | | * |
| Herbert T. Buchwald | 18,943 | | | | * |
| Rafay Farooqui | 7,552 | | | | * |
| Michael L. Kaplan | 11,571 | | | | * |
| David D. Mandarich | 6,208,838 | | 3 | | 8.17% |
| Robert N. Martin | 305,302 | | | | * |
| Courtney L. Mizel | 67,772 | | | | * |
| Larry A. Mizel | 10,192,198 | | 3,4 | | 13.40% |
| Paris G. Reece III | 79,310 | | 4 | | * |
| David Siegel | 27,830 | | 4 | | * |
| Janice Sinden | 15,891 | | | | * |
| All current executive officers and Directors as a group (13 persons) | 17,063,156 | | | | 22.15% |
_______________
* Represents less than one percent of the shares of common stock outstanding and entitled to vote.
1 Includes, where applicable, shares of common stock owned by related individuals or entities over whose shares such person may be deemed to have beneficial ownership. Also includes the following shares of common stock subject to options that are exercisable or become exercisable within 60 days of February 26, 2024 at prices ranging from $23.90 to $53.32 per share: Raymond T. Baker 7,500; Michael A. Berman 15,000; David D. Mandarich 932,000; Courtney L. Mizel, 16,534; and Larry A. Mizel 998,680. As a group, the executive officers and Directors had the right to acquire within 60 days of February 26, 2024 by the exercise of options an aggregate of 1,969,714 shares of common stock.
2 The percentage shown is based on the number of shares of common stock outstanding and entitled to vote as of February 26, 2024. All shares of common stock that the person or group had the right to acquire within 60 days of February 26, 2024 are deemed to be outstanding for the purpose of computing the percentage of shares of common stock owned by such person or group, but are not deemed to be outstanding for the purpose of computing the percentage of shares of common stock owned by any other person or group.
3 On February 29, 2024, Mr. Mandarich gifted 750,000 shares to Mandarich Family Foundation, a private foundation of which Mr. Mandarich is President and a director. Accordingly, Mr. Mandarich may continue to be deemed to be the beneficial owner of such shares as of such date. On February 28, 2024, Mr. Mizel, through CGM Capital, LLLP, gifted 1,000,000 shares to Mizel Global Cultural Fund, a private foundation of which Mr. Mizel and his spouse are the directors. Accordingly, Mr. Mizel may continue to be deemed to be the beneficial owner of such shares as of such date.
4 Mr. Mizel has sole voting power and sole investment power over 1,316,709 shares and shared voting power and shared investment power over 8,875,489 shares. Mr. Reece has sole voting power and sole investment power over 7,552 shares and shared voting power and shared investment power over 71,758 shares. Mr. Siegel has sole voting power and sole investment power over 11,311 shares and shared voting power and shared investment power over 16,519 shares.
Ownership of Certain Beneficial Owners
The table below sets forth information with respect to those persons (other than the officers/Directors listed above) known to the Company, as of February 26, 2024, to have owned beneficially 5% or more of the outstanding shares of common stock. The information as to beneficial ownership is based upon statements filed by such persons with the SEC under Section 13(d) or 13(g) of the Securities Litigation ReformExchange Act of 1995. These forward-looking statements include statements regarding our business, financial condition, results1934, as amended.
| | | | | | | | | | | | | | | | | |
| Name and Address of Beneficial Owner | | Number of Shares of
Common Stock
Owned Beneficially | | Percent of Class 1 |
BlackRock, Inc.
50 Hudson Yards
New York, NY 10001 | | 10,446,524 | | 2 | | 13.92 | % |
The Vanguard Group
100 Vanguard Blvd.
Malvern, PA 19355 | | 7,043,852 | | 3 | | 9.39 | % |
Dimensional Fund Advisors LP 6300 Bee Cave Road, Building One Austin, TX 78746 | | 5,653,891 | | 4 | | 7.53 | % |
___________________
1 The percentage shown is based on the number of operation, cash flows, strategiesshares outstanding and prospects. In addition, this Report includes forward-looking statements regardingentitled to vote as of February 26, 2024.
2 Schedule 13G/A filed with the AgreementSEC on January 23, 2024 disclosed that: BlackRock, Inc. has sole voting power over 10,215,074 shares, shared voting power over no shares, sole dispositive power over 10,446,524 shares and Plan of Merger, dated as ofshared dispositive power over no shares.
3 Schedule 13G/A filed with the SEC on February 13, 2024 disclosed that: The Vanguard Group has sole voting power over no shares, shared voting power over 57,266 shares, sole dispositive power over 6,921,134 shares and shared dispositive power over 122,718 shares.
4 Schedule 13G/A filed with the SEC on February 9, 2024 disclosed that: the Dimensional Fund Advisors LP has sole voting power over 5,579,926 shares, shared voting power over no shares, sole dispositive power over 5,653,891 shares and shared dispositive power over no shares.
Changes in control
On January 17, 2024, (the “Merger Agreement”),we entered into the Merger Agreement by and among the Company, SH Residential Holdings, LLC (“Parent”), Clear Line, Inc., a wholly owned subsidiary of Parent (“Merger Sub”), and, solely for the purposes of Section 6.2, Section 6.17 and Section 9.15 of the Merger Agreement, Sekisui House, Ltd. (“Guarantor”), including statements as to the expected timing, completion and effects of the proposed transaction. Pursuant to the terms and conditions set forth in the Merger Agreement, Merger Sub will merge with and into the Company, with the Company continuing as the surviving corporation (the “Merger”). These forward-looking statements may be identified by terminology such as “likely,” “may,” “will,” “should,” “expects,” “plans,” “anticipates,” “believes,” “estimates,” “predicts,” “potential,” ”confident,” “could,” “intends,” “target,” “might,” “path,” “approximately,” “our planning assumptions,” “forecast,” “outlook” or “continue,” or the negative of such terms and other comparable terminology. Although we believe that the expectations reflected in the forward-looking statements contained in this Report are reasonable, we cannot guarantee future results. These statements, including statements regarding the proposed transaction, are based largely on information currently available to our management and our management's current expectations and assumptions, and involve known and unknown risks, uncertainties and other factors that may cause the actual results, performance or achievements of the Company to be materially different from those expressed or implied by the forward-looking statements. We undertake no obligation to publicly update any forward-looking statements, whether as a result of new information, future events or otherwise. However, any further disclosures made on related subjects in subsequent reports on Form 10-K, 10-Q and 8-K or in the proxy statement that the Company will file in connection with the transactions contemplated by the Merger Agreement should be considered.
Important factors, risks and uncertainties and other factors that may cause actual results to differ materially from our plans, estimates or expectations include but are not limited to: (i) the completion of the proposed transaction on the anticipated terms and timing, including obtaining required stockholder and regulatory approvals, and the satisfaction of other conditions to the completion of the proposed transaction; (ii) potential litigation relating to the proposed transaction that could be instituted against the Company or its directors, managers or officers, including the effects of any outcomes related thereto; (iii) the risk that disruptions from the proposed transaction will harm the Company’s business, including current plans and operations, including during the pendency of the proposed transaction; (iv) the ability of the Company to retain and hire key personnel; (v) the diversion of management’s time and attention from ordinary course business operations to completion of the proposed transaction and integration matters; (vi) potential adverse reactions or changes to business relationships resulting from the announcement or completion of the proposed transaction; (vii) legislative, regulatory and economic developments; (viii) potential business uncertainty, including changes to existing business relationships, during the pendency of the proposed transaction that could affect the Company’s financial performance; (ix) certain restrictions during the pendency of the proposed transaction that may impact the Company’s ability to pursue certain business opportunities or strategic transactions; (x) unpredictability and severity of catastrophic events, including but not limited to acts of terrorism, outbreaks of war or hostilities or the COVID-19 pandemic, as well as management’s response to any of the aforementioned factors; (xi) the possibility that the proposed transaction may be more expensive to complete than anticipated, including as a result of unexpected factors or events; (xii) the occurrence of any event, change or other circumstance that could give rise to the termination of the proposed transaction, including in circumstances requiring the Company to pay a termination fee; and (xiii) those risks and uncertainties set forth under “Item 1A, Risk Factors.” These risks, as well as other risks associated with the proposed transaction, will be more fully discussed in the proxy statement that will be filed with the SEC in connection with the proposed transaction.
Item 1. Business.
(a) General Development of Business
M.D.C. Holdings, Inc. is a Delaware corporation. We refer to M.D.C. Holdings, Inc. as the “Company,” “MDC,” “we” or “our” in this Annual Report on Form 10-K, and these designations include our subsidiaries unless we state otherwise. We have two primary operations, homebuilding and financial services. Our homebuilding operations consist of wholly-owned subsidiary companies that generally purchase finished lots or develop lots to the extent necessary for the construction and sale primarily of single-family detached homes to first-time and first-time move-up homebuyers under the name “Richmond American Homes.” Our homebuilding operations are comprised of various homebuilding divisions that we consider to be our operating segments. For financial reporting purposes, our homebuilding operations are aggregated into reportable segments as follows: (1) West (includes operations in Arizona, California, Nevada, New Mexico, Oregon, Texas and Washington); (2) Mountain (includes operations in Colorado, Idaho and Utah); and (3) East (includes operations in Alabama, Florida, Maryland, Pennsylvania, Tennessee and Virginia).
Our financial services operations consist of (1) HomeAmerican Mortgage Corporation (“HomeAmerican”), which originates mortgage loans primarily for our homebuyers, (2) Allegiant Insurance Company, Inc., A Risk Retention Group (“Allegiant”), which provides insurance coverage primarily to our homebuilding subsidiaries on homes that have been delivered and most of our subcontractors for completed work on those delivered homes, (3) StarAmerican Insurance Ltd. ("StarAmerican"), which is a re-insurer of Allegiant claims, (4) American Home Insurance Agency, Inc., which offers third-party insurance products to our homebuyers, and (5) American Home Title and Escrow Company, which provides title agency services to our homebuilding subsidiaries and our customers in certain states. For financial reporting, we have aggregated our financial services operating segments into reportable segments as follows: (1) mortgage operations (represents HomeAmerican only) and (2) other (all remaining operating segments).
Announcement of SH Residential Holdings Merger. On January 17, 2024, we entered into the Merger Agreement with Parent, Merger Sub and, solely for the purposes of Section 6.2, Section 6.17 and Section 9.15 of the Merger Agreement, the Guarantor. Pursuant to the terms and conditions set forth in the Merger Agreement, Merger Sub will merge with and into the Company, with the Company continuing as the surviving corporation. At the effective time of the Merger (the “Effective Time”), each share of common stock, par value $0.01 per share, of the Company, outstanding as of immediately prior to the Effective Time (other than shares of common stock that are (A)(1) held by the Company as treasury stock; (2) held directly by Parent or Merger Sub; or (3) held by any direct or indirect wholly owned subsidiary of Parent or Merger Sub, in each case, immediately prior to the Effective Time (collectively, the “Owned Company Shares”), (B) held by any direct or indirect wholly owned subsidiary of the Company immediately prior to the Effective Time, (C) held by a holder who is entitled to demand, and has properly and validly demanded, appraisal for such shares of common stock in accordance with, and who complies in all respects with, Section 262 of the Delaware General Corporation Law (the “DGCL” and such shares, the “Dissenting Shares”), or (D) subject to vesting restrictions and/or forfeiture back to the Company (“Company RSAs”)) will be automatically converted into the right to receive $63.00 per share, in cash, without interest thereon (the “Merger Consideration”). At the Effective Time, each Owned Company Share will automatically be cancelled and cease to exist, and no consideration or payment will be delivered in exchange therefor or in respect thereof, and each share of common stock held by any direct or indirect wholly owned subsidiary of the Company shall be converted into such number of shares of common stock of the surviving corporation with an aggregate value immediately after the consummation of the Merger equal to the Merger Consideration. At the Effective Time, each Dissenting Share will be cancelled and cease to exist, and the holders of Dissenting Shares will only be entitled to the rights granted to them under Section 262 of the DGCL with respect to such Dissenting Shares.
At the Effective Time, subject to the terms and conditions set forth in the Merger Agreement, each (i) option to purchase shares of common stock granted under any Company equity plan (each, a “Company Option”) that is outstanding and unexercised, whether vested or unvested, as of immediately prior to the Effective Time will be fully vested, cancelled and automatically converted into the right to receive an amount in cash (without interest), if any, equal to the product of (A) the excess (if any) of (1) the Merger Consideration over (2) the exercise price per share of such Company Option, multiplied by (B) the number of shares of common stock subject to such Company Option, subject to any required withholding of taxes; provided, however, that any Company Option with respect to which the applicable per share exercise price is greater than the Merger Consideration will be cancelled without consideration; (ii) Company RSA, whether vested or unvested, that is outstanding as of immediately prior to the Effective Time will be fully vested, cancelled and automatically converted into the right to receive an amount in cash (without interest) equal to the product of (A) the aggregate number of shares of common stock subject to such Company RSA, multiplied by (B) the Merger Consideration, subject to any required withholding of taxes; and (iii) performance stock unit award relating to shares of common stock granted under any Company equity plan (each, a “Company PSU”), whether vested or unvested, that is outstanding as of immediately prior to the Effective Time will be fully
vested, cancelled and automatically converted into the right to receive an amount in cash equal to the product of (A) the aggregate number of shares of common stock subject to such Company PSU based on maximum performance, multiplied by (B) the Merger Consideration, subject to any required withholding of taxes.
Our Board of Directors unanimously approved the Merger and the Merger Agreement. If approved by our stockholders, we currently expect the Merger to close in the first half of 2024. Until the closing, we will continue to operate as an independent company.
The closing of the Merger is subject to certain conditions set forth in the Merger Agreement, including, but not limited to, the (i) affirmative vote of the holders of a majority of all of the outstanding shares of common stock to adopt the Merger Agreement; (ii) expiration or termination of any waiting period (and extensions thereof) applicable to the transactions contemplated by the Merger Agreement, including the Merger, under the Hart-Scott-Rodino Antitrust Improvements Act of 1976, as amended, and the rules and regulations promulgated thereunder; (iii) absence of any law, order or injunction enacted or issued after the date of the Merger Agreement restraining, enjoining or otherwise prohibiting the Merger; and (iv) the absence of certain events constituting a material adverse effect on the Company’s business following the date of the Merger Agreement. The obligations of Parent and Merger Sub to consummate the Merger are not subject to any financing condition.
The Company made customary representations and warranties in the Merger Agreement and agreed to customary covenants regarding the operation of the business of the Company and its subsidiaries prior to the consummation of the Merger. The Merger Agreement also provides that the Company, on the one hand, or Parent and Merger Sub, on the other hand, may specifically enforce the obligations under the Merger Agreement, including the obligation to consummate the Merger if the conditions set forth in the Merger Agreement are satisfied. The parties to the Merger Agreement have also agreed to use their respective reasonable best efforts and take certain actions to obtain the requisite regulatory approvals for the transactions contemplated by the Merger Agreement, including the Merger.
From the execution of the Merger Agreement until the earlier to occur of the termination of the Merger Agreement and the Effective Time, the Company will be subject to customary “no-shop” restrictions on its ability to solicit alternative acquisition proposals from third parties and to provide information to, and participate in discussions and negotiations with, third parties regarding any alternative acquisition proposals, subject to a customary “fiduciary out” provision that allows the Company, under certain specified circumstances, to provide information to, and participate or engage in discussions or negotiations with, third parties with respect to an acquisition proposal if the Board determines in good faith (after consultation with the Company’s financial advisor and outside legal counsel) that such alternative acquisition proposal constitutes a superior proposal or would be reasonably likely to result in a superior proposal, and the failure to take such actions would be reasonably likely to be inconsistent with the directors’ fiduciary duties pursuant to applicable law.
The Merger Agreement contains certain termination rights for the Company on the one hand and Parent and Merger Sub on the other hand. Upon termination of the Merger Agreement under specified circumstances, including (i) the Company terminating the Merger Agreement to enter into an alternative acquisition agreement providing for a superior proposal; or (ii) Parent terminating the Merger Agreement due to the Company’s Board’s change of its recommendation that our shareholders adopt the Merger Agreement and approve the transactions, including the Merger, in each case pursuant to and in accordance with the “fiduciary out” provisions of the Merger Agreement, the Company will be required to pay Parent a termination fee of $147,420,000. The termination fee will also be payable by the Company if the Merger Agreement is terminated under certain circumstances and prior to such termination (or at least two business days prior to our special meeting in the case of termination for the failure to receive the requisite shareholder approval), an acquisition proposal has been publicly announced and not publicly withdrawn or not otherwise publicly abandoned and an acquisition proposal is consummated or we enter into a definitive agreement with respect to an acquisition proposal within one year of the termination. In addition to the foregoing termination rights, and subject to certain limitations, the Company or Parent may terminate the Merger Agreement if the Merger is not consummated by July 17, 2024, subject to extension at the election of the Company or Parent for three months if necessary to obtain HSR approval or to resolve an injunction relating to other specified governmental consents.
The foregoing description of the Merger Agreement is qualified in its entirety by reference to the full text of the Merger Agreement, which has been filed herewith as Exhibit 2.1 to this Report.
(c) Description of Business
Our business consists of two primary operations, homebuilding and financial services. Our homebuilding subsidiaries build and sell primarily single-family detached homes that are designed and built to meet local customer preferences. Each homebuilding subsidiary is the general contractor for its projects and retains subcontractors for land development and home
construction. Our homebuilding subsidiaries build a variety of home styles in each of their markets, targeting primarily first-time and first-time move-up homebuyers.
For 2023, the percentage of our home deliveries and home sale revenues by state were as follows: | | | | | | | | | | | |
| Percentage
of
Deliveries | | Percentage
of Home Sale
Revenues |
| Arizona | 23 | % | | 19 | % |
| California | 20 | % | | 24 | % |
| Nevada | 9 | % | | 9 | % |
| New Mexico | — | % | | — | % |
| Oregon | 1 | % | | 1 | % |
| Texas | 1 | % | | 1 | % |
| Washington | 3 | % | | 3 | % |
| West | 57 | % | | 57 | % |
| Colorado | 20 | % | | 23 | % |
| Idaho | 1 | % | | 1 | % |
| Utah | 4 | % | | 4 | % |
| Mountain | 25 | % | | 28 | % |
| Alabama | — | % | | — | % |
| Maryland | 1 | % | | 2 | % |
| Pennsylvania | 1 | % | | — | % |
| Tennessee | 1 | % | | 1 | % |
| Virginia | 3 | % | | 3 | % |
| Florida | 12 | % | | 9 | % |
| East | 18 | % | | 15 | % |
| Total | 100 | % | | 100 | % |
Our financial services operations include subsidiaries that provide mortgage financing, place title insurance and homeowner insurance for our homebuyers, and provide general liability insurance for our subsidiaries and most of our subcontractors.
Homebuilding Operations
Operating Divisions. The primary functions of our homebuilding segments include land acquisition and development, home construction, sales and marketing, and customer service. Operating decisions are made by our local management teams under the oversight of our Chief Operating Decision Maker (“CODM”), or decision-making group, defined as two key executives - our Executive Chairman and Chief Executive Officer. Our organizational structure (i.e., the grouping and reporting of divisions) changes based upon the current needs of the Company. We had 19 active homebuilding operating divisions at December 31, 2023. We had 21 active homebuilding operating divisions at December 31, 2022 and 2021.
Corporate Management. Our homebuilding business is managed primarily through members of senior management in our Corporate segment and our four Asset Management Committees (“AMCs”), three for reviewing real estate transactions and one for reviewing corporate transactions. Each real estate AMC is comprised of the Chief Executive Officer, Chief Financial Officer and at least one of our other corporate officers, with the corporate AMC comprised of our Chief Executive Officer and Chief Financial Officer. All real estate acquisition transactions are reviewed to confirm that the transaction is projected to achieve the objectives established by our decision-making group and must be approved by the designated real estate AMC. Generally, the role of our senior management team and/or AMC includes:
•review and approval of division business plans and budgets;
•oversight of land and home inventory levels;
•review of major personnel decisions; and
•review of capital allocation decisions.
Additionally, our corporate executives and corporate departments generally are responsible for establishing and monitoring compliance with our policies and procedures. Among other things, the corporate office has primary responsibility for:
•asset management and capital allocation;
•treasury;
•insurance and risk management;
•merchandising and marketing;
•national purchasing contracts;
•accounting, tax and internal audit functions;
•legal matters;
•human resources and payroll;
•information technology; and
•training and development.
Housing. Generally, our homebuilding subsidiaries build single-family detached homes in a number of standardized series, designed to provide variety in the size and style of homes for our potential homebuyers. In certain markets, our homebuilding subsidiaries build and sell duplexes. Within each series of our single-family detached homes, our homebuilding subsidiaries build several different floor plans offering standard and optional features (such as upgraded appliances, cabinetry, flooring, etc.). Differences in sales prices of similar models from market-to-market depend primarily upon homebuyer demand, home prices offered by our competitors, market conditions (such as home inventory supply levels), location, cost of land, optional features and design specifications. The series of homes offered at a particular location is based on perceived customer preferences, lot size, area demographics and, in certain cases, the requirements of major land sellers and local municipalities. Previously, our homebuilding subsidiaries would focus generally on selling “build-to-order,” also referred to as “dirt sales,” and limit the number of homes started without a contract, also known as “spec homes.” However, with the increase in interest rates during 2022 and interest rate variability during 2023, we have seen an increased preference for spec homes that can be closed within 30 - 60 days. As a result, we have increased the number of spec home construction starts in response to this demand.
Land Acquisition and Development. Our homebuilding subsidiaries acquire lots with the intention of constructing and selling homes on the acquired land. Generally, we prefer to purchase finished lots using option contracts, in phases or in bulk for cash. As such, more than one-half of the lots we purchased in 2023 were finished lots that required no level of development. In making land purchases, we consider a number of factors, including projected rates of return, estimated gross margins from home sales, sales prices of the homes to be built, mortgage loan limits within the respective county, population and employment growth patterns, proximity to developed areas, estimated cost and complexity of development including environmental and geological factors, quality of schools, estimated levels of competition and demographic trends.
In their option contracts, our homebuilding subsidiaries generally obtain the right to purchase lots in consideration for an option deposit in the form of cash or letters of credit. In the event they elect not to purchase the lots within a specified period of time, they may be required to forfeit the option deposit. Our option contracts do not contain provisions requiring our specific performance.
Our homebuilding subsidiaries may own or have the right under option contracts to acquire undeveloped parcels of real estate that they intend to develop into finished lots. They generally develop land in phases in order to limit our risk in a particular subdivision and to efficiently employ available capital resources. Generally, building permits and utilities are available and zoning is suitable for the current intended use of substantially all of our undeveloped land. When developed, these lots generally will be used in our homebuilding activities. See “Forward-Looking Statements” above.
Labor and Raw Materials. Materials used in our homebuilding operations are mainly standard items carried by major suppliers. We generally contract for our materials and labor at a fixed price for the anticipated construction period of our homes. This allows us to mitigate the risks associated with increases in the cost of building materials and labor between the time construction begins on a home and the time it is closed. Increases in the cost of building materials and subcontracted labor may reduce gross margins from home sales to the extent that market conditions prevent the recovery of increased costs through higher home sales prices. From time to time and to varying degrees, we may experience shortages in the availability of building materials and/or labor in each of our markets. These shortages and delays may result in delays in the delivery of homes under construction, reduced gross margins from home sales, or both. See “Forward-Looking Statements” above. Discussion of shortages in the availability of building materials and labor are described in more detail in our description of Risk Factors under the heading "Supply shortages and other risks related to the demand for skilled labor and building materials could continue to increase costs and delay deliveries."
Warranty. Our homebuilding subsidiaries sell their homes with limited third-party warranties that generally provide for one year of coverage for workmanship and materials, two years of coverage for plumbing, electrical, heating, ventilation and air conditioning systems, and structural coverage for an amount of time depending on the jurisdiction in which the house was
purchased. Under our agreement with the issuer of the third-party warranties, our homebuilding subsidiaries perform all of the work for the first two years of the warranty coverage and pay for certain work required to be performed subsequent to year two.
Seasonal Nature of Business. The homebuilding industry can experience noticeable seasonality and quarter-to-quarter variability in homebuilding activity levels. The seasonal nature of our business is described in more detail in our description of Risk Factors under the heading “Because of the seasonal nature of our business, our quarterly operating results can fluctuate.”
Backlog. At December 31, 2023 and 2022, homes under contract but not yet delivered (“backlog”) totaled 1,890 and 2,974, respectively, with an estimated sales value of $1.16 billion and $1.75 billion, respectively. We anticipate that homes in backlog at December 31, 2023 generally will close during 2024 under their existing home order contracts or through the replacement of an existing contract with a new home order contract. The estimated backlog sales value at December 31, 2023 may be impacted by, among other things, subsequent home order cancellations, incentives provided, and/or options and upgrades selected. See “Forward-Looking Statements” above.
Customer Service and Quality Control. Our homebuilding divisions are responsible for pre-closing quality control inspections and responding to customers’ post-closing needs. We have a product service and quality control program, focused on improving and/or maintaining the quality of our customers’ complete home buying and homeownership experience.
Sales and Marketing. Our sales and marketing programs are designed to attract homebuyers in a cost-effective manner. We have a centralized in-house advertising and marketing department, including digital marketing, that oversees our efforts to communicate the inherent value of our homes to our prospective homebuyers and distinguish our Richmond American Homes brand from our competitors and other home buying opportunities. The main objective of this team is to generate homebuyer leads, which are actively pursued by our HomeBuyer Resource Center (HBRC) and community sales associates. Our HBRC team consists of new home specialists local to each market we build in, who are dedicated to supporting our digital and phone leads and set appointments for them to meet at one of our sales centers with a community sales associate. Our centralized in-house merchandising team furnishes our model homes and sales centers.
Another part of our marketing presentation takes place in our design centers (also known as Home Galleries). Here, homebuyers are able to personalize their homes with a variety of options and upgrades. Additionally, these locations often serve as an information center for prospective homebuyers and real estate agents who may opt to receive personalized attention from one of our new home specialists, resulting in a more focused and efficient home search across all of our Richmond American communities in a given market place. We believe that the services provided by our Home Galleries represent a key competitive advantage in attracting and retaining prospective homebuyers who prefer to personalize their home purchase.
Competition. The homebuilding industry is fragmented and highly competitive. The competitive nature of our business is described in more detail in our description of Risk Factors.
Regulation. Our homebuilding operations are subject to compliance with applicable laws and regulations, which are described in more detail in our description of Risk Factors.
Financial Services Operations
Mortgage Lending Operations
General. HomeAmerican is a full-service mortgage lender and the principal originator of mortgage loans for our homebuyers. HomeAmerican has a centralized loan processing center where it originates mortgage loans, primarily for our homebuyers.
HomeAmerican is authorized to originate Federal National Mortgage Association (“Fannie Mae”) and Federal Home Loan Mortgage Corporation (“Freddie Mac”) (together “the government-sponsored enterprises”), Federal Housing Administration-insured (“FHA”), and Department of Veterans Affairs-guaranteed (“VA”) mortgages and is an authorized issuer of Government National Mortgage Association (“Ginnie Mae”) mortgage-backed securities. Furthermore, HomeAmerican also is an authorized loan servicer for Fannie Mae, Freddie Mac and Ginnie Mae and, as such, is subject to the rules and regulations of these entities.
HomeAmerican uses a mortgage repurchase facility, internally generated funds, and temporary financing provided by its parent to finance the origination of mortgage loans until they are sold. HomeAmerican sells originated mortgage loans to third-party purchasers on either a bulk or flow basis. Mortgage loans sold on a bulk basis include the sale of a package of
substantially similar originated mortgage loans, while sales of mortgage loans on a flow basis are completed as HomeAmerican originates each loan. Mortgage loans sold to third-party purchasers include HomeAmerican’s representations and warranties with respect to certain borrower payment defaults, credit quality issues and/or misstatements made by HomeAmerican or misrepresentations by our homebuyers. Substantially all of the mortgage loans originated by HomeAmerican are sold to third-party purchasers, generally between 5 to 35 days of origination.
Pipeline. HomeAmerican’s mortgage loans in process for which a rate and price commitment had been made to a borrower that had not closed (the “locked pipeline”) at December 31, 2023 and 2022 had an aggregate principal balance of approximately $229.2 million and $394.0 million, respectively, and were under interest rate lock commitments at an average interest rate of 5.88% and 5.50%, respectively.
Forward Sales Commitments. HomeAmerican is exposed to market risks related to fluctuations in interest rates. We mitigate our exposure to interest rate market risk relating to mortgage loans held-for-sale and interest rate lock commitments using: (1) forward sales of mortgage-backed securities, which are commitments to sell a specified financial instrument at a specified future date for a specified price, (2) mandatory delivery forward loan sale commitments, which are obligations of an investor to buy loans at a specified price within a specified time period, and (3) best-effort delivery forward loan sale commitments, which are obligations of an investor to buy loans at a specified price subject to the underlying mortgage loans being funded and closed. The market related risks in our business are described in more detail in our description of Risk Factors.
Competition. HomeAmerican has significant competition with other mortgage bankers to arrange financing for our homebuyers. The competitive nature of our mortgage business is described in more detail in our description of Risk Factors.
Regulation. Our mortgage lending operations are subject to compliance with applicable laws and regulations, which are described in more detail in our description of Risk Factors.
Insurance Operations
General. Allegiant and StarAmerican were formed to provide insurance coverage of homebuilding risks for our homebuilding subsidiaries and most of our homebuilding subcontractors. Allegiant was organized as a risk retention group under the Federal Liability Risk Retention Act of 1981. Allegiant, which began operations in June of 2004, is licensed as a Class 3 Stock Insurance Company by the Division of Insurance of the State of Hawaii and is subject primarily to the regulations of its state of incorporation. StarAmerican is a single parent captive insurance company licensed by the Division of Insurance of the State of Hawaii. Pursuant to agreements executed on an annual basis since June of 2004, StarAmerican has re-insured Allegiant for all claims in excess of $50,000 per occurrence up to $3.0 million per occurrence prior to July 1, 2022, and up to $5.0 million per occurrence subsequent to July 1, 2022, subject to various aggregate limits.
Allegiant generates premium revenue generally by providing to its customers, comprised of the Company’s homebuilding subsidiaries and most subcontractors of the Company’s homebuilding subsidiaries, general liability insurance on homes sold by our homebuilding subsidiaries and for work performed in completed subdivisions. Allegiant seeks to provide to its customers coverage and insurance rates that are competitive with other insurers. StarAmerican generates premium revenue by providing re-insurance coverage to Allegiant. Allegiant and StarAmerican incur expenses for actual losses and loss adjustment expenses and for reserves established based on actuarial studies including known facts, such as our experience with similar insurance cases and historical trends involving insurance claim payment patterns, pending levels of unpaid insurance claims, claim severity, claim frequency patterns and interpretations of circumstances including changing regulatory and legal environments.
Regulation. Allegiant and StarAmerican are licensed in the State of Hawaii and, therefore, are subject to regulation by the Hawaii Insurance Division. This regulation includes restrictions and oversight regarding: types of insurance provided; investment options; required capital and surplus; financial and information reporting; use of auditors, actuaries and other service providers; periodic examinations; and other operational items. Additionally, as a risk retention group, Allegiant is also registered in other states where certain MDC homebuilding subsidiaries do business.
Insurance AgencyOperations
American Home Insurance is an insurance agency that sells primarily homeowners, personal property and casualty insurance products in the same markets where our homebuilding subsidiaries operate and primarily to our homebuyers.
Title Operations
American Home Title provides title agency services to the Company and its homebuyers in Colorado, Florida, Maryland, Nevada, Pennsylvania and Virginia.
Human Capital Resources
The table below summarizes the approximate number of employees for our combined Homebuilding, combined Financial Services and Corporate segments at December 31, 2023 and 2022. | | | | | | | | | | | |
| December 31, |
| 2023 | | 2022 |
| Homebuilding | 1,305 | | | 1,200 | |
| Financial Services | 208 | | | 205 | |
| Corporate | 247 | | | 238 | |
| Total | 1,760 | | | 1,643 | |
We believe our employees are one of our greatest assets and our Company is made up of diverse, talented and dedicated employees working together to achieve common and rewarding goals. We value integrity, hard work, dedication, energy and teamwork. Our goal is to promote an environment where employees are encouraged to do their best work with high professional standards, team collaboration and customer excellence.
At MDC we are committed to fostering a diverse and inclusive workplace. Our management teams and all of our employees are expected to exhibit and promote honest, ethical and respectful conduct in the workplace. We have implemented and maintained a corporate compliance program to provide guidance for everyone associated with the Company, including its employees, officers and directors (the "Code"). Annual review of the Code is required and it, in summary, prohibits unlawful or unethical activity, including discrimination, and directs our employees, officers, and directors to avoid actions that, even if not unlawful or unethical, might create an appearance of illegality or impropriety. In addition, the Code includes required annual training on preventing, identifying, reporting and stopping any type of unlawful discrimination.
We recognize that we are in a competitive marketplace when it comes to finding top talent. Our leaders across all levels of the organization consistently review their business metrics to determine appropriate workforce planning goals. We offer a variety of career paths for our employees; which includes consistent training and development through online resources, job shadowing, mentoring, etc. Our employees may participate in a robust benefits program, which includes a focus on health and wellness, and we offer a variety of other employee perks. We believe our compensation packages and benefits are competitive with others in our industry. We are committed to consistently evaluating total compensation across all positions within the Company.
As we look to the future, we will continue to leverage the core principles and practices that contributed to our past achievements, while welcoming new perspectives that allow our organization to evolve with the changing economic landscape. We will maintain our commitment to quality craftsmanship, providing excellent customer service, hiring from within when possible and fostering an internal culture that supports collaboration and teamwork as well as work-life balance.
(e) Available Information
We make our Annual Report on Form 10-K, Quarterly Reports on Form 10-Q, Current Reports on Form 8-K and amendments to those reports filed or furnished pursuant to Section 13(a) or 15(d) of the Securities Exchange Act of 1934, available free of charge on our website as soon as reasonably practicable after we file or furnish the materials electronically with the Securities and Exchange Commission (“SEC”). To obtain any of this information, go to our website, www.mdcholdings.com, and select “SEC Filings” from the menu. Our website includes our: (1) Corporate Governance Guidelines; (2) Corporate Code of Conduct; (3) Rules for Senior Financial Officers; (4) Audit Committee Procedures for Handling Confidential Complaints; (5) charters for the Audit, Compensation, Legal and Corporate Governance/Nominating Committees; (6) Director Standards of Independence; and (7) Lead Director Description. These materials may be obtained, free of charge, at www.mdcholdings.com (select “Governance”).
Item 1A. Risk Factors.
Public health issues such as a pandemic or epidemic could harm business and results of operations of the Company.
Demand for our homes is dependent on a variety of macroeconomic factors, such as employment levels, availability of financing for homebuyers, interest rates, consumer confidence and spending, wage growth and inflation, household formations, levels of new and existing homes for sale, cost of land, labor and construction materials, demographic trends and housing demand. These factors, in particular consumer confidence, can be significantly and adversely affected by a variety of factors beyond our control. Specifically, an epidemic, pandemic, or similar public health issue could significantly disrupt us from operating our business in the ordinary course for an extended period, and thereby, along with associated economic and/or consumer confidence instability, have a material adverse impact on our financial position, results of operations and cash flows.
For example, the COVID-19 pandemic continues to affect the global economy. The effects of the pandemic contributed to disrupting our supply chain, which has resulted in shortages of certain building materials and tightness in the labor market. There is still significant uncertainty as a result of the pandemic and its continuing potential to negatively impact the U.S. economy. The degree to which the pandemic will impact our financial results in the coming periods depends on future developments that are highly uncertain, including whether there are additional outbreaks of COVID-19 and related variants and the actions taken to contain or address the virus. If the pandemic continues to cause significant negative impacts to the U.S. economy and consumer confidence, our results of operations, financial condition and cash flows could be significantly and adversely impacted.
Changes in general economic, real estate and other business conditions may have an adverse effect on the homebuilding and mortgage industries, which could have a negative impact on our business.
The homebuilding industry is cyclical and is significantly affected by changes in industry conditions, the national political environment and general economic conditions such as:
•employment levels;
•availability of financing for homebuyers;
•interest rates;
•consumer confidence and spending;
•wage growth;
•inflation;
•household formations;
•levels of new and existing homes for sale;
•cost of land, labor and construction materials;
•demographic trends; and
•housing demand.
These conditions may exist on a national level or may affect some of the regions or markets in which we operate more than others. When adverse conditions affect any of our larger markets, they could have a proportionately greater impact on us than on some other homebuilding companies.
Changes to monetary policy or other actions by the Federal Reserve could have an adverse effect on interest rates (including mortgage interest rates), equity markets and consumer confidence. Adverse effects could cause and have caused us to experience declines in the market value of our inventory and the demand for our homes, resulting in a negative impact to our financial position, results of operations and cash flows.
An oversupply of alternatives to new homes, including foreclosed homes, homes held for sale or rent by investors and speculators, other existing homes, and rental properties, can also reduce our ability to sell new homes, depress new home prices and reduce our margins on the sale of new homes. High levels of foreclosures and short-sales not only contribute to additional inventory available for sale, but also can reduce appraisal valuations for new homes, potentially resulting in lower sales prices.
Terrorist attacks, acts of war, other acts of violence or threats to national security, and any corresponding response by the United States or others, or related domestic or international instability, may adversely affect general economic conditions or cause a slowdown of the economy.
As a result of the foregoing matters, potential customers may be less willing or able to buy our homes. In the future, our pricing strategies may be limited by market conditions. We may be unable to change the mix of our home offerings, reduce the costs of the homes we build or offer more affordable homes to maintain our gross margins or satisfactorily address changing market conditions in other ways. In addition, cancellations of home sales contracts in backlog may increase as homebuyers choose to not honor their contracts.
Additionally, the factors discussed above may increase our counterparty risk, which may include, among others, banks under our credit facilities and mortgage purchasers who may not be willing or able to perform on obligations to us. To the extent a third-party is unable or unwilling to meet its obligations, our financial position, results of operations and cash flows could be negatively impacted.
Our mortgage operations are closely related to our homebuilding business, as HomeAmerican originates mortgage loans principally to purchasers of the homes we build. Therefore, a decrease in the demand for our homes because of the preceding matters may also adversely affect the financial results of this segment of our business. Furthermore, any adverse changes in the economic conditions discussed previously could increase the default rate on the mortgages we originate, which may adversely affect our ability to sell the mortgages, the pricing we receive upon the sale of mortgages, or our potential exposure to recourse regarding mortgage loan sales.
These challenging conditions are complex and interrelated. We cannot predict their occurrence or severity, nor can we provide assurance that our responses would be successful.
Increased competition levels in the homebuilding and mortgage lending industries could have a negative impact on our homebuilding and mortgage operations.
The homebuilding industry is fragmented and highly competitive. Our homebuilding subsidiaries compete with numerous public and private homebuilders, including a number that are substantially larger than us and may have greater financial resources than we do. Our homebuilding subsidiaries also compete with subdivision developers and land development companies, some of which are themselves homebuilders or affiliates of homebuilders. Homebuilders compete for customers, land, building materials, subcontractor labor and desirable financing. Competition for home orders is based primarily on home sales price, location of property, home style, financing available to prospective homebuyers, quality of homes built, customer service and general reputation in the community, and may vary market-by-market and/or submarket-by-submarket. Additionally, competition within the homebuilding industry can be impacted by an excess supply of new and existing homes available for sale resulting from a number of factors, including, among other things, increases in the number of new home communities, increases in speculative homes available for sale and increases in home foreclosures. Increased competition can result in a decrease in our net new home orders, a decrease in our home sales prices and/or an increase in our home sales incentives in an effort to generate new home sales and maintain homes in backlog until they close. These competitive pressures may negatively impact our financial position, results of operations and cash flows.
Our mortgage lending subsidiary, HomeAmerican, experiences competition from numerous banks and other mortgage bankers and brokers, many of which are larger and may have greater financial resources. As a result, these competitors may be able to offer better pricing and/or mortgage loan terms, more relaxed underwriting criteria and a greater range of products, which could negatively impact the financial position, results of operations and cash flows of our mortgage operations.
If land is not available at reasonable prices or terms, we could be required to scale back our operations in a given market and/or we may operate at lower levels of profitability.
Our operations depend on our homebuilding subsidiaries’ ability to obtain land for the development of our residential communities at reasonable prices and with terms that meet our underwriting criteria. Our ability to obtain land for new residential communities may be adversely affected by changes in the general availability of land, the willingness of land sellers to sell land at reasonable prices, competition for available land, availability of financing to acquire land, zoning, regulations that
limit housing density, and other market conditions. If the supply of land, and especially finished lots, appropriate for development of residential communities is limited because of these factors, or for any other reason, the number of homes that our homebuilding subsidiaries build and sell may decline. To the extent that we are unable to purchase land timely or enter into new contracts for the purchase of land at reasonable prices, due to the lag time between the time we acquire land and the time we begin selling homes, we may be required to scale back our operations in a given market and/or we may operate at lower levels of profitability. As a result, our financial position, results of operations and cash flows could be negatively impacted.
Supply shortages and other risks related to the demand for skilled labor and building materials could continue to increase costs and delay deliveries.
The residential construction industry experiences price fluctuations and shortages in labor and materials from time to time. Shortages in labor can be due to: competition for labor, work stoppages, labor disputes, shortages in qualified trades people, lack of availability of adequate utility infrastructure and services, or our need to rely on local subcontractors who may not be adequately capitalized or insured. Labor and material shortages can be more severe during periods of strong demand for housing or during periods in which the markets where we operate experience natural disasters that have a significant impact on existing residential and commercial structures. Additionally, we could experience labor shortages as a result of subcontractors going out of business or leaving the residential construction market due to low levels of housing production and volumes. Pricing for labor and materials can be affected by the factors discussed above, changes in energy prices, and various other national, regional and local economic factors. In addition, environmental and other regulations and import tariffs and trade restrictions have had, and in the future could continue to have, an adverse impact on the cost of certain raw materials such as lumber. Recalls of materials driven by manufacturing defects can drive shortages in materials and delay the delivery of homes. Any of these circumstances could give rise to delays in the start or completion of our residential communities, increase the cost of developing one or more of our residential communities and/or increase the construction cost of our homes.
We generally are unable to pass on increases in construction costs on build-to-order homes to customers who have already entered into sales contracts, as those sales contracts fix the price of the homes at the time the contracts are signed, which generally is in advance of the construction of the home. With our increase in the number of spec homes due to spec construction starts, we may see an increase in our ability to pass on increases in construction costs to customers should market conditions permit. To the extent that market conditions prevent the recovery of increased costs, including, among other things, subcontracted labor, finished lots, building materials, and other resources, through higher selling prices, our financial position, cash flows and operating results, including our gross margin from home sales, could be negatively impacted.
If mortgage interest rates continue to rise, if down payment requirements are increased, if loan limits are decreased, or if mortgage financing otherwise becomes less available, it could adversely affect our business.
Mortgage liquidity influenced by governmental entities like the FHA, VA, USDA and Ginnie Mae or government-sponsored enterprises (“GSEs”) like Fannie Mae and Freddie Mac continue to be an important factor in marketing our homes. Financial losses or other factors may limit, restrict or otherwise curtail their ability or willingness to insure mortgage loans, offer insurance at rates and on terms that are not prohibitive, or purchase mortgage loans. Should this occur, it may negatively impact the availability of mortgage financing and our sales of new homes.
We believe that the liquidity provided by Fannie Mae, Freddie Mac and Ginnie Mae to the mortgage industry has been very important to the housing market. Any reduction in the availability of the liquidity provided by these institutions could adversely affect interest rates, mortgage availability and our sales of new homes and mortgage loans.
Loans sold to or insured by the GSEs are subject to various loan limits. Decreases in these loan limits may require homebuyers to make larger down payments or obtain more restrictive non-conforming or “jumbo” mortgages, which could adversely impact on our financial position, results of operations and cash flows.
Even if potential customers do not need financing, changes in the availability of mortgage products may make it harder for them to sell their current homes to potential buyers who need financing.
If interest rates continue to increase, the costs of owning a home may continue to be affected and could result in further reductions in the demand for our homes. During fiscal 2022 and into 2023, the increase in mortgage interest rates had a significant impact on the demand for our homes.
Changes to tax laws, incentives or credits currently available to our customers may negatively impact our business.
Many homeowners receive substantial tax benefits in the form of tax deductions against their personal taxable income for mortgage interest and property tax payments and the loss or reduction of these deductions could affect homeowners’ net cost of owning a home. Significant changes to existing tax laws, such as the ability to deduct mortgage interest and real property taxes, may result in an increase in the total cost of home ownership and may make the purchase of a home less attractive to buyers. This could adversely impact demand for and/or sales prices of new homes, which would have a negative impact on our business.
A decline in the market value of our homes or carrying value of our land could continue to have a negative impact on our business.
Our homebuilding subsidiaries acquire land for the replacement of land inventory and/or expansion within our current markets and may, from time to time, purchase land for expansion into new markets. The fair value of our land and land under development inventory and housing completed or under construction inventory depends on market conditions. Factors that can impact our determination of the fair value of our inventory primarily include home sale prices, levels of home sale incentives and home construction and land costs. Our home sale prices and/or levels of home sale incentives can be impacted by, among other things, uncertainty in the homebuilding and mortgage industries or the United States/global economy overall, decreased demand for new homes, decreased home prices offered by our competitors, home foreclosure and short-sale levels, decreased ability of our homebuyers to obtain suitable mortgage loan financing and high levels of home order cancellations. Under such circumstances, we may be required to record impairments of our inventory. Any such inventory impairments would have a negative impact on our financial position and results of operations. During fiscal 2022 and into 2023, the increase in mortgage interest rates had a significant impact on the homebuilding industry causing home sale prices to decrease and home sale incentives to increase across the industry. This has resulted in inventory impairments in certain of our communities due to the decline in the market value of our housing completed or under construction and land and land under development inventory.
Natural disasters could cause an increase in home construction costs, as well as delays, and could negatively impact our business.
The climates and geology of many of the markets in which we operate present increased risks of natural disasters. To the extent that hurricanes, severe storms, earthquakes, droughts, floods, heavy or prolonged precipitation, wildfires or other natural disasters or similar events occur, the financial position, results of operations and cash flows of our business may be negatively impacted.
Changes in energy pricesor regulationsmay have an adverse effect on our cost of building homes.
Some of the markets in which we operate are impacted by regulations related to energy, such as setbacks required from oil / gas drilling operations or restrictions on the use of land. To the extent that these regulations are modified, the value of land we already own or the availability of land we are looking to purchase may decline, which may adversely impact the financial position, results of operations and cash flows of our business. Furthermore, pricing offered by our suppliers and subcontractors can be adversely affected by increases in various energy costs resulting in a negative impact to our financial position, results of operations and cash flows of our business.
We have financial needs that we meet through the capital markets, including the debt and secondary mortgage markets, and disruptions in these markets could have an adverse impact on the results of our business.
We have financial needs that we meet through the capital markets, including the debt and secondary mortgage markets. Our requirements for additional capital, whether to finance operations or to service or refinance our existing indebtedness, fluctuate as market conditions and our financial performance and operations change. We cannot provide assurance that we will maintain cash reserves and generate sufficient cash flow from operations in an amount to enable us to service our debt or to fund other liquidity needs.
The availability of additional capital, whether from private capital sources or the public capital markets, fluctuates as our financial condition and market conditions in general change. There may be times when the private capital markets and the public debt or equity markets lack sufficient liquidity or when our securities cannot be sold at attractive prices, in which case we would not be able to access capital from these sources. Additionally, any reduction in our credit ratings and/or a weakening of our financial condition, could adversely affect our ability to obtain necessary funds. Even if financing is available, it could be costly or have other adverse consequences.
In addition, the sources and terms and conditions of our mortgage repurchase facility are subject to change. These changes may impact, among other things, availability of capital, cost of borrowings, collateral requirements and collateral advance rates.
Our business is subject to numerous federal, state and local laws and regulations concerning land development, construction of homes, sales, mortgage lending, environmental and other aspects of our business. These laws and regulations could give rise to additional liabilities or expenditures, or restrictions on our business.
Our operations are subject to continuing compliance requirements mandated by applicable federal, state and local statutes, ordinances, rules and regulations, including zoning and land use ordinances, building, plumbing and electrical codes, contractors’ licensing laws, state insurance laws, federal and state human resources laws and regulations, and health and safety laws and regulations. Various localities in which we operate have imposed (or may impose in the future) fees on developers to fund schools, road improvements and low and moderate-income housing.
Availability of and costs related to permit, water/sewer tap, and impact fees can impact our homebuilding operations. From time to time, various municipalities in which our homebuilding subsidiaries operate restrict or place moratoria on the availability of utilities, including water and sewer taps. Additionally, certain jurisdictions in which our homebuilding subsidiaries operate have proposed or enacted “slow growth” or “no growth” initiatives and other measures that may restrict the number of building permits available in any given year. These initiatives or other similar measures could reduce our ability to open new subdivisions and build and sell homes in the affected markets. The availability issues previously discussed and any increases in costs of these fees may negatively impact our financial position, results of operations and cash flows.
Our homebuilding operations also are affected by regulations pertaining to availability of water, municipal sewage treatment capacity, land use, dust controls, oil and gas operations, building materials, population density and preservation of endangered species, natural terrain and vegetation.
We are subject to growing local, state and federal statutes, ordinances, rules and regulations concerning the protection of public health and the environment. These include regulating the emission or discharge of materials into the environment such as greenhouse gas emissions, storm water runoff, the handling, use, storage and disposal of hazardous substances, and impacts to wetlands and other sensitive environments. These restrictions and requirements could increase our operating costs and require additional capital investment, which could negatively impact our financial position, results of operations and cash flows. Further, we have extensive operations in the western United States, where some of the most extensive environmental laws and building construction standards in the country have been enacted. We believe we are in compliance in all material respects with existing governmental environment restrictions, standards and regulations applicable to our business, and such compliance has not had a material impact on our business. Given the emerging and rapid changes of environmental laws and other matters that may arise that are not currently known, we cannot predict our future exposure, and our future costs to achieve compliance or remedy potential violations could be significant.
The particular environmental laws and regulations that apply to any given homebuilding project vary greatly according to a particular site’s location, the site’s environmental conditions and the present and former uses. These environmental laws may result in project delays, cause us to incur substantial compliance and other costs and/or prohibit or severely restrict homebuilding activity in certain environmentally sensitive locations. Environmental laws and regulations may also have a negative impact on the availability and price of certain raw materials, such as lumber.
Our revolving credit facility contains representations regarding anti-corruption and sanctions laws, a violation of which could result in an event of default.
We also are subject to rules and regulations with respect to originating, processing, selling and servicing mortgage loans, which, among other things: prohibit discrimination and establish underwriting guidelines; provide for audits and inspections; require appraisals and/or credit reports on prospective borrowers and disclosure of certain information concerning credit and settlement costs; establish maximum loan amounts; prohibit predatory lending practices; and regulate the referral of business to affiliated entities.
The regulatory environment for mortgage lending is complex and ever changing and has led to an increase in the number of audits and examinations in the industry. These examinations can include consumer lending practices, sales of mortgages to financial institutions and other investors and the practices in the financial services segments of homebuilding companies. New rules and regulations or revised interpretations of existing rules and regulations applicable to our mortgage lending operations could result in more stringent compliance standards, which may substantially increase costs of compliance.
In the ordinary course of business, we are required to obtain surety bonds, the unavailability of which could adversely affect our business.
As is customary in the homebuilding industry, we often are required to provide surety bonds to secure our performance under construction contracts, development agreements and other arrangements. Our ability to obtain surety bonds primarily depends upon our credit rating, capitalization, working capital, past performance, management expertise and certain external factors, including the overall capacity of the surety market and the underwriting practices of surety bond issuers. The ability to obtain surety bonds also can be impacted by the willingness of insurance companies to issue surety bonds. If we are unable to obtain surety bonds when required, our financial position, results of operations and cash flows could be adversely impacted.
Product liability litigation and warranty claims that arise in the ordinary course of business may be costly.
As a homebuilder, we are subject to construction defect and home warranty claims, as well as claims associated with the sale and financing of our homes arising in the ordinary course of business. These types of claims can be costly. The costs of insuring against or directly paying for construction defect and product liability claims can be high and the amount of coverage offered by insurance companies may be limited. If we are not able to obtain adequate insurance against these claims, we may incur additional expenses that would have a negative impact on our results of operations in future reporting periods. Additionally, changes in the facts and circumstances of our pending litigation matters could have a material impact on our financial position, results of operations and cash flows.
Repurchase requirements associated with HomeAmerican’s sale of mortgage loans, could negatively impact our business.
We are subject to risks associated with mortgage loans, including conventional mortgage loans, FHA and VA mortgage loans, second mortgage loans, high loan-to-value mortgage loans and jumbo mortgage loans (mortgage loans with principal balances that exceed various thresholds in our markets). These risks may include, among other things, compliance with mortgage loan underwriting criteria and the associated homebuyers’ performance, which could require HomeAmerican to repurchase certain of those mortgage loans or provide indemnification. Repurchased mortgage loans and/or the settlement of claims associated with such loans could have a negative impact on HomeAmerican’s financial position, results of operations and cash flows.
Because of the seasonal nature of our business, our quarterly operating results can fluctuate.
We may experience noticeable seasonality and quarter-to-quarter variability in homebuilding activity levels. In general, the number of homes delivered and the associated home sale revenues increase during the third and fourth quarters, compared with the first and second quarters. We believe that this type of seasonality reflects the historical tendency of homebuyers to purchase new homes in the spring and summer with deliveries scheduled in the fall or winter, as well as the scheduling of construction to accommodate seasonal weather conditions in certain markets.
We are dependent on the services of key employees, and the loss of their services could hurt our business.
Although we believe that we have made provision for adequately staffing current operations, because of competition for experienced homebuilding industry personnel, retaining our skilled people is an important area of focus. Our future success depends, in part, on our ability to attract, train and retain skilled personnel. If we are unable to retain our key employees or attract, train and retain other skilled personnel in the future, it could have an adverse impact on our financial position, results of operations and cash flows.
The interests of certain controlling stockholders may be adverse tootherinvestors
Larry A. Mizel and David D. Mandarich beneficially own, directly or indirectly through their affiliates, in the aggregate, approximately 21.2% of our common stock. To the extent they and their affiliates vote their shares in the same manner, their combined stock ownership may effectively give them the power to influence the election of members of our board of directors and other matters reserved for our stockholders.
On January 17, 2024, in connection with the Company’s execution of the Merger Agreement, Mr. Larry Mizel, Mr. David Mandarich and certain of Mr. Mizel’s affiliates and estate planning vehicles (the “Specified Company Stockholders”) entered into a Voting Agreement (the “Voting Agreement”) with Parent, pursuant to which the Specified Company Stockholders have agreed, among other things, to vote their shares of common stock in favor of the adoption of the Merger Agreement and the approval of the Merger and any other matters that would reasonably be expected to facilitate the Merger and against, among other things, any other action, proposal or transaction that is intended, or would reasonably be expected, to
impede, interfere with, delay, postpone, discourage or prevent the consummation of, or otherwise adversely affect, the Merger or any of the other transactions contemplated by the Merger Agreement or Voting Agreement. The Voting Agreement also includes certain restrictions on transfer of shares of common stock by such Specified Company Stockholders. The Voting Agreement will automatically terminate upon certain events, including the termination of the Merger Agreement.
Information technology failures and cybersecurity breaches could harm our business.
We use information technology and other computer resources to carry out important operational activities and to maintain our business records. These information technology systems are dependent upon electronic systems and other aspects of the internet infrastructure. A material breach in the security of our information technology systems or other data security controls could result in third parties obtaining or corrupting customer, employee or company data. To date, we have not had a material breach of data security, however such occurrences could have a material and adverse effect on our financial position, results of operations and cash flows.
Financial industry turmoil could materially and adversely affect our liquidity and consolidated financial statements.
The banking industry has experienced certain bank failures and other turmoil in 2023. The failure of other banks or financial institutions, if it occurs, could have a material adverse effect on our liquidity or consolidated financial statements if we have placed cash or other deposits at such banks or financial institutions, or if such banks or financial institutions, or any substitute or additional banks or financial institutions, participate in our Revolving Credit Facility. Under our Revolving Credit Facility, non-defaulting lenders are not obligated to cover or acquire a defaulting lender’s respective commitment to fund loans or to issue letters of credit and may be unwilling to issue additional letters of credit if we do not enter into arrangements to address the risk with respect to the defaulting lender (which may include cash collateral). If the non-defaulting lenders are unable or unwilling to cover or acquire a defaulting lender’s respective commitment, we may not be able to access the Revolving Credit Facility’s full borrowing or letter of credit capacity to support our business needs. In addition, if a buyer under our Mortgage Repurchase Facility, which is used to fund mortgage originations, fails or is unable or unwilling to fulfill its obligations, HomeAmerican may be limited in its ability to provide mortgage loans to our homebuyers, which may prevent them from closing on their homes at the time expected or at all.
Our By-laws designate the Court of Chancery of the State of Delaware, subject to certain exceptions, as the sole and exclusive forum for certain types of actions and proceedings that may be initiated by our stockholders and designate the federal district courts of the United States as the exclusive forum for actions arising under the Securities Act of 1933, as amended, which could limit our stockholders’ ability to obtain a favorable judicial forum for disputes with us or our directors, officers or employees.
Our By-laws, as amended, designate the Court of Chancery of the State of Delaware, to the fullest extent permitted by law, as the sole and exclusive forum for (a) any derivative action or proceeding brought on behalf of the Company, (b) any action asserting a claim of breach of a fiduciary duty owed by any current or former director, officer, or other employee or agent of the Company to the Company or its stockholders, or a claim of aiding and abetting any such breach of fiduciary duty, (c) any action asserting a claim arising pursuant to any provision of the DGCL, the Company’s Amended and Restated Certificate of Incorporation or the By-laws, (d) any action to interpret, apply, enforce or determine the validity of the Company’s Amended and Restated Certificate of Incorporation or By-laws, or (e) any action asserting a claim governed by the internal affairs doctrine. If the Court of Chancery of the State of Delaware lacks jurisdiction over such action or proceeding, the sole and exclusive forum for such action or proceeding shall be another court of the State of Delaware or, if no court of the State of Delaware has jurisdiction, then the federal district court for the District of Delaware. In addition, the By-laws provide that the federal district courts of the United States are the sole and exclusive forum for any complaint raising a cause of action arising under the Securities Act of 1933, as amended.
Any person or entity purchasing or otherwise acquiring any interest in shares of our capital stock shall be deemed to have notice of and to have consented to the provisions of our By-laws described above. In addition, to the fullest extent permitted by law, any person who, or entity that, holds, purchases or otherwise acquires an interest in stock of the Company shall be deemed to have consented to the personal jurisdiction of the Court of Chancery of the State of Delaware (or if the Court of Chancery does not have jurisdiction, another court of the State of Delaware, or if no court of the State of Delaware has jurisdiction, the federal district court for the District of Delaware) in any proceeding brought to enjoin any action by that person or entity that is inconsistent with the exclusive jurisdiction provided for in our By-Laws. To the fullest extent permitted by applicable law, if any action the subject matter of which is within the scope of the exclusive forum provisions in our By-Laws is filed in a court other than as specified above in the name of any stockholder, such stockholder shall be deemed to have consented to (a) the personal jurisdiction of the Court of Chancery of the State of Delaware, another court in the State of Delaware or the federal district court in the District of Delaware, as appropriate, in connection with any action brought in any such court to enforce the exclusive forum provisions of our By-Laws and (b) having service of process made upon such stockholder in any such action by service upon such stockholder’s counsel in the action as agent for such stockholder.
These choice of forum provisions may limit a stockholder’s ability to bring a claim in a judicial forum that it finds favorable for disputes with us or our directors, officers or employees, which may discourage such lawsuits against us and our directors, officers and employees. Alternatively, if a court were to find these provisions of our By-laws inapplicable to, or unenforceable in respect of, one or more of the specified types of actions or proceedings, we may incur additional costs associated with resolving such matters in other jurisdictions, which could adversely affect our business and financial condition.
Risks Related to the Merger
The Merger is subject to receipt of approval from our stockholders as well as the satisfaction of other closing conditions, including conditions that may not be satisfied or completed within the expected timeframe, if at all.
The consummation of the Merger is subject to a number of important closing conditions that make the closing and timing of the Merger uncertain. These conditions include, among others, the (i) affirmative vote of the holders of a majority of all of the outstanding shares of common stock to adopt the Merger Agreement; (ii) expiration or termination of any waiting period (and extensions thereof) applicable to the transactions contemplated by the Merger Agreement, including the Merger, under the Hart-Scott-Rodino Antitrust Improvements Act of 1976, as amended, and the rules and regulations promulgated thereunder; (iii) absence of any law, order or injunction enacted or issued after the date of the Merger Agreement restraining, enjoining or otherwise prohibiting the Merger; and (iv) absence of certain events constituting a material adverse effect on the Company’s business following the date of the Merger Agreement. We can provide no assurance that all required consents and approvals will be obtained or that all closing conditions will otherwise be satisfied (or waived, if applicable), and, if all required consents and approvals are obtained and all closing conditions are satisfied (or waived, if applicable), we can provide no assurance as to the terms, conditions and timing of such consents and approvals or the timing of the completion of the Merger. Many of the conditions to completion of the Merger are not within either our or Parent’s control, and neither us nor Parent can predict when or if these conditions will be satisfied (or waived, if applicable).
Each party’s obligation to consummate the Merger is also subject to the accuracy of the representations and warranties of the other party (subject to customary materiality qualifications) and compliance in all material respects with the covenants and agreements contained in the Merger Agreement as of the closing of the Merger, including, with respect to us, covenants to conduct our business in the ordinary course and to not engage in certain kinds of material transactions prior to closing.
Failure to complete the Merger in a timely manner, or at all, could negatively impact our future business and our financial condition, results of operations and cash flows.
The Merger may not be completed within the expected timeframe, or at all, as a result of various factors and conditions, some of which may be beyond our control. If the Merger is not completed for any reason, including as a result of our stockholders failing to adopt the Merger Agreement, our stockholders will not receive any payment for their shares in connection with the Merger. Instead, the Company will remain an independent public company, and its shares will continue to be traded on the New York Stock Exchange and registered under the Securities Exchange Act of 1934, as amended, and we will be required to continue to file periodic reports with the SEC. Moreover, our ongoing business may be materially adversely affected and we would be subject to a number of risks, including the following:
•we may experience negative reactions from the financial markets, including negative impacts on our stock price, and it is uncertain when, if ever, the price of the shares would return to the prices at which the shares currently trade;
•we may experience negative publicity, which could have an adverse effect on our ongoing operations including, but not limited to, retaining and attracting employees, customers, partners, suppliers and others with whom we do business;
•we will still be required to pay certain significant costs relating to the Merger, such as legal, accounting, financial advisor, printing and other professional services fees, which may relate to activities that we would not have undertaken other than in connection with the Merger;
•we may be required to pay a cash termination fee to Parent, as required under the Merger Agreement under certain circumstances;
•while the Merger Agreement is in effect, we are subject to restrictions on the conduct of our business, including restrictions on our ability to engage in certain kinds of material transactions, which could prevent us from pursuing strategic business opportunities, taking actions with respect to our business that we may consider advantageous and responding effectively and/or timely to competitive pressures and industry developments, and may as a result materially adversely affect our business, results of operations and financial condition;
•matters relating to the Merger require substantial commitments of time and resources by our management, which could result in the distraction of management from ongoing business operations and pursuing other opportunities that could have been beneficial to us; and
•litigation related to the Merger or related to any enforcement proceeding commenced against us to perform our obligations under the Merger Agreement.
If the Merger is not consummated, the risks described above may materialize and they may have a material adverse effect on our business operations, financial results and stock price, especially to the extent that the current market price of our common stock reflects an assumption that the Merger will be completed.
We are subject to certain restrictions in the Merger Agreement that may hinder operations pending the consummation of the Merger.
The Merger Agreement generally requires us to operate our business in the ordinary course pending consummation of the Merger and restricts us, without Parent’s consent, from taking certain specified actions until the Merger is completed, subject to certain exceptions. These restrictions may affect our ability to execute our business strategies and attain our financial and other goals and may impact our financial condition, results of operations and cash flows.
These restrictions could be in place for an extended period of time if the consummation of the Merger is delayed, which may delay or prevent us from undertaking business opportunities that, absent the Merger Agreement, we might have pursued, or from effectively responding to competitive pressures or industry developments.
Whether or not the Merger is completed, the pending Merger may disrupt our current plans and operations, which could have an adverse effect on our business and financial results. For these and other reasons, the pendency of the Merger could adversely affect our business and financial results.
We will be subject to various uncertainties while the Merger is pending that may cause disruption and may make it more difficult to maintain relationships with employees, clients, customers, and others with whom we do business.
Our efforts to complete the Merger could cause substantial disruptions in, and create uncertainty surrounding, our business, which may materially adversely affect our results of operation and our business. In connection with the Merger, our current and prospective employees may experience uncertainty about their future roles with the combined company following the Merger, which may materially adversely affect our ability to attract and retain key personnel while the Merger is pending. Key employees may depart because of issues relating to the uncertainty and difficulty of integration or a desire not to remain with the combined company following the Merger. Accordingly, no assurance can be given that we will be able to attract and retain key employees to the same extent that we have been able to in the past. If we do not succeed in attracting, hiring, and integrating excellent personnel, or retaining and motivating existing personnel, we may be unable to grow and operate our business effectively.
As mentioned above, some amount of our management’s and employees’ attention is being directed toward the completion of the Merger and thus is being diverted from our day-to-day operations. The Merger further could cause disruptions to our business or business relationships, which could have an adverse impact on our results of operations. Parties with which we have business relationships may experience uncertainty as to the future of such relationships and may delay or defer certain business decisions, seek alternative relationships with third parties or seek to alter their present business relationships with us. Parties with whom we otherwise may have sought to establish business relationships may seek alternative relationships with third parties. The pursuit of the Merger and the preparation for the integration may also place a significant burden on management and internal resources. The diversion of management’s attention away from day-to-day business concerns could adversely affect our financial results.
The Merger Agreement contains provisions that could discourage a third party from making a competing acquisition proposal.
The Merger Agreement contains certain customary restrictions on our ability to solicit proposals from third parties for an acquisition of the Company prior to obtaining the approval of the Merger Agreement from our stockholders. In addition, subject to certain customary “fiduciary out” exceptions, the Board is required to recommend that our stockholders vote in favor of the approval of the Merger, the Merger Agreement and the transactions contemplated thereby.
We may, under certain circumstances, be obligated to pay a termination fee to Parent and/or reimburse Parent for its expenses. These costs could require us to use cash that would have otherwise been available for other uses.
These provisions might discourage an otherwise-interested third party from considering or proposing an acquisition of the Company, including proposals that may be deemed to offer greater value to our stockholders than as provided in the Merger Agreement. Furthermore, even if a third party elects to propose an acquisition, the requirement that we must pay a termination fee to accept any such proposal may cause that third party to offer a lower price to our stockholders than such third party might otherwise have offered.
In certain instances, the Merger Agreement requires us to pay a termination fee to Parent, which could affect the decisions of a third party considering making an alternative acquisition proposal.
Under the terms of the Merger Agreement, we may be required to pay Parent a termination fee under specified conditions, including in the event Parent terminates the Merger Agreement before receipt of our stockholders’ approval due to a change in recommendation by our Board of Directors, in the event we terminate the Merger Agreement to enter into an alternative acquisition agreement providing for a superior proposal, or in the event we enter into a definitive agreement providing for or consummate an alternative transaction within twelve months of termination of the Merger Agreement in certain
circumstances. This payment could affect the structure, pricing and terms proposed by a third party seeking to acquire or merge with us and could discourage a third party from making a competing acquisition proposal, including a proposal that may be deemed to offer greater value to our stockholders than the Merger.
We have incurred, and will continue to incur, direct and indirect costs as a result of the Merger.
We have incurred, and will continue to incur, significant costs and expenses, including regulatory costs, fees for professional services and other transaction costs in connection with the Merger, for which we will have received little or no benefit if the Merger is not completed. There are a number of factors beyond our control that could affect the total amount or the timing of these costs and expenses. Many of these fees and costs will be payable by us even if the Merger is not completed and may relate to activities that we would not have undertaken other than to complete the Merger.
Litigation challenging the Merger Agreement may prevent the Merger from being consummated within the expected timeframe or at all.
Lawsuits may be filed against us, our Board of Directors or other parties to the Merger Agreement, challenging our acquisition by Parent or making other claims in connection therewith. Such lawsuits may be brought by our purported stockholders and may seek, among other things, to enjoin consummation of the Merger. One of the conditions to the consummation of the Merger is that the consummation of the Merger is not restrained, made illegal, enjoined or prohibited by any order or legal or regulatory restraint or prohibition of a court of competent jurisdiction or any governmental entity. As such, if the plaintiffs in such potential lawsuits are successful in obtaining an injunction prohibiting the defendants from completing the Merger on the agreed upon terms, then such injunction may prevent the Merger from becoming effective, or from becoming effective within the expected timeframe.
Item 1B. Unresolved Staff Comments.
None.
Item 1C. Cybersecurity.
The Company understands the importance of preventing, assessing, identifying, and managing material risks associated with cybersecurity threats. Cybersecurity processes to assess, identify and manage risks from cybersecurity threats have been incorporated as a part of the Company’s overall risk assessment process. On a regular basis we implement into our operations these cybersecurity processes, technologies, and controls to assess, identify, and manage material risks. Specifically, we engage a third-party cybersecurity firm to assist with network and endpoint monitoring, cloud system monitoring and assessment of our incident response procedures. Further, we employ periodic penetration testing and tabletop exercises to inform our risk identification and assessment of material cybersecurity threats.
To manage our material risks from cybersecurity threats and to protect against, detect, and prepare to respond to cybersecurity incidents, we undertake the below listed activities:
a.Monitor emerging data protection laws and implement changes to our processes to comply;
b.Conduct periodic customer data handling and use requirement training for our employees;
c.Conduct annual cybersecurity management and incident training for employees involved in our systems and processes that handle sensitive data;
d.Conduct regular phishing email simulations for all employees; and
e.Carry cybersecurity risk insurance that provides protection against the potential losses arising from a cybersecurity incident
Our incident response plan coordinates the activities that we and our third-party cybersecurity provider take to prepare to respond and recover from cybersecurity incidents, which include processes to triage, assess severity, investigate, escalate, contain, and remediate an incident, as well as to comply with potentially applicable legal obligations and mitigate brand and reputational damage.
As part of the above processes, we engage with consultants to review our cybersecurity program to help identify areas for continued focus, improvement, and compliance.
Our processes also include assessing cybersecurity threat risks associated with our use of third-party services providers in normal course of business use, including those in our supply chain or who have access to our customer and employee data or our systems. Third-party risks are included within our risk management process discussed above. In addition, we assess cybersecurity considerations in the selection and oversight of our third-party services providers, including due diligence on the third parties that have access to our systems and facilities that house systems and data.
We describe whether and how risks from identified cybersecurity threats have or that are reasonably likely to affect our financial position, results of operations and cash flows, under the heading “Information technology failures and cybersecurity breaches could harm our business” included as part of our Item 1A. Risk Factors of this Annual Report on Form 10-K, which disclosures are incorporated by reference herein.
Our Audit Committee of the Board of Directors is responsible for oversight of our risk assessment, risk management, disaster recovery procedures and cybersecurity risks. Periodically during each year, the Audit Committee receives an overview from our Vice President of IT of our cybersecurity threat risk management and strategy processes, including potential impact on the Company, the efforts of management to manage the risks that are identified and our disaster recovery preparations. Members of the Board of Directors regularly engage in discussions with management on cybersecurity-related news events and discuss any updates to our cybersecurity risk management and strategy programs.
Our cybersecurity risk management and strategy processes, which are discussed in greater detail above, are led by our Vice President of IT. Our Vice President of IT has over 20 years of experience in various roles involving managing information security, developing cybersecurity strategy, and implementing cybersecurity programs. The Vice President of IT is informed about and monitors the prevention, mitigation, detection, and remediation of cybersecurity incidents through their management of the cybersecurity risk management and strategy processes described above, including our incident response plan.
Item 2. Properties.
Our corporate office is located at 4350 South Monaco Street, Denver, Colorado 80237, where we lease all 144,000 square feet of office space in the building. In many of our markets, our homebuilding divisions and other MDC subsidiaries lease additional office space. While we are currently satisfied with the suitability and capacity of our office locations to meet our current business needs, we continue to evaluate them in view of market conditions and the size of our operations.
Item 3. Legal Proceedings.
Because of the nature of the homebuilding business, we and certain of our subsidiaries and affiliates have been named as defendants in various claims, complaints and other legal actions arising in the ordinary course of business, including product liability claims and claims associated with the sale and financing of our homes. In the opinion of management, the outcome of these ordinary course matters will not have a material adverse effect upon our financial condition, results of operations or cash flows.
Item 4. Mine Safety Disclosures.
Not applicable.
PART II
Item 5.Market for Registrant's Common Equity, Related Stockholder Matters and Issuer Purchases of Equity Securities.
At December 31, 2023, we had 507 shareholders of record. The shares of our common stock are traded on the New York Stock Exchange under the trading symbol MDC. On January 25, 2021, the Company declared an 8% stock dividend that was distributed on March 17, 2021 to shareholders of record on March 3, 2021. In accordance with Accounting Standards Codification Topic 260, “Earnings per Share”, weighted-average shares outstanding, and dividends declared per share have been restated for all periods presented to reflect the effect of this stock dividend.
The table below sets forth the cash dividends declared and paid in 2023, 2022 and 2021: | | | | | | | | | | | | | | | | | | | | | | | |
| Date of Declaration | | Date of Payment | | Dividend per Share | | Total Dividends Paid |
| (In thousands) |
| 2023 | | | | | | | |
| First Quarter | 01/23/23 | | 02/22/23 | | $ | 0.50 | | | $ | 36,543 | |
| Second Quarter | 04/17/23 | | 05/24/23 | | 0.50 | | | 36,565 | |
| Third Quarter | 07/24/23 | | 08/23/23 | | 0.55 | | | 41,064 | |
| Fourth Quarter | 10/23/23 | | 11/22/23 | | 0.55 | | | 41,065 | |
| | | | | $ | 2.10 | | | $ | 155,237 | |
| 2022 | | | | | | | |
| First Quarter | 01/24/22 | | 02/23/22 | | $ | 0.50 | | | $ | 35,583 | |
| Second Quarter | 04/26/22 | | 05/25/22 | | 0.50 | | | 35,580 | |
| Third Quarter | 07/26/22 | | 08/24/22 | | 0.50 | | | 35,622 | |
| Fourth Quarter | 10/24/22 | | 11/23/22 | | 0.50 | | | 35,632 | |
| | | | | $ | 2.00 | | | $ | 142,417 | |
| 2021 | | | | | | | |
| First Quarter | 01/25/21 | | 02/24/21 | | $ | 0.37 | | | $ | 25,978 | |
| Second Quarter | 04/26/21 | | 05/26/21 | | 0.40 | | | 28,249 | |
| Third Quarter | 07/26/21 | | 08/25/21 | | 0.40 | | | 28,276 | |
| Fourth Quarter | 10/25/21 | | 11/24/21 | | 0.50 | | | 35,339 | |
| | | | | $ | 1.67 | | | $ | 117,842 | |
The following table provides information about our repurchases of common stock during the Three Months Ended December 31, 2023: | | | | | | | | | | | | | | | | | | | | | | | | | | |
| Period: | | Total Number of Shares Purchased (1) | | Average
Price Paid
Per Share | | Total Number of Shares Purchased as Part of Publicly Announced Plan or Program (2) | | Maximum Number of Shares that may yet be Purchased under the Plan or Program (2) |
| October 1 to October 31, 2023 | | 989 | | | 40.37 | | | — | | | 4,000,000 | |
| November 1 to November 30, 2023 | | — | | | N/A | | — | | | 4,000,000 | |
| December 1 to December 31, 2023 | | — | | | N/A | | — | | | 4,000,000 | |
(1) Represents shares of common stock withheld by us to cover withholding taxes due upon the vesting of restricted stock award shares, at the election of certain holders of nonvested shares, with market value approximating the amount of withholding taxes due.
(2) We are authorized to repurchase up to 4,000,000 shares of our common stock. There were no shares of MDC common stock repurchased under this repurchase program during the years ended December 31, 2023, 2022 or 2021. This repurchase authorization was announced on October 25, 2005 and has no expiration.
Performance Graph
Set forth below is a graph comparing the yearly change in the cumulative total return of MDC's common stock with the cumulative total return of the S&P 500® Stock Index and with that of a peer group of other homebuilders over the five-year period ended December 31, 2023, weighted as of the beginning of that period.
It is assumed in the graph that $100 was invested (1) in our common stock; (2) in the stocks of the companies in the S&P 500® Stock Index; and (3) in the stocks of the peer group companies, just prior to the commencement of the period and that all dividends received within a quarter were reinvested in that quarter. The peer group index is composed of the following companies: Beazer Homes USA, Inc., D.R. Horton, Inc., Hovnanian Enterprises, Inc., KB Home, Lennar Corporation, M/I Homes, Inc., Meritage Homes Corporation, NVR, Inc., PulteGroup, Inc. and Toll Brothers, Inc.
The stock price performance shown on the following graph is not indicative of future price performance.
Item 6. [Reserved]
Item 7. Management's Discussion and Analysis of Financial Condition and Results of Operations.
The following discussion should be read in conjunction with, and is qualified in its entirety by, the Consolidated Financial Statements and Notes thereto included elsewhere in this Annual Report on Form 10-K. This item contains forward-looking statements that involve risks and uncertainties. Actual results may differ materially from those indicated in such forward-looking statements. Factors that may cause such a difference include, but are not limited to, those discussed in “Item 1A, Risk Factors.”This section of this Form 10-K generally discusses 2023 and 2022 items and year-to-year comparisons between 2023 and 2022. Discussions of 2021 items and year-to-year comparisons between 2022 and 2021 that are not included in this Form 10-K can be found in “Management’s Discussion and Analysis of Financial Condition and Results of Operations” in Part II, Item 7 of the Company’s Annual Report on Form 10-K for the fiscal year ended December 31, 2022. | | | | | | | | | | | | | | | | | |
| 2023 | | 2022 | | 2021 |
| (Dollars in thousands, except per share amounts) |
| Homebuilding: | | | | | |
| Home sale revenues | $ | 4,520,296 | | | $ | 5,586,264 | | | $ | 5,102,456 | |
| Home cost of sales | (3,684,487) | | | (4,214,379) | | | (3,924,093) | |
| Inventory impairments | (29,700) | | | (121,875) | | | (1,600) | |
| Total cost of sales | (3,714,187) | | | (4,336,254) | | | (3,925,693) | |
| Gross profit | 806,109 | | | 1,250,010 | | | 1,176,763 | |
| Gross margin % | 17.8 | % | | 22.4 | % | | 23.1 | % |
| Selling, general and administrative expenses | (429,894) | | | (536,395) | | | (493,993) | |
| Loss on debt retirement | — | | | — | | | (23,571) | |
| Interest and other income | 73,567 | | | 10,843 | | | 5,965 | |
| Other income (expense), net | 350 | | | (32,991) | | | (5,476) | |
| Homebuilding pretax income | 450,132 | | | 691,467 | | | 659,688 | |
| | | | | |
| Financial Services: | | | | | |
| Revenues | 122,570 | | | 131,723 | | | 152,212 | |
| Expenses | (62,942) | | | (71,327) | | | (64,477) | |
| Other income (expense), net | 16,345 | | | 7,991 | | | 4,271 | |
| Financial services pretax income | 75,973 | | | 68,387 | | | 92,006 | |
| | | | | |
| Income before income taxes | 526,105 | | | 759,854 | | | 751,694 | |
| Provision for income taxes | (125,100) | | | (197,715) | | | (178,037) | |
| Net income | $ | 401,005 | | | $ | 562,139 | | | $ | 573,657 | |
| | | | | |
| Earnings per share: | | | | | |
| Basic | $ | 5.42 | | | $ | 7.87 | | | $ | 8.13 | |
| Diluted | $ | 5.29 | | | $ | 7.67 | | | $ | 7.83 | |
| | | | | |
| Weighted average common shares outstanding: | | | | | |
| Basic | 73,505,508 | | | 71,035,558 | | | 70,174,281 | |
| Diluted | 75,357,965 | | | 72,943,844 | | | 72,854,601 | |
| | | | | |
| Cash dividends declared per share | $ | 2.10 | | | $ | 2.00 | | | $ | 1.67 | |
| | | | | |
| Cash provided by (used in): | | | | | |
| Operating Activities | $ | 561,630 | | | $ | 905,646 | | | $ | (207,990) | |
| Investing Activities | $ | 469,443 | | | $ | (585,885) | | | $ | (27,679) | |
| Financing Activities | $ | (105,271) | | | $ | (206,125) | | | $ | 335,156 | |
EXECUTIVE SUMMARY
Overview
Industry Conditions and Outlook for MDC*
During 2023, housing market conditions stabilized compared to the more challenging housing market conditions that were present during much of 2022. The majority of 2022 saw housing demand deteriorate as 30-year fixed mortgage rates increased significantly due to the Federal Reserve's aggressive actions to combat inflationary pressures, which caused many buyers to pause and reconsider a home purchase. This resulted in lower gross orders and higher cancellations. In comparison, we saw a much more modest pace of interest rate changes during 2023, which has given consumers the confidence to move forward with their home purchase decision. The housing market continues to see inventory levels that remain undersupplied relative to demand due to (1) the underproduction of new homes over the past decade, and (2) near record low levels of existing home resale inventory as the majority of homeowners with a mortgage have an interest rate below 4%. As a result, our net orders increased 42% during the year ended 2023 as compared to the prior year. Further, supply chain conditions have also normalized to a large degree with average construction build times improving year-over-year.
During 2023, we executed on our strategic pivot to build more speculative inventory, due to a shift in consumer preferences and the ongoing uncertainty around mortgage rates. The demand for our quick move-in homes was strong, with spec homes representing 75% of our gross orders during 2023. During the year we introduced our Curated by the Home GalleryTM concept. These homes include finish details selected by members of our professional design team specific to our home plans. This allows us to capitalize on our design expertise, given our experience with build-to-order homes, to deliver thoughtfully designed homes to quick move-in homebuyers. This pivot to speculative inventory helped reduce cycle times and cancellation activity and in turn drove improved inventory turnover. We ended the year with 13.5 unsold homes under construction, excluding model homes, per active community and just 1.5 completed spec homes per active community.
We believe we are well-positioned to navigate the ever-evolving market conditions given our seasoned leadership team and strong financial position. We ended the quarter with total cash and cash equivalents and marketable securities of $1.72 billion, total liquidity of $2.77 billion and no senior note maturities until 2030. We generated cash flow from operating activities during the year ended December 31, 2023 of $561.6 million and ended the year with a debt-to-capital ratio of 30.7%.
We believe that the underproduction of new homes over the past decade and the constrained supply of existing home resale inventory will benefit the industry over the long term. Further, the Federal Reserve has made more measured adjustments to combat inflation during 2023 versus the aggressive measures taken in 2022. With that said, the current demand for new homes is subject to continued uncertainty due to many factors, including ongoing inflation concerns, the Federal Reserve's efforts to reduce capital in the market and the resulting impact on mortgage interest rates, consumer confidence, the current geopolitical environment and other factors. The potential effect of these factors is highly uncertain and could adversely and materially impact our operations and financial results in future periods.
Proposed Merger*
On January 17, 2024, we entered into the Merger Agreement with Parent, Merger Sub, and solely for purposes of certain provisions specified therein, the Guarantor, providing for the merger of Merger Sub with and into the Company, with the Company continuing as the surviving corporation. The Company has incurred and will incur certain significant costs relating to the Merger, such as legal, accounting, financial advisory, printing and other professional services fees, as well as other customary payments. We currently expect the Merger, which is subject to stockholder and regulatory approvals, and other customary closing conditions, to close in the first half of 2024. See Part I, Item 1 “Business” and Item 1A, “Risk Factors” above.
Results for the Twelve Months EndedDecember 31, 2023
For the year ended December 31, 2023, we reported net income of $401.0 million, or $5.29 per diluted share, a 29% decrease compared to net income of $562.1 million, or $7.67 per diluted share, for the prior year period. Our homebuilding business was the driver of the difference, as pretax income decreased $241.3 million, or 35%. This was slightly offset by both our financial services business, as pretax income increased $7.6 million, or 11%, and our effective tax rate, which decreased to 23.8% during the year ended December 31, 2023 compared to 26.0% in the prior year period. The decrease in homebuilding pretax income was the result of a 19% decrease in home sale revenues and a 460 basis point decrease in gross margin. This decrease in homebuilding pretax income was partially offset by project abandonment expense of $33.1 million and $121.9 million of inventory impairments incurred in the year ended December 31, 2022 compared to $29.7 million of inventory impairments incurred during 2023. This was further offset by an increase in interest and other income to $73.6 million during
the period ended December 31, 2023 compared to $10.8 million during the prior year period. The increase in financial services pretax income was primarily due to our mortgage operations business, driven by a decrease in salary related expenses due to lower headcount, the allocation of revenue from our homebuilding business associated with our financing incentives and an increase in capture rate. This was partially offset by a decrease in closing volume during the period ended December 31, 2023. Our other financial services operations saw an increase in interest income due to increases in both interest rates and our cash and short-term investments year-over-year. The decrease in our effective tax rate was due to a decrease on limitations on deductible executive compensation, as well as an increase in tax windfalls recognized upon the vesting and exercise of equity awards.
* See “Forward-Looking Statements” above.
Homebuilding
Pretax Income(Loss) | | | | | | | | | | | | | | | | | | | | | | | | | | | | | | | | | | | | | | | | | |
| Year Ended December 31, |
| 2023 | | Change | | 2022 | | Change | | 2021 |
| | Amount | | % | | | Amount | | % | |
| (Dollars in thousands) |
| West | $ | 219,560 | | | $ | (193,866) | | | (47) | % | | $ | 413,426 | | | $ | (49,876) | | | (11) | % | | $ | 463,302 | |
| Mountain | 143,838 | | | (101,618) | | | (41) | % | | 245,456 | | | 13,933 | | | 6 | % | | 231,523 | |
| East | 64,222 | | | (62,602) | | | (49) | % | | 126,824 | | | 67,330 | | | 113 | % | | 59,494 | |
| Corporate | 22,512 | | | 116,751 | | | 124 | % | | (94,239) | | | 392 | | | — | % | | (94,631) | |
| Total homebuilding pretax income | $ | 450,132 | | | $ | (241,335) | | | (35) | % | | $ | 691,467 | | | $ | 31,779 | | | 5 | % | | $ | 659,688 | |
Homebuilding pretax income for 2023 was $450.1 million, a decrease of $241.3 million from $691.5 million for the year ended December 31, 2022. The decrease was primarily attributable to a 19% decrease in home sale revenues and a 460 basis point decrease in gross margin from home sales. These decreases were partially offset by project abandonment expense of $33.1 million during the year ended December 31, 2022.
Our West segment experienced a $193.9 million year-over-year decrease in pretax income, as a result of a 13% decrease in home sale revenues and a decrease in gross margin from home sales. Our Mountain segment experienced a $101.6 million decrease in pretax income from the prior year, as a result of an 25% decrease in home sale revenues and a decrease in gross margin from home sales. Our East segment experienced a $62.6 million decrease in pretax income from the prior year, primarily due to a 28% decrease in home sale revenues and a decrease in gross margin from home sales. Our Corporate segment experienced a $116.8 million increase in pretax income, due primarily to an increase in interest income from money market funds, time deposits and marketable securities acquired in the current year and a decrease in stock-based and deferred compensation expense.
Assets | | | | | | | | | | | | | | | | | | | | | | | |
| December 31, | | Change |
| 2023 | | 2022 | | Amount | | % |
| (Dollars in thousands) |
| West | $ | 2,155,357 | | | $ | 2,275,144 | | | $ | (119,787) | | | (5) | % |
| Mountain | 874,031 | | 1,005,622 | | (131,591) | | (13) | % |
| East | 459,078 | | 427,926 | | 31,152 | | 7 | % |
| Corporate | 1,608,726 | | 1,249,370 | | 359,356 | | 29 | % |
| Total homebuilding assets | $ | 5,097,192 | | | $ | 4,958,062 | | | $ | 139,130 | | | 3 | % |
Total homebuilding assets increased 3% from December 31, 2022 to December 31, 2023. Homebuilding assets decreased in our West and Mountain homebuilding operating segments largely due to a decrease in land and land under development as of period-end. Homebuilding assets increased in our East homebuilding operating segment largely due to an increase in housing completed and under construction, partially offset by a decrease in land and land under development as of period end. Corporate assets increased due to an increase in cash and cash equivalents year-over-year.
New Home Deliveries& Home Sale Revenues:
Changes in home sale revenues are impacted by changes in the number of new homes delivered and the average selling price of those delivered homes. Commentary for each of our segments on significant changes in these two metrics is provided below. | | | | | | | | | | | | | | | | | | | | | | | | | | | | | | | | | | | | | | | | | | | | | | | | | | | | | |
| December 31, |
| 2023 | | 2022 | | % Change |
| Homes | | Dollar Value | | Average Price | | Homes | | Dollar Value | | Average Price | | Homes | | Dollar Value | | Average Price |
| (Dollars in thousands) |
| West | 4,821 | | | $ | 2,624,373 | | | $ | 544.4 | | | 5,234 | | | $ | 3,024,056 | | | $ | 577.8 | | | (8) | % | | (13) | % | | (6) | % |
| Mountain | 2,028 | | | 1,267,586 | | | 625.0 | | | 2,616 | | | 1,689,376 | | | 645.8 | | | (22) | % | | (25) | % | | (3) | % |
| East | 1,379 | | | 628,337 | | | 455.6 | | | 1,860 | | | 872,832 | | | 469.3 | | | (26) | % | | (28) | % | | (3) | % |
| Total | 8,228 | | | $ | 4,520,296 | | | $ | 549.4 | | | 9,710 | | | $ | 5,586,264 | | | $ | 575.3 | | | (15) | % | | (19) | % | | (5) | % |
| | | | | | | | | | | | | | | | | | | | | | | | | | | | | | | | | | | | | | | | | | | | | | | | | | | | | |
| December 31, |
| 2022 | | 2021 | | % Change |
| Homes | | Dollar Value | | Average Price | | Homes | | Dollar Value | | Average Price | | Homes | | Dollar Value | | Average Price |
| (Dollars in thousands) |
| West | 5,234 | | | $ | 3,024,056 | | | $ | 577.8 | | | 5,732 | | | $ | 2,964,766 | | | $ | 517.2 | | | (9) | % | | 2 | % | | 12 | % |
| Mountain | 2,616 | | | 1,689,376 | | | 645.8 | | | 2,770 | | | 1,567,198 | | | 565.8 | | | (6) | % | | 8 | % | | 14 | % |
| East | 1,860 | | | 872,832 | | | 469.3 | | | 1,480 | | | 570,492 | | | 385.5 | | | 26 | % | | 53 | % | | 22 | % |
| Total | 9,710 | | | $ | 5,586,264 | | | $ | 575.3 | | | 9,982 | | | $ | 5,102,456 | | | $ | 511.2 | | | (3) | % | | 9 | % | | 13 | % |
For the twelve months ended December 31, 2023, the decrease in the number of new homes delivered in each of our segments was primarily driven by a decrease in the number of homes under construction (excluding models) to begin the period. This decrease was partially offset within each segment by an increase to monthly absorption rates and decreased cycle times during the twelve months ended December 31, 2023. The average selling price of homes delivered was negatively impacted by increased incentives during the twelve months ended December 31, 2023.
West Segment Commentary
For the year ended December 31, 2023, the decrease in new home deliveries was driven by the factors discussed above. The average selling price of homes delivered decreased as a result of a shift in closing mix to our Arizona divisions from our California divisions as well as a change in mix to more affordable product and the increased incentives discussed above.
Mountain Segment Commentary
For the year ended December 31, 2023, the decrease in new home deliveries was driven by the factors discussed above. The average selling price of homes delivered decreased as a result of the increased incentives discussed above.
East Segment Commentary
For the year ended December 31, 2023, the decrease in new home deliveries was driven by the factors discussed above. The average selling price of homes delivered decreased as a result of a change in mix to more affordable product as well as the increased incentives discussed above.
Gross Margin
Our gross margin from home sales for the year ended December 31, 2023 decreased 460 basis points year-over-year from 22.4% to 17.8%. The decrease in gross margin from home sales was driven by increased incentives and to a lesser extent increased construction and land costs year-over-year. This was partially offset by a reduction of inventory impairments to $29.7 million during the current year, compared to $121.9 million of inventory impairments recorded in the prior year.
Inventory Impairments
Inventory impairments recognized by segment for the years ended December 31, 2023, 2022 and 2021 are shown in the table below. | | | | | | | | | | | | | | | | | |
| Year Ended December 31, |
| 2023 | | 2022 | | 2021 |
| (Dollars in thousands) |
| Housing Completed or Under Construction: | |
| West | $ | 3,673 | | | $ | 8,017 | | | $ | 1,600 | |
| Mountain | 1,533 | | | 1,812 | | — | |
| East | — | | — | | — | |
| Subtotal | 5,206 | | | 9,829 | | | 1,600 | |
| Land and Land Under Development: | | | | | |
| West | 15,677 | | | 88,843 | | | — | |
| Mountain | 8,817 | | | 20,688 | | | — | |
| East | — | | | 2,515 | | | — | |
| Subtotal | 24,494 | | | 112,046 | | | — | |
| Total Inventory Impairments | $ | 29,700 | | | $ | 121,875 | | | $ | 1,600 | |
The table below provides quantitative data, for the periods presented, where applicable, used in determining the fair value of the impaired inventory. | | | | | | | | | | | | | | | | | | | | | | | | | | | | | | | | | | | |
| | Impairment Data | | Quantitative Data |
| Three Months Ended | | Number of
Subdivisions
Impaired | | Inventory
Impairments | | Fair Value of
Inventory After Impairments | | | Discount Rate |
| | (Dollars in thousands) | | | | |
| December 31, 2023 | | 3 | | $ | 2,200 | | | $ | 13,273 | | | | 12 | % | — | 15% |
| September 30, 2023 | | 2 | | 6,200 | | | 17,116 | | | | 15 | % | — | 18% |
| June 30, 2023 | | 1 | | 13,500 | | | 17,886 | | | | | 18% | |
| March 31, 2023 | | 1 | | 7,800 | | | 13,016 | | | | | 18% | |
| Total | | | | $ | 29,700 | | | | | | | | |
| | | | | | | | | | | |
| December 31, 2022 | | 16 | | $ | 92,800 | | | $ | 96,496 | | | | 15% | — | 20% |
| September 30, 2022 | | 9 | | 28,415 | | | 44,615 | | | | 15% | — | 18% |
| March 31, 2022 | | 1 | | 660 | | | 1,728 | | | | | N/A | |
| Total | | | | $ | 121,875 | | | | | | | | |
| | | | | | | | | | | |
| December 31, 2021 | | 1 | | $ | 1,600 | | | $ | 6,903 | | | | | N/A | |
| Total | | | | $ | 1,600 | | | | | | | | |
Selling, General and Administrative Expenses | | | | | | | | | | | | | | | | | | | | | | | | | | | | | |
| Year Ended December 31, |
| 2023 | | Change | | 2022 | | Change | | 2021 |
| (Dollars in thousands) |
| General and administrative expenses | $203,878 | | $(88,471) | | $292,349 | | $46,307 | | $246,042 |
General and administrative expenses as a percentage of home sale revenues | 4.5% | | (70) bps | | 5.2% | | 40 bps | | 4.8% |
| | | | | | | | | |
| Marketing expenses | $96,807 | | $(6,523) | | $103,330 | | $(1,105) | | $104,435 |
Marketing expenses as a percentage of home sale revenues | 2.1% | | 30 bps | | 1.8% | | (20) bps | | 2.0% |
| | | | | | | | | |
| Commissions expenses | $129,209 | | $(11,507) | | $140,716 | | $(2,800) | | $143,516 |
Commissions expenses as a percentage of home sale revenues | 2.9% | | 40 bps | | 2.5% | | (30) bps | | 2.8% |
| Total selling, general and administrative expenses | $429,894 | | $(106,501) | | $536,395 | | $42,402 | | $493,993 |
Total selling, general and administrative expenses as a percentage of home sale revenues (SG&A Rate) | 9.5% | | (10) bps | | 9.6% | | (10) bps | | 9.7% |
For the year ended December 31, 2023, the decrease in our general and administrative expenses was primarily due to lower stock-based and deferred compensation expenses, as well as decreased compensation related costs associated with a decline in average headcount.
For the year ended December 31, 2023, marketing expenses decreased compared to the previous year as a result of decreased marketing fees, amortization of deferred selling costs, and model home expenses.
For the year ended December 31, 2023, commissions expenses decreased due to decreases in home sale revenues, partially offset by changes in our commission structure.
Other Homebuilding Operating Data
Net New Ordersand Active Subdivisions:
Changes in the dollar value of net new orders are impacted by changes in the number of net new orders and the average selling price of those homes. Commentary for each of our segments on significant changes in these two metrics is provided below. | | | | | | | | | | | | | | | | | | | | | | | | | | | | | | | | | | | | | | | | | | | | | | | | | | | | | | | | | | | | | | | | | | | | | | | |
| December 31, |
| 2023 | | 2022 | | % Change |
| Homes | | Dollar
Value | | Average
Price | | Monthly
Absorption
Rate * | | Homes | | Dollar Value | | Average Price | | Monthly
Absorption Rate * | | Homes | | Dollar Value | | Average Price | | Monthly
Absorption
Rate * |
| | | | | | | | | | | | | | | | | | | | | | | |
| (Dollars in thousands) |
| West | 4,202 | | | $ | 2,399,987 | | | $ | 571.2 | | | 2.51 | | 2,909 | | | $ | 1,735,202 | | | $ | 596.5 | | | 2.01 | | 44 | % | | 38 | % | | (4) | % | | 25 | % |
| Mountain | 1,657 | | | 1,004,360 | | | 606.1 | | | 2.50 | | 1,157 | | | 788,734 | | | 681.7 | | | 1.85 | | 43 | % | | 27 | % | | (11) | % | | 35 | % |
| East | 1,285 | | | 578,427 | | | 450.1 | | | 2.85 | | 978 | | | 489,946 | | | 501.0 | | | 2.25 | | 31 | % | | 18 | % | | (10) | % | | 27 | % |
| Total | 7,144 | | | $ | 3,982,774 | | | $ | 557.5 | | | 2.57 | | 5,044 | | | $ | 3,013,882 | | | $ | 597.5 | | | 2.02 | | 42 | % | | 32 | % | | (7) | % | | 27 | % |
| | | | | | | | | | | | | | | | | | | | | | | | | | | | | | | | | | | | | | | | | | | | | | | | | | | | | | | | | | | | | | | | | | | | | | | |
| December 31, |
| 2022 | | 2021 | | % Change |
| Homes | | Dollar
Value | | Average
Price | | Monthly
Absorption
Rate * | | Homes | | Dollar Value | | Average Price | | Monthly
Absorption Rate * | | Homes | | Dollar Value | | Average Price | | Monthly
Absorption
Rate * |
| | | | | | | | | | | | | | | | | | | | | | | |
| (Dollars in thousands) |
| West | 2,909 | | | $ | 1,735,202 | | | $ | 596.5 | | | 2.01 | | 6,238 | | | $ | 3,417,437 | | | $ | 547.8 | | | 5.25 | | (53) | % | | (49) | % | | 9 | % | | (62) | % |
| Mountain | 1,157 | | | 788,734 | | | 681.7 | | | 1.85 | | 2,926 | | | 1,831,755 | | | 626.0 | | | 4.33 | | (60) | % | | (57) | % | | 9 | % | | (57) | % |
| East | 978 | | | 489,946 | | | 501.0 | | | 2.25 | | 1,803 | | | 789,810 | | | 438.1 | | | 4.05 | | (46) | % | | (38) | % | | 14 | % | | (44) | % |
| Total | 5,044 | | | $ | 3,013,882 | | | $ | 597.5 | | | 2.02 | | 10,967 | | | $ | 6,039,002 | | | $ | 550.7 | | | 4.75 | | (54) | % | | (50) | % | | 9 | % | | (57) | % |
*Calculated as total net new orders in period ÷ average active communities during period ÷ number of months in period
| | | | | | | | | | | | | | | | | | | | | | | | | | | | | | | | | | | |
| Active Subdivisions | | Average Active Subdivisions |
| December 31, | | Year Ended December 31, |
| 2023 | | 2022 | | % Change | | 2023 | | 2022 | | % Change |
| West | 138 | | | 134 | | | 3 | % | | 140 | | | 120 | | | 17 | % |
| Mountain | 53 | | | 53 | | | — | % | | 55 | | | 52 | | | 6 | % |
| East | 35 | | | 38 | | | (8) | % | | 38 | | | 36 | | | 6 | % |
| Total | 226 | | | 225 | | | — | % | | 233 | | | 208 | | | 12 | % |
For the year ended December 31, 2023, the increase in the number of net new orders in each of our segments was primarily the result of an increase in the monthly sales absorption pace as well as an increase in average active subdivisions. The increase in the monthly sales absorption pace was driven by a decrease in cancellations as a percentage of gross sales during the year ended December 31, 2023. The increased cancellations experienced during the year ended December 31, 2022 was the result of the sharp rise in mortgage interest rates and homebuyer concerns about purchasing in an uncertain housing market. The decrease in the average selling price in each of our segments was due to decreases in base pricing and increased incentives.
Cancellation Rate:
| | | | | | | | | | | | | | | | | | | | | | | | | | | | | | | | | | | | | | | | | | | | | | | |
| Cancellations As a Percentage of Homes in Beginning Backlog |
| 2023 | | 2022 |
| Three Months Ended |
| Dec 31 | | Sep 30 | | Jun 30 | | Mar 31 | | Dec 31 | | Sep 30 | | Jun 30 | | Mar 31 |
| West | 16 | % | | 16 | % | | 19 | % | | 26 | % | | 25 | % | | 17 | % | | 10 | % | | 8 | % |
| Mountain | 22 | % | | 22 | % | | 21 | % | | 25 | % | | 26 | % | | 17 | % | | 9 | % | | 8 | % |
| East | 23 | % | | 21 | % | | 16 | % | | 24 | % | | 20 | % | | 17 | % | | 11 | % | | 9 | % |
| Total | 18 | % | | 17 | % | | 19 | % | | 25 | % | | 25 | % | | 17 | % | | 10 | % | | 8 | % |
| | | | | | | | | | | | | | | | | | | | | | | | | | | | | |
| Cancellations As a Percentage of Gross Sales |
| December 31, |
| 2023 | | Change | | 2022 | | Change | | 2021 |
| West | 26 | % | | (18) | % | | 44 | % | | 28 | % | | 16 | % |
| Mountain | 25 | % | | (25) | % | | 50 | % | | 32 | % | | 18 | % |
| East | 21 | % | | (17) | % | | 38 | % | | 20 | % | | 18 | % |
| Total | 25 | % | | (20) | % | | 45 | % | | 28 | % | | 17 | % |
In light of our recent pivot to build more spec homes, we believe it is appropriate to view our cancellations as a product of both our beginning backlog as well as our gross sales during the periods. Our cancellation rate as a percentage of homes in beginning backlog decreased during the three months ended December 31, 2023 compared to the same period in 2022, due to a decrease in cancellations during the three months ended December 31, 2023 partially offset by a decrease in beginning backlog to start the period. Further, our cancellation rate as a percentage of gross sales decreased year-over-year during the year ended December 31, 2023 as a result of improved demand as well as the impact of the sharp increase in mortgage interest rates in the prior year period on our homebuyers in backlog who where unable to lock their interest rate prior to these increases.
Backlog: | | | | | | | | | | | | | | | | | | | | | | | | | | | | | | | | | | | | | | | | | | | | | | | | | | | | | |
| December 31, |
| 2023 | | 2022 | | % Change |
| Homes | | Dollar Value | | Average Price | | Homes | | Dollar Value | | Average Price | | Homes | | Dollar Value | | Average Price |
| (Dollars in thousands) |
| West | 1,272 | | | $ | 789,317 | | | $ | 620.5 | | | 1,891 | | | $ | 1,049,805 | | | $ | 555.2 | | | (33) | % | | (25) | % | | 12 | % |
| Mountain | 344 | | | 237,154 | | | 689.4 | | | 715 | | | 515,460 | | | 720.9 | | | (52) | % | | (54) | % | | (4) | % |
| East | 274 | | | 130,524 | | | 476.4 | | | 368 | | | 187,629 | | | 509.9 | | | (26) | % | | (30) | % | | (7) | % |
| Total | 1,890 | | | $ | 1,156,995 | | | $ | 612.2 | | | 2,974 | | | $ | 1,752,894 | | | $ | 589.4 | | | (36) | % | | (34) | % | | 4 | % |
At December 31, 2023, we had 1,890 homes in backlog with a total value of $1.16 billion, representing respective decreases of 36% and 34%, respectively, from December 31, 2022. The decrease in the number of homes in backlog was primarily a result of the shift in consumer preference to quick move-in homes and our associated pivot to build more spec homes. The decrease in average selling price in our Mountain segment was driven by a shift in mix from our Colorado communities to our Utah and Boise communities. The decrease in average selling price in our East segment was driven by a shift in mix to more affordable product in our Jacksonville communities. The increase in average selling price in the West segment was driven by a change in backlog mix from our Arizona communities to our California communities. Our ability to convert backlog into closings could be negatively impacted in future periods by rising mortgage interest rates and other factors, the extent to which is highly uncertain and depends on future developments.
Homes Completed or Under Construction: | | | | | | | | | | | | | | | | | |
| December 31, | | |
| 2023 | | 2022 | | % Change |
| Unsold: | | | | | |
| Completed | 339 | | | 396 | | | (14) | % |
| Under construction | 2,709 | | | 1,063 | | | 155 | % |
| Total unsold started homes | 3,048 | | | 1,459 | | | 109 | % |
| Sold homes under construction or completed | 1,812 | | | 2,756 | | | (34) | % |
| Model homes under construction or completed | 542 | | | 555 | | | (2) | % |
| Total homes completed or under construction | 5,402 | | | 4,770 | | | 13 | % |
The increase in total unsold started homes and decrease in sold homes under construction or completed is due to a shift in strategy to focus on speculative construction starts given current market conditions and a shift in consumer preferences.
Lots Owned and Optioned (including homes completed or under construction): | | | | | | | | | | | | | | | | | | | | | | | | | | | | | | | | | | | | | | | | | |
| December 31, 2023 | | December 31, 2022 | | |
| Lots Owned | | Lots Optioned | | Total | | Lots Owned | | Lots Optioned | | Total | | Total % Change |
| West | 9,957 | | 1,186 | | 11,143 | | 12,667 | | 687 | | 13,354 | | (17) | % |
| Mountain | 5,038 | | 1,088 | | 6,126 | | 5,398 | | 1,561 | | 6,959 | | (12) | % |
| East | 3,004 | | 2,142 | | 5,146 | | 3,534 | | 1,455 | | 4,989 | | 3 | % |
| Total | 17,999 | | 4,416 | | 22,415 | | 21,599 | | 3,703 | | 25,302 | | (11) | % |
Our total owned and optioned lots at December 31, 2023 were 22,415, a decrease of 11% from December 31, 2022. This decrease is a result of our intentional slowdown in land acquisition and approval activity in the second half of 2022 and into the first quarter of 2023 due to the market uncertainty during those periods. We believe that our total lot supply is sufficient to meet our operating needs, consistent with our philosophy of maintaining a two to three year supply of land. See "Forward-Looking Statements" above.
Financial Services | | | | | | | | | | | | | | | | | | | | | | | | | | | | | | | | | | | | | | | | | |
| Year Ended December 31, |
| | | Change | | | | Change | | |
| 2023 | | Amount | | % | | 2022 | | Amount | | % | | 2021 |
| (Dollars in thousands) |
| Financial services revenues | |
| Mortgage operations | $ | 76,479 | | | $ | 3,673 | | | 5 | % | | $ | 72,806 | | | $ | (34,729) | | | (32) | % | | $ | 107,535 | |
| Other | 46,091 | | | (12,826) | | | (22) | % | | 58,917 | | | 14,240 | | | 32 | % | | 44,677 | |
| Total financial services revenues | $ | 122,570 | | | $ | (9,153) | | | (7) | % | | $ | 131,723 | | | $ | (20,489) | | | (13) | % | | $ | 152,212 | |
| | | | | | | | | | | | | |
| Financial services pretax income | | | | | | | | | | | | | |
| Mortgage operations | $ | 40,756 | | | $ | 10,579 | | | 35 | % | | $ | 30,177 | | | $ | (39,278) | | | (57) | % | | $ | 69,455 | |
| Other | 35,217 | | | (2,993) | | | (8) | % | | 38,210 | | | 15,659 | | | 69 | % | | 22,551 | |
| Total financial services pretax income | $ | 75,973 | | | $ | 7,586 | | | 11 | % | | $ | 68,387 | | | $ | (23,619) | | | (26) | % | | $ | 92,006 | |
For the year ended December 31, 2023, our financial services pretax income increased $7.6 million or 11% from the same period in the prior year. The increase in financial services pretax income was driven by our mortgage operations as a result of a decrease in salary related expenses driven by lower headcount, the allocation of revenue from our homebuilding business associated with our financing incentives and an increase in capture rate. This was partially offset by a decrease in closing volume during the period ended December 31, 2023. Our other financial services businesses experienced a decrease in pretax income driven by our insurance operations, which saw a decrease in revenue due to a decrease in homes closed, partially offset by an increase in interest income due to increases in both interest rates and our cash and short-term investments year-over-year.
The table below sets forth information for our mortgage operations relating to mortgage loans originated and capture rate. | | | | | | | | | | | | | | | | | | | | | | | | | | | | | |
| Year Ended December 31, |
| 2023 | | % or Percentage Change | | 2022 | | % or Percentage Change | | 2021 |
| (Dollars in thousands) |
| Total Originations: | | | | | | | | | |
| Loans | 5,430 | | | (8) | % | | 5,876 | | | (6) | % | | 6,247 | |
| Principal | $ | 2,448,426 | | (11) | % | | $ | 2,746,903 | | | 5 | % | | $ | 2,622,158 | |
| Capture Rate Data: | | | | | | | | | |
| Capture rate as % of all homes delivered | 66 | % | | 6 | % | | 60 | % | | (2) | % | | 62 | % |
| Capture rate as % of all homes delivered (excludes cash sales) | 72 | % | | 8 | % | | 64 | % | | (1) | % | | 65 | % |
| Mortgage Loan Origination Product Mix: | | | | | | | | | |
| FHA loans | 26 | % | | 13 | % | | 13 | % | | (3) | % | | 16 | % |
| Other government loans (VA & USDA) | 19 | % | | (2) | % | | 21 | % | | 2 | % | | 19 | % |
| Total government loans | 45 | % | | 11 | % | | 34 | % | | (1) | % | | 35 | % |
| Conventional loans | 55 | % | | (11) | % | | 66 | % | | 1 | % | | 65 | % |
| 100 | % | | — | % | | 100 | % | | — | % | | 100 | % |
| Loan Type: | | | | | | | | | |
| Fixed rate | 97 | % | | (2) | % | | 99 | % | | (1) | % | | 100 | % |
| ARM | 3 | % | | 2 | % | | 1 | % | | 1 | % | | — | % |
| Credit Quality: | | | | | | | | | |
| Average FICO Score | 741 | | | — | % | | 744 | | | 1 | % | | 740 | |
| Other Data: | | | | | | | | | |
| Average Combined LTV ratio | 83 | % | | 2 | % | | 81 | % | | (3) | % | | 84 | % |
| Full documentation loans | 100 | % | | — | % | | 100 | % | | — | % | | 100 | % |
| Loans Sold to Third Parties: | | | | | | | | | |
| Loans | 5,356 | | | (10) | % | | 5,977 | | | (4) | % | | 6,210 | |
| Principal | $ | 2,419,558 | | | (13) | % | | $ | 2,785,712 | | | 9 | % | | $ | 2,563,637 | |
Income Taxes
We recorded an income tax provision of $125.1 million, $197.7 million and $178.0 million for the years ended December 31, 2023, 2022 and 2021, respectively, and our resulting effective income tax rates were 23.8%, 26.0% and 23.7%, respectively. Our tax provision and effective tax rate are driven by (i) pre-tax book income for the full year, adjusted for items that are deductible/non-deductible for tax purposes only (i.e., permanent items); (ii) benefits from federal energy credits; (iii) taxable income generated in state jurisdictions that varies from consolidated income and (iv) stock based compensation windfalls recorded as discrete items. The difference between our effective tax rate for the year ended December 31, 2023 and the federal statutory rate (21%) was primarily due to 4.0% in state taxes and a 1.3% increase due to limitations on deductible executive compensation. These items were partially offset by a 1.7% decrease due to benefits for federal energy credits.
LIQUIDITY AND CAPITAL RESOURCES
We use our liquidity and capital resources to (1) support our operations, including the purchase of land, land development and construction of homes; (2) provide working capital; and (3) provide mortgage loans for our homebuyers. Our liquidity includes our cash and cash equivalents, marketable securities, Revolving Credit Facility (as defined below) and Mortgage Repurchase Facility (as defined below). Additionally, we have an existing effective shelf registration statement that allows us to issue equity, debt or hybrid securities up to $5.0 billion, of which $5.0 billion remains.
Material Cash Requirements
We are a party to many contractual obligations involving commitments to make payments to third parties. These obligations impact our short-term and long-term liquidity and capital resource needs. Certain contractual obligations are reflected on the Consolidated Balance Sheet as of December 31, 2023, while others are considered future commitments. Our contractual obligations primarily consist of long-term debt and related interest payments, payments due on our Mortgage Repurchase Facility, purchase obligations related to expected acquisition of land under purchase agreements and land development agreements (many of which are secured by letters of credit or surety bonds) and operating leases. Other material cash requirements include land acquisition and development costs not yet contracted for, home construction costs, operating expenses, including our selling, general and administrative expenses, investments and funding of capital improvements and dividend payments.
At December 31, 2023, we had outstanding senior notes with varying maturities totaling an aggregate principal amount of $1.5 billion, with none payable within 12 months. Future interest payments associated with the notes total $1.3 billion, with $64.2 million payable within 12 months. As of December 31, 2023, we had $25.3 million of required operating lease future minimum payments.
At December 31, 2023, we had deposits of $28.0 million in the form of cash and $9.2 million in the form of letters of credit that secured option contracts to purchase 4,416 lots for a total estimated purchase price of $437.8 million.
At December 31, 2023, we had outstanding surety bonds and letters of credit totaling $311.0 million and $118.3 million, respectively, including $77.5 million in letters of credit issued by HomeAmerican. The estimated cost to complete obligations related to these bonds and letters of credit were approximately $107.1 million and $62.4 million, respectively. We expect that the obligations secured by these performance bonds and letters of credit generally will be performed in the ordinary course of business and in accordance with the applicable contractual terms. To the extent that the obligations are performed, the related performance bonds and letters of credit should be released and we should not have any continuing obligations. However, in the event any such performance bonds or letters of credit are called, our indemnity obligations could require us to reimburse the issuer of the performance bond or letter of credit. We have made no material guarantees with respect to third-party obligations.
Capital Resources
Our capital structure is primarily a combination of (1) permanent financing, represented by stockholders’ equity; (2) long-term financing, represented by our 3.850% senior notes due 2030, 2.500% senior notes due 2031, 6.000% senior notes due 2043, and 3.966% senior notes due 2061; (3) our Revolving Credit Facility; and (4) our Mortgage Repurchase Facility. Because of our current balance of cash, cash equivalents, marketable securities, ability to access the capital markets, and available capacity under both our Revolving Credit Facility and Mortgage Repurchase Facility, we believe that our capital resources are adequate to satisfy our short and long-term capital requirements, including meeting future payments on our senior notes as they become due. See “Forward-Looking Statements” above.
We may from time to time seek to retire or purchase our outstanding senior notes through cash purchases, whether through open market purchases, privately negotiated transactions or otherwise. Such repurchases, if any, will depend on prevailing market conditions, our liquidity requirements, contractual restrictions and other factors. The amounts involved may be material.
Senior Notes, Revolving Credit Facility and Mortgage Repurchase Facility
Senior Notes. Our senior notes are not secured and, while the senior note indentures contain some restrictions on secured debt and other transactions, they do not contain financial covenants. Our senior notes are fully and unconditionally guaranteed on an unsecured basis, jointly and severally, by most of our homebuilding segment subsidiaries. We believe that we are in compliance with the representations, warranties and covenants in the senior note indentures.
Revolving Credit Facility. We have an unsecured revolving credit agreement (“Revolving Credit Facility”) with a group of lenders, which may be used for general corporate purposes. This agreement was amended on December 28, 2020 to (1) increase the aggregate commitment from $1.0 billion to $1.2 billion (the "Commitment"), (2) extend the Revolving Credit Facility maturity of $1.125 billion of the Commitments to December 18, 2025 with the remaining Commitment terminated on December 18, 2023 and (3) provide that the aggregate amount of the commitments may increase to an amount not to exceed $1.7 billion upon our request, subject to receipt of additional commitments from existing or additional lenders and, in the case of additional lenders, the consent of the co-administrative agents.
Effective April 11, 2023, the Revolving Credit Facility was amended to transition from a eurocurrency based interest rate to an interest rate based on the Secured Overnight Financing Rate ("SOFR"). As defined in the Revolving Credit Facility, interest rates on base rate borrowings are equal to the highest of (1) 0.0%, (2) a prime rate, (3) a federal funds effective rate plus 0.50%, and (4) the one month term SOFR screen rate plus the SOFR adjustment plus 1.00% and, in each case, plus a margin that is determined based on our credit ratings and leverage ratio. Interest rates on SOFR borrowings are equal to the greater of (1) 0.0% and (2) the sum of the term SOFR screen rate for such interest period plus the SOFR adjustment, plus a margin that is determined based on our credit ratings and leverage ratio. At any time at which our leverage ratio, as of the last day of the most recent calendar quarter, exceeds 55%, the aggregate principal amount of all consolidated senior debt borrowings outstanding may not exceed the borrowing base. There is no borrowing base requirement if our leverage ratio, as of the last day of the most recent calendar quarter, is 55% or less.
The Revolving Credit Facility is fully and unconditionally guaranteed, jointly and severally, by most of our homebuilding segment subsidiaries. The facility contains various representations, warranties and covenants that we believe are customary for agreements of this type. The financial covenants include a consolidated tangible net worth test and a leverage test, along with a consolidated tangible net worth covenant, all as defined in the Revolving Credit Facility. A failure to satisfy the foregoing tests does not constitute an event of default, but can trigger a “term-out” of the facility. A breach of the consolidated tangible net worth covenant (but not the consolidated tangible net worth test) or a violation of anti-corruption or sanctions laws would result in an event of default.
The Revolving Credit Facility is subject to acceleration upon certain specified events of default, including breach of the consolidated tangible net worth covenant, a violation of anti-corruption or sanctions laws, failure to make timely payments, breaches of certain representations or covenants, failure to pay other material indebtedness, or another person becoming beneficial owner of 50% or more of our outstanding common stock. We believe we were in compliance with the representations, warranties and covenants included in the Revolving Credit Facility as of December 31, 2023.
We incur costs associated with unused commitment fees pursuant to the terms of the Revolving Credit Facility. As of December 31, 2023, we had $10.0 million in borrowings and $40.8 million in letters of credit outstanding under the Revolving Credit Facility, leaving a remaining borrowing capacity of $1.07 billion.
The Merger will trigger a change in control event of default under the Revolving Credit Facility, and the Company expects to either obtain lenders’ consent to the transaction prior to closing or terminate the Revolving Credit Agreement and repay all outstanding amounts thereunder in connection with the closing of the Merger.
Mortgage Repurchase Facility. HomeAmerican has a Master Repurchase Agreement (the “Mortgage Repurchase Facility”) with U.S. Bank National Association (“USBNA”). The Mortgage Repurchase Facility provides liquidity to HomeAmerican by providing for the sale of up to an aggregate of $75 million (subject to increase by up to $75 million under certain conditions) of eligible mortgage loans to USBNA with an agreement by HomeAmerican to repurchase the mortgage loans at a future date. Until such mortgage loans are transferred back to HomeAmerican, the documents relating to such loans are held by USBNA, as custodian, pursuant to the Custody Agreement (“Custody Agreement”), dated as of November 12, 2008, by and between HomeAmerican and USBNA. In the event that an eligible mortgage loan becomes ineligible, as defined under the Mortgage Repurchase Facility, HomeAmerican may be required to repurchase the ineligible mortgage loan immediately. The Mortgage Repurchase Facility was amended on March 25, 2021, May 20, 2021, December 21, 2021, May 19, 2022 and May 18, 2023 to adjust the commitments to purchase for specific time periods. The total capacity of the facility at December 31, 2023 was $225 million. The termination date of the Repurchase Agreement is May 15, 2024.
At December 31, 2023 and 2022, HomeAmerican had $205.0 million and $175.8 million, respectively, of mortgage loans that HomeAmerican was obligated to repurchase under the Mortgage Repurchase Facility. Mortgage loans that HomeAmerican is obligated to repurchase under the Mortgage Repurchase Facility are accounted for as a debt financing arrangement and are reported as mortgage repurchase facility in the consolidated balance sheets. Pricing under the Mortgage Repurchase Facility is based on SOFR.
The Mortgage Repurchase Facility contains various representations, warranties and affirmative and negative covenants that we believe are customary for agreements of this type. The negative covenants include, among others, (i) a minimum Adjusted Tangible Net Worth requirement, (ii) a maximum Adjusted Tangible Net Worth ratio, (iii) a minimum adjusted net income requirement, and (iv) a minimum Liquidity requirement. The foregoing capitalized terms are defined in the Mortgage Repurchase Facility. We believe HomeAmerican was in compliance with the representations, warranties and covenants included in the Mortgage Repurchase Facility as of December 31, 2023.
The Merger will trigger a change in control event of default under the Mortgage Repurchase Facility, and the Company expects to either obtain lender’s consent to the transaction prior to closing or terminate the Mortgage Repurchase Facility and repay all outstanding amounts thereunder in connection with the closing of the Merger.
Dividends
In the years ended December 31, 2023 and 2022, we paid dividends of $2.10 per share and $2.00 per share, respectively.
MDC Common Stock Repurchase Program
At December 31, 2023, we were authorized to repurchase up to 4,000,000 shares of our common stock. We did not repurchase any shares of our common stock under this repurchase program during the year ended December 31, 2023.
Consolidated Cash Flow
Our operating cash flows are primarily impacted by: (1) land purchases and related development and construction of homes; (2) closing homes and the associated timing of collecting receivables from home closings; (3) the origination and subsequent sale of mortgage loans originated by HomeAmerican; (4) payments on accounts payables and accrued liabilities; and (5) funding for payroll. When we close on the sale of a house, our homebuilding subsidiaries will generally receive the proceeds from the sale of the homes within a few days of the home being closed. Therefore, our home sales receivable balance can increase or decrease from period to period based upon the timing of our home closings. Additionally, the amount of mortgage loans held-for-sale can be impacted period to period based upon the number of mortgage loans that were originated by HomeAmerican that have not been sold to third party purchasers and by the timing of fundings by third party mortgage purchasers. Accordingly, mortgage loans held-for-sale may increase if HomeAmerican originates more homes towards the end of one reporting period when compared with the same period in the previous year. HomeAmerican will generally sell mortgage loans it originates between 5 to 35 days after origination.
Operating Cash Flow Activities
For the year ended December 31, 2023, net cash provided by operating activities was $561.6 million compared with net cash provided by operating activities of $905.6 million in the prior year. During the years ended December 31, 2023 and 2022, the most significant source of cash provided by operating activities was net income of $401.0 million and $562.1 million, respectively. Another significant source of cash provided by operating activities during the year ended December 31, 2023 was cash provided by the decrease in land and land under development of $349.8 million compared to cash used by the increase in land and land under development of $95.4 million in the prior year. This decrease in 2023 was the result of home starts outnumbering lot acquisitions during the period. Cash used by the increase in housing completed or under construction for the year ended December 31, 2023 was $163.9 million, as the number of homes under construction increased during the period. Cash provided by the decrease in housing completed or under construction for the year ended December 31, 2022 was $186.3 million as the number of homes under construction decreased during the period. Cash used to decrease accounts payable and accrued liabilities for the years ended December 31, 2023 and 2022 was $74.1 million and $18.5 million, respectively. This change was due to the decreased construction spend during the twelve months ended December 31, 2023. Cash used to increase mortgage loans held-for-sale was $28.7 million compared to cash provided by the decrease in mortgage loans held-for-sale of $53.0 million in the years ended December 31, 2023 and 2022, respectively. This was a result of a increase in loan originations for the year ended December 31, 2023.
Investing CashFlow Activities
For the year ended December 31, 2023, net cash provided by investing activities was $469.4 million compared with cash used of $585.9 million in the prior year. The primary driver of this increase in cash from investing activities relates to the maturities of marketable securities of $1.7 billion in 2023 compared to only $100.0 million in 2022. The increase was partially
offset by $1.2 billion in cash used in the purchase of marketable securities during the current year, compared to $656.8 million in the prior year.
Financing Cash Flow Activities
For the year ended December 31, 2023, net cash used in financing activities was $105.3 million compared with net cash used in financing activities of $206.1 million in the prior year. The primary driver of this decrease in cash used by financing activities was the cash provided by the increase of the mortgage repurchase facility of $29.2 million as of December 31, 2023 compared to cash used to decrease the mortgage repurchase facility of $80.5 million in the prior year. This was driven by an increase in loan originations in the last month of the year ended December 31, 2023 as compared to the prior year. Cash used to fund dividend payments increased year-over year as a result of an increase in the cash dividend declared per share in Q3 2023.
CRITICAL ACCOUNTING ESTIMATES AND POLICIES
The preparation of financial statements in conformity with accounting principles generally accepted in the United States of America requires management to make estimates and assumptions that affect the reported amounts of assets and liabilities at the date of the consolidated financial statements and the reported amounts of revenue and expenses during the reporting period. Management bases its estimates and judgments on historical experience and on various other factors that are believed to be reasonable under the circumstances, the results of which form the basis for making judgments about the carrying value of assets and liabilities that are not readily apparent from other sources. Management evaluates such estimates and judgments on an on-going basis and makes adjustments as deemed necessary. Actual results could differ from these estimates if conditions are significantly different in the future. See “Forward-Looking Statements” above.
Listed below are those estimates and policies that we believe are critical and require the use of complex judgment in their application. Our critical accounting estimates and policies are as follows and should be read in conjunction with the Notes to our Consolidated Financial Statements.
Homebuilding Inventory Valuation. Refer to Note 1, Summary of Significant Accounting Policies, in the notes to the financial statements for information on the composition of the inventory balances.
In accordance with Accounting Standards Codification (“ASC”) Topic 360, Property, Plant, and Equipment (“ASC 360”), homebuilding inventories, excluding those classified as held for sale, are carried at cost unless events and circumstances indicate that the carrying value of the underlying subdivision may not be recoverable. We evaluate inventories for impairment at each quarter end on a subdivision level basis as each such subdivision represents the lowest level of identifiable cash flows. In making this determination, we review, among other things, the following for each subdivision:
•actual and trending “Operating Margin” (which is defined as home sale revenues less home cost of sales and all incremental costs associated directly with the subdivision, including sales commissions and marketing costs);
•forecasted Operating Margin for homes in backlog;
•actual and trending net home orders;
•homes available for sale;
•market information for each sub-market, including competition levels, home foreclosure levels, the size and style of homes currently being offered for sale and lot size; and
•known or probable events indicating that the carrying value may not be recoverable.
If events or circumstances indicate that the carrying value of our inventory may not be recoverable, assets are reviewed for impairment by comparing the undiscounted estimated future cash flows from an individual subdivision (including capitalized interest) to its carrying value. We generally determine the estimated fair value of each subdivision by calculating the present value of the estimated future cash flows using discount rates, which are Level 3 inputs (see Note 6, Fair Value Measurements, in the notes to the financial statements for definitions of fair value inputs), that are commensurate with the risk of the subdivision under evaluation. The evaluation for the recoverability of the carrying value of the assets for each individual subdivision can be impacted significantly by our estimates of future home sale revenues, home construction costs, and development costs per home, all of which are Level 3 inputs. These estimates of undiscounted future cash flows are dependent on specific market or sub-market conditions for each subdivision. While we consider available information to determine what we believe to be our best estimates as of the end of a reporting period, these estimates are subject to change in future reporting periods as facts and circumstances change. Local market-specific conditions that may impact these estimates for a subdivision include:
•historical subdivision results, and actual and trending Operating Margin, base selling prices and home sales incentives;
•forecasted Operating Margin for homes in backlog;
•the intensity of competition within a market or sub-market, including publicly available home sales prices and home sales incentives offered by our competitors;
•increased levels of home foreclosures;
•the current sales pace for active subdivisions;
•subdivision specific attributes, such as location, availability and size of lots in the sub-market, desirability and uniqueness of subdivision location and the size and style of homes currently being offered;
•potential for alternative home styles to respond to local market conditions;
•changes by management in the sales strategy of a given subdivision; and
•current local market economic and demographic conditions and related trends and forecasts.
These and other local market-specific conditions that may be present are considered by personnel in our homebuilding divisions as they prepare or update the forecasted assumptions for each subdivision. Quantitative and qualitative factors other than home sales prices could significantly impact the potential for future impairments. The sales objectives can differ among subdivisions, even within a given sub-market. For example, facts and circumstances in a given subdivision may lead us to price our homes with the objective of yielding a higher sales absorption pace, while facts and circumstances in another subdivision may lead us to price our homes to minimize deterioration in our gross margins from home sales, even though this could result in a slower sales absorption pace. Furthermore, the key assumptions included in our estimated future undiscounted cash flows may be interrelated. For example, a decrease in estimated base sales price or an increase in home sales incentives may result in a corresponding increase in sales absorption pace. Additionally, a decrease in the average sales price of homes to be sold and closed in future reporting periods for one subdivision that has not been generating what management believes to be an adequate sales absorption pace may impact the estimated cash flow assumptions of a nearby subdivision. Changes in our key assumptions, including estimated construction and land development costs, absorption pace and selling strategies could materially impact future cash flow and fair value estimates. Due to the number of possible scenarios that would result from various changes in these factors, we do not believe it is possible to develop a sensitivity analysis with a level of precision that would be meaningful to an investor.
If the undiscounted future cash flows of a subdivision are less than its carrying value, the carrying value of the subdivision is written down to its then estimated fair value. We determine the estimated fair value of each subdivision either: (1) by determining the present value of the estimated future cash flows at discount rates that are commensurate with the risk of the subdivision under evaluation; or (2) assessing the market value of the land in its current condition by considering the estimated price a willing buyer would pay for the land (other than in a forced liquidation), and recent land purchase transactions that we believe are indicators of fair value. The estimated future cash flows are the same for both our recoverability and fair value assessments. Factors we consider when determining the discount rate to be used for each subdivision include, among others:
•the number of lots in a given subdivision;
•the amount of future land development costs to be incurred;
•risks associated with the home construction process, including the stage of completion for the entire subdivision and the number of owned lots under construction; and
•the estimated remaining lifespan of the subdivision.
We allocate the impairments recorded between housing completed or under construction and land and land under development for each impaired subdivision based upon the status of construction of a home on each lot (i.e., if the lot is in housing completed or under construction, the impairment for that lot is recorded against housing completed or under construction). The allocation of impairment is the same with respect to each lot in a given subdivision. Changes in management’s estimates, particularly the timing and amount of the estimated future cash inflows and outflows and forecasted average selling prices of homes to be sold and closed can materially affect any impairment calculation. Because our forecasted cash flows are impacted significantly by changes in market conditions, it is reasonably possible that actual results could differ significantly from those estimates. Please see the “Inventory Impairments” section for a detailed discussion and analysis of our asset impairments.
If land is classified as held for sale, we measure it at the lower of the carrying value or fair value less estimated costs to sell. In determining fair value, we primarily rely upon the most recent negotiated price. If a negotiated price is not available, we will consider several factors including, but not limited to, current market conditions, recent comparable sales transactions and market analysis studies. If the fair value less estimated costs to sell is lower than the current carrying value, the land is impaired down to its estimated fair value less costs to sell.
Warranty Accrual. Our homes are sold with limited third-party warranties. We record expenses and warranty accruals for general and structural warranty claims, as well as accruals for known, unusual warranty-related expenditures. A warranty accrual is recorded for each home closed based upon historical payment experience in an amount estimated to be adequate to cover expected costs of materials and outside labor during warranty periods. The determination of the warranty accrual rate for closed homes and the evaluation of our warranty accrual balance at period end are based on an internally developed analysis that includes known facts and interpretations of circumstances, including, among other things, our trends in historical warranty payment levels and warranty payments for claims not considered to be normal and recurring. Actual future warranty costs could differ from currently estimated amounts. A 10% change in the historical warranty rates used to estimate our warranty accrual would not result in a material change in our accrual.
Insurance Reserves. The establishment of reserves for estimated losses associated with insurance policies issued by Allegiant and re-insurance agreements issued by StarAmerican are based on actuarial studies that include known facts and interpretations of circumstances, including our experience with similar cases and historical trends involving claim payment patterns, pending levels of unpaid claims, product mix or concentration, claim severity, frequency patterns depending on the business conducted, and changing regulatory and legal environments. Historical trends in claim severity and frequency patterns have been inconsistent and we believe they may continue to fluctuate. It is possible that changes in the insurance payment experience used in estimating our ultimate insurance losses could have a material impact on our insurance reserves. A 10% increase in both the claim frequency and the average cost per claim used to estimate the reserves would result in an increase in our insurance reserves and an associated increase in expense of approximately $18.8 million. A 10% decrease in both the claim frequency and the average cost per claim would result in a decrease in our insurance reserves and an associated reduction in expense of $17.0 million.
Litigation Accruals. In the normal course of business, we are a defendant in claims primarily relating to premises liability, product liability and personal injury claims. These claims seek relief from us under various theories, including breach of implied and express warranty, negligence, strict liability, misrepresentation and violation of consumer protection statutes. We have accrued for losses that may be incurred with respect to legal claims based upon information provided by our legal counsel, including counsel’s on-going evaluation of the merits of the claims and defenses and the level of estimated insurance coverage. Due to uncertainties in the estimation process, actual results could vary from those accruals and could have a material impact on our results of operations.
Revenue Recognition for Homebuilding Segments. We recognize home sale revenues from home deliveries when we have satisfied the performance obligations within the sales agreement, which is generally when title to and possession of the home are transferred to the buyer at the home closing date. Revenue from a home delivery includes the base sales price and any purchased options and upgrades and is reduced for any sales price incentives.
In certain states where we build, we are not always able to complete certain outdoor features (such as landscaping or pools) prior to closing the home. To the extent these separate deliverables are not complete upon the closing of a home, we defer home sale revenues related to incomplete outdoor features, and recognize that revenue upon completion of the outdoor features.
Revenue Recognition for HomeAmerican: Revenues recorded by HomeAmerican primarily reflect (1) origination fees and (2) the corresponding sale, or expected future sale, of a loan, which will include the estimated earnings from either the release or retention of a loan’s servicing rights. Origination fees are recognized when a loan is originated. When an interest rate lock commitment is made to a customer, we record the expected gain on sale of the mortgage, plus the estimated earnings from the expected sale of the associated servicing rights, adjusted for a pull-through percentage (which is defined as the likelihood that an interest rate lock commitment will be originated), as revenue. As the interest rate lock commitment gets closer to being originated, the expected gain on the sale of that loan plus its servicing rights is updated to reflect current market value and the increase or decrease in the fair value of that interest rate lock commitment is recorded through revenues. At the same time, the expected pull-through percentage of the interest rate lock commitment to be originated is updated based upon current market conditions and the remaining time until loan origination and, if there has been a change, revenues are adjusted as necessary. After origination, our mortgage loans, which could also include their servicing rights, are sold to third-party purchasers in accordance with sale agreements entered into by us with a third-party purchaser of the loans. We make representations and warranties with respect to the status of loans transferred in the sale agreements. The sale agreements generally include statements acknowledging the transfer of the loans is intended by both parties to constitute a sale. Sale of a mortgage loan has occurred when the following criteria, among others, have been met: (1) fair consideration has been paid for transfer of the loan by a third party in an arms-length transaction, (2) all the usual risks and rewards of ownership that are in substance a sale have been transferred by us to the third party purchaser; and (3) we do not have a substantial continuing involvement with the mortgage loan.
We carry interest rate lock commitments and mortgage loans held-for-sale at fair value.
Home Cost of Sales. Refer to the Note 1, Summary of Significant Accounting Policies, in the notes to the financial statements for information on the composition of home cost of sales. When a home is closed, we generally have not yet paid or incurred all costs necessary to complete the construction of the home and certain land development costs. At the time of a home closing, we compare the home construction budgets to actual recorded costs to determine the additional estimated costs remaining to be paid on each closed home. For amounts not incurred or paid as of the time of closing a home, we record an estimated accrual associated with certain home construction and land development costs. Generally, these accruals are established based upon contracted work which has yet to be paid, open work orders not paid at the time of home closing, as well as land completion costs more likely than not to be incurred, and represent estimates believed to be adequate to cover the expected remaining home construction and land development costs. We monitor the adequacy of these accruals on a house-by-house basis and in the aggregate on both a market-by-market and consolidated basis.
Stock-Based Compensation. ASC Topic 718, Compensation—Stock Compensation (“ASC 718”) requires that share-based compensation expense be measured and recognized at an amount equal to the fair value of share-based payments granted under compensation arrangements. Determining the appropriate fair value model and calculating the fair value of stock option awards requires judgment, including estimating stock price volatility, annual forfeiture rates and the expected life of an award. For stock option awards granted with just service and/or performance conditions, we estimate the fair value using a Black-Scholes option pricing model. For any stock option awards granted that contain a market condition, we estimate the fair value using a Monte Carlo simulation model. Both the Black-Scholes option pricing model and Monte Carlo simulation utilize the following inputs to calculate the estimated fair value of stock options: (1) closing price of our common stock on the measurement date (generally the date of grant); (2) exercise price; (3) expected stock option life; (4) expected volatility; (5) risk-free interest rate; and (6) expected dividend yield rate. The expected life of employee stock options represents the period for which the stock options are expected to remain outstanding and is derived primarily from historical exercise patterns. The expected volatility is determined based on our review of the implied volatility that is derived from the price of exchange traded options of the Company. The risk-free interest rate assumption is determined based upon observed interest rates appropriate for the expected term of our employee stock options. The expected dividend yield assumption is based on our historical dividend payouts. We determine the estimated fair value of the stock option awards on the date they are granted. The fair values recorded for previously granted stock option awards are not adjusted as subsequent changes in the foregoing assumptions occur; for example, an increase or decrease in the price of our common stock. However, changes in the foregoing inputs, particularly the price of our common stock, expected stock option life and expected volatility, significantly change the estimated fair value of future grants of stock options.
An annual forfeiture rate is estimated at the time of grant, and revised if necessary, in subsequent periods if the actual forfeiture rate differs from our estimate.
RECENTLY ISSUED ACCOUNTING STANDARDS
See Note 2, Recently Issued Accounting Standards, in our consolidated financial statements.
Item 7A.Quantitative and Qualitative Disclosures AboutMarketRisk.
We have a cash and investment policy that enables us to achieve an appropriate investment return while preserving principal and managing risk. Under this policy, cash and cash equivalents may include U.S. government securities, commercial bank deposits, commercial paper, certificates of deposit, money market funds, and time deposits, with maturities of three months or less. Marketable securities under this policy may include holdings in U.S. government securities with a maturity of more than three months, equity securities and corporate debt securities.
As of December 31, 2023, our cash and cash equivalents included commercial bank deposits, money market funds and time deposits and our marketable securities included U.S. government treasury securities with original maturities upon acquisition of less than six months.
We are exposed to market risks related to fluctuations in interest rates on mortgage loans held-for-sale, mortgage interest rate lock commitments, marketable securities and debt. Financial instruments utilized in the normal course of business by HomeAmerican include forward sales of mortgage-backed securities, which are commitments to sell a specified financial instrument at a specified future date for a specified price, mandatory delivery forward loan sale commitments, which are obligations of an investor to buy loans at a specified price within a specified time period, and best-effort delivery forward loan sale commitments, which are obligations of an investor to buy loans at a specified price subject to the underlying mortgage loans being funded and closed. Such contracts are the only significant financial and derivative instruments utilized by MDC. HomeAmerican’s mortgage loans in process for which an interest rate lock commitment had been made to a borrower that had not closed at December 31, 2023 had an aggregate principal balance of $229.2 million, of which $227.9 million had not yet been committed to a mortgage purchaser. In addition, HomeAmerican had mortgage loans held-for-sale with an aggregate principal balance of $256.3 million at December 31, 2023, of which $151.9 million had not yet been committed to a mortgage purchaser. In order to hedge the changes in fair value of interest rate lock commitments and mortgage loans held-for-sale that had not yet been committed to a mortgage purchaser, HomeAmerican had forward sales of securities totaling $311.5 million and $323.0 million at December 31, 2023 and December 31, 2022, respectively.
HomeAmerican provides mortgage loans that generally are sold forward and subsequently delivered to a third-party purchaser between 5 and 35 days. Forward commitments are used for non-trading purposes to sell mortgage loans and hedge price risk due to fluctuations in interest rates on rate-locked mortgage loans in process that have not closed. Due to this economic hedging philosophy, the market risk associated with these mortgages is limited. For forward sales commitments, as well as commitments to originate mortgage loans that are still outstanding at the end of a reporting period, we record the fair value of the derivatives in the consolidated statements of operations and comprehensive income with an offset to either derivative assets or liabilities, depending on the nature of the change.
We utilize our Revolving Credit Facility, our Mortgage Repurchase Facility and senior notes in our financing strategy. For fixed rate debt, changes in interest rates generally affect the fair value of the debt instrument, but do not affect our earnings or cash flows. We do not have an obligation to prepay our senior notes prior to maturity and, as a result, interest rate risk and changes in fair value do not have an impact on our financial position, results of operations or cash flows. For variable rate debt such as our Revolving Credit Facility and Mortgage Repurchase Facility, changes in interest rates generally do not affect the fair value of the outstanding borrowing on the debt facilities, but does affect our earnings and cash flows. See “Forward-Looking Statements” above.
At December 31, 2023, we had $205.0 million of mortgage loans that HomeAmerican is obligated to repurchase under the Mortgage Repurchase Facility. Mortgage loans that HomeAmerican is obligated to repurchase under the Mortgage Repurchase Facility are accounted for as a debt financing arrangement and are reported under Mortgage Repurchase Facility in the consolidated balance sheets. The following table provides the maturities, average interest rate and estimated fair value of significant financial instruments that are sensitive to changes in interest rates at December 31, 2023. | | | | | | | | | | | | | | | | | | | | | | | | | | | | | | | | | | | | | | | | | | | | | | | |
| Maturities through December 31, | | Estimated
Fair Value |
| 2024 | | 2025 | | 2026 | | 2027 | | 2028 | | Thereafter | | Total | |
| (Dollars in thousands) | | |
| Assets: |
Mortgage loans held for sale (1) | | | | | | | | | | | | | | | |
| Fixed Rate | $ | 256,250 | | | $ | — | | | $ | — | | | $ | — | | | $ | — | | | $ | — | | | $ | 256,250 | | | $ | 258,212 | |
| Average interest rate | 5.96 | % | | | | | | | | | | | | 5.96 | % | | |
| | | | | | | | | | | | | | | |
| | | | | | | | | | | | | | | |
| Liabilities: |
| Fixed rate debt | $ | — | | | $ | — | | | $ | — | | | $ | — | | | $ | — | | | $ | 1,500,000 | | | $ | 1,500,000 | | | $ | 1,252,457 | |
| Average interest rate | | | | | | | | | | | 4.28 | % | | 4.28 | % | | |
| Mortgage facility | $ | 204,981 | | | $ | — | | | $ | — | | | $ | — | | | $ | — | | | $ | — | | | $ | 204,981 | | | $ | 204,981 | |
| Average interest rate | 6.13 | % | | | | | | | | | | | | 6.13 | % | | |
Derivative and Financial Instruments: |
| Commitments to originate mortgage loans |
| Notional amount | $ | 229,165 | | | $ | — | | | $ | — | | | $ | — | | | $ | — | | | $ | — | | | $ | 229,165 | | | $ | 5,118 | |
| Average interest rate | 5.88 | % | | | | | | | | | | | | 5.88 | % | | |
| Forward sales of mortgage backed securities |
| Notional amount | $ | 311,500 | | | $ | — | | | $ | — | | | $ | — | | | $ | — | | | $ | — | | | $ | 311,500 | | | $ | (5,388) | |
| Average interest rate | 5.57 | % | | | | | | | | | | | | 5.57 | % | | |
(1)All the amounts in this line reflect the expected 2024 disposition of these loans rather than the actual scheduled maturity dates of these mortgages.
Item 8. Financial Statements and Supplementary Data
M.D.C. HOLDINGS, INC.
INDEX TO CONSOLIDATED FINANCIAL STATEMENTS | | | | | |
| Page |
Consolidated Financial Statements | |
| |
| |
| |
| |
| |
| |
Report of Independent Registered Public Accounting Firm
To the Stockholders and the Board of Directors of M.D.C. Holdings, Inc.
Opinion on the Financial Statements
We have audited the accompanying consolidated balance sheets of M.D.C. Holdings, Inc. (the Company) as of December 31, 2023 and 2022, the related consolidated statements of operations and comprehensive income, stockholders' equity and cash flows for each of the three years in the period ended December 31, 2023, and the related notes (collectively referred to as the “consolidated financial statements”). In our opinion, the consolidated financial statements present fairly, in all material respects, the financial position of the Company at December 31, 2023 and 2022, and the results of its operations and its cash flows for each of the three years in the period ended December 31, 2023, in conformity with U.S. generally accepted accounting principles.
We also have audited, in accordance with the standards of the Public Company Accounting Oversight Board (United States) (PCAOB), the Company's internal control over financial reporting as of December 31, 2023, based on criteria established in Internal Control—Integrated Framework issued by the Committee of Sponsoring Organizations of the Treadway Commission (2013 framework), and our report dated January 30, 2024 expressed an unqualified opinion thereon.
Basis for Opinion
These financial statements are the responsibility of the Company's management. Our responsibility is to express an opinion on the Company’s financial statements based on our audits. We are a public accounting firm registered with the PCAOB and are required to be independent with respect to the Company in accordance with the U.S. federal securities laws and the applicable rules and regulations of the Securities and Exchange Commission and the PCAOB.
We conducted our audits in accordance with the standards of the PCAOB. Those standards require that we plan and perform the audit to obtain reasonable assurance about whether the financial statements are free of material misstatement, whether due to error or fraud. Our audits included performing procedures to assess the risks of material misstatement of the financial statements, whether due to error or fraud, and performing procedures that respond to those risks. Such procedures included examining, on a test basis, evidence regarding the amounts and disclosures in the financial statements. Our audits also included evaluating the accounting principles used and significant estimates made by management, as well as evaluating the overall presentation of the financial statements. We believe that our audits provide a reasonable basis for our opinion.
Critical Audit Matter
The critical audit matters communicated below are matters arising from the current period audit of the financial statements that were communicated or required to be communicated to the audit committee and that: (1) relate to accounts or disclosures that are material to the financial statements and (2) involved our especially challenging, subjective or complex judgments. The communication of critical audit matters does not alter in any way our opinion on the consolidated financial statements, taken as a whole, and we are not, by communicating the critical audit matters below, providing separate opinions on the critical audit matters or on the accounts or disclosures to which they relate.
| | | | | |
| |
| Evaluation of Insurance Reserves |
Description of the Matter | At December 31, 2023, the insurance reserves totaled $89.3 million for the estimated incurred cost of construction defect claims. As more fully described in Note 1 to the consolidated financial statements, the Company establishes the reserves for estimated losses based on actuarial studies that include known facts and interpretations of circumstances. |
| |
| Auditing the Company’s estimate of the reserves was especially challenging because the estimate is based on actuarial projections of future claims derived from historical claims data. There is significant uncertainty in the actuarial projections as the potential claim payments will be made over a long period of time, they assume that historical claims are a reasonable proxy of future claims, and the claim amounts can be significantly impacted by changes in product mix, quality of construction, units sold, and geographic location of sold units. |
| |
How We Addressed the Matter in Our Audit | We tested the Company’s internal controls over the estimation of the reserves. For example, we tested controls over the appropriateness of management’s review of the actuary’s analysis, including the underlying data used by the actuary and the consideration by management over whether historical claim information requires adjustment. |
| |
| | | | | |
| To test the estimate of reserves, our audit procedures included, among others, utilizing an internal actuarial specialist to evaluate the actuarial study utilized by management and to perform independent calculations to determine a range of reasonable reserves and to compare this range to the recorded insurance reserves. Additionally, we tested the completeness and accuracy of the underlying claims data provided to management's actuarial specialist, evaluated the change in the reserves from the prior year based upon current year trends in claim data, and performed hindsight reviews of past estimates compared to actual claim payments. |
| |
| Evaluation of Inventories for Impairment |
| |
Description of the Matter | As of and for the year ended December 31, 2023, the Company reported inventories of approximately $3.3 billion and impairment charges of $29.7 million. The Company’s inventories are primarily associated with subdivisions where it intends to construct and sell homes, including models and unsold homes. As more fully described in Note 1 to the consolidated financial statements, management evaluates inventories for impairment at each quarter end on a subdivision level basis. |
| |
| Auditing the Company’s evaluation of inventories for impairment involved subjective auditor judgment to evaluate management’s home sales revenue assumption in its future undiscounted and discounted cash flows. The estimated future home sales revenue assumption is highly judgmental as it is a forward-looking assumption that can be significantly affected by sub-market information including competition, customer demand for size and style of homes, and pricing trends in home sale orders. Differences or changes in this significant assumption could have a material impact on the Company’s analysis. |
| |
How We Addressed the Matter in Our Audit | We tested the Company’s internal controls over the inventory impairment process. For example, we tested controls over management’s review of the significant assumptions and data inputs utilized in its test for recoverability and, when applicable, its measurement of impairment losses. |
| |
| Our testing of the Company's impairment analysis included, among other procedures, evaluating the significant assumptions and operating data used to estimate the future undiscounted cash flows. To test the home sales revenue assumption included in the estimated future undiscounted cash flows we compared the home sales revenue assumption to historical subdivision operating trends, performed sensitivity analyses over the home sales revenue assumption and evaluated sub-market industry data |
/s/ Ernst & Young LLP
We have served as the Company’s auditor since 2000.
Denver, Colorado
January 30, 2024
M.D.C. HOLDINGS, INC.
Consolidated Balance Sheets | | | | | | | | | | | |
| December 31,
2023 | | December 31,
2022 |
| (Dollars in thousands, except per share amounts) |
| ASSETS | | | |
| Homebuilding: | | | |
| Cash and cash equivalents | $ | 1,475,964 | | | $ | 696,075 | |
| Restricted cash | 4,094 | | | 3,143 | |
| Marketable securities | — | | | 443,712 | |
| Trade and other receivables | 119,004 | | | 116,364 | |
| Inventories: | | | |
| Housing completed or under construction | 1,881,268 | | | 1,722,061 | |
| Land and land under development | 1,419,778 | | | 1,793,718 | |
| Total inventories | 3,301,046 | | | 3,515,779 | |
| Property and equipment, net | 82,218 | | | 63,730 | |
| Deferred tax assets, net | 38,830 | | | 49,252 | |
| Prepaids and other assets | 76,036 | | | 70,007 | |
| Total homebuilding assets | 5,097,192 | | | 4,958,062 | |
| Financial Services: | | | |
| Cash and cash equivalents | 162,839 | | | 17,877 | |
| Marketable securities | 78,250 | | | 117,388 | |
| Mortgage loans held-for-sale, net | 258,212 | | | 229,513 | |
| Other assets | 34,592 | | | 40,432 | |
| Total financial services assets | 533,893 | | | 405,210 | |
| Total Assets | $ | 5,631,085 | | | $ | 5,363,272 | |
| LIABILITIES AND EQUITY | | | |
| Homebuilding: | | | |
| Accounts payable | $ | 114,852 | | | $ | 109,218 | |
| Accrued and other liabilities | 326,478 | | | 383,406 | |
| Revolving credit facility | 10,000 | | | 10,000 | |
| Senior notes, net | 1,483,404 | | | 1,482,576 | |
| Total homebuilding liabilities | 1,934,734 | | | 1,985,200 | |
| Financial Services: | | | |
| Accounts payable and accrued liabilities | 113,485 | | | 110,536 | |
| Mortgage repurchase facility | 204,981 | | | 175,752 | |
| Total financial services liabilities | 318,466 | | | 286,288 | |
| Total Liabilities | 2,253,200 | | | 2,271,488 | |
| Stockholders' Equity | | | |
| Preferred stock, $0.01 par value; 25,000,000 shares authorized; none issued or outstanding | — | | | — | |
| Common stock, $0.01 par value; 250,000,000 shares authorized; 74,661,479 and 72,585,596 issued and outstanding at December 31, 2023 and December 31, 2022, respectively | 747 | | | 726 | |
| Additional paid-in-capital | 1,824,434 | | | 1,784,173 | |
| Retained earnings | 1,552,653 | | | 1,306,885 | |
| Accumulated other comprehensive income | 51 | | | — | |
| Total Stockholders' Equity | 3,377,885 | | | 3,091,784 | |
| Total Liabilities and Stockholders' Equity | $ | 5,631,085 | | | $ | 5,363,272 | |
The accompanying Notes are an integral part of these Consolidated Financial Statements.
M.D.C. HOLDINGS, INC.
ConsolidatedStatements ofOperationsand Comprehensive Income | | | | | | | | | | | | | | | | | |
| Year Ended December 31, |
| 2023 | | 2022 | | 2021 |
| (Dollars in thousands, except per share amounts) |
| Homebuilding: | | | | | |
| Home sale revenues | $ | 4,520,296 | | | $ | 5,586,264 | | | $ | 5,102,456 | |
| Home cost of sales | (3,684,487) | | | (4,214,379) | | | (3,924,093) | |
| Inventory impairments | (29,700) | | | (121,875) | | | (1,600) | |
| Total cost of sales | (3,714,187) | | | (4,336,254) | | | (3,925,693) | |
| Gross margin | 806,109 | | | 1,250,010 | | | 1,176,763 | |
| Selling, general and administrative expenses | (429,894) | | | (536,395) | | | (493,993) | |
| Loss on debt retirement | — | | | — | | | (23,571) | |
| Interest and other income | 73,567 | | | 10,843 | | | 5,965 | |
| Other income (expense), net | 350 | | | (32,991) | | | (5,476) | |
| Homebuilding pretax income | 450,132 | | | 691,467 | | | 659,688 | |
| | | | | |
| Financial Services: | | | | | |
| Revenues | 122,570 | | | 131,723 | | | 152,212 | |
| Expenses | (62,942) | | | (71,327) | | | (64,477) | |
| Other income (expense), net | 16,345 | | | 7,991 | | | 4,271 | |
| Financial services pretax income | 75,973 | | | 68,387 | | | 92,006 | |
| | | | | |
| Income before income taxes | 526,105 | | | 759,854 | | | 751,694 | |
| Provision for income taxes | (125,100) | | | (197,715) | | | (178,037) | |
| Net income | $ | 401,005 | | | $ | 562,139 | | | $ | 573,657 | |
| | | | | |
| Other comprehensive income net of tax: | | | | | |
| Unrealized gain related to available-for-sale debt securities | $ | 51 | | | $ | — | | | $ | — | |
| Other comprehensive income | 51 | | | — | | | — | |
| Comprehensive income | $ | 401,056 | | | $ | 562,139 | | | $ | 573,657 | |
| | | | | |
| Earnings per share: | | | | | |
| Basic | $ | 5.42 | | | $ | 7.87 | | | $ | 8.13 | |
| Diluted | $ | 5.29 | | | $ | 7.67 | | | $ | 7.83 | |
| | | | | |
| Weighted average common shares outstanding: | | | | | |
| Basic | 73,505,508 | | | 71,035,558 | | | 70,174,281 | |
| Diluted | 75,357,965 | | | 72,943,844 | | | 72,854,601 | |
The accompanying Notes are an integral part of these Consolidated Financial Statements.
M.D.C. HOLDINGS, INC.
Consolidated Statements of Stockholders' Equity
(Dollars in thousands, except share amounts) | | | | | | | | | | | | | | | | | | | | | | | | | | | | | | | | | | | |
| Common Stock | | Additional
Paid-in
Capital | | Retained
Earnings | | Accumulated
Other
Comprehensive
Income | | Total |
| Shares | | Amount | | | | |
| Balance at December 31, 2020 | 64,851,126 | | | $ | 649 | | | $ | 1,407,597 | | | $ | 711,666 | | | $ | — | | | $ | 2,119,912 | |
| Net Income | — | | | — | | | — | | | 573,657 | | | — | | | 573,657 | |
| Shares issued under stock-based compensation programs, net | 640,869 | | | 6 | | | (16,222) | | | — | | | — | | | (16,216) | |
| Cash dividends declared | — | | | — | | | — | | | (117,842) | | | — | | | (117,842) | |
| Stock dividend declared | 5,192,776 | | | 52 | | | 279,579 | | | (280,318) | | | — | | | (687) | |
| Stock-based compensation expense | — | | | — | | | 38,322 | | | — | | | — | | | 38,322 | |
| Forfeiture of restricted stock | (16,678) | | | — | | | — | | | — | | | — | | | — | |
| Balance at December 31, 2021 | 70,668,093 | | | $ | 707 | | | $ | 1,709,276 | | | $ | 887,163 | | | $ | — | | | $ | 2,597,146 | |
| Net Income | — | | | — | | | — | | | 562,139 | | | — | | | 562,139 | |
| Shares issued under stock-based compensation programs, net | 1,931,633 | | | 19 | | | 16,821 | | | — | | | — | | | 16,840 | |
| Cash dividends declared | — | | | — | | | — | | | (142,417) | | | — | | | (142,417) | |
| Stock-based compensation expense | — | | | — | | | 58,076 | | | — | | | — | | | 58,076 | |
| Forfeiture of restricted stock | (14,130) | | | — | | | — | | | | | — | | | — | |
| Balance at December 31, 2022 | 72,585,596 | | | $ | 726 | | | $ | 1,784,173 | | | $ | 1,306,885 | | | $ | — | | | $ | 3,091,784 | |
| Net Income | — | | | — | | | — | | | 401,005 | | | — | | | 401,005 | |
| Other comprehensive income (loss) | — | | | — | | | — | | | — | | | 51 | | | 51 | |
| Shares issued under stock-based compensation programs, net | 2,079,536 | | | 21 | | | 20,752 | | | — | | | — | | | 20,773 | |
| Cash dividends declared | — | | | — | | | — | | | (155,237) | | | — | | | (155,237) | |
| Stock-based compensation expense | — | | | — | | | 19,509 | | | — | | | — | | | 19,509 | |
| Forfeiture of restricted stock | (3,653) | | | — | | | — | | | — | | | — | | | — | |
| Balance at December 31, 2023 | 74,661,479 | | | $ | 747 | | | $ | 1,824,434 | | | $ | 1,552,653 | | | $ | 51 | | | $ | 3,377,885 | |
The accompanying Notes are an integral part of these Consolidated Financial Statements.
M.D.C. HOLDINGS, INC.
Consolidated Statements of Cash Flows | | | | | | | | | | | | | | | | | |
| Year Ended December 31, |
| 2023 | | 2022 | | 2021 |
| (Dollars in thousands) |
| Operating Activities: | | | | | |
| Net income | $ | 401,005 | | | $ | 562,139 | | | $ | 573,657 | |
| Adjustments to reconcile net income to net cash provided by (used in) operating activities: | | | | | |
| Stock-based compensation expense | 23,468 | | | 60,985 | | | 39,655 | |
| Depreciation and amortization | 25,553 | | | 27,751 | | | 31,666 | |
| Inventory impairments | 29,700 | | | 121,875 | | | 1,600 | |
| Project abandonment costs | (45) | | | 33,129 | | | 5,417 | |
| | | | | |
| Gain on sale of other assets | — | | | — | | | (2,014) | |
| Amortization of discount of marketable debt securities | (29,673) | | | (4,290) | | | — | |
| Loss on retirement of debt | — | | | — | | | 23,571 | |
| Deferred income tax expense | 10,408 | | | (31,310) | | | (6,488) | |
| Net changes in assets and liabilities: | | | | | |
| Trade and other receivables | 21,986 | | | (21,784) | | | (25,334) | |
| Mortgage loans held-for-sale, net | (28,699) | | | 53,016 | | | (49,973) | |
| Housing completed or under construction | (163,877) | | | 186,265 | | | (431,926) | |
| Land and land under development | 349,783 | | | (95,402) | | | (502,781) | |
| Prepaids and other assets | (3,886) | | | 31,736 | | | 8,545 | |
| Accounts payable and accrued liabilities | (74,093) | | | (18,464) | | | 126,415 | |
| Net cash provided by (used in) operating activities | 561,630 | | | 905,646 | | | (207,990) | |
| Investing Activities: | | | | | |
| Purchases of marketable securities | (1,166,412) | | | (656,810) | | | — | |
| | | | | |
| Maturities of marketable securities | 1,679,000 | | | 100,000 | | | — | |
| Proceeds from sale of other assets | — | | | — | | | 2,014 | |
| Purchases of property and equipment | (43,145) | | | (29,075) | | | (29,693) | |
| Net cash provided by (used in) investing activities | 469,443 | | | (585,885) | | | (27,679) | |
| Financing Activities: | | | | | |
| Advances on mortgage repurchase facility, net | 29,229 | | | (80,548) | | | 53,910 | |
| | | | | |
| Payments of senior notes | — | | | — | | | (276,951) | |
| Proceeds from issuance of senior notes | — | | | — | | | 694,662 | |
| Dividend payments | (155,237) | | | (142,417) | | | (118,529) | |
| Payments of deferred debt issuance costs | (36) | | | — | | | (1,720) | |
| Issuance of shares under stock-based compensation programs, net | 20,773 | | | 16,840 | | | (16,216) | |
| Net cash provided by (used in) financing activities | (105,271) | | | (206,125) | | | 335,156 | |
| Net increase in cash, cash equivalents and restricted cash | 925,802 | | | 113,636 | | | 99,487 | |
| Cash, cash equivalents and restricted cash: | | | | | |
| Beginning of year | 717,095 | | | 603,459 | | | 503,972 | |
| End of year | $ | 1,642,897 | | | $ | 717,095 | | | $ | 603,459 | |
| Reconciliation of cash, cash equivalents and restricted cash: | | | | | |
| Homebuilding: | | | | | |
| Cash and cash equivalents | $ | 1,475,964 | | | $ | 696,075 | | | $ | 485,839 | |
| Restricted cash | 4,094 | | | 3,143 | | | 12,799 | |
| Financial Services: | | | | | |
| Cash and cash equivalents | 162,839 | | | 17,877 | | | 104,821 | |
| Total cash, cash equivalents and restricted cash | $ | 1,642,897 | | | $ | 717,095 | | | $ | 603,459 | |
The accompanying Notes are an integral part of these Consolidated Financial Statements
1. Summary of Significant Accounting Policies
Principles of Consolidation. The Consolidated Financial Statements of M.D.C. Holdings, Inc. ("MDC," “the Company," “we,” “us,” or “our” which refers to M.D.C. Holdings, Inc. and its subsidiaries) include the accounts of MDC and its wholly owned subsidiaries. All intercompany balances and transactions have been eliminated in consolidation. Certain prior year balances have been reclassified to conform to the current year’s presentation.
Description of Business. We have homebuilding operations in Alabama, Arizona, California, Colorado, Florida, Idaho, Maryland, Nevada, New Mexico, Oregon, Pennsylvania, Tennessee, Texas, Utah, Virginia and Washington. The primary functions of our homebuilding operations include land acquisition and development, home construction, purchasing, marketing, merchandising, sales and customer service. We build and sell primarily single-family detached homes, which are designed and built to meet local customer preferences. We are the general contractor for all of our projects and retain subcontractors for site development and home construction.
Our financial services operations consist of HomeAmerican Mortgage Corporation (“HomeAmerican”), which originates mortgage loans, primarily for our homebuyers, American Home Insurance Agency, Inc. (“American Home Insurance”), which offers third-party insurance products to our homebuyers, and American Home Title and Escrow Company (“American Home Title”), which provides title agency services to the Company and our homebuyers in Colorado, Florida, Maryland, Nevada, Pennsylvania and Virginia. The financial services operations also include Allegiant Insurance Company, Inc., A Risk Retention Group (“Allegiant”), which provides insurance coverage primarily to our homebuilding subsidiaries on homes that have been delivered and most of our subcontractors for completed work on those delivered homes, and StarAmerican Insurance Ltd. (“StarAmerican”), a wholly owned subsidiary of MDC, which is a re-insurer of Allegiant claims.
Proposed Merger. On January 17, 2024, the Company entered into an Agreement and Plan of Merger, dated as of January 17, 2024 (the “Merger Agreement”), with SH Residential Holdings, LLC (“Parent”), Clear Line, Inc., a wholly owned subsidiary of Parent (“Merger Sub”), and, solely for the purposes of Section 6.2, Section 6.17 and Section 9.15 of the Merger Agreement, Sekisui House, Ltd. (“Guarantor”). Refer to Note 24, “Subsequent Events” for further information.
Presentation. Our balance sheet presentation is unclassified due to the fact that certain assets and liabilities have both short and long-term characteristics.
Use of Accounting Estimates. The preparation of financial statements in conformity with accounting principles generally accepted in the United States requires management to make estimates and assumptions that affect the reported amounts of assets and liabilities and disclosure of contingent assets and liabilities at the date of the financial statements and the reported amounts of revenues and expenses during the reporting period. Actual results could differ from those estimates.
Cash and Cash Equivalents. The Company periodically invests funds in highly liquid investments with an original maturity of three months or less, such as U.S. government securities, commercial bank deposits, commercial paper, certificates of deposit, money market funds and time deposits, which are included in cash and cash equivalents in the consolidated balance sheets and consolidated statements of cash flows.
Marketablesecurities. Our debt securities consist of U.S. government treasury securities with original maturities upon acquisition of less than six months and are treated as available-for-sale investments and, as such, are recorded at fair value with all changes in fair value initially recorded through other comprehensive income. Debt securities are reviewed on a regular basis for impairment.
Restricted Cash. We receive cash earnest money deposits from our customers who enter into home sale contracts. In certain states we are restricted from using such deposits for general purposes, unless we take measures to release state imposed restrictions on such deposits received from homebuyers, which may include posting blanket surety bonds. We had $4.1 million and $3.1 million in restricted cash related to homebuyer deposits at December 31, 2023 and 2022, respectively.
Trade and Other Receivables. Trade and other receivables primarily includes home sale receivables, which reflects cash to be received from title companies or outside brokers associated with closed homes. Generally, we will receive cash from title companies and outside brokers within a few days of the home being closed. At December 31, 2023 and 2022, receivables from contracts with customers were $73.9 million and $85.1 million, respectively, and are included in trade and other receivables on the accompanying consolidated balance sheets.
Mortgage Loans Held-for-Sale, net. Mortgage loans held-for-sale are recorded at fair value based on quoted market prices and estimated market prices received from a third-party. Using fair value allows an offset of the changes in fair values of the mortgage loans and the derivative and financial instruments used to hedge them without having to comply with the requirements for hedge accounting.
Inventories. Our inventories are primarily associated with communities where we intend to construct and sell homes, including models and unsold homes. Components of housing completed or under construction primarily include: (1) land costs transferred from land and land under development; (2) direct construction costs associated with a house; (3) real property taxes, engineering fees, permits and other fees; (4) capitalized interest; and (5) indirect construction costs, which include field construction management salaries and benefits, utilities and other construction related costs. Costs capitalized to land and land under development primarily include: (1) land costs; (2) land development costs; (3) entitlement costs; (4) capitalized interest; (5) engineering fees; and (6) title insurance, real property taxes and closing costs directly related to the purchase of the land parcel. Land costs are transferred from land and land under development to housing completed or under construction at the point in time that construction of a home on an owned lot begins.
In accordance with Accounting Standards Codification (“ASC”) Topic 360, Property, Plant, and Equipment (“ASC 360”), homebuilding inventories, excluding those classified as held for sale, are carried at cost unless events and circumstances indicate that the carrying value of the underlying subdivision may not be recoverable. We evaluate inventories for impairment at each quarter end on a subdivision level basis as each such subdivision represents the lowest level of identifiable cash flows. In making this determination, we review, among other things, the following for each subdivision:
•actual and trending “Operating Margin” (which is defined as home sale revenues less home cost of sales and all incremental costs associated directly with the subdivision, including sales commissions and marketing costs);
•forecasted Operating Margin for homes in backlog;
•actual and trending net home orders;
•homes available for sale;
•market information for each sub-market, including competition levels, home foreclosure levels, the size and style of homes currently being offered for sale and lot size; and
•known or probable events indicating that the carrying value may not be recoverable.
If events or circumstances indicate that the carrying value of our inventory may not be recoverable, assets are reviewed for impairment by comparing the undiscounted estimated future cash flows from an individual subdivision (including capitalized interest) to its carrying value. If the undiscounted future cash flows are less than the subdivision’s carrying value, the carrying value of the subdivision is written down to its then estimated fair value. We generally determine the estimated fair value of each subdivision by calculating the present value of the estimated future cash flows using discount rates, which are Level 3 inputs (see Note 6, Fair Value Measurements, in the notes to the financial statements for definitions of fair value inputs), that are commensurate with the risk of the subdivision under evaluation. The evaluation for the recoverability of the carrying value of the assets for each individual subdivision can be impacted significantly by our estimates of future home sale revenues, home construction costs, and development costs per home, all of which are Level 3 inputs.
If land is classified as held for sale, in accordance with ASC 360, we measure it at the lower of the carrying value or fair value less estimated costs to sell. In determining fair value, we primarily rely upon the most recent negotiated price which is a Level 2 input (see Note 6, Fair ValueMeasurements, for definitions of fair value inputs). If a negotiated price is not available, we will consider several factors including, but not limited to, current market conditions, recent comparable sales transactions and market analysis studies. If the fair value less estimated costs to sell is lower than the current carrying value, the land is impaired down to its estimated fair value less costs to sell.
Costs Related to Sales Facilities. Costs related to interior and exterior upgrades to the home that will be sold as part of the home, such as wall treatments and additional upgraded landscaping, are recorded as housing completed or under construction. Costs to furnish and ready the model home or on-site sales facility that will not be sold as part of the model home, such as furniture, construction of the sales facility parking lot or construction of the sales center, are capitalized as property and equipment, net. Other costs incurred related to the marketing of the community and readying the model home for sale are expensed as incurred.
Property and Equipment, net. Property and equipment is carried at cost less accumulated depreciation. For property and equipment related to on-site sales facilities, depreciation is recorded using the units of production method as homes are delivered. For all other property and equipment, depreciation is recorded using a straight-line method over the estimated useful lives of the related assets, which range from 2 to 16 years. Depreciation and amortization expense for property and equipment was $23.9 million, $26.4 million and $30.2 million for the years ended December 31, 2023, 2022 and 2021, respectively, which is recorded in selling, general and administrative expenses in the homebuilding or expenses in the financial services sections of our consolidated statements of operations and comprehensive income.
The following table sets forth the cost and carrying value of our homebuilding property and equipment by major asset category. | | | | | | | | | | | | | | | | | | | | |
| | Cost | | Accumulated
Depreciation and
Amortization | | Carrying
Value |
| December 31, 2023: | | (Dollars in thousands) |
| Sales facilities | | $ | 88,929 | | | $ | (52,647) | | | $ | 36,282 | |
| Aircraft | | 54,317 | | | (13,298) | | | 41,019 | |
| Computer software and equipment | | 25,617 | | | (23,181) | | | 2,436 | |
| Leasehold improvements | | 9,481 | | | (7,747) | | | 1,734 | |
| Other | | 3,384 | | | (2,637) | | | 747 | |
| Total | | $ | 181,728 | | | $ | (99,510) | | | $ | 82,218 | |
| | | | | | |
| December 31, 2022: | | | | | | |
| Sales facilities | | $ | 76,171 | | | $ | (36,113) | | | $ | 40,058 | |
| Aircraft | | 31,230 | | | (12,150) | | | 19,080 | |
| Computer software and equipment | | 24,072 | | | (22,260) | | | 1,812 | |
| Leasehold improvements | | 8,884 | | | (7,095) | | | 1,789 | |
| Other | | 3,230 | | | (2,239) | | | 991 | |
| Total | | $ | 143,587 | | | $ | (79,857) | | | $ | 63,730 | |
Deferred Tax Assets, net. Deferred income taxes reflect the net tax effects of temporary differences between (1) the carrying amounts of the assets and liabilities for financial reporting purposes and (2) the amounts used for income tax purposes. Deferred tax assets and liabilities are measured using current enacted tax rates in effect in the years in which those temporary differences are expected to reverse. A valuation allowance is recorded against a deferred tax asset if, based on the weight of available evidence, it is more-likely-than-not (a likelihood of more than 50%) that some portion, or all, of the deferred tax asset will not be realized.
Variable Interest Entities. In accordance with ASC Topic 810, Consolidation (“ASC 810”), we analyze our land option contracts and other contractual arrangements to determine whether the corresponding land sellers are variable interest entities (“VIEs”) and, if so, whether we are the primary beneficiary. Although we do not have legal title to the optioned land, ASC 810 requires a company to consolidate a VIE if the company is determined to be the primary beneficiary. In determining whether we are the primary beneficiary, we consider, among other things, whether we have the power to direct the activities of the VIE that most significantly impact VIE’s economic performance, including, but not limited to, determining or limiting the scope or purpose of the VIE, selling or transferring property owned or controlled by the VIE, or arranging financing for the VIE. We also consider whether we have the obligation to absorb losses of the VIE or the right to receive benefits from the VIE. We have concluded that, as of December 31, 2023 and 2022, we were not the primary beneficiary of any VIEs from which we are purchasing land under land option contracts.
Goodwill. In accordance with ASC Topic 350, Intangibles–Goodwill and Other(“ASC 350”), we evaluate goodwill for possible impairment annually or more frequently if events or changes in circumstances indicate that the carrying amount of such assets may not be recoverable. We use a three-step process to assess the realizability of goodwill. The first step is a qualitative assessment that analyzes current economic indicators associated with a particular reporting unit. For example, we analyze changes in economic, market and industry conditions, business strategy, cost factors, and financial performance, among others, to determine if there are indicators of a significant decline in the fair value of a particular reporting unit. If the qualitative assessment indicates a stable or improved fair value, no further testing is required.
If a qualitative assessment indicates it is more likely than not that the fair value of a reporting unit is less than its carrying amount, we will proceed to the second step where we calculate the fair value of a reporting unit based on discounted future probability-weighted cash flows. If this step indicates that the carrying value of a reporting unit is in excess of its fair value, we will proceed to the third step where the fair value of the reporting unit will be allocated to assets and liabilities as they would in a business combination. Impairment occurs when the carrying amount of goodwill exceeds its estimated fair value calculated in the third step.
Based on our analysis, we have concluded that as of December 31, 2023 and 2022, our goodwill was not impaired.
Liability for Unrecognized Tax Benefits. ASC Topic 740, Income Taxes, regarding liabilities for unrecognized tax benefits provides guidance for the recognition and measurement in financial statements of uncertain tax positions taken or expected to be taken in a tax return.
The evaluation of a tax position is a two-step process, the first step being recognition. We determine whether it is more-likely-than-not that a tax position will be sustained upon tax examination, including resolution of any related appeals or litigation, based on the technical merits of the position. The technical merits of a tax position derive from both statutory and judicial authority (legislation and statutes, legislative intent, regulations, rulings, and case law) and their applicability to the facts and circumstances of the tax position. If a tax position does not meet the more-likely-than-not recognition threshold, the benefit of that position is not recognized in the financial statements.
The second step is measurement. A tax position that meets the more-likely-than-not recognition threshold is measured to determine the amount of benefit to recognize in the financial statements. The tax position is measured as the largest amount of benefit that is greater than 50 percent likely of being realized upon ultimate resolution with a taxing authority. Once the gross unrecognized tax benefit is determined, we also accrue for any interest and penalties, as well as any offsets expected from resultant amendments to federal or state tax returns. We record the aggregate effect of these items in income tax expense in the consolidated statements of operations and comprehensive income. To the extent this tax position would be offset against a similar deferred tax asset for a net operating loss carryforward, a similar tax loss or a tax credit carryforward if such settlement is required or expected in the event the uncertain tax position is disallowed, the liability is treated as a reduction to the related deferred tax asset for a net operating loss carryforward, a similar tax loss or a tax credit carryforward. Otherwise, we record the corresponding liability in accrued and other liabilities in our consolidated balance sheets.
Warranty Accrual. Our homes are sold with limited third-party warranties and, under our agreement with the issuer of the third-party warranties, we are responsible for performing all of the work for the first two years of the warranty coverage, and paying for certain work required to be performed subsequent to year two. We record accruals for general and structural warranty claims, as well as accruals for known, unusual warranty-related expenditures. Our warranty accrual is recorded based upon historical payment experience in an amount estimated to be adequate to cover expected costs of materials and outside labor during warranty periods. The determination of the warranty accrual rate for closed homes and the evaluation of our warranty accrual balance at period end are based on an internally developed analysis that includes known facts and interpretations of circumstances, including, among other things, our trends in historical warranty payment levels and warranty payments for claims not considered to be normal and recurring.
Warranty payments are recorded against the warranty accrual. Additional reserves may be established for known, unusual warranty-related expenditures not covered through the independent warranty accrual analysis performed by us. Warranty payments incurred for an individual house may differ from the related reserve established for the home at the time it was closed. The actual disbursements for warranty claims are evaluated in the aggregate to determine if an adjustment to the historical warranty accrual should be recorded.
We assess the reasonableness and adequacy of the reserve and the per-unit reserve amount originally included in home cost of sales, as well as the timing of the reversal of any excess reserve on a quarterly basis, using historical payment data and other relevant information. Our warranty accrual is included in accrued and other liabilities in the homebuilding section of our consolidated balance sheets and adjustments to our warranty accrual are recorded as an increase or reduction to home cost of sales in the homebuilding section of our consolidated statements of operations and comprehensive income. See Note 12 to the Consolidated Financial Statements.
Insurance Reserves. The establishment of reserves for estimated losses associated with insurance policies issued by Allegiant and re-insurance agreements issued by StarAmerican are based on actuarial studies that include known facts and interpretations of circumstances, including our experience with similar cases and historical trends involving claim payment patterns, pending levels of unpaid claims, product mix or concentration, claim severity, frequency patterns depending on the business conducted, and changing regulatory and legal environments. It is possible that changes in the insurance payment
experience used in estimating our ultimate insurance losses could have a material impact on our insurance reserves. See Note 13, Insurance and Construction Defect Claim Reserves, to the Consolidated Financial Statements.
Reserves for Construction Defect Claims. The establishment of reserves for estimated losses to be incurred by our homebuilding subsidiaries associated with (1) the self-insured retention (“SIR”) portion of construction defect claims that are expected to be covered under insurance policies with Allegiant and (2) the entire cost of any construction defect claims that are not expected to be covered by insurance policies with Allegiant are based on actuarial studies that include known facts similar to those established for our insurance reserves. It is possible that changes in the payment experience used in estimating our ultimate losses for construction defect claims could have a material impact on our reserves. See Note 13, Insurance and Construction Defect Claim Reserves, to the Consolidated Financial Statements.
Litigation Reserves. We and certain of our subsidiaries have been named as defendants in various cases. We reserve for estimated exposure with respect to these cases based upon currently available information on each case. See Note 17, Commitments and Contingencies, to the Consolidated Financial Statements.
Derivative and Financial Instruments. We are exposed to market risks related to fluctuations in interest rates on mortgage loans held-for-sale, mortgage interest rate lock commitments, marketable securities and debt. Financial instruments utilized in the normal course of business by HomeAmerican include forward sales of mortgage-backed securities, which are commitments to sell a specified financial instrument at a specified future date for a specified price, mandatory delivery forward loan sale commitments, which are obligations of an investor to buy loans at a specified price within a specified time period, and best-effort delivery forward loan sale commitments, which are obligations of an investor to buy loans at a specified price subject to the underlying mortgage loans being funded and closed. These instruments are the only significant derivative and financial instruments utilized by MDC to hedge against fluctuations in interest rates. For forward sales commitments, forward sales of mortgage-backed securities and commitments to originate mortgage loans that are still outstanding at the end of a reporting period, we record the changes in fair value of these financial instruments in revenues in the financial services section of the consolidated statements of operations and comprehensive income with an offset to either other assets or accounts payable and accrued liabilities in the financial services section of our consolidated balance sheets, depending on the nature of the change. For further discussion of our policies regarding interest rate lock commitments, see our “Revenue Recognition for HomeAmerican” accounting policy section below. See Note 18, Derivative and Financial Instruments, to the Consolidated Financial Statements.
Revenue Recognition for Homebuilding Segments. We recognize home sale revenues from home deliveries when we have satisfied the performance obligations within the sales agreement, which is generally when title to and possession of the home are transferred to the buyer at the home closing date. Revenue from a home delivery includes the base sales price and any purchased options and upgrades and is reduced for any sales price incentives.
In certain states where we build, we are not always able to complete certain outdoor features (such as landscaping or pools) prior to closing the home. To the extent these separate deliverables are not complete upon the closing of a home, we defer home sale revenues related to incomplete outdoor features, and recognize that revenue upon completion of the outdoor features.
Revenue expected to be recognized in any future year related to remaining performance obligations (if any) and contract liabilities expected to be recognized as revenue, excluding revenue pertaining to contracts that have an original expected duration of one year or less, is not material.
Revenue Recognition for HomeAmerican. Revenues recorded by HomeAmerican primarily reflect (1) origination fees and (2) the corresponding sale, or expected future sale, of a loan, which will include the estimated earnings from either the release or retention of a loan’s servicing rights. Origination fees are recognized when a loan is originated. When an interest rate lock commitment is made to a customer, we record the expected gain on sale of the mortgage, plus the estimated earnings from the expected sale of the associated servicing rights, adjusted for a pull-through percentage (which is defined as the likelihood that an interest rate lock commitment will be originated), as revenue. As the interest rate lock commitment gets closer to being originated, the expected gain on the sale of that loan plus its servicing rights is updated to reflect current market value and the increase or decrease in the fair value of that interest rate lock commitment is recorded through revenues. At the same time, the expected pull-through percentage of the interest rate lock commitment to be originated is updated based upon current market conditions and, if there has been a change, revenues are adjusted as necessary. After origination, our mortgage loans, generally including their servicing rights, are sold to third-party purchasers in accordance with sale agreements entered into by us with a third-party purchaser of the loans. We make representations and warranties with respect to the status of loans transferred in the sale agreements. The sale agreements generally include statements acknowledging the transfer of the loans is intended by both parties to constitute a sale. Sale of a mortgage loan has occurred when the following criteria, among others, have been met:
(1) fair consideration has been paid for transfer of the loan by a third party in an arms-length transaction, (2) all the usual risks and rewards of ownership that are in substance a sale have been transferred by us to the third party purchaser; and (3) we do not have a substantial continuing involvement with the mortgage loan.
We measure mortgage loans held-for-sale at fair value with the changes in fair value being reported in earnings at each reporting date. Net gains on the sale of mortgage loans are included as a component of revenues in the financial services section of the consolidated statements of operations and comprehensive income.
Home Cost of Sales. Home cost of sales includes the specific construction costs of each home and all applicable land acquisition, land development and related costs, warranty costs and finance and closing costs, including closing cost incentives. We use the specific identification method for the purpose of accumulating home construction costs and allocate costs to each lot within a subdivision associated with land acquisition and land development based upon relative fair value of the lots prior to home construction. Lots within a subdivision typically have comparable fair values, and, as such, we generally allocate costs equally to each lot within a subdivision. We record all home cost of sales when a home is closed and performance obligations have been completed on a house-by-house basis.
When a home is closed, we may not have paid for all costs necessary to complete the construction of the home. This includes (1) construction that has been completed on a house but has not yet been billed or (2) work still to be performed on a home (such as limited punch-list items or certain outdoor features). For each of these items, we create an estimate of the total expected costs to be incurred and, with the exclusion of outdoor features, the estimated total costs for those items, less any amounts paid to date, are included in home cost of sales. Actual results could differ from such estimates. For incomplete outdoor features, we will defer the revenue and any cost of sales on this separate stand-alone deliverable until complete.
Stock-Based Compensation Expense. In accordance with ASC Topic 718, Compensation—Stock Compensation (“ASC 718”), stock-based compensation expense for all share-based payment awards is based on the grant date fair value. For stock option awards granted that do not contain a market condition, we estimate the fair value using a Black-Scholes option pricing model. For any stock option awards granted that contain a market condition, we estimate the fair value using a Monte Carlo simulation model. We recognize expense for share-based payment awards based on their varying vesting conditions as follows:
•Awards with service-based vesting conditions only – Expense is recognized on a straight-line basis over the requisite service period of the award.
•Awards with performance-based vesting conditions – Expense is not recognized until it is determined that it is probable the performance-based conditions will be met. When achievement of a performance-based condition is probable, a catch-up of expense will be recorded as if the award had been vesting on a straight-line basis from the award date. The award will continue to be expensed on a straight-line basis until the probability of achieving the performance-based condition changes, if applicable.
•Awards with no service or performance based vesting conditions - Expense is recognized immediately upon the grant date of the award.
An annual forfeiture rate is estimated at the time of grant for all share-based payment awards that contain service and/or performance conditions. That rate is revised, if necessary, in subsequent periods if the actual forfeiture rate differs from our estimate.
Earnings (Loss) Per Common Share. For purposes of calculating earnings (loss) per share (“EPS”), a company that has participating security holders (for example, holders of unvested restricted stock that have non-forfeitable dividend rights) is required to utilize the two-class method for calculating earnings per share unless the treasury stock method results in lower EPS. The two-class method is an allocation of earnings/(loss) between the holders of common stock and a company’s participating security holders. Under the two-class method, earnings/(loss) for the reporting period are allocated between common shareholders and other security holders based on their respective rights to receive distributed earnings (i.e., dividends) and undistributed earnings (i.e., net income/(loss)). Our common shares outstanding are comprised of shareholder owned common stock and shares of unvested restricted stock held by participating security holders. Basic EPS is calculated by dividing income or loss attributable to common stockholders by the weighted average number of shares of common stock outstanding, excluding participating shares in accordance with ASC 260. To calculate diluted EPS, basic EPS is further adjusted to include the effect of potentially dilutive stock options outstanding and contingently issuable equity awards.
2. Recently Issued Accounting Standards
Adoption of New Accounting Standards
In March 2020, the Financial Accounting Standards Board ("FASB") issued Accounting Standard Update ("ASU") 2020-04, “Reference Rate Reform (Topic 848),” as amended by ASU 2021-01 in January 2021 and ASU 2022-06 in December 2022, directly addressing the effects of reference rate reform on financial reporting as a result of the cessation of the publication of certain LIBOR rates beginning December 31, 2021, with complete elimination of the publication of the LIBOR rates by June 30, 2023. The guidance provides optional expedients and exceptions for applying GAAP to contracts, hedging relationships and other transactions affected by reference rate reform by virtue of referencing LIBOR or another reference rate expected to be discontinued. This guidance became effective on March 12, 2020 and can be adopted no later than December 31, 2024, with early adoption permitted. We adopted this amendment in the second quarter of 2023. The adoption of ASU 2020-04, as amended by ASU 2021-01 and ASU 2022-06, did not have a material impact on our consolidated balance sheet or consolidated statement of operations and comprehensive income.
Recent Accounting Pronouncements Not Yet Adopted
In November 2023, the FASB issued ASU 2023-07, "Segment Reporting (Topic 280): Improvements to Reportable Segment Disclosures (“ASU 2023-07”), which is intended to improve reportable segment disclosure requirements, primarily through additional and more detailed information about a reportable segment's expenses. The guidance is effective for fiscal years beginning after December 15, 2023, and interim periods within fiscal years beginning after December 15, 2024, with early adoption permitted. The guidance is to be applied retrospectively to all prior periods presented in the financial statements. Upon transition, the segment expense categories and amounts disclosed in the prior periods should be based on the significant segment expense categories identified and disclosed in the period of adoption. We are currently evaluating the potential impact of adopting this new guidance on our consolidated financial statements and related disclosures.
In December 2023, the FASB issued ASU 2023-09, “Income Taxes (Topic 740): Improvements to Income Tax Disclosures” (“ASU 2023-09”), which is intended to enhance the transparency and decision usefulness of income tax disclosures. This amendment modifies the rules on income tax disclosures to require entities to disclose (1) specific categories in the rate reconciliation and additional information for reconciling items that meet a quantitative threshold, (2) the amount of income taxes paid (net of refunds received) (disaggregated by federal, state, and foreign taxes) as well as individual jurisdictions in which income taxes paid is equal to or greater than 5 percent of total income taxes paid net of refunds. (3) the income or loss from continuing operations before income tax expense or benefit (disaggregated between domestic and foreign) and (4) income tax expense or benefit from continuing operations (disaggregated by federal, state and foreign). The guidance is effective for annual periods beginning after December 15, 2024, with early adoption permitted for annual financial statements that have not yet been issued or made available for issuance. ASU 2023-09 should be applied on a prospective basis, while retrospective application is permitted. We are currently evaluating the potential impact of adopting this new guidance on our consolidated financial statements and related disclosures.
3. SupplementalIncome Statement and Cash FlowDisclosure
The table below details homebuilding interest and other income and financial services other income (expense), net: | | | | | | | | | | | | | | | | | |
| Year Ended December 31, |
| 2023 | | 2022 | | 2021 |
| Homebuilding | (Dollars in thousands) |
| Interest and other income | | | | | |
| Interest income | $ | 70,458 | | | $ | 9,166 | | | $ | 1,502 | |
| Other income | 3,109 | | | 1,677 | | | 4,463 | |
| Total | $ | 73,567 | | | $ | 10,843 | | | $ | 5,965 | |
| Financial Services | | | | | |
| Other income (expense), net | | | | | |
| Interest income | $ | 16,345 | | | $ | 7,991 | | | $ | 4,271 | |
| Total | $ | 16,345 | | | $ | 7,991 | | | $ | 4,271 | |
The table below sets forth supplemental disclosures of cash flow information and non-cash investing and financing activities. | | | | | | | | | | | | | | | | | |
| Year Ended December 31, |
| 2023 | | 2022 | | 2021 |
| (Dollars in thousands) |
| Cash paid for: | | | | | |
| Interest, net of interest capitalized | $ | 917 | | | $ | 744 | | | $ | 632 | |
| Income taxes | $ | 161,454 | | | $ | 214,316 | | | $ | 192,372 | |
4. Segment Reporting
An operating segment is defined as a component of an enterprise for which discrete financial information is available and is reviewed regularly by the Chief Operating Decision Maker (“CODM”), or decision-making group, to evaluate performance and make operating decisions. We have identified our CODM as two key executives—the Executive Chairman and the Chief Executive Officer (“CEO”).
We have identified each homebuilding division as an operating segment. Our homebuilding operating segments have been aggregated into the reportable segments noted below because they are similar in the following regards: (1) economic characteristics; (2) housing products; (3) class of homebuyer; (4) regulatory environments; and (5) methods used to construct and sell homes. Our homebuilding reportable segments conducted ongoing operations in the following states:
•West (Arizona, California, Nevada, New Mexico, Oregon, Texas and Washington)
•Mountain (Colorado, Idaho and Utah)
•East (Alabama, Florida, Maryland, Pennsylvania, Tennessee and Virginia)
Our financial services business consists of the following operating segments: (1) HomeAmerican; (2) Allegiant; (3) StarAmerican; (4) American Home Insurance; and (5) American Home Title. Due to its contributions to consolidated pretax income we consider HomeAmerican to be a reportable segment (“mortgage operations”). The remaining operating segments have been aggregated into one reportable segment (“other”) because they do not individually exceed 10 percent of (1) consolidated revenue; (2) the greater of (a) combined reported profit of all operating segments that did not report a loss or (b) the positive value of the combined reported loss of all operating segments that reported losses; or (3) consolidated assets.
Corporate is a non-operating segment that develops and implements strategic initiatives and supports our operating divisions by centralizing key administrative functions such as finance, treasury, information technology, insurance, risk management, litigation and human resources. Corporate also provides the necessary administrative functions to support MDC as a publicly traded company. A portion of the expenses incurred by Corporate are allocated to the homebuilding operating segments based on their respective percentages of assets, and to a lesser degree, a portion of Corporate expenses are allocated to the financial services segments. A majority of Corporate’s personnel and resources are primarily dedicated to activities relating to the homebuilding segments, and, therefore, the balance of any unallocated Corporate expenses is included in the homebuilding operations section of our consolidated statements of operations and comprehensive income.
The following tables present revenue and pretax income / (loss) relating to our homebuilding and financial services operations: | | | | | | | | | | | | | | | | | |
| Year Ended December 31, |
| 2023 | | 2022 | | 2021 |
| (Dollars in thousands) |
| Homebuilding | | | | | |
| West | $ | 2,624,373 | | | $ | 3,024,056 | | | $ | 2,964,766 | |
| Mountain | 1,267,586 | | | 1,689,376 | | | 1,567,198 | |
| East | 628,337 | | | 872,832 | | | 570,492 | |
| Total homebuilding revenues | $ | 4,520,296 | | | $ | 5,586,264 | | | $ | 5,102,456 | |
| | | | | |
| Financial Services | | | | | |
| Mortgage operations | $ | 76,479 | | | $ | 72,806 | | | $ | 107,535 | |
| Other | 46,091 | | | 58,917 | | | 44,677 | |
| Total financial services revenues | $ | 122,570 | | | $ | 131,723 | | | $ | 152,212 | |
| | | | | |
| Total revenues | $ | 4,642,866 | | | $ | 5,717,987 | | | $ | 5,254,668 | |
| | | | | | | | | | | | | | | | | |
| Year Ended December 31, |
| 2023 | | 2022 | | 2021 |
| (Dollars in thousands) |
| Homebuilding | | | | | |
| West | $ | 219,560 | | | $ | 413,426 | | | $ | 463,302 | |
| Mountain | 143,838 | | | 245,456 | | | 231,523 | |
| East | 64,222 | | | 126,824 | | | 59,494 | |
| Corporate | 22,512 | | | (94,239) | | | (94,631) | |
| Total homebuilding pretax income | $ | 450,132 | | | $ | 691,467 | | | $ | 659,688 | |
| | | | | |
| Financial Services | | | | | |
| Mortgage operations | $ | 40,756 | | | $ | 30,177 | | | $ | 69,455 | |
| Other | 35,217 | | | 38,210 | | | 22,551 | |
| Total financial services pretax income | $ | 75,973 | | | $ | 68,387 | | | $ | 92,006 | |
| | | | | |
| Total pretax income | $ | 526,105 | | | $ | 759,854 | | | $ | 751,694 | |
The following table summarizes total assets for our homebuilding and financial services operations. The assets in our West, Mountain and East segments consist primarily of inventory while the assets in our Corporate segment primarily include cash and cash equivalents and marketable securities. The assets in our financial services operations consist mostly of cash and cash equivalents, marketable securities and mortgage loans held-for-sale.
| | | | | | | | | | | |
| December 31, |
| 2023 | | 2022 |
| (Dollars in thousands) |
| Homebuilding Assets | | | |
| West | $ | 2,155,357 | | | $ | 2,275,144 | |
| Mountain | 874,031 | | | 1,005,622 | |
| East | 459,078 | | | 427,926 | |
| Corporate | 1,608,726 | | | 1,249,370 | |
| Total homebuilding assets | $ | 5,097,192 | | | $ | 4,958,062 | |
| | | |
| Financial Services | | | |
| Mortgage operations | $ | 295,092 | | | $ | 267,309 | |
| Other | 238,801 | | | 137,901 | |
| Total financial services assets | $ | 533,893 | | | $ | 405,210 | |
| | | |
| Total assets | $ | 5,631,085 | | | $ | 5,363,272 | |
5. Earnings Per Share
The following table shows our basic and diluted EPS calculations:
| | | | | | | | | | | | | | | | | |
| Year Ended December 31, |
| 2023 | | 2022 | | 2021 |
| (Dollars in thousands, except per share amounts) |
| Numerator | | | | | |
| Net income | $ | 401,005 | | | $ | 562,139 | | | $ | 573,657 | |
| Less: distributed earnings allocated to participating securities | (895) | | | (717) | | | (634) | |
| Less: undistributed earnings allocated to participating securities | (1,353) | | | (2,026) | | | (2,343) | |
| Net income attributable to common stockholders (numerator for basic earnings per share) | 398,757 | | | 559,396 | | | 570,680 | |
| Add back: undistributed earnings allocated to participating securities | 1,353 | | | 2,026 | | | 2,343 | |
| Less: undistributed earnings reallocated to participating securities | (1,329) | | | (1,987) | | | (2,269) | |
| Numerator for diluted earnings per share under two-class method | $ | 398,781 | | | $ | 559,435 | | | $ | 570,754 | |
| | | | | |
| Denominator | | | | | |
| Weighted-average common shares outstanding | 73,505,508 | | | 71,035,558 | | | 70,174,281 | |
| Add: dilutive effect of stock options | 1,347,513 | | | 1,382,340 | | | 2,302,773 | |
| Add: dilutive effect of contingently issuable equity awards | 504,944 | | | 525,946 | | | 377,547 | |
| Denominator for diluted earnings per share under two-class method | 75,357,965 | | | 72,943,844 | | | 72,854,601 | |
| | | | | |
| Basic Earnings Per Common Share | $ | 5.42 | | | $ | 7.87 | | | $ | 8.13 | |
| Diluted Earnings Per Common Share | $ | 5.29 | | | $ | 7.67 | | | $ | 7.83 | |
Diluted EPS for the years ended December 31, 2023, 2022 and 2021 excluded options to purchase approximately 15,000, 1,861,534 and 15,000 shares, respectively, of common stock because the effect of their inclusion would be anti-dilutive.
6. Fair Value Measurements
ASC Topic 820, Fair Value Measurements (“ASC 820”), defines fair value, establishes guidelines for measuring fair value and requires disclosures regarding fair value measurements. ASC 820 establishes a three-tier fair value hierarchy, which prioritizes the inputs used in measuring fair value. These tiers include: Level 1, defined as observable inputs such as quoted prices in active markets; Level 2, defined as inputs, other than quoted prices in active markets, that are either directly or indirectly observable; and Level 3, defined as unobservable inputs for which little or no market data exists, therefore requiring an entity to develop its own assumptions.
The following table sets forth the fair values and methods used for measuring the fair values of financial instruments on a recurring basis: | | | | | | | | | | | | | | | | | | | | |
| | | | Fair Value |
| Financial Instrument | | Hierarchy | | December 31, 2023 | | December 31, 2022 |
| | | | (Dollars in thousands) |
| Marketable securities | | | | | | |
| Debt securities (available-for-sale) | | Level 1 | | $ | 78,250 | | | $ | 561,100 | |
| | | | | | |
| Mortgage loans held-for-sale, net | | Level 2 | | $ | 258,212 | | | $ | 229,513 | |
| | | | | | |
| Derivative and financial instruments, net (Note 18) | | | | | | |
| Interest rate lock commitments | | Level 2 | | $ | 5,118 | | | $ | (1,678) | |
| Forward sales of mortgage-backed securities | | Level 2 | | $ | (5,388) | | | $ | (5,269) | |
| Mandatory delivery forward loan sale commitments | | Level 2 | | $ | (816) | | | $ | 791 | |
| Best-effort delivery forward loan sale commitments | | Level 2 | | $ | (4) | | | $ | 1,976 | |
The following methods and assumptions were used to estimate the fair value of each class of financial instruments as of December 31, 2023 and 2022.
Debt securities. Our debt securities consist of U.S. government treasury securities with original maturities upon acquisition of less than six months and are treated as available-for-sale investments and, as such, are recorded at fair value with all changes in fair value initially recorded through other comprehensive income. Debt securities are reviewed on a regular basis for impairment. There were no impairments recorded during both the twelve months ended December 31, 2023 and 2022.
The estimated fair value, gross unrealized holding gains, gross unrealized holding losses and amortized cost for debt securities by major classification are as follows:
| | | | | | | | | | | | | | | | | | | | | | | | | | | | | | | | | | | | | | | | | | | | | | | |
| December 31, 2023 | | December 31, 2022 |
| (Dollars in thousands) |
| Amortized Cost | | Gross Unrealized Gains | | Gross Unrealized Losses | | Estimated Fair Value | | Amortized Cost | | Gross Unrealized Gains | | Gross Unrealized Losses | | Estimated Fair Value |
| U.S. Government | $ | 78,185 | | | $ | 65 | | | $ | — | | | $ | 78,250 | | | $ | 561,100 | | | $ | — | | | $ | — | | | $ | 561,100 | |
| Total Debt Securities | $ | 78,185 | | | $ | 65 | | | $ | — | | | $ | 78,250 | | | $ | 561,100 | | | $ | — | | | $ | — | | | $ | 561,100 | |
Mortgage Loans Held-for-Sale, Net. Our mortgage loans held-for-sale, which are measured at fair value on a recurring basis include (1) mortgage loans held-for-sale that are under commitments to sell and (2) mortgage loans held-for-sale that were not under commitments to sell. At December 31, 2023 and 2022, we had $105.1 million and $142.9 million, respectively, in fair value of mortgage loans held-for-sale that were under commitments to sell. The fair value for those loans was based on quoted market prices for those mortgage loans, which are Level 2 fair value inputs. At December 31, 2023 and 2022, we had $153.1 million and $86.6 million, respectively, in fair value of mortgage loans held-for-sale that were not under commitments to sell. The fair value for those loans was primarily based upon the estimated market price received from a third-party, which is a Level 2 fair value input. The unpaid principal balances of all mortgage loans held for sale at December 31, 2023 and 2022 were $256.3 million and $232.7 million, respectively.
Gains (losses) on sales of mortgage loans, net, are included as a component of revenues in the financial services section of our consolidated statements of operations and comprehensive income. For twelve months ended December 31, 2023, 2022, and 2021, we recorded gain (loss) on mortgage loans held-for-sale, net of $(0.8) million, $(18.0) million, and $86.4 million, respectively.
Derivative and financial instruments, net. Our derivatives and financial instruments, which include (1) interest rate lock commitments, (2) forward sales of mortgage-backed securities, (3) mandatory delivery forward loan sale commitments and (4) best-effort delivery forward loan sale commitments, are measured at fair value on a recurring basis based on market prices for similar instruments.
For the financial assets and liabilities that the Company does not reflect at fair value, the following methods and assumptions were used to estimate the fair value of each class of financial instruments.
Cash and cash equivalents(excluding debt securities with an original maturity of three months or less), restricted cash, trade and other receivables, prepaids and other assets, accounts payable, accruedand otherliabilities and borrowings on our revolving credit facility. Fair value approximates carrying value.
Mortgage Repurchase Facility. The debt associated with our Mortgage Repurchase Facility (see Note 16, Lines of Credit and Total Debt Obligations, for further discussion) is at floating rates that approximate current market rates and have relatively short-term maturities, generally within 30 days. The fair value approximates carrying value and is based on Level 2 inputs.
Senior Notes. The estimated values of the senior notes in the following table are based on Level 2 inputs, which primarily reflect estimated prices for our senior notes which were provided by multiple sources.
| | | | | | | | | | | | | | | | | | | | | | | |
| December 31, 2023 | | December 31, 2022 |
| Carrying
Amount | | Fair Value | | Carrying
Amount | | Fair Value |
| (Dollars in thousands) |
| $300 million 3.850% senior notes due January 2030, net | $ | 298,207 | | | $ | 273,580 | | | $ | 297,949 | | | $ | 246,236 | |
| $350 million 2.500% senior notes due January 2031, net | 347,708 | | | 286,957 | | | 347,413 | | | 255,374 | |
| $500 million 6.000% senior notes due January 2043, net | 491,351 | | | 464,658 | | | 491,120 | | | 414,017 | |
| $350 million 3.966% senior notes due August 2061, net | 346,138 | | | 227,262 | | | 346,094 | | | 204,014 | |
| Total | $ | 1,483,404 | | | $ | 1,252,457 | | | $ | 1,482,576 | | | $ | 1,119,641 | |
7. Inventories
The table below sets forth, by reportable segment, information relating to our homebuilding inventories.
| | | | | | | | | | | |
| December 31,
2023 | | December 31,
2022 |
| (Dollars in thousands) |
| Housing Completed or Under Construction: | | | |
| West | $ | 1,163,495 | | | $ | 1,026,880 | |
| Mountain | 448,735 | | | 511,092 | |
| East | 269,038 | | | 184,089 | |
| Subtotal | 1,881,268 | | | 1,722,061 | |
| Land and Land Under Development: | | | |
| West | 874,605 | | | 1,145,119 | |
| Mountain | 382,897 | | | 433,893 | |
| East | 162,276 | | | 214,706 | |
| Subtotal | 1,419,778 | | | 1,793,718 | |
| Total Inventories | $ | 3,301,046 | | | $ | 3,515,779 | |
Inventory impairments recognized by segment for the years ended December 31, 2023, 2022 and 2021 are shown in the table below.
| | | | | | | | | | | | | | | | | |
| Year Ended December 31, |
| 2023 | | 2022 | | 2021 |
| (Dollars in thousands) |
| Housing Completed or Under Construction: | | | | | |
| West | $ | 3,673 | | | $ | 8,017 | | | $ | 1,600 | |
| Mountain | 1,533 | | | 1,812 | | | — | |
| East | — | | | — | | | — | |
| Subtotal | 5,206 | | | 9,829 | | | 1,600 | |
| Land and Land Under Development: | | | | | |
| West | 15,677 | | | 88,843 | | | — | |
| Mountain | 8,817 | | | 20,688 | | | — | |
| East | — | | | 2,515 | | | — | |
| Subtotal | 24,494 | | | 112,046 | | | — | |
| Total Inventory Impairments | $ | 29,700 | | | $ | 121,875 | | | $ | 1,600 | |
The table below provides quantitative data, for the periods presented, where applicable, used in determining the fair value of the impaired inventory. | | | | | | | | | | | | | | | | | | | | | | | | | | | | | | | | | | | | | | |
| | Impairment Data | | Quantitative Data |
| Three Months Ended | | Number of Subdivisions Impaired | | Inventory Impairments | | Fair Value of Inventory After Impairments | | Discount Rate |
| | (Dollars in thousands) | | | | | | |
| December 31, 2023 | | 3 | | $ | 2,200 | | | $ | 13,273 | | | 12 | % | | — | | 15% |
| September 30, 2023 | | 2 | | 6,200 | | | 17,116 | | | 15 | % | | — | | 18% |
| June 30, 2023 | | 1 | | 13,500 | | | 17,886 | | | | | 18% | | |
| March 31, 2023 | | 1 | | 7,800 | | | 13,016 | | | | | 18% | | |
| Total | | | | $ | 29,700 | | | | | | | | | |
| | | | | | | | | | | | |
| December 31, 2022 | | 16 | | $ | 92,800 | | | $ | 96,496 | | | 15 | % | | — | | 20% |
| September 30, 2022 | | 9 | | 28,415 | | | 44,615 | | | 15 | % | | — | | 18% |
| March 31, 2022 | | 1 | | 660 | | | 1,728 | | | | | N/A | | |
| Total | | | | $ | 121,875 | | | | | | | | | |
| | | | | | | | | | | | |
| December 31, 2021 | | 1 | | $ | 1,600 | | | $ | 6,903 | | | | | N/A | | |
| Total | | | | $ | 1,600 | | | | | | | | | |
8. Capitalization of Interest
We capitalize interest to inventories during the period of development in accordance with ASC Topic 835, Interest (“ASC 835”). Homebuilding interest capitalized as a cost of inventories is included in cost of sales during the period that related units or lots are delivered. To the extent our homebuilding debt exceeds our qualified assets as defined in ASC 835, we expense a portion of the interest incurred. Qualified homebuilding assets consist of all lots and homes, excluding finished unsold homes or finished models, within projects that are actively selling or under development. The table set forth below summarizes homebuilding interest activity. For all periods presented below, our qualified assets exceeded our homebuilding debt and as such, all interest incurred has been capitalized. | | | | | | | | | | | | | | | | | |
| Year Ended December 31, |
| 2023 | | 2022 | | 2021 |
| (Dollars in thousands) |
| Homebuilding interest incurred | $ | 69,901 | | | $ | 69,450 | | | $ | 72,500 | |
| Less: Interest capitalized | (69,901) | | | (69,450) | | | (72,500) | |
| Homebuilding interest expensed | $ | — | | | $ | — | | | $ | — | |
| | | | | |
| Interest capitalized, beginning of period | $ | 59,921 | | | $ | 58,054 | | | $ | 52,777 | |
| Plus: Interest capitalized during period | 69,901 | | | 69,450 | | | 72,500 | |
| Less: Previously capitalized interest included in home and land cost of sales | (65,163) | | | (67,583) | | | (67,223) | |
| Interest capitalized, end of period | $ | 64,659 | | | $ | 59,921 | | | $ | 58,054 | |
9. Homebuilding Prepaids and Other Assets
The following table sets forth the components of homebuilding prepaids and other assets.
| | | | | | | | | | | |
| December 31, |
| 2023 | | 2022 |
| (Dollars in thousands) |
| Operating lease right-of-use asset (Note 10) | $ | 21,817 | | | $ | 25,636 | |
| Land option deposits | 27,988 | | | 19,539 | |
| Prepaids | 15,323 | | | 13,333 | |
| Goodwill | 6,008 | | | 6,008 | |
| Deferred debt issuance costs on revolving credit facility, net | 3,355 | | | 5,241 | |
| Other | 1,545 | | | 250 | |
| Total | $ | 76,036 | | | $ | 70,007 | |
10. Leases
We lease certain property, land and equipment, the majority of which comprise property related leases to provide office space where we operate our business. Leases with an initial term of 12 months or less are not recorded on the balance sheet. We recognize lease expense for these leases on a straight-line basis over the lease term.
Our property related leases typically have terms of between three and five years, with the exception of the lease governing the Company’s headquarters. All of our property leases are classified as operating leases. These leases do not contain any residual value guarantees or restrictive covenants and do not include variable lease payments, except for the payment of common area maintenance and real estate taxes. Many of our property related leases give us the option to extend the lease term for a period of time, generally consistent with the initial lease term. These options are excluded from our calculation of the right-of-use asset and lease liability until such time as we determine it is reasonably certain that the option will be exercised.
The property related lease for the Company’s headquarters in Denver, Colorado is ten years in length with an expiration date of October 31, 2026 and contains a ten year option to extend the term of the lease through 2036. This option has been excluded from our calculation of the right-of-use asset and lease liability as it is not currently considered reasonably certain that the option will be exercised.
Operating lease expense is included as a component of selling, general and administrative expenses and expenses in the homebuilding and financial services sections of our consolidated statements of operations and comprehensive income, respectively.
Components of operating lease expense were as follows: | | | | | | | | | | | | | | | | | |
| Year Ended December 31, |
| 2023 | | 2022 | | 2021 |
| (Dollars in thousands) |
Operating lease cost 1 | $ | 8,634 | | | $ | 8,645 | | | $ | 8,028 | |
| Sublease income | (588) | | | (507) | | | (156) | |
| Net lease cost | $ | 8,046 | | | $ | 8,138 | | | $ | 7,872 | |
1 Includes variable lease costs, which are immaterial.
Supplemental cash flow information related to leases was as follows: | | | | | | | | | | | | | | | | | |
| Year Ended December 31, |
| 2023 | | 2022 | | 2021 |
| (Dollars in thousands) |
| Cash paid for amounts included in the measurement of lease liabilities: | | | | | |
| Operating cash flows from operating leases | $ | 8,271 | | | $ | 8,147 | | | $ | 7,598 | |
| Leased assets obtained in exchange for new operating lease liabilities | $ | 3,238 | | | $ | 6,980 | | | $ | 1,765 | |
Weighted-average remaining lease term and discount rate for operating leases were as follows: | | | | | | | | |
| December 31, 2023 | December 31, 2022 |
| Weighted-average remaining lease term (years) | 3.3 | 4.0 |
| Weighted-average discount rate | 5.5% | 5.5% |
Maturities of operating lease liabilities were as follows: | | | | | |
| Year Ended December 31, |
| (Dollars in thousands) |
| 2024 | $ | 7,551 | |
| 2025 | 8,168 | |
| 2026 | 6,923 | |
| 2027 | 1,722 | |
| 2028 | 856 | |
| Thereafter | 81 | |
| Total operating lease payments | $ | 25,301 | |
| Less: Interest | (2,180) | |
Present value of operating lease liabilities 1 | $ | 23,121 | |
____________________________
1 Homebuilding and financial services operating lease liabilities of $22.9 million and $0.2 million, respectively, are included as a component of accrued and other liabilities and accounts payable and accrued liabilities, respectively, in the homebuilding and financial services section of our consolidated balance sheets at December 31, 2023.
11. Homebuilding Accrued and Other Liabilities and Financial Services Accounts Payable and Accrued Liabilities
The following table sets forth information relating to homebuilding accrued and other liabilities. | | | | | | | | | | | |
| December 31, |
| 2023 | | 2022 |
| (Dollars in thousands) |
| Accrued compensation and related expenses | $ | 93,013 | | | $ | 100,653 | |
| Customer and escrow deposits | 33,633 | | | 42,296 | |
| Warranty accrual (Note 12) | 44,082 | | | 46,857 | |
| Lease liability (Note 10) | 22,939 | | | 26,574 | |
| Land development and home construction accruals | 19,262 | | | 20,028 | |
| Accrued interest | 30,934 | | | 30,934 | |
| Income taxes payable | — | | | 23,880 | |
| Construction defect claim reserves (Note 13) | 11,433 | | | 10,466 | |
| Retentions payable | 14,765 | | | 21,519 | |
| Other accrued liabilities | 56,417 | | | 60,199 | |
| Total accrued and other liabilities | $ | 326,478 | | | $ | 383,406 | |
A reclassification was made to our prior period financial information, where $21.5 million was reclassed from other accrued liabilities to retentions payable to conform to the current year presentation.
The following table sets forth information relating to financial services accounts payable and accrued liabilities. | | | | | | | | | | | |
| December 31, |
| 2023 | | 2022 |
| (Dollars in thousands) |
| Insurance reserves (Note 13) | $ | 89,326 | | | $ | 84,108 | |
| Accounts payable and other accrued liabilities | 24,159 | | | 26,428 | |
| Total accounts payable and accrued liabilities | $ | 113,485 | | | $ | 110,536 | |
12. Warranty Accrual
The table set forth below summarizes accrual, adjustment and payment activity related to our warranty accrual for the years ended December 31, 2023, 2022 and 2021. The warranty accrual decreased due to the decrease in the number of home closings year-over-year. There were $3.1 million of warranty adjustments during the year ended December 31, 2022. From time to time, we change our warranty accrual rates based on payment trends. Any changes made to those rates did not materially affect our warranty expense or gross margin from home sales for the years ended December 31, 2023, 2022 and 2021. | | | | | | | | | | | | | | | | | |
| Year Ended December 31, |
| 2023 | | 2022 | | 2021 |
| (Dollars in thousands) |
| Balance at beginning of period | $ | 46,857 | | | $ | 37,491 | | | $ | 33,664 | |
| Expense provisions | 24,122 | | | 27,125 | | | 22,696 | |
| Cash payments | (26,897) | | | (20,872) | | | (18,850) | |
| Adjustments | — | | | 3,113 | | | (19) | |
| Balance at end of period | $ | 44,082 | | | $ | 46,857 | | | $ | 37,491 | |
13. Insuranceand Construction DefectClaimReserves
The following table summarizes our insurance and defect claim reserves activity for the years ended December 31, 2023, 2022 and 2021. These reserves are included as a component of accounts payable and accrued liabilities and accrued and other liabilities in either the financial services or homebuilding sections of the consolidated balance sheets, respectively. | | | | | | | | | | | | | | | | | |
| December 31, |
| 2023 | | 2022 | | 2021 |
| (Dollars in thousands) |
| Balance at beginning of period | $ | 94,574 | | | $ | 82,187 | | | $ | 70,054 | |
| Expense provisions | 17,721 | | | 19,537 | | | 19,653 | |
| Cash payments, net of recoveries | (11,536) | | | (7,150) | | | (7,520) | |
| Adjustments | — | | | — | | | — | |
| Balance at end of period | $ | 100,759 | | | $ | 94,574 | | | $ | 82,187 | |
In the ordinary course of business, we make payments from our insurance and construction defect claim reserves to settle litigation claims arising primarily from our homebuilding activities. These payments are irregular in both their timing and their magnitude. As a result, the cash payments, net of recoveries shown for the years ended December 31, 2023, 2022 and 2021, are not necessarily indicative of what future cash payments will be for subsequent periods.
14. Income Taxes
Our provision for income taxes for the years ended December 31, 2023, 2022 and 2021 consisted of the following: | | | | | | | | | | | | | | | | | |
| Year Ended December 31, |
| 2023 | | 2022 | | 2021 |
| (Dollars in thousands) |
| Current tax provision: | | | | | |
| Federal | $ | 87,445 | | | $ | 174,965 | | | $ | 148,741 | |
| State | 27,247 | | | 54,060 | | | 35,784 | |
| Total current | 114,692 | | | 229,025 | | | 184,525 | |
| | | | | |
| Deferred tax provision: | | | | | |
| Federal | 8,802 | | | (26,030) | | | (6,699) | |
| State | 1,606 | | | (5,280) | | | 211 | |
| Total deferred | 10,408 | | | (31,310) | | | (6,488) | |
| Provision for income taxes | $ | 125,100 | | | $ | 197,715 | | | $ | 178,037 | |
The provision for income taxes differs from the amount that would be computed by applying the statutory federal income tax rate of 21% in 2023, 2022 and 2021 to income before income taxes as a result of the following: | | | | | | | | | | | | | | | | | |
| Year Ended December 31, |
| 2023 | | 2022 | | 2021 |
| (Dollars in thousands) |
| Tax expense computed at federal statutory rate | $ | 110,482 | | | $ | 159,569 | | | $ | 157,856 | |
| State income tax expense, net of federal benefit | 19,523 | | | 30,213 | | | 26,441 | |
| Limitation on executive compensation | 6,509 | | | 23,778 | | | 14,915 | |
| Tax expense (benefit) related to an increase (decrease) in unrecognized tax benefits | (263) | | | 215 | | | (4,044) | |
| Stock based compensation (windfall)/shortfall | (6,701) | | | (2,553) | | | (1,830) | |
| Federal energy credits | (8,938) | | | (15,265) | | | (14,558) | |
| Rate changes | 432 | | | 19 | | | 81 | |
| Change in valuation allowance | 1,524 | | | (1,065) | | | (1,054) | |
| Other | 2,532 | | | 2,804 | | | 230 | |
| Provision for income taxes | $ | 125,100 | | | $ | 197,715 | | | $ | 178,037 | |
| | | | | |
| Effective tax rate | 23.8 | % | | 26.0 | % | | 23.7 | % |
Deferred income taxes reflect the net tax effects of temporary differences between the carrying amounts of the assets and liabilities for financial reporting purposes and the amounts used for income tax purposes. The tax effects of significant temporary differences that give rise to the net deferred tax asset are as follows: | | | | | | | | | | | |
| December 31, |
| 2023 | | 2022 |
| (Dollars in thousands) |
| Deferred tax assets: | | | |
| State net operating loss carryforwards | $ | 3,906 | | | $ | 2,296 | |
| Stock-based compensation expense | 1,492 | | | 2,896 | |
| Warranty, litigation and other reserves | 16,542 | | | 17,134 | |
| Accrued compensation | 9,067 | | | 8,554 | |
| Asset impairment charges | 26,316 | | | 30,319 | |
| Inventory, additional net costs capitalized for tax purposes | 10,955 | | | 11,399 | |
| Other, net | 406 | | | 1,861 | |
| Total deferred tax assets | 68,684 | | | 74,459 | |
| Valuation allowance | (3,775) | | | (2,251) | |
| Total deferred tax assets, net of valuation allowance | 64,909 | | | 72,208 | |
| | | |
| Deferred tax liabilities: | | | |
| Property, equipment and other assets | 15,343 | | | 11,714 | |
| Deferral of profit on home sales | 6,139 | | | 5,592 | |
| Other, net | 4,597 | | | 5,650 | |
| Total deferred tax liabilities | 26,079 | | | 22,956 | |
| Net deferred tax asset | $ | 38,830 | | | $ | 49,252 | |
At December 31, 2023, we had no federal net operating loss or alternative minimum tax carryforwards. However, we had $3.9 million in tax-effected state net operating loss carryforwards. The state operating loss carryforwards, if unused, begin expiring in 2028.
At December 31, 2023, we had a valuation allowance of $3.8 million, an increase of $1.5 million from the prior year. The valuation allowance is related to various state net operating loss carryforwards where realization is uncertain at this time due to the limited carryforward periods coupled with minimal activity that exists in certain states.
At December 31, 2023 and 2022, our total liability for uncertain tax positions including interest and penalties was $0.4 million and $0.6 million, respectively. The following table summarizes activity for the gross unrecognized tax benefit component of our total liability for uncertain tax positions for the years ended December 31, 2023, 2022 and 2021: | | | | | | | | | | | | | | | | | |
| Year Ended December 31, |
| 2023 | | 2022 | | 2021 |
| (Dollars in thousands) |
| Gross unrecognized tax benefits at beginning of year | $ | 646 | | | $ | 383 | | | $ | 8,497 | |
| Increases related to prior year tax positions | 79 | | | 357 | | | 162 | |
| Decreases related to prior year tax positions | (250) | | | — | | | — | |
| Lapse of applicable statute of limitations | (70) | | | (94) | | | (8,276) | |
| Gross unrecognized tax benefits at end of year | $ | 405 | | | $ | 646 | | | $ | 383 | |
During the year ended December 31, 2023, we experienced a decrease of $0.2 million in the uncertain tax positions related to state tax filings. At December 31, 2023 and 2022, there was $0.4 million and $0.6 million, respectively, of unrecognized tax benefits that if recognized, would reduce our effective tax rate.
The interest and penalties, net of federal benefit for the years ended December 31, 2023, 2022 and 2021 was $(0.1) million, $(0.1) million and $(0.8) million, respectively, and are included in provision for income taxes in the consolidated statements of operations and comprehensive income. We are not aware of any tax positions for which it is reasonably possible that the total amounts of unrecognized tax benefits will change materially in the next twelve months.
The Company and its subsidiaries file income tax returns in the U.S. federal jurisdiction and various state jurisdictions. We are subject to U.S. federal income tax examination for calendar tax years ending 2020 through 2023. Additionally, we are subject to various state income tax examinations for the 2019 through 2023 calendar tax years.
15. Related Party Transactions
The Company has a sublease agreement with CVentures, Inc. Larry A. Mizel, the Company's Executive Chairman, is the President of CVentures, Inc. The sublease is for office space that CVentures, Inc. has continuously leased from the Company as disclosed in the Form 8-K filed July 27, 2005 and the Form 8-K filed March 28, 2006. The current sublease term commenced November 1, 2016 and will continue through October 31, 2026. The sublease agreement is for approximately 5,437 rentable square feet at a base rent that increases over the term from $26.50 to $31.67 per rentable square foot per year. The sublease rent is an allocation of the rent under the master lease agreement based on the sublease square footage.
16. Lines of Credit and Total Debt Obligations
Revolving Credit Facility. We have an unsecured revolving credit agreement (“Revolving Credit Facility”) with a group of lenders, which may be used for general corporate purposes. This agreement was amended on December 28, 2020 to (1) increase the aggregate commitment from $1.0 billion to $1.2 billion (the “Commitment”), (2) extend the Revolving Credit Facility maturity of $1.125 billion of the Commitments to December 18, 2025 with the remaining Commitment terminated on December 18, 2023 and (3) provide that the aggregate amount of the commitments may increase to an amount not to exceed $1.7 billion upon our request, subject to receipt of additional commitments from existing or additional lenders and, in the case of additional lenders, the consent of the co-administrative agents.
Effective April 11, 2023, the Revolving Credit Facility was amended to transition from a eurocurrency based interest rate to an interest rate based on the Secured Overnight Financing Rate ("SOFR"). As defined in the Revolving Credit Facility, interest rates on base rate borrowings are equal to the highest of (1) 0.0%, (2) a prime rate, (3) a federal funds effective rate plus 0.50%, and (4) the one month term SOFR screen rate plus the SOFR adjustment plus 1.00% and, in each case, plus a margin that is determined based on our credit ratings and leverage ratio. Interest rates on SOFR borrowings are equal to the greater of (1) 0.0% and (2) the sum of the term SOFR screen rate for such interest period plus the SOFR adjustment, plus a margin that is determined based on our credit ratings and leverage ratio. At any time at which our leverage ratio, as of the last day of the most recent calendar quarter, exceeds 55%, the aggregate principal amount of all consolidated senior debt borrowings outstanding may not exceed the borrowing base. There is no borrowing base requirement if our leverage ratio, as of the last day of the most recent calendar quarter, is 55% or less.
The Revolving Credit Facility is fully and unconditionally guaranteed, jointly and severally, by most of our homebuilding segment subsidiaries. The facility contains various representations, warranties and covenants that we believe are customary for agreements of this type. The financial covenants include a consolidated tangible net worth test and a leverage test, along with a consolidated tangible net worth covenant, all as defined in the Revolving Credit Facility. A failure to satisfy the foregoing tests does not constitute an event of default, but can trigger a “term-out” of the facility. A breach of the consolidated tangible net worth covenant (but not the consolidated tangible net worth test) or a violation of anti-corruption or sanctions laws would result in an event of default.
The Revolving Credit Facility is subject to acceleration upon certain specified events of default, including breach of the consolidated tangible net worth covenant, a violation of anti-corruption or sanctions laws, failure to make timely payments, breaches of certain representations or covenants, failure to pay other material indebtedness, or another person becoming beneficial owner of 50% or more of our outstanding common stock. We believe we were in compliance with the representations, warranties and covenants included in the Revolving Credit Facility as of December 31, 2023.
We incur costs associated with unused commitment fees pursuant to the terms of the Revolving Credit Facility. At December 31, 2023 and 2022, there were $40.8 million and $48.3 million, respectively, in letters of credit outstanding, which reduced the amounts available to be borrowed under the Revolving Credit Facility. We had $10.0 million and $10.0 million outstanding under the Revolving Credit Facility as of December 31, 2023 and 2022, respectively. As of December 31, 2023, availability under the Revolving Credit Facility was approximately $1.07 billion.
Mortgage Repurchase Facility. HomeAmerican has a Master Repurchase Agreement (the “Mortgage Repurchase Facility”) with U.S. Bank National Association (“USBNA”). The Mortgage Repurchase Facility provides liquidity to HomeAmerican by providing for the sale of up to an aggregate of $75 million (subject to increase by up to $75 million under certain conditions) of eligible mortgage loans to USBNA with an agreement by HomeAmerican to repurchase the mortgage loans at a future date. Until such mortgage loans are transferred back to HomeAmerican, the documents relating to such loans
are held by USBNA, as custodian, pursuant to the Custody Agreement (“Custody Agreement”), dated as of November 12, 2008, by and between HomeAmerican and USBNA. In the event that an eligible mortgage loan becomes ineligible, as defined under the Mortgage Repurchase Facility, HomeAmerican may be required to repurchase the ineligible mortgage loan immediately. The Mortgage Repurchase Facility was amended on March 25, 2021, May 20, 2021, December 21, 2021, May 19, 2022 and May 18, 2023 to adjust the commitments to purchase for specific time periods. The total capacity of the facility at December 31, 2023 was $225 million. The termination date of the Repurchase Agreement is May 15, 2024.
At December 31, 2023 and 2022, HomeAmerican had $205.0 million and $175.8 million, respectively, of mortgage loans that HomeAmerican was obligated to repurchase under the Mortgage Repurchase Facility. Mortgage loans that HomeAmerican is obligated to repurchase under the Mortgage Repurchase Facility are accounted for as a debt financing arrangement and are reported as mortgage repurchase facility in the consolidated balance sheets. Pricing under the Mortgage Repurchase Facility is based on SOFR.
The Mortgage Repurchase Facility contains various representations, warranties and affirmative and negative covenants that we believe are customary for agreements of this type. The negative covenants include, among others, (i) a minimum Adjusted Tangible Net Worth requirement, (ii) a maximum Adjusted Tangible Net Worth ratio, (iii) a minimum adjusted net income requirement, and (iv) a minimum Liquidity requirement. The foregoing capitalized terms are defined in the Mortgage Repurchase Facility. We believe HomeAmerican was in compliance with the representations, warranties and covenants included in the Mortgage Repurchase Facility as of December 31, 2023.
Senior Notes. Our senior notes are not secured and, while the senior note indentures contain some restrictions on secured debt and other transactions, they do not contain financial covenants. Our senior notes are fully and unconditionally guaranteed on an unsecured basis, jointly and severally, by most of our homebuilding segment subsidiaries. We believe that we are in compliance with the representations, warranties and covenants in the senior note indentures.
Our debt obligations at December 31, 2023 and 2022, net of any unamortized debt issuance costs or discount, were as follows: | | | | | | | | | | | |
| December 31, |
| 2023 | | 2022 |
| (Dollars in thousands) |
| $300 million 3.850% senior notes due January 2030, net | $ | 298,207 | | | $ | 297,949 | |
| $350 million 2.500% senior notes due January 2031, net | 347,708 | | | 347,413 | |
| $500 million 6.000% senior notes due January 2043, net | 491,351 | | | 491,120 | |
| $350 million 3.966% senior notes due August 2061, net | 346,138 | | | 346,094 | |
| Total | $ | 1,483,404 | | | $ | 1,482,576 | |
17. Commitments and Contingencies
Surety Bonds and Lettersof Credit. We are required to obtain surety bonds and letters of credit in support of our obligations for land development and subdivision improvements, homeowner association dues, warranty work, contractor license fees and earnest money deposits. At December 31, 2023, we had outstanding surety bonds and letters of credit totaling $311.0 million and $118.3 million, respectively, including $77.5 million in letters of credit issued by HomeAmerican. The estimated cost to complete obligations related to these bonds and letters of credit were approximately $107.1 million and $62.4 million, respectively. All letters of credit as of December 31, 2023, excluding those issued by HomeAmerican, were issued under our unsecured Revolving Credit Facility (see Note 16, Lines of Credit and Total Debt Obligations, for further discussion of the Revolving Credit Facility). We expect that the obligations secured by these performance bonds and letters of credit generally will be performed in the ordinary course of business and in accordance with the applicable contractual terms. To the extent that the obligations are performed, the related performance bonds and letters of credit should be released and we should not have any continuing obligations. However, in the event any such performance bonds or letters of credit are called, our indemnity obligations could require us to reimburse the issuer of the performance bond or letter of credit.
We have made no material guarantees with respect to third-party obligations.
Litigation Reserves. Because of the nature of the homebuilding business, we have been named as defendants in various claims, complaints and other legal actions arising in the ordinary course of business, including product liability claims and claims associated with the sale and financing of homes. In the opinion of management, the outcome of these ordinary course matters will not have a material adverse effect upon our financial condition, results of operations or cash flows. At both December 31, 2023 and 2022, we had $0.3 million and $1.2 million, respectively, of legal accruals recorded in accrued liabilities in the consolidated balance sheets.
Lot Option Contracts. In the ordinary course of business, we enter into lot option purchase contracts (“Option Contracts”), generally through a deposit of cash or a letter of credit, for the right to purchase land or lots at a future point in time with predetermined terms. The use of such land option and other contracts generally allow us to reduce the risks associated with direct land ownership and development, reduces our capital and financial commitments, and minimizes the amount of land inventories on our consolidated balance sheets. In certain cases, these contracts will be settled shortly following the end of the period. Our obligation with respect to Option Contracts is generally limited to forfeiture of the related deposits. At December 31, 2023, we had cash deposits and letters of credit totaling $25.7 million and $8.0 million, respectively, at risk associated with options to purchase 4,416 lots.
18. Derivative and Financial Instruments
In the normal course of business, we enter into interest rate lock commitments ("IRLCs") with borrowers who have applied for loan funding and meet defined credit and underwriting criteria. Since we can terminate IRLCs if the borrower does not comply with the terms of the contract, and some IRLCs may expire without being utilized, these IRLCs do not necessarily represent future cash requirements.
Market risk arises if interest rates move adversely between the time we originate a mortgage loan or we enter into an IRLC and the date the loan is committed or sold to an investor. We mitigate our exposure to interest rate market risk relating to mortgage loans held-for-sale and IRLCs using: (1) forward sales of mortgage-backed securities, which are commitments to sell a specified financial instrument at a specified future date for a specified price, (2) mandatory delivery forward loan sale commitments, which are obligations of an investor to buy loans at a specified price within a specified time period, and (3) best-effort delivery forward loan sale commitments, which are obligations of an investor to buy loans at a specified price subject to the underlying mortgage loans being funded and closed. The best-effort delivery forward loan sale commitments do not meet the definition of a derivative financial instrument in accordance with ASC Topic 815, Derivatives and Hedging ("ASC 815"). We have elected the fair value option for the best-effort delivery forward loan sale commitments in accordance with ASC Topic 825, Financial Instruments ("ASC 825").
Forward sales of mortgage-backed securities are the predominant derivative and financial instruments we use to minimize market risk during the period from the time we extend an interest rate lock to a loan applicant until the time the loan is committed under a best-effort or mandatory delivery forward loan sale commitment.
The following table sets forth the notional amounts and fair value measurement of our financial instruments at December 31, 2023 and 2022:
| | | | | | | | | | | | | | | | | | | | | | | | | | | | | |
| December 31, 2023 | | December 31, 2022 |
| | | | | | | | | |
| Notional Value | Derivative Assets | Derivative Liabilities | Derivatives, Net | | Notional Value | Derivative Assets | Derivative Liabilities | Derivatives, Net |
| (Dollars in thousands) | | (Dollars in thousands) |
| Interest rate lock commitments | $ | 229,165 | | $ | 5,124 | | $ | 6 | | $ | 5,118 | | | $ | 394,004 | | $ | 1,566 | | $ | 3,244 | | $ | (1,678) | |
| Forward sales of mortgage-backed securities | 311,500 | | — | | 5,388 | | (5,388) | | | 323,000 | 580 | 5,849 | (5,269) |
| Mandatory delivery forward loan sale commitments | 100,255 | | 122 | | 938 | | (816) | | | 105,060 | 794 | 3 | 791 |
| Best-effort delivery forward loan sale commitments | 5,392 | | 6 | | 10 | | (4) | | | 139,972 | 2,161 | 185 | 1,976 |
For the year ended December 31, 2023, we recorded net gains on these derivative and financial instruments measured on a recurring basis of $1.0 million in revenues in the financial services section of our consolidated statements of operations and comprehensive income, compared to net gain of $34.8 million and $2.9 million for the same periods in 2022 and 2021. There are no credit-risk-related contingent features within our derivative agreements, and counterparty risk is considered minimal.
19. Concentration of Third-Party Mortgage Purchasers
The following table sets forth the percent of mortgage loans sold by HomeAmerican to its primary third party purchasers during 2023, 2022 and 2021. No other third parties purchased greater than 10 percent of our mortgage loans during 2023, 2022 or 2021. | | | | | | | | | | | | | | | | | |
| Year Ended December 31, |
| 2023 | | 2022 | | 2021 |
| Freddie Mac | 23 | % | | 6 | % | | 3 | % |
| PennyMac Loan Services, LLC | 16 | % | | 15 | % | | 37 | % |
| PHH Mortgage | 16 | % | | — | % | | — | % |
| Ginnie Mae | 11 | % | | 10 | % | | 9 | % |
| Fannie Mae | 5 | % | | 32 | % | | 19 | % |
| JPMorgan Chase | 4 | % | | 4 | % | | 13 | % |
20. Stockholders' Equity
Cash Dividends. In each of the years ended December 31, 2023, 2022 and 2021, we paid dividends of $2.10 per share, $2.00 per share and $1.67 per share, respectively.
Stock Dividends. On January 25, 2021, the Company declared an 8% stock dividend that was distributed on March 17, 2021 to shareholders of record on March 3, 2021.
Common Stock Repurchase Program. At December 31, 2023, we were authorized to repurchase up to 4,000,000 shares of our common stock. We did not repurchase any shares of our common stock under this repurchase program during the years ended December 31, 2023, 2022 or 2021. We did not hold any treasury stock at December 31, 2023.
21. Equity Incentive and Employee Benefit Plans
A summary of our equity incentive plans, restated as applicable for stock dividends, follows.
Employee Equity Incentive Plans. On April 27, 2011, our shareholders approved the M.D.C Holdings, Inc. 2011 Equity Incentive Plan (the “2011 Equity Incentive Plan”) which provided for the grant of non-qualified stock options, incentive stock options, stock appreciation rights, restricted stock, restricted stock units and other equity awards to employees of the Company. Stock options granted under the 2011 Equity Incentive Plan had an exercise price that is at least equal to the fair market value of our common stock on the date the stock option is granted, generally vested in periods up to five years and expired ten years after the date of grant. On April 27, 2021, the 2011 Equity Incentive Plan terminated and awards outstanding at the time the plan terminated remain outstanding in accordance with the terms and conditions of the plan and award agreement. There are 1.4 million remaining shares of MDC common stock reserved for awards under the 2011 Equity Incentive Plan as of December 31, 2023.
On April 26, 2021, our shareholders approved the M.D.C Holdings, Inc. 2021 Equity Incentive Plan (the "2021 Equity Incentive Plan") which provides for the grant of non-qualified stock options, incentive stock options, stock appreciation rights, restricted stock, restricted stock units and other stock-based and cash awards to employees of the Company. Stock options granted under the 2021 Equity Incentive Plan have an exercise price that is at least equal to the fair market value of our common stock on the date the stock option is granted, generally vest in periods up to five years and expire ten years after the date of grant. On April 17, 2023, our shareholders approved the First Amendment to the M.D.C. Holdings, Inc. 2021 Equity Incentive Plan, which increased the number of shares of Common Stock available under the plan by an additional 3.0 million shares. At December 31, 2023, a total of 5.6 million shares of MDC common stock were reserved for issuance under the 2021 Equity Incentive Plan, of which 2.2 million shares remained available for grant under this plan as of December 31, 2023.
Director Equity Incentive Plans. Effective April 27, 2011, our shareholders approved the M.D.C. Holdings, Inc. 2011 Stock Option Plan for Non-Employee Directors (the “2011 Director Stock Option Plan”), which provided for the grant of non-qualified stock options to non-employee directors of the Company. Effective March 29, 2016, our shareholders approved an amendment to the 2011 Director Stock Option Plan to provide the non-employee directors with an alternative to elect to receive an award of restricted stock in lieu of a stock option. Pursuant to the 2011 Director Stock Option Plan as amended, on August 1 of each year, each non-employee director was granted either (1) an option to purchase 25,000 shares of MDC common stock or
(2) shares of restricted stock having an expense to the Company that is equivalent to the stock option. Effective April 20, 2020, our shareholders approved an amendment and restatement of the 2011 Director Stock Option Plan to (1) rename the 2011 Director Stock Option Plan as the M.D.C. Holdings, Inc. 2020 Equity Plan for Non-Employee Directors (such amended and restated 2011 Director Plan, the "2020 Director Equity Plan"), (2) increase the number of shares covered by the annual grant of each stock option to 33,067 shares (without increasing the total number of shares authorized under the plan) to reflect, on a going forward basis, the stock dividends declared by the Company, (3) provide that the number of shares covered by the annual grant shall be proportionally increased or decreased in the future for any increase or decrease in the number of shares of stock outstanding on account of any recapitalization, split, reverse split, combination, exchange, dividend or other distribution payable in shares of stock, and (4) extend the 2020 Director Equity Plan's termination date to April 20, 2030. Each option granted under the 2020 Director Equity Plan vests immediately, becomes exercisable six months after grant, and expires ten years from the date of grant. The option exercise price must be equal to the fair market value (as defined in the plan) of our common stock on the date of grant of the option. Each restricted stock award granted under the 2020 Equity Plan vests seven months after the grant date. At December 31, 2023, a total of 0.3 million shares of MDC common stock were reserved for issuance under the 2020 Director Equity Plan and 0.3 million shares remained available for grant under this plan as of December 31, 2023.
Employee Benefit Plan. We have a defined contribution plan pursuant to Section 401(k) of the Internal Revenue Code where each employee may elect to make contributions up to the current tax limits. Effective for 2018 and thereafter, we match employee contributions at a rate of 50% of the first 6% of compensation and, as of December 31, 2023, we had accrued $3.0 million related to the match that is to be contributed in the first quarter of 2024 for 2023 activity. At December 31, 2022, we had accrued $3.5 million related to the match that was contributed in the first quarter of 2023 for 2022 activity. At December 31, 2021, we had accrued $3.6 million related to the match that was contributed during the first quarter of 2022 for 2021 activity.
22. Stock Based Compensation
Determining Fair Value of Share-BasedOptionAwards. Most options that we grant contain only a service condition (“Service-Based” option) and therefore vest over a specified number of years as long as the employee is employed by the Company. For Service-Based options, we use the Black-Scholes option pricing model to determine the grant date fair value.
The fair values for Service-Based options granted for the years ended December 31, 2022 and 2021 were estimated using the Black-Scholes option pricing model with the below weighted-average assumptions. | | | | | | | | | | | | | | | | | |
| Year Ended December 31, |
| 2023 | | 2022 | | 2021 |
| Expected lives of options (years) | N/A | | 9.4 | | 5.4 |
| Expected volatility | N/A | | 43.3 | % | | 40.4 | % |
| Risk free interest rate | N/A | | 3.7 | % | | 0.8 | % |
| Dividend yield rate | N/A | | 5.0 | % | | 3.0 | % |
Based on calculations using the Black-Scholes option pricing model, the weighted-average grant date fair values of stock options granted, restated as applicable for stock dividends, during 2022 and 2021 were $8.36 and $14.66, respectively. There were no stock options granted during the year ended 2023. The expected life of options in the table above represents the weighted-average period for which the options are expected to remain outstanding and are derived primarily from historical exercise patterns. The expected volatility is determined based on our review of the implied volatility that is derived from the price of exchange traded options of the Company. The risk-free interest rate assumption is determined based upon observed interest rates appropriate for the expected term of our employee stock options. The dividend yield assumption is based on our history of dividend payouts.
Stock Option Award Activity. Stock option activity under our option plans, restated as applicable for stock dividends, for the years ended December 31, 2023, 2022 and 2021 were as follows. | | | | | | | | | | | | | | | | | | | | | | | | | | | | | | | | | | | |
| Year Ended December 31, |
| 2023 | | 2022 | | 2021 |
| Number of
Shares | | Weighted-
Average
Exercise
Price | | Number of
Shares | | Weighted-
Average
Exercise
Price | | Number of
Shares | | Weighted-
Average
Exercise
Price |
| Outstanding Stock Option Activity |
| Outstanding, beginning of year | 4,684,481 | | | $ | 26.30 | | | 4,240,004 | | | $ | 23.64 | | | 4,364,161 | | | $ | 23.37 | |
| Granted | — | | | N/A | | 1,846,534 | | | 28.97 | | | 15,000 | | | 53.32 | |
| Exercised | (1,500,008) | | | 21.74 | | | (1,402,057) | | | 21.77 | | | (139,157) | | | 19.87 | |
| Forfeited | — | | | N/A | | — | | | N/A | | — | | | N/A |
| Cancelled | — | | | N/A | | — | | | N/A | | — | | | N/A |
| Outstanding, end of year | 3,184,473 | | | $ | 28.45 | | | 4,684,481 | | | $ | 26.30 | | | 4,240,004 | | | $ | 23.64 | |
| | | | | | | | | | | | | | | | | | | | | | | | | | | | | | | | | | | |
| Year Ended December 31, |
| 2023 | | 2022 | | 2021 |
| Number of
Shares | | Weighted-
Average
Fair Value | | Number of
Shares | | Weighted-
Average
Fair Value | | Number of
Shares | | Weighted-
Average
Fair Value |
| Unvested Stock Option Activity | | | | | | | | | | | |
| Outstanding, beginning of year | 144,000 | | | $ | 8.73 | | | 432,000 | | | $ | 8.25 | | | 875,519 | | | $ | 7.76 | |
| Granted | — | | | — | | | 1,846,534 | | | 8.36 | | | 15,000 | | | 14.66 | |
| Vested | (144,000) | | | 8.73 | | | (2,134,534) | | | 8.32 | | | (458,519) | | | 7.52 | |
| Forfeited | — | | | — | | | — | | | — | | | — | | | — | |
| Unvested, end of year | — | | | $ | — | | | 144,000 | | | $ | 8.73 | | | 432,000 | | | $ | 8.25 | |
The total intrinsic value of options (difference between price per share as of the exercise date and the exercise price, times the number of options outstanding) exercised during the years ended December 31, 2023, 2022 and 2021 was $33.7 million, $16.2 million and $5.1 million, respectively.
The following table provides data for our stock options that are vested or expected to vest as of December 31, 2023. | | | | | |
Exercisable or expected to vest | |
Number outstanding | 3,184,473 | |
Weighted-average exercise price | $ | 28.45 | |
Aggregate intrinsic value (in thousands) | $ | 85,342 | |
Weighted-average remaining contractual term (years) | 7.31 |
| |
Exercisable | |
Number outstanding | 3,184,473 | |
Weighted-average exercise price | $ | 28.45 | |
Aggregate intrinsic value (in thousands) | $ | 85,342 | |
Weighted-average remaining contractual term (years) | 7.31 |
The aggregate intrinsic values in the tables above represent the total pretax intrinsic values (the difference between the closing price of MDC’s common stock on the last trading day of fiscal 2023 and the exercise price, multiplied by the number of in-the-money stock option shares) that would have been received by the option holders had all in-the-money outstanding stock options been exercised on December 31, 2023.
The following table summarizes information associated with outstanding and exercisable stock options at December 31, 2023. | | | | | | | | | | | | | | | | | | | | | | | | | | | | | | | | | | | | | | | | | | | | | | | | | | |
| | | | | | Options Outstanding | | Options Exercisable |
| Range of Exercise Price | | Number
Outstanding | | Weighted-
Average
Remaining
Contractual
Life (in
years) | | Weighted-
Average
Exercise
Price | | Number
Outstanding | | Weighted-
Average
Remaining
Contractual
Life (in
years) | | Weighted-
Average
Exercise
Price |
| $ | 15.01 | | | - | | $ | 20.00 | | | 14,879 | | | 2.03 | | $ | 17.20 | | | 14,879 | | | 2.03 | | $ | 17.20 | |
| $ | 20.01 | | | - | | $ | 25.00 | | | 432,000 | | | 6.32 | | 23.90 | | | 432,000 | | | 6.32 | | 23.90 | |
| $ | 25.01 | | | - | | $ | 30.00 | | | 2,266,560 | | | 7.85 | | 28.29 | | | 2,266,560 | | | 7.85 | | 28.29 | |
| $ | 30.01 | | | - | | $ | 35.00 | | | 432,000 | | | 5.59 | | 32.92 | | | 432,000 | | | 5.59 | | 32.92 | |
| $ | 35.01 | | | - | | $ | 40.00 | | | 24,034 | | | 8.58 | | 36.48 | | | 24,034 | | | 8.58 | | 36.48 | |
| $ | 50.01 | | | - | | $ | 55.00 | | | 15,000 | | | 7.58 | | 53.32 | | | 15,000 | | | 7.58 | | 53.32 | |
| Total | | | | | | 3,184,473 | | | 7.31 | | $ | 28.45 | | | 3,184,473 | | | 7.31 | | $ | 28.45 | |
Total compensation expense relating to stock options was $0.2 million, $17.4 million and $3.0 million for the years ended December 31, 2023, 2022 and 2021, respectively. Our recognized tax benefit from this expense for the years ended December 31, 2023, 2022 and 2021 was $0.0 million, $0.1 million and $0.1 million, respectively.
As of December 31, 2023, there was no unrecognized compensation cost related to stock options that is expected to be recognized as an expense by the Company in the future.
For the years ended December 31, 2023, 2022 and 2021 the Company received cash from the exercise of stock option awards of $32.6 million, $30.5 million and $2.6 million, respectively. Our realized tax benefit from stock options exercised for the years ended December 31, 2023, 2022 and 2021 was $6.7 million, $2.5 million and $1.1 million, respectively.
Restricted Stock Award Activity. Non-vested restricted stock awards, restated as applicable for stock dividends, at December 31, 2023, 2022 and 2021 and changes during those years were as follows: | | | | | | | | | | | | | | | | | | | | | | | | | | | | | | | | | | | |
| Year Ended December 31, |
| 2023 | | 2022 | | 2021 |
| Number of
Shares | | Weighted-
Average
Grant Date
Fair Value | | Number of
Shares | | Weighted-
Average
Grant Date
Fair Value | | Number of
Shares | | Weighted-
Average
Grant Date
Fair Value |
| Unvested, beginning of year | 363,801 | | | $ | 46.58 | | | 347,552 | | | $ | 47.27 | | | 413,274 | | | $ | 35.94 | |
| Granted | 289,694 | | | 43.14 | | | 240,536 | | | 45.21 | | | 208,386 | | | 53.47 | |
| Vested | (205,193) | | | 44.66 | | | (210,157) | | | 45.88 | | | (257,430) | | | 38.49 | |
| Forfeited | (3,653) | | | 51.96 | | | (14,130) | | | 50.67 | | | (16,678) | | | 49.21 | |
| Unvested, end of year | 444,649 | | | $ | 45.18 | | | 363,801 | | | $ | 46.58 | | | 347,552 | | | $ | 47.27 | |
Total compensation expense relating to restricted stock awards was $16.2 million, $10.2 million and $10.1 million for the years ended December 31, 2023, 2022 and 2021, respectively. Our recognized tax benefit from this expense for the years ended December 31, 2023, 2022 and 2021 was $1.2 million, $1.1 million and $1.4 million, respectively.
At December 31, 2023, there was $6.9 million of unrecognized compensation expense related to non-vested restricted stock awards that is expected to be recognized as an expense by us in the future over a weighted-average period of approximately 1.8 years. The total intrinsic value of unvested restricted stock awards (the closing price of MDC’s common stock on the last trading day of fiscal 2023 multiplied by the number of unvested awards) at December 31, 2023 was $24.6 million. The total intrinsic value of restricted stock which vested during each of the years ended December 31, 2023, 2022 and 2021 was $7.9 million, $9.5 million and $13.4 million, respectively.
PerformanceShareUnit Awards. The Company has made annual grants of long term performance share unit awards ("PSUs") to each of the Executive Chairman, CEO and the Chief Financial Officer ("CFO"), as detailed in the table below. The PSUs are earned based upon the Company’s performance, over a period of three years (the “Performance Period”), measured by increasing home sale revenues over a “Base Period.” Each award is conditioned upon the Company achieving an average gross margin from home sales (excluding impairments) of at least fifteen percent (15%) over the Performance Period. Target goals will be earned if the Company’s three year average home sale revenues over the Performance Period (“Performance Revenues”) exceed the home sale revenues over the Base Period (“Base Revenues”) by at least 10% but less than 20%. If Performance Revenues exceed the Base Revenues by at least 5% but less than 10%, 50% of the Target Goals will be earned (“Threshold Goals”). If Performance Revenues exceed the Base Revenues by at least 20%, 200% of the Target Goals will be earned (“Maximum Goals”). The number of PSUs earned shall be adjusted to be proportional to the partial performance between the Threshold Goals, Target Goals and Maximum Goals. Details for each defined term above for each grant have been provided in the table below. | | | | | | | | | | | | | | | | | | | | | | | | | | | | | | | | | | | | | | | | | | | | | | | | | | | | | | | | | | | | | | | | | | | | | | | | | | |
| | | | | | | | Threshold Goal | | Target Goal | | Maximum Goal | | | | Maximum Potential Expense to be Recognized * | | Maximum Remaining Expense to be Recognized * |
| Date of Award | | Performance Period | | Base Period | | Base Period Revenues | | PSUs | | Home Sale Revenues | | PSUs | | Home Sale Revenues | | PSUs | | Home Sale Revenues | | Fair Value per Share | | |
| Aug 23, 2023 | | January 1, 2023 - December 31, 2025 | | January 1, 2023 - December 31, 2023 | | $4.520 billion | | 198,750 | | | $4.746 billion | | 397,500 | | | $4.972 billion | | 795,000 | | | $5.424 billion | | $ | 42.18 | | | $ | 33,536 | | | $ | 33,536 | |
| | | | | | | | | | | | | | | | | | | | | | | | |
| Jul 14, 2021 | | January 1, 2021 - December 31, 2023 | | January 1, 2020 - December 31, 2020 | | $3.765 billion | | 198,750 | | | $3.953 billion | | 397,500 | | | $4.142 billion | | 795,000 | | | $4.518 billion | | $ | 44.35 | | | $ | 35,255 | | | $ | — | |
_______________________
* Dollars in thousands
In accordance with ASC 718, the PSUs were valued on the date of grant at their fair value. The fair value of these grants was equal to the closing price of MDC stock on the date of grant less the discounted cash flows of expected future dividends over the respective vesting period (as these PSUs do not participate in dividends). The grant date fair value and maximum potential expense if the Maximum Goals were met for these awards has been provided in the table above. ASC 718 does not permit recognition of expense associated with performance-based stock awards until achievement of the performance targets are probable of occurring.
2018 PSU Grants. The 2018 PSU awards vested on April 29, 2021. For the year ended December 31, 2021 the Company recorded share-based award expense of $1.3 million.
2019 PSU Grants. The 2019 PSU awards vested on February 3, 2022. For the year ended December 31, 2021 the Company recorded the required share-based award expense related to the awards of $7.3 million related to these awards.
2020 PSU Grants. The 2020 PSU awards vested on February 3, 2023. For the year ended December 31, 2022 and 2021, the Company recorded the required share-based award expense related to the awards of $9.8 million and $13.4 million, respectively, based on its assessment of the probability for achievement of the performance targets.
2021 PSU Grants. For the year ended December 31, 2023, 2022 and 2021, the Company recorded the required share-based award expense related to the awards of $7.1 million, $23.7 million and $4.4 million, based on its assessment of the probability for achievement of the performance targets.
2023 PSU Grants. For the year ended December 31, 2023, the Company concluded that achievement of any of the performance metrics had not met the level of probability required to record compensation expense and as such, no expense related to these awards was recognized in year-ended 2023.
Our employee equity incentive plans permit us to withhold from the total number of shares that otherwise would be released to a restricted stock or performance share unit award recipient upon distribution that number of shares having a fair value at the time of distribution equal to the applicable income tax withholdings due. For the years ended December 31, 2023, 2022, and 2021, 293,366, 294,160 and 316,620 shares were withheld, respectively, resulting in $11.8 million, $13.7 million and $18.8 million of income tax withholding, respectively, being remitted on behalf of the employees.
23. Supplemental Guarantor Information
Our senior notes are fully and unconditionally guaranteed on an unsecured basis, jointly and severally, by the following subsidiaries (collectively, the "Guarantor Subsidiaries"), which are 100%-owned subsidiaries of the Company.
•M.D.C. Land Corporation
•RAH of Florida, Inc.
•Richmond American Construction, Inc.
•Richmond American Construction NM, Inc.
•Richmond American Homes of Arizona, Inc.
•Richmond American Homes of Colorado, Inc.
•Richmond American Homes of Florida, LP
•Richmond American Homes of Idaho, Inc.
•Richmond American Homes of Maryland, Inc.
•Richmond American Homes of Nevada, Inc.
•Richmond American Homes of New Mexico, Inc.
•Richmond American Homes of Oregon, Inc.
•Richmond American Homes of Pennsylvania, Inc.
•Richmond American Homes of Tennessee
•Richmond American Homes of Texas, Inc.
•Richmond American Homes of Utah, Inc.
•Richmond American Homes of Virginia, Inc.
•Richmond American Homes of Washington, Inc.
The senior note indentures do not provide for a suspension of the guarantees. Other than for the senior notes due 2061, the senior note indentures, provide that any Guarantor may be released from its guarantee so long as (1) no default or event of default exists or would result from release of such guarantee, (2) the Guarantor being released has consolidated net worth of less than 5% of the Company’s consolidated net worth as of the end of the most recent fiscal quarter, (3) the Guarantors released from their guarantees in any year-end period comprise in the aggregate less than 10% (or 15% if and to the extent necessary to permit the cure of a default) of the Company’s consolidated net worth as of the end of the most recent fiscal quarter, (4) such release would not have a material adverse effect on the homebuilding business of the Company and its subsidiaries and (5) the Guarantor is released from its guarantee(s) under all Specified Indebtedness (other than by reason of payment under its guarantee of Specified Indebtedness). The indenture for the senior notes due 2061 provides that, if a Guarantor is released under its guarantees of our credit facilities or other publicly traded debt securities, the Guarantor will also be released under its guarantee of the senior notes due 2061. Upon delivery of an officers’ certificate and an opinion of counsel stating that all conditions precedent provided for in the indenture relating to such transactions have been complied with and the release is authorized, the guarantee will be automatically and unconditionally released. “Specified Indebtedness” means indebtedness under the senior notes, the Company’s Indenture dated as of December 3, 2002, the Revolving Credit Facility, and any refinancing, extension, renewal or replacement of any of the foregoing.
As the combined assets, liabilities and results of operations of M.D.C. Holdings, Inc. and the Guarantor Subsidiaries (the “Obligor Group”) are not materially different from those in the homebuilding section of our consolidated balance sheets and consolidated statements of operations and comprehensive income, separate summarized financial information of the Obligor Group has not been included. As of December 31, 2023 and 2022 amounts due to non-guarantor subsidiaries from the Obligor Group totaled $(39.6) million and $29.7 million, respectively.
24. Subsequent Events
Announcement of SH Residential Holdings Merger. On January 17, 2024, we entered into the Merger Agreement with Parent, Merger Sub and, solely for the purposes of Section 6.2, Section 6.17 and Section 9.15 of the Merger Agreement, the Guarantor. Pursuant to the terms and conditions set forth in the Merger Agreement, Merger Sub will merge with and into the Company, with the Company continuing as the surviving corporation. At the effective time of the Merger (the “Effective Time”), each share of common stock, par value $0.01 per share, of the Company, outstanding as of immediately prior to the Effective Time (other than shares of common stock that are (A)(1) held by the Company as treasury stock; (2) held directly by Parent or Merger Sub; or (3) held by any direct or indirect wholly owned subsidiary of Parent or Merger Sub, in each case, immediately prior to the Effective Time (collectively, the “Owned Company Shares”), (B) held by any direct or indirect wholly owned subsidiary of the Company immediately prior to the Effective Time, (C) held by a holder who is entitled to demand, and has properly and validly demanded, appraisal for such shares of common stock in accordance with, and who complies in all respects with, Section 262 of the Delaware General Corporation Law (the “DGCL” and such shares, the “Dissenting Shares”), or (D) subject to vesting restrictions and/or forfeiture back to the Company (“Company RSAs”)) will be automatically converted into the right to receive $63.00 per share, in cash, without interest thereon (the “Merger Consideration”). At the Effective Time, each Owned Company Share will automatically be cancelled and cease to exist, and no consideration or payment will be delivered in exchange therefor or in respect thereof, and each share of common stock held by any direct or indirect wholly owned subsidiary of the Company shall be converted into such number of shares of common stock of the surviving corporation with an aggregate value immediately after the consummation of the Merger equal to the Merger Consideration. At the Effective Time, each Dissenting Share will be cancelled and cease to exist, and the holders of Dissenting Shares will only be entitled to the rights granted to them under Section 262 of the DGCL with respect to such Dissenting Shares.
At the Effective Time, subject to the terms and conditions set forth in the Merger Agreement, each (i) option to purchase shares of common stock granted under any Company equity plan (each, a “Company Option”) that is outstanding and unexercised, whether vested or unvested, as of immediately prior to the Effective Time will be fully vested, cancelled and automatically converted into the right to receive an amount in cash (without interest), if any, equal to the product of (A) the excess (if any) of (1) the Merger Consideration over (2) the exercise price per share of such Company Option, multiplied by (B) the number of shares of common stock subject to such Company Option, subject to any required withholding of taxes; provided, however, that any Company Option with respect to which the applicable per share exercise price is greater than the Merger Consideration will be cancelled without consideration; (ii) Company RSA, whether vested or unvested, that is outstanding as of immediately prior to the Effective Time will be fully vested, cancelled and automatically converted into the right to receive an amount in cash (without interest) equal to the product of (A) the aggregate number of shares of common stock subject to such Company RSA, multiplied by (B) the Merger Consideration, subject to any required withholding of taxes; and (iii) performance stock unit award relating to shares of common stock granted under any Company equity plan (each, a “Company PSU”), whether vested or unvested, that is outstanding as of immediately prior to the Effective Time will be fully vested, cancelled and automatically converted into the right to receive an amount in cash equal to the product of (A) the aggregate number of shares of common stock subject to such Company PSU based on maximum performance, multiplied by (B) the Merger Consideration, subject to any required withholding of taxes.
Our Board of Directors unanimously approved the Merger and the Merger Agreement. If approved by our stockholders, we currently expect the Merger to close in the first half of 2024. Until the closing, we will continue to operate as an independent company.
The closing of the Merger is subject to certain conditions set forth in the Merger Agreement, including, but not limited to, the (i) affirmative vote of the holders of a majority of all of the outstanding shares of common stock to adopt the Merger Agreement; (ii) expiration or termination of any waiting period (and extensions thereof) applicable to the transactions contemplated by the Merger Agreement, including the Merger, under the Hart-Scott-Rodino Antitrust Improvements Act of 1976, as amended, and the rules and regulations promulgated thereunder (“HSR”); (iii) absence of any law, order or injunction enacted or issued after the date of the Merger Agreement restraining, enjoining or otherwise prohibiting the Merger; and (iv) the absence of certain events constituting a material adverse effect on the Company’s business following the date of the Merger Agreement. The obligations of Parent and Merger Sub to consummate the Merger are not subject to any financing condition.
The Company made customary representations and warranties in the Merger Agreement and agreed to customary covenants regarding the operation of the business of the Company and its subsidiaries prior to the consummation of the Merger. The Merger Agreement also provides that the Company, on the one hand, or Parent and Merger Sub, on the other hand, may specifically enforce the obligations under the Merger Agreement, including the obligation to consummate the Merger if the conditions set forth in the Merger Agreement are satisfied. The parties to the Merger Agreement have also agreed to use their
respective reasonable best efforts and take certain actions to obtain the requisite regulatory approvals for the transactions contemplated by the Merger Agreement, including the Merger.
From the execution of the Merger Agreement until the earlier to occur of the termination of the Merger Agreement and the Effective Time, the Company will be subject to customary “no-shop” restrictions on its ability to solicit alternative acquisition proposals from third parties and to provide information to, and participate in discussions and negotiations with, third parties regarding any alternative acquisition proposals, subject to a customary “fiduciary out” provision that allows the Company, under certain specified circumstances, to provide information to, and participate or engage in discussions or negotiations with, third parties with respect to an acquisition proposal if the Board determines in good faith (after consultation with the Company’s financial advisor and outside legal counsel) that such alternative acquisition proposal constitutes a superior proposal or would be reasonably likely to result in a superior proposal, and the failure to take such actions would be reasonably likely to be inconsistent with the directors’ fiduciary duties pursuant to applicable law.
The Merger Agreement contains certain termination rights for the Company on the one hand and Parent and Merger Sub on the other hand. Upon termination of the Merger Agreement under specified circumstances, including (i) the Company terminating the Merger Agreement to enter into an alternative acquisition agreement providing for a superior proposal; or (ii) Parent terminating the Merger Agreement due to the Company’s Board’s change of its recommendation that our shareholders adopt the Merger Agreement and approve the transactions, including the Merger, in each case pursuant to and in accordance with the “fiduciary out” provisions of the Merger Agreement, the Company will be required to pay Parent a termination fee of $147,420,000. The termination fee will also be payable by the Company if the Merger Agreement is terminated under certain circumstances and prior to such termination (or at least two business days prior to our special meeting in the case of termination for the failure to receive the requisite shareholder approval), an acquisition proposal has been publicly announced and not publicly withdrawn or not otherwise publicly abandoned and an acquisition proposal is consummated or we enter into a definitive agreement with respect to an acquisition proposal within one year of the termination. In addition to the foregoing termination rights, and subject to certain limitations, the Company or Parent may terminate the Merger Agreement if the Merger is not consummated by July 17, 2024, subject to extension at the election of the Company or Parent for three months if necessary to obtain HSR approval or to resolve an injunction relating to other specified governmental consents.
Item 9. Changes in and Disagreements with Accountants on Accounting and Financial Disclosure.
None.
Item 9A. Controls and Procedures.
Conclusion Regarding the Effectiveness of Disclosure Controls and Procedures
An evaluation of the effectiveness of the design and operation of our disclosure controls and procedures was performed under the supervision, and with the participation, of our management, including the principal executive officer and the principal financial officer. Based on that evaluation, our management, including the principal executive officer and principal financial officer, concluded that our disclosure controls and procedures were effective as of the end of the period covered by this report.
Management's Report on Internal Control Over Financial Reporting
Management is responsible for establishing and maintaining adequate internal control over financial reporting. Under the supervision and with the participation of our management, including the principal executive officer and the principal financial officer, we conducted an evaluation of the effectiveness of our internal control over financial reporting based on the framework in the Internal Control—Integrated Framework (2013 framework) issued by the Committee of Sponsoring Organizations of the Treadway Commission. Based on our evaluation under this framework, management concluded that our internal control over financial reporting was effective at December 31, 2023.
Ernst & Young LLP, the independent registered public accounting firm that audited the consolidated financial statements included in this annual report on Form 10-K, has issued an attestation report on our internal control over financial reporting, which is included herein.
Changes in Internal Control over Financial Reporting
There were no changes in our internal control over financial reporting that occurred during the fourth quarter that have materially affected, or are reasonably likely to materially affect, our internal control over financial reporting.
Report of Independent Registered Public Accounting Firm
To the Stockholders and the Board of Directors of M.D.C. Holdings, Inc.
Opinion on Internal Control Over Financial Reporting
We have audited M.D.C. Holdings, Inc.’s internal control over financial reporting as of December 31, 2023, based on criteria established in Internal Control—Integrated Framework issued by the Committee of Sponsoring Organizations of the Treadway Commission (2013 framework) (the COSO criteria). In our opinion, M.D.C. Holdings, Inc. (the Company) maintained, in all material respects, effective internal control over financial reporting as of December 31, 2023, based on the COSO criteria.
We also have audited, in accordance with the standards of the Public Company Accounting Oversight Board (United States) (PCAOB), the consolidated balance sheets of the Company as of December 31, 2023 and 2022, the related consolidated statements of operations and comprehensive income, stockholders’ equity and cash flows for each of the three years in the period ended December 31, 2023, and the related notes and our report dated January 30, 2024 expressed an unqualified opinion thereon.
Basis for Opinion
The Company’s management is responsible for maintaining effective internal control over financial reporting and for its assessment of the effectiveness of internal control over financial reporting included in the accompanying Management’s Report on Internal Control Over Financial Reporting. Our responsibility is to express an opinion on the Company’s internal control over financial reporting based on our audit. We are a public accounting firm registered with the PCAOB and are required to be independent with respect to the Company in accordance with the U.S. federal securities laws and the applicable rules and regulations of the Securities and Exchange Commission and the PCAOB.
We conducted our audit in accordance with the standards of the PCAOB. Those standards require that we plan and perform the audit to obtain reasonable assurance about whether effective internal control over financial reporting was maintained in all material respects.
Our audit included obtaining an understanding of internal control over financial reporting, assessing the risk that a material weakness exists, testing and evaluating the design and operating effectiveness of internal control based on the assessed risk, and performing such other procedures as we considered necessary in the circumstances. We believe that our audit provides a reasonable basis for our opinion.
Definition and Limitations of Internal Control Over Financial Reporting
A company’s internal control over financial reporting is a process designed to provide reasonable assurance regarding the reliability of financial reporting and the preparation of financial statements for external purposes in accordance with generally accepted accounting principles. A company’s internal control over financial reporting includes those policies and procedures that (1) pertain to the maintenance of records that, in reasonable detail, accurately and fairly reflect the transactions and dispositions of the assets of the company; (2) provide reasonable assurance that transactions are recorded as necessary to permit preparation of financial statements in accordance with generally accepted accounting principles, and that receipts and expenditures of the company are being made only in accordance with authorizations of management and directors of the company; and (3) provide reasonable assurance regarding prevention or timely detection of unauthorized acquisition, use, or disposition of the company’s assets that could have a material effect on the financial statements.
Because of its inherent limitations, internal control over financial reporting may not prevent or detect misstatements. Also, projections of any evaluation of effectiveness to future periods are subject to the risk that controls may become inadequate because of changes in conditions, or that the degree of compliance with the policies or procedures may deteriorate.
/s/ Ernst & Young LLP
Denver, Colorado
January 30, 2024
Item 9B. Other Information.
None
Item 9C. Disclosure Regarding Foreign Jurisdictions that Prevent Inspections.
Not applicable.
PART III
Item 10. Directors,Executive Officers and Corporate Governance.
Information not disclosed below that is required by this Item is incorporated herein by reference, when filed, from our proxy statement (the “Proxy Statement”) for the Annual Meeting of Shareholders to be held on or about May 1, 2024, to be filed with the Securities and Exchange Commission pursuant to Regulation 14A under the Exchange Act. Please see the Table of Contents to the Proxy Statement.
We will provide to any shareholders or other person without charge, upon request, a copy of our Corporate Code of Conduct, Corporate Governance Guidelines, code of ethics applicable to our principal executive officer, principal financial officer, principal accounting officer or controller, or persons performing similar functions (collectively “senior financial officers”) and the charters for our Audit Committee, Compensation Committee, Legal Committee and Corporate Governance/Nominating Committee. You may obtain these documents on our website at www.mdcholdings.com, under our Investor Relations section or by contacting our Investor Relations department at 1-866-424-3395. Our intention is to post on our website any amendments to or waivers from our code of ethics applicable to our senior financial officers if such disclosure is required.
Item 11. Executive Compensation.
Information required to be set forth hereunder has been omitted and will be incorporated by reference, when filed, from our Proxy Statement. Please see the Table of Contents to the Proxy Statement.
Item 12. Security Ownership of Certain Beneficial Owners and Management and Related Stockholder Matters.
Information required to be set forth hereunder has been omitted and will be incorporated by reference, when filed, from our Proxy Statement. Please see the Table of Contents to the Proxy Statement.
Item 13. Certain Relationships and Related Transactions, and Director Independence.
Information required
Review of Transactions With Related Persons
Our policies require that full information be disclosed regarding transactions with related persons, without mandating how such transactions are to be set forth hereunderaddressed, so that they may be considered on their own merits. Specifically, our Corporate Code of Conduct, in addressing conflicts of interest, notes that personal interests of our employees and Directors and their family members could come into conflict, or create the appearance of a conflict, with the Company's interest. Accordingly, the Code of Conduct requires all employees (including our executive officers) and our Directors to immediately report conflicts of interest or transactions that could create the appearance of a conflict of interest. These reports are to be made immediately to a Company compliance officer (as identified in the Code of Conduct), the Company's Asset Management Committees, or, for members of the Company's Board of Directors, to the Audit Committee, for a determination as to compliance with the Code of Conduct.
In addition, the Audit Committee's charter provides for the Committee to be informed of any proposed related party transactions so that the Committee can review the proposed transaction. In support of this and the Company's SEC reporting requirements, the following written procedure has been omittedadopted. Specifically, the executive officers and Directors are to inform the Committee of any potential related party transactions and, each quarter, are to attest to the existence of any related party transactions. The Company's legal department reports on a monthly basis to the Audit Committee any new related party transactions between the Company (or any of its subsidiaries) and any of the executive officers and Directors, including any of their family members. Also, our CFO reports on a monthly basis to the Audit Committee as to the best of the CFO’s, Executive Chairman's and CEO’s knowledge, whether or not any related party transactions have occurred.
Transactions With Related Persons
The Company leases its headquarters office space at 4350 S. Monaco Street, Denver, CO 80237. Approximately 5,437 square feet in the Company's office building at 4350 S. Monaco Street is subleased by an entity affiliated with Mr. Mizel, for which it paid rent in 2023 to the Company of $162,784.
During 2023, the Company paid a firm owned by Carol Mizel, Mr. Mizel's spouse, $120,000 for consulting services in connection with corporate and consumer marketing, merchandising, design work, human resources development, product development, and such other matters as were requested by the Company's senior management. The firm, Mizel Design and Decorating Company, provided these services under an Independent Contractor Agreement with the Company, dated as of January 1, 2005. The Company also provides Ms. Mizel with office space in the Company's office building at 4350 S. Monaco Street, which has an estimated annual rental value of approximately $7,500.
As noted above, Director Courtney L. Mizel is the daughter of the Company’s Executive Chairman, Larry A. Mizel.
Director Independence.
Each of Ms. Sinden and Messrs. Baker, Berman, Blackford, Buchwald, Farooqui, Reece and Siegel are independent. NYSE listing standards require that the Board be comprised of a majority of independent directors. SEC rules and NYSE listing standards require that audit committees be comprised solely of independent directors. NYSE listing standards also require that corporate governance/nominating committees and compensation committees be comprised solely of independent directors.
Under the NYSE listing standards, no director qualifies as "independent" unless the Board affirmatively determines that the director has no material relationship with the Company, either directly or as a partner, shareholder or officer of an organization that has a relationship with the Company. Material relationships can include commercial, industrial, banking, consulting, legal, accounting, charitable and familial relationships, among others. The NYSE listing standards also require that, in determining the independence of any director who will serve on the Company’s Compensation Committee, the Board consider all factors specifically relevant to determining whether the director has a relationship with the Company that is material to that director’s ability to be incorporated by reference, when filed,independent from our Proxy Statement. Please seemanagement in connection with the duties of a Compensation Committee member, including the source of compensation of such director and whether the director is affiliated with the Company (or a subsidiary or affiliate of a subsidiary).
The Board has adopted standards of independence to assist in determining whether a director of the Company is independent. The standards are available on the investor relations section of the Company's website, www.mdcholdings.com.
The Company's Board of Directors has determined the independence of Directors based on a review conducted by the Corporate Governance/Nominating Committee. This determination included consideration of the checking and money market accounts the Company maintains at two banking divisions of Zions Bancorporation, National Association (“Zions”), of which Mr. Blackford is an officer. The Board also considered the participation by Zions as the smallest lender in the Company’s revolving credit facility, in which there are several lenders. Mr. Blackford had no direct or indirect material interest in the foregoing transactions and the Board concluded that the amounts involved (less than 0.010% of Zion’s revenues) were not significant.
With respect to the Proxy Statement.determination of Mr. Reece’s independence, the Board considered that, until his retirement on August 1, 2008, he was the Executive Vice President and Chief Financial Officer of the Company. Mr. Reece is serving in a volunteer position as president of a non-profit organization (Cancer League of Colorado), which, in 2023, received charitable contributions from a number of Company officers and directors (totaling less than $20,000). The Board concluded that the amount was not significant.
The Board determined that Ms. Sinden and each of Messrs. Baker, Berman, Blackford, Buchwald, Farooqui, Reece and Siegel have no material relationship with the Company, each is independent under the NYSE listing standards and each meets the foregoing standards of Director independence adopted by the Board, including for Audit, Corporate Governance/Nominating and Compensation Committee membership. The Board determined that each of the foregoing Directors meets the independence standards for Audit Committee membership under the rules of the SEC and they each qualify as a “non-employee director” as defined in Rule 16b-3 of the Exchange Act.
Item 14. Principal Accounting Fees and Services.
Information requiredAudit Fees and All Other Fees
A summary of the fees of Ernst & Young LLP Denver, Colorado (PCAOB 00042) for the years ended December 31, 2023 and 2022 are set forth below:
| | | | | | | | | | | |
| | 2023 | | 2022 |
Audit Fees 1 | $ | 1,521,426 | | | $ | 1,419,561 | |
| Audit-Related Fees | — | | | — | |
Tax Fees 2 | 670 | | | — | |
All Other Fees 3 | 3,773 | | | 4,213 | |
| Total Fees | $ | 1,525,869 | | | $ | 1,423,774 | |
1Consists of fees and expenses for the audit of consolidated financial statements, PCAOB AS 4105 interim reviews, the audit of internal control over financial reporting and services rendered in connection with statutory and regulatory filings (includes the audit of HomeAmerican Mortgage Corporation).
2Consists of fees and expenses for miscellaneous tax consulting services.
3 Consists of fees for access to Ernst & Young LLP online resources.
Audit Committee Pre-Approval Procedures
Under the procedures established by the Audit Committee, all audit services and all non-audit services by the Company's auditors are to be set forth hereunder has been omitted and will be incorporatedpre-approved by reference, when filed, from our Proxy Statement. Please see the Table of ContentsAudit Committee, subject to the Proxy Statement.de minimis exception provided under Section 202 of the Sarbanes-Oxley Act of 2002. In certain cases, pre-approval is provided by the Committee for up to a year as to particular categories of services, subject to a specific budget. The Committee also has delegated to each of its members the authority to grant pre-approvals, such pre-approvals to be presented to the full Committee at the next scheduled meeting. For 2023 and 2022, all of the fees included under the headings "Audit-Related Fees," "Tax Fees" and "All Other Fees" above were pre-approved by the Audit Committee.
PART IV
Item 15. Exhibits and Financial Statement Schedules.
(a)(1) Financial Statements.
The followingSee Index to Consolidated Financial Statements of the Company and its subsidiaries are included in Part II, Item 8. | | | | | |
| Page |
| |
M.D.C. Holdings, Inc. and Subsidiaries | |
| |
| |
| |
| |
| |
| |
8 of the Original Form 10-K.(a)(2) Financial Statement Schedules.
All schedules are omitted because they are not applicable, not material, not required or the required information is included inSee the applicable Consolidated Financial Statements or notes thereto.thereto of the Original Form 10-K.
(a)(3) Exhibits.
INDEX TO EXHIBITS | | | | | | | | |
Exhibit
Number | | Description |
| | |
| 2.1 | | |
| | |
| 3.1 | | |
| | |
| 3.2 | | |
| | |
| 4.1 | | |
| | |
| 4.2 | | |
| | |
| 4.3 | | |
| | |
| | |
| 4.4 | | |
| | |
| 4.5 | | |
| | |
| | | | | | | | |
| 9 | | |
| | |
| 10.1 | | Credit Agreement by and among M.D.C. Holding, Inc., U.S. Bank National Association, as designated agent and co-administrative agent, Citibank, N.A., as co-administrative agent, and the other Lenders identified therein, as amended as of April 11, 2023 (incorporated by reference to Exhibit 10.1 to the Company's Form 8-K filed April 13, 2023). * |
| | |
| 10.2 | | |
| | |
| 10.3 | | |
| | |
| 10.4 | | |
| | |
| 10.5 | | |
| | |
| 10.6 | | |
| | |
| 10.7 | | |
| | |
| 10.8 | | |
| | |
| 10.9 | | |
| | |
| 10.10 | | |
| | |
| 10.11 | | |
| | |
| 10.12 | | |
| | |
| | | | | | | | |
| 10.17 | | |
| | |
| 10.18 | | |
| | |
| 10.19 | | |
| | |
| 10.20 | | |
| | |
| 10.21 | | |
| | |
| 10.22 | | |
| | |
| 10.23 | | |
| | |
| 10.24 | | |
| | |
| 10.25 | | |
| | |
| 10.26 | | |
| | |
| 10.27 | | |
| | |
| 10.28 | | |
| | |
| 10.29 | | |
| | |
| 10.30 | | |
| | |
| 10.31 | | |
| | |
| 10.32 | | |
| | |
| | | | | | | | |
| 10.33 | | |
| | |
| 10.34 | | |
| | |
| 10.35 | | |
| | |
| 10.36 | | |
| | |
| 10.37 | | |
| | |
| | | | | | | | |
| 10.38 | | |
| | |
| 10.39 | | |
| | |
| 10.40 | | |
| | |
| 10.41 | | |
| | |
| 10.42 | | |
| | |
| 10.43 | | |
| | |
| 10.44 | | |
| | |
| 10.45 | | |
| | |
| 10.46 | | |
| | |
| 10.47 | | |
| | |
| 10.48 | | |
| | |
| 10.49 | | |
| | |
| 10.50 | | |
| | |
| 10.51 | | |
| | |
| 10.52 | | |
| | |
| 10.53 | | |
| | |
| 10.54 | | |
| | |
| 10.55 | | |
| | |
| 10.56 | | |
| | | | | | | | |
| 10.61 | | |
| | |
| 10.62 | | |
| | |
| 10.63 | | |
| | |
| 10.64 | | |
| | |
| 10.65 | | |
| | |
| 10.66 | | |
| | |
| 10.67 | | |
| | |
| 10.68 | | |
| | |
| 10.69 | | |
| | |
| 10.70 | | |
| | |
| 10.71 | | |
| | |
| 10.72 | | |
| | |
| 10.73 | | |
| | |
| 10.74 | | |
| | |
| 21 | | |
| | |
| 22 | | |
| | |
| 23 | | |
| | |
| | | | | | | | |
| 32.1 | | |
| | |
| 32.2 | | |
| | |
| 97 | | |
| | |
| 101 | | The following financial statements, formatted in Inline Extensible Business Reporting Language (iXBRL): (i) Consolidated Balance Sheets at December 31, 2023 and December 31, 2022, (ii) Consolidated Statements of Operations and Comprehensive Income for each of the three years in the period ended December 31, 2023, (iii) Consolidated Statements of Stockholders’ Equity for each of the three years in the period ended December 31, 2023, (iv) Consolidated Statements of Cash Flows for each of the three years in the period ended December 31, 2023; and (iv) Notes to the Consolidated Financial Statements, tagged as blocks of text.text (incorporated by reference to Exhibit 101 of the Company's Annual Report on Form 10-K dated December 31, 2023). * |
| | |
| 104 | | Cover Page Interactive Data File (formatted as iXBRL and contained in Exhibit 101) (incorporated by reference to Exhibit 104 of the Company's Annual Report on Form 10-K dated December 31, 2023). * |
____________________
*Incorporated by reference.
Item 16. Form 10-K Summary.
Not applicable.
SIGNATURES
Pursuant to the requirements of Section 13 or 15(d) of the Securities Exchange Act of 1934, the Registrant has duly caused this report to be signed on its behalf by the undersigned, thereunto duly authorized. | | | | | | | | |
| M.D.C. HOLDINGS, INC.
(Registrant) |
| | |
Date: January 30,April 8, 2024 | By: | /s/ Robert N. Martin |
| | Robert N. Martin |
| | Senior Vice President and Chief Financial Officer (principal financial officer and duly authorized officer) |
| | |
| | |
Date: January 30,April 8, 2024 | By: | /s/ Derek R. Kimmerle |
| | Derek R. Kimmerle |
| | Vice President, Controller and Chief Accounting Officer (principal accounting officer and duly authorized officer) |
POWER OF ATTORNEY
KNOW ALL BY THESE PRESENTS, that the undersigned officers and/or directors of the Registrant, by virtue of their signatures to this report, appearing below, hereby constitute and appoint Larry A. Mizel and David D. Mandarich, or any one of them, with full power of substitution, as attorneys-in-fact in their names, places and steads to execute any and all amendments to this report in the capacities set forth opposite their names and hereby ratify all that said attorneys-in-fact do by virtue hereof.
Pursuant to the requirements of the Securities Exchange Act of 1934, this report has been signed below by the following persons on behalf of the Registrant and in the capacities and on the dates indicated. | | | | | | | | |
Signature | Title | Date |
| | |
/s/ Larry A. Mizel | Executive Chairman | January 30, 2024 |
Larry A. Mizel | (principal executive officer) | |
| | |
/s/ David D. Mandarich | Director, President and Chief Executive Officer | January 30, 2024 |
David D. Mandarich | | |
| | |
/s/ Robert N. Martin | Senior Vice President and Chief Financial Officer | January 30, 2024 |
Robert N. Martin | (principal financial officer) | |
| | |
| | |
/s/ Derek R. Kimmerle | Vice President, Controller and Chief Accounting | January 30, 2024 |
Derek R. Kimmerle | Officer (principal accounting officer)
| |
| | |
/s/ Raymond T. Baker | Director | January 30, 2024 |
Raymond T. Baker | | |
| | |
/s/ Michael A. Berman | Director | January 30, 2024 |
Michael A. Berman | | |
| | |
/s/ David E. Blackford | Director | January 30, 2024 |
David E. Blackford | | |
| | |
/s/ Herbert T. Buchwald | Director | January 30, 2024 |
Herbert T. Buchwald | | |
| | |
/s/ Rafay Farooqui | Director | January 30, 2024 |
Rafay Farooqui | | |
| | |
/s/ Courtney L. Mizel | Director | January 30, 2024 |
Courtney L. Mizel | | |
| | |
/s/ Paris G. Reece III | Director | January 30, 2024 |
Paris G. Reece III | | |
| | |
/s/ David Siegel | Director | January 30, 2024 |
David Siegel | | |
| | |
/s/ Janice Sinden | Director | January 30, 2024 |
Janice Sinden | | |