2023FYfalse0000773840http://fasb.org/us-gaap/2023#OtherAssetsNoncurrenthttp://fasb.org/us-gaap/2023#OtherAssetsNoncurrenthttp://fasb.org/us-gaap/2023#AccruedLiabilitiesCurrenthttp://fasb.org/us-gaap/2023#AccruedLiabilitiesCurrenthttp://fasb.org/us-gaap/2023#OtherLiabilitiesNoncurrenthttp://fasb.org/us-gaap/2023#OtherLiabilitiesNoncurrenthttp://fasb.org/us-gaap/2023#PropertyPlantAndEquipmentAndFinanceLeaseRightOfUseAssetAfterAccumulatedDepreciationAndAmortizationhttp://fasb.org/us-gaap/2023#PropertyPlantAndEquipmentAndFinanceLeaseRightOfUseAssetAfterAccumulatedDepreciationAndAmortizationhttp://fasb.org/us-gaap/2023#LongTermDebtAndCapitalLeaseObligationsCurrenthttp://fasb.org/us-gaap/2023#LongTermDebtAndCapitalLeaseObligationsCurrenthttp://fasb.org/us-gaap/2023#LongTermDebtAndCapitalLeaseObligationshttp://fasb.org/us-gaap/2023#LongTermDebtAndCapitalLeaseObligationshttp://fasb.org/us-gaap/2023#LongTermDebtAndCapitalLeaseObligationshttp://fasb.org/us-gaap/2023#LongTermDebtAndCapitalLeaseObligationsP3Yhttp://fasb.org/us-gaap/2023#OtherLiabilitiesNoncurrenthttp://fasb.org/us-gaap/2023#OtherLiabilitiesNoncurrenthttp://fasb.org/us-gaap/2023#OtherLiabilitiesNoncurrenthttp://fasb.org/us-gaap/2023#AccruedLiabilitiesCurrenthttp://fasb.org/us-gaap/2023#AccruedLiabilitiesCurrenthttp://fasb.org/us-gaap/2023#OtherLiabilitiesNoncurrenthttp://fasb.org/us-gaap/2023#OtherLiabilitiesNoncurrent0000773840hon:CorporateAndReconcilingItemsMemberhon:ServicesMember2023-01-012023-12-31
UNITED STATES
SECURITIES AND EXCHANGE COMMISSION
WASHINGTON,Washington, D.C. 20549
Form 10-K
x ANNUAL REPORT PURSUANT TO SECTION 13 OR 15(d)
OF THE SECURITIES EXCHANGE ACT OF 1934
For the fiscal year ended December 31, 20212023
OR
☐ TRANSITION REPORT PURSUANT TO SECTION 13 OR 15(d)
OF THE SECURITIES EXCHANGE ACT OF 1934
For the transition period from to
Commission file number 1-8974
Honeywell International Inc.
(Exact name of registrant as specified in its charter)
| | | | | | | | | | | |
| Delaware | | 22-2640650 |
(State or other jurisdiction of
incorporation or organization) | | (I.R.S. Employer
Identification No.) |
| | |
| 855 South Mint Street | | 28202 |
| Charlotte, | North Carolina | |
| (Address of principal executive offices) | | (Zip Code) |
Registrant’s telephone number, including area code (704) 627-6200
Securities registered pursuant to Section 12(b) of the Act:
| | | | | | | | | | | | | | |
| Title of Each Class | | Trading SymbolsSymbol(s) | | Name of each exchange on which registered |
Common Stock, par value $1 per share*share | | HON | | The Nasdaq Stock Market LLC |
1.300% Senior Notes due 2023 | | HON 23A | | The Nasdaq Stock Market LLC |
| 0.000% Senior Notes due 2024 | | HON 24A | | The Nasdaq Stock Market LLC |
| 3.500% Senior Notes due 2027 | | HON 27 | | The Nasdaq Stock Market LLC |
| 2.250% Senior Notes due 2028 | | HON 28A | | The Nasdaq Stock Market LLC |
| 0.750% Senior Notes due 2032 | | HON 32 | | The Nasdaq Stock Market LLC |
| 3.750% Senior Notes due 2032 | | HON 32A | | The Nasdaq Stock Market LLC |
| 4.125% Senior Notes due 2034 | | HON 34 | | The Nasdaq Stock Market LLC |
* The common stock is also listed on the London Stock Exchange.
Securities registered pursuant to Section 12(g) of the Act: None
Indicate by check mark if the Registrant is a well-known seasoned issuer, as defined in Rule 405 of the Securities Act. Yes x No ☐
Indicate by check mark if the Registrant is not required to file reports pursuant to Section 13 or Section 15(d) of the Exchange Act. Yes ☐ No x
Indicate by check mark whether the Registrant (1) has filed all reports required to be filed by Section 13 or 15(d) of the Securities Exchange Act of 1934 during the preceding 12 months (or for such shorter period that the Registrant was required to file such reports), and (2) has been subject to such filing requirements for the past 90 days. Yes x No ☐
Indicate by check mark whether the Registrant has submitted electronically every Interactive Data File required to be submitted pursuant to Rule 405 of Regulation S-T (§ 232.405 of this chapter) during the preceding 12 months (or for such shorter period that the registrantRegistrant was required to submit such files). Yes x No ☐
Indicate by check mark whether the Registrant is a large accelerated filer, an accelerated filer, a non-accelerated filer, a smaller reporting company, or an emerging growth company. See definitions of “large accelerated filer,” “accelerated filer,” “smaller reporting company”company,” and "emerging growth company" in Rule 12b-2 of the Exchange Act.
| | | | | | | | | | | | | | | | | | | | | | | |
| Large accelerated filer | x | Accelerated filer ☐ | Non-accelerated filer ☐ | Smaller reporting company | ☐ | Emerging growth company | ☐ |
If an emerging growth company, indicate by check mark if the registrantRegistrant has elected not to use the extended transition period for complying with any new or revised financial accounting standards provided pursuant to sectionSection 13(a) of the Exchange Act. ☐
Indicate by check mark whether the registrantRegistrant has filed a report on and attestation to its management's assessment of the effectiveness of its internal control over financial reporting under Section 404(b) of the Sarbanes-Oxley Act (15 U.S.C. 7262(b)) by the registered public accounting firm that prepared or issued its audit report. x
If securities are registered pursuant to Section 12(b) of the Act, indicate by check mark whether the financial statements of the Registrant included in the filing reflect the correction of an error to previously issued financial statements. ☐
Indicate by check mark whether any of those error corrections are restatements that required a recovery analysis of incentive-based compensation received by any of the Registrant’s executive officers during the relevant recovery period pursuant to § 240.10D-1(b). ☐
Indicate by check mark whether the Registrant is a shell company (as defined in Rule 12b-2 of the Act). Yes ☐ No x
The aggregate market value of the votingcommon stock held by nonaffiliatesnon-affiliates of the Registrant was approximately $152.8$137.8 billion at June 30, 2021.2023.
There were 685,818,771652,181,812 shares of Common Stock outstanding at January 28, 2022.26, 2024.
Documents Incorporated by Reference
Part III: Proxy Statement for Annual Meeting of Shareowners to be held April 25, 2022.May 14, 2024
TABLE OF CONTENTS
ORGANIZATION OF OUR ANNUAL REPORT ON FORM 10-K
The order and presentation of content in our Annual Report on Form 10-K (Form 10-K) differs from the traditional U.S. Securities and Exchange Commission (SEC) Form 10-K format. We believe that our format improves readability and better presents how we organize and manage our business. See Form 10-K Cross-Reference Index for a cross-reference to the traditional SEC Form 10-K format.
CAUTIONARY STATEMENT ABOUT
FORWARD-LOOKING STATEMENTS
We describe many of the trends and other factors that drive our business and future results in the section titled Management’s Discussion and Analysis of Financial Condition and Results of Operations and in other parts of this report (including under the section titled Risk Factors). Such discussions contain forward-looking statements within the meaning of Section 21E of the Securities Exchange Act of 1934, as amended (the Exchange Act). Forward-looking statements are those that address activities, events, or developments that management intends, expects, projects, believes, or anticipates will or may occur in the future. They are based on management’s assumptions and assessments in light of past experience and trends, current economic and industry conditions, expected future developments, and other relevant factors.factors, many of which are difficult to predict and outside of our control. They are not guarantees of future performance, and actual results, developments, and business decisions may differ significantly from those envisaged by our forward-looking statements. We do not undertake to update or revise any of our forward-looking statements, except as required by applicable securities law. Our forward-looking statements are also subject to material risks and uncertainties, including the impact of the COVID-19 pandemic,ongoing macroeconomic and geopolitical risks, such as lower GDP growth or recession, capital markets volatility, inflation, and certain regional conflicts, that can affect our performance in both the near- and long-term. In addition, no assurance can be given that any plan, initiative, projection, goal, commitment, expectation, or prospect set forth in this Form 10-K can or will be achieved. These forward-looking statements should be considered in light of the information included in this Form 10-K, including, in particular, the factors discussed within the section titled Risk Factors. Such factors may be revised or supplemented in subsequent reports on Forms 10-Q and 8-K. Any forward-looking plans described herein are not final and may be modified or abandoned at any time.
1 Honeywell International Inc.1
ABOUT HONEYWELL
Honeywell International Inc. (Honeywell, we, us, our, or the Company) inventsis an integrated operating company serving a broad range of industries and commercializes technologies that address somegeographies around the world. Our portfolio of the world’s most critical challenges around energy, safety, security, air travel, productivity, and global urbanization. We are a leading software-industrial company committed to introducing state of the art technology solutions to improve efficiency, productivity, sustainability, and safety in high growth businesses in broad-based, attractive industrial end markets. As a diversified technology and manufacturing company, we areis uniquely positioned to blend physical products with software to serve customers worldwide with aerospace products and services, energy efficient products and solutions for businesses, specialty chemicals, electronic and advanced materials, process technology for refining and petrochemicals, and productivity, sensing, safety, and security technologies for buildings and industries. Our products and solutions enable a safer, more comfortable, and more productive world, enhancing the quality of life of people around the globe. The Honeywell brand dates back to 1906, and the Company was incorporated in Delaware in 1985.
Our Annual Report on Form 10-K, Quarterly Reports on Form 10-Q, Current Reports on Form 8-K, and any amendments to those reports, are available free of charge on our Investor Relations website (honeywell.com)(investor.honeywell.com) under the heading InvestorsFinancials (see SEC Filings) immediately after they are filed with, or furnished to, the SEC.Securities and Exchange Commission. Honeywell uses our Investor Relations website, investor.honeywell.com,along with press releases on our primary Honeywell website (honeywell.com) under the heading News, as a means of disclosing information which may be of interest or material to our investors and for complying with disclosure obligations under Regulation FD. Accordingly, investors should monitor our Investor Relations website and Honeywell News feed, in addition to following our presspress releases, SEC filings, public conference calls, webcasts, and social media. Information contained on or accessible through, including any reports available on, our website is not a part of, and is not incorporated by reference into, this Form 10-K or any other report or document we file with the SEC. Any reference to our website in this Form 10-K is intended to be an inactive textual reference only.
In addition, in this Form 10-K, the Company incorporates by reference certain information from its definitive Proxy Statement for the 20222024 Annual Meeting of Stockholders (the Proxy Statement), which we expect to file with the SEC on or about March 11, 2022 (the Proxy Statement),April 2, 2024, and which will also be available free of charge on our website.
2 Honeywell International Inc.
EXECUTIVE SUMMARY
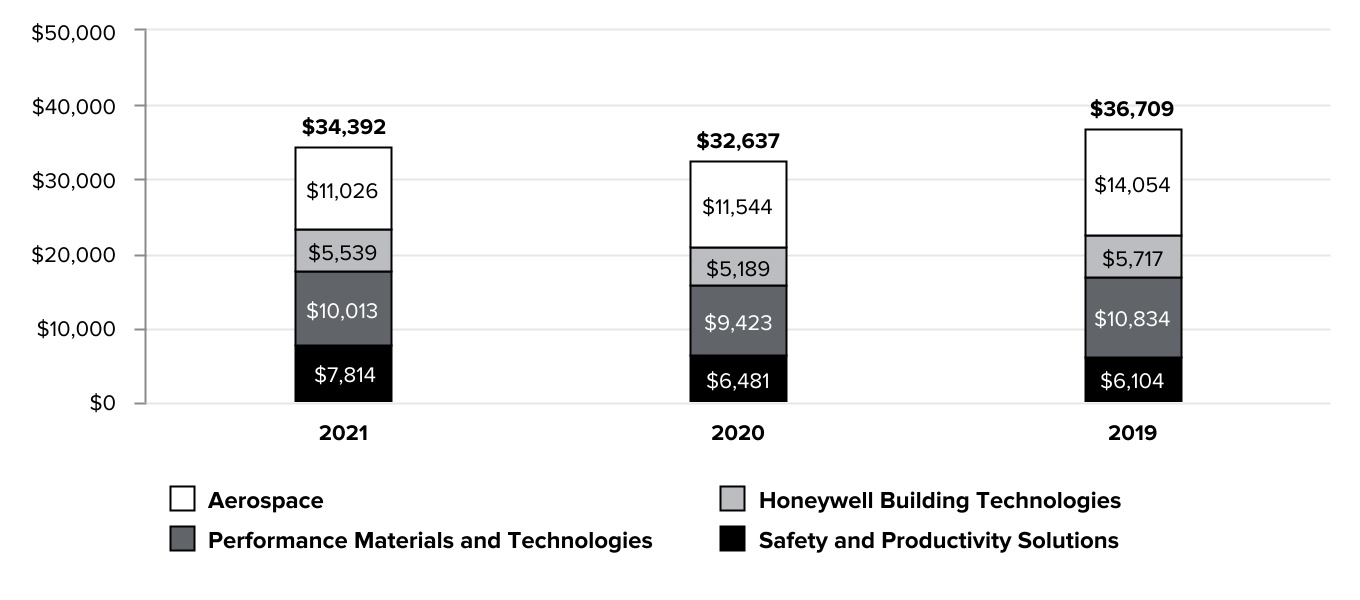
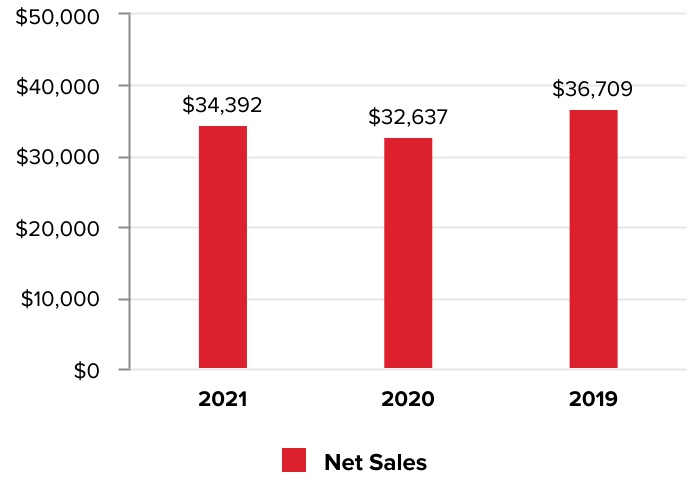
The COVID-19 pandemic continued to impact the global economy and certain ofLeveraging our business; however, our execution during 2021 allowed us to grow our market share, exceed our financial commitments, and strategically position our business for continued success.Honeywell Accelerator operating model, we delivered strong performance in 2023, remaining focused on creating long-term shareholder value. In 2021,2023, we delivered sales growth of 5%3%, to $34.4$36.7 billion, led by strong demand in our Warehouse and Workflow Solutions, Productivity Solutions and Services, Advanced Materials, and Commercial Aviation, businesses.
We deepened focus on our three transformation initiatives to actively deploy capital to achieve portfolio optimization, drive a culture of innovation enabling growth,Defense and lead in Environmental, Social, Space, and Governance objectives. In executing on these initiatives, we completed four acquisitions, droveProcess Solutions businesses, and sales growth in sustainable technologiesthree of our four reportable business segments.
In 2023, we announced the next phase of Accelerator, version 3.0 of Honeywell's robust operating system, taking an important step toward standardizing our organization end-to-end across our four main business models - products, aftermarket services, projects, and positively impactedsoftware - and facilitating knowledge transfer of best practices to drive incremental growth, margin expansion, and cash generation. We are completing the buildout of our communitiesfull suite of information technology (IT) platforms covering all different aspects of the value chain, and implementing digital threads to provide valuable data that face continued challenges fromwill improve our business performance. Over the COVID-19 pandemiclast six years, the efforts of the “Great Integration” of Honeywell transformed the organization into an integrated operating company, deploying world-class capabilities and other socioeconomic factors. While executingmultiple growth enablers that benefit each strategic business group.
We are focused on aligning our strategy,businesses with three distinct megatrends (automation, future of aviation, and energy transition), all underpinned by digitization. During the year, we maintained our commitment to create long-term shareowner value by realizing the benefits of operating efficiencies and deploying $8.2deployed $8.3 billion to capital expenditures, dividends, share repurchases, and mergers and acquisitions, which was approximately $2.2 billion in excess ofacquisitions. We opportunistically repurchased shares to maintain our operating cash flowcommitment to reduce share count by at least 1% per year, and increased our dividend for the year.fourteenth time in the last thirteen years. Our mergers and acquisition activities focused on key acquisitions to align with our megatrends. We announced three acquisitions - our acquisitions of Compressor Controls Corporation and SCADAfence, as well as our agreement to acquire Carrier Global Corporation’s Global Access Solutions business.
As we look forward, we intend to continue deploying capital to high-return opportunities, including software and services with recurring revenue streams, and sustainable technologies, positioning our business for future growth. Overall, our orders were up 11%, comparedopportunities. We continue to 2020, and we carry a robust backlog of $27.7$31.8 billion as of December 31, 2021. We continue2023, that provides a strong foundation for future and sustained capital deployment to monitor and respond to several ongoing macroeconomic factors, including supply chain constraints accompanied by shortages and rising costs for materials and labor. We implemented and continue to identify actions to mitigate the effect of these factors and reduce the impact on our businesses.accelerate growth.
| | | | | | | | | | | | | | | | | | | | | | | | | | |
| | | | | | | | |
| YEAR IN REVIEW | |
| | | | | | | | |
| | | | | | | | |
| Sales up by 35% to% | | | Diluted EPS up byRobust backlog of | | | Operating cash flows of | |
| | | | | | | | |
| $34.436.7 BILLION | | | 17.7% | | | $631.8 BILLION | | | $5.3 BILLION | |
| as we remain focused on leveraging and evolving our Honeywell Accelerator operating model to deliver growth | | | led byas of year-end, demonstrating continued strong demand in certain of our businesses as result of the recovery from the global recession created by the COVID-19 pandemicend markets and positioning us well to convert for future growth | | | reflecting strong earnings in our core businesses and continued deployment of capital for share repurchases | | | as we remain focused on increasing operating cash flows through revenue growth, margin expansion, and improved working capital turnover | |
| | | | | | | | |
3 Honeywell International Inc.3
BUSINESS OBJECTIVES
Our businesses are focusedfocus on the following objectives:
| | | | | |
| Driving profitable growth by delivering innovative products through research and development and technological excellence, and through continued enhancement of our footprint in high growth regions; |
| |
| Continuing to execute on our strategy to be a premier software-industrial company, including the ongoing expansion of Honeywell Forge connected solutions for aircraft, buildings, cybersecurity, plants, and workers and driving a recurring revenue model across the Company. Honeywell Forge is an enterprise performance management solution for digital transformation of operations. Honeywell Forge includes a mix of software products and enabling services that help companies use operational data to drive insights that improve processes, enhance productivity, support sustainability initiatives, and empower workers; |
| |
| Expanding margins by optimizing the Company’s performance through the Integrated Supply Chain and Honeywell Digital transformation initiatives, commercial excellence, repositioning, and other manufacturing and operational process improvements; |
| |
| Executing disciplined portfolio management through rigorous merger and acquisition, divestiture, and integration processes to deliver growth and shareholder value; |
| |
| Controlling corporate costs, including costs incurred for asbestos and environmental matters, and pension and other post-retirement benefits; |
| |
| Increasing availability of capital through strong cash flow generation and conversion from effective working capital management and proactive management of debt to enable the Company to strategically deploy capital for acquisitions, dividends, share repurchases and capital expenditures; and |
| |
| Committing to uphold our environmental, social, and governance principles, as a leader in responsible corporate citizenship. |

4 Honeywell International Inc.
MAJOR BUSINESSES
We globally manage our business operations through four reportable business segments: Aerospace, Honeywell Building Technologies, Performance Materials and Technologies, and Safety and Productivity Solutions. The remainder of Honeywell's operations is presented in Corporate and All Other, which is not a reportable business segment. Financial information related to our reportable business segments is included in Note 22 Segment Financial Data of Notes to Consolidated Financial Statements. The major products and services, including Honeywell Forge solutions supported by Honeywell Connected Enterprise, customers, uses and key competitors of each of our reportable segments are:
| | | | | |
| |
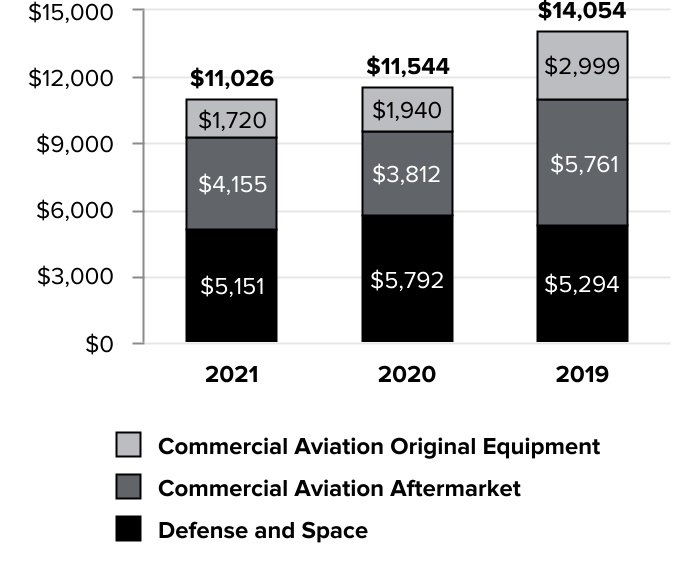
AEROSPACE Aerospace is a leading global supplier of products, software, and services for aircrafts that it sells to original equipment manufacturers (OEM) and other customers in a variety of end markets including: air transport, regional, business and general aviation aircraft, airlines, aircraft operators, and defense and space contractors. Aerospace products and services include auxiliary power units, propulsion engines, environmental control systems, integrated avionics, wireless connectivity services, electric power systems, engine controls, flight safety, communications, navigation hardware, data and software applications, radar and surveillance systems, aircraft lighting, management and technical services, advanced systems and instruments, satellite and space components, aircraft wheels and brakes, repair and overhaul services, and thermal systems. Aerospace also provides spare parts, repair, overhaul, and maintenance services (principally to aircraft operators) for the aftermarket., and sells licenses or intellectual property to other parties. Our Honeywell Forge solutions are leveraged byenable our customers as tools to turn data into predictive maintenance and predictive analytics to enable better fleet management and make flight operations more efficient. |
|
|
| | | | | | | | |
| 2023 Full-year revenue of $13,624 million | |
| 2023 Full-year revenue by business unit | |
| | |
| $2,397 million | $6,241 million | $4,986 million |
| Commercial Aviation Original Equipment | Commercial Aviation Aftermarket | Defense and Space |
| | | | | | |
| | |
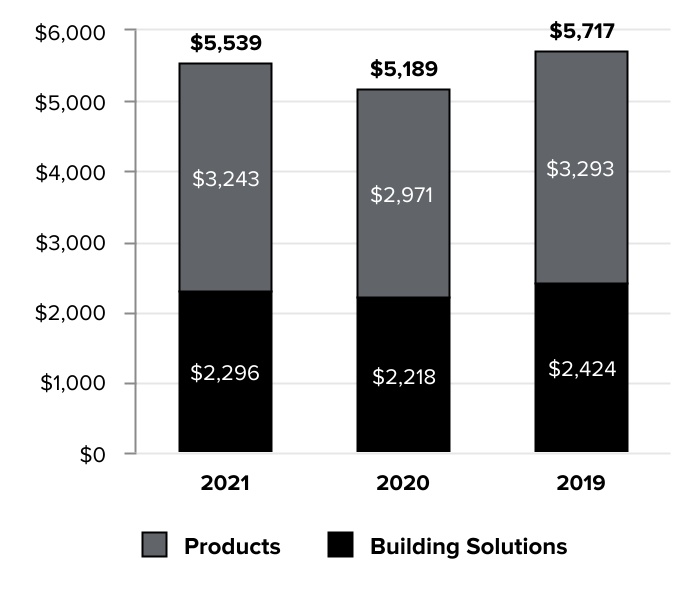
HONEYWELL BUILDING TECHNOLOGIES Honeywell Building Technologies is a leading global provider of products, software, solutions, and technologies that enable building owners and occupants to ensure their facilities are safe, energy efficient, sustainable, and productive. Honeywell Building Technologies products and services include advanced software applications for building control and optimization; sensors, switches, control systems, and instruments for energy management; access control; video surveillance; fire products; and installation, maintenance, and upgrades of systems. Our Honeywell Forge solutions enable our customers to digitally manage buildings, connecting data from different assets to enable smart maintenance, improve building performance, and even protect from incoming security threats. | |
| |
| | |
| | | | | |
| 2023 Full-year revenue of $6,031 million | |
| 2023 Full-year revenue by business unit | |
| |
| $3,583 million | $2,448 million |
| Products | Building Solutions |
5 Honeywell International Inc.5

| | | | | |
| |
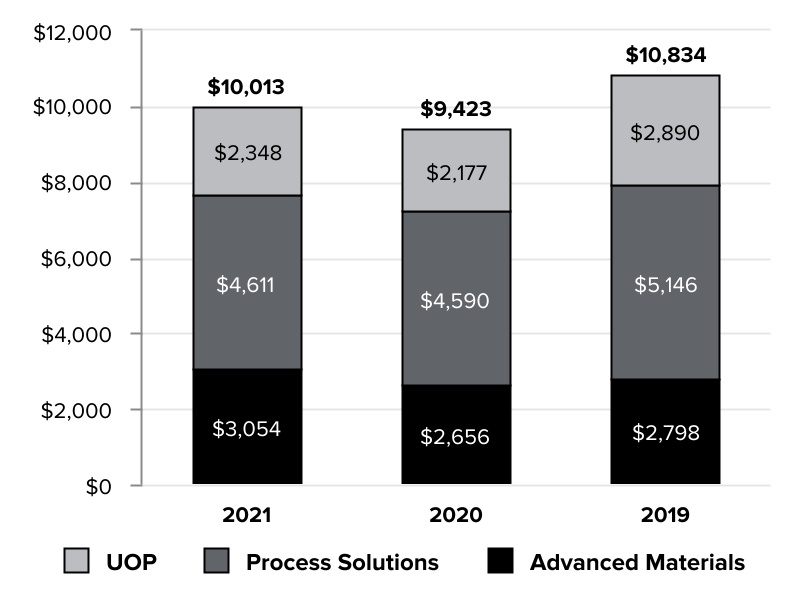
PERFORMANCE MATERIALS AND TECHNOLOGIES Performance Materials and Technologies is a leading global leaderprovider in developing and manufacturing high-quality performance chemicals and materials, process technologies, and automation solutions. The reportable business segment is comprised of Process Solutions, UOP, and Advanced Materials. Process Solutions provides automation control, instrumentation, advanced software, and related services for the oil and gas, refining, pulp and paper, industrial power generation, chemicals and petrochemicals, biofuels, life sciences, and metals, minerals, and mining industries. Through itsOur smart energy products Process Solutions enablesenable utilities and distribution companies to deploy advanced capabilities to improve operations, reliability, and environmental sustainability. UOP provides process technology, products, including catalysts and adsorbents, equipment, and consulting services that enable customers to efficiently produce gasoline, diesel, jet fuel, petrochemicals, and renewable fuels for the petroleum refining, gas processing, petrochemical, and other industries. Advanced Materials manufactures a wide variety of high-performance products, including materials used to manufacture end products such as bullet-resistant armor, nylon, computer chips, and pharmaceutical packaging, and provides reduced and low global-warming-potentialglobal warming potential materials based on hydrofluoro-olefin technology. In the industrial environment, our Honeywell Forge solutions enable integration and connectivity to provide a holistic view of operations and turn data into clear actions to maximize productivity and efficiency. Our Honeywell Forge's cybersecurity capabilities help identify risks and act on cyber-related incidents, together with enabling improved operations and protecting processes, people, and assets. | |
| |
| | | | | | | | |
| 2023 Full-year revenue of $11,506 million | |
| 2023 Full-year revenue by business unit | |
| | |
| $2,586 million | $5,267 million | $3,653 million |
| UOP | Process Solutions | Advanced Materials |
| | | | | |
| |
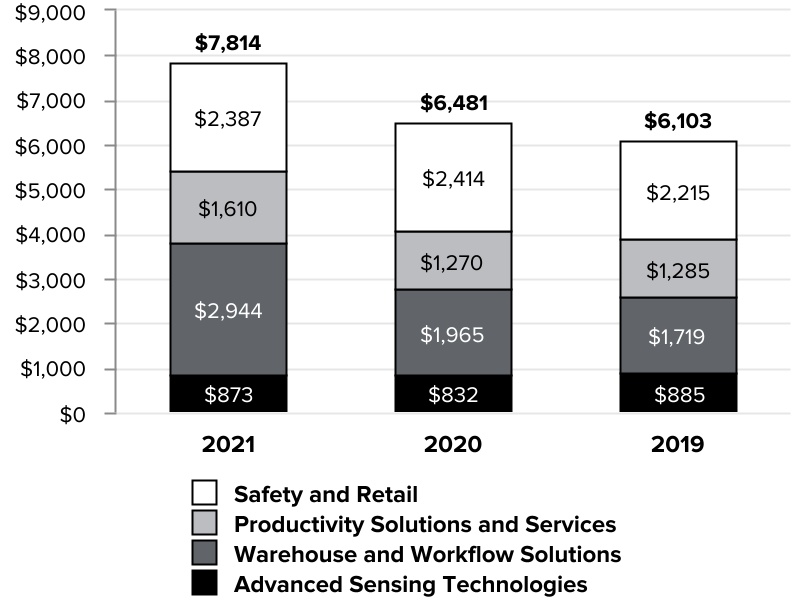
SAFETY AND PRODUCTIVITY SOLUTIONS Safety and Productivity Solutions is a leading global provider of products and software that improve productivity, workplace safety, and asset performance to customers around the globe. Sensing and Safety Technologies products include personal protectionprotective equipment (PPE), apparel, gear, and footwear; gas detection technology; custom-engineered sensors, switches, and controls for sensing and productivity solutions; and cloud-based notification and emergency messaging. Productivity Solutions and Services products and services include mobile devices and software for computing, data collection, and thermal printing; supply chain and warehouse automation equipment, software and solutions; custom-engineered sensors, switches, and controls for sensing and productivity solutions; and software-based data and asset management productivity solutions. Warehouse and Workflow Solutions products and services include system design and simulation, automation solutions, performance optimization software, and lifecycle services to enable accuracy, productivity, and predictability of warehouse operations. Our Honeywell Forge solutions digitally automate processes to improve efficiency while reducing downtime and safety costs. | |
| |
| | | | | | | | |
| 2023 Full-year revenue of $5,489 million | |
| 2023 Full-year revenue by business unit | |
| | |
| $2,733 million | $1,313 million | $1,443 million |
| Sensing and Safety Technologies | Productivity Solutions and Services | Warehouse and Workflow Solutions |
6 Honeywell International Inc.
COMPETITION
We are subject to competition in substantially all product and service areas. Some of our key competitors include but are not limited to:
| | | | | | | | | | | |
| | | |
| AEROSPACE | HONEYWELL BUILDING TECHNOLOGIES |
•Garmin •L3 Harris •Northrop Grumman | •Raytheon TechnologiesRTX Corporation •Safran •Thales | •Carrier Global •Johnson Controls | •Schneider Electric •Siemens |
| | | | | | | | | | | |
| | | |
| PERFORMANCE MATERIALS AND TECHNOLOGIES | SAFETY AND PRODUCTIVITY SOLUTIONS |
•ABB •Arkema •Axens •Chemours •DSM
| •Emerson Electric •Haldor Topsoe •Lummus TechnologyRockwell Automation •Rockwell AutomationSchneider Electric | •3M •Kion Group •MSA Safety Incorporated | •TE Connectivity •Zebra Technologies |
Our businesses compete on a variety of factors such as performance, applied technology, product innovation, product recognition, quality, reliability, customer service, delivery, and price. Brand identity, service to customers, and quality are important competitive factors for our products and services. Our products face considerable price competition. While our competitive position varies among our products and services, we are a significant competitor in each of our major product and service classes.areas.
BACKLOG
Our backlog represents the estimated remaining value of work to be performed under firm contracts. Backlog is equal to our remaining performance obligations under the contracts that meet the guidance on revenue from contracts with customers as discussed in Note 3 Revenue Recognition and Contracts with Customers of Notes to Consolidated Financial Statements. Backlog was $27,682$31,777 million and $25,769$29,558 million at December 31, 20212023, and 2020. The backlog previously disclosed as of December 31, 2020, is revised to reflect a prior period correction, which had no impact on our results of operations.2022, respectively. We expect to recognize approximately 59%60% of our remaining performance obligations as revenue in 2022,2024, and the remaining balance thereafter.
U.S. GOVERNMENT SALES
The Company, principally through our Aerospace reportable business segment, sells to the U.S. government acting through its various departments and agencies and through prime contractors, including the U.S. Department of Defense (as both a prime contractor and subcontractor). We do not expect our overall operating results to be significantly affected by any proposed changes in 20222024 federal defense spending due to the varied mix of the government programs which impact us (OEM production, engineering development programs, aftermarket spares and repairs, and overhaul programs), as well as our diversified customer base.
| | | | | | | | | | | | | | | | | | | | |
| U.S. Government Sales ($ in millions) | | Years Ended December 31, |
| 2021 | | 2020 | | 2019 |
| Sales to the U.S. Department of Defense | | $ | 3,219 | | | $ | 3,661 | | | $ | 3,491 | |
| Sales to other U.S. government departments and agencies | | 703 | | | 557 | | | 566 | |
| Total Sales to the U.S. Government | | $ | 3,922 | | | $ | 4,218 | | | $ | 4,057 | |
| | | | | | | | | | | | | | | | | |
| U.S. government sales ($ in millions) | Years Ended December 31, |
| 2023 | | 2022 | | 2021 |
| Sales to the U.S. Department of Defense | $ | 2,933 | | | $ | 2,886 | | | $ | 3,219 | |
| Sales to other U.S. government departments and agencies | 508 | | | 546 | | | 703 | |
| Total sales to the U.S. government | $ | 3,441 | | | $ | 3,432 | | | $ | 3,922 | |
7 Honeywell International Inc.7
INTERNATIONAL OPERATIONS
We engage in manufacturing, sales, service, and research and development globally. U.S. exports and non-U.S. manufactured products are significant to our operations. U.S. exports represented 12%13% of our total sales in 2023, and 12% in 20212022 and 2020, and 15% in 2019.2021. Non-U.S. manufactured products and services, mainly in Europe and Asia, were 40%42% of our total sales in 2021, 2020,2023, and 2019.40% in 2022 and 2021.
| Manufactured Products and Systems and
Performance of Services | | Year Ended December 31, 2021 |
| Aerospace | | Honeywell
Building
Technologies | | Performance
Materials and
Technologies | | Safety and
Productivity
Solutions |
| Manufactured products and systems and performance of services | | Manufactured products and systems and performance of services | Year Ended December 31, 2023 |
| Aerospace | | Honeywell
Building
Technologies | | Performance
Materials and
Technologies | | Safety and
Productivity
Solutions |
| | | | (% of Segment Sales) | | (% of Segment Sales) |
| U.S. exports | U.S. exports | | 23 | % | | 2 | % | | 13 | % | | 1 | % | U.S. exports | 23 | % | | 2 | % | | 11 | % | | 2 | % |
| Non-U.S. manufactured products/services | Non-U.S. manufactured products/services | | 15 | % | | 66 | % | | 57 | % | | 35 | % | Non-U.S. manufactured products/services | 28 | % | | 56 | % | | 53 | % | | 38 | % |
Information related to risks related toassociated with our foreign operations is included in the section titled Risk Factors under the caption “Macroeconomic and Industry Risks.”
RAW MATERIALS
The vast majority of principal raw materials used in our operations are readily available; however, during 2021,2023, we experiencedcontinued to experience supply chain constraints for certain raw materials. While the current supply chain constraints have not significantly impacted our business, to reduce the impact of current and future disruptions we have implemented short-term and long-termWe maintain mitigation strategies to reduce the impact of current and future disruptions, andincluding digital solutions to manageassist in identifying and managing shortages, pricing actions, longer term planning for constrained materials, material supply tracking tools, and prioritize mitigation actions.direct engagement with key suppliers to meet customer demand. We assist certain suppliers facing manufacturing challenges by committing our own resources to their sites and facilities. Our relationships with primary and secondary suppliers allow us to reliably source key components and raw materials. Where we cannot procure key components or raw materials, we consider altering existing products and developing new products to satisfy customer needs. Alterations to existing products and the development of new products undergo product quality controls and engineering qualification, prior to releasing to our customers. We continue to leverage existing supplier relationships and are not dependent on any one supplier for a material amount of our raw materials. We believe these mitigation strategies enable us to reduce supply risk, accelerate new product innovation, and expand our penetration in the markets we serve. Additionally, due to the strenuous quality controls and product qualification we perform on a new or altered product, we do not expect these mitigation strategies to impact product quality or reliability.
Prices of certain key raw materials including copper, fluorspar, tungsten salts, ethylene, aluminum, and molybdenum in Performance Materials and Technologies and nickel, steel, titanium, and other metals in Aerospace, are expected to fluctuate.moderate. We offset raw material cost increases with formula-driven or long-term supply agreements, price increases, and hedging activities where feasible. We anticipate that supply chain constraints for certain raw materials will continue into 2022;2024; however, we believe our short-term and long-term mitigation strategies position us well to mitigate and reduce the impact these factors may have on our businesses. As such, we do not presently anticipate that a shortage of raw materials will cause any material adverse impacts during 2022.2024.
See the section titled Risk Factors for additional information on supply chain constraints.
PATENTS, TRADEMARKS, LICENSES, AND DISTRIBUTION RIGHTS
Our reportable business segments are not dependent upon any single patent or related group of patents, trademarks, or any licenses or distribution rights. In our judgment, our intellectual property rights are adequate for the conduct of our business. We believe that, in the aggregate, the rights under our patents, trademarks, licenses, and distribution rights are generally important to our operations, but we do not consider any individual patent, trademark, or any licensing or distribution rights related to a specific process or product to be of material importance in relation to our total business.
8 Honeywell International Inc.
REGULATIONS
The Company’sOur operations are subject to various federal, state, local, and foreign government regulations, including requirements regarding the protection of human health and the environment. OurWe design our policies, practices, and procedures are designed to prevent unreasonable risk of environmental damage, and of resulting financial liability, in connection with our business. Some risk of environmental damage is, however, inherent in some of our operations and products, as it is with other companies engaged in similar businesses.
We engage in the handling, manufacturing, use, and disposal of many substances classified as hazardous by one or more regulatory agencies. OurWe design policies, practices, and procedures are designed to prevent unreasonable risk of environmental damage and personal injury, and to ensure that our handling, manufacture, use, and disposal of these substances meet or exceed environmental and safety laws and regulations. It is possible that future knowledge or other developments, such as improved capability to detect substances in the environment or increasingly strict environmental laws and standards and enforcement policies, could bring into question our current or past handling, manufacture, use, or disposal of these substances.
8 Honeywell International Inc.
Among other environmental requirements, we are subject to the Federal Superfund and similar state and foreign laws and regulations, under which we have been designated as a potentially responsible party that may be liable for cleanup costs associated with current and former operating sites and various hazardous waste sites, some of which are on the U.S. Environmental Protection Agency’s National Priority List. While there is a possibility that a responsible party might be unable to obtain appropriate contribution from other responsible parties, we do not anticipate having to bear significantly more than our proportional share in multi-party situations taken as a whole.
We do not believe that Federal, State,federal, state, and local provisions regulating the discharge of materials into the environment, or otherwise relating to the protection of the environment, or any existing or pending climate change legislation, regulation, or international treaties or accords are reasonably likely to have a material adverse effect in the foreseeable future on the Company’sour business and we will continue to monitor emerging developments in this area.
Beyond our compliance requirements with environmental regulations, compliance with other government regulations has not had, and based on laws and regulations currently in effect, is not expected to have a material effect on the Company'sour capital expenditures, earnings, or competitive position. See the section titled Risk Factors for additional information on government regulation that could impact our business.
9 Honeywell International Inc.9
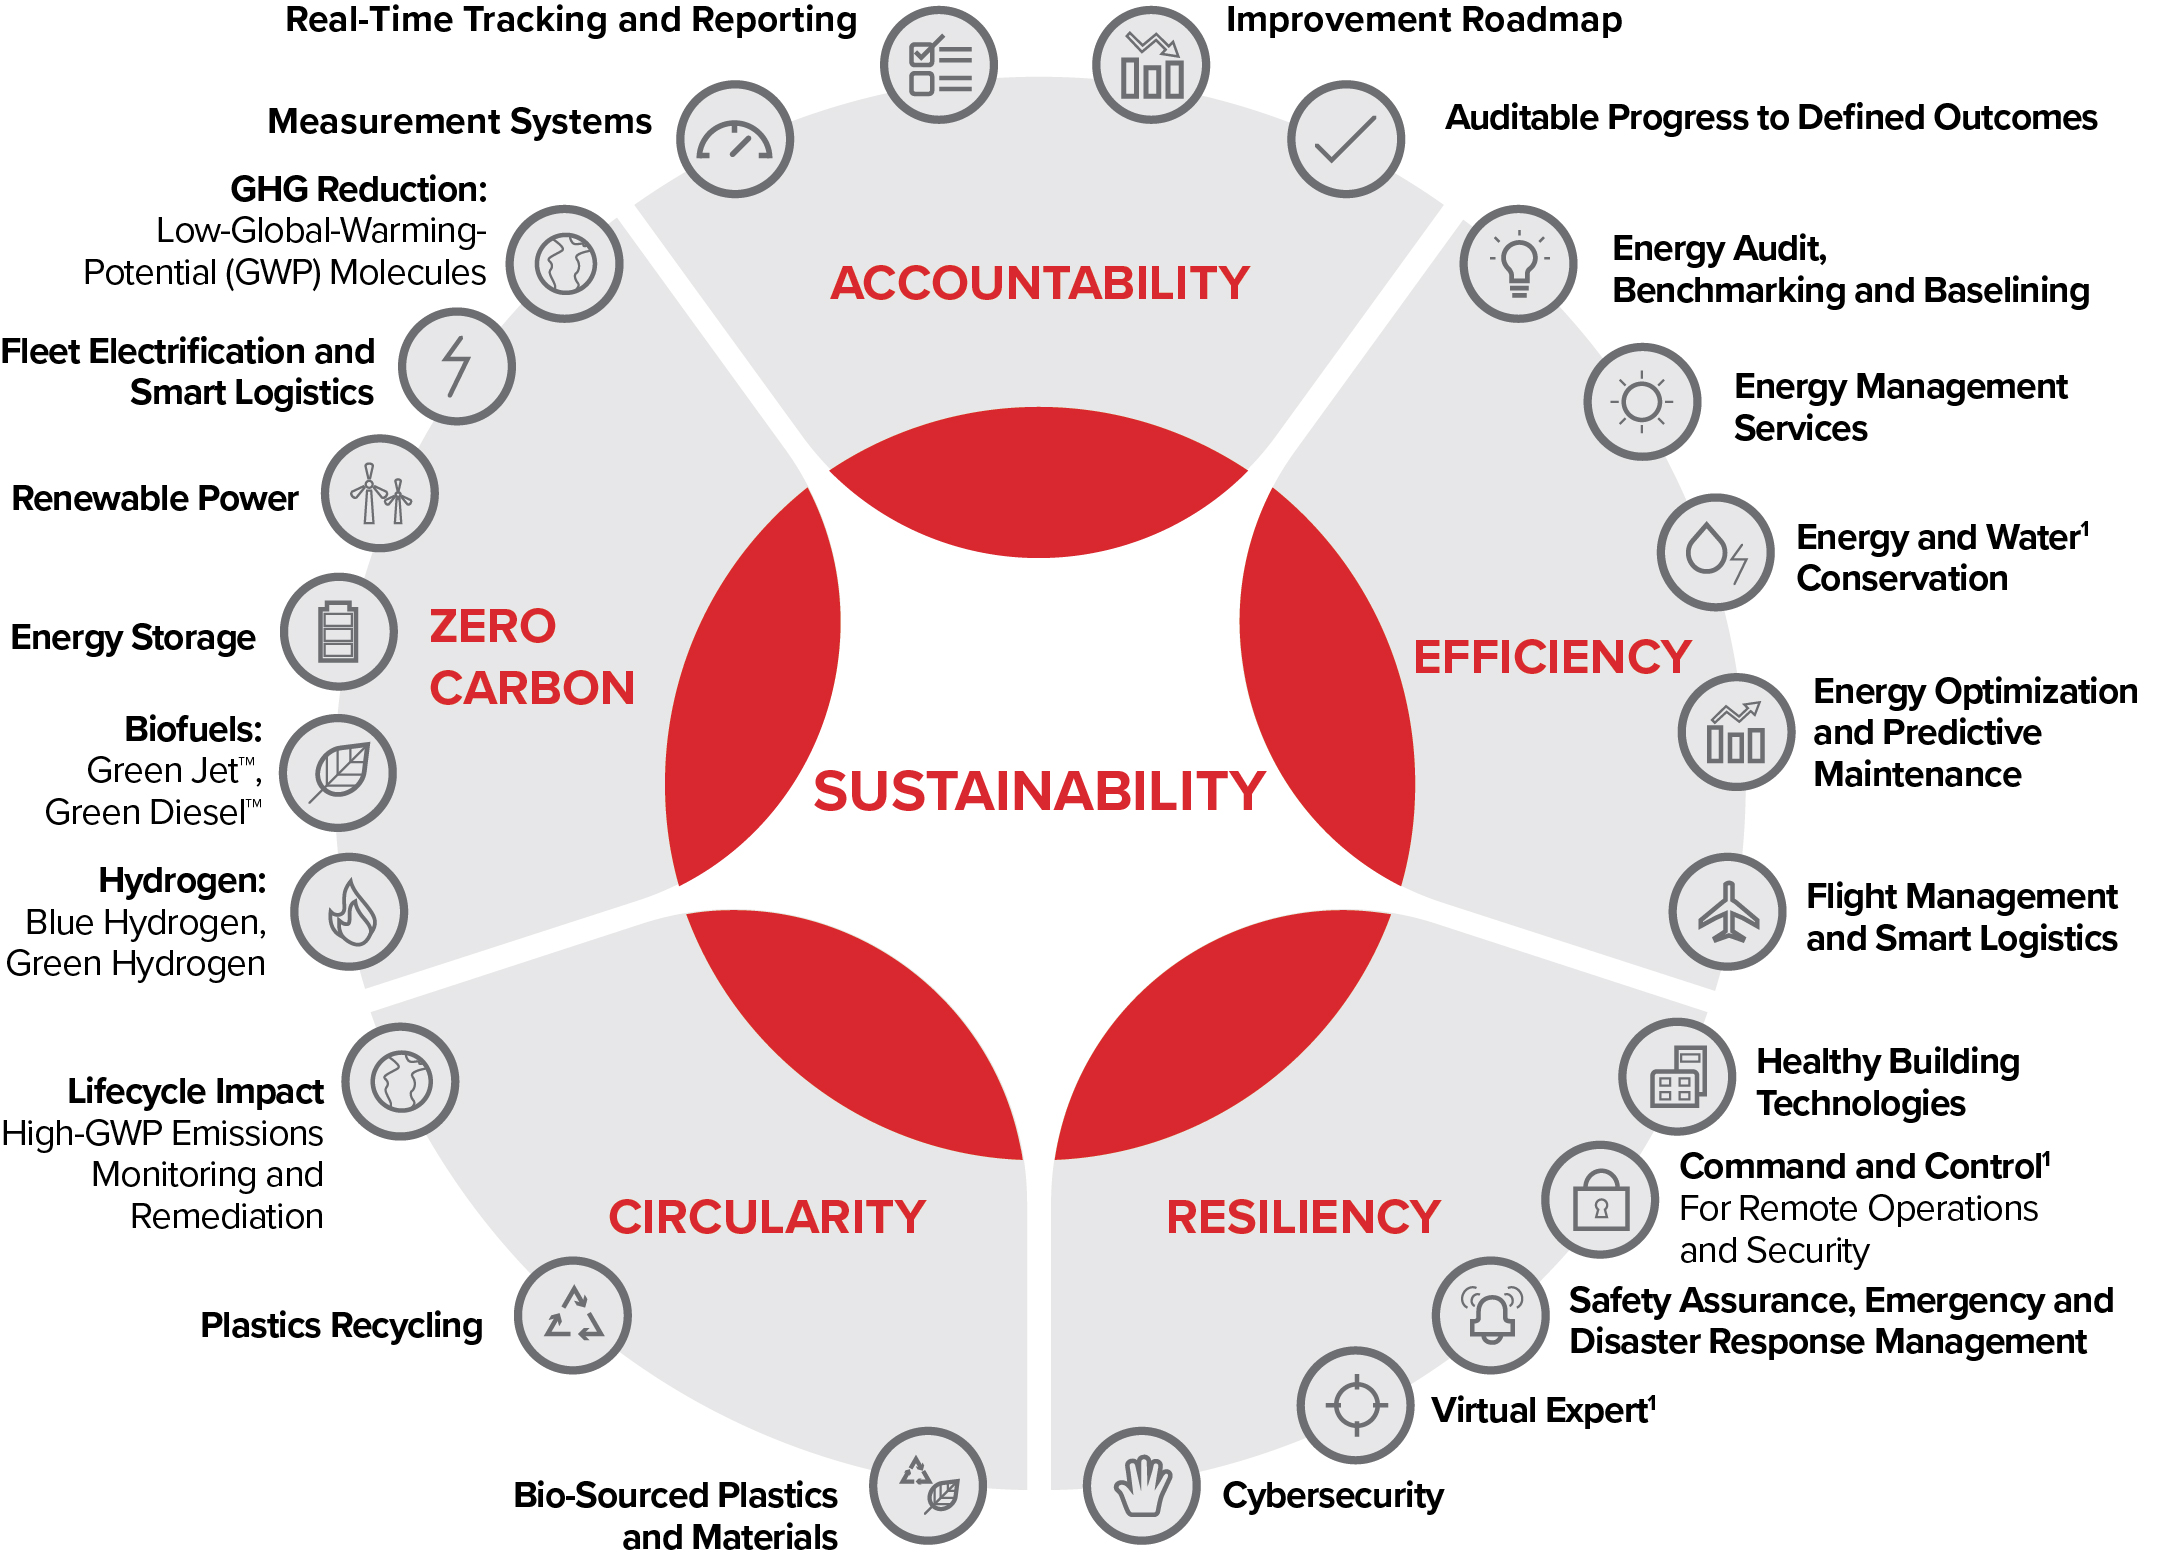
SUSTAINABILITY COMMITMENTS AND SOLUTIONS
In April 2021,Our commitment to being environmentally responsible is reflected in the extensive work we committeddo to become carbon neutralreduce greenhouse gas (GHG) emissions, increase energy efficiency, conserve water, minimize waste, manage air emissions, and drive efficiency throughout our operations. Our operating system – which drives sustainable improvements and the elimination of waste in our manufacturing operations and facilities by 2035. – is a critical component in how we approach environmental stewardship within Honeywell.
We plancommit resources each year to accomplish this through a combination of innovative investments in energy savings projects conversionthat support these objectives:
•Energy Efficiency Improvements. We continue to renewable energy sources, completion of capital improvementimplement sustainability projects at our facilities, including building automation and controls, lighting, compressed air and gas systems, mechanical upgrades, and renewable energy. Our largest sites upgradingare required to identify their significant energy use in line with ISO 50001, obtain an energy audit on an established cycle, train personnel on energy management, and track identified projects via our fleetstandard database. This ensures a robust pipeline of vehicles,both low-cost and if necessary, using crediblecapital projects that can be considered for execution.
•Managing Air Emissions. We manage air emissions in accordance with all regulatory requirements while also seeking to minimize our environmental impact. All of our manufacturing locations are required to meet the requirements of our Air Emissions procedure that is part of the Health, Safety, Environment, Product Stewardship and Sustainability (HSEPS) Management System. These requirements include, but are not limited to, identifying and detailing all emissions to air on an inventory that captures them, developing operational controls, and standardized compliance obligation tracking for permit conditions and regulatory requirements. Where there are industrial air emissions that do not have specific legal or permit requirements, we implement best management practices, where available.
•Wastewater Management. We require our locations and functions to manage water use and wastewater effluent in accordance with our HSEPS Management System. In addition to meeting all legal and regulatory requirements, the HSEPS Management System requires Honeywell manufacturing locations to complete actions such as maintain an inventory of its uses, discharges, and consumption of water, develop location-specific operation controls to manage wastewater, and provide training for employees and contractors who perform critical activities related to wastewater.
•Environmental Remediation. Our “reuse first” practice views idle properties as assets that can be revitalized to mutually benefit communities and the company. The properties that emerge from this approach ignite civic pride and catalyze further community development initiatives. Using cutting-edge science, design, and engineering to protect human health and the environment, we work cooperatively with governments and engage with local communities and other external stakeholders to implement effective solutions.
•Reducing Greenhouse Gas Emissions. As part of our commitment to reduce GHG emissions, we have been implementing solar projects to reduce dependency on conventional power sources, including installing rooftop and carport solar systems at various facilities to offset the sites' energy usage.
We uphold our commitment to be carbon credits.neutral by 2035 in our facilities and operations. Our greenhouse gasGHG reduction program initially began in 2004, in our view setting us well on our way to achieving this commitment. Further to achieving our carbon neutrality goals, in 2023, we exceeded our 10-10-10 commitments that we established in 2019 to (i) reduce Scope 1 and 2 GHG emissions intensity by 10% from a 2018 baseline, (ii) deploy 10 renewable energy opportunities, and (iii) achieve certification to ISO 50001 Energy Management Standard at 10 facilities. In 2022, we joined the U.S. Department of Energy's Better Climate Challenge, pledging to reduce U.S. Scope 1 and 2 GHG emissions by 50% from a 2018 baseline. In addition, in 2023, our near-term science-based target, which includes Scope 3 emissions, was approved by the Science Based Target initiative (SBTi).
10 Honeywell International Inc.
ESG OFFERINGS
We see ourselvesstrive to lead the marketplace in sustainable technology development and help our customers meet their sustainability goals. We are innovating to solve the world’s toughest environmental, social, and governance (ESG) challenges. The graphic below demonstrates our multitude of ESG-oriented offerings.

| | | | | |
| 1 | Methodology for identifying ESG-oriented offerings is available at investor.honeywell.com (see “ESG/ESG Information/Identification of ESG-Oriented Offerings”). |
•Honeywell Delivers Solutions For Pathways For Emissions Reductions. Our measurement and reporting technology integrates seamlessly with Software-as-a-Service (SaaS) technology, such as Honeywell Forge Sustainability+ for Industrials | Emissions Management, for near real-time emissions reporting as a responsible corporate citizen, leadingconsolidated system of record.
•Honeywell Helps Define Pathways To Net Zero. We can deliver solutions to help drive the energy transition and decarbonization. We have unique expertise in essential technologies needed to help on the journey to create a net-zero economy, including refrigerants, renewable diesel and aviation fuels, hydrogen production, and carbon capture, utilization, and storage.
•Honeywell Sets The Pace For A More Electric Future. We provide ready-now solutions for more-electric aircraft, electric vehicles, and advanced energy storage systems, including a broad array of sensors for use in battery management systems, electric drive control, energy storage systems, and battery safety applications.
•Honeywell Helps Deliver Healthier And More Sustainable Buildings. Our suite of solutions help building owners and operators control critical health, safety and security factors to enable compliance with changing building standards, safety guidelines, regulations, and risk management policies.
•Honeywell Sets Course For A Cleaner Future For Aviation. We offer proven processes for sustainable change withinaviation fuel production, advanced software that can enable real-time fuel-saving decisions, and electric and hybrid power systems that foreshadow the global marketplace. While we focus on our own sustainability commitments, we seek to partner as an agentcleaner future of change with our customers around the world through sustainable products, services, and solutions.
1Available through the Honeywell Partnership Ecosystem.flight.
Additional information regarding our sustainability initiatives and strategy is included in our 2021 Corporate Citizenship2023 Environmental, Social and Governance Report, which can be found on our website (honeywell.com); this report is not incorporated into this Form 10-K by reference and should not be considered part of this Form 10-K.
1011 Honeywell International Inc.
HUMAN CAPITAL MANAGEMENT
We believe a commitment to and investment in human capital management enables better decision making,decision-making, helps us build competitive advantage, and furthers our long-term success. As of December 31, 2021,2023, we employed approximately 99,00095,000(1)1 employees across 8279 countries, 34,00033,000(1)1 of whom are in the United States. Human capital management is the key driver of our performance culture, which enables our workforce to respond to the fast-changing needs of our customers. Our performance
| | | | | | | | | | | | | | | | | | | | | | | | | | |
| | | | | | | | |
| As of December 31, 2023, we employed approximately 95,000 EMPLOYEES1 | | | Across 79 COUNTRIES | | | 33,0001 of whom are in the United States. | |
| | | | | |
| | | | | | | | |
| | | | | | | | |
| 1 | | Excludes Sandia National Laboratories (Sandia) and Kansas City National Security Campus (KCNSC) work forces of approximately 24,000 employees. Sandia and KCNSC are U.S. Department of Energy facilities. Honeywell manages these facilities as a contract operator and does not establish or control their human resource policies. |
OUR CULTURE
Honeywell built a reputation of “doing what we say.” At the center of that commitment to excellence is a high-performance culture is definedrooted in our Foundational Principles and driven by a set of eightthe 6 Honeywell Behaviors. The 6 Behaviors which reflect the bold, entrepreneurial spirit we seek to foster while emphasizing our goal to operate with speed and precision. At their foundation is a commitment to Integrity and Ethics, Inclusion and Diversity, and Workplace Respect, fundamental values that underlie everything we do.
| | | | | | | | | | | | | | | | | | | | | | | | | | |
| | | | | | | | |
| As of December 31, 2021, we employed approximately
99,000 EMPLOYEES(1)
| | | Across
82 COUNTRIES
| | | 34,000(1)
of whom are in the United States.
| |
| | | | | |
| | | | | | | | |
(1) Excludes Sandia National Laboratories (Sandia) and Kansas City National Security Campus (KCNSC) work forces of approximately 21,000 employees. Sandia and KCNSC are U.S. Department of Energy facilities. Honeywell manages these facilities as a contract operator and does not establish or control their human resource policies.
HONEYWELL BEHAVIORS
| | | | | | | | | | | | | | | | | | | | |
| HAVE A PASSION FOR WINNING | | | | BE COURAGEOUS | |
| | | | | | |
| BE A ZEALOT FOR GROWTH | | | | BECOME YOUR BEST | |
| | | | | | |
| THINK BIG...
THEN MAKE IT HAPPEN | | | | BE COMMITTED | |
| | | | | | |
| ACT WITH URGENCY | | | | BUILD EXCEPTIONAL TALENT | |
In 2021, we furthered our foundational principles of Inclusion and Diversity by appointing a Chief Inclusion and Diversity Officer and Inclusion and Diversity leaders for each business unit focusing on three key priorities:
| | | | | | | | | | | | | | |
Representation | | Retention | | Recognition |
Cultivate a workforce that reflects our communities and the world | | Create employee development and advancement opportunities | | Be a global employer of choice for Inclusion and Diversity |
Sustain a pipeline of diverse talent from campus to the C-Suite | | Foster community engagement and belonging | | Leverage our culture as a competitive advantage |
Promote a culture of inclusion, accessibility, and respect | | Offer competitive compensation, rewards, and recognition | | Lead on Inclusion and Diversity practices |
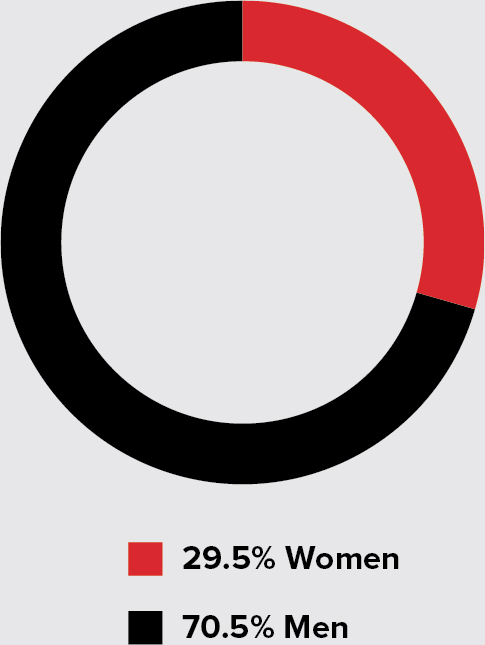
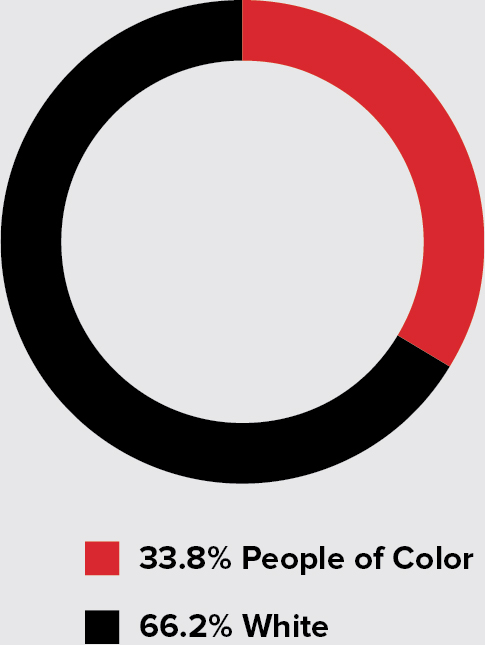
Our commitment to these fundamental values and the Honeywell Behaviors starts at the top with a diverse Board of Directors and executive management team, who represent a broad spectrum of backgrounds and perspectives. We believe that the diversity of our current Board of Directors (four women, and two Hispanic, two African American, and one Asian American director) and the diversity of Honeywell’s executive leadership (more than half of the Company’s nine executive officers are diverse by ethnic background, non-U.S. place of birth or gender) supports our evolving business strategy and is a testament to Honeywell’s ongoing commitment to hiring, developing, and retaining diverse talent. The Company’s commitment to Inclusion and Diversity enables better decision-making, helps build competitive advantages, and furthers long-term success.
Honeywell International Inc. 11
In 2020, we established a Global Inclusion and Diversity Steering Committee co-sponsored by our Chairman and CEO, Senior Vice President and General Counsel, and Senior Vice President and Chief Human Resources Officer and fortified our inclusion and diversity governance structure by embedding Inclusion and Diversity Councils in each of our business groups. The governance structure provides a scalable model that supports our seven affinity group employee networks and facilitates the introduction of new networks to reflect the diverse characteristics of our workforce. These networks are designed to provide training and development opportunities and expand internal networks for promotional opportunities.
| | | | | |
Employee Networks |
•Honeywell AllAbilities Employee Network
•Honeywell Asian Employee Network
•Honeywell Black Employee Network
•Honeywell Women’s Employee Network
| •Honeywell LGBTQ+ Employee Network
•Honeywell Veterans Employee Network
•Honeywell Hispanic Employee Network
|
| | | | | | | | |
Commitment to Inclusion and Diversity | | |
| | |
| | |
Board Gender Diversity | Board Ethnic or Racial Diversity | Executive Officer Diversity(1)
|
| | |
| | |
| | |
| | | | | |
| |
Global Workforce(2)
| U.S. Workforce(2)
|
| |
| |
| |
(1) Reflects Executive Officers as of December 31, 2021.
(2) As of December 31, 2021. Excludes work forces at Sandia and KCNSC.
|
| |
12 Honeywell International Inc.
In addition, our people managers are expected to model behaviors that promote a culture that is open and inclusive for all employees. We help managers develop this skill as they do any other leadership skill, though training programs, interactive learning and real time events, including the hiring and talent review processes. Our Leadership Edge program provides training in core management skills to leaders across the organization.
Training programs are available to all employees through our internal learning and development platform, which assigns curriculum tailored to an employee’s job responsibilities. Employees can also access additional trainings on-demand to continue to enhance their skills. We deploy unconscious bias and inclusive leadership training to our global workforce to educate and influence behavior.Our internal talent acquisition and management platform is a key component to recruiting, hiring, and developing top-performing talent. Our hiring practices consider a diverse slate of candidates and our hiring managers are provided training and toolkits to reinforce their role in bringing diverse talent into the Company. Further, we partner with top academic institutions and external professional organizations to enhance the diversity of our workforce to attract and retain top talent. Our talent review process requires our people managers to have semi-annual career discussions with each member of their teams to discuss the best opportunity for growth and development, which enhances our identification of candidates for internal promotion and succession planning.
Finally, our Code of Business Conduct establishes the baseline requirements of our integrity and compliance program and promotes an environment where everyone is treated ethically and with respect. It outlines our pledge to recognize the dignity of each individual, respect each employee, provide compensation and benefits that are competitive, promote self-development through training, and value diversity of perspectives and ideas. All employees must complete Code of Business Conduct training and, where permitted by law, must also certify each year that they will comply with the Code.
Overall, we believe our culture, along with our internal tools and initiatives, enable us to effectively execute our human capital strategy. For discussion on the risks relating to our inabilitythe ability to attract and retain top-performing talent, please see the section titled Risk Factors.
TALENT ACQUISITION AND MANAGEMENT
Our internal talent acquisition and management platform is a key component to recruiting, hiring, and developing top-performing talent. Our hiring practices consider a diverse slate of candidates and we provide our hiring managers with training and toolkits to reinforce their role in bringing diverse talent into the Company. We apply a “diversity of slate” requirement, a requirement to interview at least one diverse candidate, unless an exception is approved by human resources leadership, when hiring for any exempt role in the U.S. or for any management, professional, or senior administrative role globally. Further, we partner with top academic institutions and external professional organizations to enhance the diversity of our workforce to attract and retain top talent. Our talent review process requires our people managers to have semi-annual career discussions with each member of their teams to discuss the best opportunity for growth and development, which enhances our identification of candidates for internal promotion and succession planning.
VOICE OF THE EMPLOYEE
The Voice of the Employee feedback survey is conducted annually with all global employees with the commitment to listening, learning, and taking action to make Honeywell an even better place to work. The survey provides data and tools to leaders at all levels to best drive actionable plans around employee engagement and build our desired culture that attracts and retains top talent, improves performance, and distinguishes the Company as a great place to work.
EMPLOYEE WELL-BEING
Our well-being focus addresses physical, mental, financial, and individual needs, providing benefits and resources to help employees and their families be their best, both personally and professionally. We facilitated several campaigns to promote well-being and help provide visibility to resources and available benefits across a range of topics from health and wellness programs to caring for your family and taking care of finances. We promoted mental health globally during Mental Health Awareness month, during which we offered a variety of benefits and resources were promoted, hosted live webinars, and employees engaged in peer-to-peer sharing. We offer Employee Assistance Programs or therapy sessions to all employees and family members globally, comprehensive mental health benefits to those enrolled in the U.S. medical plan, virtual mental health options and navigation tools to improve access and speed of care, and preventive/mental health resilience programs.
13 Honeywell International Inc.13
This selected financial data should be readTRAINING AND LEADERSHIP DEVELOPMENT
Investing in conjunction withcontinuous learning and leadership development is at the Company's Consolidated Financial Statementscore of our culture and related Notes included elsewherelong-term business growth strategy. Learning and training underscores our culture of development, continuous improvement, and integrity and compliance. We offer and encourage career and leadership development programs and learning available on Honeywell Accelerator.
| | | | | |
HONEYWELL ACCELERATOR | |
Honeywell Accelerator is our operating system for governing and managing our business. Honeywell Accelerator contains all of the best practices, tools, and digital platforms to deliver best-in-class performance and enhances the way we manage, govern, and operate our business day-to-day. We designed Honeywell Accelerator with expanded tools and capabilities to provide a centralized source of best practices and training materials, taking us to the next level of performance and accelerating our transformation into a integrated operating company. With over 22,000 virtual learning modules, practice tools, and templates, this digital learning center creates common knowledge across the enterprise, helping new-joiner and long-time employees leverage the Honeywell operating system to make immediate, positive impacts. |
We expect our people managers to model behaviors that promote a culture that is open and inclusive for all employees. We help managers develop this skill as they do any other leadership skill through training programs, interactive learning, and real-time events, including the hiring and talent review processes. Our broad portfolio of leadership development programs provide training in this Annual Report as well ascore management skills to leaders across the section Management's Discussionorganization. We deploy unconscious bias and Analysis of Financial Conditioninclusive leadership training to our global workforce to educate and Results of Operations.
| | | | | | | | | | | | | | | | | | | | | | | | | | | | | |
| | Years Ended December 31, |
| 2021 | | 2020 | | 2019 | | 2018(1)(2) | | 2017(1) |
| | (Dollars in millions, except per share amounts) |
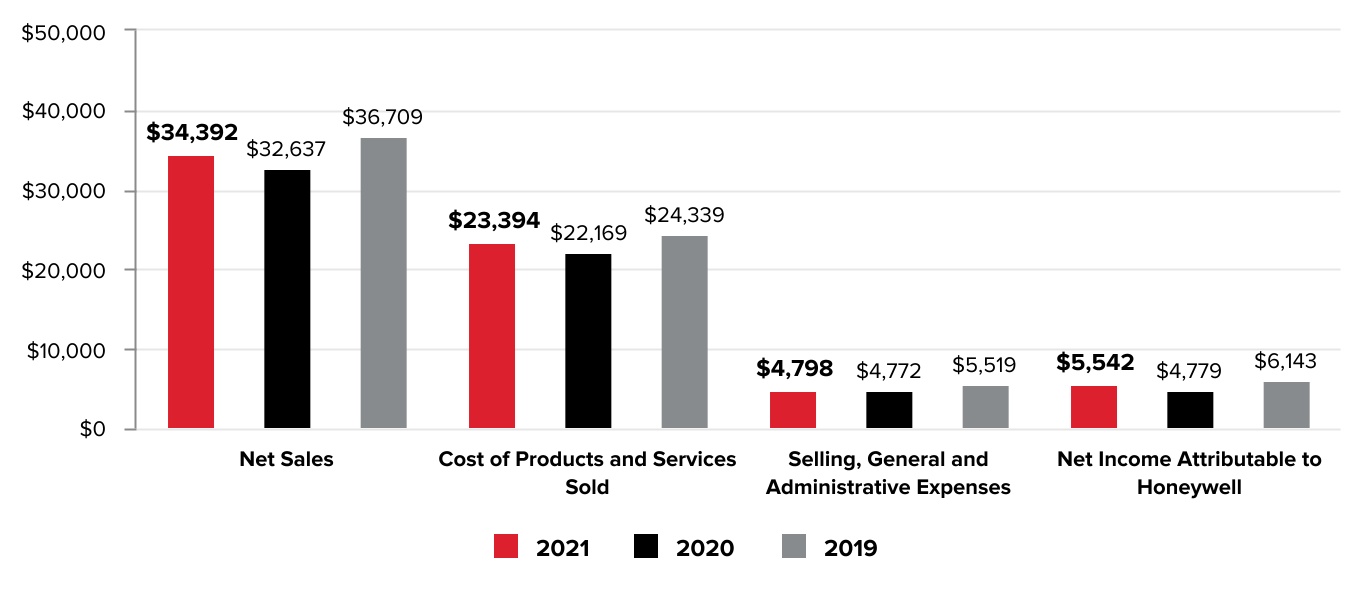
| Results of Operations | | | | | | | | | |
| Net sales | $ | 34,392 | | | $ | 32,637 | | | $ | 36,709 | | | $ | 41,802 | | | $ | 40,534 | |
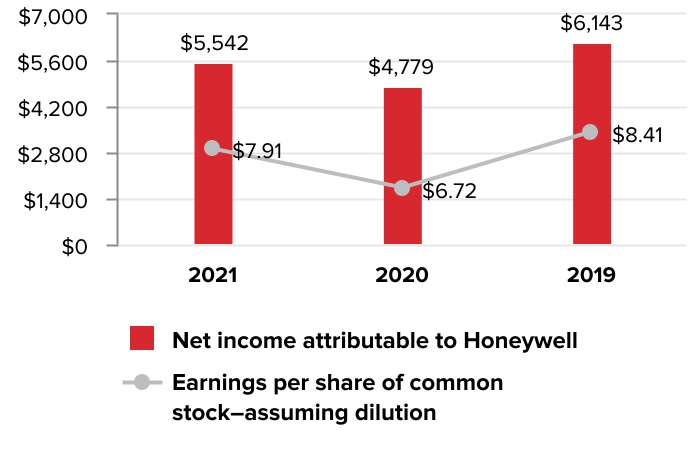
| Net income attributable to Honeywell | 5,542 | | | 4,779 | | | 6,143 | | | 6,765 | | | 1,545 | |
| Earnings Per Common Share | | | | | | | | | |
| Earnings from operations: | | | | | | | | | |
| Basic | 8.01 | | | 6.79 | | | 8.52 | | | 9.10 | | | 2.03 | |
| Assuming dilution | 7.91 | | | 6.72 | | | 8.41 | | | 8.98 | | | 2.00 | |
| Dividends per share | 3.77 | | | 3.63 | | | 3.36 | | | 3.06 | | | 2.74 | |
| Balance Sheet Data | | | | | | | | | |
| Property, plant and equipment—net | 5,562 | | | 5,570 | | | 5,325 | | | 5,296 | | | 5,926 | |
| Total assets | 64,470 | | | 64,586 | | | 58,679 | | | 57,773 | | | 59,470 | |
| Short-term debt | 5,345 | | | 6,042 | | | 4,892 | | | 6,458 | | | 5,309 | |
| Long-term debt | 14,254 | | | 16,342 | | | 11,110 | | | 9,756 | | | 12,573 | |
| Total debt | 19,599 | | | 22,384 | | | 16,002 | | | 16,214 | | | 17,882 | |
| Redeemable noncontrolling interest | 7 | | | 7 | | | 7 | | | 7 | | | 5 | |
| Shareowners’ equity | 19,242 | | | 17,790 | | | 18,706 | | | 18,358 | | | 16,665 | |
(1)2018 and 2017 Net Income attributable to Honeywell and Earnings Per Common Share were impacted by the U.S. Tax Cuts and Jobs Act.
(2)The results of operations for the Transportation Systems and Homes and Global Distribution businesses are included in the Consolidated Statement of Operations through the effective dates of the respective spin-offs, which occurred in 2018.influence behavior.
14 Honeywell International Inc.
INCLUSION AND DIVERSITY
Inclusion and Diversity is at the core of all we do and drives us to build and reinforce an inclusive culture. With our global programs and inclusive culture, we recruit, develop, retain, and promote diverse talent. We continue to build partnerships with diverse organizations and develop resources to support diverse employees. We hold employees accountable to actively support Inclusion and Diversity in words and actions. We further our foundational principle of Inclusion and Diversity by focusing on three strategic priority areas:
| | | | | | | | | | | | | | |
| REPRESENTATION | | RECOGNITION | | RETENTION |
| Cultivate a workforce that reflects our communities and the world | | Be a global employer of choice for Inclusion and Diversity | | Create employee development and advancement opportunities |
| Sustain a pipeline of diverse talent from campus to the C-Suite | | Leverage our culture as a competitive advantage | | Foster community engagement and belonging |
| Promote a culture of inclusion, accessibility, and respect | | Lead on Inclusion and Diversity practices | | Offer competitive compensation, rewards, and recognition |
Our commitment to Inclusion and Diversity starts at the top with a diverse Board of Directors (the Board) and executive management team, who represent a broad spectrum of backgrounds and perspectives. We believe that the diversity of our current Board of Directors (four women, and two African American, one Hispanic, and two Asian American directors) and the diversity of Honeywell’s executive leadership (six of the Company’s nine executive officers are diverse by ethnic background, non-U.S. place of birth, or gender) supports our evolving business strategy and is a testament to Honeywell’s ongoing commitment to hiring, developing, and retaining diverse talent. The Company’s commitment to Inclusion and Diversity enables better decision-making, helps build competitive advantages, and furthers long-term success.
Our Global Inclusion and Diversity Steering Committee co-sponsored by our CEO, Senior Vice President and General Counsel, and Senior Vice President and Chief Human Resources Officer fortifies our inclusion and diversity governance structure by embedding Inclusion and Diversity Councils in each of our business groups. The governance structure provides a scalable model that supports our nine affinity group employee networks and facilitates the introduction of new networks to reflect the diverse characteristics of our workforce. These networks are designed to provide training and development opportunities and expand internal networks for promotional opportunities.
EMPLOYEE NETWORKS
| | | | | | | | | | | | | | |
| | | | |
| Honeywell All Abilities Employee Network | | Honeywell Hispanic Employee Network | |
| Honeywell Asian Employee Network | | Honeywell LGBTQ+ Employee Network | |
| Honeywell Black Employee Network | | Honeywell Veteran's Employee Network | |
| Heighten Your Professional Experience/Early Career Employee Network | | Honeywell Women’s Employee Network | |
| Honeywell Growing Experience Employee Network | | | |
| | | | |
We held our second annual Global Inclusion and Diversity month in September 2023, during which employees all around the world recognized and supported inclusive diversity efforts by learning from and connecting with one another. The month offered employees the opportunity to make an impact by shaping an inclusive and diverse future.
15 Honeywell International Inc.
COMMITMENT TO INCLUSION AND DIVERSITY
| | | | | | | | |
BOARD
GENDER DIVERSITY | BOARD ETHNIC OR
RACIAL DIVERSITY | EXECUTIVE
OFFICER DIVERSITY |
| | |
| | |
|
| |
| | |
| | | | | |
| |
GLOBAL WORKFORCE1 | U.S. WORKFORCE1 |
| |
| |
| |
1 As of December 31, 2023. Excludes work forces at Sandia and KCNSC. |
| |
16 Honeywell International Inc.
MANAGEMENT'S DISCUSSION AND ANALYSIS OF FINANCIAL CONDITION AND RESULTS OF OPERATIONS
(Dollars in tables and graphs in millions)millions, except per share amounts)
The following Management’s Discussion and Analysis of Financial Condition and Results of Operations is intended to help the reader understand the results of operations and financial condition of Honeywell International Inc. and its consolidated subsidiaries (Honeywell, we, us, our, or the Company) for the three years ended December 31, 2021.2023. All references to Notes relate to Notes to Consolidated Financial Statements in the section titled Financial Statements and Supplementary Data.
On November 29, 2021, Honeywell Quantum Solutions, a wholly-owned subsidiary of Honeywell, which was previously reported within the Aerospace reportable business segment, combined with Cambridge Quantum Computing, to form Quantinuum. Following the combination, Honeywell consolidated and reported Quantinuum within Corporate and All Other. Quantinuum is considered a separate operating segment, but does not meet aggregation criteria for presentation as a separate reportable segment. For this reason, it is reported within Corporate and All Other, which is not considered a reportable business segment. For the eleven months ended November 30, 2021 and the years ended December 31, 2020 and 20219, Honeywell Quantum Solutions incurred operating losses of $50 million, $41 million, and $36 million, respectively. Prior to November 29, 2021, our Aerospace business segment included the operating results of Honeywell Quantum Solutions.
Quantinuum is well-positioned to lead the quantum computing industry by offering advanced, fully integrated hardware and software solutions at an unprecedented pace, scale, and level of performance to large high-growth markets worldwide. Quantinuum supports customer needs for improved computation in cyber security, drug discovery and delivery, material science, finance, and optimization across all major industrial markets.
A detailed discussion of the prior year 20202022 to 20192021 year-over-year changes is not included herein and can be found in the Management's Discussion and Analysis of Financial Condition and Results of Operations section in the 20202022 Annual Report on Form 10-K filed February 12, 202110, 2023. COVID-19BUSINESS UPDATE
In 2021, the COVID-19 pandemic continues to have a significant impact around the world. Many jurisdictions worldwide continue to distribute vaccines as a method to limit and control infections; however, the pandemic continues to impact our business as vaccine efforts face challenges and new variants of the virus emerge. Select governments continue to place restrictions on businesses (impacting manufacturing capabilities and distribution channels). Global supply shortages emerged for certain products (including electrical components), leading to delays in delivery schedules. Historically reliable supply chains were disrupted, impacting certain of our businesses. In certain parts of the world, labor shortages intensified.
These events continue to impact our business operations. As new variants of the virus emerge, we remain cautious as many factors remain unpredictable. We actively monitor and respond to the changing conditions created by the pandemic, with focus on prioritizing the health and safety of our employees, dedicating resources to support our communities, and innovating to address our customers’ needs.
In 2021, we actively promoted vaccines as a mechanism to protect the health of our employees. We supported several large-scale vaccination events to provide vaccines to our employees, their families, and the surrounding communities. In situations when local medical care was unavailable, we provided additional support to our employees to ensure they received the medical care needed. We continue to adapt our safety and hygiene protocols to enable our manufacturing employees to operate safely through the pandemic. We also continue to utilize our procedures for a phased return of our employees to our office sites, and in many parts of the world, we returned our non-manufacturing employees to the workplace. However, in certain countries, our non-manufacturing employees continue to work from home (for roles that allow for remote work).
On September 9, 2021, President Biden announced several initiatives to drive higher vaccination rates in the U.S., including an executive order for U.S. Government contractors to mandate vaccination against COVID-19. In response to these initiatives, we implemented a vaccine mandate requiring all U.S.-based employees at work locations that work on or in support of contracts with the U.S. Government to receive their first vaccine dose, or a medical or religious exemption, by January 4, 2022. Similarly, the Company adopted a vaccine mandate for all prospective and future employees and announced a timeline for a vaccine mandate for our remaining U.S. employees.
We continue to monitor and respond to the changing conditions created by the pandemic.
Honeywell International Inc. 15
MANAGEMENT’S DISCUSSION AND ANALYSIS OF FINANCIAL CONDITION AND RESULTS OF OPERATIONS
EMPLOYEE HEALTH, SAFETY, AND ECONOMIC WELLNESSMACROECONOMIC CONDITIONS
We continue to monitor the COVID-19 situationimpacts of ongoing macroeconomic conditions and its impacts globally. We are prioritizing the healthgeopolitical events. During 2023, material inflation continued to moderate. Slowing global growth relieved pressure on logistics freight and safety of our employees. Out of an abundance of caution for the health of our employeesservice capacity and to support local government initiatives to stem the spread of the virus, we implemented several precautions at various sites around the world. These include, but are not limited to:
•Limiting visitor site access to business-essential purposes;
•Enabling employees to work from home wherever and whenever required or appropriate;
•Continuously updating travel guidance, according to latest developments; and
•Complying with all local health authority guidance or regulations and our own protocols, including requesting employees to comply with self-quarantine requirements whenever advisable.
PLANT PRODUCTIVITY AND SAFETY
provided supply chain redundancy. We continue to operateleverage short-term and long-term mitigation strategies to reduce the impact of supply chain disruptions, including digital solutions to assist in identifying and managing shortages.
Our mitigation strategies include pricing actions, longer term planning for constrained materials, new supplier development, material supply tracking tools, and direct engagement with key suppliers to meet customer demand. Our relationships with primary and secondary suppliers allow us to reliably source key components and raw materials. In areas where we cannot procure key components or raw materials, we consider altering existing products and developing new products to satisfy customer needs. Alterations to existing products and the development of new products undergo product quality controls and engineering qualification prior to releasing to our customers. In addition, we assist certain suppliers facing manufacturing facilities with minimal disruptionchallenges by committing our own resources to their sites and facilities. We believe these mitigation strategies enable us to reduce supply risk, accelerate new product innovation, and expand our penetration in our productivity. As of December 31, 2021, all of our manufacturing sites were operating at normal production levels. Wethe markets we serve. Additionally, due to the strenuous quality controls and product qualification we perform on a new or altered product, we do not expect these mitigation strategies to impact product quality or reliability.
Global conflicts continue to provide essential servicescreate volatility in global financial and produce essential goods aroundenergy markets and contribute to supply chain shortages adding to the world.inflationary pressures in the global economy. We employ standards such as screening checks, use of masks, face coverings, and other safety equipment and social distancing practices along production lines in our production facilities at all times in compliance with local government requirements and CDC guidelines. We take appropriate actions including disinfecting and quarantine procedures when a suspected COVID-19 case is identified.
CUSTOMERS AND SUPPLIERS
Current global economic conditions due to COVID-19 continue to impact our customers’ and suppliers’ ability to operate at normal levels. We continue to workactively collaborate with our suppliers to manageminimize impacts of supply shortages on our supply chain disruptionsmanufacturing capabilities.
To date, our strategies have successfully mitigated our exposure to these conditions. However, if we are not successful in sustaining or executing these strategies, these macroeconomic conditions could have a material adverse effect on our consolidated results of operations or operating cash flows.
See the section titled Review of Business Segments for additional information on the impacts of inflationary cost pressures and limitlabor shortages to our exposure. We also work closely with our customers to manage expectations and meet their demand needs.businesses.
See the section titled Risk Factors for a discussion of risks associated with the potential adverse effects of the COVID-19 pandemic, including the impact of any applicable vaccine mandates.inflationary cost pressures, supply chain disruptions, and labor shortages to our businesses.
1617 Honeywell International Inc.
MANAGEMENT’S DISCUSSION AND ANALYSIS OF FINANCIAL CONDITION AND RESULTS OF OPERATIONS
| | | | | |
| MANAGEMENT’S DISCUSSION AND ANALYSIS OF FINANCIAL
CONDITION AND RESULTS OF OPERATIONS |
RESULTS OF OPERATIONS
Consolidated Financial Results
Net Sales by Segment
Honeywell International Inc. 17
MANAGEMENT’S DISCUSSION AND ANALYSIS OF FINANCIAL CONDITION AND RESULTS OF OPERATIONS
Segment Profit by Segment
18 Honeywell International Inc.
| | | | | |
| MANAGEMENT’S DISCUSSION AND ANALYSIS OF FINANCIAL
CONDITION AND RESULTS OF OPERATIONS |
Segment Profit by Segment
19 Honeywell International Inc.
MANAGEMENT’S DISCUSSION AND ANALYSIS OF FINANCIAL CONDITION AND RESULTS OF OPERATIONS
| | | | | |
| MANAGEMENT’S DISCUSSION AND ANALYSIS OF FINANCIAL
CONDITION AND RESULTS OF OPERATIONS |
CONSOLIDATED OPERATING RESULTS
Net Sales
The change in netNet sales was attributable to the following: | | | | | | | | |
| 2021 Versus 2020 | 2020 Versus 2019 |
| Volume | 1 | % | (12) | % |
| Price | 3 | % | 1 | % |
| Foreign Currency Translation | 1 | % | — | % |
| Acquisitions/Divestitures | — | % | — | % |
| 5 | % | (11) | % |
2021 compared with 2020 | | | | | | | | |
| 2023 Versus 2022 | 2022 Versus 2021 |
| Volume | —% | (4)% |
| Price | 4% | 10% |
| Foreign currency translation | (1)% | (3)% |
| Acquisitions, divestitures, and other, net | —% | —% |
| Total % change in Net sales | 3% | 3% |
A discussion of netNet sales by reportable business segment can be found in the Review of Business Segments section of this ManagementManagement's Discussion and Analysis.
2023 compared with 2022
Net sales increased due to the following:
•FavorableIncreased pricing, and price increases to offset the rising cost of materials,
•The favorablePartially offset by the unfavorable impact of foreign currency translation, driven by the weakeningstrengthening of the U.S. Dollar against the currencies of the majorityin certain of our international markets, primarily the Euro, British Pound, Chinese Renminbi, Canadian Dollar, Turkish Lira, Egyptian Pound, and Australian Dollar, and
•Higher sales volumes due to an increase in demand for certain products and services as the global economy showed signs of recovery from the COVID-19 pandemic.
20 Honeywell International Inc.19
MANAGEMENT’S DISCUSSION AND ANALYSIS OF FINANCIAL CONDITION AND RESULTS OF OPERATIONS
| | | | | |
| MANAGEMENT’S DISCUSSION AND ANALYSIS OF FINANCIAL
CONDITION AND RESULTS OF OPERATIONS |
Cost of Products and Services Sold
20212023 compared with 20202022
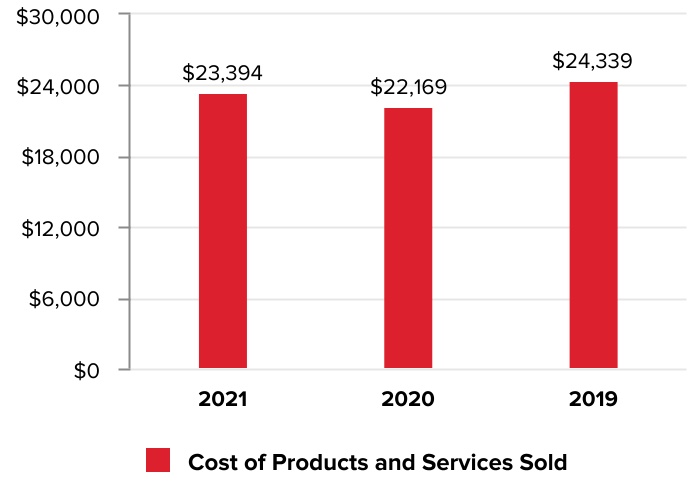
Cost of products and services sold increased in 2021 primarily due to the following:
•Higher direct and indirect material costs of approximately $1,350 million, due in part to supply chain constraints, and
•Higher repositioning and otherhigher labor costs of approximately $150 million,
•Partially offset by cost actions to improve productivity of approximately $380 million.
Gross Margin
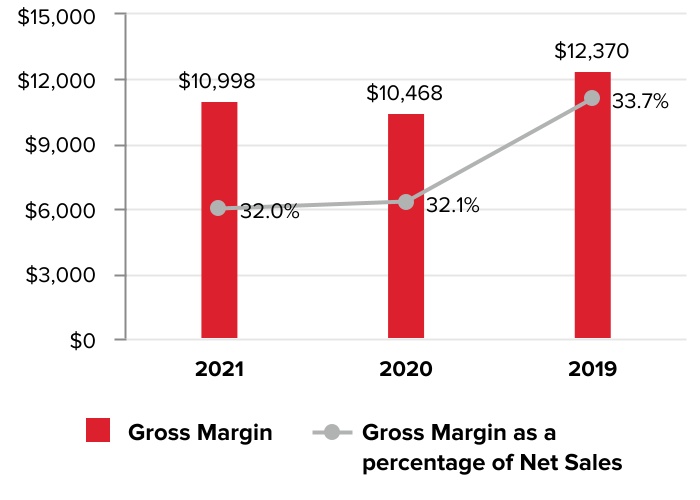
2021 compared with 2020
Gross margin increased due to the following:
•Favorable pricing,
•Higher productivity,
•The favorable impact of foreign currency translation, and
•Increased demand for our products,
•Partially offset by higher direct and indirect material costs, higher repositioning and other costs of approximately $150 million, and a larger portion of our sales being driven by our Safety and Productivity Solutions segment.
20 Honeywell International Inc.
MANAGEMENT’S DISCUSSION AND ANALYSIS OF FINANCIAL CONDITION AND RESULTS OF OPERATIONS
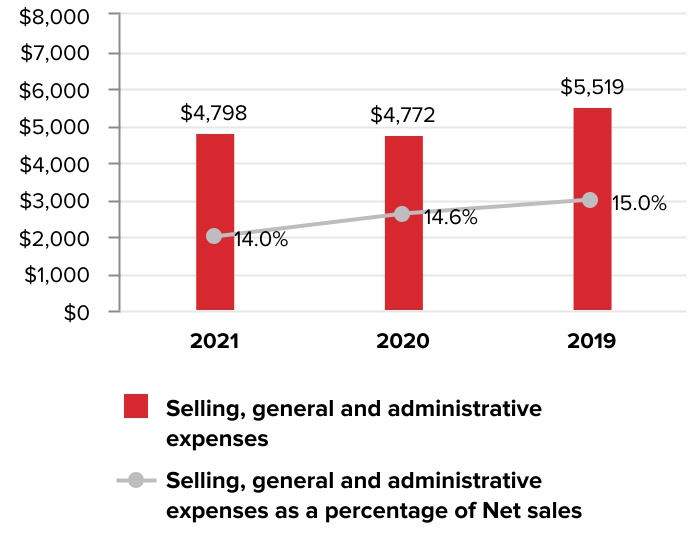
Selling, General and Administrative Expenses
2021 compared with 2020
Selling, general and administrative expenses and Selling, general and administrative expenses as a percentage of net sales changed due to the following:
•Higher expenses due to increased sales volumes and labor expense,$0.8 billion or 4%,
•Partially offset by higher productivity including lower costs resulting from repositioning actions.of approximately $0.3 billion or 1%.
Gross Margin
2023 compared with 2022
Gross margin increased by approximately $0.5 billion and gross margin percentage increased 30 basis points to 37.3% compared to 37.0% for the same period of 2022.
21 Honeywell International Inc.21
MANAGEMENT’S DISCUSSION AND ANALYSIS OF FINANCIAL CONDITION AND RESULTS OF OPERATIONS
Other (Income) Expense | | | | | |
| MANAGEMENT’S DISCUSSION AND ANALYSIS OF FINANCIAL
CONDITION AND RESULTS OF OPERATIONS |
| | | | | | | | | | | | | | | | | |
| 2021 | | 2020 | | 2019 |
| Other (Income) Expense | $ | (1,378) | | | $ | (675) | | | $ | (1,065) | |
2021
2023 compared with 20202022
Other (income) expense increasedResearch and development expenses were flat.
Selling, General and Administrative Expenses
2023 compared with 2022
Selling, general and administrative expenses were flat due to the following:
•Prior year non-cash charges associated with the reduction in value of reimbursement receivables due from Garrett,
•Higher pension income, and
•Gain on saleproductivity of the retail footwear business,approximately $0.2 billion or 4%,
•Partially offset by the recognitionhigher labor costs of an expense related to UOP matters and increased foreign exchange expense. See Note 19 Commitments and Contingencies of Notes to the Consolidated Financial Statements for additional information on UOP Matters.
Tax Expense
2021 compared with 2020
The effective tax rate for 2021 was higher than the U.S. federal statutory rate of 21% primarily due to the following:
•Accrued withholding taxes related to unremitted foreign earnings,
•The establishment of a valuation allowance for deferred tax assets not expected to be realized, and
•Incremental tax reserves and state taxes,
•Partially offset by the tax impact of restructuring.
For further discussion of changes in the effective tax rate, see Note 5 Income Taxes of Notes to Consolidated Financial Statements.
22 Honeywell International Inc.
MANAGEMENT’S DISCUSSION AND ANALYSIS OF FINANCIAL CONDITION AND RESULTS OF OPERATIONS
| | | | | |
| MANAGEMENT’S DISCUSSION AND ANALYSIS OF FINANCIAL
CONDITION AND RESULTS OF OPERATIONS |
Other (Income) Expense
| | | | | | | | | | | | | | | | | |
| 2023 | | 2022 | | 2021 |
| Other (income) expense | $ | (840) | | | $ | (366) | | | $ | (1,378) | |
2023 compared with 2022
Other income increased due to the following:
•Reduced net expenses resulting from the North American Refractory Company (NARCO) Amended Buyout Agreement in 2022 of approximately $0.6 billion, which included a charge of $1.325 billion for the Buyout Amount, partially offset by the derecognition of the NARCO asbestos-related liability of $0.7 billion, and
•Higher interest income of approximately $0.2 billion,
•Partially offset by proceeds from HarbisonWalker International Holdings, Inc. (HWI) Sale of $0.3 billion and lower pension and postretirement income of $0.2 billion.
See Note 19 Commitments and Contingencies of Notes to Consolidated Financial Statements for additional information on NARCO Amended Buyout Agreement and HWI Net Sale Proceeds.
Tax Expense
2023 compared with U.S. Statutory Rate
The effective tax rate for 2023 was lower than the U.S. federal statutory rate of 21% as a result of the following:
•Tax benefits on non-U.S. earnings, tax credits, and other accrued tax benefits, representing a 580 basis-point decrease,
•Partially offset by incremental tax expense for tax reserves and other accrued tax expenses, representing a 560 basis-point increase.
See Note 5 Income Taxes of Notes to Consolidated Financial Statements for further discussion of changes in the effective tax rate.
23 Honeywell International Inc.
| | | | | |
| MANAGEMENT’S DISCUSSION AND ANALYSIS OF FINANCIAL
CONDITION AND RESULTS OF OPERATIONS |
Net Income Attributable to Honeywell
20212023 compared with 20202022
Earnings per share of common stock–assuming dilution increased due to the following:
•Higher segment profit which impacted earnings per share by $0.70 after tax,
•Prior year non-cashLower repositioning and other charges, associated with the reductionincluding charges attributable to suspending and winding down our businesses and operations in value of reimbursement receivables due from Garrett,Russia, which impacted earnings per share by $0.56 after tax,
•Higher pensioninterest income
•Gain on sale of the retail footwear business, which impacted earnings per share by $0.21 after tax, and
•FavorableThe favorable impact of lower share count which impacted earnings per share by $0.18 after tax,
•Partially offset by higher income taxes, aninterest expense related to UOP matters, and higher foreign exchange expense.
24 Honeywell International Inc.23
REVIEW OF BUSINESS SEGMENTS
We globally manage our business operations through four reportable business segments: Aerospace, Honeywell Building Technologies, Performance Materials and Technologies, and Safety and Productivity Solutions.
AEROSPACE
Net Sales
| | 2021 | 2020 | Change 2021 vs. 2020 | 2019 | Change 2020 vs. 2019 |
| 2023 | | | 2023 | | 2022 | | Change 2023 vs. 2022 | | 2021 | | Change 2022 vs. 2021 |
| Net sales | Net sales | | $ | 11,026 | | | $ | 11,544 | | | (4) | % | | $ | 14,054 | | | (18) | % | Net sales | $ | 13,624 | | | $ | | $ | 11,827 | | | 15 | | 15 | % | | $ | 11,026 | | | 7 | | 7 | % |
| Cost of products and services sold | Cost of products and services sold | | 7,191 | | | 7,813 | | | | | 9,398 | | | | Cost of products and services sold | 8,381 | | | 7,202 | | 7,202 | | | | | | | 6,665 | | | | | |
| Selling, general and administrative and other expenses | Selling, general and administrative and other expenses | | 784 | | | 827 | | | | | 1,049 | | | | Selling, general and administrative and other expenses | 1,502 | | | 1,397 | | 1,397 | | | | | | | 1,310 | | | | | |
| Segment profit | Segment profit | | $ | 3,051 | | | $ | 2,904 | | | 5 | % | | $ | 3,607 | | | (19) | % | Segment profit | $ | 3,741 | | | $ | | $ | 3,228 | | | 16 | | 16 | % | | $ | 3,051 | | | 6 | | 6 | % |
| | Factors Contributing to Year-Over-Year Change | Factors Contributing to Year-Over-Year Change | 2021 vs. 2020 | | 2020 vs. 2019 | Factors Contributing to Year-Over-Year Change | 2023 vs. 2022 | | 2022 vs. 2021 |
Net
Sales | Segment
Profit | | Net
Sales | Segment
Profit | Net
Sales | | Segment
Profit | | Net
Sales | | Segment
Profit |
Organic(1) | | (5) | % | | 4 | % | | (18) | % | | (20) | % |
Organic1 | | Organic1 | 15 | % | | 16 | % | | 8 | % | | 6 | % |
| Foreign currency translation | Foreign currency translation | | 1 | % | | — | % | | — | % | | — | % | Foreign currency translation | — | % | | — | % | | (1) | % | | — | % |
| Acquisitions, divestitures and other, net | | — | % | | 1 | % | | — | % | | 1 | % |
| Total % Change | | (4) | % | | 5 | % | | (18) | % | | (19) | % |
| Acquisitions, divestitures, and other, net | | Acquisitions, divestitures, and other, net | — | % | | — | % | | — | % | | — | % |
| Total % change | | Total % change | 15 | % | | 16 | % | | 7 | % | | 6 | % |
(1) Organic sales % change, presented for all of our reportable business segments, is defined as the change in net sales, excluding the impact on sales from foreign currency translation and acquisitions, net of divestitures, for the first 12 months following the transaction date. We believe this non-GAAP measure is useful to investors and management in understanding the ongoing operations and analysis of ongoing operating trends. | | | | | | | | |
| 1 | | Organic sales % change, presented for all of our reportable business segments, is defined as the change in Net sales, excluding the impact on sales from foreign currency translation and acquisitions, net of divestitures, for the first 12 months following the transaction date. We believe this non-GAAP measure is useful to investors and management in understanding the ongoing operations and analysis of ongoing operating trends. |
20212023 compared with 20202022
Sales decreasedincreased $1,797 million due to lower demand from our commercial OEMs, and domestic and international defense, partially offsethigher organic sales of $1,148 million in Commercial Aviation Aftermarket driven by higher demandsales volumes in air transport due to an increase in flight hours, higher organic sales of $361 million in Defense and Space driven by higher sales volumes due to increased shipments, and higher organic sales of $315 million for our aftermarket products and services, and favorable pricing.
•Commercial Aviation Original Equipment driven by higher sales decreased 11% (decreased 12% organic)volumes due to lower demand in air transportincreased shipments.
Segment profit increased $513 million and regional and business aviation.
•Commercial Aviation Aftermarket salessegment margin percentage increased 9% (increased 9% organic) due20 basis points to higher demand in business aviation.
•Defense and Space sales decreased 11% (decreased 12% organic) driven by lower demand in U.S. and international defense and supply chain constraints.27.5% compared to 27.3% for the same period of 2022.
2425 Honeywell International Inc.
Cost of products and services sold decreased due to lower sales volumes and higher productivity.
Segment profit increased due to favorable pricing, higher productivity, and higher sales volume of higher margin products and services, partially offset by overall lower sales volume.
| | | | | |
| REVIEW OF BUSINESS SEGMENTS |
HONEYWELL BUILDING TECHNOLOGIES
Net Sales
| | 2021 | 2020 | Change 2021 vs. 2020 | 2019 | Change 2020 vs. 2019 |
| 2023 | | | 2023 | | 2022 | | Change 2023 vs. 2022 | | 2021 | | Change 2022 vs. 2021 |
| Net sales | Net sales | | $ | 5,539 | | | $ | 5,189 | | | 7 | % | | $ | 5,717 | | | (9) | % | Net sales | $ | 6,031 | | | $ | | $ | 6,000 | | | 1 | | 1 | % | | $ | 5,539 | | | 8 | | 8 | % |
| Cost of products and services sold | Cost of products and services sold | | 3,242 | | | 3,067 | | | 3,444 | | |
| Selling, general and administrative and other expenses | Selling, general and administrative and other expenses | | 1,059 | | | 1,023 | | | 1,108 | | |
| Selling, general and administrative and other expenses | |
| Selling, general and administrative and other expenses | |
| Segment profit | Segment profit | | $ | 1,238 | | | $ | 1,099 | | | 13 | % | | $ | 1,165 | | | (6) | % |
| Segment profit | |
| Segment profit | | $ | 1,505 | | | $ | 1,439 | | | 5 | % | | $ | 1,238 | | | 16 | % |
| | Factors Contributing to Year-Over-Year Change | Factors Contributing to Year-Over-Year Change | 2021 vs. 2020 | | 2020 vs. 2019 | Factors Contributing to Year-Over-Year Change | 2023 vs. 2022 | | 2022 vs. 2021 |
Net
Sales | Segment
Profit | | Net
Sales | Segment
Profit | Net
Sales | | Segment
Profit | | Net
Sales | | Segment
Profit |
| Organic | Organic | | 4 | % | | 11 | % | | (9) | % | | (5) | % | Organic | 2 | % | | 5 | % | | 14 | % | | 23 | % |
| Foreign currency translation | Foreign currency translation | | 3 | % | | 3 | % | | — | % | | (1) | % | Foreign currency translation | (1) | % | | — | % | | (6) | % | | (7) | % |
| Acquisitions, divestitures and other, net | | — | % | | (1) | % | | — | % | | — | % |
| Total % Change | | 7 | % | | 13 | % | | (9) | % | | (6) | % |
| Acquisitions, divestitures, and other, net | | Acquisitions, divestitures, and other, net | — | % | | — | % | | — | % | | — | % |
| Total % change | | Total % change | 1 | % | | 5 | % | | 8 | % | | 16 | % |
20212023 compared with 20202022
Sales increased primarily due to the favorable impact of foreign currency translation and favorable pricing.
•Sales in Products increased 9% (increased 6% organic)$31 million due to higher demand for certainorganic sales growth of our product offerings, and the favorable impact of foreign currency translation.
•Sales$145 million in Building Solutions driven by increased 4% (flat on an organic basis) due to higher demand for our services businesses, and the favorable impact of foreign currency translation.
Cost of productspricing in building projects and services, sold increased primarily due to the rising cost of materials andpartially offset by the unfavorable impact of foreign currency translation partially offsetof $88 million and lower organic sales of $27 million in Products driven by higher productivity.lower sales volumes.
Segment profit increased primarily due$66 million and segment margin percentage increased 100 basis points to higher productivity, higher demand25.0% compared to 24.0% for certain products and services, favorable pricing, and the favorable impactsame period of foreign currency translation, partially offset by the rising cost of materials.
Honeywell International Inc. 25
REVIEW OF BUSINESS SEGMENTS
PERFORMANCE MATERIALS AND TECHNOLOGIES
Net Sales
| | | | | | | | | | | | | | | | | | | | | | | | | | | | | | | | |
| 2021 | 2020 | Change 2021 vs. 2020 | 2019 | Change 2020 vs. 2019 |
| Net sales | | $ | 10,013 | | | $ | 9,423 | | | 6 | % | | $ | 10,834 | | | (13) | % |
| Cost of products and services sold | | 6,637 | | | 6,331 | | | | | 6,989 | | | |
| Selling, general and administrative and other expenses | | 1,256 | | | 1,241 | | | | | 1,412 | | | |
| Segment profit | | $ | 2,120 | | | $ | 1,851 | | | 15 | % | | $ | 2,433 | | | (24) | % |
| | | | | | | | | | | | | | | | | | | | | | | | | | | | | |
| Factors Contributing to Year-Over-Year Change | 2021 vs. 2020 | | 2020 vs. 2019 |
Net
Sales | Segment
Profit | | Net
Sales | Segment
Profit |
| Organic | | 3 | % | | 14 | % | | | (13) | % | | (24) | % |
| Foreign currency translation | | 2 | % | | 2 | % | | | — | % | | — | % |
| Acquisitions, divestitures and other, net | | 1 | % | | (1) | % | | | — | % | | — | % |
| Total % Change | | 6 | % | | 15 | % | | | (13) | % | | (24) | % |
2021 compared with 2020
Sales increased due to the impact of foreign currency translation, higher demand for certain products, and the acquisition of Sparta Systems.
•UOP sales increased 8% (increased 6% organic) due to higher demand for oil and gas products and services, and the favorable impact of foreign currency translation.
•Process Solutions sales were flat (decreased 4% organic). The acquisition of Sparta Systems and the favorable impact of foreign currency translation was offset by lower demand for projects and services.
•Advanced Materials sales increased 15% (increased 13% organic) due to higher demand for fluorine products and the favorable impact of foreign currency translation.
Cost of products and services sold increased due to the rising cost of materials, partially offset by higher productivity.
Segment profit increased due to higher demand for certain products, favorable pricing, partially offset by the rising cost of materials.2022.
26 Honeywell International Inc.
REVIEW OF BUSINESS SEGMENTS
| | | | | |
| REVIEW OF BUSINESS SEGMENTS |
PERFORMANCE MATERIALS AND TECHNOLOGIES
Net Sales
| | | | | | | | | | | | | | | | | | | | | | | | | | | | | |
| 2023 | | 2022 | | Change 2023 vs. 2022 | | 2021 | | Change 2022 vs. 2021 |
| Net sales | $ | 11,506 | | | $ | 10,727 | | | 7 | % | | $ | 10,013 | | | 7 | % |
| Cost of products and services sold | 7,166 | | | 6,670 | | | | | 6,331 | | | |
| Selling, general and administrative and other expenses | 1,791 | | | 1,703 | | | | | 1,562 | | | |
| Segment profit | $ | 2,549 | | | $ | 2,354 | | | 8 | % | | $ | 2,120 | | | 11 | % |
| | | | | | | | | | | | | | | | | | | | | | | |
| Factors Contributing to Year-Over-Year Change | 2023 vs. 2022 | | 2022 vs. 2021 |
Net
Sales | | Segment
Profit | | Net
Sales | | Segment
Profit |
| Organic | 7 | % | | 9 | % | | 11 | % | | 15 | % |
| Foreign currency translation | (1) | % | | (1) | % | | (4) | % | | (4) | % |
| Acquisitions, divestitures, and other, net | 1 | % | | — | % | | — | % | | — | % |
| Total % change | 7 | % | | 8 | % | | 7 | % | | 11 | % |
2023 compared with 2022
Sales increased $779 million due to organic sales growth of $491 million in Process Solutions driven by increased demand in projects and lifecycle solutions and services and higher organic sales of $193 million in UOP driven by growth in gas processing and refining catalyst shipments.
Segment profit increased $195 million and segment margin percentage increased 30 basis points to 22.2% compared to 21.9% for the same period of 2022.
27 Honeywell International Inc.
| | | | | |
| REVIEW OF BUSINESS SEGMENTS |
SAFETY AND PRODUCTIVITY SOLUTIONS
Net Sales
| | 2021 | 2020 | Change 2021 vs. 2020 | 2019 | Change 2020 vs. 2019 |
| 2023 | | | 2023 | | 2022 | | Change 2023 vs. 2022 | | 2021 | | Change 2022 vs. 2021 |
| Net sales | Net sales | | $ | 7,814 | | | $ | 6,481 | | | 21 | % | | $ | 6,104 | | | 6 | % | Net sales | $ | 5,489 | | | $ | | $ | 6,907 | | | (21) | | (21) | % | | $ | 7,814 | | | (12) | | (12) | % |
| Cost of products and services sold | Cost of products and services sold | | 5,738 | | | 4,532 | | | 4,158 | | |
| Selling, general and administrative and other expenses | Selling, general and administrative and other expenses | | 1,047 | | | 1,042 | | | 1,156 | | |
| Selling, general and administrative and other expenses | |
| Selling, general and administrative and other expenses | |
| Segment profit | Segment profit | | $ | 1,029 | | | $ | 907 | | | 13 | % | | $ | 790 | | | 15 | % |
| Segment profit | |
| Segment profit | | $ | 901 | | | $ | 1,080 | | | (17) | % | | $ | 1,029 | | | 5 | % |
| | Factors Contributing to Year-Over-Year Change | Factors Contributing to Year-Over-Year Change | 2021 vs. 2020 | | 2020 vs. 2019 | Factors Contributing to Year-Over-Year Change | 2023 vs. 2022 | | 2022 vs. 2021 |
Net
Sales | Segment
Profit | | Net
Sales | Segment
Profit | Net
Sales | | Segment
Profit | | Net
Sales | | Segment
Profit |
| Organic | Organic | | 22 | % | | 14 | % | | 6 | % | | 16 | % | Organic | (20) | % | | (16) | % | | (9) | % | | 9 | % |
| Foreign currency translation | Foreign currency translation | | 2 | % | | 2 | % | | — | % | | (1) | % | Foreign currency translation | (1) | % | | (1) | % | | (3) | % | | (3) | % |
| Acquisitions, divestitures and other, net | | (3) | % | | (3) | % | | — | % | | — | % |
| Total % Change | | 21 | % | | 13 | % | | 6 | % | | 15 | % |
| Acquisitions, divestitures, and other, net | | Acquisitions, divestitures, and other, net | — | % | | — | % | | — | % | | (1) | % |
| Total % change | | Total % change | (21) | % | | (17) | % | | (12) | % | | 5 | % |
20212023 compared with 20202022
Sales increaseddecreased $1,418 million due to increasedlower organic sales of $866 million in Warehouse and Workflow Solutions driven by lower demand for certain productsprojects and favorable pricing.
•Sales in Safety and Retail decreased 1% (increased 5% organic) due to the salelower organic sales of the retail footwear business, partially offset by increased demand for certain products.
•Sales$426 million in Productivity Solutions and Services increased 27% (increased 25% organic) due to higher demand on certain products.
•Sales in Warehouse and Workflow Solutions increased 50% (increased 49% organic) due to higherdriven by lower demand for warehouse automation and services.
•Sales in Advanced Sensing Technologies increased 5% (increased 3% organic) due to higher demand for certain products and the favorable impact of foreign currency translation.
Cost of products and services sold increased primarily due to higher sales volumes, higher sales on lower margin products, the rising cost of materials, partially offset by the sale of the retail footwear business.products.
Segment profit decreased $179 million and segment margin percentage increased due80 basis points to higher sales volumes16.4% compared to 15.6% for the same period in 2022.
During the second quarter of 2022, our Productivity Solutions and favorable pricing, partially offsetServices business entered into a license and settlement agreement (the Agreement). Under the Agreement, we will receive up to $360 million, paid in equal quarterly installments over eight quarters, beginning with the second quarter of 2022. The Agreement provides each party a license to its existing patent portfolio for use by higher sales of lower marginthe other party’s existing products and resolves all patent-related litigation between the rising cost of materials.parties.
28 Honeywell International Inc.27
REVIEW OF BUSINESS SEGMENTS
| | | | | |
| REVIEW OF BUSINESS SEGMENTS |
CORPORATE AND ALL OTHER
Corporate and All Other primarily includes unallocated corporate costs, interest expense on holding-company debt, and the controlling majority-owned interest in Quantinuum. Corporate and All Other is not considered a separate reportable business segment as segment reporting criteria is not met for the activities reported with Corporate and All Other and the Company does not believe the results of operations are meaningful to investors.met. The Company continues to monitor the activities in Corporate and All Other to determine the need for further reportable business segment disaggregation.
REPOSITIONING CHARGES
See Note 4 Repositioning and Other Charges of Notes to Consolidated Financial Statements for a discussion of our repositioning actions and related charges incurred in 2021, 2020,2023, 2022, and 2019.2021. Cash spending related to our repositioning actions was $294 million, $275 million, and $382 million $564 millionin 2023, 2022, and $249 million in 2021, 2020, and 2019,respectively, and was funded through operating cash flows.
BUSINESS REALIGNMENT
In October 2023, the Company announced a realignment, effective in the first quarter of 2024, of its business units comprising its Performance Materials and Technologies, and Safety and Productivity Solutions reportable business segments by forming two new reportable business segments: Industrial Automation, and Energy and Sustainability Solutions. Industrial Automation will include Sensing and Safety Technologies, Productivity Solutions and Services, and Warehouse and Workflow Solutions, which are currently included in Safety and Productivity Solutions, in addition to Process Solutions, which is currently included in Performance Materials and Technologies. Energy and Sustainability Solutions will include UOP and Advanced Materials, which are currently included in Performance Materials and Technologies. Further, as part of the realignment, the Company will rename its Aerospace and Honeywell Building Technologies reportable business segments to Aerospace Technologies and Building Automation, respectively. Following the realignment, the Company’s reportable business segments will be Aerospace Technologies, Industrial Automation, Building Automation, and Energy and Sustainability Solutions. The realignment will not impact the Company’s historical consolidated financial position, results of operations, or cash flows. The Company expects to report its financial performance based on this realignment effective with the first quarter of 2024.
2829 Honeywell International Inc.
RISK FACTORS
Our business, operating results, cash flows, and financial condition are subject to the material risks and uncertainties set forth below, any one of which could cause our actual results to vary materially from recent results or from our anticipated future results. Disclosures of risks should not be interpreted to imply that the risks have not already materialized, and there may be additional risks that are not presently material or known.
MACROECONOMIC AND INDUSTRY RISKS
Each of our businesses is subject to unique industry and economic conditions that may adversely affect the markets and operating conditions of our customers, which in turn can affect demand for our products and services and our results of operations.
•Aerospace—Our Aerospace business is impacted by customer buying patterns of aftermarket parts, supplier stability, factory transitions, and global supply chain capacity constraints that may lead to shortages of crucial components. Operating results may be adversely affected by downturns in the global demand for air travel, which may impact new aircraft production or result in the delay or cancellation of new aircraft orders, delays in launch schedules for new aircraft,aircrafts, the retirement of aircraftaircrafts, and reductions in global flying hours, which impacts air transport and regional, business, and general aviation aircraft utilization rates. Operating results may also be adversely affected by any decrease in air travel demand due to regional restrictions or suspension of service for events related to public health, safety, the environment, or environmental events, such as the effects of the COVID-19 pandemic, which impacted our operating results.regional conflicts. Operating results could also be impacted by changes in overall trends related to end market demand for the product portfolio, as well as new entrants and non-traditional players entering the market. Operating results in our Defense and Space business unit may be affected by the mix of U.S. and foreign government appropriations for defense and space programs and by compliance risks. Results may also be impacted by the potential introduction of counterfeit parts into our global supply chain.
•Honeywell Building Technologies—Operating results may be adversely impacted by downturns in the level of global commercial construction activity (including retrofits and upgrades), lower capital spending and operating expenditures on building projects, changes in the competitive landscape, including new market entrants and new technologies, and fluctuations in inventory levels in distribution channels.
•Performance Materials and Technologies—Operating results may be adversely impacted by downturns in capacity utilization for chemical, industrial, refining, petrochemical, and semiconductor plants, our customers’ availability of capital for refinery construction and expansion, raw material demand and supply, product commoditization, continued illegal imports of hydrofluorocarbons into Europe, and our ability to maximize our facilities’ production capacity and minimize downtime. Periods of increased volatility in oil and natural gas prices may result in less investment by our customers and therefore, lower demand for our products and services.
•Safety and Productivity Solutions—Operating results may be adversely impacted by reduced investments in process automation, safety monitoring, and plant capacity utilization initiatives, fluctuations in retail markets, a slowdown in demand for safety products, changes in the competitive landscape, including new market entrants and technologynew technologies that may lead to product commoditization, and adverse industry economic conditions, all of which could result in lower market share, reduced selling prices, and lower margins.
The global COVID-19 pandemic and related impacts have adversely affected and may continue to adversely affect, our business, financial condition, results of operations, liquidity, and cash flow.
The continued global spread of COVID-19 creates significant volatility, uncertainty and economic disruption that have impacted our business, operations, and financial results and may continue to do so. The extent to which the COVID-19 pandemic will continue to impact our business, operations and financial results will depend on numerous evolving factors that we may not be able to accurately predict, including: the duration, scope and severity of the pandemic, including emergence and impact of new variants; some of which have been, and may be in the future, more virulent or transmissible than the initial strain, and any continued increase in cases globally and across the United States in particular, including breakthrough infections among the fully vaccinated population, as well as the timing, availability, and acceptance of effective medical treatments and vaccines; the pace of vaccine deployment; the impact of vaccine mandates, governmental, business and individual decisions and actions; the impact of the pandemic on economic activity; and the extent to which we or our employees, customers, suppliers, service providers or other business partners may be prevented from conducting normal business activities, including due to shutdowns or other restrictive measures that may be requested or mandated by governmental authorities. These factors could, among other things, continue to disrupt (i) the purchasing, contracting and payment behaviors of our customers and their end-users; (ii) our operations, including our manufacturing activities, the shipment of our products, and the performance of our suppliers and service providers; and (iii) our liquidity and cash flow.
Honeywell International Inc. 29
Risks arising from the COVID-19 pandemic impacting our business and that may continue to impact our business, financial condition, results of operations and prospects include, among other things:
•Customer Risk—Existing and potential customers and their end-users may continue to take actions to reduce or suspend operations, reduce or delay spending, cancel contracts, or cut costs in a manner that reduces demand for our products and services. In particular, lower demand for air travel may continue to cause our customers to delay or suspend spending in connection with the manufacturing, repair, overhaul or servicing of aircraft, and there may be long-term deterioration in demand for air travel that could impact our business beyond the current COVID-19 health crisis. Customers may also continue to attempt to renegotiate contracts and obtain concessions, face financial constraints on their ability to make payments to us on a timely basis or at all, or enter into bankruptcy or discontinue their business operations, and we may continue to be required to discount the pricing of our products. In addition, unfavorable customer site conditions, such as closure of or access restrictions to customer facilities, and disruptions to our customers’ third-party logistics, warehousing, inventory management, and distribution services may continue to limit our ability to sell products, meet billing milestones, or provide services.
•Operations Risk—The closure of our facilities, restrictions inhibiting our employees’ ability to access those facilities, materials and labor shortages, and disruptions to the ability of our suppliers or service providers to deliver goods or services to us (including as a result of supplier facility closures or access restrictions, disruptions to their supply chains, and supplier liquidity or bankruptcy risk) could further disrupt our ability to provide our services and solutions and result in, among other things, higher costs which may not be recoverable under customer contracts, claims for liquidated damages in the event of delays, terminations of customer contracts and losses of revenue. Because the COVID-19 pandemic could adversely affect our near-term and long-term revenues, earnings, liquidity, and cash flows, we have taken and may be required to redeploy significant cost actions, including but not limited to reducing discretionary expenses (such as non-essential travel, contractors, and consultants), reducing hiring, canceling annual merit increases, reducing executive and board of director pay, reducing work schedules across the enterprise, shortening or staggering work schedules to match production with demand, and reducing staffing levels, as well as increasing supplier-based productivity and enhancing spending-limit controls. However, the extent to which our mitigation efforts are successful, if at all, is not currently ascertainable; also, our costs may not decrease at the same pace as revenue declines as many of our costs are less variable in nature, and we may not be able to or may not choose to significantly reduce them in an effort to remain focused on long-term outlook and growth opportunities. Further, our management of the impact of COVID-19 will continue to require significant investment of time from our management and employees, as well as resources across our global enterprise. The focus on managing and mitigating the impacts of COVID-19 on our business may cause us to divert or delay the application of our resources toward new initiatives or investments, which may adversely impact our future results of operations. Issues relating to the COVID-19 pandemic may also result in legal claims or litigation against us. In addition, remote work has increased the frequency of cybersecurity attacks, including phishing, and malware attempts that utilize COVID-19-related strategies, increasing the risk of a material cybersecurity incident that could result in the loss of proprietary or personal data, render us more vulnerable to future cybersecurity attacks, disrupt our operations, or otherwise cause us reputational or financial harm.
•Liquidity and Cash Flow Risk—Because of the customer and operations risks described above, our business may not continue to generate sufficient cash flow from operations in the future to service our debt and make necessary capital expenditures. If we are unable to generate such cash flow, we may need to use existing cash balances to service our debt, and if such balances are insufficient, then we may be required to engage in one or more alternatives, such as selling assets, restructuring of existing debt, issuing new debt, or obtaining additional equity capital on terms that may be onerous or highly dilutive. Our ability to refinance our indebtedness will depend on the capital markets and our financial condition at such time.
Due to the changing landscape of the COVID-19 pandemic and the responses to curb its spread, we cannot predict the ultimate impact the COVID-19 pandemic will have on our business, financial condition, results of operations, liquidity, and cash flow. Any recovery from the COVID-19 pandemic and related economic impact may be slowed or reversed by a variety of factors. In addition, even after the COVID-19 pandemic has subsided, we may continue to experience adverse impacts to our business as a result of its global economic impact, including any recession that may occur in the future. Further, many of the factors disclosed under Risk Factors in this Form 10-K are, and we anticipate will continue to be further, heightened or exacerbated by the impact of the COVID-19 pandemic.
A significant percentage of our sales and operations is in non-U.S. jurisdictions and is subject to the economic, political, regulatory, foreign exchange, and other risks of international operations.
Our international operations, including U.S. exports, represent more than half of the Company’s sales. Risks related to international operations include exchange control regulations, wage and price controls, fluctuations in foreign currency exchange rates, antitrust regulations, employment regulations, foreign investment laws, import, export, and other trade restrictions (such as sanctions and embargoes), differing levels of protection of intellectual property, acts of industrial espionage, violations by our employees of anti-corruption laws (despite our efforts to mitigate such risk), changes in regulations regarding transactions with state-owned enterprises, nationalization of private enterprises, acts of terrorism, acts of war, civil strife, and our ability to hire and maintain qualified staff and maintain the safety of our employees in these regions. Instability and uncertainties arising from the global geopolitical environment and the evolving international and domestic political, regulatory, and economic landscape, including the potential for changes in global trade policies, includingsuch as sanctions and trade barriers, and trends such as populism, economic nationalism, and negative sentiment toward multinational companies, as well as the cost of compliance with increasingly complex and often conflicting regulations worldwide, can impair our flexibility in modifying product, marketing, pricing, or other strategies for growing our businesses, as well as our ability to improve productivity and maintain acceptable operating margins.
30 Honeywell International Inc.
Existing free trade laws and regulations provide certain beneficial duties and tariffs for qualifying imports and exports. Changes in laws or policies governing the terms of foreign trade, and in particular increased trade restrictions, tariffs, or taxes on imports from countries where we manufacture products or from where we import products or raw materials, either directly or through our suppliers, could have an impact on our competitive position and financial results.
30 Honeywell International Inc.
The United StatesU.S. continues to implement certain trade actions, including imposing tariffs on certain goods imported from China and other countries, which has resulted in retaliatory tariffs by China and other countries. Additional tariffs, export controls, and sanctions laws imposed by the United StatesU.S. on a broader range of imports, or further retaliatory trade measures taken by China or other countries in response, could increase the cost of our products. The United States
In response to the conflict between Russia and Ukraine, the U.S. and other countries may implementimposed actions including trade actions, tariffs,sanctions, export and import controls, and sanctions,trade restrictions with respect to Russian and Belarusian governments, government-related entities, and other entities and individuals. Further, the Russian government implemented retaliatory actions against the U.S. and other nation members of the North Atlantic Treaty Organization (NATO) as well as certain other nations. Given the uncertainty inherent in our remaining obligations related to our contracts with Russian counterparties, we do not believe it is possible to develop estimates of reasonably possible loss in excess of current accruals for these matters. As the conflict continues to evolve, existing conditions may worsen, or other impacts, including escalation of the conflict in other regions of Europe where there is a material portion of our business, increased tension between Russia and the U.S. and other NATO members and other countries, or localities, including potentially against certain Russian government, government-related,other impacts that are unknown at this time, could lead to increased charges and could have a material adverse effect on our consolidated financial position. These impacts may result in increased costs or other entities or individuals related to actions in Ukraine, which along with any retaliatory measures could increase costs, adversely affectadditional impacts on our operations orand may adversely affect our ability to meet contractual and financial obligations.obligations, results of operations, and financial condition.
To the extent the current conflict between Russia and Ukraine escalates, it may also negatively impact other risk factors disclosed in this Form 10-K and further impact our financial results. Such risks include, but are not limited to, adverse effects on macroeconomic conditions, including inflation and consumer spending; cybersecurity incidents and other disruptions to our information technology infrastructure or that of our customers and suppliers, including disruptions at our cloud computing, server, systems, and other third party information technology (IT) service providers; adverse changes in international trade policies and relations; our ability to implement and execute our business strategy, particularly in Eastern Europe and surrounding regions; disruptions in global supply chains; energy shortages; terrorist activities targeting U.S. government contractors and/or critical infrastructure; our exposure to foreign currency fluctuations; and constraints, volatility, or disruption in the capital markets.
Operating outside of the United StatesU.S. also exposes us to foreign exchange risk, which we monitor and seek to reduce through hedging activities. However, foreign exchange hedging activities bear a financial cost and may not always be available to us or be successful in eliminating such volatility. Finally, we generate significant amounts of cash outside of the United StatesU.S. that is invested with financial and non-financial counterparties. While we employ comprehensive controls regarding global cash management to guard against cash or investment loss and to ensure our ability to fund our operations and commitments, a material disruption to the counterparties with whom we transact business could expose Honeywell to financial loss.
Operating outside the United StatesU.S. also exposes us to additional intellectual property risk. The laws and enforcement practices of certain jurisdictions in which we operate may not protect our intellectual property rights to the same extent as in the United StatesU.S. and may impose joint venture, technology transfer, local service or other foreign investment requirements, and restrictions that potentially compromise control over our technology and proprietary information. Failure of foreign jurisdictions to protect our intellectual property rights, an inability to effectively enforce such rights in foreign jurisdictions, or the imposition of foreign jurisdiction investment or sourcing restrictions or requirements could result in loss of valuable proprietary information and could impact our competitive position and financial results.
Risks related to our defined benefit pension plans may adversely impact our results of operations and cash flow.
Significant changes in actual investment return on pension assets, discount rates, and other factors could adversely affect our results of operations and require cash pension contributions in future periods. Changes in discount rates and actual asset returns different than our anticipated asset returns can result in significant non-cash actuarial gains or losses, which we record in the fourth quarter of each fiscal year, and, if applicable, in any quarter in which an interim re-measurement is triggered. With regard to cash pension contributions, funding requirements for our pension plans are largely dependent upon interest rates, actual investment returns on pension assets, and the impact of legislative or regulatory changes related to pension funding obligations.
OPERATIONAL RISKS
Raw material price fluctuations, inflation, the ability of key suppliers to meet quality and delivery requirements, or catastrophic events can increase the cost of our products and services, impact our ability to meet commitments to customers, and cause us to incur significant liabilities.
The cost of raw materials is a key element in the cost of our products, particularly in Performance Materials and Technologies (copper, fluorspar, tungsten salts, ethylene, aluminum, and molybdenum) and in Aerospace (nickel, steel, titanium, and other metals). As of December 31, 2021,2023, Aerospace and Performance Materials and Technologies had 80%85% and 63%64%, respectively,respectively, of raw materials supply base under contract. DueWhile we have implemented mitigation strategies to reduce the impact of supply chain constraints and labor shortages, including as a result of the ongoing COVID-19 pandemic, there have been recent inflationary trends in the cost of raw materials, including increases in labor and freight costs, for the transportation of raw materials. Ourdisruptions, any inability to source necessary materials when and as needed, offset materialmaterial price or labor inflation through increased prices to customers, formula-driven or long-term fixed price contracts with suppliers, productivity actions, or commodity hedges could adversely affect our results of operations.
31 Honeywell International Inc.
Many major components, product equipment items, and raw materials, particularly in Aerospace, are procured or subcontracted on a single or sole-source basis. Although we maintain a qualification and performance surveillance process and we believe that sources of supply for raw materials and components are generally adequate, it is difficult to predict what effects shortages or price increases, in addition to other supply chain disruptions, may have in the future. Our ability to manage inventory and meet delivery requirements may be constrained by our suppliers’ inability to scale production and adjust delivery of long-lead time products during times of volatile demand. In addition, current or future global economic uncertainty, including inflation and increased interest rates, supply chain and labor disruptions, unemployment rates, banking instability, any U.S. government shutdown, any downgrades in the ongoing COVID-19 pandemic,U.S. government's sovereign credit rating, public health crises, volatile financial markets, geopolitical instability and regional conflicts, and potential recession may affect the financial stability of our key suppliers or their access to financing, which may in turn affect their ability to perform their obligations to us. If one or more of our suppliers experiences financial difficulties, delivery delays, or other performance problems, our resulting inability to fill our supply needs would jeopardize our ability to fulfill obligations under commercial and government contracts, which could, in turn, result in reduced sales and profits, contract penalties or terminations, and damage to customer relationships.
Honeywell International Inc. 31
32 Honeywell International Inc.
RISK FACTORS
In an effort to reduce the impact of current and future supply chain disruptions, we have implemented short-term and long-term strategies to reduce the impact of such disruptions, including pricing actions, longer-term planning for constrained materials, material supply tracking tools, direct engagement with key suppliers to meet customer demand, and development of new or redesigned products that satisfy our product quality controls and engineering qualifications and/or any applicable regulatory requirements. We cannot provide any assurance that our mitigation strategies will continue to be successful, or that we will be able to alter our strategies or develop new strategies if and as needed.We may be unable to successfully execute or effectively integrate acquisitions, and divestitures may not occur as planned.
We regularly review our portfolio of businesses and pursue growth through acquisitions and seek to divest non-core businesses. We may not be able to complete transactions on favorable terms, on a timely basis, or at all. In addition, our results of operations and cash flows may be adversely impacted by (i) the failure of acquired businesses to meet or exceed expected returns, including risk of impairment; (ii) the failure to integrate multiple acquired businesses into Honeywell simultaneously and on schedule and/or to achieve expected synergies; (iii) the inability to dispose of non-core assets and businesses on satisfactory terms and conditions; and (iv) the discovery of unanticipated liabilities, labor relations difficulties, cybersecurity concerns, compliance issues, or other problems in acquired businesses for which we lack contractual protections, insurance or indemnities, or, with regard to divested businesses, claims by purchasers to whom we have provided contractual indemnification.
Our future growth is largely dependent upon our ability to develop new technologies and introduce new products that achieve market acceptance in increasingly competitive markets with acceptable margins.
Our future growth rate depends upon a number of factors, including our ability to (i) identify and evolve with emerging technological and broader industry trends, including technologies such as artificial intelligence and machine learning in our target end-markets;end markets; (ii) develop and maintain competitive products; (iii) defend our market share against an ever-expanding number of competitors, including many new and non-traditional competitors; (iv) enhance our products by adding innovative features that differentiate our products from those of our competitors and prevent commoditization of our products; (v) develop, manufacture, and bring compelling new products to market quickly and cost-effectively; (vi) monitor disruptive technologies and business models; (vii) achieve sufficient return on investment for new products introduced based on capital expenditures and research and development spending; (viii) respond to changes in overall trends related to end-marketend market demand; and (ix) attract, develop, and retain individuals with the requisite technical expertise and understanding of customers’ needs to develop new technologies and introduce new products. Competitors may also develop after-market services and parts for our products which attract customers and adversely affect our return on investment for new products. The failure of our technologies or products to gain market acceptance due to more attractive offerings by our competitors or the failure to address any of the above factors could significantly reduce our revenues and adversely affect our competitive standing and prospects.
Failure to increase productivity through sustainable operational improvements, as well as an inability to successfully execute repositioning projects or to effectively manage our workforce, may reduce our profitability or adversely impact our businesses.
Our profitability and margin growth are dependent upon our ability to drive sustainable improvements. We seek productivity and cost savings benefits through repositioning actions and projects, such as consolidation of manufacturing facilities, transitions to cost-competitive regions, and product line rationalizations. Risks associated with these actions include delays in execution, additional unexpected costs, realization of fewer than estimated productivity improvements, and adverse effects on employee morale. We may not realize the full operational or financial benefits we expect, the recognition of these benefits may be delayed, and these actions may potentially disrupt our operations. In addition, organizational changes, increased attrition, failure to create and implement a succession plan for key Company positions, not retaining key talent, inability to attract new employees with unique skills, trends in rising labor costs and labor availability, labor relations difficulties, or workforce stoppage could have a material adverse effect on our business, reputation, financial position, and results of operations. Additionally, certain personnel may be required to receive various clearances and substantial training in order to work on certain programs or perform certain tasks. Necessary security clearances may be delayed, which may impact our ability to perform on our U.S. government contracts. We also may not be successful in training or developing qualified personnel with the requisite relevant skills or security clearances.
32 Honeywell International Inc.
As a supplier to the U.S. government, we are subject to unique risks, such as the right of the U.S. government to terminate contracts for convenience and to conduct audits and investigations of our operations and performance.
U.S. government contracts are subject to termination by the government, either for the convenience of the government or for our failure to perform consistent with the terms of the applicable contract. Our contracts with the U.S. government are also subject to government audits that may recommend downward price adjustments and other changes. When appropriate and prudent, we made adjustments and paid voluntary refunds in the past and may do so in the future. In addition, U.S. government contracts are subject to congressional funding, which may be unavailable due to changes in priorities or subject to continuing resolution, which may result in funding reductions, eliminations, or other effects that could impact our business.
We are also subject to government investigations of business practices and compliance with government procurement and security regulations. If, as a result of any such investigation or other government investigations (including investigation of violations of certain environmental, employment, or export laws), Honeywell or one of its businesses were found to have violated applicable law, then it could be suspended from bidding on or receiving awards of new government contracts, suspended from contract performance pending the completion of legal proceedings, and/or have its export privileges suspended.
Honeywell International Inc. 33
Our operations and the prior operations of predecessor companies expose us to the risk of material environmental liabilities.
Mainly because of past operations and operations of predecessor companies, we are subject to potentially material liabilities related to the remediation of environmental hazards and to claims of personal injuries or property damages that may be caused by hazardous substance releases and exposures. We continue to incur remedial response and voluntary clean-up costs for site contamination and are a party to lawsuits and claims associated with environmental and safety matters, including past production of products containing hazardous substances. Additional lawsuits, claims, and costs involving environmental matters are likely to continue to arise in the future. Various federal, state, local, and foreign governments regulate the use of certain materials, the discharge of materials into the environment, and/or communications respecting certain materials in our products, and can impose substantial fines and criminal sanctions for violations, and require injunctive relief measures, including installation of costly equipment, implementation of operational changes to limit emissions and/or decrease the likelihood of accidental hazardous substance releases, or limiting access of our products to markets, among others. In addition, changes in laws, regulations and enforcement of policies, the discovery of previously unknown contamination or new technology or information related to individual sites, the establishment of stricter toxicity standards with respect to certain contaminants, or the imposition of new clean-up requirements or remedial techniques could require us to incur additional costs in the future that would have a negative effect on our financial condition or results of operations.
Cybersecurity incidents could disruptOur business, operations, result in the loss of critical and confidential information, and adversely impact our reputation, and resultsfinancial performance may be materially impacted by cybersecurity attacks on our information technology infrastructure and products.
Cybersecurity is a critical component of operations.
the Company’s enterprise risk management program. Global cybersecurity threats and incidents can range from uncoordinated individual attempts to gain unauthorized access to information technology (IT)IT systems to sophisticated and targeted measures known as advanced persistent threats, directed at the Company, its products, its customers, and/or its third party software and service providers, including cloud providers. Our customers, including the U.S. government, are increasingly requiring cybersecurity protections and mandating cybersecurity standards in our products, and we may incur additional costs to comply with such demands. While we have experienced, and expect to continue to experience, these types of threats and incidents, none of them to date have been material to the Company. We seek to deploy comprehensive measures to deter, prevent, detect, respond to, and mitigate these threats, including identity and access controls, data protection, vulnerability assessments, continuous monitoring of our IT networks and systems, and maintenance of backup and protective systems. Despite these efforts, cybersecurity incidents (against us, or parties with whom we contract)contract, or software used in our business), including incidents due to human error, third-party action, including actions of foreign actors, which risk may be exacerbated by the current Russia-Ukraine and Israel-Hamas conflicts and U.S. and international response, insider attacks, phishing or denial-of-service attacks, ransomware or other malware, social engineering, malfeasance, other unauthorized physical or electronic access, or other vulnerabilities, depending on their nature and scope, could potentially result in the misappropriation, destruction, corruption or unavailability of critical data and confidential or proprietary information (our own or that of third parties), theft of funds, and the disruption of business operations. In addition, the techniques used to obtain unauthorized access to sensitive data continue to evolve and become more sophisticated and may not be recognized until launched against a target; accordingly, we may be unable to anticipate these techniques or implement adequate preventative measures, and future cybersecurity incidents could go undetected and persist for an extended period of time. Furthermore, to the extent artificial intelligence capabilities improve and are increasingly adopted, they may be used to identify vulnerabilities and craft increasingly sophisticated cybersecurity attacks, and vulnerabilities may be introduced from the use of artificial intelligence by us, our financial services providers and other vendors and third-party providers.
Our customers, partners (including our suppliers), subcontractors, and other third parties to whom we entrust confidential data, and on whom we rely to provide products and services, face similar threats and growing requirements. We depend on such parties to implement adequate controls and safeguards to protect against and report cyber incidents. If such parties fail to deter, detect, or report cybersecurity incidents in a timely manner, we may suffer from financial and other harm, including to our information, operations, performance, employees, and reputation.
33 Honeywell International Inc.
The potential consequences of a material cybersecurity incident and its effects include financial loss, reputational damage, litigation with third parties, theft of intellectual property, fines levied by the Federal Trade Commission or other government agencies, diminution in the value of our investment in research, development, and engineering, and increased cybersecurity protection and remediation costs due to the increasing sophistication and proliferation of threats, which in turn could adversely affecthave a material impact on our competitiveness, business, financial condition, and results of operations. In addition, cybersecurity laws and regulations continue to evolve, and are increasingly demanding, both in the U.S. and globally, which adds compliance complexity and may increase our costs of compliance and expose us to reputational damage or litigation, monetary damages, regulatory enforcement actions, or fines in one or more jurisdictions. While we carry cyber insurance, weWe cannot be certain that our cybersecurity insurance coverage will be adequate for liabilities actually incurred, that insurance will continue to be available to us on economically reasonable terms, or at all, or that any insurer will not deny coverage as to any future claim.
The development of technology products and services presents security and safety risks.
An increasing number of our products, services, and technologies are delivered with Internet of Things (IoT) capabilities and the accompanying interconnected device networks, which include sensors, data, and advanced computing capabilities. We have developed product software designs that we believe are less susceptible to cyber-attacks, but despite these efforts, if our products and services that include IoT solutions do not work as intended or are compromised, the possible consequences include financial loss, reputational damage, exposure to legal claims or enforcement actions, theft of intellectual property, and diminution in the value of our investment in research, development, and engineering, which in turn could adversely affect our competitiveness and results of operations.
34 Honeywell International Inc.
Data privacy, data protection, and information security may require significant resources and present certain risks.
We collect, store, have access to, and otherwise process certain confidential or sensitive data, including proprietary business information, personal data, or other information that is subject to data privacy and security laws, regulations, and/or customer-imposed controls.contractual obligations with third parties. Despite our efforts to protect such data, we may be vulnerable to material security breaches, theft, misplaced or lost data, programming errors, or employeehuman errors that could potentially lead to the compromisingcompromise of such data, improper use of our products, systems, software solutions, or networks, unauthorized access, use, disclosure, modification, or destruction of information,data, defective products, production downtimes, and operational disruptions. A significant actual or perceived risk of theft, loss, fraudulent use or misuse of customer, employee, or other data, whether by us, our suppliers, channel partners, customers, or other third parties, as a result of employee error or malfeasance, or as a result of the imaging, software, security, and other products we incorporate into our products, as well as non-compliance with applicable industry standards or our contractual or other legal obligations or privacy and information security policies regarding such data, could result in costs, fines, litigation, or regulatory actions, or could lead customers to select the products and services of our competitors. In addition, we operate in an environment in which there are different and potentially conflicting data privacy laws in effect in the various U.S. states and foreign jurisdictions in which we operate, and we must understand and comply with each law and standard in each of these jurisdictions while also ensuring the data is secure. For example, EuropeanMany of these laws require us to have an approved legal mechanism to transfer personal data out of Europe; the European Union General Data Protection Regulation, which became enforceable in May 2018, superseded prior European Union data protection legislation and imposes moreimpose stringent requirements inas to how we collect, store, maintain, transfer, and otherwise process personal data and provides for significantly greaterprovide significant or material penalties for noncompliance; and several other states and countriesnoncompliance. Many jurisdictions have passed or are considering laws that require personal data relating to their residents or citizens to be maintained or replicated on local servers andor impose additionalspecific obligations related to extraterritorial data transfer restrictions.transfers. Government enforcement actions can be costly and interrupt the regular operation of our business, and actual or alleged violations of such laws, including in relation to the Company’s processing of personal data privacy lawsor adoption of emerging technologies such as artificial intelligence and machine learning, can result in fines, reputational damage, and civil lawsuits, any of which may adversely affect our business, reputation, and financial statements.
A material disruption of our operations, particularly at our manufacturing facilities or within our information technologyIT infrastructure, could adversely affect our business.
Our facilities, supply chains, distribution systems, and information technologyIT systems are subject to catastrophic loss due to natural disasters or other weather-related disruptions, including hurricanes and floods, which may be exacerbated by the effects of climate change, power outages, fires, explosions, terrorism, equipment failures, sabotage, cyber incidents, any potential effects of climate change and adverse weather conditions, including water scarcity and rising sea levels, labor disputes, critical supply failure, inaccurate downtime forecast, political disruption and regional conflicts, public health crises, like a regional or global pandemic, and other reasons, which can result in undesirable consequences, including financial losses and damaged relationships with customers. The ongoing COVID-19 pandemic has disrupted and may continue to disrupt our supply chain, distribution channels, production facilities, operations and customer demand, which has negatively impacted our operations and adversely affected our business and could continue to do so. We employ information technologyIT systems and networks to support the business and rely on them to process, transmit and store electronic information, and to manage or support a variety of business processes and activities. DisruptionsAlthough preventative measures may help to mitigate damage, such measures could be costly, and disruptions to our information technologymanufacturing facilities or IT infrastructure from system failures, shutdowns, power outages and energy shortages, telecommunication or utility failures, cybersecurity incidents, and other events, including disruptions at our cloud computing, server, systems, and other third party IT service providers, could interfere with our operations, interrupt production and shipments, damage customer and business partner relationships, and negatively impact our reputation.In addition, the insurance we maintain may not be adequate to cover our losses resulting from any business interruption, including those resulting from a natural disaster or other severe weather event, and recurring extreme weather events or other adverse events could reduce the availability or increase the cost of insurance.
34 Honeywell International Inc.
Concentrations of credit, counterparty, and market risk may adversely affect our results of operations and financial condition.
We maintain long-term contractual relationships with many of our customers, suppliers, and other counterparties. While we monitor the financial health of these counterparties, we are exposed to credit and market risks of such counterparties, including those concentrated in the same or similar industries and geographic regions. Changes in political and economic conditions including the impact of the COVID-19 pandemic, could also lead to concerns about the creditworthiness of counterparties and their ability to pay in the same or similar industry or geography, impacting our ability to renew our long-term contractual arrangements or collect amounts due under these arrangements. Among other factors, geopolitical events, inflation, rising interest rates, banking instability, and changes in economic conditions, including an economic downturn or recession, could also result in the credit deterioration or insolvency of a significant counterparty.
Honeywell International Inc. 35
We are impacted by increasing stakeholder interest in public company performance, disclosure, and goal-setting with respect to environmental, social, and governance (ESG) matters.
In response to growing customer, investor, employee, governmental, and other stakeholder interest in our ESG practices, including our procedures, standards, performance metrics, and goals, we have increased reporting of our ESG programs and performance and have established and announced goals and other objectives related to ESG matters. These goal statements reflect our current plans and aspirations and are not guarantees that we will be able to achieve them. Our ability to achieve any goal or objective, including with respect to ESG initiatives, is subject to numerous risks, many of which are outside of our control. Examples of such risks include: (1)(i) the availability and cost of low- or non-carbon-based energy sources and technologies, (2)(ii) evolving regulatory requirements affecting ESG standards or disclosures, (3)(iii) the availability of suppliers that can meet our sustainability, diversity and other standards, (4)(iv) our ability to recruit, develop, and retain diverse talent in our labor markets, and (5)(v) the impact of our organic growth and acquisitions or dispositions of businesses or operations. In addition, standards for tracking and reporting on ESG matters have not been harmonized and continue to evolve. Our processes and controls for reporting of ESG matters may not always comply with evolving and disparate standards for identifying, measuring, and reporting ESG metrics, our interpretation of reporting standards may differ from those of others, and such standards may change over time, any of which could result in significant revisions to our performance metrics, goals, or reported progress in achieving such goals. In addition, certain of our products and services, including offerings in our Defense and Space business unit, are unattractive to certain investors and may cause us to be increasingly subject to ESG-driven investment practices that preclude investment in our debt and equity. On the other hand, some investors have a negative response to ESG practices as a result of anti-ESG sentiment and may choose not to invest in us, or divest in their holdings of us, as a result of our ESG practices and initiatives.
If our ESG practices or business portfolio do not meet evolving investor or other stakeholder expectations and standards, then our reputation, our ability to attract or retain employees, and our attractiveness as an investment, supplier, business partner, or acquiror could be negatively impacted. In addition, ourOur failure or perceived failure to pursue or fulfill our goals, targets, and objectives or to satisfy various reporting standards within the timelines we announce, or at all, could have similar negative impacts and expose us to government enforcement actions and private litigation.
Global climate change and related regulations and changes in customer demand could negatively affect our operations and our business.
The effects of climate change could create financial risks to our business. For example, the effects of physical impacts of climate change could disrupt our operations by impacting the availability and cost of materials needed for manufacturing, exacerbate existing risks to our supply chain, disrupt our operations, and increase insurance and other operating costs. These factors may impact our decisions to construct new facilities or maintain existing facilities in areas most prone to physical climate risks. We could also face indirect financial risks passed through the supply chain and disruptions that could result in increased prices for our products and the resources needed to produce them.
The growing focus on addressing global climate change has resulted in more regulations designed to reduce GHG emissions and more customer demand for products and services that have a lower carbon footprint or that help businesses and consumers reduce carbon emissions throughout their value chains. These regulations tend to be implemented under global, national and sub-national climate objectives or policies, and target the global warming potential of refrigerants, energy efficiency, and the combustion of fossil fuels. Although we offer and continue to invest in developing solutions that help our customers meet their carbon reduction and sustainability goals, many of our products combust fossil fuels, consume energy, and use refrigerants. Regulations and carbon reduction goals which seek to reduce GHG emissions could reduce demand for such products and present a risk to our business. We may be required to further increase research and development and other capital expenditures in order to develop offerings that meet these new regulations, standards, and customer demands. There can be no assurance that our new product development efforts will be successful, that our products will be accepted by the market, or that economic returns will reflect our investments in new product development.
35 Honeywell International Inc.
LEGAL AND REGULATORY RISKS
Our U.S. and non-U.S. tax liabilities are dependent, in part, upon the distribution of income among various jurisdictions in which we operate.operate, as well as changes in tax law or regulation.
Our future results of operations could be adversely affected by changes in the effective tax rate as a result of a change in the mix of earnings in countries with differing statutory tax rates, changes in tax laws, (e.g., potential tax law changes in the United States to increase the U.S. Corporate tax rate), regulations and judicial rulings (or changes in the interpretation thereof), potential taxation of digital services, changes in generally accepted accounting principles, changes in the valuation of deferred tax assets and liabilities, changes in the amount of earnings permanently reinvested offshore, the results of audits and examinations of previously filed tax returns and continuing assessments of our tax exposures, and various other governmental enforcement initiatives. Our tax expense includes estimates of tax reserves and reflects other estimates and assumptions, including assessments of future earnings of the Company, which could impact the valuation of our deferred tax assets. In addition, our future effective tax rates could be subject to volatility or adversely affected by changes in tax laws, regulations, accounting principles, or interpretations thereof.
The Organisation for Economic Co-operation and Development (OECD)/G20 and other invited countries, developed a global tax framework inclusive of a 15% global minimum tax under the Pillar Two Global Anti-Base Erosion Rules (Pillar Two). On December 15, 2022, the Council of the European Union (EU) formally adopted the OECD’s framework to achieve a coordinated implementation amongst EU Member States consistent with EU law. The EU’s Pillar Two Directive effective dates are January 1, 2024, and January 1, 2025, for different aspects of the directive. Other major jurisdictions are actively considering and implementing changes to their tax laws to adopt certain parts of the OECD’s proposals. We have assessed this framework and determined, based upon available guidance, that these changes will not have a material impact to our results of operations. Any future changes in OECD guidance or interpretations, including local country tax legislative changes thereof, could impact our initial assessment; therefore, we will continue to monitor and refine our assessment as further guidance is made available.
Changes in legislation or government regulations or policies can have a significant impact on our results of operations.
The sales and margins of each of our reportable business segments are directly impacted by government regulations, including environmental, safety, performance, and product certification regulations. Within Aerospace, the operating results of Commercial Aviation Original Equipment and Commercial Aviation Aftermarket may be impacted by, among other things, mandates of the Federal Aviation Administration and other similar international regulatory bodies requiring the installation of equipment on aircraft. Our Defense and Space business unit may be affected by changes in government procurement regulations. Within Honeywell Building Technologies and Safety and Productivity Solutions, the demand for and cost of providing products, services and solutions can be impacted by fire, security, safety, health care, environmental, and energy efficiency standards and regulations. Performance Materials and Technologies’ results of operations can be impacted by environmental and health standards, regulations, and judicial determinations,. including potential per/polyfluoroalkyl substances (PFAS) legislation and regulations that, if adopted, could impact the sale of certain products in our Advanced Materials business unit, without fully assessing level of risk or environmental impact. Growth in all our businesses within emerging markets may be adversely impacted by the inability to acquire and retain qualified employees where local employment law mandates may be restrictive. Changes in such regulations and government policies could negatively impact us; for instance, noncompliance with legislation and regulations can result in fines and penalties, and compliance with any new regulations or policies may be burdensome and/or require significant expenditures.
Increased focus and evolving views of lawmakers on climate change and other ESG issues could have a long-term impact on our business and result of operations.
Increased public awareness and concern regarding global climate change and other ESG matters may result in more international, regional, and/or federal regulatory or other stakeholder requirements or expectations that could mandate more restrictive or expansive standards, such as stricter limits on greenhouse gasGHG emissions or more prescriptive reporting of environmental, social, and governanceESG metrics, practices, and targets, than the voluntary commitments that the Company has adopted or require such changes on a more accelerated time frame. There continues to be a lack of consistent climate and other ESG legislation, which creates economic and regulatory uncertainty; however, there has been an increasing amount of legislative and regulatory activity, particularly in the European Union, United Kingdom, and U.S. If environmental lawsIn addition, there is also an increasing number of state-level anti-ESG initiatives in the U.S. that may conflict with other regulatory requirements, resulting in regulatory uncertainty. New or regulations are either changed or adoptedrevised legal and regulatory requirements could impose significant operational restrictions and compliance requirements upon the Company or its products, theyand could negatively impact the Company’s business, capital expenditures, results of operations, financial condition, and competitive position.
36 Honeywell International Inc.
We cannot predict with certainty the outcome of litigation matters, government proceedings and other contingencies and uncertainties.
We are currently, and may in the future become, subject to a number of lawsuits, fines, investigations, and disputes (some of which involve substantial amounts claimed) arising out of the conduct of our business, including matters relating to commercial transactions, government contracts, product liability (including asbestos), the integration of emerging technologies (such as, but not limited to, artificial intelligence and machine learning), prior acquisitions and divestitures, employment, employee benefits plans, intellectual property, antitrust, anti-corruption, accounting, import and export, and environmental, health, and safety matters. Our potential liabilities are subject to change over time due to new developments, changes in settlement strategy or the impact of evidentiary requirements, and we may become subject to or be required to pay damage awards or settlements that could have a material adverse effect on our results of operations, reputation, cash flows, and financial condition. While we maintain insurance for certain risks, the amount of our insurance coverage may not be adequate to cover the total amount of all insured claims and liabilities. The incurrence of significant liabilities for which there is no or insufficient insurance coverage could adversely affect our results of operations, cash flows, liquidity, and financial condition. See Note 19 Commitments and Contingencies of Notes to Consolidated Financial Statements for further discussion regarding the uncertainty associated with asbestos-related liabilities.
Vaccine mandates applicable to us, including the U.S. presidential executive order concerning mandatory COVID-19 vaccination of U.S.-based employees of companies that work on or in support of federal contracts could have a material adverse impact on our business and results of operations.
On September 9, 2021, President Biden issued an executive order for U.S. government contractors to mandate vaccination against COVID-19. The executive order covers U.S.-based employees at work locations that directly work on or in support of contracts with the U.S. government. On December 7, 2021, the U.S. District Court for the Southern District of Georgia imposed a nationwide injunction of the executive order, temporarily staying all requirements in the executive order. The District Court’s order was appealed to the Eleventh Circuit Court of Appeals, which declined to lift the injunction. It is expected that the U.S. government will appeal the stay to the United States Supreme Court. We implemented a vaccine mandate requiring all U.S.-based employees at work locations that work on or in support of contracts with the U.S. government to receive their first vaccine dose, or a medical or religious exemption, by January 4, 2022. Employees who did not satisfy these requirements, which represented less than 1% of eligible employees, were placed on unpaid leave effective January 10, 2022, and were terminated if they had not taken steps to comply by January 28, 2022. The Company has adopted a vaccine mandate for all U.S.-based prospective and future employees.
In addition, on September 9, 2021, President Biden announced that he directed the OSHA to develop an ETS mandating either the full vaccination or weekly testing of employees for employers with 100 or more employees. The OSHA ETS was published in the federal register on November 5, 2021, and mandates that employees of employers with 100 or more employees either become fully vaccinated by receiving the final dose of an approved COVID-19 vaccine on or before January 4, 2022, or undergo weekly testing. On January 13, 2022, the U.S. Supreme Court re-imposed a stay of the ETS and returned the case to the Sixth Circuit Court of Appeals. The majority of the Supreme Court held that the challengers to the ETS were likely to prevail on the merits because OSHA exceeded its statutory authority. While the Supreme Court’s ruling enjoined OSHA from imposing its mandate, the ruling has no impact on the ability of private employers to impose their own vaccine mandate. On January 25, 2022, OSHA announced it was withdrawing the ETS as a result of the U.S. Supreme Court ruling. However, Honeywell has implemented a vaccine mandate for its U.S. employees who were not subject to the executive order described in the above paragraph.
Additional vaccine mandates, or the requirement for employees to receive vaccine booster doses, may be announced in other jurisdictions in which our businesses operate. Our implementation of existing or additional vaccine mandates may result in attrition, including attrition of critically skilled labor, and difficulty securing future labor needs, which could have a material adverse effect on our business, financial condition, and results of operations.
37 Honeywell International Inc.37
QUANTITATIVE AND QUALITATIVE DISCLOSURES ABOUT MARKET RISKS
Information relating to market risks is included within Liquidity and Capital Resources of our Form 10-K under the caption “Financial Instruments”.Instruments.”
38 Honeywell International Inc.
LIQUIDITY AND CAPITAL RESOURCES
(Dollars in tables in millions)
We continue to manage our businesses to maximize operating cash flows as the primary source of liquidity. Each of our businesses is focusedfocus on increasing operating cash flows through revenue growth, margin expansion, and improved working capital turnover. Additional sources of liquidity include committed credit lines, short-term debt from the commercial paper market, long-term borrowings, access to the public debt and equity markets, U.S. cash balances, and the ability to access non-U.S. cash balances.balances, short-term debt from the commercial paper market, long-term borrowings, committed credit lines, and access to the public debt and equity markets.
CASH
As of December 31, 2023, and 2022, we held $8.1 billion and $10.1 billion, respectively, of cash and cash equivalents, including our short-term investments. We monitor the third-party depository institutions that hold our cash and cash equivalents on a daily basis. Our emphasis is primarily safety of principal and secondarily maximizing yield of those funds. We diversify our cash and cash equivalents among counterparties to minimize exposure to any one of these entities. counterparty.
As of December 31, 2021 and 2020, we held $11.52023, $5.9 billion and $15.2 billion, respectively, of the Company’s cash, and cash equivalents, including ourand short-term investments.
BORROWINGS
Consolidated total borrowingsinvestments were $19.6 billion and $22.4 billion as of December 31, 2021 and 2020, respectively.
| | | | | | | | | | | | | | |
| December 31, |
| 2021 | 2020 |
| Commercial paper and other short-term borrowings | | $ | 3,542 | | | $ | 3,597 | |
| Variable rate notes | | 622 | | | 1,122 | |
| Fixed rate notes | | 15,314 | | | 17,399 | |
| Other | | 121 | | | 266 | |
| Total borrowings | | $ | 19,599 | | | $ | 22,384 | |
A source of liquidity isheld by non-U.S. subsidiaries. We do not have material amounts related to any jurisdiction subject to currency control restrictions that impact our ability to access and repatriate such amounts. Under current laws, we do not expect taxes on repatriation or restrictions on amounts held outside of the commercial paper market. Commercial paper notes are sold at a discount or premium andU.S. to have a maturity of not more than 365 days from date of issuance. Borrowings under the commercial paper program are available for general corporate purposes as well as for financing acquisitions. The weighted average interest rate on commercial paper and other short-term borrowings outstanding were 0.07% and 0.27% as of December 31, 2021 and 2020.
We also have the following revolving credit agreements:
•A $1.5 billion 364-Day Credit Agreement (the 364-Day Credit Agreement) with a syndicate of banks, dated March 31, 2021, and amended on November 18, 2021. This 364-Day Credit Agreement is maintained for general corporate purposes. The 364-Day Credit Agreement replaced the 364-day credit agreement dated as of April 10, 2020, which was terminated on March 31, 2021. As of December 31, 2021, there were no outstanding borrowings under our 364-Day Credit Agreement.
•A $4.0 billion Five Year Credit Agreement (the 5-Year Credit Agreement) with a syndicate of banks, dated March 31, 2021, and amended on November 18, 2021. This 5-Year Credit Agreement is maintained for general corporate purposes. Commitments under the 5-Year Credit Agreement can be increased pursuant to the terms of the 5-Year Credit Agreement to an aggregate amount not to exceed $4.5 billion. The 5-Year Credit Agreement amended and restated the previously reported $4.0 billion amended and restated five-year credit agreement dated as of April 26, 2019. As of December 31, 2021, there were no outstanding borrowings under our 5-Year Credit Agreement.
We also have a current shelf registration statement filed with the SEC under which we may issue additional debt securities, common stock, and preferred stock that may be offered in one or more offerings on terms to be determined at the time of the offering. We anticipate that net proceeds of any offering would be used for general corporate purposes, including repayment of existing indebtedness, share repurchases, capital expenditures and acquisitions.
Honeywell International Inc. 39
LIQUIDITY AND CAPITAL RESOURCES
CREDIT RATINGS
Our ability to access the global debt capital markets and the related cost of these borrowings, is affected by the strength of our credit rating and market conditions. Our credit ratings are periodically reviewed by the major independent debt-rating agencies. As of December 31, 2021, S&P Global Inc. (S&P), Fitch Ratings Inc. (Fitch), and Moody’s Investor Service (Moody's) have ratingsmaterial effect on our debt set forth in the table below:
| | | | | | | | | | | | | | | | | |
| S&P | | Fitch | | Moody's |
Outlook | Stable | | Stable | | Stable |
Short-term | A-1 | | F1 | | P1 |
Long-term | A | | A | | A2 |
overall liquidity.CASH FLOW SUMMARY
Our cash flows from operating, investing, and financing activities, as reflected in the Consolidated Statement of Cash Flows, are summarized as follows:
| | | | | | | | | | | | | | | | | | | | |
| | Years Ended December 31, |
| 2021 | 2020 | 2019 |
| Cash provided by (used for): | | | | | | |
| Operating activities | | $ | 6,038 | | | $ | 6,208 | | | $ | 6,897 | |
| Investing activities | | (1,061) | | | (987) | | | (533) | |
| Financing activities | | (8,254) | | | (81) | | | (6,600) | |
| Effect of exchange rate changes on cash | | (39) | | | 68 | | | 16 | |
| Net increase (decrease) in cash and cash equivalents | | $ | (3,316) | | | $ | 5,208 | | | $ | (220) | |
| | | | | | | | | | | | | | | | | | | | | | | | | | | | | |
| | Years Ended December 31, |
| 2023 | | 2022 | | Change 2023 vs. 2022 | | 2021 | | Change 2022 vs. 2021 |
| Cash and cash equivalents at beginning of period | $ | 9,627 | | | $ | 10,959 | | | $ | (1,332) | | | $ | 14,275 | | | $ | (3,316) | |
| | | | | | | | | |
| Operating activities | | | | | | | | | |
| Net income attributable to Honeywell | 5,658 | | | 4,966 | | | 692 | | | 5,542 | | | (576) | |
| Noncash adjustments | 1,980 | | | 1,946 | | | 34 | | | 971 | | | 975 | |
| Changes in working capital | (150) | | | (1,334) | | | 1,184 | | | 51 | | | (1,385) | |
| NARCO Buyout payment | (1,325) | | | — | | | (1,325) | | | — | | | — | |
| Other operating activities | (823) | | | (304) | | | (519) | | | (526) | | | 222 | |
| Net cash provided by operating activities | 5,340 | | | 5,274 | | | 66 | | | 6,038 | | | (764) | |
| Net cash used for investing activities | (1,293) | | | (93) | | | (1,200) | | | (1,061) | | | 968 | |
| Net cash used for financing activities | (5,763) | | | (6,330) | | | 567 | | | (8,254) | | | 1,924 | |
| Effect of foreign exchange rate changes on cash and cash equivalents | 14 | | | (183) | | | 197 | | | (39) | | | (144) | |
| Net increase (decrease) in cash and cash equivalents | (1,702) | | | (1,332) | | | (370) | | | (3,316) | | | 1,984 | |
| Cash and cash equivalents at end of period | $ | 7,925 | | | $ | 9,627 | | | $ | (1,702) | | | $ | 10,959 | | | $ | (1,332) | |
2021 compared with 202038 Honeywell International Inc.
Cash | | | | | |
| LIQUIDITY AND CAPITAL RESOURCES |
Year ended December 31, 2023
Net cash provided by operating activities decreased primarilywas $5,340 million, driven by $5,658 million of Net income attributable to Honeywell, adjusted for $1,176 million of depreciation and amortization, and a $518 million increase from Accounts payable, due to an unfavorable impact to working capital,increased material receipts and lower disbursements, partially offset by the $1,325 million payment pursuant to the NARCO Amended Buyout Agreement and a $626 million increase in Inventories, due to increased purchases.
Net cash used for investing activities was $1,293 million, driven by $1,039 million of capital expenditures and $718 million cash paid for acquisitions, partially offset by a $411 million net income attributabledecrease in investments.
Net cash used for financing activities was $5,763 million, driven by $3,715 million of repurchases of common stock, $2,855 million of cash dividends paid, and $1,731 million of payments of long-term debt, partially offset by $2,986 million of proceeds from issuance of long-term debt.
2023 compared with 2022
Net cash provided by operating activities increased by $66 million due to Honeywell during 2021,cash generated from operations, which excludesincluded a favorable impact of working capital and the 2020 non-cash charges associated withHWI Net Sale Proceeds of $275 million. The favorable impact of working capital was driven by a $697 million decrease in Accounts receivable, due to higher cash receipts, and a $673 million increase in Accounts payable, due to increased material receipts and lower disbursements. This was partially offset by the reduction in value$1,325 million payment pursuant to the NARCO Amended Buyout Agreement and $203 million payment for the settlement of the reimbursement receivables due from Garrett Motion Inc. (Garrett).UOP Matters.
CashNet cash used for investing activities increased by $74$1,200 million primarily due to a $1,065$540 million increase in cash paid for acquisitions, net$409 million of cash acquired, and $120 million net increase in investments, partially offset by $586 million cash receipts from Garrett $341Motion Inc. (Garrett) in 2022, and a $363 million increasedecrease in cash receipts from settlements of derivative contracts, and $203partially offset by a $367 million net decrease in proceeds from the sale of the retail footwear business.investments.
CashNet cash used for financing activities increaseddecreased by $8,173$567 million primarily due to a $7,608$485 million decrease in proceeds from the issuancerepurchases of long-term debtcommon stock and a $609$119 million increasedecrease in repaymentspayments of long-term debt, partially offset by a decrease$136 million increase in repurchasescash dividends paid.
See Note 19 Commitments and Contingencies of common stock of $334 million.
40 Honeywell International Inc.
LIQUIDITY AND CAPITAL RESOURCES
Notes to Consolidated Financial Statements for additional information on the NARCO Amended Buyout Agreement, HWI Net Sale Proceeds, and UOP Matters.CASH REQUIREMENTS AND ASSESSMENT OF CURRENT LIQUIDITY
In addition to our normal operating cash requirements, our principal future cash requirements will be to fund capital expenditures, share repurchases, dividends, strategic acquisitions, and debt repayments. Specifically, we expect our primary cash requirements in 20222024 to be as follows:
•Capital expenditures—we expect to spend approximately $1.2$1.1 billion for capital expenditures in 20222024 primarily for growth, production and capacity expansion, implementation of cost reduction measures, maintenance, and replacement.
•Share repurchases—under our share repurchase program, $7.1 billion was available as of December 31, 20212023, for additional share repurchases.repurchases as authorized by the Board of Directors on April 24, 2023. We expect to repurchase outstanding shares from time to time to offset the dilutive impact of employee stock-based compensation plans, including option exercises, restricted unit vesting and matching contributions under our savings plans. Additionally, we will seek to reduce share count via share repurchases as and when attractive opportunities arise. The amount and timing of future repurchases may vary depending on market conditions and our level of operating, financing, and other investing activities.
•Mergers and acquisitions—we expect to spend $5.0 billion to complete the acquisition of Carrier Global Corporation's Global Access Solutions business, as announced on December 8, 2023, subject to customary closing conditions, including receipt of certain regulatory approvals. We expect to evaluate and undertake other actions to optimize our portfolio, including executing on strategic bolt-on acquisitions over the course of 2024.
•Dividends—we increased our quarterly dividend rate by 5% to $0.98$1.08 per share of common stock effective with the fourth quarter 20212023 dividend. We intend to continue to pay quarterly dividends in 2022.2024.
We continue to identifycontinually seek opportunities to improve our liquidity and working capital efficiency, which includes the extension of payment terms with our suppliers. In addition, multiplewe maintain agreements with third-party financial institutions that offer a voluntary supply chain financing (SCF) program which enables ourprograms to suppliers. The SCF programs enable suppliers, at their sole discretion, to sell their receivables from the Company to thesethird-party financial institutions in order to receive payment on receivables earlier than the negotiated commercial terms between us and our suppliers. Supplier sale of receivables to third-party financial institutions is on terms that are negotiated between the supplier and the respective third-party financial institution. We agree on commercial terms for the goods and services we procure from our suppliers, including prices, quantities, and payment terms, which normally range between 60 and 120 days, regardless of whether the supplier elects to participate in the SCF program. Ourprograms. A suppliers’ voluntary participation in the SCF programprograms has no bearing on our payment terms and we have no economic interest in a supplier’s decision to participate in the SCF program.programs. We agree to pay participating third-party financial institutions the stated amounts of confirmed invoices from suppliers on the original maturity dates of the invoices.
39 Honeywell International Inc.
| | | | | |
| LIQUIDITY AND CAPITAL RESOURCES |
Amounts dueoutstanding related to our suppliers that elected to participate in the SCF programs are included in Accounts payable onin the Consolidated Balance Sheet. At December 31, 2021,2023, Accounts payable included approximately $700$1,112 million payable to suppliers who have elected to participate in the SCF program.programs. Amounts settled with third-party financial institutions through the SCF programprograms increased approximately $300$700 million for the year ended December 31, 2021.2023. The increase for the year ended December 31, 2021,2023, reflects a combination of an extension of payment terms with suppliersincreased enrollment and increased utilization of our SCF program.programs. All activity related to amounts due to suppliers that elected to participate in the SCF programprograms is reflected in Cash flows from operating activities in our Consolidated Statement of Cash Flows. While access to SCF could decrease if our credit ratings are downgraded, we do not believe that changes in the availability of SCF will have a significant impact on our liquidity. The impact of this programthese programs is not material to our overall liquidity.
We sell trade receivables to unaffiliated financial institutions withoutwith limited or no recourse. Transfers of the receivables are accounted for as sales and, accordingly, receivables sold are excluded from Accounts receivable—net onin the Consolidated Balance Sheet and are reflected in Cash flows from operating activities onin the Consolidated Statement of Cash Flows. The difference between the carrying amount of the trade receivables sold and the cash received is recorded in Cost of products and services sold onin the Consolidated Statement of Operations. The impact of this program is not material to our overall liquidity.
Finally, we continue to assess the relative strength of each business in our portfolio as to strategic fit, market position, profit, and cash flow contribution in order to identify target investment and acquisition opportunities in order to upgrade our combined portfolio. We identify acquisition candidates that will further our strategic plan and strengthen our existing core businesses. We also identify businesses that do not fit into our long-term strategic plan based on their market position, relative profitability, or growth potential. These businesses are considered for potential divestiture, restructuring, or other repositioning actions, subject to regulatory constraints.
In early 2023, we made payments of approximately $1.5 billion in connection with the NARCO Buyout and UOP Matters. Pursuant to the NARCO Amended Buyout Agreement, in 2023 we received proceeds from the HWI Sale in the amount of $275 million. See Note 12 Fair Value Measurements of Notes to Consolidated Financial Statements for additional discussion related to the fair value of future proceeds from the HWI Sale.
Based on past performance and current expectations, we believe that our operating cash flows will be sufficient to meet our future operating cash needs. Our available cash, committed credit lines, and access to the public debt and equity markets provide additional sources of short-term and long-term liquidity to fund current operations, debt maturities, and future investment opportunities.
See Note 9 Long-term Debt and Credit Agreements of Notes to Consolidated Financial Statements for additional discussion of items impacting our liquidity.
We leverage a variety of debt instruments to manage our overall borrowing costs. As of December 31, 2023, and 2022, our total borrowings were $20.4 billion and $19.6 billion, respectively.
| | | | | | | | | | | |
| December 31, |
| 2023 | | 2022 |
| Commercial paper | $ | 2,083 | | | $ | 2,715 | |
| Variable rate notes | 22 | | | 22 | |
| Fixed rate notes | 18,530 | | | 17,086 | |
| Other | 219 | | | 267 | |
| Fair value of hedging instruments | (166) | | | (287) | |
| Debt issuance costs | (245) | | | (233) | |
| Total borrowings | $ | 20,443 | | | $ | 19,570 | |
A primary source of liquidity is our ability to access the corporate bond markets. Through these markets, we issue a variety of long-term fixed rate notes, in a variety of currencies, to manage our overall funding costs.
Another primary source of liquidity is our ability to access the commercial paper market. Commercial paper notes are sold at a discount or premium and have a maturity of not more than 365 days from date of issuance. Borrowings under the commercial paper program are available for general corporate purposes as well as for financing acquisitions. The weighted average interest rate on commercial paper and other short-term borrowings outstanding was 4.29% and 3.29% as of December 31, 2023, and 2022, respectively.
40 Honeywell International Inc.41
LIQUIDITY AND CAPITAL RESOURCES
| | | | | |
| LIQUIDITY AND CAPITAL RESOURCES |
We also have the following revolving credit agreements:
•A $1.5 billion 364-day credit agreement (the 364-Day Credit Agreement) with a syndicate of banks, dated as of March 20, 2023. Amounts borrowed under the 364-Day Credit Agreement are required to be repaid no later than March 18, 2024, unless (i) we elect to convert all then outstanding amounts into a term loan, upon which such amounts shall be repaid in full on March 18, 2025, or (ii) the 364-Day Credit Agreement is terminated earlier pursuant to its terms. The 364-Day Credit Agreement replaced the previously reported $1.5 billion 364-day credit agreement dated as of March 24, 2022, which was terminated in accordance with its terms effective March 20, 2023. As of December 31, 2023, there were no outstanding borrowings under our 364-Day Credit Agreement.
•A $4.0 billion five-year credit agreement (the 5-Year Credit Agreement) with a syndicate of banks, dated as of March 20, 2023. Commitments under the 5-Year Credit Agreement can be increased pursuant to the terms of the 5-Year Credit Agreement to an aggregate amount not to exceed $4.5 billion. The 5-Year Credit Agreement amended and restated the previously reported $4.0 billion amended and restated five-year credit agreement dated as of March 24, 2022. As of December 31, 2023, there were no outstanding borrowings under our 5-Year Credit Agreement.
We also have a current shelf registration statement filed with the SEC under which we may issue additional debt securities, common stock, and preferred stock that may be offered in one or more offerings on terms to be determined at the time of the offering. We anticipate that net proceeds of any offering would be used for general corporate purposes, including repayment of existing indebtedness, share repurchases, capital expenditures, and acquisitions.
CREDIT RATINGS
Our ability to access the global debt capital markets and the related cost of these borrowings is affected by the strength of our credit rating and market conditions. Our credit ratings are periodically reviewed by the major independent debt-rating agencies. As of December 31, 2023, S&P Global Inc. (S&P), Fitch Ratings Inc. (Fitch), and Moody’s Investor Service (Moody's) have ratings on our debt set forth in the table below:
| | | | | | | | | | | | | | | | | |
| S&P | | Fitch | | Moody's |
| Outlook | Stable | | Stable | | Positive |
| Short-term | A-1 | | F1 | | P1 |
| Long-term | A | | A | | A2 |
On September 20, 2023, Moody's affirmed all credit ratings of the Company and revised their credit rating outlook from stable to positive.
41 Honeywell International Inc.
| | | | | |
| LIQUIDITY AND CAPITAL RESOURCES |
CONTRACTUAL OBLIGATIONS
Following is a summary of our significant contractual obligations and probable liability payments at December 31, 2021:2023:
| | | | | | | | | | | | | | | | | | | | | | | | | | | | | | | | |
| | Total(6)(7) | Payments by Period | Thereafter |
| 2022 | 2023 - 2024 | 2025 - 2026 |
Long-term debt, including finance leases(1) | | $ | 16,057 | | | $ | 1,803 | | | $ | 3,154 | | | $ | 2,761 | | | $ | 8,339 | |
| Interest payments on long-term debt, including finance leases | | 4,030 | | | 356 | | | 679 | | | 586 | | | 2,409 | |
| Operating lease liabilities | | 1,164 | | | 215 | | | 341 | | | 204 | | | 404 | |
Purchase obligations(2) | | 2,585 | | | 1,067 | | | 784 | | | 562 | | | 172 | |
Estimated environmental liability payments(3) | | 618 | | | 225 | | | 241 | | | 115 | | | 37 | |
Asbestos related liability payments(4) | | 2,061 | | | 261 | | | 456 | | | 396 | | | 948 | |
Asbestos insurance recoveries(5) | | (363) | | | (41) | | | (74) | | | (54) | | | (194) | |
| | | $ | 26,152 | | | $ | 3,886 | | | $ | 5,581 | | | $ | 4,570 | | | $ | 12,115 | |
| | | | | | | | | | | | | | | | | | | | | | | | | | | | | |
| | | | Payments by Period | | |
Total6,7 | | 2024 | | 2025 - 2026 | | 2027 - 2028 | | Thereafter |
Long-term debt, including finance leases1 | $ | 18,358 | | | $ | 1,796 | | | $ | 2,842 | | | $ | 3,245 | | | $ | 10,475 | |
| Interest payments on long-term debt, including finance leases | 4,995 | | | 568 | | | 1,037 | | | 893 | | | 2,497 | |
| Operating lease liabilities | 1,241 | | | 222 | | | 340 | | | 236 | | | 443 | |
Purchase obligations2 | 3,004 | | | 1,543 | | | 1,144 | | | 265 | | | 52 | |
Estimated environmental liability payments3 | 641 | | | 227 | | | 211 | | | 153 | | | 50 | |
Asbestos-related liability payments4 | 1,644 | | | 154 | | | 278 | | | 225 | | | 987 | |
Asbestos insurance recoveries5 | (123) | | | (16) | | | (24) | | | (19) | | | (64) | |
| Total contractual obligations | $ | 29,760 | | | $ | 4,494 | | | $ | 5,828 | | | $ | 4,998 | | | $ | 14,440 | |
| | | | | | | | |
| 1 | | Assumes all long-term debt is outstanding until scheduled maturity. |
| 2 | | Purchase obligations are entered into with various vendors in the normal course of business and are consistent with our expected requirements. |
| 3 | | The payment amounts in the table only reflect the environmental liabilities which are probable and reasonably estimable as of December 31, 2023. |
| 4 | | These amounts are estimates of asbestos-related cash payments for Bendix Friction Materials (Bendix) based on our asbestos-related liabilities which are probable and reasonably estimable as of December 31, 2023. See Asbestos Matters in Note 19 Commitments and Contingencies of Notes to Consolidated Financial Statements for additional information. |
| 5 | | These amounts represent our insurance recoveries that are deemed probable for asbestos-related liabilities as of December 31, 2023. See Asbestos Matters in Note 19 Commitments and Contingencies of Notes to Consolidated Financial Statements for additional information. |
| 6 | | The table excludes tax liability payments, including those for unrecognized tax benefits. See Note 5 Income Taxes of Notes to Consolidated Financial Statements for additional information. |
| 7 | | The table excludes expected proceeds from the indemnification and reimbursement agreements entered into with Resideo Technologies, Inc. (Resideo). See Note 19 Commitments and Contingencies of Notes to Consolidated Financial Statements for additional information. |
(1)Assumes all long-term debt is outstanding until scheduled maturity.
(2)Purchase obligations are entered into with various vendors in the normal course of business and are consistent with our expected requirements.
(3)The payment amounts in the table only reflect the environmental liabilities which are probable and reasonably estimable as of December 31, 2021.
(4)These amounts are estimates of asbestos related cash payments for NARCO and Bendix based on our asbestos related liabilities which are probable and reasonably estimable as of December 31, 2021. See Asbestos Matters in Note 19 Commitments and Contingencies of Notes to Consolidated Financial Statements for additional information.
(5)These amounts represent our insurance recoveries that are deemed probable for asbestos related liabilities as of December 31, 2021. See Asbestos Matters in Note 19 Commitments and Contingencies of Notes to Consolidated Financial Statements for additional information.
(6)The table excludes tax liability payments, including those for unrecognized tax benefits. See Note 5 Income Taxes of Notes to Consolidated Financial Statements for additional information.
(7)The table excludes expected proceeds from the indemnification and reimbursement agreements entered into with Resideo. See Note 19 Commitments and Contingencies of Notes to Consolidated Financial Statements for additional information.
ASBESTOS MATTERS
Payments, net of insurance recoveries, related to known asbestos matters were $240$109 million, $229$166 million, and $163$240 million for the years ended December 31, 2021, 20202023, 2022, and 2019,2021, respectively, and are estimated to be approximately $220$177 million in 2022.2024. We expect to make paymentpayments associated with these asbestos matters from operating cash flows. The timing of these payments depends on several factors, including the timing of litigation and settlements of liability claims. In early 2023, we made payments of approximately $1.3 billion in connection with the NARCO Buyout. For additional information regarding the NARCO Buyout, see Note 19 Commitments and Contingencies of Notes to Consolidated Financial Statements.
ENVIRONMENTAL MATTERS
Accruals during the year for environmental matters deemed probable and reasonably estimable were $168$222 million, $173$186 million, and $213$168 million for the years ended December 31, 2021, 20202023, 2022, and 2019,2021, respectively. In addition, for the years ended December 31, 2021, 20202023, 2022, and 2019,2021, we incurred operating costs for ongoing businesses of approximately $88 $110 million, $88$71 million, and $99$88 million, respectively, relating to compliance with environmental regulations.
Payments related to known environmental matters were $210$196 million, $216$211 million, and $256$210 million for the years ended December 31, 2021, 20202023, 2022, and 2019,2021, respectively, and are estimated to be approximately $225$227 million in 2022.2024. We expect to make paymentpayments associated with these environmental matters from operating cash flows. The timing of these payments depends on several factors, including the timing of litigation and settlements of remediation liability, personal injury and property damage claims, regulatory approval of cleanup projects, execution timeframe of projects, remedial techniques to be utilized, and agreement with other parties.
Reimbursements from Resideo for payments related to environmental matters at certain sites, as defined in the indemnification and reimbursement agreement, were $140 million in 20212023 and are expected to be $140 million in 2022.2024.
See Note 19 Commitments and Contingencies of Notes to Consolidated Financial Statements for further discussion of our environmental matters and the indemnification and reimbursement agreement entered into with Resideo.
42 Honeywell International Inc.
LIQUIDITY AND CAPITAL RESOURCES
| | | | | |
| LIQUIDITY AND CAPITAL RESOURCES |
FINANCIAL INSTRUMENTS
The Company uses derivative financial instruments to reduce our risks from interest and foreign currency exchange rate fluctuations. Derivative financial instruments are not used for trading or other speculative purposes and we do not use leveraged derivative financial instruments.
The following table illustrates the potential change in fair value for interest rate sensitive instruments based on a hypothetical immediate one percentage point increase in interest rates across all maturities and the potential change in fair value for foreign exchange rate sensitive instruments based on a 10% weakening of the U.S. Dollar versus local currency exchange rates across all maturities at December 31, 20212023, and 2020.2022:
| | | | | | | | | | | | | | | | | | | | | | | | | | |
| Face or
Notional
Amount | Carrying Value(1) | Fair Value(1) | Estimated Increase (Decrease) in Fair Value(2) |
| December 31, 2021 | | | | | | | | |
| Interest Rate Sensitive Instruments | | | | | | | | |
| Long-term debt (including current maturities) | | $ | 16,057 | | | $ | (16,057) | | | $ | (17,022) | | | $ | (1,148) | |
| Interest rate swap agreements | | 3,150 | | | 60 | | | 60 | | | (112) | |
| Foreign Exchange Rate Sensitive Instruments | | | | | | | | |
Foreign currency exchange contracts(3) | | 12,671 | | | 92 | | | 92 | | | (628) | |
| Cross currency swap agreements | | 1,200 | | | 39 | | | 39 | | | (116) | |
| December 31, 2020 | | | | | | | | |
| Interest Rate Sensitive Instruments | | | | | | | | |
| Long-term debt (including current maturities) | | $ | 18,787 | | | $ | (18,787) | | | $ | (20,176) | | | $ | (1,063) | |
| Interest rate swap agreements | | 3,950 | | | 194 | | | 194 | | | (148) | |
| Foreign Exchange Rate Sensitive Instruments | | | | | | | | |
Foreign currency exchange contracts(3) | | 16,123 | | | 52 | | | 52 | | | (334) | |
| Cross currency swap agreements | | 1,200 | | | (50) | | | (50) | | | (125) | |
(1)Asset or (liability).
(2)A hypothetical immediate one percentage point decrease in interest rates across all maturities and a potential change in fair value of foreign exchange rate sensitive instruments based on a 10% strengthening of the U.S. dollar versus local currency exchange rates across all maturities will result in a change in fair value approximately equal to the inverse of the amount disclosed in the table.
(3)Changes in the fair value of foreign currency exchange contracts are offset by changes in the fair value, cash flows, or net investments of underlying hedged foreign currency transactions or foreign operations. | | | | | | | | | | | | | | | | | | | | | | | |
| Face or
Notional
Amount | | Carrying Value1 | | Fair Value1 | | Estimated Increase (Decrease) in Fair Value2 |
| December 31, 2023 | | | | | | | |
| Interest rate sensitive instruments | | | | | | | |
| Long-term debt (including current maturities) | $ | 18,358 | | | $ | (18,358) | | | $ | (17,706) | | | $ | (1,530) | |
| Interest rate swap agreements | 4,717 | | | (166) | | | (166) | | | (160) | |
| Total | $ | 23,075 | | | $ | (18,524) | | | $ | (17,872) | | | $ | (1,690) | |
| Foreign exchange rate sensitive instruments | | | | | | | |
Foreign currency exchange contracts3 | $ | 8,910 | | | $ | 26 | | | $ | 26 | | | $ | (319) | |
| Cross currency swap agreements | 4,264 | | | (145) | | | (145) | | | (234) | |
| Total | $ | 13,174 | | | $ | (119) | | | $ | (119) | | | $ | (553) | |
| December 31, 2022 | | | | | | | |
| Interest rate sensitive instruments | | | | | | | |
| Long-term debt (including current maturities) | $ | 16,853 | | | $ | (16,853) | | | $ | (15,856) | | | $ | (980) | |
| Interest rate swap agreements | 4,984 | | | (287) | | | (287) | | | (189) | |
| Total | $ | 21,837 | | | $ | (17,140) | | | $ | (16,143) | | | $ | (1,169) | |
| Foreign exchange rate sensitive instruments | | | | | | | |
Foreign currency exchange contracts3 | $ | 10,545 | | | $ | 85 | | | $ | 85 | | | $ | (305) | |
| Cross currency swap agreements | 3,189 | | | 90 | | | 90 | | | (311) | |
| Total | $ | 13,734 | | | $ | 175 | | | $ | 175 | | | $ | (616) | |
| | | | | | | | |
| 1 | | Asset or (liability). |
| 2 | | A potential change in fair value of interest rate sensitive instruments based on a hypothetical immediate one percentage point decrease in interest rates across all maturities and a potential change in fair value of foreign exchange rate sensitive instruments based on a 10% strengthening of the U.S. dollar versus local currency exchange rates across all maturities will result in a change in fair value approximately equal to the inverse of the amount disclosed in the table. |
| 3 | | Changes in the fair value of foreign currency exchange contracts are offset by changes in the fair value, cash flows, or net investments of underlying hedged foreign currency transactions or foreign operations. |
See Note 11 Derivative Instruments and Hedging Transactions of Notes to Consolidated Financial Statements for further discussion.
43 Honeywell International Inc.43
CRITICAL ACCOUNTING ESTIMATES
The preparation of our consolidated financial statements in accordance with generally accepted accounting principles is based on the selection and application of accounting policies that require us to make significant estimates and assumptions about the effects of matters that are inherently uncertain. Many estimates and assumptions involved in the application of accounting principles have a material impact on reported financial condition and operating performance and on the comparability of such reported information over different reporting periods. Critical accounting estimates or assumptions are those where the nature of the estimates or assumptions is material due to the levels of subjectivity and judgment necessary to account for highly uncertain matters or the susceptibility of such matters to change, and the impact of the estimates and assumptions on financial condition or operating performance is material. We consider the estimates and assumptions discussed below to be critical to the understanding of our financial statements. Actual results could differ from our estimates and assumptions, and any such differences could be material to our consolidated financial statements.
Sales Recognition on Long-Term Contracts—We recognize sales for long-term contracts with performance obligations satisfied over time using either an input or output method. We recognize revenue over time as we perform on these contracts based on the continuous transfer of control to the customer. With control transferring over time, revenue is recognized based on the extent of progress towards completion of the performance obligation. We generally use the cost-to-cost input method of progress for our contracts because it best depicts the transfer of control to the customer that occurs as we incur costs. Under the cost-to-cost input method, the extent of progress towards completion is measured based on the proportion of costs incurred to date to the total estimated costs at completion of the performance obligation. Due to the nature of the work required to be performed on many of our performance obligations, the estimation of total revenue and cost at completion requires judgment. Contract revenues are largely determined by negotiated contract prices and quantities, modified by our assumptions regarding contract options, change orders, incentive and award provisions associated with technical performance and price adjustment clauses (such as inflation or index-based clauses). Cost estimates are largely based on negotiated or estimated purchase contract terms, historical performance trends and other economic projections. Significant factors that influence these estimates include inflationary trends, technical and schedule risk,risks, internal and subcontractor performance trends, business volume assumptions, asset utilization, and anticipated labor agreements. Revenue and cost estimates are regularly monitored and revised based on changes in circumstances. Impacts from changes in estimates of net sales and cost of sales are recognized on a cumulative catch-up basis, which recognizes in the current period the cumulative effect of the changes on current and prior periods based on a performance obligation’s percentage of completion. Anticipated losses on long-term contracts are recognized when such losses become evident. We maintain financial controls over the customer qualification, contract pricing, and estimation processes to reduce the risk of contract losses.
Income Taxes—On a recurring basis, we assess the need for a valuation allowance against our deferred tax assets by considering all available positive and negative evidence, such as past operating results, projections of future taxable income, enacted tax law changes, and the feasibility and impact of tax planning initiatives. Our projections of future taxable income include a number of estimates and assumptions regarding our volume, pricing and costs, as well as the timing and amount of reversals of taxable temporary differences.
We recognize tax benefits from uncertain tax positions only if it is more likely than not that the tax position will be sustained on examination by the taxing authorities, including resolution of any related appeals and litigation. We assess our income tax positions based upon our evaluation of the facts, circumstances, and information available at the reporting date. The tax benefits recognized in the financial statements from such positions are then measured based on the largest benefit that has a greater than 50% likelihood of being realized upon ultimate settlement with a taxing authority that has full knowledge of all relevant information. For those income tax positions where it is not more likely than not that a tax benefit will be sustained, no tax benefit has been recognized in the financial statements.
For further discussion of additional income tax policies, seeSee Note 1 Summary of Significant Accounting Policies of Notes to Consolidated Financial Statements.
44 Honeywell International Inc.
CRITICAL ACCOUNTING ESTIMATES
| | | | | |
| CRITICAL ACCOUNTING ESTIMATES |
Goodwill and Indefinite-Lived Intangible Assets Impairment Testing—Goodwill and intangible assets deemed to have indefinite lives are not amortized, but are subject to annual, or more frequent if necessary, impairment testing. In testing goodwill and indefinite-lived intangible assets, the fair value is estimated utilizing a discounted cash flow approach, utilizing cash flow forecasts, including strategic and annual operating plans, adjusted for terminal value assumptions. These impairment tests involve the use of accounting estimates and assumptions, and changes in whichto those assumptions could materially impact our financial condition or operating performance if actual results differ from such estimates and assumptions. To address this uncertainty, we perform sensitivity analyses on key estimates and assumptions. Once the fair value is determined, if the carrying amount exceeds the fair value, it is impaired. Any impairment is measured as the difference between the carrying amount and its fair value.
Finite-LivedDefinite-Lived Intangible Assets—The determination of useful lives (for depreciation/amortization purposes) and whether or not intangible assets are impaired involves the use of accounting estimates and assumptions, and changes in whichto those assumptions could materially impact our financial condition or operating performance if actual results differ from such estimates and assumptions. We evaluate the recoverability of the carrying amount of our finite-liveddefinite-lived intangible assets whenever events or changes in circumstances indicate that the carrying amount of a finite-liveddefinite-lived intangible asset group may not be fully recoverable. The principal factors in considering when to perform an impairment review are as follows:
•Significant under-performance (i.e., declines in sales, earnings, or cash flows) of a business or product line in relation to expectations;
•Annual operating plans or strategic plan outlook that indicateindicates an unfavorable trend in operating performance of a business or product line;
•Significant negative industry or economic trends; or
•Significant changes or planned changes in our use of the assets.
Once it is determined that an impairment review is necessary, recoverability of assets is measured by comparing the carrying amount of the asset grouping to the estimated future undiscounted cash flows. If the carrying amount exceeds the estimated future undiscounted cash flows, the asset grouping is considered to be impaired. The impairment is then measured as the difference between the carrying amount of the asset grouping and its fair value. We endeavor to utilize the best information available to measure fair value, which is usually either market prices (if available), level 1 or level 2 of the fair value hierarchy, or an estimate of the future discounted cash flow,flows, level 3 of the fair value hierarchy. The key estimates in our discounted cash flow analysis include assumptions as to expected industry and business growth rates, sales volume, selling prices and costs, cash flows, and the discount rate selected. These estimates are subject to changes in the economic environment, including market interest rates and expected volatility. Management believes the estimates of future cash flows and fair values are reasonable; however, changes in estimates due to variancevariances from assumptions could materially affect the valuations.
Defined Benefit Pension Plans—We sponsor both funded and unfunded U.S. and non-U.S. defined benefit pension plans. For financial reporting purposes, net periodic pension (income) expense is calculated annually based upon various actuarial assumptions, including a discount rate for plan obligations and an expected long-term rate of return on plan assets. Changes in the discount rate and expected long-term rate of return on plan assets could materially affect the annual pension (income) expense amount. Annual pension (income) expense is comprised of service and interest cost, assumed return on plan assets, prior service amortization (Pension ongoing (income) expense), and a potential mark-to-market adjustment (MTM Adjustment).
The key assumptions used in developing our net periodic pension (income) expense for our U.S. plans included the following:
| | 2021 | 2020 | 2019 |
| Discount Rate: | | | | | | |
| 2023 | | | 2023 | | 2022 | | 2021 |
| Discount rate | | Discount rate | | | |
| Projected benefit obligation | Projected benefit obligation | | 2.50 | % | | 3.22 | % | | 4.35 | % | Projected benefit obligation | 5.17 | % | | 2.87 | % | | 2.50 | % |
| Service cost | Service cost | | 2.68 | % | | 3.33 | % | | 4.47 | % | Service cost | 5.26 | % | | 2.98 | % | | 2.68 | % |
| Interest cost | Interest cost | | 1.76 | % | | 2.76 | % | | 3.94 | % | Interest cost | 5.07 | % | | 2.26 | % | | 1.76 | % |
| Assets: | | | | | | |
| Assets | | Assets | | | |
| Expected rate of return | Expected rate of return | | 6.15 | % | | 6.15 | % | | 6.75 | % | Expected rate of return | 6.75 | % | | 6.40 | % | | 6.15 | % |
| Actual rate of return | Actual rate of return | | 6.84 | % | | 13.81 | % | | 21.20 | % | Actual rate of return | 7.09 | % | | (10.45) | % | | 6.84 | % |
| Actual 10 year average annual compounded rate of return | Actual 10 year average annual compounded rate of return | | 11.37 | % | | 10.64 | % | | 11.10 | % | Actual 10 year average annual compounded rate of return | 7.26 | % | | 8.77 | % | | 11.37 | % |
The MTM Adjustment represents the recognition of net actuarial gains or losses in excess of 10% of the greater of the fair value of plan assets or the plans’ projected benefit obligation (the corridor). Net actuarial gains and losses occur when the actual experience differs from any of the various assumptions used to value our pension plans or when assumptions change. The primary factors contributing to actuarial gains and losses are changes in the discount rate used to value pension obligations as of the measurement date each year and the difference between expected and actual returns on plan assets. The mark-to-market accounting method results in the potential for volatile and difficult to forecast MTM Adjustments. MTM Adjustments wereThese adjustments resulted in expenses of $40$153 million, $44$523 million, and $123$40 million for the years ended December 31, 2021, 20202023, 2022, and 2019,2021, respectively.
45 Honeywell International Inc.45
CRITICAL ACCOUNTING ESTIMATES
| | | | | |
| CRITICAL ACCOUNTING ESTIMATES |
We determine the expected long-term rate of return on plan assets utilizing historical plan asset returns over varying long-term periods combined with our expectations of future market conditions and asset mix considerations (see Note 20 Pension and Other Postretirement Benefits of Notes to Consolidated Financial Statements for details on the actual various asset classes and targeted asset allocationallocation percentages for our pension plans). We plan to use an expected rate of return on plan assets of 6.40%7.00% for 2022,2024, which is an increase in the assumption used for 2021.2023.
The discount rate reflects the market rate on December 31 (measurement date) for high-quality fixed-incomefixed income investments with maturities corresponding to our benefit obligations and is subject to change each year. The discount rate can be volatile from year to year as it is determined based upon prevailing interest rates as of the measurement date. We used a 2.87%4.97% discount rate to determine benefit obligations as of December 31, 2021,2023, reflecting an increasedecrease in the market interest rate environment since the prior year-end.
In addition to the potential for MTM Adjustments, changes in our expected rate of return on plan assets and discount rate resulting from economic events also affects future Pension ongoing (income) expense. The following table highlights the sensitivity of our U.S. pension obligations and ongoing (income) expense to changes in these assumptions, assumingwith all other assumptions remainremaining constant. These estimates exclude any potential MTM Adjustment:
| | | | | | | | | | | | | | |
| Change in Assumption | Impact on 20222024 Pension Ongoing Expense | | Impact on PBOProjected Benefit Obligation |
| 0.25 percentage point decrease in discount rate | | Decrease $29$16 million | | Increase $500$292 million |
| 0.25 percentage point increase in discount rate | | Increase $27$15 million | | Decrease $475$280 million |
| 0.25 percentage point decrease in expected rate of return on assets | | Increase $50$40 million | | — |
| 0.25 percentage point increase in expected rate of return on assets | | Decrease $50$40 million | | — |
Pension ongoing income for our world-wide pension plans is expected to be approximately $1,008$538 million in 20222024 compared with Pension ongoing income of $1,083$528 million in 2021. The expected decrease in pension income is primarily due to lower expected return on plan assets caused by a change in allocation of UK plan assets and higher interest costs caused by increased discount rates in our U.S. and UK plans.2023. Also, if required, a MTM Adjustment will be recorded in the fourth quarter of 20222024 in accordance with our pension accounting method as previously described. It is difficult to reliably forecast or predict whether there will be a MTM Adjustment in 2022,2024, and if one is required, what the magnitude of such adjustment will be. MTM Adjustments are primarily driven by events and circumstances beyond the control of the Company such as changes in interest rates and the performance of the financial markets.
Asbestos RelatedAsbestos-Related Liabilities and Insurance Recoveries—The recognition of asbestos-related liabilities relates to a predecessor company, Bendix Friction Materials (Bendix). For Bendix asbestos-related claims, we accrue for the estimated value of pending claims using average resolution values over a defined look-back period. We also accrue for the estimated value of future claims related to Bendix over the full term of epidemiological disease projection through 2059 based on historic and anticipated claims filing experience and dismissal rates, disease classifications, and average resolution values in the tort system over a defined look-back period. We review our valuation assumptions and average resolution values used to estimate the cost of Bendix asserted and unasserted claims during the fourth quarter of each year.
In connection with the recognition of liabilities for asbestos relatedasbestos-related matters, we record asbestos relatedasbestos-related insurance recoveries that are deemed probable. In assessing the probability of insurance recovery, we make judgments concerning insurance coverage that we believe are reasonable and consistent with our historical dealings and our knowledge of any pertinent solvency issues surrounding insurers. While the substantial majority of our insurance carriers are solvent, some of our individual carriers are insolvent, which has beenwas considered in our analysis of probable recoveries. Projecting future events is subject to various uncertainties that could cause the insurance recovery on asbestos relatedasbestos-related liabilities to be higher or lower than that projected and recorded. Given the inherent uncertainty in making future projections, we reevaluate our projections concerning our probable insurance recoveries considering any changes to the projected liability, our recovery experience or other relevant factors that may impact future insurance recoveries.
Our involvement in asbestos related personal injury actions relates to two predecessor companies. Regarding North American Refractories Company (NARCO) asbestos related claims, we estimate our NARCO asbestos liability for the resolution of asserted NARCO-related asbestos claims which qualify for payment under the NARCO Trust Distribution Procedures (Annual Contribution Claims) and for amounts owed pursuant to settlement agreements reached during the pendency of the NARCO bankruptcy proceedings that provide for the right to submit claims to the NARCO Trust subject to qualification under the terms of the settlement agreements and Trust Distribution Procedures (Pre-Established Unliquidated Claims) using average payment values for the relevant historical period. We estimate our NARCO asbestos liability for unasserted claims based on historic and anticipated claims filing experience and payment rates, disease classifications and type of claim, and average payment values by the NARCO Trust for the relevant historical period. Our estimate also includes all years of epidemiological disease projection through 2059. Regarding Bendix Friction Materials (Bendix) asbestos related claims, we accrued for the estimated value of pending claims using average resolution values for the previous five years. We also accrued for the estimated value of future claims related to Bendix over the full term of epidemiological disease projection through 2059 based on historic and anticipated claims filing experience and dismissal rates, disease classifications, and average resolution values in the tort system for the previous five years. We update our assumptions on average payment values and average resolution values in the fourth quarter of each year.
See Note 19 Commitments and Contingencies of Notes to Consolidated Financial Statements for a discussion of management’s judgments applied in the recognition and measurement of our asbestos relatedasbestos-related liabilities and related insurance recoveries.
46 Honeywell International Inc.
CRITICAL ACCOUNTING ESTIMATES
Contingent Liabilities—We are subject to a number of lawsuits, investigations, and claims (some of which involve substantial dollar amounts) that arisearising out of the conduct of our global business operations or those of previously owned entities, including matters relating to commercial transactions, government contracts, product liability (including asbestos), prior acquisitions and divestitures, employee benefit plans, intellectual property, legal, and environmental, health, and safety matters. We continually assess the likelihood of any adverse judgments or outcomes to our contingencies, as well as potential amounts or ranges of probable losses, and recognize a liability, if any, for these contingencies based on a thoroughcareful analysis of each matter with the assistance of outside legal counsel and, if applicable, other experts. Such analysis includes making judgments concerning matters such as the costs associated with environmental matters, the outcome of negotiations, the number and cost of pending and future asbestos claims, and the impact of evidentiary requirements. Because most contingencies are resolved over long periods of time, liabilities may change in the future due to new developments (including new discovery of facts, changes in legislation, and outcomes of similar cases through the judicial system), changes in assumptions, or changes in our settlement strategy. See Note 19 Commitments and Contingencies of Notes to Consolidated Financial Statements for a discussion of management’s judgment applied in the recognition and measurement of our environmental and asbestos liabilities, which represent our most significant contingencies.
46 Honeywell International Inc.47
OTHER MATTERS
LITIGATION
See Note 19 Commitments and Contingencies of Notes to Consolidated Financial Statements for a discussion of environmental, asbestos, and other litigation matters.
RECENT ACCOUNTING PRONOUNCEMENTS
See Note 1 Summary of Significant Accounting Policies of Notes to Consolidated Financial Statements for a discussion of recent accounting pronouncements.
4847 Honeywell International Inc.
INFORMATION ABOUT OUR EXECUTIVE OFFICERS
The executive officers of Honeywell, listed as follows, are elected annually by the Board of Directors. There are no family relationships among them.
| | | | | | | | |
Name, Age, Year First
Elected an Executive Officer | Business Experience |
| Darius AdamczykLucian Boldea, , 5652
2017(a)2022
| Chairman of the Board and Chief Executive Officer since April 2018. President and Chief Executive Officer, from April 2017 to April 2018. Chief Operating Officer from April 2016 to March 2017.Industrial Automation since January 2024. President and Chief Executive Officer, Performance Materials and Technologies from April 2014October 2022 to April 2016.December 2023. Mr. Boldea was previously employed at Eastman Chemical Company, from 1997 to 2022, where he held a variety of leadership roles during his tenure, including Executive Vice President of Honeywell Process Solutions from April 2012January 2019 to April 2014.September 2022, where he led global strategy, business operations, and financial performance. |
| Que Thanh DallaraJim Currier, 4857
2023 | President and Chief Executive Officer, Aerospace Technologies since January 2024. President and Chief Executive Officer, Aerospace from August 2023 to December 2023. President, Electronic Solutions from June 2021 to August 2023. President, EMAI Aftermarket organization from October 2019 to June 2021. Vice President of Airlines, North America from October 2018 to October 2019. |
| Kevin Dehoff, 61 2022 | President and Chief Executive Officer, Connected Enterprise since May 2022. President, Productivity Solutions and Services from November 2019 to April 2022. From 2012 to October 2018. Vice 2019, Mr. Dehoff served as Senior Partner and Practice Leader in McKinsey & Company where he supported strategic business transformations and led a wide range of performance and operating excellence initiatives. |
| Billal M. Hammoud, 51 2023 | President and Chief CommercialExecutive Officer, Building Automation since January 2024. President and Chief Executive Officer, Honeywell Building Technologies from JanuaryApril 2023 to December 2023. President of Smart Energy and Thermal Solutions in Performance Materials and Technologies from November 2021 to March 2023. From April 2017 to October 2018. From 2007 to 2016, Ms. DallaraNovember 2021, Mr. Hammoud served in multiple leadership positionsas President of ESAB Americas and Global Fabrication Solutions at TE Connectivity Ltd., most recently as Senior Vice President, Corporate StrategyColfax where he led strategy, business operations, and Analytics.financial performance. |
| Vimal Kapur, 5658 2018(a) | Chief Executive Officer since June 2023. President and Chief Operating Officer from July 2022 to May 2023. President and Chief Executive Officer, Performance Materials and Technologies sincefrom July 2021.2021 to October 2022. President and Chief Executive Officer, Honeywell Building Technologies from June 2018 to June 2021. President of Honeywell Process Solutions from 2014 to May 2018. |
| George Koutsaftes, 52
April 2022(b)
| Chief Operating Officer, Safety and Productivity Solutions since January 2022. President of the Advanced Materials business in Honeywell’s Performance Materials and Technologies segment from November 2017 to January 2022 and interim global leader of Business Development and Mergers and Acquisitions from May 2019 to December 2019. |
| Gregory P. Lewis, 5456 2018 | Senior Vice President and Chief Financial Officer since August 2018. Vice President of Enterprise Information Management from October 2016 to April 2018, prior to being named Vice President, Corporate Finance in May 2018. Chief Financial Officer of Automation and Control Solutions from April 2013 to September 2016. |
| Anne T. Madden, 5759 2017 | Senior Vice President and General Counsel since October 2017. Corporate Secretary from February 2018 to September 2019. Vice President of Corporate Development and Global Head of M&A from January 2002 to October 2017. |
| Michael R. Madsen, 58
2019
| President and Chief Executive Officer, Aerospace since October 2019. Vice President, Integrated Supply Chain of Aerospace from May 2015 to October 2019. President, Aerospace Defense and Space from October 2010 to May 2015. |
| Karen Mattimore, 5557 2020 | Senior Vice President and Chief Human Resources Officer since June 2020. Vice President, Human Resources and Communications, Aerospace from February 2018 to June 2020. Vice President, Human Resources Services from April 2015 to February 2018. |
| John F. WaldronKen West, 4649
20162024
| President and Chief Executive Officer, SafetyEnergy and ProductivitySustainability Solutions since July 2016. President of SensingJanuary 2024. Mr. West previously held roles within Performance Materials and Productivity Solutions from July 2015 to July 2016. President of Scanning and Mobility from April 2012 to July 2015. |
| Doug Wright, 51
2021
| Technologies, including President and Chief Executive Officer, Honeywell Building Technologies since July 2021. President of the global Fire & Security businessUOP from July 20202023 to June 2021. From 2013 to 2020, Mr. Wright served asDecember 2023, President and Chief Executive Officer, Advanced Materials from January 2022 to July 2023, Vice President and General Manager of Source Photonics, a global providerthe Fluorine Products business from April 2021 to January 2022, Vice President and General Manager of optical communication products used in telecommunication systemsthe Life Sciences, Protective, and data communication networks.Industrial Products business from June 2020 to April 2021, and Vice President and General Manager of the Packaging and Composites business from October 2018 to June 2020. |
(a)Also a Director.
(b)Mr. Koutsaftes will become President and Chief Executive Officer of Safety and Productivity Solutions and an Executive Officer of the Company effective April 1, 2022, succeeding Mr. Waldron in such position
48 Honeywell International Inc.49
UNRESOLVED STAFF COMMENTS
None.
CYBERSECURITY
Honeywell has a cybersecurity risk management program that is designed to assess, identify, manage, and govern material risks from cybersecurity threats. Our cybersecurity risk management program is a key component of our overall risk management program.Honeywell maintains cybersecurity policies and procedures in accordance with industry standard control frameworks and applicable regulations, laws, and standards. Honeywell maintains oversight of its cybersecurity risk management program via a corporate structure that includes a Cybersecurity Disclosure Committee, a Security Governance Council, the Audit Committee, and the Board.
Honeywell’s Board is responsible for cybersecurity risk oversight and has delegated such oversight to the Audit Committee. The Audit Committee, a committee comprised of independent Board members, four of whom have notable experience related to the oversight of cybersecurity issues, is responsible for oversight of Honeywell’s information technology and cybersecurity risks and regularly reports to the Board on information technology and cybersecurity matters. The Audit Committee oversees risk related to the protection of customer and employee data, trade secrets, and other proprietary information, the security of data on the cloud, persistent threats, and cybersecurity risks associated with the Company’s own products and facilities. As part of its cybersecurity oversight responsibilities, the Audit Committee receives regular updates from our Security Governance Council, which meets quarterly or as needed and is led by our Chief Security Officer and includes members of senior executive leadership. In addition, our Chief Security Officer provides updates directly to the Audit Committee at least twice a year or as needed. These updates cover topics related to information security, privacy, cyber risks and risk management processes, including the status of significant cybersecurity incidents, the emerging threat landscape, and the status of projects to strengthen the Company’s information security posture. In addition, the Security Governance Council maintains a security program designed to monitor and track key security performance indicators, which is periodically presented to senior leadership and the Audit Committee for review and oversight. As noted above, assessing, identifying, and managing cybersecurity risks are integrated into our overall enterprise risk management program. Cybersecurity-related risks are assessed and evaluated on a quarterly basis or as needed; the identified cybersecurity-related risks are assessed and evaluated to determine whether any such risks have the potential to materially impact our business operations, revenue, and expenditures and to understand the degree of such risks relative to other risks faced by Honeywell. Our Chief Security Officer has served in various roles in information technology and information security for over 30 years, including security-related roles in technology deployments, product development, product security, supply chain, and operations. He holds a Bachelor of Science in computer science from the Georgia Institute of Technology.
In addition, Honeywell’s Cybersecurity Disclosure Committee receives updates at least quarterly or as needed from Honeywell’s global security organization regarding cybersecurity incidents. The Cybersecurity Disclosure Committee includes Honeywell’s Chief Information Security Officer, Chief Security Officer, and senior representatives from finance, controllership, internal audit, investor relations, tax, and legal. Our governance, risk and compliance team, which is part of Honeywell’s enterprise security team, works in partnership with the Company’s internal audit team to review cybersecurity and information technology-related internal controls as part of our overall internal controls process. The Cybersecurity Disclosure Committee informs the Security Governance Council and the Audit Committee of any cybersecurity incidents (if any) that have the potential to materially adversely impact the Company or our information systems.
Our Chief Information Security Officer, who reports to our Chief Security Officer, oversees the global enterprise security team responsible for leading enterprise-wide information security strategy, architecture, and processes. The enterprise information security team reporting to our Chief Information Security Officer is responsible for infrastructure defense and security controls, performing vulnerability assessments, security incident management, and defining the parameters and standards of our information security risk management program. Honeywell has a comprehensive cybersecurity and information security risk management program that includes risk assessment and mitigation through a threat intelligence-driven approach, application controls, and security monitoring. The risk management program leverages International Organization for Standardizations (ISO) 22301 standards for business continuity and the National Institute of Standards and Technology (NIST) Cyber Security Framework (NIST 800-171) for measuring overall readiness to respond to cyber threats. Our Chief Information Security Officer has more than 20 years of experience in information technology and information security, particularly in the engineering and technology industries. Our information security organization has more than 300 members, with expertise in: (i) application security, (ii) governance and compliance, (iii) program and vulnerability management, (iv) security engineering, (v) identity and access management, (vi) security operations security assurance, (vii) threat intelligence and security architecture, and (viii) incident response.
From time to time, in addition to performing periodic, internal security reviews/audits, Honeywell engages a third-party to assess the adequacy of our risk management program, with the last such engagement occurring during the first quarter of 2022.
49 Honeywell International Inc.
Honeywell relies on third-party service providers for certain critical or key infrastructure, solutions, and services across our operations. Honeywell has a third-party risk management program that assesses risks from vendors and suppliers that provide, amongst other things, key information and supply chain services to Honeywell. In addition, the Company maintains business continuity and disaster recovery plans as well as a cybersecurity insurance policy.
Honeywell has established cybersecurity and information security awareness training programs for employees. Formal training on topics relating to the Company’s cybersecurity, data privacy and information security policies and procedures is mandatory for all employees with access to the Company’s network. Training is administered and tracked through online learning modules. Additionally, Honeywell periodically engages in cyber crisis response table-top simulations to assess Honeywell’s ability to adapt to security-related threats. Improper or illegitimate use of the Company’s information system resources or violation of the Company’s information security policies and procedures may result in disciplinary action.
To date, no risks from cybersecurity threats, including as a result of any previous cybersecurity incidents, have materially affected or are reasonably likely to materially affect our business, our business strategy, our results of operations or financial condition. For further information, see “Our business, reputation, and financial performance may be materially impacted by cybersecurity attacks on our information technology infrastructure and products” in Item 1A, Risk Factors of this Annual Report. In the event an attack or other intrusion were to be successful, we have a response team of internal and external resources engaged and prepared to respond.
PROPERTIES
We have approximately 750approximately 715 locations, of which 210194 are manufacturing sites. Our properties and equipment are in good operating condition and are adequate for our present needs. We do not anticipate difficulty in renewing existing leases as they expire or in finding alternative facilities.
LEGAL PROCEEDINGS
There were no matters requiring disclosure pursuant to the requirement to disclose certain environmental matters involving potential monetary sanctions in excess of $300,000.
MINE SAFETY DISCLOSURES
One of our wholly-owned subsidiaries has a placer claim for and operates a chabazite ore surface mine in Arizona. Information concerning mine safety and other regulatory matters associated with this mine is required by Section 1503(a) of the Dodd-Frank Wall Street Reform and Consumer Protection Act and Item 104 of Regulation S-K and is included in Exhibit 95 to this Form 10-K.
50 Honeywell International Inc.
MARKET FOR REGISTRANT'S COMMON EQUITY, RELATED STOCKHOLDER MATTERS AND ISSUER PURCHASES OF EQUITY SECURITIES
Since May 11, 2021, ourOur common stock has beenis listed on The Nasdaq Stock Market LLC (Nasdaq) under the ticker symbol “HON”. Prior to May 11, 2021, our common stock was listed and traded on the New York Stock Exchange. “HON.” We increased our quarterly dividend rate by 5% to $0.98$1.08 per share of common stock effective with the fourth quarter 20212023 dividend. We intend to continue to pay quarterly dividends in 2022.2024.
The number of record holders of our common stock at December 31, 20212023, was 40,420.35,911.
Information regarding securities authorized for issuance under equity compensation plans is included in the section titled Security Ownership of Certain Beneficial Owners and Management and Related Stockholder Matters under the caption “Equity Compensation Plans.”
We purchased 4,256,144 shares of our common stock, par value $1 per share, in the quarter ended December 31, 2021. On February 12, 2021,April 24, 2023, the Board of Directors authorized the repurchase of up to a total of $10 billion of Honeywell common stock, which included amountsincluding approximately $2.1 billion of remaining availability under and replaced, the previously approvedannounced $10 billion share repurchase program. Asauthorization. The repurchase authorization does not have an expiration date and may be amended or terminated by the Board of December 31, 2021, $7.1 billion remained available for additionalDirectors at any time without prior notice.
Repurchases may be made through a variety of methods, which could include open market purchases, accelerated share repurchases. We expectrepurchase transactions, negotiated block transactions, 10b5-1 plans, other transactions that may be structured through investment banking institutions or privately negotiated, or a combination of the foregoing. Honeywell presently expects to repurchase outstanding shares from time to time (i) to generally offset the dilutive impact of employee stock-based compensation plans, including option exercises, restricted unit vesting, and matching contributions under our savings plans. Additionally, we seekplans, and (ii) to reduce share count via share repurchases as and when attractive opportunities arise. The amount and timing of future repurchases may vary depending on market conditions and the level of our operating, financing, and other investing activities.
During the quarter ended December 31, 2023, Honeywell purchased 7,929,193 shares of its common stock, par value $1 per share. As of December 31, 2023, $7.1 billion remained available under the share repurchase authorization for additional share repurchases. The following table summarizes our purchases of Honeywell's common stock for the three monthsquarter ended December 31, 2021:2023:
| | | | | | | | | | | | | | | | | | | | | | | | | | |
| Issuer Purchases of Equity Securities |
| Period | Total
Number of
Shares
Purchased | Average
Price Paid
per Share | Total Number
of Shares
Purchased as
Part of Publicly
Announced
Plans
or Programs | Approximate Dollar
Value of Shares that
May Yet be Purchased
Under Plans or
Programs
(Dollars in millions) |
| October 1 - 31, 2021 | | 189,536 | | | $ | 213.76 | | | 189,536 | | | $ | 7,946 | |
| November 1 - 30, 2021 | | — | | | $ | — | | | — | | | $ | 7,946 | |
| December 1 - 31, 2021 | | 4,066,608 | | | $ | 206.51 | | | 4,066,608 | | | $ | 7,106 | |
| | | | | | | | | | | | | | | | | | | | | | | |
| Issuer Purchases of Equity Securities |
| Period | Total
Number of
Shares
Purchased | | Average
Price Paid
per Share | | Total Number
of Shares
Purchased as
Part of Publicly
Announced
Plans
or Programs | | Approximate Dollar
Value of Shares that
May Yet be Purchased
Under the Plans or
Programs
(Dollars in millions) |
| October 1 - 31, 2023 | 1,088,242 | | | $ | 183.76 | | | 1,088,242 | | | $ | 8,432 | |
| November 1 - 30, 2023 | 2,996,513 | | | $ | 186.83 | | | 2,996,513 | | | $ | 7,872 | |
| December 1 - 31, 2023 | 3,844,438 | | | $ | 199.75 | | | 3,844,438 | | | $ | 7,104 | |
51 Honeywell International Inc.51
MARKET FOR REGISTRANT'S COMMON EQUITY, RELATED STOCKHOLDER MATTERS AND ISSUER PURCHASES OF EQUITY SECURITIES
| | | | | |
| MARKET FOR REGISTRANT'S COMMON EQUITY, RELATED STOCKHOLDER MATTERS AND ISSUER PURCHASES OF EQUITY SECURITIES |
PERFORMANCE GRAPH
The following graph compares the five-year cumulative total return on our common stock to the total returns on the S&PStandard & Poor's (S&P) 500 Stock Index, composite of S&P’s Industrial Conglomerates and Aerospace and Defense indices, on a 55%/45% weighted basis (the Composite Index) and Nasdaq Industrial Select Sector (XLI Index). The weighting of the components of the Composite Index are based on our segments’ relative contribution to total segment profit. The selection of the Industrial Conglomerates component of the Composite Index reflects the diverse and distinct range of non-aerospace businesses conducted by Honeywell. The annual changes for the five-year period shown in the graph are based on the assumption that $100 was invested in Honeywell stock and each index on December 31, 20162018, and that all dividends were reinvested.
Comparison of Cumulative Five YearFive-Year Total Return
| | | | | | | | | | | | | | | | | | | | | | | | |
| | | Dec. 2016 | Dec. 2017 | Dec. 2018 | Dec. 2019 | Dec. 2020 | Dec. 2021 |
| Honeywell | | 100 | | 135.10 | | 123.99 | | 169.49 | | 208.43 | | 207.82 | |
| S&P 500 Index | | 100 | | 121.83 | | 116.49 | | 153.17 | | 181.35 | | 233.41 | |
| Composite Index | | 100 | | 113.96 | | 92.97 | | 118.5 | | 116.63 | | 126.92 | |
| XLI Composite Index | | 100 | | 123.98 | | 107.55 | | 138.84 | | 153.98 | | 186.44 | |
| | | | | | | | | | | | | | | | | | | | | | | | |
| | | Dec. 2018 | Dec. 2019 | Dec. 2020 | Dec. 2021 | Dec. 2022 | Dec. 2023 |
| Honeywell | | 100 | | 136.70 | | 168.10 | | 167.60 | | 175.82 | | 175.85 | |
| S&P 500 Index | | 100 | | 131.49 | | 155.68 | | 200.37 | | 164.08 | | 207.21 | |
| Composite Index | | 100 | | 127.46 | | 125.45 | | 136.51 | | 140.88 | | 163.96 | |
| XLI Index | | 100 | | 129.08 | | 143.16 | | 173.34 | | 163.69 | | 193.36 | |
52 Honeywell International Inc.
FINANCIAL STATEMENTS
AND SUPPLEMENTARY DATA
INDEX TO THE CONSOLIDATED FINANCIAL STATEMENTS
53 Honeywell International Inc.
| | | | | |
| FINANCIAL STATEMENTS AND SUPPLEMENTARY DATA |
HONEYWELL INTERNATIONAL INC.
CONSOLIDATED STATEMENT OF OPERATIONS
| | Years Ended December 31, |
| 2021 | | 2020 | | 2019 |
| (Dollars in millions,
except per share amounts) |
| Years Ended December 31, | | | Years Ended December 31, |
| 2023 | | 2022 | | 2021 |
| (Dollars in millions,
except per share amounts) | | | (Dollars in millions,
except per share amounts) |
| Product sales | Product sales | $ | 25,643 | | | $ | 24,737 | | | $ | 27,629 | |
| Service sales | Service sales | 8,749 | | | 7,900 | | | 9,080 | |
| Net sales | Net sales | 34,392 | | | 32,637 | | | 36,709 | |
| Costs, expenses and other | Costs, expenses and other | |
| Cost of products sold | Cost of products sold | 18,344 | | | 17,638 | | | 19,269 | |
| Cost of products sold | |
| Cost of products sold | |
| Cost of services sold | Cost of services sold | 5,050 | | | 4,531 | | | 5,070 | |
| 23,394 | | | 22,169 | | | 24,339 | |
| Total Cost of products and services sold | |
| Research and development expenses | |
| Selling, general and administrative expenses | Selling, general and administrative expenses | 4,798 | | | 4,772 | | | 5,519 | |
| Other (income) expense | Other (income) expense | (1,378) | | | (675) | | | (1,065) | |
| Interest and other financial charges | Interest and other financial charges | 343 | | | 359 | | | 357 | |
| 27,157 | | | 26,625 | | | 29,150 | |
| Total costs, expenses and other | |
| Income before taxes | Income before taxes | 7,235 | | | 6,012 | | | 7,559 | |
| Tax expense | Tax expense | 1,625 | | | 1,147 | | | 1,329 | |
| Net income | Net income | 5,610 | | | 4,865 | | | 6,230 | |
| Less: Net income attributable to the noncontrolling interest | 68 | | | 86 | | | 87 | |
| Less: Net income attributable to noncontrolling interest | |
| Net income attributable to Honeywell | Net income attributable to Honeywell | $ | 5,542 | | | $ | 4,779 | | | $ | 6,143 | |
| Earnings per share of common stock—basic | Earnings per share of common stock—basic | $ | 8.01 | | | $ | 6.79 | | | $ | 8.52 | |
| Earnings per share of common stock—assuming dilution | Earnings per share of common stock—assuming dilution | $ | 7.91 | | | $ | 6.72 | | | $ | 8.41 | |
The Notes to Consolidated Financial Statements are an integral part of this statement.
54 Honeywell International Inc.53
FINANCIAL STATEMENTS AND SUPPLEMENTARY DATA
| | | | | |
| FINANCIAL STATEMENTS AND SUPPLEMENTARY DATA |
HONEYWELL INTERNATIONAL INC.
CONSOLIDATED STATEMENT OF COMPREHENSIVE INCOME
| | | | Years Ended December 31, | | Years Ended December 31, |
| 2021 | | 2020 | | 2019 | 2023 | | 2022 | | 2021 |
| | | (Dollars in millions) | | (Dollars in millions) |
| Net income | Net income | $ | 5,610 | | | $ | 4,865 | | | $ | 6,230 | |
| Other comprehensive income (loss), net of tax | Other comprehensive income (loss), net of tax | |
| Foreign exchange translation adjustment | Foreign exchange translation adjustment | 302 | | | (211) | | | 143 | |
| Foreign exchange translation adjustment | |
| Foreign exchange translation adjustment | |
| Actuarial gains (losses) recognized | Actuarial gains (losses) recognized | 256 | | | 91 | | | 162 | |
| Prior service credit (cost) recognized | 7 | | | 47 | | | 1 | |
| Prior service credit recognized | |
| Prior service credit recognized during year | Prior service credit recognized during year | (87) | | | (82) | | | (79) | |
| Actuarial (gains) losses recognized during year | 5 | | | 41 | | | 16 | |
| Actuarial losses recognized during year | |
| | Foreign exchange translation and other | Foreign exchange translation and other | 5 | | | (23) | | | (14) | |
| Pensions and other postretirement benefit adjustments | 186 | | | 74 | | | 86 | |
| Foreign exchange translation and other | |
| Foreign exchange translation and other | |
| Pension and other postretirement benefit adjustments | |
| Changes in fair value of available for sale investments | Changes in fair value of available for sale investments | (3) | | | 4 | | | — | |
| Cash flow hedges recognized in other comprehensive income | 17 | | | 10 | | | 103 | |
| Less: Reclassification adjustment for gains (losses) included in net income | 20 | | | 54 | | | 92 | |
| Cash flow hedges recognized in other comprehensive income (loss) | |
| Less: Reclassification adjustment for gains included in net income | |
| Changes in fair value of cash flow hedges | Changes in fair value of cash flow hedges | (3) | | | (44) | | | 11 | |
| Other comprehensive income (loss), net of tax | Other comprehensive income (loss), net of tax | 482 | | | (177) | | | 240 | |
| Comprehensive income | Comprehensive income | 6,092 | | | 4,688 | | | 6,470 | |
| Less: Comprehensive income attributable to the noncontrolling interest | 64 | | | 89 | | | 82 | |
| Less: Comprehensive income (loss) attributable to the noncontrolling interest | |
| Comprehensive income attributable to Honeywell | Comprehensive income attributable to Honeywell | $ | 6,028 | | | $ | 4,599 | | | $ | 6,388 | |
The Notes to Consolidated Financial Statements are an integral part of this statement.
5455 Honeywell International Inc.
FINANCIAL STATEMENTS AND SUPPLEMENTARY DATA
| | | | | |
| FINANCIAL STATEMENTS AND SUPPLEMENTARY DATA |
HONEYWELL INTERNATIONAL INC.
CONSOLIDATED BALANCE SHEET
| | | | December 31, | | December 31, |
| 2021 | | 2020 | 2023 | | 2022 |
| | | (Dollars in millions) | | (Dollars in millions) |
| ASSETS | ASSETS | | | | ASSETS | | | |
| Current assets: | | | |
| Current assets | | Current assets | | | |
| Cash and cash equivalents | Cash and cash equivalents | $ | 10,959 | | | $ | 14,275 | |
| Short-term investments | Short-term investments | 564 | | | 945 | |
| Accounts receivable, less allowances of $177 and $202, respectively | 6,830 | | | 6,827 | |
| Accounts receivable, less allowances of $323 and $326, respectively | |
| Inventories | Inventories | 5,138 | | | 4,489 | |
| Other current assets | Other current assets | 1,881 | | | 1,639 | |
| Total current assets | Total current assets | 25,372 | | | 28,175 | |
| Investments and long-term receivables | Investments and long-term receivables | 1,222 | | | 685 | |
| Property, plant and equipment—net | Property, plant and equipment—net | 5,562 | | | 5,570 | |
| Goodwill | Goodwill | 17,756 | | | 16,058 | |
| Other intangible assets—net | Other intangible assets—net | 3,613 | | | 3,560 | |
| Insurance recoveries for asbestos related liabilities | 322 | | | 366 | |
| Insurance recoveries for asbestos-related liabilities | |
| Deferred income taxes | Deferred income taxes | 489 | | | 760 | |
| Other assets | Other assets | 10,134 | | | 9,412 | |
| Total assets | Total assets | $ | 64,470 | | | $ | 64,586 | |
| LIABILITIES | LIABILITIES | |
| Current liabilities: | |
| Current liabilities | |
| Current liabilities | |
| Current liabilities | |
| Accounts payable | |
| Accounts payable | |
| Accounts payable | Accounts payable | $ | 6,484 | | | $ | 5,750 | |
| Commercial paper and other short-term borrowings | Commercial paper and other short-term borrowings | 3,542 | | | 3,597 | |
| Current maturities of long-term debt | Current maturities of long-term debt | 1,803 | | | 2,445 | |
| Accrued liabilities | Accrued liabilities | 7,679 | | | 7,405 | |
| Total current liabilities | Total current liabilities | 19,508 | | | 19,197 | |
| Long-term debt | Long-term debt | 14,254 | | | 16,342 | |
| Deferred income taxes | Deferred income taxes | 2,364 | | | 2,113 | |
| Postretirement benefit obligations other than pensions | Postretirement benefit obligations other than pensions | 208 | | | 242 | |
| Asbestos related liabilities | 1,800 | | | 1,920 | |
| Asbestos-related liabilities | |
| Other liabilities | Other liabilities | 7,087 | | | 6,975 | |
| Redeemable noncontrolling interest | Redeemable noncontrolling interest | 7 | | | 7 | |
| SHAREOWNERS’ EQUITY | SHAREOWNERS’ EQUITY | |
| Capital—common stock issued | |
| Capital—common stock issued | |
| Capital—common stock issued | Capital—common stock issued | 958 | | | 958 | |
| —additional paid-in capital | —additional paid-in capital | 8,141 | | | 7,292 | |
| Common stock held in treasury, at cost | Common stock held in treasury, at cost | (30,462) | | | (27,229) | |
| Accumulated other comprehensive income (loss) | Accumulated other comprehensive income (loss) | (2,895) | | | (3,377) | |
| Retained earnings | Retained earnings | 42,827 | | | 39,905 | |
| Total Honeywell shareowners’ equity | Total Honeywell shareowners’ equity | 18,569 | | | 17,549 | |
| Noncontrolling interest | Noncontrolling interest | 673 | | | 241 | |
| Total shareowners’ equity | Total shareowners’ equity | 19,242 | | | 17,790 | |
| Total liabilities, redeemable noncontrolling interest and shareowners’ equity | Total liabilities, redeemable noncontrolling interest and shareowners’ equity | $ | 64,470 | | | $ | 64,586 | |
The Notes to Consolidated Financial Statements are an integral part of this statement.
56 Honeywell International Inc.55
FINANCIAL STATEMENTS AND SUPPLEMENTARY DATA
| | | | | |
| FINANCIAL STATEMENTS AND SUPPLEMENTARY DATA |
HONEYWELL INTERNATIONAL INC.
CONSOLIDATED STATEMENT OF CASH FLOWS
| | | | Years Ended December 31, | | Years Ended December 31, |
| 2021 | | 2020 | | 2019 | 2023 | | 2022 | | 2021 |
| | | (Dollars in millions) | | (Dollars in millions) |
| Cash flows from operating activities: | | | | | |
| Cash flows from operating activities | | Cash flows from operating activities | | | |
| Net income | Net income | $ | 5,610 | | | $ | 4,865 | | | $ | 6,230 | |
| Less: Net income attributable to the noncontrolling interest | 68 | | | 86 | | | 87 | |
| Less: Net income attributable to noncontrolling interest | |
| Net income attributable to Honeywell | Net income attributable to Honeywell | 5,542 | | | 4,779 | | | 6,143 | |
| Adjustments to reconcile net income attributable to Honeywell to net cash provided by operating activities: | |
| Adjustments to reconcile net income attributable to Honeywell to net cash provided by operating activities | |
| Depreciation | |
| Depreciation | |
| Depreciation | Depreciation | 674 | | | 644 | | | 673 | |
| Amortization | Amortization | 549 | | | 358 | | | 415 | |
| (Gain) loss on sale of non-strategic businesses and assets | (102) | | | 3 | | | 1 | |
| Gain on sale of non-strategic businesses and assets | |
| Repositioning and other charges | Repositioning and other charges | 569 | | | 575 | | | 546 | |
| Net payments for repositioning and other charges | Net payments for repositioning and other charges | (692) | | | (833) | | | (376) | |
| NARCO Buyout payment | |
| Pension and other postretirement income | Pension and other postretirement income | (1,114) | | | (798) | | | (516) | |
| Pension and other postretirement benefit payments | Pension and other postretirement benefit payments | (43) | | | (47) | | | (78) | |
| Stock compensation expense | Stock compensation expense | 217 | | | 168 | | | 153 | |
| Deferred income taxes | Deferred income taxes | 178 | | | (175) | | | 179 | |
| Reimbursement receivables charge | — | | | 509 | | | — | |
| | Other | Other | (28) | | | (338) | | | (287) | |
| Changes in assets and liabilities, net of the effects of acquisitions and divestitures: | |
| Other | |
| Other | |
| Changes in assets and liabilities, net of the effects of acquisitions and divestitures | |
| Accounts receivable | |
| Accounts receivable | |
| Accounts receivable | Accounts receivable | (8) | | | 669 | | | 11 | |
| Inventories | Inventories | (685) | | | (67) | | | (100) | |
| Other current assets | Other current assets | (276) | | | 191 | | | (430) | |
| Accounts payable | Accounts payable | 744 | | | 15 | | | 118 | |
| Accrued liabilities | Accrued liabilities | 513 | | | 555 | | | 445 | |
| Net cash provided by (used for) operating activities | 6,038 | | | 6,208 | | | 6,897 | |
| Cash flows from investing activities: | |
| Expenditures for property, plant and equipment | (895) | | | (906) | | | (839) | |
| Net cash provided by operating activities | |
| Cash flows from investing activities | |
| Capital expenditures | |
| Capital expenditures | |
| Capital expenditures | |
| Proceeds from disposals of property, plant and equipment | Proceeds from disposals of property, plant and equipment | 27 | | | 57 | | | 43 | |
| Increase in investments | Increase in investments | (2,373) | | | (3,236) | | | (4,253) | |
| Decrease in investments | Decrease in investments | 2,525 | | | 3,508 | | | 4,464 | |
| Receipts from Garrett Motion Inc. | Receipts from Garrett Motion Inc. | 586 | | | — | | | — | |
| Receipts (payments) from settlements of derivative contracts | Receipts (payments) from settlements of derivative contracts | 192 | | | (149) | | | 102 | |
| Cash paid for acquisitions, net of cash acquired | Cash paid for acquisitions, net of cash acquired | (1,326) | | | (261) | | | (50) | |
| Proceeds from sales of businesses, net of fees paid | Proceeds from sales of businesses, net of fees paid | 203 | | | — | | | — | |
| Net cash provided by (used for) investing activities | (1,061) | | | (987) | | | (533) | |
| Cash flows from financing activities: | |
| Net cash used for investing activities | |
| Cash flows from financing activities | |
| Proceeds from issuance of commercial paper and other short-term borrowings | |
| Proceeds from issuance of commercial paper and other short-term borrowings | |
| Proceeds from issuance of commercial paper and other short-term borrowings | Proceeds from issuance of commercial paper and other short-term borrowings | 5,194 | | | 10,474 | | | 14,199 | |
| Payments of commercial paper and other short-term borrowings | Payments of commercial paper and other short-term borrowings | (5,190) | | | (10,400) | | | (14,199) | |
| Proceeds from issuance of common stock | Proceeds from issuance of common stock | 229 | | | 393 | | | 498 | |
| Proceeds from issuance of long-term debt | Proceeds from issuance of long-term debt | 2,517 | | | 10,125 | | | 2,726 | |
| Payments of long-term debt | Payments of long-term debt | (4,917) | | | (4,308) | | | (2,903) | |
| Repurchases of common stock | Repurchases of common stock | (3,380) | | | (3,714) | | | (4,400) | |
| Cash dividends paid | Cash dividends paid | (2,626) | | | (2,592) | | | (2,442) | |
| | Other | Other | (81) | | | (59) | | | (79) | |
| Net cash provided by (used for) financing activities | (8,254) | | | (81) | | | (6,600) | |
| | Other | |
| | Other | |
| Net cash used for financing activities | |
| Effect of foreign exchange rate changes on cash and cash equivalents | Effect of foreign exchange rate changes on cash and cash equivalents | (39) | | | 68 | | | 16 | |
| Net increase (decrease) in cash and cash equivalents | (3,316) | | | 5,208 | | | (220) | |
| Net decrease in cash and cash equivalents | |
| Cash and cash equivalents at beginning of period | Cash and cash equivalents at beginning of period | 14,275 | | | 9,067 | | | 9,287 | |
| Cash and cash equivalents at end of period | Cash and cash equivalents at end of period | $ | 10,959 | | | $ | 14,275 | | | $ | 9,067 | |
The Notes to Consolidated Financial Statements are an integral part of this statement.
5657 Honeywell International Inc.
FINANCIAL STATEMENTS AND SUPPLEMENTARY DATA
| | | | | |
| FINANCIAL STATEMENTS AND SUPPLEMENTARY DATA |
HONEYWELL INTERNATIONAL INC.
CONSOLIDATED STATEMENT OF SHAREOWNERS’ EQUITY
| | | | Years Ended December 31, | | Years Ended December 31, |
| 2021 | | 2020 | | 2019 | 2023 | | 2022 | | 2021 |
| Shares | | $ | | Shares | | $ | | Shares | | $ | Shares | | $ | | Shares | | $ | | Shares | | $ |
| | | (in millions, except per share amounts) | | (In millions, except per share amounts) |
| Common stock, par value | Common stock, par value | 957.6 | | | 958 | | | 957.6 | | | 958 | | | 957.6 | | | 958 | |
| Additional paid-in capital | Additional paid-in capital | |
| Beginning balance | Beginning balance | | 7,292 | | | 6,876 | | | 6,452 | |
| Beginning balance | |
| Beginning balance | |
| Issued for employee savings and option plans | Issued for employee savings and option plans | | 184 | | | 248 | | | 271 | |
| Stock-based compensation expense | | 217 | | | 168 | | | 153 | |
| Stock compensation expense | |
| Impact of Quantinuum contribution | Impact of Quantinuum contribution | | 448 | | | — | | | — | |
| Ending balance | Ending balance | | 8,141 | | | 7,292 | | | 6,876 | |
| Treasury stock | Treasury stock | |
| Beginning balance | |
| Beginning balance | |
| Beginning balance | Beginning balance | (260.8) | | | (27,229) | | | (246.5) | | | (23,836) | | | (228.0) | | | (19,771) | |
| Reacquired stock or repurchases of common stock | Reacquired stock or repurchases of common stock | (15.8) | | | (3,380) | | | (20.7) | | | (3,714) | | | (26.5) | | | (4,400) | |
| Issued for employee savings and option plans | Issued for employee savings and option plans | 3.8 | | | 147 | | | 6.4 | | | 321 | | | 8.0 | | | 335 | |
| Ending balance | Ending balance | (272.8) | | | (30,462) | | | (260.8) | | | (27,229) | | | (246.5) | | | (23,836) | |
| Retained earnings | Retained earnings | |
| Beginning balance | Beginning balance | | 39,905 | | | 37,693 | | | 33,978 | |
| Beginning balance | |
| Beginning balance | |
| | Net income attributable to Honeywell | |
| Net income attributable to Honeywell | |
| Net income attributable to Honeywell | Net income attributable to Honeywell | | 5,542 | | | 4,779 | | | 6,143 | |
| Dividends on common stock | Dividends on common stock | | (2,620) | | | (2,567) | | | (2,428) | |
| | Ending balance | Ending balance | | 42,827 | | | 39,905 | | | 37,693 | |
| | Ending balance | |
| | Ending balance | |
| Accumulated other comprehensive income (loss) | Accumulated other comprehensive income (loss) | |
| Beginning balance | Beginning balance | | (3,377) | | | (3,197) | | | (3,437) | |
| Beginning balance | |
| Beginning balance | |
| Foreign exchange translation adjustment | Foreign exchange translation adjustment | | 302 | | | (214) | | | 143 | |
| Pensions and other postretirement benefit adjustments | | 186 | | | 74 | | | 86 | |
| Pension and other postretirement benefit adjustments | |
| Changes in fair value of available for sale investments | Changes in fair value of available for sale investments | | (3) | | | 4 | | | — | |
| Changes in fair value of cash flow hedges | Changes in fair value of cash flow hedges | | (3) | | | (44) | | | 11 | |
| Ending balance | Ending balance | | (2,895) | | | (3,377) | | | (3,197) | |
| Noncontrolling interest | Noncontrolling interest | |
| Beginning balance | |
| Beginning balance | |
| Beginning balance | Beginning balance | | 241 | | | 212 | | | 178 | |
| Acquisitions, divestitures, and other | Acquisitions, divestitures, and other | | 397 | | | (6) | | | (3) | |
| Net income attributable to noncontrolling interest | Net income attributable to noncontrolling interest | | 68 | | | 86 | | | 87 | |
| Foreign exchange translation adjustment | Foreign exchange translation adjustment | | (4) | | | 3 | | | (5) | |
| Dividends paid | Dividends paid | | (33) | | | (54) | | | (45) | |
| Contributions from noncontrolling interest holders | Contributions from noncontrolling interest holders | | 4 | | | — | | | — | |
| Ending balance | Ending balance | | 673 | | | 241 | | | 212 | |
| Total shareowners’ equity | Total shareowners’ equity | 684.8 | | | 19,242 | | | 696.8 | | | 17,790 | | | 711.1 | | | 18,706 | |
| Cash dividends per share of common stock | Cash dividends per share of common stock | | $ | 3.770 | | | $ | 3.630 | | | $ | 3.360 | |
The Notes to Consolidated Financial Statements are an integral part of this statement.
58 Honeywell International Inc.57
| | | | | |
| FINANCIAL STATEMENTS AND SUPPLEMENTARY DATA |
HONEYWELL INTERNATIONAL INC.
NOTES TO CONSOLIDATED FINANCIAL STATEMENTS
(Dollars in tables in millions, except per share amounts)
NOTE 1 .1. SUMMARY OF SIGNIFICANT ACCOUNTING POLICIES
ACCOUNTING PRINCIPLES
The financial statements and accompanying notes are prepared in accordance with accounting principles generally accepted in the United States of America. The following is a description of Honeywell’s significant accounting policies.
PRINCIPLES OF CONSOLIDATION
The Consolidated Financial Statements include the accounts of Honeywell International Inc. and all of its subsidiaries and entities in which a controlling interest is maintained. The Company's consolidation policy requires equity investments that the Company exercises significant influence over, but dodoes not control the investee and are not the primary beneficiary of the investee’s activities, to be accounted for using the equity method. Investments through which the Company is not able to exercise significant influence over the investee and which the Company does not have readily determinable fair values are accounted for under the cost method. All intercompany transactions and balances are eliminated in consolidation.
RECLASSIFICATIONS
Certain prior year amounts have beenare reclassified to conform to the current year presentation.
Historically, the Company included Company-sponsored costs and costs that relate to contracts with customers for research and development projects as a component of Cost of products and services sold on the Consolidated Statement of Operations. Effective January 1, 2023, the Company began classifying Company-sponsored costs for research and development projects as a separate financial statement line item, titled Research and development expenses, on the Consolidated Statement of Operations and recast prior period results for this reclassification. This reclassification had no impact on the Company's net income, earnings per share, cash flows, segment reporting, or financial position. The Company revised historical periods to reflect this change in presentation.
RECENT ACCOUNTING PRONOUNCEMENTS
The Company considers the applicability and impact of all Accounting Standards Updates (ASUs) issued by the Financial Accounting Standards Board (FASB). ASUs not listed below were assessed and determined to be either not applicable or are expected to have minimal impact on the Company's consolidated statementConsolidated Statement of operations, balance sheetOperations, Balance Sheet, and cash flowsCash Flows (Consolidated Financial Statements).
In December 2019,2023, the FASB issued ASU 2019-12,2023-09, SimplifyingIncome Taxes (Topic 740): Improvements to Income Taxes Disclosures, which requires greater disaggregation of income tax disclosures. The new standard requires additional information to be disclosed with respect to the Accounting for Income Taxes. The standard’s amendments include changes in various subtopics of accounting forincome tax rate reconciliation and income taxes including, butpaid disaggregated by jurisdiction. This ASU should be applied prospectively for fiscal years beginning after December 15, 2024, with retrospective application permitted. The Company is currently evaluating the impacts of this guidance on the Company’s Consolidated Financial Statements.
In November 2023, the FASB issued ASU 2023-07, Segment Reporting (Topic 280): Improvements to Reportable Segment Disclosures, which requires companies to enhance the disclosures about segment expenses. The new standard requires the disclosure of the Company’s Chief Operating Decision Maker (CODM), expanded incremental line-item disclosures of significant segment expenses used by the CODM for decision-making, and the inclusion of previous annual only segment disclosure requirements on a quarterly basis. This ASU should be applied retrospectively for fiscal years beginning after December 15, 2023, and early adoption is permitted. The Company is currently evaluating the impacts of this guidance on the Company’s Consolidated Financial Statements.
In September 2022, the FASB issued ASU 2022-04, Liabilities—Supplier Finance Programs (Topic 405): Disclosure of Supplier Finance Program Obligations, to enhance the transparency of supplier finance programs. The new standard requires annual disclosure of the key terms of the program, a description of where in the financial statements amounts outstanding under the program are presented, a rollforward of such amounts, and interim disclosure of amounts outstanding as of the end of each period. The guidance does not limited to, accounting for “hybrid” tax regimes, tax basis step-up in goodwill obtained in a transaction thataffect recognition, measurement, or financial statement presentation of supplier finance programs. The ASU is not a business combination, intraperiod tax allocation exception to incremental approach, ownership changes in investments, interim-period accounting for enacted changes in tax law, and year-to-date loss limitation in interim-period tax accounting. Effectiveeffective on January 1, 2021,2023, except for the rollforward, which is effective on January 1, 2024. The Company adopted this standard.guidance on January 1, 2023, with the exception of the rollforward that is effective on January 1, 2024. The adoption of this standard diddoes not have a material impact on the Company'sCompany’s Consolidated Financial Statements.
59 Honeywell International Inc.
| | | | | |
| FINANCIAL STATEMENTS AND SUPPLEMENTARY DATA |
HONEYWELL INTERNATIONAL INC.
NOTES TO CONSOLIDATED FINANCIAL STATEMENTS—(Continued)
(Dollars in tables in millions, except per share amounts)
In October 2021, the FASB issued ASU 2021-08, Business Combinations (Topic 805): Accounting for Contract Assets and Contract Liabilities from Contracts with Customers, which requires contract assets and contract liabilities acquired in a business combination to be recognized and measured by the acquirer on the acquisition date in accordance with ASC 606, Revenue from Contracts with Customers. This ASU should be applied prospectively to acquisitions occurring on or after the effective date of December 15, 2022, and early adoption was permitted. The Company adopted this guidance on January 1, 2022. The adoption of this standard does not have a material impact on the Company’s Consolidated Financial Statements.
In March 2020, the FASB issued ASU 2020-04, Reference Rate Reform (Topic 848): Facilitation of the Effects of Reference Rate Reform on Financial Reporting, which provides optional expedients and exceptions for applying generally accepted accountedaccounting principles to contracts, hedging relationships, and other transactions affected by the transition away from reference rates expected to be discontinued to alternative reference rates. In January 2021, the FASB issued ASU 2021-01, Reference Rate Reform (Topic 848): Scope, to expand the scope of this guidance to include derivatives. The guidance was effective upon issuance and may be applied prospectively to contract modifications made and hedging relationships entered into on or before December 31, 2022. In December 2022, the FASB issued ASU 2022-06, Reference Rate Reform (Topic 848): Deferral of the Sunset Date of Topic 848, which extends the period of time entities can utilize the reference rate reform relief guidance under ASU 2020-04 from December 31, 2022, to December 31, 2024. The Company will apply the guidance to impacted transactions during the transition period. The Company does not expect the adoption of this standard todoes not have a material impact on the Company’s Consolidated Financial Statements.
In October 2021, the FASB issued ASU 2021-08, Business Combinations (Topic 805) - Accounting for Contract Assets and Contract Liabilities from Contracts with Customers, which requires contract assets and contract liabilities acquired in a business combination to be recognized and measured by the acquirer on the acquisition date in accordance with ASC 606, Revenue from Contracts with Customers. This ASU should be applied prospectively to acquisitions occurring on or after the effective date of December 15, 2022, and early adoption is permitted. The Company is currently evaluating the impacts of this guidance on the Company’s Consolidated Financial Statements. The Company does not expect the adoption of this standard to have a material impact on the Company’s Consolidated Financial Statements.
58 Honeywell International Inc.
FINANCIAL STATEMENTS AND SUPPLEMENTARY DATA
HONEYWELL INTERNATIONAL INC.
NOTES TO CONSOLIDATED FINANCIAL STATEMENTS—(Continued)
(Dollars in tables in millions, except per share amounts)
RESEARCH AND DEVELOPMENT
Research and development costs for projects are expensed as incurred, unless these costs relate to contracts with customers where the Company receives reimbursements. Amounts expensed as incurred for Company-sponsored research and development projects are included in Cost of productsResearch and services solddevelopment expenses and were $1,333$1,456 million, $1,334$1,478 million, and $1,556$1,333 million for the years ended December 31, 2021, 20202023, 2022, and 2019,2021, respectively. Costs related to contracts with customers for customer-sponsored research and development projects are included as a contract cost and included in Cost of products and services sold when revenue from such contracts is recognized, consistent with the Company's sales recognition policies. This revenue was $1,284$1,303 million, $1,200$1,336 million, and $1,079$1,284 million for the years ended December 31, 2021, 20202023, 2022, and 2019,2021, respectively.
CASH AND CASH EQUIVALENTS
Cash and cash equivalents include cash on hand and highly liquid investments having an original maturity of three months or less.
INVENTORIES
Inventories are stated at the lower of cost or net realizable value, with cost determined on a first-in, first-out (FIFO) basis. Carrying value adjustments for inventory obsolescence is equal to the difference between the cost and net realizable value. Net realizable value is the estimateestimated selling price in the ordinary course of business, less reasonably predictable costs of completion, disposal, and transportation.
PROPERTY, PLANT AND EQUIPMENT
Property, plant and equipment are recorded at cost, including any asset retirement obligations, less accumulated depreciation. For financial reporting, the straight-line method of depreciation is used over the estimated useful lives of 10 to 50 years for buildings and improvements and 3 to 16 years for machinery and equipment. Recognition of the fair value of obligations associated with the retirement of tangible long-lived assets is required when there is a legal obligation to incur such costs. Upon initial recognition of a liability, the cost is capitalized as part of the related long-lived asset and depreciated over the corresponding asset’s useful life.
GOODWILL AND INDEFINITE-LIVED INTANGIBLE ASSETS
Goodwill and indefinite-lived intangible assets are subject to impairment testing annually as of March 31,the first day of the fourth quarter, or if a triggering event occurs or changes in circumstances indicate that the carrying amount may not be fully recoverable. This testing compares carrying values to fair values and, when appropriate, the carrying value of these assets is reduced to fair value.value, not to exceed the carrying value of goodwill. The Company completed its annual goodwill impairment test as of March 31, 2021,the first day of the fourth quarter and determined that there was no impairment as of that date. The Company is not aware of any additional triggering events.
FINITE-LIVED60 Honeywell International Inc.
| | | | | |
| FINANCIAL STATEMENTS AND SUPPLEMENTARY DATA |
HONEYWELL INTERNATIONAL INC.
NOTES TO CONSOLIDATED FINANCIAL STATEMENTS—(Continued)
(Dollars in tables in millions, except per share amounts)
Prior to 2022, the Company performed its annual goodwill and intangible asset impairment test as of the last day of the first quarter. In 2022, the Company changed the date of its annual goodwill and intangible asset impairment assessment to the first day of the fourth quarter. The Company believes this change does not represent a material change in method of applying an accounting principle. This change has been applied prospectively as of the date of the change, as retrospective application is deemed impracticable due to the inability to objectively determine the assumptions used in earlier periods without the benefit of hindsight. This voluntary change is preferable under the circumstances as it results in better alignment with the timing of the Company’s forecasting process and reduces the time period between the assessment date and annual financial statements. This change in accounting principle does not delay, accelerate, or avoid an impairment of goodwill. In 2022, due to this change, the Company performed annual goodwill and intangible asset impairment tests as of the last day of the first quarter and the first day of the fourth quarter.
DEFINITE-LIVED INTANGIBLE ASSETS
Other intangible assets with determinabledefinite lives consist of customer lists, technology,relationships, patents and technology, trademarks, and other intangibles and are amortized over their estimated usefuluseful lives, ranging from 2 to 2220 years.
CAPITALIZED SOFTWARE
The Company capitalizes costs of software developed or obtained for internal use during the application development stage of a project and amortizes those costs using the straight-line method over the expected useful life of the software, not to exceed 7 years. Costs incurred during the preliminary and post-implementation stages are expensed as incurred. Development costs for software held for sale are capitalized once a project has reached the point of technological feasibility. Completed projects are amortized after reaching the point of general availability using the straight-line method based on the expected useful life, not to exceed 7 years. At each balance sheet date, or earlier if an indicator of an impairment exists, the Company evaluates the recoverability of unamortized capitalized software costs based on estimated future undiscounted revenues net of estimated related costs over the remaining amortization period. Capitalized software held for internal use and held for sale is included in Other assets in the Consolidated Balance Sheet.
FOREIGN CURRENCY TRANSLATION
Assets and liabilities of subsidiaries operating outside the United States with a functional currency other than the U.S. DollarsDollar are translated into U.S. Dollars using year-end exchange rates. Sales, costs, and expenses are translated at the average exchange rates in effect during the year. Foreign currency translation gains and losses are included as a component of Accumulated other comprehensive income (loss). For subsidiaries operating in highly inflationary environments, inventories and property, plant and equipment, including related expenses, are remeasured at the exchange rate in effect on the date the assets were acquired, while monetary assets and liabilities are remeasured at year-end exchange rates. Remeasurement adjustments for these subsidiaries are included in earnings.
Honeywell International Inc. 59
FINANCIAL STATEMENTS AND SUPPLEMENTARY DATA
HONEYWELL INTERNATIONAL INC.
NOTES TO CONSOLIDATED FINANCIAL STATEMENTS—(Continued)
(Dollars in tables in millions, except per share amounts)
DERIVATIVE FINANCIAL INSTRUMENTS
All derivative financial instruments are recorded on the balance sheet as assets or liabilities and measured at fair value. For derivatives designated as hedges of the fair value of assets or liabilities, the changes in fair values of both the derivatives and the hedged items are recorded in current earnings. For derivatives designated as cash flow hedges, the changes in fair value of the derivatives are recorded in Accumulated other comprehensive income (loss) and subsequently recognized in earnings when the hedged items impact earnings.
Derivative financial instruments designated as hedges must be designated and effective as a hedge of the identified risk exposure at the inception of the contract. Changes in fair value of the derivative contract must be highly correlated with changes in fair value of the underlying hedged item at inception and over the life of the hedge contract. Cash flows of such derivative financial instruments are classified consistent with the underlying hedged item. The Company elected to exclude the time value of the derivatives (i.e., the forward points) from the assessment of hedge effectiveness and to recognize the initial value of the excluded component in earnings using the amortization approach. For derivative instruments that are designated and qualify as a net investment hedge, the gain or loss is reported as a component of Other comprehensive income (loss) and recorded in Accumulated other comprehensive income (loss). The gain or loss will be subsequently reclassified into net earnings when the hedged net investment is either sold or substantially liquidated.
61 Honeywell International Inc.
| | | | | |
| FINANCIAL STATEMENTS AND SUPPLEMENTARY DATA |
HONEYWELL INTERNATIONAL INC.
NOTES TO CONSOLIDATED FINANCIAL STATEMENTS—(Continued)
(Dollars in tables in millions, except per share amounts)
LEASES
At the inception of a contract, the Company assesses whether the contract is, or contains, a lease. The assessment is based on (1)(i) whether the contract involves the use of a distinct identified asset, (2)(ii) whether the Company obtains the right to substantially all the economic benefit from the use of the asset throughout the period, and (3)(iii) whether the Company has the right to direct the use of the asset.
All significant lease arrangements are generally recognized at lease commencement. Operating lease right-of-use (ROU) assets and lease liabilities are recognized at commencement. AnA ROU asset and corresponding lease liability are not recorded for leases with an initial term of 12 months or less (short-term leases), and we recognize; however, lease expense for these leases is recognized as incurred over the lease term.
ROU assets represent the Company's right to use an underlying asset during the reasonably certain lease term, and lease liabilities represent the obligation to make lease payments arising from the lease. The Company's lease terms may include options to extend or terminate the lease when it is reasonably certain that the Company will exercise that option.
Operating lease ROU assets and liabilities are recognized at commencement date based on the present value of lease payments over the lease term. Lease payments may be fixed or variable, however, only fixed payments or in-substance fixed payments are included in determining the lease liability. Variable lease payments are recognized in operating expenses in the period in which the obligation for those payments are incurred. The operating lease ROU asset also includes any lease payments related to initial direct costcosts and prepayments and excludes lease incentives. Lease expense is recognized on a straight-line basis over the lease term. The Company has lease agreements with lease and non-lease components, which are generally accounted for separately.
The Company primarily uses its incremental borrowing rate, which is based on the information available at the lease commencement date, in determining the present value of the lease payments. In determining the borrowing rate, the Company considers the lease term, secured incremental borrowing rate, and for leases denominated in a currency different than the U.S. dollar, the collateralized borrowing rate in the foreign currency using the U.S. dollar and foreign currency swap spread, when available.
PENSION BENEFITS
The Company presents net periodic pensionspension costs by disaggregating the service cost component of such costs and reports those costs in the same line item or items in the Consolidated Statement of Operations as other compensation costs arising from services rendered by the pertinent employees during the period. The other non-service components of such costs are required to be presented separately from the service cost component.
The Company records the service cost component of Pension ongoing (income) expense in CostsCost of products and services sold, Research and development expenses, and Selling, general and administrative expenses. The remaining components of costs within Pension ongoing (income) expense, primarily interest costs and assumed return on plan assets, are recorded in Other (income) expense. The Company recognizes net actuarial gains or losses in excess of 10% of the greater of the fair value of plan assets or the plan's projected benefit obligation (the corridor) annually in the fourth quarter each year (MTM Adjustment). The MTM Adjustment is also reported in Other (income) expense. See Note 22 Segment Financial Data
SUPPLY CHAIN FINANCING
The Company maintains agreements with third-party financial institutions that offer voluntary supply chain financing (SCF) programs to suppliers. The SCF programs enable suppliers, at their sole discretion, to sell their receivables to third-party financial institutions in order to receive payment on receivables earlier than the negotiated commercial terms between suppliers and the Company. Supplier sale of receivables to third-party financial institutions is on terms negotiated between the supplier and the respective third-party financial institution. The Company agrees on commercial terms for the goods and services procured from suppliers, including prices, quantities, and payment terms, which normally range between 60 and 120 days, regardless of whether the supplier elects to participate in the SCF programs. A suppliers’ voluntary participation in the SCF programs has no bearing on the Company's payment terms and the Company has no economic interest in a definitionsupplier’s decision to participate in the SCF programs. The Company agrees to pay participating third-party financial institutions the stated amounts of Pension ongoing (income) expense.confirmed invoices from suppliers on the original maturity dates of the invoices.
Amounts outstanding related to SCF programs are included in Accounts payable in the Consolidated Balance Sheet. Accounts payable included approximately $1,112 million and $992 million as of December 31, 2023, and 2022, respectively. The impact of these programs is not material to the Company's overall liquidity.
6062 Honeywell International Inc.
| | | | | |
| FINANCIAL STATEMENTS AND SUPPLEMENTARY DATA |
HONEYWELL INTERNATIONAL INC.
NOTES TO CONSOLIDATED FINANCIAL STATEMENTS—(Continued)
(Dollars in tables in millions, except per share amounts)
SALES RECOGNITION
Product and service sales are recognized when or as the Company transfers control of the promised products or services to its customers. Revenue is measured as the amount of consideration the Company expects to receive in exchange for transferring goods or providing services. Service sales, principally representing repair, maintenance, and engineering activities, are recognized over the contractual period or as services are rendered. Sales under long-term contracts with performance obligations satisfied over time are recognized using either an input or output method. The Company recognizes revenue over time as the Company performs on these contracts because of the continuous transfer of control to the customer. With control transferring over time, revenue is recognized based on the extent of progress towards completion of the performance obligation. The Company generally uses the cost-to-cost input method of progress for contracts because it best depicts the transfer of control to the customer that occurs as the Company incurs costs. Under the cost-to-cost input method, the extent of progress towards completion is measured based on the proportion of costs incurred to date to the total estimated costs at completion of the performance obligation. The Company reviews its cost estimates on significant contracts on a periodic basis, or when circumstances change and warrant a modification to a previous estimate. Cost estimates are largely based on negotiated or estimated purchase contract terms, historical performance trends, and other economic projections. Significant factors that influence these estimates include inflationary trends, technical and schedule risk,risks, internal and subcontractor performance trends, business volume assumptions, asset utilization, and anticipated labor agreements. Provisions for anticipated losses on long-term contracts are recorded in full when such losses become evident, to the extent required.
The customer funding for costs incurred for nonrecurring engineering and development activities of the Company's products under agreements with commercial customers is deferred and subsequently recognized as revenue as products are delivered to the customers. Additionally, expenses incurred, up to the customer agreed funded amount, are deferred as an asset and recognized as cost of sales when products are delivered to the customer. The deferred customer funding and costs result in recognition of deferred costs (asset) and deferred revenue (liability) onwithin Other assets and Accrued liabilities, respectively, in the Company's Consolidated Balance Sheet. CapitalizedDeferred contract fulfillment costs were approximately $1.2 billion and $1.3 billion as of December 31, 20212023, and 2020.2022, respectively. The amounts recognized as Cost of products and services sold were approximately $0.1 billion for the yearsyear ended December 31, 2023, and $0.2 billion and $0.1 billion for 2022 and 2021, 2020 and 2019.respectively.
Revenues for the Company's mechanical service programs are recognized as performance obligations that are satisfied over time, with recognition reflecting a series of distinct services using the output method.
The terms of a contract or the historical business practice can give rise to variable consideration due to, but not limited to, cash-based incentives, rebates, performance awards, or credits. The Company estimates variable consideration at the most likely amount the Company will receive from customers. The Company includes estimated amounts in the transaction price to the extent it is probable that a significant reversal of cumulative revenue recognized for such transaction will not occur, or when the uncertainty associated with the variable consideration is resolved. The Company's estimates of variable consideration and determination of whether to include estimated amounts in the transaction price are based largely on an assessment of the Company's anticipated performance and all information (historical, current and forecasted) that is reasonably available to the Company.
STOCK-BASED COMPENSATION PLANS
The principal awards issued under the Company's stock-based compensation plans, which are described in Note 15 Stock-Based Compensation Plans, are non-qualified stock options and restricted stock units. The cost for such awards is measured at the grant date based on the fair value of the award. The value of the portion of the award that is ultimately expected to vest is recognized as expense over the requisite service periods (generally the vesting period of the equity award) and is included in Selling, general and administrative expenses. Forfeitures are estimated at the time of grant to recognize expense for those awards that are expected to vest and are based on the Company's historical forfeiture rates.
Honeywell International Inc. 61
FINANCIAL STATEMENTS AND SUPPLEMENTARY DATA
HONEYWELL INTERNATIONAL INC.
NOTES TO CONSOLIDATED FINANCIAL STATEMENTS—(Continued)
(Dollars in tables in millions, except per share amounts)
INCOME TAXES
Significant judgment is required in evaluating tax positions. The Company establishes reserves for income taxes when, despite the belief that tax positions are fully supportable, there remain certain positions remain that do not meet the minimum recognition threshold. The approach for evaluating certain and uncertain tax positions is defined by the authoritative guidance which determines when a tax position is more likely than not to be sustained upon examination by the applicable taxing authority. In the normal course of business, the Company and its subsidiaries are examined by various federal, state, and foreign tax authorities. The Company regularly assesses the potential outcomes of these examinations and any future examinations for the current or prior years in determining the adequacy of the Company's provision for income taxes. The Company continually assesses the likelihood and amount of potential adjustments and adjustadjusts the income tax provision, the current tax liability, and deferred taxes in the period in which the facts that give rise to a change in estimate become known. For additional information, seeSee Note 5 Income Taxes.Taxes for additional information.
63 Honeywell International Inc.
| | | | | |
| FINANCIAL STATEMENTS AND SUPPLEMENTARY DATA |
HONEYWELL INTERNATIONAL INC.
NOTES TO CONSOLIDATED FINANCIAL STATEMENTS—(Continued)
(Dollars in tables in millions, except per share amounts)
EARNINGS PER SHARE
Basic earnings per share is based on the weighted average number of common shares outstanding. Diluted earnings per share is based on the weighted average number of common shares outstanding and all dilutive potential common shares outstanding.
ENVIRONMENTAL
The Company accrues costs related to environmental matters when it is probable that it has incurred a liability related to a contaminated site and the amount can be reasonably estimated. For additional information, seeSee Note 19 Commitments and Contingencies.
ASBESTOS RELATED LIABILITIES AND INSURANCE RECOVERIES
The Company recognizes a liabilityContingencies for any asbestos related contingency that is probable of occurrence and reasonably estimable. In connection with the recognition of liabilities for asbestos related matters, the Company records asbestos related insurance recoveries that are deemed probable. For additional information, see Note 19 Commitments and Contingencies.information.
REIMBURSEMENT RECEIVABLES
In conjunction with the Resideo Technologies, Inc. (Resideo) spin-off, the Company entered into a reimbursement agreement under which Honeywell receives cash payments as reimbursement primarily related to net spending for environmental matters at certain sites as defined in the reimbursement agreement. Accordingly, the Company recorded receivables based on estimates of the underlying reimbursable Honeywell environmental spend, and the Company monitors the recoverability of such receivables, which are subject to the terms of applicable credit agreements and general ability to pay.
ASBESTOS-RELATED LIABILITIES AND INSURANCE RECOVERIES
62 Honeywell International Inc.
FINANCIAL STATEMENTS AND SUPPLEMENTARY DATA
HONEYWELL INTERNATIONAL INC.
NOTES TO CONSOLIDATED FINANCIAL STATEMENTS—(Continued)
(Dollars in tables in millions, except per share amounts)
NOTE 2. ACQUISITIONS AND DIVESTITURES
ACQUISITIONS
On December 8, 2023, the Company agreed to acquire Carrier Global Corporation's Global Access Solutions business in an all-cash transaction for $5.0 billion. The transaction is subject to regulatory review and approval and customary closing conditions. The transaction is expected to close by the end of the third quarter of 2024 and the business will be reported within the Honeywell Building Technologies reportable business segment.
On August 25, 2023, the Company acquired 100% of the outstanding equity interests of SCADAfence, a provider of operational technology and Internet of Things cybersecurity solutions for monitoring large scale networks, for total consideration of $52 million, net of cash acquired. The business is included in the Performance Materials and Technologies reportable business segment. The assets and liabilities acquired with SCADAfence are included in the Consolidated Balance Sheet as of December 31, 2023, including $17 million of intangible assets and $42 million of goodwill, which is not deductible for tax purposes. The purchase accounting is subject to final adjustment, primarily for the value of intangible assets, amounts allocated to goodwill, and tax balances.
On June 30, 2023, the Company acquired 100% of the outstanding equity interests of Compressor Controls Corporation, a turbomachinery services and controls company based in the United States, for total cash consideration of $673 million, net of cash acquired. The business is included in the Performance Materials and Technologies reportable business segment. The assets and liabilities acquired with Compressor Controls Corporation are included in the Consolidated Balance Sheet as of December 31, 2023, including $282 million of intangible assets and $350 million allocated to goodwill, which is deductible for tax purposes. The identifiable intangible assets primarily include customer relationships amortized over an estimated life of 15 years using an excess earnings amortization method. The purchase accounting is subject to final adjustment, primarily for the valuation of intangible assets, amounts allocated to goodwill, and tax balances.
On January 18, 2022, the Company acquired 100% of the issued and outstanding shares of US Digital Designs, Inc., a leading provider of technologies for first responders, for total consideration of $186 million. The business is included within the Honeywell Building Technologies reportable business segment. The Company finalized the evaluation for the fair value of all the assets and liabilities acquired with US Digital Designs, Inc. during the first quarter of 2023. Management recorded intangible assets of $53 million and allocated $129 million to goodwill, which is deductible for tax purposes.
64 Honeywell International Inc.
| | | | | |
| FINANCIAL STATEMENTS AND SUPPLEMENTARY DATA |
HONEYWELL INTERNATIONAL INC.
NOTES TO CONSOLIDATED FINANCIAL STATEMENTS—(Continued)
(Dollars in tables in millions, except per share amounts)
On November 29, 2021, Honeywell Quantum Solutions, a wholly-owned subsidiary of Honeywell, and Cambridge Quantum Computing, a leading developer of quantum computing and quantum software, combined to form Quantinuum. Prior to closing the transaction, Honeywell held a 4.2% ownership interest in Cambridge Quantum Computing. At closingAs part of the business combination, Honeywell contributed an additional $270 million of cash and is the controlling majority-owner of Quantinuum, with an overall 54% ownership in the business. Quantinuum is well positioned to lead the quantum computing industry by offering advanced, fully integrated hardware and software solutions at an unprecedented pace, scale and level of performance to large high-growth markets worldwide. Quantinuum supports customer needs for improved computation in cyber security, drug discovery and delivery, material science, finance, and optimization across all major industrial markets. The business is included within Corporate and All Other, which is not considered a reportable business segment. The combination was accounted for under the acquisition method of accounting; as such, assetsAssets and liabilities of Quantinuum are consolidated by Honeywell and included in the Consolidated Balance Sheet. The business is included within Corporate and All Other, which is not a reportable business segment. Upon close of the transaction, Honeywell recorded a non-cash adjustment of $460 million in Additional paid-in-capital onpaid-in capital in the Consolidated Balance Sheet as the contribution of ownership interest in Honeywell Quantum Solutions and Cambridge Quantum Computing for the formation of Quantinuum. In addition, Honeywell recognized a gain of $22 million related to the fair value remeasurement of Honeywell's existing 4.2% ownership interest in Cambridge Quantum Computing, which was recorded in Other (income) expense on in the Consolidated Statement of Operations. At close of the transaction, the fair value of Cambridge Quantum Computing's noncontrolling interest in Quantinuum was $419 million. In December 2021, Cambridge Quantum Computing contributed cash of $12 million to Quantinuum, increasing their noncontrolling interest and decreasing Honeywell's additional-paid-in-capital. Asadditional paid-in capital. In the fourth quarter of December 31, 2021,2022, the Company completed its evaluation of the fair value of all the assets and liabilities in Honeywell's Consolidated Balance Sheet includesacquired. Management recorded intangible assets of $90 million of intangible assets and $943allocated $945 million allocated to goodwill, which is non-deductible for tax purposes. The purchase accounting is subject to final adjustments, primarily for the valuation of intangible assets and goodwill.
On February 12, 2021, the Company acquired 100% of the shares outstanding of Sparta Systems, a leading provider of enterprise quality management software for the life sciences industry, for $1,303 million. Sparta Systems is expected to further strengthen the Company's leadership in industrial automation, digital transformation solutions, and enterprise performance management software. The business is included within the Performance Materials and Technologies reportable business segment. The assets and liabilities acquired with Sparta Systems are included in the Consolidated Balance Sheet as of December 31, 2021, including $383 million of intangible assets and $1,011 million allocated to goodwill, which is nondeductible for tax purposes. The purchase accounting is subject to final adjustment, primarily for the valuation of intangible assets, amounts allocated to goodwill, tax balances, and certain pre-acquisition contingencies.
During 2020, the Company acquired businesses for an aggregate cost (net of cash and debt assumed) of $261 million, which included the October 2020 acquisition of Rocky Research and the December 2020 acquisition of Sine Group. Rocky Research is a technology leader specializing in thermal, energy and power management solutions and is included within the Aerospace segment. Sine Group offers a Software-as-a-Service (SaaS) that handles visitor management, workplace and supply chain solutions and is included in the Honeywell Building Technologies segment. The acquisition of Rocky Research and Sine Group included approximately $167 million allocated to goodwill, which is non-deductible for tax purposes.
DIVESTITURES
During 2019,2023, there were no significant acquisitions that closeddivestitures individually or in the aggregate.
DIVESTITURESIn conjunction with the wind down of the Company's businesses and operations in Russia (the Wind down), during 2022 the Company completed the sale of three entities domiciled in Russia in exchange for gross cash consideration of less than $1 million. The Company recognized a pre-tax gain of $22 million, which was recorded in Other (income) expense in the Consolidated Statement of Operations, driven by favorable foreign currency cumulative translation adjustment positions in the entities at the time of sale. The financial results of the entities were previously included in the Performance Materials and Technologies, Honeywell Building Technologies, and Safety and Productivity Solutions reportable business segments.
On March 15, 2021, the Company completed the sale of its retail footwear business in exchange for gross cash consideration of $230 million. The Company recognized a pre-tax gain of $95 million for the twelve months ended December 31, 2021, which was recorded in Other (income) expense. The retail footwear business was previously included in the Safety and Productivity Solutions reportable business segment.
During 2020 and 2019, there were no significant divestitures that closed individually or in the aggregate.
65 Honeywell International Inc.63
| | | | | |
| FINANCIAL STATEMENTS AND SUPPLEMENTARY DATA |
HONEYWELL INTERNATIONAL INC.
NOTES TO CONSOLIDATED FINANCIAL STATEMENTS—(Continued)
(Dollars in tables in millions, except per share amounts)
NOTE 3. REVENUE RECOGNITION AND CONTRACTS WITH CUSTOMERS
The Company has a comprehensive offering of products and services, including software and technologies, that are sold to a variety of customers in multiple end markets. See the following disaggregated revenue table and related discussions by operatingreportable business segment for details.details:
| | Years Ended December 31, |
| Years Ended December 31, | | | Years Ended December 31, |
| | | 2021 | 2020 | 2019 | | 2023 | | 2022 | | 2021 |
| Aerospace | Aerospace | | | |
| Commercial Aviation Original Equipment | |
| Commercial Aviation Original Equipment | |
| Commercial Aviation Original Equipment | Commercial Aviation Original Equipment | | $ | 1,720 | | | $ | 1,940 | | | $ | 2,999 | |
| Commercial Aviation Aftermarket | Commercial Aviation Aftermarket | | 4,155 | | | 3,812 | | | 5,761 | |
| Defense and Space | Defense and Space | | 5,151 | | | 5,792 | | | 5,294 | |
| | | | 11,026 | | | 11,544 | | | 14,054 | |
| Net Aerospace sales | |
| Net Aerospace sales | |
| Net Aerospace sales | |
| Honeywell Building Technologies | Honeywell Building Technologies | |
| | Products | Products | | 3,243 | | | 2,971 | | | 3,293 | |
| | Products | |
| | Products | |
| Building Solutions | Building Solutions | | 2,296 | | | 2,218 | | | 2,424 | |
| 5,539 | | | 5,189 | | | 5,717 | |
| Net Honeywell Building Technologies sales | |
| Performance Materials and Technologies | Performance Materials and Technologies | |
| UOP | |
| UOP | |
| UOP | UOP | | 2,348 | | | 2,177 | | | 2,890 | |
| Process Solutions | Process Solutions | | 4,611 | | | 4,590 | | | 5,146 | |
| Advanced Materials | Advanced Materials | | 3,054 | | | 2,656 | | | 2,798 | |
| | | 10,013 | | | 9,423 | | | 10,834 | |
| Net Performance Materials and Technologies sales | |
| Safety and Productivity Solutions | Safety and Productivity Solutions | |
| Safety and Retail | | 2,387 | | | 2,414 | | | 2,215 | |
| Sensing and Safety Technologies | |
| Sensing and Safety Technologies | |
| Sensing and Safety Technologies | |
| Productivity Solutions and Services | Productivity Solutions and Services | | 1,610 | | | 1,270 | | | 1,285 | |
| Warehouse and Workflow Solutions | Warehouse and Workflow Solutions | | 2,944 | | | 1,965 | | | 1,719 | |
| Advanced Sensing Technologies | | 873 | | | 832 | | | 885 | |
| | | 7,814 | | | 6,481 | | | 6,104 | |
| Net Safety and Productivity Solutions sales | |
| Corporate and All Other | Corporate and All Other | | — | | | — | | | — | |
| Net sales | Net sales | | $ | 34,392 | | | $ | 32,637 | | | $ | 36,709 | |
In July 2022, the Company realigned certain business units within the Safety and Productivity Solutions reportable business segment. The Safety and Retail business unit, which included the gas detection and safety business, combined with the Advanced Sensing Technologies business unit to form the Sensing and Safety Technologies business unit. The Company recast historical periods to reflect this realignment.
Aerospace – A global supplier of products, software, and services for aircrafts that it sells to OEMoriginal equipment manufacturers (OEM) and other customers in a variety of end markets including: air transport, regional, business and general aviation aircraft, airlines, aircraft operators, and defense and space contractors. Aerospace products and services include auxiliary power units, propulsion engines, environmental control systems, integrated avionics, wireless connectivity services, electric power systems, engine controls, flight safety, communications, navigation hardware, data and software applications, radar and surveillance systems, aircraft lighting, management and technical services, advanced systems and instruments, satellite and space components, aircraft wheels and brakes, repair, and overhaul services and thermal systems. Aerospace also provides spare parts, repair, overhaul, and maintenance services (principally to aircraft operators) for the aftermarket., and sells licenses or intellectual property to other parties. Our Honeywell Forge solutions are leveraged by the Company'senable our customers as tools to turn data into predictive maintenance and predictive analytics to enable better fleet management and make flight operations more efficient.
Honeywell Building Technologies – A global provider of products, software, solutions, and technologies that enable building owners and occupants to ensure their facilities are safe, energy efficient, sustainable, and productive. Honeywell Building Technologies products and services include advanced software applications for building control and optimization; sensors, switches, control systems, and instruments for energy management; access control; video surveillance; fire products; and installation, maintenance, and upgrades of systems. Our Honeywell Forge solutions enable the Company'sour customers to digitally manage buildings, connecting data from different assets to enable smart maintenance, improve building performance, and even protect from incoming security threats.
6466 Honeywell International Inc.
| | | | | |
| FINANCIAL STATEMENTS AND SUPPLEMENTARY DATA |
HONEYWELL INTERNATIONAL INC.
NOTES TO CONSOLIDATED FINANCIAL STATEMENTS—(Continued)
(Dollars in tables in millions, except per share amounts)
Performance Materials and Technologies– A global provider in developing and manufacturing high-quality performance chemicals and materials, process technologies, and automation solutions. The reportable business segment is comprised of Process Solutions, UOP, and Advanced Materials. Process Solutions provides automation control, instrumentation, advanced software, and related services for the oil and gas, refining, pulp and paper, industrial power generation, chemicals and petrochemicals, biofuels, life sciences, and metals, minerals, and mining industries. Through itsOur smart energy products Process Solutions enablesenable utilities and distribution companies to deploy advanced capabilities to improve operations, reliability, and environmental sustainability. UOP provides process technology, products, including catalysts and adsorbents, equipment, and consulting services that enable customers to efficiently produce gasoline, diesel, jet fuel, petrochemicals, and renewable fuels for the petroleum refining, gas processing, petrochemical, and other industries. Advanced Materials manufactures a wide variety of high-performance products, including materials used to manufacture end products such as bullet-resistant armor, nylon, computer chips, and pharmaceutical packaging, and provides reduced and low global-warming-potentialglobal warming potential materials based on hydrofluoro-olefin technology. In the industrial environment, our Honeywell Forge solutions enable integration and connectivity to provide a holistic view of operations and turn data into clear actions to maximize productivity and efficiency. Our Honeywell Forge's cybersecurity capabilities help identify risks and act on cyber-related incidents, together enabling improved operations and protecting processes, people, and assets.
Safety and Productivity Solutions – A global provider of products and software that improve productivity, workplace safety, and asset performance to customers around the globe. Sensing and Safety Technologies products include PPE,personal protective equipment (PPE), apparel, gear, and footwear; gas detection technology; custom-engineered sensors, switches, and controls for sensing and productivity solutions; and cloud-based notification and emergency messaging. Productivity Solutions and Services products and services include mobile devices and software for computing, data collection, and thermal printing; supply chain and warehouse automation equipment, software and solutions; custom-engineered sensors, switches and controls for sensing and productivity solutions; and software-based data and asset management productivity solutions. Warehouse and Workflow Solutions products and services include system design and simulation, automation solutions, performance optimization software, and lifecycle services to enable accuracy, productivity, and predictability of warehouse operations. Our Honeywell Forge solutions digitally automate processes to improve efficiency while reducing downtime and safety costs.
Corporate and All Other – Corporate and All Other includes revenue from Honeywell's majority-owned investment in Quantinuum. Through Quantinuum, Honeywell provides a wide range of service offerings of fully integrated quantum computing hardware and software solutions.
ForSee Note 22 Segment Financial Data for a summary by disaggregated product and services sales for each segment, refer to Note 22 Segment Financial Data.reportable business segment.
The Company recognizes revenue arising from performance obligations outlined in contracts with its customers that are satisfied at a point in time and over time. The disaggregation of the Company's revenue based off timing of recognition is as follows:
| | Years Ended December 31, |
| Years Ended December 31, | | | Years Ended December 31, |
| | | 2021 | 2020 | 2019 | | 2023 | | 2022 | | 2021 |
| Products, transferred point in time | Products, transferred point in time | | 58 | % | | 61 | % | | 61 | % | Products, transferred point in time | 58 | % | | 59 | % | | 58 | % |
| Products, transferred over time | Products, transferred over time | | 17 | | | 15 | | | 14 | |
| Net product sales | Net product sales | | 75 | | | 76 | | | 75 | |
| Services, transferred point in time | Services, transferred point in time | | 8 | | | 8 | | | 9 | |
| Services, transferred over time | Services, transferred over time | | 17 | | | 16 | | | 16 | |
| Net service sales | Net service sales | | 25 | | | 24 | | | 25 | |
| Net sales | Net sales | | 100 | % | | 100 | % | | 100 | % | Net sales | 100 | % | | 100 | % | | 100 | % |
CONTRACT BALANCES
The Company recordstracks progress on satisfying performance obligations under contracts with customers and thecustomers. The related billings and cash collections are recorded onin the Consolidated Balance Sheet in Accounts receivable—net and Other assets (unbilled receivables (contract assets) and billed receivables), and Accrued liabilities and Other liabilities (customer advances and deposits (contract liabilities)). Unbilled receivables (contract assets) arise when the timing of cash collected from customers differs from the timing of revenue recognition, such as when contract provisions require specific milestones to be met before a customer can be billed. Contract assets are recognized when the revenue associated with the contract is recognized prior to billing and derecognized when billed in accordance with the terms of the contract. Contract liabilities are recorded when customers remit contractual cash payments in advance of usthe Company satisfying performance obligations under contractual arrangements, including those with performance obligations to be satisfied over a period of time. Contract liabilities are derecognized when revenue is recorded, either when a milestone is met triggering the contractual right to bill or when the performance obligation is satisfied.
67 Honeywell International Inc.65
| | | | | |
| FINANCIAL STATEMENTS AND SUPPLEMENTARY DATA |
HONEYWELL INTERNATIONAL INC.
NOTES TO CONSOLIDATED FINANCIAL STATEMENTS—(Continued)
(Dollars in tables in millions, except per share amounts)
Contract balances are classified as assets or liabilities on a contract-by-contract basis at the end of each reporting period.
The following table summarizes the Company's contract assets and liabilities balances:
| | | | 2021 | 2020 | | 2023 | | 2022 |
| Contract assets—January 1 | Contract assets—January 1 | | $ | 1,618 | | | $ | 1,602 | |
| Contract assets—December 31 | Contract assets—December 31 | | 2,060 | | | 1,618 | |
| Change in contract assets—increase (decrease) | Change in contract assets—increase (decrease) | | $ | 442 | | | $ | 16 | |
| Contract liabilities—January 1 | Contract liabilities—January 1 | | $ | (4,033) | | | $ | (3,501) | |
| Contract liabilities—December 31 | Contract liabilities—December 31 | | (4,290) | | | (4,033) | |
| Change in contract liabilities—(increase) decrease | | $ | (257) | | | $ | (532) | |
| Change in contract liabilities—decrease (increase) | |
| Net change | Net change | | $ | 185 | | | $ | (516) | |
The net change in 2021 and 2020 was primarily driven by the receipt of advance payments from customers exceeding recognition of revenue as performance obligations were satisfied prior to billing. For the years ended December 31, 20212023, and 2020,2022, the Company recognized revenue of $1,925$2,070 million and $1,709$1,838 million, respectively, that was previously included in the beginning balance of contract liabilities.
Contract assets include $2,035included $1,949 million and $1,589$2,265 million of unbilled balances under long-term contracts as of December 31, 20212023, and 2020,2022, respectively. These amounts are billed in accordance with the terms of customer contracts to which they relate.
When contracts are modified to account for changes in contract specifications and requirements, the Company considers whether the modification either creates new or changes the existing enforceable rights and obligations. Contract modifications for goods or services and not distinct from the existing contract, due to the significant integration with the original good or service provided, are accounted for as if they were part of that existing contract. The effect of a contract modification on the transaction price and the Company's measure of progress for the performance obligation to which it relates, is recognized as an adjustment to revenue (either as an increase in or a reduction of revenue) on a cumulative catch-up basis. When the modifications include additional performance obligations that are distinct and at relative stand-alone selling price, they are accounted for as a new contract and performance obligation, which are recognized prospectively.
PERFORMANCE OBLIGATIONS
A performance obligation is a promise in a contract to transfer a distinct good or service to the customer and is defined as the unit of account. A contract’s transaction price is allocated to each distinct performance obligation and recognized as revenue when, or as, the performance obligation is satisfied. When the Company's contracts with customers require highly complex integration or manufacturing services that are not separately identifiable from other promises in the contracts and, therefore, not distinct, then the entire contract is accounted for as a single performance obligation. In situations when the Company's contracts includesinclude distinct goods or services that are substantially the same and have the same pattern of transfer to the customer over time, they are recognized as a series of distinct goods or services. For any contracts with multiple performance obligations, the Company allocates the contract’s transaction price to each performance obligation based on the estimated relative standalonestand-alone selling price of each distinct good or service in the contract. For product sales, each product sold to a customer typically represents a distinct performance obligation. In such cases, the observable standalonestand-alone sales are used to determine the stand alonestand-alone selling price.
Performance obligations are satisfied as of a point in time or over time. Performance obligations are supported by contracts with customers, providing a framework for the nature of the distinct goods, services or bundle of goods and services. The timing of satisfying the performance obligation is typically indicated by the terms of the contract.
The following table outlines the Company's remaining performance obligations disaggregated by reportable business segment:
| | | | | | | | |
| | December 31, 20212023 |
| Aerospace | | $ | 9,42313,898 | |
| Honeywell Building Technologies | | 6,8717,302 | |
| Performance Materials and Technologies | | 7,2438,643 | |
| Safety and Productivity Solutions | | 4,1431,887 | |
Corporate and All Other(1)1 | | 247 | |
| Total performance obligations2 | $ | 27,68231,777 | |
| | | | | | | | |
| 1 | | The remaining performance obligations within Corporate and All Other relate to the Quantinuum business. |
| 2 | | Effective March 31, 2022, performance obligations exclude contracts with customers related to Russia as collectability is not reasonably assured. |
(1) The remaining performance obligations within Corporate and All Other relate to the Quantinuum business.
6668 Honeywell International Inc.
| | | | | |
| FINANCIAL STATEMENTS AND SUPPLEMENTARY DATA |
HONEYWELL INTERNATIONAL INC.
NOTES TO CONSOLIDATED FINANCIAL STATEMENTS—(Continued)
(Dollars in tables in millions, except per share amounts)
Performance obligations recognized as of December 31, 20212023 will be satisfied over the course of future periods. The Company's disclosure of the timing for satisfying the performance obligation is based on the requirements of contracts with customers. However, from time to time, these contracts may be subject to modifications, impacting the timing of satisfying the performance obligations. Performance obligations expected to be satisfied within one year and greater than one year are 59%60% and 41%40%, respectively.
The timing of satisfaction of the Company's performance obligations does not significantly vary from the typical timing of payment. Typical payment terms of the Company's fixed-pricefixed price over time contracts include progress payments based on specified events or milestones or based on project progress. For some contracts, the Company may be entitled to receive an advance payment.
The Company has applied the practical expedient for certain revenue streams to exclude the value of remaining performance obligations for (i) contracts with an original expected term of one year or less or (ii) contracts for which the Company recognizes revenue in proportion to the amount the Company has the right to invoice for services performed.
Honeywell International Inc. 67
FINANCIAL STATEMENTS AND SUPPLEMENTARY DATA
HONEYWELL INTERNATIONAL INC.
NOTES TO CONSOLIDATED FINANCIAL STATEMENTS—(Continued)
(Dollars in tables in millions, except per share amounts)
NOTE 4. REPOSITIONING AND OTHER CHARGES
A summary of net repositioning and other charges follows:
| | | | Years Ended December 31, | | Years Ended December 31, |
| 2021 | 2020 | 2019 | 2023 | | 2022 | | 2021 |
| Severance | Severance | | $ | 80 | | | $ | 475 | | | $ | 260 | |
| Asset impairments | Asset impairments | | 117 | | | 21 | | | 95 | |
| Exit costs | Exit costs | | 134 | | | 69 | | | 83 | |
| Reserve adjustments | Reserve adjustments | | (13) | | | (47) | | | (5) | |
| Total net repositioning charge | | 318 | | | 518 | | | 433 | |
| Asbestos related litigation charges, net of insurance and reimbursements | | 129 | | | 50 | | | 42 | |
| Total net repositioning charges | |
| Asbestos-related charges, net of insurance and reimbursements | |
| Probable and reasonably estimable environmental liabilities, net of reimbursements | Probable and reasonably estimable environmental liabilities, net of reimbursements | | 22 | | | 27 | | | 59 | |
| Other charges | Other charges | | 100 | | | (20) | | | 12 | |
| Total net repositioning and other charges | Total net repositioning and other charges | | $ | 569 | | | $ | 575 | | | $ | 546 | |
The following table summarizes the pre-tax distribution of total net repositioning and other charges by classification in the Consolidated Statement of Operations:
| | | | Years Ended December 31, | | Years Ended December 31, |
| 2021 | 2020 | 2019 | 2023 | | 2022 | | 2021 |
| Cost of products and services sold | Cost of products and services sold | | $ | 457 | | | $ | 308 | | | $ | 276 | |
| Selling, general and administrative expenses | Selling, general and administrative expenses | | 112 | | | 267 | | | 270 | |
| Other (income) expense | Other (income) expense | | — | | | — | | | — | |
| | | $ | 569 | | | $ | 575 | | | $ | 546 | |
| Total net repositioning and other charges | |
The following table summarizes the pre-tax amount of total net repositioning and other charges by reportable business segment. These amounts are excluded from segment profit as described in Note 22 Segment Financial Data.Data:
| | | | Years Ended December 31, | | Years Ended December 31, |
| 2021 | 2020 | 2019 | 2023 | | 2022 | | 2021 |
| Aerospace | Aerospace | | $ | 62 | | | $ | 157 | | | $ | 33 | |
| Honeywell Building Technologies | Honeywell Building Technologies | | 13 | | | 100 | | | 108 | |
| Performance Materials and Technologies | Performance Materials and Technologies | | 24 | | | 167 | | | 93 | |
| Safety and Productivity Solutions | Safety and Productivity Solutions | | 268 | | | 41 | | | 71 | |
| Corporate and All Other | Corporate and All Other | | 202 | | | 110 | | | 241 | |
| | | $ | 569 | | | $ | 575 | | | $ | 546 | |
| Total net repositioning and other charges | |
6869 Honeywell International Inc.
| | | | | |
| FINANCIAL STATEMENTS AND SUPPLEMENTARY DATA |
HONEYWELL INTERNATIONAL INC.
NOTES TO CONSOLIDATED FINANCIAL STATEMENTS—(Continued)
(Dollars in tables in millions, except per share amounts)
NET REPOSITIONING CHARGES
In 2023, the Company recognized gross repositioning charges totaling $342 million, including severance costs of $162 million related to workforce reductions of 5,854 manufacturing and administrative positions mainly in the Company's Honeywell Building Technologies and Safety and Productivity Solutions reportable business segments. The workforce reductions related to productivity and ongoing functional transformation initiatives. The repositioning charges included asset impairments of $41 million related to the write-down of certain assets within the Company's Safety and Productivity Solutions reportable business segment and corporate function. The repositioning charges included exit costs of $139 million related to current period costs incurred for closure obligations associated with site transitions in the Company's Performance Materials and Technologies and Safety and Productivity Solutions reportable business segments. Also, $56 million of previously established reserves, primarily for severance, were returned to income due to higher-than-expected voluntary exits and adjustments to the scope of previously announced repositioning actions.
In 2022, the Company recognized repositioning charges totaling $420 million, including severance costs of $122 million related to workforce reductions of 4,345 manufacturing and administrative positions mainly in the Company's Safety and Productivity Solutions reportable business segment. The workforce reductions related to our productivity and ongoing functional transformation initiatives. The repositioning charges included asset impairments of $176 million related to the write-down of certain manufacturing and other equipment, primarily related to closing and relocating the production of certain respiratory manufacturing from a U.S.-based facility to a non-U.S. facility in the Company's Safety and Productivity Solutions reportable business segment. The repositioning charges included exit costs of $122 million related to current period costs incurred for closure obligations associated with site transitions in the Company's Performance Materials and Technologies and Aerospace reportable business segments. Also, $56 million of previously established reserves, primarily for severance, were returned to income due to higher than expected voluntary exits and adjustments to the scope of previously announced repositioning actions.
In 2021, the Company recognized repositioning charges totaling $331 million, including severance costs of $80 million related to workforce reductions of 6,432 manufacturing and administrative positions mainly in the Company's Safety and Productivity Solutions and Aerospace reportable business segments. The workforce reductions were primarily related to the re-alignmentrealignment of a product line in the Company's Safety and Productivity Solutions reportable business segment, site transitions, mainly in the Aerospace reportable business segment, to more cost-effective locations, and the Company's productivity and ongoing functional transformation initiatives.initiatives. The repositioning chargecharges included asset impairments of $117 million primarily related to the write-down of certain manufacturing and other equipment. The repositioning chargecharges included exit costs of $134 million primarily for current period exit costs incurred for previously approved repositioning projects, closure obligations associated with site transitions, and lease obligations for equipment. Also, $13$13 million of previously established reserves, primarily for severance, were returned to income due to adjustments to the scope of previously announced repositioning actions.
70 Honeywell International Inc.
| | | | | |
| FINANCIAL STATEMENTS AND SUPPLEMENTARY DATA |
HONEYWELL INTERNATIONAL INC.
NOTES TO CONSOLIDATED FINANCIAL STATEMENTS—(Continued)
(Dollars in tables in millions, except per share amounts)
The following table summarizes the status of the Company's total repositioning reserves:
| | | | | | | | | | | | | | | | | | | | | | | |
| Severance
Costs | | Asset
Impairments | | Exit
Costs | | Total |
| Balance at December 31, 2020 | $ | 527 | | | $ | — | | | $ | 74 | | | $ | 601 | |
| Charges | 80 | | | 117 | | | 134 | | | 331 | |
| Usage—cash | (299) | | | — | | | (83) | | | (382) | |
| Usage—noncash | — | | | (119) | | | — | | | (119) | |
| Divestitures | — | | | — | | | — | | | — | |
| Adjustments | (14) | | | 2 | | | (1) | | | (13) | |
| Foreign currency translation | (5) | | | — | | | (2) | | | (7) | |
| Balance at December 31, 2021 | 289 | | | — | | | 122 | | | 411 | |
| Charges | 122 | | | 176 | | | 122 | | | 420 | |
| Usage—cash | (135) | | | — | | | (140) | | | (275) | |
| Usage—noncash | — | | | (168) | | | (15) | | | (183) | |
| Divestitures | — | | | — | | | — | | | — | |
| Adjustments | (42) | | | (8) | | | (6) | | | (56) | |
| Foreign currency translation | 1 | | | — | | | (9) | | | (8) | |
| Balance at December 31, 2022 | 235 | | | — | | | 74 | | | 309 | |
| Charges | 162 | | | 41 | | | 139 | | | 342 | |
| Usage—cash | (173) | | | — | | | (121) | | | (294) | |
| Usage—noncash | — | | | (36) | | | — | | | (36) | |
| Divestitures | — | | | (4) | | | (5) | | | (9) | |
| Adjustments | (42) | | | (1) | | | (13) | | | (56) | |
| Foreign currency translation | 6 | | | — | | | 17 | | | 23 | |
| Balance at December 31, 2023 | $ | 188 | | | $ | — | | | $ | 91 | | | $ | 279 | |
Certain repositioning projects will recognize exit costs in future periods when the actual liability is incurred. Such exit costs incurred in 2023, 2022, and 2021 were $62 million, $63 million, and $45 million, respectively.
OTHER CHARGES
In 2021,2022, the Company recognized $295 million of Other charges related to the initial suspension and the wind down of our business and operations in Russia. These costs impacted all reportable business segments, with the most significant impact within the Performance Materials and Technologies reportable business segment. The Other charges include costs recorded in Cost of products sold, Selling, general and administrative expenses, or Other (income) expense in the Consolidated Statement of Operations. Cost of products and services sold includes $65 million primarily related to inventory reserves and the write-down of other assets, Selling, general and administrative includes $185 million primarily related to reserves against outstanding accounts receivable and contract assets, impairment of intangible assets, the write-down of other assets, and employee severance, and Other (income) expense includes $45 million related to foreign exchange revaluation on an intercompany loan with a Russian affiliate, impairment of property, plant and equipment, and expenses for called guarantees. Directly attributable to our wind down of businesses and operations in Russia, but excluded from Other charges, is a $2 million tax valuation allowance recorded to Tax expense in the Consolidated Statement of Operations.
Given the uncertainty inherent in the Company's remaining obligations related to contracts with Russian counterparties, the Company does not believe it is possible to develop estimates of reasonably possible loss in excess of current accruals for these matters (other than as specifically set forth above). Based on available information to date, the Company’s estimate of potential future losses or other contingencies related to suspension and wind down activities, including any guarantee payments or any litigation costs or as otherwise related to the Company's wind down in Russia, could adversely affect the Company's consolidated results of operations in the periods recognized but would not be material with respect to the Company's consolidated financial position. See Note 19 Commitments and Contingencies for a discussion of the recognition and measurement of estimate for contingencies.
71 Honeywell International Inc.
| | | | | |
| FINANCIAL STATEMENTS AND SUPPLEMENTARY DATA |
HONEYWELL INTERNATIONAL INC.
NOTES TO CONSOLIDATED FINANCIAL STATEMENTS—(Continued)
(Dollars in tables in millions, except per share amounts)
Additionally, for the years ended December 31, 2022, and 2021, Other charges include $41 million and $105 million, respectively, of incremental long-term contract labor cost inefficiencies due to severe supply chain disruptions (attributable to the COVID-19 pandemic) relating to the warehouse automation business within the Safety and Productivity Solutions reportable business segment. Certain of these costs incurred include amounts and provisions for anticipated losses recognized during the fourth quarter2022 and 2021 when total estimated costs at completion for certain of the business’ long-term contracts exceeded total estimated revenue. These costs represent unproductive labor costs due to unexpected supply delays and the resulting downstream installation issues, demobilization and remobilization of contract workers, and resolution of contractor disputes. These costs do not include normal operational inefficiencies experienced during a challenging operating environment in 2022 and 2021.
In 2020, the Company recognized repositioning charges totaling $565 million, including severance costs of $475 million related to workforce reductions of 14,159 manufacturing and administrative positions across the Company's segments, with a majority of the workforce reductions in Aerospace and Performance Materials and Technologies. The workforce reductions primarily related to the Company aligning its cost structure with the slowdown in demand for many of its products and services due to the global recession, the Company's productivity and ongoing functional transformation initiatives, and to site consolidations and hub strategies. The repositioning charge included exit costs of $69 million primarily related to current period exit costs incurred for previously approved repositioning projects. Also, $47 million of previously established reserves, primarily for severance, were returned to income mainly as a result of higher attrition than anticipated in prior severance actions resulting in lower payments.
In 2019, the Company recognized repositioning charges totaling $438 million, including severance costs of $260 million related to workforce reductions of 5,336 manufacturing and administrative positions across the Company's segments. The workforce reductions related to the Company's productivity and ongoing functional transformation initiatives and to site transitions, mainly in Honeywell Building Technologies, as the Company transitions manufacturing to more cost-effective locations. The repositioning charge included asset impairments of $95 million largely related to a write down in connection with assets held for sale. The repositioning charge included exit costs of $83 million primarily related to current period exit costs incurred for previously approved repositioning projects, termination fees associated with the early cancellation of supply agreements for certain raw materials in Performance Materials and Technologies and Honeywell Building Technologies and for closure obligations associated with site transitions.NOTE 5. INCOME TAXES
INCOME BEFORE TAXES
| | | | | | | | | | | | | | | | | |
| | Years Ended December 31, |
| 2023 | | 2022 | | 2021 |
| U.S. | $ | 2,368 | | | $ | 3,305 | | | $ | 3,955 | |
| Non-U.S. | 4,791 | | | 3,074 | | | 3,280 | |
| Total Income before taxes | $ | 7,159 | | | $ | 6,379 | | | $ | 7,235 | |
TAX EXPENSE (BENEFIT)
Tax expense (benefit) consists of:
| | | | | | | | | | | | | | | | | |
| | Years Ended December 31, |
| 2023 | | 2022 | | 2021 |
| | | | | |
| Current | | | | | |
| U.S. Federal | $ | 176 | | | $ | 653 | | | $ | 415 | |
| U.S. State | 60 | | | 124 | | | 146 | |
| Non-U.S. | 1,098 | | | 815 | | | 886 | |
| Total current tax expense (benefit) | 1,334 | | | 1,592 | | | 1,447 | |
| Deferred | | | | | |
| U.S. Federal | 27 | | | (175) | | | 173 | |
| U.S. State | 11 | | | (36) | | | 37 | |
| Non-U.S. | 115 | | | 32 | | | (32) | |
| Total deferred tax expense (benefit) | 153 | | | (180) | | | 178 | |
| Total Tax expense | $ | 1,487 | | | $ | 1,412 | | | $ | 1,625 | |
72 Honeywell International Inc.69
| | | | | |
| FINANCIAL STATEMENTS AND SUPPLEMENTARY DATA |
HONEYWELL INTERNATIONAL INC.
NOTES TO CONSOLIDATED FINANCIAL STATEMENTS—(Continued)
(Dollars in tables in millions, except per share amounts)
The following table summarizesU.S. federal statutory income tax rate is reconciled to the statuseffective income tax rate as follows:
| | | | | | | | | | | | | | | | | |
| | Years Ended December 31, |
| 2023 | | 2022 | | 2021 |
| | | | | |
| U.S. federal statutory income tax rate | 21.0 | % | | 21.0 | % | | 21.0 | % |
Taxes on non-U.S. earnings1,2,3 | (2.0) | | | (0.4) | | | (1.4) | |
U.S. state income taxes1 | 0.5 | | | 1.4 | | | 1.5 | |
| Reserves for tax contingencies | 3.4 | | | 1.1 | | | 2.2 | |
| Employee share-based payments | (0.3) | | | (0.9) | | | (0.7) | |
| | | | | |
| | | | | |
| Restructuring | — | | | 0.7 | | | (1.4) | |
| U.S. federal tax credits | (1.6) | | | (0.9) | | | (0.6) | |
| U.S. valuation allowance | (0.1) | | | (0.2) | | | 2.0 | |
| All other items—net | (0.1) | | | 0.3 | | | (0.1) | |
| Effective income tax rate | 20.8 | % | | 22.1 | % | | 22.5 | % |
| | | | | | | | |
| 1 | | Net of changes in valuation allowance. |
| 2 | | Includes U.S. taxes on non-U.S. earnings, net of foreign tax credits. |
| 3 | | 2023 includes (3.6)% deferred tax benefit resulting from a non-U.S. legislative change, offset by 3.6% deferred tax expense resulting from a full valuation allowance. |
The effective tax rate decreased by 1.3 percentage points in 2023 compared to 2022. The decrease was primarily attributable to the increased benefit of taxes on non-U.S. earnings and lower expense related to unremitted withholding taxes on non-U.S. earnings, partially offset by incremental tax expense for reserves. The Company’s 2023 non-U.S. effective tax rate was 25.3%, a decrease of approximately 2.2 percentage points compared to 2022. The decrease in the non-U.S. effective tax rate was primarily attributable to increased benefit of taxes on non-U.S. earnings and lower expense related to unremitted withholding taxes on non-U.S. earnings, partially offset by incremental tax expense for reserves.
The effective tax rate decreased by 0.4 percentage points in 2022 compared to 2021. The decrease was primarily a result of additional tax expense reported in 2021 arising from a valuation allowance established against a capital loss, partially offset by a tax benefit related to restructuring transactions. In 2022, the valuation allowance was partially released as losses were utilized against a capital gain. Additionally, in 2022, there was lower tax expense reported for contingencies as a result of the Company's total repositioning reserves:
| | | | | | | | | | | | | | | | | | | | | | | | | | |
| Severance
Costs | Asset
Impairments | Exit
Costs | Total |
| Balance at December 31, 2018 | | $ | 489 | | | $ | — | | | $ | 77 | | | $ | 566 | |
| Charges | | 260 | | | 95 | | | 83 | | | 438 | |
| Usage—cash | | (186) | | | — | | | (63) | | | (249) | |
| Usage—noncash | | — | | | (100) | | | — | | | (100) | |
| Divestitures | | — | | | — | | | — | | | — | |
| Adjustments | | (8) | | | 5 | | | (2) | | | (5) | |
| Foreign currency translation | | — | | | — | | | 1 | | | 1 | |
| Balance at December 31, 2019 | | 555 | | | — | | | 96 | | | 651 | |
| Charges | | 475 | | | 21 | | | 69 | | | 565 | |
| Usage—cash | | (474) | | | — | | | (90) | | | (564) | |
| Usage—noncash | | — | | | (21) | | | — | | | (21) | |
| Divestitures | | — | | | — | | | — | | | — | |
| Adjustments | | (44) | | | — | | | (3) | | | (47) | |
| Foreign currency translation | | 15 | | | — | | | 2 | | | 17 | |
| Balance at December 31, 2020 | | 527 | | | — | | | 74 | | | 601 | |
| Charges | | 80 | | | 117 | | | 134 | | | 331 | |
| Usage—cash | | (299) | | | — | | | (83) | | | (382) | |
| Usage—noncash | | — | | | (119) | | | — | | | (119) | |
| Divestitures | | — | | | — | | | — | | | — | |
| Adjustments | | (14) | | | 2 | | | (1) | | | (13) | |
| Foreign currency translation | | (5) | | | — | | | (2) | | | (7) | |
| Balance at December 31, 2021 | | $ | 289 | | | $ | — | | | $ | 122 | | | $ | 411 | |
Certain repositioning projects will recognize exit costsrelease of certain state income tax reserves. The Company’s 2022 non-U.S. effective tax rate was 27.5%, an increase of approximately 1.5 percentage points compared to 2021. The increase in future periodsthe non-U.S. effective tax rate was primarily attributable to a 2021 tax benefit recorded for the release of a valuation allowance on net operating losses due to restructuring in Canada, which resulted in more tax expense in 2022 compared to 2021. This increase was partially offset by lower tax expense recorded in 2022 related to tax reserves when the actual liability is incurred. Such exit costs incurred in 2021, 2020, and 2019 were not significant.
7073 Honeywell International Inc.
| | | | | |
| FINANCIAL STATEMENTS AND SUPPLEMENTARY DATA |
HONEYWELL INTERNATIONAL INC.
NOTES TO CONSOLIDATED FINANCIAL STATEMENTS—(Continued)
(Dollars in tables in millions, except per share amounts)
NOTE 5. INCOME TAXES
INCOME BEFORE TAXES
| | | | | | | | | | | | | | | | | | | | |
| | Years Ended December 31, |
| 2021 | 2020 | 2019 |
| U.S. | | $ | 3,955 | | | $ | 3,318 | | | $ | 4,178 | |
| Non-U.S. | | 3,280 | | | 2,694 | | | 3,381 | |
| | $ | 7,235 | | | $ | 6,012 | | | $ | 7,559 | |
TAX EXPENSE (BENEFIT)
| | | | | | | | | | | | | | | | | | | | |
| | Years Ended December 31, |
| 2021 | 2020 | 2019 |
| Tax expense (benefit) consists of | | | | | | |
| Current: | | | | | | |
| U.S. Federal | | $ | 415 | | | $ | 475 | | | $ | 8 | |
| U.S. State | | 146 | | | 79 | | | 43 | |
| Non-U.S. | | 886 | | | 768 | | | 1,099 | |
| | | $ | 1,447 | | | $ | 1,322 | | | $ | 1,150 | |
| Deferred: | | | | | | |
| U.S. Federal | | $ | 173 | | | $ | 234 | | | $ | 332 | |
| U.S. State | | 37 | | | 39 | | | 63 | |
| Non-U.S. | | (32) | | | (448) | | | (216) | |
| | 178 | | | (175) | | | 179 | |
| | | $ | 1,625 | | | $ | 1,147 | | | $ | 1,329 | |
| | | | | | | | | | | | | | | | | | | | |
| | Years Ended December 31, |
| 2021 | 2020 | 2019 |
| The U.S. federal statutory income tax rate is reconciled to the effective income tax rate as follows: | | | | | | |
| U.S. federal statutory income tax rate | | 21.0 | % | | 21.0 | % | | 21.0 | % |
Taxes on non-U.S. earnings(1)(2) | | (1.4) | | | (0.8) | | | (0.5) | |
U.S. state income taxes(1) | | 1.5 | | | 1.3 | | | 1.1 | |
| Reserves for tax contingencies | | 2.2 | | | (2.6) | | | 2.0 | |
| Employee share-based payments | | (0.7) | | | (1.2) | | | (1.2) | |
| Reduction of certain receivables | | — | | | 2.0 | | | — | |
| U.S. Tax Cuts and Jobs Act | | — | | | — | | | (3.6) | |
| Restructuring | | (1.4) | | | — | | | — | |
| U.S. Valuation Allowance | | 2.0 | | | 0.1 | | | — | |
| All other items—net | | (0.7) | | | (0.7) | | | (1.2) | |
| | 22.5 | % | | 19.1 | % | | 17.6 | % |
(1)Net of changes in valuation allowance
(2)Includes U.S. taxes on non-U.S. earnings
Honeywell International Inc. 71
FINANCIAL STATEMENTS AND SUPPLEMENTARY DATA
HONEYWELL INTERNATIONAL INC.
NOTES TO CONSOLIDATED FINANCIAL STATEMENTS—(Continued)
(Dollars in tables in millions, except per share amounts)
The effective tax rate increased by 3.4 percentage points in 2021 compared to 2020. The increase was primarily due to the establishment of a valuation allowance for deferred tax assets not expected to be realized, incremental tax reserves, a lower tax benefit from restructuring and the absence of prior year items including tax benefits realized as a result of the favorable resolution of a foreign tax matter related to the spin-off transactions, tax law changes in India and the resolution of certain U.S. tax matters offset by a non-cash charge related to the reduction of the aggregate carrying value of certain receivables with no corresponding tax benefit. The Company’s non-U.S. effective tax rate was 26.0%, an increase of approximately 14.1 percentage points compared to 2020. The increase in the foreign effective tax rate was primarily attributable to incremental tax reserves, the tax impact of restructuring and the absence of prior year items including the favorable resolution of a foreign tax matter related to the previously completed spin-off transactions and tax law changes in India.
The effective tax rate increased by 1.5 percentage points in 2020 compared to 2019. The increase was primarily attributable to accrued withholding taxes related to unremitted foreign earnings and non-cash charges related to the reduction of the aggregate carrying value of certain receivables with no corresponding tax benefit, offset by the favorable resolution of a foreign tax matter related to the previously completed spin-off transactions, tax impact of restructuring, tax law changes in India, and the resolution of certain U.S. tax matters. The Company’s non-U.S. effective tax rate was 11.9%, a decrease of approximately 14.2 percentage points compared to 2019. The decrease in the foreign effective tax rate was primarily attributable to the favorable resolution of a foreign tax matter related to the previously completed spin-off transactions, tax impact of restructuring, and tax law changes in India offset by accrued withholding taxes related to unremitted foreign earnings.
DEFERRED TAX ASSETS (LIABILITIES)
The tax effects of temporary differences and tax carryforwards which give rise to future income tax benefits and payables are as follows:
| | Deferred tax assets: | December 31, |
| 2021 | 2020 |
| Deferred tax assets | | Deferred tax assets | December 31, |
| 2023 | | 2022 |
| Postretirement benefits other than pensions | Postretirement benefits other than pensions | | $ | 77 | | | $ | 85 | |
| Asbestos and environmental | Asbestos and environmental | | 468 | | | 508 | |
| Capitalized research and development | |
| Employee compensation and benefits | Employee compensation and benefits | | 174 | | | 180 | |
| Lease liabilities | Lease liabilities | | 242 | | | 197 | |
| Other accruals and reserves | Other accruals and reserves | | 260 | | | 110 | |
| Net operating and capital losses | | 734 | | | 779 | |
| Net operating losses | |
| Capital loss limitation and carryover | Capital loss limitation and carryover | | 151 | | | — | |
| Tax credit carryforwards | | 164 | | | 219 | |
| Tax credit carryforwards and other attributes | |
| Gross deferred tax assets | Gross deferred tax assets | | 2,270 | | | 2,078 | |
| Valuation allowance | Valuation allowance | | (857) | | | (766) | |
| Total deferred tax assets | Total deferred tax assets | | $ | 1,413 | | | $ | 1,312 | |
| Deferred tax liabilities: | |
| Deferred tax liabilities | |
| Pension | |
| Pension | |
| Pension | Pension | | $ | (948) | | | $ | (548) | |
| Property, plant and equipment | Property, plant and equipment | | (464) | | | (437) | |
| Right-of-use asset | Right-of-use asset | | (230) | | | (184) | |
| Intangibles | Intangibles | | (883) | | | (898) | |
| Unremitted earnings of foreign subsidiaries | Unremitted earnings of foreign subsidiaries | | (426) | | | (398) | |
| Other asset basis differences | Other asset basis differences | | (334) | | | (169) | |
| Other | Other | | (2) | | | (31) | |
| Total deferred tax liabilities | Total deferred tax liabilities | | (3,287) | | | (2,665) | |
| Net deferred tax liability | Net deferred tax liability | | $ | (1,874) | | | $ | (1,353) | |
The Company's gross deferred tax assets include $1,378 million related to non-U.S. operations comprised primarily of net operating losses and other tax attribute carryforwards in Canada, France, Germany, Luxembourg, Switzerland, and the United Kingdom. The Company maintains a valuation allowance of $1,176 million against a portion of the non-U.S. gross deferred tax assets and a valuation allowance of $116 million against the U.S. gross deferred tax asset, primarily related to capital loss carryovers. The change in the valuation allowance resulted in an increase of $458 million, a decrease of $8 million, and an increase of $124 million to income tax expense in 2023, 2022, and 2021, respectively. The majority of the $458 million increase in 2023 tax expense relates to a $257 million valuation allowance resulting from uncertainty regarding the realizability of a $257 million deferred tax asset established as a result of a non-U.S. tax legislative change. The remaining $201 million relates to other tax attribute carryforwards. If the Company determines that the likelihood of realization of existing deferred tax assets changes, a corresponding increase or decrease to valuation allowances will be recognized as an increase or reduction to income tax expense in the period that determination is made.
As of December 31, 2023, the Company recorded a $542 million deferred tax liability on all unremitted foreign earnings based on estimated earnings and profits of approximately $15 billion as of the balance sheet date.
7274 Honeywell International Inc.
| | | | | |
| FINANCIAL STATEMENTS AND SUPPLEMENTARY DATA |
HONEYWELL INTERNATIONAL INC.
NOTES TO CONSOLIDATED FINANCIAL STATEMENTS—(Continued)
(Dollars in tables in millions, except per share amounts)
The Company's gross deferred tax assets include $901 million related to non-U.S. operations comprised principally of net operating losses, capital loss and tax credit carryforwards, primarily in Canada, France, Germany, Luxembourg, and the United Kingdom, and deductible temporary differences. The Company maintains a valuation allowance of $703 million against a portion of the non-U.S. gross deferred tax assets. Additionally, a valuation allowance of $150 million was established against the U.S. gross deferred tax asset for capital losses generated from restructuring transactions during the year. The change in the valuation allowance resulted in an increase of $124 million, increase of $105 million, and a decrease of $23 million to income tax expense in 2021, 2020 and 2019, respectively. In the event the Company determines that it will not be able to realize its net deferred tax assets in the future, the Company will reduce such amounts through an increase to income tax expense in the period such determination is made. Conversely, if the Company determines that it will be able to realize net deferred tax assets in excess of the carrying amounts, the Company will decrease the recorded valuation allowance through a reduction to income tax expense in the period that such determination is made.
As of December 31, 2021, the Company recorded a $426 million deferred tax liability on all unremitted foreign earnings based on estimated earnings and profits of approximately $17.1 billion as of the balance sheet date.
As of December 31, 2021,2023, the Company's net operating loss, capital loss, and tax credit carryforwards, and other attributes were as follows:
| | Jurisdiction | Jurisdiction | Expiration
Period | Net Operating
and Capital Loss
Carryforwards | Tax Credit
Carryforwards | Jurisdiction | | Net Operating
and Capital Loss
Carryforwards | | Tax Credit Carryforwards and Other Attributes |
| U.S. Federal | U.S. Federal | 2040 | | $ | 684 | | | $ | 97 | |
| U.S. State | U.S. State | 2040 | | 390 | | | 21 | |
| Non-U.S. | Non-U.S. | 2041 | | 466 | | | 50 | |
| Non-U.S. | Indefinite | | 2,185 | | | — | |
| | | $ | 3,725 | | | $ | 168 | |
| Total | |
Many jurisdictions impose limitations on the timing and utilization of net operating loss and tax credit carryforwards. In those instances, whereby there is an expected permanent limitation onApproximately $3,140 million of the utilization of thenon-U.S. net operating loss orhas no expiration period. The U.S. federal capital loss carryforward of $502 million expires in 2026. The remaining net operating loss, capital loss and credit carryforwards, and other tax credit carryforward, the deferred tax asset and amount of the carryforwardattributes have been reduced.expiration periods through 2043.
| | Years Ended December 31, |
| 2021 | 2020 | 2019 |
| Change in unrecognized tax benefits: | | | | | | |
| Years Ended December 31, | | | Years Ended December 31, |
| 2023 | | | 2023 | | 2022 | | 2021 |
| Change in unrecognized tax benefits | | Change in unrecognized tax benefits | | | | | |
| Balance at beginning of year | Balance at beginning of year | | $ | 991 | | | $ | 1,164 | | | $ | 1,089 | |
| Gross increases related to current period tax positions | Gross increases related to current period tax positions | | 93 | | | 94 | | | 51 | |
| Gross increases related to prior periods tax positions | Gross increases related to prior periods tax positions | | 39 | | | 68 | | | 83 | |
| Gross decreases related to prior periods tax positions | Gross decreases related to prior periods tax positions | | (27) | | | (256) | | | (34) | |
| Decrease related to resolutions of audits with tax authorities | Decrease related to resolutions of audits with tax authorities | | (1) | | | (35) | | | (3) | |
| Expiration of the statute of limitations for the assessment of taxes | Expiration of the statute of limitations for the assessment of taxes | | (12) | | | (76) | | | (13) | |
| Foreign currency translation | Foreign currency translation | | (22) | | | 32 | | | (9) | |
| Balance at end of year | Balance at end of year | | $ | 1,061 | | | $ | 991 | | | $ | 1,164 | |
As of December 31, 2021, 20202023, 2022, and 2019,2021, there were $1,061$1,225 million, $991$1,086 million, and $1,164$1,061 million, respectively, of unrecognized tax benefits that if recognized would be recorded as a component of Tax expense.
Honeywell International Inc. 73
FINANCIAL STATEMENTS AND SUPPLEMENTARY DATA
HONEYWELL INTERNATIONAL INC.
NOTES TO CONSOLIDATED FINANCIAL STATEMENTS—(Continued)
(Dollars in tables in millions, except per share amounts)
The following table summarizes tax years that remain subject to examination by major tax jurisdictions as of December 31, 2021:2023:
| | | | | | | | |
| Jurisdiction | Open Tax Years Based on Originally Filed Returns |
| Examination in progress | Examination not yet initiated |
| U.S. Federal | 2017-20182017-2021 | 2019-20212022-2023 |
| U.S. State | 2013-20192013-2021 | 2017-2021 |
Australia | n/a | 2018-2021 |
Canada(1)
| 2015-2018 | 2019-20212022-2023 |
| China | 2011-20202013-2022 | 20212023 |
| Germany | France2013-2020 | 2018-2020 | 2021 |
Germany(1)
| 2009-2018 | 2019-20212021-2023 |
| India | 1999-20202013-2020 | 20212021-2023 |
ItalyPuerto Rico | 2012-2018N/A | 2019-20212020-2023 |
NetherlandsSwitzerland | n/a2019-2020 | 2018-2021 |
Switzerland(1)
| 2016-2018 | 2019-20212021-2023 |
| United Kingdom | 2013-20192013-2021 | 2020-20212022-2023 |
(1)Includes provincial or similar local jurisdictions, as applicable.
Based on the outcome of these examinations, or as a result of the expiration of statute of limitations for specific jurisdictions, it is reasonably possible that certain unrecognized tax benefits for tax positions taken on previously filed tax returns will materially change from those recorded as liabilities in the Company's financial statements. In addition, the outcome of these examinations may impact the valuation of certain deferred tax assets (such as net operating losses) in future periods.
Unrecognized tax benefits for examinations in progress were $592$803 million, $556$640 million, and $413$592 million as of December 31, 2021, 20202023, 2022, and 2019,2021, respectively. Estimated interest and penalties related to the underpayment of income taxes are classified as a component of Tax expense in the Consolidated Statement of Operations and totaled $79$74 million, $80$5 million, and $73$79 million for the years ended December 31, 2021, 20202023, 2022, and 2019,2021, respectively. Accrued interest and penalties were $580$612 million, $507$557 million, and $487$580 million as of December 31, 2023, 2022, and 2021, 2020 and 2019, respectively.
NOTE 6. INVENTORIES
| | | | | | | | | | | | | | |
| | December 31, |
| 2021 | 2020 |
| Raw materials | | $ | 1,352 | | | $ | 1,079 | |
| Work in process | | 861 | | | 798 | |
| Finished products | | 2,925 | | | 2,612 | |
| | $ | 5,138 | | | $ | 4,489 | |
7475 Honeywell International Inc.
| | | | | |
| FINANCIAL STATEMENTS AND SUPPLEMENTARY DATA |
HONEYWELL INTERNATIONAL INC.
NOTES TO CONSOLIDATED FINANCIAL STATEMENTS—(Continued)
(Dollars in tables in millions, except per share amounts)
NOTE 6. INVENTORIES
| | | | | | | | | | | |
| | December 31, |
| 2023 | | 2022 |
| Raw materials | $ | 1,704 | | | $ | 1,407 | |
| Work in process | 1,217 | | | 1,049 | |
| Finished products | 3,257 | | | 3,082 | |
| Total Inventories | $ | 6,178 | | | $ | 5,538 | |
NOTE 7. PROPERTY, PLANT AND EQUIPMENT—NET
| | | | December 31, | | December 31, |
| 2021 | 2020 | 2023 | | 2022 |
| Land and improvements | Land and improvements | | $ | 226 | | | $ | 259 | |
| Machinery and equipment | Machinery and equipment | | 10,143 | | | 10,008 | |
| Buildings and improvements | Buildings and improvements | | 3,225 | | | 3,245 | |
| Construction in progress | Construction in progress | | 856 | | | 825 | |
| 14,450 | | | 14,337 | |
| Total Property, plant and equipment | |
| Less—Accumulated depreciation | Less—Accumulated depreciation | | (8,888) | | | (8,767) | |
| $ | 5,562 | | | $ | 5,570 | |
| Total Property, plant and equipment—net | |
Depreciation expense was $674$659 million, $644$657 million, and $673$674 million for the years ended December 31, 2021, 20202023, 2022, and 2019,2021, respectively.
NOTE 8. GOODWILL AND OTHER INTANGIBLE ASSETS—NET
The following table summarizes the change in the carrying amount of goodwill for the years ended December 31, 20212023, and 20202022, by segment.reportable business segment:
| | | | | | | | | | | | | | | | | | | | | | | | | | |
| December 31, 2020 | Acquisitions/
Divestitures | Currency
Translation
Adjustment | December 31, 2021 |
| Aerospace | | $ | 2,378 | | | $ | 21 | | | $ | — | | | $ | 2,399 | |
| Honeywell Building Technologies | | 3,385 | | | 20 | | | (88) | | | 3,317 | |
| Performance Materials and Technologies | | 5,255 | | | 1,019 | | | (136) | | | 6,138 | |
| Safety and Productivity Solutions | | 5,040 | | | (32) | | | (47) | | | 4,961 | |
| Corporate and All Other | | — | | | 943 | | | (2) | | | 941 | |
| | $ | 16,058 | | | $ | 1,971 | | | $ | (273) | | | $ | 17,756 | |
Other intangible assets are comprised of:
| | | | | | | | | | | | | | | | | | | | | | | | | | | | | | | | | | | | | | | | | |
| | December 31, 2021 | | December 31, 2020 |
Gross
Carrying
Amount | Accumulated
Amortization | Net
Carrying
Amount | | Gross
Carrying
Amount | Accumulated
Amortization | Net
Carrying
Amount |
| Determinable life intangibles: | | | | | | | | | | | | | |
| Patents and technology | | $ | 2,345 | | | $ | (1,678) | | | $ | 667 | | | | $ | 2,159 | | | $ | (1,595) | | | $ | 564 | |
| Customer relationships | | 4,045 | | | (2,235) | | | 1,810 | | | | 3,889 | | | (2,050) | | | 1,839 | |
| Trademarks | | 356 | | | (261) | | | 95 | | | | 327 | | | (247) | | | 80 | |
| Other | | 298 | | | (271) | | | 27 | | | | 298 | | | (267) | | | 31 | |
| | | 7,044 | | | (4,445) | | | 2,599 | | | | 6,673 | | | (4,159) | | | 2,514 | |
| Indefinite life intangibles: | | | | | | | | | | | | | |
| Trademarks | | 1,014 | | | — | | | 1,014 | | | | 1,046 | | | — | | | 1,046 | |
| | $ | 8,058 | | | $ | (4,445) | | | $ | 3,613 | | | | $ | 7,719 | | | $ | (4,159) | | | $ | 3,560 | |
Intangible assets amortization expense was $465 million, $358 million and $415 million for the years ended December 31, 2021, 2020 and 2019, respectively. Estimated intangible asset amortization expense for each of the next five years approximates $310 million in 2022, $273 million in 2023, $250 million in 2024, $241 million in 2025 and $203 million in 2026. | | | | | | | | | | | | | | | | | | | | | | | |
| December 31, 2022 | | Acquisitions/
Divestitures | | Currency
Translation
Adjustment | | December 31, 2023 |
| Aerospace | $ | 2,376 | | | $ | — | | | $ | 10 | | | $ | 2,386 | |
| Honeywell Building Technologies | 3,338 | | | — | | | 42 | | | 3,380 | |
| Performance Materials and Technologies | 6,013 | | | 392 | | | 80 | | | 6,485 | |
| Safety and Productivity Solutions | 4,896 | | | — | | | (4) | | | 4,892 | |
| Corporate and All Other | 874 | | | — | | | 32 | | | 906 | |
| Total Goodwill | $ | 17,497 | | | $ | 392 | | | $ | 160 | | | $ | 18,049 | |
76 Honeywell International Inc.75
| | | | | |
| FINANCIAL STATEMENTS AND SUPPLEMENTARY DATA |
HONEYWELL INTERNATIONAL INC.
NOTES TO CONSOLIDATED FINANCIAL STATEMENTS—(Continued)
(Dollars in tables in millions, except per share amounts)
Other intangible assets are comprised of:
| | | | | | | | | | | | | | | | | | | | | | | | | | | | | | | | | | | |
| | December 31, 2023 | | December 31, 2022 |
Gross
Carrying
Amount | | Accumulated
Amortization | | Net
Carrying
Amount | | Gross
Carrying
Amount | | Accumulated
Amortization | | Net
Carrying
Amount |
| Definite-life intangibles | | | | | | | | | | | |
| Patents and technology | $ | 2,399 | | | $ | (1,837) | | | $ | 562 | | | $ | 2,313 | | | $ | (1,759) | | | $ | 554 | |
| Customer relationships | 4,199 | | | (2,601) | | | 1,598 | | | 3,989 | | | (2,397) | | | 1,592 | |
| Trademarks | 362 | | | (284) | | | 78 | | | 371 | | | (273) | | | 98 | |
| Other | 299 | | | (277) | | | 22 | | | 299 | | | (274) | | | 25 | |
| Total definite-life intangibles—net | 7,259 | | | (4,999) | | | 2,260 | | | 6,972 | | | (4,703) | | | 2,269 | |
| Indefinite-life intangibles | | | | | | | | | | | |
| Trademarks | 971 | | | — | | | 971 | | | 953 | | | — | | | 953 | |
| Total Other intangible assets—net | $ | 8,230 | | | $ | (4,999) | | | $ | 3,231 | | | $ | 7,925 | | | $ | (4,703) | | | $ | 3,222 | |
Intangible assets amortization expense was $292 million, $333 million, and $465 million for the years ended December 31, 2023, 2022, and 2021, respectively. Estimated intangible asset amortization expense for each of the next five years approximates $287 million in 2024, $262 million in 2025, $257 million in 2026, $247 million in 2027, and $249 million in 2028.
77 Honeywell International Inc.
| | | | | |
| FINANCIAL STATEMENTS AND SUPPLEMENTARY DATA |
HONEYWELL INTERNATIONAL INC.
NOTES TO CONSOLIDATED FINANCIAL STATEMENTS—(Continued)
(Dollars in tables in millions, except per share amounts)
NOTE 9. LONG-TERM DEBT AND CREDIT AGREEMENTS
| | | | December 31, | | December 31, |
| 2021 | | 2020 | 2023 | | 2022 |
| | 4.25% notes due 2021 | | $ | — | | | $ | 800 | |
| 1.85% notes due 2021 | | — | | | 1,500 | |
| 0.483% notes due 2022 | | 500 | | | 2,500 | |
| 2.15% notes due 2022 | | 600 | | | 600 | |
| Floating rate notes due 2022 | | 600 | | | 1,100 | |
| | 1.30% Euro notes due 2023 | |
| | 1.30% Euro notes due 2023 | |
| | 1.30% Euro notes due 2023 | 1.30% Euro notes due 2023 | | 1,416 | | | 1,534 | |
| 3.35% notes due 2023 | 3.35% notes due 2023 | | 300 | | | 300 | |
| 0.00% Euro notes due 2024 | 0.00% Euro notes due 2024 | | 566 | | | 614 | |
| 2.30% notes due 2024 | 2.30% notes due 2024 | | 750 | | | 750 | |
| 4.85% notes due 2024 | |
| 1.35% notes due 2025 | 1.35% notes due 2025 | | 1,250 | | | 1,250 | |
| 2.50% notes due 2026 | 2.50% notes due 2026 | | 1,500 | | | 1,500 | |
| 1.10% notes due 2027 | 1.10% notes due 2027 | | 1,000 | | | — | |
| 3.50% Euro notes due 2027 | |
| 4.95% notes due 2028 | |
| 2.25% Euro notes due 2028 | 2.25% Euro notes due 2028 | | 849 | | | 920 | |
| 4.25% notes due 2029 | |
| 2.70% notes due 2029 | 2.70% notes due 2029 | | 750 | | | 750 | |
| 1.95% notes due 2030 | 1.95% notes due 2030 | | 1,000 | | | 1,000 | |
| 1.75% notes due 2031 | 1.75% notes due 2031 | | 1,500 | | | — | |
| 0.75% Euro notes due 2032 | 0.75% Euro notes due 2032 | | 566 | | | 614 | |
| 3.75% Euro notes due 2032 | |
| 5.00% notes due 2033 | |
| 4.50% notes due 2034 | |
| 4.125% Euro notes due 2034 | |
| 5.70% notes due 2036 | 5.70% notes due 2036 | | 441 | | | 441 | |
| 5.70% notes due 2037 | 5.70% notes due 2037 | | 462 | | | 462 | |
| 5.375% notes due 2041 | 5.375% notes due 2041 | | 417 | | | 417 | |
| 3.812% notes due 2047 | 3.812% notes due 2047 | | 445 | | | 445 | |
| 2.80% notes due 2050 | 2.80% notes due 2050 | | 750 | | | 750 | |
| Industrial development bond obligations, floating rate maturing at various dates through 2037 | Industrial development bond obligations, floating rate maturing at various dates through 2037 | | 22 | | | 22 | |
| 6.625% debentures due 2028 | 6.625% debentures due 2028 | | 201 | | | 201 | |
| 9.065% debentures due 2033 | 9.065% debentures due 2033 | | 51 | | | 51 | |
| Other (including capitalized leases and debt issuance costs), 8.2% weighted average interest rate maturing at various dates through 2026 | | 121 | | | 266 | |
| 16,057 | | | 18,787 | |
| Less-current portion | | (1,803) | | | (2,445) | |
| $ | 14,254 | | | $ | 16,342 | |
| Other (including capitalized leases), 7.0% weighted average interest rate maturing at various dates through 2029 | |
| Fair value of hedging instruments | |
| Debt issuance costs | |
| Total Long-term debt and current related maturities | |
| Less: Current maturities of long-term debt | |
| Total Long-term debt | |
7678 Honeywell International Inc.
| | | | | |
| FINANCIAL STATEMENTS AND SUPPLEMENTARY DATA |
HONEYWELL INTERNATIONAL INC.
NOTES TO CONSOLIDATED FINANCIAL STATEMENTS—(Continued)
(Dollars in tables in millions, except per share amounts)
The schedule of principal payments on long-term debt is as follows:
| | | | December 31, 2021 | | December 31, 2023 |
| 2022 | | $ | 1,803 | |
| 2023 | | 1,810 | |
| 2024 | 2024 | | 1,344 | |
| 2025 | 2025 | | 1,258 | |
| 2026 | 2026 | | 1,503 | |
| 2027 | |
| 2028 | |
| Thereafter | Thereafter | | 8,339 | |
| 16,057 | |
| Less-current portion | | (1,803) | |
| $ | 14,254 | |
| Total Long-term debt and current related maturities | |
| Less: Current maturities of long-term debt | |
| Total Long-term debt | |
On NovemberDecember 1, 2021,2023, the Company repaid its 1.85%3.35% notes due 2021.2023.
On August 16, 2021May 17, 2023, the Company issued $1.0 billion 1.10%$750 million 4.25% Senior Notes due 20272029 and $1.5$1.0 billion 1.75%4.50% Senior Notes due 20312034 (collectively, the 2023 USD Notes). The Company may redeem the 2023 USD Notes at any time, and from time to time, in whole or in part, at the Company's option at the applicable make-whole redemption price. The offering provided gross proceeds of $1.8 billion, offset by $20 million in discount and closing costs related to the offering.
On May 17, 2023, the Company issued €650 million 3.50% Senior Notes due 2027 and €500 million 3.75% Senior Notes due 2032 (collectively, the 2023 Euro Notes). The Company may redeem the 2023 Euro Notes at any time, and from time to time, in whole or in part, at the Company's option at the applicable redemption price. The offering provided gross proceeds of $1.2 billion, offset by $12 million in discount and closing costs related to the offering.
The 2023 USD Notes and 2023 Euro Notes are senior unsecured and unsubordinated obligations of the Company and rank equally with each other and with all of the Company's existing and future senior unsecured debt and senior to all of the Company's subordinated debt. The offering provided gross proceeds of $2.5 billion, offset by $18.0 million in discount and closing costs relatedCompany intends to the offering. The Company useduse the proceeds from the issuances for the repayment of the offering to redeem at par $2 billion of the $2.5 billion in outstanding principal amount of the callable 0.483% Senior Notes due 2022commercial paper and to redeem in full and at par $500 million callable Floating rate Senior Notes due 2022 thatgeneral corporate purposes.
On February 22, 2023, the Company issued in August 2020.repaid its 1.30% Euro notes due 2023.
On March 31, 2021,20, 2023, the Company entered into a $1.5 billion 364-day credit agreement (the 364-Day Credit Agreement) and a $4.0 billion Amendedamended and Restated Five Year Credit Agreementrestated five-year credit agreement (the 5-Year Credit Agreement) and a $1.5 billion. The 364-Day Credit Agreement (thereplaced the $1.5 billion 364-day credit agreement dated as of March 24, 2022, which was terminated in accordance with its terms effective March 20, 2023. Amounts borrowed under the 364-Day Credit Agreement).Agreement are required to be repaid no later than March 18, 2024, unless (i) Honeywell elects to convert all then outstanding amounts into a term loan, upon which such amounts shall be repaid in full on March 18, 2025, or (ii) the 364-Day Credit Agreement is terminated earlier pursuant to its terms. The 5-Year Credit Agreement amended and restated the previously reported $4.0 billion amended and restated five-year credit agreement dated as of April 26, 2019.March 24, 2022. Commitments under the 5-Year Credit Agreement can be increased pursuant to the terms of the 5-Year Credit Agreement to an aggregate amount not to exceed $4.5 billion. The 364-Day Credit Agreement replaced the $1.5 billion 364-day credit agreement dated as of April 10, 2020, which was terminated in accordance with its terms effective March 31, 2021. Amounts borrowed under the 364-Day Credit Agreement are required to be repaid no later than March 30, 2022, unless (i) Honeywell elects to convert all then outstanding amounts into a term loan, upon which such amounts shall be repaid in full on March 30, 2023, or (ii) the 364-Day Credit Agreement is terminated earlier pursuant to its terms. Theand 5-Year Credit Agreement and the 364-Day Credit Agreement are maintained for general corporate purposes. On November 18, 2021, the Company amended the 364-Day Credit Agreement and the 5-Year Credit Agreement to transition from LIBOR-based benchmark rates to the appropriate replacement rates.
On March 1, 2021, the Company repaid its 4.25% notes due 2021.
As of December 31, 2021,2023, there were no outstanding borrowings under the 364-Day Credit Agreement or 5-Year Credit Agreement.
On August 19, 2020,November 2, 2022, the Company issued $2.5 billion 0.483%$400 million 4.85% Senior Notes due 2022 and2024, $500 million Floating Rate4.95% Senior Notes due 20222028, and $1.1 billion 5.00% Senior Notes due 2033 (collectively, the 2022 CallableUSD Notes). The $500 million Floating Rate Senior Notes due 2022 were issued at a variable interest rate equal to the three-month LIBOR plus the applicable margin of 0.23%. The Company may redeem the 2022 fixed rate notesUSD Notes at any time, and from time to time, in whole or in part, at the Company's option. The Company may redeem the 2022 floating rate notes at any time, in whole or in part, on or after August 19, 2021. The 2022 Callable Notes resulted in gross proceeds of $3.0 billion, offset by $10 million in discount and closing costs related to the offering. The Company used the proceeds of the offering to repay $3.0 billion of borrowings under the Term Loan Agreement (defined below).
On May 18, 2020, the Company issued $1.25 billion 1.35% Senior Notes due 2025, $1.0 billion 1.95% Senior Notes due 2030, and $750 million 2.80% Senior Notes due 2050 (collectively, the 2020 Notes) to replace and, accordingly, permanently reduce $3.0 billion of undrawn commitments under the Term Loan Agreement, referenced below. The Company may redeem the 2020 Notes at any time, in whole or in part,option at the Company's option.applicable redemption price. The offering provided gross proceeds of $3.0$2.0 billion, offset by $27$22 million in discount and closing costs related to the offering.
On March 10, 2020,November 2, 2022, the Company issued €500 million 0.00%€1.0 billion 4.125% Senior Notes due 2024 and €500 million 0.75% Senior Notes due 2032 (collectively, the 20202034 (the 2022 Euro Notes). The Company may redeem the 2022 Euro Notes at any time, and from time to time, in whole or in part, at the Company's option at the applicable redemption price. The offering provided gross proceeds of $1.1 billion,$990 million, offset by $9$17 million in discount and closing costs related to the offering.
The 2022 Callable Notes, 2020USD Notes and 20202022 Euro Notes are senior unsecured and unsubordinated obligations of the Company and rank equally with each other and with all of the Company's existing and future senior unsecured debt and senior to all of the Company's subordinated debt. The Company intends to use the proceeds from the issuance for general corporate purposes.
On August 8, 2022, the Company repaid its 2.15% and its Floating rate notes due 2022. On August 19, 2022, the Company repaid its 0.483% notes due 2022.
79 Honeywell International Inc.77
| | | | | |
| FINANCIAL STATEMENTS AND SUPPLEMENTARY DATA |
HONEYWELL INTERNATIONAL INC.
NOTES TO CONSOLIDATED FINANCIAL STATEMENTS—(Continued)
(Dollars in tables in millions, except per share amounts)
On March 26, 2020, the Company entered into a Delayed Draw Term Loan Agreement (the Term Loan Agreement) with a syndicate of banks. The Term Loan Agreement provided for a two-year, delayed draw term loan facility in the aggregate principal amount of $6.0 billion. Effective May 22, 2020, the Company permanently reduced the undrawn commitments under the Term Loan Agreement by an aggregate amount of $3.0 billion. On June 24, 2020, the Company drew on the remaining $3.0 billion of commitments under the Term Loan Agreement at a variable interest rate equal to the one-month LIBOR plus the applicable margin of 1.25%. The draw provided gross proceeds of $3.0 billion, offset by $7 million in closing costs related to the borrowing. On August 20, 2020, the Company prepaid the outstanding principal amount of $3.0 billion, using the proceeds from the offering of the 2022 Callable Notes.
On February 21, 2020, the Company paid its 0.65% Euro notes due 2020.
NOTE 10. LEASES
A significant portion of the Company's operating and finance lease portfolio includes corporate offices, research and development facilities, manufacturing sites, information technology equipment, and automobiles. The majority of the Company's leases have remaining lease terms of 1 year to 20 years, some of which include options to extend the leases for 5 years or more. Operating lease ROU assets are included in Other assets. The current portion of operating lease liabilities are included in Accrued liabilities, and the non-current portion of operating lease liabilities are included in Other liabilities onin the Consolidated Balance Sheet. Finance lease ROU assets are included in Property, plant and equipment—net. The current portion of finance lease liabilities are included in Current maturities of long-term debt, and the non-current portion of finance lease liabilities are included in Long-term debt onin the Consolidated Balance Sheet.
A portion of the Company's real estate leases isare generally subject to annual changes in the Consumer Price Index (CPI). The changes to the CPI are treated as variable lease payments and recognized in the period in which the obligation for those payments was incurred. In addition, a subset of the Company's automobile leases are considered variable. The variable lease payments for such automobilesautomobile leases are based on actual mileage incurred at the stated contractual rate and recognized in the period in which the obligation for those payments was incurred.
| | Years Ended December 31, | |
| Years Ended December 31, | |
| Years Ended December 31, | |
| | | Years Ended December 31, | |
| | | 2021 | 2020 | |
| Operating lease cost | Operating lease cost | | $ | 228 | | | $ | 214 | | |
| Operating lease cost | |
| Operating lease cost | |
| Variable lease cost | |
| Variable lease cost | |
| Variable lease cost | Variable lease cost | | 14 | | | 18 | | |
| Short-term lease cost | Short-term lease cost | | 15 | | | 17 | | |
| Finance lease cost: | | |
| Short-term lease cost | |
| Short-term lease cost | |
| Finance lease cost | |
| Finance lease cost | |
| Finance lease cost | |
| Amortization of right-of-use assets | |
| Amortization of right-of-use assets | |
| Amortization of right-of-use assets | Amortization of right-of-use assets | | 65 | | | 69 | | |
| Interest on lease liability | Interest on lease liability | | 24 | | | 27 | | |
| Interest on lease liability | |
| Interest on lease liability | |
| Total finance lease cost | |
| Total finance lease cost | |
| Total finance lease cost | Total finance lease cost | | 89 | | | 96 | | |
| Total lease cost | Total lease cost | | $ | 346 | | | $ | 345 | | |
| Total lease cost | |
| Total lease cost | |
Supplemental cash flow information related to leases was as follows:
| | | | | | | | | | | | | | | | |
| Years Ended December 31, | | |
| 2021 | 2020 | | |
| Cash paid for amounts included in the measurement of lease liabilities: | | | | | | |
| Operating cash flows for operating leases | | $ | 215 | | | $ | 206 | | | |
| Operating cash flows for finance leases | | 24 | | | 32 | | | |
| Financing cash flows for finance leases | | 67 | | | 65 | | | |
| Right-of-use assets obtained in exchange for lease obligations: | | | | | | |
| Operating leases | | $ | 350 | | | $ | 245 | | | |
| Finance leases | | 32 | | | 27 | | | |
Supplemental balance sheet information related to leases was as follows: | | | | | | | | | | | | | |
| Years Ended December 31, | | |
| 2023 | | 2022 | | |
| Cash paid for amounts included in the measurement of lease liabilities | | | | | |
| Operating cash flows for operating leases | $ | 237 | | | $ | 225 | | | |
| Operating cash flows for finance leases | 19 | | | 21 | | | |
| Financing cash flows for finance leases | 87 | | | 79 | | | |
| Right-of-use assets obtained in exchange for lease obligations | | | | | |
| Operating leases | $ | 339 | | | $ | 251 | | | |
| Finance leases | 42 | | | 61 | | | |
7880 Honeywell International Inc.
| | | | | |
| FINANCIAL STATEMENTS AND SUPPLEMENTARY DATA |
HONEYWELL INTERNATIONAL INC.
NOTES TO CONSOLIDATED FINANCIAL STATEMENTS—(Continued)
(Dollars in tables in millions, except per share amounts)
| | | | | | | | | | | | | | |
| December 31, |
| 2021 | 2020 |
| Operating leases: | | | | |
| Other assets | | $ | 947 | | | $ | 773 | |
| Accrued liabilities | | 185 | | | 187 | |
| Other liabilities | | 847 | | | 641 | |
| Total operating lease liabilities | | $ | 1,032 | | | $ | 828 | |
| Finance leases: | | | | |
| Property, plant and equipment | | $ | 325 | | | $ | 357 | |
| Accumulated depreciation | | (177) | | | (180) | |
| Property, plant and equipment—net | | $ | 148 | | | $ | 177 | |
| Current maturities of long-term debt | | $ | 57 | | | $ | 60 | |
| Long-term debt | | 99 | | | 124 | |
| Total finance lease liabilities | | $ | 156 | | | $ | 184 | |
| Weighted-average remaining lease term: | | | | |
| Operating leases | 9 years | 7 years |
| Finance leases | 3 years | 3 years |
| Weighted-average discount rate: | | | | |
| Operating leases | | 2.3 | % | | 2.9 | % |
| Finance leases | | 11.0 | % | | 16.3 | % |
| | | | | | | | | | | |
| December 31, |
| 2023 | | 2022 |
| Operating leases | | | |
| Other assets | $ | 1,004 | | | $ | 881 | |
| Accrued liabilities | 196 | | | 192 | |
| Other liabilities | 897 | | | 775 | |
| Total operating lease liabilities | $ | 1,093 | | | $ | 967 | |
| Finance leases | | | |
| Property, plant and equipment | $ | 402 | | | $ | 383 | |
| Accumulated depreciation | (204) | | | (161) | |
| Property, plant and equipment—net | $ | 198 | | | $ | 222 | |
| Current maturities of long-term debt | $ | 86 | | | $ | 77 | |
| Long-term debt | 99 | | | 145 | |
| Total finance lease liabilities | $ | 185 | | | $ | 222 | |
| Weighted average remaining lease term | | | |
| Operating leases | 9 years | | 8 years |
| Finance leases | 3 years | | 4 years |
| Weighted average discount rate | | | |
| Operating leases | 3.0 | % | | 2.1 | % |
| Finance leases | 8.5 | % | | 7.8 | % |
As of December 31, 2021,2023, maturities of lease liabilities were as follows:
| | | | | | | | | | | | | | |
| | Operating
Leases | Finance Leases |
| 2022 | | $ | 215 | | | $ | 77 | |
| 2023 | | 188 | | | 59 | |
| 2024 | | 153 | | | 47 | |
| 2025 | | 113 | | | 14 | |
| 2026 | | 91 | | | — | |
| Thereafter | | 404 | | | — | |
| Total lease payments | | 1,164 | | | 197 | |
| Less-interest | | (132) | | | (41) | |
| Total | | $ | 1,032 | | | $ | 156 | |
| | | | | | | | | | | |
| | Operating Leases | | Finance Leases |
| 2024 | $ | 222 | | | $ | 98 | |
| 2025 | 185 | | | 53 | |
| 2026 | 155 | | | 24 | |
| 2027 | 131 | | | 12 | |
| 2028 | 105 | | | 11 | |
| Thereafter | 443 | | | 7 | |
| Total lease payments | 1,241 | | | 205 | |
| Less: Interest | 148 | | | 20 | |
| Total maturities of lease liabilities | $ | 1,093 | | | $ | 185 | |
81 Honeywell International Inc.79
| | | | | |
| FINANCIAL STATEMENTS AND SUPPLEMENTARY DATA |
HONEYWELL INTERNATIONAL INC.
NOTES TO CONSOLIDATED FINANCIAL STATEMENTS—(Continued)
(Dollars in tables in millions, except per share amounts)
NOTE 11. DERIVATIVE INSTRUMENTS AND HEDGING TRANSACTIONS
DERIVATIVES AND HEDGING ACTIVITIES
The Company uses derivative financial instruments to manage its risks related to interest rates, and foreign currency exchange rate fluctuations.rates, and commodity prices. Derivative financial instruments are not used for trading or other speculative purposes. To qualify as a hedge, derivative financial instruments must be evaluated for hedge effectiveness at the inception of the contract and designated as a hedge. Changes in fair value of the derivative contract must be highly correlated with changes in fair value of the underlying hedged item at inception and over the life of the hedge contract.
FOREIGN CURRENCY RISK MANAGEMENT
The Company operates a global business in a wide variety of foreign currencies. The Company's exposure to market risk for changes in foreign currency exchange rates arises from international financing activities between subsidiaries, foreign currency denominated monetary assets and liabilities, and transactions arising from international trade. The Company's objective is to preserve the U.S. Dollar value of foreign currency denominated cash flows and earnings. The Company monitors its collective foreign currency exposure and enters into foreign currency exchange forward and option contracts (foreign currency exchange contracts) with third parties, when necessary, to minimize the impact of changes in foreign currency exchange rates.
The Company has monetary assets and liabilities denominated in non-functional currencies. Prior to conversion into U.S. dollars,Dollars, these assets and liabilities are remeasured at spot exchange rates in effect onas of the balance sheet date. The Company recognizes effects of changes in spot rates are recognized in earnings and included in Other (income) expense.
The Company uses foreign currency exchange contracts to hedge its foreign currency exposure. These contracts are marked-to-market with the resulting gainsin net income and losses recognized in earnings offsetting theoffset gains and losses on the non-functional currency denominated monetary assets and liabilities being hedged.The Company also uses foreign currency contracts to hedge forecasted sales and purchases, which are denominated in non-functional currencies. Changes in the forecasted non-functional currency cash flows due to movements in exchange rates are substantially offset by changes in the fair value of these foreign currency exchange contracts designated as hedges. Market value gains and losses on these contracts are recognized in earnings when the hedged transaction is recognized. As of December 31, 2021,2023, and 2020,2022, the Company held contracts with notional amounts of $12,671$8,910 million and $16,123$10,545 million, respectively, to exchange foreign currencies, principally the U.S. Dollar, Euro, Canadian Dollar, British Pound, Mexican Peso, Chinese Renminbi, and Indian Rupee.
The Company also designates certain foreign currency debt and derivative contracts as hedges against portions of its net investment in foreign operations. Gains or losses of the foreign currency debt and derivative contracts designated as net investment hedges are recorded in the same manner as foreign currency translation adjustments.
INTEREST RATE RISK MANAGEMENT
Financial instruments, including derivatives, expose the Company to market risk related to changes in interest rates. The Company uses a combination of financial instruments, including long-term, medium-term, and short-term financing, variable-rate commercial paper, and interest rate swaps to convert the interest rate mix of the Company's total debt portfolio and related overall cost of borrowing.
CREDIT RISK MANAGEMENT
The Company continues to monitor the creditworthiness of its counterparties to mitigate the risk of nonperformance. Financial instruments, including derivatives, expose the Company to counterparty credit risk. In addition, the Company grants credit terms to its customers in the normal course of business. The terms and conditions of the Company's credit sales are designed to mitigate or eliminate concentrations of credit risk with any single customer. The Company's sales are not materially dependent on a single customer or a small group of customers.
COMMODITY PRICE RISK MANAGEMENT
The Company's operations subject the Company to risk related to the price volatility of certain commodities. To mitigate the commodity price risk associated with the Company's operations, the Company may enter into commodity derivative instruments. In both 2023 and 2022, the Company entered into various contracts to mitigate commodity price volatility. The Company elected to apply hedge accounting to these contracts.
8082 Honeywell International Inc.
| | | | | |
| FINANCIAL STATEMENTS AND SUPPLEMENTARY DATA |
HONEYWELL INTERNATIONAL INC.
NOTES TO CONSOLIDATED FINANCIAL STATEMENTS—(Continued)
(Dollars in tables in millions, except per share amounts)
DERIVATIVE AND HEDGING INSTRUMENTS
The following table summarizes the notional amounts and fair values of the Company’s outstanding derivatives by risk category and instrument type within the Consolidated Balance Sheet:
| | | | | | | | | | | | | | | | | | | | | | | | | | | | | | | | | | | | | | | | | | | | |
| Notional | | Fair Value Asset | | Fair Value (Liability) |
| December 31, 2021 | December 31, 2020 | | December 31, 2021 | December 31, 2020 | | December 31, 2021 | December 31, 2020 |
| Derivatives in Fair Value Hedging Relationships: | | | | | | | | | | | | | | |
| Interest rate swap agreements | | $ | 3,150 | | | $ | 3,950 | | | | $ | 60 | | | $ | 194 | | | | $ | — | | | $ | — | |
| Derivatives in Cash Flow Hedging Relationships: | | | | | | | | | | | | | | |
| Foreign currency exchange contracts | | 647 | | | 488 | | | | 4 | | | 65 | | | | — | | | (58) | |
| Derivatives in Net Investment Hedging Relationships: | | | | | | | | | | | | | | |
| Foreign currency exchange contracts | | 746 | | | 806 | | | | 92 | | | 45 | | | | — | | | (1) | |
| Cross currency swap agreements | | 1,200 | | | 1,200 | | | | 39 | | | — | | | | — | | | (50) | |
| Total Derivatives Designated as Hedging Instruments | | 5,743 | | | 6,444 | | | | 195 | | | 304 | | | | — | | | (109) | |
| Derivatives Not Designated as Hedging Instruments: | | | | | | | | | | | | | | |
| Foreign currency exchange contracts | | 11,278 | | | 14,829 | | | | 278 | | | 92 | | | | (282) | | | (91) | |
| Total Derivatives at Fair Value | | $ | 17,021 | | | $ | 21,273 | | | | $ | 473 | | | $ | 396 | | | | $ | (282) | | | $ | (200) | |
| | | | | | | | | | | | | | | | | | | | | | | | | | | | | | | | | | | |
| Notional | | Fair Value Asset | | Fair Value (Liability) |
| December 31, 2023 | | December 31, 2022 | | December 31, 2023 | | December 31, 2022 | | December 31, 2023 | | December 31, 2022 |
| Derivatives in fair value hedging relationships | | | | | | | | | | | |
| Interest rate swap agreements | $ | 4,717 | | | $ | 4,984 | | | $ | 18 | | | $ | 16 | | | $ | (184) | | | $ | (303) | |
| Derivatives in cash flow hedging relationships | | | | | | | | | | | |
| Foreign currency exchange contracts | 712 | | | 866 | | | 28 | | | 19 | | | (4) | | | (5) | |
| Commodity contracts | 6 | | | 9 | | | — | | | — | | | (1) | | | (1) | |
| Derivatives in net investment hedging relationships | | | | | | | | | | | |
| | | | | | | | | | | |
| Cross currency swap agreements | 4,264 | | | 3,189 | | | — | | | 90 | | | (145) | | | — | |
| Total derivatives designated as hedging instruments | 9,699 | | | 9,048 | | | 46 | | | 125 | | | (334) | | | (309) | |
| Derivatives not designated as hedging instruments | | | | | | | | | | | |
| Foreign currency exchange contracts | 8,198 | | | 9,679 | | | 7 | | | 74 | | | (5) | | | (3) | |
| | | | | | | | | | | |
| Total derivatives at fair value | $ | 17,897 | | | $ | 18,727 | | | $ | 53 | | | $ | 199 | | | $ | (339) | | | $ | (312) | |
All derivativeDerivative assets are presented in Other current assets or Other assets. All derivativeDerivative liabilities are presented in Accrued liabilities or Other liabilities.
In addition to the foreign currency derivative contracts designated as net investment hedges, certain of the Company's foreign currency denominated debt instruments are designated as net investment hedges. The carrying value of those debt instruments designated as net investment hedges, which includes the adjustment for the foreign currency transaction gain or loss on those instruments, was $4,074$6,099 million and $4,414$3,836 million as of December 31, 20212023, and 2020,2022, respectively.
Interest rate swap agreements are designated as hedge relationships with gains or losses on the derivative recognized in Interest and other financial charges offsetting the gains and losses on the underlying debt being hedged. Gains and losses on interest rate swap agreements recognized in earnings were $135$121 million of income, $347 million of expense, $169 million of income and $70$135 million of expense for the years ended December 31, 2021, 20202023, 2022, and 2019,2021, respectively. Gains and losses are fully offset by losses and gains on the underlying debt being hedged.
The following table sets forth the amounts recorded onin the Consolidated Balance Sheet related to cumulative basis adjustments for fair value hedges:
| | | | | | | | | | | | | | | | | | | | | | | | | | | | | |
| Line in the Consolidated Balance Sheet of Hedged Item | Carrying Amount
of the Hedged Item | | Cumulative Amount of
Fair Value Hedging Adjustment
Included in the Carrying
Amount of the Hedged Item |
| December 31, 2021 | December 31, 2020 | | December 31, 2021 | December 31, 2020 |
| Long-term debt | | $ | 3,210 | | | $ | 4,144 | | | | $ | 60 | | | $ | 194 | |
| | | | | | | | | | | | | | | | | | | | | | | |
| Carrying Amount
of Hedged Item | | Cumulative Amount of
Fair Value Hedging Adjustment
Included in the Carrying
Amount of Hedged Item |
| December 31, 2023 | | December 31, 2022 | | December 31, 2023 | | December 31, 2022 |
| Long-term debt | $ | 4,551 | | | $ | 4,696 | | | $ | (166) | | | $ | (287) | |
83 Honeywell International Inc.81
| | | | | |
| FINANCIAL STATEMENTS AND SUPPLEMENTARY DATA |
HONEYWELL INTERNATIONAL INC.
NOTES TO CONSOLIDATED FINANCIAL STATEMENTS—(Continued)
(Dollars in tables in millions, except per share amounts)
The following tables summarize the location and impact to the Consolidated Statement of Operations related to derivative instruments:
| | | | | | | | | | | | | | | | | | | | | | | | | | | | | | | | | | | | | | |
| | Year Ended December 31, 2021 |
| Net Sales | Cost of
Products Sold | Cost of
Services Sold | Selling, general and administrative expenses | Other
(Income)
Expense | Interest and Other
Financial Charges |
| | $ | 34,392 | | | $ | 18,344 | | | $ | 5,050 | | | $ | 4,798 | | | $ | (1,378) | | | $ | 343 | |
| Gain or (loss) on cash flow hedges: | | | | | | | | | | | | |
| Foreign Currency Exchange Contracts: | | | | | | | | | | | | |
| Amount reclassified from accumulated other comprehensive income into income | | 5 | | | 8 | | | 2 | | | 9 | | | — | | | — | |
| | | | | | | | | | | | |
| Gain or (loss) on fair value hedges: | | | | | | | | | | | | |
| Interest Rate Swap Agreements: | | | | | | | | | | | | |
| Hedged items | | — | | | — | | | — | | | — | | | — | | | 135 | |
| Derivatives designated as hedges | | — | | | — | | | — | | | — | | | — | | | (135) | |
| Gain or (loss) on net investment hedges: | | | | | | | | | | | | |
| Foreign Currency Exchange Contracts: | | | | | | | | | | | | |
| Amount excluded from effectiveness testing recognized in earnings using an amortization approach | | — | | | — | | | — | | | — | | | — | | | 16 | |
| Gain or (loss) on derivatives not designated as hedging instruments: | | | | | | | | | | | | |
| Foreign currency exchange contracts | | — | | | — | | | — | | | — | | | 195 | | | — | |
| | | | | | | | | | | | | | | | | | | | | | | | | | | | | | | | | | | |
| | Year Ended December 31, 2023 |
| Net Sales | | Cost of
Products Sold | | Cost of
Services Sold | | Selling, General and Administrative Expenses | | Other (Income) Expense | | Interest and Other
Financial Charges |
| $ | 36,662 | | | $ | 16,977 | | | $ | 6,018 | | | $ | 5,127 | | | $ | (840) | | | $ | 765 | |
| Gain or (loss) on cash flow hedges | | | | | | | | | | | |
| Foreign currency exchange contracts | | | | | | | | | | | |
| Amount reclassified from accumulated other comprehensive income (loss) into income | 15 | | | 28 | | | 10 | | | 10 | | | — | | | — | |
| | | | | | | | | | | |
| | | | | | | | | | | |
| | | | | | | | | | | |
| | | | | | | | | | | |
| Gain or (loss) on fair value hedges | | | | | | | | | | | |
| Interest rate swap agreements | | | | | | | | | | | |
| Hedged items | — | | | — | | | — | | | — | | | — | | | (121) | |
| Derivatives designated as hedges | — | | | — | | | — | | | — | | | — | | | 121 | |
| | | | | | | | | | | |
| | | | | | | | | | | |
| | | | | | | | | | | |
| Gain or (loss) on derivatives not designated as hedging instruments | | | | | | | | | | | |
| Foreign currency exchange contracts | — | | | — | | | — | | | — | | | (116) | | | — | |
| | | | | | | | | | | | | | | | | | | | | | | | | | | | | | | | | | | | | | |
| | Year Ended December 31, 2020 |
| Net Sales | Cost of
Products Sold | Cost of Services Sold | Selling, general and administrative expenses | Other
(Income)
Expense | Interest and Other
Financial Charges |
| | $ | 32,637 | | | $ | 17,638 | | | $ | 4,531 | | | $ | 4,772 | | | $ | (675) | | | $ | 359 | |
| Gain or (loss) on cash flow hedges: | | | | | | | | | | | | |
| Foreign Currency Exchange Contracts: | | | | | | | | | | | | |
| Amount reclassified from accumulated other comprehensive income into income | | (3) | | | 43 | | | 11 | | | (4) | | | 28 | | | — | |
| Amount excluded from effectiveness testing recognized in earnings using an amortization approach | | — | | | 10 | | | 3 | | | — | | | 29 | | | — | |
| Gain or (loss) on fair value hedges: | | | | | | | | | | | | |
| Interest Rate Swap Agreements: | | | | | | | | | | | | |
| Hedged items | | — | | | — | | | — | | | — | | | — | | | (169) | |
| Derivatives designated as hedges | | — | | | — | | | — | | | — | | | — | | | 169 | |
| Gain or (loss) on net investment hedges: | | | | | | | | | | | | |
| Foreign Currency Exchange Contracts: | | | | | | | | | | | | |
| Amount excluded from effectiveness testing recognized in earnings using an amortization approach | | — | | | — | | | — | | | — | | | — | | | 18 | |
| Gain or (loss) on derivatives not designated as hedging instruments: | | | | | | | | | | | | |
| Foreign currency exchange contracts | | — | | | — | | | — | | | — | | | (166) | | | — | |
| | | | | | | | | | | | | | | | | | | | | | | | | | | | | | | | | | | |
| | Year Ended December 31, 2022 |
| Net Sales | | Cost of
Products Sold | | Cost of Services Sold | | Selling, General and Administrative Expenses | | Other (Income) Expense | | Interest and Other
Financial Charges |
| $ | 35,466 | | | $ | 16,955 | | | $ | 5,392 | | | $ | 5,214 | | | $ | (366) | | | $ | 414 | |
| Gain or (loss) on cash flow hedges | | | | | | | | | | | |
| Foreign currency exchange contracts | | | | | | | | | | | |
| Amount reclassified from accumulated other comprehensive income (loss) into income | 13 | | | 50 | | | 14 | | | (3) | | | — | | | — | |
| | | | | | | | | | | |
| Commodity Contracts | | | | | | | | | | | |
| Amount reclassified from accumulated other comprehensive income (loss) into income | — | | | (2) | | | — | | | — | | | — | | | — | |
| Gain or (loss) on fair value hedges | | | | | | | | | | | |
| Interest rate swap agreements | | | | | | | | | | | |
| Hedged items | — | | | — | | | — | | | — | | | — | | | 347 | |
| Derivatives designated as hedges | — | | | — | | | — | | | — | | | — | | | (347) | |
| Gain or (loss) on net investment hedges | | | | | | | | | | | |
| Foreign currency exchange contracts | | | | | | | | | | | |
| Amount excluded from effectiveness testing recognized in earnings using an amortization approach | — | | | — | | | — | | | — | | | — | | | 13 | |
| Gain or (loss) on derivatives not designated as hedging instruments | | | | | | | | | | | |
| Foreign currency exchange contracts | — | | | — | | | — | | | — | | | 351 | | | — | |
8284 Honeywell International Inc.
| | | | | |
| FINANCIAL STATEMENTS AND SUPPLEMENTARY DATA |
HONEYWELL INTERNATIONAL INC.
NOTES TO CONSOLIDATED FINANCIAL STATEMENTS—(Continued)
(Dollars in tables in millions, except per share amounts)
| | | | | | | | | | | | | | | | | | | | | | | | | | | | | | | | | | | | | | |
| | Year Ended December 31, 2019 |
| Net Sales | Cost of
Products Sold | Cost of Services Sold | Selling, general and administrative expenses | Other
(Income)
Expense | Interest and Other
Financial Charges |
| | $ | 36,709 | | | $ | 19,269 | | | $ | 5,070 | | | $ | 5,519 | | | $ | (1,065) | | | $ | 357 | |
| Gain or (loss) on cash flow hedges: | | | | | | | | | | | | |
| Foreign Currency Exchange Contracts: | | | | | | | | | | | | |
| Amount reclassified from accumulated other comprehensive income into income | | 3 | | | 35 | | | 9 | | | 1 | | | 73 | | | — | |
| Amount excluded from effectiveness testing recognized in earnings using an amortization approach | | — | | | 16 | | | 6 | | | — | | | 35 | | | — | |
| Gain or (loss) on fair value hedges: | | | | | | | | | | | | |
| Interest Rate Swap Agreements: | | | | | | | | | | | | |
| Hedged items | | — | | | — | | | — | | | — | | | — | | | (70) | |
| Derivatives designated as hedges | | — | | | — | | | — | | | — | | | — | | | 70 | |
| Gain or (loss) on net investment hedges: | | | | | | | | | | | | |
| Foreign Currency Exchange Contracts: | | | | | | | | | | | | |
| Amount excluded from effectiveness testing recognized in earnings using an amortization approach | | — | | | — | | | — | | | — | | | — | | | 19 | |
| Gain or (loss) on derivatives not designated as hedging instruments: | | | | | | | | | | | | |
| Foreign currency exchange contracts | | — | | | — | | | — | | | — | | | 106 | | | — | |
| | | | | | | | | | | | | | | | | | | | | | | | | | | | | | | | | | | |
| | Year Ended December 31, 2021 |
| Net Sales | | Cost of
Products Sold | | Cost of Services Sold | | Selling, General and Administrative Expenses | | Other (Income) Expense | | Interest and Other
Financial Charges |
| $ | 34,392 | | | $ | 17,082 | | | $ | 4,979 | | | $ | 4,798 | | | $ | (1,378) | | | $ | 343 | |
| Gain or (loss) on cash flow hedges | | | | | | | | | | | |
| Foreign currency exchange contracts | | | | | | | | | | | |
| Amount reclassified from accumulated other comprehensive income (loss) into income | 5 | | | 8 | | | 2 | | | 9 | | | — | | | — | |
| | | | | | | | | | | |
| | | | | | | | | | | |
| Gain or (loss) on fair value hedges | | | | | | | | | | | |
| Interest rate swap agreements | | | | | | | | | | | |
| Hedged items | — | | | — | | | — | | | — | | | — | | | 135 | |
| Derivatives designated as hedges | — | | | — | | | — | | | — | | | — | | | (135) | |
| Gain or (loss) on net investment hedges | | | | | | | | | | | |
| Foreign currency exchange contracts | | | | | | | | | | | |
| Amount excluded from effectiveness testing recognized in earnings using an amortization approach | — | | | — | | | — | | | — | | | — | | | 16 | |
| Gain or (loss) on derivatives not designated as hedging instruments | | | | | | | | | | | |
| Foreign currency exchange contracts | — | | | — | | | — | | | — | | | 195 | | | — | |
As of December 31, 2021,2023, the Company estimates that approximately $10$24 million of net derivative gains related to its cash flow hedges included in Accumulated other comprehensive income (loss) will be reclassified into earnings within the next 12 months.
The following table summarizes the amountsamount of gain or (loss) on net investment hedges recognized in Accumulated other comprehensive income (loss): | | | | | | | | | | | | | | |
| Derivatives Net Investment Hedging Relationships | Years Ended December 31, |
| 2021 | 2020 |
| Euro-denominated long-term debt | | $ | 284 | | | $ | (256) | |
| Euro-denominated commercial paper | | 57 | | | (8) | |
| Cross currency swap | | 88 | | | (109) | |
| Foreign currency exchange contracts | | 40 | | | (94) | |
| | | | | | | | | | | |
| Years Ended December 31, |
| 2023 | | 2022 |
| Euro-denominated long-term debt | $ | (84) | | | $ | 196 | |
| Euro-denominated commercial paper | (42) | | | 39 | |
| Cross currency swap agreements | (193) | | | (65) | |
| Foreign currency exchange contracts | — | | | 34 | |
Honeywell International Inc. 83
FINANCIAL STATEMENTS AND SUPPLEMENTARY DATA
HONEYWELL INTERNATIONAL INC.
NOTES TO CONSOLIDATED FINANCIAL STATEMENTS—(Continued)
(Dollars in tables in millions, except per share amounts)
NOTE 12. FAIR VALUE MEASUREMENTS
The accounting guidance for fair value measurements and disclosures establishes a three-level fair value hierarchy.hierarchy:
•Level 1 - Inputs are based on quoted prices in active markets for identical assets and liabilities.
•Level 2 - Inputs are based on observable inputs other than quoted prices in active markets for identical or similar assets and liabilities.
•Level 3 - One or more inputs are unobservable and significant.
Financial and nonfinancial assets and liabilities are classified in their entirety based on the lowest level of input that is significant to the fair value measurement.
85 Honeywell International Inc.
| | | | | |
| FINANCIAL STATEMENTS AND SUPPLEMENTARY DATA |
HONEYWELL INTERNATIONAL INC.
NOTES TO CONSOLIDATED FINANCIAL STATEMENTS—(Continued)
(Dollars in tables in millions, except per share amounts)
The following table sets forth the Company’s financial assets and liabilities that were accounted for at fair value on a recurring basis:
| | | | December 31, |
| 2021 | 2020 |
| Assets: | | | | |
| | | December 31, 2023 | | December 31, 2022 |
| Level 1 | | | Level 1 | | Level 2 | | | Level 3 | | Total | | Level 1 | | Level 2 | | | Level 3 | | Total |
| Assets | |
| Foreign currency exchange contracts | |
| Foreign currency exchange contracts | |
| Foreign currency exchange contracts | Foreign currency exchange contracts | | $ | 374 | | | $ | 202 | |
| Available for sale investments | Available for sale investments | | 742 | | | 1,118 | |
| Interest rate swap agreements | Interest rate swap agreements | | 60 | | | 194 | |
| Cross currency swap agreements | Cross currency swap agreements | | 39 | | | — | |
| Investments in equity securities | Investments in equity securities | | 57 | | | 11 | |
| Liabilities: | |
| Right to HWI Net Sale Proceeds | |
| Total assets | |
| Liabilities | |
| Foreign currency exchange contracts | Foreign currency exchange contracts | | $ | 282 | | | $ | 150 | |
| Foreign currency exchange contracts | |
| Foreign currency exchange contracts | |
| Interest rate swap agreements | |
| Commodity contracts | |
| Cross currency swap agreements | |
| | Cross currency swap agreements | | — | | | 50 | |
| Total liabilities | |
| Total liabilities | |
| Total liabilities | |
The Company values foreign currency exchange contracts, interest rate swap agreements, and cross currency swap agreements, are valuedand commodity contracts using broker quotations, or market transactions in either the listed or over-the-counter markets. As such, these derivative instruments are classified within level 2. The Company also holds investments in commercial paper, certificates of deposits, and time deposits, and corporate debt securities that are designated as available for sale, as well assale. These investments in equity securities, which are valued using published prices based on observable market data. As such, these investments are classified within level 2.
The Company holds certain available for sale investments in U.S. government and corporate debt securities as well asand investments in equity securities, which are valuedsecurities. The Company values these investments utilizing published prices based on quoted market pricing, which are classified within level 1.
The carrying value of cash and cash equivalents, trade accounts and notes receivables, payables, commercial paper, and other short-term borrowings contained in the Consolidated Balance Sheet approximates fair value.
As part of the NARCO Buyout (see Note 19 Commitments and Contingencies for definition), Honeywell holds a right to proceeds from the definitive sale agreement pursuant to which HarbisonWalker International Holdings, Inc. (HWI), the reorganized and renamed entity that emerged from the NARCO Bankruptcy, was acquired by an affiliate of Platinum Equity, LLC (HWI Sale). The right to these proceeds is considered a financial instrument. The significant input for the valuation of this right is unobservable, and as such, is classified within level 3.
The HWI Sale closed on February 16, 2023. During the twelve months ended December 31, 2023, Honeywell received $275 million of proceeds from the HWI Sale (HWI Net Sale Proceeds), of which $256 million was received during the first quarter of 2023 and $19 million during the second quarter of 2023. Additionally, during the second quarter of 2023, the Company recorded a fair value adjustment for the HWI Net Sale Proceeds and reduced the estimate by $11 million. The fair value of the remaining HWI Net Sale Proceeds as of December 31, 2023, represents contingent consideration to be paid in future periods if certain conditions under the definitive sale agreement for the HWI Sale are met.
The following table sets forth a reconciliation of beginning and ending balances of assets and liabilities that were accounted for at fair value using level 3 measurements:
| | | | | | | | | | | |
| Years Ended December 31, |
| 2023 | | 2022 |
| Balance at beginning of period | $ | 295 | | | $ | — | |
| | | |
| Recognition of right to HWI Net Sale Proceeds | — | | | 295 | |
| Receipt of HWI Net Sale Proceeds | (275) | | | — | |
| Fair value adjustment of HWI Net Sale Proceeds | (11) | | | — | |
| Balance at end of period | $ | 9 | | | $ | 295 | |
86 Honeywell International Inc.
| | | | | |
| FINANCIAL STATEMENTS AND SUPPLEMENTARY DATA |
HONEYWELL INTERNATIONAL INC.
NOTES TO CONSOLIDATED FINANCIAL STATEMENTS—(Continued)
(Dollars in tables in millions, except per share amounts)
The following table sets forth the Company’s financial assets and liabilities that were not carried at fair value:
| | | | | | | | | | | | | | | | | | | | | | | | | | | | | |
| | December 31, 2021 | | December 31, 2020 |
Carrying
Value | Fair
Value | | Carrying
Value | Fair
Value |
| Assets: | | | | | | | | | |
| Short-term investment | | $ | 34 | | | $ | 34 | | | | $ | — | | | $ | — | |
| Long-term receivables | | 170 | | | 152 | | | | 137 | | | 132 | |
| Long-term investment | | 366 | | | 366 | | | | — | | | — | |
| Liabilities: | | | | | | | | | |
| Long-term debt and related current maturities | | $ | 16,057 | | | $ | 17,022 | | | | $ | 18,787 | | | $ | 20,176 | |
| | | | | | | | | | | | | | | | | | | | | | | |
| | December 31, 2023 | | December 31, 2022 |
Carrying
Value | | Fair
Value | | Carrying
Value | | Fair
Value |
| Assets | | | | | | | |
| | | | | | | |
| Long-term receivables | $ | 232 | | | $ | 173 | | | $ | 229 | | | $ | 183 | |
| | | | | | | |
| Liabilities | | | | | | | |
| Long-term debt and related current maturities | 18,358 | | | 17,706 | | | 16,853 | | | 15,856 | |
The Company determined the fair value of the long-term receivables by utilizing transactions in the listed markets for identical or similar assets. As such, the fair value of these receivables is considered level 2.
84 Honeywell International Inc.
FINANCIAL STATEMENTS AND SUPPLEMENTARY DATA
HONEYWELL INTERNATIONAL INC.
NOTES TO CONSOLIDATED FINANCIAL STATEMENTS—(Continued)
(Dollars in tables in millions, except per share amounts)
The fair value of the short-term and long-term investments are based on the present value of the mandatory redemptions as reflected within Garrett Motion Inc.'s (Garrett) Series B Preferred Stock (Series B Preferred Stock) Certificate of Designation, as amended. Fair Value of the Series B Preferred Stock is not impacted by early redemptions until receipt of payment. The investment is designated as held to maturity and was initially recognized at fair value. The fair value of Garrett's Series B Preferred Stock was determined using observable market data and is considered level 2. Refer to Note 19 Commitments and Contingencies for further discussion of the Company’s investment in Garrett's Series B Preferred Stock.
The Company determined the fair value of the long-term debt and related current maturities utilizing transactions in the listed markets for identical or similar liabilities. As such, the fair value of the long-term debt and related current maturities is considered level 2.
NOTE 13. ACCRUED LIABILITIES
| | | | | | | | | | | |
| | December 31, |
| 2023 | | 2022 |
| Customer advances and deferred income | $ | 3,499 | | | $ | 3,555 | |
| Compensation, benefit and other employee related | 1,322 | | | 1,218 | |
| Repositioning | 279 | | | 309 | |
| Asbestos-related liabilities | 154 | | | 110 | |
| Income taxes | 680 | | | 549 | |
| Other taxes | 176 | | | 174 | |
| Environmental costs | 227 | | | 222 | |
| Operating lease liabilities | 196 | | | 192 | |
| Product warranties and performance guarantees | 182 | | | 175 | |
| Insurance | 69 | | | 68 | |
| Accrued interest | 217 | | | 122 | |
| NARCO Buyout accrual | — | | | 1,325 | |
| Other (primarily operating expenses) | 808 | | | 1,143 | |
| Total Accrued liabilities | $ | 7,809 | | | $ | 9,162 | |
87 | | | | | | | | | | | | | | |
| | December 31, |
| 2021 | 2020 |
| Customer advances and deferred income | | $ | 3,163 | | | $ | 2,932 | |
| Compensation, benefit and other employee related | | 1,273 | | | 1,244 | |
| Repositioning | | 411 | | | 601 | |
| Asbestos related liabilities | | 261 | | | 300 | |
| Income taxes | | 393 | | | 307 | |
| Other taxes | | 269 | | | 281 | |
| Environmental costs | | 225 | | | 225 | |
| Operating lease liabilities | | 185 | | | 187 | |
| Product warranties and performance guarantees | | 180 | | | 183 | |
| Insurance | | 101 | | | 140 | |
| Accrued interest | | 100 | | | 102 | |
| Other (primarily operating expenses) | | 1,118 | | | 903 | |
| | $ | 7,679 | | | $ | 7,405 | |
| | | | | |
| FINANCIAL STATEMENTS AND SUPPLEMENTARY DATA |
HONEYWELL INTERNATIONAL INC.
NOTES TO CONSOLIDATED FINANCIAL STATEMENTS—(Continued)
(Dollars in tables in millions, except per share amounts)
NOTE 14. OTHER LIABILITIES
| | | | December 31, | | December 31, |
| 2021 | 2020 | 2023 | | 2022 |
| Income taxes | Income taxes | | $ | 2,152 | | | $ | 2,009 | |
| Pension and other employee related | Pension and other employee related | | 1,672 | | | 1,923 | |
| Deferred income | Deferred income | | 1,324 | | | 1,356 | |
| Operating lease liabilities | Operating lease liabilities | | 847 | | | 641 | |
| Environmental | | 393 | | | 435 | |
| Environmental costs | |
| Insurance | Insurance | | 299 | | | 280 | |
| Product warranties and performance guarantees | Product warranties and performance guarantees | | 43 | | | 60 | |
| Asset retirement obligations | Asset retirement obligations | | 26 | | | 31 | |
| Other | Other | | 331 | | | 240 | |
| $ | 7,087 | | | $ | 6,975 | |
| Total Other liabilities | |
Honeywell International Inc. 85
FINANCIAL STATEMENTS AND SUPPLEMENTARY DATA
HONEYWELL INTERNATIONAL INC.
NOTES TO CONSOLIDATED FINANCIAL STATEMENTS—(Continued)
(Dollars in tables in millions, except per share amounts)
NOTE 15. STOCK-BASED COMPENSATION PLANS
The 2016 Stock Incentive Plan of Honeywell International Inc. and its Affiliates (2016 Plan) and 2016 Stock Plan for Non-Employee Directors of Honeywell International Inc. (2016 Directors Plan) were both approved by the shareowners at the Annual Meeting of Shareowners effective on April 25, 2016. At December 31, 2021,2023, there were 32,337,638,28,946,133 and 815,299781,768 shares of Honeywell common stock available for future grants under terms of the 2016 Plan and 2016 Directors Plan, respectively.
STOCK OPTIONS
The exercise price, term, and other conditions applicable to each option granted under the Company's stock plans are generally determined by the Management Development and Compensation Committee of the Board of Directors. The exercise price of stock options is set on the grant date and may not be less than the fair market value per share of the Company's stock on that date. The fair value is recognized as an expense over the employee’s requisite service period (generally the vesting period of the award). Options generally vest over a four-yearfour-year period and expire after ten years.
The fair value of each option award is estimated on the date of grant using the Black-Scholes option-pricing model. Expected volatility is based on implied volatilities from traded options on our common stock and historical volatility of the Company's common stock. The Company used a Monte Carlo simulation model to derive an expected term which represents an estimate of the time options are expected to remain outstanding. Such model uses historical data to estimate option exercise activity and post-vest termination behavior. The risk-free rate for periods within the contractual life of the option is based on the U.S. treasury yield curve in effect at the time of grant.
The following table summarizes the impact to the Consolidated Statement of Operations from stock options:
| | | | Years Ended December 31, | | Years Ended December 31, |
| 2021 | 2020 | 2019 | 2023 | | 2022 | | 2021 |
| Compensation expense | Compensation expense | | $ | 55 | | | $ | 50 | | | $ | 47 | |
| Future income tax benefit recognized | Future income tax benefit recognized | | 11 | | | 10 | | | 10 | |
| | | | | |
| FINANCIAL STATEMENTS AND SUPPLEMENTARY DATA |
HONEYWELL INTERNATIONAL INC.
NOTES TO CONSOLIDATED FINANCIAL STATEMENTS—(Continued)
(Dollars in tables in millions, except per share amounts)
The following table sets forth fair value per share information, including related weighted-averageweighted average assumptions, used to determine compensation cost.cost:
| | | | | | | | | | | | | | | | | | | | |
| | Years Ended December 31, |
| 2021 | 2020 | 2019 |
Weighted average fair value per share of options granted during the year(1) | | $ | 32.42 | | | $ | 21.30 | | | $ | 21.57 | |
| Assumptions: | | | | | | |
| Expected annual dividend yield | | 2.31 | % | | 2.59 | % | | 2.65 | % |
| Expected volatility | | 24.69 | % | | 18.76 | % | | 18.40 | % |
| Risk-free rate of return | | 0.48 | % | | 1.32 | % | | 2.46 | % |
| Expected option term (years) | | 4.54 | | | 4.62 | | | 4.87 | |
(1) | | | | | | | | | | | | | | | | | |
| | Years Ended December 31, |
| 2023 | | 2022 | | 2021 |
Weighted average fair value per share of options granted during the year1 | $ | 38.84 | | | $ | 31.22 | | | $ | 32.42 | |
| Assumptions | | | | | |
| Expected annual dividend yield | 2.50 | % | | 2.58 | % | | 2.31 | % |
| Expected volatility | 22.42 | % | | 23.05 | % | | 24.69 | % |
| Risk-free rate of return | 3.94 | % | | 1.97 | % | | 0.48 | % |
| Expected option term (years) | 4.86 | | 4.74 | | 4.54 |
| | | | | | | | |
| 1 | | Estimated on date of grant using Black-Scholes option-pricing model. |
The following table summarizes information about stock option activity for the three years ended December 31, 2023:
| | | | | | | | | | | |
| Number of
Options | | Weighted Average
Exercise Price |
| Outstanding at December 31, 2020 | 16,568,529 | | | $ | 125.75 | |
| Granted | 2,065,574 | | | 204.99 | |
| Exercised | (2,016,489) | | | 113.01 | |
| Lapsed or canceled | (764,675) | | | 175.42 | |
| Outstanding at December 31, 2021 | 15,852,939 | | | 135.31 | |
| Granted | 2,150,910 | | | 189.53 | |
| Exercised | (3,046,107) | | | 103.89 | |
| Lapsed or canceled | (905,454) | | | 186.35 | |
| Outstanding at December 31, 2022 | 14,052,288 | | | 147.14 | |
| Granted | 1,573,520 | | | 195.27 | |
| Exercised | (1,640,952) | | | 123.12 | |
| Lapsed or canceled | (548,842) | | | 192.22 | |
| Outstanding at December 31, 2023 | 13,436,014 | | | $ | 153.86 | |
Vested and expected to vest at December 31, 20231 | 12,420,005 | | | $ | 150.58 | |
| Exercisable at December 31, 2023 | 9,593,986 | | | $ | 138.24 | |
| | | | | | | | |
| 1 | | Represents the sum of vested options of9.6 million and expected to vest options of 2.8 million. Expected to vest options are derived by applying the pre-vesting forfeiture rate assumption to total outstanding unvested options of 3.8 million. |
8689 Honeywell International Inc.
| | | | | |
| FINANCIAL STATEMENTS AND SUPPLEMENTARY DATA |
HONEYWELL INTERNATIONAL INC.
NOTES TO CONSOLIDATED FINANCIAL STATEMENTS—(Continued)
(Dollars in tables in millions, except per share amounts)
The following table summarizes information about stock option activity for the three years ended December 31, 2021:
| | | | | | | | | | | | | | |
| Number of
Options | Weighted Average
Exercise Price |
| Outstanding at December 31, 2018 | | 22,478,581 | | | $ | 97.83 | |
| Granted | | 3,136,058 | | | 155.43 | |
| Exercised | | (5,897,060) | | | 84.31 | |
| Lapsed or canceled | | (986,017) | | | 136.15 | |
| Outstanding at December 31, 2019 | | 18,731,562 | | | 109.87 | |
| Granted | | 3,192,693 | | | 176.93 | |
| Exercised | | (4,424,754) | | | 88.96 | |
| Lapsed or canceled | | (930,972) | | | 156.62 | |
| Outstanding at December 31, 2020 | | 16,568,529 | | | 125.75 | |
| Granted | | 2,065,574 | | | 204.99 | |
| Exercised | | (2,016,489) | | | 113.01 | |
| Lapsed or canceled | | (764,675) | | | 175.42 | |
| Outstanding at December 31, 2021 | | 15,852,939 | | | $ | 135.31 | |
Vested and expected to vest at December 31, 2021(1) | | 14,694,701 | | | $ | 131.08 | |
| Exercisable at December 31, 2021 | | 10,664,625 | | | $ | 113.30 | |
(1)Represents the sum of vested options of10.7 million and expected to vest options of 4.0 million. Expected to vest options are derived by applying the pre-vesting forfeiture rate assumption to total outstanding unvested options of 5.2 million.
The following table summarizes information about stock options outstanding and exercisable at December 31, 2021:2023:
| | | | | | | | | | | | | | | | | | | | | | | | | | | | | | | | | | | | | | | | | | | | | | | |
| Range of Exercise Prices | Options Outstanding | | Options Exercisable |
Number
Outstanding | Weighted Average Life(1) | Weighted
Average
Exercise
Price per share | Aggregate
Intrinsic
Value | | Number
Exercisable | Weighted
Average
Exercise
Price per share | Aggregate
Intrinsic
Value |
| $27.00–$64.99 | | 90,181 | | | 0.17 | | $ | 56.97 | | | $ | 14 | | | | 90,181 | | | $ | 56.97 | | | $ | 14 | |
| $65.00–$89.99 | | 2,293,585 | | | 1.68 | | 79.39 | | | 296 | | | | 2,293,585 | | | 79.39 | | | 296 | |
| $90.00–$99.99 | | 3,341,048 | | | 3.44 | | 98.80 | | | 367 | | | | 3,341,048 | | | 98.80 | | | 366 | |
| $100.00–$134.99 | | 2,435,321 | | | 5.04 | | 119.69 | | | 216 | | | | 2,314,755 | | | 119.19 | | | 214 | |
| $135.00–$232.99 | | 7,692,804 | | | 7.55 | | 173.71 | | | 271 | | | | 2,625,056 | | | 158.14 | | | 232 | |
| | 15,852,939 | | | 5.41 | | $ | 135.28 | | | $ | 1,164 | | | | 10,664,625 | | | $ | 113.30 | | | $ | 1,122 | |
(1) | | | | | | | | | | | | | | | | | | | | | | | | | | | | | | | | | | | | | | | | | |
| Range of Exercise Prices | Options Outstanding | | Options Exercisable |
Number
Outstanding | | Weighted Average Life1 | | Weighted Average Exercise Price Per Share | | Aggregate
Intrinsic
Value | | Number
Exercisable | | Weighted Average Exercise Price Per Share | | Aggregate
Intrinsic
Value |
| | | | | | | | | | | | | |
| $65.00–$89.99 | 687,158 | | | 0.16 | | $ | 89.46 | | | $ | 83 | | | 687,158 | | | $ | 89.46 | | | $ | 83 | |
| $90.00–$99.99 | 2,285,249 | | | 1.52 | | 98.79 | | | 253 | | | 2,285,249 | | | 98.79 | | | 253 | |
| $100.00–$134.99 | 1,814,529 | | | 3.02 | | 119.30 | | | 164 | | | 1,787,835 | | | 119.15 | | | 163 | |
| $135.00–$189.99 | 5,737,860 | | | 5.83 | | 170.92 | | | 222 | | | 4,078,279 | | | 164.61 | | | 209 | |
| $190.00–$232.60 | 2,911,218 | | | 8.02 | | 200.23 | | | 30 | | | 755,465 | | | 204.77 | | | 22 | |
| 13,436,014 | | | 4.90 | | $ | 153.86 | | | $ | 752 | | | 9,593,986 | | | $ | 138.24 | | | $ | 730 | |
| | | | | | | | |
| 1 | | Average remaining contractual life in years. |
There were 10,120,7939,509,606 and 11,620,99210,664,625 options exercisable at weighted average exercise prices of $103.89$127.99 and $92.19$113.30 at December 31, 20202022, and 2019,2021, respectively.
The following table summarizes the financial statement impact from stock options exercised: | | | | | | | | | | | | | | | | | | | | |
| Options Exercised | Years Ended December 31, |
| 2021 | 2020 | 2019 |
Intrinsic value(1) | | $ | 219 | | | $ | 379 | | | $ | 483 | |
| Tax benefit realized | | 48 | | | 84 | | | 117 | |
(1) | | | | | | | | | | | | | | | | | |
| Years Ended December 31, |
| 2023 | | 2022 | | 2021 |
Intrinsic value1 | $ | 122 | | | $ | 310 | | | $ | 219 | |
| Tax benefit realized | 27 | | | 71 | | | 48 | |
| | | | | | | | |
| 1 | | Represents the amount by which the stock price exceeded the exercise price of the options on the date of exercise. |
At December 31, 2021,2023, there was $100$96 million of total unrecognized compensation cost related to non-vested stock option awards which is expected to be recognized over a weighted-averageweighted average period of 2.462.49 years. The total fair value of options vested for the years ended December 31, 2023, 2022, and 2021 2020was $48 million, $49 million, and 2019 was $52 million, $55 million and $61 million, respectively.
Honeywell International Inc. 87
FINANCIAL STATEMENTS AND SUPPLEMENTARY DATA
HONEYWELL INTERNATIONAL INC.
NOTES TO CONSOLIDATED FINANCIAL STATEMENTS—(Continued)
(Dollars in tables in millions, except per share amounts)
RESTRICTED STOCK UNITS
Restricted stock unit (RSU) awards entitle the holder to receive one share of common stock for each unit when the units vest. RSUs are issued to certain key employees and directors as compensation at fair market value at the date of grant. RSUs generally become fully vested over periods ranging from three to six years and are payable in Honeywell common stock upon vesting. Certain RSU awards are performance-based and awarded to eligible employees which entitle the grantee to receive shares of common stock if specified Company performance goals are achieved during the performance period and if the grantee remains employed through the vesting period.
90 Honeywell International Inc.
| | | | | |
| FINANCIAL STATEMENTS AND SUPPLEMENTARY DATA |
HONEYWELL INTERNATIONAL INC.
NOTES TO CONSOLIDATED FINANCIAL STATEMENTS—(Continued)
(Dollars in tables in millions, except per share amounts)
The following table summarizes information about RSU activity for the three years ended December 31, 2021:2023:
| | Number of
Restricted
Stock Units | Weighted
Average
Grant Date
Fair Value
Per Share |
| Non-vested at December 31, 2018 | | 3,657,873 | | | $ | 125.35 | |
| Granted | | 1,200,202 | | | 162.43 | |
| Vested | | (1,160,333) | | | 104.32 | |
| Forfeited | | (457,677) | | | 134.50 | |
| Non-vested at December 31, 2019 | | 3,240,065 | | | 143.07 | |
| Granted | | 1,551,675 | | | 158.52 | |
| Vested | | (1,001,101) | | | 117.84 | |
| Forfeited | | (394,116) | | | 145.42 | |
| Number of
Restricted
Stock Units | | | Number of
Restricted
Stock Units | | Weighted
Average
Grant Date
Fair Value
Per Share |
| Non-vested at December 31, 2020 | Non-vested at December 31, 2020 | | 3,396,523 | | | 148.23 | |
| Granted | Granted | | 992,854 | | | 214.61 | |
| Vested | Vested | | (1,123,547) | | | 144.34 | |
| Forfeited | Forfeited | | (308,293) | | | 156.74 | |
| Non-vested at December 31, 2021 | Non-vested at December 31, 2021 | | 2,957,536 | | | $ | 171.73 | |
| Granted | |
| Vested | |
| Forfeited | |
| Non-vested at December 31, 2022 | |
| Granted | |
| Vested | |
| Forfeited | |
| Non-vested at December 31, 2023 | |
As of December 31, 2021,2023, there was approximately $273$250 million of total unrecognized compensation cost related to non-vested RSUs granted under the Company's stock plans which is expected to be recognized over a weighted-averageweighted average period of 2.231.91 years.
The following table summarizes the impact to the Consolidated Statement of Operations from RSUs: | | | | | | | | | | | | | | | | | | | | |
| | Years Ended December 31, |
| 2021 | 2020 | 2019 |
| Compensation expense | | $ | 162 | | | $ | 118 | | | $ | 106 | |
| Future income tax benefit recognized | | 23 | | | 24 | | | 21 | |
| | | | | | | | | | | | | | | | | |
| | Years Ended December 31, |
| 2023 | | 2022 | | 2021 |
| Compensation expense | $ | 154 | | | $ | 143 | | | $ | 162 | |
| Future income tax benefit recognized | 32 | | | 29 | | | 23 | |
88 Honeywell International Inc.
FINANCIAL STATEMENTS AND SUPPLEMENTARY DATA
HONEYWELL INTERNATIONAL INC.
NOTES TO CONSOLIDATED FINANCIAL STATEMENTS—(Continued)
(Dollars in tables in millions, except per share amounts)
NOTE 16. EARNINGS PER SHARE
The details of the earnings per share calculations for the years ended December 31, 2021, 20202023, 2022, and 20192021, are as follows (shares in millions):
| | Basic | Basic | Years Ended December 31, | Basic | Years Ended December 31, |
| 2021 | 2020 | 2019 | 2023 | | 2022 | | 2021 |
| Net income attributable to Honeywell | Net income attributable to Honeywell | | $ | 5,542 | | | $ | 4,779 | | | $ | 6,143 | |
| Weighted average shares outstanding | Weighted average shares outstanding | | 692.3 | | | 704.1 | | | 721.0 | |
| Earnings per share of common stock | | $ | 8.01 | | | $ | 6.79 | | | $ | 8.52 | |
| Earnings per share of common stock—basic | |
| | Assuming Dilution | Assuming Dilution | Years Ended December 31, | Assuming Dilution | Years Ended December 31, |
| 2021 | 2020 | 2019 | 2023 | | 2022 | | 2021 |
| Net income attributable to Honeywell | Net income attributable to Honeywell | | $ | 5,542 | | | $ | 4,779 | | | $ | 6,143 | |
| Average Shares | |
| Average shares | |
| Weighted average shares outstanding | |
| Weighted average shares outstanding | |
| Weighted average shares outstanding | Weighted average shares outstanding | | 692.3 | | | 704.1 | | | 721.0 | |
| Dilutive securities issuable—stock plans | Dilutive securities issuable—stock plans | | 8.1 | | | 7.1 | | | 9.3 | |
| Total weighted average diluted shares outstanding | Total weighted average diluted shares outstanding | | 700.4 | | | 711.2 | | | 730.3 | |
| Earnings per share of common stock—assuming dilution | Earnings per share of common stock—assuming dilution | | $ | 7.91 | | | $ | 6.72 | | | $ | 8.41 | |
91 Honeywell International Inc.
| | | | | |
| FINANCIAL STATEMENTS AND SUPPLEMENTARY DATA |
HONEYWELL INTERNATIONAL INC.
NOTES TO CONSOLIDATED FINANCIAL STATEMENTS—(Continued)
(Dollars in tables in millions, except per share amounts)
The diluted earnings per share calculations exclude the effect of stock options when the options’ assumed proceeds exceedcost to exercise an option exceeds the average market price of the common shares during the period. In 2021, 20202023, 2022, and 20192021, the weighted average number of stock options excluded from the computations were 1.7was 4.5 million, 5.53.5 million, and 2.51.7 million, respectively. These stock options were outstanding at the end of each of the respective periods.
As of December 31, 2023, and 2022, the total shares outstanding were 651.8 million and 667.6 million, respectively, and as of December 31, 2023, and 2022, total shares issued were 957.6 million.
NOTE 17. ACCUMULATED OTHER COMPREHENSIVE INCOME (LOSS)
The changes in Accumulated other comprehensive income (loss) are provided in the tables below. Comprehensive income (loss) attributable to noncontrolling interest consists predominantly of net income.
| | | | | | | | | | | | | | | | | | | | |
| Pre-tax | Tax | After-Tax |
| Year Ended December 31, 2021 | | | | | | |
| Foreign exchange translation adjustment | | $ | 302 | | | $ | — | | | $ | 302 | |
| Pensions and other postretirement benefit adjustments | | 245 | | | (59) | | | 186 | |
| Changes in fair value of available for sale investments | | (3) | | | — | | | (3) | |
| Changes in fair value of designated cash flow hedges | | (4) | | | 1 | | | (3) | |
| | $ | 540 | | | $ | (58) | | | $ | 482 | |
| Year Ended December 31, 2020 | | | | | | |
| Foreign exchange translation adjustment | | $ | (214) | | | $ | — | | | $ | (214) | |
| Pensions and other postretirement benefit adjustments | | 76 | | | (2) | | | 74 | |
| Changes in fair value of available for sale investments | | 4 | | | — | | | 4 | |
| Changes in fair value of designated cash flow hedges | | (61) | | | 17 | | | (44) | |
| | | $ | (195) | | | $ | 15 | | | $ | (180) | |
| Year Ended December 31, 2019 | | | | | | |
| Foreign exchange translation adjustment | | $ | 143 | | | $ | — | | | $ | 143 | |
| Pensions and other postretirement benefit adjustments | | 115 | | | (29) | | | 86 | |
| Changes in fair value of designated cash flow hedges | | 20 | | | (9) | | | 11 | |
| | $ | 278 | | | $ | (38) | | | $ | 240 | |
| | | | | | | | | | | | | | | | | |
| Pre-tax | | Tax | | After-Tax |
| Year Ended December 31, 2023 | | | | | |
| Foreign exchange translation adjustment | $ | (269) | | | $ | — | | | $ | (269) | |
| Pension and other postretirement benefit adjustments | (538) | | | 131 | | | (407) | |
| Changes in fair value of available for sale investments | 5 | | | — | | | 5 | |
| Changes in fair value of cash flow hedges | 17 | | | (6) | | | 11 | |
| Total net current period other comprehensive income (loss) | $ | (785) | | | $ | 125 | | | $ | (660) | |
| Year Ended December 31, 2022 | | | | | |
| Foreign exchange translation adjustment | $ | (354) | | | $ | — | | | $ | (354) | |
| Pension and other postretirement benefit adjustments | (280) | | | 47 | | | (233) | |
| Changes in fair value of available for sale investments | (8) | | | — | | | (8) | |
| Changes in fair value of cash flow hedges | 9 | | | 6 | | | 15 | |
| Total net current period other comprehensive income (loss) | $ | (633) | | | $ | 53 | | | $ | (580) | |
| Year Ended December 31, 2021 | | | | | |
| Foreign exchange translation adjustment | $ | 302 | | | $ | — | | | $ | 302 | |
| Pension and other postretirement benefit adjustments | 245 | | | (59) | | | 186 | |
| Changes in fair value of available for sale investments | (3) | | | — | | | (3) | |
| Changes in fair value of cash flow hedges | (4) | | | 1 | | | (3) | |
| Total net current period other comprehensive income (loss) | $ | 540 | | | $ | (58) | | | $ | 482 | |
COMPONENTS OF ACCUMULATED OTHER COMPREHENSIVE INCOME (LOSS)
| | | | | | | | | | | |
| | December 31, |
| 2023 | | 2022 |
| Cumulative foreign exchange translation adjustment | $ | (3,101) | | | $ | (2,832) | |
| Pension and other postretirement benefit adjustments | (1,055) | | | (648) | |
| Fair value adjustments of available for sale investments | (2) | | | (7) | |
| Fair value adjustments of cash flow hedges | 23 | | | 12 | |
| Total Accumulated other comprehensive income (loss) | $ | (4,135) | | | $ | (3,475) | |
92 Honeywell International Inc.89
| | | | | |
| FINANCIAL STATEMENTS AND SUPPLEMENTARY DATA |
HONEYWELL INTERNATIONAL INC.
NOTES TO CONSOLIDATED FINANCIAL STATEMENTS—(Continued)
(Dollars in tables in millions, except per share amounts)
COMPONENTS OF ACCUMULATED OTHER COMPREHENSIVE INCOME (LOSS)
| | | | | | | | | | | | | | |
| | December 31, |
| 2021 | 2020 |
| Cumulative foreign exchange translation adjustment | | $ | (2,478) | | | $ | (2,780) | |
| Pensions and other postretirement benefit adjustments | | (415) | | | (601) | |
| Fair value adjustments of available for sale investments | | 1 | | | 4 | |
| Fair value adjustments of designated cash flow hedges | | (3) | | | — | |
| | | $ | (2,895) | | | $ | (3,377) | |
CHANGES IN ACCUMULATED OTHER COMPREHENSIVE INCOME (LOSS) BY COMPONENT
| | Foreign
Exchange
Translation
Adjustment | Pension
and Other
Postretirement
Adjustments | Changes in
Fair Value
of Available
for Sale
Investments | Changes in
Fair Value of
Cash Flow
Hedges | Total |
| Balance at December 31, 2018 | | $ | (2,709) | | | $ | (761) | | | $ | — | | | $ | 33 | | | $ | (3,437) | |
| Foreign
Exchange
Translation
Adjustment | | | Foreign
Exchange
Translation
Adjustment | | Pension
and Other
Postretirement Benefit
Adjustments | | Changes in
Fair Value
of Available
for Sale
Investments | | Changes in
Fair Value of
Cash Flow
Hedges | | Total |
| Balance at December 31, 2020 | |
| Other comprehensive income (loss) before reclassifications | Other comprehensive income (loss) before reclassifications | | 156 | | | 149 | | | — | | | 103 | | | 408 | |
| Amounts reclassified from accumulated other comprehensive income | | (13) | | | (63) | | | — | | | (92) | | | (168) | |
| Amounts reclassified from accumulated other comprehensive income (loss) | |
| Net current period other comprehensive income (loss) | Net current period other comprehensive income (loss) | | 143 | | | 86 | | | — | | | 11 | | | 240 | |
| Balance at December 31, 2019 | | $ | (2,566) | | | $ | (675) | | | $ | — | | | $ | 44 | | | $ | (3,197) | |
| Balance at December 31, 2021 | |
| Other comprehensive income (loss) before reclassifications | Other comprehensive income (loss) before reclassifications | | (201) | | | 115 | | | 4 | | | 10 | | | (72) | |
| Amounts reclassified from accumulated other comprehensive income | | (13) | | | (41) | | | — | | | (54) | | | (108) | |
| Amounts reclassified from accumulated other comprehensive income (loss) | |
| | Net current period other comprehensive income (loss) | Net current period other comprehensive income (loss) | | (214) | | | 74 | | | 4 | | | (44) | | | (180) | |
| Balance at December 31, 2020 | | $ | (2,780) | | | $ | (601) | | | $ | 4 | | | $ | — | | | $ | (3,377) | |
| Net current period other comprehensive income (loss) | |
| Net current period other comprehensive income (loss) | |
| Balance at December 31, 2022 | |
| Other comprehensive income (loss) before reclassifications | Other comprehensive income (loss) before reclassifications | | 314 | | | 268 | | | (3) | | | 17 | | | 596 | |
| Amounts reclassified from accumulated other comprehensive income | | (12) | | | (82) | | | — | | | (20) | | | (114) | |
| Amounts reclassified from accumulated other comprehensive income (loss) | |
| Net current period other comprehensive income (loss) | Net current period other comprehensive income (loss) | | 302 | | | 186 | | | (3) | | | (3) | | | 482 | |
| Balance at December 31, 2021 | | $ | (2,478) | | | $ | (415) | | | $ | 1 | | | $ | (3) | | | $ | (2,895) | |
| Balance at December 31, 2023 | |
| | | | | | | | | | | | | | | | | | | | | | | | | | | | | | | | | | | | | | | | | |
| | Year Ended December 31, 2023 |
| Affected Line in the Consolidated Statement of Operations |
| Net Sales | | Cost of Products Sold | | Cost of Services Sold | | Selling, General and Administrative Expenses | | Other (Income) Expense | | Interest and Other Financial Charges | | Total |
| Amortization of pension and other postretirement benefit items | | | | | | | | | | | | | |
| Actuarial losses recognized | $ | — | | | $ | — | | | $ | — | | | $ | — | | | $ | 141 | | | $ | — | | | $ | 141 | |
| Prior service (credit) recognized | — | | | — | | | — | | | — | | | (63) | | | — | | | (63) | |
| | | | | | | | | | | | | |
| Losses (gains) on cash flow hedges | (15) | | | (28) | | | (10) | | | (10) | | | — | | | — | | | (63) | |
| Losses (gains) on excluded component of net investment hedges | — | | | — | | | — | | | — | | | — | | | — | | | — | |
| Total before tax | $ | (15) | | | $ | (28) | | | $ | (10) | | | $ | (10) | | | $ | 78 | | | $ | — | | | $ | 15 | |
| Tax (expense) benefit | 6 | |
| Total reclassifications for the period, net of tax | $ | 21 | |
9093 Honeywell International Inc.
| | | | | |
| FINANCIAL STATEMENTS AND SUPPLEMENTARY DATA |
HONEYWELL INTERNATIONAL INC.
NOTES TO CONSOLIDATED FINANCIAL STATEMENTS—(Continued)
(Dollars in tables in millions, except per share amounts)
RECLASSIFICATIONS OUT OF ACCUMULATED OTHER COMPREHENSIVE INCOME (LOSS) | | | | Year Ended December 31, 2021 | | Year Ended December 31, 2022 |
| Affected Line in the Consolidated Statement of Operations | Affected Line in the Consolidated Statement of Operations |
| Net Sales | Cost of
Products
Sold | Cost of
Services
Sold | Selling, general and administrative expenses | Other
(Income)
Expense | Interest and
Other Financial
Charges | Total | Net Sales | | Cost of Products Sold | | Cost of Services Sold | | Selling, General and Administrative Expenses | | Other (Income) Expense | | Interest and Other Financial Charges | | Total |
| Amortization of Pension and Other Postretirement Items: | | | | | | | | | | | | |
| Amortization of pension and other postretirement benefit items | | Amortization of pension and other postretirement benefit items | | | | | | | |
| Actuarial losses recognized | Actuarial losses recognized | | $ | — | | | $ | — | | | $ | — | | | $ | — | | | $ | 7 | | | $ | — | | | $ | 7 | |
| Prior service (credit) recognized | Prior service (credit) recognized | | — | | | — | | | — | | | — | | | (116) | | | — | | | (116) | |
| | Losses (gains) on cash flow hedges | Losses (gains) on cash flow hedges | | (5) | | | (8) | | | (2) | | | (9) | | | — | | | — | | | (24) | |
| Losses (gains) on cash flow hedges | |
| Losses (gains) on cash flow hedges | |
| Losses (gains) on excluded component of net investment hedges | Losses (gains) on excluded component of net investment hedges | | — | | | — | | | — | | | — | | | — | | | (16) | | | (16) | |
| Total before tax | Total before tax | | $ | (5) | | | $ | (8) | | | $ | (2) | | | $ | (9) | | | $ | (109) | | | $ | (16) | | | $ | (149) | |
| Tax expense (benefit) | 35 | |
| Tax (expense) benefit | |
| Total reclassifications for the period, net of tax | Total reclassifications for the period, net of tax | $ | (114) | |
| | | | | | | | | | | | | | | | | | | | | | | | | | | | | | | | | | | | | | | | | | | | |
| | Year Ended December 31, 2020 |
| Affected Line in the Consolidated Statement of Operations |
| Net Sales | Cost of
Products
Sold | Cost of
Services
Sold | Selling, general and administrative expenses | Other
(Income)
Expense | Interest
and Other
Financial
Charges | Total |
| Amortization of Pension and Other Postretirement Items: | | | | | | | | | | | | | | |
| Actuarial losses recognized | | $ | — | | | $ | — | | | $ | — | | | $ | — | | | $ | 57 | | | $ | — | | | $ | 57 | |
| Prior service (credit) recognized | | — | | | — | | | — | | | — | | | (108) | | | — | | | (108) | |
| | | | | | | | | | | | | | |
| Losses (gains) on cash flow hedges | | 3 | | | (43) | | | (11) | | | 4 | | | (28) | | | — | | | (75) | |
| Losses (gains) on excluded component of net investment hedges | | — | | | — | | | — | | | — | | | — | | | (18) | | | (18) | |
| Total before tax | | $ | 3 | | | $ | (43) | | | $ | (11) | | | $ | 4 | | | $ | (79) | | | $ | (18) | | | $ | (144) | |
| Tax expense (benefit) | | | | 36 | |
| Total reclassifications for the period, net of tax | | | | $ | (108) | |
Honeywell International Inc. 91
FINANCIAL STATEMENTS AND SUPPLEMENTARY DATA
HONEYWELL INTERNATIONAL INC.
NOTES TO CONSOLIDATED FINANCIAL STATEMENTS—(Continued)
(Dollars in tables in millions, except per share amounts)
| | | | Year Ended December 31, 2019 | | Year Ended December 31, 2021 |
| Affected Line in the Consolidated Statement of Operations | Affected Line in the Consolidated Statement of Operations |
| Net Sales | Cost of
Products
Sold | Cost of
Services
Sold | Selling, general and administrative expenses | Other
(Income)
Expense | Interest
and Other
Financial
Charges | Total | Net Sales | | Cost of Products Sold | | Cost of Services Sold | | Selling, General and Administrative Expenses | | Other (Income) Expense | | Interest and Other Financial Charges | | Total |
| Amortization of Pension and Other Postretirement Items: | | | | | | | | | | | | |
| Amortization of pension and other postretirement benefit items | | Amortization of pension and other postretirement benefit items | | | | | | | |
| Actuarial losses recognized | Actuarial losses recognized | | $ | — | | | $ | — | | | $ | — | | | $ | — | | | $ | 135 | | | $ | — | | | $ | 135 | |
| Prior service (credit) recognized | Prior service (credit) recognized | | — | | | — | | | — | | | — | | | (104) | | | — | | | (104) | |
| | Losses (gains) on cash flow hedges | Losses (gains) on cash flow hedges | | (3) | | | (35) | | | (9) | | | (1) | | | (73) | | | — | | | (121) | |
| Losses (gains) on cash flow hedges | |
| Losses (gains) on cash flow hedges | |
| Losses (gains) on excluded component of net investment hedges | Losses (gains) on excluded component of net investment hedges | | — | | | — | | | — | | | — | | | — | | | (19) | | | (19) | |
| Total before tax | Total before tax | | $ | (3) | | | $ | (35) | | | $ | (9) | | | $ | (1) | | | $ | (42) | | | $ | (19) | | | $ | (109) | |
| Tax expense (benefit) | | | (59) | |
| Tax (expense) benefit | |
| Total reclassifications for the period, net of tax | Total reclassifications for the period, net of tax | | $ | (168) | |
NOTE 18. CAPITAL STOCK
The Company is authorized to issue up to 2,000,000,000 shares of common stock, with a par value of $1. Common shareowners are entitled to receive such dividends as may be declared by the Board of Directors, are entitled to one vote per share, and are entitled, in the event of liquidation, to share ratably in all the assets of the Company which are available for distribution to the common shareowners. Common shareowners do not have preemptive or conversion rights. Shares of common stock issued and outstanding or held in the treasury are not liable to further calls or assessments. There are no restrictions on the Company relative to dividends or the repurchase or redemption of common stock.
InOn April 2019,24, 2023, the Board of Directors authorized the repurchase of up to a total of $10 billion of Honeywell common stock. On February 12, 2021 the Board of Directors authorized another repurchase of up to a total of $10stock, including approximately $2.1 billion of Honeywell common stock, which included $2.8 billion remaining availability under and replaced, the previously approvedannounced $10 billion share repurchase authorization. Approximately $7.1 billion and $3.3$2.9 billion remained available as of December 31, 20212023, and 2020,2022, respectively, for additional share repurchases.
Honeywell repurchased approximately 15.819.2 million and 20.721.9 million shares of its common stock during the years ended December 31, 20212023, and 2020,2022, for $3,380 million$3.7 billion and $3,714 million.$4.2 billion, respectively.
The Company is authorized to issue up to 40,000,000 shares of preferred stock, without par value, and can determine the number of shares of each series, and the rights, preferences, and limitations of each series. At December 31, 2021,2023, there was no preferred stock outstanding.
9294 Honeywell International Inc.
| | | | | |
| FINANCIAL STATEMENTS AND SUPPLEMENTARY DATA |
HONEYWELL INTERNATIONAL INC.
NOTES TO CONSOLIDATED FINANCIAL STATEMENTS—(Continued)
(Dollars in tables in millions, except per share amounts)
NOTE 19. COMMITMENTS AND CONTINGENCIES
ENVIRONMENTAL MATTERS
The Company is subject to various federal, state, local, and foreign government requirements relating to the protection of the environment. The Company believes that, as a general matter, the Company's policies, practices, and procedures are properly designed to prevent unreasonable risk of environmental damage and personal injury and that the handling, manufacture, use, and disposal of hazardous substances are in accordance with environmental and safety laws and regulations. However, mainly because of past operations and operations of predecessor companies, the Company, like other companies engaged in similar businesses, have incurred remedial response and voluntary cleanup costs for site contamination and areis a party to lawsuits and claims associated with environmental and safety matters, including past production of products containing hazardous substances. Additional lawsuits, claims, and costs involving environmental matters are likely to continue to arise in the future.
With respect to environmental matters involving site contamination, the Company continually conducts studies, individually or jointly with other potentially responsible parties, to determine the feasibility of various remedial techniques. It is the Company's policy to record appropriate liabilities for environmental matters when remedial efforts or damage claim payments are probable and the costs can be reasonably estimated. Such liabilities are based on our best estimate of the undiscounted future costs required to complete the remedial work. The recorded liabilities are adjusted periodically as remediation efforts progress or as additional technical, regulatory, or legal information becomes available. Given the uncertainties regarding the status of laws, regulations, enforcement policies, the impact of other potentially responsible parties, technology, and information related to individual sites, the Company does not believe it is possible to develop an estimate of the range of reasonably possible environmental loss in excess of the Company's recorded liabilities. The Company expects to fund expenditures for these matters from operating cash flow.flows. The timing of cash expenditures depends on a number of factors, including the timing of remedial investigations and feasibility studies, the timing of litigation and settlements of remediation liability, personal injury and property damage claims, regulatory approval of cleanup projects, remedial techniques to be utilized, and agreements with other parties.
The following table summarizes information concerning ourthe Company's recorded liabilities for environmental costs:
| | | | Years Ended December 31, | | Years Ended December 31, |
| 2021 | 2020 | 2019 | 2023 | | 2022 | | 2021 |
| Beginning of year | Beginning of year | | $ | 660 | | | $ | 709 | | | $ | 755 | |
| Accruals for environmental matters deemed probable and reasonably estimable | Accruals for environmental matters deemed probable and reasonably estimable | | 168 | | | 173 | | | 213 | |
| Environmental liability payments | Environmental liability payments | | (210) | | | (216) | | | (256) | |
| Other | Other | | — | | | (6) | | | (3) | |
| End of year | End of year | | $ | 618 | | | $ | 660 | | | $ | 709 | |
Environmental liabilities are included in the following balance sheet accounts:
| | | | December 31, | | December 31, |
| 2021 | 2020 | 2023 | | 2022 |
| Accrued liabilities | Accrued liabilities | | $ | 225 | | | $ | 225 | |
| Other liabilities | Other liabilities | | 393 | | | 435 | |
| $ | 618 | | | $ | 660 | |
| Total environmental liabilities | |
The Company does not currently possess sufficient information to reasonably estimate the amounts of environmental liabilities to be recorded upon future completion of studies, litigation, or settlements, and neither the timing nor the amount of the ultimate costs associated with environmental matters can be determined, although they could be material to the Company's consolidated results of operations and operating cash flows in the periods recognized or paid. However, considering the Company's past experience and existing reserves, the Company does not expect that environmental matters will have a material adverse effect on its consolidated financial position.
In conjunction with the Resideo spin-off, the Company entered into an indemnification and reimbursement agreement with a Resideo subsidiary, pursuant to which Resideo’s subsidiary has an ongoing obligation to make cash payments to Honeywell in amounts equal to 90% of Honeywell’s annual net spending for environmental matters at certain sites as defined in the agreement. The amount payable to Honeywell in any given year is subject to a cap of $140 million, and the obligation will continue until the earlier of December 31, 2043, or December 31 of the third consecutive year during which the annual payment obligation is less than $25 million.
95 Honeywell International Inc.93
| | | | | |
| FINANCIAL STATEMENTS AND SUPPLEMENTARY DATA |
HONEYWELL INTERNATIONAL INC.
NOTES TO CONSOLIDATED FINANCIAL STATEMENTS—(Continued)
(Dollars in tables in millions, except per share amounts)
Reimbursements associated with this agreement are collected from Resideo quarterly and were $140 million in both 20212023 and 20202022 and offset operating cash outflows incurred by the Company. As the Company incurs costs for environmental matters deemed probable and reasonably estimable related to the sites covered by the indemnification and reimbursement agreement, a corresponding receivable from Resideo for 90% of such costs is also recorded. This receivable amount recorded in 20212023 and 20202022 was $146$187 million and $146$157 million, respectively. As of December 31, 2021,2023, Other current assets and Other assets included $140 million and $457$521 million, respectively,respectively, for the short-term and long-term portion of the receivable amount due from Resideo under the indemnification and reimbursement agreement. As of December 31, 2020,2022, Other current assets and Other assets included $140 million and $451$474 million, respectively, for the short-term and long-term portion of the receivable amount due from Resideo under the indemnification and reimbursement agreement.
ASBESTOS RELATED LIABILITIESMATTERS
Honeywell is named in asbestos-related personal injury claims related to North American Refractories Company (NARCO),NARCO, which was sold in 1986, and the Bendix Friction Materials (Bendix) business, which was sold in 2014.
The following tables summarize information concerning NARCO and Bendix asbestos-related balances:
| | | | | | | | | | | | | | | | | | | | | | | | | | | | | | | | | | | | | | | | | | | | | | | | | | | | | | | | | | | | | | |
| Year Ended December 31, 2021 | | Year Ended December 31, 2020 | | Year Ended December 31, 2019 |
| Bendix | NARCO | Total | | Bendix | NARCO | Total | | Bendix | NARCO | Total |
| Beginning of year | | $ | 1,441 | | | $ | 779 | | | $ | 2,220 | | | | $ | 1,499 | | | $ | 858 | | | $ | 2,357 | | | | $ | 1,623 | | | $ | 891 | | | $ | 2,514 | |
| Accrual for update to estimated liability | | 64 | | | 31 | | | 95 | | | | 80 | | | 18 | | | 98 | | | | 78 | | | 22 | | | 100 | |
| Change in estimated cost of future claims | | 29 | | | — | | | 29 | | | | 42 | | | — | | | 42 | | | | (22) | | | — | | | (22) | |
| Update of expected resolution values for pending claims | | 3 | | | — | | | 3 | | | | 10 | | | — | | | 10 | | | | (4) | | | — | | | (4) | |
| Asbestos related liability payments | | (165) | | | (121) | | | (286) | | | | (190) | | | (97) | | | (287) | | | | (176) | | | (55) | | | (231) | |
| End of year | | $ | 1,372 | | | $ | 689 | | | $ | 2,061 | | | | $ | 1,441 | | | $ | 779 | | | $ | 2,220 | | | | $ | 1,499 | | | $ | 858 | | | $ | 2,357 | |
| | | | | | | | | | | | | | | | | | | | | | | | | | | | | | | | | | | | | | | | | | | | | | | | | | | | | |
| Year Ended December 31, 2023 | | Year Ended December 31, 2022 | | Year Ended December 31, 2021 |
| Bendix | | NARCO | | Total | | Bendix | | NARCO | | Total | | Bendix | | NARCO | | Total |
| Beginning of year | $ | 1,291 | | | $ | 1,325 | | | $ | 2,616 | | | $ | 1,372 | | | $ | 689 | | | $ | 2,061 | | | $ | 1,441 | | | $ | 779 | | | $ | 2,220 | |
| Accrual for update to estimated liability | 43 | | | 5 | | | 48 | | | 93 | | | (634) | | | (541) | | | 64 | | | 31 | | | 95 | |
| Change in estimated cost of future claims | 423 | | | — | | | 423 | | | 41 | | | — | | | 41 | | | 29 | | | — | | | 29 | |
| Update of expected resolution values for pending claims | 56 | | | — | | | 56 | | | 1 | | | — | | | 1 | | | 3 | | | — | | | 3 | |
| Asbestos-related liability payments | (169) | | | (5) | | | (174) | | | (216) | | | (55) | | | (271) | | | (165) | | | (121) | | | (286) | |
| NARCO Buyout | — | | | (1,325) | | | (1,325) | | | — | | | 1,325 | | | 1,325 | | | — | | | — | | | — | |
| End of year | $ | 1,644 | | | $ | — | | | $ | 1,644 | | | $ | 1,291 | | | $ | 1,325 | | | $ | 2,616 | | | $ | 1,372 | | | $ | 689 | | | $ | 2,061 | |
INSURANCE RECOVERIES FOR ASBESTOS RELATEDASBESTOS-RELATED LIABILITIES
| | | | | | | | | | | | | | | | | | | | | | | | | | | | | | | | | | | | | | | | | | | | | | | | | | | | | | | | | | | | | | |
| Year Ended December 31, 2021 | | Year Ended December 31, 2020 | | Year Ended December 31, 2019 |
| Bendix | NARCO | Total | | Bendix | NARCO | Total | | Bendix | NARCO | Total |
| Beginning of year | | $ | 148 | | | $ | 254 | | | $ | 402 | | | | $ | 153 | | | $ | 281 | | | $ | 434 | | | | $ | 170 | | | $ | 307 | | | $ | 477 | |
| Probable insurance recoveries related to estimated liability | | 7 | | | — | | | 7 | | | | 10 | | | — | | | 10 | | | | 3 | | | — | | | 3 | |
| Insurance receipts for asbestos related liabilities | | (13) | | | (33) | | | (46) | | | | (33) | | | (25) | | | (58) | | | | (39) | | | (29) | | | (68) | |
| Insurance receivables settlements and write offs | | — | | | — | | | — | | | | 18 | | | (2) | | | 16 | | | | 19 | | | 3 | | | 22 | |
| | | | | | | | | | | | | | | | | | | | |
| End of year | | $ | 142 | | | $ | 221 | | | $ | 363 | | | | $ | 148 | | | $ | 254 | | | $ | 402 | | | | $ | 153 | | | $ | 281 | | | $ | 434 | |
NARCO and Bendix asbestos related balances are included in the following balance sheet accounts:
| | | | | | | | | | | | | | |
| | December 31, |
| 2021 | 2020 |
| Other current assets | | $ | 41 | | | $ | 36 | |
| Insurance recoveries for asbestos related liabilities | | 322 | | | 366 | |
| | $ | 363 | | | $ | 402 | |
| Accrued liabilities | | $ | 261 | | | $ | 300 | |
| Asbestos related liabilities | | 1,800 | | | 1,920 | |
| | | $ | 2,061 | | | $ | 2,220 | |
| | | | | | | | | | | | | | | | | | | | | | | | | | | | | | | | | | | | | | | | | | | | | | | | | | | | | |
| Year Ended December 31, 2023 | | Year Ended December 31, 2022 | | Year Ended December 31, 2021 |
| Bendix | | NARCO | | Total | | Bendix | | NARCO | | Total | | Bendix | | NARCO | | Total |
| Beginning of year | $ | 130 | | | $ | 135 | | | $ | 265 | | | $ | 142 | | | $ | 221 | | | $ | 363 | | | $ | 148 | | | $ | 254 | | | $ | 402 | |
| Probable insurance recoveries related to estimated liability | 11 | | | — | | | 11 | | | 5 | | | 2 | | | 7 | | | 7 | | | — | | | 7 | |
| Insurance receipts for asbestos-related liabilities | (18) | | | (21) | | | (39) | | | (17) | | | (20) | | | (37) | | | (13) | | | (33) | | | (46) | |
| Insurance receivables settlements and write-offs | — | | | (26) | | | (26) | | | — | | | (68) | | | (68) | | | — | | | — | | | — | |
| | | | | | | | | | | | | | | | | |
| End of year | $ | 123 | | | $ | 88 | | | $ | 211 | | | $ | 130 | | | $ | 135 | | | $ | 265 | | | $ | 142 | | | $ | 221 | | | $ | 363 | |
9496 Honeywell International Inc.
| | | | | |
| FINANCIAL STATEMENTS AND SUPPLEMENTARY DATA |
HONEYWELL INTERNATIONAL INC.
NOTES TO CONSOLIDATED FINANCIAL STATEMENTS—(Continued)
(Dollars in tables in millions, except per share amounts)
NARCO and Bendix asbestos-related balances are included in the following balance sheet accounts:
| | | | | | | | | | | |
| | December 31, |
| 2023 | | 2022 |
| Other current assets | $ | 41 | | | $ | 41 | |
| Insurance recoveries for asbestos-related liabilities | 170 | | | 224 | |
| Total insurance recoveries for asbestos-related liabilities | $ | 211 | | | $ | 265 | |
| Accrued liabilities | $ | 154 | | | $ | 1,436 | |
| Asbestos-related liabilities | 1,490 | | | 1,180 | |
Total asbestos-related liabilities1 | $ | 1,644 | | | $ | 2,616 | |
| | | | | | | | |
| 1 | | As of December 31, 2022, Accrued liabilities included the Buyout Amount, as described and defined below, agreed upon between Honeywell and the Trust. The Buyout Amount does not represent an asbestos-related liability. |
NARCO Products – NARCO manufactured high-grade, heat-resistant, refractory products for various industries. Honeywell’s predecessor, Allied Corporation, owned NARCO from 1979 to 1986. Allied Corporation sold the NARCO business in 1986 and entered into a cross-indemnity agreement which included an obligation to indemnify the purchaser for asbestos claims, arising primarily from alleged occupational exposure to asbestos-containing refractory brick and mortar for high-temperature applications. NARCO ceased manufacturing these products in 1980 and filed for bankruptcy in January 2002, at which point in time all then current and future NARCO asbestos claims were stayed against both NARCO and Honeywell pending the reorganization of NARCO. The Company established its initial liability for NARCO asbestos claims in 2002.
NARCO emerged from bankruptcy in April 2013, at which time a federally authorized 524(g) trust was established to evaluate and resolve all existing NARCO asbestos claims (the Trust). Both Honeywell and NARCO are protected by a permanent channeling injunction barring all present and future individual actions in state or federal courts and requiring all asbestos-related claims based on exposure to NARCO asbestos-containing products to be made against the Trust.Trust (Channeling Injunction). The NARCO Trust Agreement (TA) and the NARCO Trust Distribution Procedures (TDP) set forth the structure and operating rules of the Trust, and established Honeywell’s evergreen funding obligations.
In accordance with the TA, the Trust is eligible to receive cash dividends from Harbison-Walker International Inc. (HWI), the reorganized and renamed entity that emerged from the NARCO bankruptcy. HWI cash dividends are required to be used to pay asbestos-related claims which qualify for payment under the TDP (Annual Contribution Claims) until those funds are exhausted, at which point Honeywell’s funding obligation, subject to an annual cap of $145 million, is triggered. The Trust received dividend payments from HWI in 2021. The Company is also required to fund amounts owed pursuant to settlement agreements reached during the pendency of the NARCO bankruptcy proceedings that provide for the right to submit claims to the Trust subject to qualification under the terms of the settlement agreements and TDP (Pre-Established Unliquidated Claims), as well as fund the annual operating costs of the Trust. There is no annual funding cap relative to Pre-Established Unliquidated Claims.
The operating rules per the TDP define criteria claimants must meet for a claim to be considered valid and paid, which include adequate medical evidence of the claimant’s asbestos-related condition and credible evidence of exposure to a specific NARCO asbestos-containing product. The TDP allows Honeywell to audit claim support documents against these criteria.paid. Once operational in 2014, the Trust began to receive, process, and pay claims. The Company identified several issues with the way the Trust was adhering to the TDP in audits subsequent to the Trust becoming operational. The Company consistently raised with the Trust concern that the Trust adopted an improper practice of paying claimants who have not demonstrated the requisite exposure. The Trust refused to alter its practices for payment of claims, and inIn September 2021, Honeywell filed suit against the Trust in the United States Bankruptcy Court for the Western District of Pennsylvania (Bankruptcy Court) alleging that the Trust has breached its duties in managing the Trust, including breaches of certain provisions of the TA and TDP. Honeywell's lawsuit seekssought appropriate relief preventing the Trust from continuing these practices. The Trust also filed suit against Honeywell, alleging Honeywell has breached its obligations under the Trust's governing documents. Honeywell moved to dismiss the Trust’s suit, and on December 15, 2021, the Bankruptcy Court granted Honeywell’s motion to dismiss subject to granting the Trust leave to file an amended complaint. On December 28, 2021, the Trust filed an answer with counterclaims in response to Honeywell’s complaint and in lieu of filing an amended complaint. At this time,The Bankruptcy Court conducted a trial on these matters during May 2022; following the trial, the Company cannot predictand the outcomeTrust began discussing a potential settlement of these matters, or the potential impact on the asbestos-related liabilities.
DueHoneywell’s remaining obligations to the bankruptcy filing in 2002, claimants were not permitted to file additional claims until the Trust became operative in 2014. AsTrust.
On November 18, 2022, Honeywell entered into a consequence, there was a large backlog of claims fileddefinitive agreement (Buyout Agreement) with the Trust, upon itand on November 20, 2022, in exchange for the NARCO Trust Advisory Committee (TAC) and Lawrence Fitzpatrick, in his capacity as the NARCO Asbestos Future Claimants Representative (FCR), becoming operative in 2014 through December 31, 2017,parties to the date by which these claims hadBuyout Agreement, Honeywell, the Trust, the TAC, and the FCR entered into an Amended and Restated Buyout Agreement (Amended Buyout Agreement).
Pursuant to be filed or else be barred by the expirationterms of the statuteAmended Buyout Agreement, Honeywell agreed to make a one-time, lump sum payment in the amount of limitations. Therefore,$1.325 billion to the claims filing rate did not startTrust (Buyout Amount), subject to normalize until 2018certain deductions as described in the Amended Buyout Agreement and thereafter. As a result, between 2002 and 2018, the Company lacked a history of sufficiently reliable claims data to derive a reasonable estimate of its NARCO asbestos-related liability, and the Company continued to update its original estimate, as appropriate, using all available information.
Beginning in 2020, with three years of sufficiently reliable claims data, the Company updated its estimate of the NARCO asbestos-related liability. The estimateexchange for the resolution of asserted Annual Contribution Claims and Pre-Established Unliquidated Claims uses average payment values for the relevant historical period. The estimate for unasserted claims is based on historic and anticipated claims filing experience and payment rates, disease classifications and type of claim, and average payment valuesrelease by the Trust forof Honeywell from all further and future obligations of any kind related to the relevant historical period. The Company utilizes an asbestos liability valuation specialistTrust and/or any claimants who were exposed to supportasbestos-containing products manufactured, sold, or distributed by NARCO or its predecessors, including Honeywell’s ongoing evergreen obligation to fund (i) claims against the preparation of theTrust, which comprise Honeywell’s NARCO asbestos-related claims liability, estimates duringand (ii) the fourth quarter each year. The Company's estimates, which involve significant management judgment, and consider multiple scenarios, include all years of epidemiological disease projection through 2059.
The NARCO asbestos-related liability reflects an estimate for the resolution of Annual Contribution Claims and Pre-Established Unliquidated Claims filed with the Trust, as well as for unasserted Annual Contribution Claims and Pre-Established Unliquidated Claims. The NARCO asbestos-related liability excludes theTrust’s annual operating expenses, of the Trust which are expensed as they are incurred.incurred, including its legal fees (which operating expenses, for reference, were approximately $30 million in 2022) (such evergreen obligations referred to in (i) and (ii), Honeywell Obligations) (the NARCO Buyout).
On December 8, 2022, the Bankruptcy Court issued an order that (A) approved the Amended Buyout Agreement, and (B) declared that the NARCO Channeling Injunction (which bars all past, present, and future individual actions in state or federal courts based on exposure to NARCO asbestos-containing products and requires all such claims to be made against the Trust) will remain in full force and effect without modification, dissolution, or termination (Order).
97 Honeywell International Inc.95
| | | | | |
| FINANCIAL STATEMENTS AND SUPPLEMENTARY DATA |
HONEYWELL INTERNATIONAL INC.
NOTES TO CONSOLIDATED FINANCIAL STATEMENTS—(Continued)
(Dollars in tables in millions, except per share amounts)
The Company's NARCO-related insurance receivable reflects coverageOn December 14, 2022, HWI, the reorganized and renamed entity that emerged from the NARCO bankruptcy, entered into a definitive agreement (Sale Agreement) pursuant to which reimburses Honeywell for portionsan affiliate of NARCO-related claims and defense costs. This coverage is provided by a large number of insurance policies written by dozens of insurance companiesPlatinum Equity, LLC agreed to acquire HWI (HWI Sale) subject to the terms set forth in both the domestic insurance market andSale Agreement, including customary conditions to closing set forth therein. In accordance with the London excess market. Honeywell's NARCO-related insurance receivable is an estimateAmended Buyout Agreement, the economic rights of the probable amountTrust in respect of insurance that is recoverable for asbestos claims. The Company's judgments relatedthe net proceeds from the HWI Sale inure to the Company'sbenefit of Honeywell.
On January 30, 2023, the Company paid the Buyout Amount to the Trust, the parties closed the transactions contemplated in the Amended Buyout Agreement (Closing), and Honeywell was released from the Honeywell Obligations. Honeywell continues to have the right to collect proceeds in connection with its NARCO asbestos-related insurance carrierspolicies.
With the issuance of the Order, the Company derecognized the NARCO asbestos-related liability of $688 million from the Consolidated Balance Sheet and insurance coverages are reasonablerecognized a charge of $1.325 billion in the Consolidated Statement of Operations and consistent withaccrued a corresponding liability in the Consolidated Balance Sheet for the Buyout Amount. In addition, the Company recognized a benefit of $295 million in the Consolidated Statement of Operations and corresponding asset in Other current assets in the Consolidated Balance Sheet for Honeywell's historical dealingsrights to the proceeds from the HWI Sale. The benefit of $295 million offset the charge for the Buyout Amount.
On February 16, 2023, the HWI Sale closed. Pursuant to the Amended Buyout Agreement, during 2023, Honeywell received $275 million of proceeds from the HWI sale. See Note 12 Fair Value Measurements for further information on the related proceeds and Honeywell's knowledge of any pertinent solvency issues surrounding insurers.remaining amount under the Amended Buyout Agreement.
Bendix Products – Bendix manufactured automotive brake linings that contained chrysotile asbestos in an encapsulated form. Claimants consist largely of individuals who allege exposure to asbestos from brakes from either performing or being in the vicinity of individuals who performed brake replacements. The following tables present information regarding Bendix relatedBendix-related asbestos claims activity:
| | | | | | | | | | | | | | |
| Claims Activity | Years Ended December 31, |
| 2021 | 2020 |
| Claims Unresolved at the beginning of year | | 6,242 | | | 6,480 | |
| Claims Filed | | 2,611 | | | 2,233 | |
| Claims Resolved | | (2,452) | | | (2,471) | |
| Claims Unresolved at the end of year | | 6,401 | | | 6,242 | |
| | | | | | | | | | | |
| Years Ended December 31, |
| 2023 | | 2022 |
| Claims unresolved at the beginning of year | 5,608 | | | 6,401 | |
| Claims filed | 1,803 | | | 2,014 | |
| Claims resolved | (1,894) | | | (2,807) | |
| Claims unresolved at the end of year | 5,517 | | | 5,608 | |
| | | | | | | | | | | | | | |
| Disease Distribution of Unresolved Claims | Years Ended December 31, |
| 2021 | 2020 |
| Mesothelioma and Other Cancer Claims | | 3,760 | | | 3,422 | |
| Nonmalignant Claims | | 2,641 | | | 2,820 | |
| Total Claims | | 6,401 | | | 6,242 | |
| | | | | | | | | | | |
| Disease Distribution of Unresolved Claims | Years Ended December 31, |
| 2023 | | 2022 |
| Mesothelioma and other cancer claims | 3,244 | | | 3,283 | |
| Nonmalignant claims | 2,273 | | | 2,325 | |
| Total claims | 5,517 | | | 5,608 | |
Honeywell has experienced average resolution values per claim excluding legal costs as follows:
| | | | | | | | | | | | | | | | | | | | | | | | | | | | | | | | |
| | Years Ended December 31, |
| 2021 | 2020 | 2019 | 2018 | 2017 |
| | | (in whole dollars) |
| Malignant claims | | $ | 56,000 | | | $ | 61,500 | | | $ | 50,200 | | | $ | 55,300 | | | $ | 56,000 | |
| Nonmalignant claims | | $ | 400 | | | $ | 550 | | | $ | 3,900 | | | $ | 4,700 | | | $ | 2,800 | |
It is not possible to predict whether resolution values for Bendix-related asbestos claims will increase, decrease or stabilize in the future. | | | | | | | | | | | | | | | | | | | | | | | | | | | | | |
| | Years Ended December 31, |
| 2023 | | 2022 | | 2021 | | 2020 | | 2019 |
| | (in whole dollars) |
| Mesothelioma and other cancer claims | $ | 66,200 | | | $ | 59,200 | | | $ | 56,000 | | | $ | 61,500 | | | $ | 50,200 | |
| Nonmalignant claims | 1,730 | | | 520 | | | 400 | | | 550 | | | 3,900 | |
The Consolidated Financial Statements reflect an estimated liability for resolution of asserted (claims filed as of the financial statement date) and unasserted Bendix-related asbestos claims, which exclude the Company’s ongoing legal fees to defend such asbestos claims which will continue to be expensed as they are incurred.
The Company reflects the inclusion of all years of epidemiological disease projection through 2059 when estimating the liability for unasserted Bendix-related asbestos claims. Such liability for unasserted Bendix-related asbestos claims is based on historic and anticipated claims filing experience and dismissal rates, disease classifications, and average resolution values in the tort system for the previous five years.over a defined look-back period. The Company hashistorically valued Bendix asserted and unasserted claims using average resolution values for the previous five years.a five-year look-back period. The Company updatesreviews the valuation assumptions and average resolution values used to estimate the cost of Bendix asserted and unasserted claims during the fourth quarter each year.
98 Honeywell International Inc.
| | | | | |
| FINANCIAL STATEMENTS AND SUPPLEMENTARY DATA |
HONEYWELL INTERNATIONAL INC.
NOTES TO CONSOLIDATED FINANCIAL STATEMENTS—(Continued)
(Dollars in tables in millions, except per share amounts)
The Company experienced fluctuations in average resolution values year-over-year in each of the past five years with no well-established trends in either direction. In 2023, the Company observed two consecutive years of increasing average resolution values (2023 and 2022), with more volatility in the earlier years of the five-year period (2019 through 2021). Based on these observations, the Company, during its annual review in the fourth quarter of 2023, reevaluated its valuation methodology and elected to give more weight to the two most recent years by shortening the look-back period from five years to two years (2023 and 2022). The Company believes that the average resolution values in the last two consecutive years are likely more representative of expected resolution values in future periods.
It is not possible to predict whether such resolution values will increase, decrease, or stabilize in the future, given recent litigation trends within the tort system and the inherent uncertainty in predicting the outcome of such trends. The Company will continue to monitor Bendix claim resolution values and other trends within the tort system to assess the appropriate look-back period for determining average resolution values going forward.
In 2023, the Company recognized a $522 million expense and corresponding adjustment to its estimated liability for Bendix asbestos-related claims. This amount includes $434 million attributable primarily to shortening the look-back period to the two most recent years, and to a lesser extent to increasing expected resolution values for a subset of asserted claims to adjust for higher claim values in that subset than in the modelled two-year data set.
The Company's insurance receivable corresponding to the liability for settlement of asserted and unasserted Bendix asbestos claims reflects coverage which is provided by a large number of insurance policies written by dozens of insurance companies in both the domestic insurance market and the London excess market. Based on the Company's ongoing analysis of the probable insurance recovery, insurance receivables are recorded in the financial statements simultaneous with the recording of the estimated liability for the underlying asbestos claims. This determination is based on the Company's analysis of the underlying insurance policies, historical experience with insurers, ongoing review of the solvency of insurers, judicial determinations relevant to insurance programs, and consideration of the impacts of any settlements reached with the Company's insurers.
96 Honeywell International Inc.
FINANCIAL STATEMENTS AND SUPPLEMENTARY DATA
HONEYWELL INTERNATIONAL INC.
NOTES TO CONSOLIDATED FINANCIAL STATEMENTS—(Continued)
(Dollars in tables in millions, except per share amounts)
On October 31, 2018, David Kanefsky (Plaintiff), a Honeywell shareholder, filed a putative class action complaint in the U.S. District Court for the District of New Jersey (the Court) alleging violations of the Securities Exchange Act of 1934 and Rule 10b-5 related to the prior accounting for Bendix asbestos claims. An Amended Complaint was filed on December 30, 2019, and on February 7, 2020, the Company filed a Motion to Dismiss. On May 18, 2020, the Court denied the Motion to Dismiss. On December 7, 2021, the parties filed a Stipulation of Settlement (Settlement Agreement) and Plaintiff filed a motion for preliminary approval of the Settlement Agreement, which includesincluded payment by Honeywell of $10 million to settle the claims in dispute. On January 18, 2022, the Court approved the motion for preliminary approval of the Settlement Agreement. On May 3, 2022, the Court entered a final judgment and order approving the Settlement Agreement and dismissed the action. Honeywell continues to believe the claims lacklacked merit and denieshas denied wrongdoing as well as any liability for the claims made against Honeywell in the action. The Settlement Agreement remains subject to final court approval and other conditions.
GARRETT LITIGATION AND BANKRUPTCY PROCEEDINGS
In conjunction with the Garrett spin-off, the Company entered into a binding indemnification and reimbursement agreement (Garrett Indemnity) and a binding tax matters agreement (Tax Matters Agreement) with Garrett and a Garrett subsidiary. On December 2, 2019, Garrett and Garrett ASASCO Inc. filed a Summons with Notice and commenced a lawsuit in the Commercial Division of the Supreme Court of the State of New York, County of New York (the State Court), seeking to invalidate the Garrett Indemnity. Garrett sought damages and a declaratory judgment based on various claims set forth in the Summons with Notice. On July 17, 2020, the Company received a notice from Garrett asserting that the Company had caused material breaches of the Tax Matters Agreement and that the Tax Matters Agreement was unenforceable.
On September 20, 2020, Garrett and 36 of its affiliates filed voluntary petitions for relief under Chapter 11 of the United States Bankruptcy Code in the United States Bankruptcy Court for the Southern District of New York (the Bankruptcy Court). On September 24, 2020, Garrett moved the existing State Court litigation against Honeywell to the Bankruptcy Court. For the year ended December 31, 2020, the Company reviewed the aggregate carrying value of the receivable amounts due in connection with the Garrett Indemnity and Tax Matters Agreement and reduced the aggregate carrying value of the receivable by $509 million to reflect the present value of the amounts owed to the Company over the full term of these agreements.
On April 26, 2021, the Bankruptcy Court confirmed Garrett’s amended Chapter 11 plan of reorganization (the Confirmed Plan), and on April 30, 2021 (the Effective Date), Garrett emerged from bankruptcy. On the Effective Date, and in accordance with the Confirmed Plan, (i) the Company received from Garrett an initial payment of $375 million and 834.8 million shares of Garrett's Series B Preferred Stock in full and final satisfaction of the Garrett Indemnity and Tax Matters Agreement, (ii) the Garrett Indemnity and Tax Matters Agreement were terminated, (iii) the Company and Garrett mutually released each other from the claims asserted in all pending legal actions related to the Garrett Indemnity and Tax Matters Agreement, and (iv) all pending litigation between the Company and Garrett in connection with those agreements was resolved.
99 Honeywell International Inc.
| | | | | |
| FINANCIAL STATEMENTS AND SUPPLEMENTARY DATA |
HONEYWELL INTERNATIONAL INC.
NOTES TO CONSOLIDATED FINANCIAL STATEMENTS—(Continued)
(Dollars in tables in millions, except per share amounts)
The original Series B Preferred Stock Certificate of Designation providesprovided for mandatory redemptions by Garrett of $35 million in 2022 and $100 million per year from 2023 to 2030 (inclusive) at the anniversary of the Effective Date, unless (i) Garrett’s consolidated EBITDA as of the end of the most recently completed fiscal year iswas less than $425 million, or (ii) Garrett doesdid not have sufficient funds available to pay the redemption, at which point the redemption amounts past due willwould accrue interest. The Series B Preferred Stock Certificate of Designation also includesincluded rights which allowallowed (a) the Company to put the Series B Preferred Stock to Garrett if certain EBITDA conditions arewere met, and (b) Garrett to call the Series B Preferred Stock in whole or in part if certain EBITDA conditions arewere met.
On September 30, 2021, Garrett filed an Amended and Restated Series B Preferred Stock Certificate of Designation (Amendment) with the Secretary of State of Delaware. The Amendment required Garrett to partially redeem a portion of the Series B Preferred Stock on or before March 31, 2022, such that the present value of remaining outstanding shares of the Series B Preferred Stock would be $400 million (First Partial Redemption), subject to applicable law, including that Garrett had funds legally available for the partial redemption. The First Partial Redemption would be applied to the latest scheduled redemption dates, beginning with the shares to be redeemed in 2030. The Amendment also providesprovided that the Company cannotcould not exercise its right to put the Series B Preferred Stock to Garrett until after December 31, 2022, subject to the EBITDA conditions described in the above section, unless the partial redemption doesdid not occur on or before March 31, 2022. All other material terms and conditions in the Amendment were unchanged from the original Series B Preferred Stock Certificate of Designation.
On December 16, 2021, Garrett filed a Second Amended and Restated Series B Preferred Stock Certificate of Designation (Second Amendment) with the Secretary of State of Delaware. The Second Amendment acceleratesaccelerated the First Partial Redemption from March 31, 2022, to December 30, 2021, and allowsallowed Garrett to partially redeem an additional portion of the Series B Preferred Stock on or before March 31, 2022, such that the present value of remaining outstanding shares of the Series B Preferred Stock willwould be $207 million (Second Partial Redemption). The Second Partial Redemption is subject to similar terms as the First Partial Redemption, including that Garrett hashad funds legally available for the partial redemption. However, the Second Partial Redemption iswas also contingent upon Garrett completing the First Partial Redemption and either (i) increasing their revolving credit facility, or (ii) the Garrett Board of Directors determining that Garrett otherwise hashad sufficient liquidity to effect the Second Partial Redemption. The Second Partial Redemption would be applied to the earliest scheduled redemptions beginning with the shares to be redeemed on April 30, 2022.
Honeywell International Inc. 97
FINANCIAL STATEMENTS AND SUPPLEMENTARY DATA
HONEYWELL INTERNATIONAL INC.
NOTES TO CONSOLIDATED FINANCIAL STATEMENTS—(Continued)
(Dollars in tables in millions, except per share amounts)
On December 17, 2021, Garrett announced their intention to effect the First Partial Redemption on December 28, 2021, in the amount of $211 million, and plan to effect the Second Partial Redemption during the first quarter of 2022 for a corresponding payment of $200 million. On December 28, 2021, Garrett paid $211 million for the amount due as the First Partial Redemption.
On February 18, 2022, Garrett early redeemed $197 million of the Series B Preferred Stock, pursuant to the terms and conditions of the Second Amended and Restated Series B Preferred Stock Certificate of Designation. Immediately following the early redemption, the fair value of the Series B Preferred Stock was $207 million.
On June 28, 2022, Garrett early redeemed all remaining shares of the Series B Preferred Stock in the amount of $212 million, pursuant to the terms and conditions of the Second Amended and Restated Series B Preferred Stock Certificate of Designation. Following the redemption, the Series B Preferred Stock were no longer outstanding.
The Company recorded the Series B Preferred Stock at fair value at the Effective Date. The Company believes the present value of the mandatory redemptions is an appropriate basisSee Note 12 Fair Value Measurements for determiningadditional information on the fair value leveling of the Series B Preferred Stock. The Company's present value reflects amortized cost determined
PETROBRAS AND UNAOIL MATTERS
On December 19, 2022, the Company reached a comprehensive resolution to the investigations by the present valueU.S. Department of Justice (DOJ), the mandatory redemptions discounted at 7.25%Securities and Exchange Commission (SEC), which is the rate reflected in the Series B Preferred Stock Certificate of Designation. The discount amount will accrete into interest income over the mandatory redemption period. In additionand certain Brazilian authorities (Brazilian Authorities) relating to the Series B Preferred Stock, the Company subscribed for 4.2 million sharesCompany's use of Garrett's Series A Preferred Stock, which are convertible into Garrett’s Common Stock if certain conditions are met. Prior to and following Garrett’s emergence from bankruptcy, the Company also held 2.9 million shares of Garrett’s Common Stock. As of December 31, 2021, Short-term investments included $34 million and Investments and long-term receivables included $423 millionthird parties who previously worked for the Company's investmentsUOP business in Garrett's Series B Preferred Stock, Series A Preferred StockBrazil in relation to a project awarded in 2010 for Petróleo Brasileiro S.A. (Petrobras). The investigations focused on the Company’s compliance with the U.S. Foreign Corrupt Practices Act and Common Stock.similar Brazilian laws (UOP Matters). The comprehensive resolution also resolves DOJ and SEC investigations relating to a matter involving a foreign subsidiary’s prior contract with Unaoil S.A.M. in Algeria executed in 2011 (the Unaoil Matter).
In connection with the comprehensive resolution, (i) the Company agreed to pay a total equivalent of $202.7 million, which payment occurred in January 2023, to the DOJ, the SEC, and the Brazilian Authorities, collectively, in penalties, disgorgement, and prejudgment interest, (ii) the Company’s subsidiary, UOP, LLC (UOP), entered into a three-year Deferred Prosecution Agreement (DPA) with the DOJ for charges related to the UOP Matters, (iii) UOP entered into leniency agreements with the Brazilian authorities related to the UOP Matter in Brazil, and (iv) the Company entered into an agreement with the SEC that resolves allegations relating to the UOP Matters and the Unaoil Matter. Pursuant to these agreements, the Company agreed to undertake certain compliance measures and compliance reporting obligations. These agreements entirely resolve the Petrobras and Unaoil investigations.
100 Honeywell International Inc.
| | | | | |
| FINANCIAL STATEMENTS AND SUPPLEMENTARY DATA |
HONEYWELL INTERNATIONAL INC.
NOTES TO CONSOLIDATED FINANCIAL STATEMENTS—(Continued)
(Dollars in tables in millions, except per share amounts)
OTHER MATTERS
The Company is subject to a number of other lawsuits, investigations, and disputes (some of which involve substantial amounts claimed) arising out of the conduct of the Company's business, including matters relating to commercial transactions, government contracts, product liability, prior acquisitions and divestitures, employee benefit plans, intellectual property, and environmental, health, and safety matters (including the matter described below).matters. The Company recognizes liabilities for any contingency that is probable of occurrence and reasonably estimable. The Company continually assesses the likelihood of adverse judgments or outcomes in such matters, as well as potential ranges of possibleprobable losses (taking into consideration any insurance recoveries), based on a careful analysis of each matter with the assistance of outside legal counsel and, if applicable, other experts.
Such matters include:
•Petrobras and Unaoil – The Company continues to cooperate with investigations by the U.S. Department of Justice (DOJ), the Securities and Exchange Commission (SEC) and the Brazilian authorities relating to the Company's use of third parties who previously worked for the Company's UOP business in Brazil in relation to Petróleo Brasileiro S.A. (Petrobras) in connection with a project awarded in 2010. The investigations focus on compliance with the U.S. Foreign Corrupt Practices Act and similar Brazilian laws (the UOP Matters), and involve, among other things, document production and interviews with former and current management and employees. The DOJ and the SEC are also examining a matter involving a foreign subsidiary’s prior contract with Unaoil S.A.M. in Algeria executed in 2011. The Company continues to be engaged in discussions with the authorities with respect to a potential comprehensive resolution of these matters.
As the discussions are both ongoing and at different stages with regards to each respective authority, there can be no assurance as to whether the Company will reach a resolution with such authorities or as to the potential timing, terms, or collateral consequences of any such resolution. As a result, the Company cannot predict the ultimate outcome of these UOP Matters or the potential impact on the Company. Based on available information to date, the Company estimates that a potential comprehensive resolution of these UOP Matters would result in a probable loss of at least $160 million, and the Company has recorded a charge in this amount in the Company's Consolidated Statement of Operations, and accrued a corresponding liability on the Consolidated Balance Sheet. Amounts payable to authorities pursuant to any potential final comprehensive resolution could differ from the amount recorded in the Company's consolidated financial statements. Based on available information to date, the Company does not expect that any such difference would be material with respect to the Company's consolidated financial position.
Given the uncertainty inherent in litigation and investigations, the Company does not believe it is possible to develop estimates of reasonably possible lossesloss (or a range of possible losses)loss) in excess of current accruals for such matters.commitment and contingency matters, including those discussed in this Note 19. Considering the Company's past experience and existing accruals, the Company does not expect the outcome of such matters, either individually or in the aggregate, to have a material adverse effect on the Company's consolidated financial position. Because most contingencies are resolved over long periods of time, potential liabilities are subject to change due to new developments, changes in settlement strategy or the impact of evidentiary requirements, which could cause usthe Company to pay damage awards or settlements (or become subject to equitable remedies) that could have a material adverse effect on the Company's consolidated results of operations or operating cash flows in the periods recognized or paid.
98 Honeywell International Inc.
FINANCIAL STATEMENTS AND SUPPLEMENTARY DATA
HONEYWELL INTERNATIONAL INC.
NOTES TO CONSOLIDATED FINANCIAL STATEMENTS—(Continued)
(Dollars in tables in millions, except per share amounts)
WARRANTIES AND GUARANTEES
In the normal course of business, the Company issues product warranties and product performance guarantees. The Company accrues for the estimated cost of product warranties and performance guarantees based on contract terms and historical experience at the time of sale. Adjustments to initial obligations for warranties and guarantees are made as changes to the obligations become reasonably estimable. The following table summarizes information concerning the Company's recorded obligations for product warranties and product performance guarantees.guarantees:
| | | | Years Ended December 31, | | Years Ended December 31, |
| 2021 | 2020 | 2019 | 2023 | | 2022 | | 2021 |
| Beginning of year | Beginning of year | | $ | 243 | | | $ | 269 | | | $ | 310 | |
| Accruals for warranties/guarantees issued during the year | Accruals for warranties/guarantees issued during the year | | 146 | | | 164 | | | 173 | |
| Adjustment of pre-existing warranties/guarantees | Adjustment of pre-existing warranties/guarantees | | (7) | | | (18) | | | (34) | |
| Settlement of warranty/guarantee claims | Settlement of warranty/guarantee claims | | (159) | | | (172) | | | (180) | |
| End of year | End of year | | $ | 223 | | | $ | 243 | | | $ | 269 | |
Product warranties and product performance guarantees are included in the following balance sheet accounts:
| | | | December 31, | | December 31, |
| 2021 | 2020 | 2023 | | 2022 |
| Accrued liabilities | Accrued liabilities | | $ | 180 | | | $ | 183 | |
| Other liabilities | Other liabilities | | 43 | | | 60 | |
| $ | 223 | | | $ | 243 | |
| Total obligations for product warranties and product performance guarantees | |
Honeywell International Inc. 99
FINANCIAL STATEMENTS AND SUPPLEMENTARY DATA
HONEYWELL INTERNATIONAL INC.
NOTES TO CONSOLIDATED FINANCIAL STATEMENTS—(Continued)
(Dollars in tables in millions, except per share amounts)
NOTE 20. PENSION AND OTHER POSTRETIREMENT BENEFITS
The Company sponsors a number of both funded and unfunded U.S. and non-U.S. defined benefit pension plans. Pension benefits for many of the Company's U.S. employees are provided through non-contributory, qualified, and non-qualified defined benefit plans. All non-union hourly and salaried employees joining Honeywell for the first time after December 31, 2012, are not eligible to participate in Honeywell’s U.S. defined benefit pension plans. The Company also sponsors defined benefit pension plans which cover non-U.S. employees who are not U.S. citizens, in certain jurisdictions, principally the UK, Netherlands, Germany, and Canada. Other pension plans outside of the U.S. are not material to the Company either individually or in the aggregate.
The Company also sponsors postretirement benefit plans that provide health care benefits and life insurance coverage mainly to U.S. eligible retirees. None of Honeywell’s U.S. employees are eligible for a retiree medical subsidy from the Company. In addition, the vast majority of Honeywell’s U.S. retirees either have no Company subsidy or have a fixed-dollar subsidy amount. This significantly limits the Company's exposure to the impact of future health care cost increases. The retiree medical and life insurance plans are not funded. Claims and expenses are paid from the Company's cash flows from operations.
100101 Honeywell International Inc.
| | | | | |
| FINANCIAL STATEMENTS AND SUPPLEMENTARY DATA |
HONEYWELL INTERNATIONAL INC.
NOTES TO CONSOLIDATED FINANCIAL STATEMENTS—(Continued)
(Dollars in tables in millions, except per share amounts)
The following tables summarize the balance sheet impact, including the benefit obligations, assets, and funded status associated with the Company's significant pension and other postretirement benefit plans.plans:
| | | | Pension Benefits | | Pension Benefits |
| U.S. Plans | Non-U.S. Plans | U.S. Plans | | Non-U.S. Plans |
| 2021 | 2020 | 2021 | 2020 | 2023 | | 2022 | | 2023 | | 2022 |
| Change in benefit obligation: | | | | | | | | |
| Change in benefit obligation | | Change in benefit obligation | | | |
| Benefit obligation at beginning of year | Benefit obligation at beginning of year | | $ | 18,054 | | | $ | 17,283 | | | $ | 7,670 | | | $ | 6,897 | |
| Service cost | Service cost | | 105 | | | 99 | | | 26 | | | 23 | |
| Interest cost | Interest cost | | 306 | | | 461 | | | 77 | | | 106 | |
| Plan amendments | Plan amendments | | — | | | — | | | (3) | | | 2 | |
Actuarial (gains) losses(1) | | 141 | | | 1,331 | | | (403) | | | 509 | |
Actuarial (gains) losses1 | |
| Benefits paid | Benefits paid | | (1,221) | | | (1,100) | | | (249) | | | (246) | |
| Settlements and curtailments | Settlements and curtailments | | — | | | (21) | | | — | | | — | |
| Foreign currency translation | Foreign currency translation | | — | | | — | | | (121) | | | 291 | |
| Other | Other | | 6 | | | 1 | | | 2 | | | 88 | |
| Benefit obligation at end of year | Benefit obligation at end of year | | 17,391 | | | 18,054 | | | 6,999 | | | 7,670 | |
| Change in plan assets: | |
| Change in plan assets | |
| Fair value of plan assets at beginning of year | |
| Fair value of plan assets at beginning of year | |
| Fair value of plan assets at beginning of year | Fair value of plan assets at beginning of year | | 20,396 | | | 18,995 | | | 8,450 | | | 7,307 | |
| Actual return on plan assets | Actual return on plan assets | | 1,344 | | | 2,475 | | | 166 | | | 918 | |
| Company contributions | Company contributions | | 35 | | | 46 | | | 101 | | | 116 | |
| Benefits paid | Benefits paid | | (1,221) | | | (1,100) | | | (249) | | | (246) | |
| Settlements and curtailments | Settlements and curtailments | | — | | | (21) | | | — | | | — | |
| Foreign currency translation | Foreign currency translation | | — | | | — | | | (74) | | | 253 | |
| Other | Other | | 6 | | | 1 | | | 2 | | | 102 | |
| Fair value of plan assets at end of year | Fair value of plan assets at end of year | | 20,560 | | | 20,396 | | | 8,396 | | | 8,450 | |
| Funded status of plans | Funded status of plans | | $ | 3,169 | | | $ | 2,342 | | | $ | 1,397 | | | $ | 780 | |
| Amounts recognized in Consolidated Balance Sheet consist of: | |
Prepaid pension benefit cost(2) | | $ | 3,528 | | | $ | 2,695 | | | $ | 2,105 | | | $ | 1,688 | |
Accrued pension liabilities—current(3) | | (33) | | | (29) | | | (14) | | | (14) | |
Accrued pension liabilities—noncurrent(4) | | (326) | | | (324) | | | (694) | | | (894) | |
| Amounts recognized in the Consolidated Balance Sheet consist of | |
Prepaid pension benefit cost2 | |
Prepaid pension benefit cost2 | |
Prepaid pension benefit cost2 | |
Accrued pension liabilities—current3 | |
Accrued pension liabilities—noncurrent4 | |
| Net amount recognized | Net amount recognized | | $ | 3,169 | | | $ | 2,342 | | | $ | 1,397 | | | $ | 780 | |
| | | | | | | | |
| 1 | | The actuarial losses incurred in 2023 related to the Company's U.S. plans are primarily the result of a decrease in the discount rate assumption, as well as changes in demographic experience and demographic assumptions used to estimate the benefit obligations as of December 31, 2023, compared to December 31, 2022. Actuarial losses incurred in 2023 related to the Company's non-U.S. plans are primarily the result of a decrease in the discount rate assumption, partially offset by inflation related assumptions used to estimate the benefit obligations as of December 31, 2023, compared to December 31, 2022. Actuarial gains incurred in 2022 related to the Company's U.S. plans are primarily the result of an increase in the discount rate assumption, partially offset by changes in demographic experience and demographic assumptions used to estimate the benefit obligations as of December 31, 2022, compared to December 31, 2021. Actuarial gains incurred in 2022 related to the Company's non-U.S. plans are primarily the result of an increase in the discount rate assumption, partially offset by inflation related assumptions used to estimate the benefit obligations as of December 31, 2022, compared to December 31, 2021. |
| 2 | | Included in Other assets in the Consolidated Balance Sheet. |
| 3 | | Included in Accrued liabilities in the Consolidated Balance Sheet. |
| 4 | | Included in Other liabilities in the Consolidated Balance Sheet. |
(1)The actuarial losses incurred in 2021 related to the Company's U.S. plans are primarily the result of changes in demographic experience and demographic assumptions, partially offset by actuarial gains due to an increase in the discount rate assumptions used to estimate the benefit obligations as of December 31, 2021 compared to December 31, 2020. Actuarial gains incurred in 2021 related to the Company's non-U.S. plans are primarily the result of an increase in the discount rate assumption used to estimate the benefit obligations as of December 31, 2021 compared to December 31, 2020. Actuarial losses incurred in 2020 related to the Company's U.S. and non-U.S. plans are primarily the result of a decrease in the discount rate assumptions used to estimate the benefit obligations as of December 31, 2020 compared to December 31, 2019.
(2)Included in Other assets on the Consolidated Balance Sheet
(3)Included in Accrued liabilities on the Consolidated Balance Sheet
(4)Included in Other liabilities on the Consolidated Balance Sheet
102 Honeywell International Inc.101
| | | | | |
| FINANCIAL STATEMENTS AND SUPPLEMENTARY DATA |
HONEYWELL INTERNATIONAL INC.
NOTES TO CONSOLIDATED FINANCIAL STATEMENTS—(Continued)
(Dollars in tables in millions, except per share amounts)
| | | | | | | | | | | | | | |
| | Other
Postretirement
Benefits |
| 2021 | 2020 |
| Change in benefit obligation: | | | | |
| Benefit obligation at beginning of year | | $ | 229 | | | $ | 325 | |
| Service cost | | — | | | — | |
| Interest cost | | 5 | | | 8 | |
| Plan amendments | | — | | | (65) | |
| Actuarial (gains) losses | | (8) | | | (8) | |
| Benefits paid | | (30) | | | (31) | |
| Benefit obligation at end of year | | 196 | | | 229 | |
| Change in plan assets: | | | | |
| Fair value of plan assets at beginning of year | | — | | | — | |
| Actual return on plan assets | | — | | | — | |
| Company contributions | | — | | | — | |
| Benefits paid | | — | | | — | |
| Fair value of plan assets at end of year | | — | | | — | |
| Funded status of plans | | $ | (196) | | | $ | (229) | |
| Amounts recognized in Consolidated Balance Sheet consist of: | | | | |
| Accrued liabilities | | $ | (25) | | | $ | (27) | |
Postretirement benefit obligations other than pensions(1) | | (171) | | | (202) | |
| Net amount recognized | | $ | (196) | | | $ | (229) | |
(1)Excludes non-U.S. plan of $37 million and $40 million as of December 31, 2021 and 2020. | | | | | | | | | | | |
| | Other
Postretirement
Benefits |
| 2023 | | 2022 |
| Change in benefit obligation | | | |
| Benefit obligation at beginning of year | $ | 133 | | | $ | 196 | |
| Service cost | — | | | — | |
| Interest cost | 6 | | | 5 | |
| Plan amendments | — | | | — | |
| Actuarial (gains) losses | 3 | | | (54) | |
| Benefits paid | (26) | | | (14) | |
| Benefit obligation at end of year | 116 | | | 133 | |
| Change in plan assets | | | |
| Fair value of plan assets at beginning of year | — | | | — | |
| Actual return on plan assets | — | | | — | |
| Company contributions | — | | | — | |
| Benefits paid | — | | | — | |
| Fair value of plan assets at end of year | — | | | — | |
| Funded status of plans | $ | (116) | | | $ | (133) | |
| Amounts recognized in the Consolidated Balance Sheet consist of | | | |
| Accrued liabilities | $ | (12) | | | $ | (21) | |
Postretirement benefit obligations other than pensions1 | (104) | | | (112) | |
| Net amount recognized | $ | (116) | | | $ | (133) | |
| | | | | | | | |
| 1 | | Excludes non-U.S. plan of $30 million and $34 million as of December 31, 2023, and 2022, respectively. |
Amounts recognized in Accumulated other comprehensive (income) loss associated with the Company's significant pension and other postretirement benefit plans at December 31, 20212023, and 20202022, are as follows:
| | | | Pension Benefits | | Pension Benefits |
| U.S. Plans | Non-U.S. Plans | U.S. Plans | | Non-U.S. Plans |
| 2021 | 2020 | 2021 | 2020 | 2023 | | 2022 | | 2023 | | 2022 |
| Prior service (credit) cost | Prior service (credit) cost | | $ | (92) | | | $ | (134) | | | $ | 20 | | | $ | 23 | |
| Net actuarial (gain) loss | Net actuarial (gain) loss | | 492 | | | 505 | | | 397 | | | 629 | |
| Net amount recognized | Net amount recognized | | $ | 400 | | | $ | 371 | | | $ | 417 | | | $ | 652 | |
| | | | | | | | | | | | | | |
| | Other
Postretirement
Benefits |
| 2021 | 2020 |
| Prior service (credit) cost | | $ | (92) | | | $ | (165) | |
| Net actuarial (gain) loss | | (34) | | | (28) | |
| Net amount recognized | | $ | (126) | | | $ | (193) | |
| | | | | | | | | | | |
| | Other
Postretirement
Benefits |
| 2023 | | 2022 |
| Prior service (credit) cost | $ | (30) | | | $ | (50) | |
| Net actuarial (gain) loss | (68) | | | (84) | |
| Net amount recognized | $ | (98) | | | $ | (134) | |
102103 Honeywell International Inc.
| | | | | |
| FINANCIAL STATEMENTS AND SUPPLEMENTARY DATA |
HONEYWELL INTERNATIONAL INC.
NOTES TO CONSOLIDATED FINANCIAL STATEMENTS—(Continued)
(Dollars in tables in millions, except per share amounts)
The components of netNet periodic benefit (income) cost and other amounts recognized in Other comprehensive (income) loss for the Company's significant pension and other postretirement benefit plans include the following components:
| | Net Periodic Benefit Cost | Pension Benefits |
| U.S. Plans | | Non-U.S. Plans |
| 2021 | 2020 | 2019 | | 2021 | 2020 | 2019 |
| Pension Benefits | | | Pension Benefits |
| U.S. Plans | | Non-U.S. Plans |
| 2023 | | 2022 | | 2021 | | 2023 | | 2022 | | 2021 |
| Service cost | Service cost | | $ | 105 | | | $ | 99 | | | $ | 82 | | | $ | 26 | | | $ | 23 | | | $ | 22 | |
| Interest cost | Interest cost | | 306 | | | 461 | | | 613 | | | 77 | | | 106 | | | 142 | |
| Expected return on plan assets | Expected return on plan assets | | (1,220) | | | (1,135) | | | (1,117) | | | (348) | | | (336) | | | (331) | |
| Amortization of prior service (credit) cost | Amortization of prior service (credit) cost | | (42) | | | (42) | | | (42) | | | — | | | — | | | — | |
| Recognition of actuarial losses | | 31 | | | 26 | | | 35 | | | 9 | | | 18 | | | 88 | |
| Recognition of actuarial (gains) losses | |
| Settlements and curtailments | Settlements and curtailments | | — | | | 4 | | | 4 | | | — | | | — | | | — | |
| Net periodic benefit (income) cost | Net periodic benefit (income) cost | | $ | (820) | | | $ | (587) | | | $ | (425) | | | $ | (236) | | | $ | (189) | | | $ | (79) | |
| | | | | | | | | | | | | | | | | | | | | | | | | | | | | | | | | | | | | | | | | |
Other Changes in Plan Assets and
Benefits Obligations Recognized in Other Comprehensive
(Income) Loss | U.S. Plans | | Non-U.S. Plans |
| 2021 | 2020 | 2019 | | 2021 | 2020 | 2019 |
| Actuarial (gains) losses | | $ | (14) | | | $ | (9) | | | $ | (277) | | | | $ | (221) | | | $ | (73) | | | $ | 176 | |
| Prior service (credit) cost | | — | | | — | | | — | | | | (3) | | | 2 | | | — | |
| Prior service credit recognized during year | | 43 | | | 42 | | | 42 | | | | (1) | | | — | | | — | |
| Actuarial losses recognized during year | | — | | | (30) | | | (39) | | | | (9) | | | (18) | | | (88) | |
| Foreign currency translation | | — | | | — | | | — | | | | (1) | | | 19 | | | 14 | |
| Total recognized in other comprehensive (income) loss | | $ | 29 | | | $ | 3 | | | $ | (274) | | | | $ | (235) | | | $ | (70) | | | $ | 102 | |
| Total recognized in net periodic benefit (income) cost and other comprehensive (income) loss | | $ | (791) | | | $ | (584) | | | $ | (699) | | | | $ | (471) | | | $ | (259) | | | $ | 23 | |
| | | | | | | | | | | | | | | | | | | | | | | | | | | | | | | | | | | |
| U.S. Plans | | Non-U.S. Plans |
| 2023 | | 2022 | | 2021 | | 2023 | | 2022 | | 2021 |
| Actuarial (gains) losses | $ | 378 | | | $ | 307 | | | $ | (14) | | | $ | 198 | | | $ | 294 | | | $ | (221) | |
| Prior service (credit) cost | — | | | — | | | — | | | — | | | — | | | (3) | |
| Prior service credit recognized during year | 42 | | | 43 | | | 43 | | | — | | | (1) | | | (1) | |
| Actuarial (gains) losses recognized during year | — | | | 15 | | | — | | | (153) | | | (537) | | | (9) | |
| Foreign currency translation | — | | | — | | | — | | | 17 | | | 204 | | | (1) | |
| Total recognized in Other comprehensive (income) loss | $ | 420 | | | $ | 365 | | | $ | 29 | | | $ | 62 | | | $ | (40) | | | $ | (235) | |
| Total recognized in net periodic benefit (income) cost and Other comprehensive (income) loss | $ | (59) | | | $ | (508) | | | $ | (791) | | | $ | 152 | | | $ | 341 | | | $ | (471) | |
| | Net Periodic Benefit Cost | Other Postretirement Benefits |
Years Ended December 31, | | 2021 | 2020 | 2019 |
| Other Postretirement Benefits | | | Other Postretirement Benefits |
| Years Ended December 31, |
| 2023 | | 2022 | | 2021 |
| Service cost | Service cost | | $ | — | | | $ | — | | | $ | — | |
| Interest cost | Interest cost | | 5 | | | 8 | | | 14 | |
| Amortization of prior service (credit) cost | Amortization of prior service (credit) cost | | (74) | | | (66) | | | (62) | |
| Recognition of actuarial (gains) losses | Recognition of actuarial (gains) losses | | (2) | | | — | | | — | |
| Net periodic benefit (income) cost | Net periodic benefit (income) cost | | $ | (71) | | | $ | (58) | | | $ | (48) | |
| | | | | | | | | | | | | | | | | | | | |
Other Changes in Plan Assets and Benefits Obligations
Recognized in Other Comprehensive (Income) Loss | Years Ended December 31, |
| 2021 | 2020 | 2019 |
| Actuarial (gains) losses | | $ | (8) | | | $ | (8) | | | $ | (16) | |
| Prior service (credit) cost | | — | | | (65) | | | (2) | |
| Prior service credit recognized during year | | 74 | | | 66 | | | 62 | |
| Actuarial (gains) losses recognized during year | | 2 | | | — | | | — | |
| Total recognized in other comprehensive (income) loss | | $ | 68 | | | $ | (7) | | | $ | 44 | |
| Total recognized in net periodic benefit (income) cost and other comprehensive (income) loss | | $ | (3) | | | $ | (65) | | | $ | (4) | |
| | | | | | | | | | | | | | | | | |
| Years Ended December 31, |
| 2023 | | 2022 | | 2021 |
| Actuarial (gains) losses | $ | 3 | | | $ | (54) | | | $ | (8) | |
| Prior service (credit) cost | — | | | — | | | — | |
| Prior service credit recognized during year | 20 | | | 42 | | | 74 | |
| Actuarial (gains) losses recognized during year | 13 | | | 4 | | | 2 | |
| Total recognized in other comprehensive (income) loss | 36 | | | (8) | | | 68 | |
| Total recognized in net periodic benefit (income) cost and Other comprehensive (income) loss | $ | 9 | | | $ | (49) | | | $ | (3) | |
104 Honeywell International Inc.103
| | | | | |
| FINANCIAL STATEMENTS AND SUPPLEMENTARY DATA |
HONEYWELL INTERNATIONAL INC.
NOTES TO CONSOLIDATED FINANCIAL STATEMENTS—(Continued)
(Dollars in tables in millions, except per share amounts)
Major actuarial assumptions used in determining the benefit obligations and net periodic benefit (income) cost for the Company's significant benefit plans are presented in the following table as weighted averages.averages:
| | | | Pension Benefits | | Pension Benefits |
| U.S. Plans | | Non-U.S. Plans | U.S. Plans | | Non-U.S. Plans |
| 2021 | 2020 | 2019 | | 2021 | 2020 | 2019 | 2023 | | 2022 | | 2021 | | 2023 | | 2022 | | 2021 |
| Actuarial assumptions used to determine benefit obligations as of December 31: | |
| Actuarial assumptions used to determine benefit obligations as of December 31 | |
| Discount rate | |
| Discount rate | |
| Discount rate | Discount rate | | 2.87 | % | | 2.50 | % | | 3.22 | % | | 1.79 | % | | 1.23 | % | | 1.81 | % | 4.97 | % | | 5.17 | % | | 2.87 | % | | 4.15 | % | | 4.50 | % | | 1.79 | % |
| Expected annual rate of compensation increase | Expected annual rate of compensation increase | | 3.25 | % | | 3.25 | % | | 3.25 | % | | 2.56 | % | | 2.43 | % | | 2.47 | % | Expected annual rate of compensation increase | 3.25 | % | | 3.25 | % | | 3.25 | % | | 2.68 | % | | 2.69 | % | | 2.56 | % |
| Actuarial assumptions used to determine net periodic benefit (income) cost for years ended December 31: | |
| Actuarial assumptions used to determine net periodic benefit (income) cost for years ended December 31 | |
| Discount rate—benefit obligation | |
| Discount rate—benefit obligation | |
| Discount rate—benefit obligation | Discount rate—benefit obligation | | 2.50 | % | | 3.22 | % | | 4.35 | % | | 1.24 | % | | 1.81 | % | | 2.63 | % | 5.17 | % | | 2.87 | % | | 2.50 | % | | 4.49 | % | | 1.77 | % | | 1.24 | % |
| Discount rate—service cost | Discount rate—service cost | | 2.68 | % | | 3.33 | % | | 4.47 | % | | 1.00 | % | | 1.48 | % | | 2.26 | % | Discount rate—service cost | 5.26 | % | | 2.98 | % | | 2.68 | % | | 3.81 | % | | 1.48 | % | | 1.00 | % |
| Discount rate—interest cost | Discount rate—interest cost | | 1.76 | % | | 2.76 | % | | 3.94 | % | | 1.00 | % | | 1.56 | % | | 2.34 | % | Discount rate—interest cost | 5.07 | % | | 2.26 | % | | 1.76 | % | | 4.56 | % | | 1.59 | % | | 1.00 | % |
| Expected rate of return on plan assets | Expected rate of return on plan assets | | 6.15 | % | | 6.15 | % | | 6.75 | % | | 4.03 | % | | 4.66 | % | | 5.14 | % | Expected rate of return on plan assets | 6.75 | % | | 6.40 | % | | 6.15 | % | | 5.15 | % | | 3.61 | % | | 4.03 | % |
| Expected annual rate of compensation increase | Expected annual rate of compensation increase | | 3.25 | % | | 3.25 | % | | 3.25 | % | | 2.43 | % | | 2.47 | % | | 2.46 | % | Expected annual rate of compensation increase | 3.25 | % | | 3.25 | % | | 3.25 | % | | 2.68 | % | | 2.56 | % | | 2.43 | % |
| | | | | | | | | | | | | | | | | | | | |
| | Other Postretirement Benefits |
| 2021 | 2020 | 2019 |
| Actuarial assumptions used to determine benefit obligations as of December 31: | | | | | | |
| Discount rate | | 2.66 | % | | 2.20 | % | | 3.03 | % |
| Actuarial assumptions used to determine net periodic benefit cost for years ended December 31: | | | | | | |
Discount rate(1) | | 2.20 | % | | 2.36 | % | | 4.07 | % |
(1)Discount rate was 3.03% for January 1, 2020 through September 30, 2020. The rate was changed to 2.36% for the remainder of 2020 due to a Plan remeasurement as of October 1, 2020. | | | | | | | | | | | | | | | | | |
| | Other Postretirement Benefits |
| 2023 | | 2022 | | 2021 |
| Actuarial assumptions used to determine benefit obligations as of December 31 | | | | | |
| Discount rate | 5.00 | % | | 5.32 | % | | 2.66 | % |
| Actuarial assumptions used to determine net periodic benefit cost for years ended December 31 | | | | | |
| Discount rate | 5.32 | % | | 2.66 | % | | 2.20 | % |
The discount rate for the Company's U.S. pension and other postretirement benefitsbenefit plans reflects the current rate at which the associated liabilities could be settled at the measurement date of December 31. To determine discount rates for the Company's U.S. pension and other postretirement benefit plans, the Company uses a modeling process that involves matching the expected cash outflows of the Company's benefit plans to a yield curve constructed from a portfolio of high quality, fixed-incomehigh-quality, fixed income debt instruments. The Company uses the single weighted-averageweighted average yield of this hypothetical portfolio as a discount rate benchmark. The Company utilizes a full yield curve approach in the estimation of the service and interest cost components of net periodic pension benefit (income) for the Company's significant pension plans. This approach applies the specific spot rates along the yield curve used in the determination of the pension benefit obligation to their underlying projected cash flows and provides a more precise measurement of service and interest costs by improving the correlation between projected cash flows and their corresponding spot rates. For the Company's U.S. pension plans, the single weighted average spot rates used to determine service and interest costs for 20222024 are 2.97%5.06% and 2.26%.4.89%, respectively. The discount rate used to determine the other postretirement benefit obligation is lowerhigher principally due to a shorter expected duration of other postretirement plan obligations as compared to pension plan obligations.
The Company plans to use an expected rate of return on U.S. plan assets of 6.40%7.00% for 2022,2024, which represents an increase from the 6.15%6.75% assumption used for 2021.2023. The Company's asset return assumption is based on historical plan asset returns over varying long-term periods combined with current market conditions and broad asset mix considerations with a focus on long-term trends rather than short-term market conditions. The Company reviews the expected rate of return on an annual basis and reviserevises it as appropriate.
For non-U.S. benefit plans, actuarial assumptions reflect economic and market factors relevant to each country.
104105 Honeywell International Inc.
| | | | | |
| FINANCIAL STATEMENTS AND SUPPLEMENTARY DATA |
HONEYWELL INTERNATIONAL INC.
NOTES TO CONSOLIDATED FINANCIAL STATEMENTS—(Continued)
(Dollars in tables in millions, except per share amounts)
PENSION BENEFITS
The following amounts relate to the Company's significant pension plans with accumulated benefit obligations exceeding the fair value of plan assets:
| | | | December 31, | | December 31, |
| U.S. Plans | | Non-U.S. Plans | U.S. Plans | | Non-U.S. Plans |
| 2021 | 2020 | | 2021 | 2020 | 2023 | | 2022 | | 2023 | | 2022 |
| Projected benefit obligation | Projected benefit obligation | | $ | 359 | | | $ | 353 | | | $ | 964 | | | $ | 2,116 | |
| Accumulated benefit obligation | Accumulated benefit obligation | | $ | 346 | | | $ | 341 | | | $ | 932 | | | $ | 2,042 | |
| Fair value of plan assets | Fair value of plan assets | | $ | — | | | $ | — | | | $ | 256 | | | $ | 1,208 | |
The accumulated benefit obligation for the Company's U.S. defined benefit pension plans was $17.3$12.8 billion and $17.9$13.3 billion and for the Company's Non-U.S.non-U.S. defined benefit pension plans was $6.9$4.7 billion and $7.6$4.4 billion at December 31, 20212023, and 2020.2022, respectively.
The Company's asset investment strategy for its U.S. pension plans focuses on maintaining a diversified portfolio using various asset classes in order to achieve the Company's long-term investment objectives on a risk adjusted basis. The Company's long-term target allocations are as follows: 55%-70%45%-65% fixed income securities and cash, 25%-40% equity securities, 5%-10% real estate investments, and 10%-20% other types of investments. Equity securities include publicly-traded stock of companies located inside the United States. Fixed income securities include corporate bonds of companies from diversified industries, mortgage-backed securities, and U.S. Treasuries. Real estate investments include direct investments in commercial properties and investments in real estate funds. Other types of investments include investments in private equity that follow several different strategies. The Company reviews its assets on a regular basis to ensure that the Company is within the targeted asset allocation ranges and, if necessary, asset balances are adjusted back within target allocations.
The Company's non-U.S. pension assets are typically managed by decentralized fiduciary committees with the Honeywell Corporate Investments group providing funding and investment guidance. The Company's non-U.S. investment policies are different for each country as local regulations funding requirements, and financial and tax considerations are part of the funding and investment allocation process in each country.
In accordance with ASU 2015-07,Accounting Standards Codification “Fair Value Measurement (Topic 820)”, certain investments that are measured at fair value using the net asset value (NAV) per share (or its equivalent) practical expedient have not been classified in the fair value hierarchy. The fair value amounts presented in the following tables are intended to permit reconciliation of the fair value hierarchy to the amounts presented for the total pension benefits plan assets.
106 Honeywell International Inc.105
| | | | | |
| FINANCIAL STATEMENTS AND SUPPLEMENTARY DATA |
HONEYWELL INTERNATIONAL INC.
NOTES TO CONSOLIDATED FINANCIAL STATEMENTS—(Continued)
(Dollars in tables in millions, except per share amounts)
The fair values of both the Company's U.S. and non-U.S. pension plans assets by asset category are as follows:
| | | | U.S. Plans | | U.S. Plans |
| December 31, 2021 | December 31, 2023 |
| Total | Level 1 | Level 2 | Level 3 | Total | | Level 1 | | Level 2 | | Level 3 |
| Equities: | |
| Equities | |
| Honeywell common stock | |
| Honeywell common stock | |
| Honeywell common stock | Honeywell common stock | | $ | 3,251 | | | $ | 3,251 | | | $ | — | | | $ | — | |
| U.S. equities | U.S. equities | | — | | | — | | | — | | | — | |
| | Fixed income: | |
| Short term investments | | 1,767 | | | 1,767 | | | — | | | — | |
| Fixed income | |
| | Fixed income | |
| | Fixed income | |
| Short-term investments | |
| Short-term investments | |
| Short-term investments | |
| Government securities | Government securities | | 1,373 | | | — | | | 1,373 | | | — | |
| Corporate bonds | Corporate bonds | | 9,588 | | | — | | | 9,588 | | | — | |
| Mortgage/Asset-backed securities | Mortgage/Asset-backed securities | | 1,072 | | | — | | | 1,072 | | | — | |
| Insurance contracts | Insurance contracts | | 8 | | | — | | | 8 | | | — | |
| Direct investments: | |
| Direct investments | |
| Direct private investments | |
| Direct private investments | |
| Direct private investments | Direct private investments | | 1,336 | | | — | | | — | | | 1,336 | |
| Real estate properties | Real estate properties | | 843 | | | — | | | — | | | 843 | |
| Total | Total | | $ | 19,238 | | | $ | 5,018 | | | $ | 12,041 | | | $ | 2,179 | |
| Investments measured at NAV: | |
| Investments measured at NAV | |
| Private funds | |
| Private funds | |
| Private funds | Private funds | | 1,244 | | |
| Real estate funds | Real estate funds | | 14 | | |
| Real estate funds | |
| Real estate funds | |
| | Commingled Funds | | 64 | | |
| Commingled funds | |
| | Commingled funds | |
| | Commingled funds | |
| Total assets at fair value | Total assets at fair value | | $ | 20,560 | | |
| Total assets at fair value | |
| Total assets at fair value | |
| | | | U.S. Plans | | U.S. Plans |
| December 31, 2020 | December 31, 2022 |
| Total | Level 1 | Level 2 | Level 3 | Total | | Level 1 | | Level 2 | | Level 3 |
| Equities: | |
| Equities | |
| Honeywell common stock | |
| Honeywell common stock | |
| Honeywell common stock | Honeywell common stock | | $ | 3,319 | | | $ | 3,319 | | | $ | — | | | $ | — | |
| U.S. equities | U.S. equities | | — | | | — | | | — | | | — | |
| | Fixed income: | |
| Short term investments | | 1,314 | | | 1,314 | | | — | | | — | |
| Fixed income | |
| | Fixed income | |
| | Fixed income | |
| Short-term investments | |
| Short-term investments | |
| Short-term investments | |
| Government securities | Government securities | | 1,520 | | | — | | | 1,520 | | | — | |
| Corporate bonds | Corporate bonds | | 10,190 | | | — | | | 10,190 | | | — | |
| Mortgage/Asset-backed securities | Mortgage/Asset-backed securities | | 982 | | | — | | | 982 | | | — | |
| Insurance contracts | Insurance contracts | | 7 | | | — | | | 7 | | | — | |
| Direct investments: | |
| Direct investments | |
| Direct private investments | |
| Direct private investments | |
| Direct private investments | Direct private investments | | 1,220 | | | — | | | — | | | 1,220 | |
| Real estate properties | Real estate properties | | 651 | | | — | | | — | | | 651 | |
| Total | Total | | $ | 19,203 | | | $ | 4,633 | | | $ | 12,699 | | | $ | 1,871 | |
| Investments measured at NAV: | |
| Investments measured at NAV | |
| Private funds | Private funds | | 1,105 | | |
| Private funds | |
| Private funds | |
| Real estate funds | |
| Real estate funds | |
| Real estate funds | Real estate funds | | 26 | | |
| | Commingled funds | Commingled funds | | 62 | | |
| | Commingled funds | |
| | Commingled funds | |
| Total assets at fair value | Total assets at fair value | | $ | 20,396 | | |
| Total assets at fair value | |
| Total assets at fair value | |
106107 Honeywell International Inc.
| | | | | |
| FINANCIAL STATEMENTS AND SUPPLEMENTARY DATA |
HONEYWELL INTERNATIONAL INC.
NOTES TO CONSOLIDATED FINANCIAL STATEMENTS—(Continued)
(Dollars in tables in millions, except per share amounts)
| | | | Non-U.S. Plans | | Non-U.S. Plans |
| December 31, 2021 | December 31, 2023 |
| Total | Level 1 | Level 2 | Level 3 | Total | | Level 1 | | Level 2 | | Level 3 |
| Equities: | |
| Equities | |
| U.S. equities | |
| U.S. equities | |
| U.S. equities | U.S. equities | | $ | 229 | | | $ | 1 | | | $ | 228 | | | $ | — | |
| Non-U.S. equities | Non-U.S. equities | | 824 | | | — | | | 824 | | | — | |
| Fixed income: | |
| Fixed income | |
| Short-term investments | |
| Short-term investments | |
| Short-term investments | Short-term investments | | 571 | | | 571 | | | — | | | — | |
| Government securities | Government securities | | 3,893 | | | — | | | 3,893 | | | — | |
| Corporate bonds | Corporate bonds | | 1,681 | | | — | | | 1,681 | | | — | |
| Mortgage/Asset-backed securities | Mortgage/Asset-backed securities | | 79 | | | — | | | 79 | | | — | |
| Insurance contracts | Insurance contracts | | 123 | | | — | | | 123 | | | — | |
| Insurance buy-in contracts | Insurance buy-in contracts | | 691 | | | — | | | — | | | 691 | |
| Investments in private funds: | |
| Investments in private funds | |
| Private funds | |
| Private funds | |
| Private funds | Private funds | | 74 | | | — | | | 41 | | | 33 | |
| Real estate funds | Real estate funds | | 163 | | | — | | | — | | | 163 | |
| Total | Total | | $ | 8,328 | | | $ | 572 | | | $ | 6,869 | | | $ | 887 | |
| Investments measured at NAV: | |
| Investments measured at NAV | |
| Private funds | |
| Private funds | |
| Private funds | Private funds | | 17 | | |
| Real estate funds | Real estate funds | | 51 | | |
| Real estate funds | |
| Real estate funds | |
| Total assets at fair value | Total assets at fair value | | $ | 8,396 | | |
| Total assets at fair value | |
| Total assets at fair value | |
| | | | | | | | | | | | | | | | | | | | | | | | | | |
| | Non-U.S. Plans |
| December 31, 2020 |
| Total | Level 1 | Level 2 | Level 3 |
| Equities: | | | | | | | | |
| U.S. equities | | $ | 207 | | | $ | — | | | $ | 207 | | | $ | — | |
| Non-U.S. equities | | 1,614 | | | 66 | | | 1,548 | | | — | |
| Fixed income: | | | | | | | | |
| Short-term investments | | 596 | | | 596 | | | — | | | — | |
| Government securities | | 3,105 | | | — | | | 3,105 | | | — | |
| Corporate bonds | | 1,649 | | | — | | | 1,649 | | | — | |
| Mortgage/Asset-backed securities | | 93 | | | — | | | 93 | | | — | |
| Insurance contracts | | 142 | | | — | | | 142 | | | — | |
| Insurance buy-in contracts | | 767 | | | — | | | — | | | 767 | |
| Investments in private funds: | | | | | | | | |
| Private funds | | 65 | | | — | | | 36 | | | 29 | |
| Real estate funds | | 147 | | | — | | | — | | | 147 | |
| Total | | $ | 8,385 | | | $ | 662 | | | $ | 6,780 | | | $ | 943 | |
| Investments measured at NAV: | | | | | | | | |
| Private funds | | 18 | | | | | | | |
| Real estate funds | | 47 | | | | | | | |
| Total assets at fair value | | $ | 8,450 | | | | | | | |
| | | | | | | | | | | | | | | | | | | | | | | |
| | Non-U.S. Plans |
| December 31, 2022 |
| Total | | Level 1 | | Level 2 | | Level 3 |
| Equities | | | | | | | |
| U.S. equities | $ | 144 | | | $ | 2 | | | $ | 142 | | | $ | — | |
| Non-U.S. equities | 374 | | | — | | | 374 | | | — | |
| Fixed income | | | | | | | |
| Short-term investments | 341 | | | 341 | | | — | | | — | |
| Government securities | 2,045 | | | — | | | 2,045 | | | — | |
| Corporate bonds | 1,031 | | | — | | | 1,031 | | | — | |
| Mortgage/Asset-backed securities | 31 | | | — | | | 31 | | | — | |
| Insurance contracts | 115 | | | — | | | 115 | | | — | |
| Insurance buy-in contracts | 950 | | | — | | | — | | | 950 | |
| Investments in private funds | | | | | | | |
| Private funds | 90 | | | — | | | 54 | | | 36 | |
| Real estate funds | 130 | | | — | | | — | | | 130 | |
| Total | $ | 5,251 | | | $ | 343 | | | $ | 3,792 | | | $ | 1,116 | |
| Investments measured at NAV | | | | | | | |
| Private funds | 10 | | | | | | | |
| Real estate funds | 43 | | | | | | | |
| Total assets at fair value | $ | 5,304 | | | | | | | |
108 Honeywell International Inc.107
| | | | | |
| FINANCIAL STATEMENTS AND SUPPLEMENTARY DATA |
HONEYWELL INTERNATIONAL INC.
NOTES TO CONSOLIDATED FINANCIAL STATEMENTS—(Continued)
(Dollars in tables in millions, except per share amounts)
The following table summarizes changes in the fair value of Levellevel 3 assets for both U.S. and Non-U.S.non-U.S. plans:
| | | | U.S. Plans | | Non-U.S. Plans | | U.S. Plans | | Non-U.S. Plans |
Direct
Private
Investments | Real Estate
Properties | | Private
Funds | Real Estate
Funds | Insurance Buy-in Contracts | Direct Private Investments | | Real Estate Properties | | Private Funds | | Real Estate Funds | | Insurance Buy-in Contracts |
| Balance at December 31, 2019 | | $ | 950 | | | $ | 619 | | | $ | 34 | | | $ | 150 | | | $ | — | |
| Actual return on plan assets: | |
| Balance at December 31, 2021 | |
| Actual return on plan assets | |
| Relating to assets still held at year-end | |
| Relating to assets still held at year-end | |
| Relating to assets still held at year-end | Relating to assets still held at year-end | | 100 | | | (4) | | | (5) | | | (3) | | | — | |
| Relating to assets sold during the year | Relating to assets sold during the year | | 53 | | | — | | | — | | | — | | | — | |
| Purchases | Purchases | | 221 | | | 59 | | | — | | | — | | | 767 | |
| Sales and settlements | Sales and settlements | | (104) | | | (23) | | | — | | | — | | | — | |
| Balance at December 31, 2020 | | 1,220 | | | 651 | | | 29 | | | 147 | | | 767 | |
| Actual return on plan assets: | |
| Balance at December 31, 2022 | |
| Actual return on plan assets | |
| Relating to assets still held at year-end | |
| Relating to assets still held at year-end | |
| Relating to assets still held at year-end | Relating to assets still held at year-end | | 11 | | | 96 | | | 4 | | | 23 | | | (76) | |
| Relating to assets sold during the year | Relating to assets sold during the year | | 174 | | | — | | | — | | | 4 | | | — | |
| Purchases | Purchases | | 194 | | | 99 | | | — | | | — | | | — | |
| Sales and settlements | Sales and settlements | | (263) | | | (3) | | | — | | | (11) | | | — | |
| Balance at December 31, 2021 | | $ | 1,336 | | | $ | 843 | | | $ | 33 | | | $ | 163 | | | $ | 691 | |
| Balance at December 31, 2023 | |
The Company enters into futures contracts to gain exposure to certain markets. Sufficient cash or cash equivalents are held by the Company's pension plans to cover the notional value of the futures contracts. At December 31, 20212023, and 2020,2022, the Company's U.S. plans had contracts with notional amounts of $4,415$4,025 million and $3,673 million.$2,567 million, respectively. At December 31, 20212023, and 2020,2022, the Company's non-U.S. plans had contracts with notional amounts of $311$124 million and $564$120 million, respectively. In both the Company's U.S. and non-U.S. pension plans, the notional derivative exposure is related to outstanding equity and fixed income futures contracts.
Common stocks, preferred stocks, real estate investment trusts, and short-term investments are valued at the closing price reported in the active market in which the individual securities are traded. Corporate bonds, mortgages/mortgage/asset-backed securities, and government securities are valued either by using pricing models, bids provided by brokers or dealers, quoted prices of securities with similar characteristics, or discounted cash flows, and as such, include adjustments for certain risks that may not be observable such as credit and liquidity risks. Certain securities are held in collective trust funds which are valued using net asset values provided by the administrators of the funds. Investments in private equity, debt, real estate and hedge funds, and direct private investments are valued at estimated fair value based on quarterly financial information received from the investment advisor and/or general partner. Investments in real estate properties are valued on a quarterly basis using the income approach. Valuation estimates are periodically supplemented by third party appraisals. The insurance buy-in contracts represent policies held by the Honeywell UK Pension Scheme, whereby the cost of providing pension benefits to plan participants is funded by the policies. The cash flows from the policies are intended to match the pension benefits. The fair value of these policies is based on an estimate of the policies' exit price.
The Company's funding policy for qualified defined benefit pension plans is to contribute amounts at least sufficient to satisfy regulatory funding standards. In 2021, 2020,2023, 2022, and 2019,2021, the Company was not required to make contributions to the U.S. pension plans and no contributions were made. The Company is not required to make any contributions to the U.S. pension plans in 2022.2024. In 2021,2023, contributions of $94$12 million were made to the non-U.S. pension plans to satisfy regulatory funding requirements. In 2022,2024, the Company expects to make contributions of cash and/or marketable securities of approximately $11$12 million to the non-U.S. pension plans to satisfy regulatory funding standards. Contributions for both the U.S. and non-U.S. pension plans do not reflect benefits paid directly from Company assets.
108109 Honeywell International Inc.
| | | | | |
| FINANCIAL STATEMENTS AND SUPPLEMENTARY DATA |
HONEYWELL INTERNATIONAL INC.
NOTES TO CONSOLIDATED FINANCIAL STATEMENTS—(Continued)
(Dollars in tables in millions, except per share amounts)
Benefit payments, including amounts to be paid from Company assets, and reflecting expected future service, as appropriate, are expected to be paid as follows:
| | U.S. Plans | Non-U.S. Plans |
| 2022 | $ | 1,135 | | $ | 261 | |
| 2023 | 1,124 | | 263 | |
| U.S. Plans | | | U.S. Plans | Non-U.S. Plans |
| 2024 | 2024 | 1,115 | | 268 | |
| 2025 | 2025 | 1,107 | | 275 | |
| 2026 | 2026 | 1,097 | | 284 | |
| 2027-2031 | 5,152 | | 1,455 | |
| 2027 | |
| 2028 | |
| 2029-2033 | |
During the twelve months ended December 31, 2023, the Company repurchased $200 million of outstanding Honeywell shares of common stock from the Honeywell U.S. Pension Plan Master Trust. The Company completed no repurchases of outstanding Honeywell shares of common stock from the Honeywell U.S. Pension Plan Master Trust during 2022.
OTHER POSTRETIREMENT BENEFITS
| | | | December 31, | | December 31, |
| 2021 | 2020 | 2023 | | 2022 |
| Assumed health care cost trend rate: | |
| Assumed health care cost trend rate | |
| Health care cost trend rate assumed for next year | |
| Health care cost trend rate assumed for next year | |
| Health care cost trend rate assumed for next year | Health care cost trend rate assumed for next year | | 6.50 | % | | 7.00 | % | 7.00 | % | | 7.50 | % |
| Rate that the cost trend rate gradually declines to | Rate that the cost trend rate gradually declines to | | 5.00 | % | | 5.00 | % | Rate that the cost trend rate gradually declines to | 5.00 | % | | 5.00 | % |
| Year that the rate reaches the rate it is assumed to remain at | Year that the rate reaches the rate it is assumed to remain at | | 2029 | | | 2029 | |
Benefit payments reflecting expected future service, as appropriate, are expected to be paid as follows:
| | | | | | | | |
| Without Impact of
Medicare Subsidy | Net of
Medicare Subsidy |
| 2022 | $ | 27 | | $ | 25 | |
| 2023 | 25 | | 24 | |
| 2024 | 14 | | 14 | |
| 2025 | 14 | | 13 | |
| 2026 | 13 | | 12 | |
| 2027-2031 | 57 | | 53 | |
NOTE 21. OTHER (INCOME) EXPENSE
| | | | | | | | | | | | | | | | | | | | |
| | Years Ended December 31, |
| 2021 | 2020 | 2019 |
| Interest income | | $ | (102) | | | $ | (107) | | | $ | (255) | |
| Pension ongoing income—non-service | | (1,202) | | | (901) | | | (606) | |
| Other postretirement income—non-service | | (71) | | | (57) | | | (47) | |
| Equity income of affiliated companies | | (67) | | | (66) | | | (52) | |
| Loss (gain) on sale of non-strategic business and assets | | (102) | | | 3 | | | 1 | |
| Foreign exchange | | 25 | | | (68) | | | (120) | |
| Expense related to UOP Matters | | 160 | | | — | | | — | |
| Reimbursement receivables charge | | — | | | 509 | | | — | |
| Other (net) | | (19) | | | 12 | | | 14 | |
| | $ | (1,378) | | | $ | (675) | | | $ | (1,065) | |
For more information on the UOP Matters and reimbursement receivables related to Garrett, see Note 19 Commitments and Contingencies. | | | | | | | | |
| Without Impact of
Medicare Subsidy | Net of
Medicare Subsidy |
| 2024 | $ | 13 | | $ | 12 | |
| 2025 | 12 | | 12 | |
| 2026 | 12 | | 11 | |
| 2027 | 11 | | 11 | |
| 2028 | 11 | | 10 | |
| 2029-2033 | 46 | | 44 | |
110 Honeywell International Inc.109
| | | | | |
| FINANCIAL STATEMENTS AND SUPPLEMENTARY DATA |
HONEYWELL INTERNATIONAL INC.
NOTES TO CONSOLIDATED FINANCIAL STATEMENTS—(Continued)
(Dollars in tables in millions, except per share amounts)
NOTE 21. OTHER (INCOME) EXPENSE
| | | | | | | | | | | | | | | | | |
| | Years Ended December 31, |
| 2023 | | 2022 | | 2021 |
| Interest income | $ | (321) | | | $ | (138) | | | $ | (102) | |
| Pension ongoing income—non-service | (441) | | | (602) | | | (1,202) | |
| Other postretirement income—non-service | (29) | | | (41) | | | (71) | |
| Equity income of affiliated companies | (100) | | | (61) | | | (67) | |
| Gain on sale of non-strategic businesses and assets | (5) | | | (22) | | | (102) | |
| Foreign exchange (gain) loss | 9 | | | 48 | | | 25 | |
| Expense related to UOP Matters | — | | | 45 | | | 160 | |
| Expense (benefit) related to Russia-Ukraine conflict | (3) | | | 45 | | | — | |
| | | | | |
| Net expense related to the NARCO Buyout and HWI Sale | 11 | | | 342 | | | — | |
| Other, net | 39 | | | 18 | | | (19) | |
| Total Other (income) expense | $ | (840) | | | $ | (366) | | | $ | (1,378) | |
See Note 19 Commitments and Contingencies for more information on the UOP Matters, NARCO Buyout, and HWI Sale. See Note 4 Repositioning and Other Charges for further discussion of the expense related to the Russia-Ukraine conflict. See Note 2 Acquisitions and Divestitures for further discussion on the gain on sale of non-strategic businesses and assets.
NOTE 22. SEGMENT FINANCIAL DATA
Honeywell globally manages its business operations through 4four reportable operatingbusiness segments. Segment information is consistent with how management reviews the businesses, makes investing and resource allocation decisions, and assesses operating performance.
Honeywell’s senior management evaluates segment performance based on segment profit. Each segment’s profit is measured as segment income (loss) before taxes excluding general corporate unallocated expense, interest and other financial charges, stock compensation expense, pension and other postretirement income (expense), repositioning and other charges, and other items within Other (income) expense.
| | | | | | | | | | | | | | | | | | | | |
| | Years Ended December 31, |
| 2021 | 2020 | 2019 |
| Net Sales | | | | | | |
| Aerospace | | | | | | |
| Products | | $ | 6,158 | | | $ | 7,194 | | | $ | 8,766 | |
| Services | | 4,868 | | | 4,350 | | | 5,288 | |
| Total | | 11,026 | | | 11,544 | | | 14,054 | |
| Honeywell Building Technologies | | | | | | |
| Products | | 4,098 | | | 3,868 | | | 4,395 | |
| Services | | 1,441 | | | 1,321 | | | 1,322 | |
| Total | | 5,539 | | | 5,189 | | | 5,717 | |
| Performance Materials and Technologies | | | | | | |
| Products | | 8,008 | | | 7,548 | | | 8,732 | |
| Services | | 2,005 | | | 1,875 | | | 2,102 | |
| Total | | 10,013 | | | 9,423 | | | 10,834 | |
| Safety and Productivity Solutions | | | | | | |
| Products | | 7,379 | | | 6,127 | | | 5,736 | |
| Services | | 435 | | | 354 | | | 368 | |
| Total | | 7,814 | | | 6,481 | | | 6,104 | |
| Corporate and All Other | | | | | | |
| Services | | — | | | — | | | — | |
| Total | | — | | | — | | | — | |
| | | $ | 34,392 | | | $ | 32,637 | | | $ | 36,709 | |
| Depreciation and amortization | | | | | | |
| Aerospace | | $ | 278 | | | $ | 241 | | | $ | 234 | |
| Honeywell Building Technologies | | 67 | | | 55 | | | 63 | |
| Performance Materials and Technologies | | 454 | | | 440 | | | 493 | |
| Safety and Productivity Solutions | | 237 | | | 223 | | | 222 | |
| Corporate and All Other | | 102 | | | 44 | | | 76 | |
| | $ | 1,138 | | | $ | 1,003 | | | $ | 1,088 | |
| Segment Profit | | | | | | |
| Aerospace | | $ | 3,051 | | | $ | 2,904 | | | $ | 3,607 | |
| Honeywell Building Technologies | | 1,238 | | | 1,099 | | | 1,165 | |
| Performance Materials and Technologies | | 2,120 | | | 1,851 | | | 2,433 | |
| Safety and Productivity Solutions | | 1,029 | | | 907 | | | 790 | |
| Corporate and All Other | | (226) | | | (96) | | | (256) | |
| | | $ | 7,212 | | | $ | 6,665 | | | $ | 7,739 | |
110111 Honeywell International Inc.
| | | | | |
| FINANCIAL STATEMENTS AND SUPPLEMENTARY DATA |
HONEYWELL INTERNATIONAL INC.
NOTES TO CONSOLIDATED FINANCIAL STATEMENTS—(Continued)
(Dollars in tables in millions, except per share amounts)
| | | | Years Ended December 31, | | Years Ended December 31, |
| 2021 | 2020 | 2019 | 2023 | | 2022 | | 2021 |
| Capital expenditures | |
| Net sales | |
| Aerospace | |
| Aerospace | |
| Aerospace | |
| Products | |
| Products | |
| Products | |
| Services | |
| Net Aerospace sales | |
| Honeywell Building Technologies | |
| Products | |
| Products | |
| Products | |
| Services | |
| Net Honeywell Building Technologies sales | |
| Performance Materials and Technologies | |
| Products | |
| Products | |
| Products | |
| Services | |
| Net Performance Materials and Technologies sales | |
| Safety and Productivity Solutions | |
| Products | |
| Products | |
| Products | |
| Services | |
| Net Safety and Productivity Solutions sales | |
| Corporate and All Other | |
| Services | |
| Services | |
| Services | |
| Net Corporate and All Other sales | |
| Net sales | |
| Depreciation and amortization | |
| Aerospace | |
| Aerospace | |
| Aerospace | Aerospace | | $ | 284 | | | $ | 248 | | | $ | 272 | |
| Honeywell Building Technologies | Honeywell Building Technologies | | 62 | | | 66 | | | 43 | |
| Performance Materials and Technologies | Performance Materials and Technologies | | 265 | | | 252 | | | 314 | |
| Safety and Productivity Solutions | Safety and Productivity Solutions | | 190 | | | 288 | | | 82 | |
| Corporate and All Other | Corporate and All Other | | 94 | | | 52 | | | 128 | |
| $ | 895 | | | $ | 906 | | | $ | 839 | |
| Total Assets | |
| Total depreciation and amortization | |
| Segment profit | |
| Aerospace | |
| Aerospace | |
| Aerospace | Aerospace | | $ | 11,490 | | | $ | 11,035 | | | $ | 11,378 | |
| Honeywell Building Technologies | Honeywell Building Technologies | | 6,543 | | | 6,351 | | | 5,968 | |
| Performance Materials and Technologies | Performance Materials and Technologies | | 18,021 | | | 16,772 | | | 16,888 | |
| Safety and Productivity Solutions | Safety and Productivity Solutions | | 11,242 | | | 10,640 | | | 9,888 | |
| Corporate and All Other | Corporate and All Other | | 17,174 | | | 19,788 | | | 14,557 | |
| $ | 64,470 | | | $ | 64,586 | | | $ | 58,679 | |
| Total segment profit | |
112 Honeywell International Inc.
| | | | | |
| FINANCIAL STATEMENTS AND SUPPLEMENTARY DATA |
HONEYWELL INTERNATIONAL INC.
NOTES TO CONSOLIDATED FINANCIAL STATEMENTS—(Continued)
(Dollars in tables in millions, except per share amounts)
| | | | | | | | | | | | | | | | | |
| | Years Ended December 31, |
| 2023 | | 2022 | | 2021 |
| Capital expenditures | | | | | |
| Aerospace | $ | 310 | | | $ | 246 | | | $ | 284 | |
| Honeywell Building Technologies | 79 | | | 74 | | | 62 | |
| Performance Materials and Technologies | 462 | | | 318 | | | 265 | |
| Safety and Productivity Solutions | 106 | | | 50 | | | 190 | |
| Corporate and All Other | 82 | | | 78 | | | 94 | |
| Total capital expenditures | $ | 1,039 | | | $ | 766 | | | $ | 895 | |
| | | | | |
| | | | | |
| | | | | |
| | | | | |
| | | | | |
| | | | | |
| | | | | |
| | | | | | | | | | | | | |
| Years Ended December 31, |
| 2023 | | 2022 | | |
| Total assets | | | | | |
| Aerospace | $ | 12,976 | | | $ | 12,189 | | | |
| Honeywell Building Technologies | 6,723 | | | 6,599 | | | |
| Performance Materials and Technologies | 19,732 | | | 17,887 | | | |
| Safety and Productivity Solutions | 10,342 | | | 10,892 | | | |
| Corporate and All Other | 11,752 | | | 14,708 | | | |
| Total assets | $ | 61,525 | | | $ | 62,275 | | | |
A reconciliation of segment profit to consolidated income before taxes are as follows:
| | | | | | | | | | | | | | | | | | | | |
| | Years Ended December 31, |
| 2021 | 2020 | 2019 |
| Segment Profit | | $ | 7,212 | | | $ | 6,665 | | | $ | 7,739 | |
| Interest and other financial charges | | (343) | | | (359) | | | (357) | |
Stock compensation expense(1) | | (217) | | | (168) | | | (153) | |
Pension ongoing income (expense)(2) | | 1,083 | | | 785 | | | 592 | |
| Pension mark-to-market expense | | (40) | | | (44) | | | (123) | |
Other postretirement income(2) | | 71 | | | 57 | | | 47 | |
Repositioning and other charges(3) | | (569) | | | (575) | | | (546) | |
Other(4) | | 38 | | | (349) | | | 360 | |
| Income before taxes | | $ | 7,235 | | | $ | 6,012 | | | $ | 7,559 | |
(1)Amounts included in Selling, general and administrative expenses.
(2)Amounts included in Cost of products and services sold and Selling, general and administrative expenses (service cost component) and Other (income) expense (non-service cost component).
(3)Amounts included in Cost of products and services sold, Selling, general and administrative expenses, and Other (income) expense.
(4) | | | | | | | | | | | | | | | | | |
| | Years Ended December 31, |
| 2023 | | 2022 | | 2021 |
| Segment profit | $ | 8,304 | | | $ | 7,689 | | | $ | 7,212 | |
| Interest and other financial charges | (765) | | | (414) | | | (343) | |
| Interest income | 321 | | | 138 | | | 102 | |
Stock compensation expense1 | (202) | | | (188) | | | (217) | |
Pension ongoing income2 | 528 | | | 993 | | | 1,083 | |
| Pension mark-to-market expense | (153) | | | (523) | | | (40) | |
Other postretirement income2 | 29 | | | 41 | | | 71 | |
Repositioning and other charges3 | (860) | | | (1,266) | | | (569) | |
Other expense4 | (43) | | | (91) | | | (64) | |
| Income before taxes | $ | 7,159 | | | $ | 6,379 | | | $ | 7,235 | |
| | | | | | | | |
| 1 | | Amounts included in Selling, general and administrative expenses. |
| 2 | | Amounts included in Cost of products and services sold (service cost component), Selling, general and administrative expenses (service cost component), Research and development expenses (service cost component), and Other (income) expense (non-service cost component). |
| 3 | | Amounts included in Cost of products and services sold, Selling, general and administrative expenses, and Other (income) expense. |
| 4 | | Amounts include the other components of Other (income) expense not included within other categories in this reconciliation. Equity income of affiliated companies is included in segment profit. |
113 Honeywell International Inc.111
| | | | | |
| FINANCIAL STATEMENTS AND SUPPLEMENTARY DATA |
HONEYWELL INTERNATIONAL INC.
NOTES TO CONSOLIDATED FINANCIAL STATEMENTS—(Continued)
(Dollars in tables in millions, except per share amounts)
NOTE 23. GEOGRAPHIC AREAS—FINANCIAL DATA
| | | | | | | | | | | | | | | | | | | | | | | | | | | | | | | | | | | | | | | | | |
| | Net Sales(1) | | Long-lived Assets(2) |
| Years Ended December 31, | | Years Ended December 31, |
| | 2021 | 2020 | 2019 | | 2021 | 2020 | 2019 |
| United States | | $ | 20,662 | | | $ | 19,665 | | | $ | 21,910 | | | | $ | 3,964 | | | $ | 3,823 | | | $ | 3,649 | |
| Europe | | 6,800 | | | 6,356 | | | 7,424 | | | | 566 | | | 628 | | | 579 | |
| Other International | | 6,930 | | | 6,616 | | | 7,375 | | | | 1,032 | | | 1,119 | | | 1,097 | |
| | | $ | 34,392 | | | $ | 32,637 | | | $ | 36,709 | | | | $ | 5,562 | | | $ | 5,570 | | | $ | 5,325 | |
(1)Sales between geographic areas approximate market value and are not significant. Net sales are classified according to their country of origin. Included in United States Net sales are export sales of $4,037 million, $4,000 million and $5,415 million for the years ended December 31, 2021, 2020 and 2019, respectively.
(2)Long-lived assets are comprised of Property, plant and equipment - net. | | | | | | | | | | | | | | | | | | | | | | | | | | | | | | | | | | | |
| | Net Sales1 | | Long-lived Assets2 |
| Years Ended December 31, | | Years Ended December 31, |
| | 2023 | | 2022 | | 2021 | | 2023 | | 2022 | | 2021 |
| United States | $ | 20,907 | | | $ | 21,262 | | | $ | 20,662 | | | $ | 4,107 | | | $ | 3,949 | | | $ | 3,964 | |
| Europe | 8,052 | | | 6,840 | | | 6,800 | | | 555 | | | 537 | | | 566 | |
| Other international | 7,703 | | | 7,364 | | | 6,930 | | | 998 | | | 985 | | | 1,032 | |
| Net sales | $ | 36,662 | | | $ | 35,466 | | | $ | 34,392 | | | $ | 5,660 | | | $ | 5,471 | | | $ | 5,562 | |
| | | | | | | | |
| 1 | | Sales between geographic areas approximate market value and are not significant. Net sales are classified according to their country of origin. Included in United States Net sales are export sales of $4,708 million, $4,187 million, and $4,037 million for the years ended December 31, 2023, 2022, and 2021, respectively. |
| 2 | | Long-lived assets consists of Property, plant and equipment—net. |
NOTE 24. SUPPLEMENTAL CASH FLOW INFORMATION
| | | | | | | | | | | | | | | | | | | | |
| | Years Ended December 31, |
| 2021 | 2020 | 2019 |
| Net payments for repositioning and other charges: | | | | | | |
| Severance and exit cost payments | | $ | (382) | | | $ | (564) | | | $ | (249) | |
| Environmental payments | | (210) | | | (216) | | | (256) | |
| Reimbursement receipts | | 140 | | | 176 | | | 292 | |
| Insurance receipts for asbestos related liabilities | | 46 | | 58 | | | 68 | |
| Asbestos related liability payments | | (286) | | | (287) | | | (231) | |
| | $ | (692) | | | $ | (833) | | | $ | (376) | |
| Interest paid, net of amounts capitalized | | $ | 339 | | | $ | 329 | | | $ | 344 | |
| Income taxes paid, net of refunds | | 1,202 | | | 1,173 | | | 1,564 | |
| Non-cash investing and financing activities: | | | | | | |
| Common stock contributed to savings plans | | 191 | | | 211 | | | 159 | |
| Marketable securities contributed to non-U.S. pension plans | | 81 | | | 93 | | | — | |
Impact of Quantinuum contribution(1) | | 460 | | | — | | | — | |
Noncontrolling interest non-cash contribution(1) | | 419 | | | — | | | — | |
| Loan in exchange for prepaid assets | | 25 | | | — | | | — | |
Receipt of Garrett Series B Preferred Stock(2) | | 577 | | | — | | | — | |
(1)See Note 2 Acquisitions and Divestitures for additional information for non-cash amounts recognized related to the combination of Honeywell Quantum Solutions and Cambridge Quantum Computing to form Quantinuum, a newly formed entity, Honeywell consolidates as the controlling majority-owner.
(2)See Note 19 Commitments and Contingencies for additional information for non-cash amounts recognized related to the receipt of 834.8 million shares of Garrett Series B Preferred Stock in exchange for the full and final satisfaction of the Garrett Indemnity, Tax Matters Agreement and pending litigation between the Company and Garrett. The non-cash amount reflects the fair value of the Garrett Series B Preferred Stock as of April 30, 2021, the date Garrett issued the Series B Preferred Stock to the Company. See Note 12 for additional information for the fair value determination of the Garrett Series B Preferred Stock.
| | | | | | | | | | | | | | | | | |
| | Years Ended December 31, |
| 2023 | | 2022 | | 2021 |
| Net payments for repositioning and other charges | | | | | |
| Severance and exit cost payments | $ | (294) | | | $ | (275) | | | $ | (382) | |
| Environmental payments | (196) | | | (211) | | | (210) | |
| Reimbursement receipts | 140 | | | 140 | | | 140 | |
| Insurance receipts for asbestos-related liabilities | 39 | | | 37 | | | 46 | |
| Insurance receivables settlements and write-offs | 26 | | | 68 | | | — | |
| Asbestos-related liability payments | (174) | | | (271) | | | (286) | |
| Total net payments for repositioning and other charges | $ | (459) | | | $ | (512) | | | $ | (692) | |
| Interest paid, net of amounts capitalized | $ | 649 | | | $ | 375 | | | $ | 339 | |
| Income taxes paid, net of refunds | 1,581 | | | 1,324 | | | 1,202 | |
| Non-cash investing and financing activities | | | | | |
| Common stock contributed to savings plans | 216 | | | 196 | | | 191 | |
| Marketable securities contributed to non-U.S. pension plans | — | | | — | | | 81 | |
Impact of Quantinuum contribution1 | — | | | — | | | 460 | |
Noncontrolling interest non-cash contribution1 | — | | | — | | | 419 | |
| Loan in exchange for prepaid assets | — | | | — | | | 25 | |
Receipt of Garrett Series B Preferred Stock2 | — | | | — | | | 577 | |
| | | | | | | | |
| 1 | | See Note 2 Acquisitions and Divestitures for additional information of non-cash amounts recognized related to the combination of Honeywell Quantum Solutions and Cambridge Quantum Computing to form Quantinuum, a newly formed entity, which Honeywell consolidates as the controlling majority-owner. |
| 2 | | See Note 19 Commitments and Contingencies for additional information of non-cash amounts recognized related to the receipt of 834.8 million shares of Garrett Series B Preferred Stock in exchange for the full and final satisfaction of the Garrett Indemnity, Tax Matters Agreement, and pending litigation between the Company and Garrett. The non-cash amount reflects the fair value of the Garrett Series B Preferred Stock as of April 30, 2021, the date Garrett issued the Series B Preferred Stock to the Company. |
112114 Honeywell International Inc.
REPORT OF INDEPENDENT REGISTERED PUBLIC ACCOUNTING FIRM
To the shareowners and the Board of Directors of Honeywell International Inc.
Opinions on the Financial Statements and Internal Control over Financial Reporting
We have audited the accompanying consolidated balance sheets of Honeywell International Inc. and subsidiaries (the "Company" or “Honeywell”) as of December 31, 20212023 and 2020,2022, and the related consolidated statements of operations, comprehensive income, shareowners’ equity, and cash flows, for each of the three years in the period ended December 31, 2021,2023, and the related notes (collectively referred to as the "financial statements"). We also have audited the Company’s internal control over financial reporting as of December 31, 2021,2023, based on criteria established in Internal Control — Integrated Framework (2013)issued by the Committee of Sponsoring Organizations of the Treadway Commission (COSO).
As described in Management’s Report on Internal Control Over Financial Reporting, management excluded from its assessment the internal control over financial reporting at Compressor Controls Corporation, which was acquired on June 30, 2023, and whose financial statements constitute less than 1% of net and total assets, revenues, and net income, respectively, of the consolidated financial statement amounts as of and for the year ended December 31, 2023. Accordingly, our audit did not include the internal control over financial reporting at Compressor Controls Corporation.
In our opinion, the financial statements referred to above present fairly, in all material respects, the financial position of the Company as of December 31, 20212023 and 2020,2022, and the results of its operations and its cash flows for each of the three years in the period ended December 31, 2021,2023, in conformity with accounting principles generally accepted in the United States of America (“generally accepted accounting principles”). Also, in our opinion, the Company maintained, in all material respects, effective internal control over financial reporting as of December 31, 2021,2023, based on criteria established in Internal Control — Integrated Framework (2013)issued by COSO.
Basis for Opinions
The Company’s management is responsible for these financial statements, for maintaining effective internal control over financial reporting, and for its assessment of the effectiveness of internal control over financial reporting, included in the accompanying Management’s Report on Internal Control Over Financial Reporting. Our responsibility is to express an opinion on these financial statements and an opinion on the Company’s internal control over financial reporting based on our audits. We are a public accounting firm registered with the Public Company Accounting Oversight Board (United States) (PCAOB) and are required to be independent with respect to the Company in accordance with the U.S. federal securities laws and the applicable rules and regulations of the Securities and Exchange Commission and the PCAOB.
We conducted our audits in accordance with the standards of the PCAOB. Those standards require that we plan and perform the audits to obtain reasonable assurance about whether the financial statements are free of material misstatement, whether due to error or fraud, and whether effective internal control over financial reporting was maintained in all material respects.
Our audits of the financial statements included performing procedures to assess the risks of material misstatement of the financial statements, whether due to error or fraud, and performing procedures to respond to those risks. Such procedures included examining, on a test basis, evidence regarding the amounts and disclosures in the financial statements. Our audits also included evaluating the accounting principles used and significant estimates made by management, as well as evaluating the overall presentation of the financial statements. Our audit of internal control over financial reporting included obtaining an understanding of internal control over financial reporting, assessing the risk that a material weakness exists, and testing and evaluating the design and operating effectiveness of internal control based on the assessed risk. Our audits also included performing such other procedures as we considered necessary in the circumstances. We believe that our audits provide a reasonable basis for our opinions.
Definition and Limitations of Internal Control over Financial Reporting
A company’s internal control over financial reporting is a process designed to provide reasonable assurance regarding the reliability of financial reporting and the preparation of financial statements for external purposes in accordance with generally accepted accounting principles. A company’s internal control over financial reporting includes those policies and procedures that (1) pertain to the maintenance of records that, in reasonable detail, accurately and fairly reflect the transactions and dispositions of the assets of the company; (2) provide reasonable assurance that transactions are recorded as necessary to permit preparation of financial statements in accordance with generally accepted accounting principles, and that receipts and expenditures of the company are being made only in accordance with authorizations of management and directors of the company; and (3) provide reasonable assurance regarding prevention or timely detection of unauthorized acquisition, use, or disposition of the company’s assets that could have a material effect on the financial statements.
Because of its inherent limitations, internal control over financial reporting may not prevent or detect misstatements. Also, projections of any evaluation of effectiveness to future periods are subject to the risk that controls may become inadequate because of changes in conditions, or that the degree of compliance with the policies or procedures may deteriorate.
115 Honeywell International Inc.113
REPORT OF INDEPENDENT REGISTERED PUBLIC ACCOUNTING FIRM
| | | | | |
| REPORT OF INDEPENDENT REGISTERED PUBLIC ACCOUNTING FIRM |
Critical Audit MattersMatter
The critical audit mattersmatter communicated below are mattersis a matter arising from the current-period audit of the financial statements that werewas communicated or required to be communicated to the audit committee and that (1) relaterelates to accounts or disclosures that are material to the financial statements and (2) involved our especially challenging, subjective, or complex judgments. The communication of critical audit matters does not alter in any way our opinion on the financial statements, taken as a whole, and we are not, by communicating the critical audit mattersmatter below, providing a separate opinionsopinion on the critical audit mattersmatter or on the accounts or disclosures to which they relate.
Asbestos Related Liabilities - North American Refractories Company (NARCO) Asbestos Liability – Refer to Note 19 to the financial statements
Critical Audit Matter Description
The Company records an estimated liability for asbestos related personal injury claims related to a predecessor company, NARCO. Such claims arise primarily from alleged occupational exposure to asbestos-containing refractory brick and mortar.
The Company’s NARCO asbestos-related liability reflects an estimated liability for the resolution of asserted and unasserted NARCO-related asbestos claims that are probable of occurrence and reasonably estimable. The Company records an estimated liability for the resolution of asserted Annual Contribution Claims and Pre-Established Unliquidated Claims filed with the NARCO Trust using average payment values for the relevant historical period. The Company also records an estimated liability for unasserted Annual Contribution Claims and Pre-Established Unliquidated Claims based on historic and anticipated claims filing experience and payment rates, disease classifications and type of claim, and average payment values by the NARCO Trust for the relevant historical period. Beginning in 2020, with three years of sufficiently reliable claims data, the Company updated its estimate of the NARCO asbestos-related liability.
Accounting for the NARCO asbestos-related liability is an inherently subjective exercise as it requires management to make significant assumptions and judgments. Given the subjectivity related to estimating the NARCO asbestos-related liability and the assessment of the sufficiency and reliability of the claims data, auditing the NARCO asbestos-related liability involved especially subjective judgment.
How the Critical Audit Matter Was Addressed in the Audit
Our audit procedures related to the NARCO asbestos-related liability included the following, among others:
•We tested the effectiveness of internal controls over the estimate of the NARCO asbestos-related liability including management’s controls over the estimate for asserted and unasserted Annual Contribution Claims and Pre-Established Unliquidated Claims.
•We evaluated the methods and assumptions used by management to estimate the NARCO asbestos-related liability by:
◦Reading the Company’s analysis and third-party assessment to evaluate the Company’s methodology used in the analysis.
◦Confirming the claims data with the NARCO Trust to evaluate the appropriateness of the underlying data used in the analysis.
◦Making inquiries of the Company’s third-party specialist to identify the significant assumptions used to develop the analysis.
◦Making inquiries of internal and external legal counsel regarding the regulatory and litigation environments related to the NARCO asbestos-related liability.
•With the assistance of our internal actuarial specialists, we developed a range of independent estimates and compared those to the Company’s recorded NARCO asbestos-related liability.relates.
Revenue Recognition and Contracts with Customers – Long-Term Contracts – Refer to Note 1 and Note 3 to the financial statements
Critical Audit Matter Description
The Company has several businesses which enter into long-term contracts whereby revenue is recognized over the contract term (“over time”) as the work progresses and control of the goods and services are continuously transferred to the customer. Revenue for these contracts is recognized based on the extent of progress towards completion, generally measured by using a cost-to-cost input method.
Accounting for long-term contracts requires management’s judgment in estimating total contract costs. Contract costs, which can be incurred over several years, are largely determined based on negotiated or estimated purchase contract terms and consider factors such as historical performance trends, inflationary trends, technical and schedule risk, internal and subcontractor performance trends, business volume assumptions, asset utilization and anticipated labor agreements.
Given the significance of the judgments necessary to estimate costs associated with these long-term contracts (which varies upon the length of the contract), auditing long-term contracts requires a high degree of auditor judgment.
114 Honeywell International Inc.
REPORT OF INDEPENDENT REGISTERED PUBLIC ACCOUNTING FIRM
How the Critical Audit Matter Was Addressed in the Audit
Our audit procedures related to long-term contracts included the following, among others:
•We tested the effectiveness of internal controls over the recognition of revenue and the determination of estimated contract costs including controls over the review of management’s assumptions and key inputs used to recognize revenue and costs on long-term contracts using the cost-to-cost input method.
•We evaluated the appropriateness and consistency of management’s methods and assumptions used to recognize revenue and costs on long-term contracts using the cost-to-cost input method to recognize revenue over time.
•We tested recorded revenue using a combination of analytical procedures and detailed contract testing.
•We profiled the population of long-term contracts with longer duration and evaluated a selection of loss contracts or contracts with significant gross margin changes against historical performance to assess management’s ability to achieve estimates and to identify potential bias in the recognition of revenue over time.
/S/ DELOITTE & TOUCHE LLP
Charlotte, North Carolina
February 11, 202216, 2024
We have served as the Company's auditor since 2014.
116 Honeywell International Inc.115
CHANGES IN AND DISAGREEMENTS WITH ACCOUNTANTS ON ACCOUNTING AND FINANCIAL DISCLOSURE
Not Applicable.applicable.
CONTROLS AND PROCEDURES
Honeywell management maintains disclosure controls and procedures designed to provide reasonable assurance that information required to be disclosed in reports filed under the Exchange Act is recorded, processed, summarized, and reported within the specified time periods and accumulated and communicated to our management, including our principal executive officer and principal financial officer, as appropriate, to allow timely decisions regarding required disclosure. There have been no changes that have materially affected, or are reasonably likely to materially affect, Honeywell’s internal control over financial reporting that have occurred during the quarter ended December 31, 2021.2023.
Our management, with the participation of our CEO and CFO, evaluated the effectiveness of our disclosure controls and procedures (as defined in RulesRule 13a-15(e) or 15d-15(e) promulgated under the Exchange Act) as of December 31, 2021.2023. Based on these evaluations, our CEO and CFO concluded that our disclosure controls and procedures were effective as of December 31, 2021.2023.
MANAGEMENT'S REPORT ON INTERNAL CONTROL OVER FINANCIAL REPORTING
Honeywell management is responsible for establishing and maintaining adequate internal control over financial reporting and for its assessment of the effectiveness of internal control over financial reporting as(as defined in RulesRule 13a-15(f) or 15d-15(f) under the Exchange Act.Act). Honeywell’s internal control over financial reporting is a process designed to provide reasonable assurance to our management and boardBoard of directorsDirectors regarding the reliability of financial reporting and the preparation of financial statements for external purposes in accordance with generally accepted accounting principles.
Because of its inherent limitations, internal control over financial reporting may not prevent or detect misstatements.
Management assessed the effectiveness of Honeywell’s internal control over financial reporting as of December 31, 2021.2023. In making this assessment, management used the criteria set forth by the Committee of Sponsoring Organizations of the Treadway Commission (COSO) in Internal Control—Integrated Framework (2013).
Based on this assessment, management determined that Honeywell maintained effective internal control over financial reporting as of December 31, 2021.2023.
We have not experienced any material impact to ourManagement’s assessment of the effectiveness of the Company’s internal control over financial reporting duringas of December 31, 2023, excluded Compressor Controls Corporation, which was acquired by the COVID-19 pandemic. MostCompany on June 30, 2023. The total revenues, net income, and net and total assets of our employees worked remotely during Compressor Controls Corporation represents less than 1% each of the year in which we prepared theserelated consolidated financial statements due to the impactstatement amounts as of COVID-19. We are continually monitoring and assessing the need to modify or enhance our disclosure controls to ensure disclosure controls and procedures continue to be effective.December 31, 2023.
The effectiveness of Honeywell’s internal control over financial reporting as of December 31, 2021,2023 has been audited by Deloitte & Touche LLP, an independent registered public accounting firm, as stated in their report which is included in the section titled Financial Statements and Supplementary Data.
116117 Honeywell International Inc.
OTHER INFORMATION
Not Applicable.EQUITY TRADING PLAN ELECTIONS
Certain executive officers and directors of the Company may execute purchases and sales of the Company's common stock through Rule 10b5-1 and non-Rule 10b5-1 equity trading plans.
During the three months ended December 31, 2023, none of our executive officers or directors adopted, terminated, or modified a Rule 10b5-1 equity trading plan, or adopted, terminated, or modified any "non-Rule 10b5-1 trading arrangement" (as defined in Item 408(c) of Regulation S-K).
DISCLOSURE REGARDING FOREIGN JURISDICTIONS THAT PREVENT INSPECTIONS
Not Applicable.applicable.
DIRECTORS, EXECUTIVE OFFICERS, AND CORPORATE GOVERNANCE
Information relating to the Directors of Honeywell, as well as information relating to compliance with Section 16(a) of the Securities Exchange Act of 1934, will be contained in the Proxy Statement, which will be filed with the SEC pursuant to Regulation 14A not later than 120 days after December 31, 2021,2023, and such information is incorporated herein by reference. Certain information relating to the Executive Officers of Honeywell appears in this Form 10-K under the heading titled Information about ourOur Executive Officers.
The members of the Audit Committee of our Board of Directors are: George PazD. Scott Davis (Chair), Kevin Burke, D. Scott Davis, Judd A. GreggMichael W. Lamach, Robin L. Washington, and Robin L. Washington.Watson. The Board has determined that Mr. Paz, Mr. Burke, Mr. Davis and Ms. Washington are audit committeeAudit Committee financial experts as defined by applicable SEC rules and that Mr. Paz,Davis, Mr. Davis,Burke, Mr. Lamach, Ms. Washington, and Ms. WashingtonMr. Watson satisfy the financial sophistication criteria established by the Nasdaq. All members of the Audit Committee are independent as that term is defined in applicable SEC rules and Nasdaq listing standards.
Honeywell’s corporate governance policies and procedures, including the Code of Business Conduct, Corporate Governance Guidelines, and Charters of the Committees of the Board of Directors are available, free of charge, on our Investor Relations website (honeywell.com)(investor.honeywell.com) under the heading InvestorsGovernance (see Corporate Governance)Governance Overview), or by writing to Honeywell, 855 South Mint Street, Charlotte, North Carolina 28202, c/o Vice President and Corporate Secretary. Honeywell’s Code of Business Conduct applies to all Honeywell directors, officers (including the Chief Executive Officer, Chief Financial Officer, and Controller), and employees. Amendments to or waivers of the Code of Business Conduct granted to any of Honeywell’s directors or executive officers will be published on our website within four business days of such amendment or waiver.
On December 8, 2023, the Board of Directors amended and restated the By-laws of the Company (as amended and restated, the “By-laws”), effective as of such date, to (i) update the procedures and information requirements for the nomination of directors and the proposal of business for consideration at meetings of shareowners, including with respect to Rule 14a-19 promulgated under the Exchange Act; (ii) provide the chair of the meeting of shareowners with the power and duty to determine whether, in certain specified circumstances, a nomination shall be disregarded or business proposal shall not be transacted; (iii) clarify that the chair of the meeting may prescribe rules and determinations as to the conduct of the shareowners’ meeting; and (iv) clarify and conform various provisions of the By-laws to the General Corporation Law of the State of Delaware and to other provisions of the By-laws and make certain non-substantive changes and updates.
EXECUTIVE COMPENSATION
Information relating to executive compensation, including the Management Development and Compensation Committee Report and disclosures regarding compensation committee interlocks and insider participation will be contained in the Proxy Statement, and such information is incorporated herein by reference.
118 Honeywell International Inc.117
SECURITY OWNERSHIP OF CERTAIN BENEFICIAL OWNERS AND MANAGEMENT AND RELATED STOCKHOLDER MATTERS
Information relating to security ownership of certain beneficial owners and management and related stockholder matters will be contained in the Proxy Statement, and such information is incorporated herein by reference.
EQUITY COMPENSATION PLANS
As of December 31, 2021,2023, information about our equity compensation plans iswas as follows:
| | | | | | | | | | | | | | | | | | | | | | | | | | |
| Plan category | Number of Securities
to be Issued
Upon Exercise of
Outstanding Options,
Warrants and Rights | Weighted-Average
Exercise Price of
Outstanding
Options, Warrants
and Rights | | Number of Securities
Remaining Available for
Future Issuance Under
Equity Compensation
Plans (Excluding
Securities Reflected in
Column (a)) |
| (a) | | (b) | | (c) |
| Equity compensation plans approved by security holders | 19,340,042 | | (1) | | $ | 135.31 | | (2) | | 34,886,930 | | (3) |
| Equity compensation plans not approved by security holders | 225,753 | | (4) | | N/A | (5) | | N/A | (6) |
| Total | 19,565,795 | | | | $ | 135.31 | | | | 34,886,930 | | |
(1)Equity compensation plans approved by shareowners which are included in column (a) of the table are the 2016 Stock Incentive Plan and the 2011 Stock Incentive Plan (including 15,657,151 shares of Common Stock to be issued upon exercise of outstanding options; 2,886,193 RSUs subject to continued employment; 197,586 RSUs at target level and subject to company performance metrics and continued employment; and 415,773 deferred RSUs); and the 2016 Stock Plan for Non-Employee Directors and the 2006 Stock Plan for Non-Employee Directors (including 175,104 shares of Common Stock to be issued upon exercise of outstanding options; and 8,235 RSUs subject to continued services). RSUs included in column (a) of the table represent the full number of RSUs awarded and outstanding whereas the number of shares of Common Stock to be issued upon vesting will be lower than what is reflected on the table because the value of shares required to meet employee tax withholding requirements are not issued.
Because the number of future shares that may be distributed to employees participating in the Honeywell Global Stock Plan is unknown, no shares attributable to that plan are included in column (a) of the table above.
(2)Column (b) relates to stock options and does not include any exercise price for RSUs because an RSU’s value is dependent upon attainment of certain performance goals and/or continued employment or service and they are settled for shares of Common Stock on a one-for-one basis.
(3)The number of shares that may be issued under the 2016 Stock Incentive Plan as of December 31, 2021 is 32,337,638, which includes the following additional shares that may again be available for issuance: shares that are settled for cash, expire, are canceled, or under similar prior plans, are tendered as option exercise price or tax withholding obligations, are reacquired with cash option exercise price or with monies attributable to any tax deduction to Honeywell upon the exercise of an option, or are under any outstanding awards assumed under any equity compensation plan of an entity acquired by Honeywell. No securities are available for future issuance under the 2011 Stock Incentive Plan.
The number of shares that may be issued under the Honeywell Global Stock Plan as of December 31, 2021 is 1,713,993. This plan is an umbrella plan for three plans described below maintained solely for eligible employees of participating non-U.S. countries.
•The UK Sharebuilder Plan allows an eligible UK employee to invest taxable earnings in Common Stock. The Company matches those shares and dividends paid are used to purchase additional shares of Common Stock. For the year ended December 31, 2021, 21,228 shares were credited to participants’ accounts under the UK Sharebuilder Plan.
•The Honeywell Aerospace Ireland Share Participation Plan and the Honeywell Measurex (Ireland) Limited Group Employee Profit Sharing Plan allow eligible Irish employees to contribute a percentage of base pay and/or bonus that is invested in Common Stock. For the year ended December 31, 2021, 1,059 shares of Common Stock were credited to participants’ accounts under these plans.
The remaining 815,299 shares included in column (c) are shares remaining under the 2016 Stock Plan for Non-Employee Directors.
(4)Equity compensation plans not approved by shareowners included in the table refer to the Honeywell Excess Benefit Plan and Supplemental Savings Plan.
The Honeywell Excess Benefit Plan and Supplemental Savings Plan for highly compensated employees is an unfunded, non-tax qualified plan that provides benefits equal to the employee deferrals and Company matching allocations that would have been provided under Honeywell’s U.S. tax-qualified savings plan if the Internal Revenue Code limitations on compensation and contributions did not apply. The Company matching contribution is credited to participants’ accounts in the form of notional shares of Common Stock. The notional shares are distributed in the form of actual shares of Common Stock. The number of shares to be issued under this plan based on the value of the notional shares as of December 31, 2021 is 225,753.
(5)Column (b) does not include any exercise price for notional shares allocated to employees under Honeywell’s equity compensation plans not approved by shareowners because all of these shares are only settled for shares of Common Stock on a one-for-one basis.
(6)The amount of securities available for future issuance under the Honeywell Excess Benefit Plan and Supplemental Savings Plan is not determinable because the number of securities that may be issued under this plan depends upon the amount deferred to the plan by participants in future years. | | | | | | | | | | | | | | | | | | | | | | | | | | |
| Plan category | Number of Securities
to be Issued
Upon Exercise of
Outstanding Options,
Warrants, and Rights | Weighted Average
Exercise Price of
Outstanding
Options, Warrants,
and Rights | | Number of Securities
Remaining Available for
Future Issuance Under
Equity Compensation
Plans (Excluding
Securities Reflected in
Column (a)) |
| (a) | | (b) | | (c) |
| Equity compensation plans approved by security holders | 16,000,561 | | 1 | | $ | 153.79 | | 2 | | 31,178,450 | | 3 |
| Equity compensation plans not approved by security holders | 144,884 | | 4 | | N/A | 5 | | N/A | 6 |
| Total | 16,145,445 | | | | $ | 153.79 | | | | 31,178,450 | | |
| | | | | | | | |
| 1 | | Equity compensation plans approved by shareowners which are included in column (a) of the table are the 2016 Stock Incentive Plan and the 2011 Stock Incentive Plan (including 13,246,624 shares of Common Stock to be issued for options; 2,110,539 RSUs subject to continued employment; 201,130 RSUs at target level and subject to company performance metrics and continued employment; and 265,530 deferred RSUs); and the 2016 Stock Plan for Non-Employee Directors and the 2006 Stock Plan for Non-Employee Directors (including 170,176 shares of Common Stock to be issued for options; and 3,104 RSUs subject to continued services, and 3,458 deferred RSUs). RSUs included in column (a) of the table represent the full number of RSUs awarded and outstanding whereas the number of shares of Common Stock to be issued upon vesting will be lower than what is reflected on the table because the value of shares required to meet employee tax withholding requirements are not issued. Because the number of future shares that may be distributed to employees participating in the Honeywell Global Stock Plan is unknown, no shares attributable to that plan are included in column (a) of the table above. |
| 2 | | Column (b) relates to stock options and does not include any exercise price for RSUs because an RSU’s value is dependent upon attainment of certain performance goals and/or continued employment or service and they are settled for shares of Common Stock on a one-for-one basis. |
| 3 | | The number of shares that may be issued under the 2016 Stock Incentive Plan as of December 31, 2023, is 28,946,133, which includes the following additional shares that may again be available for issuance: shares that are settled for cash, expire, are canceled, or under similar prior plans, are tendered as option exercise price or tax withholding obligations, are reacquired with cash option exercise price or with monies attributable to any tax deduction to Honeywell upon the exercise of an option, or are under any outstanding awards assumed under any equity compensation plan of an entity acquired by Honeywell. No securities are available for future issuance under the 2011 Stock Incentive Plan. The number of shares that may be issued under the Honeywell Global Stock Plan as of December 31, 2023, is 1,450,549. This plan is an umbrella plan for three plans described below maintained solely for eligible employees of participating non-U.S. countries. •The UK Sharebuilder Plan allows an eligible UK employee to invest taxable earnings in Common Stock. The Company matches those shares and dividends paid are used to purchase additional shares of Common Stock. For the year ended December 31, 2023, 240,267 shares were credited to participants’ accounts under the UK Sharebuilder Plan. •The Honeywell Aerospace Ireland Share Participation Plan allows eligible Irish employees to contribute a percentage of base pay and/or bonus that is invested in Common Stock. For the year ended December 31, 2023, 685 shares of Common Stock were credited to participants’ accounts under these plans. •The remaining 781,768 shares included in column (c) are shares remaining under the 2016 Stock Plan for Non-Employee Directors. |
| 4 | | Equity compensation plans not approved by shareowners included in the table refer to the Honeywell Excess Benefit Plan and Supplemental Savings Plan. The Honeywell Excess Benefit Plan and Supplemental Savings Plan for certain highly compensated employees is an unfunded, non-tax qualified plan that provides benefits equal to the employee deferrals and Company matching allocations that would have been provided under Honeywell’s U.S. tax-qualified savings plan if the Internal Revenue Code limitations on compensation and contributions did not apply. The Company matching contribution is credited to participants’ accounts in the form of notional shares of Common Stock. The notional shares are distributed in the form of actual shares of Common Stock. The number of shares to be issued under this plan based on the value of the notional shares as of December 31, 2023, is 144,884. |
| 5 | | Column (b) does not include any exercise price for notional shares allocated to employees under Honeywell’s equity compensation plans not approved by shareowners because all of these shares are only settled for shares of Common Stock on a one-for-one basis. |
| 6 | | The amount of securities available for future issuance under the Honeywell Excess Benefit Plan and Supplemental Savings Plan is not determinable because the number of securities that may be issued under this plan depends upon the amount deferred to the plan by participants in future years. |
118119 Honeywell International Inc.
CERTAIN RELATIONSHIPS AND RELATED TRANSACTIONS, AND DIRECTOR INDEPENDENCE
Information relating to certain relationships and related transactions and director independence will be contained in the Proxy Statement, and such information is incorporated herein by reference.
PRINCIPAL ACCOUNTING FEES AND SERVICES
Information relating to fees paid to and services performed by Deloitte & Touche LLP and our Audit Committee’s pre-approval policies and procedures with respect to non-audit services will be contained in the Proxy Statement, and such information is incorporated herein by reference.
EXHIBITS AND FINANCIAL STATEMENT SCHEDULES
| | | | | | | | |
| | Page Number
in Form 10-K |
| (a)(1.) | Consolidated Financial Statements: | |
| Consolidated Statement of Operations for the years ended December 31, 2021, 20202023, 2022, and 20192021 | |
| Consolidated Statement of Comprehensive Income for the years ended December 31, 2021, 20202023, 2022, and 20192021 | |
| Consolidated Balance Sheet at December 31, 20212023, and 20202022 | |
| Consolidated Statement of Cash Flows for the years ended December 31, 2021, 20202023, 2022, and 20192021 | |
| Consolidated Statement of Shareowners’ Equity for the years ended December 31, 2021, 20202023, 2022, and 20192021 | |
| Notes to Consolidated Financial Statements | |
| Report of Independent Registered Public Accounting Firm (PCAOB ID No. 34) | |
| | | | | | | | |
| | Page Number
in Form 10-K |
| (a)(3.) | Exhibits | |
| See the Exhibit Index of this Annual Report on Form 10-K | |
FORM 10-K SUMMARY
None.
120 Honeywell International Inc.119
EXHIBIT INDEX
| | | | | | | | |
| Exhibit No. | | Description |
| 3(i) | | |
| 3(ii) | | |
| 4.1 | | Honeywell International Inc. is a party to several long-term debt instruments under which, in each case, the total amount of securities authorized does not exceed 10% of the total assets of Honeywell and its subsidiaries on a consolidated basis. Pursuant to paragraph 4(iii)(A) of Item 601(b) of Regulation S-K, Honeywell agrees to furnish a copy of such instruments to the Securities and Exchange Commission upon request. |
| 4.2 | | |
| 10.1* | | |
| 10.2* | | |
| 10.3* | | |
| 10.4* | | |
| 10.5* | | |
| 10.6* | | |
10.6*10.7* | | |
10.7*10.8* | | |
10.8*10.9* | | |
10.9*10.10* | | |
10.10*10.11* | | |
10.11*10.12* | | |
10.12*10.13* | | |
10.13*10.14* | | |
10.14*10.15* | | |
10.15*10.16* | | |
10.16*10.17* | | |
10.17*10.18* | | |
10.18*10.19* | | |
10.19*10.20* | | |
10.20*10.21* | | |
121 Honeywell International Inc.
| | | | | | | | |
10.21*Exhibit No. | | Description |
| 10.22* | | |
120 Honeywell International Inc.
| | | | | | | | |
Exhibit No.10.23* | | Description |
10.22* | | |
10.23*10.24* | | |
10.24*10.25* | | |
10.25*10.26* | | |
10.26* | | |
| 10.27* | | |
| 10.28* | | |
| 10.29* | | |
| 10.30* | | |
| 10.31* | | |
| 10.32* | | |
10.33* | | |
10.34* | | |
10.35*10.33* | | |
10.36*10.34* | | |
10.37*10.35* | | |
10.38*10.36* | | |
10.39*10.37* | | |
10.40*10.38* | | |
10.41* | | |
10.42* | | |
10.43* | | |
10.44* | | |
10.45*10.39* | | |
10.46*10.40* | | |
10.47*10.41* | | |
10.48*10.42* | | |
10.49*10.43* | | |
10.50*10.44* | | |
Honeywell International Inc. 121
| 10.45* | | | | | | | | |
Exhibit No. | | Description |
10.51* | | |
10.52*10.46* | | |
10.53*10.47* | | |
10.54*10.48* | | |
10.55*10.49* | | |
10.56*10.50* | | |
122 Honeywell International Inc.
| | | | | | | | |
10.57*Exhibit No. | | Description |
| 10.51* | | |
10.58*10.52* | | |
10.59*10.53* | | |
10.60*10.54* | | |
10.61*10.55* | | |
10.62*10.56* | | |
10.63*10.57* | | |
10.64*10.58* | | |
10.65*10.59* | | |
| 10.60* | | |
10.66*10.61* | | |
10.67*10.62* | | |
10.68*10.63* | | |
10.69* | | |
10.70*10.64* | | |
10.71*10.65* | | |
10.7210.66* | | |
| 10.67 | | 364-Day Credit Agreement, dated as of March 31, 2021,20, 2023, among Honeywell International Inc., the banks, financial institutions, and other institutional lenders parties thereto, Bank of America, N.A., as administrative agent, and JPMorgan Chase Bank, N.A. and Wells Fargo Bank, National Association, as syndication agents (incorporated by reference to Exhibit 10.1 to Honeywell’sHoneywell's Form 8-K filed on April 2, 2021)March 21, 2023) |
10.7310.68 | | Amended and Restated Five-Year Credit Agreement, dated as of March 31, 2021,20, 2023, among Honeywell International Inc., the banks, financial institutions, and other institutional lenders parties thereto, Bank of America, N.A., as administrative agent Bank of America Europe Designated Activity Company, London Branch,and as swing line agent, and JPMorgan Chase Bank, N.A., and Wells Fargo Bank, National Association, as syndication agents (incorporated by reference to Exhibit 10.2 to Honeywell’sHoneywell's Form 8-K filed April 2, 20March 21,) 2023) |
10.7410.69 | | |
10.75 | | |
10.76 | | |
122 Honeywell International Inc.
| | | | | | | | |
Exhibit No. | | Description |
10.77 | | |
10.7810.70 | | Delayed Draw Term Loan Agreement, dated as of March 26, 2020, among Honeywell International Inc., the initial lenders named therein, Citibank, N.A., as administrative agent, and Citibank, N.A., Bank of America, N.A., JPMorgan Chase Bank, N.A. and Wells Fargo Bank, National Association, as syndication agents (incorporated by reference to Exhibit 10.1 to Honeywell’s Form 8-K filed on March 31, 2020) |
10.79 | | |
10.80 | | |
10.8110.71 | | |
10.8210.72 | | |
10.8310.73 | | |
| 10.74 | | |
| 21 | | |
| 23.1 | | |
123 Honeywell International Inc.
| | | | | | | | |
| Exhibit No. | | Description |
| 24 | | |
| 31.1 | | |
| 31.2 | | |
| 32.1 | | |
| 32.2 | | |
| 95 | | |
| 97 | | |
| 101.INS | | The following financial statements from the Company's Annual Report on Form 10-K for the year ended December 31, 2021,2023, formatted in Inline XBRL: (i) Consolidated Statements of Cash Flows,Operations, (ii) Consolidated Statements of Operations, (iii) Consolidated Statements of Comprehensive Income, (iii) Consolidated Balance Sheet, (iv) Consolidated Balance Sheets,Statements of Cash Flows, (v) Consolidated Statements of Shareowners' Equity and (vi) Notes to Consolidated Financial Statements, tagged as blocks of text and including detailed tags.tags (filed herewith) |
| 101.SCH | | iXBRL Taxonomy Extension Schema (filed herewith) |
| 101.CAL | | iXBRL Taxonomy Extension Calculation Linkbase (filed herewith) |
| 101.DEF | | iXBRL Taxonomy Extension Definition Linkbase (filed herewith) |
| 101.LAB | | iXBRL Taxonomy Extension Label Linkbase (filed herewith) |
| 101.PRE | | iXBRL Taxonomy Extension Presentation Linkbase (filed herewith) |
| 104 | | Cover page from the Company’s Annual Report on Form 10-K for the year ended December 31, 2021,2023, formatted in Inline XBRL (and contained in Exhibit 101) (filed herewith) |
The Exhibits identified above with an asterisk (*) are management contracts or compensatory plans or arrangements.
124 Honeywell International Inc.123
SIGNATURES
Pursuant to the requirements of Section 13 or 15(d) of the Securities Exchange Act of 1934, the registrantRegistrant has duly caused this report to be signed on its behalf by the undersigned thereunto duly authorized.
| | | | | | | | | | | | | | |
| | | HONEYWELL INTERNATIONAL INC. |
| | | | |
Date: February 11, 202216, 2024 | | By: | | /s/ Robert D. Mailloux |
| | | | | Robert D. Mailloux
Vice President and Controller
(on behalf of the Registrant
and as the Registrant’s
Principal Accounting Officer) |
125 Honeywell International Inc.
Pursuant to the requirements of the Securities Exchange Act of 1934, this annual report has been signed below by the following persons on behalf of the Registrant and in the capacities and on the date indicated:
| | | | | | | | |
| Name | | Name |
| | | |
/s/ Darius E. Adamczyk* | | * |
Darius E. Adamczyk
Chairman and Chief Executive Officer
(Principal Executive Officer)of the Board | | Judd A. GreggMichael W. Lamach
Director |
| | | |
| * | | * |
Duncan B. Angove
Director | | Rose Lee
Director |
| | |
| * | | * |
William S. Ayer
Director | | Grace D. Lieblein
Director |
| | |
| * | | * |
Kevin Burke
Director | | George PazRobin L. Washington
Director |
| | | |
| * | | * |
D. Scott Davis
Director | | Robin L. WashingtonWatson
Director |
| | | |
| * | | |
Deborah Flint
Director | | |
| | | |
| /s/ Vimal Kapur | | |
Vimal Kapur
Chief Executive Officer and Director
(Principal Executive Officer) | | |
| | |
| | |
| | |
| | |
| /s/ Gregory P. Lewis | | /s/ Robert D. Mailloux |
Gregory P. Lewis
Senior Vice President and
Chief Financial Officer
(Principal Financial Officer) | | Robert D. Mailloux
Vice President and Controller
(Principal Accounting Officer) |
| | | | | | | | | | | | | | |
| *By: | | /s/ Gregory P. Lewis | | |
| | | Gregory P. Lewis
Attorney-in-fact | | |
February 11, 202216, 2024
126 Honeywell International Inc.124
FORM 10-K CROSS-REFERENCE INDEX
| | | | | | | | | | | | | | |
| Page(s) | | PART I | | |
| | ITEM 1 | | |
| | | | |
| | ITEM 1A. | | |
| | ITEM 1B. | | |
| | ITEM 1C. | | |
| | ITEM 2 | | |
| | ITEM 3 | | |
| | ITEM 4 | | |
| | | | |
| | PART II. | | |
| | ITEM 5 | | |
| | ITEM 6 | | |
| | ITEM 7 | | |
| | ITEM 7A. | | |
| | ITEM 8 | | |
| | ITEM 9 | | |
| | ITEM 9A. | | |
| | ITEM 9B. | | |
| | | | |
| | | | |
| | Part III. | | |
| | ITEM 10 | | |
| | ITEM 11 | | |
| | ITEM 12 | | |
| | ITEM 13 | | |
| | ITEM 14 | | |
| | | | |
| | Part IV. | | |
| | ITEM 15 | | |
| | ITEM 16 | | |
| | | | |
125127 Honeywell International Inc.