UNITED STATES
SECURITIES AND EXCHANGE COMMISSION
Washington, D.C. 20549
FORM 10-K
| | |
☒ | | ANNUAL REPORT PURSUANT TO SECTION 13 OR 15(d) OF THE SECURITIES EXCHANGE ACT OF 1934 |
For the fiscal year ended December 31, 20162017 |
OR |
☐ | | TRANSITION REPORT PURSUANT TO SECTION 13 OR 15(d) OF THE SECURITIES EXCHANGE ACT OF 1934 |
For the transition period from to
Commission file number: 001-9025

VISTA GOLD CORP.
(Exact Name of Registrant as Specified in its Charter)
| | |
British Columbia | | 98-0542444 |
(State or other jurisdiction of incorporation or organization) | | (I.R.S. Employer Identification No.) |
| | |
Suite 5, 7961 Shaffer Parkway | | |
Littleton, Colorado | | 80127 |
(Address of Principal Executive Offices) | | (Zip Code) |
(720) 981-1185
(Registrant’s Telephone Number, including Area Code)
SECURITIES REGISTERED PURSUANT TO SECTION 12(b) OF THE ACT:
| |
Title of Each Class | Name of Each Exchange on Which Registered |
| |
Common Shares without par value | NYSE MKTAmerican |
SECURITIES REGISTERED PURSUANT TO SECTION 12(g) OF THE ACT: None
Indicate by check mark if the registrant is a well-known seasoned issuer, as defined in Rule 405 of the Securities Act. Yes ☐No☒
Indicate by check mark if the registrant is not required to file reports pursuant to Section 13 or Section 15(d) of the Act. Yes ☐No☒
Indicate by checkmark whether the registrant (1) filed all reports required to be filed by Section 13 or 15(d) of the Securities Exchange Act of 1934 during the preceding 12 months (or for such shorter period that the registrant was required to file such reports), and (2) has been subject to such filing requirements for the past 90 days. Yes ☒No ☐
Indicate by check mark whether the Registrant has submitted electronically and posted on its corporate Web site, if any, every Interactive Data File required to be submitted and posted pursuant to Rule 405 of Regulation S-T (§ 229.405 of this chapter) during the preceding 12 months (or for such shorter period that the registrant was required to submit and post such files). Yes ☒No ☐
Indicate by checkmark if disclosure of delinquent filers pursuant to Item 405 of Regulation S-K is not contained herein, and will not be contained, to the best of the registrant’s knowledge, in definitive proxy or information statements incorporated by reference in Part II of this Form 10-K or any amendment to the Form 10-K. ☐
Indicate by check mark whether the registrant is a large accelerated filer, an accelerated filer, or a non-accelerated filer. See definition of “Accelerated filer and large accelerated filer” in Rule 12b-2 of the Exchange Act (Check one):
Large Accelerated Filer ☐ Accelerated Filer ☒ Non-Accelerated Filer ☐Smaller Reporting Company ☐
Indicate by check mark whether the registrant is a shell company (as defined in Rule 12b-2 of the Act). Yes ☐No☒
State the aggregate market value of the voting and non-voting common equity held by non-affiliates computed by reference to the price at which the common equity was last sold, or the average bid and asked price of such common equity, as of the last business day of the registrant’s most recently completed second fiscal quarter: $157,621,00083,654,000
The number of shares of the Registrant’s Common Stock outstanding as of February 10, 201726, 2018 was 9799,786,608,412,007.
Documents incorporated by reference: To the extent herein specifically referenced in Part III, portions of the Registrant’s Definitive Proxy Statement on Schedule 14A for the 20152018 Annual General Meeting of Shareholders are incorporated herein. See Part III.
CAUTIONARY NOTE TO U.S. INVESTORS REGARDING ESTIMATES OF MEASURED, INDICATED AND INFERRED RESOURCES AND PROVEN AND PROBABLE RESERVES
The terms “mineral reserve”, “proven mineral reserve” and “probable mineral reserve” are Canadian mining terms defined in Canadian National Instrument 43-101 – Standards of Disclosure for Mineral Projects (“NI 43-101”) and the Canadian Institute of Mining, Metallurgy and Petroleum (the “CIM”) – CIM Definition Standards on Mineral Resources and Mineral Reserves, adopted by the CIM Council, as amended (the “CIM Definition Standards”). These definitions differ from the definitions in the United States Securities and Exchange Commission (“SEC”) Industry Guide 7 (“SEC Industry Guide 7”) under the United States Securities Act of 1933, as amended (the “Securities Act”). Under SEC Industry Guide 7 standards, a “final” or “bankable” feasibility study is required to report reserves, the three-year historical average metal price is used in any reserve or cash flow analysis to designate reserves, and the primary environmental analysis or report must be filed with the appropriate governmental authority.
In addition, the terms “mineral resource”, “measured mineral resource”, “indicated mineral resource” and “inferred mineral resource” are defined in and required to be disclosed by NI 43-101; however, these terms are not defined terms under SEC Industry Guide 7 and are normally not permitted to be used in reports and registration statements filed with the SEC. Investors are cautioned not to assume that all or any part of a mineral deposit in these categories will ever be converted into reserves. “Inferred mineral resources” have a great amount of uncertainty as to their existence, and great uncertainty as to their economic, technical and legal feasibility. It cannot be assumed that all, or any part, of an inferred mineral resource will ever be upgraded to a higher category. Under Canadian rules, estimates of inferred mineral resources may not form the basis of feasibility or pre-feasibility studies, except in rare cases. Investors are cautioned not to assume that all or any part of an inferred mineral resource exists or is economically, technically or legally mineable. Disclosure of “contained ounces” in a resource is permitted disclosure under Canadian regulations; however, the SEC normally only permits issuers to report mineralization that does not constitute “reserves” by SEC standards as in place tonnage and grade without reference to unit measures.
Accordingly, information contained in this report and the documents incorporated by reference herein contain descriptions of our mineral deposits that may not be comparable to similar information made public by U.S. companies subject to the reporting and disclosure requirements under the United States federal securities laws and the rules and regulations thereunder.
The term “mineralized material” as used in this annual report on Form 10-K, although permissible under SEC Industry Guide 7, does not indicate “reserves” by SEC Industry Guide 7 standards. We cannot be certain that any part of the mineralized material will ever be confirmed or converted into SEC Industry Guide 7 compliant “reserves”. Investors are cautioned not to assume that all or any part of the mineralized material will ever be confirmed or converted into reserves or that mineralized material can be economically or legally extracted.
GLOSSARY
“acid rock drainage (ARD)” results from the interaction of meteoric water with oxidizing sulfide minerals.
“arsenopyrite” means an iron arsenic sulfide. It is the most common arsenic mineral and the primary ore of arsenic metal.
“assay” means to test ores or minerals by chemical or other methods for the purpose of determining the amount of valuable metals contained.
“automated sorting” means technology that separates “ore” and “waste” based on physical and/or chemical properties of the material being sorted.
“bedding” means the characteristic structure of sedimentary rock in which layers of different composition, grain size or arrangement are layered one on top of another in a sequence with oldest on the bottom and youngest at the top.
“bismuthinite” means a mineral consisting of bismuth sulfide; it is an ore for bismuth.
“chalcopyrite” means a brass-yellow colored sulfide of copper and iron. It is a copper mineral.
“claim” means a mining title giving its holder the right to prospect, explore for and exploit minerals within a defined area.
“clastic” refers to sedimentary rock (such as shale or siltstone) or sediment. An accumulation of transported weathered debris.
“comminution” means the process in which solid materials are broken into small fragments by crushing, grinding, and other processes.
“conglomerate” refers to clastic sedimentary rock that contains rounded particles that are greater than two millimeters in diameter. The space between the pebbles is generally filled with smaller particles and/or a chemical cement that binds the rock together.
“cut-off grade” means the grade below which mineralized material will be considered waste.
“deposit” is an informal term for an accumulation of mineralized material.
“exploration stage enterprise” refers to an issuer engaged in the search for mineral deposits (reserves) which are not in either the development or production stage, per SEC Industry Guide 7. A development stage enterprise is engaged in the preparation of an established, commercially minable deposit (reserve) which is not in the production stage. A production stage enterprise is engaged in the exploitation of commercially viable mineral deposits (reserves).
“facies” means the characteristics of a rock mass that reflects its depositional environment.
“fault” means a fracture in rock along which there has been displacement of the two sides parallel to the fracture.
“feasibility study” is a comprehensive technical and economic study of the selected development option for a mineral project that includes appropriately detailed assessments of realistically assumed mining, processing, metallurgical, economic, marketing, legal, environmental, social and governmental considerations together with any other relevant operational factors and detailed financial analysis, that are necessary to demonstrate at the time of reporting that extraction is reasonably justified or economically viable. The results of the study may reasonably serve as the basis for a final decision by a proponent or financial institution to proceed with, or finance, the development of the project. The confidence level of the study will be higher than that of a pre-feasibility study.
“felsic” is a term used to describe an igneous rock that has a large percentage of light-colored minerals such as quartz, feldspar and muscovite. Felsic rocks are generally rich in silicon and aluminum and contain only small amounts of magnesium and iron.
“ferruginous” means containing iron oxides or rust.
“foliation” means planar arrangement of structural or textural features in any rock type.
“fold” is a bend or flexure in a rock unit or series of rock units caused by crust movements.
“g Au/tonne” or “g Au/t” means grams of gold per tonne.
“galena” means a lead sulfide mineral commonly found in hydrothermal veins; it is the primary ore of lead.
“geosyncline” means a major trough or downwarp of the Earth’s crust, in which great thicknesses of sedimentary and/or volcanic rocks have accumulated.
“granitoid” means a variety of coarse grained plutonic rock similar to granite, which are composed predominantly of feldspar or quartz.
“greywackes” means fine-grained sandstone generally characterized by its hardness, dark color and poorly sorted angular grains of quarts, feldspar and small rock fragments set in a compact, clay-fine matrix.
“heap leach” means a gold extraction method that percolates a cyanide solution through ore heaped on an impermeable pad or base.
“hornfels” refers to nonfoliated metamorphic rock that is typically formed by contact metamorphism around igneous intrusions.
“indicated mineral resource” and “indicated resource” means “indicated mineral resource” as defined by the CIM in the CIM Definition Standards and is that part of a mineral resource for which quantity, grade or quality, densities, shape and physical characteristics can be estimated with sufficient confidence to allow the appropriate application of technical and economic parameters in sufficient detail to support mine planning and evaluation of the economic viability of the deposit. Geological evidence is derived from adequately detailed and reliable exploration, sampling and testing and is sufficient to assume geological and grade or quality continuity between points of observation. An indicated mineral resource has a lower level of confidence than that applying to a measured mineral resource and may only be converted to a probable mineral reserve.
“inferred mineral resource” and “inferred resource” means “inferred mineral resource” as defined by the CIM in the CIM Definition Standards and is that part of a mineral resource for which quantity and grade or quality are estimated on the basis of limited geological evidence and sampling. Geological evidence is sufficient to imply but not verify geological and grade or quality continuity. An inferred mineral resource has a lower level of confidence than that applying to an indicated mineral resource and must not be converted to a mineral reserve. It is reasonably expected that the majority of inferred mineral resources could be upgraded to indicated mineral resources with continued exploration.
“intrusion” refers to an igneous rock body that formed from magma that forced its way into, through or between subsurface rock units.
“intrusives” refers to igneous rocks that crystallize below the earth’s surface.
“ironstone” is a sedimentary rock, either deposited directly as a ferruginous sediment or created by chemical replacement, that contains a substantial proportion of an iron compound from which iron either can be or once was smelted commercially.
“joint” means a fracture in a rock along which there has been no displacement.
“measured mineral resource” means “measured mineral resource” as defined by the CIM in the CIM Definition Standards and is that part of a mineral resource for which quantity, grade or quality, densities, shape and physical characteristics are estimated with confidence sufficient to allow the application of technical and economic parameters to support detailed mine planning and final evaluation of the economic viability of the deposit. Geological evidence is derived from detailed and reliable exploration, sampling and testing and is sufficient to confirm geological and grade or quality continuity between points of observation. A measured mineral resource has a higher level of confidence than that applying to either an indicated mineral resource or an inferred mineral resource. It may be converted to a proven mineral reserve or to a probable mineral reserve.
“mica” any of a group of phyllosilicate minerals having similar chemical compositions and highly perfect basal cleavage.
“mineral reserve” means the economically mineable part of a measured mineral resource and/or indicated mineral resource. It includes diluting materials and allowances for losses, which may occur when the material is mined or
extracted and is defined by studies at pre-feasibility or feasibility level as appropriate that include application of mining,
processing, metallurgical, infrastructure, economic, marketing, legal, environmental, social, and governmental or other relevant factors. Such studies demonstrate that, at the time of reporting, extraction could reasonably be justified.
“mineral resource” means a concentration or occurrence of solid material of economic interest in or on the earth’s crust in such form, grade or quality and quantity that there are reasonable prospects for eventual economic extraction. The location, quantity, grade or quality, continuity and other geological characteristics of a mineral resource are known, estimated or interpreted from specific geological evidence and knowledge, including sampling.
“mineralization” means the concentration of valuable minerals within a body of rock.
“mineralized material” under SEC Industry Guide 7 is a mineralized body that has been delineated by appropriately spaced drilling and/or underground sampling to support a sufficient tonnage and average grade of metal(s). Such a deposit does not qualify as a reserve until a comprehensive evaluation based upon unit cost, grade, recoveries, and other material factors conclude legal and economic feasibility. Mineralized material is equivalent to measured plus indicated mineral resources but does not include inferred mineral resources.
“mudstone” is a fine grained sedimentary rock whose original constituents were clays or muds.
“ore” means material containing minerals in such quantity, grade and chemical composition that they can be economically extracted.
“oxide” means mineralized rock in which some of the original minerals have been oxidized (i.e., combined with oxygen). Oxidation tends to make the ore more porous and permits a more complete permeation of cyanide solutions so that minute particles of gold in the interior of the minerals will be more readily dissolved.
“preliminary economic assessment” and “PEA” as defined by NI 43-101 is a study, other than a pre-feasibility study or feasibility study, that includes an economic analysis of the potential viability of mineral resources.
“preliminary feasibility study”, “PFS” and “pre-feasibility study” as defined by the CIM in the CIM Definition Standards is a comprehensive study of a range of options for the technical and economic viability of a mineral project that has advanced to a stage where a preferred mining method, in the case of underground mining, or the pit configuration, in the case of an open pit, is established and an effective method of mineral processing is determined. It includes a financial analysis based on reasonable assumptions on the realistically assumed mining, processing, metallurgical, economic, marketing, legal, environmental, social and government considerations and the evaluation of any other relevant factors which are sufficient for a qualified person, acting reasonably, to determine if all or part of the mineral resource may be converted to a mineral reserve at the time of reporting. A pre-feasibility study is at a lower confidence level than a feasibility study.
“probable reserves” under SEC Industry Guide 7 means reserves for which quantity and grade and/or quality are computed from information similar to that used for proven reserves, but the sites for inspection, sampling and measurement are farther apart or are otherwise less adequately spaced. The degree of assurance, although lower than that for proven reserves, is high enough to assume continuity between points of observation.
“probable mineral reserves” as defined by the CIM in the CIM Definition Standards is the economically mineable part of an indicated and, in some circumstances, a measured mineral resource. The confidence in the mining, processing, metallurgical, economic, and other relevant factors applying to a probable mineral reserve is lower than that applying to a proven mineral reserve.
“proven reserves” under SEC Industry Guide 7 means reserves for which (a) quantity is computed from dimensions revealed in outcrops, trenches, workings or drill holes; grade and/or quality are computed from the results of detailed sampling and (b) the sites for inspection, sampling and measurement are spaced so closely and the geologic character is so well defined that size, shape, depth and mineral content of reserves are well established.
“proven mineral reserves”, as defined by the CIM in the CIM Definition Standards, is the economically mineable part of a measured mineral resource A proven mineral reserve implies a high degree of confidence in the mining, processing, metallurgical, economic and other relevant factors.
“pyrrhotite” means a bronze-colored magnetic ferrous sulfide mineral consisting of iron and sulfur.
“pyrite” means a pale brass-yellow colored iron sulfide mineral consisting of iron and sulfur.
“qualified person” as defined under NI 43-101 means an individual who (a) is an engineer or geoscientist with a university degree, or equivalent accreditation, in an area of geoscience, or engineering, relating to mineral exploration or mining; (b) has at least five years of experience in mineral exploration, mine development or operation, or mineral project assessment or any combination of these that is relevant to his or her professional degree or area of practice; (c) has experience relevant to the subject matter of the mineral project and the technical report; (d) is in good standing with a professional association; and (e) in the case of a professional association in a foreign jurisdiction, has a membership designation that (i) requires attainment of a position of responsibility in their profession that requires the exercise of independent judgment; and (ii) requires (A) a favorable, confidential peer evaluation of the individual’s character, professional judgment, expertise and ethical fitness; or (B) a recommendation for membership by at least two peers, and demonstrated prominence or expertise in the field of mineral exploration or mining. Note: a professional association is a self-regulatory organization of engineers, geoscientists or both that, among other criteria, requires compliance with the professional standards of competence and ethics established by the organization and has disciplinary powers over its members.
“recovery” means that portion of the metal contained in the ore that is successfully extracted by processing and is expressed as a percentage.
“rheology” is the study of the flow of matter, primarily as it relates to solids in suspension within liquids.
“sampling” means selecting a fractional, but representative, part of a mineral deposit for analysis.
“scats” means material in a ball mill or sag mill that has become rounded and no longer susceptible to additional size reduction. Basically, this material may be rejected from the grinding circuit for additional crushing because it contributes to higher energy consumption within the mill.
“schist” is a metamorphic rock containing abundant particles of mica, characterized by strong foliation and originating from a metamorphism in which directed pressure played a significant role.
“sediment” means solid material settled from suspension in a liquid.
“sedimentary rock” means rock formed from the accumulation and consolidation of sediment, usually in layered deposits.
“shale” is a fine grained, clastic sedimentary rock composed of mud that is a mix of flakes of clay minerals and tiny fragments (silt-sized particles) or other minerals, especially quartz and calcite.
“silicified” means to become converted into or impregnated with silica.
“siltstone” is a sedimentary rock that has a grain size in the silt range, finer than sandstone and coarser than claystones.
“sphalerite” means a zinc sulfide mineral commonly found in hydrothermal veins; it is the primary ore of zinc.
“strike” when used as a noun, means the direction, course or bearing of a vein or rock formation measured on a level surface and, when used as a verb, means to take such direction, course or bearing.
“sulfide” means a compound of sulfur and some other element. From a metallurgical perspective, sulfide rock is primary ore that has not been oxidized. Both ore and waste may contain sulfide minerals.
“tailings” means material rejected from a mill after most of the valuable minerals have been extracted.
“tonne” means a metric tonne and has the weight of 1,000 kg or 2,204.6 pounds.
“tpd” means tonnes per day.
“tuffs” are a type of rock consisting of consolidated volcanic ash ejected from vents during a volcanic eruption.
“vein” means a fissure, fault or crack in a rock filled by minerals that have traveled upwards from some deep source.
“waste” means rock lacking sufficient grade and/or other characteristics of ore.
USE OF NAMES
In this annual report on Form 10-K, unless the context otherwise requires, the terms “we”, “us”, “our”, “Vista”, “Vista Gold”, or the “Company” refer to Vista Gold Corp. and its subsidiaries.
CURRENCY
References to C$ refer to Canadian currency, AUD or A$ to Australian currency and USD or $ to United States currency. All dollars amounts are expressed in thousands of dollars except references to per ounce and per share amounts.
METRIC CONVERSION TABLE
| | | | | |
To Convert Imperial Measurement Units | | To Metric Measurement Units | | Multiply by | |
Acres | | Hectares | | 0.4047 | |
Feet | | Meters | | 0.3048 | |
Miles | | Kilometers | | 1.6093 | |
Tons (short) | | Tonnes | | 0.9071 | |
Gallons | | Liters | | 3.785 | |
Ounces (troy) | | Grams | | 31.103 | |
Ounces (troy) per ton (short) | | Grams per tonne | | 34.286 | |
NOTE REGARDING FORWARD-LOOKING STATEMENTS
This annual report, including all exhibits hereto and any documents that are incorporated by reference as set forth on the face page under “Documents incorporated by reference”, contains “forward-looking statements” within the meaning of the Private Securities Litigation Reform Act of 1995 and forward-looking information under Canadian securities laws that are intended to be covered by the safe harbor created by such legislation. All statements, other than statements of historical facts, included in this annual report on Form 10-K, our other filings with the SEC and Canadian securities commissions and in press releases and public statements by our officers or representatives that address activities, events or developments that we expect or anticipate will or may occur in the future are forward-looking statements and forward-looking information, including, but not limited to, such things as those listed below:
| · | | our belief that selective screening and rejecting sub-economic material could improve gold recoveries and lower process operating costs at Mt Todd; |
| ·
| | our expectation that we will complete additional feasibility level metallurgical studies by the third quarter of 2017;
|
| ·
| | our expectation that we will update the July 2014 Preliminary Feasibility Study integrating possible flow sheet changes following completionresults of the additional metallurgical studies;
|
| ·
| | our expectation that we will complete the first draft of the mine management plan by the third quarter of 2017;current PFS demonstrate a technically sound project with robust economics at current gold prices;
|
| · | | our plans and available funding to continue to identify and study potential Mt Todd optimizations, project improvements and efficiencies; |
| · | | our belief that we are in a position to actively pursue strategic alternatives that provide the best opportunity to maximize value for the Company; |
| · | | the feasibility of Mt Todd; |
| · | | our belief that selectively screening and rejecting sub-economic material will improve gold recoveries and lower process operating costs at Mt Todd; |
| · | | our ability to sustain fixed costs (those cash expenditures necessary to ensurebelief that we preserve our property rights and meet all of our safety, regulatory and environmental responsibilities) at $1,400 to $1,600 per quarter for several years;these design changes can be implemented without materially changing the project’s capital requirements; |
| · | | our expectation that we will complete four additional PQ core holes during the first quarter of 2018; |
| · | | our expectation that we will complete additional definition drilling at Quigleys and exploration programs on the ELs in 2018; |
| · | | our belief that our existing working capital, coupled with potential future sources of non-dilutive financing will be ablesufficient to fully fund Mt Todd toour currently planned fixed costs and discretionary programs; |
| · | | our belief that the point ofAt-the-Market program will provide additional financing flexibility at a development decision;low cost; |
| · | | the potential monetization of our non-core assets, including our mill equipment which is for sale, the Guadalupe de los Reyes gold project, and our Midas Gold Shares; |
| · | | our expectation that 2017 R&Dresearch and development grants from the Australian Government of Australia, if any, will not be material; |
| ·
| | our ability to provide sufficient additional information required to complete the Environmental Protection and Biodiversity Conservation Act 1999 authorization;a material source of near term funding;
|
| · | | estimates of future operating and financial performance; |
| · | | potential funding requirements and sources of capital, including near-term sources of additional cash; |
| · | | our expectation that the Company will continue to incur losses and will not pay dividends for the foreseeable future; |
| · | | the timing, performance and results of feasibility studies; |
| · | | our potential entry into agreements to find, lease, purchase, option or sell mineral interests; |
| · | | our plans for evaluation and advancementto advance work at Mt Todd to take advantage of Mt Todd;our strategic position; |
| · | | our expectation of Mt Todd’s impact, including environmental and economic impacts; |
| · | | plans and estimates concerning potential project exploration and development, including the use of high pressure grinding roll crushers and access to a water supply, as well as the ability to obtain all required permits; |
| · | | our belief that we are in compliance in all material respects with applicable laws and regulations including applicable mining, health, safety and environmental statutes and regulations in all of the jurisdictions in which we operate; |
| · | | our belief that we maintain reasonable amounts of insurance; |
| · | | estimates of mineral reserves and mineral resources; |
| · | | our intention to seek partners to advance the Guadalupe de los Reyes project; |
| ·
| | our intention to improve the value of our gold projects;
|
| · | | the receipt of future consideration in accordance with the contract of sale of our Long Valley claims;
|
| ·
| | potential changes in regulations or taxation initiatives; and |
| · | | our expectation that we will continue to be a passive foreign investment company (“PFIC”).; |
| · | | the potential that we may grant options and/or restricted stock unit (“RSUs”) or restricted stock awards to our directors, officers, employees and consultants; |
| · | | the potential that future expenditures may be required for compliance with various laws and regulations governing the protection of the environment; and |
| · | | the potential that development projects may lead to gold production or value adding strategic transactions; |
| · | | our belief that Minera Alamos will have no interest in the Guadalupe de los Reyes gold/silver project if the Option Agreement (defined in Item 2: Properties – Guadalupe de los Reyes Gold/Silver Project, Sinaloa, Mexico) terminates; |
| · | | our belief that we will receive any future payments and that we will be granted the Open-Pit NSR and the Underground NSR pursuant to the terms of the Option Agreement; |
| · | | our belief that if we exercise the Back-in Right we will enter into a joint venture agreement on acceptable terms, if at all; and |
| · | | preliminary estimates of the reclamation and other related costs associated with certain mining claims in British Columbia. |
Forward-looking statements and forward-looking information have been based upon our current business and operating plans, as approved by the Company’s Board of Directors (the “Board”); our cash and other funding requirements and timing and sources thereof; results of pre-feasibility and feasibility studies, mineral resource and reserve estimates, preliminary economic assessments and exploration activities; advancements of the Company’s required permitting processes; current market conditions and project development plans. The words “estimate,” “plan,” “anticipate,”
“expect, “expect,” “intend,” “believe,” “will,” “may” and similar expressions are intended to identify forward-looking statements and forward-looking information. These statements involve known and unknown risks, uncertainties, assumptions and other factors which may cause our actual results, performance or achievements to be materially different from any results, performance or achievements expressed or implied by such forward-looking statements and forward-looking information. These factors include risks such as:
| ·
| | our ability to raise additional capital or raise funds from the sale of non-core assets on favorable terms, if at all;
|
| · | | pre-feasibility and feasibility study results and preliminary assessment results and the accuracy of estimates and assumptions on which they are based; |
| · | | resource and reserve estimate results, the accuracy of such estimates and the accuracy of sampling and subsequent assays and geologic interpretations on which they are based; |
| · | | technical and operational feasibility and the economic viability of deposits; |
| · | | our ability to obtain, renew or maintain the necessary authorizations and permits for Mt Todd, including its development plans and operating activities; |
| · | | the timing and results of a feasibility study on Mt Todd; |
| · | | delays in commencement of construction at Mt Todd; |
| · | | increased costs that affect our operations or our financial condition; |
| · | | our reliance on third parties to fulfill their obligations under agreements with us; |
| · | | whether projects not managed by us will comply with our standards or meet our objectives; |
| · | | a shortage of skilled labor, equipment and supplies; |
| · | | whether our acquisition, exploration and development activities, as well as the realization of the market value of our assets, will be commercially successful and whether any transactions we enter into will maximize the realization of the market value of our assets; |
| · | | the lack of cash dividend payments by us; |
| · | | the success of future joint ventures, partnerships and other arrangements relating to our properties; |
| · | | industry consolidation which could result in the acquisition of a control position in the Company for less than fair value;
|
| ·
| | perception of potential environmental impact of Mt Todd; |
| · | | known and unknown environmental and reclamation liabilities, including reclamation requirements at Mt Todd; |
| · | | our history of losses from operations; |
| · | | future water supply issues at Mt Todd; |
| · | | litigation or other legal claims; |
| · | | lack of adequate insurance to cover potential liabilities; |
| · | | our ability to attract, retain and hire key personnel; |
| · | | fluctuations in the price of gold; |
| · | | volatility in our stock price;price and gold equities generally; |
| · | | our ability to raise additional capital or raise funds from the sale of non-core assets on favorable terms, if at all; |
| · | | industry consolidation which could result in the acquisition of a control position in the Company for less than fair value; |
| · | | inherent hazards of mining exploration, development and operating activities; |
| · | | the accuracy of calculations of mineral reserves, mineral resources and mineralized material and fluctuations therein based on metal prices, and inherent vulnerability of the ore and recoverability of metal in the mining process; |
| · | | changes in environmental regulations to which our exploration and development operations are subject; |
| · | | changes in climate change regulations could result in increased operating costs; |
| · | | intense competition in the mining industry; |
| · | | potential challenges to the title to our mineral properties; |
| · | | evolving corporate governance and public disclosure regulations; |
| · | | tax initiatives on domestic and international levels; |
| · | | fluctuation in foreign currency values; |
| · | | potential adverse findings in review of our Australian R&Dresearch and development grants; and |
| · | | our likely status as a PFIC for U.S. federal tax purposes. |
For a more detailed discussion of such risks and other important factors that could cause actual results to differ materially from those in such forward-looking statements and forward-looking information, please see “Item 1A. Risk Factors” below in this annual report on Form 10-K. Although we have attempted to identify important factors that could cause actual results to differ materially from those described in forward-looking statements and forward-looking information, there may be other factors that cause results not to be as anticipated, estimated or intended. There can be no assurance that these statements will prove to be accurate as actual results and future events could differ materially from those anticipated in the statements. Except as required by law, we assume no obligation to publicly update any forward-looking statements and forward-looking information, whether as a result of new information, future events or otherwise.
PART I
ITEM 1. BUSINESS.
Overview
Vista Gold Corp. and its subsidiaries (collectively, “Vista,” the “Company,” “we,” “our,” or “us”) are engagedoperate in the gold mining industry. We are focused on the evaluation, acquisition, exploration and advancement of gold exploration and potential development projects, which may lead to gold production or value adding strategic transactions such as earn-in right agreements, option agreements, leases to third parties, joint venture arrangements with other mining companies, or outright sales of assets for cash and/or other consideration. We look for opportunities to improve the value of our gold projects through exploration drilling and/or technical studies focused on optimizing previous engineering work. We do not currently generate cash flows from mining operations.
The Company’s flagship asset is its 100% owned Mt Todd gold project (“Mt Todd”) in the Northern Territory (“NT”) Australia, where we are seeking approval of our finalAustralia. Mt Todd is the largest undeveloped gold project in Australia. The Company recently received authorization for the last major environmental authorizationpermit and evaluating potential material process improvements in anticipation of commencingcompleted an update of our July 2014updated Preliminary Feasibility Study (“PFS”).
Ultimately, a development decision atfor Mt Todd, will depend on several factors, principally a sustainable acceptable gold price, a favorable outlook forwhich confirms the AUD:USD exchange rate, completion of a positive feasibility study and the availability of financing. With 60%-70% of the project capital and operating costs denominated in Australian dollars, the current AUD:USD exchange rate has a material favorable impact on the projectproject’s robust economics substantially mitigating the effects of the lower current USDat today’s gold price.
As one of the largest, undeveloped single-deposit gold projectsWith these important milestones complete, Vista is in Australia, we believe Mt Todd is a highlyposition to actively pursue strategic gold project with several potential paths to production. Our strong working capital position provides us flexibility and
the assurancealternatives that we can continue to fund further optimization studies at Mt Todd, and to select a development strategy that we believe will haveprovide the best potentialopportunity to maximize value for our shareholders.the Company.
Vista Gold Corp. was originally incorporated on November 28, 1983 under the name “Granges Exploration Ltd.” It amalgamated with Pecos Resources Ltd. during June 1985 and continued as Granges Exploration Ltd. In June 1989, Granges Exploration Ltd. changed its name to Granges Inc. Granges Inc. amalgamated with Hycroft Resources & Development Corporation during May 1995 and continued as Granges Inc. Effective November 1996, Da Capo Resources Ltd. and Granges, Inc. amalgamated under the name “Vista Gold Corp.” and, effective December 1997, Vista Gold continued from British Columbia to the Yukon Territory, Canada under the Business Corporations Act (Yukon Territory). On June 11, 2013, Vista Gold continued from the Yukon Territory, Canada to the Province of British Columbia, Canada under the Business Corporations Act (British Columbia). The current addresses, telephone and facsimile numbers of our offices are:
| | |
Executive Office | | Registered and Records Office |
Suite 5 - 7961 Shaffer Parkway | | 1200 Waterfront Centre – 200 Burrard Street |
Littleton, Colorado, USA 80127 | | Vancouver, British Columbia, Canada V7X 1T2 |
Telephone: (720) 981-1185 | | Telephone: (604) 687-5744 |
Facsimile: (720) 981-1186 | | Facsimile: (604) 687-1415 |
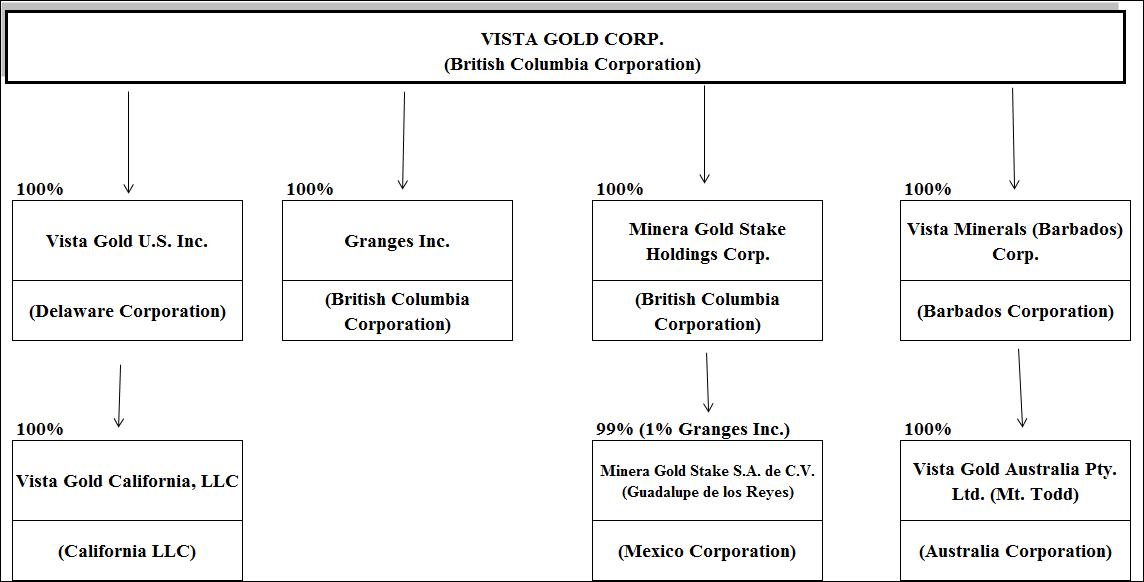
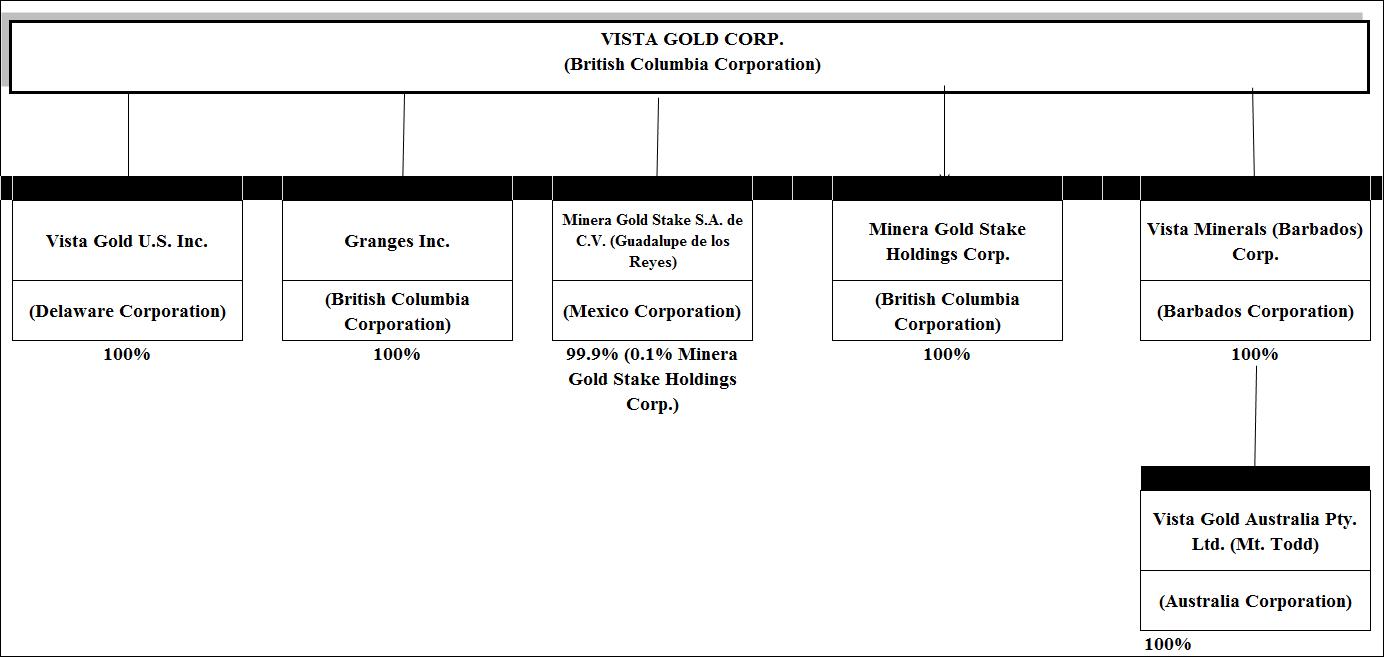
Corporate Organization Chart
The name, place of incorporation, continuance or organization and percent of equity securities that we own or control as of February 15, 201726, 2018 for each of itsour subsidiaries is set out below.
Employees
As of December 31, 2016,2017, we had 1312 full-time and no part-time employees globally. In addition, we use consultants with specific skills to assist with various aspects of our project evaluation, due diligence, corporate governance and property management.
Geographic and Segment Information
We have one reportable segment, consisting of evaluation, acquisition and exploration activities which are focused principally in Australia. We evaluate, acquire, explore and advance gold exploration and potential development projects, which may lead to gold production or value adding strategic transactions. We reported no operating revenues during the years ended December 31, 2017, 2016 2015 and 2014.2015. Geographic location of mineral properties and plant and equipment is provided in Notes 4 – Mineral Properties and 5 – Plant and Equipment to our Consolidated Financial Statements under the section heading “Item 8. Financial Statements and Supplementary Data” below.
Reclamation
We generally will be required to mitigate long-term environmental impacts by stabilizing, contouring, re-sloping and re-vegetating various portions of a site after mining and mineral processing operations are completed. These reclamation efforts would be conducted in accordance with detailed plans, which must be reviewed and approved by the appropriate regulatory agencies.
The Mt Todd site was not reclaimed when the mine closed in the late 1990’s. Liability for the reclamation of the environmental conditions existing prior to Vista’s involvement with the project remains the responsibility of the NT Government until 30 days after we have provided notice to the NT Government that we intend to take over and assume the management, operation and rehabilitation of Mt Todd. Vista willdoes not expect to give such notice until a production decision has been made, the project is fully permitted to construct the mine, andconcurrent with the necessary financing arrangements for construction has been arranged. construction.
The Province of British Columbia Ministry of Energy and Mines (“MEM”) has requested that the Company prepare and present to MEM a reclamation plan for closure and abandonment of certain mining claims in British Columbia which the Company had disposed of in 1996. Assuming no other potentially responsible parties are identified and based on preliminary estimates of the reclamation and other related costs, we have accrued $350.$242 as of December 31, 2017. It is possible that this estimate may change.
Government Regulation
Our exploration and development activities and other property interests are subject to various national, state, provincial and local laws and regulations in the United States, Mexico, Australia, and other jurisdictions, which govern prospecting, development, mining, production, exports, taxes, labor standards, occupational health, waste disposal, protection of the environment, mine safety, hazardous substances and other matters. We have obtained or have pending applications for those licenses, permits or other authorizations currently required to conduct our exploration and other programs. We believe that we are in compliance in all material respects with applicable mining, health, safety and environmental statutes and regulations in all of the jurisdictions in which we operate. With the exception of the British Columbia claims noted above, management of the Company is not aware of any current orders or directions relating to us with respect to the foregoing laws and regulations.
Australia Laws
Mineral projects in the Northern TerritoryNT are subject to Australian federal and Northern TerritoryNT laws and regulations regarding environmental matters and the discharge of hazardous wastes and materials. As with all mining projects, Mt Todd would be expected to have a variety of environmental impacts should development proceed. We are required under Australian laws and regulations (federal, state and territorial) to acquire permits and other authorizations before Mt Todd can be developed and mined. In Australia, environmental legislation plays a significant role in the mining industry. Various environmental documents, such as the Mt Todd EIS,Environmental Impact Statement (“EIS”), covering studies on inter alia, air, water, pollution, hazardous and toxic wastes, reclamation of mining area, etc., are required for approval by the Northern Territory Minister for Mines & Energy and Environment and the Australian Government Minister For Sustainability, Environment, Water, Population and Communities for approval.Communities. During September 2014, the EIS for Mt Todd was approved. The Environmental Protection Agency of the Northern Territory Government (“NTEPA”) advised that it had assessed the environmental impacts of the Mt Todd gold mine and concluded that Mt Todd can proceed, subject to a number of recommendations which are outlined in the assessment report, particularly, a request for authorization under the federal Environmental
Protection and Biodiversity Conservation Act 1999 (“EPBC”) as it relates to the Gouldian Finch. In January 2018, the authorization under the EPBC was approved by the Australia Department of the Environment and Energy. We must comply with the terms of our Authority Certificate under the Northern Territory Aboriginal Sacred Sites Act 1989 which deals with the handling of archeological material within sacred sites. We are also subject to statutory requirements under the Mining Management Act, which includes the requirement to complete a Mine Management Plan (“MMP”) before the start of mining operations. Preparation of theA preliminary Mt Todd MMP iswas submitted for review in progressNovember 2017.
Environmental Regulation
Our projects are subject to various federal, state and local laws and regulations governing protection of the environment. These laws are continually changing and, in general, are becoming more restrictive. Our policy is to conduct business in a way that safeguards public health and the environment. We believe that our operations are conducted in material compliance with applicable laws and regulations.
Changes to current local, state or federal laws and regulations in the jurisdictions where we operate could require additional capital expenditures and increased operating and/or reclamation costs. We are unable to predict what additional legislation, if any, might be proposed or enacted, or what additional regulatory requirements could impact the economics of our projects.
During 2016,2017, none of our project sites had any material non-compliance occurrences with any applicable environmental regulations. See “Reclamation” above.
Competition
We compete with other mining companies in connection with the acquisition, exploration, financing and development of gold properties. There is competition for the limited number of gold acquisition and exploration opportunities, some of which is with other companies having substantially greater financial resources than we have. As a result, we may have difficulty acquiring attractive gold projects at reasonable prices. We use consultants and compete with other mining companies for the man hours of consulting time required to complete our studies. We also compete with other mining companies for mining engineers, geologists and other skilled personnel in the mining industry and for exploration and development services.
Gold Price History
The price of gold is volatile and is affected by numerous factors, all of which are beyond our control, such as the sale or purchase of gold by various central banks and financial institutions, inflation, recession, fluctuation in the relative values of the U.S. dollar and foreign currencies, changes in global gold demand and political and economic conditions.
The following table presents the high, low and average afternoon fixed prices in U.S. dollars for an ounce of gold on the London Bullion Market over the past five years:
| | | | | | | | | | | | | | | | | | | | |
Year | | High | | Low | | Average | | | High | | Low | | Average | |
2012 | | $ | 1,792 | | $ | 1,540 | | $ | 1,669 | | |
2013 | | | 1,694 | | | 1,192 | | | 1,411 | | | $ | 1,694 | | $ | 1,192 | | $ | 1,411 | |
2014 | | | 1,385 | | | 1,142 | | | 1,266 | | | | 1,385 | | | 1,142 | | | 1,266 | |
2015 | | | 1,296 | | | 1,049 | | | 1,160 | | | | 1,296 | | | 1,049 | | | 1,160 | |
2016 | | | 1,366 | | | 1,077 | | | 1,251 | | | | 1,366 | | | 1,077 | | | 1,251 | |
2017 (to February 10, 2017) | | | 1,242 | | | 1,151 | | | 1,201 | | |
2017 | | | | 1,346 | | | 1,151 | | | 1,257 | |
2018 (to February 26, 2018) | | | | 1,355 | | | 1,311 | | | 1,332 | |
Data Source: www.kitco.com
Available Information
We make available, free of charge, on or through our Internet website, at www.vistagold.com, our annual report on Form 10-K, our quarterly reports on Form 10-Q and our current reports on Form 8-K and amendments to those reports
filed or furnished pursuant to Section 13(a) or 15(d) of the U.S. Securities Exchange Act of 1934. Our Internet website and the information contained therein or connected thereto are not intended to be, and are not, incorporated into this annual report on Form 10-K.
ITEM 1A. RISK FACTORS.
An investment in our securities involves a high degree of risk. The risks described below are not the only ones facing the Company or otherwise associated with an investment in our securities. Additional risks not presently known to us or which we currently consider immaterial may also adversely affect our business. If any of the following risks actually occur, our business, financial condition and operating results could be materially adversely affected.
Operating Risks
We cannot be assured that Mt Todd is feasible or that a feasibility study will accurately forecast operating results.
Mt Todd is our principal asset. Our future profitability depends largely on the economic feasibility of the project. Before arranging financing for Mt Todd, we will have to complete a feasibility study. There can be no assurance that the results of the feasibility study will be positive or that such study will be completed when expected. If the Mt Todd feasibility study is favorable,mining and if the project can be financed, there is no assurance that actualcomminution processes including ore sorting, gold production rates, revenues,revenue, capital and operating costs at Mt Todd
including taxes and royalties will not vary unfavorably from the estimates and assumptions included in the feasibility study.
Mt Todd requires substantial capital investment and we may be unable to raise sufficient capital on favorable terms or at all.
The construction and operation of Mt Todd will require significant capital. Our ability to raise sufficient capital will depend on several factors, including a favorable feasibility study, acquisition of the requisite permits, macroeconomic conditions, and future gold prices. Uncontrollable factors such as lower gold prices, unanticipated operating or permitting challenges, perception of environmental impact, illiquidity in the debt markets or equity markets, could impede our ability to finance Mt Todd on acceptable terms, if at all.
If we decide to construct the mine at Mt Todd, we will be assuming certain reclamation obligations resulting in a material financial obligation.
The Mt Todd site was not reclaimed when the original mine closed. Although we are not currently responsible for the reclamation of these historical disturbances, we will accept full responsibility for them if and when we make a decision to finance and construct the mine and we provide 30 days’ notice to NT Government of our intention to take over and assume the management, operation and rehabilitation of Mt Todd. At that time, we will be required to provide a bond in a form and amount satisfactory to the NT Government (in whose jurisdiction Mt Todd is located) that would cover the prospective expense of the reclamation of the property. In addition, the regulatory authorities may increase reclamation and bonding requirements from time to time. The satisfaction of these bonding requirements and continuing or future reclamation obligations will require a significant amount of capital.
We may not be able to get the required permits to begin construction at Mt Todd in a timely manner or at all.
Any delay in acquiring the requisite permits, or failure to receive required governmental approvals could delay or prevent the start of construction of Mt Todd. If we are unable to acquire permits to mine the property, then the project cannot be developed and operated; in addition, the property will have no reserves under SEC Industry Guide 7 and NI 43-101, which would result in an impairment of the carrying value of the project.
There may be other delays in the construction of Mt Todd.
Delays in commencement of construction could result from factors such as availability and performance of engineering and construction contractors, suppliers and consultants; availability of required equipment; and availability of capital.
Any delay in the performance of any one or more of the contractors, suppliers, consultants or other persons on which we depend, or lack of availability of required equipment, or delay or failure to receive required governmental approvals, or financing could delay or prevent commencement of construction at Mt Todd. There can be no assurance of whether or when construction at Mt Todd will start or that the necessary personnel, equipment or supplies will be available to the Company if and when construction is started.
Increased costs could impede our ability to become profitable.
Costs at any particular mining location frequently are subject to variation due to a number of factors, such as changing ore grade, changing metallurgy, and revisions to mine plans in response to the physical shape and location of the ore body. In addition, costs are affected by the price of commodities, fuel, electricity, operating supplies and labor. These costs are at times subject to volatile price movements, including increases that could make future production at Mt Todd less profitable or uneconomic. This could have a material adverse effect on our financial condition, cash flows and results of operations.
We cannot be assured that we will have an adequate water supply at Mt Todd.
Water at Mt Todd is expected to be provided from a fresh water reservoir which is fed by seasonal rains. Insufficient rainfall, or drought-like conditions in the area feeding the reservoir could limit or extinguish this water supply, and sufficient water resources may not be available leading to operations stopping until the water supply is replenished.
We could be subject to litigation, allegations or other legal claims.
Our assets or our business activities may be subject to disputes that may result in litigation or other legal claims. We may be subject to allegations through press, social media or other mediums that may or may not be founded. We may be required to respond to or defend against these claims and/or allegations which will divert resources away from our principal business. There can be no assurance that our defense of such claims and/or allegations would be successful, and we may be required to make material settlements. This could have a material adverse effect on our financial condition and cash flows, results of operations, and corporate reputation.
We rely on third parties to fulfill their obligations under agreements.
Our business strategy includes entering into agreements with third-parties (“Partners”) which may earn the right to obtain a majorityan interest in certain of our projects, in part by managing the respective project. Whether or not we hold a majority interest in a respective project, our Partner(s) may: (i) have economic or business interests or goals that are inconsistent with or opposed to ours; (ii) exercise veto rights to block actions that we believe to be in the best interests of the project; (iii) take action contrary to our policies or objectives; or (iv) as a result of financial or other difficulties, be unable or unwilling to fulfill their obligations under the respective joint venture, option, earn-in right or other agreement(s), such as contributing capital for the expansion or maintenance of projects. Any one or a combination of these could result in liabilities for us and/or could adversely affect the value of the related project(s) and, by association, damage our reputation and consequently our ability to acquire or advance other projects and/or attract future Partners.
Our exploration and development interests are subject to evolving environmental regulations.
Our property and royalty interests are subject to environmental regulation. Environmental legislation is becoming more restrictive in some countries or jurisdictions in a manner that will require stricter standards and enforcement, increased fines and penalties for non-compliance, more stringent environmental assessments of proposed projects and a heightened degree of responsibility for companies and their officers, directors and employees. There is no assurance that future changes in environmental regulation, if any, will not adversely affect our interests. Currently, our property and royalty interests are subject to government environmental regulations in Australia, Indonesia, Mexico and the U.S.
We could be subject to environmental lawsuits.
Neighboring landowners and other third parties could file claims based on environmental statutes and common law for personal injury and property damage allegedly caused by environmental nuisance, the release of hazardous substances or other waste material into
the environment on or around our properties. There can be no assurance that our defense of such claims would be successful. This could have a material adverse effect on our business prospects, financial condition, results of operation, and corporate reputation.
We may have material undisclosed environmental liabilities of which we are not aware.
Vista has been engaged in gold exploration since 1983. Since inception the Company has been involved in a large number of exploration projects in many different jurisdictions. There may be environmental liabilities associated with disturbances at any of these projects for which the Company may be identified as a probable responsible party, regardless of its level of involvement in creating the related disturbance. We may not be aware of such claims against the Company until regulators provide notice thereof. Consequently, we may have material undisclosed environmental responsibilities which could negatively affect our results of operations, cash flows and corporate reputation.
There may be challenges to our title to mineral properties.
There may be challenges to our title to our mineral properties. If there are title defects with respect to any of our properties, we may be required to compensate other persons or perhaps reduce our interest in the affected property. Also, in any such case, the investigation and resolution of title issues could divert Company resources from our core strategies.
Our exploration and development activities, strategic transactions, or any acquisition activities may not be commercially successful and fail to lead to gold production or fail to add value.
Substantial expenditures are required to acquire gold properties, to establish mineral reserves through drilling and analysis, to develop metallurgical processes to extract metal from the ore and to develop the mining and processing facilities and infrastructure at any site chosen for mining. We cannot be assured that any mineral reserves or mineral resources acquired, established or discovered will be in sufficient quantities to justify commercial operations, or an ability to execute a strategic transaction, or that the funds invested in them will ever be recovered.
Financial and Business Risks
A substantial or extended decline in gold prices would have a material adverse effect on the value of our assets, on our ability to raise capital and could result in lower than estimated economic returns.
The value of our assets, our ability to raise capital and our future economic returns are substantially dependent on the price of gold. The gold price fluctuates on a daily basis and is affected by numerous factors beyond our control. Factors tending to influence gold prices include:
| · | | gold sales or leasing by governments and central banks or changes in their monetary policy, including gold inventory management and reallocation of reserves; |
| · | | speculative short or long positions taken by significant investors or traders in gold;on futures markets; |
| · | | the relative strength of the U.S. dollar; |
| · | | expectations of the future rate of inflation; |
| · | | changes to economic activity in the United States, China, India and other industrialized or developing countries; |
| · | | changes in jewelry, investment or industrial demand; |
| · | | changes in supply from production, disinvestment and scrap; and |
| · | | forward sales by producers in hedging or similar transactions. |
A substantial or extended decline in the gold price could:
| · | | negatively impact our ability to raise capital on favorable terms, or at all; |
| · | | jeopardize the development of Mt Todd; |
| · | | reduce our existing estimated mineral resources and reserves by removing oresmaterial from these estimates that could not be economically processed at the lower gold price; |
| · | | reduce the potential for future revenues from gold projects in which we have an interest; |
| · | | reduce funds available to operate our business; and |
| · | | reduce the market value of our assets, including our investment in Midas Gold Shares. |
Industry consolidation could result in the acquisition of a control position in the Company for less than fair value.
Consolidation within the industry is a growing trend. As a result of the broad market and industry factors including the price of gold, we believe the current market value of our common stock does not reflect the fair value of the Company’s assets. These conditions could result in the acquisition of a control position, or attempted acquisition of a control position in the Company at what we believe to be less than fair value. This could result in substantial costs to us and
divert our management’s attention and resources. A completed acquisition could result in realized losses of shareholder value.
We have a history of losses, and we do not expect to generate earnings from operations or pay dividends in the near term.
We are an exploration stage enterprise. As such, we devote our efforts to exploration, analysis and, if warranted, development of our projects. We do not currently produce gold and do not currently generate operating earnings from gold production. We finance our business activities principally by issuing equity and/or debt, and selling non-core assets.
We have incurred losses in all periods since 1998, except for the year ended December 31, 2011, during which we recorded non-cash net gains, and the year ended December 31, 2015 during which we recorded gains related to R&D Refunds. We expect to continue to incur losses for the foreseeable future.losses. We have no history of paying cash dividends and we do not expect to be able to pay cash dividends or to make any similar distribution in the foreseeable future.
We may be unable to raise additional capital on favorable terms, if at all.
Our exploration and, if warranted, development activities and the construction and start-up of any mining operation require substantial amounts of capital. In order to develop Mt Todd, and/or to acquire attractive gold projects, we will have to raise additional funds from the sale of non-core assets and / or external sources. There can be no assurance that we will be successful in selling non-core assets or that additional financing will be available at all or on acceptable terms. If we cannot raise sufficient additional financing, we may have to substantially reduce or cease operations.
Our exploration and development activities or any acquisition activities may not be commercially successful.
Substantial expenditures are required to acquire gold properties, to establish mineral reserves through drilling and analysis, to develop metallurgical processes to extract metal from the ore and to develop the mining and processing facilities and infrastructure at any site chosen for mining. We cannot be assured that any mineral reserves or mineral resources acquired, established or discovered will be in sufficient quantities to justify commercial operations or that the funds invested in them will ever be recovered.
Our business is subject to evolving corporate governance and public disclosure regulations that have increased both our compliance costs and the risk of noncompliance.
We are subject to changing rules and regulations promulgated by a number of governmental and self-regulated organizations, including the British Columbia Securities Commission, the SEC, the TSX,Toronto Stock Exchange, the NYSE MKT,American, and the Financial Accounting Standards Board. These rules and regulations continue to evolve in scope and complexity and many new requirements have been created in response to laws enacted by the United States Congress, making compliance increasingly more difficult and uncertain, which could have an adverse effect on reputation and our stock price.
We face intense competition in the mining industry.
The mining industry is intensely competitive in all of its phases. Some of our competitors are much larger, established mining companies with greater financial and technical resources than ours. We compete with other mining companies for attractive mining claims, for capital, for equipment and supplies, for outside services and for qualified managerial and technical employees. If we are unable to raise sufficient capital, we will be unable to execute exploration and
development programs or such programs may be reduced in scope. Competition for equipment and supplies could result in shortage of necessary supplies and/or increased costs. Competition for outside services could result in increased costs, reduced quality of service and/or delays in completing services. If we cannot successfully retain or attract qualified employees, our ability to advance the development of Mt Todd, to attract necessary financing, to meet all of our environmental and regulatory responsibilities, or to take opportunities to improve our business, could be negatively affected. This could have a material adverse effect on our results of operations, cash flows, financial condition and corporate reputation.
The occurrence of events for which we are not insured may affect our cash flow and overall profitability.
We maintain insurance policies that mitigate certain risks related to our operations. This insurance is maintained in amounts that we believe to be reasonable based on the circumstances surrounding each identified risk. However, we may elect not to have insurance for certain risks because of the high premiums associated with insuring those risks or for various other reasons; in other cases, insurance may not be available for certain risks. We do not insure against political
risk. Occurrence of events for which we are not insured could result in significant losses that could materially adversely affect our financial condition and our ability to fund our business.
Our stockshare price may be volatile and your investment in our common stockshares could suffer a decline in value.
Broad market and industry factors may adversely affect the price of our common stock, regardless of our actual operating performance. Factors that could cause fluctuation in the price of our common stock may include, among other things:
| · | | changes in financial estimates by us or by any securities analysts who might cover our stock; |
| · | | stock market price and volume fluctuations of other publicly traded companies and, in particular, those that are in the mining industry; |
| · | | speculation about our business in the press or the investment community; |
| · | | conditions or trends in our industry or the economy generally; |
| · | | changes in the prices of gold; |
| · | | announcements by us or our competitors of significant acquisitions, strategic partnerships or divestitures; |
| · | | additions or departures of key personnel; and |
| · | | sales of our common stock, including sales by our directors, officers or significant stockholders. |
In the past, securities class action litigation has often been instituted against companies following periods of volatility in their stock price. This type of litigation could result in substantial costs to us and divert our management’s attention and resources.
Currency fluctuations may adversely affect our costs.
We have material property interests in Australia. Most costs in Australia are incurred in the local currency. The appreciation of the Australian dollar, if any, against the U.S. dollar effectively increases our cost of doing business in Australia. This could have the effect of increasing the amount of capital required to continue to explore and develop Mt Todd, and/or reducing the pace at which it is developed.
Our Australian Research and development (“R&D”) grants are subject to review.
The Australian R&D tax incentive program, under which we have received certain grants related to qualifying R&D programs and expenditures, is a self-assessment process, and as such, the Australian Government has the right to review our qualifying programs and related expenditures for a period of four years. If such a review were to occur, and as a result of the review and failure of a related appeal a qualified program and related expenditures were disqualified, the respective R&D grant could be recalled with penalties and interest.
The Company is likely a “passive foreign investment company,” which will likely have adverse U.S. federal income tax consequences for U.S. shareholders.
U.S. shareholders of our common shares should be aware that the Company believes it was classified as a PFIC during the taxable year ended December 31, 2016,2017, and based on current business plans and financial projections, management believes there is a significant likelihood that the Company will be a PFIC during the current taxable year. If the Company is a PFIC for any year during a U.S. shareholder’s holding period, then such U.S. shareholder generally will be required to treat any gain realized upon a disposition of Common Shares, or any so-called “excess distribution” received on their Common Shares, as ordinary income, and to pay an interest charge on a portion of such gain or distributions, unless the shareholder makes a timely and effective “qualified electing fund” (“QEF Election”) or a “mark-to-market” election with respect to the Common Shares. A U.S. shareholder who makes a QEF Election generally must report on a current basis its share of the net capital gain and ordinary earnings for any year in which the Company is PFIC, whether or not the Company distributes any amounts to its shareholders. U.S. shareholders should be aware that there can be no assurance that the Company will satisfy record keeping requirements that apply to a QEF Election, or that the Company will supply U.S. shareholders with information that such U.S. shareholders require to report under the QEF Election rules, in event that the Company is a PFIC and a U.S. shareholder wishes to make a QEF Election. Thus, U.S.
shareholders may not be able to make a QEF Election with respect to their Common Shares. A U.S. shareholder who makes the mark-to-market election generally must include as ordinary income each year the excess of the fair market value of the Common Shares over the taxpayer’s basis therein. This paragraph is qualified in its entirety by the discussion below in “Item 5. Market for Registrant’s Common Equity, Related Stockholder Matters and Issuer Purchases of Equity Securities - “Certain U.S. Federal Income Tax Considerations.” Each U.S. shareholder should consult his or her own tax advisor regarding the U.S. federal, U.S. state and local, and foreign tax consequences of the PFIC rules and the acquisition, ownership, and disposition of Common Shares.
Industry Risks
Calculations of mineral reserves and mineral resources are estimates only and subject to uncertainty.
The estimating of mineral reserves and mineral resources is an imprecise process and the accuracy of such estimates is a function of the quantity and quality of available data, the assumptions used and judgments made in interpreting engineering and geological information and estimating future capital and operating costs. There is significant uncertainty in any reserve or resource estimate, and the economic results of mining an ore deposit may differ materially from the estimates.
Feasibility studies are estimates only and subject to uncertainty.
Feasibility studies are used to determine the economic viability of an ore deposit, as are pre-feasibility studies and preliminary economic assessments. Feasibility studies are the most detailed studies and reflect a higher level of confidence in the estimated production rates, and capital and operating costs. Generally accepted levels of confidence are plus or minus 15% for feasibility studies, plus or minus 25-30% for pre-feasibility studies and plus or minus 35-40% for preliminary economic assessments. These levels reflect the levels of confidence that exist at the time the study is completed. Subsequent changes to metal prices, foreign exchange rates (if applicable), reclamation requirements, operating and capital costs may differ materially from these estimates.
Mining companies are increasingly required to consider and provide benefits to the communities and countries in which they operate, and are subject to extensive environmental, health and safety laws and regulations.
As a result of public concern about the real or perceived detrimental effects of economic globalization and global climate impacts, businesses in general and the mining industry in particular, face increasing public scrutiny of their activities. These businesses are under pressure to demonstrate that as they seek to generate satisfactory returns on investment to shareholders, other stakeholders, including employees, governments, indigenous peoples, communities surrounding operations and the countries in which they operate, benefit and will continue to benefit from their commercial activities. The potential consequences of these pressures include reputational damage, legal suits, increased costs, increased social investment obligations, difficulty in acquiring permits, and increased taxes and royalties payable to governments and communities.
Mining exploration, development and operating activities are inherently hazardous.
Mineral exploration involves many risks that even a combination of experience, knowledge and careful evaluation may not be able to overcome. Operations in which we have direct or indirect interests will be subject to all the hazards and risks normally incidental to exploration, development and production of gold and other metals, any of which could result in work stoppages, damage to property, physical harm and possible environmental damage. The nature of these risks is such that liabilities might exceed any liability insurance policy limits. It is also possible that the liabilities and hazards might not be insurable, or, we could elect not to be insured against such liabilities due to high premium costs or other reasons, in which event, we could incur significant costs that could have a material adverse effect on our financial condition.
Regulations and pending legislation involving climate change could result in increased operating costs.
Gold production is energy intensive, resulting in a significant carbon footprint. A number of governments and/or governmental bodies have introduced or are contemplating regulatory changes in response to various climate change interest groups and the potential impact of climate change. This type of legislation and possible future legislation and increased regulation regarding climate change could impose significant costs related to increased energy requirements, capital equipment, environmental monitoring and reporting and other costs to comply with such regulations.
Pending initiatives involving taxation could result in increased tax and operating costs.
There is growing attention from the media and the public on perceived international tax avoidance techniques which could result in escalating rates of poverty, inequality and unemployment in host countries. Initiatives like the Base Erosion and Profit Shifting project being led by the Organization for Economic Cooperation and Development aim to reform the system of international taxation to minimize international tax avoidance techniques. This initiative and possible future initiatives could result in increased tax expense and related compliance costs for future international mining operations.
ITEM 1B. UNRESOLVED STAFF COMMENTS.
None.
ITEM 2. PROPERTIES.
The following scientific and technical disclosures about Mt Todd have been reviewed and approved by Mr. John W. Rozelle, Senior Vice President of Vista. Mr. Rozelle is a qualified person as defined by NI 43-101.
All dollar amounts in ITEM 2. are in U.S. dollars, unless otherwise indicated
Cautionary Note to U.S. Investors: This section and other sections of this annual report on Form 10-K contain the terms “measured mineral resources,” “indicated mineral resources,” “inferred mineral resources,” “proven mineral reserves,” and “probable mineral reserves” as defined in accordance with NI 43-101. Please note the following regarding these terms:
| · | | “Measured mineral resources” and “indicated mineral resources” – weWe advise U.S. investors that although these terms are recognized and required by Canadian regulations, these terms are not defined in SEC Industry Guide 7 and the SEC does not normally permit such terms to be used in reports and registration statements filed with the SEC. U.S. investorsInvestors are cautioned not to assume that any part or all of the mineral deposits in these categories will ever be converted into reserves. |
| · | | “Inferred mineral resources” – weWe advise U.S. investors that although this term is recognized by Canadian regulations, the SEC does not recognize it. “Inferred mineral resources” have a great amount of uncertainty as to their existence, and great uncertainty as to their economic, technical and legal feasibility. It cannot be assumed that all or any part of an inferred mineral resource will ever be upgraded to a higher category. Under Canadian rules, estimates of inferred mineral resources may not form the basis of a feasibility study or pre-feasibility study, except in rare cases. The SEC normally only permits an issuer to report mineralization that does not constitute “reserves” as in-place tonnage and grade without reference to unit measures. U.S. investorsInvestors are cautioned not to assume that any part or all of an inferred mineral resource exists or is economically or legally minable. |
| · | | “Proven mineral reserves” and “probable mineral reserves” – The definitions of proven and probable mineral reserves used in NI 43-101 differ from the definitions for “proven reserves” and “probable reserves” as found in SEC Industry Guide 7. Accordingly, our disclosures of mineral reserves herein may not be comparable to information from U.S. companies subject to reporting and disclosure requirements of the SEC. |
Please see “Cautionary Note to U.S. Investors Regarding Estimates of Measured, Indicated and Inferred Resources and Proven and Probable Reserves” above for further discussion on the differences between terms under NI 43-101 and SEC Industry Guide 7.
Cautionary Note To All Investors Concerning Economic Assessments That Include Mineral Resources: Mineral resources that are not mineral reserves have no demonstrated economic viability.
Units of measurement reported by the qualified person in compiling reports on a project vary by country, Imperial units for properties in the U.S. and metric units for properties outside the U.S. We use the units of measurement as reported by the qualified persons in their respective reports, regardless of property location, in order to correspond to those units as reported by the qualified persons.
Mt Todd Gold Project, Northern Territory, Australia
Property Description and LocationCurrent Technical Report
A pre-feasibility study (“PFS”) for Mt Todd pursuant to NI 43-101 was filed on SEDAR on March 2, 2018 and is entitled “NI 43-101 Technical Report - Mt Todd Gold Project - 50,000 tpd Preliminary Feasibility Study – Northern Territory, Australia” with an effective date of January 24, 2018 and an issue date of March 2, 2018 prepared by Rex Clair Bryan, Ph.D., Anthony Clark, P.E., Thomas L. Dyer, P.E., Amy L. Hudson, Ph.D., CPG, REM, Chris Johns, M.Sc., P.Eng., Benjamin S. Johnson, P.E., Deepak Malhotra, Ph.D., Zvon Ponos, BE, MIEAust, CPeng, NER, Guy Roemer, P.E., Vicki J. Scharnhorst, P.E., LEED AP, D. Erik Spiller, QP, Jessica I. Spriet, P.E., Keith Thompson, CPG, PG, each of whom is a qualified person under NI 43-101.
The following description of Mt Todd has been sourced, in part, from the PFS and readers should consult the PFS to obtain further particulars regarding Mt Todd. The PFS is available for review under our profile at www.sedar.com.
Certain capitalized terms in this section not otherwise defined have the meanings ascribed to them in the PFS.
Pre-Feasibility Study Results: Base Case and Alternate Case
The PFS evaluates two development scenarios: a 50,000 tpd project that develops more of the Mt Todd resource and generates a larger Net Present Value (“NPV”) (the “Base Case”); and a smaller and higher-grade 33,000 tpd project (the “Alternate Case”).
The Base Case (50,000 tpd) includes:
| · | | Estimated proven and probable reserves of 5.848 Moz of gold (221 Mt at 0.82 g-Au/t) at a cut-off grade of 0.40 g-Au/t(1); |
| · | | Average annual production of 381,211 ounces of gold over the mine life, including average annual production of 479,450 ounces of gold per year during the first five years of operations; |
| · | | Life of Mine (“LoM”) average cash costs of $645 per ounce, including average cash costs of $571 per ounce during the first five years of operations; |
| · | | A 13 year operating life; |
| · | | After-tax NPV5% of $679 million and internal rate of return (IRR) of 20.5% at $1,300 per ounce gold price and a USD:AUD exchange rate of 0.80, and |
| · | | Initial capital requirements of $839 million. |
The Alternate Case (33,000 tpd) includes:
| · | | Estimated proven and probable reserves of 3.557 Moz of gold (128 Mt at 0.86 g-Au/t) at a cut-off grade of 0.40 g-Au/t(1); |
| · | | Average annual production of 273,000 ounces of gold over the mine life, including average annual production of 301,778 ounces of gold per year during the first five years of operations; |
| · | | LoM average cash costs of $593 per ounce, including average cash costs of $581 per ounce during the first five years of operations; |
| · | | An 11 year operating life; |
| · | | After-tax NPV5% of $418 million and IRR of 17.8% at $1,300 per ounce gold price and USD:AUD exchange rate of $0.80, and |
| · | | Initial capital requirements of $641 million. |
| (1) | | Cautionary note to investors: Proven and probable reserves are estimated in accordance with NI 43-101 and do not constitute SEC Industry Guide 7 compliant reserves. See the section heading “Cautionary Note to United States Investors Regarding Estimates of Measured, Indicated and Inferred Resources and Proven and Probable Reserves” above. |
Base Case Presented in PFS
Highlights of the PFS Base Case are presented in the table below:
| | | | | | | | | | |
@ $1,300/oz Au | | Years 1-5 | | Life of Mine (13 years) | |
Average Milled Grade (g Au/t) | | | 0.98 | | | | | 0.82 | | |
Payable Gold Annual Average (000's ozs) | | | 479 | | | | | 382 | | |
Payable Gold Total (000's ozs) | | | 2,397 | | | | | 4,956 | | |
Gold Recovery | | | 86.4 | % | | | | 85.8 | % | |
Cash Costs ($/oz) | | $ | 571 | | | | $ | 645 | | |
Strip Ratio (waste:ore) | | | 2.8 | | | | | 2.5 | | |
Initial Capital ($ millions) | | | | | | | $ | 839 | | |
Pre-tax NPV 5% ($ millions) | | | | | | | $ | 1,178 | | |
After-tax NPV 5% ($ millions) | | | | | | | $ | 679 | | |
IRR (Pre-tax/After-tax) | | | | | | | | 27.3 / 20.5 | % | |
After-tax Payback (Production Years) | | | | | | | | 3.2 | | |
Note: Economics presented using $1,300/oz gold and a flat $0.80 USD : $1.00 AUD exchange rate and assumes deferral of certain Northern Territory tax obligations as well as realization of equipment salvage values at the end of the mine life..
The following table provides additional details of the Mt Todd’s Base Case economics at variable gold price and Australian dollar assumptions:
| | | | | | | | | | | | | | | | |
After-Tax NPV 5%, in Millions | | Gold Price per Ounce | |
ForEx USD/AUD | | $1,100 | | $1,200 | | $1,300 | | $1,400 | | $1,500 | |
$0.70 | | $ | 439 | | $ | 632 | | $ | 825 | | $ | 1,016 | | $ | 1,208 | |
$0.75 | | $ | 366 | | $ | 559 | | $ | 752 | | $ | 944 | | $ | 1,136 | |
$0.80 | | $ | 292 | | $ | 486 | | $ | 679 | | $ | 872 | | $ | 1,063 | |
$0.85 | | $ | 222 | | $ | 412 | | $ | 606 | | $ | 799 | | $ | 991 | |
$0.90 | | $ | 150 | | $ | 339 | | $ | 532 | | $ | 726 | | $ | 918 | |
Base Case key capital expenditures for initial and sustaining capital requirements are identified in the following table:
| | | | | | | |
Capital Expenditures ($ Millions, except per ounce amount) | | Initial | | Sustaining | |
| | Capital | | Capital | |
Mining | | $ | 144 | | $ | 385 | |
Process Plant | | | 341 | | | 23 | |
Project Services | | | 118 | | | 83 | |
Project Infrastructure | | | 23 | | | — | |
Site Establishment & Early Works | | | 20 | | | — | |
Management, Engineering, EPCM Services | | | 86 | | | — | |
Preproduction Costs | | | 11 | | | — | |
Contingency | | | 96 | | | 3 | |
Sub-Total | | $ | 839 | | $ | 494 | |
Asset Sale and Salvage | | | — | | | (142) | |
Total Capital | | $ | 839 | | $ | 352 | |
Total Capital per payable ounce of gold | | $ | 169 | | $ | 71 | |
Note: Amounts may not add due to rounding. Asset sale and salvage value assumptions include end of life re-sale values for mining and processing equipment; and recycle value for steel and pipe from the process plant and other facilities. We assume the power plant will be sold as a going concern.
The Base Case project includes a 70MW gas-fired power plant in the initial capital. The project consumes all power generated during the operating life. Self-generated power creates significant savings in operating costs compared to grid-sourced power. During the four years of reclamation and closure, the PFS assumes we will continue to generate power and sell that power into the NT electrical grid, for which there is a known market; and indicative purchase rates have been provided by the government-owned utility.
The following table presents a breakdown of Base Case operating costs.
| | | | | | | | | | | | | |
Operating Cost | | First 5 Years | | Life of Mine Cost | |
| | Per tonne | | | | | Per tonne | | | | |
| | processed | | Per ounce | | processed | | Per ounce | |
Mining | | $ | 7.06 | | $ | 260.23 | | $ | 6.08 | | $ | 270.97 | |
Processing | | | 6.66 | | | 245.30 | | | 6.72 | | | 299.50 | |
Site General and Administrative | | | 1.18 | | | 43.43 | | | 1.22 | | | 54.40 | |
Jawoyn Royalty | | | 0.35 | | | 13.00 | | | 0.29 | | | 13.00 | |
Water Treatment | | | 0.07 | | | 2.74 | | | 0.09 | | | 3.58 | |
Tailings Management | | | 0.08 | | | 2.91 | | | 0.08 | | | 3.51 | |
Refining Costs | | | 0.09 | | | 3.13 | | | 0.07 | | | 3.11 | |
Power Credit | | | — | | | — | | | (0.06) | | | (2.67) | |
Total Cash Costs | | $ | 15.49 | | $ | 570.68 | | $ | 14.48 | | $ | 645.33 | |
Note: Jawoyn Royalty and Refining Costs calculated at $1,300 per ounce of gold. Amounts may not add due to rounding.
The 50,000 tpd Base Case mine plan contains 207.7 million tonnes of material mined from the Batman open pit plus 13.4 million tonnes of material from the existing heap leach pad that is processed through the mill at the end of the mine life. Together, 221.0 million tonnes of material containing 5.848 million ounces of gold at an average grade of 0.82 g Au/t are processed over the 13-year operating life. Total gold recovered is expected to be 4.956 million ounces. Average annual gold production over the life of mine is 381,211 ounces, averaging 479,450 ounces during the first five years of operations, with 582,032 ounces produced in the first year of operations. Commercial production would begin following approximately two years of construction and commissioning.
The following table highlights the Base Case production schedule:
| | | | | | | | | | | | | | | |
| | | | | | | | | | | | | | | |
| | | | | | | | | | Milled | | Contained | | Mill | |
| | Ore Mined | | Waste | | Strip Ratio | | Milled Ore | | Grade (g | | Ounces | | Production | |
Years | | (kt) | | mined (kt) | | (W:O) | | (kt) | | Au/t | | (kozs) | | (kozs) | |
(1) | | 10,437 | | 16,850 | | 1.61 | | — | | — | | — | | — | |
1 | | 13,174 | | 27,284 | | 2.07 | | 17,750 | | 1.19 | | 682 | | 582 | |
2 | | 23,679 | | 32,692 | | 1.38 | | 17,750 | | 0.83 | | 473 | | 404 | |
3 | | 20,112 | | 74,220 | | 3.69 | | 17,799 | | 0.95 | | 543 | | 463 | |
4 | | 34,149 | | 54,933 | | 1.61 | | 17,750 | | 1.00 | | 570 | | 487 | |
5 | | 10,843 | | 98,928 | | 9.12 | | 17,750 | | 0.95 | | 542 | | 462 | |
6 | | 6,427 | | 71,318 | | 11.10 | | 17,750 | | 0.56 | | 317 | | 270 | |
7 | | 10,429 | | 53,987 | | 5.18 | | 17,799 | | 0.55 | | 317 | | 270 | |
8 | | 14,965 | | 43,800 | | 2.93 | | 17,750 | | 0.61 | | 349 | | 298 | |
9 | | 22,633 | | 33,942 | | 1.50 | | 17,750 | | 0.78 | | 448 | | 382 | |
10 | | 37,943 | | 14,990 | | 0.40 | | 17,750 | | 1.24 | | 709 | | 605 | |
11 | | 2,895 | | 47 | | 0.02 | | 17,799 | | 0.84 | | 481 | | 411 | |
12 | | — | | — | | — | | 17,750 | | 0.49 | | 278 | | 224 | |
13 | | — | | — | | — | | 7,895 | | 0.54 | | 137 | | 98 | |
Total | | 207,687 | | 522,990 | | 2.52 | | 221,041 | | 0.82 | | 5,848 | | 4,956 | |
Note: Amounts may not add due to rounding. Total milled ore includes material from the heap leach pad that is processed at the end of the mine life.
Alternative Case Presented in PFS
The key differences between the Alternate Case and the Base Case include:
| · | | a 33,000 tpd processing facility as compared to a 50,000 tpd facility with associated lower mining rates and a smaller mining fleet; |
| · | | pit design based on a pit shell calculated at $800/oz-Au ($1,000/ozAu in the 50,000 tpd project); the same cut-off grade of 0.40 g-Au/t was used; and |
| · | | A shorter operating life for the 33,000 tpd Alternate Case. |
Highlights of the PFS Alternate case are presented in the table below:
| | | | | | | | | | | |
@ $1,300/oz Au | | Years 1-5 | | Life of Mine (11 years) |
Average Milled Grade (g Au/t) | | | 0.95 | | | | | | | 0.90 | |
Payable Gold Annual Average (000's ozs) | | | 302 | | | | | | | 273 | |
Payable Gold Total (000's ozs) | | | 1,509 | | | | | | | 3,003 | |
Gold Recovery | | | 86.4 | % | | | | | | 85.5 | % |
Cash Costs ($/oz) | | $ | 581 | | | | | | $ | 593 | |
Strip Ratio (waste:ore) | | | 1.7 | | | | | | | 1.7 | |
Initial Capital ($ millions) | | | | | | | | | $ | 641 | |
Pre-tax NPV 5% ($ millions) | | | | | | | | | $ | 722 | |
After-tax NPV 5% ($ millions) | | | | | | | | | $ | 418 | |
IRR (Pre-tax/After-tax) | | | | | | | | | | 23.4 / 17.8 | % |
After-tax Payback (Production Years) | | | | | | | | | | 3.6 | |
Note: Economics presented using $1,300/oz gold and a flat $0.80 USD : $1.00 AUD exchange rate and assumes deferral of certain Northern Territory tax obligations as well as realization of equipment salvage values at the end of the mine life.
The following tableprovides additional details of the Alternative Case economics at variable gold price and Australian dollar assumptions:
| | | | | | | | | | | | | | | |
After-Tax NPV 5%, in Millions | | | | | | | | | | | | | | | |
ForEx USD/AUD | | $1,100 | | $1,200 | | $1,300 | | $1,400 | | $1,500 |
$0.70 | | $ | 274 | | $ | 394 | | $ | 513 | | $ | 633 | | $ | 752 |
$0.75 | | $ | 226 | | $ | 346 | | $ | 465 | | $ | 585 | | $ | 704 |
$0.80 | | $ | 178 | | $ | 298 | | $ | 418 | | $ | 537 | | $ | 657 |
$0.85 | | $ | 132 | | $ | 250 | | $ | 370 | | $ | 490 | | $ | 609 |
$0.90 | | $ | 81 | | $ | 202 | | $ | 322 | | $ | 442 | | $ | 561 |
Alternate Case key capital expenditures for initial and sustaining capital requirement are identified in the table below:
| | | | | | | |
Capital Expenditures ($ Millions) | | Initial | | Sustaining | |
| | Capital | | Capital | |
Mining | | $ | 77 | | $ | 264 | |
Process Plant | | | 322 | | | 13 | |
Project Services | | | 104 | | | 48 | |
Project Infrastructure | | | 26 | | | — | |
Site Establishment & Early Works | | | 21 | | | — | |
Mangament, Engineering, EPCM Services | | | 82 | | | — | |
Preproduction costs | | | 10 | | | — | |
Sub-Total | | | 642 | | | 325 | |
Asset Sale and Salvage | | | — | | | (96) | |
Total Capital | | $ | 642 | | $ | 229 | |
Total Capital per payable ounce of gold | | $ | 263 | | $ | 73 | |
Note: Amounts may not add due to rounding. Asset sale and salvage value assumptions include end of life re-sale values for mining and processing equipment; and recycle value for steel and pipe from the process plant and other facilities. We assume the power plant will be sold as a going concern.
The Alternate Case project includes a 50MW gas-fired power plant in initial capital. The project consumes all power generated during the operating life. During the four years of reclamation and closure, Vista intends to generate and sell power into the NT electrical grid, for which there is a known market; and indicative purchase rates have been provided by the government-owned utility.
The followingtable presents a breakdown of Alternate Case operating costs.
| | | | | | | | | | | | | |
Operating Cost | | First 5 Years | | Life of Mine Cost | |
| | Per tonne | | | | | Per tonne | | | | |
| | processed | | Per ounce | | processed | | Per ounce | |
Mining | | $ | 5.49 | | $ | 211.74 | | $ | 4.40 | | $ | 187.57 | |
Processing | | | 7.20 | | | 277.58 | | | 7.23 | | | 308.14 | |
Site General and Administrative | | | 1.78 | | | 68.47 | | | 1.80 | | | 76.68 | |
Jawoyn Royalty | | | 0.33 | | | 13.00 | | | 0.30 | | | 13.00 | |
Water Treatment | | | 0.11 | | | 4.35 | | | 0.12 | | | 5.20 | |
Tailings Management | | | 0.08 | | | 3.20 | | | 0.09 | | | 3.90 | |
Refining Costs | | | 0.08 | | | 3.22 | | | 0.08 | | | 3.24 | |
Power Credit | | | — | | | — | | | (0.10) | | | (4.35) | |
Total Cash Costs | | $ | 15.07 | | $ | 581.42 | | $ | 13.93 | | $ | 593.38 | |
Note: Jawoyn Royalty and Refining Costs calculated at $1,300 per ounce of gold. Amounts may not add due to rounding.
The 33,000 tpd Alternate Case mine plan contains 114.7 million tonnes of material mined from the Batman open pit plus 13.4 million tonnes of material from the existing heap leach pad that is processed through the mill at the end of the mine
life. Together, 128.0 million tonnes of material containing 3.557 million ounces of gold at an average grade of 0.86 g Au/t are processed over the 11 year operating life. Total gold recovered is expected to be 3.003 million ounces. Average annual gold production over the life of mine is 273,000 ounces, averaging 301,778 ounces during the first five years of operations, with 360,501 ounces produced in the first year of operations. Commercial production would begin following two years of construction and commissioning.
The table below highlights the Alternate Case production schedule:
| | | | | | | | | | | | | | | |
| | | | | | | | | | | | Contained | | Mill | |
| | Ore Mined | | Waste | | Strip Ratio | | Milled Ore | | Milled Grade | | Ounces | | Production | |
Years | | (kt) | | mined (kt) | | (W:O) | | (kt) | | (g Au/t) | | (kozs) | | (kozs) | |
(1) | | 2,105 | | 8,484 | | 4.03 | | — | | — | | — | | — | |
1 | | 14,047 | | 10,997 | | 0.78 | | 11,747 | | 1.12 | | 423 | | 361 | |
2 | | 8,239 | | 28,696 | | 3.48 | | 11,715 | | 0.94 | | 356 | | 304 | |
3 | | 15,714 | | 25,094 | | 1.60 | | 11,715 | | 0.77 | | 291 | | 248 | |
4 | | 20,323 | | 24,118 | | 1.19 | | 11,715 | | 1.19 | | 447 | | 382 | |
5 | | 4,660 | | 35,880 | | 7.70 | | 11,747 | | 0.67 | | 253 | | 215 | |
6 | | 5,981 | | 27,234 | | 4.55 | | 11,715 | | 0.54 | | 204 | | 174 | |
7 | | 12,234 | | 20,350 | | 1.66 | | 11,715 | | 0.80 | | 304 | | 259 | |
8 | | 18,977 | | 10,953 | | 0.58 | | 11,715 | | 1.13 | | 425 | | 363 | |
9 | | 12,389 | | 1,510 | | 0.12 | | 11,747 | | 1.24 | | 467 | | 399 | |
10 | | 3,964 | | 49 | | — | | 11,715 | | 0.41 | | 200 | | 165 | |
11 | | — | | — | | — | | 10,798 | | 0.54 | | 187 | | 134 | |
Total | | 114,669 | | 193,316 | | 1.69 | | 128,044 | | 0.86 | | 3,557 | | 3,004 | |
Note: Amounts may not add due to rounding. Total milled ore includes material from the heap leach pad that is processed at the end of the mine life.
Property Description, Location and Access
In 2006, we acquired the concession rights to Mt Todd fromthrough an agreement with the Deed Administrators for Pegasus Gold Australia PtyPty. Ltd. (“Pegasus”), the NT Government and the Jawoyn Association Aboriginal Corporation (“JAAC”)., we acquired the concession rights and access to MT Todd. In 2014,2017, the related agreement was extended through the end of 2018.2023. Mt Todd was an operating mine in the late 1990’s,mid-1990s, but the project had been closed due to bankruptcy and was held by these organizations. The failure of the project was primarily a result of inefficiencies in the comminution circuit, poor gold recoveries and low gold prices. We hold Mt Todd through our wholly-owned subsidiary Vista Gold Australia Pty. Ltd. (“Vista Gold Australia”).
Mt Todd is located 56 kilometers by road northwest of Katherine, NT, Australia, and approximately 250290 kilometers southeast of Darwin. Access is by existing paved public roads and approximately four kilometers of paved private road. We control and maintain the private paved road.
Gold mineralization in the Batman deposit at the project occurs in sheeted veins within silicified greywackes/shales/siltstones. The Batman deposit strikes north-northeast and dips steeply to the east. Higher grade zones of the deposit plunge to the south. The core zone is approximately 200-250 meters wide and 1.61.5 km long, with several hanging wall structures providing additional width to the orebody. Mineralization is open at depth as well as along strike, although the intensity of mineralization weakens to the north and south along strike.
The Mt Todd Base Case (defined below) is designed to be a conventional, large open-pit mining operation that will utilize large-scale mining equipment in a drill/blast/load/haul operation. Ore is planned to be processed in a large comminution circuit consisting of a gyratory crusher, two cone crushers, two High Pressure Grinding Rollhigh pressure grinding roll (“HPGR”) crushers, followed by X-ray transmission (“XRT”) and threelaser sorting, and primary ball mills, followed by ISAMills, as discussed in greater detail below. Vista plans to recover gold in a conventional carbon-in-pulp (“CIP”) recovery circuit.
The Mt Todd site was not reclaimed when the mine closed in the late 1990’s.1990s. Liability for the reclamation of the environmental conditions existing prior to Vista’s involvement with the project remains the responsibility of the NT Government until 30 days after we have provided notice to the NT Government that we intend to take over and assume the management operation and rehabilitation of Mt Todd. Vista will not give such notice until a production decision has been made, the project is fully permitted to construct the mine, and the necessary financing for project construction has been arranged.
The area has a sub-tropical climate with a distinct wet season and dry season. The area receives most of its rainfall between the months of January and March. Temperatures are moderate, allowing for year-round mining operations. Topography is relatively flat. The tenements encompass a variety of habitats forming part of the northern Savannah woodland region, which is characterized by eucalypt woodland with tropical grass understories. Surface elevations are approximately 130 to 160 meters above sea level in the area of the previous and planned plant site and waste dump.
Total land holdings controlled by Vista Gold Australia are approximately 140,000160,000 hectares. A map showing the location of the mineral licenses (“MLs”) and exploration licenses (“ELs”) and a table with a list of MLs and ELs and the holding requirements follows.follow. All of the estimated mineral resources are located within the boundaries of the MLs and substantially all of the estimated mineral resources at Mt Todd are located in the Batman deposit.
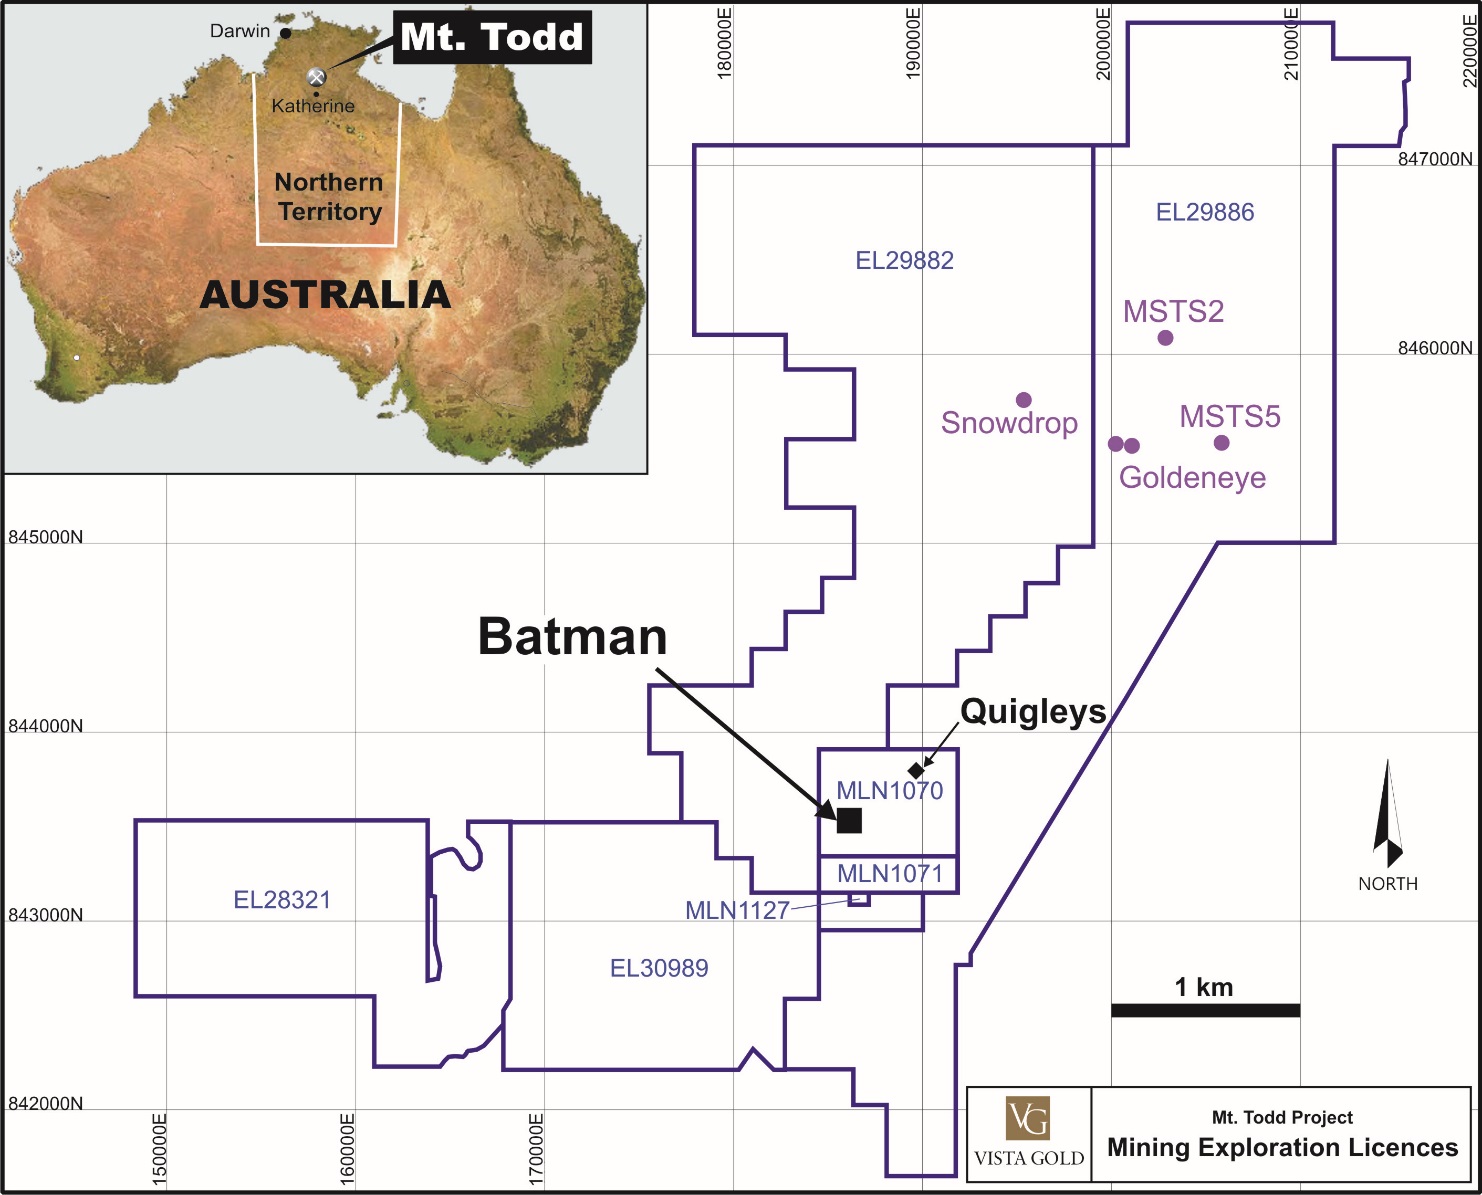
The significant risks that could affect access or title, our right to perform work, including permitting and environmental liabilities are included above in Item 1A Risk Factors.

Mt Todd Land Holdings of Vista Gold Australia
| | | | | | | | | | | | | | | | | | | | | | | | | | | | | | |
| | | | | | | | | | Estimated Holding | | | | | | | | | | | | | | | Estimated Holding | | | | | |
| | | | | | | | | | Requirements | | | | | | | | | | | | | | | Requirements | | | | | |
| | | | | | | | | | Annual Rent & | | Annual Work | | Annual | | | | | | | | | | | Annual Rent & | | Annual Work | | Annual | |
| | Surface | | Location | | | | | | Admin Fees | | Requirement | | Expenditure/ | | | Surface | | Location | | | | | | Admin Fees | | Requirement | | Expenditure/ | |
| | Area | | Description | | Location Date | | | | (thousands | | (thousands | | Technical | | | Area | | Description | | Location Date/ | | | | (thousands | | (thousands | | Technical | |
Mineral Licenses | | (Hectares) | | (UTM) | | /Grant Date | | Renewal Date | | of A$) | | of A$) | | Reports Due | | | (Hectares) | | (UTM) | |
Grant Date
| | Renewal Date | |
of A$)
| |
of A$)
| | Reports Due | |
MLN 1070 | | 3,982 | | Mining License Block | | March 5, 1993 | | March 4, 2018 | | 80 (due March 4) | | N/A | | May 3 | | | 3,982 | | Mining License Block | | March 5, 1993 | | March 4, 2018 | | 80 (due March 4) | | N/A | | May 4 | |
MLN 1071 | | 1,327 | | centered at approximately | | March 5, 1993 | | March 4, 2018 | | 27 (due March 4) | | N/A | | May 3 | | | 1,327 | | centered at | | March 5, 1993 | | March 4, 2018 | | 27 (due March 4) | | N/A | | May 4 | |
MLN 1127 | | 80 | | 188555E, 435665N | | March 5, 1993 | | March 4, 2018 | | 2 (due March 4) | | N/A | | May 3 | | | 80 | | approximately | | March 5, 1993 | | March 4, 2018 | | 2 (due March 4) | | N/A | | May 4 | |
MLN 31525 | | | 155 | | 188555E, 435665N | | September 4, 2017 | | September 3, 2042 | | 3 (due September 4) | | N/A | | May 4 | |
Subtotals | | 5,389 | | | | | | | | 109 | | 0 | | | | | 5,544 | | | | | | | | 112 | | - | | | |
| | | | | | | | | | | | | | | | | | | | | | | | | | | | | | |
| | | | | | | | | | Estimated Holding | | | | | | | | | | | | | | | Estimated Holding | | | | | |
| | | | | | | | | | Requirements | | | | | | | | | | | | | | | Requirements | | | | | |
| | | | | | | | | | Annual Rent & | | Annual Work | | Annual | | | | | | | | | | | Annual Rent & | | Annual Work | | Annual | |
| | Surface | | Location | | | | | | Admin Fees | | Requirement | | Expenditure/ | | | Surface | | Location | | | | | | Admin Fees | | Requirement | | Expenditure/ | |
| | Area | | Description | | Location Date | | | | (thousands | | (thousands | | Technical | | | Area | | Description | | Location Date/ | | | | (thousands | | (thousands | | Technical | |
Exploration Licenses | | (Square Km) | | (UTM) | | /Grant Date | | Renewal Date | | of A$) | | of A$) | | Reports Due | | | (Square Km) | | (UTM) | |
Grant Date
| | Renewal Date | |
of A$)
| |
of A$)
| | Reports Due | |
EL 28321 | | 198 | | Centered at approximately 806729E, 8429210N | | May 3, 2011 | | May 2, 2017 | | 9 (due May 2) | | 15 | | June 1, July 1 | | | 198 | | Centered at approximately 806729E, 8429210N | | May 3, 2011 | | May 2, 2019 | | 12 (due May 2) | | 25 | | May 14 | |
EL29882 | | 556 | | Centered at approximately 189100E, 84520000N | | September 16, 2013 | | September 15, 2017 | | 36 (due September 16) | | 442 | | May 14 | | | 556 | | Centered at approximately 189100E, 84520000N | | September 16, 2013 | | September 15, 2019 | | 36 (due September 16) | | 130 | | May 14 | |
EL29886 | | 596 | | Centered at approximately 200300E, 8452000N | | September 16, 2013 | | September 15, 2017 | | 41 (due September 16) | | 132 | | May 14 | | | 596 | | Centered at approximately 200300E, 8452000N | | September 16, 2013 | | September 15, 2019 | | 41 (due September 16) | | 77 | | May 14 | |
EL30898 | | 187 | | Centered at approximately 176100E, 8428700N | | May 3, 2016 | | May 2, 2022 | | 3 (due May 2) | | 18 | | June 1, July 1 | | | 187 | | Centered at approximately 176100E, 8428700N | | May 3, 2016 | | May 2, 2022 | | 3 (due May 2) | | 25 | | May 14 | |
Subtotals | | 1,537 | | | | | | | | 89 | | 607 | | | | | 1,537 | | | | | | | | 92 | | 257 | | | |
| | | | | | | | | | | | | | | | | | | | | | | | | | | | | | |
Totals A$ | | | | | | | | | | 198 | | 607 | | | | | | | | | | | | | 204 | | 257 | | | |
Totals US$ (exchange rate of A$1.00 = $0.72 on December 31, 2016 | | | | | | 143 | | 438 | | | | |
Totals US$ (exchange rate of A$1.00 = $0.78 on December 31, 2017 | | Totals US$ (exchange rate of A$1.00 = $0.78 on December 31, 2017 | | 159 | | 200 | | | | | |
The surface land in the area of the contiguous MLs and ELs (excluding EL28321)EL 28321) is freehold land owned by the JAAC. Because the JAAC have title to the land, such land is not part of the lands classified by the government as indigenous lands, and as a result such lands are not subject to an Indigenous Land Use Agreement. Vista has a private agreement with the JAAC for the use of and access to the land.
InUnder the terms of our agreement with the JAAC, we must offer the JAAC the opportunity to establish a joint venture with Vista holding 90% and the JAAC holding a 10% participating interest in Mt Todd. In addition, the JAAC will be entitled to cash payments, or payment in kind, equal to 1% of the value of the annual gold production from the current MLs, and a 1% NSR royalty on other metals, subject to a minimum payment of A$50 per year.year.
We are required annually to submit a Mine Management Plan that details work to be done on the property. We have received approval for all work done on the project to date and obtained approval for the EIS. Further permitting will be required before mine development can start. The related permitting processes are relatively straight-forward and are not
expected to impede to a material extent our exploration and future development plans. Any future mining will require an approved closure plan and sufficient surety bonding to fund that closure.
Following the bankruptcy of the previous operator, in the 1990’s, most of the processing equipment and facilities were removed from the site; but some basic infrastructure which may be of use in a future operation is still in place, including project access control point, a small shop and office, and the flotation plant building, as well as a fully functioning tailings impoundment facility that has capacity to store additional mill tailings and a fresh water storage reservoir. In addition, a medium voltage power line supplies the site with electrical power, and a natural gas pipeline, used for power generation by the former operators, is still in place. Mt Todd is located sufficiently close to the city of Katherine and the town of Pine Creek to allow for an easy commute for workers.
Because the Mt Todd site was not reclaimed when the mine closed, the dumps and heap leach pad require ongoing care and maintenance, which we provide. Precipitation on the waste dumps, low-grade ore stockpiles and scats have resulted in acid rock drainage which is controlled to the extent possiblemanaged through collection in retention ponds, storage, pH adjustment and controlled release of acidic or treated water into the Edith River when water levels wereare high enough, in accordance with the waste discharge license.Waste Discharge License.
Water TreatmentHistory
We completedThe Batman gold prospect is part of the installationPine Creek Geosyncline goldfield that was worked from early in the 20th century. Gold and tin were discovered in the Mt Todd area in 1889. Most deposits were worked in the period from 1902 to 1914. A total of 7.80 tonnes of tin concentrate was obtained from cassiterite-bearing quartz-kaolin lodes at the Morris and Shamrock mines. The Jones Brothers reef was the most extensively mined gold-bearing quartz vein, with a recorded production of 28.45 kg Au. This reef consists of a lime silosteeply dipping ferruginous quartz lode within tightly folded greywackes.
The Yinberrie Wolfram field, discovered in 1913, is located 5 km west of Mt Todd. Tungsten, molybdenum and slakerbismuth mineralization was discovered in greisenized aplite dykes and quartz veins in a small stock of the Cullen Batholith. Recorded production from numerous shallow shafts is 163 tonnes of tungsten, 130 kg of molybdenite and a small quantity of bismuth.
Exploration for water treatment in 2009. The treated water was initially storeduranium began in the existing tailings impoundment facility, but1950s. Small uranium prospects were discovered in sheared or greisenized portions of the above average rainfall experiencedCullen Batholith in the 2010-2011 wet season raisedvicinity of the levelEdith River.
Australian Ores and Minerals Limited (“AOM”) in a joint venture with Wandaroo Mining Corporation and Esso Standard Oil took out a number of watermining leases in the tailings impoundment facilityMt Todd area during 1975. Initial exploration consisted of stream sediment sampling, rock chip sampling, and geological reconnaissance for a variety of commodities. A number of geochemical anomalies were found primarily in the vicinity of old workings. Follow-up work concentrated on alluvial tin and, later, auriferous reefs. Backhoe trenching, costeaning, and ground follow-up were the favored mode of exploration. Two diamond drillholes were drilled at Quigleys. Despite determining that the gold potential of the reefs in the area was promising, AOM ceased work around Mt Todd.
The Arafura Mining Corporation, CRA Exploration, and Marriaz Pty Ltd all explored the Mt Todd area at different times between 1975 and 1983. In late 1981, CRA Exploration conducted grid surveys, geological mapping and a 14 diamond drillhole program, with an aggregate meterage of 676.5 m, to test the gold content of Quigleys Reef over a strike length of 800 m. Following this program CRA Exploration did not proceed with further exploration.
During late 1986, Pacific Gold Mines NL (“Pacific”) undertook exploration in the area which resulted in small-scale open cut mining on the suspension of water treatment. In 2011, we started pumping water fromQuigleys and Golf reefs, and limited test mining at the tailings impoundment facility into the Batman pit. Following extensive chemicalAlpha, Bravo, Charlie and ecotoxicological testwork, in 2012 we received authorization from the NT GovernmentDelta pits. Ore was transported to in situ treat the water storeda carbon-in-pulp (“CIP”) plant owned by Pacific at Moline. This continued until December 1987. Pacific ceased operations in the Batman Pit to neutralize the acidity and to precipitate the contained metals. Inarea in February 2013, we received a waste discharge license from the NT Government that authorized the release of treated water from1988. having produced approximately 86,000 tonnes grading 4 g-Au/t (historic reported production, not NI 43-101 compliant). Subsequent negotiations between the Mt Todd siteJoint Venture partners Shell Company of Australia (“Billiton”), Zapopan NL (“Zapopan”) and Pacific resulted in the acquisition of this ground and incorporation into the joint venture.
Billiton, who was the managing partner in an exploration program in the joint venture with Zapopan, discovered the Mt Todd mineralization, or more specifically the Batman deposit, in May 1988. Zapopan acquired Billiton’s interest in 1992 by way of placement of shares to Pegasus Gold Australia Pty. Ltd. (Pegasus). Pegasus progressively increased their shareholding until they acquired full ownership of Zapopan in July 1995.
Feasibility studies (not NI 43-101 compliant) for Phase I, a heap leach operation which focused predominately on the oxide portion of the deposit, commenced during 1992 culminating in an engineering, procurement, construction management (EPCM) award to Minproc in November of that year. The Phase I project was predicated upon a 4 million tonne per year (Mtpy) heap leach plant, which came on stream in late 1993. The treatment rate was subsequently expanded to a rate of 6 Mtpy on in late 1994.
Historic production is shown in the wet seasontable below:
Category | Historic Production Actual |
Tonnes Leached (million) | 13.2 |
Head Grade (g-Au/t) | 0.96 |
Recovery (%) | 53.8 |
Gold Recovered (oz) | 220,755 |
Cost/t (AUD) | 8.33 |
Cost/oz (AUD) | 500 |
NOTE: All tonnages and grades are historic production numbers that pre-date Vista’s ownership. The QPs and issuer consider historic estimates to be relevant but not current. |
Phase II involved expanding to 8 Mtpy and treatment through a flotation and carbon-in-leach (“CIL”) circuit. The feasibility study was conducted by a joint venture between Bateman Kinhill and Kilborne (BKK, 1996) and was completed in accordance with higher environmental protection standards. We have operatedJune 1995.
The Pegasus board approved the project on August 17, 1995, and awarded an EPCM contract to BKK in complianceOctober 1995. Commissioning commenced in November 1996. Final capital costs to complete the project were AUD232 million (US$181 million).
Design capacity was never achieved due to inadequacies in the crushing circuit. A throughput rate of just under 7 Mtpy was achieved by mid-1997; however, problems with the new standards. We will haveflotation circuit which resulted in reduced recoveries necessitated closure of this circuit. Subsequently, high reagent consumption, as a result of cyanide soluble copper minerals, further hindered efforts to dewater substantiallyreach design production. Operating costs were above those predicted in the entire pit before mining operations can be started.feasibility study. The spot price of gold deteriorated from above US$400 in early 1996 to below US$300 per ounce during 1997. Underperformance of the project and higher operating costs led to the mine being closed and placed on care and maintenance on November 14, 1997.
Geology,In February 1999, General Gold Resources Pty. Ltd. (“General Gold”) agreed to form a joint venture with Multiplex Resources Pty Ltd (“Multiplex”) and Pegasus to own, operate, and explore the mine. Initial equity participation in the joint venture was General Gold 2% , Multiplex 93%, and Pegasus 5%. The joint venture appointed General Gold as mine operator, which contributed the operating plan in exchange for a 50% share of the net cash flow generated by the project, after allowing for acquisition costs and environmental sinking fund contributions. General Gold operated the mine from March 1999 to July 2000. Operations ceased in July 2000, and Pegasus, through the Deed Administrators, regained possession of various parts of the mine assets in order to recoup the balance of purchase price owed to it. Most of the equipment was sold in June 2001 and removed from the mine.
In March 2006, Vista acquired the concession rights from the Deed Administrators, surface rights from the Jawoyn Association Aboriginal Corporation (“JAAC”) and entered in to a contract with the Government of the Northern Territory of Australia
Geological Setting, Mineralization, and ExplorationDeposit Type
Mt Todd is situated within the southeastern portion of the Early Proterozoic Pine Creek Geosyncline. Meta-sediments, granitoids, basic intrusives, acidic and intermediate volcanic rocks occur within this geological province. Within the Mt Todd region, the oldest outcropping rocks are assigned to the Burrell Creek Formation. These rocks consist primarily of interbedded greywackes, siltstones, and shales of turbidite affinity, which are interspersed with the minor volcanics. The Burrell Creek Formation is overlain by interbedded greywackes, mudstones, tuffs, minor conglomerates, mafic to intermediate volcanics and banded ironstone of the Tollis Formation. The Burrell Creek Formation and Tollis Formation comprise the Finniss River Group. The Finniss River Group strata have been folded about northerly trending F1 fold axes. The folds are closed to open style and have moderate westerly dipping axial planes with some sections being overturned. A later north-south compression event resulted in east-west trending open style upright D2 folds. The Finniss River Group has been regionally metamorphosed to lower green schist facies. Late and Post Orogenic granite intrusions of the Cullen Batholith occurred from 17891,789 Ma to 17301,730 Ma, and brought about local contact metamorphism to hornblende hornfels facies.
The Batman pit geology consists of a sequence of hornfelsed interbedded greywackes and shales with minor thin beds of felsic tuff. Bedding consistently strikes at 325 degrees, dipping 40 degrees to 60 degrees to the southwest. Northerly trending sheeted quartz sulfide veins and joints striking at 0 degrees to 20 degrees and dipping 60 degrees to the east are the major controls for mineralization in the Batman pit. The veins are 1 to 100 millimeters in thickness with an average thickness of around 8 to 10 millimeters and occur in sheets with up to 20 veins per horizontal meter. These sheeted veins are the main source of gold mineralization in the Batman pit. In general, the Batman pit extends 1,600 meters in length
by 1,100 meters in width and has been drill tested to a depth of 800 meters down-dip. The deposit is open along strike and at depth.
The mineralization within the Batman pit is directly related to the intensity of the north-south trending quartz sulfide veining. The lithological units impact on the orientation and intensity of mineralization. Sulfide minerals associated with the gold mineralization are pyrite, pyrrhotite and lesser amounts of chalcopyrite, bismuthinite and arsenopyrite. Galena and sphalerite are also present, but appear to be post-gold mineralization, and are related to calcite veining in the bedding plains and the east-west trending faults and joints. Two main styles of mineralization have been identified in the Batman pit. These are the north-south trending vein mineralization and bedding parallel mineralization.
Based on our review of the historic project files, we believe that approximately 21.4 million tonnes grading 1.05 grams gold per tonne and containing 723,795 ounces of gold were extracted between 1993 and the termination of mining in 2000. Processing was by a combination of heap leach production from oxide ore and cyanidation of sulfide ore. The remaining mineralization consists of sulfide mineralization lying below and along strike of the existing open pit, and in hanging wall structures parallel to the main zone in the existing open pit.
Preliminary Feasibility StudyExploration (“ELs”)
An amended and restated pre-feasibility study (“PFS”) forSince acquiring the Mt Todd pursuant to NI 43-101 was filed on SEDAR on July 9, 2014,ELs, Vista has conducted an ongoing exploration program that includes prospecting, geologic mapping, rock and is entitled “NI 43-101 Technical Report - Mt Todd 50,000 tpd Preliminary Feasibility Study – Northern Territory, Australia” withsoil sampling, geophysical surveys and exploration drilling. Equipment and personnel were mobilized from the site or from an effective date of July 7, 2014. This PFS is based on the same scientific and technical data asexploration base camp established in the May 2013 PFS.central part of the exploration licenses. The work was conducted by geologists and field technicians.
The PFS evaluates two development scenarios includingexploration effort initially focused on follow up work on targets developed by Pegasus during their tenure on the property. These included the RKD target, Tablelands, and Silver Spray. During a 50,000 tpd projectreview of Pegasus’ airborne geophysical survey data, five distinct magnetic highs were observed located within sedimentary rocks that develops moreshould have a low magnetic signature. These features are remarkably similar to those at Batman, which, as a result of the Mt Todd resource (the “Base Case”) and generatesincluded pyrrhotite, exhibits a larger Net Present Value (“NPV”) and a smaller and higher-grade 33,000 tpd project that focuses on maximizing internal ratestrong magnetic high. The geophysical targets were prioritized following review of return and operating margins (the “Alternate Case”).
Highlights of the 50,000 tpd Base Case include:
| ·
| | estimated measured and indicated mineral resource categories of 7.40 million ounces of gold (280 million tons at 0.82 g Au/t) and estimated proven and probable mineral reserves of 5.90 million ounces of gold (223 million tonnes at 0.82 g Au/t) at a cut-off grade of 0.40 g Au/t (1);
|
| ·
| | average annual production of 369,850 ounces of gold per year over the mine life, including average annual production of 481,316 ounces of gold per year during the first five years of operations;
|
| ·
| | life of mine average cash costs of $773 per ounce, including average cash costs of $662 per ounce during the first five years of operations;
|
| ·
| | a 13 year operating life;
|
| ·
| | after-tax NPV5% of $591.3 million and internal rate of return of 15.9% at $1,450 per ounce gold prices, increasing to $876.6 million and 21.1%, respectively, at $1,600 per ounce gold prices; and
|
| ·
| | initial capital requirements of $1,046 million.
|
Highlights of the 33,000 tpd Alternate Case include:
| ·
| | estimated proven and probable mineral reserves of 3.56 million ounces of gold (124 million tonnes at 0.90 g Au/t) at a cut-off grade of 0.45 g Au/t(1);
|
| ·
| | average annual production of 262,826 ounces of gold per year over the mine life, including average annual production of 294,502 ounces of gold per year during the first five years of operations;
|
| ·
| | life of mine average cash costs of $684 per ounce, including average cash costs of $676 per ounce during the first five years of operations;
|
| ·
| | an 11 year operating life;
|
| ·
| | after-tax NPV5% of $440.2 million and internal rate of return of 16.9% at $1,450 per ounce gold prices, increasing to $615.6 million and 21.4%, respectively, at $1,600 per ounce gold prices; and
|
| ·
| | Initial capital requirements of $761 million.
|
| (1)
| | Cautionary note to U.S. investors: Proven and probable reserves are estimated in accordance with NI 43-101 and do not constitute SEC Industry Guide 7 compliant reserves.See the section heading “Cautionary Note to United States Investors Regarding Estimates of Measured, Indicated and Inferred Resources and Proven and Probable Reserves” above.
|
Base Case Scenario Presented in PFS
Highlights of the PFS Base Case scenario are presented in the table below:
| | | | | | | | | | | | |
@ $1,450/oz Au | | Years 1-5 | | Life of Mine (13 years) | |
Average Milled Grade (g Au/t) | | | 1.03 | | | | | | | 0.82 | | |
Payable Gold Annual Average (000's ozs) | | | 481 | | | | | | | 370 | | |
Payable Gold Total (000's ozs) | | | 2,407 | | | | | | | 4,808 | | |
Gold Recovery | | | 82.0 | % | | | | | | 81.5 | % | |
Cash Costs ($/oz) | | $ | 662 | | | | | | $ | 773 | | |
Strip Ratio (waste:ore) | | | 2.5 | | | | | | | 2.7 | | |
Initial Capital ($ millions) | | | | | | | | | $ | 1,046 | | |
Pre-tax NPV 5% ($ millions) | | | | | | | | | $ | 1,094 | | |
After-tax NPV 5% ($ millions) | | | | | | | | | $ | 591 | | |
IRR (Pre-tax/After-tax) | | | | | | 21.8 | % | | / | 15.9 | % | |
After-tax Payback (Production Years) | | | | | | | | | | 3.5 | | |
Note: Economics presented using $1,450/oz gold and a flat $1.00 USD : $1.00 AUD exchange rate and assumes deferral of certain Northern Territory tax obligations as well as realization of equipment salvage values at the end of the mine life.
The following table provides additional details of the Mt Todd’s Base Case economics at variable gold price and Australian dollar assumptions:
| | | | | | | | | | | | | | | | | | | | | | | | | |
After-Tax NPV 5%, in Millions | | Gold Price per Ounce | |
ForEx USD/AUD | | $1,200 | | $1,300 | | $1,400 | | $1,450 | | $1,500 | | $1,600 | | $1,700 | | $1,800 | |
USD$1.10 | | $ | (51.4) | | $ | 155.9 | | $ | 352.1 | | $ | 448.4 | | $ | 543.8 | | $ | 734.5 | | $ | 924.9 | | $ | 1,114.1 | |
USD$1.00 | | $ | 108.1 | | $ | 304.5 | | $ | 496.1 | | $ | 591.3 | | $ | 686.6 | | $ | 876.6 | | $ | 1,065.6 | | $ | 1,255.1 | |
USD$0.90 | | $ | 258.5 | | $ | 448.3 | | $ | 638.8 | | $ | 733.6 | | $ | 828.3 | | $ | 1,017.2 | | $ | 1,206.5 | | $ | 1,395.9 | |
USD$0.80 | | $ | 400.6 | | $ | 591.0 | | $ | 780.0 | | $ | 874.4 | | $ | 968.9 | | $ | 1,157.9 | | $ | 1,347.2 | | $ | 1,536.1 | |
Note: Changes in Foreign Exchange rates are only applied to operating costs and not applied to either initial or sustaining capital costs.
Base Case key capital expenditures for initial and sustaining capital requirements are identified in the following table:
| | | | | | | |
Capital Expenditures ($ Millions) | | Initial | | Sustaining | |
| | Capital | | Capital | |
Capitalized Stripping & Dewatering | | $ | 57 | | $ | 40 | |
Mobile Equipment | | $ | 139 | | $ | 151 | |
Process Facility | | $ | 410 | | | — | |
Tailings | | $ | 20 | | $ | 184 | |
Power Plant | | $ | 91 | | | — | |
Water Supply & Treatment | | $ | 19 | | | — | |
Owners Cost | | $ | 203 | | $ | (10) | |
Sub-Total | | $ | 938 | | $ | 366 | |
Contingency | | $ | 107 | | $ | 23 | |
Salvage Value | | | | | $ | (124) | |
Mine Closure | | $ | 1 | | $ | 94 | |
Total Capital | | $ | 1,046 | | $ | 359 | |
Total Capital per payable ounce gold | | $ | 218 | | $ | 75 | |
Note: Amounts may not add due to rounding. The negative value in the sustaining capital category of the owners' cost line is the recapture of the cash component of the project's cash reclamation bond, which is spent as cash under the Mine Closure category.
The following table presents a breakdown of Base Case operating costs. The project includes a 76MW gas-fired power plant in the initial capital. The Base Case project consumes all power generated during the operating life. Self-generated power creates significant savings in operating costs compared to a grid-sourced power solution. During the four years of reclamation and closure, the PFS assumes we will continue to generate power and will sell that power into the NT electrical grid, for which there is a known market and indicative purchase rates have been provided by the government-owned utility.
| | | | | | | | | | | | | |
Operating Cost | | First 5 Years | | Life of Mine Cost | |
| | Per tonne | | | | | Per tonne | | | | |
| | processed | | Per ounce | | processed | | Per ounce | |
Mining | | $ | 8.18 | | $ | 302.30 | | $ | 6.95 | | $ | 321.88 | |
Processing | | $ | 8.71 | | $ | 321.47 | | $ | 8.78 | | $ | 406.86 | |
Site General and Administrative | | $ | 0.49 | | $ | 18.27 | | $ | 0.50 | | $ | 22.94 | |
Jawoyn Royalty | | $ | 0.39 | | $ | 14.50 | | $ | 0.31 | | $ | 14.50 | |
Water Treatment | | $ | 0.07 | | $ | 2.60 | | $ | 0.10 | | $ | 3.39 | |
Refining Costs | | $ | 0.09 | | $ | 3.19 | | $ | 0.07 | | $ | 3.19 | |
Power Credit | | | — | | | — | | | — | | | — | |
Total Cash Costs | | $ | 17.93 | | $ | 662.06 | | $ | 16.70 | | $ | 772.76 | |
Note: Jawoyn Royalty and Refining Costs calculated at $1,450 per ounce of gold. Amounts may not add due to rounding.
The 50,000 tpd Base Case mine plan contains 209.5 million tonnes of material mined from the Batman open pit plus 13.4 million tonnes of material from the existing heap leach pad that is processed through the mill at the end of the mine life. Together, 222.8 million tonnes of material containing 5.901 million ounces of gold at an average grade of 0.82 g Au/t are processed over the 13 year operating life. Total gold recovered is expected to be 4.808 million ounces. Average annual gold production over the life of mine is 369,850 ounces, averaging 481,316 ounces during the first five years of operations, with 580,472 ounces produced in the first year of operations. Commercial production would begin following two years of construction and commissioning.
The following table highlights the Base Case production schedule:
| | | | | | | | | | | | | | | |
| | | | | | | | | | | | | | | |
| | | | | | | | | | Milled | | Contained | | Mill | |
| | Ore Mined | | Waste | | Strip Ratio | | Milled Ore | | Grade (g | | Ounces | | Production | |
Years | | (kt) | | mined (kt) | | (W:O) | | (kt) | | Au/t | | (kozs) | | (kozs) | |
(1) | | 11,764 | | 24,761 | | 2.1 | | — | | — | | — | | — | |
1 | | 28,101 | | 33,803 | | 1.2 | | 17,799 | | 1.24 | | 708 | | 580 | |
2 | | 20,983 | | 55,290 | | 2.6 | | 17,750 | | 0.92 | | 525 | | 430 | |
3 | | 23,941 | | 78,227 | | 3.3 | | 17,750 | | 1.07 | | 613 | | 502 | |
4 | | 18,285 | | 71,608 | | 3.9 | | 17,750 | | 0.82 | | 471 | | 386 | |
5 | | 29,066 | | 58,329 | | 2.0 | | 17,799 | | 1.08 | | 620 | | 508 | |
6 | | 7,561 | | 71,279 | | 9.4 | | 17,750 | | 0.71 | | 408 | | 334 | |
7 | | 4,777 | | 54,405 | | 11.4 | | 17,750 | | 0.55 | | 312 | | 256 | |
8 | | 7,078 | | 45,482 | | 6.4 | | 17,750 | | 0.53 | | 301 | | 247 | |
9 | | 10,700 | | 38,710 | | 3.6 | | 17,799 | | 0.57 | | 325 | | 266 | |
10 | | 24,331 | | 27,864 | | 1.1 | | 17,750 | | 0.83 | | 473 | | 388 | |
11 | | 22,861 | | 2,592 | | 0.1 | | 17,750 | | 1.14 | | 653 | | 535 | |
12 | | — | | — | | — | | 17,750 | | 0.57 | | 324 | | 258 | |
13 | | — | | — | | — | | 9,659 | | 0.54 | | 168 | | 117 | |
Total | | 209,451 | | 562,349 | | 2.7 | | 222,805 | | 0.82 | | 5,901 | | 4,808 | |
Note: Amounts may not add due to rounding. Total milled ore includes material from the heap leach pad that is processed at the end of the mine life.
The table below illustrates the updated mineral reserve and resource estimate for the Project. The effectivedate of the Batman deposit mineral resource estimate is March 18, 2013. The effective date of the heap leach resource estimate is May 29, 2013.
Mt Todd Mineral Reserves, Base Case (50,000 tpd) 0.40 g Au/t cut-off. Mineral reserves calculated at $1,360 per ounce of gold
| | | | | | | | | | | | | | | | | | | | | | | | | |
| | Batman Deposit | | Heap Leach Pad | | Quigleys Deposit | | Total | |
| | Tonnes | | Grade | | Contained | | Tonnes | | Grade | | Contained | | Tonnes | | Grade | | Contained | | Tonnes | | Grade | | Contained | |
| | (000s) | | (gAu/t) | | Ounces | | (000s) | | (g Au/t) | | Ounces | | (000s) | | (g/t) | | Ounces | | (000s) | | (g Au/t) | | Ounces | |
Proven | | 72,495 | | 0.88 | | 2,057 | | — | | — | | — | | — | | — | | — | | 72,495 | | 0.88 | | 2,057 | |
Probable | | 136,955 | | 0.82 | | 3,612 | | 13,354 | | 0.54 | | 232 | | — | | — | | — | | 150,309 | | 0.80 | | 3,844 | |
Total | | 209,451 | | 0.84 | | 5,669 | | 13,354 | | 0.54 | | 232 | | — | | — | | — | | 222,805 | | 0.82 | | 5,901 | |
Mt Todd Mineral Resources Base Case (50,000 tpd)
| | | | | | | | | | | | | | | | | | | | | | | | | |
| | Batman Deposit | | Heap Leach Pad | | Quigleys Deposit | | Total | |
| | Tonnes | | Grade | | Contained | | Tonnes | | Grade | | Contained | | Tonnes | | Grade | | Contained | | Tonnes | | Grade | | Contained | |
| | (000s) | | (g Au/t) | | Ounces | | (000s) | | (g Au/t) | | Ounces | | (000s) | | (g Au/t) | | Ounces | | (000s) | | (g Au/t) | | Ounces | |
Measured | | 77,793 | | 0.88 | | 2,193 | | — | | — | | — | | 571 | | 0.98 | | 18 | | 78,364 | | 0.88 | | 2,211 | |
Indicated | | 201,792 | | 0.80 | | 5,209 | | 13,354 | | 0.54 | | 232 | | 6,868 | | 1 | | 181 | | 222,014 | | 0.79 | | 5,622 | |
Total | | 279,585 | | 0.82 | | 7,401 | | 13,354 | | 0.54 | | 232 | | 7,439 | | 0.83 | | 199 | | 300,378 | | 0.81 | | 7,832 | |
Inferred | | 72,458 | | 0.74 | | 1,729 | | — | | — | | — | | 11,767 | | 0.85 | | 320 | | 84,225 | | 0.76 | | 2,049 | |
Note: Measured and indicated resources include proven and probable reserves. Batman and Quigleys resources are estimated at a 0.40g Au/t cut-off grade. Heap leach resources are the average grade of the heap, no cut-off applied. Economic analysis conducted on proven and probable mineral reserves.
Cautionary note to U.S. investors: Proven and probable reserves are estimated in accordance with NI 43-101 and do not constitute SEC Industry Guide 7 compliant reserves see the section heading “Cautionary Note to United States Investors Regarding Estimates of Measured, Indicated and Inferred Resources and Proven and Probable Reserves” above.
Alternative Case Scenario Presented in PFS
The key differences between the Base Case and the alternative case include:
| ·
| | a 33,000 tpd processing facility versus a 50,000 tpd facility in the Base Case with associated lower mining rates and a smaller fleet; and
|
| ·
| | an ultimate pit design based on a reserve pit shell of $925/oz versus $1,360/oz in the Base Case and the application of a higher cut-off grade (0.45g Au/t versus 0.40g Au/t).
|
Highlights of the PFS alternative case scenario are presented in the table below:
| | | | | | | | | | | |
@ $1,450/oz Au | | Years 1-5 | | Life of Mine (11 years) |
Average Milled Grade (g Au/t) | | | 0.95 | | | | | | | 0.90 | |
Payable Gold Annual Average (000's ozs) | | | 295 | | | | | | | 263 | |
Payable Gold Total (000's ozs) | | | 1,473 | | | | | | | 2,891 | |
Gold Recovery | | | 82.0 | % | | | | | | 81.2 | % |
Cash Costs ($/oz) | | $ | 676 | | | | | | $ | 684 | |
Strip Ratio (waste:ore) | | | 2.1 | | | | | | | 2 | |
Initial Capital ($ millions) | | | | | | | | | $ | 761 | |
Pre-tax NPV 5% ($ millions) | | | | | | | | | $ | 777 | |
After-tax NPV 5% ($ millions) | | | | | | | | | $ | 440 | |
IRR (Pre-tax/After-tax) | | | | | | 22.1 | % | | / | 16.9 | % |
After-tax Payback (Production Years) | | | | | | | | | | 3.2 | |
Note: Economics presented using $1,450/oz gold and a flat $1.00 USD : $1.00 AUD exchange rate and assumes deferral of certain Northern Territory tax obligations as well as realization of equipment salvage values at the end of the mine life.
The following tableprovides additional details of the project’s alternative case economics at variable gold price and Australian dollar assumptions:
| | | | | | | | | | | | | | | | | | | | | | | | | |
After-Tax NPV 5%, in Millions | | Gold Price per Ounce | |
ForEx USD/AUD | | $1,200 | | $1,300 | | $1,400 | | $1,450 | | $1,500 | | $1,600 | | $1,700 | | $1,800 | |
USD$1.10 | | $ | 58.5 | | $ | 187.2 | | $ | 305.1 | | $ | 363.2 | | $ | 421.5 | | $ | 538.2 | | $ | 655.5 | | $ | 773.2 | |
USD$1.00 | | $ | 146.4 | | $ | 265.6 | | $ | 381.9 | | $ | 440.2 | | $ | 498.5 | | $ | 615.6 | | $ | 733.2 | | $ | 850.9 | |
USD$0.90 | | $ | 225.6 | | $ | 342.4 | | $ | 458.8 | | $ | 517.1 | | $ | 575.8 | | $ | 693.2 | | $ | 810.9 | | $ | 928.6 | |
USD$0.80 | | $ | 303.3 | | $ | 419.3 | | $ | 535.9 | | $ | 594.6 | | $ | 653.2 | | $ | 770.9 | | $ | 888.6 | | $ | 1,006.3 | |
Note: Changes in Foreign Exchange rates are only applied to operating costs and not applied to either initial or sustaining capital costs.
Alternate Case key capital expenditures for initial and sustaining capital requirement are identified in the table below:
| | | | | | | |
Capital Expenditures ($ Millions) | | Initial | | Sustaining | |
| | Capital | | Capital | |
Capitalized Stripping & Dewatering | | $ | 24 | | $ | 38 | |
Mobile Equipment | | $ | 77 | | $ | 73 | |
Process Facility | | $ | 310 | | | — | |
Tailings | | $ | 19 | | $ | 86 | |
Power Plant | | $ | 64 | | | — | |
Water Supply & Treatment | | $ | 11 | | | — | |
Owners Cost | | $ | 75 | | $ | (14) | |
Sub-Total | | $ | 680 | | $ | 183 | |
Contingency | | $ | 80 | | $ | 11 | |
Salvage Value | | | — | | $ | (77) | |
Mine Closure | | $ | 1 | | $ | 94 | |
Total Capital | | $ | 761 | | $ | 211 | |
Total Capital per payable ounce gold | | $ | 263 | | $ | 73 | |
Note: Amounts may not add due to rounding. The negative value in the sustaining capital category of the owners' cost line is the recapture of the cash component of the project's cash reclamation bond, which is spent as cash under the Mine Closure category.
The followingtable presents a breakdown of Alternate Case operating costs. The Alternate Case project includes a 58MW gas-fired power plant in initial capital. During the operating life, the power plant generates excess power and Vista has assumed a power credit against operating costs. Additionally, during the four years of reclamation and closure, Vista intends to generate and sell power into the NT electrical grid, for which there is a known market and indicative purchase rates have been provided by the government-owned utility.
| | | | | | | | | | | | | |
Operating Cost | | First 5 Years | | Life of Mine Cost | |
| | Per tonne | | | | | Per tonne | | | | |
| | processed | | Per ounce | | processed | | Per ounce | |
Mining | | $ | 6.55 | | $ | 260.99 | | $ | 5.49 | | $ | 234.75 | |
Processing | | | 9.37 | | | 373.32 | | | 9.51 | | | 406.86 | |
Site General and Administrative | | | 0.74 | | | 29.42 | | | 0.74 | | | 31.63 | |
Jawoyn Royalty | | | 0.36 | | | 14.5 | | | 0.34 | | | 4.5 | |
Water Treatment | | | 0.08 | | | 3.17 | | | 0.11 | | | 3.55 | |
Refining Costs | | | 0.08 | | | 3.19 | | | 0.07 | | | 3.19 | |
Power Credit | | | (0.23) | | | (15.99) | | | (0.23) | | | (10.05) | |
Total Cash Costs | | $ | 16.97 | | $ | 675.61 | | $ | 15.99 | | $ | 684.43 | |
Note: Jawoyn Royalty and Refining Costs calculated at $1,450 per ounce of gold. Amounts may not add due to rounding.
The 33,000 tpd Alternate Case mine plan contains 110.4 million tonnes of material mined from the Batman open pit plus 13.4 million tonnes of material from the existing heap leach pad that is processed through the mill at the end of the mine life. Together, 123.7 million tonnes of material containing 3.562 million ounces of gold at an average grade of 0.90 g Au/t are processed over the 11 year operating life. Total gold recovered is expected to be 2.891 million ounces. Average annual gold production over the life of mine is 262,826 ounces, averaging 294,502 ounces during the first five years of operations, with 417,166 ounces produced in the first year of operations. Commercial production would begin following two years of construction and commissioning.
The table below highlights the Alternate Case production schedule:
| | | | | | | | | | | | | | | |
| | | | | | | | | | | | Contained | | Mill | |
| | Ore Mined | | Waste | | Strip Ratio | | Milled Ore | | Milled Grade | | Ounces | | Production | |
Years | | (kt) | | mined (kt) | | (W:O) | | (kt) | | (g Au/t) | | (kozs) | | (kozs) | |
(1) | | 3,407 | | 8,483 | | 2.5 | | — | | — | | — | | — | |
1 | | 16,872 | | 23,714 | | 1.4 | | 11,747 | | 1.35 | | 509 | | 417 | |
2 | | 12,013 | | 23,611 | | 2.0 | | 11,715 | | 0.86 | | 323 | | 265 | |
3 | | 17,775 | | 22,960 | | 1.3 | | 11,715 | | 1.16 | | 438 | | 359 | |
4 | | 4,921 | | 35,191 | | 7.2 | | 11,715 | | 0.63 | | 237 | | 194 | |
5 | | 10,331 | | 24,062 | | 2.3 | | 11,747 | | 0.77 | | 289 | | 237 | |
6 | | 17,311 | | 23,934 | | 1.4 | | 11,715 | | 1.17 | | 442 | | 361 | |
7 | | 2,681 | | 31,629 | | 11.8 | | 11,715 | | 0.65 | | 245 | | 201 | |
8 | | 8,501 | | 22,889 | | 2.7 | | 11,715 | | 0.73 | | 277 | | 227 | |
9 | | 12,597 | | 6,209 | | 0.5 | | 11,747 | | 0.99 | | 375 | | 308 | |
10 | | 3,964 | | 49 | | — | | 11,715 | | 0.83 | | 314 | | 244 | |
11 | | — | | — | | — | | 6,482 | | 0.54 | | 113 | | 79 | |
Total | | 110,374 | | 222,732 | | 2.0 | | 123,728 | | 0.90 | | 3,562 | | 2,891 | |
Note: Amounts may not add due to rounding. Total milled ore includes material from the heap leach pad that is processed at the end of the mine life.
Metallurgy, Processing and Infrastructure
Our metallurgical testhistoric work programs support: (1) ore hardness estimates at the Batman deposit that are consistent and do not change at depth; (2) the selection of HPGR technology as part of the comminution circuit; (3) estimated gold recovery rates based on optimized grind size and leach conditions; and (4) the processing of material from the historic heap leach pad at the end of the proposed mine life.
Ore Hardness
Samples used for the test work program were sourced from eight holes from the Company's 2010 and 2011 drilling program that were oriented to intersect the main Batman deposit beneath the existing pit and are believed to be representative of the material within the limits of the preliminary feasibility pit.
Twenty of the samples were subjected to Bond ball mill work index (“BWi”) tests, the SMC Test (drop-weight and specific gravity tests) as well as Compressive Strength Tests and Crushing Work Index tests. The results of the BWi tests show an average BWi value of 25 kWh/t with a maximum value of 28.2 kWh/t and a minimum value of 23.6 kWh/t.
The results of this test work support two main conclusions: (1) that the hardness of ore at the Batman deposit is relatively constant; and (2) that ore at the Batman deposit does not change at depth.
This test work validates the Company’s prior test work and supports Vista's comminution circuit design, which is designed to crush and grind material with an average BWi of 26.2 kWh/t, a 5% factor of safety above the average BWi and closer to the 75th percentile of BWi test results.
HPGR Selection
The proposed Base Case comminution circuit incorporates the use of a large gyratory crusher and two large cone crushers for the primary and secondary stages, respectively, and contemplates the use of two HPGRs as the third-stage of the crushing circuit. Much of our test work has focused on evaluating and confirming the use of HPGRs.
Initially, we ran a series of parallel tests comparing a semi-autogenous grinding (“SAG”)/ball mill circuit with an HPGR crushing and ball mill circuit. Based on the test work completed, HPGR technology was selected. Industry experience
has shown HPGRs to produce micro-fracturing in particles that reduce the overall particle strength and generate a greater distribution of fine material in the ball mill feed, reducing downstream ball mill energy requirements. The material at the Batman deposit consists of silicified greywackes/shales/siltstones and test work has shown the HPGRs tend to fracture material at the Batman deposit along the bedding planes more than micro-fracturing. The result, however, is consistent with other industry HPGR applications in that the HPGR product produces a lower BWi feed for the ball mills. The test results indicate the SAG mill circuit produced a product with an average BWi of 26.4 kWh/t compared to the HPGR crushed product with an average BWi of 24.8 kWh/t, a reduction of over 6%.
Additionally, material crushed in the HPGR test resulted in approximately 10% of the HPGR product being fine enough to by-pass the ball mills entirely and proceed straight to the leach circuit. Vista has incorporated this HPGR advantage in its comminution circuit design.
The test work also assessed the difference in power requirements between a primary/SAG/ball mill circuit, a conventional 3-stage crush/ball mill circuit, and a 3-stage HPGR/ball mill circuit to generate a P80 passing 90 μm product. The assessment concluded that the 3-stage HPGR/ball mill circuit has a significantly lower specific energy requirement than the primary/SAG/ball mill option and that a finer grind size can be achieved with the HPGR crushed material compared to conventionally crushed material ground for the same period of time.
This test work also confirms our prior test work and supports our comminution circuit design. The use of HPGRs is anticipated to (a) produce a product that can be ground more efficiently (lower BWi) in the ball mills; and (b) reduce energy requirements when compared to a SAG mill design.
Gold Recoveries
Our focus was to solve the high reagent consumption, poor gold recovery and copper leaching issues encountered by previous operators. Historic core samples indicated the presence of cyanide soluble secondary copper mineralization (chalcocite and bornite) in material at the Batman deposit, and as such, our initial focus was to develop a flowsheet that incorporated the production of a copper concentrate.
However, our drill programs from 2007–2012 indicated a significant change in the mineralogy of material in the Batman deposit with depth, with copper mineralogy changing from cyanide soluble secondary copper to non-cyanide soluble primary copper mineralization (chalcopyrite). The change in mineralogy occurs at approximately 40 meters below the existing surface and the majority of the ore containing cyanide soluble secondary copper was mined by previous operators. As a result, more than 96% of material at the Batman deposit contains low-to-non-cyanide soluble primary copper mineralization. Therefore, our recovery circuit has been simplified and focuses only on recovering gold from material at the Batman deposit through a conventional CIP circuit.
The remainder of our test work relating to gold recovery focused on optimal grind size, pre-conditioning of ore with lime (to reduce cyanide consumption), the identification of a reagent to suppress copper leaching (lead nitrate was selected), and optimal cyanide concentration.
After determining the optimal leach conditions, 99 samples covering a range of head grades from throughout the Batman deposit were subjected to leach tests resulting in gold extraction between 75% and 85%, with an average of 81.7%, net of solution losses. Cyanide consumption was estimated at 0.77kg/t and lime consumption was estimated at 0.91kg/t.
This test work validates our prior recovery estimates (82%), indicates minimal gold recovery variability throughout the Batman deposit, and supports Vista's recovery plant design utilizing a conventional, industry-proven, CIP circuit.
Existing Heap Leach Pad
In addition to analysis of freshly-mined material from the Batman deposit, Vista has analyzed the potential to process nearly 13.4 million tonnes of material on the existing heap leach pad at Mt Todd. The original Mt Todd started as a heap leach operation with historic records indicating that the average grade of material placed on the pad was 0.96 g
Au/t. Although the material was partially leached in the mid-1990s, Vista has drilled 24 air-rotary holes into the heap leach padarea and assayed 361 samples, and created a 3D resource model that has an average grade of 0.54 g Au/t.
Initial evaluation efforts focused on re-starting the heap leach pad. Bottle roll and column tests were completed, both of which supported the leachabilitysite visits. To date, two of the material with gold recovery rates around 35%. However, poor in situ permeability rates caused Vista to ultimately abandon plans to re-start the heap.
We subsequently submitted two heap leach variability compositesgeophysical targets, Golden Eye and two drill hole composites from the leach pad for CIP cyanidation leach test work. The samples were ground to the size of 80% passing (P80) passing 90 μmSnowdrop, have been drilled and pre-treated with lime and 100g/t of lead nitrate to suppress copper leaching. The material was then leached for 24 hours. These results support recovery rates of 70% for this material when processed through the CIP plant.a third, Black Hill, has been covered by soil sampling.
The PFS assumes that the existing heap leach pad will be left in place and processed through the mill at the end of mine life. This ultimately reduces the scope of related reclamation by limiting the scope of reclamation to the pad liner only.Wandie target has a different magnetic signature. Field examination identified small scale pits on an iron-rich outcropping.
InfrastructureThere are no reportable resources and reserves on the ELs. Once a reportable discovery is made, Vista will disclose all applicable exploration works that supports the discovery. No data from the ELs are used in the development of the PFS results.
Because Mt Todd was an operating mine, infrastructure exists that reduces initial capital expenditure and significantly reduces capital risk related to infrastructure construction, which has been a major source of capital overruns in the mining industry over the last decade. Existing mining infrastructure items include:
Exploration Sampling summary:
| ·
| | an existing tailings storage facility that is expected to contain the initial 62 million tonnes of material processed with two operating raises of the embankment;
|
| ·
| | an existing fresh water storage reservoir that will receive a two-meter dam raise and will harvest stormwater sufficient to provide process water for year-round operations for a 50,000 tpd operation;
|
| ·
| | a natural gas pipeline at site that can supply sufficient natural gas to meet the project's energy requirements which, coupled with the planned power generating plant, would save considerably on project operating costs compared to grid-supplied power;
|
| ·
| | current electrical connection to the NT electric grid; and
|
| ·
| | reduced earthworks costs due to the process plant location being the same as the previous process plant, which has already been cleared and graded.
|
| | |
Year | Soils | Rock Chips |
2008 | 0 | 164 |
2009 | 0 | 45 |
2010 | 3,135 | 224 |
2011 | 1,925 | 79 |
2012 | 2,312 | 295 |
2013 | 572 | 51 |
2014 | 2601 | 143 |
2015 | 841 | 53 |
2016 | 241 | 27 |
2017 | 1098 | 78 |
Total Samples | 10,498 | 949 |
Other benefits of Mt Todd’s NT location include:
| ·
| | the Stuart highway – the main North / South highway in the NT is less than 15km from the project site;
|
| ·
| | rail line parallel to the Stuart highway; and
|
| ·
| | the regional center of Katherine (population approximately 12,000) less than 60 km from site and the NT capital of Darwin less than 300 km from the project site, which has port access.
|
Permitting
In June 2013, we completed and submitted an initial EIS to the NTEPA for review. This submission started concurrent agency review and public consultation periods, the latter of which completed during August 2013. Following closure of the public consultation and agency review periods, the NTEPA provided a consolidated set of comments to us, which we responded to in a final EIS which was submitted for approval during November 2013. During September 2014, the EIS was approved. In its formal notification to us (the “Assessment Report”), the NTEPA has advised that it has assessed the environmental impacts of the Mt Todd gold mine and concluded that it can proceed, subject to a number of recommendations which are outlined in the Assessment Report. The NTEPA Assessment Report includes 28 recommendations which are to be addressed as part of the MMP. Four of these recommendations must be addressed under the EPBC Act as they relate directly to the Gouldian Finch. See ‘2016 Programs and 2017 Plans’ below.
Exploration Potential (“MLs”)
Based on airborne geophysical survey data, we have identified fiveseveral magnetic targets within our controlled land holdings surrounding the Batman pit. The targets are distinct magnetic highs located within sedimentary rocks that should have a low magnetic signature. These features are similar to those at Mt Todd, which, as a result of the included pyrrhotite, exhibits a strong magnetic high.
Mineralization at the Quigleys deposit is interpreted to occur within a series of mineralized shears that strike north northwest and dip 30 to 35 degrees to the west. The main shear extends for nearly one kilometer along the strike and has been drilled to a vertical depth of 230 meters. The mineral resource estimate has been defined by 632 drill holes drilled by Pegasus and Billiton Australia Gold Pty. Ltd. in the late 1980s through the mid-1990s. Tetra Tech reviewed the integrity of the drill-hole database and developed a computer model to estimate and classify the estimated mineral resources. The model reflected Tetra Tech’s geological interpretation of the deposit, which constrained the mineralization to the shear zones using geological information and assays from 49,178 samples obtained from the drilling. Lower grade, erratic mineralization in the hanging wall of the shears has not been included in the mineral resource estimate.
Sampling and assaying was done under the supervision of prior operators in conjunction with evaluation of the Batman pit and are discussed in the PFS, as part of the overall project sampling and assaying methodology.
Based on Tetra Tech’s resource analysis, at a cut-off grade of 0.500.40 g Au/t, under SEC Industry Guide 7 guidelines, mineralized material for the Quigleys deposit is estimated at 6,076,0006.2 million tonnes grading 0.921.13 g Au/t. Under CIM Definition Standards, at the same cut-off grade of 0.500.40 g Au/t, measured mineral resources are estimated at 511,000457,000 tonnes grading 1.041.27 g Au/t, indicated mineral resources are estimated at 5,565,0005.7 million tonnes grading 0.911.12 g Au/t and inferred mineral resources are estimated at 9,416,0001.6 million tonnes grading 0.950.84 g Au/t. Cautionary Note to U.S. Investors: see the
section heading “Cautionary Note to United States Investors Regarding Estimates of Measured, Indicated and Inferred Resources and Proven and Probable Reserves” above.
2016 Programs and 2017 PlansDrilling
InThe drilling discussed in this section is related to the MLs and is limited to that completed since the filing of the NI 43-101 Technical Report – Mt Todd Gold Project, 50,000 tpd Preliminary Feasibility Study, Northern Territory, Australia, Amended & Restated; July 7, 2014. A portion of the drillhole data was used to complete the resource estimate in August 2017. Part of the drillholes were completed for metallurgical samples and are not used in the mineral resource estimate. All of the drillhole data presented in the above report are still valid and have been incorporated in an unchanged manner.
Between the fourth quarter of 2015, we submitted a request for authorization under the EPBC as it relates to the Gouldian Finch. The Australian Commonwealth Department of Environment (the “DoE”) subsequently requested additional information from us as part of their review. We responded to the requests and were subsequently advised that additional information was required. After a process of active dialog2012 and the discovery/analysis of additional data we have submitted the information that we believe satisfies the request for additional information. The DoE review and approval process has resumed and we are waiting for notification of a final outcome.
In early 2016, we retained a team of industry experts to review the key areasend of the project, concentrating on metallurgical recovery, process engineering and plant design, pit slope rock mechanics, mine plans and scheduling, andfirst quarter of 2017, the gas-fired power plant, and to make recommendations that may lead to improved project economics. No material flaws in any of these areas were identified by the team, although recommendations for potential incremental improvements and efficiencies were proposed and will be followed up in due course.
In late 2016, we completed preliminary process area optimization studies that indicated that selectively screening and rejecting sub-economic, coarse crusher product prior to grinding could be expected to produce higher gold recoveries and lower process area operating costs. These results were encouraging and warranted additional metallurgical test work. Accordingly, in December 2016, we initiated a drillVista exploration program to generate approximately 18-20 tonnes of PQ (3.75 inch diameter) core fromat the Batman deposit which was completedconsisted of 22 diamond core drillholes containing 12,530 m that targeted both infill definitional drilling and step-out drilling.
Drillholes added for resource update:
| | | | | | | |
Drillhole ID | Northing m (MGA94 z53) | Easting m (MGA94 z53) | Elevation (masl) | Bearing (°) | Dip (°) | Total Depth (m) | Drillhole Type |
VB12-015 | 8434901.6 | 187446.7 | 144.4 | 268 | -55 | 745.85 | Diamond |
VB12-016 | 8434703.6 | 187262.7 | 147.3 | 267 | -61 | 713.5 | Diamond |
VB12-017 | 8435349.1 | 187391.2 | 150.8 | 277 | -61 | 833.28 | Diamond |
VB12-018 | 8434849.2 | 187429.9 | 144.7 | 270 | -56 | 177 | Diamond |
VB12-019 | 8434846.9 | 187429.4 | 144.8 | 269 | -61 | 731.8 | Diamond |
VB12-020 | 8435852.4 | 187359.6 | 167.3 | 272 | -67 | 611.9 | Diamond |
VB12-021 | 8435954.0 | 187378.8 | 149.9 | 271 | -65 | 602.9 | Diamond |
VB12-022 | 8434453.4 | 187179.3 | 153.3 | 269 | -57 | 647.9 | Diamond |
VB12-023 | 8435801.3 | 187371.0 | 161.3 | 265 | -60 | 650.88 | Diamond |
VB12-024 | 8434482.1 | 187094.7 | 149.8 | 266 | -58 | 460.14 | Diamond |
VB12-025 | 8435656.2 | 187344.7 | 158.6 | 261 | -60 | 650.63 | Diamond |
VB12-026 | 8434393.4 | 187066.8 | 144.8 | 270 | -59 | 378.9 | Diamond |
VB12-027 | 8435717.0 | 187259.7 | 169.8 | 291 | -54 | 434.75 | Diamond |
VB15-001 | 187431 | 8434480 | 147 | 268.3 | -75.812 | 455.5 | Diamond |
VB15-001W1 | 187431 | 8434480 | 147 | 268.3 | -75.812 | 831.8 | Diamond |
VB15-001W2 | 187431 | 8434480 | 147 | 268.3 | -75.812 | 746 | Diamond |
VB15-002 | 187277 | 8434703 | 147.268 | 266.07 | -76.19 | 446.3 | Diamond |
VB15-002W1 | 187277 | 8434703 | 147.268 | 266.07 | -76.19 | 705 | Diamond |
VB16-002* | 187195 | 8434849 | 134.84 | 328.6 | -64 | 485.7 | Diamond |
VB17-001* | 187094 | 8435292 | 161.5 | 184.6 | -55 | 166.6 | Diamond |
VB17-002* | 187194 | 8434848 | 134.84 | 330.6 | -64 | 485 | Diamond |
VB17-003* | 187091 | 8435290 | 161.5 | 188.2 | -55 | 568.9 | Diamond |
*Used for metallurgical testing. Not used in January 2017. The core will be used to complete additional feasibility-level metallurgical studies (automated sorting, fine grinding, gold recovery and rheology/tailings classification), with completion of these studies expected by the third quarter of 2017. Confirmation of the preliminary test work could support material improvements to the economics of the Mt Todd gold project without significant alterations to the current flow sheet. An update of the PFS, which would integrate these potential flow sheet alterations and the associated economic benefits, will likely follow completion of these studies. We also plan to complete a firstmineral resource estimate.
Sampling, Analysis and Data Verification
The sampling method and approach for drillholes completed between 2012 and 2017 has remained consistent. The drill core, upon removal from the core barrel, is placed into plastic core boxes. The poly core boxes are transported to the sample preparation building where the core is marked, geologically logged, geotechnically logged, photographed, and cut into halves. One-half is placed into sample bags as nominal one-meter sample lengths, and the other half retained for future reference. The only exception to this is when a portion of the remaining core has been flagged for use in the ongoing metallurgical testwork.
The bagged samples have sample tags placed both inside and on the outside of the sample bags. The individual samples are grouped into “lots” for submission to Northern Analytical Laboratories for preparation and analytical testing. All of this work was done under the supervision of a Vista geologist.
The following section describes the sample preparation, analyses and security undertaken by Vista through the March 2018 resource update.
The diamond drilling program was conducted under the supervision of the geologic staff composed of a chief geologist, several experienced geologists, and a core handling/cutting crew. The core handling crew was recruited locally.
Facilities for the core processing included an enclosed logging shed and a covered cutting and storage area that was fenced in. Both of these facilities were considered to be limited access areas and kept secured when work was not in progress.
The diamond drill core was boxed and stacked at the rig by the drill crews. Core was then picked up daily by members of the core handling crew and transported directly into the logging shed. Processing of the core included photographing, geotechnical and geologic logging, and marking the core for sampling. The nominal sample interval was one meter. When this process was completed, the core was moved into the core cutting/storage area where it was laid out for sampling. The core was logged using the following procedures:
| · | | One-meter depth intervals were marked out on the core by a member of the geologic staff; |
| · | | Core orientation (bottom of core) was marked with a solid line when at least three orientation marks aligned and used for structural measurements. When orientation marks were insufficient an estimation orientation was indicated by a dashed line; |
| · | | Geologic logging was then done by a member of the geologic staff. Assay intervals were selected at that time and a cut line marked on the core. The standard sample interval was one-m, with a minimum of 0.4 m and a maximum of 1.4 m; |
| · | | Blind sample numbers were then assigned based on pre-labeled sample bags. Sample intervals were then indicated in the core tray at the appropriate locations; |
| · | | Each core tray was photographed and restacked on pallets pending sample cutting and stored on site indefinitely; and |
| · | | 9,635 assays were added for the October 2012 resource update, an additional 7,601 assay intervals were added for the March 2013 resource, and 729 assay intervals were added for the 2017 model update. |
The core was then cut using diamond saws with each interval placed in sample bags. At this time, the standards and blanks were also placed in plastic bags for inclusion in the shipment. A reference standard or a blank was inserted at a minimum ratio of 1 in 10 and at suspected high-grade intervals additional blanks sample were added. Standard reference material was sourced from Ore Research & Exploration Pty Ltd and provided in 60 g sealed packets. When a sequence of five samples was completed, they were placed in a shipping bag and closed with a zip tie. All of these samples were kept in the secure area until crated for shipping.
Samples were placed in crates for shipping with 100 samples per crate (20 shipping bags). The crates were stacked outside the core shed until picked up for transport.
The following laboratories have been used for lab preparation, analyses, and check assays:
Assay and Preparation Laboratories
Laboratory | Address | Purpose | Abbreviation | Certifications |
ALS | Minerals | 31 Denninup Way Malaga, WA 6090 | Main assay analyses | ALS | ISO:9001:2008 and ISO 17025 Certified |
ALS | Minerals | 13 Price St Alice Springs, NT 0870 | Sample Preparation | ALS Alice Springs | ISO 9001:2008 and ISO 17025 Certified |
Genalysis Laboratory Services (Intertek Group) | 15 Davison St Maddington, WA 6109 | Check Analyses | Genalysis | Unable to verify |
North Australian Laboratories Pty Ltd (“NAL”) | MLN 792 Eleanor Rd Pine Creek, NT 0847 | Alternative assay analyses | NAL | ISO 10725 Certified |
NT Environmental Laboratories (Intertek Group) | 3407 Export Dr Berrimah, NT 0828 | Check Analyses | NTEL | ISO 17025 |
Prior to the 2011 drilling campaign, the majority of samples were transported first to ALS in Alice Springs (NT) for sample preparation. After preparation, samples were then forwarded on to ALS in Malaga (WA) for assay analyses. One in every 20 pulp or reject was sent from ALS in Alice Springs to Northern Australian Laboratories (NAL), Vista was notified by email which samples were sent to NAL. For the 2011-2012 drilling campaign samples for assay were sent to NAL lab in Pine Creek, NT. Check assays on one in every 20 pulps or rejects were completed by NT Environmental Laboratories.
Following completion of assay results, all pulps and reject material was shipped back to the Project site and stored.
Vista is completely independent of any analytical testing entity, other than they have engaged said entities as a customer.
Sample Security
NAL is the primary laboratory we use for analysis of drill core assays. The NAL laboratory is located in the town of Pine Creek, approximately 50 km distant by road. Samples were picked up and transported by NAL employees.
Sample shipments were scheduled for approximately once a week. The sealed crates were picked up on site by NAL for direct road transport to the assay lab. A sample transmittal form was prepared and included with each shipment and a copy was filed in the geology office on site.
When the shipment left site, sample transmittals were prepared and e-mailed to NAL. When the shipment arrived at the preparation facility the samples were lined out and a confirmation of sample receipt was e-mailed back to Vista.
Statistical analysis of the various drilling populations and quality assurance/quality control (QA/QC) samples has neither identified nor highlighted any reasons to not accept the data as representative of the tenor and grade of the mineralization estimated at the Batman deposit
Mineral Resources and Mineral Reserve Estimates
The table below illustrates the updated mineral reserve and resource estimate for the Project. The effectivedate of the Batman deposit mineral resource estimate and the heap leach resource estimate is January 24, 2018.
Mt Todd Mineral Reserves, Base Case (50,000 tpd) 0.40 g Au/t cut-off. Mineral reserves calculated at $1,250 per ounce of gold
| | | | | | | | | | | | | | | | | | | | | | | | | |
| | Batman Deposit | | Heap Leach Pad | | Quigleys Deposit | | Total | |
| | Tonnes | | Grade | | Contained | | Tonnes | | Grade | | Contained | | Tonnes | | Grade | | Contained | | Tonnes | | Grade | | Contained | |
| | (000s) | | (gAu/t) | | Ounces | | (000s) | | (g Au/t) | | Ounces | | (000s) | | (g/t) | | Ounces | | (000s) | | (g Au/t) | | Ounces | |
Proven | | 72,672 | | 0.88 | | 2,057 | | — | | — | | — | | — | | — | | — | | 72,672 | | 0.88 | | 2,057 | |
Probable | | 135,015 | | 0.82 | | 3,559 | | 13,354 | | 0.54 | | 232 | | — | | — | | — | | 148,369 | | 0.790 | | 3,791 | |
Total | | 207,687 | | 0.84 | | 5,616 | | 13,354 | | 0.54 | | 232 | | — | | — | | — | | 221,041 | | 0.82 | | 5,848 | |
Batman reserves are reported using a 0.40 cut- off grade and a $1250 per ounce gold price. Unit costs used: $1.90/tonne mined, milling cost $7.80/tonne processed, tailings cost $0.90 per tonne processed, G&A cost $0.46/tonne processed, water treatment $0.10/tonne processed,1% gross royalty. Ore processing at 50,000 TPD, 355 Days/Yr., for a total of 17,750,000 TPY. Au recovery: sulfide 85%, transition 80%, oxide 80%. Because all of the heap-leach pad reserves are to be fed through the mill, these reserves are reported without a cutoff grade applied.
Mt Todd Mineral Reserves, Alternate Case (33,000 tpd) 0.40 g Au/t cut-off. Mineral reserves calculated at $1,250 per ounce of gold
| | | | | | | | | | | | | | | | | | | | | | | | | | |
| | Batman Deposit | | Heap Leach Pad | | Quigleys Deposit | | Total | | |
| | Tonnes | | Grade | | Contained | | Tonnes | | Grade | | Contained | | Tonnes | | Grade | | Contained | | Tonnes | | Grade | | Contained | | |
| | (000s) | | (gAu/t) | | Ounces | | (000s) | | (g Au/t) | | Ounces | | (000s) | | (g/t) | | Ounces | | (000s) | | (g Au/t) | | Ounces | | |
Proven | | 54,031 | | 0.91 | | 1,589 | | — | | — | | — | | — | | — | | — | | 54,031 | | 0.91 | | 1,589 | | |
Probable | | 60,628 | | 0.89 | | 1,736 | | 13,354 | | 0.54 | | 232 | | — | | — | | — | | 73,982 | | 0.83 | | 1,968 | | |
Total | | 114,659 | | 0.90 | | 3,325 | | 13,354 | | 0.54 | | 232 | | — | | — | | — | | 128,013 | | 0.86 | | 3,557 | | |
Batman reserves are reported using a 0.40 cut- off grade and a $1250 per ounce gold price. Unit costs used: $2.16/tonne mined, milling cost $8.65/tonne processed, tailings cost $0.90 per tonne processed, G&A cost $0.77/tonne processed, water treatment $0.10/tonne processed, 1% gross royalty. Ore processing at 33,000 TPD, 355 Days/Yr.,for a total of 11,715,000 TPY. Au recovery: sulfide 85%, transition 80%, oxide 80%. Because all of the heap-leach pad reserves are to be fed through the mill, these reserves are reported without a cutoff grade applied.
Mt Todd Mineral Resources Base Case (50,000 tpd)
| | | | | | | | | | | | | | | | | | | | | | | | | |
| | Batman Deposit | | Heap Leach Pad | | Quigleys Deposit | | Total | |
| | Tonnes | | Grade | | Contained | | Tonnes | | Grade | | Contained | | Tonnes | | Grade | | Contained | | Tonnes | | Grade | | Contained | |
| | (000s) | | (g Au/t) | | Ounces | | (000s) | | (g Au/t) | | Ounces | | (000s) | | (g Au/t) | | Ounces | | (000s) | | (g Au/t) | | Ounces | |
Measured | | 77,725 | | 0.88 | | 2,191 | | — | | — | | — | | 457 | | 1.27 | | 19 | | 78,182 | | 0.88 | | 2,210 | |
Indicated | | 200,112 | | 0.80 | | 5,169 | | 13,354 | | 0.54 | | 232 | | 5,743 | | 1.12 | | 207 | | 219,209 | | 0.80 | | 5,608 | |
Total | | 277,837 | | 0.82 | | 7,360 | | 13,354 | | 0.54 | | 232 | | 6,200 | | 1.13 | | 225 | | 297,391 | | 0.82 | | 7,818 | |
Inferred | | 61,323 | | 0.720 | | 1,421 | | — | | — | | — | | 1,600 | | 0.840 | | 43 | | 62,923 | | 0.72 | | 1,464 | |
Note: Measured and indicated resources include proven and probable reserves. Batman and Quigleys resources are estimated at a 0.40g Au/t cut-off grade. Heap leach resources are the average grade of the heap, no cut-off applied. Economic analysis conducted on proven and probable mineral reserves.
Cautionary note to investors: Proven and probable reserves are estimated in accordance with NI 43-101 and do not constitute SEC Industry Guide 7 compliant reserves see the section heading “Cautionary Note to Investors Regarding Estimates of Measured, Indicated and Inferred Resources and Proven and Probable Reserves” above.
The tables below show the resource classification criteria and variogram parameters for the Batman resource model.
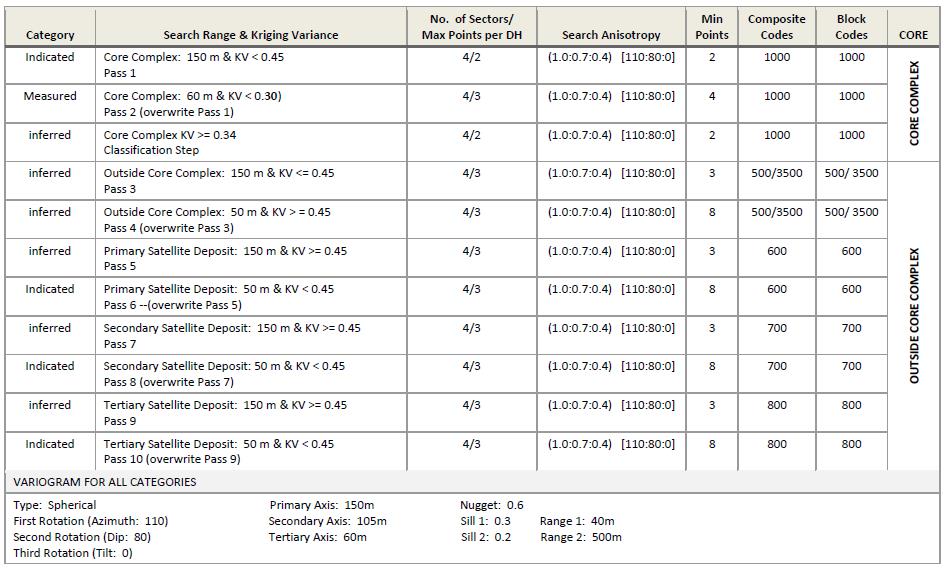
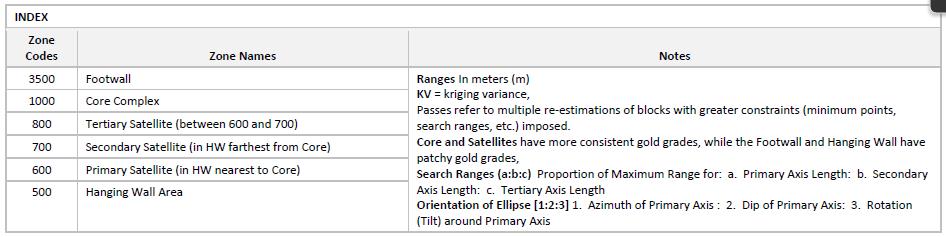
Mining Operations
Only open-pit mining methods are considered for mining at Mt Todd. Mt Todd has been planned as a conventional, owner-operated, truck and shovel operation, that will use large scale mining equipment in a blast/load/haul operation. The truck and shovel method provides reasonable cost benefits and selectivity for this type of deposit.
The Base Case and the Alternate Case use substantially the same sized equipment, however, the Alternate Case requires fewer units
Mineral Processing
The flowsheet consists of primary crushing, closed circuit secondary crushing, closed circuit tertiary crushing using HPGRs, ore sorting, two-stage ball milling, cyclone classification, pre-leach thickening, leach and adsorption, elution electrowinning and smelting, carbon regeneration, tailings detoxification and disposal to conventional tailings storage facility (“TSF”). The flowsheet for the Base Case is illustrated below.
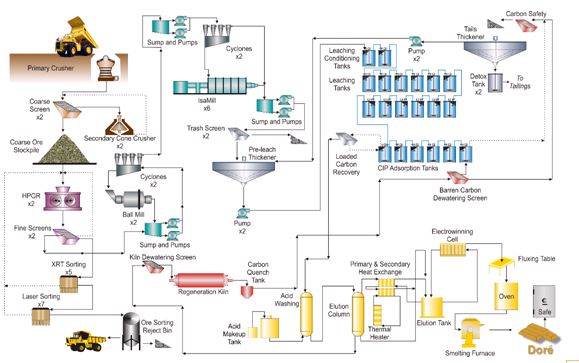
The flowsheet for the Alternate Case is based on the same configuration, but with proportionally smaller scale equipment.
Metallurgical Testing
Our metallurgical test work programs have confirmed: (1) ore hardness estimates at the Batman deposit are consistent throughout the deposit and do not change at depth; (2) the selection of HPGR technology as part of the comminution circuit; (3) the selection of automated ore sorting technology to eliminate low-grade material after crushing and prior to grinding; (4) estimated gold recovery rates based on optimized grind size and leach conditions; and (5) the processing of material from the historic heap leach pad at the end of the proposed mine life.
The test work results collated from the 2011 and 2012 testing campaigns and additional metallurgical and process test work conducted in 2016 and 2017, together with the process design criteria, were used to develop the process flow sheet and mass balance.
Ore Hardness
Bond ball mill work indices (“BWi”) were determined at a grind size of P80 of 100 mesh for the various products, namely HPGR, ore-sorting, composite samples and waste material.
The test results indicate the following:
| · | | The BWi for the XRT products was higher than the composite samples prepared from the crushed products. Hence, it is reasonable to conclude that the uncrushed material in the HPGR is harder than the crushed product. |
| · | | The waste material had a BWi higher than the composite sample as well as the XRT recycle products. |
| · | | The BWi for the products ranged from 23.10 to 24.28. A BWi of 24.50 was selected for the design of the primary ball mill circuit. |
The results of this test work support two main conclusions: (1) that the hardness of ore at the Batman deposit is relatively constant; and (2) that ore hardness at the Batman deposit does not change at depth.
This test work validates the Company’s prior test work and supports Vista’s revised comminution circuit design, which is designed to crush and grind material with an average BWi of 26.2 kWh/t, a 5% factor of safety above the average BWi and closer to the 75th percentile of BWi test results.
HPGR Selection
The proposed Base Case comminution circuit incorporates the use of a large gyratory crusher and two large cone crushers for the primary and secondary stages, respectively, and contemplates the use of two HPGRs as the third-stage of the crushing circuit.
The test work also assessed the difference in power requirements between a primary/SAG/ball mill circuit, a conventional 3-stage crush/ball mill circuit, and a 3-stage HPGR/ball mill circuit to generate a P80 passing 60 μm product.
This test work also confirms our prior test work and supports our comminution circuit design. The use of HPGRs is anticipated to (a) produce a product that can be ground more efficiently (lower BWi) in the ball mills; and (b) reduce energy requirements when compared to a SAG mill design.
Sorting
The bulk automated sorting tests comprised four, five-tonne composites prepared from 3.75" drill core. Three of the composites contained predominately sulfide mineralization and one composite contained mixed oxide/sulfide material that is encountered on the periphery of the deposit. The drill core was HPGR crushed and screened at 16mm at the facilities of Thyssen Krupp Industries (“TKI”) near Dusseldorf, Germany. The +16mm material was sent to the test facility of Tomra Sorting Solutions (“Tomra”) near Hamburg, Germany where this material was initially sorted using XRT sorting. A total of 12 sorting tests were completed. The XRT rejects were then subjected to laser sorting to produce a final reject. All material (-16mm HPGR crushed, XRT product, laser product and sorting reject) was sent to the metallurgical laboratory of Resource Development Inc. (“RDi”) in Wheatridge, Colorado for subsequent sample preparation, assaying and additional metallurgical testing.
On a material mass basis, the combined XRT and laser sorting tests confirmed the Company’s expectation that it can reject approximately 10% of the run-of-mine feed as waste (test results range from 6.8% to 11.0%). The average grade of the rejected material is estimated to be 0.12 g Au/t (results range from 0.06 g Au/t to 0.23 g Au/t) compared to the mine cut-off grade of 0.4 g Au/t, resulting in a gold loss from the rejected waste of approximately 1.3%. The improvement in mill feed grade is expected to be approximately 8%, resulting in run-of-mine average mill feed grade of 0.91 g Au/t compared to the life-of-mine reserve grade of 0.84 g Au/t. We now expect grinding, leaching and tailings
handling costs, which are dependent on the volume of material processed, to be approximately 10% less than previously estimated.
Gold Recoveries
We continued evaluating gold recoveries using two-stage grinding and a finer product size. This test work has confirmed that the introduction of sorting to reduce the leach tonnage by approximately 10% and finer grinding to P80 of 60 µm yields an increase in recovery of approximately 4.1%, net of solution losses.
A total of 41 additional leach tests were completed using the above mentioned two-staged grinding to confirm our resulting leach recoveries of 86.5% for sulfide ores, 79.5% for mixed and oxide ores and 71.5% for heap leach ore, net of solution losses. This test work has also confirmed a cyanide consumption rate of 0.45 kg per tonne.
Our recovery plant design utilizing a conventional, industry-proven, CIP circuit remains unchanged.
Existing Heap Leach Pad
In addition to analysis of freshly-mined material from the Batman deposit, Vista has analyzed the potential to process nearly 13.4 million tonnes of material on the existing heap leach pad at Mt Todd. The original Mt Todd started as a heap leach operation with historic records indicating that the average grade of material placed on the pad was 0.96 g Au/t. Although the material was partially leached in the mid-1990s, Vista has drilled 24 air-rotary holes into the heap leach pad and assayed 361 samples, and Tetra Tech created a 3D resource model that has an average grade of 0.54 g Au/t.
Initial evaluation efforts focused on re-starting the heap leach pad. Bottle roll and column tests were completed, both of which supported the leachability of the material with gold recovery rates around 35%. However, poor in situ permeability rates caused Vista to ultimately abandon plans to re-start the heap.
We subsequently submitted two heap leach variability composites and two drill hole composites from the leach pad for CIP cyanidation leach test work. The samples were ground to the size of P80 of 90 μm and pre-treated with lime and 100g/t of lead nitrate to suppress copper leaching. The material was then leached for 24 hours. These results support recovery rates of 71.5% for this material when processed through the CIP plant.
The PFS assumes that the existing heap leach pad will be left in place and processed through the mill at the end of mine life. This ultimately reduces the scope of reclamation to the pad liner only.
Infrastructure
Because Mt Todd was an operating mine, infrastructure exists that reduces initial capital expenditure and significantly reduces capital risk related to infrastructure construction, which has been a major source of capital overruns in the mining industry over the last decade. Existing mining infrastructure items include:
| · | | an existing tailings storage facility that is expected to contain approximately 87 million tonnes of material processed; |
| · | | an existing fresh water storage reservoir that will receive a two-meter dam raise and will harvest stormwater sufficient to provide process water for year-round operations for a 50,000 tpd operation; |
| · | | a natural gas pipeline at site that can supply sufficient natural gas to meet the project's energy requirements which, coupled with the planned power generating plant, would save considerably on project operating costs compared to grid-supplied power; |
| · | | current electrical connection to the NT electric grid; and |
| · | | reduced earthworks costs due to the process plant location being the same as the previous process plant, which has already been cleared and graded. |
Other benefits of Mt Todd’s NT location include:
| · | | the Stuart highway – the main North / South highway in the NT is less than 15km from the project site; |
| · | | rail line parallel to the Stuart highway; and |
| · | | the regional center of Katherine (population approximately 12,000) less than 60 km from site and the NT capital of Darwin less than 300 km from the project site, which has port access. |
The area has both historic and current mining activity and therefore a portion of the skilled workforce will be sourced locally. In addition, Katherine offers the necessary support functions that are found in a medium-sized city with regard to supplies, accommodations, communications, etc.
Planned infrastructure for the site includes the following:
| · | | Ammonium Nitrate and Fuel Oil (ANFO) Facility; |
| · | | Mine Support Facilities (Heavy Vehicle (HV) Workshop, Lube Farm, Washdown and Tire Change, Warehouse, Fuel Farm, Mining Offices, Core Storage Facility); |
| · | | Water Treatment Plant (WTP); |
| · | | Expanded existing and additional TSF. |
Permitting
During September 2014, the Environmental Impact Statement (“EIS”) was approved. In its formal notification to us (the “Assessment Report”), the Northern Territory Environmental Protection Agency (“NTEPA”) advised that it had assessed the environmental impacts of the Mt Todd gold mine and concluded that it can proceed, subject to a number of recommendations which are outlined in the Assessment Report. The NTEPA Assessment Report includes 28 recommendations which are to be addressed as part of the MMP.
We are in the process of applying for the MMP permit, the operating permit that sets out how mine operating strategy will be implemented throughout the mine life in compliance with the EIS and Australian Environmental Protection and Biodiversity Conservation Act of 1999 (“EPBC”) requirements. A draft of the mine management plan (“MMP”) byMMP permit was submitted to the third quarterDepartment of 2017. The MMP is essentially the plan of operations,Primary Industries and Resources in November 2017 and is onecurrently under review.
The approval of the final remaining major permits.EIS resulted in the requirement to obtain an authorization of a controlled activity as required under the EPBC as it relates to the Gouldian Finch. The EPBC authorization was submitted for approval to the Australian Commonwealth Department of Environment and Energy during December 2015 and the authorization was granted in January 2018.
Environmental, Social and Community Factors
A number of environmental studies have been conducted at Mt Todd in support of the EIS and as required for environmental and operational permits. Studies conducted have investigated soils, climate and meteorology, geology, geochemistry, biological resources, cultural and anthropological sites, socio-economics, hydrogeology, and water quality.
The EIS for the Project was submitted in June 2013. The document was prepared by independent consultants GHD Pty Ltd to identify potential environmental, social, transport, cultural and economic impacts associated with reopening and operating the mine. NTEPA provided its final assessment of the Project in June 2014. Final approval was given in September 2014.
In January 2018, the “authorization of a controlled activity” was received for the Project as required under the EBPC as it relates to the Gouldian Finch, and as such has received approval from the Australian Commonwealth Department of Environment and Energy.
The Jawoyn people have strong involvement in the planning of the Project. Areas of aboriginal significance have been designated, and the mine plan has avoided development in these restricted works areas
Water Treatment
We have a Waste Discharge License (“WDL”) from the NT Government that authorizes the release of treated water from the Mt Todd site during the wet season in accordance with higher environmental protection standards. We operate in compliance with the standards. We will have to dewater substantially the entire pit before mining operations can be started.
2018 Plans
At the beginning of each year, the Company identifies those areas of the project that require, or could benefit from, additional technical work or studies. These are considered discretionary programs, and are subject to strict program approval criteria, including program justification, alternatives methods, and availability of funding.
During the first half of 2018 we expect to complete four additional PQ core holes designed to extract approximately 5 tonnes of higher grade material from the Batman pit, for the completion of two additional approximately 2.5 tonne HPGR crushing, XRT and laser sorting tests. These tests are being conducted to confirm gold loss in the rejected material for higher grade ores. We are completing grinding tests on the secondary grinding mills in order to obtain specific data for future application. These tests are with Glencore, who manufacture the ISAMill referenced in the PFS, and with FLSmidth, who produce a competing mill known as a vertimill. We are also completing testing with Lightnin for design of impellers, electrical motor requirements, and percent solids within the leaching tanks. The total 2018 expenditure for this program is expected to be approximately $625,000.
We expect to continue dewatering in accordance with our WDL and to perform baseline monitoring in accordance with our EPBC approval.
We anticipate completing additional definition drilling at Quigleys, intended to investigate the possibility of providing the mill with future supplemental higher grade Quigleys ore. We also anticipate exploration programs on the ELs, designed to continue investigating some of the known geophysical and geochemical anomalies. The scope, scheduling and cost estimates for these programs have not yet been completed
Mt Todd is without known mineral reserves under SEC Industry Guide 7.
Guadalupe de los Reyes Gold/Silver Project, Sinaloa, Mexico
During April 2014, Minera Gold Stake S.A. de C.V. (“MGS”), Vista’s wholly-owned subsidiary,October 2017, we entered into a definitive optionan agreement (the “Option Agreement”) to option a 70%our interest in the Guadalupe de los Reyes gold/gold and silver project in Sinaloa, Mexico (the “GdlR Project”) to Great Panther Silver Limited (formerly Cangold Limited)Minera Alamos Inc. and its subsidiary Minera Alamos de Sonora S.A. de C.V. (“Great Panther”Minera Alamos”) for consideration.
Pursuant to the terms of $5,000 in five payments overthe Option Agreement, we have granted Minera Alamos an exclusive right and option to earn a three-year period, with payments totaling $1,000100% interest in the first year ($500 received in 2014 and $496 net of legal costs was received in March 2015), $1,500 due in February 2016 (postponed from January 2016) and $2,500 due in January 2017. GdlR Project by:
| · | | making payments totaling $6,000,000 comprised of a payment of $1,500,000 made at the execution of the Option Agreement (“Option Grant Date”); two successive payments of $1,500,000 each to be made at the one-year and two-year anniversaries of the Option Grant Date; and a final $1,500,000 payment to be made before the four-year anniversary of the Option Grant Date; |
| · | | maintaining the concessions comprising the GdlR Project in good standing; |
| · | | fulfilling all of our obligations to the Ejido La Tasajera (the “Ejido”) as set out in the temporary occupation contract between us and the Ejido; |
| · | | granting us a capped NSR royalty on production from open pit mining (the “Open Pit NSR”) at rates that range from 1% (at gold prices of $1,400/oz or less) to a maximum of 2% (at gold prices above $1,600/oz) up to an aggregate of $2,000,000 in royalty payments; |
| · | | granting us a perpetual NSR royalty on production from underground mining (the “Underground NSR”) at rates that range from 1% (at gold prices of $1,400/oz or less) to a maximum of 2% (at gold prices above $1,600/oz); and |
| · | | granting us the right to assume a 49% non-carried interest in an underground project if Minera Alamos decides to develop an underground mine at the GdlR Project (the “Back-in Right”). |
The Option Agreement providedprovides that all cash payments are non-refundable and optional to Great Panther,Minera Alamos, and in the event Great Panther failedMinera Alamos fails to pay any of the required amounts onas set out in the scheduled datesOption Agreement, or failedfails to comply with its other obligations, the Option Agreement wouldwill terminate and Great Panther wouldMinera Alamos will have no interest in the Guadalupe de los Reyes gold/silver project.
On February 25, 2016 Vista received notification from Great Panther thatGdlR Project. Provided it was terminating the Option Agreement and the $1,500 option payment dueis not in February 2016 was not made. Pursuant to the termsbreach of the Option Agreement, Vista retainedMinera Alamos may at its discretion advance the above payment schedule.
Subject to Minera Alamos timely making all amounts paid by Great Pantherthe option payments, and fulfilling its other obligations with respect to the Option Agreement, we will transfer 100% of the Guadalupeshares of the Company’s 100% owned subsidiary Minera Gold Stake S.A. de los Reyes gold/silver project.C.V., the entity which owns the GdlR Project, to Minera Alamos and the Open-Pit NSR and Underground NSR will be granted to us.
We do not consider Guadalupe de los Reyes gold/silver projectIf Minera Alamos discovers, and decides to develop, an underground mine at the GdlR Project and we exercise the Back-in Right, we and Minera Alamos have agreed to form a material project. We intendjoint venture to seek partners to advancedevelop and operate the project.underground mine. If the joint venture is formed, the Underground NSR will terminate.
Guadalupe de los Reyes is without known mineral reserves under SEC Industry Guide 7.
Long Valley Gold Project, California
We acquired theDuring March 2017, we sold our Long Valley gold project in January 2003. The property consists of 95 contiguous, unpatented mining claims that cover an arealocated in California for consideration, net of approximately 1,963 acres. The surface rights coveringtransaction costs, of $358,000 which was paid at closing; a future payment of $500,000 one month after the areastart of commercial production; a future payment of $500,000 on or prior to the first anniversary of the start of commercial production; and a net smelter return royalty (“NSR”) on any future production from said claims are owned byat a variable rate between 0.5% and 2.0% depending on the U.S. government, and are subject toaverage gold price realized. This sale resulted in a surface grazing lease. The project is subject to a 1% NSR royalty.realized gain of $358,000 for 2017.
Because
ITEM 3. LEGAL PROCEEDINGS.
We are not aware of any material pending litigation or of any proceedings known to be contemplated by governmental authorities that are, or would be, likely to have a material adverse effect upon us or our operations, taken as a whole. There are no known material proceedings pursuant to which any of our directors, officers or affiliates or any owner of record or beneficial owner of more than 5% of our securities or any associate of any such director, officer or security holder is a party adverse to us or has a material interest adverse to us.
ITEM 4. MINE SAFETY DISCOSURES.DISCLOSURES.
We consider health, safety and environmental stewardship to be a core value forof the Company.
Pursuant to Section 1503(a) of the United States Dodd-Frank Wall Street Reform and Consumer Protection Act of 2011 (the “Dodd-Frank Act”), issuers that are operators, or that have a subsidiary that is an operator, of a coal or other mine in the United States are required to disclose in their periodic reports filed with the SEC information regarding specified health and safety violations, orders and citations, related assessments and legal actions, and mining-related fatalities under the regulation of the Federal Mine Safety and Health Administration (“MSHA”) under the United States Federal Mine Safety and Health Act of 1977 (the “Mine Act”). During the fiscal year ended December 31, 2016, our U.S
exploration2017, we had no properties in the United States and were not subject to regulation by the MSHA under the Mine Act and consequently no disclosure is required under Section 1503(a) of the Dodd-Frank Act.
PART II
ITEM 5. MARKET FOR REGISTRANT’S COMMON EQUITY, RELATED STOCKHOLDER MATTERS AND ISSUER PURCHASES OF EQUITY SECURITIES.
Price Range of Common Shares
The common shares of Vista Gold are listed on the NYSE MKT.American. The following table sets out the reported high and low sale prices on the NYSE MKTAmerican for the periods indicated as reported by the exchange.
| | | | | | | | | | | | | | |
| | NYSE MKT | | | NYSE MKT | |
| | High | | Low | | | High | | Low | |
2015 | | | | | | | | |
1st quarter | | $ | 0.45 | | $ | 0.28 | | |
2nd quarter | | | 0.40 | | | 0.30 | | |
3rd quarter | | | 0.33 | | | 0.24 | | |
4th quarter | | | 0.37 | | | 0.26 | | |
2016 | | | | | | | | | | | | | | |
1st quarter | | | 0.60 | | | 0.27 | | | $ | 0.60 | | $ | 0.27 | |
2nd quarter | | | 2.09 | | | 0.44 | | | | 2.09 | | | 0.44 | |
3rd quarter | | | 2.05 | | | 0.87 | | | | 2.05 | | | 0.87 | |
4th quarter | | | 1.14 | | | 0.80 | | | | 1.14 | | | 0.80 | |
2017 | | | | | | | | | | | | | | |
1st quarter (through February 10, 2017) | | | 1.24 | | | 0.90 | | |
1st quarter | | | | 1.24 | | | 0.90 | |
2nd quarter | | | | 1.11 | | | 0.81 | |
3rd quarter | | | | 0.92 | | | 0.63 | |
4th quarter | | | | 0.83 | | | 0.60 | |
2018 | | | | | | | | |
1st quarter (through February 26, 2018) | | | | 0.87 | | | 0.70 | |
On February 10, 2017,26, 2018, the last reported sale price of the common shares of Vista Gold on the NYSE MKTAmerican was $1.19,$0.77, there were 97,786,60899,412,007 Common Shares issued and outstanding, and we had approximately 302277 registered shareholders of record.
Dividends
We have never paid cash dividends. The declaration and payment of future dividends, if any, will be determined by our Board and will depend on our earnings, financial condition, future cash requirements and other relevant factors.
Securities Authorized for Issuance under Equity Compensation Plans
The following table sets out information relating to the Company’s equity compensation plans as at December 31, 2016.2017. The Corporation’s equity compensation plans as of December 31, 20162017 were the Stock Option Plan and the LTIP.Long-Term Incentive Plan (“LTIP”). Equity compensation under these plans has been granted to directors, officers, employees and consultants of the Company.
| | | | | | | | | | | | |
Plan Category | | Number of securities to be issued upon exercise/conversion of outstanding options and rights | | Weighted-average exercise price of outstanding options | | Number of securities remaining available for future grants under equity compensation plans (excluding securities reflected in column (a)) | | Number of securities to be issued upon exercise/conversion of outstanding options and rights | | Weighted-average exercise price of outstanding options | | Number of securities remaining available for future grants under equity compensation plans (excluding securities reflected in column (a)) |
| | (a) | | (b) | | (c) | | (a) | | (b) | | (c) |
Equity compensation plans approved by securityholders | | 4,212,887 | | 1.05 | | 5,565,774 | | 2,712,407 | | 0.42 | | 7,228,794 |
Equity compensation plans not approved by securityholders | | N/A | | N/A | | N/A | | N/A | | N/A | | N/A |
Total | | 4,212,887 | | 1.05 | | 5,565,774 | | 2,712,407 | | 0.42 | | 7,228,794 |
As of December 31, 2016, 2,668,3872017, 1,567,907 RSUs are outstanding under the LTIP and 1,544,5001,144,500 options are outstanding under the Stock Option Plan to acquire 4,212,8872,712,407 Common Shares.
See “Part III Item 11. Executive Compensation” for additional information relating to our equity compensation plan.
Stock Performance Graph
The following graph compares the yearly percentage change in the Company’s cumulative total shareholder return on its Common Shares with the cumulative total return of the S&P 500 and the NYSE ARCA Gold Bugs Index for the last five financial years. This performance chart assumes that $100 was invested on December 31, 2011,2012, in (i) the Company’s Common Shares at the closing price of the Common Shares on December 31, 2011;2012; (ii) the S&P 500; and the NYSE ARCA Gold Bugs Index.
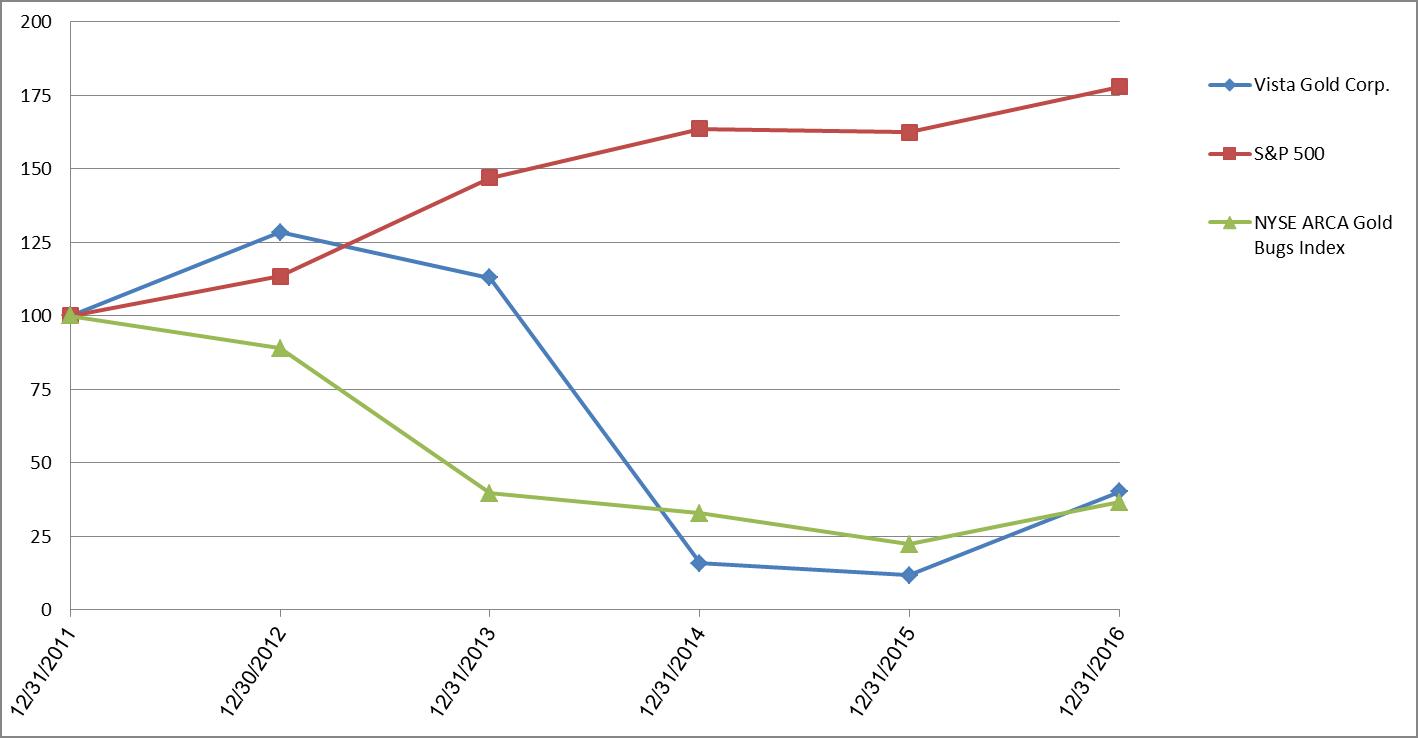
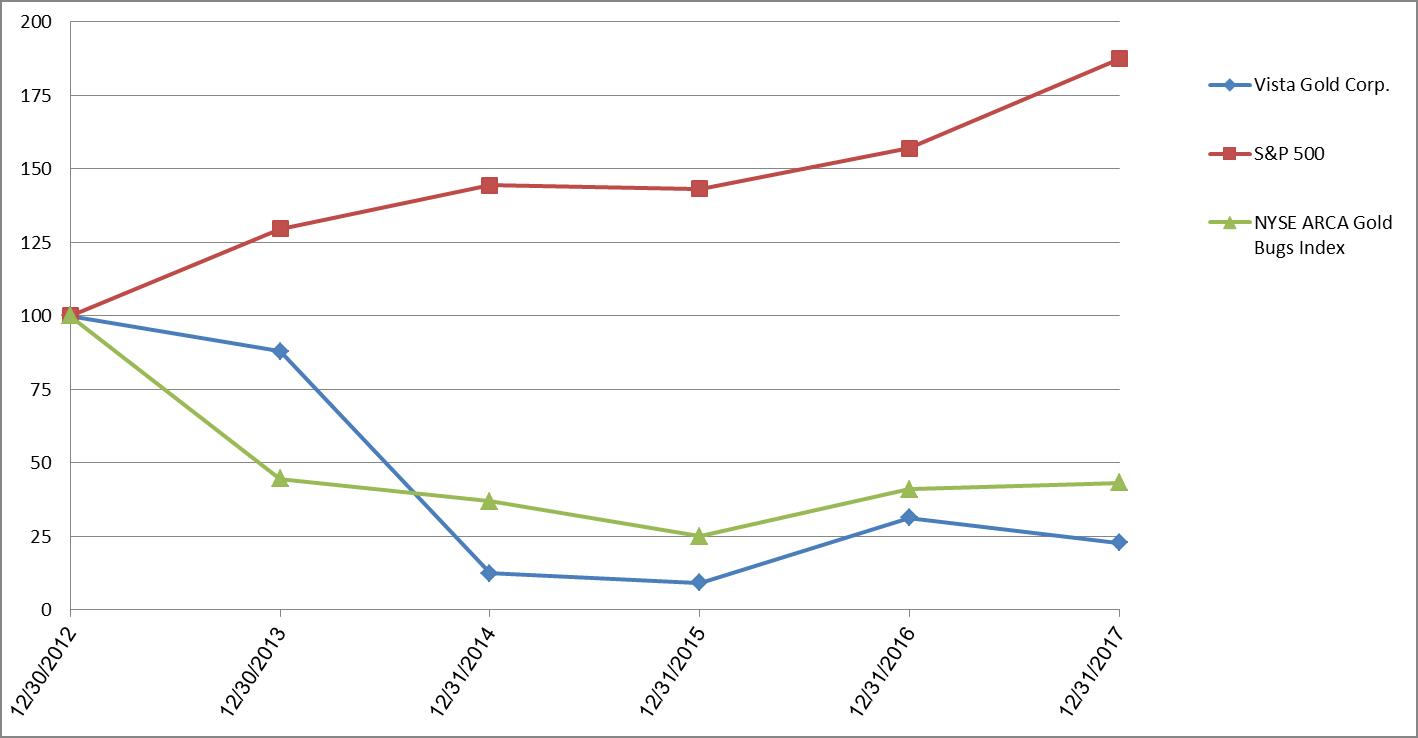
| | | | | | | | | | | | | | | | | | | | | | | | | | | | | | | | | | | | | | |
| | 12/31/2011 | | 12/30/2012 | | 12/31/2013 | | 12/31/2014 | | 12/31/2015 | | 12/31/2016 | | | 12/30/2012 | | 12/30/2013 | | 12/31/2014 | | 12/31/2015 | | 12/31/2016 | | 12/31/2017 | |
Vista Gold Corp. | | $ | 100 | | $ | 128.45 | | $ | 112.97 | | $ | 15.90 | | $ | 11.72 | | $ | 40.17 | | | $ | 100 | | $ | 87.95 | | $ | 12.38 | | $ | 9.12 | | $ | 31.27 | | $ | 22.80 | |
S&P 500 | | $ | 100 | | $ | 113.41 | | $ | 146.98 | | $ | 163.72 | | $ | 162.53 | | $ | 178.02 | | | $ | 100 | | $ | 129.60 | | $ | 144.36 | | $ | 143.31 | | $ | 156.98 | | $ | 187.47 | |
NYSE ARCA Gold Bugs Index | | $ | 100 | | $ | 89.07 | | $ | 39.64 | | $ | 32.89 | | $ | 22.29 | | $ | 36.55 | | | $ | 100 | | $ | 44.50 | | $ | 36.93 | | $ | 25.03 | | $ | 41.04 | | $ | 43.29 | |
Exchange Controls
There are no governmental laws, decrees or regulations in Canada that restrict the export or import of capital, including foreign exchange controls, or that affect the remittance of dividends, interest or other payments to non-resident holders of the securities of Vista, other than Canadian withholding tax. See “Certain Canadian Federal Income Tax Considerations for U.S. Residents” below.
Certain Canadian Federal Income Tax Considerations for U.S. Residents
The following summarizes certain Canadian federal income tax consequences generally applicable under the Income Tax Act (Canada) and the regulations enacted thereunder (collectively, the “Canadian Tax Act”) and the Canada-United States Income Tax Convention (1980) (the “Convention”) to the holding and disposition of Common Shares.
Comment is restricted to holders of Common Shares each of whom, at all material times for the purposes of the Canadian Tax Act and the Convention, (i) is resident solely in the United States, (ii) is entitled to the benefits of the Convention, (iii) holds all Common Shares as capital property, (iii) holds no Common Shares that are “taxable Canadian property” (as defined in the Canadian Tax Act) of the holder, (iv) deals at arm’s length with and is not affiliated with Vista Gold, (v) does not and is not deemed to use or hold any Common Shares in a business carried on in Canada, and (vi) is not an insurer that carries on business in Canada and elsewhere (each
| (i) | | is resident solely in the United States, |
| (ii) | | is entitled to the benefits of the Convention, |
| (iii) | | holds all Common Shares as capital property, |
| (iv) | | holds no Common Shares that are “taxable Canadian property” (as defined in the Canadian Tax Act) of the holder, |
| (v) | | deals at arm’s length with and is not affiliated with Vista Gold, |
| (vi) | | does not and is not deemed to use or hold any Common Shares in a business carried on in Canada, and |
| (vii) | | is not an insurer that carries on business in Canada and elsewhere |
(each such holder, a “U.S. Resident Holder”).
Certain U.S.-resident entities that are fiscally transparent for United States federal income tax purposes (including limited liability companies) may not in all circumstances be regarded by the Canada Revenue Agency (the “CRA”) as entitled to the benefits of the Convention. Members of or holders of an interest in such an entity that holds Common Shares should consult their own tax advisers regarding the extent, if any, to which the CRA will extend the benefits of the Convention to the entity in respect of its Common Shares.
Generally, a holder’s Common Shares will be considered to be capital property of the holder provided that the holder is not a trader or dealer in securities, did not acquire, hold or dispose of the Common Shares in one or more transactions considered to be an adventure or concern in the nature of trade (i.e. speculation), and does not hold the Common Shares as inventory in the course of carrying on a business.
Generally, a holder’s Common Shares will not constitute “taxable Canadian property” of the holder at a particular time at which the Common Shares are listed on a “designated stock exchange” (which currently includes the TSX)TSX and NYSE American) unless both of the following conditions are true:true at any time during the 60 month period immediately preceding the particular time:
| (i) | | the holder, or any one or more persons with whom the holder does not deal at arm’s length, owned,or any partnership in which the holder or persons with whom the holder did not deal at arm’s length holds a membership interest directly or indirectly through one or more partnerships, alone or in any combination, owned 25% or more of the issued shares of any class of the capital stock of Vista Gold at any time in the 60 months preceding the particular time;Gold; and |
| (ii) | | more than 50% of the fair market value of the Common Shares was derived directly or indirectly from, or from any combination of, real or immovable property situated in Canada, “Canadian resource properties” (as defined in the Canadian Tax Act), “timber resource properties” (as so defined)defined in the Canadian Tax Act), or options in respect of or interests therein, at any time in the 60 months preceding the particular time.such properties whether or not such properties exist. |
In certain circumstances, a Common Share may be deemed to be “taxable Canadian property” for purposes of the Canadian Tax Act.
This summary is based on the current provisions of the Canadian Tax Act and the Convention in effect on the date hereof, all specific proposals to amend the Canadian Tax Act and Convention publicly announced by or on behalf of the Minister of Finance (Canada) on or before the date hereof, and the current published administrative and assessing policies of the CRA. It is assumed that all such amendments will be enacted as currently proposed, and that there will be no other material change to any applicable law or administrative or assessing practice, although no assurance can be given in these respects. Except as otherwise expressly provided, this summary does not take into account any provincial, territorial or foreign tax considerations, which may differ materially from those set out herein.
This summary is of a general nature only, is not exhaustive of all possible Canadian federal income tax considerations, and is not intended to be and should not be construed as legal or tax advice to any particular U.S. Resident Holder. U.S. Resident Holders are urged to consult their own tax advisers for advice with respect to their particular circumstances. The discussion below is qualified accordingly.
A U.S. Resident Holder who disposes or is deemed to dispose of one or more Common Shares generally should not thereby incur any liability for Canadian federal income tax in respect of any capital gain arising as a consequence of the disposition.
A U.S. Resident Holder to whom Vista Gold pays or is deemed to pay a dividend on the holder’s Common Shares will be subject to Canadian withholding tax, and Vista Gold will be required to withhold the tax from the dividend and remit it to the CRA for the holder’s account. The rate of withholding tax under the Canadian Tax Act is 25% of the gross amount of the dividend but should(subject to reduction under the provisions of an applicable tax treaty). Under the Convention, a U.S. Resident Holder who beneficially owns the dividend will generally be reduced undersubject to Canadian withholding tax at the Convention torate of 15% (or, if the U.S. Resident Holder who beneficially owns the dividend is a company which owns at least 10% of the voting stock of Vista Gold, 5%) of the gross amount of the dividend.
Certain United States Federal Income Tax Considerations for U.S. Residents
There may be material tax consequences to U.S. Residents in relation to an acquisition or disposition of Common Shares or other securities of the Company. U.S. Residents should consult their own legal, accounting and tax advisors regarding such tax consequences under United States, state, local or foreign tax law regarding the acquisition or disposition of our Common Shares or other securities, in particular, the tax consequences of the Company likely being a "passive foreign investment company" (commonly known as a “PFIC”) within the meaning of Section 1297 of the United States Internal Revenue Code. See the section “Item 1A. – Risk Factors - The Company is likely a “passive foreign investment company”, which will likely have adverse U.S. federal income tax consequences for U.S. shareholders” above.
Unregistered Sales of Equity Securities
None.
Repurchase of Securities
During 2016,2017, neither Vista nor any affiliate of Vista repurchased Common Shares of Vista registered under Section 12 of the Exchange Act.
ITEM 6. SELECTED FINANCIAL DATA
| | | | | | | | | | | | | | | | | | | | | | | | | | | | | | | | |
| | Years Ended December 31, | | | Years Ended December 31, | |
| | 2016 | | 2015 | | 2014 | | 2013 | | 2012 | | | 2017 | | 2016 | | 2015 | | 2014 | | 2013 | |
Results of operations | | | | | | | | | | | | | | | | | | | | | | | | | | | | | | | | |
Net income/(loss) | | $ | (3,133) | | $ | 1,011 | | $ | (18,926) | | $ | (59,488) | | $ | (70,656) | | | $ | (12,035) | | $ | (3,133) | | $ | 1,011 | | $ | (18,926) | | $ | (59,488) | |
Basic income/(loss) per share | | | (0.04) | | | 0.01 | | | (0.23) | | | (0.73) | | | (0.95) | | | | (0.12) | | | (0.04) | | | 0.01 | | | (0.23) | | | (0.73) | |
Diluted income/(loss) per share | | | (0.04) | | | 0.01 | | | (0.23) | | | (0.73) | | | (0.95) | | | | (0.12) | | | (0.04) | | | 0.01 | | | (0.23) | | | (0.73) | |
Financial position | | | | | | | | | | | | | | | | | | | | | | | | | | | | | | | | |
Working capital | | | 28,438 | | | 14,399 | | | 8,619 | | | 8,622 | | | 60,342 | | | | 19,057 | | | 28,438 | | | 14,399 | | | 8,619 | | | 8,622 | |
Total assets | | | 41,608 | | | 27,868 | | | 28,026 | | | 53,094 | | | 133,065 | | | | 31,141 | | | 41,608 | | | 27,868 | | | 28,026 | | | 53,094 | |
Long-term debt and non-current liabilities | | | — | | | — | | | — | | | 8,859 | | | 635 | | | | — | | | — | | | — | | | — | | | 8,859 | |
Shareholders' equity | | | 40,525 | | | 27,065 | | | 25,283 | | | 43,013 | | | 101,343 | | | | 29,083 | | | 40,525 | | | 27,065 | | | 25,283 | | | 43,013 | |
ITEM 7. MANAGEMENT’S DISCUSSION AND ANALYSIS OF FINANCIAL CONDITION AND RESULTS OF OPERATIONS.
The following discussion and analysis should be read in conjunction with our consolidated financial statements for the three years ended December 31, 2016,2017, and the related notes thereto, which have been prepared in accordance with generally accepted accounting principles in the United States (“U.S. GAAP”). This discussion and analysis contains forward-looking statements that involve risks, uncertainties and assumptions. Our actual results may differ materially from those anticipated in these forward-looking statements as a result of many factors, including, but not limited to, those set forth under the section heading “Item 1A. Risk Factors” above and elsewhere in this annual report on Form 10-K. See section heading “Note Regarding Forward-Looking Statements” above.
All dollar amounts stated herein are in U.S. dollars in thousands, except per share amounts and per warrant amounts unless specified otherwise. References to C$ refer to Canadian currency, AUD or A$ to Australian currency, and USD or $ to United States currency.
Overview
Vista Gold Corp. and its subsidiaries (collectively, “Vista,” the “Company,” “we,” “our,” or “us”) are engagedoperate in the gold mining industry. We are focused on the evaluation, acquisition, exploration and advancement of gold exploration and potential development projects, which may lead to gold production or value adding strategic transactions such as earn-in right agreements, option agreements, leases to third parties, joint venture arrangements with other mining companies, or outright sales of assets for cash and/or other consideration. We look for opportunities to improve the value of our gold projects through exploration drilling and/or technical studies focused on optimizing previous engineering work. We do not currently generate cash flows from mining operations.
The Company’s flagship asset is its 100% owned Mt Todd gold project (“Mt Todd”) in the Northern Territory (“NT”) Australia, where we are seeking approval of our finalAustralia. Mt Todd is the largest undeveloped gold project in Australia. The Company recently received authorization for the last major environmental authorizationpermit needed and evaluating potential material process improvements in anticipation of commencingcompleted an update of our July 2014updated Preliminary Feasibility Study (“PFS”).
Ultimately, a development decision atfor Mt Todd, will depend on several factors, principally a sustainable acceptable gold price, a favorable outlook forwhich confirms the AUD:USD exchange rate, completion of a positive feasibility study and the availability
of financing. With 60%-70% of the project capital and operating costs denominated in Australian dollars, the current AUD:USD exchange rate has a material favorable impact on the projectproject’s robust economics substantially mitigating the effects of the lower current USDat today’s gold price.
As one of the largest, undeveloped single-deposit gold projectsWith these important milestones complete, Vista is in Australia, we believe Mt Todd is a highlyposition to actively pursue strategic gold project with several potential paths to production. Our strong working capital position provides us flexibility and the assurancealternatives that we can continue to fund further optimization studies at Mt Todd, and to select a development strategy that we believe will haveprovide the best potentialopportunity to maximize value for our shareholders.
Significant Developments in 2016
Mt Todd
In late 2016, we completed preliminary Mt Todd process area optimization studies that indicated that selective screening and rejecting sub-economic, coarse crusher product prior to grinding could be expected to produce higher gold recoveries and lower process area operating costs.
See the section heading “Item 2. Properties – Mt Todd Gold Project, Northern Territory, Australia” above.
Corporate
In 2016, the Company received a total of $1,295 Research & Development (“R&D”) Tax Incentive refunds, net of costs to prepare and file.These amounts were paid under the Australian Government’s R&D Tax Incentive Program, a program designed to encourage industry to engage in R&D activities that benefit Australia; and relate to costs we incurred during the 2014 and 2015 fiscal years for qualifying R&D programs. This R&D Tax Incentive program is a self-assessment process, and as such, the Australian Government has the right to review the qualifying programs and expenditures for a period of four years.
During August 2016, we closed a public offering of 12,362,500 units (the “Units”), which included 1,612,500 Units issued pursuant to the full exercise of the underwriters’ over-allotment option, for net proceeds of approximately $15,883 (the “2016 Offering”). Each Unit consisted of one common share in the capital of the Company (“Common Share”) and one-half of one Common Share purchase warrant (each full warrant, a “2016 Warrant”). A total of 6,514,625 2016 Warrants were issued, including 333,375 broker warrants issued to the underwriters. Each 2016 Warrant entitles the holder thereof to purchase one Common Share at a price of $1.92 per Common Share (subject to adjustment in certain circumstances) and is exercisable for a period of 36 months from the closing of the 2016 Offering.Company.
Results from Operations
Summary
Through 2016,2017, we continued to effectively execute a strategy of strict cost control while completing selected discretionary programs that are expected to add value to Mt Todd. In January 2018, we announced completion of an updated PFS for Mt Todd (see the section heading “Item 2. Properties – Mt Todd Gold Project, Northern Territory,
Australia” above). As a result of an equity financing completed in 2016, we believe we are well funded, and do notwe have anyno debt.
Consolidated net loss for the year ended December 31, 2017 was $12,035 or $0.12 per basic share. Consolidated net loss for the year ended December 31, 2016 was $3,133 or $0.04 per basic share. Consolidated net income for the year ended December 31, 2015 was $1,011 or $0.01 per basic share. Consolidated net loss for the year ended December 31, 2014 was $18,926 or $0.23 per basic share. The principal components of our 20162017 net incomeloss and these year-over-year changes are discussed below.
Exploration, property evaluation and holding costs
Exploration, property evaluation and holding costs, including fixed cash costs, cash discretionary programs, and non-cash stock-based compensation, were $6,931, $4,303 $4,265 and $3,991$4,265 during the years ended December 31, 2017, 2016, and 2015, and 2014, respectively. These costs are predominantly associated with Mt Todd. For the years ended December 31, 2017, 2016 and 2015, and 2014our fixed costs (those
(which include cash expenditures necessary to ensure that we preserve our property rights and meet all of our safety, regulatory and environmental responsibilities) in AUD terms were substantially unchanged year-to-year,period over period, consistent with our expectations. The 2017 discretionary programs totaled approximately $3,500, significantly higher than in previous years. The material 2017 discretionary programs included: the completion of the drilling program to generate the 20 tonne sample for use in the ore sorting testing program; the ore sorting testing program and subsequent metallurgical studies, including grinding studies, to confirm the potential for improved gold recoveries; the substantial completion of the PFS update; and preparation of a draft Mine Management Plan (“MMP”).
During 2016 we completed approximately $400 in discretionary programs consisting mainly of permitting, engineering and project optimization studies. During 2015 we completed discretionary proof-of-concept drilling programs on the exploration and mineral licenses at a total cost of approximately $650.
Included in the 2017, 2016 and 2015 Exploration, property evaluation and 2014holding costs is non-cash stock-based compensation of $260, $193 and $244, and $251, respectively.
The weaker Australian dollar in 2015 compared to 2014 resulted in a U.S. dollar cost reduction of approximately $642.
Included in the 2016 costs is the provision for environmental liability of $350, see Note 1514 to the Consolidated Financial Statements for further discussion.
Corporate administration
Corporate administration costs, including fixed cash costs, cash discretionary programs, and non-cash stock-based compensation, were $3,527, $2,944 $3,888 and $3,798$3,888 for the years ended December 31, 2017, 2016, 2015, and 20142015, respectively. Several marginal cost reductions were realized in 2017 and 2016. Discretionary programs totaling approximately $327, $145 and $520 are included in the 2017, 2016 and 2015 costs, respectively; there were no similar programs in 2014. The 2014 cost included $148 of severance costs resulting from the 2013 staff reductions; there were no severance costs in 2016 or 2015.respectively.
Included in the 2017, 2016 and 2015 and 2014 Corporate administrationcosts is non-cash stock-based compensation of $614, $454 $573 and $875,$573, respectively. Stock-based compensation is higher in 2017 mainly due to increases in grant date fair values per restricted stock units (“RSU”).
Gain on disposal of mineral property
Long Valley claims
During the first quarter of 2017, we sold our Long Valley unpatented mining claims located in California for consideration, net of transaction costs, of $358 which was paid at closing; a future payment of $500 one month after the start of commercial production; a future payment of $500 on or prior to the first anniversary of the start of commercial production; and a net smelter return royalty (“NSR”) on any future production from said claims at a variable rate between 0.5% and 2.0% depending on the average gold price realized. This sale resulted in a realized gain of $358.
Utah claims
During the first quarter of 2016, we sold our unpatented mining claims located in Utah for $150 and a 2% net smelter return royaltyNSR on any future production from said claims. This resulted in a realized gain of $150.
Los Cardones
In October 2013, we sold our 100% debt and equity participation in the Los Cardones gold project located in Baja California Sur, Mexico (“Los Cardones Sale”) to Invecture Group, S.A. de C.V. (“Invecture”) and RPG Structrued Finance S.a.R.L. (together, the “Purchasers”) for a total of $13,000 ($7,000 of which was paid in October 2013 and $6,000 was originally payable January 2014 (the “Subsequent Payment”) subject to the Purchasers’ option to elect to not make the Subsequent Payment). In 2014, the due date for the Subsequent Payment was extended to January 30, 2015 for additional consideration of $500 payable.$500. In October 2014, Invecture announced that the Los Cardones gold project, had been suspended because the conditions for its development were not favorable at that time, which introduced substantial doubt that the Subsequent Payment would be made. After making this announcement, there were no apparent significant favorable changes to incentivize Invecture to lift the suspension. In January 2015, we agreed to amend the payment terms (the “Amendment”) of the Los Cardones Sale. Under the Amendment, the Company received a payment of $2,994 net of legal costs from the Purchasers as full and final payment for 100% of the Company’s interest in the project, which resulted in a realized gain of $1,958.
There were no similar transactions during the year ended December 31, 2014.
Write-down value-added tax receivable
For the year ended December 31, 2015, we incurred a non-cash write-down associated with value-added tax (“VAT”) receivable in Mexico of $572. The Mexican tax authorities have denied our claim for the VAT recovery; we are contesting their position. No similar write-downwrite-downs occurred during the years ended December 31, 2016 or 2014.
Write-down of Amayapampa interest
In December 2014, the owner of the Amayapampa gold project completed the sale of 100% of the project to a private investor. Accordingly, at that time, we evaluated the carrying value of our interest in Amayapampa. Given the frequency of ownership changes over the past several years, the conditions in the gold market, and the political climate in Bolivia, we concluded that there was no more than a remote possibility that the Amayapampa project would be successfully developed and operated within the foreseeable future; and an impairment amount equal to the $4,813 carrying value was included in our Consolidated Statements of Income/(Loss) and Comprehensive Income/(Loss) for the year ended December 31, 2014. There were no similar charges for the year ended December 31, 2016 or 2015.
Write-down of mineral properties
During 2014, we completed a review of the permitting process and probable impediments to developing the Long Valley gold project, and concluded that the permitting process could consume significant resources and last for a protracted period of time. Accordingly, we determined that we would not advance the project. As a result, an impairment amount equal to the $750 carrying value was taken for the year ended December 31, 2014. There were no similar charges for the years ended December 31, 2016 or 2015.2017.
Non-operating income and expenses
Gain/(loss) on Other Investments
Gain/(loss) on other investments was $(1,248), $3,196 $(1,593) and $(4,112)$(1,593) for the years ended December 31, 2017, 2016 2015 and 2014,2015, respectively. These amounts are the result of changes in fair value of our Midas Gold Shares. The 2015 loss includes a realized loss of $348 on the sale of 8,000,000 Midas Gold Shares; the 2014 loss is net of a realized gain of $155 on the sale of 16,000,000 Midas Gold Shares. There were no similar sales during the yearyears ended December 31, 2017 and 2016.
Research and development grant
During the yearyears ended December 31, 2016 and 2015, the Company received Research & Development (“R&D”) Tax Incentive payments totaling $1,295 and $10,220, respectively, net of costs to prepare and file. These amounts were paid under the Australian Government’s R&D Tax Incentive Program, a program designed to encourage industry to engage in R&D activities that benefit Australia; and relate to costs we incurred during the 2012, 2013, 2014 and 2015 fiscal years for qualifying R&D programs.
This R&D Tax Incentive program is a self-assessment process, and as such, the Australian Government has the right to review the qualifying programs and expenditures for a period of four years.
There were no similar grants for the year ended December 31, 2014.2017.
Financial Position, Liquidity and Capital Resources
Operating Activities
Net cash provided by/(used in) operating activities was $(5,024)$(8,801), $3,009$(5,024) and $(7,058)$3,009 for the years ended December 31, 2017, 2016, 2015, and 2014,2015, respectively. These amounts in 2016 and 2015 include grants totaling $1,295 and $10,220,
respectively, net of costs to prepare and file respectively, from the Government of Australia related to research and development expenditures we incurred in 2012 through 2015. Other material factors that contributed to the positive year-over-year change are discussed in “Results from Operations” above.
Investing Activities
Investing Activitiesshort-term investments comprised of U.S. Government Treasury bills and notes, net of purchases, of $6,831. Proceeds of $1,761, net of legal costs, were received from the first option payment for the Guadalupe de los Reyes gold/silver project and the Long Valley gold claims (discussed in “Note 4 of the Consolidated Financial Statements” below).
Net cash of $9,872 for the year ended December 31, 2016 was primarily used for the purchase of short-term investments comprised of U.S. Government Treasury bills and notes, net of redemptions.
Cash provided byused in investing activities for the year ended December 31, 2015 was comprised of proceeds received from the Los Cardones Sale (defined in “Note 4 of the Consolidated Financial Statements” below) of $2,994 net of legal costs, the Guadalupe de los Reyes Option Agreement (defined in “Item 2: Properties” above)an option payment of $496, net of legal costs, related to an option agreement for GdlR that terminated in 2016, and the sale of 8,000,000 Midas Gold Shares for net proceeds of $2,772.$2,772; net of $11,990 was used to purchase short-term investments comprised of U.S. and Australian Government Treasury bills, net of redemptions.
Net cash provided by investing activities of $11,641 for the year ended December 31, 2014 was primarily due to the sale of 16,000,000 Midas Gold Shares for net proceeds of $10,560 and $1,028 received from the Los Cardones sale and the Guadalupe de los Reyes Option Agreement. Financing Activities
Financing ActivitiesNet cash of $264 for 2017 was utilized for the payment of certain employee withholding tax obligations in lieu of the issuance of common shares.
Net cash of $15,898 was provided by financing activities, $15,883 of which, was provided by the August 2016 Offeringpublic offering and $15 of which was provided by the exercise of stock options.
There were no cash transactions from financing activities during year ended December 31, 2015.
Net cash used in financing activities was $6,344 for the year ended December 31, 2014 was a result of the repayment of a loan facility entered into in 2013.2015.
Liquidity and Capital Resources
Cash flows generated during the year ended December 31, 2016 included net proceeds of $15,883 from the 2016 Offering and the receipt of grants totaling $1,295, net of costs to prepare and file, from the Government of Australia related to the R&D Tax Incentive for qualifying R&D expenditures we incurred in 2014 and 2015. Our cash and short-term investments as of December 31, 2016 increased2017 decreased to $23,879$16,575 from $12,892$23,879 at December 31, 2015; and our2016 due mainly to expenditures for operating activities. Our net working capital increaseddecreased to $28,438$19,057 as at December 31, 20162017 from $14,399$28,438 at December 31, 20152016 due mainly to these transactions.the decrease in cash and short-term investments to fund operating activities and the decrease in the market value of our Midas Gold Shares.
With the completion ofWe believe that our the 2016 Offering, we believe we are well funded, with sufficientexisting working capital, together with potential future sources of non-dilutive financing, will be sufficient to coverfully fund our currently planned fixed costs (those cash expenditures necessary to ensure that we preserve our property rights and meet all of our safety, regulatory and environmental responsibilities), which are expected to average $1,400 to $1,600 per quarter, for several years (depending on the timing and scope of discretionary and permitting programs); to continue to execute selected discretionary programs intended to optimize and add value to Mt Todd; and to complete all of the critical milestones, including permitting, necessary to advance the Mt Todd project to the point of a development decision.programs.
Potential future sources of non-dilutive financing include the sale of non-core assets such as our used mill equipment and other non-core assets such asfuture option payments for the Guadalupe de los Reyes (described in “Item 2: Properties” above);gold/silver project; and, depending on market conditions, the sale of some or all of our remaining common shares of Midas Gold Corp. (“Midas Gold Shares”).Shares. We do not currently expect that R&D grants from the Australian Government will be a material source of Australia, if any, arenear term funding.
In addition to the potential for non-dilutive financing, during November 2017, the Company entered into an At-the-Market offering agreement (the “ATM Agreement”) with H. C. Wainwright & Co., LLC (“Wainwright”) to provide additional balance sheet flexibility at a low cost. Under the ATM Agreement the Company may, but is not expectedobligated to, issue and sell shares of the Company’s common stock through Wainwright as sales manager in an At-the-Market offering under a prospectus supplement for aggregate sales proceeds of up to $10,000 (the “ATM Program”). The ATM Agreement will remain in full force and effect until the earlier of August 31, 2020, or the date that the ATM Agreement is terminated in accordance with the terms therein. Offers or sales of common shares under the ATM Program will be materialmade only in the United States and no offers or sales of common shares under the Agreement will be made in Canada. The common stock will be distributed At-the-Market prices prevailing at the time of sale. As a result, prices of the
common stock sold under the ATM Program may vary during the period of distribution. The ATM Agreement provides that Wainwright will be entitled to compensation for its services at a commission rate of 2.0% of the gross sales price per share of common stock sold. The Company reimbursed certain legal expenses of Wainwright totaling $50 and incurred additional accounting, legal, and regulatory costs of approximately $156 in connection with establishing the ATM Program. Such costs have been expensed as incurred during 2017. At December 31, 2017 no offers or sales had been made under the ATM Program.
The continuing long-term viability of the Company is dependent upon our ability to secure sufficient funding and ultimately to generate future profits from operations or sales of assets. The underlying value and recoverability of the amounts shown as mineral properties and plant and equipment in our Consolidated Balance Sheets are dependent on our ability to fund exploration and development activities that could lead to profitable production or proceeds from the disposition of these assets.
Fair Value Accounting
The following table sets forth the Company’s assets measured at fair value by level within the fair value hierarchy. As required by accounting guidance, assets are classified in their entirety based on the lowest level of input that is significant to the fair value measurement.
| | | | | | | | | | | | | | | | | | | | |
| | Fair value at December 31, 2016 | | | Fair value at December 31, 2017 | |
| | Total | | Level 1 | | Level 3 | | | Total | | Level 1 | | Level 3 | |
Marketable securities | | $ | 109 | | $ | 109 | | $ | — | | | $ | 90 | | $ | 90 | | $ | — | |
Other investments (Midas Gold Shares) | | | 4,994 | | | 4,994 | | | — | | | | 3,746 | | | 3,746 | | | — | |
Used mill equipment (non-recurring) | | | 6,500 | | | — | | | 6,500 | | | | 6,500 | | | — | | | 6,500 | |
| | | | | | | | | | | |
| | Fair value at December 31, 2015 | | |
| | Total | | Level 1 | | Level 3 | | |
Marketable securities | | $ | 61 | | $ | 61 | | | — | | |
Other investments (Midas Gold Shares) | | | 1,798 | | | 1,798 | | | — | | |
Used mill equipment (non-recurring) | | | 6,500 | | | — | | | 6,500 | | |
| | | | | | | | | | |
| | Fair value at December 31, 2016 | |
| | Total | | Level 1 | | Level 3 | |
Marketable securities | | $ | 109 | | $ | 109 | | | — | |
Other investments (Midas Gold Shares) | | | 4,994 | | | 4,994 | | | — | |
Used mill equipment (non-recurring) | | | 6,500 | | | — | | | 6,500 | |
Our marketable securities and investment in Midas Gold Shares are classified as Level 1 of the fair value hierarchy as they are valued at quoted market prices in an active market. Marketable securities are included in other current assets on the Consolidated Balance Sheets for each period presented.
The mill equipment is classified as Level 3 of the fair value hierarchy as its value at December 31, 20162017 and 20152016 was based on an independent third partythird-party valuation. The mill equipment is included in plant and equipment on the Consolidated Balance Sheets for each period presented.
There were no transfers between levels nor were there any changes in valuation techniques in 2016.2017.
Off-Balance Sheet Arrangements
We have no off-balance sheet arrangements required to be disclosed in this annual report on Form 10-K.
Contractual Obligations
During November 2015, we entered into a two-year lease agreement to store our used mill equipment. Monthly rent for the termWe have no material contractual obligations as of the lease is C$18 ($13).December 31, 2017.
Summary of Quarterly Results
| | | | | | | | | | | | | |
| | 4th quarter | | 3rd quarter | | 2nd quarter | | 1st quarter | |
2016 | | | | | | | | | | | | | |
Revenue | | $ | — | | $ | — | | $ | — | | $ | — | |
Net income/(loss) | | | (1,973) | | | (2,083) | | | 1,637 | | | (714) | |
Basic income/(loss) per share | | | (0.03) | | | (0.02) | | | 0.02 | | | (0.01) | |
2015 | | | | | | | | | | | | | |
Revenue | | | — | | | — | | | — | | | — | |
Net income/(loss) | | | (2,167) | | | 536 | | | 3,589 | | | (947) | |
Basic income/(loss) per share | | | (0.03) | | | 0.01 | | | 0.04 | | | (0.01) | |
Summary of Quarterly Results
| | | | | | | | | | | | | |
| | 4th quarter | | 3rd quarter | | 2nd quarter | | 1st quarter | |
2017 | | | | | | | | | | | | | |
Revenue | | $ | — | | $ | — | | $ | — | | $ | — | |
Net income/(loss) | | | (3,851) | | | (2,655) | | | (2,682) | | | (2,847) | |
Basic income/(loss) per share | | | (0.03) | | | (0.03) | | | (0.03) | | | (0.03) | |
2016 | | | | | | | | | | | | | |
Revenue | | | — | | | — | | | — | | | — | |
Net income/(loss) | | | (1,973) | | | (2,083) | | | 1,637 | | | (714) | |
Basic income/(loss) per share | | | (0.03) | | | (0.02) | | | 0.02 | | | (0.01) | |
Critical Accounting Policies and Recent Accounting Pronouncements
Critical accounting policies
Use of Estimates
The Company’s Consolidated Financial Statements have been prepared in accordance with generally accepted accounting principles in the United States (“U.S. GAAP”). The preparation of the Company’s Consolidated Financial Statements requires the Company to make estimates and assumptions that affect the reported amounts of assets, liabilities, income and expenses during the reporting period. The more significant areas requiring the use of management estimates and assumptions are: the fair value and accounting treatment of financial instruments including marketable securities; useful lives of assets for asset depreciation purposes; valuation allowances for deferred tax assets; the fair value and accounting treatment of stock-based compensation; the provision for environmental liabilities; and asset impairments (including impairments long-lived assets and investments).impairments. The Company bases its estimates on historical experience and on various other assumptions that are believed to be reasonable under the circumstances. Accordingly, actual results will likely differ from the amounts estimated in these financial statements.
Cash and cash equivalents
Cash and cash equivalents include cash on hand and government securities with original maturities of three months or less when purchased. Because of the short maturity of these investments, the carrying amounts approximate their fair valuevalue.
Foreign Currency Transactions
Our functional currency is the U.S. dollar. Gains and losses resulting from foreignForeign currency transactions denominated in currency other than the functional currency are recorded at the approximate rate of exchange at the transaction date and gains/(losses) resulting therefrom are recorded in other expense. For each of the years ended December 31, 2017, 2016 and 2015, we recorded insignificant net foreign currency gains/(losses).
Short-term Investments
Short-term investments consist of securities with original maturity dates greater than ninety days and less than one year. These securities are typically United States and Australian government treasury bills and/or notes. Australian dollar denominated treasury bills may result in currency risk associated with fluctuation in exchanges rates. Short-term investments are recorded at amortized cost and are classified as debt securities held-to-maturity as the Company has the intention and ability to hold these instruments until their original maturity date at the time of purchase.
Mineral Properties
Mineral property acquisition costs, including directly related costs, are capitalized when incurred, and mineral property exploration costs are expensed as incurred. When we determine that a mineral property can be economically developed in accordance with U.S. GAAP and SEC Industry Guide 7 reserves are established, the costs then incurred to develop
such property will be capitalized. Capitalized costs will be depleted using the units-of-production method over the estimated life of the proven and probable reserves. If mineral properties are subsequently abandoned or impaired, any undepleted costs will be charged to loss in that period.
The recoverability of the carrying values of our mineral properties is dependent upon economic reserves being discovered or developed on the properties, permitting, financing, start-up, and commercial production from, or the sale/lease of, or other strategic transactions related to these properties. Development and/or start-up of any of these projects will depend on, among other things, management’s ability to raise additionalsufficient capital for these purposes.
We assess the carrying cost of our mineral properties for impairment whenever information or circumstances indicate the potential for impairment. This would include events and circumstances such as our inability to obtain all the necessary
permits, changes in the legal status of our mineral properties, government actions, the results of exploration activities and technical evaluations and changes in economic conditions, including the price of gold and other commodities or input prices. Such evaluations compare estimated future net cash flows with our carrying costs and future obligations on an undiscounted basis. If it is determined that the estimated future undiscounted cash flows are less than the carrying value of the property, a write-down to the estimated fair value will then be reported in our Consolidated Statement of Income/(Loss) and Comprehensive Income/(Loss) for the period. Where estimates of future net cash flows are not determinable and where other conditions indicate the potential for impairment, management uses available market information and/or third partythird-party valuation experts to assess if the carrying value can be recovered and to estimate fair value.
Impairment
Carrying values of long-lived assets, other than mineral properties, are evaluated for impairment at such time that information becomes available indicating that the carrying value may not be recoverable. If it is determined that the fair value is less than the carrying value an impairment charge equal to the difference between the fair value and the carrying value will be recorded in our Consolidated Statements of Income/(Loss) and Comprehensive Income/(Loss).
Stock-Based Compensation
Under our stock option and long-term equity incentive plans, stock incentive options and restricted stock units may be granted to executives, employees, consultants and non-employee directors. Compensation expense for such grants is recorded in the Consolidated Statements of Income/(Loss) and Comprehensive Income/(Loss) as a component of Exploration, property evaluation and holding costs and Corporate administration, with a corresponding increase to Common shares in the Consolidated Balance Sheets. The fair values of the options are calculated using the Black-Scholes option pricing model and forfeiture rates are based on historic trends and future projections, as appropriate.model. The fair value of restricted stock units is based on the closing price of our common shares on the grant date and forfeiture rates are based on historic trends and future projections, as appropriate.date. The expense is based on the fair values of the grant on the grant date and is recognized over the vesting period specified for each grant. The fair value and compensation expense related to RSUs and stock options granted to consultants is marked to market at each period until the RSU or stock option vests. Forfeitures for all stock-based compensation are recorded as incurred.
Financial Instruments
Accounting Standards Codification Topic 820, Fair Value Measurements and Disclosures (“ASC 820”) of the Financial Accounting Standards Board (“FASB”) requires an entity to maximize the use of observable inputs and minimize the use of unobservable inputs when measuring fair value. ASC 820 establishes a fair value hierarchy based on the level of independent, objective evidence surrounding the inputs used to measure fair value. A financial instrument’s categorization within the fair value hierarchy is based upon the lowest level of input that is significant to the fair value measurement. ASC 820 prioritizes the inputs into three levels that may be used to measure fair value:
| · | | Level 1 – Unadjusted quoted prices in active markets that are accessible at the measurement date for identical, unrestricted assets or liabilities. |
| · | | Level 2 – Observable inputs other than quoted prices included within Level 1 that are observable for the asset or liability, either directly or indirectly, including quoted prices for similar assets and liabilities in active markets; quoted prices for identical or similar assets and liabilities in markets that are not active; or other inputs that are observable or can be corroborated by observable market data by correlation or other means. |
| · | | Level 3 – Prices or valuation techniques requiring inputs that are both significant to the fair value measurement and unobservable. |
Our financial instruments include cash and cash equivalents, marketable securities, short-term investments, accounts payable and certain other current assets and liabilities. Due to the short-term nature of our cash and cash equivalents, short-term investments, accounts payable and certain other current assets and liabilities, we believe that their carrying amounts approximate fair value. Our marketable securities are classified as available-for-sale. Accordingly, these securities are carried at fair value, which is based upon quoted market prices in an active market and included in Level 1
of the fair value hierarchy. Our other investments, comprised of Midas Gold Shares, isare accounted for using the fair value option based on quoted market prices in an active market and is included in Level 1 of the fair value hierarchy. The mill equipment is accounted for using a third-party valuation and is included in Level 3 of the fair value hierarchy.
Research and Development (“R&D”) Grants
The Company has received Research and Development Tax Incentive payments from the Australian Government. The Company’s activities in Australia do not generate revenue subject to Australian income tax. Consequently, the R&D Tax Incentive payment is considered a government grant, as opposed to an income tax refund. Grants are recognized when there is reasonable assurance that the grant will be received and that conditions attached to the grant have been met.
Recent accounting pronouncements
Compensation – Stock Compensation (Topic 718): Improvements to Employee Share-Based Payment Accounting (Accounting Standard Update 2016-09)Leases
In March 2016,The FASB issued ASU No. 2016-02, Leases. The new standard establishes a right-of-use (“ROU”) model that requires a lessee to record a ROU asset and a lease liability on the Financial Accounting Standards Board issued guidance related to accountingbalance sheet for stock-based compensation which is intended to improve the accounting for employee share-based payments and which affects all organizations that issue share-based payment awards to their employees. Several aspects of the accounting for share-based payment award transactions are simplified, including: (a) income tax consequences; (b) classification of awardsleases with terms longer than 12 months. Leases will be classified as either equityfinance or liabilities; and (c)operating, with classification onaffecting the statementpattern of cash flows. For public companies,expense recognition in the amendments areincome statement. The new standard is effective for interim and annual periods beginning after December 15, 2016,2018. A modified retrospective transition approach is required for lessees for capital and interim periods within those annual periods. Earlyoperating leases existing at, or entered into after, the beginning of the earliest comparative period presented in the financial statements, with certain practical expedients available. We are evaluating the impact the adoption is permitted for any organization in any interim or annual period. For the year ended December 31, 2016,of ASU 2016-02 may have. However, based upon our initial reviews, we adopteddo not currently anticipate that adoption of this guidance which did notstandard will have a materialsignificant impact on our financial statements.
Revenue Recognition
The FASB issued ASU No. 2014-09, Revenue from Contracts with Customers (Topic 606). ASU No. 2014-09, as subsequently amended, supersedes the revenue recognition requirements in Revenue Recognition (Topic 605), and most industry-specific guidance throughout the Industry Topics of the Codification. Additionally, ASU No. 2014-09 supersedes some cost guidance included in Revenue Recognition-Construction-Type and Production-Type Contracts (Subtopic 605-35). Under ASU No. 2014-09, an entity should recognize revenue when it transfers promised goods or services to customers in an amount that reflects the consideration to which the entity expects to be entitled in exchange for those goods or services. ASU No. 2014-09 also requires additional disclosure about the nature, amount, timing, and uncertainty of revenue and cash flows arising from customer contracts. This includes significant judgments and changes in judgments and assets recognized from costs incurred to obtain or fulfill a contract. Additionally, from time to time, the Company may enter into transactions whereby it sells certain property, plant and equipment. In these instances, certain principles of ASC 606 may apply when recognizing a gain or loss on the transaction even though the transaction is not considered to be in the normal course of business. ASU No. 2014-09 states that entities should apply guidance related to transfer of control and measurement of the transaction price when evaluating the timing and amount of the gain or loss to be recognized. The new guidance is effective for interim and annual periods beginning after December 15,
2017. The Company is evaluating the impact of the adoption of ASU 2014-09 as it relates to the option agreements for Guadalupe de los Reyes, specifically analyzing the impact of any distinct performance obligations, variable consideration, and possible constraints.
Investments
The FASB issued ASU No. 2016-01 was issued related to financial instruments. The new guidance requires entities to measure equity investments that do not result in consolidation and are not accounted for under the equity method at fair value and recognize any changes in fair value in net income. This new guidance also updates certain disclosure requirements for these investments. This update is effective in fiscal years, including interim periods, beginning after December 15, 2017, and upon adoption, an entity should apply the amendments with the cumulative effect of initially applying the guidance recognized at January 1, 2018. Early adoption is not permitted. The Company expects the updated guidance to result in a reclassification of unrealized holding gains and losses and deferred income taxes related to investments in marketable equity securities from Accumulated other comprehensive income (loss) to Retained earnings in the Consolidated Balance Sheets upon adoption. Accumulated other comprehensive income (loss) at December 31, 2017 included $17 of unrealized holding gains and losses related to marketable equity securities.
Stock-based Compensation
The FASB issued ASU 2017-09, Compensation — Stock Compensation — Scope of Modification Accounting (“ASU 2017-09”), which provides guidance about the types of changes to terms or conditions of a share-based payment award that would require an entity to apply modification accounting. The new guidance is effective for fiscal years beginning after December 15, 2017, including interim periods within those fiscal years. Early adoption is permitted. The amendments in this update should be applied prospectively to an award modified on or after the adoption date.
Income Taxes
On December 22, 2017, Staff Accounting Bulletin No. 118 (“SAB 118”) was issued to address the application of U.S. GAAP in situations when a registrant does not have the necessary information available, prepared, or analyzed (including computations) in reasonable detail to complete the accounting for certain income tax effects of the Tax Cuts and Jobs Act. We determine if the assessment of a particular income tax effect is “complete” or “incomplete” as of the due date of the financial statements. Those effects for which the accounting is determined to be complete are reported in the enactment period financial statements.
For those effects determined to be incomplete, we determine whether a reasonable estimate of those effects can be made. If a reasonable estimate can be made, the estimate is recognized as a provisional amount. If a reasonable estimate cannot be made, no effects are recognized as provisional amounts until the first reporting period in which a reasonable estimate can be made. Provisional amounts are updated when additional information becomes available and the evaluation of such information is complete. We complete the accounting for all provisional amounts within a measurement period of up to one year from the enactment date.
ITEM 7A7A. QUANTITATIVE AND QUALITATIVE DISCLOSURES ABOUT MARKET RISK.
Certain of the Company’s financial instruments are exposed to currency, credit and price risks. We do not currently hedge our exposure to any of these risks.
Currency risk
We are exposed to financial risk related to the fluctuation of foreign exchange rates. We operate in Australia and in the gold mining industry.United States. We are focused onreport our financial results in U.S. currency. A significant change in the evaluation, acquisition, explorationcurrency exchange rate between the Australian dollar and advancementthe U.S. dollar could affect our results of gold exploration and potential development projects, which may lead to gold productionoperations, financial position or value adding strategic transactions such as earn-in right agreements, option agreements, leases to third parties, joint venture arrangements with other mining companies, or outright sales of assets for cash and/or other consideration. The value offlows.
We typically limit our properties, as well as our investmentholdings in Midas Gold shares, is closely relatedAustralian dollars to the priceamount required to fund one month of gold, and changes in the price of gold could affect the value of, and/or our ability to generate revenue from, these assets.
Gold prices may fluctuate widely from time to time and are affected by numerous factors, including: expectations with respect to the rate of inflation, exchange rates, interest rates, global and regional political and economic circumstances and governmental policies, including those with respect to gold holdings by central banks. The demand for and supply of gold affect gold prices, but not necessarily in the same manner as demand and supply affect the prices of other commodities. The supply of gold consists of a combination of new mine production and existing stocks of bullion and fabricated gold held by governments, public and private financial institutions, industrial organizations and private individuals. The demand for gold primarily consists of jewelry and investments. Additionally, hedging activities by producers, consumers, financial institutions and individuals can affect gold supply and demand. Because of these dynamics, it is extremely difficult to predict the future market value of gold with any certainty.
Our principal gold project is located in Australia, consequently we are subject to Australian dollar currency fluctuations. We do not engage in currency hedging to offset any risk of currency fluctuations.operating activities.
Credit risk
Concentration of credit risk exists related to our cash and cash equivalents and short-term investments. Our Australian dollar cash is held in a major Australian chartered bank. Similarly, in the United States we hold U.S. dollar cash in a major U.S. bank. Our surplus cash is invested in government securities, principally notes and/or bills issued by the Treasury Dept. of the United States, and, occasionally notes and/or bills issued by the Government of Australia.
Other Price Risk
Other price risk is the risk that the fair value or future cash flows of a financial instrument will fluctuate because of changes in market prices, other than those arising from interest rate risk or foreign exchange risk. The Company’s investment in the common shares of Midas Gold is exposed to such risk.
Metal Price Risk
Changes in the market price of gold significantly affect the value of our assets, including our shares of Midas Gold. Gold prices can fluctuate widely due to numerous factors, such as demand; forward selling by producers; central bank sales, purchases and lending; investor sentiment; the strength of the U.S. dollar; inflation, deflation, or other general price instability; geopolitical events; and global mine production levels.
ITEM 8. FINANCIAL STATEMENTS AND SUPPLEMENTARY DATA.
Management’s Report on Internal Control Over Financial Reporting
The management of Vista Gold Corp. (the “Company”) is responsible for establishing and maintaining adequate internal control over financial reporting. Internal control over financial reporting is a process designed by, or under the supervision of, the Company’s principal executive and principal financial officers and effected by the Company’s board of directors (the “Board”), management and other personnel, to provide reasonable assurance regarding the reliability of financial reporting and the preparation of financial statements for external purposes in accordance with generally accepted accounting principles. Because of its inherent limitations, internal control over financial reporting may not prevent or detect misstatements. Also, projections of any evaluation of effectiveness to future periods are subject to risk that controls may become inadequate because of changes in conditions, or that the degree of compliance with the policies or procedures may deteriorate.
The Company’s management assessed the effectiveness of the Company’s internal control over financial reporting at December 31, 2016.2017. In making this assessment, the Company’s management used the criteria set forth by the Committee of Sponsoring Organizations of the Treadway Commission Internal Control-Integrated Framework in 2013. Based upon its assessment, management concluded that, at December 31, 2016,2017, the Company’s internal control over financial reporting was effective.
The effectiveness of the Company’s assessment of internal control over financial reporting at December 31, 20162017 has been audited by EKS&H LLLP, an independent registered public accounting firm, as stated in their report which appears herein.
Report of Independent Registered Public Accounting Firm
To the Shareholders and Board of Directors and Shareholders
Vista Gold Corp.
Littleton, Colorado
OPINIONS ON THE CONSOLIDATED FINANCIAL STATEMENTS AND INTERNAL CONTROL OVER FINANCIAL REPORTING
We have audited the accompanying consolidated balance sheets of Vista Gold Corp. and subsidiaries (the “Company”) as of December 31, 20162017 and 2015,2016, and the related consolidated statements of income (loss) and comprehensive income (loss), shareholders’shareholders' equity, and cash flows, for each of the yearsyear in the three-yearthree‑year period ended December 31, 2016, 2015,2017, and 2014.the related notes (collectively referred to as the “financial statements’). We have also audited the Company’sCompany's internal control over financial reporting as of December 31, 2016,2017, based on the criteria established in Internal Control—Control ‑ Integrated FrameworkFramework: (2013) issued by the Committee of Sponsoring Organizations of the Treadway Commission (“COSO”).
In our opinion, the financial statements referred to above present fairly, in all material respects, the financial position of the Company as of December 31, 2017 and 2016, and the results of its operations and its cash flows for each year in the three‑year period ended December 31, 2017, in conformity with accounting principles generally accepted in the United States of America. Also, in our opinion, the Company maintained, in all material respects, effective internal control over financial reporting as of December 31, 2017, based on criteria established in Internal Control ‑ Integrated Framework: (2013) issued by COSO.
BASIS FOR OPINIONS
The Company’sCompany's management is responsible for these financial statements, for maintaining effective internal control over financial reporting, and for its assessment of the effectiveness of internal control over financial reporting, included in the accompanying Management’sManagement's Report on Internal Control Overover Financial Reporting. Our responsibility is to express an opinion on thesethe Company's financial statements and an opinion on the Company’sCompany's internal control over financial reporting based on our audits.
We are a public accounting firm registered with the Public Company Accounting Oversight Board (United States) (“PCAOB”) and are required to be independent with respect to the Company in accordance with the U.S. federal securities laws and the applicable rules and regulations of the Securities and Exchange Commission and the PCAOB.
We conducted our audits in accordance with the standards of the Public Company Accounting Oversight Board (United States).PCAOB. Those standards require that we plan and perform the audits to obtain reasonable assurance about whether the financial statements are free of material misstatement, whether due to error or fraud, and whether effective internal control over financial reporting was maintained in all material respects.
Our audits of the financial statements included performing procedures to assess the risks of material misstatement of the financial statements, whether due to error or fraud, and performing procedures that respond to those risks. Such procedures included examining, on a test basis, evidence supportingregarding the amounts and disclosures in the financial statements, assessingstatements. Our audits also included evaluating the accounting principles used and significant estimates made by management, andas well as evaluating the overall presentation of the financial statement presentation.statements. Our audit of internal control over financial reporting included obtaining an understanding of internal control over financial reporting, assessing the risk that a material weakness exists, and testing and evaluating the design and operating effectiveness of internal control based on the assessed risk. Our audits also included performing such other procedures as we considered necessary in the circumstances. We believe that our audits provide a reasonable basis for our opinions.
DEFINITION AND LIMITATIONS OF INTERNAL CONTROL OVER FINANCIAL REPORTING
A company’scompany's internal control over financial reporting is a process designed to provide reasonable assurance regarding the reliability of financial reporting and the preparation of financial statements for external purposes in accordance with generally accepted accounting principles. A company’scompany's internal control over financial reporting includes those policies and procedures that 1)(i) pertain to the maintenance of records that, in reasonable detail, accurately and fairly reflect the transactions and dispositions of the assets of the company; 2)(ii) provide reasonable assurance that transactions are recorded as necessary to permit preparation of financial statements in accordance with generally accepted accounting principles, and that receipts and expenditures of the company are being made only in accordance with authorizations of management and directors of the company; and 3)(iii) provide reasonable assurance regarding prevention or timely detection of unauthorized acquisition, use, or disposition of the company’scompany's assets that could have a material effect on the financial statements.
Because of its inherent limitations, internal control over financial reporting may not prevent or detect misstatements. Also, projections of any evaluation of effectiveness to future periods are subject to the risk that controls may become inadequate because of changes in conditions, or that the degree of compliance with the policies or procedures may deteriorate.
In our opinion, the consolidated financial statements referred to above present fairly, in all material respects, the financial position of Vista Gold Corp. and subsidiaries as of December 31, 2016 and 2015, and the results of their operations and their cash flows for each of the years in the three-year period ended December 31, 2016, in conformity with accounting principles generally accepted in the United States of America. Also, in our opinion, the Company maintained, in all material respects, effective internal control over financial reporting as of December 31, 2016, based on criteria established in Internal Control—Integrated Framework (2013) issued by the Committee of Sponsoring Organizations of the Treadway Commission (“COSO”).
EKS&H LLLP
February 22, 2017March 6, 2018
Denver, Colorado
We have served as the Company's auditor since 2014.
VISTA GOLD CORP.
CONSOLIDATED BALANCE SHEETS
(Dollar amounts in U.S. dollars and in thousands, except shares)
| | | | | | | | | | | | | | |
| | | | | | | | | | | | |
| | December 31, | | December 31, | | | December 31, | | December 31, | |
| | 2016 | | 2015 | | | 2017 | | 2016 | |
Assets: | | | | | | | | | | | | | | |
Current assets: | | | | | | | | | | | | | | |
Cash and cash equivalents | | $ | 1,904 | | $ | 902 | | | $ | 1,431 | | $ | 1,904 | |
Short-term investments (Note 3) | | | 21,975 | | | 11,990 | | | | 15,144 | | | 21,975 | |
Other investments, at fair value (Note 3) | | | 4,994 | | | 1,798 | | | | 3,746 | | | 4,994 | |
Other current assets | | | 648 | | | 512 | | | | 794 | | | 648 | |
Total current assets | | | 29,521 | | | 15,202 | | | | 21,115 | | | 29,521 | |
| | | | | | | | | | | | | | |
Non-current assets: | | | | | | | | | | | | | | |
Mineral properties (Note 4) | | | 3,874 | | | 3,874 | | | | 2,471 | | | 3,874 | |
Plant and equipment, net (Note 5) | | | 8,213 | | | 8,792 | | | | 7,555 | | | 8,213 | |
Total non-current assets | | | 12,087 | | | 12,666 | | | | 10,026 | | | 12,087 | |
Total assets | | $ | 41,608 | | $ | 27,868 | | | $ | 31,141 | | $ | 41,608 | |
| | | | | | | | | | | | | | |
Liabilities and Shareholders' Equity: | | | | | | | | | | | | | | |
Current liabilities: | | | | | | | | | | | | | | |
Accounts payable | | $ | 252 | | $ | 115 | | | $ | 830 | | $ | 252 | |
Accrued liabilities and other | | | 481 | | | 688 | | | | 986 | | | 481 | |
Provision for environmental liability (Note 15) | | | 350 | | | - | | |
Provision for environmental liability | | | | 242 | | | 350 | |
Total current liabilities | | | 1,083 | | | 803 | | | | 2,058 | | | 1,083 | |
Total liabilities | | | 1,083 | | | 803 | | | | 2,058 | | | 1,083 | |
| | | | | | | | | | | | | | |
Commitments and contingencies – (Note 8) | | | | | | | | | | | | | | |
Shareholders' equity: | | | | | | | | | | | | | | |
Common shares, no par value - unlimited shares authorized; shares outstanding: 2016 - 97,786,608 and 2015 - 82,883,562 (Note 6) | | | 455,443 | | | 438,900 | | |
Common shares, no par value - unlimited shares authorized; shares outstanding: 2017 - 99,412,007 and 2016 - 97,786,608 (Note 6) | | | | 456,053 | | | 455,443 | |
Accumulated other comprehensive income/(loss) | | | 15 | | | (35) | | | | (2) | | | 15 | |
Accumulated deficit | | | (414,933) | | | (411,800) | | | | (426,968) | | | (414,933) | |
Total shareholders' equity | | | 40,525 | | | 27,065 | | | | 29,083 | | | 40,525 | |
Total liabilities and shareholders' equity | | $ | 41,608 | | $ | 27,868 | | | $ | 31,141 | | $ | 41,608 | |
Approved by the Board of Directors
/s/ Tracy A. Stevenson | /s/ John M. Clark |
Tracy A. Stevenson | John M. Clark |
Director | Director |
The accompanying notes are an integral part of these consolidated financial statements.
VISTA GOLD CORP.
CONSOLIDATED STATEMENTS OF INCOME/(LOSS) AND COMPREHENSIVE INCOME/(LOSS)
(Dollar amounts in U.S. dollars and in thousands, except share and per share data)
| | | | | | | | | | | | | | | | | | | | | |
| | | Years Ended December 31, | | | | Years Ended December 31, | |
| | | 2016 | | 2015 | | 2014 | | | | 2017 | | 2016 | | 2015 | |
Operating expense: | | | | | | | | | | | | | | | | | | | | | |
Exploration, property evaluation and holding costs | | $ | (4,303) | | $ | (4,265) | | $ | (3,991) | | | | $ | (6,931) | | $ | (4,303) | | $ | (4,265) | |
Corporate administration | | | (2,944) | | | (3,888) | | | (3,798) | | | | | (3,527) | | | (2,944) | | | (3,888) | |
Depreciation and amortization | | | (618) | | | (694) | | | (863) | | | | | (655) | | | (618) | | | (694) | |
Gain on disposal of mineral property, net (Note 4) | | | 150 | | | 1,958 | | | — | | |
Write-down of mineral property (Note 4) | | | — | | | — | | | (750) | | |
Write-down of Amayapampa interest (Note 9) | | | — | | | — | | | (4,813) | | |
Gain on disposal of mineral properties, net (Note 4) | | | | | 358 | | | 150 | | | 1,958 | |
Write-down of value-added tax receivable | | | — | | | (572) | | | — | | | | | — | | | — | | | (572) | |
Total operating expense | | | (7,715) | | | (7,461) | | | (14,215) | | | | | (10,755) | | | (7,715) | | | (7,461) | |
| | | | | | | | | | | | | | | | | | | | | |
Non-operating income/(expense): | | | | | | | | | | | | | | | | | | | | | |
Gain on sale of marketable securities | | | — | | | 12 | | | 24 | | | | | — | | | — | | | 12 | |
Gain/(loss) on other investments (Note 3) | | | 3,196 | | | (1,593) | | | (4,112) | | | | | (1,248) | | | 3,196 | | | (1,593) | |
Write-down of marketable securities and long-term investments | | | — | | | — | | | (138) | | |
Research and development grant, net (Note 10) | | | 1,295 | | | 10,220 | | | — | | |
Research and development grant, net (Note 9) | | | | | — | | | 1,295 | | | 10,220 | |
Interest income | | | 57 | | | 31 | | | 10 | | | | | 111 | | | 57 | | | 31 | |
Interest expense | | | — | | | — | | | (78) | | |
Other income/(expense) | | | 34 | | | (198) | | | (417) | | | | | (143) | | | 34 | | | (198) | |
Total non-operating income/(expense) | | | 4,582 | | | 8,472 | | | (4,711) | | | | | (1,280) | | | 4,582 | | | 8,472 | |
| | | | | | | | | | | | | | | | | | | | | |
Net income/(loss) | | $ | (3,133) | | $ | 1,011 | | $ | (18,926) | | | | $ | (12,035) | | $ | (3,133) | | $ | 1,011 | |
| | | | | | | | | | | | | | | | | | | | | |
Other comprehensive income/(loss): | | | | | | | | | | | | | | | | | | | | | |
Unrealized fair value increase/(decrease) on available-for-sale securities | | | 50 | | | (46) | | | 70 | | | | | (17) | | | 50 | | | (46) | |
Comprehensive income/(loss) | | $ | (3,083) | | $ | 965 | | $ | (18,856) | | | | $ | (12,052) | | $ | (3,083) | | $ | 965 | |
| | | | | | | | | | | | | | | | | | | | | |
Basic: | | | | | | | | | | | | | | | | | | | | | |
Weighted average number of shares outstanding | | | 89,064,260 | | | 82,571,182 | | | 82,294,331 | | | | | 98,627,255 | | | 89,064,260 | | | 82,571,182 | |
Net income/(loss) per share | | $ | (0.04) | | $ | 0.01 | | $ | (0.23) | | | | $ | (0.12) | | $ | (0.04) | | $ | 0.01 | |
| | | | | | | | | | | | | | | | | | | | | |
Diluted: | | | | | | | | | | | | | | | | | | | | | |
Weighted average number of shares outstanding | | | 89,064,260 | | | 83,755,080 | | | 82,294,331 | | | | | 98,627,255 | | | 89,064,260 | | | 83,755,080 | |
Net income/(loss) per share | | $ | (0.04) | | $ | 0.01 | | $ | (0.23) | | | | $ | (0.12) | | $ | (0.04) | | $ | 0.01 | |
The accompanying notes are an integral part of these consolidated financial statements.
VISTA GOLD CORP.
CONSOLIDATED STATEMENTS OF SHAREHOLDERS’ EQUITY
(Dollar amounts in U.S. dollars and in thousands, except share amounts)
| | | | | | | | | | | | | | | | | | | | | | | | | | | | | | |
| | | | | | | | | | Accumulated other | | Total | | | | | | | | | | | Accumulated other | | Total | |
| | Common | | | | Accumulated | | comprehensive | | shareholders' | | | Common | | | | Accumulated | | comprehensive | | shareholders' | |
| | shares | | Amount | | deficit | | income/(loss) | | equity | | | shares | | Amount | | deficit | | income/(loss) | | equity | |
Balances at December 31, 2013 | | 82,275,217 | | $ | 436,957 | | $ | (393,885) | | $ | (59) | | $ | 43,013 | | |
| | | | | | | | | | | | | | | | |
Shares issued (RSUs vested) | | 115,000 | | | — | | | — | | | — | | | — | | |
Stock-based compensation | | — | | | 1,126 | | | — | | | — | | | 1,126 | | |
Other comprehensive loss | | — | | | — | | | — | | | 70 | | | 70 | | |
Net loss | | — | | | — | | | (18,926) | | | — | | | (18,926) | | |
Balances at December 31, 2014 | | 82,390,217 | | $ | 438,083 | | $ | (412,811) | | $ | 11 | | $ | 25,283 | | | 82,390,217 | | $ | 438,083 | | $ | (412,811) | | $ | 11 | | $ | 25,283 | |
| | | | | | | | | | | | | | | | | | | | | | | | | | | | | | |
Shares issued (RSUs vested) | | 493,345 | | | — | | | — | | | — | | | — | | | 493,345 | | | — | | | — | | | — | | | — | |
Stock-based compensation | | — | | | 817 | | | — | | | — | | | 817 | | | — | | | 817 | | | — | | | — | | | 817 | |
Other comprehensive loss | | — | | | — | | | — | | | (46) | | | (46) | | | — | | | — | | | — | | | (46) | | | (46) | |
Net income | | — | | | — | | | 1,011 | | | — | | | 1,011 | | | — | | | — | | | 1,011 | | | — | | | 1,011 | |
Balances at December 31, 2015 | | 82,883,562 | | $ | 438,900 | | $ | (411,800) | | $ | (35) | | $ | 27,065 | | | 82,883,562 | | $ | 438,900 | | $ | (411,800) | | $ | (35) | | $ | 27,065 | |
| | | | | | | | | | | | | | | | | | | | | | | | | | | | | | |
Units issued (net of offering costs of $1,425)(Note 6) | | 12,362,500 | | | 15,883 | | | — | | | — | | | 15,883 | | | 12,362,500 | | | 15,883 | | | — | | | — | | | 15,883 | |
Shares issued (RSUs vested/options exercised) | | 2,540,546 | | | 15 | | | — | | | — | | | 15 | | | 2,540,546 | | | 15 | | | — | | | — | | | 15 | |
Stock-based compensation | | — | | | 645 | | | — | | | — | | | 645 | | | — | | | 645 | | | — | | | — | | | 645 | |
Other comprehensive income | | — | | | — | | | — | | | 50 | | | 50 | | | — | | | — | | | — | | | 50 | | | 50 | |
Net loss | | — | | | — | | | (3,133) | | | — | | | (3,133) | | | — | | | — | | | (3,133) | | | — | | | (3,133) | |
Balances at December 31, 2016 | | 97,786,608 | | $ | 455,443 | | $ | (414,933) | | $ | 15 | | $ | 40,525 | | | 97,786,608 | | $ | 455,443 | | $ | (414,933) | | $ | 15 | | $ | 40,525 | |
| | | | | | | | | | | | | | | | |
Shares issued (RSUs vested, net of shares withheld) | | | 1,625,399 | | | (264) | | | — | | | — | | | (264) | |
Stock-based compensation | | | — | | | 874 | | | — | | | — | | | 874 | |
Other comprehensive loss | | | — | | | — | | | — | | | (17) | | | (17) | |
Net loss | | | — | | | — | | | (12,035) | | | — | | | (12,035) | |
Balances at December 31, 2017 | | | 99,412,007 | | $ | 456,053 | | $ | (426,968) | | $ | (2) | | $ | 29,083 | |
The accompanying notes are an integral part of these consolidated financial statements.
VISTA GOLD CORP.
CONSOLIDATED STATEMENTS OF CASH FLOWS
(Dollar amounts in U.S. dollars and in thousands)
| | | | | | | | | | | | | | | | | | | | |
| | Year ended December 31, | | | Year ended December 31, | |
| | 2016 | | 2015 | | 2014 | | | 2017 | | 2016 | | 2015 | |
Cash flows from operating activities: | | | | | | | | | | | | | | | | | | | | |
Net income/(loss) for the period | | $ | (3,133) | | $ | 1,011 | | $ | (18,926) | | | $ | (12,035) | | $ | (3,133) | | $ | 1,011 | |
Adjustments to reconcile net income/(loss) for the period to net provided by/(cash used) in operations: | | | | | | | | | | | |
Adjustments to reconcile net income/(loss) for the period to net cash provided by/(used) in operations: | | | | | | | | | | | |
Depreciation and amortization | | | 618 | | | 694 | | | 863 | | | | 655 | | | 618 | | | 694 | |
Stock-based compensation | | | 645 | | | 817 | | | 1,126 | | | | 874 | | | 645 | | | 817 | |
Gain on disposal of marketable securities | | | — | | | (12) | | | (24) | | | | — | | | — | | | (12) | |
Write-down of marketable securities and long-term investments | | | — | | | — | | | 138 | | |
Gain on disposal of mineral property | | | (150) | | | (1,958) | | | — | | | | (358) | | | (150) | | | (1,958) | |
Write-down of value-added tax receivable | | | — | | | 572 | | | — | | | | — | | | — | | | 572 | |
Write-down of non-current assets | | | — | | | — | | | 5,563 | | |
(Gain)/loss on other investments | | | (3,196) | | | 1,593 | | | 4,112 | | | | 1,248 | | | (3,196) | | | 1,593 | |
Other non-cash items | | | — | | | — | | | (162) | | |
Change in working capital account items: | | | | | | | | | | | | | | | | | | | | |
Other current assets | | | (88) | | | 316 | | | 492 | | | | (160) | | | (88) | | | 316 | |
Provision for environmental liability | | | 350 | | | — | | | — | | | | (108) | | | 350 | | | — | |
Accounts payable, accrued liabilities and other | | | (70) | | | (24) | | | (240) | | | | 1,083 | | | (70) | | | (24) | |
Net cash provided by/(used in) operating activities | | | (5,024) | | | 3,009 | | | (7,058) | | | | (8,801) | | | (5,024) | | | 3,009 | |
Cash flows from investing activities: | | | | | | | | | | | | | | | | | | | | |
Proceeds from sales of marketable securities | | | — | | | 41 | | | 60 | | | | — | | | — | | | 41 | |
Proceeds from sale of other investments, net | | | — | | | 2,772 | | | 10,560 | | | | — | | | — | | | 2,772 | |
Acquisition of short-term investments, net of dispositions | | | (9,985) | | | (11,990) | | | — | | |
Disposition of short-term investments, net of acquisitions | | | | 6,831 | | | (9,985) | | | (11,990) | |
Additions to plant and equipment | | | (37) | | | (134) | | | (7) | | | | — | | | (37) | | | (134) | |
Proceeds from option/sale agreements, net | | | 150 | | | 3,490 | | | 1,028 | | | | 1,761 | | | 150 | | | 3,490 | |
Net cash provided by/(used) in investing activities | | | (9,872) | | | (5,821) | | | 11,641 | | |
Net cash provided by/(used in) investing activities | | | | 8,592 | | | (9,872) | | | (5,821) | |
Cash flows from financing activities: | | | | | | | | | | | | | | | | | | | | |
Proceeds from equity financings, net | | | 15,883 | | | — | | | — | | | | — | | | 15,883 | | | — | |
Repayment of debt | | | — | | | — | | | (6,344) | | |
Payment of taxes from withheld shares | | | | (264) | | | — | | | — | |
Proceeds from exercise of stock options | | | 15 | | | — | | | — | | | | — | | | 15 | | | — | |
Net cash provided by/(used in) financing activities | | | 15,898 | | | — | | | (6,344) | | | | (264) | | | 15,898 | | | — | |
| | | | | | | | | | | | | | | | | | | | |
Net increase/(decrease) in cash and cash equivalents | | | 1,002 | | | (2,812) | | | (1,761) | | | | (473) | | | 1,002 | | | (2,812) | |
Cash and cash equivalents, beginning of period | | | 902 | | | 3,714 | | | 5,475 | | | | 1,904 | | | 902 | | | 3,714 | |
Cash and cash equivalents, end of period | | $ | 1,904 | | $ | 902 | | $ | 3,714 | | | $ | 1,431 | | $ | 1,904 | | $ | 902 | |
Supplemental cash flow information – Note 1211
The accompanying notes are an integral part of these consolidated financial statements.
1. Nature of Operations
Vista Gold Corp. and its subsidiaries (collectively, “Vista,” the “Company,” “we,” “our,” or “us”) operate in the gold mining industry. We are focused on the evaluation, acquisition, exploration and advancement of gold exploration, and potential development projects, which may lead to gold production or value adding strategic transactions such as earn-in right agreements, option agreements, leases to third parties, joint venture arrangements with other mining companies, or outright sales of assets for cash and/or other consideration. We look for opportunities to improve the value of our gold projects through exploration drilling and/or technical studies focused on optimizing previous engineering work.
Our principalThe Company’s flagship asset is our flagshipits 100% owned Mt Todd gold project (“Mt Todd”) in the Northern Territory Australia where we are concluding test work(“NT”) Australia. Mt Todd is the largest undeveloped gold project in Australia. The Company recently received authorization for the last major environmental permit and completed an updated Preliminary Feasibility Study for Mt Todd, which confirms the projects robust economics at today’s gold prices. With these important milestones complete, Vista is in a position to optimizeactively pursue strategic alternatives that provide the process flowsheet, seeking approval of our final environmental authorization and commencing an update of our preliminary feasibility study.best opportunity to maximize value for the Company. We also hold 4.4%4.2% of the outstanding common shares in the capital of Midas Gold Corp. (“Midas Gold Shares”), a non-core projectsproject in Mexico, and the United States, and royalty interests in Indonesia.Indonesia and the United States.
All dollar amounts stated herein are in U.S. dollars in thousands, except per share amounts and per warrant amounts unless specified otherwise. References to C$ refer to Canadian currency, AUD or A$ to Australian currency, and USD or $ to United States currency.
2. Significant Accounting Policies
Principles of Consolidation
The Consolidated Financial Statements include the accounts of Vista Gold Corp. and more-than-50%-owned subsidiaries that it controls and entities over which control is achieved through means other than voting rights. All significant intercompany balances and transactions have been eliminated. The Consolidated Financial Statements have been prepared in accordance with generally accepted accounting principles in the United States (“U.S. GAAP”).
Use of Estimates
The preparation of the Company’s Consolidated Financial Statements requires the Company to make estimates and assumptions that affect the reported amounts of assets, liabilities, income and expenses during the reporting period. The more significant areas requiring the use of management estimates and assumptions are: the fair value and accounting treatment of financial instruments including marketable securities; useful lives of assets for asset depreciation purposes; valuation allowances for deferred tax assets; the fair value and accounting treatment of stock-based compensation; the provision for environmental liabilities; and asset impairments (including impairments long-lived assets and investments).impairments. The Company bases its estimates on historical experience and on various other assumptions that are believed to be reasonable under the circumstances. Accordingly, actual results will likely differ from the amounts estimated in these financial statements.
Cash and cash equivalents
Cash and cash equivalents include cash on hand and government securities with original maturities of three months or less when purchased. Because of the short maturity of these investments, the carrying amounts approximate their fair value.
Foreign Currency Transactions
Our functional currency is the U.S. dollar. Gains and losses resulting from foreignForeign currency transactions denominated in currency other than the functional currency are recorded at the approximate rate of exchange at the transaction date and any gains/(losses) resulting therefrom are recorded in other expense. For each of the years ended December 31, 2017, 2016 2015 and 2014,2015, we recorded insignificant net foreign currency gains/(losses).
Short-term Investment
Short-term investments consist of securities with original maturity dates greater than ninety days and less than one year. These securities are typically United States and Australian government treasury bills and/or notes. Australian dollar denominated treasury bills may result in currency risk associated with fluctuation in exchanges rates. Short-term
investments are recorded at amortized cost and are classified as debt securities held-to-maturity as the Company has the intention and ability to hold these instruments until their original maturity date at the time of purchase.
Mineral Properties
Mineral property acquisition costs, including directly related costs, are capitalized when incurred, and mineral property exploration costs are expensed as incurred. When we determine that a mineral property can be economically developed in accordance with U.S. GAAP and SEC Industry Guide 7 reserves are established, the costs then incurred to develop such property will be capitalized. Capitalized costs will be depleted using the units-of-production method over the estimated life of the proven and probable reserves. If mineral properties are subsequently abandoned or impaired, any undepleted costs will be charged to loss in that period.
The recoverability of the carrying values of our mineral properties is dependent upon economic reserves being discovered or developed on the properties, permitting, financing, start-up, and commercial production from, or the sale/lease of, or other strategic transactions related to these properties. Development and/or start-up of any of these projects will depend on, among other things, management’s ability to raise additionalsufficient capital for these purposes.
We assess the carrying cost of our mineral properties for impairment whenever information or circumstances indicate the potential for impairment. This would include events and circumstances such as our inability to obtain all the necessary permits, changes in the legal status of our mineral properties, government actions, the results of exploration activities and technical evaluations and changes in economic conditions, including the price of gold and other commodities or input prices. Such evaluations compare estimated future net cash flows with our carrying costs and future obligations on an undiscounted basis. If it is determined that the estimated future undiscounted cash flows are less than the carrying value of the property, a write-down to the estimated fair value will then be reported in our Consolidated Statement of Income/(Loss) and Comprehensive Income/(Loss) for the period. Where estimates of future net cash flows are not determinable and where other conditions indicate the potential for impairment, management uses available market information and/or third partythird-party valuation experts to assess if the carrying value can be recovered and to estimate fair value.
Impairment
Carrying values of long-lived assets, other than mineral properties, are evaluated for impairment at such time that information becomes available indicating that the carrying value may not be recoverable. If it is determined that the fair value is less than the carrying value an impairment charge equal to the difference between the fair value and the carrying value will be recorded in our Consolidated Statements of Income/(Loss) and Comprehensive Income/(Loss).
Stock-Based Compensation
Under our stock option and long-term equity incentive plans, stock incentive options and restricted stock units may be granted to executives, employees, consultants and non-employee directors. Compensation expense for such grants is recorded in the Consolidated Statements of Income/(Loss) and Comprehensive Income/(Loss) as a component of Exploration, property evaluation and holding costs and Corporate administration, with a corresponding increase to Common shares in the Consolidated Balance Sheets. The fair values of the options are calculated using the Black-Scholes option pricing model and forfeiture rates are based on historic trends and future projections, as appropriate.model. The fair value of restricted stock units is based on the closing price of our common shares on the grant date and forfeiture rates are based on historic trends and future projections, as appropriate.date. The expense is based on the fair values of the grant on the grant date and is recognized over the vesting period specified for each grant. The fair value and compensation expense related to RSUs and stock options granted to consultants is marked to market at each period until the RSU or stock option vests. Forfeitures for all stock-based compensation are recorded when incurred.
Financial Instruments
Accounting Standards Codification Topic 820, Fair Value Measurements and Disclosures (“ASC 820”) of the Financial Accounting Standards Board (“FASB”) requires an entity to maximize the use of observable inputs and minimize the use of unobservable inputs when measuring fair value. ASC 820 establishes a fair value hierarchy based on the level of independent, objective evidence surrounding the inputs used to measure fair value. A financial instrument’s
categorization within the fair value hierarchy is based upon the lowest level of input that is significant to the fair value measurement. ASC 820 prioritizes the inputs into three levels that may be used to measure fair value:
| · | | Level 1 – Unadjusted quoted prices in active markets that are accessible at the measurement date for identical, unrestricted assets or liabilities. |
| · | | Level 2 – Observable inputs other than quoted prices included within Level 1 that are observable for the asset or liability, either directly or indirectly, including quoted prices for similar assets and liabilities in active markets; quoted prices for identical or similar assets and liabilities in markets that are not active; or other inputs that are observable or can be corroborated by observable market data by correlation or other means. |
| · | | Level 3 – Prices or valuation techniques requiring inputs that are both significant to the fair value measurement and unobservable. |
Our financial instruments include cash and cash equivalents, marketable securities, short-term investments, accounts payable and certain other current assets and liabilities. Due to the short-term nature of our cash and cash equivalents, short-term investments, accounts payable and certain other current assets and liabilities, we believe that their carrying amounts approximate fair value. Our marketable securities are classified as available-for-sale. Accordingly, these securities are carried at fair value, which is based upon quoted market prices in an active market and included in Level 1 of the fair value hierarchy. Our other investments, comprised of Midas Gold Shares, isare accounted for using the fair value option based on quoted market prices in an active market and is included in Level 1 of the fair value hierarchy. The mill equipment is accounted for using a third-party valuation and is included in Level 3 of the fair value hierarchy.
Research and Development (“R&D”) Grants
The Company has received Research and Development Tax Incentive payments from the Australian Government. Accounting practice generally refers to International Accounting Standard 20 “Accounting for Government Grants and Disclosure of Government Assistance” (“IAS 20”) to determine the most appropriate accounting for payments of this type. The Company’s activities in Australia do not generate revenue subject to Australian income tax. Consequently, under IAS 20, the R&D Tax Incentive payment is considered a government grant, as opposed to an income tax refund. Grants are recognized when there is reasonable assurance that the grant will be received and that conditions attached to the grant have been met.
Recent accounting pronouncements
Compensation – Stock Compensation (Topic 718): Improvements to Employee Share-Based Payment Accounting (Accounting Standard Update 2016-09)Leases
In March 2016,The FASB issued ASU No. 2016-02, Leases. The new standard establishes a right-of-use (“ROU”) model that requires a lessee to record a ROU asset and a lease liability on the Financial Accounting Standards Board issued guidance related to accountingbalance sheet for stock-based compensation which is intended to improve the accounting for employee share-based payments and which affects all organizations that issue share-based payment awards to their employees. Several aspects of the accounting for share-based payment award transactions are simplified, including: (a) income tax consequences; (b) classification of awardsleases with terms longer than 12 months. Leases will be classified as either equityfinance or liabilities; and (c)operating, with classification onaffecting the statementpattern of cash flows. For public companies,expense recognition in the amendments areincome statement. The new standard is effective for interim and annual periods beginning after December 15, 2016,2018. A modified retrospective transition approach is required for lessees for capital and interim periods within those annual periods. Earlyoperating leases existing at, or entered into after, the beginning of the earliest comparative period presented in the financial statements, with certain practical expedients available. We are evaluating the impact the adoption is permitted for any organization in any interim or annual period. For the year ended December 31, 2016,of ASU 2016-02 may have. However, based upon our initial reviews, we adopteddo not currently anticipate that adoption of this guidance which did notstandard will have a materialsignificant impact on our financial statements.
Revenue Recognition
The FASB issued ASU No. 2014-09, Revenue from Contracts with Customers (Topic 606). ASU No. 2014-09, as subsequently amended, supersedes the revenue recognition requirements in Revenue Recognition (Topic 605), and most industry-specific guidance throughout the Industry Topics of the Codification. Additionally, ASU No. 2014-09 supersedes some cost guidance included in Revenue Recognition-Construction-Type and Production-Type Contracts (Subtopic 605-35). Under ASU No. 2014-09, an entity should recognize revenue when it transfers promised goods or services to customers in an amount that reflects the consideration to which the entity expects to be entitled in exchange for those goods or services. ASU No. 2014-09 also requires additional disclosure about the nature, amount, timing, and uncertainty of revenue and cash flows arising from customer contracts. This includes significant judgments and changes in judgments and assets recognized from costs incurred to obtain or fulfill a contract. Additionally, from time to time, the Company may enter into transactions whereby it sells certain property, plant and equipment. In these instances, certain principles of ASC 606 may apply when recognizing a gain or loss on the transaction even though the transaction is not considered to be in the normal course of business. ASU No. 2014-09 states that entities should apply guidance related to transfer of control and measurement of the transaction price when evaluating the timing and amount of the gain or loss to be recognized. The new guidance is effective for interim and annual periods beginning after December 15, 2017. The Company is evaluating the impact of ASU No. 2014-09 as it relates to the option agreement for Guadalupe de los Reyes, specifically analyzing the impact of any distinct performance obligations, variable consideration and possible constraints.
Investments
The FASB issued ASU No. 2016-01 was issued related to financial instruments. The new guidance requires entities to measure equity investments that do not result in consolidation and are not accounted for under the equity method at fair value and recognize any changes in fair value in net income. This new guidance also updates certain disclosure requirements for these investments. This update is effective in fiscal years, including interim periods, beginning after December 15, 2017, and upon adoption, an entity should apply the amendments with the cumulative effect of initially applying the guidance recognized at January 1, 2018. Early adoption is not permitted. The Company expects the updated guidance to result in a reclassification of unrealized holding gains and losses and deferred income taxes related to investments in marketable equity securities from Accumulated other comprehensive income (loss) to Retained earnings in the Consolidated Balance Sheets upon adoption. Accumulated other comprehensive income (loss) at December 31, 2017 included $17 of unrealized holding gains and losses related to marketable equity securities.
Stock-based Compensation
The FASB issued ASU 2017-09, Compensation — Stock Compensation — Scope of Modification Accounting (“ASU 2017-09”), which provides guidance about the types of changes to terms or conditions of a share-based payment award that would require an entity to apply modification accounting. The new guidance is effective for fiscal years beginning after December 15, 2017, including interim periods within those fiscal years. Early adoption is permitted. The amendments in this update should be applied prospectively to an award modified on or after the adoption date
Income Taxes
On December 22, 2017, Staff Accounting Bulletin No. 118 (“SAB 118”) was issued to address the application of U.S. GAAP in situations when a registrant does not have the necessary information available, prepared, or analyzed (including computations) in reasonable detail to complete the accounting for certain income tax effects of the Tax Cuts and Jobs Act. We determine if the assessment of a particular income tax effect is “complete” or “incomplete” as of the due date of the financial statements. Those effects for which the accounting is determined to be complete are reported in the enactment period financial statements.
For those effects determined to be incomplete, we determine whether a reasonable estimate of those effects can be made. If a reasonable estimate can be made, the estimate is recognized as a provisional amount. If a reasonable estimate cannot be made, no effects are recognized as provisional amounts until the first reporting period in which a reasonable estimate
can be made. Provisional amounts are updated when additional information becomes available and the evaluation of such information is complete. We complete the accounting for all provisional amounts within a measurement period of up to one year from the enactment date.
3. Other Investments
Short-term investments
As of December 31, 20162017 and 2015,2016, the amortized cost basis of our short-term investments was $21,975$15,144 and $11,990,$21,975, respectively. The amortized cost basis approximates fair value at December 31, 20162017 and 2015.2016. Short-term investments at December 31, 20162017 are comprised of U.S. government treasury bills and/or notes, while short-term investments at December 31, 20152016 were comprised of U.S. government and Australian treasury bills and/or notes, all of which have maturity dates greater than 90 days but less than one year.
Other investments - Midas Gold Shares
During February 2014, we sold 16,000,000 Midas Gold Shares at a price of C$0.80 ($0.73) per Midas Gold Share for net proceeds of $10,560 reducing the total of our Midas Gold Shares to 15,802,615 or approximately 11.2% of the outstanding Midas Gold Shares outstanding, on a non-dilutive basis, at that time. This sale resulted in a realized gain on other investments of $155 based on the realized value at the time of the sale compared to the fair value of the Midas Gold Shares at December 31, 2013, net of costs to sell.
During March 2015, we sold 8,000,000 Midas Gold Shares, at a price of C$0.46 ($0.36) per Midas Gold Share, for net proceeds of $2,772, reducing the total Midas Gold Shares we own to 7,802,615 or approximately 4.4% of the Midas Gold Shares outstanding, on a non-dilutive basis. This sale resulted in a realized loss on other investments of $348 based on the realized value at the time of the sale compared to the fair value of the Midas Gold Shares at December 31, 2014, net of costs to sell.
Upon initial recognition of its investment in the Midas Gold Shares, Vista elected to apply the fair value option, and as such, the investment is recorded at fair value in the Consolidated Balance Sheets. Subsequent changes in fair value are recorded in the Consolidated Statements of Income/(Loss) and Comprehensive Income/(Loss) in the period in which they occur.
The following table summarizes our investment in Midas Gold Shares as at December 31, 20162017 and 2015.2016.
| | | | | | | | | | | | | | |
| | December 31, 2016 | | December 31, 2015 | | | December 31, 2017 | | December 31, 2016 | |
Fair value at beginning of period | | $ | 1,798 | | $ | 6,163 | | | $ | 4,994 | | $ | 1,798 | |
Sale of Midas Gold Shares, net of costs to sell | | | — | | | (2,772) | | |
Gain/(loss) during the period | | | 3,196 | | | (1,593) | | | | (1,248) | | | 3,196 | |
Fair value at end of period | | $ | 4,994 | | $ | 1,798 | | | $ | 3,746 | | $ | 4,994 | |
| | | | | | | | | | | | | | |
Midas Gold Shares held at the end of the period | | | 7,802,615 | | | 7,802,615 | | | | 7,802,615 | | | 7,802,615 | |
4. Mineral Properties
| | | | | | | | | | | | | | |
| | At December 31, 2016 | | At December 31, 2015 | | | At December 31, 2017 | | At December 31, 2016 | |
Mt Todd, Australia | | $ | 2,146 | | $ | 2,146 | | | $ | 2,146 | | $ | 2,146 | |
Guadalupe de los Reyes, Mexico | | | 1,728 | | | 1,728 | | | | 325 | | | 1,728 | |
| | $ | 3,874 | | $ | 3,874 | | | $ | 2,471 | | $ | 3,874 | |
Guadalupe de los Reyes
During April 2014, Minera Gold Stake S.A. de C.V. (“MGS”), Vista’s wholly-owned subsidiary,October 2017, we entered into a definitive optionan agreement (the “Option Agreement”) to option a 70%our interest in the Guadalupe de los Reyes gold/gold and silver project in Sinaloa, Mexico (the “GdlR Project”) to Great Panther Silver Limited (formerly Cangold Limited)Minera Alamos Inc. and its subsidiary Minera Alamos de Sonora S.A. de C.V. (“Great Panther”Minera Alamos”) for consideration.
Pursuant to the terms of $5,000 in five payments overthe Option Agreement, we granted Minera Alamos an exclusive right and option to earn a three-year period, with payments totaling $1,000100% interest in the first year ($500 received in 2014 and $496 net of legal costs was received in March 2015), $1,500 due in February 2016 (postponed from January 2016) and $2,500 due in January 2017. The Option Agreement provided that all cash payments are non-GdlR Project by:
| · | | making payments totaling $6,000 comprised of a payment of $1,500 made at the execution of the Option Agreement (“Option Grant Date”); two successive payments of $1,500 each to be made at the one-year and two-year anniversaries of the Option Grant Date; and a final $1,500 payment to be made before the four-year anniversary of the Option Grant Date; |
| · | | maintaining the concessions comprising the GdlR Project in good standing; |
| · | | fulfilling all of our obligations to the Ejido La Tasajera (the “Ejido”) as set out in the temporary occupation contract between us and the Ejido; |
refundable
| · | | granting us a capped NSR royalty on production from open pit mining (the “Open Pit NSR”) at rates that range from 1% (at gold prices of $1,400/oz or less) to a maximum of 2% (at gold prices above $1,600/oz) up to an aggregate of $2,000 in royalty payments; |
| · | | granting us a perpetual NSR royalty on production from underground mining (the “Underground NSR”) at rates that range from 1% (at gold prices of $1,400/oz or less) to a maximum of 2% (at gold prices above $1,600/oz); and |
| · | | granting us the right to assume a 49% non-carried interest in an underground project if Minera Alamos decides to develop an underground mine at the GdlR Project (the “Back-in Right”). |
The Option Agreement provides that all cash payments are non-refundable and optional to Great Panther,Minera Alamos, and in the event Great Panther failedMinera Alamos fails to pay any of the required amounts onas set out in the scheduled datesOption Agreement, or failedfails to comply with its other obligations, the Option Agreement wouldwill terminate and Great Panther wouldMinera Alamos will have no interest in the Guadalupe de los Reyes gold/silver project.
On February 25, 2016 Vista received notification from Great Panther thatGdlR Project. Provided it was terminating the Option Agreement and the $1,500 option payment dueis not in February 2016 was not made. Pursuant to the termsbreach of the Option Agreement, Vista retainsMinera Alamos may at its discretion advance the above payment schedule.
Subject to Minera Alamos timely making all amounts already paid by Great Pantherthe option payments, and fulfilling its other obligations with respect to the Option Agreement, we will transfer 100% of the shares of the Company’s 100% owned subsidiary Minera Gold Stake S.A. de C.V., the entity which owns the GdlR Project, Guadalupe de los Reyes gold/silver project.to Minera Alamos and the Open-Pit NSR and Underground NSR will be granted to us.
AlthoughIf Minera Alamos discovers, and decides to develop, an underground mine at the termination ofGdlR Project and we exercise the Option Agreement indicatesBack-in Right, we and Minera Alamos have agreed to form a joint venture to develop and operate the potential for impairment ofunderground mine. If the carrying value of Guadalupe de los Reyes mineral property, our review has concluded thatjoint venture is formed, the $1,728 carrying value should not be impaired considering the quantity of mineral resources contained in the concessions, and the strategic value that these resources represent. Underground NSR will terminate.
Los Cardones
In October 2013, we sold our 100% debt and equity participation in the Los Cardones gold project located in Baja California Sur, Mexico (“Los Cardones Sale”) to Invecture and RPG Structrued Finance S.a.R.L. (the “Purchasers”) for a total of $13,000 ($7,000 of which was paid in October 2013 and $6,000 was originally payable January 2014 (the “Subsequent Payment”) subject to the Purchasers’ option to elect to not make the Subsequent Payment). In 2014, the due date for the Subsequent Payment was extended to January 30, 2015 for additional consideration of $500. In October 2014, Invecture announced that the Los Cardones gold project, had been suspended because the conditions for its development were not favorable at that time, which introduced substantial doubt that the Subsequent Payment would be made. After making this announcement, there were no apparent significant favorable changes to incentivize Invecture to lift the suspension. In January 2015, we agreed to amend the payment terms (the “Amendment”) of the Los Cardones Sale. Under the Amendment, the Company received a payment of $2,994 net of legal costs from the Purchasers as final payment for 100% of the Company’s interest in the project. This resulted in a realized gain of approximately $1,958.
Long Valley
We acquired theDuring 2017, we sold our Long Valley gold projectunpatented mining claims located in 2003. During 2014, we completedCalifornia for consideration, net of transaction costs, of $358 which was paid at closing; a reviewfuture payment of $500 one month after the start of commercial production; a future payment of $500 on or prior to the first anniversary of the permitting processstart of commercial production; and probable impediments to developinga net smelter return royalty (“NSR”) on any future production from said claims at a variable rate between 0.5% and 2.0% depending on the project, and concluded that the permitting process could consume significant resources and last foraverage gold price realized. This sale resulted in a protracted periodrealized gain of time. Accordingly, we do not plan to advance this project in the foreseeable future. As a result, an impairment amount equal to the $750 carrying value has been included in our Consolidated Statements of Income/(Loss) and Comprehensive Income/(Loss) for the year ended December 31, 2014.$358.
Utah Claims
During 2016 we sold unpatented mining claims located in Utah for $150 and a 2% net smelter return royalty on any future production from said claims. This resulted in a realized gain of $150.
5. Plant and Equipment
| | | | | | | | | | | | | | | | | | | | | | | | | | | | | | | | | | | | | | |
| | December 31, 2016 | | December 31, 2015 | | | December 31, 2017 | | December 31, 2016 | |
| | | | | Accumulated | | | | | | | | Accumulated | | | | | | | | | Accumulated | | | | | | | | Accumulated | | | | |
| | Cost | | depreciation | | Net | | Cost | | depreciation | | Net | | | Cost | | depreciation | | Net | | Cost | | depreciation | | Net | |
Mt Todd, Australia | | $ | 5,654 | | $ | 3,944 | | $ | 1,710 | | $ | 5,617 | | $ | 3,346 | | $ | 2,271 | | | $ | 5,646 | | $ | 4,591 | | $ | 1,055 | | $ | 5,654 | | $ | 3,944 | | $ | 1,710 | |
Guadalupe de los Reyes, Mexico | | | 14 | | | 11 | | | 3 | | | 17 | | | 9 | | | 8 | | | | — | | | — | | | — | | | 14 | | | 11 | | | 3 | |
Corporate, United States | | | 333 | | | 333 | | | — | | | 403 | | | 390 | | | 13 | | | | 333 | | | 333 | | | — | | | 333 | | | 333 | | | — | |
Used mill equipment, Canada | | | 6,500 | | | — | | | 6,500 | | | 6,500 | | | — | | | 6,500 | | | | 6,500 | | | — | | | 6,500 | | | 6,500 | | | — | | | 6,500 | |
| | $ | 12,501 | | $ | 4,288 | | $ | 8,213 | | $ | 12,537 | | $ | 3,745 | | $ | 8,792 | | | $ | 12,479 | | $ | 4,924 | | $ | 7,555 | | $ | 12,501 | | $ | 4,288 | | $ | 8,213 | |
We continue to actively market the used mill equipment, however, we do not classify it as ‘held for sale’ on our balance sheetConsolidated Balance Sheets as of December 31, 20162017 or 20152016 as we do not have reasonable assurance that the mill equipment will sell within 12 months. We are not currently depreciating the used mill equipment as we continue to market it and it is not in use.
6. Common Shares
Public Offering, August 2016
During August 2016, we closed a public offering of 12,362,500 units (the “Units”), which included 1,612,500 Units issued pursuant to the full exercise of the underwriters’ over-allotment option, for net proceeds of $15,883 (the “2016 Offering”). Each Unit consisted of one common share in the capital of the Company (“Common Share”) and one-half of one Common Share purchase warrant (each full warrant, a “2016 Warrant”). A total of 6,514,625 2016 Warrants were issued, including 333,375 broker warrants issued to the underwriters. Each 2016 Warrant entitles the holder thereof to purchase one Common Share at a price of $1.92 per Common Share (subject to adjustment in certain circumstances) and is exercisable for a period of 36 months from the closing of the 2016 Offering. The 2016 Warrants, which are classified as equity, had a fair value of $3,320 at the time of the 2016 Offering. The fair value of 2016 Warrants was estimated at the grant date using the Black-Scholes option pricing model using the following assumptions: 1) expected volatility of 89%, 2) risk-free rate of 0.86%, 3) expected life of 3 years, and 4) stock price on the issue date of $1.13 per Common Share.
Other Share Issuances
During the years ended December 31, 2017, 2016 2015 and 2014,2015, we issued 1,625,399;2,540,546 493,345 and 115,000493,345 common shares, respectively, in connection with the vesting of RSUs and/or stock option exercises.
Warrants
Warrant activity is summarized in the following table:
| | | | | | | | | | | | | | | | | | | | | | |
| | | | Weighted | | Weighted | | | | | | | | Weighted | | Weighted | | | | |
| | | | average | | average | | | | | | | | average | | average | | | | |
| | Warrants | | exercise price | | remaining life | | | | | | Warrants | | exercise price | | remaining life | | | | |
| | outstanding | | per share | | (yrs.) | | Intrinsic value | | | outstanding | | per share | | (yrs.) | | Intrinsic value | |
As of December 31, 2013 | | 19,977,743 | | $ | 4.63 | | 1.6 | | $ | — | | |
Expired (issued as part of equity financing completed in 2012) | | (4,757,941) | | | | | | | | | | |
As of December 31, 2014 | | 15,219,802 | | $ | 5.00 | | 0.8 | | $ | — | | | 15,219,802 | | $ | 5.00 | | 0.8 | | $ | — | |
Expired (issued as part of equity financing completed in 2010) | | (15,219,802) | | | | | | | | | | | (15,219,802) | | | | | | | | | |
As of December 31, 2015 | | — | | $ | — | | — | | $ | — | | | — | | | — | | — | | | — | |
Issued | | 6,514,625 | | | 1.92 | | 2.6 | | | — | | | 6,514,625 | | | | | | | | | |
As of December 31, 2016 | | 6,514,625 | | $ | 1.92 | | 2.6 | | $ | — | | | 6,514,625 | | | 1.92 | | 2.6 | | | — | |
As of December 31, 2017 | | | 6,514,625 | | $ | 1.92 | | 1.6 | | $ | — | |
Stock-Based Compensation
Under our Stock Option Plan (the “Plan”) and our Long-Term Equity Incentive Plan (the “LTIP”), we may grant options and/or RSUs or restricted stock awards to our directors, officers, employees and consultants. The combined maximum number of our Common Shares that may be reserved for issuance under the Plan and the LTIP is a variable number equal to 10% of the issued and outstanding Common Shares on a non-diluted basis. Options and RSUs under the Plan and LTIP, respectively, are granted from time to time at the discretion of the Board, with vesting periods and other terms as determined by the Board. Stock-based compensation expense for the years ended December 31, 2017, 2016 2015 and 20142015 is as follows:
| | | | | | | | | | | | | | | | | | | | | |
| | Year Ended December 31, | | | | | Year Ended December 31, |
| | 2016 | | 2015 | | 2014 | | | | 2017 | | 2016 | | 2015 | |
Stock options | | $ | 23 | | $ | 8 | | $ | 160 | | | | $ | 36 | | $ | 23 | | $ | 8 | |
Restricted stock units | | | 622 | | | 809 | | | 966 | | | | | 838 | | | 622 | | | 809 | |
| | $ | 645 | | $ | 817 | | $ | 1,126 | | | | $ | 874 | | $ | 645 | | $ | 817 | |
As of December 31, 2016,2017, stock options and RSUs had unrecognized compensation expense of $39$10 and $582,$649, respectively, which is expected to be recognized over a weighted average period of 1.230.99 and 1.41.3 years, respectively.
Stock Options
A summary of option activity under the Plan as of December 31, 2017, 2016 2015 and 20142016 and changes during the period then ended is set forth in the following table:
| | | | | | | | | | | | | | | | | | | | | | |
| | | | Weighted average | | Weighted average | | Aggregate | | | | | Weighted average | | Weighted average | | Aggregate | |
| | Number of | | exercise price | | remaining | | intrinsic | | | Number of | | exercise price | | remaining | | intrinsic | |
| | options | | per option | | contractual term | | value | | | options | | per option | | contractual term | | value | |
Outstanding - December 31, 2013 | | 2,882,500 | | $ | 1.79 | | 3.07 | | $ | 54 | | |
Granted | | 175,000 | | | 0.52 | | | | | — | | |
Cancelled/Forfeited | | (125,000) | | | 3.16 | | | | | — | | |
Expired | | (675,000) | | | 1.85 | | | | | — | | |
Outstanding - December 31, 2014 | | 2,257,500 | | | 1.60 | | 3.02 | | | — | | | 2,257,500 | | $ | 1.60 | | 3.02 | | $ | — | |
Outstanding - December 31, 2015 | | 2,257,500 | | | 1.60 | | 2.02 | | | — | | | 2,257,500 | | | 1.60 | | 2.02 | | | — | |
Granted | | 50,000 | | | 1.11 | | | | | — | | | 50,000 | | | 1.11 | | | | | — | |
Exercised | | (65,500) | | | 0.39 | | | | | 42 | | | (65,500) | | | 0.39 | | | | | 42 | |
Expired | | (697,500) | | | 2.91 | | | | | — | | | (697,500) | | | 2.91 | | | | | — | |
Outstanding - December 31, 2016 | | 1,544,500 | | $ | 1.05 | | 1.79 | | $ | 626 | | | 1,544,500 | | $ | 1.05 | | 1.79 | | $ | 626 | |
Expired | | | (400,000) | | | 2.87 | | | | | | |
Outstanding - December 31, 2017 | | | 1,144,500 | | $ | 0.42 | | 1.15 | | $ | 346 | |
| | | | | | | | | | | | | | | | | | | | | | |
Exercisable - December 31, 2016 | | 1,248,250 | | $ | 1.18 | | 1.64 | | $ | 480 | | |
Exercisable - December 31, 2017 | | | 898,250 | | $ | 0.43 | | 1.19 | | $ | 262 | |
A summary of our unvested stock options as of December 31, 2017, 2016 2015 and 20142015 and changes during the period then ended is set forth in the following table:
| | | | | | | | | | | | | | | | |
| | | | | | | Weighted | | | | | | | | Weighted | |
| | | | Weighted | | average | | | | | Weighted | | average | |
| | | | average | | remaining | | | | | average | | remaining | |
| | | | grant-date | | amortization | | | | | grant-date | | amortization | |
| | Number of | | fair value | | period | | | Number of | | fair value | | period | |
| | options | | per option | | (Years) | | | options | | per option | | (Years) | |
Unvested - December 31, 2013 | | 738,750 | | $ | 0.22 | | 4.99 | | |
Granted | | 175,000 | | | 0.30 | | | | |
Vested | | (667,500) | | | 0.24 | | | | |
Unvested - December 31, 2014 | | 246,250 | | | 0.22 | | 3.99 | | | 246,250 | | $ | 0.22 | | 3.99 | |
Unvested - December 31, 2015 | | 246,250 | | | 0.22 | | 3.00 | | | 246,250 | | | 0.22 | | 3.00 | |
Granted | | 50,000 | | | 0.69 | | | | | 50,000 | | | 0.69 | | | |
Unvested - December 31, 2016 | | 296,250 | | | 0.49 | | 1.23 | | | 296,250 | | $ | 0.49 | | 1.23 | |
Vested | | | (50,000) | | | 0.69 | | | |
Unvested - December 31, 2017 | | | 246,250 | | $ | 0.22 | | 0.99 | |
No stock options were granted for the years ended December 31, 2017 and 2015. The fair value of stock options granted during the years ended December 31, 2016 and 2014 (no stock options were granted for the year ended December 31, 2015) to employees, directors and consultants was estimated at the grant date using the Black-Scholes option pricing model using the following assumptions:
| | | | | | | | | | |
| | | | | | | | | | |
| | Year Ended December 31, | |
| | 2016 | | | 2015 | | | 2014 | | |
Expected volatility | | 77.68 | % | | — | % | | 69.17 | % | |
Risk-free interest rate | | 1.12 | % | | — | % | | 1.75 | % | |
Expected life (years) | | 5 | | | — | | | 5 | | |
Dividend yield | | N/A | | | — | | | N/A | | |
Forfeiture assumption | | 0 | % | | — | % | | 10 | % | |
| | | | |
| | | | |
| | 2016 | | |
Expected volatility | | 77.68 | % | |
Risk-free interest rate | | 1.12 | % | |
Expected life (years) | | 5 | | |
Dividend yield | | N/A | | |
Forfeiture assumption | | 0 | % | |
Option pricing models require the input of highly subjective assumptions, including the expected price volatility. Expected price volatility is based on the historical volatility of our common shares. Changes in the subjective input assumptions can materially affect the fair value estimate. The expected term of the options granted represents the period of time that the options granted are expected to be outstanding. The risk-free rate for the periods within the contractual term of the option is based on the U.S. Treasury yield curve in effect at the date of grant.
Restricted Stock Units
The following table summarizes the RSU activity under the LTIP as of December 31, 2017, 2016 2015 and 20142015 and changes during the years then ended:
| | | | | | | | | | | | |
| | | | Weighted average | | | | | Weighted average | |
| | Number | | grant-date fair | | | Number | | grant-date fair | |
| | of units | | value per unit | | | of units | | value per unit | |
Unvested - December 31, 2013 | | 2,594,464 | | $ | 2.00 | | |
Cancelled/forfeited | | (865,635) | | | 3.42 | | |
Vested | | (115,000) | | | 3.84 | | |
Granted | | 2,079,000 | | | 0.46 | | |
Unvested - December 31, 2014 | | 3,692,829 | | $ | 0.74 | | | 3,692,829 | | $ | 0.74 | |
Cancelled/forfeited | | (841,038) | | | 0.73 | | | (841,038) | | | 0.73 | |
Vested | | (493,345) | | | 1.62 | | | (493,345) | | | 1.62 | |
Granted | | 1,727,000 | | | 0.27 | | | 1,727,000 | | | 0.27 | |
Unvested - December 31, 2015 | | 4,085,446 | | $ | 0.44 | | | 4,085,446 | | $ | 0.44 | |
Vested | | (2,475,046) | | | 0.32 | | | (2,475,046) | | | 0.32 | |
Granted | | 1,057,987 | | | 0.84 | | | 1,057,987 | | | 0.84 | |
Unvested - December 31, 2016 | | 2,668,387 | | $ | 0.49 | | | 2,668,387 | | $ | 0.49 | |
Cancelled/forfeited | | | (441,084) | | | 0.34 | |
Vested, net of shares withheld | | | (1,625,399) | | | 0.38 | |
Granted | | | 966,003 | | | 0.82 | |
Unvested - December 31, 2017 | | | 1,567,907 | | $ | 0.85 | |
During the year ended December 31, 2017, the Company withheld shares equivalent to the employee withholding tax obligation which resulted from RSUs vesting in the period. Shares withheld are considered cancelled/forfeited.
A portion of the RSU awards vest on a fixed future date provided the recipient continues to be affiliated with Vista on that date. Other RSU awards vest subject to certain performance and market criteria, including the accomplishment of certain corporate objectives and the Company’s share price performance. The vesting period for all RSUs is at least one year.
Weighted Average Common Shares
| | | | | | | | | | | | | | |
| | At December 31, | | | At December 31, | |
| | 2016 | | 2015 | | 2014 | | | 2017 | | 2016 | | 2015 | |
Basic common shares | | 89,064,260 | | 82,571,182 | | 82,294,331 | | | 98,627,255 | | 89,064,260 | | 82,571,182 | |
Effect of dilutive stock-based awards | | — | | 1,183,898 | | — | | | — | | — | | 1,183,898 | |
Diluted common shares | | 89,064,260 | | 83,755,080 | | 82,294,331 | | | 98,627,255 | | 89,064,260 | | 83,755,080 | |
Stock options to purchase 1,144,500 common shares, unvested RSUs representing 1,567,907 common shares and 6,514,625 warrants were outstanding at December 31, 2017 but were not included in the computation of diluted weighted average common shares outstanding because their effect would have been anti-dilutive. Stock options to purchase 1,544,500 common shares, unvested RSUs representing 2,668,387 common shares and 6,514,625 warrants were outstanding at December 31, 2016 but were not included in the computation of diluted weighted average common shares outstanding because their effect would have been anti-dilutive. Stock options to purchase 2,257,500 common shares and unvested RSUs representing 2,901,548 common shares were outstanding at December 31, 2015 but were not included in the computation of diluted weighted average common shares outstanding because their effect would have been anti-dilutive. Stock options
During November 2017, the Company entered into an At-the-Market offering agreement (the “ATM Agreement”) with H. C. Wainwright & Co., LLC (“Wainwright”), under which the Company may, but is not obligated to, purchase 2,257,500issue and sell shares of the Company’s common stock through Wainwright as sales manager in an At-the-Market offering under a prospectus supplement for aggregate sales proceeds of up to $10,000 (the “ATM Program”). The ATM Agreement will remain in full force and effect until the earlier of August 31, 2020, or the date that the ATM Agreement is terminated in accordance with the terms therein. Offers or sales of common shares unvested RSUs representing 3,692,829under the ATM Program will be made only in the United States and no offers or sales of common shares under the Agreement will be made in Canada. The common stock will be distributed At-the-Market prices prevailing at the time of sale. As a result, prices of the common stock sold under the ATM Program may vary during the period of distribution. The ATM Agreement provides that Wainwright will be entitled to compensation for its services at a commission rate of 2.0% of the gross sales price per share of common stock sold. The Company reimbursed certain legal expenses of Wainwright totaling $50 and warrants to purchase 15,219,802 common shares were outstanding atincurred additional accounting, legal, and regulatory costs of approximately $156 in connection with establishing the ATM Program. Such costs have been expensed as incurred during 2017. At December 31, 2014 but were not included in2017 no offers or sales had been made under the computation of diluted weighted average common shares outstanding because their effect would have been anti-dilutive.
ATM Program.
7. Accumulated Other Comprehensive Income/(Loss)
| | | | | | | | | | | | | | |
| | | | | Accumulated | | | | | | Accumulated | |
| | Accumulated | | other comprehensive | | | Accumulated | | other comprehensive | |
| | other comprehensive | | income/(loss), | | | other comprehensive | | income/(loss), | |
| | income/(loss) | | net of tax | | | income/(loss) | | net of tax | |
As of December 31, 2014 | | $ | 11 | | $ | 10 | | |
As of December 31, 2015 | | | $ | (35) | | $ | (29) | |
Other comprehensive loss due to change in fair market value of marketable securities during period before reclassifications | | | (34) | | | (29) | | | | 50 | | | 43 | |
Reclassifications due to realization of gain on sale of marketable securities (1) | | | (12) | | | (10) | | |
As of December 31, 2015 | | $ | (35) | | $ | (29) | | |
As of December 31, 2016 | | | $ | 15 | | $ | 14 | |
Other comprehensive gain due to change in fair market value of marketable securities during period | | | 50 | | | 43 | | | | (17) | | | (14) | |
As of December 31, 2016 | | $ | 15 | | $ | 14 | | |
As of December 31, 2017 | | | $ | (2) | | $ | - | |
| (1)
| | Reclassified to gain/(loss) on sale of marketable securities on the Consolidated Statement of Income/(Loss) and Comprehensive Income/(Loss).
|
8. Commitments and Contingencies
Our exploration and development activities are subject to various laws and regulations governing the protection of the environment. These laws and regulations are continually changing and are generally becoming more restrictive. As such, the future expenditures that may be required for compliance with these laws and regulations cannot be predicted. We conduct our operations to minimize effects on the environment and believe our operations are in compliance with applicable laws and regulations in all material respects. During May 2015, we settled a contract dispute for $295.
Under our agreement with the Jawoyn Association Aboriginal Corporation (the “JAAC”), we must offer the JAAC the opportunity to establish a joint venture with Vista holding 90% and the JAAC holding a 10% participating interest in Mt Todd. In addition, the JAAC will be entitled to an annual cash payment, or payment in kind, equal to 1% of the value of the annual gold production from the current mining licenses, and a 1% NSR royalty on other metals, subject to a minimum payment of A$50 per year.
During November 2015, we entered into a two-year lease agreement to store our used mill equipment. Monthly rent for the term
9.Amayapampa Interest
In December 2014, the owner of the Amayapampa gold project completed the sale of 100% of the project to a private investor. Accordingly, we evaluated the carrying value of our interest in Amayapampa, comprised of a right to receive an NSR royalty on future gold production, if any, plus certain additional cash payments if the project successfully starts commercial production. Given the frequency of ownership changes over the past several years, the conditions in gold market, and the political climate in Bolivia, we concluded that there was no more than a remote possibility that the Amayapampa project will be successfully developed and operated within the foreseeable future and that the asset was fully impaired, an impairment amount equal to the $4,813 carrying value was included in our Consolidated Statements of Income/(Loss) and Comprehensive Income/(Loss) for the year ended December 31, 2014.
10. Research and Development Grant
The Company received Research & Development (“R&D”) Tax Incentive refunds, net of costs to prepare and file, paid under the Australian Government’s R&D Tax Incentive Program, a program designed to encourage industry to engage in R&D activities that benefit Australia. These refunds are related to costs we incurred during the 2012 through 2015 fiscal years for qualifying R&D programs. The R&D Tax Incentive Program is a self-assessment process, and as such, the Australian Government has the right to audit the qualifying programs and expenditures for a period of four years. If such a review were to occur, and as a result of the review and failure of a related appeal a qualified program and related
expenditures were disqualified, the respective R&D grant could be recalled with penalties and interest. As of December 31, 2016,2017, we have not received any notice regarding a formal review from the Australian Government has not requested a review.Government.
11.10. Fair Value Accounting
The following table sets forth the Company’s assets measured at fair value by level within the fair value hierarchy. As required by accounting guidance, assets are classified in their entirety based on the lowest level of input that is significant to the fair value measurement.
| | | | | | | | | | | | | | | | | | | | |
| | Fair value at December 31, 2016 | | | Fair value at December 31, 2017 | |
| | Total | | Level 1 | | Level 3 | | | Total | | Level 1 | | Level 3 | |
Marketable securities | | $ | 109 | | $ | 109 | | $ | — | | | $ | 90 | | $ | 90 | | $ | — | |
Other investments (Midas Gold Shares) | | | 4,994 | | | 4,994 | | | — | | | | 3,746 | | | 3,746 | | | — | |
Used mill equipment (non-recurring) | | | 6,500 | | | — | | | 6,500 | | | | 6,500 | | | — | | | 6,500 | |
| | | | | | | | | | | | | | | | | | | | |
| | Fair value at December 31, 2015 | | | Fair value at December 31, 2016 | |
| | Total | | Level 1 | | Level 3 | | | Total | | Level 1 | | Level 3 | |
Marketable securities | | $ | 61 | | $ | 61 | | $ | — | | | $ | 109 | | $ | 109 | | $ | — | |
Other investments (Midas Gold Shares) | | | 1,798 | | | 1,798 | | | — | | | | 4,994 | | | 4,994 | | | — | |
Used mill equipment (non-recurring) | | | 6,500 | | | — | | | 6,500 | | | | 6,500 | | | — | | | 6,500 | |
Our marketable securities and investment in Midas Gold Shares are classified as Level 1 of the fair value hierarchy as they are valued at quoted market prices in an active market. Marketable securities are included in other current assets on the Consolidated Balance Sheets for each period presented.
The mill equipment is classified as Level 3 of the fair value hierarchy as its value at December 31, 20162017 and 20152016 was based on an independent third partythird-party valuation. The mill equipment is included in plant and equipment on the Consolidated Balance Sheets for each period presented.
There were no transfers between levels nor were there any changes in valuation methods in 2016.2017.
12.11. Supplemental Cash Flow Information and Material Non-Cash Transactions
As of December 31, 2017, 2016 2015 and 2014,2015, all of our cash was held in liquid bank deposits and/or government treasury billsbills/notes in the Unites States and Australia.
There were no significant non-cash transactions for the year ended December 31, 2017, 2016 2015 or 2014.2015.
During the years ended December 31, 2014, we paid interest associated with the 2013 Facility
13.12. Income Taxes
The Company’s U.S. and foreign source income/(loss) is as follows:
| | | | | | | | | | | | | | | | | | | | |
| | Years ended December 31, | | | Years ended December 31, | |
| | 2016 | | 2015 | | 2014 | | | 2017 | | 2016 | | 2015 | |
U.S. | | $ | 1,219 | | $ | (3,297) | | $ | (6,705) | | | $ | (2,477) | | $ | 1,219 | | $ | (3,297) | |
Canada | | | (1,395) | | | (121) | | | (7,750) | | | | (2,119) | | | (1,395) | | | (121) | |
Other Foreign | | | (2,957) | | | 4,429 | | | (4,471) | | | | (7,439) | | | (2,957) | | | 4,429 | |
| | $ | (3,133) | | $ | 1,011 | | $ | (18,926) | | | $ | (12,035) | | $ | (3,133) | | $ | 1,011 | |
During the years ended December 31, 2017, 2016 2015 and 2014,2015, the Company has recognized ‘nil’ current and deferred income tax expense or benefit in each of the US, Canadian, and other foreign jurisdictions, due to full valuation allowances within each jurisdiction.
Rate Reconciliation
A reconciliation of the combined income taxes at the statutory rates and the Company’s effective income tax benefit is as follows:
| | | | | | | | | | | | | | | | | | | | |
| | Years ended December 31, | | | Years ended December 31, | |
| | 2016 | | 2015 | | 2014 | | | 2017 | | 2016 | | 2015 | |
Income taxed at statutory rates | | $ | (1,226) | | $ | 392 | | $ | (7,314) | | | $ | (4,212) | | $ | (1,226) | | $ | 392 | |
Increase (decrease) in taxes from: | | | | | | | | | | | | | | | | | | | | |
Stock-based compensation | | | (382) | | | 32 | | | 41 | | | | 46 | | | (382) | | | 32 | |
Other adjustments | | | 15 | | | 27 | | | 5 | | | | (87) | | | 15 | | | 27 | |
Adjustment due to capital transactions | | | | | | (119) | | | — | | | | | | | | | | (119) | |
R&D grant | | | 5,936 | | | 5,366 | | | — | | | | — | | | 5,936 | | | 5,366 | |
Prior year provision to actual adjustments | | | (4,269) | | | (2,894) | | | (4,511) | | | | 108 | | | (4,269) | | | (2,894) | |
Change in US tax rate | | | | 2,487 | | | | | | | |
Differences in tax rates | | | 524 | | | (368) | | | 541 | | | | 563 | | | 524 | | | (368) | |
Effect of foreign exchange | | | 379 | | | 350 | | | 276 | | | | (99) | | | 379 | | | 350 | |
Expiration of NOLs | | | - | | | 231 | | | 189 | | | | — | | | — | | | 231 | |
Change in valuation allowance | | | (977) | | | (3,017) | | | 10,773 | | | | 1,194 | | | (977) | | | (3,017) | |
Income tax (benefit)/expense | | $ | — | | $ | — | | $ | — | | | $ | — | | $ | — | | $ | — | |
Deferred Taxes
Deferred income taxes reflect the net effects of temporary differences between the carrying amounts of assets and liabilities for financial reporting purposes and the amounts used for income tax purposes. The significant components of our deferred tax assets and liabilities as at December 31 are as follows:
| | | | | | | | | | | | | | | | | | | | |
| | December 31, | | | December 31, | |
| | 2016 | | 2015 | | 2014 | | | 2017 | | 2016 | | 2015 | |
Deferred income tax assets | | | | | | | | | | | | | | | | | | | | |
Excess tax basis over book basis of property, plant and equipment | | $ | 7,773 | | $ | 7,785 | | $ | 7,893 | | | $ | 7,488 | | $ | 7,773 | | $ | 7,785 | |
Marketable securities | | | 713 | | | 862 | | | 798 | | | | 771 | | | 713 | | | 862 | |
Operating loss carryforwards | | | 27,943 | | | 26,464 | | | 35,001 | | | | 28,530 | | | 27,943 | | | 26,464 | |
Capital loss carryforwards | | | 13,469 | | | 13,463 | | | 10,212 | | | | 13,470 | | | 13,469 | | | 13,463 | |
Other | | | 1,783 | | | 2,725 | | | 2,891 | | | | 1,848 | | | 1,783 | | | 2,725 | |
Total future tax assets | | | 51,681 | | | 51,299 | | | 56,795 | | | | 52,107 | | | 51,681 | | | 51,299 | |
Valuation allowance for future tax assets | | | (50,209) | | | (50,816) | | | (54,397) | | | | (51,406) | | | (50,209) | | | (50,816) | |
| | | 1,472 | | | 483 | | | 2,398 | | | | 701 | | | 1,472 | | | 483 | |
Deferred income tax liabilities | | | | | | | | | | | | | | | | | | | | |
Other investments | | | 1,472 | | | 483 | | | 1,916 | | | | 701 | | | 1,472 | | | 483 | |
Amayapampa disposal consideration | | | — | | | — | | | 482 | | |
| | | 1,472 | | | 483 | | | 2,398 | | | | 701 | | | 1,472 | | | 483 | |
| | | | | | | | | | | | | | | | | | | | |
Total Deferred Taxes | | $ | — | | $ | — | | $ | — | | | $ | — | | $ | — | | $ | — | |
Valuation Allowance on Canadian and Foreign Tax Assets
We establish a valuation allowance against the future income tax assets if, based on available information, it is more likely than not that all of the assets will not be realized. The valuation allowance of $50,209,$51,406, $50,816209, and $54,397$50,816 at December 31, 2017, 2016 2015 and 2014,2015, respectively, relates mainly to net operating loss carryforwards, in Canada and other foreign tax jurisdictions, where the utilization of such attributes is not more likely than not. The Company continually assesses both positive and negative evidence to determine whether it is more likely than not that deferred tax assets can be realized prior to their expiration.
Loss Carryforwards
The Company has available income tax losses of $67,$73,822532, which may be carried forward and applied against future taxable income when earned.
The losses expire as follows:
| | | | | | | | | | | | | | | | | | | | | | | | | | | | | | | | |
| | Noncapital
Canada (1) | | U.S. | | Mexico | | Barbados | | Total | | | Noncapital
Canada (1) | | U.S. | | Mexico | | Barbados | | Total | |
2016 | | $ | — | | $ | — | | $ | — | | $ | (2) | | $ | (2) | | |
2017 | | | — | | | — | | | — | | | (1) | | | (1) | | | $ | — | | $ | — | | $ | — | | $ | (1) | | $ | (1) | |
2018 | | | — | | | — | | | — | | | (6) | | | (6) | | | | — | | | — | | | — | | | (6) | | | (6) | |
2019 | | | — | | | — | | | — | | | (20) | | | (20) | | | | — | | | — | | | — | | | (20) | | | (20) | |
2020 | | | — | | | — | | | — | | | (42) | | | (42) | | | | — | | | — | | | — | | | (42) | | | (42) | |
2021 | | | — | | | — | | | — | | | (20) | | | (20) | | | | — | | | — | | | — | | | (20) | | | (20) | |
2022 | | | — | | | — | | | (5,511) | | | (31) | | | (5,542) | | | | — | | | — | | | (5,933) | | | (31) | | | (5,964) | |
2023 | | | — | | | — | | | (302) | | | (23) | | | (325) | | | | — | | | — | | | (325) | | | (22) | | | (347) | |
2024 | | | — | | | — | | | — | | | (4) | | | (4) | | | | — | | | — | | | — | | | (4) | | | (4) | |
2025 | | | — | | | — | | | — | | | (6) | | | (6) | | | | — | | | — | | | (70) | | | (8) | | | (78) | |
2026 | | | (1,027) | | | — | | | — | | | — | | | (1,027) | | | | (1,027) | | | — | | | (654) | | | (6) | | | (1,687) | |
2027 | | | (847) | | | (1,287) | | | — | | | — | | | (2,134) | | | | (847) | | | — | | | (205) | | | (6) | | | (1,058) | |
2028 | | | (5,245) | | | (1,719) | | | — | | | — | | | (6,964) | | | | (5,245) | | | (1,287) | | | — | | | — | | | (6,532) | |
2029 | | | (4,022) | | | (1,970) | | | — | | | — | | | (5,992) | | | | (4,022) | | | (1,719) | | | — | | | — | | | (5,741) | |
2030 | | | (5,032) | | | (1,827) | | | — | | | — | | | (6,859) | | | | (5,032) | | | (1,970) | | | — | | | — | | | (7,002) | |
2031 | | | (3,806) | | | (3,407) | | | — | | | — | | | (7,213) | | | | (3,806) | | | (1,827) | | | — | | | — | | | (5,633) | |
2032 | | | (6,397) | | | (2,323) | | | — | | | — | | | (8,720) | | | | (6,397) | | | (3,407) | | | — | | | — | | | (9,804) | |
2033 | | | (6,076) | | | (3,098) | | | — | | | — | | | (9,174) | | | | (6,076) | | | (2,323) | | | — | | | — | | | (8,399) | |
2034 | | | (4,420) | | | (2,824) | | | — | | | — | | | (7,244) | | | | (4,420) | | | (3,098) | | | — | | | — | | | (7,518) | |
2035 | | | (3,729) | | | — | | | | | | | | | (3,729) | | | | (3,729) | | | (2) | | | — | | | — | | | (3,731) | |
2036 | | | (2,798) | | | — | | | | | | | | | (2,798) | | | | (2,799) | | | (2,655) | | | | | | | | | (5,454) | |
2037 | | | | (1,949) | | | (2,542) | | | | | | | | | (4,491) | |
| | $ | (43,399) | | $ | (18,455) | | $ | (5,813) | | $ | (155) | | $ | (67,822) | | | $ | (45,349) | | $ | (20,830) | | $ | (7,187) | | $ | (166) | | $ | (73,532) | |
| (1) | | Canadian capital loss carryforwards of $55,367$53,875 and Australian NOLs of $25,909,$32,002, which do not expire and are therefore not included above. |
During 2016, an income tax benefit and the corresponding valuation allowance of $370 related to share-issuance cost was recorded directly to equity.
Accounting for uncertainty in taxes
Accounting Standards Codification Topic 740 guidance requires that the Company evaluate all income tax positions taken, and recognize a liability for any uncertain tax positions that are not more likely than not to be sustained by the tax authorities. As of December 31, 2016,2017, the Company believes it has no liability for unrecognized tax positions. If the Company were to determine there were any uncertain tax positions, the Company would recognize the liability and related interest and penalties within income tax expense.
Tax statute of limitations
The Company files income tax returns in Canada, U.S. federal and state jurisdictions and other foreign jurisdictions. There are currently no tax examinations underway for these jurisdictions. Furthermore, the Company is no longer subject to Canadian tax examinations by the Canadian Revenue Authority for years ended on or before December 31, 20132014 or U.S. federal income tax examinations by the Internal Revenue Service for years ended on or before December 31, 2013.2014. Some U.S. state and other foreign jurisdictions are still subject for tax examination for years ended on or before December 31, 2012.
2013.
Although certain tax years are closed under the statute of limitations, tax authorities can still adjust losses being carried forward into open years.
Tax reform
14.On December 22, 2017, the U.S. government enacted comprehensive tax legislation commonly referred to as the Tax Cut and Jobs Act of 2017 (“TCJA”). The passage of this legislation resulted in the change in the U.S. statutory rate from 35% to 21% beginning in January of 2018, the elimination of the corporate alternative minimum tax (“AMT”), the acceleration of depreciation for US tax purposes, limitations on deductibility of interest expense, the elimination of net operating loss carrybacks, and limitations on the use of future losses. In accordance with ASC 740, Income Taxes, the impact of a change in tax law is recorded in the period of enactment. Consequently, the Company has recorded a decrease to its net deferred tax assets of $2,487 with a corresponding net adjustment to the valuation allowance for the year ended December 31, 2017. Based on the Company's current interpretation and subject to the release of the related regulations and any future interpretive guidance, the Company believes the effects of the change in tax law incorporated herein are substantially complete. As a result of other changes introduced by the TCJA, starting with compensation paid in 2018, Section 162(m) will limit us from deducting compensation, including performance-based compensation, in excess of $1,000 paid to anyone who, starting in 2018, serves as the Chief Executive Officer or Chief Financial Officer, or who is among the three most highly compensated executive officers for any fiscal year. The only exception to this rule is for compensation that is paid pursuant to a binding contract in effect on November 2, 2017 that would have otherwise been deductible under the prior Section 162(m) rules. Accordingly, any compensation paid in the future pursuant to new compensation arrangements entered into after November 2, 2017, even if performance-based, will count towards the $1,000 fiscal year deduction limit if paid to a covered executive. Additional information that may affect our income tax accounts and disclosures would include further clarification and guidance on how the Internal Revenue Service will implement tax reform, including guidance with respect to 100% bonus depreciation on self-constructed assets and Section 162(m), further clarification and guidance on how state taxing authorities will implement tax reform and the related effect on our state income tax returns, completion of our 2017 tax return filings, and the potential for additional guidance from the SEC or the FASB related to tax reform.
13. Geographic and Segment information
The Company has one reportable operating segment, consisting of evaluation, acquisition, and exploration activities. We evaluate, acquire, explore and advance gold exploration and potential development projects, which may lead to gold production or value adding strategic transactions. These activities are currently focused principally in Australia. We reported no revenues during the years ended December 31, 2017, 2016 2015 and 2014.2015. Geographic location of mineral properties and plant and equipment is provided in Notes 4 and 5, respectively.
15.14. Provision for Environmental Liability
TheDuring 2016, the Province of British Columbia Ministry of Energy and Mines (“MEM”) has requested that the Company prepare and present to MEM a reclamation plan for closure and abandonment of certain mining claims in British Columbia which the Company had disposed of in 1996. A plan was presented to MEM and we are awaiting a formal response. Assuming no other potentially responsible parties are identified, and based on preliminary estimates of the reclamation costs, we have accrued $350estimated reclamation and other related costs, as of December 31, 2017 and 2016 on an undiscounted basis, which hashave been included in Exploration, property evaluation and holding costs. It is possible that this estimate may change.
ITEM 9. CHANGES IN AND DISAGREEMENTS WITH ACCOUNTANTS ON ACCOUNTING AND FINANCIAL DISCLOSURE.
None.
ITEM 9A. CONTROLS AND PROCEDURES.
Disclosure Controls and Procedures.
At the end of the period covered by this annual report on Form 10-K for the fiscal year ended December 31, 2016,2017, an evaluation was carried out under the supervision of and with the participation of our management, including the Chief Executive Officer (“CEO”) and Chief Financial Officer (“CFO”), of the effectiveness of the design and operations of our disclosure controls and procedures (as defined in Rule 13a-15(e) and Rule 15d-15(e) under the Exchange Act). Based on that evaluation, the CEO and the CFO have concluded that as of the end of the period covered by this annual report, our disclosure controls and procedures were effective in ensuring that: (i) information required to be disclosed by us in reports that we file or submit to the SEC under the Exchange Act is recorded, processed, summarized and reported within the time periods specified in applicable rules and forms and (ii) material information required to be disclosed in our reports filed under the Exchange Act is accumulated and communicated to our management, including our CEO and CFO, as appropriate, to allow for accurate and timely decisions regarding required disclosure.
Internal Control over Financial Reporting.
Management’s Report on Internal Control over Financial Reporting.
Management’s report on internal control over financial reporting and the attestation report on management’s assessment are included in “Item 8 Financial Statements and Supplementary Data” herein.
Attestation Report of the Independent Registered Public Accounting Firm.
EKS&H’s attestation report on our internal control over financial reporting is included as part of “Item 8. Financial Statements and Supplementary Data” herein.
Changes in Internal Controls.
There has been no change in our internal control over financial reporting during the quarter ended December 31, 20162017 that has materially affected, or is reasonably likely to materially affect, our internal control over financial reporting.
ITEM 9B. OTHER INFORMATION.
None.
PART III
ITEM 10. DIRECTORS, EXECUTIVE OFFICERS AND CORPORATE GOVERNANCE.
Information concerning our executive officers, directors, Audit Committee, corporate governance, compliance with Section 16(a) of the Exchange Act and Code of Ethics is contained in our definitive Proxy Statement, filed pursuant to Regulation 14A promulgated under the Securities Exchange Act of 1934 for the 20172018 Annual Meeting of Stockholders (the “Proxy Statement”) and is incorporated herein by reference.
Code of Business Conduct and Ethics
We have a code of business conduct and ethics (the “Code of Ethics”) that applies to all of our employees, officers and directors of the Company and its affiliated entities. The Code of Ethics is available on our website at www.vistagold.com and we will post any amendments to, or waivers from, including an implicit waiver, the Code of Ethics on that website.
ITEM 11. EXECUTIVE COMPENSATION.
Information relating to executive compensation will be contained in the Proxy Statement and is incorporated herein by reference.
ITEM 12. SECURITY OWNERSHIP OF CERTAIN BENEFICIAL OWNERS AND MANAGEMENT AND RELATED STOCKHOLDER MATTERS.
Information relating to security ownership of certain beneficial owners of our common shares, our equity compensation plans and the security ownership of our management will be contained in the Proxy Statement and is incorporated herein by reference.
ITEM 13. CERTAIN RELATIONSHIPS AND RELATED TRANSACTIONS.
Information concerning this item will be contained in the Proxy Statement and is incorporated herein by reference.
ITEM 14. PRINCIPAL ACCOUNTANT FEES AND SERVICES.
Information concerning this item will be contained in the Proxy Statement and is incorporated herein by reference.
PART IV
ITEM 15. EXHIBITS AND FINANCIAL STATEMENT SCHEDULES.
Documents Filed as Part of Report
Financial Statements
The following Consolidated Financial Statements of the Company are filed as part of this report:
| 1. | | Report of Independent Registered Public Accounting Firm. |
| 2. | | Report of Independent Registered Public Accounting Firm.Consolidated Balance Sheets – At December 31, 2017 and 2016.
|
| 3. | | Consolidated Balance SheetsStatements of Income/(Loss) and Comprehensive Income/(Loss) – AtYears ended December 31, 2017, 2016 and 2015. |
| 4. | | Consolidated Statements of Income/(Loss) and Comprehensive Income/(Loss)Cash Flows – Years ended December 31, 2017, 2016 2015 and 2014.2015. |
| 5. | | Consolidated Statements of Cash FlowsShareholders’ Equity – Years ended December 31, 2017, 2016 2015 and 2014.2015. |
| 6. | | Consolidated Statements of Shareholders’ Equity – Years ended December 31, 2016, 2015 and 2014.
|
| 7.
| | Notes to Consolidated Financial Statements. |
See “Item 8. Financial Statements and Supplementary Data”.
Financial Statement Schedules
No other financial statement schedules are filed as part of this report because such schedules are not applicable or the required information is shown in the Consolidated Financial Statements or notes thereto. See “Item 8. Financial Statements and Supplementary Data”.
Exhibits
The following exhibits are filed as part of this report:
| | |
Exhibit
Number | | Description |
3.01 | | Certificate of Continuation, previously filed as Exhibit 3.1 to the Company’s Form 8-K dated June 12, 2013 and incorporated by reference herein (File No. 1-9025) |
3.02 | | Notice of Articles, previously filed as Exhibit 3.2 to the Company’s Form 8-K dated June 12, 2013 and incorporated herein by reference (File No. 1-9025) |
3.03 | | Articles, previously filed as Exhibit 3.3 to the Company’s Form 8-K dated June 12, 2013and2013 and incorporated herein by reference (File No. 1-9025) |
4.01 | | Warrant Indenture dated August 8, 2016, previously filed as Exhibit 4.1 to the Company’s Form 8-K dated August 8, 2016 and incorporated herein by reference (File No. 1-9025) |
10.01* | | Amended Stock Option Plan of Vista Gold filed as Appendix F to the Company’s Proxy Statement on March 20, 2015 and incorporated herein by reference (File No. 1-9025) |
10.02* | | Amended Long Term Equity Incentive Plan of Vista Gold filed as Appendix E to the Company’s Proxy Statement on March 20, 2015 and incorporated herein by reference (File No. 1-9025) |
10.03 | | Agreement, dated March 1, 2006, among the Northern Territory of Australia, Vista Gold Australia Pty. Ltd. and Vista Gold Corp. filed as Exhibit 10.2410.2 to the Company’s Annual Report on Form 8-K, dated February 28, 2006 and incorporated herein by reference (File No. 1-9025) |
10.0410.04*
| | Earn-In Right Agreement, dated February 7, 2012, filed as Exhibit 10.1 to the Company’s Current Report on Form 8-K dated February 13, 2012 and incorporated herein by reference (File No. 1-9025)
|
10.05*
| | Employment Agreement with John F. Engele, filed as Exhibit 10.1 to the Company’s Current Report on Form 8-K dated June 1, 2012 and incorporated herein by reference (File No. 1-9025)
|
10.06*
| | Employment Agreement with John W. Rozelle, filed as Exhibit 10.1 to the Company’s Current Report on Form 8-K dated August 6, 2012 and incorporated herein by reference (File No. 1-9025)
|
10.07*
| | Amended Employment Agreement of John F. Engele, dated November 1, 2012, previously filed as Exhibit 10.13 to the Company’s Form 10-K dated March 14, 2013 and incorporated herein by reference (File No. 1-9025) |
10.08*10.05*
| | Amended Employment Agreement of FredFrederick H. Earnest, dated November 1, 2012 previously filed as Exhibit 10.14 to the Company’s Form 10-K dated March 14, 2013 and incorporated herein by reference (File No. 1-9025) |
10.09*10.06*
| | Amended Employment Agreement of John W. Rozelle, dated November 1, 2012 previously filed as Exhibit 10.15 to the Company’s Form 10-K dated March 14, 2013 and incorporated herein by reference (File No. 1-9025) |
10.10
| | Credit Agreement between the Company and Sprott Resource Lending Partnership, dated March 28, 2013, previously filed as Exhibit 10.1 to the Corporation’s Form 8-K dated April 2, 2013 and incorporated herein by reference (File No. 1-9025)
|
10.1110.07*
| | General Security Agreement between the Company and Sprott Resource Lending Partnership, dated March 28, 2013, previously filed as Exhibit 10.2 to the Corporation’s Form 8-K dated April 2, 2013 and incorporated herein by reference (File No. 1-9025)
|
10.12
| | Credit Agreement Modification Agreement, previously filed as Exhibit 10.1 to the Company’s Form 8-K dated September 26, 2013 and incorporated herein by reference (File No. 1-9025)
|
10.13
| | Terms of Agreement – Los Cardones Project, previously filed as Exhibit 10.1 to the Company’s Form 8-K dated October 8, 2013 and incorporated herein by reference (File No. 1-9025)
|
10.14
| | Share Purchase Agreement between the Company and Invecture dated October 16, 2013, previously filed as Exhibit 10.13 to the Corporation’s Form 10-K dated March 17, 2014 and incorporated herein by reference (File No. 1-9025)
|
10.15
| | Termination of Trust Agreement dated October 16, 2013, previously filed as Exhibit 10.14 to the Company’s Form 10-K dated March 17, 2014 and incorporated herein by reference (File No. 1-9025)
|
10.16
| | Debt Transfer Agreement dated October 16, 2013, previously filed as Exhibit 10.15 to the Company’s Form 10-K dated March 17, 2014 and incorporated herein by reference (File No. 1-9025)
|
10.17
| | Termination Agreement between Invecture Group, S.A. de C.V., Desarrollos Zapal Holdings Corp., Granges Inc., Desarrollos Zapal, S.A. de C.V. and Vista Gold Corp.,dated October 18, 2013, , previously filed as Exhibit 10.16 to the Company’s Form 10-K dated March 17, 2014 and incorporated herein by reference (File No. 1-9025)
|
10.18
| | Share Pledge Agreement between the Company and Sprott Resource Lending Partnership dated November 8, 2013, previously filed as Exhibit 10.17 to the Company’s Form 10-K dated March 17, 2014 and incorporated herein by reference (File No. 1-9025)
|
10.19
| | Share Pledge Agreement between the Vista Gold US Inc and Sprott Resource Lending Partnership dated November 8, 2013, previously filed as Exhibit 10.18 to the Company’s Form 10-K dated March 17, 2014 and incorporated herein by reference (File No. 1-9025)
|
10.20
| | Amendment Agreement, previously filed as Exhibit 10.1 to the Company’s Form 8-K dated February 4, 2014 and incorporated herein by reference (File No. 1-9025)
|
10.21
| | Agency Agreement between the Company and a certain agent relating to the sale of shares of Midas Gold Corp. dated February 5, 2014, previously filed as Exhibit 10.2 to the Company’s Form 10-Q dated May 2, 2014 and incorporated herein by reference (File No. 1-9025)
|
10.22
| | Finder’s Fee Agreement between the Company and a certain finder relating to the sale of shares of Midas Gold Corp. dated February 14, 2014, previously filed as Exhibit 10.3 to the Corporation’s Form 10-Q dated May 2, 2014 and incorporated herein by reference (File No. 1-9025)
|
10.23*
| | Earnest Amendment Agreement, dated March 12, 2014, previously filed as Exhibit 10.1 to the Company’s Form 8-K dated March 14, 2014 and incorporated herein by reference (File No. 1-9025) |
10.24*10.08*
| | Engele Amendment Agreement, dated March 12, 2014, previously filed as Exhibit 10.2 to the Company’s Form 8-K dated March 14, 2014 and incorporated herein by reference (File No. 1-9025) |
10.2510.09*
| | Option Agreement – Guadalupe de los Reyes filed as Exhibit 10.1 to the Company’s Form 8-K dated April 17, 2014 and incorporated herein by reference (File No. 1-9025)
|
10.26
| | Second Amending Agreement between the Company and RPG Structured Finance S.á.R.L, previously filed as Exhibit 10.1 to the Company’s Form 8-K dated July 31, 2014 and incorporated herein by reference (File No. 1-9025)
|
10.27
| | Third Amending Agreement between the Company and RPG Structured Finance S.á.R.L, previously filed as Exhibit 10.1 to the Company’s Form 8-K dated February 2, 2015 and incorporated herein by reference (File No. 1-9025)
|
10.27
| | Agency Agreement with Haywood Securities Inc. dated February 24, 2015, previously filed as Exhibit 10.1 to the Company’s Form 8-K dated March 2, 2015 and incorporated herein by reference (File No. 1-9025)
|
10.29
| | Finders Agreement with Global Market Development LLC, dated February 25, 2015, previously filed as Exhibit 10.2 to the Company’s Form 8-K dated March 2, 2015 and incorporated herein by reference (File No. 1-9025)
|
10.30*
| | Earnest Amendment Agreement dated January 1, 2016, previously filed as Exhibit 10.30 to the Company’s Form 10-K dated February 26, 2016 and incorporated herein by reference (File No. 1-9025) |
10.31*10.10*
| | Engele Amendment Agreement dated January 1, 2016, previously filed as Exhibit 10.3010.31 to the Company’s Form 10-K dated February 26, 2016 and incorporated herein by reference (File No. 1-9025) |
10.32*10.11*
| | Rozelle Amendment Agreement dated January 1, 2016, previously filed as Exhibit 10.3010.32 to the Company’s Form 10-K dated February 26, 2016 and incorporated herein by reference (File No. 1-9025) |
2110.12
| | Subsidiaries ofOption Agreement for the CorporationGuadalupe de los Reyes property, previously filed as Exhibit 10.1 to the Company’s Form 8-K dated October 27, 2017 and incorporated herein by reference (File No. 1-9025)
|
23.110.13
| | Consent of EKS&H LLLP, Denver, Independent Registered Public Accounting FirmAt-the-Market Offering Agreement dated November 22, 2017, previously filed as Exhibit 1.1 to the Company’s Form 8-K dated November 22, 2017 and incorporated herein by reference (File No. 1-9025)
|
23.2
| | Consent of Tetra Tech, Inc.
|
* Management Contract or Compensatory Plan
| 1. | | Submitted Electronically Herewith. Attached as Exhibit 101 to this report are the following formatted in XBRL (Extensible Business Reporting Language): (i) Consolidated Statements of Income/(Loss) and Comprehensive Income/(Loss)for the years ended December 31, 2017, 2016 2015 and 20142015, (ii) Consolidated Balance Sheets at December 31, 20162017 and 2015,2016, (iii) Consolidated Statements of Cash Flows for the years ended December 31, 2017, 2016 2015 and 20142015, and (iv) Notes to Consolidated Financial Statements. |
ITEM 16. FORM 10-K SUMMARY
None.
SIGNATURES
Pursuant to the requirements of Section 13 or 15(d) of the Securities Exchange Act of 1934, the registrant has duly caused this report to be signed on its behalf by the undersigned, thereunto duly authorized.
| |
| VISTA GOLD CORP. (Registrant) |
Dated: February 22, 2017March 6, 2018 | By: /s/ Frederick H. Earnest |
| Frederick H. Earnest, |
| Chief Executive Officer |
Dated: February 22, 2017March 6, 2018 | By: /s/ John F. Engele |
| John F. Engele |
| Chief Financial Officer |
Pursuant to the requirements of the Securities Exchange Act of 1934, this report has been signed below by the following persons on behalf of the registrant and in the capacities and on the dates indicated:
| |
Dated: February 22, 2017March 6, 2018 | By: /s/ Frederick H. Earnest |
| Frederick H. Earnest, |
| Chief Executive Officer |
| (Principal Executive Officer) |
Dated: February 22, 2017March 6, 2018 | By: /s/ John F. Engele |
| John F. Engele |
| Chief Financial Officer |
| (Principal Financial and Accounting Officer) |
Pursuant to the requirements of the Securities Exchange Act of 1934, this report has been signed below by the following persons on behalf of the registrant and in the capacities and on the dates indicated:
Signature | | Capacity | | Date |
/s/ Frederick H. Earnest Frederick H. Earnest | | Director | | February 22, 2017March 6, 2018
|
* John M. Clark | | Director | | February 22, 2017March 6, 2018
|
* C. Thomas Ogryzlo | | Director | | February 22, 2017March 6, 2018
|
* Tracy Stevenson | | Director | | February 22, 2017March 6, 2018
|
* W. Durand Eppler | | Director | | February 22, 2017March 6, 2018
|
* Michael B. Richings | | Director | | February 22, 2017March 6, 2018
|
* By: /s/ Frederick H. Earnest | | | | |
| | | | |
Frederick H. Earnest, Attorney-in-Fact | | | | |
Pursuant to Power of Attorney filed as Exhibit 24 herewith.