UNITED STATES
SECURITIES AND EXCHANGE COMMISSION
WASHINGTON, D.C. 20549
——————————
FORM 10-K
(Mark One)
x ANNUAL REPORT PURSUANT TO SECTION 13 OR 15(d) OF THE
SECURITIES EXCHANGE ACT OF 1934
FOR THE FISCAL YEAR ENDED DECEMBER 31, 20162018
OR
¨ TRANSITION REPORT PURSUANT TO SECTION 13 OR 15(d) OF THE
SECURITIES EXCHANGE ACT OF 1934
FOR THE TRANSITION PERIOD FROM TO
|
| | | | |
Commission File Number | | Registrants, State of Incorporation, Address, and Telephone Number | | I.R.S. Employer Identification No. |
| | | | |
| 001-09120 | | PUBLIC SERVICE ENTERPRISE GROUP INCORPORATED | | 22-2625848 |
| | | (A New Jersey Corporation) | | |
| | | 80 Park Plaza | | |
| | | Newark, New Jersey 07102 | | |
| | | 973 430-7000 | | |
| | | http://www.pseg.com | | |
| 001-00973 | | PUBLIC SERVICE ELECTRIC AND GAS COMPANY | | 22-1212800 |
| | | (A New Jersey Corporation) | | |
| | | 80 Park Plaza | | |
| | | Newark, New Jersey 07102 | | |
| | | 973 430-7000 | | |
| | | http://www.pseg.com | | |
| 001-34232 | | PSEG POWER LLC | | 22-3663480 |
| | | (A Delaware Limited Liability Company) | | |
| | | 80 Park Plaza | | |
| | | Newark, New Jersey 07102 | | |
| | | 973 430-7000 | | |
| | | http://www.pseg.com | | |
Securities registered pursuant to Section 12(b) of the Act:
|
| | | | |
| Registrant | | Title of Each Class | | Name of Each Exchange On Which Registered |
Public Service Enterprise Group Incorporated | | Common Stock without par value | | New York Stock Exchange |
| | | First and Refunding Mortgage Bonds | | |
Public Service Electric and Gas Company | | 9 1/4%4% Series CC, due 2021 | | New York Stock Exchange |
| | 8%, due 2037 | | |
| | | 5%, due 2037 | | |
| PSEG Power LLC | | 8 5/8%8% Senior Notes, due 2031 | | New York Stock Exchange |
(Cover continued on next page)
(Cover continued from previous page)
|
| | |
| Securities registered pursuant to Section 12(g) of the Act: |
| Registrant | | Title of Each Class |
Public Service Electric and Gas Company | | Medium-Term Notes |
| | | |
| PSEG Power LLC | | Limited Liability Company Membership Interest |
Indicate by check mark whether each registrant is a well-known seasoned issuer, as defined in Rule 405 of the Securities Act.
|
| | | | |
| Public Service Enterprise Group Incorporated | | Yes x | | No ¨ |
| Public Service Electric and Gas Company | | Yes x | | No ¨ |
| PSEG Power LLC | | Yes x | | No ¨ |
Indicate by check mark if each of the registrants is not required to file reports pursuant to Section 13 or 15(d) of the Securities Exchange Act of 1934. Yes ¨ No x
Indicate by check mark whether each of the registrants (1) has filed all reports required to be filed by Section 13 or 15(d) of the Securities Exchange Act of 1934 during the preceding 12 months (or for such shorter period that the registrants were required to file such reports) and (2) has been subject to such filing requirements for the past 90 days. Yes x No ¨
Indicate by check mark whether the registrants have submitted electronically and posted on their corporate Web site, if any, every Interactive Data File required to be submitted and posted pursuant to Rule 405 of Regulation S-T (§232.405 of this chapter) during the preceding 12 months (or for such shorter period that the registrants were required to submit and post such files). Yes x No ¨
Indicate by check mark if disclosure of delinquent filers pursuant to Item 405 of Regulation S-K (§229.405 of this chapter) is not contained herein, and will not be contained, to the best of registrant’s knowledge, in definitive proxy or information statements incorporated by reference in Part III of this Form 10-K or any amendment to this Form 10-K. ¨
Indicate by check mark whether each registrant is a large accelerated filer, an accelerated filer, a non-accelerated filer, or a smaller reporting company, or an emerging growth company. See the definitions of “large accelerated filer,” “accelerated filer”filer,” “smaller reporting company,” and “smaller reporting“emerging growth company” in Rule 12b-2 of the Exchange Act.
|
| | | | | | | |
| Public Service Enterprise Group Incorporated | | Large accelerated filer x | | Accelerated filer ¨o | | Non-accelerated filer ¨o | Smaller reporting company o | Emerging growth company o |
| | | | | |
| Public Service Electric and Gas Company | | Large accelerated filer ¨o | | Accelerated filer ¨o | | Non-accelerated filer x | Smaller reporting company o | Emerging growth company o |
| | | | | |
| PSEG Power LLC | | Large accelerated filer ¨o | | Accelerated filer ¨o | | Non-accelerated filer x | Smaller reporting company o | Emerging growth company o |
If any of the registrants is an emerging growth company, indicate by check mark if such registrant has elected not to use the extended transition period for complying with any new or revised financial accounting standards provided pursuant to Section 13(a) of the Exchange Act. ¨
Indicate by check mark whether any of the registrants is a shell company (as defined in Rule 12b-2 of the Exchange Act). Yes ¨ No x
The aggregate market value of the Common Stock of Public Service Enterprise Group Incorporated held by non-affiliates as of June 30, 20162018 was $23,504,828,537$27,172,268,280 based upon the New York Stock Exchange Composite Transaction closing price.
The number of shares outstanding of Public Service Enterprise Group Incorporated’s sole class of Common Stock as of February 17, 201715, 2019 was 506,217,300.504,999,536.
As of February 17, 2017,15, 2019, Public Service Electric and Gas Company had issued and outstanding 132,450,344 shares of Common Stock, without nominal or par value, all of which were privately held, beneficially and of record, by Public Service Enterprise Group Incorporated.
Public Service Electric and Gas Company and PSEG Power LLC are wholly owned subsidiaries of Public Service Enterprise Group Incorporated and each meet the conditions set forth in General Instruction I(1)(a) and (b) of Form 10-K. Each is filing its Annual Report on Form 10-K with the reduced disclosure format authorized by General Instruction I.
DOCUMENTS INCORPORATED BY REFERENCE |
| | |
Part of Form 10-K of Public Service Enterprise Group Incorporated | | Documents Incorporated by Reference |
| III | | Portions of the definitive Proxy Statement for the 20172019 Annual Meeting of Stockholders of Public Service Enterprise Group Incorporated, which definitive Proxy Statement is expected to be filed with the Securities and Exchange Commission on or about March 14, 2017,12, 2019, as specified herein. |
|
| | |
| | Page |
| FORWARD-LOOKING STATEMENTS | |
FILING FORMAT AND GLOSSARY | |
| WHERE TO FIND MORE INFORMATION | |
| PART I | | |
| Item 1. | Business | |
| | Regulatory Issues | |
| | Environmental Matters | |
| Segment Information | |
| | Executive Officers of the Registrant (PSEG) | |
| Item 1A. | Risk Factors | |
| Item 1B. | Unresolved Staff Comments | |
| Item 2. | Properties | |
| Item 3. | Legal Proceedings | |
| Item 4. | Mine Safety Disclosures | |
| PART II | | |
| Item 5. | Market for Registrant’s Common Equity, Related Stockholder Matters and Issuer Purchases of Equity Securities | |
| Item 6. | Selected Financial Data | |
| Item 7. | Management’s Discussion and Analysis of Financial Condition and Results of Operations | |
| | Executive Overview of 20162018 and Future Outlook | |
| | Results of Operations | |
| | Liquidity and Capital Resources | |
| | Capital Requirements | |
| | Off-Balance Sheet Arrangements | |
| | Critical Accounting Estimates | |
| Item 7A. | Quantitative and Qualitative Disclosures About Market Risk | |
| Item 8. | Financial Statements and Supplementary Data | |
| | Report of Independent Registered Public Accounting Firm | |
| | Consolidated Financial Statements | |
| | Notes to Consolidated Financial Statements | |
| | Note 1. Organization, Basis of Presentation and Summary of Significant Accounting Policies | |
| | Note 2. Recent Accounting Standards | |
| | Note 3. Early Plant RetirementsRevenues | |
| | Note 4. Variable Interest EntitiesEarly Plant Retirements | |
| | Note 5. Variable Interest Entity | |
| Note 6. Property, Plant and Equipment and Jointly-Owned Facilities | |
| Note 6. Regulatory Assets and Liabilities | |
| | Note 7. Long-Term InvestmentsRegulatory Assets and Liabilities | |
| | Note 8. Financing Receivables | |
| Note 9. Available-for-Sale SecuritiesLong-Term Investments | |
| | Note 10. Goodwill and Other Intangibles9. Financing Receivables | |
| Note 10. Trust Investments | |
| | Note 11. Asset Retirement Obligations (AROs)Goodwill and Other Intangibles | |
| | Note 12. Asset Retirement Obligations (AROs) | |
| Note 13. Pension, Other Postretirement Benefits (OPEB) and Savings Plans | |
| Note 13. Commitments and Contingent Liabilities | |
| | Note 14. DebtCommitments and Credit FacilitiesContingent Liabilities | |
| | Note 15. Debt and Credit Facilities | |
| Note 16. Schedule of Consolidated Capital Stock | |
| | Note 16. Financial Risk Management Activities | |
|
| | |
| | | |
| TABLE OF CONTENTS (continued) | |
| | Note 17. Financial Risk Management Activities | |
| | Page |
| | Note 17.18. Fair Value Measurements | |
| | Note 18.19. Stock Based Compensation | |
| | Note 19.20. Other Income and Deductions(Deductions) | |
| | Note 20.21. Income Taxes | |
| | Note 21.22. Accumulated Other Comprehensive Income (Loss), Net of Tax | |
| | Note 22.23. Earnings Per Share (EPS) and Dividends | |
| Note 23. Financial Information by Business Segment | |
| | Note 24. Related-Party TransactionsFinancial Information by Business Segment | |
| | Note 25. Selected Quarterly Data (Unaudited)Related-Party Transactions | |
| | Note 26. Selected Quarterly Data (Unaudited) | |
| Note 27. Guarantees of Debt | |
| Item 9. | Changes In and Disagreements With Accountants on Accounting and Financial Disclosure | |
| Item 9A. | Controls and Procedures | |
| Item 9B. | Other Information | |
| PART III | | |
| Item 10. | Directors, Executive Officers and Corporate Governance | |
| Item 11. | Executive Compensation | |
| Item 12. | Security Ownership of Certain Beneficial Owners and Management and Related Stockholder Matters | |
| Item 13. | Certain Relationships and Related Transactions, and Director Independence | |
| Item 14. | Principal Accounting Fees and Services | |
| PART IV | | |
| Item 15. | Exhibits, Financial Statement Schedules | |
| | Schedule II - Valuation and Qualifying Accounts | |
| Glossary of Terms | |
| | Signatures | |
| Exhibit Index | |
FORWARD-LOOKING STATEMENTS
Certain of the matters discussed in this report about our and our subsidiaries’ future performance, including, without limitation, future revenues, earnings, strategies, prospects, consequences and all other statements that are not purely historical constitute “forward-looking statements” within the meaning of the Private Securities Litigation Reform Act of 1995. Such forward-looking statements are subject to risks and uncertainties, which could cause actual results to differ materially from those anticipated. Such statements are based on management’s beliefs as well as assumptions made by and information currently available to management. When used herein, the words “anticipate,” “intend,” “estimate,” “believe,” “expect,” “plan,” “should,” “hypothetical,” “potential,” “forecast,” “project,” variations of such words and similar expressions are intended to identify forward-looking statements. Factors that may cause actual results to differ are often presented with the forward-looking statements themselves. Other factors that could cause actual results to differ materially from those contemplated in any forward-looking statements made by us herein are discussed in Item 1A. Risk Factors, Item 7. Management’s Discussion and Analysis of Financial Condition and Results of Operations (MD&A), Item 8. Financial Statements and Supplementary Data—Note 13.14. Commitments and Contingent Liabilities, and other filings we make with the United States Securities and Exchange Commission (SEC), including our subsequent reports on Form 10-Q and Form 8-K. These factors include, but are not limited to:
fluctuations in wholesale power and natural gas markets, including the potential impacts on the economic viability of our generation units;
our ability to obtain adequate fuel supply;
any inability to manage our energy obligations with available supply;
PSE&G’s proposed investment programs may not be fully approved by regulators and its capital investment may be lower than planned;
increases in competition in wholesale energy and capacity markets;
changes in technology related to energy generation, distribution and consumption and customer usage patterns;
economic downturns;
third-party credit risk relating to our sale of generation output and purchase of fuel;
adverse performance of our decommissioning and defined benefit plan trust fund investments and changes in funding requirements;
changes in state and federal legislation and regulations;regulations, and PSE&G’s ability to recover costs and earn returns on authorized investments;
the impact of pendingany future rate case proceedings;
regulatory, financial, environmental, health and safety risks associated with our ownership and operation of nuclear facilities;facilities, including regulatory risks, such as compliance with the Atomic Energy Act and trade control, environmental and other regulations, as well as financial, environmental and health and safety risks;
the impact on our New Jersey nuclear plants of the failure of such plants to be selected to participate in the Zero Emissions Certificate (ZEC) program or adverse changes to the capacity market construct;
adverse changes in energy industry laws, policies and regulations, including market structures and transmission planning;
changes in federal and state environmental regulations and enforcement;
delays in receipt of, or an inability to receive, necessary licenses and permits;
adverse outcomes of any legal, regulatory or other proceeding, settlement, investigation or claim applicable to us and/or the energy industry;
changes in tax laws and regulations;
the impact of our holding company structure on our ability to meet our corporate funding needs, service debt and pay dividends;
lack of growth or slower growth in the number of customers or changes in customer demand;
any inability of Power to meet its commitments under forward sale obligations;
reliance on transmission facilities that we do not own or control and the impact on our ability to maintain adequate transmission capacity;
any inability to successfully develop, obtain regulatory approval for, or construct generation, transmission and distribution projects;
any equipment failures, accidents, severe weather events or other incidents that impact our ability to provide safe and reliable service to our customers;
our inability to exercise control over the operations of generation facilities in which we do not maintain a controlling interest;
any inability to recover the carrying amount of our long-lived assets and leveraged leases;
any inability to maintain sufficient liquidity;
any inability to realize anticipated tax benefits or retain tax credits;
challenges associated with recruitment and/or retention of key executives and a qualified workforce;
the impact of our covenants in our debt instruments on our operations; and
the impact of acts of terrorism, cybersecurity attacks or intrusions.
All of the forward-looking statements made in this report are qualified by these cautionary statements and we cannot assure you that the results or developments anticipated by management will be realized or even if realized, will have the expected consequences to, or effects on, us or our business, prospects, financial condition, results of operations or cash flows. Readers are cautioned not to place undue reliance on these forward-looking statements in making any investment decision. Forward-looking statements made in this report apply only as of the date of this report. While we may elect to update forward-looking statements from time to time, we specifically disclaim any obligation to do so, even in light of new information or future events, unless otherwise required by applicable securities laws.
The forward-looking statements contained in this report are intended to qualify for the safe harbor provisions of Section 27A of the Securities Act of 1933, as amended, and Section 21E of the Securities Exchange Act of 1934, as amended.
FILING FORMAT AND GLOSSARY
This combined Annual Report on Form 10-K is separately filed by Public Service Enterprise Group Incorporated (PSEG), Public Service Electric and Gas Company (PSE&G) and PSEG Power LLC (Power). Information relating to any individual company is filed by such company on its own behalf. PSE&G and Power are each only responsible for information about itself and its subsidiaries.
Discussions throughout the document refer to PSEG and its direct operating subsidiaries, PSE&G and Power. Depending on the context of each section, references to “we,” “us,” and “our” relate to PSEG or to the specific company or companies being discussed. In addition, certain key acronyms and definitions are summarized in a glossary beginning on page 193.
WHERE TO FIND MORE INFORMATION
We file annual, quarterly and current reports, proxy statements and other information with the SEC. You may read and copy any document that we file at the Public Reference Room of the SEC at 100 F Street, N.E., Washington, D.C. 20549. Information on the operation of the Public Reference Room may be obtained by calling the SEC at 1-800-SEC-0330. You may also obtain our filed documents from commercial document retrieval services, the SEC’s internet website at www.sec.gov or our website at www.pseg.com. Information on our website should not be deemed incorporated into or as a part of this report. Our Common Stock is listed on the New York Stock Exchange under the tickertrading symbol PEG. You can obtain information about us at the offices of the New York Stock Exchange, Inc., 20 Broad11 Wall Street, New York, New York 10005.
PART I
ITEM 1. BUSINESS
We were incorporated under the laws of the State of New Jersey in 1985 and our principal executive offices are located at 80 Park Plaza, Newark, New Jersey 07102. We conduct our business through two direct wholly owned subsidiaries, PSE&G and Power, each of which also has its principal executive offices at 80 Park Plaza, Newark, New Jersey 07102.
We are an energy company with a diversified business mix. Our operations are located primarily in the Northeastern and Mid- Atlantic United States. Our business approach focuses on operational excellence, financial strength and disciplined investment. As a holding company, our profitability depends on our subsidiaries’ operating results. Below are descriptions of our two principal direct operating subsidiaries.
|
| | | | |
| | PSE&G | | Power | |
| | | | |
| | A New Jersey corporation, incorporated in 1924, which is a franchised public utility in New Jersey. It is also the provider of last resort for gas and electric commodity service for end users in its service territory. Earns revenues from its regulated rate tariffs under which it provides electric transmission and electric and gas distribution to residential, commercial and industrial customers in its service territory. It also offers appliance services and repairs to customers throughout its service territory. Has also implementedAlso invests in regulated demand responsesolar generation projects and regulated energy efficiency and related programs and invested in solar generation within New Jersey.
| | A Delaware limited liability company formed in 1999 as a result of the deregulation and restructuring of the electric power industry in New Jersey. It integrates the operations of its merchant nuclear and fossil generating assets with its wholesale power marketing businesses and fuel supply functions through competitive energy sales in well-developed energy markets and fuel supply functions.markets. Earns revenues from the generation and marketing of power and natural gas to hedge business risks and optimize the value of its portfolio of power plants, other contractual arrangements and oil and gas storage facilities. This is achieved primarily by selling power and transacting in natural gas and other energy-related products, on the spot market or using short-term or long-term contracts for physical and financial products. Also earns revenues from solar generation facilities under long-term sales contracts for power and environmental products.
| |
| | | | | |
Our other direct wholly owned subsidiaries are: PSEG Long Island LLC (PSEG LI), which operates the Long Island Power Authority’s (LIPA) electric transmission and distribution (T&D) system under a contractual agreement; PSEG Energy Holdings L.L.C. (Energy Holdings), which earns its revenues primarily from its portfolio of lease investments; PSEG Long Island LLC (PSEG LI), which operates the Long Island Power Authority’s (LIPA) transmission and distribution (T&D) system under a contractual agreement; and PSEG Services Corporation (Services), which provides us and our operating subsidiaries with certain management, administrative and general services at cost.
The following is a more detailed description of our business, including a discussion of our:
Business Operations and Strategy
Competitive Environment
Employee Relations
Regulatory Issues
Environmental Matters
BUSINESS OPERATIONS AND STRATEGY
PSE&G
Our regulated transmission and distribution (T&D) public utility, PSE&G, distributes electric energy and gas to customers within a designated service territory running diagonally across New Jersey where approximately 6.2 million people, or about 70% of
New Jersey’s population resides.
.
Products and Services
Our utility operations primarily earn margins through the transmission and distributionT&D of electricity and the distribution of gas.
Transmission—the movement of electricity at high voltage from generating plants to substations and transformers, where it is then reduced to a lower voltage for distribution to homes, businesses and industrial customers. Our
revenues for these services are based upon tariffs approved by the Federal Energy Regulatory Commission (FERC).
Distribution—the delivery of electricity and gas to the retail customer’s home, business or industrial facility. Our revenues for these services are based upon tariffs approved by the New Jersey Board of Public Utilities (BPU).
The commodity portion of our utility business’ electric and gas sales is managed by basic generation service (BGS) and basic gas supply service (BGSS) suppliers. Pricing for those services areis set by the BPU as a pass-through, resulting in no margin for our utility operations.
We also earn margins through competitive services, such as appliance repair.repair, in our service territory.
In addition to our current utility products and services, we have implemented several programs to invest in regulated solar generation within New Jersey, including:
programs to help finance the installation of solar power systems throughout our electric service area, and
programs to develop, own and operate solar power systems.
We have also implemented a set of energy efficiency and demand response programs to encourage conservation and energy efficiency by providing energy and cost savingcost-saving measures directly to businesses and families. For additional information concerning these programs and the components of our tariffs, see Regulatory Issues—State Regulation and Item 8. Financial Statements and Supplementary Data—Note 6. Regulatory Assets and Liabilities.
How PSE&G Operates
We are a transmission owner in PJM Interconnection, L.L.C. (PJM) and we provide distribution service to 2.22.3 million electric customers and 1.8 million gas customers in a service area that covers approximately 2,600 square miles running diagonally across New Jersey. We serve the most heavilydensely populated, commercialized and industrialized territory in New Jersey, including its six largest cities and approximately 300 suburban and rural communities.
Transmission
We use formula rates for our transmission cost of service and investments. Formula-type rates provide a method of rate recovery where the transmission owner annually determines its revenue requirements through a fixed formula that considers Operation and Maintenance expenditures, rate base and capital investments and applies an approved return on equity (ROE) in developing the weighted average cost of capital. Under this formula, rates are put into effect in January of each year based upon our internal forecast of annual expenses and capital expenditures. Rates are subsequently trued up to reflect actual annual expenses and capital expenditures. Our current approved rates provide for a base ROE of 11.68% on existing and new transmission investment, while certain investments are entitled to earn an additional incentive rate. For more information, see Regulatory Issues—Federal Regulation.
We continue to invest in transmission projects that are included for review in the FERC-approved PJM transmission expansion process. These projects focus on reliability improvements and replacement of aging infrastructure with anticipatedplanned capital spendspending of $4.1$3.4 billion for transmission in 2017-20192019-2021 as disclosed in Item 7. MD&A—Capital Requirements.
Distribution
PSE&G distributes gas and electricity to end users in our respective franchised service territories. Our approved rates, established inIn October 2018, the BPU issued an Order approving the settlement of our most recent gas and electricdistribution base rate proceeding completed in mid-2010, providewith new rates effective November 1, 2018. The Order provides for a ROE of 10.3% on distribution rate base. We are required to filebase of $9.5 billion, a 9.60% ROE for our next distribution base rate case proceeding no later than November 1, 2017.business and a 54% equity component of our capitalization structure. The BPU has also approved a series of PSE&G infrastructure, energy efficiency and renewable energy investment programs with cost recovery through various clause mechanisms, with approved ROEs ranging from 9.75% to 10.3%.mechanisms. Our load requirements are split among residential, commercial and industrial customers, as described in the following table for 2016:2018:
|
| | | | | | |
| | | | | | | |
| | | | % of 2018 Sales | |
| | Customer Type | | Electric | | Gas | |
| | Commercial | | 58% | | 38% | |
| | Residential | | 33% | | 58% | |
| | Industrial | | 9% | | 4% | |
| | Total | | 100% | | 100% | |
| | | | | | | |
|
| | | | | | |
| | | | | | | |
| | | | % of 2016 Sales | |
| | Customer Type | | Electric | | Gas | |
| | Commercial | | 58% | | 37% | |
| | Residential | | 33% | | 59% | |
| | Industrial | | 9% | | 4% | |
| | Total | | 100% | | 100% | |
| | | | | | | |
While ourOur customer base has modestly increased since 2012,2014, with electric load has declined and gas load has increasedloads increasing as illustrated below:
|
| | | | | | | | | | | |
| | | | | | | | | | |
| | Electric and Gas Distribution Statistics | |
| | | | | | | |
| | | December 31, 2016 | | | |
| | | Number of Customers | | Electric Sales and Gas Firm Sales (A) | | Historical Annual Load Growth 2012-2016 | |
| | Electric | 2.2 |
| Million | | 41,580 |
| Gigawatt hours (GWh) | | (0.4)% | |
| | Gas | 1.8 |
| Million | | 2,360 |
| Million Therms | | 0.7% | |
| | | | | | | | | | |
|
| | | | | | | | | | | |
| | | | | | | | | | |
| | Electric and Gas Distribution Statistics | |
| | | | | | | |
| | | December 31, 2018 | | | |
| | | Number of Customers | | Electric Sales and Firm Gas Sales (A) | | Historical Annual Load Growth 2014-2018 | |
| | Electric | 2.3 |
| Million | | 41,889 |
| Gigawatt hours (GWh) | | 0.3% | |
| | Gas | 1.8 |
| Million | | 2,630 |
| Million Therms | | 1.7% | |
| | | | | | | | | | |
| |
| (A) | Excludes sales from Gas rate classes that do not impact margin, specifically Contract, Non-Firm Transportation, Cogeneration Interruptible and Interruptible Services. |
The declineElectric sales were essentially flat with increases due to growth in electric sales is the resultnumber of changes in customer usage patterns, includingcustomers and improved economic conditions offset by conservation and more energy efficient appliances. Gas firmFirm gas sales increased as a result of lowergrowth in the number of customers and customer response to continued low gas prices. Only firm gas firm sales impact margin.
During 2016, PSE&G as part ofcompleted its BPU-approved $1.2 billion Energy Strong Program I (ES I) in 2018. Under ES I, PSE&G, at an investment of $1 billion, completed the replacement and modernization of 240 miles of low-pressure cast iron gas mains in or near flood areas. PSE&G continues to execute the Energy Strong Program to (1) upgradeupgraded all of its electric substations that were damaged by water in recent storms; makemade investments that will create redundancy in the electric distribution system, reducing outages when damage occurs; and deploydeployed technologies to better monitor system operations, enabling PSE&G to restore customers more quickly in the event of an electric outage, and (2) with respect tooutage. Concerning PSE&G’s gas system, upgradePSE&G upgraded five natural gas metering stations, two liquefied propane stations and a liquefied natural gas station recently affected by severe weather or located in flood zones.
In 2018, PSE&G also commenced modernizingessentially completed its gas distribution system as part of our Gas System Modernization Program (GSMP)(GSMP I), which was approved by the BPU in late 2015. TheBy June 2019, through GSMP through whichI, we will invest $905have invested approximately $900 million over three years, willto replace approximately 510450 miles of cast iron and unprotected steel gas mains and about 38,00040,000 unprotected steel service lines to homes and businesses, including the uprating of the mains to higher pressure. The mains and service lines will bewere replaced with stronger, more durable plastic piping, reducing the potential for leaks and release of methane gas. The new elevated pressure systemssystem also enableincludes the installation of excess flow valves on each gas service that automatically shut off gas flow if a service line is abruptly damaged, and better supportsupports the use of high-efficiency appliances.
In May 2018, PSE&G received approval for the Gas System Modernization Program II (GSMP II), an expanded, five-year program to invest $1.9 billion over five years beginning in 2019 to replace approximately 875 miles of cast iron and unprotected steel mains in addition to other improvements to the gas system.
In June 2018, we filed for our Energy Strong Program II (ES II), a proposed five-year $2.5 billion program to harden, modernize and make our electric and gas distribution systems more resilient. The size and duration of ES II, as well as certain other elements of the program, are subject to BPU approval. A procedural schedule has been issued with the review process expected to conclude in mid-2019.
In October 2018, we filed our proposed Clean Energy Future (CEF) program with the BPU, a six-year estimated $3.6 billion investment program covering four programs; (i) an Energy Efficiency (EE) program totaling $2.5 billion of investment designed to achieve energy efficiency targets required under New Jersey’s Clean Energy law; (ii) an Electric Vehicle (EV) infrastructure program; (iii) an Energy Storage (ES) program and (iv) an Energy Cloud (EC) program which will include installing approximately two million electric smart meters and associated infrastructure. The procedural process for the CEF-EE program is expected to conclude by the third quarter of 2019. The CEF-EV/ES and CEF-EC programs will have separate procedural schedules. For additional information regarding the New Jersey Division of Rate Counsel’s motions related to these programs, see Item 7. MD&A—Executive Overview of 2018 and Future Outlook.
Solar Generation
In order toTo support New Jersey’s Energy Master Plan and the state’s renewable energy goals, we have undertaken two major solar initiatives at PSE&G, the Solar Loan Program and the Solar 4 All and Solar 4 All ExtensionAll® Programs. Our Solar Loan Program provides solar system financing to our residential and commercial customers. The loans are repaid with cash or solar renewable energy certificates (SRECs). We sell the SRECs received through periodic auctions and use the proceeds to offset program costs. Our Solar 4 All® Programs invest in utility-owned solar photovoltaic (PV) centralized solar systems installed on PSE&G property and third-party sites, including landfill facilities, and solar panels installed on distribution system poles in our electric service territory. We sell the energy and capacity from the systems in the PJM wholesale electricity market. In addition, we sell SRECs generated by the projects through the same periodic auction used in the loan program, the proceeds of which are used to offset program costs.
Supply
Although commodity revenues make up almost 41%39% of our revenues, we make no margin on the default supply of electricity and gas since the actual costs are passed through to our customers.
All electric and gas customers in New Jersey have the ability to choose their own electric energy and/or gas supplier. Pursuant to BPU requirements, we serve as the supplier of last resort for two types of electric and gas customers within our service territory that are not served by another supplier. The first type, which represents about 80% of PSE&G’s load requirements, provides default supply service for smaller commercial and industrial and commercial(C&I) customers and residential customers at seasonally-adjusted fixed prices for a three-year term (BGS-Residential Small Commercial Pricing (RSCP)). These rates change annually on June 1 and are based on the average price obtained at auctions in the current year and two prior years. The second type provides default supply for larger customers, with energy priced at hourly PJM real-time market prices for a contract term of 12 months (BGS-Commercial Industrial Energy Pricing (CIEP))Pricing).
We procure the supply to meet our BGS obligations through auctions authorized by the BPU for New Jersey’s total BGS requirement. These auctions take place annually in February. Results of these auctions determine which energy suppliers are authorized to supply BGS to New Jersey’s electric distribution companies (EDCs). Once validated by the BPU, electricity prices for BGS service are set. Approximately one-third of PSE&G’s total BGS-RSCP eligible load is auctioned each year for a three-year term. For information on current prices, see Item 8. Financial Statements and Supplementary Data—Note 13.14. Commitments and Contingent Liabilities.
PSE&G procures the supply requirements of its default service BGSS gas customers through a full-requirements contract with Power. The BPU has approved a mechanism designed to recover all gas commodity costs related to BGSS for residential customers. BGSS filings are made annually by June 1 of each year, with an effective date of October 1. PSE&G’s revenues are matched with its costs using deferral accounting, with the goal of achieving a zero cumulative balance by September 30 of each year. In addition, we have the ability to put in place two self-implementing BGSS increases on December 1 and February 1 of up to 5% and also may reduce the BGSS rate at any time and/or provide bill credits. See Item 8. Financial Statements and Supplementary Data—Note 6.7. Regulatory Assets and Liabilities for information on recent self-implementing credits.Liabilities. Any difference between rates charged under the BGSS contract and rates charged to our residential customers is deferred and collected or refunded through adjustments in future rates. Commercial and industrialC&I customers that do not select third-party suppliers are also supplied under the BGSS arrangement. These customers are charged a market-based price largely determined by prices for commodity futures contracts.
Markets and Market Pricing
Historically, there has been significant volatility in commodity prices. Such volatilityfluctuations can have a considerable impact on us since a rising commodity price environment results in higher delivered electric and gas rates for customers. This could result in decreased demand for electricity and gas, increased regulatory pressures and greater working capital requirements as the collection of higher commodity costs from our customers may be deferred under our regulated rate structure. A declining commodity price, on the other hand, would be expected to have the opposite effect. For additional information, including the impact of natural gas commodity prices on electricity prices such as BGS, see Item 7. MD&A—Executive Overview of 2016 and Future Outlook.
Power
Through Power, we seek to produce low-cost electricity by efficiently operating our nuclear, coal, gas, oil-fired and renewable generation assets while balancing generation output, fuel requirements and supply obligations through energy portfolio management. Our commitments for load, such as BGS in New Jersey and other bilateral supply contracts, are backed by the generation we own and may be combined with the use of physical commodity purchases and financial instruments from the market to optimize the economic efficiency of serving the load. Power is a public utility within the meaning of the Federal Power Act (FPA) and the payments it receives and how it operates are subject to FERC regulation.
Power is also subject to certain regulatory requirements imposed by state utility commissions such as those in New York and Connecticut.
Products and Services
As a merchant generator and power marketer, our profit is derived from selling a range of products and services under contract to an array of customers including utilities, other power marketers, such as retail energy providers, or counterparties in the open market. These products and services may be transacted bilaterally or through exchange markets and include but are not limited to:
Energy—the electrical output produced by generation plants that is ultimately delivered to customers for use in lighting, heating, air conditioning and operation of other electrical equipment. Energy is our principal product and is priced on a usage basis, typically in cents per kilowatt hour (kWh) or dollars per megawatt hour (MWh).
Capacity—distinct from energy, capacity is a market commitment that a given generation unit will be available to an Independent System Operator (ISO) for dispatch to produce energy when it is needed to meet system demand. Capacity is typically priced in dollars per MW for a given sale period (e.g. day or month).
Ancillary Services—related activities supplied by generation unit owners to the wholesale market that are required by the ISO to ensure the safe and reliable operation of the bulk power system. Owners of generation units may bid units into the ancillary services market in return for compensatory payments. Costs to pay generators for ancillary services are recovered through charges collected from market participants.
Congestion and Renewable Energy Credits—Congestion credits (or Financial Transmission Rights) are financial instruments that entitle the holder to a stream of revenues (or charges) based on the hourly congestion price differences across a transmission path. Renewable Energy Credits (RECs) are obtained through Power’s owned renewable generation or purchased in the open market. Electric suppliers of load are required to deliver a certain amount or percentage of their delivered power from renewable resources as mandated by applicable regulatory requirements.
Power also sells wholesale natural gas, primarily through a full-requirements BGSS contract with PSE&G to meet the gas supply requirements of PSE&G’s customers. On March 19,In 2014, the BPU approved an extension of the long-term BGSS contract to March 31, 2019, and then year-to-year thereafter the contract remains in effect unless terminated by either party with a two yeartwo-year notice.
Approximately 45% of PSE&G’s peak daily gas requirements is provided from Power’s firm gas transportation capacity, which is available every day of the year. Power satisfies the remainder of PSE&G’s requirements from storage contracts, liquefied natural gas, seasonal purchases, contract peaking supply and propane. Based upon the availability of natural gas beyond PSE&G’s daily needs, Power sells gas to others and uses it for its generation fleet.
In addition to its nuclear and fossil generation fleet, Power also owns and operates 326414 MW direct current (dc) of PV solar generation facilities and has an additional 7052 MW dc of PV solar generation in construction. Power also has a 50% ownership interest in a 208 MW oil-fired generation facility in Hawaii.
The remainder of this section about Power covers our nuclear and fossil fleet in the Mid-Atlantic and Northeast regions which comprises the vast majority of Power’s operations and financial performance.
How Power’s Generation Operates
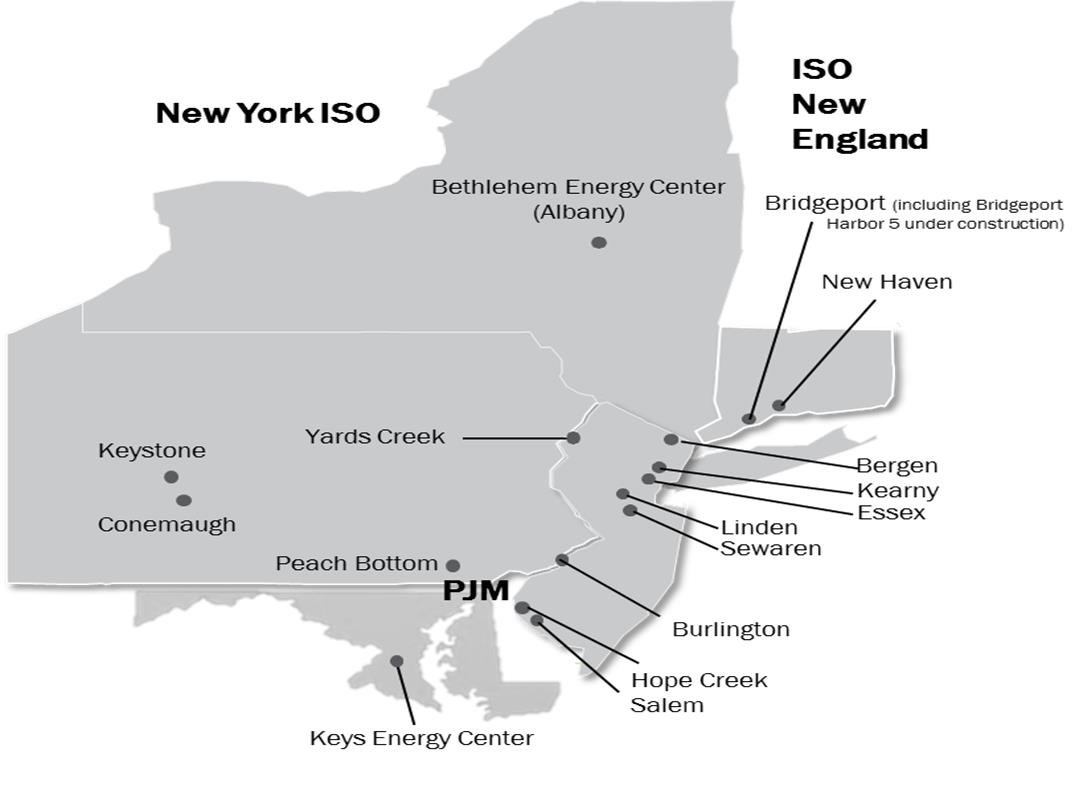
Nearly all of our generation capacity consists of nuclear and fossil generation (11,681(11,458 MW) that is located in the Northeast and Mid-Atlantic regions of the United States in some of the country’s largest and most developed electricity markets. For additional information see Item 2. Properties.
The map below shows the locations of our Northeast and Mid-Atlantic nuclear and fossil generation facilities, and projectsincluding theBridgeport Harbor 5 (BH5) project currently under construction:
Generation Capacity
Our nuclear and fossil installed capacity utilizes a diverse mix of fuels. As of December 31, 2016,2018, our fuel mix was comprised of 41%51% gas, 32% nuclear, 20%10% coal, 5% oil and 2% pumped storage. This fuel mix does not give effect to our previously announced decision to cease generation operations of the existing coal/gas units at our Hudson and Mercer generating stations on June 1, 2017. This fuel diversity helps to mitigate risks associated with fuel price volatility and market demand cycles. Our total generating output in 20162018 was approximately 52,000 GWh.55,800 gigawatt hours (GWh). The generation mix by fuel type in recent years has reflected the relatively more favorable price of natural gas compared to coal, making it more economical to run certain of our gas units in place of our coal units.coal. The following table indicates the proportionate share of generating output by fuel type in 2016.2018.
|
| | | | | |
| | | | | | |
| | Generation by Fuel Type (A) | | Actual 20162018 | | |
| | Nuclear: | | | | |
| | New Jersey facilities | | 36%37% | | |
| | Pennsylvania facilities | | 21%19% | | |
| | Fossil: | | | | |
| Coal: | | | | |
| Pennsylvania facilities | | 9% | | |
| Connecticut facilities | | —% | (B) | |
| Coal and Natural Gas: | | | | |
| New Jersey facilities | | —% | (B) | |
| | Natural Gas and Oil: | | | | |
| | New Jersey facilities | | 24%21% | | |
| | New York facilities | | 9% | | |
| Maryland facilities | | 4% | | |
| Connecticut facilities | | —% | (B) | |
| Coal: | | | | |
| Pennsylvania facilities | | 10% | | |
| | Connecticut facilities | | —% | (B) | |
| | Total | | 100% | | |
| | | | | | |
| |
| (A) | Excludes pumped storage, solar facilities and fossil generation in Hawaii which account for less than two2.5 percent of total generation. |
(B) Less than one percent.
WeIn mid-2018, we commenced commercial operations of our Keys Energy Center (Keys), a 761 MW gas-fired combined cycle generating station in Maryland and Sewaren 7, a 538 MW dual-fueled combined cycle generating station in New Jersey.
In July 2018, Exelon, co-owner of the Peach Bottom nuclear facilities in Pennsylvania, submitted a second 20-year license renewal application with the Nuclear Regulatory Commission (NRC) for Peach Bottom Units 2 and 3. It is anticipated that the NRC’s review process will take approximately two years from submission of the application. Peach Bottom Units 2 and 3 are also executingcurrently licensed to operate through 2033 and 2034, respectively.
In February 2016, the
following growth projectsproposed generating facility, BH5, a 485 MW dual-fueled combined cycle generation project, was awarded a capacity obligation. Construction continues on BH5, which
are includedis targeted for commercial operation in
the 2017-2019 capital spend of $1.3 billion for Fossil Growth Opportunities disclosed in Item 7. MD&A—Capital Requirements. |
| | | | | | |
| | | | | | |
| Major Growth Projects | |
| As of December 31, 2016 | |
| Project | | Location | | Expected In-Service Date | |
| | | | | | |
| Keys Energy Center gas-fired combined cycle generating station (755 MW) | | Maryland | | 2018 | |
| Sewaren 7 dual-fueled combined cycle generating station (540 MW) | | New Jersey | | 2018 | |
| Bridgeport Harbor 5 gas-fired combined cycle generating station (485 MW) | | Connecticut | | 2019 | |
| Bethlehem Energy Center (BEC) combined cycle uprate (58 MW) | | New York | | 2017/2018 | |
| | | | | | |
mid-2019.Generation Dispatch
Our generation units have historically been characterized as serving one or more of three general energy market segments: base load; load following; and peaking, based on their operating capability and performance.
Base Load Units run the most and typically are called to operate whenever they are available. These units generally derive revenues from both energy and capacity sales. Variable operating costs are low due to the combination of highly efficient operations and the use of relatively lower-cost fuels. Performance is generally measured by the unit’s “capacity factor,” or the ratio of the actual output to the theoretical maximum output. In 2016, our2018, the base load capacity factors were as follows:for the following units were:
|
| | | | |
| | | | | |
| | Unit | | 20162018
Capacity Factor | |
| | Nuclear | | | |
| | Salem Unit 1 | | 67.0%97.9% | |
| | Salem Unit 2 | | 84.3%84.6% | |
| | Hope Creek | | 89.8%88.8% | |
| | Peach Bottom Unit 2 | | 91.7%93.4% | |
| | Peach Bottom Unit 3 | | 100.0%94.2% | |
| | Coal | | | |
| | Keystone | | 68.4%83.4% | |
| | Conemaugh | | 61.7%76.9% | |
| | | | | |
Load Following Units’ operating costs are generally higher per unit of output than for base load units due to the use of higher-cost fuels such as oil, natural gas and, in some cases, coal or lower overall unit efficiency. These units usually have more flexible operating characteristics than base load units which enable them to more easily follow fluctuations in load. They operate less frequently than base load units and derive revenues from energy, capacity and ancillary services.
Peaking Units run the least amount of time and in some cases may utilize higher-priced fuels. These units typically start very quickly in response to system needs. Costs per unit of output tend to be higher than for base load units given the combination of higher heat rates and fuel costs. The majority of revenues are from capacity and ancillary service sales. The characteristics of these units enable them to capture energy revenues during periods of high energy prices.
In the energy markets in which we operate, owners of power plants specify to the ISO prices at which they are prepared to generate and sell energy based on the marginal cost of generating energy from each individual unit. The ISOs will generally dispatch in merit order, calling on the lowest variable cost units first and dispatching progressively higher-cost units until the point that the entire system demand for power (known as the system “load”) is satisfied reliably. Base load units are dispatched first, with load following units next, followed by peaking units. It should be noted that the sustained lower pricing of natural gas over the past several years has resulted in changes in relative operating costs compared to historical norms, whereinenabling some gas-fired generation is now able to displace some coal-fired generation.generation by other fuel types. This change, combined with the addition of new, more efficient generation capacity, has altered the historical dispatch order of certain plants in the markets where we operate.
During periods when one or more parts of the transmission grid are operating at full capability, thereby resulting in a constraint on the transmission system, it may not be possible to dispatch units in merit order without violating transmission reliability standards. Under such circumstances, the ISO may dispatch higher-cost generation out of merit order within the congested area, and power suppliers will be paid an increased Locational Marginal Price (LMP) in congested areas, reflecting the bid prices of those higher-cost generation units.
Typically, the bid price of the last unit dispatched by an ISO establishes the energy market-clearing price. After considering the market-clearing price and the effect of transmission congestion and other factors, the ISO calculates the LMP for every location in the system. The ISO pays all units that are dispatched their respective LMP for each MWh of energy produced, regardless of their specific bid prices. Since bids generally approximate the marginal cost of production, units with lower marginal costs typically generate higher operating profitsgross margins than units with comparatively higher marginal costs.
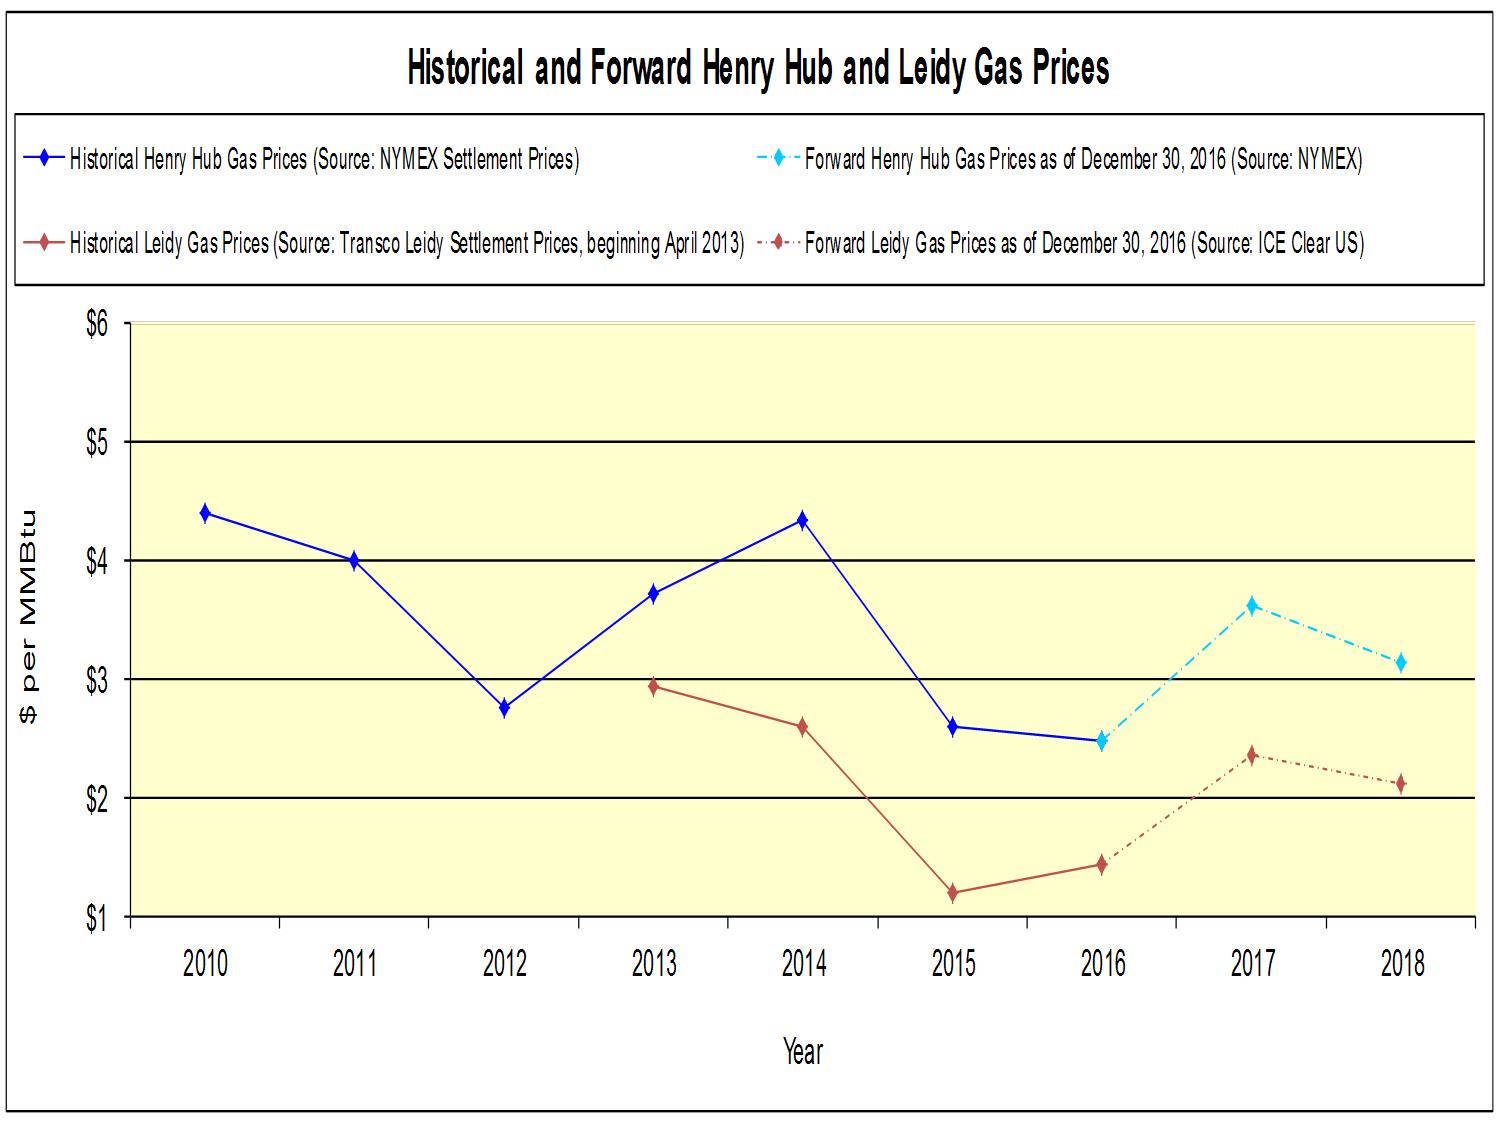
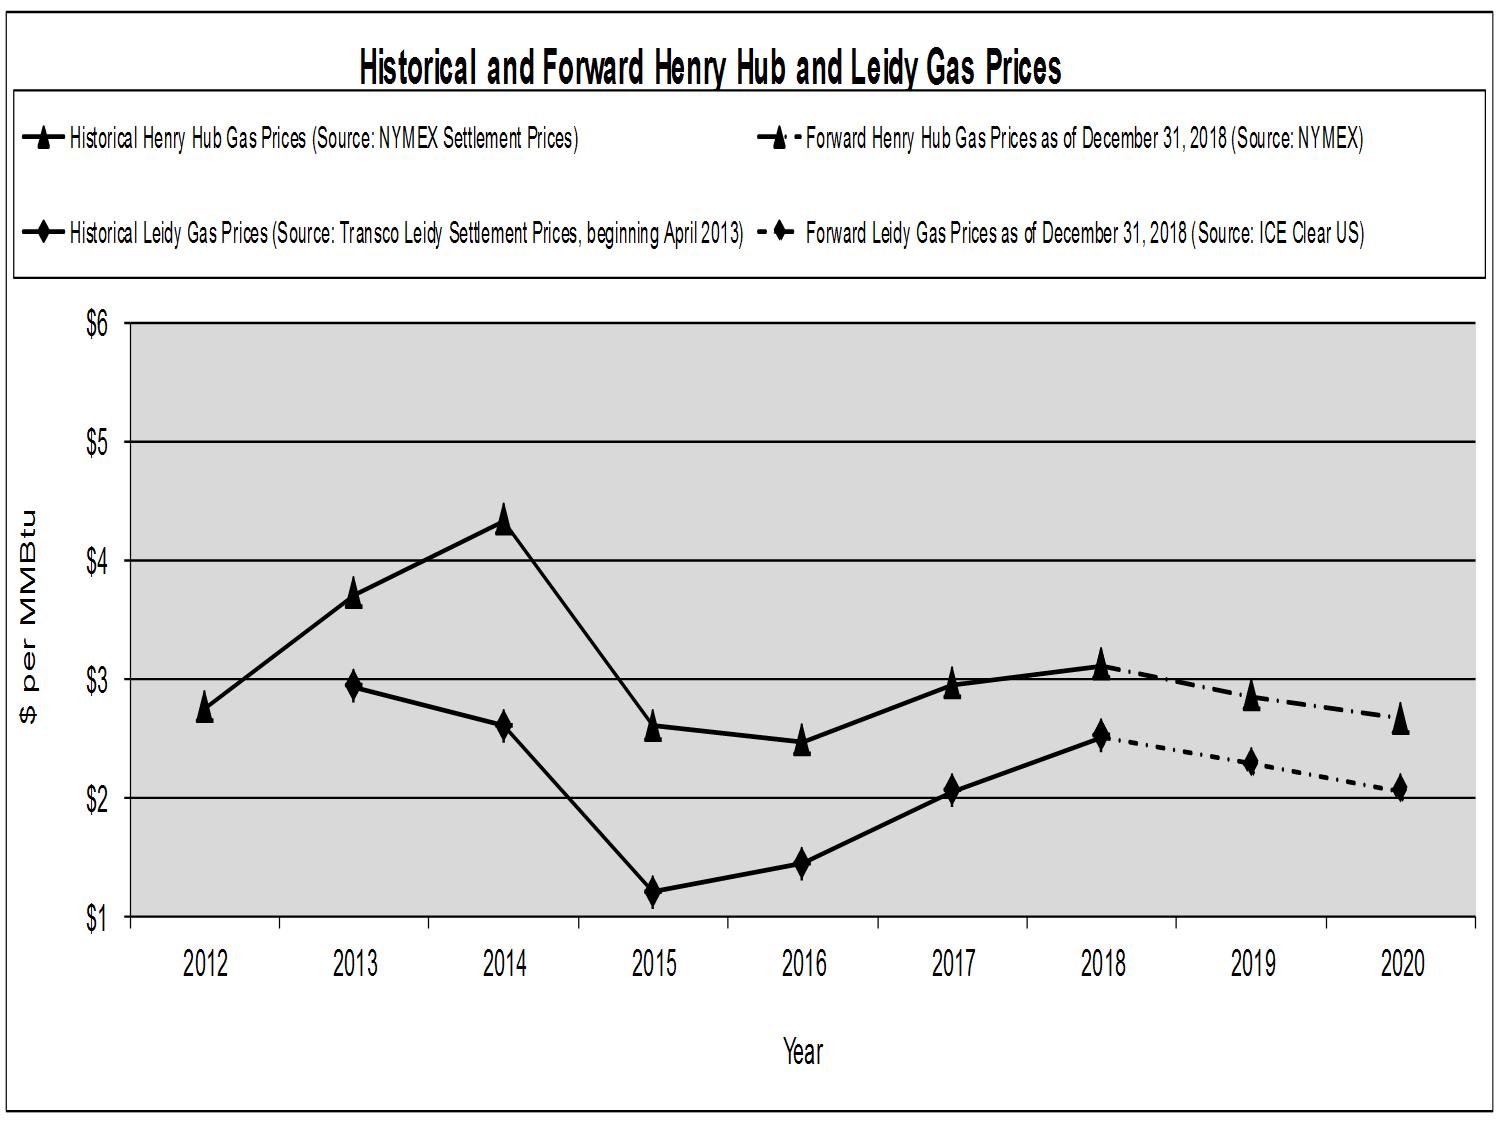
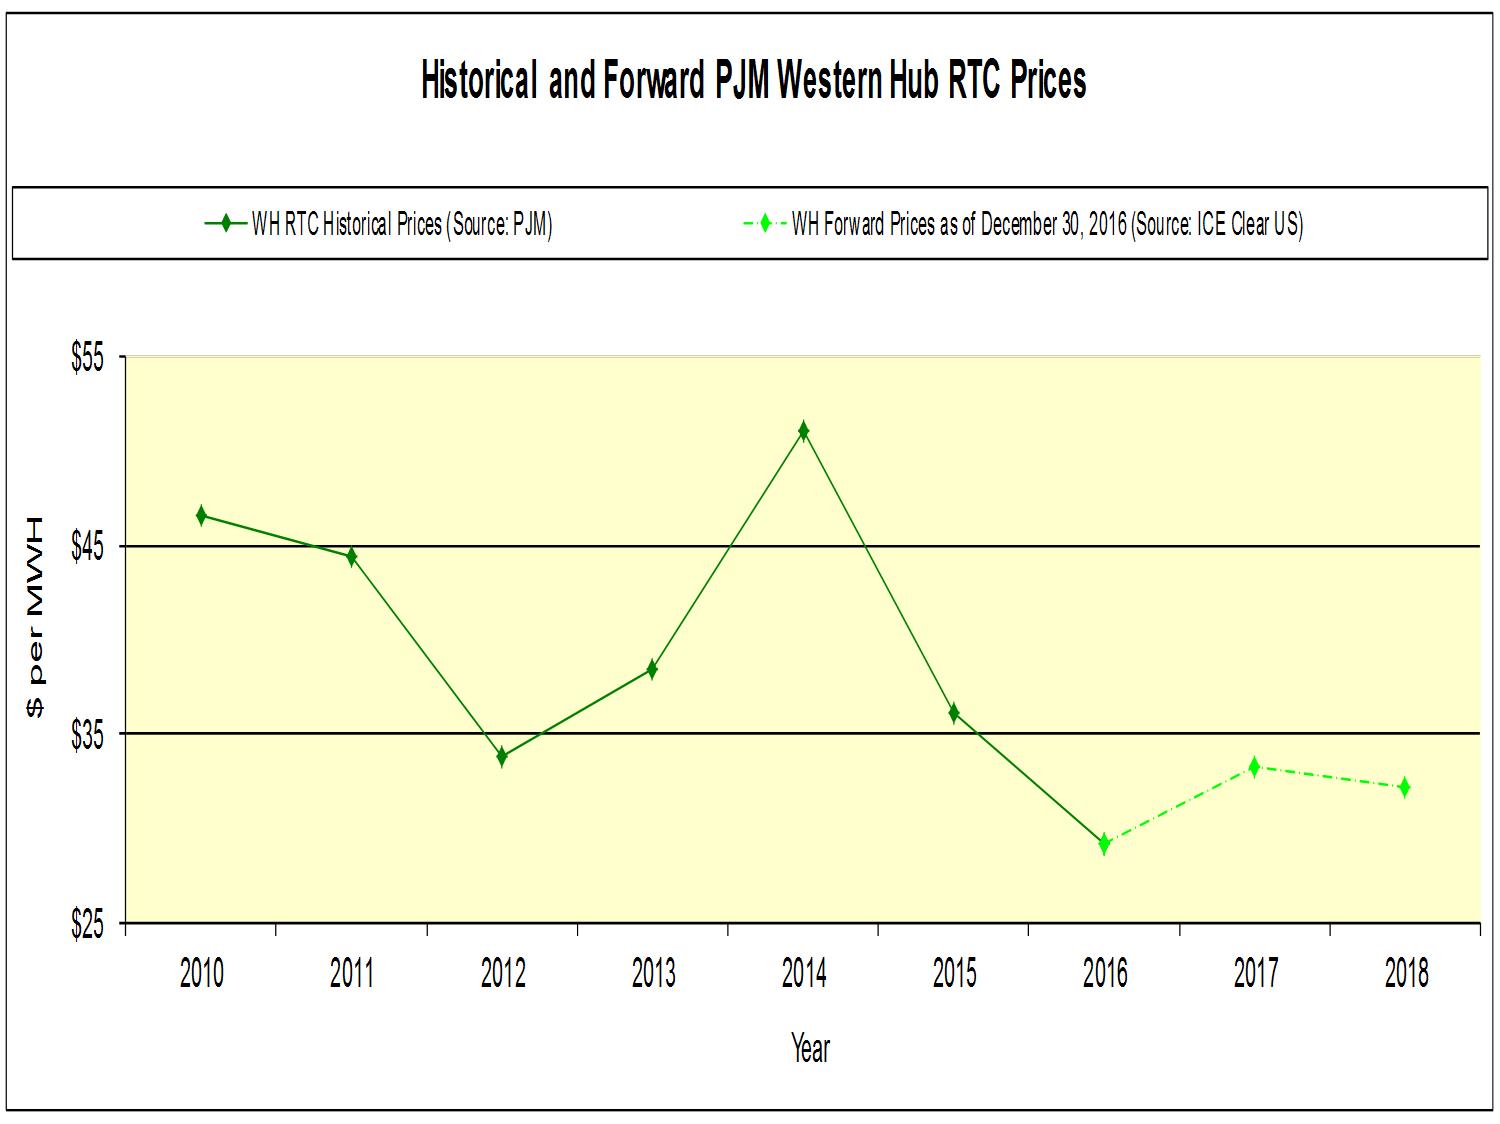
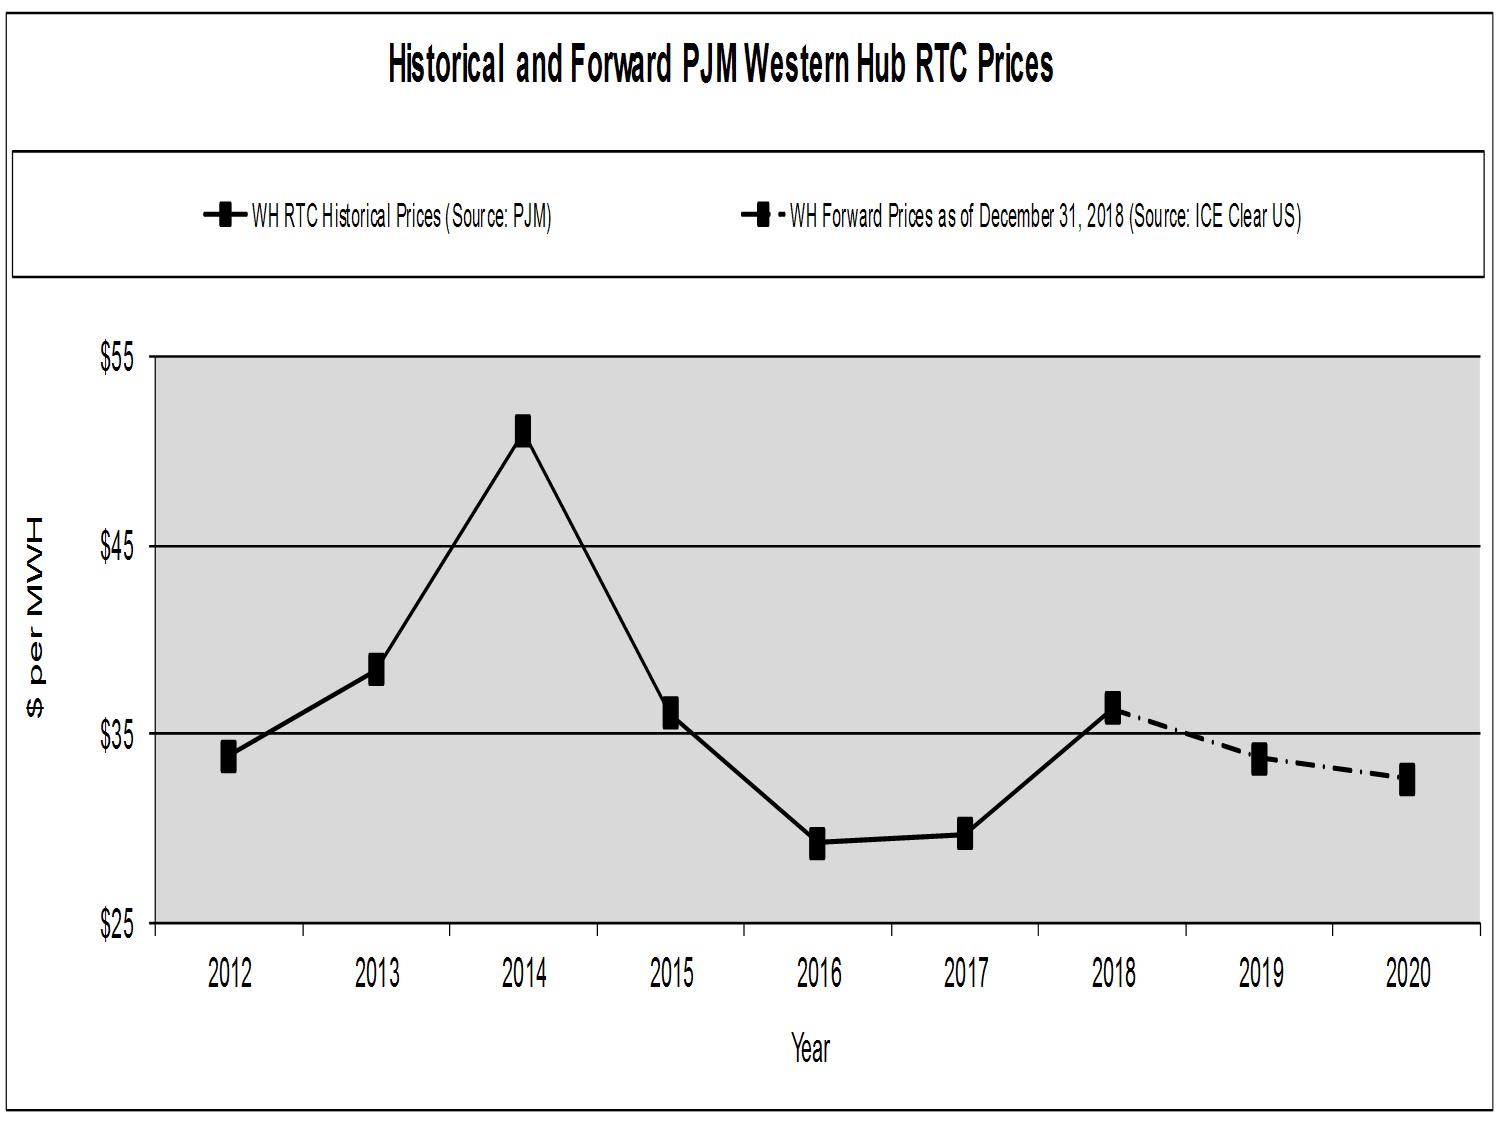
This method of determining supply and pricing creates a situation where natural gas prices often have a major influence on the price that generators will receive for their output, especially in periods of relatively strong or weak demand. Therefore, changes in the price of natural gas will often translate into changes in the wholesale price of electricity. This can be seen in the following graphs which present historical annual spot prices and forward calendar prices as averaged over each year at two liquid trading hubs.
Historical data implies that the price of natural gas will continue to have a strong influence on the price of electricity in the primary markets in which we operate.
The prices reflected in the preceding graphs above do not necessarily illustrate our contract prices, but they are representative of market prices at relatively liquid hubs, with nearer-term forward pricing generally resulting from more liquid markets than pricing for later years. As shown above, prices may vary by location resulting from congestion or other factors, such as the availability of natural gas from the Marcellus (Leidy) and other shale-gas regionsregions. These variations can be considerable. Concurrent with the development of regional shale gas, we have been increasing our purchases from the Marcellus/Utica shale gas regions and in 20162018 they accounted for approximately 90%70% of the gas we procured. While these prices provide some perspective on past and future prices, the forward prices are volatile and there can be no assurance that such prices will remain in effect or that we will be able to contract output at these forward prices.
Fuel Supply
Nuclear Fuel Supply—We have long-term contracts for nuclear fuel. These contracts provide for:
purchase of uranium (concentrates and uranium hexafluoride),
conversion of uranium concentrates to uranium hexafluoride,
enrichment of uranium hexafluoride, and
fabrication of nuclear fuel assemblies.
Our nuclear fuel contracts cover approximately 100% of our estimated uranium, enrichment and fabrication requirements through 2018 and a significant portion through 2021.
Coal Supply—OurThe Keystone, Conemaugh and Bridgeport Harbor 3 (BH3) stations operate on coal. Coal is delivered to ourthese units through a combination of rail, truck, barge and ocean shipments.
In order toTo control emissions levels, our Bridgeport 3BH3 unit uses a specific type of coal obtained from Indonesia. We currently have a coal supply contract from Indonesia under contract through 2017 forinventory at the Bridgeport facility and believe that additional coal would be available after 2017BH3 station as required.well as off-site storage to meet the plant’s projected requirements.
Gas Supply—Natural gas is the primary fuel for the bulk of our load following and peaking fleet. We purchase gas directly from natural gas producers and marketers. These supplies are transported to New Jersey by four interstate pipelines with which we have contracted. In addition, we have firm gas transportation contracted for this winter season to serve a portion of the gas requirements for our BEC stationBethlehem Energy Center (BEC) in New York.York and hold year-round firm gas transportation to serve the majority of the requirements of Keys in Maryland.
We have 1.3 billion cubic feet-per-day of firm transportation capacity and 0.9 billion cubic feet-per-day of firm storage delivery under contract to meet our obligations under the BGSS contract. This volume includes capacity from the Pennsylvania and Ohio shale gas regions where we purchase the majority of our natural gas. On an as-available basis, this firm transportation capacity may also be used to serve the gas supply needs of our New Jersey generation fleet.
Power has contracted for approximately 125 million cubic feet-per-day125,000 dekatherms/day of delivery capability on the PennEast Pipeline from eastern Pennsylvania to New Jersey with a targeted in-service date in the latter half of 2018.Jersey. This additional delivery capability will be used to supplement the BGSS contract.contract when it becomes operational.
Oil—Oil is used as the primary fuel for one load following steam unit and four combustion turbine peaking units and can be used as an alternate fuel by several load following and peaking units that have a dual-fuel capability. Oil for operations is drawn from on-site storage and is generally purchased on the spot market and delivered by truck or barge.
We expect to be able to meet the fuel supply demands of our customers and our own operations. However, the ability to maintain an adequate fuel supply could be affected by several factors not within our control, including changes in prices and demand, curtailments by suppliers, severe weather, environmental regulations, and other factors. For additional information and a discussion of risks, see Item 1A. Risk Factors, Item 7. MD&A—Executive Overview of 20162018 and Future Outlook and Item 8. Financial Statements and Supplementary Data—Note 13.14. Commitments and Contingent Liabilities.
Markets and Market Pricing
The vast majority of Power’s generation assets are located in three centralized, competitive electricity markets operated by ISO organizations all of which are subject to the regulatory oversight of FERC:
PJM Regional Transmission Organization—PJM conducts the largest centrally dispatched energy market in North America. It serves over 6165 million people, nearly 19%20% of the total United States population, and has a record peak demand of 165,492 MW. The PJM Interconnection coordinates the movement of electricity through all or parts of Delaware, Illinois, Indiana, Kentucky, Maryland, Michigan, New Jersey, North Carolina, Ohio, Pennsylvania, Tennessee, Virginia, West Virginia and the District of Columbia. The majority of our generating stations operate in PJM.
New York—The New York ISO (NYISO) is the market coordinator for New York State and is responsible for managing the New York Power Pool and for administering its energy marketplace. This service area has a population of about 19 million and a record peak demand of 33,956 MW. Our BEC station operates in New York.
New England—The ISO-New England (ISO-NE) is the market coordinator for the New England Power Pool and for administering its energy marketplace which covers Maine, New Hampshire, Vermont, Massachusetts, Connecticut and Rhode Island. This service area has a population of about 15 million and a record peak demand of 28,130 MW. Our Bridgeport and New Haven stations operate in Connecticut.
The price of electricity varies by location in each of these markets. Depending uponon our production and our obligations, these price differentials may increase or decrease our profitability.
Commodity prices, such as electricity, gas, coal, oil and environmental products, as well as the availability of our diverse fleet of generation units to operate, also have a considerable effect on our profitability. Over the long-term, the higher the forward prices are, the more attractive an environment exists for us to contract for the sale of our anticipated output. However, higher prices also increase the cost of replacement power; thereby placing us at greater risk should our generating units fail to operate effectively or otherwise become unavailable.
Over the past fewseveral years, lower wholesale natural gas prices have resulted in lower electric energy prices. One of the reasons for the lower natural gas prices is greater supply from more recently-developed sources, such as shale gas, much of which is
produced in states adjacent statesto New Jersey (e.g. Pennsylvania). This trend has reduced margin on forward sales as we re-contract our expected generation output.
In addition to energy sales, we earn revenue from capacity payments for our generating assets. These payments are compensation for committing our generating units to the ISO for dispatch at its discretion. Capacity payments reflect the value to the ISO of assurance that there will be sufficient generating capacity available at all times to meet system reliability and energy requirements. Currently, there is sufficient capacity in the markets in which we operate. However, in certain areas of these markets, there are transmission system transfer limitations which raise concerns about reliability and create a more acute need for capacity.
In PJM and ISO-NE, where we operate most of our generation, the market design for capacity payments provides for a structured, forward-looking, transparent capacity pricing mechanism. This is through the Reliability Pricing Model (RPM) in PJM and the Forward Capacity Market (FCM) in ISO-NE. These mechanisms provide greater transparency regarding the value of capacity and provide a pricing signal to prospective investors in new generating facilities so as to encourage expansion of capacity to meet future market demands. For additional information regarding FERC actions related to the capacity market construct, see Regulatory Issues—Federal Regulation.
The prices to be received by generating units in PJM for capacity have been set through RPM base residual and incremental auctions and depend upon the zone in which the generating unit is located. For each delivery year, the prices differ in the various areas of PJM, depending on the transfer limitations of the transmission system in each area. Keystone and Conemaugh in Pennsylvania receive lower capacity prices than the majority of our PJM generating units since there are fewer constraints in that region and our generating units in New Jersey usually receive higher pricing.
Our PJM generating units are located in several zones andzones. The average capacity prices that Power expects to realize the following average capacity pricesreceive from the base and incremental auctions which have been completed:
|
| | | | |
| | | | |
| Delivery Year | | MW-day | |
| June 2016 to May 2017 | | $172 | |
| June 2017 to May 2018 | | $177 | |
| June 2018 to May 2019 | | $215 | |
| June 2019 to May 2020 | | $116 | |
| | | | |
completed are disclosed in Item 8. Note 3. Revenues. The price that must be paid by an entity serving load in the various zones is also set through these auctions. These prices can be higher or lower than the prices noteddisclosed in the table aboveNote 3. Revenues due to the import and export capability to and from lower-priced areas. Prices in the most recent auction reflect PJM’s downwardly-revised demand forecast, changes in the emergency transfer limits due to transmission expansion and the effects of both the new generation and uncleared generation from the prior year’s auction.
We have obtained price certainty for our PJM capacity through May 20202022 and New England capacity through May 20212026 forBH5 and May 2022 for New Haven through the RPM and FCM pricing mechanisms, respectively.
Like PJM and ISO-NE, the NYISO provides capacity payments to its generating units, but unlike the other two markets, the New York market does not provide a forward price signal beyond a six monthsix-month auction period.
On a prospective basis, many factors may affect the capacity pricing, including but not limited to:
load and demand,
availability of generating capacity (including retirements, additions, derates and forced outage rates),
capacity imports from external regions,
transmission capability between zones,
available amounts of demand response resources,
pricing mechanisms, including potentially increasing the number of zones to create more pricing sensitivity to changes in supply and demand, as well as other potential changes that PJM and the other ISOs may propose over time, and
legislative and/or regulatory actions impacting the capacity auction or that permit subsidized local electric power generation.
For additional information on the RPM and FCM markets, as well as on state subsidization through various mechanisms, see Regulatory Issues—Federal Regulation.
Hedging Strategy
To mitigate volatility in our results, we seek to contract in advance for a significant portion of our anticipated electric output, capacity and fuel needs. We seek to sell a portion of our anticipated lower-cost generation over a multi-year forward horizon, normally over a period of two to three years. We believe this hedging strategy increases the stability of earnings.
Among the ways in which we hedge our output are: (1) sales at PJM West or other nodes within PJM corresponding to our generation portfolio and (2) BGS and similar full-requirements contracts. Sales atin PJM Westgenerally reflect block energy sales at the liquid PJM Western Hub or other basis locations when available and other transactions that seek to secure price certainty for our generation related products. The BGS-RSCP contract, a full-requirements contract that includes energy and capacity, ancillary and other services, is awarded for three-year periods through an auction process managed by the BPU. The volume of
BGS contracts and the mix of electric utilities that our generation operations serve will vary from year to year. Pricing for the BGS contracts, including a capacity component, for recent and future periods by purchasing utility is as follows:
|
| | | | | | | | | | |
| | | | | | | | | | | |
| | Load Zone ($/MWh) | | 2014-2017 | | 2015-2018 | | 2016-2019 | | 2017-2020 | |
| | PSE&G | | $97.39 | | $99.54 | | $96.38 | | $90.78 | |
| | Jersey Central Power & Light Company (JCP&L) | | $84.44 | | $80.42 | | $74.85 | | $69.08 | |
| | Atlantic City Electric Company | | $87.80 | | $86.06 | | $82.14 | | $75.49 | |
| | Rockland Electric Company | | $95.61 | | $90.66 | | $85.02 | | $80.50 | |
| | | | | | | | | | | |
|
| | | | | | | | | | |
| | | | | | | | | | | |
| | Load Zone ($/MWh) | | 2016-2019 | | 2017-2020 | | 2018-2021 | | 2019-2022 | |
| | PSE&G | | $96.38 | | $90.78 | | $91.77 | | $98.04 | |
| | Jersey Central Power & Light Company (JCP&L) | | $74.85 | | $69.08 | | $73.11 | | $77.15 | |
| | Atlantic City Electric Company | | $82.14 | | $75.49 | | $81.23 | | $87.40 | |
| | Rockland Electric Company | | $85.02 | | $80.50 | | $85.94 | | $88.03 | |
| | | | | | | | | | | |
Although we enter into these hedges in an effort to provide price certainty for a large portion of our anticipated generation, there is variability in both our actual output as well as in the effectiveness of our hedges. Actual output will vary based upon total market demand, the relative cost position of our units compared to other units in the market and the operational flexibility of our units. Hedge volume can also vary, depending on the type of hedge into which we have entered. The BGS auction, for example, results in a contract that provides for the supplier to serve a percentage of the default load of a New Jersey EDC, that is, the load that remains after some customers have chosen to be served directly either by third-party suppliers or through municipal aggregation. The amount of power supplied through the BGS auction varies based on the level of the EDC’s default load, which is affected by the number of customers who are served by third-party suppliers, as well as by other factors such as weather and the economy.
In recent years, as market prices declined from previous levels, there was an incentive for more of the smaller commercial and industrialC&I electric customers to switch to third-party suppliers. In a falling price environment, this has a negative impact on our margins, as the anticipated BGS pricing is replaced by lower spot market pricing. As average BGS rates have declined to a level that more closely resembles current market prices, customers may see less of an incentive to switch to third-party suppliers. We are unable to determine the degree to which this switching, or “migration,” will continue, but the impact on our results could be material should market prices fall or rise significantly.
In 2016, Power announced its intention to develop a retail energy platform to sell physical electricity and natural gas directly to commercial and industrial customers. We believe a retail energy platform would complement our existing wholesale generation-to-load marketing business and is intended to hedge our generation at improved margins inReflecting February 2019 BGS auction results, the geographic areas where we have generation facilities. Power was granted licenses in 2016 to sell both electricity and gas in the states of New Jersey and Pennsylvania and expects to begin its marketing efforts in 2017.
As of February 9, 2017, we had contracted for the following percentages of our anticipated base load generation output for the next three years with modest amounts beyond 20192021. are as follows:
|
| | | | | | | | |
| | | | | | | | | |
| | Base Load Generation | | 2017 | | 2018 | | 2019 | |
| | Generation Sales | | 100% | | 80%-85% | | 35%-40% | |
| | | | | | | | | |
|
| | | | | | | | |
| | | | | | | | | |
| | Base Load Generation | | 2019 | | 2020 | | 2021 | |
| | Generation Sales | | 100% | | 95%-100% | | 30%-35% | |
| | | | | | | | | |
In a changing market environment, this hedging strategy may cause our realized prices to differ materially from current market prices. In a rising price environment, this strategy normally results in lower margins than would have been the case had no hedging activity been conducted. Alternatively, in a falling price environment, this hedging strategy will tend to create margins higher than those implied by the then-current market.
Our fuel strategy is to maintain certain levels of uranium in inventory and to make periodic purchases to support such levels. Our nuclear fuel commitments cover approximately 100% of our estimated uranium, enrichment and fabrication requirements through 20182020 and a significant portion through 2021.
We also have various long-term fuel purchase commitments for coal to support our Keystone Conemaugh and Bridgeport HarborConemaugh stations. These purchase obligations are consistent with our strategy, in general, to enter into contracts for our fuel supply in comparable volumes to our sales contracts.
We take a more opportunistic approach in hedging both the fuel for and the anticipated output of our natural gas-fired generation. The generation from thesemore efficient load following units iscan be estimated with a moderate degree of certainty. The peaking units are less predictable, as a significant portion of these units will only dispatch when aggregate market demand has exceeded the supply provided by lower-cost units. The natural gas-fired units are hedged based on their expected generation; however, at much lower thresholds than baseload generation. Additionally, the recent development of low-cost gas supplies in the Marcellus region presents opportunities during certain portions of the year to procure gas for our generating units at attractive prices.
More than half of Power’s expected gross margin in the upcoming year2019 relates to our hedging strategy, our expected revenues from the capacity market mechanisms described above and certain ancillary service payments such as reactive power.
Other
Energy Holdings Lease Investments
Energy Holdings primarily owns and manages a portfolio of domestic lease investments. The majority of Energy Holdings’ $649$540 million of domestic lease investments are primarily energy-related leveraged leases. As of December 31, 2016,2018, the counterparties for 66%55% of our total leveraged lease investments were rated below investment grade by Standard & Poor’s (S&P). See Item 8. Financial Statements and Supplementary Data—Note 8.9. Financing Receivables for additional information.
Energy Holdings’ leveraged leasing portfolio is designed to provide a fixed rate of return. Leveraged lease investments involve three parties: an owner/lessor, a creditor and a lessee. In a typical leveraged lease financing, the lessor purchases an asset to be leased. The purchase price is typically financed 80% with debt provided by the creditor and the balance comes from equity funds provided by the lessor. The creditor provides long-term financing to the transaction secured by the property subject to the lease. Such long-term financing is non-recourse to the lessor and, with respect to our lease investments, is not presented on our Consolidated Balance Sheets.
The lessor acquires economic and tax ownership of the asset and then leases it to the lessee for a period of time no greater than 80% of its remaining useful life. As the owner, the lessor is entitled to depreciate the asset under applicable federal and state tax guidelines. The lessor receives income from lease payments made by the lessee during the term of the lease and from tax benefits associated with interest and depreciation deductions with respect to the leased property. Our ability to realize these tax benefits is dependent on operating gains generated by our other operating subsidiaries and allocated pursuant to the consolidated tax sharing agreement between us and our operating subsidiaries.
Lease rental payments are unconditional obligations of the lessee and are set at levels at least sufficient to service the non-recourse lease debt. The lessor is also entitled to any residual value associated with the leased asset at the end of the lease term. An evaluation of the after-tax cash flows to the lessor determines the return on the investment. Under accounting principles generally accepted in the United States (GAAP), the leveraged lease investment is recorded net of non-recourse debt and income is recognized as a constant return on the net unrecovered investment.
For additional information on leases, including the credit, tax and accounting risks, see Item 1A. Risk Factors, Item 7A. Quantitative and Qualitative Disclosures About Market Risk—Credit Risk, and Item 8. Financial Statements and Supplementary Data—Note 8.9. Financing Receivables.
LIPA Operating Services Agreement (OSA)
In accordance with a twelve year Amended and Restated Operations Services Agreement (OSA)OSA entered into by PSEG LI and the LIPA, PSEG LI commenced operating LIPA’s electric T&D system in Long Island, New York on January 1, 2014. As required by the OSA, PSEG LI also provides certain administrative support functions to LIPA. PSEG LI uses its brand in the Long Island T&D service area. Pursuant toUnder the OSA, PSEG LI acts as LIPA’s agent in performing many of its obligations and in return (a) receives reimbursement for pass-through operating expenditures, (b) receives a fixed management fee and (c) is eligible to receive an incentive fee contingent on meeting established performance metrics. In addition,Also, there is thean opportunity for the parties to extend the contract for an additional eight years subject to the achievement by PSEG LI of certain performance levels during the initial term of the OSA. Also, as ofFurther, since January 2015, Power began providingprovides fuel procurement and power management services to LIPA under separate agreements.
COMPETITIVE ENVIRONMENT
PSE&G
Our transmission and distributionT&D business is minimally impacted when customers choose alternate electric or gas suppliers since we earn our return by providing transmission and distribution service, not by supplying the commodity. Increased reliance by customers on net-metered generation, including solar, and changes in customer behaviors can result in decreased reliance on our system and impact our revenues and investment opportunities. The demand for electric energy and gas by customers is affected by customer conservation, economic conditions, weather and other factors not within our control. Construction of new local generation and changing customer usage patterns also have the potential to reduce the need for the construction of new transmission to transport remote generation and alleviate system constraints.
Changes in the current policies for building new transmission lines, such as those ordered by FERC and being implemented by PJM and other ISOs to eliminate contractual provisions that previously provided us a “right of first refusal” (ROFR) to construct projects in our service territory, could result in third-party construction of transmission lines in our area in the future
and also allow us to seek opportunities to build in other service territories. These implementing rules within the regions are still in fluxcontinue to evolve so both the extent of the risk within our service territory and the opportunities for our transmission business elsewhere remain difficult to assess. For additional information, see the discussion in Regulatory Issues—Federal Regulation—Transmission Regulation, below.
Construction
Power
Various market participants compete with us and one another in buying and sellingtransacting in the wholesale energy markets, entering into bilateral contracts and selling to individual and aggregated retail customers. Our competitors include:
merchant generators,
domestic and multi-national utility generators,
energy marketers and retailers,
private equity firms, banks funds and other financial entities,
fuel supply companies, and
affiliates of other industrial companies.
New additions of lower-cost or more efficient generation capacity could make our plants less economic in the future. Although it is not clear if this capacity will be built or, if so, what the economic impact will be, such additions would impact market prices and our competitiveness.
Our business is also under competitive pressure due to demand sidedemand-side management (DSM) and other efficiency efforts aimed at changing the quantity and patterns of usage by consumers which could result in a reduction in load requirements. A reduction in load requirements can also be caused by economic cycles, weather, municipal aggregation and other customer migration and other factors. In addition, how resources such as demand response and capacity imports are permitted to bid into the capacity markets also affects the prices paid to generators such as Power in these markets. It is also possible that advances in technology, such as distributed generation and micro grids, will reduce the cost of alternative methods of producing electricity to a level that is competitive with that of most central station electric production. To the extent that additions to the electric transmission system relieve or reduce limitations and constraints in eastern PJM where most of our plants are located, our revenues could be adversely affected. Changes in the rules governing what types of transmission will be built, who is selected to build transmission and who will pay the costs of future transmission could also impact our generation revenues.
Adverse changes in energy industry law, policies and regulation includingcould have significant economic, environmental and reliability consequences. For example, PJM, NYISO and ISO-NE each have capacity markets that have been approved by FERC. FERC regulates these markets and continues to examine whether the market structures and a potential shift away fromdesign for each of these three capacity markets is working optimally. Various forums are considering how the competitive markets toward subsidized market mechanisms, would have the effect of artificially depressing pricesframework can incorporate or be reconciled with state public policies that support particular resources, resource attributes or emerging technologies, whether generators are being sufficiently compensated in the competitive wholesalecapacity market and thuswhether subsidized resources may be adversely affecting capacity market prices. We cannot predict what action, if any, FERC might take with regard to capacity market designs but it may have an impact on Power’s generation portfolio. For additional information, see the potential to harm competitive markets, on both a short-term and a long-term basis. At the same time, changes implemented in the PJM and New England capacity markets and other proposed market changes discussed more fullydiscussion in Regulatory Issues—Federal Regulation provide the opportunity for additional compensation in both the energy and capacity markets.Regulation.
Environmental issues, such as restrictions on emissions of carbon dioxide (CO2) and other pollutants, may also have a competitive impact on us to the extent that it becomes more expensive for some of our plants to remain compliant, thus affecting our ability to be a lower-cost provider compared to competitors without such restrictions. In addition, most of our plants, which are located in the Northeast where rules are more stringent, can be at an economic disadvantage compared to our competitors in certain Midwest states.
While it is our expectation that continued efforts may be undertaken by the new administration, following the 2016 U.S. presidential election,federal and state governments to preserve the existing base of fossilnuclear generating plants, we still believe that pressures from renewable resources will continue to increase. For example, many parts of the country, including the mid-western region served by the Midwest Independent System Operator (MISO), the PJM region and the California ISO, have either implemented or proposed implementing changes to their respective regional transmission planning processes that may enable the construction of large amounts of “public policy” transmission to move renewable generation to load centers. For additional information, see the discussion in Regulatory Issues—Federal Regulation.
EMPLOYEE RELATIONS
As of December 31, 2016,2018, we had 13,06513,145 employees within our subsidiaries, including 8,1618,145 covered under collective bargaining agreements. Since the beginning of 2016, six of our eight labor unions ratified extensions of their collective bargaining agreements with us, with expiration dateseight unions expiring from 2019 to 2021. The collective bargaining agreements for the remaining two unions expire in June 2017 and May 2018.through 2022. We believe we maintain satisfactory relationships with our employees.
|
| | | | | | | | | | | | | | |
| | | | | | | | | | | |
| | Employees as of December 31, 2016 | |
| | | | PSE&G | | Power | | PSEG LI | | Other | |
| | Non-Union | | 1,898 |
| | 1,165 |
| | 811 |
| | 1,030 |
| |
| | Union | | 5,108 |
| | 1,549 |
| | 1,496 |
| | 8 |
| |
| | Total Employees | | 7,006 |
| | 2,714 |
| | 2,307 |
| | 1,038 |
| |
| | | | | | | | | | | |
|
| | | | | | | | | | | | | | |
| | | | | | | | | | | |
| | Employees as of December 31, 2018 | |
| | | | PSE&G | | Power | | PSEG LI | | Services | |
| | Non-Union | | 2,003 |
| | 1,057 |
| | 899 |
| | 1,041 |
| |
| | Union | | 5,315 |
| | 1,065 |
| | 1,510 |
| | 255 |
| |
| | Total Employees | | 7,318 |
| | 2,122 |
| | 2,409 |
| | 1,296 |
| |
| | | | | | | | | | | |
REGULATORY ISSUES
In the ordinary course of our business, we are subject to regulation by, and are party to various claims and regulatory proceedings with, FERC, the BPU, the Commodity Futures Trading Commission and various state and federal environmental regulators, among others. For information regarding material matters, other than those discussed below, see Item 3. Legal Proceedings and Item 8. Financial Statements and Supplementary Data—Note 13.14. Commitments and Contingent Liabilities.
Federal Regulation
FERC
FERC is an independent federal agency that regulates the transmission of electric energy and gas in interstate commerce and the sale of electric energy and gas at wholesale pursuant to the Federal Power Act (FPA)FPA and the Natural Gas Act. PSE&G and the generation and energy trading subsidiaries of Power are public utilities as defined by the FPA. FERC has extensive oversight over such public utilities. FERC approval is usually required when a public utility seeks to: sell or acquire an asset that is regulated by FERC (such as a transmission line or a generating station); collect costs from customers associated with a new transmission facility; charge a rate for wholesale sales under a contract or tariff; or engage in certain mergers and internal corporate reorganizations. As a result of the change in administration following the U.S. presidential election, FERC does not currently have the quorum required to issue certain substantive orders. Until quorum is obtained, FERC Staff has been delegated authority, which allows FERC to continue carrying out its regulatory obligations in the absence of a quorum of Commissioners. The FERC order delegated to FERC Staff the ability to take certain actions to avoid filings going into effect by operation of law until FERC again has a quorum and moves to lift the delegation order.
FERC also regulates generating facilities known as qualifying facilities (QFs). QFs are cogeneration facilities that produce electricity and another form of useful thermal energy, or small power production facilities where the primary energy source is renewable, biomass, waste or geothermal resources. QFs must meet certain criteria established by FERC. We own various QFs through Power. QFs are subject to some, but not all, of the same FERC requirements as public utilities.
FERC also regulates Regional Transmission Operators (RTOs)/ISOs, such as PJM, and their energy and capacity markets.
For us, the major effects of FERC regulation fall into five general categories:
Regulation of Wholesale Sales—Generation/Market Issues/Market Power
Energy Clearing Prices
Capacity Market Issues
Transmission Regulation
Compliance
Regulation of Wholesale Sales—Generation/Market Issues/Market Power
Under FERC regulations, public utilities that wish to sell power at market rates must receive FERC authorization (“MBR Authority”)(MBR Authority) to sell power in interstate commerce before making power sales. They can sell power at cost-based rates or apply to FERC for authority to make market-based rate (MBR) sales. For a requesting company to receive MBR Authority, FERC must
first make a determinationdetermine that the requesting company lacks market power in the relevant markets and/or that market power in the relevant markets is sufficiently mitigated. The following PSEG companies are public utilities and currently have MBR Authority: PSE&G, PSEG ER&T,Energy Resources & Trade (ER&T), PSEG Fossil, PSEG Nuclear, PSEG Power Connecticut, PSEG New Haven, PSEG Energy Solutions, PSEG Keys Energy Center LLC, Pavant Solar II LLC, San Isabel Solar LLC and Bison Solar LLC. FERC requires that holders of MBR Authority file an update every three years demonstrating that they continue to lack market power and/or that their market power has been sufficiently mitigated and report in the interim to FERC any material change in facts from those FERC relied on in granting MBR Authority.
In December 2016, the PSEG companies with MBR Authority filed their triennial market power analysis as required by FERC regulations. A FERC order on the PSEG companies’ triennial filing is expected in the third quarter 2017.
Energy Clearing Prices
Energy clearing prices in the markets in which we operate are generally based on bids submitted by generating units. Under FERC-approved market rules, bids are subject to price caps and mitigation rules applicable to certain generation units. FERC rules also govern the overall design of these markets. At present, all units within a delivery zone receive a clearing price based on the bid of the marginal unit (i.e. the last unit that must be dispatched to serve the needs of load) which can vary by location. In addition, recent rule changes in the energy markets administered by PJM and ISO-NE (see Capacity Market Issues below) impose rigorous performance obligations and nonperformance penalties on resources during times of system stress. These FERC rules haveprovide an opportunity for bonus payments or require the payment of penalties depending on whether a direct impact on the prices received by our units.unit is available during a performance hour.
FERC has also recently ordered certain favorable changes to energy market price formation rules improving shortage pricing and enhancing bidding flexibility for units. We continue to advocate in this context for additional changes in market rules that would provide more transparency aboutregarding operator actions affecting energy market prices. Weprices and would promote better alignment between generation dispatch decisions and energy market price outcomes. Certain reforms, such as a reform that
would allow prices to better reflect scarcity conditions in which short-term demand is met by fast-start resources, are currently pending before FERC. However, we cannot predict what actionwhether they will be adopted.
In February 2019, the PJM Board approved a filing to modify the curves used for pricing reserves with FERC. The reforms include a 30-minute reserve product in real-time, more dynamic reserve requirements to better capture operator actions taken to maintain reliability, and improvement to the curves used to price reserves during reserve shortage conditions. If placed into effect, this reform is expected to improve energy and reserve prices by ensuring that when operators commit resources to ensure reliability, the commitments are reflected in market clearing prices. However, this reform could result in lower capacity payments. There is no timeline for this type of filing and therefore we cannot predict when FERC might ultimately take, but such an examination could lead to future rule changes.will act on the filing or the outcome of this matter.
Capacity Market Issues
PJM, NYISO and ISO-NE each have capacity markets that have been approved by FERC. FERC regulates these markets and continues to examine whether the market design for each of these three capacity markets is working optimally. Issues presented in variousVarious forums include consideration of whether capacityare considering how the competitive market rules properly address and foster the development offramework can incorporate or be reconciled with state public policies demand response (DR) andthat support particular resources, resource attributes or emerging technologies, whether generators are being sufficiently compensated in the capacity market and whether subsidized resources may be adversely affecting capacity market outcomes.prices. We cannot predict what action, if any, FERC might take with regard to capacity market design.designs.
PJM—The RPM is the locational installed capacity market design for the PJM region, including a forward auction for installed capacity. Under the RPM, generators located in constrained areas within PJM are paid more for their capacity as an incentive to ensure adequate supply where generation capacity is most needed. The mechanics of the RPM in PJM continue to evolve and be refined in stakeholder proceedings and FERC proceedings in which we are active.
During 2015, PJM implementedIn June 2018, FERC issued an order finding that PJM’s current capacity market construct was not just and reasonable. FERC found that the RPM market design was not sufficiently competitive because it enabled state-supported resources to bid below their costs which resulted in suppressed clearing prices. In particular, FERC found that nuclear generating units that receive zero emission certificate (ZEC) payments were of concern. FERC initiated a new “Capacity Performance” (CP)separate proceeding to develop a mechanism to protect resources that createddo not receive subsidies and proposed a more robust capacity product definitionFixed Resource Alternative option that removes subsidized resources along with enhanced incentives for performance during emergency conditionsa commensurate amount of load. PSEG and significant penalties for non-performance. However, aspectsother parties have sought rehearing of FERC’s order, which is still pending.
In response to FERC’s order, PJM proposed a minimum offer price rule (MOPR) with a significant number of exceptions and a “resource carve-out” (RCO) option that would carve certain resources out of the capacity market that have actionable subsidies. If this proposal is ultimately adopted by FERC and our New Jersey nuclear units receive ZECs, they may become subject to the MOPR and would be required to submit capacity bids at a level that may be above the auction clearing price. Under this scenario, if Hope Creek, Salem 1 and Salem 2 nuclear units are currently pending appealawarded ZECs, they may not clear the capacity auction in the Court of Appealswhole or in part, and they may not receive capacity payments. However, these units may be eligible for the D.C. Circuit (D.C. Circuit).RCO option and receive payments directly from New Jersey Load-serving entities through a mechanism approved by the BPU. The CP product will be implemented fullyBPU could utilize the existing BGS mechanism for the 2020-2021 Delivery Year. Based upon the August 2015 base residual auction results, the CP mechanism appears to have provided the opportunity for enhanced capacity market revenue streams for Power but future impacts cannot be assured. Efforts to modify the CP construct to enhance the participation of intermittent and DR resources (“seasonal resources”) are currently pending before FERC. this purpose.
PJM hasalso proposed modificationsan alternative to the aggregation rulesRCO option that includes a two-tiered “repricing” option. Under this proposal, PJM would run an initial auction to improvedetermine which resources would receive a commitment and a second auction to determine the ability of seasonal resourcesprice to pay the capacity resources. If this mechanism was adopted by FERC, it would likely have a favorable impact on the capacity payments received by non-nuclear units within the PSEG generating fleet but could adversely affect the nuclear units if, as ZEC recipients, they participate and two complaints have been filed requesting that FERC investigate the rules governing the participation of seasonalas RCO resources and extendhave to make payments to other plants. We are unable to predict the participationoutcome of the base resources for future auctions. We expect either FERC action on PJM’s proposalproceeding or inaction inany BPU efforts to effectuate the event that it goes into effect by operation of law before the upcoming base residual auction in May 2017. If PJM’s proposal goes into effect by operation of law, there could be an increase in the participation of seasonal resources in the auction.RCO option.
In September 2014,October 2018, PJM filed atwith FERC to re-setrevise the shape of the Variable Resource Requirement (VRR) curve that will be implemented for the RPM. PJM expects to reset the VRR every four years. Establishment of thecapacity auction that will be held in August 2019. The VRR curve is a critical component in determining how generators are paidthe administratively determined demand curve that serves as one of the key elements for establishing the amount of generation capacity to be procured in the auction. PJM contends that its proposal will lower capacity auction. In November 2014, FERC acceptedprices as compared to the currently effective VRR curve. PSEG protested PJM’s filing, which we believe represents an improvement overproposal on the status quogrounds that it would result in terms of appropriately setting the demand curve. However, we and a trade association composed of other generators have challenged FERC’s approval order on appeal at the D.C. Circuit, taking exceptionunderstated prices for capacity relative to FERC’s approval of the manner in which PJM calculated the cost of capital and labor costs that form the basis for the Cost of New Entry component of the demand curve, which we believe have been set too low and do not accurately reflect the costs of buildingconstructing a new reference generating unit and will result in PJM.
Over the past several years, certain entities in PJM, namely, FirstEnergy Corp. (FE) and American Electric Power (AEP) sought financial support arrangements from the Ohio Public Utility Commission (PUCO) for certain coal plants and, for FE, a nuclear plant. FE and AEP originally proposed to enter into power purchase agreements (PPAs) with their non-utility generation affiliates providing for above-market purchases from these plants. The PUCO Staff proposed a payment to support modernization of the distribution system (distribution modernization rider) in the FE case which was ultimately accepted by the PUCO. The Dayton Power and Light Company also recently filed for a distribution modernization rider for the generating plants that it owns.
The PUCO proceedings created a concern that subsidized units within the PJM footprint would submit bids in the capacity marketprices that are not reflective of their actual operating costsunjust and would, in turn, artificially suppress capacity prices. As a result, certain parties requested thatunreasonable. This matter is pending before FERC should direct PJM to expand the “minimum offer price rule” to apply to existing units.
We are unable toand we cannot predict the results of these pending proceedings or any future related proceedings or to calculate the potential impacts on our business.
MISO—MISO does not have a mandatory capacity market in place, as load serving entities may submit Fixed Resource Adequacy Plans in lieu of participating in the capacity auction. Significant quantities of capacity from MISO are imported into PJM which tends to have a downward effect on PJM capacity prices. However, recent enhancements to PJM market rules have tightened eligibility requirements for PJM imports and reduced these impacts. The issue of “capacity portability” from MISO continues to be examined in the stakeholder process.outcome.
ISO-NE—ISO-NE’s market for installed capacity in New England provides fixed capacity payments for generators, imports and DR.demand response. The market design consists of a forward-looking auction for installed capacity that is intended to recognize the locational value of resources on the system and contains incentive mechanisms to encourage availability during stressed system conditions. ISO-NE also employs a mechanism, similar to PJM’s CPCapacity Performance mechanism, that provides incentives for performance and that imposes charges for non-performance during times of system stress. We view this mechanism as generally positive for generating resources as providing more robust income streams. However, it also imposes additional financial risk for non-performance. One aspectIn March 2018, FERC approved proposed changes to the FCM referred to as the
Competitive Auctions and Sponsored Policy Resources (CASPR) to accommodate clean and renewable energy policy resources. The CASPR design creates a second auction that commences immediately following the current marketForward Capacity Auction and provides the opportunity for certain renewable, clean and alternative energy resources to acquire supply obligations when they cannot clear economically in the Forward Capacity Auction. The CASPR design that we do not support isalso phases out the exemption from the MOPR in the capacity market afforded for up to 200 MW200MW annually (600 MW cumulatively) of renewable resources. FERC has approved downward sloping demand curves and zonal curves forresources, an aspect of the three designatedmarket design that we did not support due to the capacity zones formarket suppression associated with this mechanism. The effective date of these CASPR provisions will be implemented beginning with the Forward Capacity Auction (FCA) 11. In addition, ISO-NE’s review of the Net Cost of New Entry (Net CONE) was recently submitted at FERC which wouldto be implemented for FCA 12. If approved by FERC, the value of Net CONE will be reduced which could impact the revenues we expect to receive for our generationheld in the New England capacity market.February 2019.
NYISO—NYISO operates a short-term capacity market that provides a forward price signal only for six months into the future. Various matters pending before FERC could affect the competitiveness of this market and the outcome of these proceedings could result in artificial price suppression unless sufficient market protections are adopted.
One capacity market matter pending before FERC involves rules to govern payments and bidding requirements for generators proposing to exit the market but required to remain in service for reliability reasons. In March 2015, FERC issued an order which held that units receiving special reliability payments could properly take those payments into account in formulating capacity market bids. We believe that this ruling could impact efficient price formation in the capacity market and could artificially suppress capacity market outcomes. In April 2015, a trade association, Independent Power Producers of New York, Inc. (IPPNY) of which Power is a member, filed for rehearing by FERC of this ruling. This rehearing is still pending. Also, inruling, which was denied by FERC at the end of 2017. In connection with this same proceeding, FERC required NYISO to submit a report addressing whether buyer-side mitigation measures are needed for new entry occurring in the “Rest of State” (ROS) region and for uneconomic retention and repowering anywhere in the state. NYISO filed a report with FERC in December 2015 contending that these measures are not needed. The IPPNY has opposed NYISO’s contentions. The matter remains pending before FERC. In addition, in May 2015, the New York Public Service Commission and other New York agencies filed a complaint at FERC requesting certain exemptions from the NYISO rules that prevent capacity suppliers from submitting bids that are not market competitive. OnIn October 9, 2015, FERC granted in part, certain of the requested exemptions for renewable resources and for resources being used by the owner for self-supply. The IPPNY has challenged NYISO’s proposed implementation of the newly required exemptions. This challenge is still pending.
NYISO’s capacity market incorporates demand curves that are determined periodically by NYISO and approved by FERC. In November 2016, NYISO submitted to FERC for approval proposed demand curves that updated key parameters. The updated demand curves reflect the expected cost of new entry of peaking plants in New York and in each of the three capacity localities. If approved, this could impact the revenues we expect to receive for our generation in the New York capacity market. FERC issued an order substantially accepting NYISO’s proposed demand curves, but did not accept the proposal that the ROS proxy peaking unit design include selective catalytic reduction (SCR) emissions control technology.
Price Formation Initiatives
Power has been actively involved both through stakeholder processes and through filings at FERC in seeking improvements to the rules for setting prices for energy in the day-ahead and real-time markets administered by PJM and other system operators. FERC recently issued a notice of proposed rulemaking (NOPR) proposing that RTOs/ISOs modify their rules governing fast-start resources. Fast-start resources typically are committed in real-time, very close to the interval when needed and can respond quickly to unforeseen system needs. However, without fast-start pricing, some fast-start resources are ineligible to set prices due to inflexible operating limits. As a result, prices may not reflect the marginal cost of serving load. In a separate proceeding, PJM has submitted a proposal at FERC’s request to modify its rules to allow market sellers to submit day-ahead offers that vary by hour and to allow market sellers to update their offers in real time on an hourly basis under certain circumstances. These rule changes are currently pending before FERC. If both changes are approved, we believe that they would improve price formation in the energy and ancillary services markets.
Transmission Regulation
FERC has exclusive jurisdiction to establish the rates and terms and conditions of service for interstate transmission. We currently have FERC-approved formula rates in effect to recover the costs of our transmission facilities. Under this formula, rates are put into effect in January of each year based upon our internal forecast of annual expenses and capital expenditures. Rates are subsequently trued up to reflect actual annual expenses and capital expenditures. Our allowed ROE is 11.68% for both existing and new transmission investments and we have received incentive rates, affording a higher ROE, for certain large scale transmission investments.
In October 2016, PSE&G filed its 2017 Annual Formula Rate Update with FERC which requests approximately $121 million in increased annual transmission revenues effective January 1, 2017, subject to true-up. Each year, transmission revenues are adjusted to reflect items such as updating estimates used in the filing with actual data. For additional information about our transmission formula rate,filings, see Item 8. Financial Statements and Supplementary Data—Note 6.7. Regulatory Assets and Liabilities.
Transmission Policy Developments—FERC concluded in Order 1000 that the incumbent transmission owner should not always have a ROFR to construct and own transmission projects in its service territory. We and other companies appealed Order 1000 but this appeal was denied in 2014 by the D.C. Court. The current PJM rules retain carve-outs for projects that will continue to default to incumbents for construction responsibility, including immediately needed reliability projects, upgrades to existing transmission facilities, projects cost-allocated to a single transmission zone, and projects being built on existing rights-of-way and whose construction would interfere with incumbents’ use of their rights-of-way.
In a September 2015 order, FERC directed that a technical conference be held to address “concerns regarding how PJM plans for local transmission projects.” Parties in the case raised concerns that too many projects are being approved outside of the Regional Transmission Expansion Plan (RTEP) mechanism to address “local” reliability requirements without going through the Order 1000 open window process. Intervenors also complained that there is inadequate transparency regarding the PJM transmission owners’ consideration and selection of Supplemental Projects (which are not approved by the PJM Board). PSE&G is participating in the process before FERC in support of the current PJM processes. In addition, certain PJM stakeholders have proposed an examination of the current planning rules, including changes with regard to criteria to be used for replacement of facilities that have reached their “end of life.” PSE&G has been actively participating in this process. However, we are unable to predict the outcome of these efforts.
In a February 2016 order, FERC reversed a previous order and accepted a filing by the PJM transmission owners seeking authority to assign costs for RTEP projects (subject to PJM Board approval requirements) solely addressing localized needs to customers within the local transmission owner’s zone. FERC’s action in this order provides an exemption from the Order 1000 open window procedures for projects constructed by transmission owners to meet local transmission planning criteria. In April 2016, PJM filed at FERC to incorporate a voltage threshold into PJM’s RTEP process to exempt, except under certain circumstances, reliability violations on facilities below 200 kV from PJM’s proposal window process. We generally support this reform as a measure to improve the efficiency of the open window procedure that will permit transmission developers to focus on the projects most likely to benefit from a competitive process.
There are several matters pending before FERC that concern the allocation of costs associated with transmission projects being constructed by PSE&G contending that insufficient levels of costs are being allocated to customers in the PSE&G transmission zone. Projects involved include the Artificial Island project and the Bergen-Linden Corridor project in New Jersey and a smaller project in Sewaren, New Jersey. In April 2016, FERC issued orders denying the complaints and leaving the current cost allocation in effect as to the Bergen-Linden project. In October 2017, FERC accepted the Artificial Island and Bergen-Linden projects. DueCost allocation filing on the grounds that PJM correctly applied its Tariff. However, FERC deferred a ruling on whether the cost allocation methodology applied to an interveningthe Artificial Island project is appropriate. FERC order concerning the allocation of costs for projects constructed to meet local reliability requirements, FERC directedwill decide this issue in a separate proceeding that all of the Sewaren costs be allocated to customers in the PSE&G transmission zone.is currently pending. It is anticipated that additional proceedings are likely to occur.
In February 2016, FERC issued an order granting PSE&G’s request that it be permitted to seek recovery of 100% of its portion of the project’s costs to address identified high voltage issues at Artificial Island in New Jersey if the project is canceled for reasons beyond PSE&G’s control. In April 2016, PSE&G accepted construction responsibility for the three components of the project that PJM assigned to it, based on having reached agreement with PJM regarding an estimate for the project base cost of $273 million, plus risk and contingency for a total project cost of up to $340 million. In August 2016, PJM announced that it had suspended the Artificial Island transmission project and would be performing a comprehensive analysis to support a future course of action. PJM is expected to submit its final recommendation to the PJM Board at the April 2017 Board meeting.
In June 2015, a transmission developer filed a complaint against PJM claiming that PJM wrongfully refused to provide data and a transparent process for evaluating transmission network upgrade requests that the transmission developer had submitted to PJM. According to the complaint, PJM and certain transmission owners wrongfully inflated the scope and associated costs of mitigation work needed to accommodate the developer’s proposal in order to prevent it from pursuing its projects. Although not named as a respondent in the complaint, PSE&G is identified as one of the companies claimed to have been involved. FERC set the complaint for hearing and settlement procedures and the parties are currently engaged in discovery. We are unable to predict the outcome of these proceedings.
Another proceeding is a matter remanded from a federal appellate court concerning the appropriate cost allocation for certain 500 kVkilovolt (kV) projects in PJM that either have been built or are in the process of being built, including the Susquehanna-Roseland project. A proposedbuilt. In May 2018, FERC approved a settlement was filed with FERC in June 2016. The settlement, if adopted by FERC, wouldfor this matter that is expected to result in increased annual cost allocations to customers in the PSE&G transmission zone. The cost reallocation was implemented by PJM in July 2018. Under this settlement, Power, as a BGS supplier could becomeis obligated to pay amounts previously paid by other PJM transmission customers. However, we do not believe thatIn November 2018, the anticipated level of any such potential payments would haveBPU authorized BGS suppliers to collect increased allocation amounts from BGS customers through a material effect on Power’s financial statements. We believe that there is a mechanismpass-through provision in place under the BGS contract for the pass-through of increases in transmission charges.supplier contracts.
Transmission Rate Proceedings and Return on Equity—SeveralNumerous complaints have been filed and several remain pending at FERC againstin recent years seeking to reduce the base ROE of transmission owners aroundacross the country, challenging those transmission owners’ base ROEs. Certaincountry. Many of those complaints havewere resolved through agreement and settlement resulted in ROE reductions while others remain pending in the FERC adjudication process or are being litigated in the courts. Recent court decisions, and others have been settled, resulting in reductions of those transmission owners’ base ROEs. While we are not the subject of a challengeas well as proposed changes to the ROE employed in PSE&G’s transmission formula rate,calculation methodology discussed below, create some uncertainty as to the timing and outcome of these complaints. The results of these othersettlements and proceedings could set precedents for other transmission owners with formula rates in place, including PSE&G.
Con Edison Wheeling Agreement—In April 2016, Con Edison informed PJMOctober 2018, FERC issued an order establishing a new framework for determining whether a company’s ROE is unjust and unreasonable. The order was issued in a proceeding that was remanded to FERC from D.C. Circuit concerning the
establishment of the New England Transmission Owners’ ROE. FERC’s order proposes a new method for evaluating whether an existing ROE remains just and reasonable. Under FERC’s approach, FERC will determine a composite zone of reasonableness based on the results of three financial models, and if the targeted utility’s existing ROE falls within the range of just and reasonable ROEs for its risk profile, FERC will dismiss the complaint. However, if FERC determines that an existing ROE is unjust and unreasonable, it would allow its Wheeling Agreementproposes to expire effective as of May 1, 2017. The Wheeling Agreement enables Con Edison to move 1,000 MW of power from southeastern New York across the PSE&G system for delivery into New York City. NYISOrely on four financial models: a discounted cash flow, a risk premium analysis, a capital-asset pricing model analysis and PJM submitted proposed tariff provisions in January 2017. The proposal concerns future operational procedures and transmission planning assumptions associated with the affected transmission lines. The manner in which PJM has calculated the import assumptions for the upcoming base residual auction has decreasedan expected earnings analysis. We are analyzing the potential for locational splits in the zones where PSEG has its assets. However, PJM has indicated that it is still reviewingimpact of these import assumptionsmethodologies and may publish revised values before the auction. We cannot predict the impactoutcome of the proposal on energy prices or transmission planning at this time. Also, PSE&G will continue to recover the costs associated with the new arrangement through its formula rate. However, we continue to review the proposal and may protest certain of its elements.proceeding.
Compliance
FERC—For information about the preliminary non-public investigation initiated by the FERC Staff regarding errors in the calculation of certain components of Power’s cost-based bids for its New Jersey fossil generating units in the PJM energy market and the quantity of energy that Power offered into the energy market for its fossil peaking units compared to the amounts for which Power was compensated in the capacity market for those units, see Item 8. Financial Statements and Supplementary Data—Note 13. Commitments and Contingent Liabilities.
Reliability Standards—Congress has required FERC to put in place, through the North American Electric Reliability CouncilCorporation (NERC), national and regional reliability standards to ensure the reliability of the U.S. electric transmission and generation system (grid) and to prevent major system blackouts. There has been considerable focus recently on physical security in light of, among other things, a substation attack in California that occurred in 2013. As a result, FERC directed the NERC to draft a physical security standard intended to further protect assets deemed “critical” to reliability of the grid. In November 2014, FERC issued an order approving the NERC’s proposed physical security standard. Under the standard, utilities will be required to identify critical substations as well as develop threat assessment plans to be reviewed by independent third parties. In our case, the third-party is PJM. As part of these plans, utilities could decide or be required to build additional redundancy into their systems. This standard will supplement the Critical Infrastructure Protection (CIP) standards that are already in place and that establish physical and cybersecurity protections for critical systems. We are taking steps to meet the newthese obligations. FERC directed the NERC to develop a new reliability standard to provide security controls for supply chain management associated with the procurement of industrial control system hardware, software, and services related to bulk electric system operations. When adopted, compliance with these new standards would be expected to impose additional obligations and costs.
Commodity Futures Trading Commission (CFTC)
In accordance with the Dodd-Frank Wall Street Reform and Consumer Protection Act (Dodd-Frank Act), the SEC and the CFTC are in the process of implementing a new regulatory framework for swaps and security-based swaps. The legislation was enacted to reduce systemic risk, increase transparency and promote market integrity within the financial system by providing for the registration and comprehensive regulation of swap dealers and by imposing recordkeeping, data reporting, margin and clearing requirements with respect to swaps. To implement the Dodd-Frank Act, the CFTC has engaged in a comprehensive rulemaking process and has issued a number of proposed and final rules addressing many of the key issues. We are currently subject to recordkeeping and data reporting requirements applicable to commercial end users. The CFTC has also re-proposed rules establishing position limits for trading in certain commodities, such as natural gas, and we will begin complying with these rules once they become final.
Nuclear Regulatory Commission (NRC)
Our operation of nuclear generating facilities is subject to comprehensive regulation by the NRC,Nuclear Regulatory Commission (NRC), a federal agency established to regulate nuclear activities to ensure the protection of public health and safety, as well as the security and protection of the environment. Such regulation involves testing, evaluation and modification of all aspects of plant operation in light of NRC safety and environmental requirements. Continuous demonstration to the NRC that plant operations meet requirements is also necessary.
The NRC has the ultimate authority to determine whether any nuclear generating unit may operate. The current operating licenses of our nuclear facilities expire in the years shown in the following table:
|
| | | | |
| | | | |
| Unit | | Year | |
| Salem Unit 1 | | 2036 | |
| Salem Unit 2 | | 2040 | |
| Hope Creek | | 2046 | |
| Peach Bottom Unit 2 | | 2033 | |
| Peach Bottom Unit 3 | | 2034 | |
| | | | |
As a result of events at the Fukushima Daiichi nuclear facility in Japan following the earthquake and tsunami in 2011, the NRC began performing additional operational and safetyconducts ongoing reviews of nuclear facilities in the United States. These reviewsindustry operating experience and the lessons learned from the events in Japan have resulted in additional regulation and implementation guidance for the nuclear industry and could impact future operations and capital requirements for our facilities. We believe that our nuclear plants currently meet the stringent applicable design and safety specifications of the NRC.
We have implemented the diverse and flexible mitigating strategies and spent fuel pool level indication modifications in accordance with themay issue or revise regulatory requirements at the Salem, Hope Creek and Peach Bottom nuclear units. For our Hope Creek and Peach Bottom units, implementation of the required venting system modifications is expected to be completed by 2018.
The NRC continues to evaluate potential revisions to its requirements in connection with its operational and safety reviews of nuclear facilities in the United States as a result of the Fukushima Daiichi incident.
these ongoing reviews. We are unable to predict the final outcome of these reviews or the cost of any actions we would need to take to comply with any new regulations, including possible modifications to ourthe Salem, Hope Creek and Peach Bottom facilities, but such costcosts could be material.
State Regulation
Since our operations are primarily located within New Jersey, our principal state regulator is the BPU, which oversees electric and natural gas distribution companies in New Jersey. We are also subject to various other states’ regulations due to our operations in those states.
Our New Jersey utility operations are subject to comprehensive regulation by the BPU including, among other matters, regulation of retail electric and gas distribution rates and service, the issuance and sale of certain types of securities and compliance matters. PSE&G’s participation in solar, demand response and energy efficiency programs is also regulated by the BPU, as the terms and conditions of these programs are approved by the BPU. BPU regulation can also have a direct or indirect impact on our power generation business as it relates to energy supply agreements and energy policy in New Jersey.
We must file electric and gas rate cases with the BPU in order to change our utility base distribution rates. Our last base rate case was settled in 2010. As a result of our 2014 Energy Strong Order, we are required to file our next distribution base rate case proceeding no later than November 1, 2017. In addition to base rates, we recover certain costs or earn on certain investments pursuant to mechanisms known as adjustment clauses. These clauses permit the flow-through of costs to, or the
recovery of investments from, customers related to specific programs, outside the context of base rate case proceedings. Recovery of these costs or investments is subject to BPU approval for
which we make periodic filings. Delays in the pass-through of costs or recovery of investments under these mechanisms could result in significant changes in cash flow. For additional information on our specific filings, see Item 8. Financial Statements and Supplementary Data—Note 6.7. Regulatory Assets and Liabilities.
Gas System ModernizationNew Jersey Energy Master Plan (EMP)—In May 2018,the New Jersey governor signed an executive order directing the BPU and other New Jersey executive branch agencies to prepare a new EMP by June 1, 2019. While not having the force of law, the EMP provides an overview of energy policy in New Jersey. The new EMP will, among other issues: focus on New Jersey converting to 100% clean energy sources by January 1, 2050; incorporate New Jersey’s offshore wind development goals; include provisions to guide the continued development of solar energy, including community solar; make recommendations to bolster energy storage in New Jersey; and explore methods to incentivize the use of clean, efficient energy and electric technology alternatives in New Jersey’s transportation sector and at its ports.
In January 2018, the governor of New Jersey signed Executive Order No. 8 directing the BPU to begin the process of moving the state toward its 2030 goal of 3,500 MW of offshore wind energy generation. An initial solicitation was established for 1,100 MW of offshore wind, with bids due in December 2018. For a discussion of our involvement with offshore wind in New Jersey, see Item 7. MD&A—Executive Overview of 2018 and Future Outlook.
Energy Efficiency Initiatives—In May 2018, the New Jersey governor signed legislation that requires the state’s electric and gas utilities to implement energy efficiency programs that are expected to achieve energy savings targets for electric and gas usage within five years of the utility’s implementation of its BPU-approved energy efficiency programs. To meet these savings targets, energy usage reductions and peak demand reductions that result from utility and non-utility based programs and investments (including building code changes) will be counted. The initial targets are 2% of annual electric usage and 0.75% of annual gas usage with the targets then being reassessed periodically by the BPU. The specific energy savings target for each public electric and gas utility will be determined from an energy efficiency study to be completed within a year from enactment of the legislation. The legislation requires utilities to make annual filings with the BPU outlining their planned investments and proposed programs for cost-effectively achieving the targeted energy savings. These filings are also expected to address the utility’s return of and on those investments and recovery of lost revenues associated with the lower sales. The BPU is required to adopt rules to implement the legislation within one year of enactment.
Infrastructure Investment Program (GSMP)(IIP)—The BPU has enacted IIP regulations that encourage utilities to construct, install or remediate utility plant and facilities related to reliability, resiliency and/or safety to support the provision of safe and adequate service. Under these regulations, utilities can seek authority to make specified infrastructure investments in programs extending for up to five years with accelerated cost recovery mechanisms. The BPU characterized the IIP regulations as a regulatory initiative intended to create a financial incentive for utilities to accelerate the level of investment needed to promote the timely rehabilitation and replacement of certain non-revenue producing infrastructure that enhances reliability, resiliency, and/or safety.
BGSS Process—In November 2015,2017, a filing was made by the Retail Energy Supply Association (RESA) with the BPU issued an order approving the settlement of our GSMP through which PSE&G will invest $905 million over the next three years to modernize its gas system. The settlement enables the utility to replace up to 510 miles of gas mains and 38,000 service lines over a three-year period, with cost recovery at a 9.75% rate of return on equity on $650 million of the investment through an accelerated recovery mechanism. Under the settlement, PSE&G will seek recovery of the remaining $255 million of investment in its next base rate case. In December 2016,requesting that the BPU approved PSE&G’s initial GSMP cost recoveryrevisit the BGSS process and establish a gas capacity release program. In March 2018, the RESA filed an amended petition which allows PSE&Gwith the BPU requesting a formal proceeding to recover in base rates capitalized GSMP investment costs for infrastructure placed in service through September 30, 2016.establish a gas capacity release program. This filing applies to all New Jersey gas utilities. The BPU order provides for a total $10 million annual revenue increase effective January 1, 2017.matter remains pending.
BPU Cybersecurity Requirements for Regulated Entities2018 Storm Investigation—InThe BPU conducted an investigation of the state’s EDCs’ responses to the March 2016,2018 late winter storms. Based on the findings of the investigation, the BPU issued an orderimplemented certain recommendations that it deemed essential to facilitate the continued provision of safe, proper and adequate service; to help mitigate future outages; and to help develop more effective responses and coordination of resources. These recommendations imposed several specific follow-up requirements on the EDCs concerning, among other things, weather forecasting; updates to the EDCs’ event level classification matrices and emergency operations plans; and submission of a plan and cost benefit analysis for the regulated electric, natural gas,implementation of Advanced Metering Infrastructure (AMI).
In January 2019, PSE&G filed a response to the request for a plan and water/wastewater utilitiescost benefit analysis for the implementation of AMI. The response highlighted a number of customer and operational benefits associated with the deployment of AMI, and incorporated PSE&G’s EC Business case and direct testimony from the CEF-EC proceeding previously filed with the BPU. PSE&G has filed all responses to furtherthe follow-up requirements specified by the BPU.
Federal Tax Legislation —As a result of the enactment of the Tax Cuts and Jobs Act of 2017 (Tax Act), various state regulatory authorities, including the BPU, took action to ensure that excess federal income taxes previously collected in rates are returned to customers. We have adjusted our revenue requirement in certain of our rate matters as a result of the change in the federal income tax rate.
Additional matters and information on our specific filings are discussed in Item 8. Note 7. Regulatory Assets and Liabilities.
Cybersecurity
In an effort to reduce the potential forlikelihood and severity of cybersecurity incidents, we have established a comprehensive cybersecurity program designed to protect and preserve the confidentiality, integrity and availability of our company’s and our customers’ information and our systems. Our cybersecurity program is built on technical, procedural, and people-focused measures to detect, protect against, respond to, and recover from cyber threats to our systems and information including company, employee and customer data. Features of our program include: identifying critical information and systems; conducting cyber risk assessments of our and third-party systems; maintaining awareness of cyber threats and vulnerabilities through partnerships with public and private entities, as well as industry groups; maintaining and testing our cybersecurity incident response plans and systems; training personnel on cybersecurity issues; cybersecurity awareness throughout our company with electronic notices and seminars; and periodically reviewing industry best practices and operational benchmarking. Cybersecurity and the effectiveness of our cybersecurity processes are discussed by senior management and at Board and Audit Committee meetings. Our strategy for managing cyber-related risks is integrated within our enterprise risk management processes.
In addition, we are subject to federal and state requirements designed to further protect against cybersecurity threats to critical infrastructure, as discussed below. For a discussion of the risks associated with cybersecurity threats, see Item 1A. Risk Factors.
Federal—NERC, at the direction of FERC, has implemented national and regional reliability standards to ensure the reliability and resiliency of utility servicethe grid and to protect customers’ information. prevent major system blackouts. NERC CIP standards establish cybersecurity and physical security protections for critical systems and facilities. These standards are also designed to develop coordination, threat sharing and interaction between utilities and various government agencies regarding potential cybersecurity and physical threats against the nation’s electric grid.
FERC further directed NERC to develop a new reliability standard to provide security controls for supply chain management associated with the procurement of industrial control system hardware, software, and services related to bulk electric system operations. FERC approved these supply chain risk management standards in October 2018, with an implementation date of July 1, 2020. We are taking steps to meet these additional obligations. Compliance with these new standards would be expected to impose additional costs.
State—The orderBPU requires these regulated utilities, including PSE&G, to, among other conditions,things, implement a cybersecurity program that defines and implements organization accountabilities and responsibilities for cyber risk management activities, and establishes policies, plans, processes and procedures for identifying and mitigating cyber risk to critical systems.
In December 2016, PSE&G submitted a required letterAdditional requirements of this order include, but are not limited to: (i) annually inventorying critical utility systems; (ii) annually assessing risks to critical utility systems; (iii) implementing controls to mitigate cyber risks to critical utility systems; (iv) monitoring log files of critical utility systems; (v) reporting cyber incidents to the BPU outlining its compliance effortsBPU; and (vi) establishing a cybersecurity incident response plan and conducting biennial exercises to date and noting that it currently has not identified any potential barriers to compliance withtest the order’s requirements. New Jersey utilities, including PSE&G, are required to be compliant with these requirements by October 1, 2017, taking various measures aimed to meet this compliance deadline. For a discussion of the risks associated with cyber threats, see Item 1A. Risk Factors.
Solar 4 All Program Extension IIplan.—In November 2016, the BPU approved a settlement providing for an extension of PSE&G’s existing landfill/brownfield solar program to construct up to 33 MW of grid connected facilities with projected capital expenditures of approximately $80 million through May 2020.
Consolidated Tax Adjustments (CTA)—New Jersey is one of only a few states that make CTA in setting rates for regulated utilities. These adjustments to rate base are madeduring the rate setting process andare intended to allocate to utility customers a portion of the tax benefits realized from the filing of a consolidated federal tax return by the utility’s parent corporation. The BPU has been considering the appropriateness of the adjustment and the methodology and mechanics of the calculation for some time. In October 2014, the BPU approved a proposal by its Staff that limits the tax benefit period to be considered in the calculation to five years, sets the rate base adjustment at 25% of any such tax benefit and eliminates from the process any tax benefits tied to transmission earnings. In accordance with this October action, this CTA policy will be applied only with respect to future rate cases. The adoption of these modifications by the BPU is not expected to have a material impact on PSE&G’s current earnings nor in its next rate case filing. In November 2014, the New Jersey Division of Rate Counsel appealed the BPU’s decision which remains pending.
Connecticut Rate Filing—In June 2016, Power’s subsidiary, PSEG New Haven LLC, filed a mandatory annual rate case with the Connecticut Public Utilities Regulatory Authority for recovery of its costs and investment in its Connecticut-based peaking unit. Power requested 2017 revenues of $20 million, which was approved in its entirety.
Additional matters are discussed in Item 8. Financial Statements and Supplementary Data—Note 6. Regulatory Assets and Liabilities.
ENVIRONMENTAL MATTERS
We are subject to federal, state and local laws and regulations with regard to environmental matters including, but not limited to:
air pollution control,
climate change,
water pollution control,
hazardous substance liability, and
fuel and waste disposal.
We expect there will be changes to existing environmental laws and regulations particularly in light of the change in administration following the 2016 U.S. presidential election, whichthat could significantly impact the manner in which our operations are currently conducted. Such laws and regulations may also affect the timing, cost, location, design, construction and operation of new facilities. Due to evolving environmental regulations, it is difficult to project future costs of compliance and their impact on competition. Capital costs of complying with known pollution control requirements are included in our estimate of construction expenditures in Item 7. MD&A—Capital Requirements. The costs of compliance associated with any new requirements that may be imposed by future regulations are not known, but may be material.
For additional information related to environmental matters, including proceedings not discussed below, as well as anticipated expenditures for installation of pollution control equipment, hazardous substance liabilities and fuel and waste disposal costs, see Item 1A. Risk Factors Item 3. Legal Proceedings and Item 8. Financial Statements and Supplementary Data—Note 13.14. Commitments and Contingent Liabilities.
Air Pollution Control
Our facilities are subject to federal regulation under the Clean Air Act (CAA) whichthat requires controls of emissions from sources of air pollution and imposes recordkeeping, reporting and permit requirements. Our facilities are also subject to requirements established under state and local air pollution laws. The CAA requires all major sources, such as our generation facilities, to obtain and keep current an operating permit. The costs of compliance associated with any new requirements that may be imposed and included in these permits in the future could be material and are not included in our estimates of capital expenditures.
Hazardous Air Pollutants Regulation—In February 2012, the Environmental Protection Agency (EPA) published Mercury Air Toxics Standards (MATS) for both newly-built and existing electric generating sources under the National Emission Standard for Hazardous Air Pollutants (NESHAP) provisions of the CAA. The MATS established allowable levels for mercury as well as other hazardous air pollutants (HAPS) and went into effect in April 2015. In June 2015, the U.S. Supreme Court held that it was unreasonable for the EPA to refuse to consider the materiality of costs in determining whether to regulate hazardous air pollutants from power plants. In April 2016, the EPA released the final Supplemental Finding that considers the materiality of costs in determining whether to regulate hazardous air pollutants from power plants in response to the U.S. Supreme Court’s ruling. The 2016 Supplemental Finding determined that HAPS from existing electric generating units should be regulated and that the environmental and health benefits derived from the reduction in emissions of both HAPS and co-benefit pollutants far outweighed the cost of compliance. Industry participants and various state authorities have filed petitions with the D.C. CourtCircuit challenging the EPA’s Supplemental Finding. The D.C. Circuit is holding the case in abeyance pending further directions from the EPA.
In December 2018, the EPA issued a proposed Supplemental Finding to reverse the 2016 Supplemental Finding, concluding that the analysis should not include the benefits from the reduction in emissions from co-benefit pollutants. Although the EPA proposed that it will retain the emission standards and other requirements of MATS, it is seeking comment on two alternatives to potentially rescind MATS. Finally, the EPA proposal concluded that no additional regulations are required. We do not expect this Supplemental Finding, if finalized as proposed, to impact the operation of our facilities.
Demand Response (DR) Reciprocating Internal Combustion Engines (RICE) Litigation—In March 2013, Power filed a petition at the EPA challenging the NESHAP for RICE issued in January 2013. Among other things, the NESHAP include two exemptions that allow owners and operators of stationery emergency RICE to operate their engines without the installation and operation of emission controls (1) as part of an emergency DR program for 100 hours per year (100 hour exemption) or (2) as part of a financial arrangement with another entity per specified restrictions in non-emergency situations for 50 hours per year (50 hour exemption). In its petition, Power sought more stringent emission control standards for RICE to support more competitive markets, particularly the PJM capacity market. In August 2014, the EPA denied the March 2013 petition and in October 2014, Power appealed the EPA’s denial to the D.C. Court. In September 2015, the D.C. Court granted the EPA’s motion for voluntary remand of the 50 hour exemption provision to the EPA. In May 2016, the D.C. Court vacated the 100 hour exemption which removes that provision from the rule.
Cross-State Air Pollution Rule (CSAPR)—In January 2015, the final CSAPR became effective which limits power plant emissions of sulfur dioxide (SO2) and annual and ozone season nitrogen oxide (NOx) in 28 states that contribute to the ability of downwind states to attain and/or maintain the 1997 and 2006 particulate matter and the 1997 ozone National Ambient Air Quality Standards (NAAQS). In April 2015, the EPA revoked the 1997 ozone NAAQS of 80 parts per billion (ppb) and began implementation of the more stringent 2008 ozone NAAQS of 75 ppb. In September 2016, the EPA published the final CSAPR Updating Rule to address the 2008 National Ambient Air Quality Standards for ground-level ozone. The rule establishes more stringent annual ozone season (May 1 through September 30) caps beginning in May 2017. We do not anticipate any material impact on our business or financial condition due to the CSAPR. Numerous parties have filed petitions for review with the D.C. Court to challenge the CSAPR Updating Rule.
Ozone Standard—In December 2014, the EPA proposed a rule to lower the ambient air quality standard for the level of ozone in the atmosphere from 75 ppb to a level in the range of 65-70 ppb. On October 1, 2015, the EPA finalized a standard of 70 ppb. To meet the new standard, the EPA and the states have to implement additional emission reduction strategies for NOx and volatile organic compounds. Some portions of the Mid-Atlantic and New England states are not expected to be able to meet the new standard. Although the majority of our fossil generating units employ state-of-the-art NOx emission controls, we cannot predict the outcome of this matter since new requirements of the EPA and the states are unknown at this time. Numerous parties have filed petitions for review with the D.C. Court to challenge the rule.
Climate Change
CO2 Regulation under the CAA—In October 2015, the EPA published the New Source Performance Standards (NSPS) for new power plants. The NSPS establishes two emission standards for CO2 for the following categories: (i) fossil fuel-fired utility boilers and integrated gasification combined cycle (IGCC) units, and (ii) natural gas combustion turbines. Simple cycle combustion turbines are exempt from the rule.
In October 2015, the EPA also published the Clean Power Plan (CPP), a greenhouse gas (GHG) emissions regulation under the CAA for existing power plants.
In August 2018, the EPA released the proposed Affordable Clean Energy (ACE) rule as a replacement for the CPP. The regulationproposed ACE rule gives states great flexibility to evaluate specific heat rate improvement technologies and practices to be applied at coal-fired electric generating units. States have three years from the date of finalization to submit a plan that establishes state-specific emission rate targets based on implementationa standard of performance that reflects the best systemdegree of emission reduction (BSER). The BSER consistslimitation through the application of three components: (i) heat rate improvements at existing coal-fired power plants, (ii) increased useimprovement technologies and practices. We cannot estimate the impact of existing natural gas combined cycle capacity, and (iii) operationthis action on our business or results of incremental zero-emitting generation (renewables and nuclear). States may choose these or other methodologies to achieve the necessary reductions of CO2 emissions.
Numerous states, including New Jersey, and several industry groups filed petitions for review with the D.C. Court to challenge the CPP. In addition, the petitioners sought a stay of the rule. The U.S. Supreme Court stayed the rule pending further review of the case.
The U.S. Supreme Court’s decision to stay the implementation of the CPP will delay deadlines for submission of state requests for extensions and final plans. If the CPP is upheld, new deadlines will need to be established and the effective date of the compliance period may be impacted.operations.
Regional Greenhouse Gas Initiative (RGGI)—In response to concerns over global climate change, some states have developed initiatives to stimulate national climate legislation through CO2 emission reductions in the electric power industry. New Jersey withdrew from RGGI in 2012. However, certainCertain northeastern states (RGGI States), including New York and Connecticut where we have generation facilities, have state-specific rules in place to enable the RGGI regulatory mandate in each state to cap and reduce CO2 emissions.
These rules make allowances available through a regional auction whereby generators may acquire allowances that are each equal to one ton of CO2 emissions. Generators are required to submit an allowance for each ton emitted over a three-year period. Allowances are available through the auction or through secondary markets.
In November 2015September 2017, the RGGI States initiatedannounced their new post-2020 program for a 2016 Program Review stakeholder process. The focus ofcap on regional CO2 emissions, which would require a decline in CO2 emissions in 2021 and each year thereafter, resulting in a 30% reduction in the 2016 Program Review is the post-2020 caps on GHGCO2 emissions and the incorporation of the EPA’s CPP requirements.cap by 2030.
New Jersey adopted the Global Warming Response Act in 2007, which calls for stabilizing its GHG emissions to 1990 levels by 2020, followed by a further reduction of greenhouse emissions to 80% below 2006 levels by 2050. To reach this goal, the NJDEP,New Jersey Department of Environmental Protection (NJDEP), the BPU, other state agencies and stakeholders are required to evaluate methods to meet and exceed the emission reduction targets, taking into account their economic benefits and costs. In December 2018, the NJDEP proposed two rules that begin New Jersey’s re-entry into RGGI. The first proposal is the mechanism that establishes New Jersey’s initial cap on GHG emissions of 18 million tons in 2020. The proposal follows the RGGI model rule with a cap that will decline three percent annually through 2030 to a final cap of 11.5 million tons. New Jersey is committed to a start date of January 1, 2020. The second proposal establishes the framework for how New Jersey will
spend the RGGI auction proceeds. We cannot estimate the impact of this action on our business or results of operations at this time.
Water Pollution Control
The Federal Water Pollution Control Act (FWPCA) prohibits the discharge of pollutants to U.S. waters from point sources, except pursuant to a National Pollutant Discharge Elimination System (NPDES) permit issued by the EPA or by a state under a federally authorized state program. The FWPCA authorizes the imposition of technology-based and water quality-based effluent limits to regulate the discharge of pollutants into surface waters and ground waters. The EPA has delegated authority to a number of state agencies, including those in New Jersey, New York and Connecticut, to administer the NPDES program through state action. We also have ownership interests in facilities in other jurisdictions that have their own laws and implement regulations to control discharges to their surface waters and ground waters that directly govern our facilities in those jurisdictions.
Steam Electric Effluent Guidelines—In September 2015, the EPA issued a new Effluent Limitation Guidelines Limitation Rule (ELG Rule) for steam electric generating units. The rule establishes new best available technology economically achievable (BAT) standards for fly ash transport water, bottom ash transport water, flue gas desulfurization and flue gas mercury control wastewater. The EPA provides an implementation period for currently existing discharges of three years or up to eight years if a facility needs more time to implement equipment upgradeswastewater, and provide supporting information to its permitting authority. In the intervening time period, existing discharge standards continue to apply.gasification wastewater. Power’s Bridgeport Harbor stationsstation and the jointly-owned Keystone and Conemaugh stations have bottom ash transport water discharges that are regulated under this rule. We arethe ELG Rule. Keystone and Conemaugh also have flue gas desulfurization wastewaters regulated by the ELG Rule.
Through various orders, the EPA has stayed the compliance dates in the ELG Rule and has announced plans to further revise the requirements and compliance dates of the ELG Rule. Power is unable to predict ifdetermine how this rule will have a materialultimately impact on our future capitalits compliance requirements or its financial condition and results of operations.
In addition to regulating the discharge of pollutants, the FWPCA regulates the intake of surface waters for cooling. The use of cooling water is a significant part of the generation of electricity at steam-electric generating stations. Section 316(b) of the FWPCA requires that cooling water intake structures reflect the best technology available (BTA) for minimizing adverse environmental impact. The impact of regulations under Section 316(b) can be significant, particularly at steam-electric generating stations which do not have closed cycle cooling and do not use cooling towers to recycle water for cooling purposes.
The installation of cooling towers at an existing generating station can impose significant engineering challenges and significant costs, which can affect the economic viability of a particular plant.
Cooling Water Intake Structure Regulation—In May 2014, the EPA issued a final cooling water intake rule under Section 316(b) of the Clean Water Act (CWA) that establishes new requirements for the regulation of cooling water intakes at existing power plants and industrial facilities with a design flow of more than two million gallons of water per day.
The EPA has structured the rule so that each state Permitting Director will continue to consider renewal permits for existing power facilities on a case by case basis. In connection with assessment of the best technology available for minimizing adverse environmental impacts of each facility that seeks a permit renewal, the rule requires that facilities conduct a wide range ofbasis, based on studies related to impingement mortality and entrainment and submit the results with their permit applications.applications to be conducted by the facilities seeking renewal permits.
In September 2014, severalSeveral environmental non-governmental groupsorganizations and certain energy industry groups filed petitions for review of the rule and the case has been assigned to the U.S. Second Circuit Court of Appeals (Second Circuit). Environmental organizations, including but not limited to the environmental petitioners in the Second Circuit, have also filed suit under the CWA and the Endangered Species Act. The cases were subsequentlyhave been consolidated at the Second Circuit and a decision is expected by mid-2017.remains pending.
We are assessing the potential impact of the rule on each of our affected facilities and are unable to predict the outcome of permitting decisions and the effect, if any, that they may have on our future capital requirements, financial condition or results of operations, although such impacts could be material. See Item 8. Financial Statements and Supplementary Data— Note 13.14. Commitments and Contingent Liabilities for additional information.
In June 2016, the New Jersey Department of Environmental Protection (NJDEP) issued the final New Jersey Pollutant Discharge Elimination System (NJPDES) permit for Salem, with an effective date of August 1, 2016. The final permit does not require installation of cooling towers and allows Salem to continue to operate utilizing the existing once-through cooling water system. The final permit does not mandate specific service water system modifications, but consistent with Section 316 (b) of the Clean Water Act, it requires additional studies and the selection of technology to address impingement for the service water system. In July 2016, the Delaware Riverkeeper Network (Riverkeeper) filed a request challenging the NJDEP’s issuance of a final NJPDES renewal permit for Salem. The Riverkeeper’s filing does not change the effective date of the permit. For additional information, see Item 8. Financial Statements and Supplementary Data—Note 13. Commitments and Contingent Liabilities.
We are actively engaged with the Connecticut Department of Energy and Environmental Protection (CTDEEP) regarding renewal of the current permit for the cooling water intake structure at Bridgeport Harbor Station Unit 3 (BH3). To address compliance with the EPA’s CWA Section 316(b) final rule, the current proposal under consideration is that, if a final permit is issued, we would continue to operate BH3 without making the capital expenditures for modification to the existing intake structure and retire the BH3 within five years of the effective date of the final permit. Based on current discussions with the CTDEEP, if the proposal is accepted, a final permit could be issued in 2017 with a retirement date for BH3 by summer 2021, which is four years earlier than the previously estimated useful life ending in 2025. If the permit is not issued and the conditions below are not met, we may seek to operate BH3 through the previously estimated useful life.
Separately, we have also negotiated a Community Environmental Benefit Agreement (CEBA) with the City of Bridgeport, Connecticut. That CEBA provides that we would retire BH3 early if all its precedent conditions occur, which include receipt of all final permits to build and operate a proposed new combined cycle generating facility on the same site that BH3 currently operates, which could occur in 2017. Absent those conditions being met, and the permit renewal referred to above not being issued, we may seek to operate BH3 through the previously estimated useful life. See Item 8. Financial Statements and Supplementary Data—Note 3. Early Plant Retirements.
In February 2016, the proposed generating facility, Bridgeport Harbor Station Unit 5 (BH5), was awarded a capacity obligation. Construction is expected to commence in 2017, with operations expected to begin in mid-2019. The Connecticut Siting Council issued an order to approve siting BH5. All major environmental permits have been obtained except for the New Source air permit that is currently in draft form for public comment.
Waters of the United States—In April 2014, the EPA Administrator and the Assistant Secretary of the Army (Civil Works) jointly published a proposed rule to clarify the definition of waters of the U.S. under the CWA programs in order to protect the streams and wetlands that form the foundation of the nation’s water resources. This definition will have broad application to all areas of compliance under the CWA, including permitted discharges and construction activities. The final rule was published in June 2015 and various states, industry coalitions and environmental organizations have initiated legal action related to the provisions of the final rule as well as which court has jurisdiction over the rule. The U.S. Supreme Court is expected to rule on the question of jurisdiction by June 2017. Some states, including New Jersey, are subject to state requirements beyond thoseimposed under federal law. While we do not anticipate material impacts to projects in New Jersey, the new definition could impose requirements in other states and regions that could impact the development of renewables.
Bridgeport Harbor National Pollutant Discharge Elimination System (NPDES) Permit Compliance—In April 2015, we determined that monitoring and reporting practices related to certain permitted wastewater discharges at our Bridgeport Harbor station may have violated conditions of the station’s NPDES permit and applicable regulations and could subject us to fines and penalties. We have notified the CTDEEP of the issues and have taken actions to investigate and resolve the potential non-compliance. We cannot predict the impact of this matter.
Endangered Species Act—In June 2015, the Sierra Club and another environmental group submitted to the NJDEP a sixty-day notice of intent to sue alleging the agency has caused violations of the Endangered Species Act by allowing our Mercer generation station to operate in a manner which has caused the mortality of certain species of sturgeon. Among other things, the notice requested the NJDEP to prioritize completion of a permit renewal action for Mercer which addresses the alleged Endangered Species Act violations. We are currently working with the National Marine Fisheries Service regarding an Incidental Take Permit that will outline operation and monitoring requirements through retirement of the Mercer generation station in May 2017 and subsequent decommissioning.
Hazardous Substance Liability
The production and delivery of electricity and the distribution and manufacture of gas result in various by-products and substances classified by federal and state regulations as hazardous. These regulations may impose liability for damages to the environment from hazardous substances, including obligations to conduct environmental remediation of discharged hazardous substances as well as monetary payments, regardless of the absence of fault and the absence of any prohibitions against the activity when it occurred, as compensation for injuries to natural resources. See Item 3. Legal Proceedings. Our historic operations and the operations of hundreds of other companies along the Passaic and Hackensack Rivers are alleged by federal and state agencies to have discharged substantial contamination into the Passaic River/Newark Bay Complex. The EPA is also evaluating the Hackensack River, a tributary to Newark Bay, for inclusion in the Superfund program. We no longer manufacture gas. For additional information, see Item 8. Financial Statements and Supplementary Data—Note 13.14. Commitments and Contingent Liabilities.
Site Remediation—The Federal Comprehensive Environmental Response, Compensation and Liability Act of 1980 (CERCLA) and the New Jersey Spill Compensation and Control Act (Spill Act) require the remediation of discharged hazardous substances and authorize the EPA, the NJDEP and private parties to commence lawsuits to compel clean-ups or reimbursement for such remediation. The clean-ups can be more complicated and costly when the hazardous substances are in a body of water.
Natural Resource Damages—CERCLA and the Spill Act authorize the assessment of damages against persons who have discharged a hazardous substance, causing an injury to natural resources. Pursuant to the Spill Act, the NJDEP requires persons conducting remediation to characterizeaddress injuries to natural resources and to address those injuries through restoration or damages. The NJDEP adopted regulations concerning site investigation and remediation that require an ecological evaluation of potential damages to natural resources in connection with an environmental investigation of contaminated sites. The NJDEP also issued guidance to assist parties in calculating their natural resource damage liability for settlement purposes, but has stated that those calculations are applicable only for those parties that volunteer to settle a claim for natural resource damages before a claim is asserted by the NJDEP. We are currently unable to assess the magnitude
Fuel and Waste Disposal
Nuclear Fuel Disposal—The federal government has entered into contracts with the operators of nuclear power plants for transportation and ultimate disposal of spent nuclear fuel. To pay for this service,Under the Nuclear Waste Policy Act of 1982 (NWPA), nuclear plant owners are required to contribute to a Nuclear Waste Fund. In accordance withFund to pay for this service. Since May 2014, the Nuclear Waste Policy ActUnited States Department of 1982,Energy (DOE) reduced the nuclear waste fee to zero. No assurances can be given that this fee will not be increased in 2009 the DOE conducted its annual review of the adequacy of the Nuclear Waste Fee and concluded that the current fee of 1/10 cent per kWh was adequate to recover program costs. In 2011, we joined the Nuclear Energy Institute (NEI) and fifteen other nuclear plant operators in a lawsuit in federal court seeking suspension of the Nuclear Waste Fee. In June 2012, the court ruled that the DOE failed to justify continued payments by electricity consumers into the Nuclear Waste Fund and ordered the DOE to conduct a complete reassessment of this fee. Spentfuture. The NWPA allows spent nuclear fuel generated in any reactor canto be stored in reactor facility storage pools or in Independent Spent Fuel Storage Installations located at reactors or away from reactor sites. Since May 2014, the DOE reduced the nuclear waste fee to zero. Prior to the elimination of this fee, the annualized pre-tax cost was approximately $30 million.
We have on-site storage facilities that are expected to satisfy the storage needs of Salem 1, Salem 2, Hope Creek, Peach Bottom 2 and Peach Bottom 3 through the end of their operating licenses.
Low LevelLow-Level Radioactive Waste—As a by-product of their operations, nuclear generation units produce low levellow-level radioactive waste. Such waste includes paper, plastics, protective clothing, water purification materials and other materials. These waste materials are accumulated on site and disposed of at licensed permanent disposal facilities. New Jersey, Connecticut and South Carolina have formed the Atlantic Compact, which gives New Jersey nuclear generators continued access to the Barnwell waste disposal facility which is owned by South Carolina. We believe that the Atlantic Compact will provide for adequate low level
low-level radioactive waste disposal for Salem and Hope Creek through the end of their current licenses including full decommissioning, although no assurances can be given. Low LevelLow-Level Radioactive Waste is periodically being shipped to the Barnwell site from Salem and Hope Creek. Additionally, there are on-site storage facilities for Salem, Hope Creek and Peach Bottom, which we believe have the capacity for at least five years of temporary storage for each facility.
Coal Combustion Residuals (CCRs)—In December 2014, the EPA issued a final rule that regulates CCRs as non-hazardous and requires that facility owners implement a series of actions to close or upgrade existing CCR surface impoundments and/or landfills. See Item 8. Financial Statements and Supplementary Data—Note 13. Commitments and Contingent Liabilities for additional information.
In December 2016, the Water Infrastructure Improvements for the Nation Act was enacted, which includes provisions regarding CCRs which allow for implementation of the EPA CCR rule through a state or EPA-based permit program. We believe this will have minimal impact to our operations.
SEGMENT INFORMATION
Financial information with respect to our business segments is set forth in Item 8. Financial Statements and Supplementary Data—Note 23. Financial Information by Business Segment.
EXECUTIVE OFFICERS OF THE REGISTRANT (PSEG) |
| | | | | | |
| | | | | | | |
| Name | | Age as of December 31, 20162018
| | Office | | Effective Date First Elected to Present Position |
| | | | | | | |
| Ralph Izzo | | 5961 | | Chairman of the Board, President and Chief Executive Officer (PSEG) | | April 2007 to present |
| | | | | Chairman of the Board and Chief Executive Officer (PSE&G) | | April 2007 to present |
| | | | | Chairman of the Board and Chief Executive Officer (Power) | | April 2007 to present |
| | | | | Chairman of the Board and Chief Executive Officer (Energy Holdings) | | April 2007 to present |
| | | | | Chairman of the Board and Chief Executive Officer (Services) | | January 2010 to present |
| | | | | | | |
| Daniel J. Cregg | | 5355 | | Executive Vice President and CFO (PSEG) | | October 2015 to present |
| | | | | Executive Vice President and CFO (PSE&G) | | October 2015 to present |
| | | | | Executive Vice President and CFO (Power) | | October 2015 to present |
| | | | | Vice President-Finance (PSE&G) | | June 2013 to October 2015 |
| | | | | Vice President-Finance (Power) | | December 2011 to June 2013 |
| | | | | | | |
William LevisDavid M. Daly | | 60 | | President and Chief Operating Officer (Power) | | June 2007 to present |
| | | | | | |
Ralph LaRossa | | 5357 | | President and Chief Operating Officer (PSE&G) | | October 20062017 to present |
| | | | | Chairman of the Board of PSEG Long Island LLC | | October 2017 to present |
| | | | President and Chief Operating Officer (PSEG Long Island LLC) | | October 2013 to October 2017 |
| | | | | | |
| Ralph A. LaRossa | | 55 | | President and Chief Operating Officer (Power) | | October 2017 to present |
| | | | President and Chief Operating Officer (PSE&G) | | October 2006 to October 2017 |
| | | | Chairman of the Board of PSEG Long Island LLC | | October 2013 to October 2017 |
| | | | | | | |
| Derek M. DiRisio | | 5254 | | President (Services) | | August 2014 to present |
| | | | | Vice President and Controller (PSEG) | | January 2007 to August 2014 |
| | | | | Vice President and Controller (PSE&G) | | January 2007 to August 2014 |
| | | | | Vice President and Controller (Power) | | January 2007 to August 2014 |
| | | | | Vice President and Controller (Energy Holdings) | | January 2007 to August 2014 |
| | | | | Vice President and Controller (Services) | | January 2007 to August 2014 |
| | | | | | | |
| Tamara L. Linde | | 5254 | | Executive Vice President and General Counsel (PSEG) | | July 2014 to present |
| | | | | Executive Vice President and General Counsel (PSE&G) | | July 2014 to present |
| | | | | Executive Vice President and General Counsel (Power) | | July 2014 to present |
| | | | | Vice President - Regulatory (Services) | | December 2006 to July 2014 |
| | | | | | | |
| Stuart J. Black | | 5456 | | Vice President and Controller (PSEG) | | August 2014 to present |
| | | | | Vice President and Controller (PSE&G) | | August 2014 to present |
| | | | | Vice President and Controller (Power) | | August 2014 to present |
| | | | | Vice President (Services) and Assistant Controller (Power) | | March 2010 to August 2014 |
| | | | | | | |
ITEM 1A. RISK FACTORS
The following factors should be considered when reviewing our business. These factors could have a material adverse impact on our business, prospects, financial position, results of operations or cash flows and could cause results to differ materially from those expressed elsewhere in this report.
MARKET AND COMPETITION RISKS
Fluctuations in the wholesale power and natural gas markets could negatively affect our financial condition, results of operations and cash flows.
In the markets where we operate, natural gas prices have a major impact on the price that generators receive for their output. Over the past several years, wholesale prices for natural gas have remained well below the peak levels experienced in 2008, in part due to increased shale gas production as extraction technology has improved. Lower gas prices have resulted in lower electricity prices, which hashave reduced our margins as nuclear and coal generation costs have not declined similarly.
In October 2016, Power determined that it will cease generation operations of the existing coal/gas units at the Hudson and Mercer generating stations on June 1, 2017. The primary factors considered during this process that contributed to the decision to retire these units early include significant declines in revenues and margin caused by the sustained period of depressed wholesale power prices and reduced capacity factors caused by lower natural gas prices making coal generation less economically competitive than natural gas-fired generation. Despite experiencing recent warmer than normal weather in PJM this summer, Power did not experience the usual increase in electricity prices in PJM as it had in past hot summers. This trend has a further adverse economic impact to these units because they generally dispatch and earn energy margin on peak hot and cold days. In addition, the upcoming PJM capacity auction in May 2017 for the capacity period from June 2020 to May 2021 will be the first to require all generating units to meet the increased operating performance standards of PJM’s new capacity performance regulations. During the current annual five-year strategic planning process, Power determined, on October 3, 2016, that the costs to upgrade the existing units at the Hudson and Mercer stations to comply with these higher reliability standards to be too significant and not economic given current market conditions, including anticipated future capacity prices, current forward energy prices and past operational performance results of the units. The decision to retire the Hudson and Mercer units early had and will continue to have a material effect on PSEG’s and Power’s results of operations through the retirement date.
In addition, PSEG and Power continue to monitor their otherremaining coal assets, including the Keystone and Conemaugh generating stations, to ensure their economic viability through the end of their designated useful lives and their continued classification as held for use. The precise timing of a change in useful lives may be dependent upon events out of PSEG’s and Power’s control and may impact our ability to operate or maintain these assets in the future. These generating stations may be impacted by factors such as continued depressed wholesale power prices or capacity factors, among other things. Any early retirement of these coal units before the end of their current estimated useful lives or change in the classification as held for use may have a material adverse impact on PSEG’s and Power’s future financial results.
Low natural gas prices, as well as continuing costs for regulatory compliance and federal and state-level policies that provide credits to renewable energy such as wind and solar, but do not apply to nuclear generating stations, have been a contributing factor to the significantly reduced revenues from nuclear generating stations while simultaneously raising the unit cost of production. If these trends continue or worsen, our nuclear generating units could cease being economically competitive which may cause us to retire such units prior to the end of their useful lives. The costs associated with any such retirement, which may include, among other things, accelerated depreciation and amortization or impairment charges, accelerated asset retirement costs, severance costs and environmental remediation costs, could be material.
We may be unable to obtain an adequate fuel supply in the future.
We obtain substantially all of our physical natural gas coal and nuclear fuel supply from third parties pursuant to arrangements that vary in term, pricing structure, firmness and delivery flexibility. Our fuel supply arrangements must be coordinated with transportation agreements, balancing agreements, storage services, financial hedging transactions and other contracts to ensure that the natural gas coal and nuclear fuel isare delivered to our power plants at the times, in the quantities and otherwise in a manner that meets the needs of our generation portfolio and our customers. We must also comply with laws and regulations governing the transportation of such fuels.
Additionally, the PJM power market has recently experienced an increase in natural gas-fired generation assets that supply electricity to the region. As a result, there has been a corresponding increase in the need for natural gas transportation assets to serve power generation assets. When extreme cold temperatures rapidly increase the demand for natural gas used for residential heating, it can also create constraints on natural gas pipelines that serve power generation assets. When these conditions exist, it could interrupt the fuel supply to our natural gas-fired power plants in the PJM power market.
We are exposed to increases in the price of natural gas coal and nuclear fuel, and it is possible that sufficient supplies to operate our generating facilities profitably may not continue to be available to us. Significant changes in the price of natural gas and nuclear fuel could affect our future results and impact our liquidity needs. In addition, we face risks with regard to the delivery to, and the use of natural gas coal and nuclear fuel by, our power plants including the following:
transportation may be unavailable if pipeline infrastructure is damaged or disabled;
pipeline tariff changes may adversely affect our ability to, or cost to, deliver such fuels;
creditworthiness of third-party suppliers, defaults by third-party suppliers on supply obligations and our ability to replace supplies currently under contract may delay or prevent timely delivery;
market liquidity for physical supplies of such fuels or availability of related services (e.g. storage) may be insufficient or available only at prices that are not acceptable to us;
variation in the quality of such fuels may adversely affect our power plant operations;
legislative or regulatory actions or requirements, including those related to pipeline integrity inspections, may increase the cost of such fuels;
fuel supplies diverted to residential heating may limit the availability of such fuels for our power plants; and
the loss of critical infrastructure, terrorist attacks (including cybersecurity breaches) or catastrophic events such as fires, earthquakes, explosions, floods, severe storms or other similar occurrences could impede the delivery of such fuels.
Our nuclear facilitiesunits have a diversified portfolio of contracts and certaininventory that provide a substantial portion of our fuel raw material needs over the next several years. However, each of our nuclear units has contracted with a single fuel fabrication services provider, and transitioning to an alternative provider could take an extended period of time. Certain of our other generation facilities also require fuel or other services that may only be available from one or a limited number of suppliers. The availability and price of this fuel may vary due to supplier financial or operational disruptions, transportation disruptions and force majeure. At times, such fuel may not be available at any price, or we may not be able to transport it to our facilities on a timely basis. In this case, we may not be able to run those facilities even if it would be profitable. If we had sold forward the
power from such a facility, we could be required to supply or purchase power from alternate sources, perhaps at a loss. This could have a material adverse impact on our business, the financial results of specific plants and on our results of operations.
OurIn 2018, a petition was filed with the U.S. Department of Commerce by two uranium mining companies seeking relief under Section 232 of the Trade Expansion Act of 1962, as amended, from imports of uranium products, alleging that these imports threaten national security. In July 2018, the Secretary of Commerce announced the initiation of an investigation in response to the petition. The relief sought by the petitioners would require U.S. nuclear units have a diversified portfolioreactors to purchase at least 25% of contracts and inventory that provide a substantial portion of our fueltheir uranium needs from domestic mines over the next several years. However, itten years, although the Department of Commerce and ultimately the President will be necessary to enter into additional arrangements to acquiremake an independent determination regarding an appropriate remedy regarding uranium imports and national security. The outcome of this petition could increase nuclear fuel costs in future periods, which would have an adverse impact on the future. results of operations, cash flows and financial positions of our nuclear facilities.
Although our fuel contract portfolio provides a degree of hedging against these market risks, such hedging may not be effective and future increases in our fuel costs could materially and adversely affect our liquidity, financial condition and results of operations. While our generation runs on a mix of fuels, primarily natural gas and nuclear fuel, an increase in the cost of any particular fuel ultimately used could impact our results of operations.
Our inability to balance energy obligations with available supply could negatively impact results.
The revenues provided by the operation of our generating stations are subject to market risks that are beyond our control. Generation output will either be used to satisfy wholesale contract requirements or other bilateral contracts or be sold into competitive power markets. Participants in the competitive power markets are not guaranteed any specified rate of return on their capital investments. Generation revenues and results of operations are dependent upon prevailing market prices for energy, capacity, ancillary services and fuel supply in the markets served. Changes in prevailing market prices could have a material adverse effect on our financial condition and results of operations.
Factors that may cause market price fluctuations include:
increases and decreases in generation capacity, including the addition of new supplies of power as a result of the development of new power plants, expansion of existing power plants or additional transmission capacity;
power transmission or fuel transportation capacity constraints or inefficiencies;
power supply disruptions, including power plant outages and transmission disruptions;
weather conditions, particularly unusually mild summers or warm winters in our market areas;
quarterly and seasonal fluctuations;
economic and political conditions that could negatively impact the demand for power;
changes in the supply of, and demand for, energy commodities;
development of new fuels or new technologies for the production or storage of power;
federal and state regulations and actions of the ISOs; and
federal and state power, market and environmental regulation and legislation, including financial incentives for new renewable energy generation capacity that could lead to oversupply.
Our generation business frequently involves the establishment of forward sale positions in the wholesale energy markets on long-term and short-term bases. To the extent that we have produced or purchased energy in excess of our contracted obligations, a reduction in market prices could reduce profitability. Conversely, to the extent that we have contracted obligations in excess of energy we have produced or purchased, an increase in market prices could reduce profitability. If the strategy we utilize to hedge our exposure to these various risks isor if our internal policies and procedures designed to monitor the exposure to these various risks are not effective, we could incur material losses. Our market positions can also be adversely affected by the level of volatility in the energy markets that, in turn, depends on various factors, including weather in various geographical areas, short-term supply and demand imbalances, customer migration and pricing differentials at various geographic locations. These risks cannot be predicted with certainty.
Increases in market prices also affect our ability to hedge generation output and fuel requirements as the obligation to post margin increases with increasing prices.
PSE&G’s proposed investment programs may not be fully approved by regulators, which could result in lower than desired service levels to customers, and actual capital investment by PSE&G may be lower than planned, which would cause lower than anticipated rate base.
PSE&G is a regulated public utility that operates and invests in an electric T&D system and a gas distribution system as well as certain regulated clean energy investments, including solar and energy efficiency within New Jersey. PSE&G invests in capital projects to maintain and improve its existing T&D system and to address various public policy goals and meet customer
expectations. Transmission projects are subject to review in the FERC-approved PJM transmission expansion process while distribution and clean energy projects are subject to approval by the BPU. We cannot be certain that any proposed project will be approved as requested or at all. In particular, PSE&G is currently seeking approval for a number of investment programs from the BPU including our ES II, a proposed five-year $2.5 billion program to harden, modernize and make our electric and gas distribution systems more resilient; and our proposed CEF program, a six-year estimated $3.6 billion investment program focused on achieving New Jersey’s EE targets, supporting EV infrastructure, deploying ES, and implementing an EC program. If these programs and other programs that PSE&G may file from time to time are only approved in part, or not at all, or if the approval fails to allow for the timely recovery of all of PSE&G’s costs, including a return of, or on, its investment, PSE&G will have a lower than anticipated rate base, thus causing its future earnings to be lower than anticipated. If these programs are not approved, that could also adversely affect our service levels for customers. Further, the BPU could take positions to exclude or limit utility participation in certain areas, such as renewable generation, energy efficiency, electric vehicle infrastructure and energy storage, which would limit our relationship with customers and narrow our future growth prospects.
We face significant competition in the wholesale energy and capacity markets.
Our wholesale power and marketing businesses are subject to significant competition that may adversely affect our ability to make investments or sales on favorable terms and achieve our business objectives. Increased competition could contribute to a reduction in prices offered for power and could result in lower earnings.earnings and cash flows. Decreased competition could negatively impact results through a decline in market liquidity. Regulatory, environmental, industry and other operational developments will have a significant impact on our ability to compete in energy and capacity markets, potentially resulting in erosion of our market share and impairment in the value of our power plants. Recently, certain states have taken, or are considering taking, actions to subsidize or otherwise provide economic support to renewables, energy efficiency initiatives and existing, uneconomic generation facilities that could adversely affect capacity and energy prices. Increased generation supply and lower energy prices due to these subsidies could have an adverse impact on our results of operations.
The introduction or expansion of technologies related to energy generation, distribution and consumption and changes in customer usage patterns and could adversely impact us.
The power generation business has seen a substantial change in the technologies used to produce power. Newer generation facilities are often more efficient than aging facilities, which may put some of these older facilities at a competitive disadvantage to the extent newer facilities are able to consume the same or less fuel to achieve a higher level of generation output. Federal and state incentives for the development and production of renewable sources of power hashave allowed for the penetration of competing technologies, such as wind, solar, and commercial-sized power storage. Additionally, the development of DSM tools and practices can impact peak demand requirements for some of our markets at certain times during the year. The continued development of subsidized, competing power generation technologies and significant development of DSM tools and practices could alter the market and price structure for power generation and could result in a reduction in load requirements, negatively impacting our financial condition, results of operations and cash flows. Additionally, technologicalTechnological advances driven by federal laws mandating new levels of energy efficiency in end-use electric devices or other improvements in, or applications of, technology could also lead to declines in per capita energy consumption.
Advances in distributed generation technologies, such as fuel cells, micro turbines, micro grids, windmills and net-metered solar installations, may reduce the cost of alternative methods of producing electricity to a level that is competitive with that of most central station electric production. Large customers, such as universities and hospitals, continue to explore potential micro grid installation. Certain states, such as Massachusetts and California, are also considering mandating the use of power storage resources to replace uneconomic or retiring generation facilities. Such developments could (i) affect the price of energy, (ii) reduce energy deliveries as customer-owned generation becomes more cost-effective, (iii) require further improvements to our distribution systems to address changing load demands, and (iv) make portions of our transmission and/or distribution facilities obsolete prior to the end of their useful lives. SuchThese technologies could also result in further declines in commodity prices or demand for delivered energy.
Some or all of these factors could result in a lack of growth or decline in customer demand for electricity or number of customers, and may cause us to fail to fully realize anticipated benefits from significant capital investments and expenditures, which could have a material adverse effect on our financial position, results of operations and cash flows. These factors could also materially affect our results of operations, cash flows or financial positions through, among other things, reduced operating revenues, increased operating and maintenance expenses, and increased capital expenditures, as well as potential asset impairment charges or accelerated depreciation and decommissioning expenses over shortened remaining asset useful lives.
Economic downturns would likely have a material adverse effect on our businesses.
Our results of operations may be negatively affected by sustained downturns or sluggishness in the economy, including low levels in the market prices for power, generation capacity and natural gas, which can fluctuate substantially. Increased unemployment of residential customers and decreased demand for products and services provided by commercial and industrialC&I customers resulting from an economic downturn could lead to declines in the demand for energy and an increase in the number of uncollectible
customer balances, which would negatively impact our overall sales and cash flows. Although our utility
business is subject to regulated allowable rates of return, overall declines in electricity and gas sold could materially adversely affect our financial condition, results of operations and cash flows. Additionally, prolonged economic downturns that negatively impact our financial condition, results of operations and cash flows could result in future material impairment charges to write down the carrying value of certain assets to their respective fair values.
We are subject to third-party credit risk relating to our sale of generation output and purchase of fuel.
We sell generation output and buy fuel through the execution of bilateral contracts. We also seek to contract in advance for a significant proportion of our anticipated output capacity and fuel needs. These contracts are subject to credit risk, which relates to the ability of our counterparties to meet their contractual obligations to us. Any failure of these counterparties to perform by these counterparties could require Power to purchase or sell energy or fuel in the wholesale markets at less favorable prices and incur additional losses, which could have a material adverse impact on our results of operations, cash flows and financial position. In the spot markets, we are exposed to the risks of the default sharing mechanisms that exist in those markets, some of which attempt to spread the risk across all participants. Therefore, a default by a third party could increase our costs, which could negatively impact our results of operations and cash flows.
Financial market performance directly affects the asset values of our nuclear decommissioning trust funds(NDT) Fund and defined benefit plan trust funds. Market performance and other factors could decrease the value of trust assets and could result in the need for significant additional funding.
The performance of the financial markets will affect the value of the assets that are held in trust to satisfy our future obligations under our defined benefit plans and to decommission our nuclear generating plants. A decline in the market value of our nuclear decommissioning trust fundsNDT Fund could increase Power’s funding requirements to decommission its nuclear plants. A decline in the market value of the defined benefit plan trust funds could increase our pension and other postretirement benefit (OPEB) plan funding requirements. The market value of our trusts could be negatively impacted by decreases in the rate of return on trust assets, decreased interest rates used to measure the required minimum funding levels and future government regulation. Additional funding requirements for our defined benefit plans could be caused by changes in required or voluntary contributions, an increase in the number of employees becoming eligible to retire and changes in life expectancy assumptions. Increased costs could also lead to additional funding requirements for our decommissioning trust. Failure to adequately manage our investments in our nuclear decommissioning trustNDT Fund and defined benefit plan trusts could result in the need for us to make significant cash contributions in the future to maintain our funding at sufficient levels, which would negatively impact our results of operations, cash flows and financial position.
REGULATORY, LEGISLATIVE AND LEGAL RISKS
PSE&G’s revenues, earnings and results of operations are dependent upon state laws and regulations that affect distribution and related activities.
PSE&G is subject to regulation by the BPU. Such regulation affects almost every aspect of its businesses, including its retail rates, and failure to comply with these regulations could have a material adverse impact on PSE&G’s ability to operate its business and could result in fines, penalties or sanctions. The retail rates for electric and gas distribution services are established in a base rate caseproceeding and remain in effect until a new base rate caseproceeding is filed and concluded. As a result of our Energy Strong Order, we are required to file our next distribution base rate case proceeding no later than November 1, 2017. In addition, our utility has received approval for several clause recovery mechanisms, some of which provide for recovery of costs and earn returns on authorized investments. These clause mechanisms require periodic updates to be reviewed and approved by the BPU and are subject to prudency reviews. Inability to obtain fair or timely recovery of all our costs, including a return of, or on, our investments in rates, could have a material adverse impact on our results of operations and cash flows. In addition, if legislative and regulatory structures were to evolve in such a way that PSE&G’s exclusive rights to serve its regulated customers were eroded, its future earnings could be negatively impacted.
Efforts designed to promote and expand the use of energy efficiency measures and distributed generation technologies, such as rooftop solar and battery storage, in PSE&G’s service territories could result in customers leaving the electric distribution system and an increase in customer net energy metering. Over time, customer adoption of these and other technologies and increased energy efficiency could adversely impact PSE&G’s revenue and ability to fully recover theits costs, which could require PSE&G to pursue a rate caseproceeding to adjust revenue requirements or seek recovery though other mechanisms.
The BPU also conducts periodic combined management/competitive service audits of New Jersey utilities related to affiliate standard requirements, competitive services, cross-subsidization, cost allocation and other issues. A finding by the BPU of non-compliance with these requirements could result in fines, a reduction in PSE&G’s authorized base rate or the disallowance of the recovery of certain costs, which could have a materiallymaterial adverse impact on our business, results of operations and cash flows.
In addition, PSE&G procures the supply requirements of its default service BGSS gas customers through a full-requirements contract with Power. Government officials, legislators and advocacy groups are aware of the affiliation between PSE&G and Power. In periods of rising utility rates, those officials and advocacy groups may question or challenge costs and transactions
incurred by PSE&G with Power, irrespective of any previous regulatory processes or approvals underlying those transactions. The occurrence of such challenges may subject Power to a level of scrutiny not faced by other unaffiliated competitors in those markets and could adversely affect retail rates received by PSE&G in an effort to offset any perceived benefit to Power from the affiliation.
PSE&G periodically files base rate case proceedings. Such proceedings are at times contentious, lengthy and subject to appeal, which could lead to uncertainty as to the ultimate results and which could introduce time delays in effectuating rate changes.
PSE&G periodically files base rate case proceedings with the BPU. These proceedings typically involve multiple parties, including governmental bodies and officials, consumer advocacy groups and various consumers of energy, who have differing concerns but who have the common objective of limiting rate increases or even reducing rates. The proceedings generally have timelines that may not be limited by statute. Decisions are subject to appeal, potentially leading to additional uncertainty associated with the approval proceedings. The potential duration of such proceedings creates a risk that rates ultimately approved by the applicable regulatory body may not be sufficient for PSE&G to recover its costs by the time the rates become effective. Established rates are also subject to subsequent reviews by state regulators, whereby various portions of rates could be adjusted, including recovery mechanisms for costs associated with the procurement of electricity or gas, bad debt, MGPmanufactured gas plant (MGP) remediation, smart grid infrastructure and energy efficiency, demand response and renewable energy programs. If thefuture base rate case proceeding isproceedings are protracted or resultsresult in approved rates that do not allow PSE&G to fully recover its costs or result in ROEs that are below historical levels, our financial condition, results of operations and cash flows would be materially adversely impacted. Our next distribution base rate case proceeding is required to be filed no later than November 1, 2017.
We are subject to comprehensive federal regulation that affects, or may affect, our businesses.
We are subject to regulation by federal authorities. Such regulation affects almost every aspect of our businesses, including management and operations; the terms and rates of transmission services; investment strategies; the financing of our operations and the payment of dividends. Failure to comply with these regulations could have a material adverse impact on our ability to operate our business and could result in fines, penalties or sanctions.
Recovery of wholesale transmission rates—PSE&G’s wholesale transmission rates are regulated by FERC and are recovered through a FERC-approved formula rate. The revenue requirements are reset each year through this formula. In addition, transmission ROEs have recently become the target of certain state utility commissions, municipal utilities, consumer advocates and consumer groups seeking to lower customer rates. These agencies and groups have filed complaints with FERC asking to reduce the base ROE of various transmission owners. They point to changes in the capital markets as justification for lowering the ROE of these companies. While we are not the subject of any of these complaints, they could set a precedent for FERC-regulated transmission owners, such as PSE&G. Inability to obtain fair or timely recovery of all our costs, including a return of or on our investments in rates, could have a material adverse impact on our business.
NERC Compliance—Mandatory NERC, at the direction of FERC, has implemented mandatory NERC Operations and Critical Infrastructure ProtectionCIP standards have been established to ensure the reliability of the U.S. Bulk Electric System, which includes electric transmission and generation systemsystems, and to prevent major system black-outs. NERC CIP standards establish cybersecurity and physical security protections for critical systems and facilities. We have been, and will continue to be, periodically audited by NERC for compliance and are subject to penalties for non-compliance with applicable NERC standards. An audit of PSE&G’s compliance with CIP physical and cybersecurity standards was performed in the fourth quarter of 2018, the results of which are under review. We cannot determine what actions, if any, NERC or FERC may take. Failure to comply with such standards could result in penalties or increased costs to bring such facilities into compliance. Such penalties and costs, as well as lost revenue from prolonged outages required to bring facilities into compliance with these standards, could materially adversely impact our business, results of operations and cash flows.
Market-Based Rate (MBR)MBR Authority and Other Regulatory Approvals—Under FERC regulations, public utilities that wish to sell power at market rates must receive MBR Authority before making power sales, and the majority of our businesses operate with such authority. Failure to maintain MBR authorization, or the effects of any severe mitigation measures that may be required if market power was evaluated differently in the future, could have a material adverse effect on our business, financial condition and results of operations.
In December 2016, the PSEG companies with MBR Authority filed their triennial market power analysis as required by FERC regulations. A FERC order on the PSEG companies’ triennial filing is expected in the third quarter 2017.
Oversight by the Commodity Futures Trading Commission (CFTC)CFTC relating to derivative transactions—The CFTC has regulatory oversight of the swap and futures markets and options, including energy trading, and licensed futures professionals such as brokers, clearing members and large traders. Changes to regulations or adoption of additional regulations by the CFTC, including any regulations relating to position limits on futures and other derivatives or margin for derivatives and increased investigations by the CFTC, could negatively impact Power’s ability to hedge its portfolio in an efficient, cost-effective manner by, among other things, potentially decreasing liquidity in the forward commodity and derivatives markets or limiting Power’s ability to utilize non-cash collateral for derivatives transactions.
We may also be required to obtain various other regulatory approvals to, among other things, buy or sell assets, engage in
transactions between our public utility and our other subsidiaries, and, in some cases, enter into financing arrangements, issue securities and allow our subsidiaries to pay dividends. Failure to obtain these approvals on a timely basis could materially adversely affect our results of operations and cash flows.
Our ownership and operation of nuclear power plants involve regulatory risks as well as financial, environmental and health and safety risks.
Approximately half of our total generation output each year is provided by our nuclear fleet. For this reason, we are exposed to risks related to the continued successful operation of our nuclear facilities and issues that may adversely affect the nuclear generation industry. TheseIn addition to the risk of retirement discussed below, risks associated with the operation of nuclear facilities include:
Storage and Disposal of Spent Nuclear Fuel—Federal law requires the DOE to provide for the permanent storage of spent nuclear fuel but the DOE has not yet begun accepting spent nuclear fuel. Until a federal site is available, we use on-site storage for spent nuclear fuel, which is reimbursed by the DOE. However, future capital expenditures may be required to increase spent fuel storage capacity at our nuclear facilities. Once a federal site is available, the DOE may impose fees to support a permanent repository. In addition, the on-site storage for spent nuclear fuel may significantly increase the decommissioning costs of our nuclear units.
Regulatory and Legal Risk—We may be required to substantially increase capital expenditures or operating or decommissioning costs at our nuclear facilities to the extent there is a change in the Atomic Energy Act or the applicable regulations, trade controls or the environmental rules and regulations applicable to nuclear facilities; a modification, suspension or revocation of licenses issued by the NRC; the imposition of civil penalties for failure to comply with the Atomic Energy Act, related regulations, trade controls or the terms and conditions of the licenses for nuclear generating facilitiesfacilities; or the shutdown of one of our nuclear facilities. Any such event could have a material adverse effect on our financial position or results of operations.
Operational Risk—Operations at any of our nuclear generating units could degrade to the point where the affected unit needs to be shut down or operated at less than full capacity. If this were to happen, identifying and correcting the causes may require significant time and expense. In April 2016, during a scheduled refueling outage at Salem Unit 1, a visual inspection revealed degradation to a number of bolts inside the reactor vessel. The required bolt replacement significantly extended the duration of the outage. We expect to continue to inspect and replace degraded bolts at both Salem units over the next several refueling outage cycles and are developing a strategy to maintain the long-term health of both reactor vessel internals. Any significant outages could result in reduced earnings as we would need to purchase or generate higher-priced energy to meet our contractual obligations.
In addition, if a stationunit cannot be operated through the end of its current estimated useful life, our results of operations could be adversely affected by increased depreciation rates, impairment charges and accelerated future decommissioning costs.
Nuclear Incident or Accident Risk—Accidents and other unforeseen problems have occurred at nuclear stations, both in the U.S. and elsewhere. The consequences of an accident can be severe and may include loss of life, significant property damage and/or a change in the regulatory climate. We have nuclear units at two sites. It is possible that an accident or other incident at a nuclear generating unit could adversely affect our ability to continue to operate unaffected units located at the same site, which would further affect our financial condition, results of operations and cash flows. An accident or incident at a nuclear unit not owned by us could also affect our ability to continue to operate our units. Any resulting financial impact from a nuclear accident may exceed our resources, including insurance coverages. Further, as a licensed nuclear operator subject to the Price-Anderson Act and a member of a nuclear industry mutual insurance company, Power is subject to potential retroactive assessments as a result of aan industry nuclear incident or retroactiveretrospective premiums due to adverse industry loss experience.experience and such assessments may be material.
In the event of non-compliance with applicable legislation, regulation and licenses, the NRC may increase regulatory oversight, impose fines, and/or shut down a unit, depending on its assessment of the severity of the non-compliance. If a serious nuclear incident were to occur, our business, reputation, financial condition and results of operations could be materially adversely affected. In each case, the amount and types of insurance commercially available to cover losses that might arise in connection with the operation of our nuclear fleet are limited and may be insufficient to cover any costs we may incur.
Decommissioning—NRC regulations require that licensees of nuclear generating facilities demonstrate reasonable assurance that funds will be available to decommission the facility at the end of its useful life. PSEG Nuclear has established an NDT Fund to satisfy these obligations. However, forecasting trust fund investment earnings and costs to decommission nuclear generating stations requires significant judgment, and actual results could differ significantly from current estimates. If we determine that it is necessary to retire one of our nuclear generating stations before the end of its useful life, there is a risk that it will no longer meet the NRC minimum funding requirements due to the earlier commencement of decommissioning activities and a shorter time period over which the NDT investments could appreciate in value. A shortfall could require PSEG to post parental guarantees or make additional cash contributions to ensure that the NDT Fund continues to satisfy the NRC minimum funding requirements. As a result, our financial position or cash flows could be significantly adversely affected.
There is no assurance that our New Jersey nuclear plants will be selected to participate in the Zero Emission Certificate (ZEC) program. Absent a material financial change, failure of any of these plants to be selected would result in the retirement of all of these nuclear plants.
In May 2018, the governor of New Jersey signed legislation, referred to as the ZEC legislation, that recognizes that nuclear power is a critical component of New Jersey’s clean energy portfolio and an important element of a diverse energy generation portfolio that currently meets approximately 40 percent of New Jersey’s electric power needs. The ZEC legislation creates a ZEC program to be administered by the BPU.
In December 2018, Power submitted applications to the BPU for the Salem 1 and 2 and Hope Creek nuclear plants. As required, Power’s three applications each included a certification pursuant to which Power confirmed that each of the Salem 1, Salem 2 and Hope Creek plants will cease operations within three years absent a material financial change. Power’s submittal further attested that the nuclear plants are not expected to cover their costs and operating and market risks as defined in the ZEC legislation, absent a material financial change.
In the event that any of the Salem 1, Salem 2 and Hope Creek plants is not selected to receive ZEC payments in April 2019 by the BPU and do not otherwise experience a material financial change, Power will take all necessary steps to retire all of these plants at or prior to their refueling outages scheduled for the Fall 2019 in the case of Hope Creek, Spring 2020 in the case of Salem 2 and Fall 2020 in the case of Salem 1. Alternatively, if all of the Salem 1, Salem 2 and Hope Creek plants are selected to receive ZEC payments in April 2019 but the financial condition of the plants is materially adversely impacted by potential changes to the capacity market construct being considered by FERC (absent sufficient capacity revenues provided under a program approved by the BPU in accordance with a FERC authorized capacity mechanism), Power would still take all necessary steps to retire all of these plants. The costs and accounting charges associated with any such retirement, which may include, among other things, accelerated depreciation and amortization or impairment charges, potential penalties associated with the early termination of capacity obligations and fuel contracts, accelerated asset retirement costs, severance costs, environmental remediation costs and, in certain circumstances, potential additional funding of the NDT Fund, would be material to both PSEG and Power.
We may be adversely affected by changes in energy regulatory policies, including energy and capacity market design rules and developments affecting transmission.
The energy industry continues to be regulated and the rules to which our businesses are subject are always at risk of being changed, particularly in light of the change in administration following the 2016 U.S. presidential election.changed. Our business has been impacted by established rules that create locational capacity markets in each of PJM, ISO-NE and NYISO. Under these rules, generators located in constrained areas are paid more for their capacity so there is an incentive to locate in those areas where generation capacity is most needed. Because much of our generation has historically been located in constrained areas in PJM and ISO-NE, the existence of these rules has had a positive impact on our revenues. PJM’s locational capacity market
design rules and ISO-NE’s forward capacity marketFCM rules have been challenged in court and continue to evolve.evolve, most recently in response to efforts to integrate public policy initiatives into the wholesale markets. Any changes to these rules may have an adverse impact on our financial condition, results of operations and cash flows.
In 2011, New Jersey enacted a law that provided for the construction of subsidized electric power generation. While this legislation was subsequently invalidated as unconstitutional, future state actions in New Jersey and elsewhere to subsidize the construction of new generation could have the effect of artificially depressing prices in the competitive wholesale market on both a short-term and long-term basis.
We could also be impacted by a number of other events, including regulatory or legislative actions such as direct and indirect subsidies, favoring non-competitive marketscertain types of resources and/or technologies and energy efficiency and demand response initiatives.technologies. Further, some of the market-based mechanisms in which we participate, including BGS auctions, are at times the subject of review or discussion by some of the participants in the New Jersey and federal regulatory and political arenas. We can provide no assurance that these mechanisms will continue to exist in their current form, nor otherwise be modified.
To the extent that additions to the transmission system relieve or reduce congestion in eastern PJM where most of our plants are located, Power’s capacity and energy revenues could be adversely affected. Moreover, through changes encouraged by FERC to transmission planning processes, or through RTO/ISO initiatives to change their planning processes, such as the recently accepted multi-driver project category in PJM, more transmission may ultimately be built to facilitate renewable generation or support other public policy initiatives. Any such addition to the transmission system could have a material adverse impact on our financial condition and results of operations.
We are subject to numerous federal, state and local environmental laws and regulations that may significantly limit or affect our businesses, adversely impact our business plans or expose us to significant environmental fines and liabilities.
We are subject to extensive federal, state and local environmental laws and regulations regarding air quality, water quality, site remediation, land use, waste disposal, the impact on global climate, natural resources damages and other matters. These laws and regulations affect the manner in whichhow we conduct our operations and make capital expenditures. We expect there will beThere have been a number of recent changes to existing environmental laws and regulations particularly in light of the change in administration following the 2016 U.S. presidential election.and this trend may continue. Changes in these laws, or violations of laws, could result in significant increases in our compliance costs, capital expenditures to bring our facilities into compliance, operating costs for remediation and clean-up actions, civil penalties or damages from actions brought by third parties for alleged health or property damages. Any such increase in our costs could have a material impact on our financial condition, results of operations and cash flows and could require further economic review to determine whether to continue operations or decommission an affected facility. We may also be unable to successfully recover certain of these cost increases through our existing regulatory rate structures, in the case of PSE&G, or our contracts with our customers, in the case of Power.
Environmental laws and regulations have generally become more stringent over time, and this trend is likely to continue. In particular:
Concerns over global climate change could result in laws and regulations to limit CO2 emissions or other GHG emissions produced by our fossil generation facilities—Federal and state legislation and regulation designed to address global climate change through the reduction of GHG emissions could materially impact our fossil generation facilities. For example, in 20152018 the EPANJDEP published new rules that establish a mechanism for both new and existing power plants. We may be requiredNew Jersey to incur significant costs to comply with these regulations and to continue operation ofre-enter the RGGI. This will have cost implications for our fossil generation facilities, which could include the potential need to purchase CO2 emission allowances.facilities. Such expenditures could materially affect the continued economic viability of one or more such facilities.
In addition to legislative and regulatory initiatives, the outcome of certain legal proceedings regarding alleged impacts of global climate change not involving us could be material to the future liability of energy companies. If relevant federal or state common law were to develop that imposed liability upon those that emit GHGs for alleged impacts of GHGs emissions, such potential liability to our fossil generation operations could be material.
Potential closed-cycle cooling requirements—In 2014, the EPA finalized rules regarding the regulation of cooling water intake structures. The EPA did not mandate closed cycle cooling as the BTA. Instead, the EPA set a fish impingement mortality standard that relies on a technology-based approach. The EPA has structured the rule so that each state will continue to consider renewal permits for existing power facilities on a case by case basis. In connection with the assessment of the BTA of each facility that seeks permit renewal, theThe rule requires that facilities seeking permit renewals conduct a wide range of studies related to impingement mortality and entrainment and submit the results with their permit applications. State actions to renew permits under the provisions of this rule are ongoing at this time.
If the NJDEP or the CTEEPConnecticut Department of Energy and Environmental Protection were to require installation of closed-cycle cooling or its equivalent at any of our Salem, Bridgeport Sewaren or New Haven generating stations, the related increased costs and impacts would be material to our financial position, results of operations and cash flows and would require further economic review to determine whether to continue operations or decommission any such station.
Remediation of environmental contamination at current or formerly-owned facilities—We are subject to liability under environmental laws for the costs of remediating environmental contamination of property now or formerly owned by us and of property contaminated by hazardous substances that we generated. Remediation activities associated with our former Manufactured Gas Plant (MGP)MGP operations are one source of such costs. In addition, the historic operations of our companies and the operations of numerous other companies along the Passaic and Hackensack Rivers are alleged by Federal and State agencies to have discharged substantial contamination into the Passaic River/Newark Bay Complex in violation of various statutes. The EPA is also evaluating the Hackensack River, a tributary to Newark Bay, for inclusion in the Superfund program. We are also involved in a number of proceedings relating to sites where other hazardous substances may have been discharged and may be subject to additional proceedings in the future, the related costs of which could have a material adverse effect on our financial condition, results of operations and cash flows. New Jersey law places affirmative obligations on us to investigate and, if necessary, remediate contaminated property upon which we were in any way responsible for a discharge of hazardous substances, impacting the speed by which we will need to investigate contaminated properties, which could adversely impact cash flows. We cannot predict what further actions, if any, or the costs or the timing thereof, that may be required with respect to these or other natural resource damages claims. However, exposure to natural resource damages could subject us to additional potentially material liability. For a discussion of these and other environmental matters, see Item 8. Financial Statements and Supplementary Data—Note 13.14. Commitments and Contingent Liabilities.
We may not receive necessary licenses and permits in a timely manner or at all, which could adversely impact our business and results of operations.
We must periodically apply for licenses and permits from various regulatory authorities, including environmental regulatory authorities, and abide by their respective orders. Delay in obtaining, or failure to obtain and maintain, any permits or approvals, including environmental permits or approvals, or delay in or failure to satisfy any applicable regulatory requirements, could:
prevent construction of new facilities,
limit or prevent continued operation of existing facilities,
limit or prevent the sale of energy from these facilities, or
result in significant additional costs,
each of which could materially affect our business, financial condition, results of operations and cash flows. In addition, the process of obtaining licenses and permits from regulatory authorities may be delayed or defeated by concerted community opposition and such delay or defeat could have a material effect on our business.
We cannot predict the outcome of any legal, regulatory or other proceeding, settlement, investigation or claim relating to our business activities. An adverse determination could negatively impact our financial condition, results of operations and cash flows.
From time to time we are involved in legal, regulatory and other proceedings or claims arising out of our business operations, the most significant of which are summarized in Item 8. Financial Statements and Supplementary Data—Note 13. Commitments and Contingent Liabilities. Adverse outcomes
in any of these proceedings could require significant expenditures that could have a material adverse effect on our financial condition, results of operations and cash flows.
In particular, as previously disclosed, Power has discovered that it incorrectly calculated certain components of its cost-based bids for its New Jersey fossil generating units in the PJM energy market. Upon discovery of the errors, PSEG retained outside counsel to assist in the conduct of an investigation into the matter and self-reported the errors to FERC, PJM and the PJM Independent Market Monitor (IMM). FERC Staff initiated a preliminary, non-public staff investigation into the matter, which is ongoing. We are unable to reasonably estimate the range of possible loss for this matter; however, the amounts of potential disgorgement and other potential penalties that Power may incur span a wide range depending on the success of PSEG’s legal arguments. If we do not prevail in whole or in part with FERC or in a judicial challenge that we may choose to pursue, it is likely that Power would record additional losses and that such additional losses would be material to our results of operations.
Changes in tax law and regulation and the inherent difficulty in quantifying potential tax effects of business decisions could negatively impact our results of operations and cash flows.
There existsThe Tax Act made significant changes to U.S. tax law. Among other things, the statutory U.S. corporate income tax rate decreased from a maximum of 35% to 21%, effective January 1, 2018, and certain changes were made to bonus depreciation and interest disallowance rules. However, the Tax Act is unclear in certain respects and will require interpretations and the implementation of regulations by the Internal Revenue Service (IRS), as well as state taxing authorities. Further, the Tax Act could be subject to potential for comprehensive tax reform in the U.S. that may significantly change the tax rules applicable to domestic businesses, including changes that may impact investment incentives, deductions for depreciation, interest or otherwise,amendments and dividends.technical corrections. We cannot assess what the overall effect ofimpact that any such potential legislationinterpretations, regulations, amendments or corrections could behave on our results of operations or cash flows. financial condition.
In 2018 the IRS issued a Notice of Proposed Rulemaking (Notice) regarding the application of tax depreciation rules and issued proposed regulations addressing the interest disallowance rules. However, certain aspects of the Notice and proposed regulations are unclear; therefore, we recorded taxes based on our interpretation of the relevant statutes. These interpretations are subject to change based on several factors including, but not limited to, the IRS issuing final guidance and/or further clarification. We are subject to the provisions of the Financial Accounting Standards Board Accounting Standards Codification 740, Income Taxes, which require that the effect on deferred tax assets and liabilities of a change in tax rates be recognized in the period the tax rate change was enacted. The impact of the rate change in 2017’s financial statements is discussed in Item 8. Note 21. Income Taxes.
In addition, we are required to make judgments in order to estimate our obligations to taxing authorities. These tax obligations include income, real estate, sales and use and employment-related taxes. These judgments can include reserves for potential adverse outcomes regarding tax positions that have been taken that could be subject to challenge by the tax authorities. If our actual tax obligations materially differ from our estimated obligations, our results of operations and cash flows could be materially adversely affected.
OPERATIONAL RISKS
Because PSEG is a holding company, its ability to meet its corporate funding needs, service debt and pay dividends could be limited.
PSEG is a holding company with no material assets other than the stock or membership interests of its subsidiaries. Accordingly, all of the operations of PSEG are conducted by its subsidiaries, which are separate and distinct legal entities that have no obligation, contingent or otherwise, to pay the debt of PSEG or to make any funds available to PSEG to pay such debt or satisfy its other corporate funding needs. These corporate funding needs include PSEG’s operating expenses, the payment of interest on and principal of its outstanding indebtedness and the payment of dividends on its capital stock. As a result, PSEG can give no assurances that its subsidiaries will be able to transfer funds to PSEG to meet all of these obligations.
Lack of growth or slower growth in the number of customers, or a decline in customer demand, could adversely impact our financial condition, results of operations and cash flows.
Growth in customer accounts and growth of customer usage each directly influence the demand for electricity and the need for additional generation, transmission and distribution facilities. Customer growth and customer usage may be affected by a number of factors, including:
the impacts of economic downturns, including increased unemployment and less demand from C&I customers;
regulatory incentives to reduce energy consumption;
mandated energy efficiency measures;
demand-side managementDSM tools;
technological advances; and
a shift in the composition of our customer base from commercial and industrialC&I customers to residential customers.
Some or all of these factors could result in a lack of growth or decline in customer demand for electricity and may prevent us from fully realizing the benefits from significant capital investments and expenditures, which could have a material adverse effect on our financial position, results of operations and cash flows.
There may be periods when Power may not be able to meet its commitments under forward sale obligations at a reasonable cost or at all.
A substantial portion of Power’s generation output has been sold forward under fixed price power sales contracts and Power also sells forward the output from its intermediate and peaking facilities when it deems it commercially advantageous to do so.
Our forward sales of energy and capacity assume sustained, acceptable levels of operating performance. This is especially important at our lower-cost facilities. Operations at any of our plants could degrade to the point where the plant has to shut down or operate at less than full capacity. Some issues that could impact the operation of our facilities are:
breakdown or failure of equipment, information technology, processes or management effectiveness;
disruptions in the transmission of electricity;
labor disputes or work stoppages;
fuel supply interruptions;
transportation constraints;
limitations which may be imposed by environmental or other regulatory requirements; and
operator error, terrorist attacks (including cybersecurity breaches) or catastrophic events such as fires, earthquakes, explosions, floods, severe storms or other similar occurrences.
Identifying and correcting any of these issues may require significant time and expense. Depending on the materiality of the issue, we may choose to close a plant rather than incur the expense of restarting it or returning it to full capacity.
Because the obligations under most of these agreements are not contingent on a unit being available to generate power, Power is generally required to deliver power to the buyer, even in the event of a plant outage, fuel supply disruption or a reduction in the available capacity of the unit. To the extent that Power does not have sufficient lower cost capacity to meet its commitments under its forward sale obligations, Power would be required to supply replacement power either by running its other higher cost power plants or by obtaining power from third-party sources at market prices that could substantially exceed the contract price. This could have a material adverse effect on our financial condition, results of operations and cash flows. If Power fails to deliver the contracted power, it would be required to pay the difference between the market price at the delivery point and the contract price, and the amount of such payments could be substantial.
In addition, as market prices for energy and fuel fluctuate, our forward energy sale and forward fuel purchase contracts could require us to post substantial additional collateral, thus requiring us to obtain additional sources of liquidity during periods when our ability to do so may be limited.
Certain of our generation facilities rely on transmission facilities that we do not own or control and that may be subject to transmission constraints. Our inability to maintain adequate transmission capacity could restrict our ability to deliver wholesale electric power to our customers and we may either incur additional costs or foregoforgo revenues. Conversely, improvements to certain transmission systems could also reduce revenues.
We depend on transmission facilities owned and operated by others to deliver the wholesale power we sell from our generation facilities. If transmission is disrupted or if the transmission capacity infrastructure is inadequate, our ability to sell and deliver wholesale power may be adversely impacted. If a region’s power transmission infrastructure is inadequate, our recovery of wholesale costs and profits may be limited. If restrictive transmission price regulation is imposed, the transmission companies may not have sufficient incentive to invest in expansion of transmission infrastructure. We also cannot predict whether transmission facilities will be expandedinvest in specific markets to accommodate competitive access to those markets.
In addition, in certain of the markets in which we operate, energy transmission congestion may occur and we may be deemed responsible for congestion costs if we schedule delivery of power between congestion zones during times when congestion occurs between the zones. If we were liable for such congestion costs, our financial results could be adversely affected.
A portion of our generation is located in load pockets. Expansion ofInvestment in transmission systems to reduce or eliminate these load pockets could negatively impact the value or profitability of our existing generation facilities in these areas.
Inability to successfully develop, obtain regulatory approval for, or construct generation, transmission and distribution projects could adversely impact our businesses.
Our business plan calls for extensive investment in capital improvements and additions, including the installation of required environmental upgrades and retrofits; construction and/or acquisition of additional generation units and transmission and distributionT&D facilities; and modernizing existing infrastructure pursuant to investment programs entitled to current recovery. Currently, we have several significant projects underway or being contemplated.
The successful construction and development of these projects will depend, in part, on our ability to:
obtain necessary governmental and regulatory approvals;
obtain environmental permits and approvals;
obtain community support for such projects to avoid delays in the receipt of permits and approvals from regulatory authorities;
complete such projects within budgets and on commercially reasonable terms and conditions;
obtain any necessary debt financing on acceptable terms and/or necessary governmental financial incentives;
ensure that contracting parties, including suppliers, perform under their contracts in a timely and cost effective manner; and
at PSE&G, recover the related costs through rates.
Any delays, cost escalations or otherwise unsuccessful construction and development could materially affect our financial position, results of operations and cash flows. Further, any unexpected failure of our existing facilities, including failure associated with breakdowns, forced outages or any unanticipated capital expenditures could result in reduced profitability. Modifications to existing facilities may require us to install the best available control technology or to achieve the lowest achievable emission rates required by then-current regulations, which would likely result in substantial additional capital expenditures.
In addition, the successful operation of new or upgraded generation facilities or transmission or distribution projects is subject to risks relating to supply interruptions; work stoppages and labor disputes; weather interferences; unforeseen engineering and environmental problems, including those related to climate change; and the other risks described herein. Any of these risks could cause our return on these investments to be lower than expected or they could cause these facilities to operate below expected capacity or availability levels, which would adversely impact our financial condition and results of operations through lost revenue, increased expenses, higher maintenance costs and penalties.
FERC Order 1000 has generally opened transmission development to competition from independent developers, allowing such developers to compete with incumbent utilities for the construction and operation of transmission facilities in its service territory. While Order 1000 retains limited carve-outs for certain projects that will continue to default to incumbents for construction responsibility, including immediately needed reliability projects, upgrades to existing transmission facilities, projects cost-allocated to a single transmission zone, and projects being built on existing rights-of-way and whose construction would interfere with incumbents’ use of their rights-of-way, increased competition for transmission projects could decrease the value of new investments that would be subject to recovery by PSE&G under its rate base, which could have a material adverse impact on our financial condition and results of operations. In addition, certain PJM cost allocation determinations have been
recently challenged at FERC, the resolution of which could impact costs borne by New Jersey ratepayers and increase customer bills.
In January 2018, the governor of New Jersey signed Executive Order No. 8 directing the BPU to begin the process of moving the state toward its 2030 goal of 3,500 MW of offshore wind energy generation. An initial solicitation was established for 1,100 MW of offshore wind, with bids due in December. In connection with the bid submitted by Ocean Wind, LLC, a wholly owned subsidiary of Ørsted US Offshore Wind, referred to as the Ocean Wind project, PSEG agreed to provide energy management services and the potential lease of land for use in project development. We also retained an option to acquire an equity interest in the project. If the Ocean Wind bid is successful and PSEG elects to acquire an equity interest, PSEG would be required to incur additional capital expenditures. The amount of such capital expenditures, if any, cannot be determined at this time.
We may be adversely affected by equipment failures, accidents, severe weather events or other incidents that impact our ability to provide safe and reliable service to our customers and remain competitive and could result in substantial financial losses.
The success of our businesses is dependent on our ability to continue providing safe and reliable service to our customers while minimizing service disruptions. We are exposed to the risk of equipment failures, accidents, severe weather events, or other incidents which could result in damage to or destruction of our facilities or damage to persons or property. For instance, equipment failures in our natural gas distribution could give rise to a variety of hazards and operating risks, such as leaks, accidental explosions and mechanical problems, which could cause substantial financial losses and harm our reputation.
In addition, the physical risks of severe weather events, such as experienced from Hurricane Irene and Superstorm Sandy, and of climate change, changes in sea level, temperature and precipitation patterns and other related phenomena have further exacerbated these risks. Such issues experienced at our facilities, or by others in our industry, could adversely impact our revenues; increase costs to repair and maintain our systems; subject us to potential litigation and/or damage claims, fines/penalties; and increase the level of oversight of our utility and generation operations and infrastructure through investigations or through the imposition of additional regulatory or legislative requirements. Such actions could adversely affect our costs, competitiveness and future investments, which could be material to our financial position, results of operations and cash flow. For our transmission and distributionT&D business, the cost of storm restoration efforts may not be fully recoverable through the regulatory process. In addition, the inability to restore power to our customers on a timely basis could also materially damage our reputation.
We own less than a controlling interest in some of our generating facilities.
We have limited control over the operation of some of our generating facilities, including the Keystone, Conemaugh and Peach Bottom facilities, because our investments represent less than a controlling interest. We seek to exert a degree of influence with respect to the management and operation of projects in which we own less than a controlling interest by negotiating to obtain positions on management committees or to receive certain limited governance rights. However, we may not always succeed in such negotiations. As a result, we may be dependent on our partners to operate such facilities. The approval of our partners also may be required for us to transfer our interest in such projects. Reliance on our partners for the management and operation of these facilities could result in a lower return on these facilities than what we believe we could have otherwise achieved.
Any inability to recover the carrying amount of our long-lived assets and leveraged leases could result in future impairment charges which could have a material adverse impact on our financial condition and results of operations.
Long-lived assets represent approximately 74%76%, 79%82% and 70% of the total assets of PSEG, PSE&G and Power, respectively, as of December 31, 2016.2018. Management evaluates long-lived assets for impairment whenever events or changes in circumstances, such as significant adverse changes in regulation, business climate or market conditions, including prolonged periods of adverse commodity and capacity prices, could potentially indicate an asset’s or group of assets’ carrying amount may not be recoverable. Significant reductions in our expected revenues or cash flows for an extended period of time resulting from such events could result in future asset impairment charges, which could have a material adverse impact on our financial condition and results of operations.
Energy Holdings has investments in domestic energy and real estate assets subject primarily to leveraged lease accounting. A leveraged lease is typically comprised of an investment by an equity investor and debt provided by a third-party debt investor. As an equity investor, Energy Holdings’ equity investments in the leases are comprised of the total expected lease receivables over the lease terms plus the estimated residual values at the end of the lease terms, reduced for any income not yet earned on the leases. Our receipt of payments related to our leveraged lease portfolio in accordance with the lease contracts can be impacted by various factors, including new environmental legislation regarding air quality and other discharges in the process of generating electricity; market prices for fuel and electricity, including the impact of low gas prices on our Powerton coal generation investments;investment; overall financial condition of lease counterparties; and the quality and condition of assets under lease.
During the third quarter of 2016, in connection with Energy Holdings’ annual review of estimated residual values embedded in the NRG REMA, LLC (REMA) leveraged leases, it was determined that the revised residual value estimates for such leases were lower than the recorded residual values and the decline was deemed to be other than temporary due to the adverse economic conditions experienced by coal generation in PJM. As a result, a pre-tax write-down of $137 million was reflected in Operating Revenues in the quarter ended September 30, 2016. During the fourth quarter of 2016, Energy Holdings recorded a $10 million pre-tax charge reflecting its best estimate of loss as a result of the current liquidity issues facing REMA.
In addition, REMA’s parent company, GenOn Energy, Inc. (GenOn), reported in August 2016 that it did not expect to have sufficient liquidity to repay their senior unsecured notes due in June 2017. Although all lease payments are current, PSEG cannot predict the outcome of GenOn’s efforts to restructure its portfolio and improve its liquidity and the possible related
impact on REMA. PSEG continues to monitor any changes to REMA’s and GenOn’s status and potential impacts on Energy Holdings’ lease investments, which could include further write-downs of the values of Energy Holdings’ leveraged leases.
There can be no assurance that a continuation or worsening of the adverse economic conditions would not lead to additional write-downs at any of our other generation units in our leveraged lease portfolio, and such write-downs could be material.
Inability to maintain sufficient liquidity in the amounts and at the times needed or access sufficient capital at reasonable rates or on commercially reasonable terms could adversely impact our business.
Funding for our investments in capital improvement and additions, scheduled payments of principal and interest on our existing indebtedness and the extension and refinancing of such indebtedness has been provided primarily by internally-generated cash flow and external financings. We have significant capital requirements and depend on our ability to generate cash in the future from our operations and continued access to capital and credit markets to efficiently fund our cash flow needs. Our ability to generate cash flow is dependent upon, among other things, industry conditions and general economic, financial, competitive, legislative, regulatory and other factors. The ability to arrange financing and the costs of such financing depend on numerous factors including, among other things.
general economic and capital market conditions;
the availability of credit from banks and other financial institutions;
tax, regulatory and securities law developments;
for PSE&G, our ability to obtain necessary regulatory approvals for the incurrence of additional indebtedness;
investor confidence in us and our industry;
our current level of indebtedness and compliance with covenants in our debt agreements;
the success of current projects and the quality of new projects;
our current and future capital structure;
our financial performance and the continued reliable operation of our business; and
maintenance of our investment grade credit ratings.
Market disruptions, such as economic downturns experienced in the U.S. and abroad in recent years, the bankruptcy of an unrelated energy company, changes in market prices for electricity and gas, and actual or threatened terrorist attacks, may increase our cost of borrowing or adversely affect our ability to access capital. As a result, no assurance can be given that we will be successful in obtaining financing for projects and investments, to extend or refinance maturing debt or for our other cash
flow needs on acceptable terms or at all, which could materially adversely impact our financial position, results of operations and future growth.
In addition, if Power were to lose its investment grade credit rating from S&P or Moody’s, it would be required under certain agreements to provide a significant amount of additional collateral in the form of letters of credit or cash, which would have a material adverse effect on our liquidity and cash flows.
We may be unable to realize anticipated tax benefits or retain existing tax credits.
The deferred tax assets and tax credits of PSEG, PSE&G or Power are evaluated for ultimate ability to realize these assets. A valuation allowance may be recorded against the deferred tax assets if we estimate that such assets are more likely than not to be unrealizable based on available evidence including cumulative and forecasted pretaxpre-tax book earnings at the time the estimate is made. A valuation allowance related to deferred tax assets or the monetization of tax credits can be affected by changes to tax laws, statutory tax rates and future taxable income levels. In the event that we determine that we would not be able to realize all or a portion of our deferred tax assets in the future or the benefit of tax credits, we would reduce such amounts through a charge to income tax expense in the period in which that determination was made, which could have a material adverse impact on our financial condition and results of operations.
Challenges associated with recruitment and/or retention of key executives and a skilled workforce could adversely impact our businesses.
Our operations depend on the recruitment and retention of key executives and a skilled workforce. The loss or retirement of key executives or other employees, including those with the specialized knowledge required to support our generation transmission and distributionT&D operations, could result in various operational challenges. Certain events, such as the potential for early retirement of our nuclear facilities, can make it more difficult to retain these employees. We may incur increased costs for contractors to replace employees, and the loss of institutional and industry knowledge and the increased costs to hire and lengthy time to train new personnel could result in lower productivity, resulting in increased costs, which would negatively impact our results of operations. This has the potential to become more critical as a growing number of employees become eligible to retire.
As of December 31, 2016,2018, approximately 62%73% of our employees were covered by collective bargaining agreements. As a result, our success will depend on our ability to successfully renegotiate these agreements as they expire. Inability to do so may result
in employee strikes or work stoppages which would disrupt our operations and could also result in increased costs, all of which could have a material adverse effect on our business, financial condition, results of operations and cash flows.
Covenants in our debt instruments may adversely affect our operations.
PSEG’s, PSE&G’s and Power’s debt instruments contain events of default customary for financings of their type, including cross accelerations to other debt of that entity and, in the case of PSEG’s and Power’s bank credit agreements, certain change of control events. Power’s bank credit agreements and outstanding notes also contain limitations on the incurrence of subsidiary debt and liens and certain of Power’s outstanding notes require Power to repurchase such notes upon certain change of control events. Our ability to comply with these covenants may be affected by events beyond our control. If we fail to comply with the covenants and are unable to obtain a waiver or amendment, or a default exists and is continuing under such debt, the lenders or the holders or trustee of such debt, as applicable, could give notice and declare outstanding borrowings and other obligations under such debt immediately due and payable. We may not be able to obtain waivers, amendments or alternative financing, or if obtainable, it could be on terms that are not acceptable to us. Any of these events could adversely impact our financial condition, results of operations and cash flows.
Cybersecurity attacks or intrusions could adversely impact our businesses.
Cybersecurity threats to the U.S. energy market infrastructure are increasing in sophistication, magnitude and frequency. We own and/rely on information technology systems that utilize sophisticated digital systems and network infrastructure to operate our generation and T&D systems. We also store sensitive data, intellectual property and proprietary or operate generating stationspersonally identifiable information regarding our business, employees, shareholders, customers and transmissionvendors on our systems and distribution facilities, all of which are dependent onconduct power marketing and hedging activities. In addition, the operation of our information technology systems. Our ability to market our generation output and acquire and hedge fuel and power are alsobusiness is dependent on ourupon the information technology systems as well as information technology systems owned and operated byof third parties, such asincluding our vendors, regulators, RTOs and ISOs, and RTOs.among others. Our and third-party information technology systems may be impacted byvulnerable to cybersecurity attacks or hostile technological intrusions involving domestic or foreign sources (including nation states and special interest groups) or inadvertent disclosure of company and/or customer information.sources. A cybersecurity attack may also leverage such information technology to cause disruptions at a third party. Cybersecurity threatsimpacts to our operations include:
disruption of the operation of our assets, the fuel supply chain and the power grid,
theft of confidential company, employee, shareholder, vendor or customer information, which may cause us to be in breach of certain covenants and contractual obligations,
general business system and process interruption or compromise, including preventing us from servicing our customers, collecting revenues or the ability to record, process and/or report financial information correctly, and
breaches of vendors’ infrastructures where our confidential information is stored.
We and our third-party vendors have experiencedbeen and expect tolikely will continue to experience actual orbe subject to attempted cyber-attacks on our information technology systems. However, none of these actual or attempted cyber-attackscybersecurity attacks. While there has had abeen no material impact on our business or operations or financial condition. Iffrom these attempted attacks, if a significant cybersecurity event or breach should occur within our company or with one of our material vendors, we could (i) experience disruptionsbe exposed to our business, property damage, theft of unauthorized access to customer or other information; (ii) experience significant loss of revenue, or incur material costs for repair remediation and breach notification and increased capital and operating costs to implementintellectual and physical property, significant fines and penalties for non-compliance with existing laws and regulations, significant litigation costs, increased security measures;costs to finance our businesses, damage to our reputation and (iii) be subject to increased regulation, litigationloss of confidence from our customers, regulators, investors, vendors and reputational damage.employees. Similarly, a significant cybersecurity event or breach experienced by a competitor, regulatory authority, RTO, ISO, or ISOvendor could also materially impact our business and results of operations. Experiencingoperations via enhanced legal and regulatory requirements. For a discussion of state and federal cybersecurity incident could also cause us to be non-compliant with applicable lawsregulatory requirements and regulations, including those promulgated by the NRC and NERG, or contracts that require us to securely maintain confidential data, causing us to incur costs related to legal claims or proceedings, regulatory fines and increased scrutiny and possible damage toinformation regarding our reputation and brand, resulting in a reduction in customer confidence. cybersecurity program, see Item 1. Business—Regulatory Issues.
The market for cybersecurity insurance is relatively new and coverage available for cybersecurity events may evolve as the industry matures. While we maintain insurance relating to cybersecurity events, such insurance is subject to a number of exclusions and may be insufficient to offset any losses, costs or damage we experience.
Acts of war or terrorism could adversely affect our operations.
Our businesses and industry may be impacted by acts and threats of war or terrorism. These actions could result in increased political, economic and financial and insurance market instability and volatility in power and fuel markets, which could materially adversely affect our business and results of operations, including our ability to access capital on terms and conditions acceptable to us. In addition, our infrastructure facilities, such as our generating stations, transmission and distributionT&D facilities and information technology systems, could be direct or indirect targets or be affected by terrorist or other criminal activity. Such events could severely disrupt our business operations and prevent us from servicing our customers. New or updated security regulations may require us to make changes to our current measures which could also result in additional expenses.
ITEM 1B. UNRESOLVED STAFF COMMENTS
PSEG, PSE&G and Power
None.
None.
ITEM 2. PROPERTIES
Our subsidiaries own all of our physical property. We believe that we and our subsidiaries maintain adequate insurance coverage against loss or damage to plants and properties, subject to certain exceptions, to the extent such property is usually insured and insurance is available at a reasonable cost. For a discussion of nuclear insurance, see Item 8. Financial Statements and Supplementary Data—Note 13.14. Commitments and Contingent Liabilities.
Generation Facilities
Power
As of December 31, 2016,2018, Power’s share of installed fossil and nuclear generating capacity is shown in the following table: |
| | | | | | | | | | | | | | |
| | | | | | | | | | | | | |
| | Name | | Location | | Total Capacity (MW) | | % Owned | | Owned Capacity (MW) | | Principal Fuels Used | |
| | Steam: | | | | | | | | | | | |
| | Hudson (A) | | NJ | | 565 |
| | 100% | | 565 |
| | Coal/Gas | |
| | Mercer (A) | | NJ | | 632 |
| | 100% | | 632 |
| | Coal/Gas | |
| | Sewaren | | NJ | | 445 |
| | 100% | | 445 |
| | Gas | |
| | Keystone (B) | | PA | | 1,711 |
| | 23% | | 391 |
| | Coal | |
| | Conemaugh (B) | | PA | | 1,711 |
| | 23% | | 385 |
| | Coal | |
| | Bridgeport Harbor | | CT | | 383 |
| | 100% | | 383 |
| | Coal | |
| | New Haven Harbor | | CT | | 448 |
| | 100% | | 448 |
| | Oil/Gas | |
| | Total Steam | | | | 5,895 |
| | | | 3,249 |
| | | |
| | Nuclear: | | | | | | | |
| | | |
| | Hope Creek | | NJ | | 1,172 |
| | 100% | | 1,172 |
| | Nuclear | |
| | Salem 1 & 2 | | NJ | | 2,296 |
| | 57% | | 1,318 |
| | Nuclear | |
| | Peach Bottom 2 & 3 (C) | | PA | | 2,450 |
| | 50% | | 1,225 |
| | Nuclear | |
| | Total Nuclear | | | | 5,918 |
| | | | 3,715 |
| | | |
| | Combined Cycle: | | | | | | | |
| | | |
| | Bergen | | NJ | | 1,229 |
| | 100% | | 1,229 |
| | Gas/Oil | |
| | Linden | | NJ | | 1,230 |
| | 100% | | 1,230 |
| | Gas/Oil | |
| | Bethlehem | | NY | | 757 |
| | 100% | | 757 |
| | Gas | |
| | Kalaeloa | | HI | | 208 |
| | 50% | | 104 |
| | Oil | |
| | Total Combined Cycle | | | | 3,424 |
| | | | 3,320 |
| | | |
| | Combustion Turbine: | | | | | | | | | | | |
| | Essex | | NJ | | 81 |
| | 100% | | 81 |
| | Gas/Oil | |
| | Kearny | | NJ | | 456 |
| | 100% | | 456 |
| | Gas/Oil | |
| | Burlington | | NJ | | 168 |
| | 100% | | 168 |
| | Gas/Oil | |
| | Linden | | NJ | | 336 |
| | 100% | | 336 |
| | Gas/Oil | |
| | New Haven Harbor | | CT | | 129 |
| | 100% | | 129 |
| | Gas/Oil | |
| | Bridgeport Harbor | | CT | | 17 |
| | 100% | | 17 |
| | Oil | |
| | Total Combustion Turbine | | | | 1,187 |
| | | | 1,187 |
| | | |
| | Pumped Storage: | | | | | | | |
| | | |
| | Yards Creek (D) | | NJ | | 420 |
| | 50% | | 210 |
| | | |
| | Total Power Plants | | | | 16,844 |
| | | | 11,681 |
| | | |
| | | | | | | | | | | | | |
|
| | | | | | | | | | | | | | |
| | | | | | | | | | | | | |
| | Name | | Location | | Total Capacity (MW) | | % Owned | | Owned Capacity (MW) | | Principal Fuels Used | |
| | Steam: | | | | | | | | | | | |
| | Keystone (A) | | PA | | 1,711 |
| | 23% | | 391 |
| | Coal | |
| | Conemaugh (A) | | PA | | 1,711 |
| | 23% | | 385 |
| | Coal | |
| | Bridgeport Harbor | | CT | | 383 |
| | 100% | | 383 |
| | Coal | |
| | New Haven Harbor | | CT | | 448 |
| | 100% | | 448 |
| | Oil/Gas | |
| | Total Steam | | | | 4,253 |
| | | | 1,607 |
| | | |
| | Nuclear: | | | | | | | |
| | | |
| | Hope Creek | | NJ | | 1,173 |
| | 100% | | 1,173 |
| | Nuclear | |
| | Salem 1 & 2 | | NJ | | 2,278 |
| | 57% | | 1,308 |
| | Nuclear | |
| | Peach Bottom 2 & 3 (B) | | PA | | 2,450 |
| | 50% | | 1,225 |
| | Nuclear | |
| | Total Nuclear | | | | 5,901 |
| | | | 3,706 |
| | | |
| | Combined Cycle: | | | | | | | |
| | | |
| | Keys (C) | | MD | | 761 |
| | 100% | | 761 |
| | Gas | |
| | Bergen | | NJ | | 1,229 |
| | 100% | | 1,229 |
| | Gas/Oil | |
| | Linden | | NJ | | 1,300 |
| | 100% | | 1,300 |
| | Gas/Oil | |
| | Sewaren 7 (D) | | NJ | | 538 |
| | 100% | | 538 |
| | Gas/Oil | |
| | Bethlehem | | NY | | 815 |
| | 100% | | 815 |
| | Gas | |
| | Kalaeloa | | HI | | 208 |
| | 50% | | 104 |
| | Oil | |
| | Total Combined Cycle | | | | 4,851 |
| | | | 4,747 |
| | | |
| | Combustion Turbine: | | | | | | | | | | | |
| | Essex | | NJ | | 81 |
| | 100% | | 81 |
| | Gas/Oil | |
| | Kearny | | NJ | | 456 |
| | 100% | | 456 |
| | Gas/Oil | |
| | Burlington | | NJ | | 168 |
| | 100% | | 168 |
| | Gas/Oil | |
| | Linden | | NJ | | 336 |
| | 100% | | 336 |
| | Gas/Oil | |
| | New Haven Harbor | | CT | | 130 |
| | 100% | | 130 |
| | Gas/Oil | |
| | Bridgeport Harbor | | CT | | 17 |
| | 100% | | 17 |
| | Oil | |
| | Total Combustion Turbine | | | | 1,188 |
| | | | 1,188 |
| | | |
| | Pumped Storage: | | | | | | | |
| | | |
| | Yards Creek (E) | | NJ | | 420 |
| | 50% | | 210 |
| | | |
| | Total Power Plants | | | | 16,613 |
| | | | 11,458 |
| | | |
| | | | | | | | | | | | | |
| |
| (A) | In October 2016, Power determined that it would cease generation operations of the existing coal/gas units at the Hudson and Mercer generating stations on June 1, 2017. See Item 8. Financial Statements and Supplementary Data—Note 3. Early Plant Retirements for additional information. |
| |
(B) | Operated by GenOn Northeast Management Company. |
| |
(C)(B) | Operated by Exelon Generation. |
| |
| (C) | Commenced commercial operation in mid-2018. |
| |
| (D) | Commenced commercial operation in mid-2018, replacing our 100%-owned steam generation Sewaren Units 1 through 4 that had a 445 MW capacity. |
| |
| (E) | Operated by Jersey Central Power & Light Company. |
As of December 31, 2016,2018, Power also owned and operated 326414 MW dc of photovoltaicPV solar generation facilities in various states.
PSE&G
Primarily all of PSE&G’s property is located in New Jersey and PSE&G’s First and Refunding Mortgage, which secures the bonds issued thereunder, constitutes a direct first mortgage lien on substantially all of PSE&G’s property. PSE&G’s electric lines and gas mains are located over or under public highways, streets, alleys or lands, except where they are located over or under property owned by PSE&G or occupied by it under easements or other rights. PSE&G deems these easements and other rights to be adequate for the purposes for which they are being used.
Electric Property and Facilities
As of December 31, 20162018, PSE&G’s electric transmission and distributionT&D system included approximately 24,000 circuit miles, and 851,000855,000 poles, of which 65%64% are jointly-owned. In addition, PSE&G owns and operates 4752 switching stations with an aggregate installed capacity of 30,03737,378 megavolt-amperes (MVA) and 246244 substations with an aggregate installed capacity of 8,1798,228 MVA. Four of those substations, having an aggregate installed capacity of 109 MVA are operated on leased property. In addition, PSE&G owns four electric distribution headquarters and five electric sub-headquarters.
Gas Property and Facilities
As of December 31, 2016,2018, PSE&G’s gas system included approximately 18,000 miles of gas mains, 12 gas distribution headquarters, two sub-headquarters, and one meter shop serving all of its gas territory in New Jersey. In addition, PSE&G operates 6158 natural gas metering and regulating stations, of which 2522 are located on land owned by customers or natural gas pipeline suppliers and are operated under lease, easement or other similar arrangement. In some instances, the pipeline companies own portions of the metering and regulating facilities. PSE&G also owns one liquefied natural gas (LNG) and three liquid petroleum air gas (LPG) peaking facilities. The daily gas capacity of these peaking facilities (the maximum daily gas delivery available during the three peak winter months) is approximately 2.8 million therms in the aggregate.
Solar
As of December 31, 2016,2018, PSE&G had 123122 MW dc of installed PV solar capacity throughout New Jersey.
ITEM 3. LEGAL PROCEEDINGS
We are party to various lawsuits and environmental and regulatory matters, including in the ordinary course of business. For information regarding material legal proceedings, other than those discussed below, see Item 1. Business—Regulatory Issues and Environmental Matters and Item 8. Financial Statements and Supplementary Data—Note 13.14. Commitments and Contingent Liabilities.
Ewing Explosion
In 2014, pursuant to an existing contract, PSE&G assigned Henkels and McCoy (Henkels) to replace the electrical service at a home in the South Fork Townhouse Community in Ewing Township, Mercer County, New Jersey. As Henkels began work to install new electric service, a gas explosion occurred in the townhouse community resulting in damage to numerous properties, personal injuries and one fatality.
Twenty-two lawsuits have been filed to date relating to the gas explosion, of which PSE&G was named as a defendant in nineteen cases. To date, six of these cases have resolved through private negotiations and/or mediation. In one of the remaining pending matters, plaintiffs representing the estate of the decedent are seeking damages under the New Jersey Wrongful Death Act and the New Jersey Survivors Act as well as punitive damages. PSE&G has denied all allegations of liability. We intend to continue to vigorously defend these lawsuits. At this stage of the litigation, we are unable to determine or predict the ultimate outcome of any of the remaining lawsuits. Henkels has agreed to indemnify PSE&G for all compensatory damages awarded as a result of this incident unless it is proven that PSE&G is solely responsible. Any award for punitive damages against PSE&G would not be covered by such indemnity.
Environmental Matters
The following items are environmental matters involving governmental authorities not discussed elsewhere in this Form 10-K. We do not expect expenditures for any such site relating to the items listed below, individually or for all such current sites in the aggregate, to have a material effect on our financial condition, results of operations or net cash flows.
| |
(1) | Claim by the EPA, Region III, under CERCLA with respect to the Cottman Avenue Superfund Site, a former non-ferrous scrap reclamation facility located in Philadelphia, Pennsylvania, owned and formerly operated by Metal Bank of America, Inc. PSE&G, other utilities and the former and current site owners are alleged to be liable for contamination at the site and PSE&G has been named as a Potentially Responsible Party (PRP). The EPA approved the Final Revised Remedial Design for the Site in early 2008. This document presented the design details of the EPA’s selected remedy. PSE&G and other utility companies as members of a PRP group entered into a Consent Decree and agreed to implement the negotiated EPA selected remedy. The EPA settled its claims against the site owners who did not join the Consent Decree to implement the remedy. The PRP group’s implementation of the remedy was completed in 2010; however, an additional estimated cost of $200,000 was incurred by PSE&G in 2016 to repair part of the remedy. Although the PRP Group has not received a formal Certification of Completion of the Remedy from the EPA, the PRP Group does not anticipate further significant costs at this time. Although subject to EPA approval and oversight, long-term monitoring, operations, and maintenance activities are anticipated through 2018 at a total estimated cost to PSE&G of $200,000. |
| |
(2) | The EPA sent PSE&G, Power and approximately 157 other entities a notice that the EPA considered each of the entities to be a PRP with respect to contamination in Berry’s Creek in Bergen County, New Jersey and requesting that the PRPs perform a Remedial Investigation and Feasibility Study (RI/FS) on Berry’s Creek and the connected tributaries and wetlands. Berry’s Creek flows through approximately 6.5 miles of areas that have been used for a variety of industrial purposes and landfills. The EPA estimates that the study could cost approximately $18 million. As members of a PRP Group, Power and certain of the other entities named in the EPA Notice entered into an Administrative Settlement Agreement and Order on Consent in 2008 to conduct the RI/FS, which is estimated to be completed in 2017/2018. |
| |
(3) | In January 2010, we, as the current owner of the Gates Construction Corporation Landfill, received a letter from the NJDEP asserting that the subject landfill has not been properly closed in accordance with the NJDEP Solid Waste Regulations. Power has retained an environmental consultant to prepare a closure plan acceptable to the NJDEP. |
ITEM 4. MINE SAFETY DISCLOSURES
Not applicable.
PART II
ITEM 5. MARKET FOR REGISTRANT’S COMMON EQUITY, RELATED STOCKHOLDER MATTERS AND ISSUER PURCHASES OF EQUITY SECURITIES
Our common stock is listed on the New York Stock Exchange, Inc. under the trading symbol “PEG.” As of February 17, 2017,15, 2019, there were 63,71858,399 registered holders.
The following graph below shows a comparison of the five-year cumulative return assuming $100 invested on December 31, 20112013 in our common stock and the subsequent reinvestment of quarterly dividends, the S&P Composite Stock Price Index, the Dow Jones Utilities Index and the S&P Electric Utilities Index.
|
| | | | | | | | | | | | | | | | | | | | | | | | | | |
| | | | | | | | | | | | | | | |
| | | | 2011 | | 2012 | | 2013 | | 2014 | | 2015 | | 2016 | |
| | PSEG | | $ | 100.00 |
| | $ | 96.96 |
| | $ | 106.03 |
| | $ | 142.26 |
| | $ | 138.12 |
| | $ | 162.47 |
| |
| | S&P 500 | | $ | 100.00 |
| | $ | 115.93 |
| | $ | 153.39 |
| | $ | 174.30 |
| | $ | 176.76 |
| | $ | 197.77 |
| |
| | DJ Utilities | | $ | 100.00 |
| | $ | 101.59 |
| | $ | 114.46 |
| | $ | 149.35 |
| | $ | 144.84 |
| | $ | 170.94 |
| |
| | S&P Electrics | | $ | 100.00 |
| | $ | 101.24 |
| | $ | 114.61 |
| | $ | 147.63 |
| | $ | 140.53 |
| | $ | 163.20 |
| |
| | | | | | | | | | | | | | | |
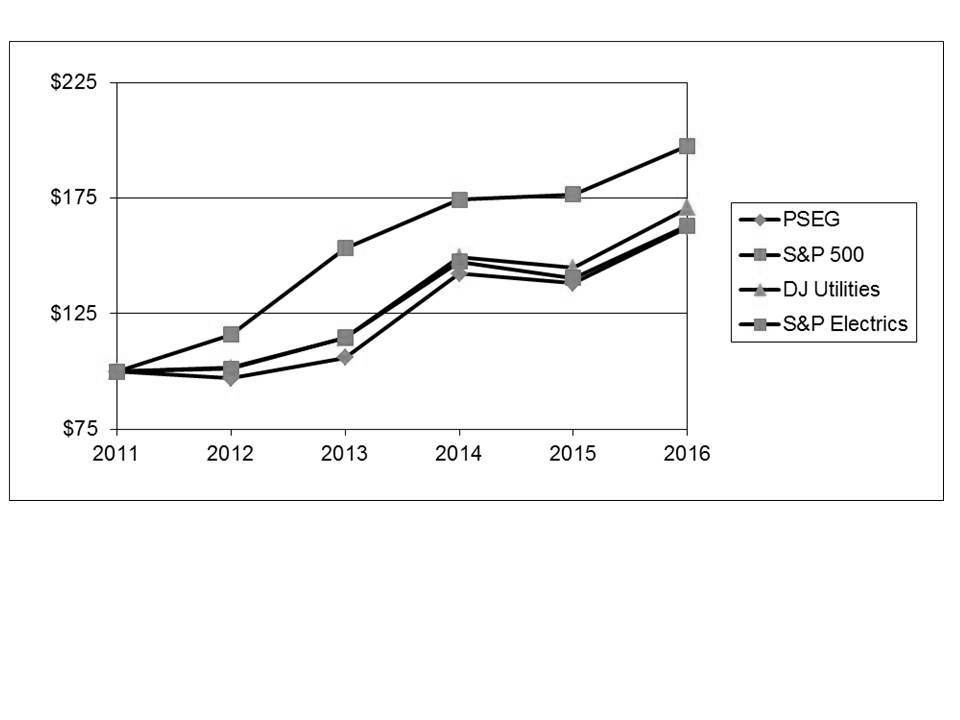
|
| | | | | | | | | | | | | | | | | | | | | | | | | | |
| | | | | | | | | | | | | | | |
| | | | 2013 | | 2014 | | 2015 | | 2016 | | 2017 | | 2018 | |
| | PSEG | | $ | 100.00 |
| | $ | 134.36 |
| | $ | 130.62 |
| | $ | 153.85 |
| | $ | 187.34 |
| | $ | 196.09 |
| |
| | S&P 500 | | $ | 100.00 |
| | $ | 113.68 |
| | $ | 115.24 |
| | $ | 129.02 |
| | $ | 157.17 |
| | $ | 150.27 |
| |
| | DJ Utilities | | $ | 100.00 |
| | $ | 130.65 |
| | $ | 126.65 |
| | $ | 149.67 |
| | $ | 169.65 |
| | $ | 173.01 |
| |
| | S&P Electrics | | $ | 100.00 |
| | $ | 128.98 |
| | $ | 122.73 |
| | $ | 142.72 |
| | $ | 160.00 |
| | $ | 166.57 |
| |
| | | | | | | | | | | | | | | |
The following table indicates the high and low sale prices for our common stock and dividends paid for the periods indicated:
|
| | | | | | | | | | | | | | |
| | | | | | | | | |
| | Common Stock | | High | | Low | | Dividend per Share | |
| | |
| | 2016 | | | | | | | |
| | First Quarter | | $ | 47.22 |
| | $ | 37.85 |
| | $ | 0.41 |
| |
| | Second Quarter | | $ | 47.41 |
| | $ | 42.77 |
| | $ | 0.41 |
| |
| | Third Quarter | | $ | 46.81 |
| | $ | 41.07 |
| | $ | 0.41 |
| |
| | Fourth Quarter | | $ | 44.29 |
| | $ | 39.28 |
| | $ | 0.41 |
| |
| | 2015 | | | | | | | |
| | First Quarter | | $ | 44.45 |
| | $ | 39.00 |
| | $ | 0.39 |
| |
| | Second Quarter | | $ | 43.97 |
| | $ | 38.93 |
| | $ | 0.39 |
| |
| | Third Quarter | | $ | 43.91 |
| | $ | 38.16 |
| | $ | 0.39 |
| |
| | Fourth Quarter | | $ | 44.18 |
| | $ | 36.80 |
| | $ | 0.39 |
| |
| | | | | | | | | |
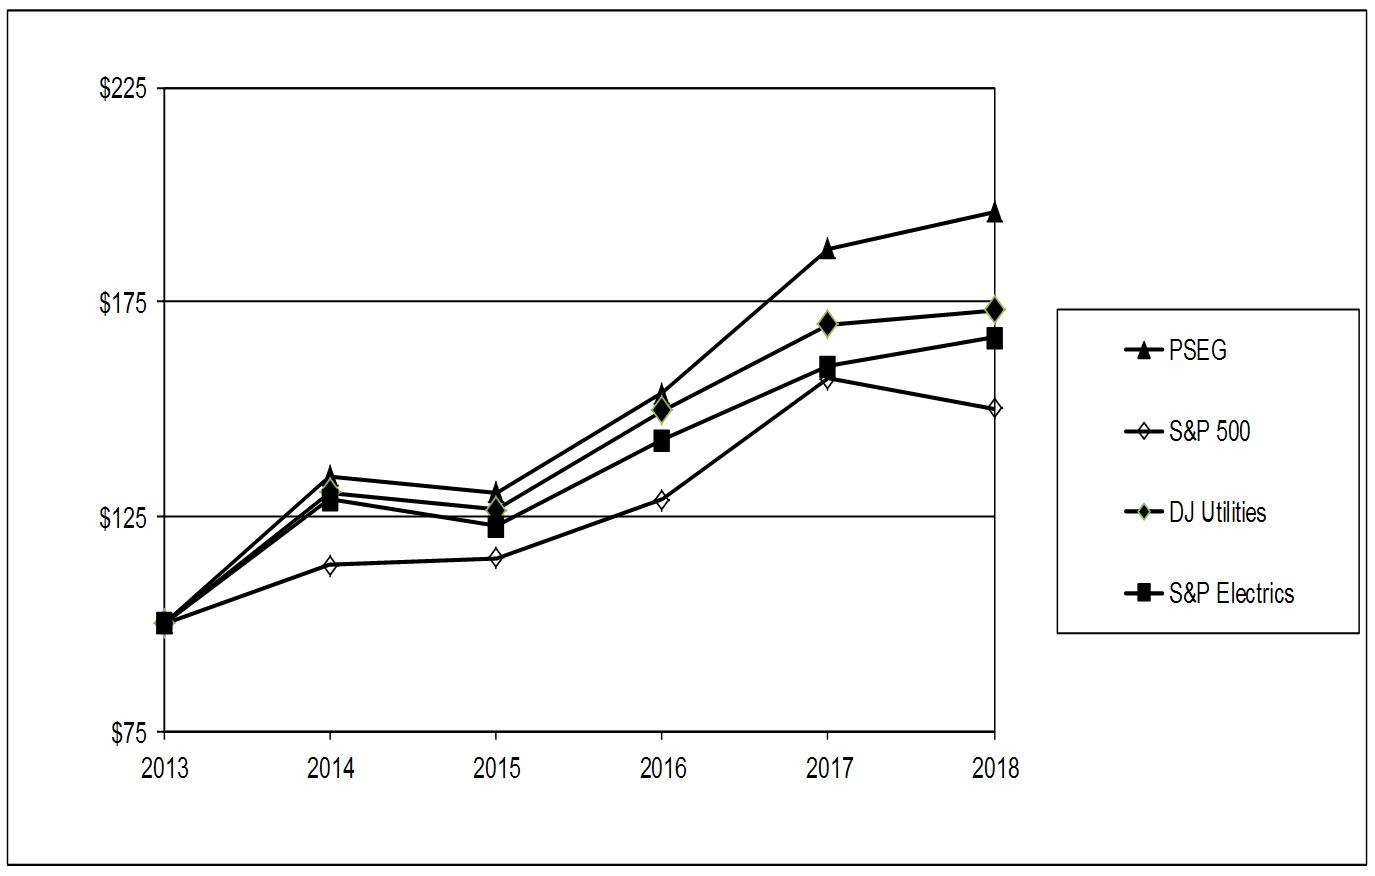
On February 21, 2017,19, 2019, our Board of Directors approved a $0.43$0.47 per share common stock dividend for the first quarter of 2017.2019. This reflects an indicative annual dividend rate of $1.72$1.88 per share. We expect to continue to pay cash dividends on our common stock; however, the declaration and payment of future dividends to holders of our common stock will be at the discretion of the Board of Directors and will depend upon many factors, including our financial condition, earnings, capital requirements of our businesses, alternate investment opportunities, legal requirements, regulatory constraints, industry practice and other factors that the Board of Directors deems relevant.
The following table indicates ourIn December 2018, we entered into a share repurchase plan that complies with Rule 10b5-1 of the Securities Exchange Act of 1934, as amended, solely with respect to the repurchase of shares to satisfy obligations under equity compensation awards that are expected to vest or be exercised in 2019. There were no common share repurchases in the open market during the fourth quarter of 2016 to satisfy obligations under various equity compensation award grants:
|
| | | | | | | | | |
| | | | | | | |
| | Three Months Ended December 31, 2016 | | Total Number of Shares Purchased | | Average Price Paid per Share | |
| | October 1-October 31 | | — |
| | $ | — |
| |
| | November 1-November 30 | | 127,128 |
| | $ | 40.97 |
| |
| | December 1-December 31 | | 30,000 |
| | $ | 41.42 |
| |
| | | | | | | |
The following table indicates the securities authorized for issuance under equity compensation plans as of December 31, 2016:2018:
|
| | | | | | | | | | | | |
| | | | | | | | | |
| | Plan Category | | Number of Securities to be Issued upon Exercise of Outstanding Options, Warrants and Rights | | Weighted-Average Exercise Price of Outstanding Options, Warrants and Rights | | Number of Securities Remaining Available for Future Issuance under Equity Compensation Plans | |
| | Long-Term Incentive Plan | | 1,029,900 |
| | $ | 37.93 |
| | 14,517,886 |
| |
| | Employee Stock Purchase Plan | | — |
| | — |
| | 3,463,447 |
| |
| | Total | | 1,029,900 |
| | $ | 37.93 |
| | 17,981,333 |
| |
| | | | | | | | | |
|
| | | | | | | | | | | | |
| | | | | | | | | |
| | Plan Category | | Number of Securities to be Issued upon Exercise of Outstanding Options, Warrants and Rights | | Weighted-Average Exercise Price of Outstanding Options, Warrants and Rights | | Number of Securities Remaining Available for Future Issuance under Equity Compensation Plans | |
| | Long-Term Incentive Plan | | 231,933 |
| | $ | 33.49 |
| | 12,992,138 |
| |
| | Employee Stock Purchase Plan | | — |
| | — |
| | 2,888,361 |
| |
| | Total | | 231,933 |
| | $ | 33.49 |
| | 15,880,499 |
| |
| | | | | | | | | |
For additional discussion of specific plans concerning equity-based compensation, see Item 8. Financial Statements and Supplementary Data—Note 18.19. Stock Based Compensation.
PSE&G
We own all of the common stock of PSE&G. For additional information regarding PSE&G’s ability to continue to pay dividends, see Item 7. MD&A—Liquidity and Capital Resources.
Power
We own all of Power’s outstanding limited liability company membership interests. For additional information regarding Power’s ability to pay dividends, see Item 7. MD&A—Liquidity and Capital Resources.
ITEM 6. SELECTED FINANCIAL DATA
PSEG
The information presented below should be read in conjunction with the MD&A and the Consolidated Financial Statements and Notes to Consolidated Financial Statements (Notes).Statements.
|
| | | | | | | | | | | | | | | | | | | | | | |
| | | | | | | | | | | | | |
| | PSEG | | | | | | | | | | | |
| | Years Ended December 31, | | 2016 | | 2015 | | 2014 | | 2013 | | 2012 | |
| | | | Millions, except Earnings per Share | |
| | Operating Revenues (A) | | $ | 9,061 |
| | $ | 10,415 |
| | $ | 10,886 |
| | $ | 9,968 |
| | $ | 9,781 |
| |
| | Income from Continuing Operations (B) | | $ | 887 |
| | $ | 1,679 |
| | $ | 1,518 |
| | $ | 1,243 |
| | $ | 1,275 |
| |
| | Net Income | | $ | 887 |
| | $ | 1,679 |
| | $ | 1,518 |
| | $ | 1,243 |
| | $ | 1,275 |
| |
| | Earnings per Share: | | | | | | | | | | | |
| | Income from Continuing Operations | | | | | | | | | | | |
| | Basic (A) | | $ | 1.76 |
| | $ | 3.32 |
| | $ | 3.00 |
| | $ | 2.46 |
| | $ | 2.52 |
| |
| | Diluted (A) | | $ | 1.75 |
| | $ | 3.30 |
| | $ | 2.99 |
| | $ | 2.45 |
| | $ | 2.51 |
| |
| | Net Income | | | | | | | | | | | |
| | Basic | | $ | 1.76 |
| | $ | 3.32 |
| | $ | 3.00 |
| | $ | 2.46 |
| | $ | 2.52 |
| |
| | Diluted | | $ | 1.75 |
| | $ | 3.30 |
| | $ | 2.99 |
| | $ | 2.45 |
| | $ | 2.51 |
| |
| | Dividends Declared per Share | | $ | 1.64 |
| | $ | 1.56 |
| | $ | 1.48 |
| | $ | 1.44 |
| | $ | 1.42 |
| |
| | As of December 31, | | | | | | | | | | | |
| | Total Assets | | $ | 40,070 |
| | $ | 37,535 |
| | $ | 35,287 |
| | $ | 32,480 |
| | $ | 31,694 |
| |
| | Long-Term Obligations (C) | | $ | 10,897 |
| | $ | 8,837 |
| | $ | 8,218 |
| | $ | 7,830 |
| | $ | 6,670 |
| |
| | | | | | | | | | | | | |
|
| | | | | | | | | | | | | | | | | | | | | | |
| | | | | | | | | | | | | |
| | PSEG | | | | | | | | | | | |
| | Years Ended December 31, | | 2018 | | 2017 | | 2016 | | 2015 | | 2014 | |
| | | | Millions, except Earnings per Share | |
| | Operating Revenues (A) | | $ | 9,696 |
| | $ | 9,094 |
| | $ | 8,966 |
| | $ | 10,415 |
| | $ | 10,886 |
| |
| | Income from Continuing Operations (B)(C)(D) | | $ | 1,438 |
| | $ | 1,574 |
| | $ | 887 |
| | $ | 1,679 |
| | $ | 1,518 |
| |
| | Net Income (B)(C)(D) | | $ | 1,438 |
| | $ | 1,574 |
| | $ | 887 |
| | $ | 1,679 |
| | $ | 1,518 |
| |
| | Earnings per Share: | | | | | | | | | | | |
| | Income from Continuing Operations | | | | | | | | | | | |
| | Basic | | $ | 2.85 |
| | $ | 3.12 |
| | $ | 1.76 |
| | $ | 3.32 |
| | $ | 3.00 |
| |
| | Diluted | | $ | 2.83 |
| | $ | 3.10 |
| | $ | 1.75 |
| | $ | 3.30 |
| | $ | 2.99 |
| |
| | Net Income | | | | | | | | | | | |
| | Basic | | $ | 2.85 |
| | $ | 3.12 |
| | $ | 1.76 |
| | $ | 3.32 |
| | $ | 3.00 |
| |
| | Diluted | | $ | 2.83 |
| | $ | 3.10 |
| | $ | 1.75 |
| | $ | 3.30 |
| | $ | 2.99 |
| |
| | Dividends Declared per Share | | $ | 1.80 |
| | $ | 1.72 |
| | $ | 1.64 |
| | $ | 1.56 |
| | $ | 1.48 |
| |
| | As of December 31, | | | | | | | | | | | |
| | Total Assets | | $ | 45,326 |
| | $ | 42,716 |
| | $ | 40,070 |
| | $ | 37,535 |
| | $ | 35,287 |
| |
| | Long-Term Obligations (E) | | $ | 13,168 |
| | $ | 12,071 |
| | $ | 10,897 |
| | $ | 8,837 |
| | $ | 8,218 |
| |
| | | | | | | | | | | | | |
| |
| (A) | Operating RevenuesAmounts for 2017 and 2016 have been retrospectively adjusted to reflect new guidance for Revenue from Contracts with Customers adopted on January 1, 2018. Amounts for 2015 and 2014 includes $410 million, $375 millionwere not required to be adjusted for this guidance and $389 million, respectively, for Long Island Electric Utility Servco, LLC (Servco), a wholly owned subsidiary of PSEG Long Island LLC (PSEG LI). Seeare therefore not comparative. For additional information, see Item 8. Financial Statements and Supplementary Data—Note 4. Variable Interest Entities for additional information.2. Recent Accounting Standards. |
| |
| (B) | Income from Continuing Operations and Net Income for 2018 includes after-tax expensesnet unrealized losses on equity securities of $396approximately $125 million related toin accordance with new accounting guidance effective January 1, 2018. |
| |
| (C) | Income from Continuing Operations and Net Income include an after-tax gain for 2018 of $39 million from the early retirementsale of Power’s Hudson and Mercer coal/gas generation plants and after-tax expenses for 2017 and 2016 of $577 million and $396 million, respectively, related to the early retirement of these plants; after-tax charges for 2018, 2017 and 2016 totaling $5 million, $45 million and $92 million, respectively, related to investments in NRG REMA, LLC’sREMA’s leveraged leases for 2016leases; and an after-tax insurance recovery for Superstorm Sandy2015 of $102 million for 2015.Superstorm Sandy. See Item 8. Financial Statements and Supplementary Data—Note 3.4. Early Plant Retirements, Note 7.8. Long-Term Investments and Note 8.9. Financing Receivables for additional information for 2016.information. |
| |
(C)(D) | Income from Continuing Operations and Net Income for 2017, include the non-cash net income benefit of $745 million, primarily resulting from the remeasurement of deferred tax liabilities required due to the enactment of the Tax Act in December 2017. See Item 8. Note 21. Income Taxes for additional information for 2017. |
| |
| (E) | Includes capital lease obligations. |
PSE&G and Power
Omitted pursuant to conditions set forth in General Instruction I of Form 10-K.
ITEM 7. MANAGEMENT’S DISCUSSION AND ANALYSIS OF FINANCIAL CONDITION AND RESULTS OF OPERATIONS (MD&A)
This combined MD&A is separately filed by Public Service Enterprise Group Incorporated (PSEG), Public Service Electric and Gas Company (PSE&G) and PSEG Power LLC (Power). Information contained herein relating to any individual company is filed by such company on its own behalf. PSE&G and Power each make representations only as to itself and make no representations whatsoever as to any other company.
PSEG’s business consists of two reportable segments, our principal direct wholly owned subsidiaries, which are:
PSE&G—which is a public utility engaged principally in the transmission of electricity and distribution of electricity and natural gas in certain areas of New Jersey. PSE&G is subject to regulation by the New Jersey Board of Public Utilities (BPU) and the Federal Energy Regulatory Commission (FERC). PSE&G also invests in regulated solar generation projects and has implemented energy efficiency and demand responserelated programs in New Jersey, which are regulated by the BPU, and
Power—which is a multi-regional energy supply company that integrates the operations of its merchant nuclear and fossil generating assets with its power marketing businesses and fuel supply functions through competitive energy sales in well-developed energy markets and fuel supply functions primarily in the Northeast and Mid-Atlantic United States through its principal direct wholly owned subsidiaries. In addition, Power owns and operates solar generation in various states. Power’s subsidiaries are subject to regulation by FERC, the Nuclear Regulatory Commission (NRC), the Environmental Protection Agency (EPA) and the states in which they operate.
PSEG’s other direct wholly owned subsidiaries include PSEG Energy Holdings L.L.C. (Energy Holdings), which primarily has investments in leveraged leases;are: PSEG Long Island LLC (PSEG LI), which operates the Long Island Power Authority’s (LIPA) transmission and distribution (T&D) system under an Operations Services Agreement (OSA);Agreement; PSEG Energy Holdings L.L.C. (Energy Holdings), which primarily has investments in leveraged leases; and PSEG Services Corporation (Services), which provides certain management, administrative and general services to PSEG and its subsidiaries at cost.
Our business discussion in Item 1. Business provides a review of the regions and markets where we operate and compete, as well as our strategy for conducting our businesses within these markets, focusing on operational excellence, financial strength and making disciplined investments. Our risk factor discussion in Item 1A. Risk Factors provides information about factors that could have a material adverse impact on our businesses. The following discussion provides an overview of the significant events and business developments that have occurred during 20162018 and key factors that we expect may drive our future performance. This discussion refers to the Consolidated Financial Statements (Statements) and the related Notes to the Consolidated Financial Statements (Notes). This discussion should be read in conjunction with such Statements and Notes.
EXECUTIVE OVERVIEW OF 20162018 AND FUTURE OUTLOOK
2016 Overview
Our business plan is designed to achieve growth while managing the risks associated with fluctuating commodity prices and changes in customer demand. We continue
PSE&G
At PSE&G, our focus is on operational excellence, financial strength and disciplined investment. These guiding principles have provided the base from which we have been able to execute our strategic initiatives, including:
improving utility operations through growth in investment in T&D and other infrastructure projects designed to enhanceenhancing system reliability and resiliency, and to meetmeeting customer expectations and supporting public policy objectives
maintaining and expanding a reliable generation fleet with the flexibility to utilize a diverse mix of fuels which allows us to respond to market volatility and capitalize on opportunities as they arise.
Financial Results
The results for PSEG, PSE&G and Power for the years ended December 31, 2016 and 2015 are presented below:
|
| | | | | | | | | | |
| | | | | | | |
| | | | Years Ended December 31, | |
| | | | 2016 | | 2015 | |
| | Earnings (Losses) | | Millions, except per share data | |
| | PSE&G | | $ | 889 |
| | $ | 787 |
| |
| | Power | | 18 |
| | 856 |
| |
| | Other | | (20 | ) | | 36 |
| |
| | PSEG Net Income | | $ | 887 |
| | $ | 1,679 |
| |
| | | | | | | |
| | PSEG Net Income Per Share (Diluted) | | $ | 1.75 |
| | $ | 3.30 |
| |
| | | | | | | |
Our 2016 over 2015 decrease in Net Income was due primarily to charges related to the early retirement of our Hudson and Mercer units, mark-to-market (MTM) losses in 2016 as compared to gains in 2015, lower volumes of electricity and gas sold at lower average realized sales prices, lower capacity and operating reserve revenues, storm insurance recoveries received primarily by Power in 2015 related to Superstorm Sandy, and charges in 2016 related to investments in certain leveraged leases at Energy Holdings. These decreases were partially offset by higher transmission revenues, lower generation costs and higher costs incurred at Power for planned outages in 2015, and higher management fee revenues at PSEG LI pursuant to the OSA. For a more detailed discussion of our financial results, see Results of Operations.
During 2016, we maintained a strong balance sheet. We continued to effectively deploy capital without the need for additional equity, while our solid credit ratings aided our ability to access capital and credit markets. The greater emphasis on capital spending for projects on which we receive contemporaneous returns at PSE&G, our regulated utility, in recent years has yielded strong results, which when combined with the cash flow generated by Power, our merchant generator and power marketer, has allowed us to increase our dividend. These actions to transition our business to meet market conditions and investor expectations reflect our multi-year, long-term approach to managing our company. Our focus has been to investinvesting capital in T&D infrastructure and other infrastructure projects aimed at maintaining service reliability to our customers and bolstering our system resiliency. At Power, we strive to improve performance and reduce costs in order to enhance the value of our generation fleet in light of low gas prices, environmental considerations and competitive market forces that reward efficiency and reliability.
At PSE&G, we continue to invest in transmission projects that focus on reliability improvements and replacement of aging infrastructure. We also continue to make investments to improve the resiliency of our gas and electric distribution system as part of our Energy Strong program that was approved by the BPU in 2014 and to seek recovery on such investments. We also commenced modernizing PSE&G’s gas distribution systems as part of our Gas System Modernization Program (GSMP) that was approved by the BPU in late 2015.clean energy projects. Over the past few years, these types ofour investments have altered our business mix to reflect a higher percentage of earnings contribution by PSE&G. In 2017, as a resultOver the next five years, we expect to invest between $11 billion and $16 billion in our business which is expected to provide an annual rate base growth of 7%—9%. We completed our Energy Strong Order fromProgram I (ES I) and essentially completed our Gas System Modernization Program I (GSMP I). See Item 1. Business—Business Operations and Strategy—PSE&G for a description of these programs.
In May 2018, we received approval for our Gas System Modernization Program II (GSMP II), an expanded, five-year program to invest $1.9 billion beginning in 2019 to replace approximately 875 miles of cast iron and unprotected steel mains in addition to other improvements to the BPU, wegas system. Approximately $1.6 billion will be requiredrecovered through periodic rate roll-ins, with the remaining $300 million to be recovered through a future base rate proceeding. As part of the settlement, PSE&G agreed to file a base rate proceeding no later than five years from the commencement of the program, to maintain a base level of gas distribution capital expenditures of $155 million per year and to achieve certain leak reduction targets.
In June 2018, we filed for our Energy Strong Program II (ES II), a proposed five-year $2.5 billion program to harden, modernize and make our electric and gas distribution systems more resilient. The size and duration of ES II, as well as certain other elements of the program, are subject to BPU approval. The review process is expected to conclude in mid-2019.
In October 2018, we filed our proposed Clean Energy Future (CEF) program with the BPU, a six-year estimated $3.6 billion investment covering four programs; (i) an Energy Efficiency (EE) program totaling $2.5 billion of investment designed to
achieve energy efficiency targets required under New Jersey’s Clean Energy law; (ii) an Electric Vehicle (EV) infrastructure program; (iii) an Energy Storage (ES) program and (iv) an Energy Cloud (EC) program which will include installing approximately two million electric smart meters and associated infrastructure. The review process for the CEF-EE program is expected to conclude by the third quarter of 2019. The CEF-EV/ ES and CEF-EC programs will have separate procedural schedules.
In November 2018, the New Jersey Division of Rate Counsel (Rate Counsel) filed a motion to dismiss the CEF-EC filing on the basis that the BPU announced a moratorium on electric distribution companies’ AMI program. In December 2018, Rate Counsel filed a motion to stay the CEF-EV/ES filing, arguing that the BPU should conclude other regulatory proceedings addressing EVs and ES, including the new Energy Master Plan and initiatives required by the Clean Energy Act, before it rules on PSE&G’s program. We opposed Rate Counsel’s motions, asking for the BPU to permit these filings to proceed. There is no timetable for the BPU to decide on Rate Counsel’s motions.
Also, in October 2018, the BPU issued an Order approving the settlement of our distribution base rate case proceeding. We cannot predictproceeding with new rates effective November 1, 2018. The settlement resulted in a net reduction in overall annual revenues of approximately $13 million, comprised of a $212 million increase in base revenues, which includes the impact such proceeding will haverecovery of deferred storm costs, and the return of tax benefits largely due to tax reform of approximately $225 million. The Order provides for a distribution rate base of $9.5 billion, a 9.6% return on equity (ROE) for our distribution business.business and a 54% equity component of our capitalization structure.
DespitePower
At Power, we strive to improve performance and reduce costs in order to optimize cash flow generation from our fleet in light of low wholesale power and gas prices, environmental considerations and competitive market forces that reward efficiency and reliability. Power continues to move its fleet toward improved efficiency and believes that its investment program enhances its competitive position with the unseasonable warm winter weather patternsaddition of efficient, clean, reliable combined cycle gas turbine capacity. Our commitments for load, such as basic generation service (BGS) in 2016, Power’s results benefited from access to natural gas supplies through existing firm pipeline transportation contracts. Power manages these contracts for the benefit of PSE&G’s customers through the BGSS arrangement. TheNew Jersey and other bilateral supply contracts, are sizedbacked by this generation or may be combined with the use of physical commodity purchases and financial instruments from the market to provide for deliveryoptimize the economic efficiency of a reliable gas supply to PSE&G customers on peak winter days. When pipeline capacity beyond the customers’ needs is available, Power can use it to make third-party sales and supply gas to its generating units in New Jersey. Alternatively, gas supply and pipeline capacity constraints could adversely impactserving our ability to meet the needs of our utility customers and generating units.obligations. Power’s hedging practices and ability to capitalize on market opportunities help it to balance some of the volatility of the merchant power business. More than half of Power’s expected gross margin in the upcoming year2018 relates to our hedging strategy, our expected revenues from the capacity market mechanisms and certain ancillary service payments such as reactive power.
Our investments in the latter half of 2015 and early 2016 in Keys Energy Center (Keys), Sewaren 7 and Bridgeport Harbor Station Unit 5 (BH5) reflect our recognition of the value of opportunistic growth in the Power business. See Item 1. Business—Power for additional information on major growth projects. These additions to our fleet both expand our geographic diversity and adjust our fuel mix and are expected to contribute toenhance the environmental profile and overall efficiency of operations.Power’s generation fleet.
Since 2013, severalOperational Excellence
We emphasize operational performance while developing opportunities in both our competitive and regulated businesses. Flexibility in our generating fleet has allowed us to take advantage of opportunities in a rapidly evolving market as we remain diligent in managing costs. In 2018, our
utility achieved continued strong reliability and customer satisfaction results, as well as comprehensive storm preparation and restoration efforts, and ongoing cost control,
diverse fuel mix and dispatch flexibility allowed us to generate approximately 56 terawatt hours while addressing fuel availability and price volatility, and
total nuclear generating stationsfleet achieved a capacity factor of 91.4%.
Financial Strength
Our financial strength is predicated on a solid balance sheet, positive operating cash flow and reasonable risk-adjusted returns on increased investment. Our financial position remained strong during 2018 as we
maintained sufficient liquidity,
maintained solid investment grade credit ratings, and
increased our indicative annual dividend for 2018 to $1.80 per share.
We expect to be able to fund our planned capital requirements, as described in Liquidity and Capital Resources, and the United States have closed or announced early retirement due to economic reasons, or have announced as being at risk for early retirement. This situation is generally due to low natural gas prices resulting fromimpacts of the growthTax Cuts and Jobs Act of shale gas production since 2007,2017 (Tax Act) without the continuing costissuance of regulatory compliance for nuclear facilitiesnew equity. For additional information on the impacts of the Tax Act, see Item 8. Note 7. Regulatory Assets and both federalLiabilities and state-level policies that provide credits to renewable energy such as wind and solar, but do not apply toNote 21. Income Taxes.
nuclear generating stations. These trends have significantly reducedThe financial results for PSEG, PSE&G and Power for the revenuesyears ended December 31, 2018 and 2017 are presented below:
|
| | | | | | | | | | |
| | | | | | | |
| | | | Years Ended December 31, | |
| | | | 2018 | | 2017 | |
| | | | Millions, except per share data | |
| | PSE&G | | $ | 1,067 |
| | $ | 973 |
| |
| | Power | | 365 |
| | 479 |
| |
| | Other | | 6 |
| | 122 |
| |
| | PSEG Net Income | | $ | 1,438 |
| | $ | 1,574 |
| |
| | | | | | | |
| | PSEG Net Income Per Share (Diluted) | | $ | 2.83 |
| | $ | 3.10 |
| |
| | | | | | | |
Our 2018 over 2017 decrease in Net Income was due primarily to nuclear generating stations while simultaneously raising the unit costone-time favorable impacts in 2017 of production. This may resultnew tax legislation at Power and Holdings, discussed below, and the recognition in 2018 of net unrealized losses on NDT Fund equity securities at Power in accordance with new accounting guidance. The decrease was partially offset by charges in 2017 related to the electric generation industry experiencingearly retirement of our Hudson and Mercer units, as well as a shiftlower federal tax rate at Power and higher earnings from nuclear generation to natural gas-fired generation, creating greater reliance on natural gas pipelines for deliveryT&D investments and less diversitythe favorable impact of new rates upon settlement of the distribution base rate proceeding, discussed above, at PSE&G. For a more detailed discussion of our financial results, see Results of Operations.
Disciplined Investment
We utilize rigorous criteria when deploying capital and seek to invest in areas that complement our existing business and provide reasonable risk-adjusted returns. These areas include upgrading our energy infrastructure, responding to trends in environmental protection and providing new energy supplies in domestic markets with growing demand. In 2018, we
made additional investments in T&D infrastructure projects,
continued to execute our GSMP I, Energy Efficiency and other existing BPU-approved utility programs,
received approval for our GSMP II program and filed our proposed ES II and CEF programs, and
commenced commercial operation of Sewaren 7 and Keys generation fleet.
If trends noted above continue or worsen,facilities and continued construction of our nuclear generating units could cease being economically competitiveBH5 generation project, which may cause us to retire such units prior to the end of their useful lives. The costs associated with any such retirement, which may include, among other things, accelerated depreciation and amortization or impairment charges, accelerated asset retirement costs, severance costs and environmental remediation costs, could be material. We continue to advocateis targeted for sound policies that recognize nuclear power as a source of clean energy and an important part of a diverse and reliable energy portfolio. commercial operation in mid-2019.
Regulatory, Legislative and Other Developments
In our pursuit of operational excellence, financial strength and disciplined investment, we closely monitor and engage with stakeholders on significant regulatory and legislative developments. Transmission planning rules and wholesale power market design are of particular importance to our results and we continue to advocate for policies and rules that promote fair and efficient electricity markets. For additional information about regulatory, legislative and other developments that may affect the company, see Item 1. Business—Regulatory Issues.
Transmission Planning
In April 2013, PJM initiated its first “open window” solicitation process to allow both incumbents and non-incumbents the opportunity to submit transmission project proposals to address identified high voltage issues in New Jersey. In February 2016, FERC issued an order granting PSE&G’s request that it be permitted to seek recovery of 100% of its portion of the project’s costs to address identified high voltage issues at Artificial Island in New Jersey if the project is canceled for reasons beyond PSE&G’s control. In April 2016, PSE&G accepted construction responsibility for the three components of the project that PJM assigned to it, based on having reached agreement with PJM regarding an estimate for the project base cost of $273 million, plus risk and contingency for a total project cost of up to $340 million. In August 2016, PJM announced that it had suspended the Artificial Island transmission project and would be performing a comprehensive analysis to support a future course of action. PJM will submit its final recommendation to the PJM Board at the April 2017 Board meeting.
In April 2016, PJM filed at FERC to incorporate a voltage threshold into PJM’s Regional Transmission Expansion Plan (RTEP) process to exempt, except under certain circumstances, reliability violations on facilities below 200 kV from PJM’s proposal window process. We generally support this reform as a measure to improve the efficiency of the open window procedure that will permit transmission developers to focus on the projects most likely to benefit from a competitive process.
There are several matters pending before FERC that concernmay impact the allocation of costs associated with transmission projects, including those being constructed by PSE&G. Regardless of how these proceedings are resolved, PSE&G’s ability to recover the costs of these projects will not be affected. However, the result of these proceedings could ultimately impact the amount of costs borne by ratepayerscustomers in New Jersey and may cause increased scrutiny regarding PSE&G’s future capital investments.Jersey. In addition, as a basic generation service (BGS)BGS supplier, Power provides services that include specified transmission costs. If the allocation of the costs associated with the transmission projects were to increase these BGS-related transmission costs, BGS suppliers maywould be entitled to an adjustment,recovery, subject to BPU approval. We do not believe that these matters will have a material effect on Power’s business or results of operations.
Several complaints have been filed and several remain pending at FERC against transmission owners around the country, challenging those transmission owners’ base return on equity (ROE).ROE. Certain of those complaints have resulted in decisions and others have been settled, resulting in reductions of those transmission owners’ base ROEs. While we are not the subject of a challenge to the ROE employed in PSE&G’s transmission formula rate, theThe results of these other proceedings could set precedents for other transmission owners with formula rates in place, including PSE&G.
Wholesale Power Market Design
Capacity market design, including the Reliability Pricing Model (RPM) in PJM, remainsIn October 2018, FERC issued an important focusorder establishing a new framework for us. In June 2015,determining whether a company’s ROE is unjust and unreasonable. FERC conditionally acceptedproposes to rely on financial models to establish a proposal from PJMcomposite zone of reasonableness that will be used to determine whether an ROE complaint should be dismissed. If FERC determines that an ROE for a capacity performance productcompany is not just and reasonable, it intends to include generators, Demand Response and energy efficiency providers, which will be required to perform during emergency conditions, as a supplement toreset the base capacity product. The proposal included enhanced performance-based incentives and penalties. We believe that the auction pricing adequately reflects the increased costs that could result from operating under more stringent rules for generation availability. BasedROE based on the auction results, the capacity performance mechanism appears to have provided the opportunity for enhanced capacity market revenue streams for Power, but future impacts cannot be assured. Further, there may be requirements for additional investment and there are additional performance and financial risks. Appeals of FERC’s capacity performance orders are pending.
In May 2016, PJM announcedaveraging the results of various financial models. We are still analyzing the RPM capacity auction forpotential impact of these methodologies and cannot predict the 2019-2020 delivery year. Power cleared 8,895 MWoutcome of its generating capacity at an average price of $116 per MW-day for the 2019-2020 delivery period. Of the clearedongoing ROE proceedings.
Wholesale Power Market Design
In June 2018, FERC issued an order finding that PJM’s current capacity Power believesmarket is not just and reasonable because it enabled state-supported resources to bid below their costs which resulted in suppressed clearing prices. In particular, FERC found that nearly allnuclear generating units that receive zero emission certificate (ZEC) payments were of concern. Depending on the outcome of this matter, our generating stations could also be impacted. For additional information see Item 1. Business—Regulatory Issues—Federal Regulation.
In February 2019, the PJM Board approved a filing to modify the curves used for pricing reserves with FERC. The reforms include a 30-minute reserve product in real-time, more dynamic reserve requirements to better capture operator actions taken to maintain reliability, and improvement to the curves used to price reserves during reserve shortage conditions. If placed into effect, this reform is compliantexpected to improve energy and reserve prices by ensuring that when operators commit resources to ensure reliability, the commitments are reflected in market clearing prices. However, this reform could result in lower capacity payments. There is no timeline for this type of filing and therefore we cannot predict when FERC will act on the filing or the outcome of this matter.
In October 2018, PJM filed with PJM’sFERC to revise the shape of the Variable Resource Requirement (VRR) curve that will be implemented for the capacity performance requirements. Inauction to be held in August 2019. The VRR curve is the two prioradministratively determined demand curve that serves as one of the key elements for establishing the amount of generation capacity auctions covering the 2017-2018 and 2018-2019 delivery years, Power cleared approximately 8,700 MW at average prices of $177 per MW-day and $215 per MW-day, respectively. Pricesto be procured in the most recent auction reflect PJM’s downwardly-revised demand forecast, changes in theauction. PJM contends that its proposal will lower capacity emergency transfer limits dueprices as compared to transmission expansion and the effects of both the new generation and uncleared generation from the prior year’s auction.
As a result of the efforts of certain entities in PJM to obtain financial support arrangements from their state commission, a group of suppliers requested that FERC direct PJM to expand the currently effective “minimum offer price rule” to apply to certain existing units seeking subsidies. The suppliers’ request was intended to avoid a scenario where the subsidized generators would submit bids into the PJM capacity market that did not reflect their actual costs of operation and could artificially suppress capacity market prices. We are currently awaiting FERC actionVRR curve. PSEG protested PJM’s proposal on the suppliers’ requestgrounds that it would result in understated prices for capacity relative to the cost of constructing a new reference generating unit and will result in prices that are unjust and unreasonable. This matter is pending before FERC and we cannot predict the outcomeoutcome.
Distribution
Effective in January 2018, the BPU adopted Infrastructure Investment Program (IIP) regulations that encourage utilities to construct, install, or remediate utility plant and facilities related to reliability, resiliency, and/or safety to support the provision of safe and adequate service. Under these regulations, utilities can seek authority to make specified infrastructure investments in programs extending for up to five years with accelerated cost recovery mechanisms. The BPU characterized the proceeding.IIP regulations as a regulatory initiative intended to create a financial incentive for utilities to accelerate the level of investment needed to promote the timely rehabilitation and replacement of certain traditional utility infrastructure that enhances reliability, resiliency, and/or safety.Since these regulations were adopted, the BPU approved our GSMP II and we filed our ES II and CEF-EC programs with the BPU.
See Item 1. Business—Federal Regulation for additional information.
Environmental Regulation
We continue to advocate for the development and implementation of fair and reasonable rules by the EPA and state environmental regulators. In particular, section 316(b) of the FederalClean Water Pollution Control Act (FWPCA) requires that cooling water intake structures, which are a significant part of the generation of electricity at steam-electric generating stations, reflect the best technology available for minimizing adverse environmental impacts. Implementation of Section 316(b) and related state regulations could adversely impact future nuclear and fossil operations and costs.
The U.S. Supreme Court’s February 2016 decision to stayIn August 2018, the implementation ofEPA released the proposed Affordable Clean Energy (ACE) rule as a replacement for the EPA’s Clean Power Plan (CPP), a greenhouse gas emissions regulation under the Clean Air Act (CAA) for existing power plants, will delay deadlines for submission of state requests for extensionsPlan. The proposed ACE rule gives states great flexibility to evaluate specific heat rate improvement technologies and final plans. If the CPP is upheld, new deadlines will needpractices to be established andapplied at coal-fired electric generating units. States have three years from the effective date of finalization to submit a plan that establishes a standard of performance that reflects the compliance period may be impacted.degree of emission limitation through the application of heat rate improvement technologies and practices. We cannot estimate the impact of this action on our business or results of operations at this time.
We are also subject to liability under environmental laws for the costs of remediating environmental contamination of property now or formerly owned by us and of property contaminated by hazardous substances that we generated. In particular, the historic operations of PSEG companies and the operations of numerous other companies along the Passaic and Hackensack Rivers are alleged by Federal and State agencies to have discharged substantial contamination into the Passaic River/Newark Bay Complex in violation of various statutes. We are also currently involved in a number of proceedings relating to sites where other hazardous substances may have been discharged and may be subject to additional proceedings in the future, and the costs of any such remediation efforts could be material.
In December 2018, the New Jersey Department of Environmental Protection proposed two rules that begin the state’s re-entry into the Regional Greenhouse Gas Initiative (RGGI). The first proposal is the mechanism rulemaking that establishes the state’s initial cap on greenhouse gas emissions of 18 million tons in 2020. The proposal follows the RGGI model rule with a cap that will decline three percent annually through 2030 to a final cap of 11.5 million tons. New Jersey is committed to a start date of January 1, 2020. The second proposal establishes the framework for how the state will spend the RGGI auction proceeds. We cannot estimate the impact of this action on our business or results of operations at this time.
For further information regarding the matters described above, as well as other matters that may impact our financial condition and results of operations, see Item 8. Financial Statements and Supplementary Data—Note 13. Commitments and Contingent Liabilities.
FERC Compliance
Since September 2014, FERC Staff has been conducting a preliminary non-public investigation regarding errors in the calculation of certain components of Power’s cost-based bids for its New Jersey fossil generating units in the PJM energy market and the quantity of energy that Power offered into the energy market for its fossil peaking units compared to the amounts for which Power was compensated in the capacity market for those units. This investigation is ongoing. The amounts of potential disgorgement and other potential penalties that we may incur span a wide range depending on the success of our legal arguments. If our legal arguments do not prevail, in whole or in part with FERC or in a judicial challenge that we may choose to pursue, it is likely that Power would record losses that would be material to PSEG’s and Power’s results of operations in the quarterly and annual periods in which they are recorded. For additional information, see Item 8. Financial Statements and Supplementary Data—Note 13.14. Commitments and Contingent Liabilities.
Early Retirement of Hudson and Mercer UnitsPlant Retirements
Nuclear
In October 2016,May 2018, the governor of New Jersey signed legislation, referred to as the ZEC legislation, that recognizes that nuclear power is a critical component of New Jersey’s clean energy portfolio and an important element of a diverse energy generation portfolio that currently meets approximately 40 percent of New Jersey’s electric power needs. The ZEC legislation creates a Zero Emission Certificate (ZEC) program to be administered by the BPU. The BPU subsequently established processes to evaluate applications by qualified nuclear plants and to review and approve changes to the New Jersey’s electric distribution companies’ tariffs to provide for the purchase of ZECs from selected nuclear plants and recover those ZEC payments through a non-bypassable distribution charge (ZEC charge) in the amount of $0.004 per kilowatt-hour (which is equivalent to approximately $10 per megawatt hour (MWh) in payments to selected nuclear plants. ZECs will be awarded to selected nuclear plants, if any, in April 2019 at which time ZEC revenue would commence and would continue for approximately three years. Nuclear plants receiving ZEC payments will be obligated to maintain operations, subject to exceptions specified in the ZEC legislation. The ZEC legislation requires nuclear plants to reapply for any subsequent three year periods. The ZEC payment may be adjusted by the BPU (a) at any time to offset environmental or fuel diversity payments that a selected nuclear plant may receive from another source or (b) at certain times specified in the ZEC legislation if the BPU determines that the purposes of the ZEC legislation can be achieved through a reduced charge that will nonetheless be sufficient to achieve the state’s air quality and other environmental objectives by preventing the retirement of nuclear plants.
In December 2018, Power determined itsubmitted applications to the BPU for the Salem 1 and 2 and Hope Creek nuclear plants. These were the only applications received by the BPU. As required, Power’s three applications each included a certification pursuant to which Power confirmed that each of the Salem 1, Salem 2 and Hope Creek plants will cease generation operations within three years absent a material financial change. Power’s submittal further attested that the nuclear plants are not expected to cover their costs and operating and market risks as defined in the ZEC legislation, absent a material financial change. As a result, absent a material financial change, Power will retire all three plants unless all of the existing coal/gas unitsplants receive ZECs. Power operates its nuclear plants as an interdependent fleet on a common site with shared costs and services, which allows them to achieve economies of scale. A decision to retire one nuclear plant would also adversely impact Power’s ability to attract and retain qualified employees at its remaining plants. Power believes that the retirement of any individual nuclear plant would have the effect of decreasing the scale of its nuclear operations; however, the complex nature of operating nuclear plants would not decrease the attention required from management for the safe operation of the remaining nuclear operations. As a result, Power’s decision to retire any nuclear plant would be made at the Hudsonsite level and Mercer generating stationswould result in the retirement of all of these New Jersey nuclear plants.
Given the anticipated timing of the BPU’s decision on Junewhich nuclear plants, if any, have been selected to receive ZECs, which is expected in April 2019, in March 2019 Power will submit to the PJM Independent Market Monitor and the PJM Office of Interconnection a request for a preliminary exception to PJM’s Reliability Pricing Model must-offer requirement with respect to Power’s interest for each of the Salem 1, 2017.Salem 2 and Hope Creek plants in connection with the 2022/2023 capacity auction expected to be held in August 2019. Power will also submit a deactivation notice to the extent that its filing deadline occurs prior to the award of ZECs by the BPU. If all of the Salem and Hope Creek plants are selected to receive ZECs, the preliminary exception and requested deactivation notice, as applicable, would be withdrawn.
In the event that any of the Salem 1, Salem 2 and Hope Creek plants is not selected to receive ZEC payments in April 2019 by the BPU and do not otherwise experience a material financial change, Power will take all necessary steps to retire all of these plants at or prior to their refueling outages scheduled for the Fall 2019 in the case of Hope Creek, Spring 2020 in the case of Salem 2 and Fall 2020 in the case of Salem 1. Alternatively, if all of the Salem 1, Salem 2 and Hope Creek plants are selected to receive ZEC payments in April 2019 but the financial condition of the plants is materially adversely impacted by potential changes to the capacity market construct being considered by FERC (absent sufficient capacity revenues provided under a program approved by the BPU in accordance with a FERC authorized capacity mechanism), Power would still take all necessary steps to retire all of these plants. The exact timingcosts and accounting charges associated with any such retirement, which may include, among other things, accelerated depreciation and amortization or impairment charges, potential penalties associated with the early termination of capacity obligations and fuel contracts, accelerated asset retirement costs, severance costs, environmental remediation costs and, in certain circumstances, potential additional funding of the Nuclear Decommissioning Trust (NDT) Fund, would be material to both PSEG and Power.
Following any action to retire its nuclear plants, Power would take the necessary steps to satisfy its capacity obligations through 2022 with other assets in its fleet or through market purchases. Power intends to decommission any retired nuclear plant using the “SAFESTOR” process, which is a process approved by the NRC. As a result, Power believes adequate funds are available in the NDT Fund for the early retirement of these units maythe nuclear plants. To the extent another decommissioning process is employed, the NDT Fund would not be impacted by operational and other conditions that could subsequently arise. The decisionsufficient to retirecover the Hudson and Mercer units will have a material effect on PSEG’s and Power’s resultscosts of operations. In 2016, PSEG and Power recognized pre-tax charges in Energy Costs and Operation and Maintenance (O&M) of $62 million and $53 million, respectively, related to coal inventory adjustments, capacity penalties, materials and supplies inventory reserve adjustments for parts that cannot be used at other generating units, employee-related severance benefits costs and construction work in progress impairments, among other shut down items. In addition to these charges, Power recognized incremental Depreciation and Amortization during 2016 of $555 million ($571 million in total) and expects to recognize an additional $931 million ($958 million in total) in 2017 due todecommissioning all the significant shortening of the expected economic useful lives of Hudson and Mercer. Additional employee-related salary continuance and severance costs and various miscellaneous costs may also be incurred during the period prior tonuclear plants upon early retirement. Finally, Power currently anticipates using the
sites for alternative industrial activity. However, ifFossil
In December 2018, Power determines not to usecompleted the sale of the sites for alternative industrial activity, the early retirement of the units at such sites would trigger obligations under certain environmental regulations, including possible remediation. The amounts for any such remediation are neither currently probable nor estimable but may be material. For additional information, including our estimated costs through 2017, see Item 8. Financial Statements and Supplementary Data—Note 3. Early Plant Retirements.
The primary factors considered during our annual five-year strategic planning process that contributed to the decision to retire these units early include significant declines in revenues and margin caused by a sustained period of depressed wholesale power prices and reduced capacity factors caused by lower natural gas prices making coal generation less economically competitive than natural gas-fired generation. Despite experiencing recent warmer than normal weather in PJM this summer, Power did not experience the usual increase in electricity prices in PJM as it had in past hot summers. This trend has a further adverse economic impact to these units because they generally dispatch and earn energy margin on peak hot and cold days. In addition, the upcoming PJM capacity auction in May 2017 will be the first to require all generating units to meet the increased operating performance standards of PJM’s new capacity performance construct. Power determined that the costs to upgrade the existing units at theretired Hudson and Mercer stationsunits. Power transferred all land rights and structures on the sites to be able to complya third-party purchaser, along with these higher reliability standards are too significantthe assumption of the environmental liabilities for the sites. As a result of the sale and not economic given current market conditions. transfer of liabilities, Power recorded a pre-tax gain in 2018 of $54 million in Operation and Maintenance (O&M) Expense.
In addition, PSEG and Power continue to monitor their other coal assets, including their interest in the Keystone and Conemaugh generating stations, to ensureassess their economic viability through the end of their designated useful lives and their continued classification as held for use. The precise timing of a change in useful lives may be dependent upon events out of PSEG’s and Power’s control and may impact ourtheir ability to operate or maintain thesecertain assets in the future. These generating stations may be impacted by factors such as environmental legislation, co-owner capital requirements and continued depressed wholesale power prices or capacity factors, among other things. Any early retirement or change in the classification as held for use of our remaining coal units may have a material adverse impact on PSEG’s and Power’s future financial results.
Leveraged Lease ImpairmentsCalifornia Solar Facilities
DuringAs part of its solar production portfolio, Power owns and operates two California-based solar facilities with an aggregate capacity of approximately 30 MW direct current whose output is sold to Pacific Gas and Electric Company (PG&E) under power purchase agreements (PPAs) with twenty year terms. The net book value of these solar facilities was approximately $57 million as of December 31, 2018. In January 2019, PG&E and its parent company PG&E Corporation filed for Chapter 11 bankruptcy protection. Power cannot predict the third quarterultimate outcome that this bankruptcy proceeding will have on our ability to collect all of 2016, Energy Holdings completed its annual reviewthe future revenues from these facilities due under the PPAs; however, any adverse changes to the terms of estimated residual values embeddedPower’s PPAs as a result of this bankruptcy proceeding could result in the future impairment of these assets in amounts up to their current net book value.
Offshore Wind
In January 2018, the governor of New Jersey signed Executive Order No. 8 directing the BPU to begin the process of moving the state toward its 2030 goal of 3,500 MW of offshore wind energy generation. An initial solicitation was established for 1,100 MW of offshore wind, with bids due in December 2018. In connection with the bid submitted by Ocean Wind, LLC, a wholly owned subsidiary of Ørsted US Offshore Wind, referred to as the Ocean Wind project, PSEG agreed to provide energy management services and the potential lease of land for use in project development. We also retained an option to acquire an equity interest in the project. We expect to make a decision regarding an equity investment in the Ocean Wind project in the second half of 2019.
Leveraged Leases
In December 2018, NRG REMA, LLC (REMA) leveraged leases. The outcome indicated thatemerged from its in-court proceeding under Chapter 11 of the revised residual value estimates were lower thanBankruptcy Code. Upon emergence, PSEG received $31.5 million in cash in exchange for transferring the recorded residual valuesownership interests in Keystone and the decline was deemed to be other than temporary dueConemaugh to the adverse economic conditions experienced by coal generationdebtholders of REMA and satisfaction of all other claims asserted against REMA, as well as certain amendments to the Shawville lease. The Shawville lease amendments, among other things, will allow REMA to express interest in PJM, as discussed in Item 8. Financial Statements and Supplementary Data—Note 3. Early Plant Retirements, negatively impacting the economic outlook of the leased assets.a renewal on or after November 24, 2019. In addition, REMA has agreed to fund qualifying credit support up to $36 million. As a result, a pre-tax write-down of $137 million was reflected in Operating Revenues in the quarter ended September 30, 2016, calculated by comparing the gross investment in the leases before and after the revised residual estimates. During the fourth quarter of 2016, Energy Holdings recorded a $10 million pre-tax charge in Operating Revenues reflecting its best estimate of loss as a result of the restructuring, Energy Holdings recognized a pre-tax gain in Operating Revenues of approximately $12 million ($9 million after tax). In addition, the remaining deferred tax liabilities related to these lease investments were reclassified to current liquidity issues facing REMA. There can be no assurance that a continuation or worsening of the adverse economic conditions would not leadtax liabilities. PSEG expects to additional write-downs at any of our other generation units in our leveraged lease portfolio, and such write-downs could be material.pay approximately $120 million to taxing authorities resulting from this restructuring activity.
Additional facilities in our leveraged lease portfolio include the Joliet and Powerton generating facilities. Converted natural gas units such as Shawville generating facilities, which were converted to use natural gas. However, these unitsand Joliet may have higher operating costs and fuel consumption, as well as longer start-up times, compared to newer combined cycle gas units. AsPowerton is a result,coal-fired generating facility in Illinois. Each of these three facilities may not be as economically competitive as newer combined cycle gas units and could continue to be adversely impacted by the same economic conditions experienced by other less efficient natural gas and coal generation facilities, which could require Energy Holdings to write down the residual value of the leveraged leaseslease receivables associated with these facilities.
Further, REMA’s parent company, GenOn Energy, Inc. (GenOn)Tax Legislation
In December 2017, the Tax Act, among other things, decreased the statutory U.S. corporate income tax rate from a maximum of 35% to 21%, reported in August 2016 that it did not expect to have sufficient liquidity to repay their senior unsecured notes due in June 2017. Although all lease payments are current, PSEG cannot predict the outcome of GenOn’s efforts to restructure its portfolioeffective January 1, 2018, and improve its liquidity and the possible related impact on REMA. PSEG continues to monitor anymade certain changes to REMA’sbonus depreciation and GenOn’s status and potential impacts on Energy Holdings’ lease investments, which could include further write-downs of the values of Energy Holdings’ leveraged leases. For additional information, see Item 8. Financial Statements and Supplementary Data—Note 8. Financing Receivables.interest disallowance rules.
Salem Operations
The previously announced bolt replacement at Salem Unit 1 was completed and the unit returned to service on July 30, 2016. We expect to continue to inspect and replace degraded bolts at both Salem units over the next several refueling outage cycles. We are participating with the Electric Power Research Institute, the Nuclear Energy Institute and other operators of similarly-designed pressurized water reactors in developing a strategy to maintain the long-term health of the reactor vessel internals.
Extension of the Salem Unit 1 outage into July and an unplanned outage at Salem Unit 2 due to a transformer failure currently under investigation reduced output from the Salem units in the third quarter. This was partially offset by increased production at our Hope Creek and Peach Bottom units. As a result our nuclear capacity factor forof the year ended December 31, 2016Tax Act, we recorded a one-time, non-cash earnings benefit of $745 million in 2017, including $588 million related to Power and $147 million related to Energy Holdings. This benefit was 86.9%.primarily due to the remeasurement of deferred tax balances. In addition, PSE&G recorded excess deferred taxes of approximately $2.1 billion and recorded an approximate $2.9 billion revenue impact of these excess deferred taxes as Regulatory Liabilities.
Pension Plan MergerBeginning in 2018, PSEG, on a consolidated basis, is incurring lower income tax expense resulting in a decrease in its effective income tax rate that has led to an increase in PSEG’s and Power’s Net Income. To the extent allowed under the Tax Act, Power’s operating cash flows will reflect the full expensing of capital investments for income tax purposes. For PSE&G, the Tax Act has led to lower customer rates due to lower income tax expense recoveries and the BPU and FERC have approved our proposal to refund excess deferred income tax Regulatory Liabilities. See Item 8. Note 7. Regulatory Assets and Liabilities for additional information. The impact of the lower federal income tax rate on PSE&G was reflected in PSE&G’s distribution base rate proceeding and its 2018 transmission formula rate filings. The Tax Act is generally expected to result in lower operating cash flows for PSE&G resulting from the elimination of bonus depreciation, partially offset by higher revenues due to the higher rate base.
In August 2018, the Internal Revenue Service (IRS) issued a Notice of Proposed Rulemaking (Notice) regarding the application of tax depreciation rules as amended by the Tax Act. While the Notice provides some guidance as to the application of the changes made by the Tax Act to the bonus depreciation rules, certain aspects remain unclear. Further, in November 2018 the IRS issued Proposed Regulations addressing the interest disallowance rules contained in the Tax Act. For non-regulated businesses, these rules set acap on the amount of interest that can be deducted in a given year. Any amount that is disallowed can be carried forward indefinitely. For 2018, PSEG and Power expect that a portion of their interest will be disallowed in the current period but realized in future periods. However, certain aspects of the proposed regulations are unclear; therefore, we recorded taxes based on our interpretation of the relevant statute.
We recorded amounts based on our interpretation of the Tax Act, the depreciation rules contained in the Notice and proposed interest disallowance regulations. Such amounts are subject to change based on several factors, including but not limited to, the IRS and state taxing authorities issuing final guidance and/or further clarification. Any further guidance or clarification could impact PSEG’s, PSE&G’s and Power’s financial statements. For additional information, see Item 8. Note 21. Income Taxes.
As a result of the enactment of the Tax Act, various state regulatory authorities, including the BPU, have taken action to ensure that excess federal income taxes previously collected in rates are returned to customers. We adjusted the revenue requirement in certain of our rate matters as a result of the change in the federal income tax rate. See Item 8. Note 7. Regulatory Assets and Liabilities for additional information.
In July 2018, the State of New Jersey made changes to its income tax laws, including imposing a temporary surtax on allocated corporate taxable income of 2.5% effective January 1, 2018 and 2019 and 1.5% in 2020 and 2021, as well as requiring corporate taxpayers to file in a combined reporting group as defined under New Jersey law starting in 2019. Both provisions include an exemption for public utilities. We believe PSE&G meets the definition of a public utility and, therefore, will not be impacted by the temporary surtax or be included in the combined reporting group. We expect these new provisions to unfavorably affect our non-utility business. In accordance with GAAP accounting for income taxes, deferred taxes are required to be measured at the enacted tax rate expected to apply to taxable income in the periods in which the deferred taxes are expected to settle. The newly enacted New Jersey tax legislation did not have a material impact on PSEG’s deferred income tax balance.
Amendments to Other Postretirement Employee Benefit (OPEB) Plans
In December 2018, PSEG amended certain provisions of its OPEB plans applicable to all current and future Medicare-eligible retirees and spouses who receive or will receive subsidized healthcare from PSEG. Effective January 1, 2021, the PSEG-sponsored Medicare-eligible plans will be replaced by a Medicare private exchange. For each Medicare-eligible retiree and spouse, PSEG will provide annual credits to a Health Reimbursement Arrangement, which can be used to pay for medical, prescription drug, and dental plan premiums, as well as certain out-of-pocket costs. The amendment resulted in a $559 million reduction in PSEG’s OPEB obligation as of December 31, 2016, PSEG merged its three qualified defined benefit pension plans (excluding Servco plans) into one plan, thereby also merging all of the pension plans’ assets. As a result, we estimate that in 2017, the total2018 and is expected to decrease net periodic benefit costs are expected to decrease by approximately $72 million or $48 million, net of amounts capitalized, as compared to the 2017 amounts that would have been recognized had the plans not been merged. This is due to the amortization period for gains and losses for the merged plan resulting in lower amortization than that of the individual plans. No changes were made to the benefit formulas, vesting provisions, or to the employees covered by the plans.
Pension and Other Postretirement Benefits—Change in Accounting Estimate
At the end of 2015, we changed the approach used to measure future service and interest costs for pension and other post-retirement benefits. For 2015 and prior, we calculated service and interest costs utilizing a single weighted-average discount rate derived from the yield curve used to measure the plan obligations. For 2016 and beyond, we have elected to calculate service and interest costs by applying the specific spot rates along that yield curve to the plans’ liability cash flows. We believe the new approach provides a more precise measurement of service and interest costs by aligning the timing of the plans’ liability cash flows to the corresponding spot rates on the yield curve. This change did not affect the measurement of the plan obligations. As a change in accounting estimate, this change was reflected prospectively. We reduced 2016 pension and OPEB expense by approximately $34 million and $13 million, respectively, net of amounts capitalized.
Operational Excellence
We emphasize operational performance while developing opportunities in both our competitive and regulated businesses. Flexibility in our generating fleet has allowed us to take advantage of opportunities in a rapidly evolving market as we remain diligent in managing costs. In 2016, our
diverse fuel mix and dispatch flexibility allowed us to generate approximately 52 terra-watt hours while addressing fuel availability and price volatility and compensating for the extended outages at our Salem units,
combined cycle fleet produced 16 terawatt hours at an average capacity factor of 57%, and
utility was recognized for the fifteenth consecutive year as the most reliable utility in the Mid-Atlantic region.
Financial Strength
Our financial strength is predicated on a solid balance sheet, positive operating cash flow and reasonable risk-adjusted returns on increased investment. Our financial position remained strong during 2016 as we:
maintained sufficient liquidity,
maintained solid investment grade credit ratings, and
increased our indicative annual dividend for 2016 to $1.64 per share.
We expect to be able to fund our planned capital requirements, as described in Liquidity and Capital Resources, without the issuance of new equity.
Disciplined Investment
We utilize rigorous investment criteria when deploying capital and seek to invest in areas that complement our existing business and provide reasonable risk-adjusted returns. These areas include upgrading our energy infrastructure, responding to trends in environmental protection and providing new energy supplies in domestic markets with growing demand. In 2016, we
made additional investments in transmission infrastructure projects,
began executing our GSMP and continued executing Energy Strong and other existing BPU-approved utility programs,
commenced construction of our Keys and Sewaren 7 generation projects for targeted commercial operation in 2018 and announced our plan to construct BH5 and commence operations in mid-2019, and
acquired solar energy projects totaling 248 MW-direct current (dc), of which 177 MW dc are already in-service, primarily in North Carolina, Colorado and Utah. The remaining MW dc are scheduled to be in-service by the fourth quarter of 2017.
2019.
Future Outlook
Our future success will depend on our ability to continue to maintain strong operational and financial performance in a slow-growing economy and a cost-constrainedan environment with low gas prices, to capitalize on or otherwise address appropriately regulatory and legislative developments that impact our business and to respond to the issues and challenges described below. In order to do this, we must continue to:
focus on controlling costs while maintaining safety, reliability and reliabilitycustomer satisfaction and complying with applicable standards and requirements,
successfully manage our energy obligations and re-contract our open supply positions in response to changes in prices and demand,
obtain approval of and execute our utility capital investment program, including ES II, GSMP II, our Energy StrongCEF program GSMP and other investments for growth that yield contemporaneous and reasonable risk-adjusted returns, while enhancing the resiliency of our infrastructure and maintaining the reliability of the service we provide to our customers,
effectively manage construction of our Keys, Sewaren 7, BH5 and our other generation projects,
advocate for measures to ensure the implementation by PJM and FERC of market design and transmission planning rules that continue to promote fair and efficient electricity markets,
engage multiple stakeholders, including regulators, government officials, customers and investors, and
successfully operate the LIPA T&D system and manage LIPA’s fuel supply and generation dispatch obligations.
For 2017In addition to the risks described elsewhere in this Form 10-K for 2019 and beyond, the key issues and challenges we expect our business to confront include:
regulatory and political uncertainty, both with regard to future energy policy, design of energy and capacity markets, transmission policy and environmental regulation, as well as with respect to the outcome of any legal, regulatory or other proceeding, settlement, investigation or claim, applicable to us and/or proceedings,
the energy industry,
fair and timely rate relief fromreview by the BPU and FERC for recovery of costs and return on investments, including with respectour application to select our distribution base rate case which must be filed withNew Jersey nuclear generation units to receive payments under the BPU no later than November 1, 2017,ZEC program,
the potential for comprehensive tax reform, particularly in lightcontinuing impacts of public statements by the current U.S. administrationTax Act and key members of Congress,
uncertainty in the national and regional economic recovery, continuing customer conservation efforts, changes in energy usage patternsstate tax laws, and evolving technologies, which impact customer behaviors and demand,
the potential for continuedimpact of reductions in demand and sustained lower natural gas and electricity prices both at market hubs and the locations where we operate,
the impact of lower natural gas prices and increasing environmental compliance costs on the competitiveness of our nuclear and remaining coal-fired generation plants, and the potential for retirement of such plants earlier than their current useful lives,costs.
delays and other obstacles that might arise in connection with the construction of our T&D, generation and other development projects, including in connection with permitting and regulatory approvals,
maintaining a diverse mix of fuels to mitigate risks associated with fuel price volatility and market demand cycles, and
FERC Staff’s continuing investigation of certain of Power’s New Jersey fossil generating unit bids in the PJM energy market.
Our primary investment opportunities are in two areas: our regulated utility business and our merchant power business. We continually assess a broad range of strategic options to maximize long-term stockholder value. In assessing our options, we consider a wide variety of factors, including the performance and prospects of our businesses; the views of investors, regulators, customers and rating agencies; our existing indebtedness and restrictions it imposes; and tax considerations, among other things. Strategic options available to us include:
the acquisition, construction or disposition of transmission and distributionT&D facilities, clean energy investments and/or generation units,projects, including offshore wind opportunities,
the disposition or reorganization of our merchant generation business or other existing businesses or the acquisition or development of new businesses,
the expansion of our geographic footprint,
continued or expanded participation in solar, demand response and energy efficiency programs, including the operation of T&D facilities outside of our traditional service territory, and
investments in capital improvements and additions, including the installation of environmental upgrades and retrofits, improvements to system resiliency, modernizing existing infrastructure and participation in transmission projects through FERC’s “open window” solicitation process.
In 2016, Power announced its intention to develop a retail platform to sell physical electricity and natural gas, which we believe would complement our existing wholesale marketing business. Power was granted licenses in 2016 to sell both electricity and gas in the states of New Jersey and Pennsylvania.
There can be no assurance, however, that we will successfully develop and execute any of the strategic options noted above, or any additional options we may consider in the future. The execution of any such strategic plan may not have the expected benefits or may have unexpected adverse consequences.
RESULTS OF OPERATIONS
|
| | | | | | | | | | | | | | |
| | | | | | | | | |
| | | | Years Ended December 31, | |
| | | | 2016 | | 2015 | | 2014 | |
| | Earnings (Losses) | | Millions | |
| | PSE&G | | $ | 889 |
| | $ | 787 |
| | $ | 725 |
| |
| | Power (A) | | 18 |
| | 856 |
| | 760 |
| |
| | Other (B) | | (20 | ) | | 36 |
| | 33 |
| |
| | PSEG Net Income | | $ | 887 |
| | $ | 1,679 |
| | $ | 1,518 |
| |
| | | | | | | | | |
| | PSEG Net Income Per Share (Diluted) | | $ | 1.75 |
| | $ | 3.30 |
| | $ | 2.99 |
| |
| | | | | | | | | |
|
| | | | | | | | | | | | | | |
| | | | | | | | | |
| | | | Years Ended December 31, | |
| | | | 2018 | | 2017 | | 2016 | |
| | Earnings (Losses) | | Millions | |
| | PSE&G | | $ | 1,067 |
| | $ | 973 |
| | $ | 889 |
| |
| | Power (A)(B) | | 365 |
| | 479 |
| | 18 |
| |
| | Other (B)(C) | | 6 |
| | 122 |
| | (20 | ) | |
| | PSEG Net Income | | $ | 1,438 |
| | $ | 1,574 |
| | $ | 887 |
| |
| | | | | | | | | |
| | PSEG Net Income Per Share (Diluted) | | $ | 2.83 |
| | $ | 3.10 |
| | $ | 1.75 |
| |
| | | | | | | | | |
| |
| (A) | Power’s results in 2016 includes2018 include an after-tax expensesgain of $396$39 million related tofrom the early retirementsale of its Hudson and Mercer coal/gas generation plants. See Item 8. Financial Statementsplants and Supplementary Data—Note 3. Early Plant Retirements for additional information. Power’s resultsafter-tax expenses of $577 million and $396 million in 20152017 and 2016, respectively, related to |
the early retirement of these generation plants. See Item 8. Note 4. Early Plant Retirements for additional information.
| |
| (B) | Results in 2017 include an after-tax insurance recovery for Superstorm Sandythe non-cash net income benefit of $102 million.$745 million, including $588 million related to Power and $147 million related to Energy Holdings, resulting from the remeasurement of deferred tax liabilities required due to the enactment of the Tax Act in December 2017. |
| |
(B)(C) | Other includes after-tax activities at the parent company, PSEG LI and Energy Holdings as well as intercompany eliminations. Energy Holdings recorded after-tax charges totaling $5 million, $45 million and $92 million related to its investments in NRG REMA, LLC’sREMA’s leveraged leases in 2016.2018, 2017 and 2016, respectively. See Item 8. Financial Statements and Supplementary Data—Note 7.8. Long-Term Investments and Note 8.9. Financing Receivables for further information. |
OurPower’s results above include the realized gains, losses and earnings on Power’s NDT Fund and other related NDT activity. Realized gains and losses, interest and dividend income and other costs related to the NDT Fund are recorded in Other Income (Deductions),activity and impairments on certain NDT securities are recorded as Other-Than-Temporary Impairments. Interest accretion expense on Power’s nuclear ARO is recorded in O&M Expense and the depreciation related to the ARO asset is recorded in Depreciation and Amortization Expense. In 2014, we restructured portions of our NDT Fund and realized a pre-tax gain of $65 million.
Our results also include the after-tax impacts of non-trading MTMcommodity mark-to-market (MTM) activity, which consist of the financial impact from positions with forwardfuture delivery dates.
The combined after-tax impact onvariances in our Net Income for the years ended December 31, 2016, 2015 and 2014 include theattributable to changes related to the NDT Fund and MTM activityare shown in the chart below:following table:
|
| | | | | | | | | | | | | | |
| | | | | | | | | |
| | Years Ended December 31, | | 2016 | | 2015 | | 2014 | |
| | | | Millions, after tax | |
| | NDT Fund and Related Activity (A) | | $ | — |
| | $ | 8 |
| | $ | 68 |
| |
| | Non-Trading MTM Gains (Losses) (B) | | $ | (100 | ) | | $ | 93 |
| | $ | 66 |
| |
| | | | | | | | | |
|
| | | | | | | | | | | | | | |
| | | | | | | | | |
| | Years Ended December 31, | | 2018 | | 2017 | | 2016 | |
| | | | Millions, after tax | |
| | NDT Fund and Related Activity (A) (B) | | $ | (90 | ) | | $ | 62 |
| | $ | — |
| |
| | Non-Trading MTM Gains (Losses) (C) | | $ | (84 | ) | | $ | (99 | ) | | $ | (100 | ) | |
| | | | | | | | | |
| |
| (A) | NDT Fund Income (Expense) includes gains and losses on NDT securities which are recorded in Net of tax (expense) benefit of $(5) million, $(16) millionGains (Losses) on Trust Investments. See Item 8. Note 10. Trust Investments for additional information. NDT Fund Income (Expense) also includes interest and $(70) million fordividend income and other costs related to the years ended December 31, 2016, 2015NDT Fund recorded in Other Income (Deductions), interest accretion expense on Power’s nuclear Asset Retirement Obligation (ARO) recorded in O&M Expense and 2014, respectively.the depreciation related to the ARO asset recorded in Depreciation and Amortization (D&A) Expense. |
| |
| (B) | Net of tax (expense) benefit of $68$54 million, $(65)$(72) million and $(45)$(5) million for the years ended December 31, 2018, 2017 and 2016, 2015respectively. |
| |
| (C) | Net of tax benefit of $33 million, $68 million and 2014,$68 million for the years ended December 31, 2018, 2017 and 2016, respectively. |
The 20162018 year-over-year decrease in Net Income was driven largely by
non-cash Net Income benefits in 2017 related to new tax legislation (See Item 8. Note 21. Income Taxes) at Power and Energy Holdings, and
recognition in 2018 of net unrealized losses on equity securities in the NDT Fund in accordance with new accounting guidance effective January 1, 2018 (See Item 8. Note 2. Recent Accounting Standards and Note 10. Trust Investments),
These decreases were partially offset by
accelerated depreciation in 2017 related to early retirement of our Hudson and Mercer coal/gas generation units at Power (See Item 8. Note 4. Early Plant Retirements),
the favorable impact at Power from the lower federal tax rate effective January 1, 2018, and
higher earnings due to investments in T&D programs and the favorable impact of new rates effective November 1, 2018 as a result of the BPU approval of our distribution base rate proceeding.
The 2017 year-over-year increase in our Net Income was driven primarily by:
chargesnon-cash Net Income benefits related to the early retirement of two coal/gas generation units at Powernew tax legislation (See Item 8. Financial StatementsNote 21. Income Taxes) at Power and Supplementary Data—Note 3. Early Plant Retirements),Energy Holdings,
MTM losses in 2016 as compared to MTMhigher transmission revenues,
higher net NDT gains in 2015,2017, and
lower volumes of energy sold at lower average realized sales prices,
lower capacity and operating reserve revenues in PJM,
higher 2016 congestion costs in PJM due primarily to realized gains on financial transmission rights (FTR) in PJM in the prior year due to extremely cold weather,
lower volumes of gas sold at lower average prices under the Basic Gas Supply Service (BGSS) contract,
insurance recoveries received primarily by Power in 2015 related to Superstorm Sandy, and
an impairmentcharges related to investments in certain leveraged leases at Energy Holdings (See Item 8. Financial Statements and Supplementary Data—Note 8. Financing Receivables)Long-Term Investments).
These decreases were partially offset by:
lower generation costs driven by lower fuel costs, particularly for natural gas, and reduced generation output at Power,
•higher costs incurred at Power for planned outages in 2015,
higher transmission revenues, and
higher management fee revenues at PSEG LI pursuant to the OSA.
The 2015 year-over-year increase in our Net Income was driven by:
higher transmission revenues,
lower generation costs due to lower fuel costs, primarily reflecting lower natural gas and coal prices,
higher MTM gains in 2015, and
insurance recoveries of Superstorm Sandy costs, primarily at Power.
These increases were partially offset by:
lower capacity revenues resulting from lower average auction prices coupled with lower ancillary and operating reserve revenues in the PJM region,
lower realized gains and higher other-than-temporary impairments related to the NDT Fund, and
higher pension and OPEB costs, net of amounts capitalized.
These increases were partially offset by:
higher charges related to the early retirement of our Hudson and Mercer coal/gas generation units at Power (See Item 8. Note 4. Early Plant Retirements), and
lower volumes of energy sold at lower average realized sales prices under the BGS contracts and in the PJM and New England regions.
PSEG
Our results of operations are primarily comprised of the results of operations of our principal operating subsidiaries, PSE&G and Power, excluding charges related to intercompany transactions, which are eliminated in consolidation. For additional information on intercompany transactions, see Item 8. Financial Statements and Supplementary Data—Note 24.25. Related-Party Transactions.
|
| | | | | | | | | | | | | | | | | | | | | | | | | | | | |
| | | | | | | | | | | | | | | | | |
| | | | | | | | | | Increase / (Decrease) | | Increase / (Decrease) | |
| | | | Years Ended December 31, | | |
| | | | 2016 | | 2015 | | 2014 |
| | 2016 vs. 2015 | 2015 vs. 2014 | |
| | | | Millions | | Millions | | % |
| | Millions | | % |
| |
| | Operating Revenues | | $ | 9,061 |
| | $ | 10,415 |
| | $ | 10,886 |
| | $ | (1,354 | ) | | (13 | ) | | $ | (471 | ) | | (4 | ) | |
| | Energy Costs | | 3,001 |
| | 3,261 |
| | 3,886 |
| | (260 | ) | | (8 | ) | | (625 | ) | | (16 | ) | |
| | Operation and Maintenance | | 3,008 |
| | 2,978 |
| | 3,150 |
| | 30 |
| | 1 |
| | (172 | ) | | (5 | ) | |
| | Depreciation and Amortization | | 1,476 |
| | 1,214 |
| | 1,227 |
| | 262 |
| | 22 |
| | (13 | ) | | (1 | ) | |
| | Income from Equity Method Investments | | 11 |
| | 12 |
| | 13 |
| | (1 | ) | | (8 | ) | | (1 | ) | | (8 | ) | |
| | Other Income (Deductions) | | 124 |
| | 152 |
| | 229 |
| | (28 | ) | | (18 | ) | | (77 | ) | | (34 | ) | |
| | Other-Than-Temporary Impairments | | 28 |
| | 53 |
| | 20 |
| | (25 | ) | | (47 | ) | | 33 |
| | N/A |
| |
| | Interest Expense | | 385 |
| | 393 |
| | 389 |
| | (8 | ) | | (2 | ) | | 4 |
| | 1 |
| |
| | Income Tax Expense | | 411 |
| | 1,001 |
| | 938 |
| | (590 | ) | | (59 | ) | | 63 |
| | 7 |
| |
| | | | | | | | | | | | | | | | | |
|
| | | | | | | | | | | | | | | | | | | | | | | | | | | | |
| | | | | | | | | | | | | | | | | |
| | | | | | | | | | Increase / (Decrease) | | Increase / (Decrease) | |
| | | | Years Ended December 31, | | |
| | | | 2018 | | 2017 | | 2016 | | 2018 vs. 2017 | 2017 vs. 2016 | |
| | | | Millions | | Millions | | % |
| | Millions | | % |
| |
| | Operating Revenues | | $ | 9,696 |
| | $ | 9,094 |
| | $ | 8,966 |
| | $ | 602 |
| | 7 |
| | $ | 128 |
| | 1 |
| |
| | Energy Costs | | 3,225 |
| | 2,778 |
| | 2,901 |
| | 447 |
| | 16 |
| | (123 | ) | | (4 | ) | |
| | Operation and Maintenance | | 3,015 |
| | 2,901 |
| | 2,991 |
| | 114 |
| | 4 |
| | (90 | ) | | (3 | ) | |
| | Depreciation and Amortization | | 1,158 |
| | 1,986 |
| | 1,476 |
| | (828 | ) | | (42 | ) | | 510 |
| | 35 |
| |
| | Income from Equity Method Investments | | 15 |
| | 14 |
| | 11 |
| | 1 |
| | 7 |
| | 3 |
| | 27 |
| |
| | Net Gains (Losses) on Trust Investments | | (143 | ) | | 134 |
| | (6 | ) | | (277 | ) | | N/A |
| | 140 |
| | N/A |
| |
| | Other Income (Deductions) | | 85 |
| | 82 |
| | 102 |
| | 3 |
| | 4 |
| | (20 | ) | | (20 | ) | |
| | Non-Operating Pension and OPEB Credits (Costs) | | 76 |
| | — |
| | (22 | ) | | 76 |
| | N/A |
| | 22 |
| | N/A |
| |
| | Interest Expense | | 476 |
| | 391 |
| | 385 |
| | 85 |
| | 22 |
| | 6 |
| | 2 |
| |
| | Income Tax (Benefit) Expense | | 417 |
| | (306 | ) | | 411 |
| | 723 |
| | N/A |
| | (717 | ) | | N/A |
| |
| | | | | | | | | | | | | | | | | |
The 2016, 20152018, 2017 and 20142016 amounts in the preceding table for Operating Revenues and O&M costs each include $410$458 million, $375$438 million and $389$410 million, respectively, for Servco.PSEG LI’s subsidiary, Long Island Electric Utility Servco, LLC (Servco). These amounts represent the O&M pass-through costs for the Long Island operations, the full reimbursement of which is reflected in Operating Revenues. See Item 8. Financial Statements and Supplementary Data—Note 4.5. Variable Interest EntitiesEntity for further explanation. The Income Tax Benefit in 2017 includes the non-cash benefit resulting from the remeasurement of deferred tax liabilities required due to the enactment of the Tax Act in December 2017. The following discussions for PSE&G and Power provide a detailed explanation of their respective variances.
PSE&G
|
| | | | | | | | | | | | | | | | | | | | | | | | | | | | |
| | | | | | | | | | | | | | | | | |
| | | | Years Ended December 31, | | Increase / (Decrease) | | Increase / (Decrease) | |
| | | | 2016 | | 2015 | | 2014 | | 2016 vs. 2015 | 2015 vs. 2014 | |
| | | | Millions | | Millions | | % |
| | Millions | | % |
| |
| | Operating Revenues | | $ | 6,221 |
| | $ | 6,636 |
| | $ | 6,766 |
| | $ | (415 | ) | | (6 | ) | | $ | (130 | ) | | (2 | ) | |
| | Energy Costs | | 2,567 |
| | 2,722 |
| | 2,909 |
| | (155 | ) | | (6 | ) | | (187 | ) | | (6 | ) | |
| | Operation and Maintenance | | 1,475 |
| | 1,560 |
| | 1,558 |
| | (85 | ) | | (5 | ) | | 2 |
| | — |
| |
| | Depreciation and Amortization | | 565 |
| | 892 |
| | 906 |
| | (327 | ) | | (37 | ) | | (14 | ) | | (2 | ) | |
| | Other Income (Deductions) | | 79 |
| | 75 |
| | 58 |
| | 4 |
| | 5 |
| | 17 |
| | 29 |
| |
| | Interest Expense | | 289 |
| | 280 |
| | 277 |
| | 9 |
| | 3 |
| | 3 |
| | 1 |
| |
| | Income Tax Expense | | 515 |
| | 470 |
| | 449 |
| | 45 |
| | 10 |
| | 21 |
| | 5 |
| |
| | | | | | | | | | | | | | | | | |
|
| | | | | | | | | | | | | | | | | | | | | | | | | | | | |
| | | | | | | | | | | | | | | | | |
| | | | Years Ended December 31, | | Increase / (Decrease) | | Increase / (Decrease) | |
| | | | 2018 | | 2017 | | 2016 | | 2018 vs. 2017 | 2017 vs. 2016 | |
| | | | Millions | | Millions | | % |
| | Millions | | % |
| |
| | Operating Revenues | | $ | 6,471 |
| | $ | 6,324 |
| | $ | 6,303 |
| | $ | 147 |
| | 2 |
| | $ | 21 |
| | — |
| |
| | Energy Costs | | 2,520 |
| | 2,421 |
| | 2,644 |
| | 99 |
| | 4 |
| | (223 | ) | | (8 | ) | |
| | Operation and Maintenance | | 1,575 |
| | 1,458 |
| | 1,465 |
| | 117 |
| | 8 |
| | (7 | ) | | — |
| |
| | Depreciation and Amortization | | 770 |
| | 685 |
| | 565 |
| | 85 |
| | 12 |
| | 120 |
| | 21 |
| |
| | Net Gains (Losses) on Trust Investments | | (1 | ) | | 2 |
| | — |
| | (3 | ) | | N/A |
| | 2 |
| | N/A |
| |
| | Other Income (Deductions) | | 80 |
| | 85 |
| | 79 |
| | (5 | ) | | (6 | ) | | 6 |
| | 8 |
| |
| | Non-Operating Pension and OPEB Credits (Costs) | | 59 |
| | (8 | ) | | (15 | ) | | 67 |
| | N/A |
| | 7 |
| | (47 | ) | |
| | Interest Expense | | 333 |
| | 303 |
| | 289 |
| | 30 |
| | 10 |
| | 14 |
| | 5 |
| |
| | Income Tax Expense | | 344 |
| | 563 |
| | 515 |
| | (219 | ) | | (39 | ) | | 48 |
| | 9 |
| |
| | | | | | | | | | | | | | | | | |
Year Ended December 31, 20162018 as compared to 20152017
Operating Revenues decreased$415 millionincreased $147 million due to changes in delivery, clause, commodity and other operating revenues.
Delivery Revenues increased $19144 million due primarily to an increase in transmission revenues..
Transmission revenues were $223increased $180 millionhigher due to higher revenue requirements calculated through our transmission formula rate, primarily to recover required investments.
Gas distribution revenues increased $67 million due to $63 million from higher sales volumes, $36 million from the inclusion of the GSMP I in base rates, $25 million from an increase in the distribution tariff rates effective November 1, 2018 and $2 million in higher collections of Green Program Recovery Charges (GPRC). These increases were partially offset by lower Weather Normalization Clause (WNC) revenues of $31 million, a $26 million reduction for Tax Adjustment Credits (TAC) and a $2 million reduction in ES I collections.
Electric distribution revenues increased $62 million due primarily to a $49 million increase in sales volume, a $17 million increase in ES I collections, $6 million from an increase in the distribution tariff rates effective November 1, 2018 and $4 million in higher collections of GPRC. These increases were partially offset by a reduction of $14 million in TAC.
Transmission, electric distribution and gas distribution revenue requirements were $265 million lower as a result of rate reductions due to the Tax Act which reduced the corporate income tax rate. This decrease is offset in Income Tax Expense.
Clause Revenues increased $2 million due to higher Societal Benefit Charges (SBC) of $14 million, and $2 million in higher Solar Pilot Recovery Charge (SPRC) collections, partially offset by decreases of $7 million in Margin Adjustment Clause (MAC) revenues and $7 million in TAC and GPRC deferrals. The changes in SBC, SPRC and MAC collections and TAC and GPRC deferrals were entirely offset by the amortization of related costs (Regulatory Assets) in O&M, D&A and Interest and Tax Expense. PSE&G does not earn margin on SBC, SPRC or MAC collections or on TAC or GPRC deferrals.
Commodity Revenues increased $99 million due to higher Electric revenues and higher Gas revenues. This increase is entirely offset with increased Energy Costs. PSE&G earns no margin on the provision of BGS and basic gas supply service (BGSS) to retail customers.
Electric revenues increased $73 million due to $67 million in higher net BGS revenues reflecting $148 million from higher BGS sales volumes partially offset by $81 million from lower prices, and $6 million in higher revenues from solar renewable energy credit (SREC) sales.
Gas revenues increased $26 million due to $65 million from higher BGSS sales volumes, which were partially offset by lower BGSS prices of $42 million, and $3 million in higher BGSS Asset Charges.
Operating Expenses
Energy Costs increased $99 million. This is entirely offset by Commodity Revenues.
Operation and Maintenance increased $117 million, due to a $24 million increase in electric distribution maintenance expenditures, a $24 million increase in transmission maintenance expenditures, a $16 million increase in appliance service costs, a $12 million net increase for various clause mechanisms and GPRC expenditures, a $9 million increase in storm-related costs, an $8 million increase in gas distribution expenditures, a $6 million net increase in pension and OPEB expenses, net of amounts capitalized, a $3 million increase in damage claims, and a $15 million increase in other operating expenses.
Depreciation and Amortizationincreased$85 million due primarily to an increase in depreciation of $81 million due to additional plant placed into service, a $7 million net increase in amortization of Regulatory Assets primarily due to the settlement of our base rate proceeding and an increase of $5 million in software amortization, partially offset by a $7 million increase in capitalized depreciation.
Non-Operating Pension and OPEB Credits (Costs) reflect an increase of $67 million in credits primarily due to the adoption of new accounting guidance effective January 1, 2018 which no longer allows for the capitalization of any portion of these benefit costs. See Item 8. Note 2. Recent Accounting Standards.
Other Income (Deductions) decreased $5 million due primarily to a $2 million decrease in the Allowance for Funds Used During Construction (AFUDC) and a $3 million decrease in solar loan interest.
Interest Expense increased $30 million due primarily to increases of $16 million due to long-term debt issuances in May and December 2017, $8 million due to net long-term debt issuances in 2018 and $4 million in clause-related interest.
Income Tax Expense decreased $219 million due primarily to the decrease in the federal statutory income tax rate from 35% in 2017 to 21% in 2018 and lower pretax income.
Year Ended December 31, 2017 as compared to 2016
Operating Revenues increased $21 million due to changes in delivery, clause, commodity and other operating revenues.
Delivery Revenues increased $166 million due primarily to an increase in transmission revenues.
Transmission revenues were $152 million higher due to higher revenue requirements calculated through our transmission formula rate, primarily to recover required investments.
Gas distribution revenues increased $30 million due to a $16 million increase due to Energy Strong I, $10 million from inclusion of the GSMP I in base rates, $4 million in higher collections of GPRC and an increase of $2 million due to higher sales volumes. These increases were partially offset by lower WNC revenues of $2 million.
Electric distribution revenues decreased $27$16 million due primarily to $47a $28 million decrease in sales volume and $14 million in lower collections of Green Program Recovery Charges (GPRC),GPRC, partially offset by an $18a $26 million increase in Energy Strong I revenues.
Gas distribution revenues decreased$5 millionClause Revenues due to a decrease of $43 million due to lower sales volumes and $7 million in lower collections of GPRC. These decreases were partially offset by higher Weather Normalization Clause (WNC) revenues of $25 million due to warmer weather in 2016 compared to 2015 and $20increased $75 million due to the inclusionabsence of Energy Strongthe return in base rates.
Clause Revenuesdecreased$445 million due2016 to lowercustomers of overcollections of Securitization Transition Charge (STC) revenues of $419$59 million, lower Societal Benefit Charges (SBC)higher GPRC collections of $33$28 million, and lower Solar Pilot Recovery Charges (SPRC)higher MAC revenues of $8$4 million. These decreasesincreases were partially offset by higher Margin Adjustment Clause (MAC) revenueslower SBC of $15$17 million. The changes in STC, SBC, SPRCGPRC, MAC and MACSBC amounts were entirely offset by the amortization of related costs (Regulatory Assets) in O&M, Depreciation and AmortizationD&A and Interest Expense. PSE&G does not earn margin on STC, SBC, SPRCGPRC, MAC or MACSBC collections.
Commodity Revenues decreased $155$223 million due to lower Electric andrevenues partially offset by higher Gas revenues. This decrease is entirely offset with decreased Energy Costs. PSE&G earns no margin on the provision of BGS and BGSS to retail customers.
Electric revenues decreased $136$288 million due to $73$199 million in lower BGS revenues reflecting $109 million from lower sales volumes and $90 million from lower prices, $61 million in lower collections of Non-Utility Generation (NUG) Charges (NGC) due primarily to lower prices, $42a $14 million decrease from sales of SRECs and $14 million in lower revenues from the saledecreased sales volume of Non-Utility Generation (NUG) energy and $21 million in lower BGS revenues primarily due to lower sales volumes.NUG energy.
Gas revenues decreased $19increased $65 million due to $80higher BGSS prices of $68 million and $2 million from lowerhigher sales volumes, partially offset by higher$5 million in lower BGSS prices of $61 million.Asset Charges.
Operating Expenses
Energy Costs decreased $155$223 million. This is entirely offset by Commodity Revenues.
Operation and Maintenance decreased $85$7 million due to
a $98 million net reduction related to various clause mechanisms and GPRC, and
a $13 million decrease in pension and OPEB expenses, net of amounts capitalized,
partially offset by $10 million of insurance recovery proceeds in 2015,
a $10 million increase in vegetation management costs, and
a $6 million net increase due primarily to transmission and distribution corrective maintenance and appliance service costs.
Depreciation and Amortizationdecreased$327 million due primarily to a $396$15 million net decrease in amortization of Regulatory Assets,appliance service costs, partially offset by an $8 million net increase in depreciation of $65 million due additional plant placed into service in 2016.
Interest Expense increased $9 million due to increases of
$14 million due to net debt issuances in 2015, and
$13 million due to net debt issuances in 2016,
partially offset by a decreases of $11 million due to the redemption of securitization debt in 2015 and
$7 million of higher interest related to BGSS in 2015.
Income Tax Expenseincreased$45 million due primarily to higher pre-tax income partially offset by changes in the reserve for uncertain tax positions and flow through items.
Year Ended December 31, 2015 as compared to 2014
Operating Revenues decreased $130 million due to changes in delivery, clause, commodity and other operating revenues.expenses.
Delivery Revenues increased $212 million due primarily to an increase in transmission revenues.
Transmission revenues were $164 million higher due to higher revenue requirements calculated through our transmission formula rate, primarily to recover required investments.
Electric distribution revenuesDepreciation and Amortization increased $31$120 million due primarily to higher sales volumes due to weather.
Gas distribution revenues increased $17 million due to higher WNC revenues of $35 million due to warmer weather in 2015 compared to 2014, partially offset by $18 million due to lower sales volumes.
Clause Revenues decreased $154 million due to lower STC revenues of $86 million, lower SBC of $31 million, lower MAC of $29 million, and lower SPRC of $8 million. The changes in STC, SBC, MAC and SPRC amounts were entirely offset by decreases in the amortization of Regulatory Assets and related costs in O&M, Depreciation and Amortization and Interest Expense. PSE&G does not earn margin on STC, SBC, MAC or SPRC collections.
Commodity Revenues decreased $187 million due to lower Gas revenues, partially offset by higher Electric revenues. This is entirely offset with decreased Energy Costs. PSE&G earns no margin on the provision of BGS and BGSS to retail customers.
Gas revenues decreased $266 million due to lower BGSS prices of $295 million, partially offset by $29 million from higher sales volumes. The average price of natural gas was 29% lower to the customer in 2015 than in 2014.
Electric revenues increased $79 million due to $120 million in higher net BGS revenues, comprised of $166 million from higher sales volumes, partially offset by lower prices of $46 million. BGS sales volume increased due primarily to weather. The BGS net revenue increase was partially offset by $41 million in lower revenues from the sale of NUG energy and the collections of NGC due primarily to lower prices.
Operating Expenses
Energy Costs decreased $187 million. This is entirely offset by Commodity Revenues.
Operation and Maintenance increased $2 million, of which the most significant components were increases of
$33 million in pension and OPEB expenses, net of amounts capitalized,
$13 million in transmission operating expenses,
$7 million in gas bad debt expense, and
a $49$61 million net increase due to various increases, including information technology expenditures, wages, appliance service costs and preventative maintenance,
almost entirely offset by a $90 million net reduction related to various clause mechanisms, GPRC and the Capital Infrastructure Program, and
$10 million of insurance recovery proceeds.
Depreciation and Amortization decreased $14 million due to a $69 million decrease in amortization of Regulatory Assets, partially offset byincluding the absence of the STC liability that ended in 2016, and an increase in depreciation of $55$59 million due to additional plant placed into service in service.2017.
Non-Operating Pension and OPEB Credits (Costs) reflect a decrease in costs of $7 million due primarily to a decrease in the amortization of the net unrecognized actuarial pension loss, partially offset by the impacts of capitalization.
Other Income (Deductions)net increased $6 million due primarily to an increase of $17 million in AFUDC.
Interest Expense increased $3$14 million due primarily to increases of
$12an $11 million increase due to net long-term debt issuances in 2016 and $9 million due to net long-term debt issuances in the latter half of 2014, and
$9 million due to net debt issuances in 2015,
2017, partially offset by a decrease of $17$6 million due to the redemption of securitization debtclause-related interest for BGSS in 2015.2016.
Income Tax Expense increased $21$48 million due primarily to higher pre-tax income.
Power
|
| | | | | | | | | | | | | | | | | | | | | | | | | | | | |
| | | | | | | | | | | | | | | | | |
| | | | Years Ended December 31, | | Increase / (Decrease) | | Increase / (Decrease) | |
| | | | 2016 | | 2015 | | 2014 | | 2016 vs. 2015 | 2015 vs. 2014 | |
| | | | Millions | | Millions | | % |
| | Millions | | % |
| |
| | Operating Revenues | | $ | 4,023 |
| | $ | 4,928 |
| | $ | 5,434 |
| | $ | (905 | ) | | (18 | ) | | $ | (506 | ) | | (9 | ) | |
| | Energy Costs | | 1,986 |
| | 2,150 |
| | 2,747 |
| | (164 | ) | | (8 | ) | | (597 | ) | | (22 | ) | |
| | Operation and Maintenance | | 1,143 |
| | 1,057 |
| | 1,186 |
| | 86 |
| | 8 |
| | (129 | ) | | (11 | ) | |
| | Depreciation and Amortization | | 881 |
| | 291 |
| | 292 |
| | 590 |
| | N/A |
| | (1 | ) | | — |
| |
| | Income from Equity Method Investments | | 11 |
| | 14 |
| | 14 |
| | (3 | ) | | (21 | ) | | — |
| | — |
| |
| | Other Income (Deductions) | | 45 |
| | 97 |
| | 170 |
| | (52 | ) | | (54 | ) | | (73 | ) | | (43 | ) | |
| | Other-Than-Temporary Impairments | | 28 |
| | 53 |
| | 20 |
| | (25 | ) | | (47 | ) | | 33 |
| | N/A |
| |
| | Interest Expense | | 84 |
| | 121 |
| | 122 |
| | (37 | ) | | (31 | ) | | (1 | ) | | (1 | ) | |
| | Income Tax Expense (Benefit) | | (61 | ) | | 511 |
| | 491 |
| | (572 | ) | | N/A |
| | 20 |
| | 4 |
| |
| | | | | | | | | | | | | | | | | |
|
| | | | | | | | | | | | | | | | | | | | | | | | | | | | |
| | | | | | | | | | | | | | | | | |
| | | | Years Ended December 31, | | Increase / (Decrease) | | Increase / (Decrease) | |
| | | | 2018 | | 2017 | | 2016 | | 2018 vs. 2017 | 2017 vs. 2016 | |
| | | | Millions | | Millions | | % |
| | Millions | | % |
| |
| | Operating Revenues | | $ | 4,146 |
| | $ | 3,860 |
| | $ | 3,861 |
| | $ | 286 |
| | 7 |
| | $ | (1 | ) | | — |
| |
| | Energy Costs | | 2,197 |
| | 1,913 |
| | 1,824 |
| | 284 |
| | 15 |
| | 89 |
| | 5 |
| |
| | Operation and Maintenance | | 999 |
| | 1,046 |
| | 1,139 |
| | (47 | ) | | (4 | ) | | (93 | ) | | (8 | ) | |
| | Depreciation and Amortization | | 354 |
| | 1,268 |
| | 881 |
| | (914 | ) | | (72 | ) | | 387 |
| | 44 |
| |
| | Income from Equity Method Investments | | 15 |
| | 14 |
| | 11 |
| | 1 |
| | 7 |
| | 3 |
| | 27 |
| |
| | Net Gains (Losses) on Trust Investments | | (140 | ) | | 125 |
| | (6 | ) | | (265 | ) | | N/A |
| | 131 |
| | N/A |
| |
| | Other Income (Deductions) | | 21 |
| | 20 |
| | 23 |
| | 1 |
| | 5 |
| | (3 | ) | | (13 | ) | |
| | Non-Operating Pension and OPEB Credits (Costs) | | 15 |
| | 8 |
| | (4 | ) | | 7 |
| | 88 |
| | 12 |
| | N/A |
| |
| | Interest Expense | | 76 |
| | 50 |
| | 84 |
| | 26 |
| | 52 |
| | (34 | ) | | (40 | ) | |
| | Income Tax Expense (Benefit) | | 66 |
| | (729 | ) | | (61 | ) | | 795 |
| | N/A |
| | (668 | ) | | N/A |
| |
| | | | | | | | | | | | | | | | | |
Year Ended December 31, 20162018 as compared to 20152017
Operating Revenues decreasedincreased $905286 million due to changes in generation, gas supply and other operating revenues.
Generation Revenues decreased$714 millionincreased $199 million due primarily to
a decrease of $317 million due to MTM losses in 2016 as compared to MTM gains in 2015. Of this amount, $199 million was due to changes in forward power prices resulting in lower MTM gains this year compared to last year. Also contributing to the decrease was $118 million of higher gains on positions reclassified to realized upon settlement this year compared to last year,
a decrease of $298 million in energy sales volumes in the PJM, NE and NY regions due primarily to milder weather in 2016 and lower average realized prices,
a decrease of $80 million in capacity revenue primarily in the PJM region due to the retirement of older peaking units in June 2015, and
a decrease of $49 million due to lower operating reserve revenues in the PJM region due to less congestion and lower prices,
partially offset by a net increase of $19$113 million due primarily to higher volumes of electricity sold under wholesale load contracts in the PJM region coupled with the commencement of commercial operations for Keys and NE regions,Sewaren 7 in mid-2018, partially offset by lower average realized prices and higher purchases for wholesale load contracts in the PJM region,
a net increase of $110 million due to lower MTM net losses in 2018 as compared to 2017. Of this amount, there was a $153 million increase due to gains on positions reclassified to realized upon settlement, partially offset by a net decrease of $43 million due to changes in forward prices,
a net increase of $26 million in capacity revenues due primarily to increases in auction prices in the PJM region,
a net increase of $24 million resulting from a prior year reduction to revenue for excess federal income tax previously collected by Power’s subsidiary, PSEG New Haven LLC, from ratepayers due to the change in federal tax rates, and
a net increase of $8$7 million due to higher sales related to new solar projects, beginning commercial operations.
partially offset by a decrease of $82 million in electricity sold under our BGS contracts due to lower prices and lower volumes.
Gas Supply Revenues decreasedincreased $191$87 million due primarily to
a decreasean increase of $183$61 million in sales under the BGSS contract, of which $53 million was due primarily to lowerincreases in sales volumes as a result of periods of colder weather in the heating season, coupled with $8 million due to higher average sales prices, and a decrease in
an increase of $42 million related to sales to third parties, of which $26 million was due to higher sales volumes dueand $16 million to warmerhigher average temperatures in the 2016 heating season, andsales prices,
partially offset by a decrease of $9$16 million due to net MTM losses in 2016 due2018 compared to changesnet gains in forward prices.2017.
Operating Expenses
Energy Costs represent the cost of generation, which includes fuel costs for generation as well as purchased energy in the market, and gas purchases to meet Power’s obligation under its BGSS contract with PSE&G. Energy Costs decreased $164increased $284 million due to
Generation costs decreased $95increased $167 million due primarily to
lowerhigher fuel costs of $288$158 million reflecting lower average realizedutilization of higher volumes of gas and oil in the PJM region, primarily due to the commencement of commercial operations of Keys and Sewaren 7 fossil stations in mid-2018, coupled with higher prices forof natural gas in the PJM and New York regions and higher coal costs in the utilizationPJM and New England (NE) regions, and
an increase of lower volumes of fuel,$40 million due to MTM losses in 2018 as compared to gains in 2017 due to changes in forward prices,
partially offset by a net increasedecrease of $143$22 million primarily due to realized gains on FTRs in PJMa decrease in the prior yearvolume of energy purchased in the NE region to serve load obligations, and
a net decrease of $14 million due to extremely cold weather, and
a $62 million chargecharges primarily related to additional retirement costs incurred in 2017 associated with the announced early retirement of the Hudson and Mercer and Hudson units, primarily related to a coal inventory write-down.units.
Gas costs decreased $69increased $117 million due primarily to
a decreasean increase of $101$75 million related to sales under the BGSS contract due primarily to lower average gas costs and a decrease$51 million increase in volumes sold due to warmer average temperaturesperiods of colder weather during the 2016 winter heating season in 2018 as compared to 2017, and $24 million of higher average gas costs, and
partially offset by an increase of $32$38 million related to sales to third parties, of which $25 million was due primarilyto an increase in volumes sold coupled with $13 million due to higher average gas costs and an increase in volumes sold.costs.
Operation and Maintenance increased $86decreased $47 million due primarily to
$145a $67 million decrease at our fossil plants, due primarily to a pre-tax gain of insurance recoveries received$54 million on the sale of the Hudson and Mercer units in 20152018 and associated shutdown costs incurred in 2017, partially offset by higher planned outage costs in 2018 associated with our various other fossil plants,
partially offset by a $22 million net increase at our nuclear facilities primarily due to higher planned outage costs at our 100%-owned Hope Creek nuclear plant in 2018 as compared to our 57%-owned Salem Unit 1 nuclear plant in 2017, coupled with higher accretion directly related to Superstorm Sandy,an increase in the nuclear ARO in 2017.
Depreciation and Amortization decreased $914 million due primarily to
$53a $964 million of charges relateddecrease primarily due to accelerated depreciation recorded in 2017 for the early retirement of the Hudson and Mercer units,
partially offset by a net decrease of $73$23 million related to our fossil plants, largelyincrease due to higher costs incurred in 2015 for our planned major outages at the Bethlehem Energy CenterKeys and Bergen generating plants,
a net decrease of $31 million related to our nuclear plants due primarily to lower planned outage costs at our 100%-owned Hope Creek plant and our 57%-owned Salem Unit 1 plant, andSewaren 7 fossil stations being placed into service,
an $8increase of $12 million decrease due to lower pension and OPEB costs.
Depreciation and Amortization increased $590 million due primarily to
$555 million of acceleratedin depreciation due to the early retirement ofincrease in the Hudsonnuclear ARO in late 2017, and Mercer units,
a $24$7 million increase in 2018 due primarily to a higher nuclear asset base and
$5 million of higher depreciation due to new solar projects.from increased capitalized asset retirement costs.
Other Income (Deductions)Net Gains (Losses) on Trust Investments decreased $52$265 million due primarily to $28
the inclusion in 2018 of $209 million of insurance recoveries receivednet unrealized losses on equity investments in 2015 related to Superstorm Sandy and $38 million of lower net realized gains from the NDT Fund in 2016, accordance with new accounting guidance, and
a $64 million decrease in net realized gains on NDT Fund investments,
partially offset by $10a $12 million of lower purchased tax creditsdecrease in 2016.
Other-Than-Temporary Impairments decreased $25 million due to lowerother-than-temporary impairments of equity securities in the NDT FundFund.
Non-Operating Pension and OPEB Credits (Costs) reflect an increase in 2016.credits of $7 million due primarily to an increase in the expected return on pension plan assets.
Interest Expense decreased $37increased $26 million due primarily to
$27 million of interest capitalized for the construction of three new fossil stations: Bridgeport Harbor 5, Sewaren 7 and Keys Energy Center, and
a $15 million decreaseincrease due to the maturitya June 2018 debt issuance and $11 million in lower capitalized interest as a result of 5.50% of Senior Notes in December 2015,
partially offset by an increase of $5 million due to net debt issuances in 2016.Keys and Sewaren 7 fossil stations being placed into service.
Income Tax Expense decreased $572increased $795 million in 2016 due primarily to a pre-tax lossone-time benefit recorded in 20162017 as compared toa result of the remeasurement of deferred tax balances and higher pre-tax income in 2015.2018. This increase was partially offset by the favorable impacts in 2018 of a decrease in the federal statutory income tax rate from 35% in 2017 to 21% and the remeasurement of the reserve for uncertain tax positions in connection with a 2015 claim to carry back tax-defined nuclear decommissioning costs and the 2011 and 2012 federal tax audit.
Year Ended December 31, 20152017 as compared to 20142016
Operating Revenues decreased $506$1 million due to changes in generation, gas supply and other operating revenues.
Generation Revenues decreased $172$112 million due primarily to
a decrease of $192$100 million in electricity sold under our BGS contracts due primarily to lower capacity revenues resulting from lower average auction prices and the retirement of older peaking units in June 2015,volumes coupled with lower ancillary and operating reserve revenuesprices,
a decrease of $41 million in energy sales in the PJM region, and
lower net revenues of $73 million NE regions due primarily to lower energy volumes soldaverage realized prices,
a decrease of $24 million in revenue expected to be returned to ratepayers associated with excess federal income tax previously collected by Power’s subsidiary, PSEG New Haven LLC, due to the change in federal tax rates effective January 1, 2018,
a decrease of $12 million in operating reserves in the NEPJM region, and lower average realized prices
a charge of $10 million due to an increase in the NE and NY regions,FERC accrual related to the PJM bidding matter,
a decrease of $7 million due to higher MTM losses in 2017 as compared to 2016. Of this amount, $120 million was due to increased forward prices, partially offset by higher energy volumes sold in the NY and PJM regions. Also included in the neta decrease is $22of $113 million due to lower MTM gains on positions reclassified to realized upon settlement in 2015.2017 as compared to 2016,
partially offset by ana net increase of $56$53 million due primarily to higher volumes of electricity sold under wholesale load contracts in the PJM and NE regions, coupled with higher average prices
a net increase of $18 million in capacity revenues in the PJM and NE region,regions due to increases in cleared capacity and capacity auction prices, and
an increase of $37$11 million due primarily to higher volumes of electricity sold under the BGS contract at higher average prices.sales related to new solar projects.
Gas Supply Revenues decreased $336increased $110 million due primarily to
a net decreasean increase of $214$67 million in sales under the BGSS contract, substantially comprised of lower average sales prices, and
a decrease of $122 million on sales to third-party customers, of which $93$40 million was due to lowerhigher average sales prices coupled with a $27 million increase in sales volumes due to periods of colder weather in the heating season,
a net increase of $24 million due to higher MTM gains in 2017 as compared to 2016, and
an increase of $19 million related to sales to third parties, of which $48 million was due to higher average sales prices, partially offset by $29 million toof lower volumes sold.
Operating Expenses
Energy Costs represent the cost of generation, which includes fuel costs for generation as well as purchased energy in the market, and gas purchases to meet Power’s obligation under its BGSS contract with PSE&G. Energy Costs decreased $597increased $89 million due to
Gas costs increased $66 million due to
an increase of $50 million related to sales under the BGSS contract, of which $31 million was due to higher average gas costs, coupled with a $19 million increase in volumes sold due to periods of colder weather in the heating season, and
an increase of $16 million related to sales to third parties, of which $44 million was due to higher average gas costs, partially offset by a $28 million decrease in volumes sold.
Generation costs decreased $254increased $23 million due primarily to lower
higher fuel costs of $330$31 million reflecting lowerhigher average realized prices for natural gas andcoupled with the utilization of higher volumes of coal, prices andpartially offset by the utilization of lower volumes of oil and coal.gas,
an increase of $17 million due to MTM gainslosses in 20152017 as compared to MTM lossesgains in 2014 resulted2016,
a net increase of $17 million primarily due to an increase in the volume of energy purchases in the NE region to serve load obligations, and
a $66net increase of $10 million decrease. These decreased costs were primarily due to higher transmission charges resulting from higher rates,
partially offset by higher congestion costsa net decrease of $50 million due to charges associated with the announced early retirement of the Mercer and Hudson units in the PJM region of $140 million.
Gas costs decreased $343 million mainly2016, primarily related to a decreaselower coal inventory write-downs in average gas2017, partially offset by additional retirement costs on both obligations under the BGSS contract and sales to third parties.
incurred in 2017.Operation and Maintenance decreased $129$93 million due primarily to
a $72 million decrease of $145 million due to insurance recoveries received in 2015 related to Superstorm Sandy, and
a net decrease of $61 million related toat our fossil plants, largely due primarily to higher costs incurred in 2014 for planned outage costs, including maintenancethe retirement of the Hudson and installation of upgraded technology at our Linden combined cycle gas generating plant, partially offset byMercer units and higher planned outage costs in 2015 at our BEC generating plant2016, and installation of upgraded technology at our combined cycle Bergen plant,
partially offset by an increase of $51a $35 million net decrease at our nuclear facilities primarily due to higherlower planned outage costs at our 100%57%-owned Hope Creek and 50%-owned Peach Bottom 3Salem nuclear plants in 20152017 as compared to our 57%100%-owned Hope Creek nuclear plant and Salem Unit 1 nuclear unit 2plant in 2014,2016,
partially offset by a $5 million increase of costs related to new solar plants placed into service in 2017.
Depreciation and Amortization increased $387 million due primarily to
$346 million of higher depreciation for Hudson and Mercer, primarily due to the accelerated expense related to the early retirement of those units,
a $30$15 million increase due to the accelerated retirement date for the Bridgeport Harbor unit 3,
an $11 million increase due primarily to a higher pensionnuclear asset base, and OPEB costs, net
$11 million of amounts capitalized.higher depreciation due to new solar projects.
Other Income (Deductions)Net Gains (Losses) on Trust Investments decreased $73increased $131 million due primarily to lowera $113 million increase in net realized gains from theon NDT Fund partially offset by a $28 million insurance recovery related to Superstorm Sandy.
Other-Than-Temporary Impairments increased $33 million due primarily to an increase ininvestments and lower other-than-temporary impairments of equity securities of $16 million in the NDT Fund.
Non-Operating Pension and OPEB Credits (Costs) reflect an increase in credits of $12 million due primarily to a decrease in the amortization of the net unrecognized actuarial pension loss.
Interest Expense decreased $34 million due primarily to
a $24 million decrease due to higher interest capitalized for the construction of three new fossil stations: BH5, Sewaren 7 and Keys, and
a net $7 million decrease due to debt maturities in September 2016, partially offset by a debt issuance in June 2016.
Income Tax Expense increased $20decreased $668 million in 2015 due primarily to higher pre-tax income.the one-time benefit recorded as a result of the remeasurement of deferred tax balances required due to the enactment of the Tax Act in December 2017.
LIQUIDITY AND CAPITAL RESOURCES
The following discussion of our liquidity and capital resources is on a consolidated basis, noting the uses and contributions, where material, of our two direct major operating subsidiaries.
Financing Methodology
We expect our capital requirements to be met through internally generated cash flows and external financings, consisting of short-term debt for working capital needs and long-term debt for capital investments.
PSE&G’s sources of external liquidity include a $600 million multi-year syndicatedrevolving credit facility. PSE&G uses internally generated cash flow and its commercial paper program to meet seasonal, intra-month and temporary working capital needs.
PSE&G does not engage in any intercompany borrowing or lending arrangements. PSE&G maintains back-up facilities in an amount sufficient to cover the commercial paper and letters of credit outstanding. PSE&G’s dividend payments to/capital contributions from PSEG are consistent with its capital structure objectives which have been established to maintain investment grade credit ratings. PSE&G’s long-term financing plan is designed to replace maturities, fund a portion of its capital program and manage short-term debt balances. Generally, PSE&G uses either secured medium-term notes or first mortgage bonds to raise long-term capital.
PSEG, Power, Energy Holdings, PSEG LI and Services participate in a corporate money pool, an aggregation of daily cash balances designed to efficiently manage their respective short-term liquidity needs. Servco does not participate in the corporate money pool. Servco’s short-term liquidity needs are met through an account funded and owned by LIPA.
PSEG’s sources of external liquidity may include the issuance of long-term debt securities and the incurrence of additional indebtedness under credit facilities. Our current sources of external liquidity include multi-year syndicatedrevolving credit facilities totaling $11.5 billion. These facilities are available to back-stop PSEG’s commercial paper program, issue letters of credit and for general corporate purposes. These facilities may also be used to provide support to PSEG’s subsidiaries. PSEG’s credit facilities and the commercial paper program are available to support PSEG working capital needs or to temporarily fund growth opportunities in advance of obtaining permanent financing. PSEG also has a $500 million$1.1 billion of term loan credit agreement thatagreements, of which $350 million is scheduled to expire in June 2019 and $700 million in November 2017.2020. From time to time, PSEG may make equity contributions or provide credit support to its subsidiaries.
Power’s sources of external liquidity include $2.6$2.1 billion of syndicated multi-year revolving credit facilities. Additionally, from time to time, Power maintains bilateral credit agreements designed to enhance its liquidity position. Credit capacity is primarily used to provide collateral in support of Power’s forward energy sale and forward fuel purchase contracts as the market prices for energy and fuel fluctuate, and to meet potential collateral postings in the event that Power is downgraded to below investment grade by Standard & Poor’s (S&P&P) or Moody’s. Power’s dividend payments to PSEG are also designed to be consistent with its capital structure objectives which have been established to maintain investment grade credit ratings and provide sufficient financial flexibility. Generally, Power issues senior unsecured debt to raise long-term capital.
Operating Cash Flows
We expect our operating cash flows combined with cash on hand and financing activities to be sufficient to fund capital expenditures and shareholder dividend payments.
For the year ended December 31, 20162018, our operating cash flow decreased by $608347 million. For the year ended December 31, 2015,2017, our operating cash flow increaseddecreased by $759$53 million. The net changes were primarily due to net changes from our subsidiaries as discussed below.below and net tax payments at Energy Holdings in 2018 as compared to tax refunds in 2017.
PSE&G
PSE&G’s operating cash flow decreased $231increased $15 million from $2,125$1,838 million to $1,894$1,853 million for the year ended December 31, 2016,2018, as compared to 2015,2017, due primarily to a decreasean increase of $171 million relating to accounts receivable and unbilled revenues resulting from higher collections and lower collectionsprices and volumes in 2018 and higher earnings, offset by tax payments in 2018 as compared to tax refunds in 2017.
PSE&G’s operating cash flow decreased $58 million from $1,896 million to $1,838 million for securitization debt principal repayments which were $259 million in 2015,the year ended December 31, 2017, as compared to 2016, due primarily to lower tax refunds and a decrease of $249 million in cash receipts from customers due to lower sales driven by warmer winter weather in 2016 compared to 2015, a decrease of $90$50 million related to a change in regulatory deferrals, primarily driven by net returns to customers in 2016 related to 2015 overcollections, partially offset by higher bill credits and $74 million in increased vendor payments.deferrals. These amounts were partially offset by higher earnings and higher tax refunds$30 million in 2016.decreased vendor payments.
PSE&G’sPower
Power’s operating cash flow increased $292decreased $242 million from $1,833$1,326 million to $2,125$1,084 million for the year ended December 31, 2015,2018, as compared to 2014,2017, due primarily to higher earnings, a $311 million reduction in tax payments, and an increase of $102 million due to higher customer billings in the fourth quarter of 2014 primarily as a result of increased usage due to weather. These increases were partially offset by a decrease of $250 million related to a change in regulatory deferrals, primarily driven by the return of prior year overcollections to customers for BGSS gas costs, Gas WNC charges and BGS costs.
Power
Power’s operating cash flow decreased $451 million from $1,706 million to $1,255 million for the year ended December 31, 2016, as compared to 2015, primarily resulting from lower earnings, an increase in margin deposit requirements of $198$157 million, and a $134 million decrease from net collection of counterparty receivables, partially offset by a reduction in tax payments.
Power’s operating cash flow increased $281 million from $1,425 million to $1,706 million for the year ended December 31, 2015, as compared to 2014, primarily resulting from higherlower earnings, a decrease in margin deposit requirementsfuels, materials and supplies of $144$81 million and an increase of $52 million in payments to counterparties, offset by tax refunds in 2018 as compared to tax payments in 2017, and a $78$96 million increase from net collectioncollections of counterparty receivables. These amounts were partially offset by an increase of $325 million in tax payments.
Power’s operating cash flow increased $71 million from $1,255 million to $1,326 million for the year ended December 31, 2017, as compared to 2016, primarily resulting from a decrease of $61 million in payments to counterparties, a $26 million increase from higher net collections of counterparty receivables, and higher earnings. These amounts were partially offset by higher tax payments and an increase in margin deposit requirements of $14 million.
Short-Term Liquidity
PSEG meets its short-term liquidity requirements, as well as those of Power, primarily with cash and through the issuance of commercial paper. PSE&G maintains its own separate commercial paper program to meet its short-term liquidity requirements. Each commercial paper program is fully back-stopped by its own separate credit facilities.
We continually monitor our liquidity and seek to add capacity as needed to meet our liquidity requirements. Each of our credit facilities is restricted as to availability and use to the specific companies as listed below; however, if necessary, the PSEG facilities can also be used to support our subsidiaries’ liquidity needs. Our total credit facilities and available liquidity as of December 31, 20162018 were as follows:
|
| | | | | | | | | | | | | | |
| | | | | | | | | |
| | Company/Facility | | As of December 31, 2016 | |
| | Total Facility | | Usage | | Available Liquidity | |
| | | | Millions | |
| | PSEG | | $ | 1,000 |
| | $ | 398 |
| | $ | 602 |
| |
| | PSE&G | | 600 |
| | 14 |
| | 586 |
| |
| | Power | | 2,553 |
| | 198 |
| | 2,355 |
| |
| | Total | | $ | 4,153 |
| | $ | 610 |
| | $ | 3,543 |
| |
| | | | | | | | | |
|
| | | | | | | | | | | | | | |
| | | | | | | | | |
| | Company/Facility | | As of December 31, 2018 | |
| | Total Facility | | Usage | | Available Liquidity | |
| | | | Millions | |
| | PSEG | | $ | 1,500 |
| | $ | 759 |
| | $ | 741 |
| |
| | PSE&G | | 600 |
| | 288 |
| | 312 |
| |
| | Power | | 2,100 |
| | 154 |
| | 1,946 |
| |
| | Total | | $ | 4,200 |
| | $ | 1,201 |
| | $ | 2,999 |
| |
| | | | | | | | | |
As of December 31, 2016,2018, our credit facility capacity was in excess of our projected maximum liquidity requirements over our 12 month planning horizon. Our maximum liquidity requirements are based on stress scenarios that incorporate changes in commodity prices and the potential impact of Power losing its investment grade credit rating from S&P or Moody’s, which would represent a three level downgrade from its current S&P or Moody’s ratings. In the event of a deterioration of Power’s credit rating, certain of Power’s agreements allow the counterparty to demand further performance assurance. The potential additional collateral that we would be required to post under these agreements if Power were to lose its investment grade credit rating was approximately $783$857 million and $864$848 million as of December 31, 20162018 and 2015,2017, respectively. The early retirement of Power’s Hudson and Mercer coal/gas generation units is not expected to have a material impact on Power’s debt covenant ratios or its ability to obtain credit facilities. See Item 8. Financial Statements and Supplementary Data—Note 3. Early Plant Retirements.
For additional information, see Item 8.Financial Statements and Supplementary Data—8. Note 14.15. Debt and Credit Facilities.
Long-Term Debt Financing
During the next twelve months, PSEG has a $350 million floating rate $500 million term loan maturing in June 2019 and $400 million of 1.60% Senior Notes maturing in November 2017.2019. PSE&G has $250 million of 1.80% Medium Term Notes maturing in June 2019 and $250 million of 2.00% Medium Term Notes maturing in August 2019. Power has a letter of credit backing $44 million of Pennsylvania Economic Development Financing Authority Variable Rate Demand Bonds which expires in November 2019.
For a discussion of our long-term debt transactions during 2016 and into 2017,2018, see Item 8. Financial Statements and Supplementary Data—Note 14.15. Debt and Credit Facilities.
Debt Covenants
Our credit agreements contain maximum debt to equity ratios and other restrictive covenants and conditions to borrowing. We are currently in compliance with all of our debt covenants. Continued compliance with applicable financial covenants will depend upon our future financial position, level of earnings and cash flows, as to which no assurances can be given.
In addition, under its First and Refunding Mortgage (Mortgage), PSE&G may issue new First and Refunding Mortgage Bonds against previous additions and improvements, provided that its ratio of earnings to fixed charges calculated in accordance with its Mortgage is at least 2 to 1, and/or against retired Mortgage Bonds. As of December 31, 20162018, PSE&G’s Mortgage coverage ratio was 4.23.8 to 1 and the Mortgage would permit up to approximately $5.7$6.3 billion aggregate principal amount of new Mortgage Bonds to be issued against additions and improvements to its property.
Default Provisions
Our bank credit agreements and indentures contain various, customary default provisions that could result in the potential acceleration of indebtedness under the defaulting company’s agreement.
In particular, PSEG’s bank credit agreements contain provisions under which certain events, including an acceleration of material indebtedness under PSE&G’s and Power’s respective financing agreements, a failure by PSE&G or Power to satisfy certain final judgments and certain bankruptcy events by PSE&G or Power, that would constitute an event of default under the PSEG bank credit agreements. Under the PSEG bank credit agreements, it would also be an event of default if either PSE&G or Power ceases to be wholly owned by PSEG. The PSE&G and Power bank credit agreements include similar default provisions; however, such provisions only relate to the respective borrower under such agreement and its subsidiaries and do not contain cross default provisions to each other. The PSE&G and Power bank credit agreements do not include cross default provisions relating to PSEG.
subsidiary debt and liens and certain of Power’s outstanding notes require Power to repurchase such notes upon certain change of control events.
There are no cross acceleration provisions in PSEG’s or PSE&G’s indentures. However, PSEG’s existing notes include a cross acceleration provision that may be triggered upon the acceleration of more than $75 million of indebtedness incurred by PSEG. Such provision does not extend to an acceleration of indebtedness by any of PSEG’s subsidiaries. Power’s indenture includes a cross acceleration provision similar to that described above for PSEG’s existing notes except that such provision may be triggered upon the acceleration of more than $50 million of indebtedness incurred by Power or any of its subsidiaries. Such provision does not cross accelerate to PSEG, any of PSEG’s subsidiaries (other than Power and its subsidiaries), PSE&G or any of PSE&G’s subsidiaries.
Ratings Triggers
Our debt indentures and credit agreements do not contain any material ‘ratings triggers’“ratings triggers” that would cause an acceleration of the required interest and principal payments in the event of a ratings downgrade. However, in the event of a downgrade, any one or more of the affected companies may be subject to increased interest costs on certain bank debt and certain collateral requirements. In the event that we are not able to affirm representations and warranties on credit agreements, lenders would not be required to make loans.
In accordance with BPU requirements under the BGS contracts, PSE&G is required to maintain an investment grade credit rating. If PSE&G were to lose its investment grade rating, it would be required to file a plan to assure continued payment for the BGS requirements of its customers.
Fluctuations in commodity prices or a deterioration of Power’s credit rating to below investment grade could increase Power’s required margin postings under various agreements entered into in the normal course of business. Power believes it has sufficient liquidity to meet the required posting of collateral which would likely result from a credit rating downgrade to below investment grade by S&P or Moody’s at today’s market prices.
Common Stock Dividends
|
| | | | | | | | | | | | | | |
| | | | | | | | | |
| | | | Years Ended December 31, | |
| | Dividend Payments on Common Stock | | 2016 | | 2015 | | 2014 | |
| | Per Share | | $ | 1.64 |
| | $ | 1.56 |
| | $ | 1.48 |
| |
| | in Millions | | $ | 830 |
| | $ | 789 |
| | $ | 748 |
| |
| | | | | | | | | |
|
| | | | | | | | | | | | | | |
| | | | | | | | | |
| | | | Years Ended December 31, | |
| | Dividend Payments on Common Stock | | 2018 | | 2017 | | 2016 | |
| | Per Share | | $ | 1.80 |
| | $ | 1.72 |
| | $ | 1.64 |
| |
| | in Millions | | $ | 910 |
| | $ | 870 |
| | $ | 830 |
| |
| | | | | | | | | |
On February 21, 2017,19, 2019, our Board of Directors approved a $0.43$0.47 per share common stock dividend for the first quarter of 2017.2019. This reflects an indicative annual dividend rate of $1.721.88 per share. We expect to continue to pay cash dividends on our common stock; however, the declaration and payment of future dividends to holders of our common stock will be at the discretion of the Board of Directors and will depend upon many factors, including our financial condition, earnings, capital requirements of our businesses, alternate investment opportunities, legal requirements, regulatory constraints, industry practice and other factors that the Board of Directors deems relevant. For additional information related to cash dividends on our common stock, see Item 8. Financial Statements and Supplementary Data—Note 22.23. Earnings Per Share (EPS) and Dividends.
Credit Ratings
If the rating agencies lower or withdraw our credit ratings, such revisions may adversely affect the market price of our securities and serve to materially increase our cost of capital and limit access to capital. Credit Ratings shown are for securities that we typically issue. Outlooks are shown for Corporate Credit Ratings (S&P) and Issuer Credit Ratings (Moody’s) and can
be Stable, Negative, or Positive. There is no assurance that the ratings will continue for any given period of time or that they will not be revised by the rating agencies, if in their respective judgments, circumstances warrant. Each rating given by an agency should be evaluated independently of the other agencies’ ratings. The ratings should not be construed as an indication to buy, hold or sell any security.
In January 2016, S&P published updated research reports on PSEG and PSE&G and the existing ratings and outlooks were unchanged. In June 2016, Moody’s published credit opinions on Power and PSE&G and the existing ratings and outlooks were unchanged. In June 2016, S&P published an updated research report on Power and the existing rating and outlook were unchanged. In September 2016, Moody’s published an updated research report on PSEG and the existing rating and outlook were unchanged.
|
| | | | | |
| | | | | | |
| | | Moody’s (A) | | S&P (B) | |
| | PSEG | | | | |
| | Outlook | PositiveStable | | Stable | |
| | Senior Notes | Baa2Baa1 | | BBB | |
| | Commercial Paper | P2 | | A2 | |
| | PSE&G | | | | |
| | Outlook | Stable | | Stable | |
| | Mortgage Bonds | Aa3 | | A | |
| | Commercial Paper | P1 | | A2 | |
| | Power | | | | |
| | Outlook | Stable | | Stable | |
| | Senior Notes | Baa1 | | BBB+ | |
| | | | | | |
| |
| (A) | Moody’s ratings range from Aaa (highest) to C (lowest) for long-term securities and P1 (highest) to NP (lowest) for short-term securities. |
| |
| (B) | S&P ratings range from AAA (highest) to D (lowest) for long-term securities and A1 (highest) to D (lowest) for short-term securities. |
Other Comprehensive Income
For the year ended December 31, 2016,2018, we had Other Comprehensive Income of $32$28 million on a consolidated basis. Other Comprehensive Income was due primarily to a $42an increase of $46 million increase inrelated to pension and other postretirement benefits, partially offset by $17 million of net unrealized gainslosses related to Available-for-Sale Securities and $2$1 million of unrealized gainslosses on derivative contracts accounted for as hedges, partially offset by a decrease of $12 million in our consolidated liability for pension and postretirement benefits.hedges. See Item 8. Financial Statements and Supplementary Data—Note 21.22. Accumulated Other Comprehensive Income (Loss), Net of Tax for additional information.
CAPITAL REQUIREMENTS
We expect that all of our capital requirements over the next three years will come from a combination of internally generated funds and external debt financing. Projected capital construction and investment expenditures, excluding nuclear fuel purchases, for the next three years are presented in the table below. These projections include Allowance for Funds Used During ConstructionAFUDC and Interest Capitalized During Construction for PSE&G and Power, respectively. These amounts are subject to change, based on various factors. Amounts shown below for Energy Strong, GSMP and Solar/Energy Efficiency programs are for currently approved programs. We intend to continue to invest in infrastructure modernization and will seek to extend these and related programs as appropriate. We will also continue to approach potential growth investments for Power opportunistically, seeking projects that will provide attractive risk-adjusted returns for our shareholders.
|
| | | | | | | | | | | | | | |
| | | | | | | | |
| | | | 2017 | | 2018 | | 2019 | |
| | | | | | Millions | | | |
| | PSE&G: | | | | | | | |
| | Transmission | | $ | 1,630 |
| | $ | 1,375 |
| | $ | 1,110 |
| |
| | Distribution | | 1,180 |
| | 775 |
| | 615 |
| |
| | Energy Strong | | 205 |
| | 75 |
| | 15 |
| |
| | Gas System Modernization Program | | 305 |
| | 315 |
| | 50 |
| |
| | Solar/Energy Efficiency | | 90 |
| | 75 |
| | 60 |
| |
| | Total PSE&G | | $ | 3,410 |
| | $ | 2,615 |
| | $ | 1,850 |
| |
| | Power: | | | | | | | |
| | Baseline | | $ | 190 |
| | $ | 210 |
| | $ | 170 |
| |
| | Environmental/Regulatory | | 35 |
| | 35 |
| | 35 |
| |
| | Fossil Growth Opportunities | | 825 |
| | 405 |
| | 90 |
| |
| | Nuclear Expansion | | 20 |
| | 20 |
| | 10 |
| |
| | Solar Growth Opportunities | | 130 |
| | — |
| | — |
| |
| | Total Power | | $ | 1,200 |
| | $ | 670 |
| | $ | 305 |
| |
| | Other | | $ | 50 |
| | $ | 35 |
| | $ | 35 |
| |
| | Total PSEG | | $ | 4,660 |
| | $ | 3,320 |
| | $ | 2,190 |
| |
| | | |
|
| | | | | |
|
| | | | | | | | | | | | | | |
| | | | | | | | |
| | | | 2019 | | 2020 | | 2021 | |
| | | | | | Millions | | | |
| | PSE&G: | | | | | | | |
| | Transmission | | $ | 1,350 |
| | $ | 1,145 |
| | $ | 875 |
| |
| | Distribution | | 740 |
| | 820 |
| | 820 |
| |
| | Gas System Modernization Program | | 420 |
| | 455 |
| | 435 |
| |
| | Solar/Energy Efficiency | | 70 |
| | 55 |
| | 5 |
| |
| | Total PSE&G | | $ | 2,580 |
| | $ | 2,475 |
| | $ | 2,135 |
| |
| | Power: | | | | | | | |
| | Baseline | | $ | 165 |
| | $ | 130 |
| | $ | 150 |
| |
| | Growth Opportunities | | 225 |
| | 20 |
| | 15 |
| |
| | Other | | 5 |
| | 15 |
| | 20 |
| |
| | Total Power | | $ | 395 |
| | $ | 165 |
| | $ | 185 |
| |
| | Other | | $ | 40 |
| | $ | 55 |
| | $ | 40 |
| |
| | Total PSEG | | $ | 3,015 |
| | $ | 2,695 |
| | $ | 2,360 |
| |
| | | |
|
| | | | | |
PSE&G
PSE&G’s projections for future capital expenditures include material additions and replacements to its transmission and distributionT&D systems to meet expected growth and to manage reliability. As project scope and cost estimates develop, PSE&G will modify its current projections to include these required investments. PSE&G’s projected expenditures for the various items reported above are primarily comprised of the following:
Transmission—investments focused on reliability improvements and replacement of aging infrastructure.
Distribution—investments for new business, reliability improvements, modernization and replacement of equipment that has reached the end of its useful life.
Energy Strong—Electric and Gas Distribution reliability investment program focused on system hardening and resiliency.
Gas System Modernization Program—Gas Distribution investment program to replace aging infrastructure.
Solar/Energy Efficiency—investments associated with grid-connected solar, solar loan programs and customer energy efficiency programs.
In August 2016, PSE&GJune 2018, we filed for our ES II, a petitionproposed five-year $2.5 billion program to harden, modernize and make our electric and gas distribution systems more resilient. The size and duration of ES II, as well as certain other elements of the program, are subject to BPU approval.
In October 2018, we filed our proposed CEF program with the BPU, requesting approvala six-year estimated $3.6 billion investment program focused on achieving New Jersey’s energy efficiency targets, supporting electric vehicle infrastructure, deploying energy storage, and implementing an EC program which will include installing approximately two million electric smart meters and associated infrastructure. The size and duration of the $268 million investmentCEF program, as well as certain other elements of the program, are subject to BPU approval.
ES II and an associated cost recovery mechanism to develop a project where PSE&G would rebuild New Jersey Transit’s Mason substation and related facilities in Kearny, NJ. This isthe CEF program are not included in PSE&G’s projected capital expenditures.expenditures in the above table.
In 2016,2018, PSE&G made $2,816$2,901 million of capital expenditures, primarily for transmission and distributionT&D system reliability. This does not include expenditures for cost of removal, net of salvage, of $131$160 million, which are included in operating cash flows.
Power
Power’s projected expenditures for the various items listed above are primarily comprised of the following:
Baseline—investments to replace major parts and enhance operational performance.
Environmental/Regulatory—investments made in response to environmental, regulatory or legal mandates.
Fossil Growth Opportunities—investments associated with new construction, including Keys Energy Center, Sewaren 7 and BH5, and with upgrades to increase efficiency and output at combined cycle plants.
Nuclear Expansion—Other—includes investments associated with certain nuclearmade in response to environmental, regulatory and legal mandates and other capital projects, primarily at existing facilities designed to increase operating output.
Solar Growth Opportunities—investments associated with the construction of utility-scale photovoltaic facilities.projects.
In 2016,2018, Power made $1,136815 million of capital expenditures, excluding $207181 million for nuclear fuel, primarily related to various projects at Fossil Solar and Nuclear.
Disclosures about Contractual Obligations
The following table reflects our contractual cash obligations in the respective periods in which they are due. In addition, the table summarizes anticipated debt maturities for the years shown. For additional information, see Item 8. Financial Statements and Supplementary Data—Note 14.15. Debt and Credit Facilities.
The table below does not reflect any anticipated cash payments for pension obligations due to uncertain timing of payments or liabilities for uncertain tax positions since we are unable to reasonably estimate the timing of liability payments in individual years beyond 12 months due to uncertainties in the timing of the effective settlement of tax positions. See Item 8. Financial Statements and Supplementary Data—Note 20.21. Income Taxes for additional information.
|
| | | | | | | | | | | | | | | | | | | | | | |
| | | | | | | | | | | | | |
| | | | Total Amount Committed | | Less Than 1 Year | | 2 - 3 Years | | 4 - 5 Years | | Over 5 Years | |
| | | | Millions | |
| | Contractual Cash Obligations | | | | | | | | | | | |
| | Long-Term Recourse Debt Maturities | | | | | | | | | | | |
| | PSEG | | $ | 2,450 |
| | $ | 750 |
| | $ | 1,000 |
| | $ | 700 |
| | $ | — |
| |
| | PSE&G | | 9,258 |
| | 500 |
| | 693 |
| | 825 |
| | 7,240 |
| |
| | Power | | 2,850 |
| | 44 |
| | 1,356 |
| | 950 |
| | 500 |
| |
| | Interest on Recourse Debt | | | | | | | | | | | |
| | PSEG | | 152 |
| | 61 |
| | 72 |
| | 19 |
| | — |
| |
| | PSE&G | | 5,564 |
| | 342 |
| | 651 |
| | 609 |
| | 3,962 |
| |
| | Power | | 830 |
| | 134 |
| | 224 |
| | 148 |
| | 324 |
| |
| | Operating Leases | | | | | | | | | | | |
| | PSE&G | | 118 |
| | 15 |
| | 21 |
| | 16 |
| | 66 |
| |
| | Power | | 110 |
| | 11 |
| | 26 |
| | 22 |
| | 51 |
| |
| | Services | | 178 |
| | 14 |
| | 29 |
| | 30 |
| | 105 |
| |
| | Other | | 5 |
| | 1 |
| | 3 |
| | 1 |
| | — |
| |
| | Energy-Related Purchase Commitments | | | | | | | | | | | |
| | Power | | 2,742 |
| | 774 |
| | 918 |
| | 586 |
| | 464 |
| |
| | Total Contractual Cash Obligations | | $ | 24,257 |
| | $ | 2,646 |
| | $ | 4,993 |
| | $ | 3,906 |
| | $ | 12,712 |
| |
| | | | | | | | | | | | | |
| | Liability Payments for Uncertain Tax Positions | | | | | | | | | | | |
| | PSEG | | $ | 112 |
| | $ | 112 |
| | $ | — |
| | $ | — |
| | $ | — |
| |
| | PSE&G | | 62 |
| | 62 |
| | — |
| | — |
| | — |
| |
| | Power | | 34 |
| | 34 |
| | — |
| | — |
| | — |
| |
| | | | | | | | | | | | | |
|
| | | | | | | | | | | | | | | | | | | | | | |
| | | | | | | | | | | | | |
| | | | Total Amount Committed | | Less Than 1 Year | | 2 - 3 Years | | 4- 5 Years | | Over 5 Years | |
| | | | Millions | |
| | Contractual Cash Obligations | | | | | | | | | | | |
| | Long-Term Recourse Debt Maturities | | | | | | | | | | | |
| | PSEG | | $ | 1,200 |
| | $ | 500 |
| | $ | 400 |
| | $ | 300 |
| | $ | — |
| |
| | PSE&G | | 7,883 |
| | — |
| | 1,250 |
| | 693 |
| | 5,940 |
| |
| | Power | | 2,400 |
| | — |
| | 294 |
| | 1,356 |
| | 750 |
| |
| | Interest on Recourse Debt | | | | | | | | | | | |
| | PSEG | | 57 |
| | 20 |
| | 25 |
| | 12 |
| | — |
| |
| | PSE&G | | 4,986 |
| | 299 |
| | 555 |
| | 502 |
| | 3,630 |
| |
| | Power | | 935 |
| | 113 |
| | 221 |
| | 170 |
| | 431 |
| |
| | Capital Lease Obligations | | | | | | | | | | | |
| | Power | | 3 |
| | 1 |
| | 1 |
| | 1 |
| | — |
| |
| | Operating Leases | | | | | | | | | | | |
| | PSE&G | | 100 |
| | 12 |
| | 15 |
| | 12 |
| | 61 |
| |
| | Power | | 52 |
| | 3 |
| | 6 |
| | 4 |
| | 39 |
| |
| | Services | | 198 |
| | 13 |
| | 26 |
| | 27 |
| | 132 |
| |
| | Other | | 5 |
| | 1 |
| | 2 |
| | 2 |
| | — |
| |
| | Energy-Related Purchase Commitments | | | | | | | | | | | |
| | Power | | 2,625 |
| | 745 |
| | 898 |
| | 450 |
| | 532 |
| |
| | Total Contractual Cash Obligations | | $ | 20,444 |
| | $ | 1,707 |
| | $ | 3,693 |
| | $ | 3,529 |
| | $ | 11,515 |
| |
| | | | | | | | | | | | | |
| | Liability Payments for Uncertain Tax Positions | | | | | | | | | | | |
| | PSEG | | $ | 14 |
| | $ | 14 |
| | $ | — |
| | $ | — |
| | $ | — |
| |
| | PSE&G | | 3 |
| | 3 |
| | — |
| | — |
| | — |
| |
| | Power | | 7 |
| | 7 |
| | — |
| | — |
| | — |
| |
| | | | | | | | | | | | | |
OFF-BALANCE SHEET ARRANGEMENTS
PSEG and Power issue guarantees, primarily in conjunction with certain of Power’s energy contracts. See Item 8. Financial Statements and Supplementary Data—Note 13.14. Commitments and Contingent Liabilities for further discussion.
Through Energy Holdings, we have investments in leveraged leases that are accounted for in accordance with GAAP Accounting for Leases. Leveraged lease investments generally involve three parties: an owner/lessor, a creditor and a lessee. In a typical leveraged lease arrangement, the lessor purchases an asset to be leased. The purchase price is typically financed 80% with debt provided by the creditor and the balance comes from equity funds provided by the lessor. The creditor provides long-term financing to the transaction secured by the property subject to the lease. Such long-term financing is non-recourse to the lessor and is not presented on our Consolidated Balance Sheets. In the event of default, the leased asset, and in some cases the lessee, secures the loan. As a lessor, Energy Holdings has ownership rights to the property and rents the property to the lessees for use in their business operations. For additional information, see Item 8. Financial Statements and Supplementary Data—Note 7.8. Long-Term Investments and Note 8.9. Financing Receivables.
In the event that collection of the minimum lease payments to be received by Energy Holdings is no longer reasonably assured, Energy Holdings may deem that a lessee has a high probability of defaulting on the lease obligation and would consider the need to record an impairment of its investment. In the event the lease is ultimately rejected by the lessee in a Bankruptcy Court proceeding, the fair value of the underlying asset and the associated debt would be recorded on the Consolidated Balance Sheets instead of the net equity investment in the lease.
CRITICAL ACCOUNTING ESTIMATES
Under GAAP,accounting principles generally accepted in the United States (GAAP), many accounting standards require the use of estimates, variable inputs and assumptions (collectively referred to as estimates) that are subjective in nature. Because of this, differences between the actual measure realized versus the estimate
can have a material impact on results of operations, financial position and cash flows. We have determined that the following estimates are considered critical to the application of rules that relate to the respective businesses.
Accounting for Pensions
PSEG sponsors qualified and nonqualified pension plans covering PSEG’s and its participating affiliates’ current and former employees who meet certain eligibility criteria. The market-related value of plan assets held for the qualified pension plan is equal to the fair value of these assets as of year-end. The plan assets are comprised of investments in both debt and equity securities which are valued using quoted market prices, broker or dealer quotations, or alternative pricing sources with reasonable levels of price transparency. We calculate pension costs using various economic and demographic assumptions.
Assumptions and Approach Used: Economic assumptions include the discount rate and the long-term rate of return on trust assets. Demographic assumptions include projections of future mortality rates, pay increases and retirement patterns.
|
| | | | | | | | | | | |
| | | | | | | | | |
| | Assumption | | 2016 |
| | 2015 |
| | 2014 |
| |
| | Discount Rate | | 4.29 | % | | 4.54 | % | | 4.20 | % | |
| | Expected Rate of Return on Plan Assets | | 8.00 | % | | 8.00 | % | | 8.00 | % | |
| | | | | | | | | |
|
| | | | | | | | | | | |
| | | | | | | | | |
| | Assumption | | 2018 |
| | 2017 |
| | 2016 |
| |
| | Discount Rate | | 4.41 | % | | 3.73 | % | | 4.29 | % | |
| | Expected Rate of Return on Plan Assets | | 7.80 | % | | 7.80 | % | | 8.00 | % | |
| | | | | | | | | |
The discount rate used to calculate pension obligations is determined as of December 31 each year, our measurement date. The discount rate is determined by developing a spot rate curve based on the yield to maturity of a universe of high quality corporate bonds with similar maturities to the plan obligations. The spot rates are used to discount the estimated plan distributions. The discount rate is the single equivalent rate that produces the same result as the full spot rate curve.
At the end of 2015, we changed the approach used to measure future service and interest costs for pension benefits. See Item 8. Financial Statements and Supplementary Data—Note 12. Pension and Other Postretirement Benefits (OPEB) and Savings Plans for additional information.
Our expected rate of return on plan assets reflects current asset allocations, historical long-term investment performance and an estimate of future long-term returns by asset class, long-term inflation assumptions and a premium for active management.
Based on the above assumptions, we have estimated a net periodic pension expense in 20172019 of approximately $3$49 million, or $6$11 million, net of amounts capitalized.
We utilize a corridor approach that reduces the volatility of reported pension expense/income. The corridor requires differences between actuarial assumptions and plan results be deferred and amortized as part of expense/income. This occurs only when the accumulated differences exceed 10% of the greater of the pension benefit obligation or the fair value of plan assets as of each year-end. The excess would be amortized over the average remaining service period of the active employees, which is approximately thirteenfourteen years.
Effect if Different Assumptions Used: As part of the business planning process, we have modeled future costs assuming a 7.80% expected rate of return and a 4.29%4.41% discount rate for 2017.2019 expense. Actual future pension expense/income and funding levels will depend on future investment performance, changes in discount rates, market conditions, funding levels relative to our projected benefit obligation and accumulated benefit obligation and various other factors related to the populations participating in the pension plans.
The following chart reflects the sensitivities associated with a change in certain assumptions. The effects of the assumption changes shown below solely reflect the impact of that specific assumption.
|
| | | | | | | | | | | | | | | | |
| | | | | | | | | | | |
| | | | % Change | | Impact on Pension Benefit Obligation as of December 31, 2016 | | Increase to Pension Expense in 2017 | | Increase to Pension Expense, net of Amounts Capitalized in 2017 | |
| | Assumption | | | | Millions | |
| | Discount Rate | | (1)% | | $ | 737 |
| | $ | 40 |
| | $ | 27 |
| |
| | Expected Rate of Return on Plan Assets | | (1)% | | N/A |
| | $ | 50 |
| | $ | 33 |
| |
| | | | | | | | | | | |
|
| | | | | | | | | | | | | | | | |
| | | | | | | | | | | |
| | | | % Change | | Impact on Pension Benefit Obligation as of December 31, 2018 | | Increase to Pension Expense in 2019 | | Increase to Pension Expense, net of Amounts Capitalized in 2019 | |
| | Assumption | | | | Millions | |
| | Discount Rate | | (1)% | | $ | 746 |
| | $ | 39 |
| | $ | 32 |
| |
| | Expected Rate of Return on Plan Assets | | (1)% | | N/A |
| | $ | 50 |
| | $ | 50 |
| |
| | | | | | | | | | | |
See Item 7A. Quantitative and Qualitative Disclosures About Market Risk for additional information.
Derivative Instruments
The operations of PSEG, Power and PSE&G are exposed to market risks from changes in commodity prices, interest rates and equity prices that could affect their results of operations and financial condition. Exposure to these risks is managed through normal operating and financing activities and, when appropriate, through executing derivative transactions. Derivative instruments are used to create a relationship in which changes to the value of the assets, liabilities or anticipated transactions exposed to market risks are expected to be offset by changes in the value of these derivative instruments.
Current accounting guidance requires us to recognize all derivatives on the balance sheet at their fair value, except for derivatives that qualify for and are designated as normal purchases and normal sales contracts.
Assumptions and Approach Used: In general, the fair value of our derivative instruments is determined primarily by end of day clearing market prices from an exchange, such as NYMEX, Intercontinental Exchange and Nodal Exchange, or auction prices. Fair values of other energy contracts may be based on broker quotes.
For a small number of contracts where limited observable inputs or pricing information are available, modeling techniques are employed in determination of their fair value using assumptions reflective of contractual terms, current market rates, forward price curves, discount rates and risk factors, as applicable.
For our wholesale energy business, many of the forward sale, forward purchase, option and other contracts are derivative instruments that hedge commodity price risk, but do not meet the requirements for, or are not designated as, either cash flow or fair value hedge accounting. The changes in value of such derivative contracts are marked to market through earnings as the related commodity prices fluctuate. As a result, our earnings may experience significant fluctuations depending on the volatility of commodity prices.
Effect if Different Assumptions Used: Any significant changes to the fair market values of our derivatives instruments could result in a material change in the value of the assets or liabilities recorded on our Consolidated Balance Sheets and could result in a material change to the unrealized gains or losses recorded in our Consolidated Statements of Operations.
For additional information regarding Derivative Financial Instruments, see Item 8. Financial Statements and Supplementary Data – Note 1. Organization, Basis of Presentation and Summary of Significant Accounting Policies, Note 16.17. Financial Risk Management Activities and Note 17.18. Fair Value Measurements.
Long-Lived Assets
Management evaluates long-lived assets for impairment and reassesses the reasonableness of their related estimated useful lives whenever events or changes in circumstances, such as significant adverse changes in regulation, business climate, counterparty credit worthiness, or market conditions, could potentially indicate an asset’s or asset group’s carrying amount may not be recoverable. recoverable or an asset’s probability of operating through its estimated remaining useful life changes.
Assumptions and Approach Used: In the event certain triggers exist indicating an asset/asset group may not be recoverable, an undiscounted cash flow test is performed to determine if an impairment exists. When the carrying value of a long-lived asset/asset group exceeds the undiscounted estimate of future cash flows associated with the asset/asset group, an impairment may exist to the extent that the fair value of the asset/asset group is less than its carrying amount. These tests require significant
estimates and judgment when developing expected future cash flows. Significant inputs include forward power prices, fuel costs, dispatch rates, other operating and capital expenditures and the cost of borrowing.
In addition, long-lived assets are depreciated under the straight-line method based on estimated useful lives. An asset’s operating useful life is generally based upon operational experience with similar asset types and other non-operational factors. In the ordinary course, management, together with an asset’s co-owners in the case of certain of our jointly-owned assets, makes a number of decisions that impact the operation of our generation assets beyond the current year. These decisions may have a direct impact on the estimated remaining useful lives of our assets and will be influenced by the financial outlook of the assets, including future market conditions such as forward energy and capacity prices, operating and capital investment costs and any state or federal legislation and regulations, among other items.
The assumptions used by management incorporate inherent uncertainties that are at times difficult to predict and could result in impairment charges or accelerated depreciation in future periods if actual results materially differ from the estimated assumptions utilized in our forecasts.
Effect if Different Assumptions Used: The above cash flow tests, and fair value estimates and estimated remaining useful lives may be impacted by a change in the assumptions noted above and could significantly impact the outcome, triggering additional impairment tests, write-offs or write-offs.
certain of our generating assets. See Item 8. Note 4. Early Plant Retirements and Note 6. Property, Plant and Equipment and Jointly-Owned Facilities.
Lease Investments
Our Investments in Leases, included in Long-Term Investments on our Consolidated Balance Sheets, are comprised of Lease Receivables (net of non-recourse debt), the estimated residual value of leased assets, and unearned and deferred income. A significant portion of the estimated residual value of leased assets is related to merchant power plants leased to other energy companies. See Item 8. Financial Statements and Supplementary Data – Note 7.8. Long-Term Investments and Note 8.9. Financing Receivables.
Assumptions and Approach Used: Residual values are the estimated values of the leased assets at the end of the respective lease terms.per the original lease terms, net of any subsequent impairments. The estimated values are calculated by discounting the cash flows related to the leased assets after the lease term. For the merchant power plants, the estimated discounted cash flows are dependent upon various assumptions, including:
estimated forward power and capacity prices in the years after the lease,
related prices of fuel for the plants,
dispatch rates for the plants,
future capital expenditures required to maintain the plants,
future operation and maintenanceO&M expenses,
discount rates, and
the current estimated economic viability of the plants after the end of the base lease term.
ResidualA review of the residual valuations areis performed at least annually for each plant subject to lease using specific assumptions tailored to each plant. Those valuations are compared to the recorded residual values to determine if an impairment is warranted.
Effect if Different Assumptions Used: A significant change to the assumptions, such as a large decrease in near-term power prices that affects the market’s view of long-term power prices, could result in an impairment of one or more of the residual values, but not necessarily to all of the residual values. However, if because of changes in assumptions, all the residual values related to the merchant energy plants were deemed to be zero, we would recognize an after-tax charge to income of approximately $91$80 million.
Asset Retirement Obligations (ARO)
PSE&G, Power and Services recognize liabilities for the expected cost of retiring long-lived assets for which a legal obligation exists. These AROs are recorded at fair value in the period in which they are incurred and are capitalized as part of the carrying amount of the related long-lived assets. PSE&G, as a rate-regulated entity, recognizes regulatory assetsRegulatory Assets or liabilitiesLiabilities as a result of timing differences between the recording of costs and costs recovered through the rate-making process. We accrete the ARO liability to reflect the passage of time.time with the corresponding expense recorded in O&M.
Assumptions and Approach Used: Because quoted market prices are not available for AROs, we estimate the initial fair value of an ARO by calculating discounted cash flows that are dependent upon various assumptions, including:
estimation of dates for retirement, which can be dependent on environmental and other legislation,
amounts and timing of future cash expenditures associated with retirement, settlement or remediation activities,
discount rates,
cost escalation rates,
market risk premium,
inflation rates, and
if applicable, past experience with government regulators regarding similar obligations.
We obtain updated cost studies triennially unless new information necessitates more frequent updates. The most recent cost study was done in 2015.2018. When we revise any assumptions used to calculate fair values of existing AROs, we adjust the ARO balance and corresponding long-lived asset which generally impacts the amount of accretion and depreciation expense recognized in future periods.
Nuclear Decommissioning AROs
AROs related to the future decommissioning of Power’s nuclear facilities comprised 89%93% of Power’s total AROs as of December 31, 2016.2018. Power determines its AROs for its nuclear units by assigning probability weighting to various discounted cash flow outcomes for each of its nuclear units that incorporate the assumptions above as well as:
financial feasibility and impacts on potential early shutdown,
license renewals,
early shutdown,
safe storage forSAFESTOR alternative, which assumes the nuclear facility can be safely stored and subsequently decommissioned in a period of timewithin 60 years after retirement,operations,
DECON alternative, which assumes decommissioning activities begin after operations, and
recovery from the federal government of costs incurred for spent nuclear fuel.
Effect if Different Assumptions Used: Changes in the assumptions could result in a material change in the ARO balance sheet obligation and the period over which we accrete to the ultimate liability. For example, aHad the following assumptions been applied, our estimates of the approximate impacts on the Nuclear ARO as of December 31, 2018 are as follows:
A decrease of 1% in the discount rate would result in a $39$32 million increase in the Nuclear ARO as of December 31, 2016. ARO.
An increase of 1% in the inflation rate would result in a $203$260 million increase in the Nuclear ARO as of December 31, 2016. Also, ifARO.
If we didwere not assume that we would recover fromreimbursed by the federal government the costs incurred for spent nuclear fuel costs as prescribed under the Nuclear Waste Policy Act, the Nuclear ARO would increase by $283$346 million.
If we would elect or be required to decommission under a DECON alternative at Salem and Hope Creek, the Nuclear ARO would increase by $635 million at December 31, 2016..
If Power were to increase its early shutdown probability to 100% and retire Hope Creek and Salem starting in the Fall of 2019, which is significantly earlier than the end of their current license periods, the Nuclear ARO would increase by $314 million. For additional information, see Item 8. Note 4. Early Plant Retirements.
Accounting for Regulated Businesses
PSE&G prepares its financial statements to comply with GAAP for rate-regulated enterprises, which differs in some respects from accounting for non-regulated businesses. In general, accounting for rate-regulated enterprises should reflect the economic effects of regulation. As a result, a regulated utility is required to defer the recognition of costs (Regulatory Asset) or recognize obligations (Regulatory Liability) if the rates established are designed to recover the costs and if the competitive environment makes it probable that such rates can be charged or collected. This accounting results in the recognition of revenues and expenses in different time periods than that of enterprises that are not regulated.
Assumptions and Approach Used: PSE&G recognizes Regulatory Assets where it is probable that such costs will be recoverable in future rates from customers and Regulatory Liabilities where it is probable that refunds will be made to
customers in future billings. The highest degree of probability is an order from the BPU either approving recovery of the deferred costs over a future period or requiring the refund of a liability over a future period.
Virtually all of PSE&G’s regulatory assetsRegulatory Assets and liabilitiesRegulatory Liabilities are supported by BPU orders. In the absence of an order, PSE&G will consider the following when determining whether to record a Regulatory Asset or Liability:
past experience regarding similar items with the BPU,
treatment of a similar item in an order by the BPU for another utility,
passage of new legislation, and
recent discussions with the BPU.
All deferred costs are subject to prudence reviews by the BPU. When the recovery of a Regulatory Asset or payment of a Regulatory Liability is no longer probable, PSE&G charges or credits earnings, as appropriate.
Effect if Different Assumptions Used: A change in the above assumptions may result in a material impact on our results of operations or our cash flows. See Item 8. Financial Statements and Supplementary Data—Note 6.7. Regulatory Assets and Liabilities for a description of the amounts and nature of regulatory balance sheet amounts.
ITEM 7A. QUANTITATIVE AND QUALITATIVE DISCLOSURES ABOUT
MARKET RISK
The risk inherent in our market-risk sensitive instruments and positions is the potential loss arising from adverse changes in commodity prices, equity security prices and interest rates as discussed in the Notes to Consolidated Financial Statements. It is our policy to use derivatives to manage risk consistent with business plans and prudent practices. We have a Risk Management Committee comprised of executive officers who utilize a risk oversight function to ensure compliance with our corporate policies and risk management practices.
Additionally, we are exposed to counterparty credit losses in the event of non-performance or non-payment. We have a credit management process, which is used to assess, monitor and mitigate counterparty exposure. In the event of non-performance or non-payment by a major counterparty, there may be a material adverse impact on our financial condition, results of operations or net cash flows.
Commodity Contracts
The availability and price of energy-related commodities are subject to fluctuations from factors such as weather, environmental policies, changes in supply and demand, state and federal regulatory policies, market rules and other events. To reduce price risk caused by market fluctuations, we enter into supply contracts and derivative contracts, including forwards, futures, swaps and options with approved counterparties. These contracts, in conjunction with physical sales and other services, help reduce risk and optimize the value of owned electric generation capacity.
Value-at-Risk (VaR) Models
VaR represents the potential losses, under normal market conditions, for instruments or portfolios due to changes in market factors, for a specified time period and confidence level. We estimate VaR across our commodity businesses.
MTM VaR consists of MTM derivatives that are economic hedges. The MTM VaR calculation does not include market risks associated with activities that are subject to accrual accounting, primarily our generating facilities and some load servingload-serving activities.
The VaR models used are variance/covariance models adjusted for the change of positions with 95% and 99.5% confidence levels and a one-day holding period for the MTM activities. The models assume no new positions throughout the holding periods; however, we actively manage our portfolio.
|
| | | | | | | | | | |
| | | | | | | |
| | | | MTM VaR | |
| | | | Millions | |
| | Years Ended December 31, | | 2016 | | 2015 | |
| | | | | |
| | 95% Confidence Level, Loss could exceed VaR one day in 20 days | | | | | |
| | Period End | | $ | 26 |
| | $ | 24 |
| |
| | Average for the Period | | $ | 16 |
| | $ | 17 |
| |
| | High | | $ | 32 |
| | $ | 40 |
| |
| | Low | | $ | 10 |
| | $ | 8 |
| |
| | | | | | | |
| | 99.5% Confidence Level, Loss could exceed VaR one day in 200 days | | | | | |
| | Period End | | $ | 40 |
| | $ | 38 |
| |
| | Average for the Period | | $ | 25 |
| | $ | 26 |
| |
| | High | | $ | 51 |
| | $ | 63 |
| |
| | Low | | $ | 16 |
| | $ | 12 |
| |
| | | | | | | |
|
| | | | | | | | | | |
| | | | | | | |
| | | | MTM VaR | |
| | | | Millions | |
| | Years Ended December 31, | | 2018 | | 2017 | |
| | | | | |
| | 95% Confidence Level, Loss could exceed VaR one day in 20 days | | | | | |
| | Period End | | $ | 21 |
| | $ | 39 |
| |
| | Average for the Period | | $ | 14 |
| | $ | 10 |
| |
| | High | | $ | 46 |
| | $ | 39 |
| |
| | Low | | $ | 6 |
| | $ | 5 |
| |
| | | | | | | |
| | 99.5% Confidence Level, Loss could exceed VaR one day in 200 days | | | | | |
| | Period End | | $ | 32 |
| | $ | 60 |
| |
| | Average for the Period | | $ | 22 |
| | $ | 15 |
| |
| | High | | $ | 72 |
| | $ | 60 |
| |
| | Low | | $ | 9 |
| | $ | 8 |
| |
| | | | | | | |
See Item 8. Financial Statements and Supplementary Data—Note 16.17. Financial Risk Management Activities for a discussion of credit risk.
Interest Rates
We are subject to the risk of fluctuating interest rates in the normal course of business. We manage interest rate risk by targeting a balanced debt maturity profile which limits refinancing in any given period or interest rate environment. In addition, we use a mix of fixed and floating rate debt, interest rate swaps and interest rate lock agreements.
As of December 31, 2016,2018, a hypothetical 10% increase in market interest rates would result in
less than $1$2 million of additional annual interest costs related to both the current and long-term portion of long-term debt, and
a $366$426 million decrease in the fair value of debt, including an $18 million decrease at PSEG, a $303$354 million decrease at PSE&G and a $57$54 million decrease at Power.
Debt and Equity Securities
We have $5.6 billion of assets in a trust for our pension plan trusts.and OPEB plans. Although fluctuations in market prices of securities within this portfolio do not directly affect our earnings in the current period, changes in the value of these investments could affect
our future contributions to these plans,
our financial position if our accumulated benefit obligation under our pension plans exceeds the fair value of the pension trust funds, and
future earnings, as we could be required to adjust pension expense and the assumed rate of return.
The NDT Fund is comprised primarily of fixed income and equity securities. As of December 31, 2016,2018, the portfolio included $957$900 million of equity securities and $857$978 million in fixed income securities. The fair market value of the assets in the NDT Fund will fluctuate primarily depending upon the performance of equity markets. As of December 31, 2016,2018, a hypothetical 10% change in the equity market would impact the value of the equity securities in the NDT Fund by approximately $96$90 million.
We use duration to measure the interest rate sensitivity of the fixed income portfolio. Duration is a summary statistic of the effective average maturity of the fixed income portfolio. The benchmark for the fixed income component of the NDT Fund currently has a duration of 5.895.87 years and a yield of 2.61%3.28%. The portfolio’s value will appreciate or depreciate by the duration with a 1% change in interest rates. As of December 31, 2016,2018, a hypothetical 1% increase in interest rates would result in a decline in the market value for the fixed income portfolio of approximately $50$57 million.
Credit Risk
See Item 8. Financial Statements and Supplementary Data—Note 16.17. Financial Risk Management Activities for a discussion of credit risk and a discussion about Power’s and PSE&G’s credit risk.
Energy Holdings has credit risk related to its investments in leases, which totaled $(25)186 million, net of deferred taxes of $674354 million, as of December 31, 2016.2018. These leveraged leases are concentrated in the U.S. energy industry. See Item 8. Financial Statements and Supplementary Data—Note 8.9. Financing Receivables for counterparties’ credit ratings and other information. The credit exposure to the lessees is partially
mitigated through various credit enhancement mechanisms within the lease transactions. These credit enhancement features vary from lease to lease. Some of the leasing transactionsCredit enhancements include covenants that restrict the flow of dividends from the lessee to its parent, over-collateralizationaffiliate guarantees and partial collateralization of the lessee with non-leased assets, historical and forward cash flow coverage tests that prohibit discretionary capital expenditures and dividend payments to the parent/lessee if stated minimum coverages are not met and similar cash flow restrictions if ratings are not maintained at stated levels. These covenants are designed to maintain cash reserves in the transaction entity for the benefit of the non-recourse lenders and the lessor/equity participants in the event of a temporary market downturn or degradation in operating performance of the leased assets.
In any lease transaction, in the event of a default, Energy Holdings would exercise its rights and attempt to seek recovery of its investment. The results of such efforts may not be known for a period of time. A bankruptcy of a lessee and failure to recover adequate value could lead to a foreclosure of the lease. Under a worst-case scenario, if a foreclosure were to occur, Energy Holdings would record a pre-tax write-off up to its outstanding gross investment in these facilities. Also, in the event of a potential foreclosure, the net tax benefits generated by Energy Holdings’ portfolio of investments could be materially reduced in the period in which gains associated with the potential forgiveness of debt at these projects occurs. The amount and timing of any potential reduction in net tax benefits generated by Energy Holdings’ portfolio of investments is dependent upon a number of factors including, but not limited to, the time of a potential foreclosure, the amount of lease debt outstanding, any cash trapped at the projects and negotiations during such potential foreclosure process. The potential loss of earnings, impairment and/or tax payments could have a material impact to our financial position, results of operations and net cash flows.
ITEM 8. FINANCIAL STATEMENTS AND SUPPLEMENTARY DATA
This combined Form 10-K is separately filed by PSEG, PSE&G and Power. Information contained herein relating to any individual company is filed by such company on its own behalf. PSE&G and Power each make representations only as to itself and make no representations as to any other company.
REPORT OF INDEPENDENT REGISTERED PUBLIC ACCOUNTING FIRM
To the Board of Directors and Stockholders of
Public Service Enterprise Group Incorporated
Newark, New Jersey
Opinion on the Financial Statements
We have audited the accompanying consolidated balance sheets of Public Service Enterprise Group Incorporated and subsidiaries (the “Company”) as of December 31, 20162018 and 2015, and2017, the related consolidated statements of operations, comprehensive income, stockholders’stockholders' equity, and cash flows for each of the three years in the period ended December 31, 2016. Our audits also included2018, the related notes and the consolidated financial statement schedule listed in the Index at Item 15(B)(a) (collectively referred to as the “financial statements”). These consolidatedIn our opinion, the financial statements and consolidatedpresent fairly, in all material respects, the financial statement schedule are the responsibilityposition of the Company’s management. Our responsibility is to express an opinion onCompany as of December 31, 2018 and 2017, and the consolidated financial statementsresults of its operations and consolidated financial statement schedule based on our audits.its cash flows for each of the three years in the period ended December 31, 2018, in conformity with accounting principles generally accepted in the United States of America.
We conducted our auditshave also audited, in accordance with the standards of the Public Company Accounting Oversight Board (United States). (“PCAOB”), the Company's internal control over financial reporting as of December 31, 2018, based on criteria established in Internal Control - Integrated Framework (2013) issued by the Committee of Sponsoring Organizations of the Treadway Commission and our report dated February 27, 2019, expressed an unqualified opinion on the Company's internal control over financial reporting.
Basis for Opinion
These financial statements are the responsibility of the Company's management. Our responsibility is to express an opinion on the Company's financial statements based on our audits. We are a public accounting firm registered with the PCAOB and are required to be independent with respect to the Company in accordance with the U.S. federal securities laws and the applicable rules and regulations of the Securities and Exchange Commission and the PCAOB.
We conducted our audits in accordance with the standards of the PCAOB. Those standards require that we plan and perform the audit to obtain reasonable assurance about whether the financial statements are free of material misstatement. An audit includesmisstatement, whether due to error or fraud. Our audits included performing procedures to assess the risks of material misstatement of the financial statements, whether due to error or fraud, and performing procedures that respond to those risks. Such procedures included examining, on a test basis, evidence supportingregarding the amounts and disclosures in the financial statements. An auditOur audits also includes assessingincluded evaluating the accounting principles used and significant estimates made by management, as well as evaluating the overall presentation of the financial statement presentation.statements. We believe that our audits provide a reasonable basis for our opinion.
In our opinion, such consolidated financial statements present fairly, in all material respects, the financial position of the Company as of December 31, 2016 and 2015, and the results of their operations and their cash flows for each of the three years in the period ended December 31, 2016, in conformity with accounting principles generally accepted in the United States of America. Also, in our opinion, such consolidated financial statement schedule, when considered in relation to the basic consolidated financial statements taken as a whole, presents fairly, in all material respects, the information set forth therein.
We have also audited, in accordance with the standards of the Public Company Accounting Oversight Board (United States), the Company’s internal control over financial reporting as of December 31, 2016, based on the criteria established in Internal Control - Integrated Framework (2013) issued by the Committee of Sponsoring Organizations of the Treadway Commission and our report dated February 27, 2017 expressed an unqualified opinion on the Company’s internal control over financial reporting.
|
|
| |
/s/ DELOITTEDELOITTE & TOUCHETOUCHE LLP |
| |
| Parsippany, New Jersey |
February 27, 20172019 |
We have served as the Company's auditor since 1934.
REPORT OF INDEPENDENT REGISTERED PUBLIC ACCOUNTING FIRM
To the Board of Directors and Sole Stockholder of
Public Service Electric and Gas Company
Newark, New Jersey
Opinion on the Financial Statements
We have audited the accompanying consolidated balance sheets of Public Service Electric and Gas Company and subsidiaries (the “Company”) as of December 31, 20162018 and 2015,2017, and the related consolidated statements of operations, comprehensive income, common stockholder’s equity, and cash flows for each of the three years in the period ended December 31, 2016. Our audits also included2018, the related notes and the consolidated financial statement schedule listed in the Index at Item 15(B)(b) (collectively referred to as the “financial statements”). These consolidatedIn our opinion, the financial statements present fairly, in all material respects, the financial position of the Company as of December 31, 2018 and consolidated2017, and the results of its operations and its cash flows for each of the three years in the period ended December 31, 2018, in conformity with accounting principles generally accepted in the United States of America.
Basis for Opinion
These financial statement schedulestatements are the responsibility of the Company’sCompany's management. Our responsibility is to express an opinion on the consolidatedCompany's financial statements and consolidated financial statement schedule based on our audits. We are a public accounting firm registered with the Public Company Accounting Oversight Board (United States) (“PCAOB”) and are required to be independent with respect to the Company in accordance with the U.S. federal securities laws and the applicable rules and regulations of the Securities and Exchange Commission and the PCAOB.
We conducted our audits in accordance with the standards of the Public Company Accounting Oversight Board (United States).PCAOB. Those standards require that we plan and perform the audit to obtain reasonable assurance about whether the financial statements are free of material misstatement.misstatement, whether due to error or fraud. The Company is not required to have, nor were we engaged to perform, an audit of its internal control over financial reporting. OurAs part of our audits, included considerationwe are required to obtain an understanding of internal control over financial reporting as a basis for designing audit procedures that are appropriate in the circumstances, but not for the purpose of expressing an opinion on the effectiveness of the Company’s internal control over financial reporting. Accordingly, we express no such opinion. An audit also includes
Our audits included performing procedures to assess the risks of material misstatement of the financial statements, whether due to error or fraud, and performing procedures that respond to those risks. Such procedures included examining, on a test basis, evidence supportingregarding the amounts and disclosures in the financial statements, assessingstatements. Our audits also included evaluating the accounting principles used and significant estimates made by management, as well as evaluating the overall presentation of the financial statement presentation.statements. We believe that our audits provide a reasonable basis for our opinion.
In our opinion, such consolidated financial statements present fairly, in all material respects, the financial position of the Company as of December 31, 2016 and 2015, and the results of their operations and their cash flows for each of the three years in the period ended December 31, 2016, in conformity with accounting principles generally accepted in the United States of America. Also, in our opinion, such consolidated financial statement schedule, when considered in relation to the basic consolidated financial statements taken as a whole, presents fairly in all material respects the information set forth therein.
|
|
| |
/s/ DELOITTEDELOITTE & TOUCHETOUCHE LLP |
| |
| Parsippany, New Jersey |
February 27, 20172019 |
We have served as the Company's auditor since 1934.
REPORT OF INDEPENDENT REGISTERED PUBLIC ACCOUNTING FIRM
To the Board of Directors and Sole Member of
PSEG Power LLC
Newark, New Jersey
Opinion on the Financial Statements
We have audited the accompanying consolidated balance sheets of PSEG Power LLC and subsidiaries (the “Company”) as of December 31, 20162018 and 2015, and2017, the related consolidated statements of operations, comprehensive income, member’s equity, and cash flows for each of the three years in the period ended December 31, 2016. Our audits also included2018, the related notes and the consolidated financial statement schedule listed in the Index at Item 15(B)(c) (collectively referred to as the “financial statements”). These consolidatedIn our opinion, the financial statements present fairly, in all material respects, the financial position of the Company as of December 31, 2018 and consolidated2017, and the results of its operations and its cash flows for each of the three years in the period ended December 31, 2018, in conformity with accounting principles generally accepted in the United States of America.
Basis for Opinion
These financial statement schedulestatements are the responsibility of the Company’sCompany's management. Our responsibility is to express an opinion on the consolidatedCompany's financial statements and consolidated financial statement schedule based on our audits. We are a public accounting firm registered with the Public Company Accounting Oversight Board (United States) (“PCAOB”) and are required to be independent with respect to the Company in accordance with the U.S. federal securities laws and the applicable rules and regulations of the Securities and Exchange Commission and the PCAOB.
We conducted our audits in accordance with the standards of the Public Company Accounting Oversight Board (United States).PCAOB. Those standards require that we plan and perform the audit to obtain reasonable assurance about whether the financial statements are free of material misstatement.misstatement, whether due to error or fraud. The Company is not required to have, nor were we engaged to perform, an audit of its internal control over financial reporting. OurAs part of our audits, included considerationwe are required to obtain an understanding of internal control over financial reporting as a basis for designing audit procedures that are appropriate in the circumstances, but not for the purpose of expressing an opinion on the effectiveness of the Company’s internal control over financial reporting. Accordingly, we express no such opinion. An audit also includes
Our audits included performing procedures to assess the risks of material misstatement of the financial statements, whether due to error or fraud, and performing procedures that respond to those risks. Such procedures included examining, on a test basis, evidence supportingregarding the amounts and disclosures in the financial statements, assessingstatements. Our audits also included evaluating the accounting principles used and significant estimates made by management, as well as evaluating the overall presentation of the financial statement presentation.statements. We believe that our audits provide a reasonable basis for our opinion.
In our opinion, such consolidated financial statements present fairly, in all material respects, the financial position of the Company as of December 31, 2016 and 2015, and the results of their operations and their cash flows for each of the three years in the period ended December 31, 2016, in conformity with accounting principles generally accepted in the United States of America. Also, in our opinion, such consolidated financial statement schedule, when considered in relation to the basic consolidated financial statements taken as a whole, presents fairly in all material respects the information set forth therein.
|
|
| |
/s/ DELOITTEDELOITTE & TOUCHETOUCHE LLP |
| |
| Parsippany, New Jersey |
February 27, 20172019 |
We have served as the Company's auditor since 2000.
PUBLIC SERVICE ENTERPRISE GROUP INCORPORATED
CONSOLIDATED STATEMENTS OF OPERATIONS
Millions, except per share data
|
| | | | | | | | | | | | | | |
| | | | | | | | | |
| | | | Years Ended December 31, | |
| | | | 2016 | | 2015 | | 2014 | |
| | OPERATING REVENUES | | $ | 9,061 |
| | $ | 10,415 |
| | $ | 10,886 |
| |
| | OPERATING EXPENSES | | | | | | | |
| | Energy Costs | | 3,001 |
| | 3,261 |
| | 3,886 |
| |
| | Operation and Maintenance | | 3,008 |
| | 2,978 |
| | 3,150 |
| |
| | Depreciation and Amortization | | 1,476 |
| | 1,214 |
| | 1,227 |
| |
| | Total Operating Expenses | | 7,485 |
| | 7,453 |
| | 8,263 |
| |
| | OPERATING INCOME | | 1,576 |
| | 2,962 |
| | 2,623 |
| |
| | Income from Equity Method Investments | | 11 |
| | 12 |
| | 13 |
| |
| | Other Income | | 191 |
| | 254 |
| | 290 |
| |
| | Other Deductions | | (67 | ) | | (102 | ) | | (61 | ) | |
| | Other-Than-Temporary Impairments | | (28 | ) | | (53 | ) | | (20 | ) | |
| | Interest Expense | | (385 | ) | | (393 | ) | | (389 | ) | |
| | INCOME BEFORE INCOME TAXES | | 1,298 |
| | 2,680 |
| | 2,456 |
| |
| | Income Tax Expense | | (411 | ) | | (1,001 | ) | | (938 | ) | |
| | NET INCOME | | $ | 887 |
| | $ | 1,679 |
| | $ | 1,518 |
| |
| | WEIGHTED AVERAGE COMMON SHARES OUTSTANDING: | | | | | | | |
| | BASIC | | 505 |
| | 505 |
| | 506 |
| |
| | DILUTED | | 508 |
| | 508 |
| | 508 |
| |
| | NET INCOME PER SHARE: | | | | | | | |
| | BASIC | | $ | 1.76 |
| | $ | 3.32 |
| | $ | 3.00 |
| |
| | DILUTED | | $ | 1.75 |
| | $ | 3.30 |
| | $ | 2.99 |
| |
| | | | | | | | | |
|
| | | | | | | | | | | | | | |
| | | | | | | | | |
| | | | Years Ended December 31, | |
| | | | 2018 | | 2017 | | 2016 | |
| | OPERATING REVENUES | | $ | 9,696 |
| | $ | 9,094 |
| | $ | 8,966 |
| |
| | OPERATING EXPENSES | | | | | | | |
| | Energy Costs | | 3,225 |
| | 2,778 |
| | 2,901 |
| |
| | Operation and Maintenance | | 3,015 |
| | 2,901 |
| | 2,991 |
| |
| | Depreciation and Amortization | | 1,158 |
| | 1,986 |
| | 1,476 |
| |
| | Total Operating Expenses | | 7,398 |
| | 7,665 |
| | 7,368 |
| |
| | OPERATING INCOME | | 2,298 |
| | 1,429 |
| | 1,598 |
| |
| | Income from Equity Method Investments | | 15 |
| | 14 |
| | 11 |
| |
| | Net Gains (Losses) on Trust Investments | | (143 | ) | | 134 |
| | (6 | ) | |
| | Other Income (Deductions) | | 85 |
| | 82 |
| | 102 |
| |
| | Non-Operating Pension and OPEB Credits (Costs) | | 76 |
| | — |
| | (22 | ) | |
| | Interest Expense | | (476 | ) | | (391 | ) | | (385 | ) | |
| | INCOME BEFORE INCOME TAXES | | 1,855 |
| | 1,268 |
| | 1,298 |
| |
| | Income Tax Benefit (Expense) | | (417 | ) | | 306 |
| | (411 | ) | |
| | NET INCOME | | $ | 1,438 |
| | $ | 1,574 |
| | $ | 887 |
| |
| | WEIGHTED AVERAGE COMMON SHARES OUTSTANDING: | | | | | | | |
| | BASIC | | 504 |
| | 505 |
| | 505 |
| |
| | DILUTED | | 507 |
| | 507 |
| | 508 |
| |
| | NET INCOME PER SHARE: | | | | | | | |
| | BASIC | | $ | 2.85 |
| | $ | 3.12 |
| | $ | 1.76 |
| |
| | DILUTED | | $ | 2.83 |
| | $ | 3.10 |
| | $ | 1.75 |
| |
| | | | | | | | | |
See Notes to Consolidated Financial Statements.
PUBLIC SERVICE ENTERPRISE GROUP INCORPORATED
CONSOLIDATED STATEMENTS OF COMPREHENSIVE INCOME
Millions
|
| | | | | | | | | | | | | | |
| | | | | | | | | |
| | | Years Ended December 31, | |
| | | | 2016 | | 2015 | | 2014 | |
| | NET INCOME | | $ | 887 |
| | $ | 1,679 |
| | $ | 1,518 |
| |
| | Other Comprehensive Income (Loss), net of tax | | | | | | | |
| | Unrealized Gains (Losses) on Available-for-Sale Securities, net of tax (expense) benefit of $(41), $34, and $26 for the years ended 2016, 2015 and 2014, respectively | | 42 |
| | (27 | ) | | (27 | ) | |
| | Unrealized Gains (Losses) on Cash Flow Hedges, net of tax (expense) benefit of $(1), $7 and $(8) for the years ended 2016, 2015 and 2014, respectively | | 2 |
| | (10 | ) | | 12 |
| |
| | Pension/Other Postretirement Benefit Costs (OPEB) adjustment, net of tax (expense) benefit of $8, $(18) and $120 for the years ended 2016, 2015 and 2014, respectively | | (12 | ) | | 25 |
| | (173 | ) | |
| | Other Comprehensive Income (Loss), net of tax | | 32 |
| | (12 | ) | | (188 | ) | |
| | COMPREHENSIVE INCOME | | $ | 919 |
| | $ | 1,667 |
| | $ | 1,330 |
| |
| | | | | | | | | |
|
| | | | | | | | | | | | | | |
| | | | | | | | | |
| | | Years Ended December 31, | |
| | | | 2018 | | 2017 | | 2016 | |
| | NET INCOME | | $ | 1,438 |
| | $ | 1,574 |
| | $ | 887 |
| |
| | Other Comprehensive Income (Loss), net of tax | | | | | | | |
| | Unrealized Gains (Losses) on Available-for-Sale Securities, net of tax (expense) benefit of $11, $(37) and $(41) for the years ended 2018, 2017 and 2016, respectively | | (17 | ) | | 44 |
| | 42 |
| |
| | Unrealized Gains (Losses) on Cash Flow Hedges, net of tax (expense) benefit of $1, $1 and $(1) for the years ended 2018, 2017 and 2016, respectively | | (1 | ) | | (2 | ) | | 2 |
| |
| | Pension/Other Postretirement Benefit Costs (OPEB) adjustment, net of tax (expense) benefit of $(18), $(4) and $8 for the years ended 2018, 2017 and 2016, respectively | | 46 |
| | (8 | ) | | (12 | ) | |
| | Other Comprehensive Income (Loss), net of tax | | 28 |
| | 34 |
| | 32 |
| |
| | COMPREHENSIVE INCOME | | $ | 1,466 |
| | $ | 1,608 |
| | $ | 919 |
| |
| | | | | | | | | |
See Notes to Consolidated Financial Statements.
PUBLIC SERVICE ENTERPRISE GROUP INCORPORATED
CONSOLIDATED BALANCE SHEETS
Millions
|
| | | | | | | | | |
| | | | | | |
| | | December 31, | |
| | | 2016 | | 2015 | |
| | ASSETS | |
| | CURRENT ASSETS | | | | |
| | Cash and Cash Equivalents | $ | 423 |
| | $ | 394 |
| |
| | Accounts Receivable, net of allowances of $68 in 2016 and $67 in 2015 | 1,161 |
| | 1,068 |
| |
| | Tax Receivable | 78 |
| | 305 |
| |
| | Unbilled Revenues | 260 |
| | 197 |
| |
| | Fuel | 326 |
| | 463 |
| |
| | Materials and Supplies, net | 561 |
| | 513 |
| |
| | Prepayments | 76 |
| | 135 |
| |
| | Derivative Contracts | 163 |
| | 242 |
| |
| | Regulatory Assets | 199 |
| | 164 |
| |
| | Other | 7 |
| | 13 |
| |
| | Total Current Assets | 3,254 |
| | 3,494 |
| |
| | PROPERTY, PLANT AND EQUIPMENT | 39,337 |
| | 35,494 |
| |
| | Less: Accumulated Depreciation and Amortization | (10,051 | ) | | (8,955 | ) | |
| | Net Property, Plant and Equipment | 29,286 |
| | 26,539 |
| |
| | NONCURRENT ASSETS | | | | |
| | Regulatory Assets | 3,319 |
| | 3,196 |
| |
| | Long-Term Investments | 1,050 |
| | 1,233 |
| |
| | Nuclear Decommissioning Trust (NDT) Fund | 1,859 |
| | 1,754 |
| |
| | Long-Term Tax Receivable | 104 |
| | 171 |
| |
| | Long-Term Receivable of VIEs | 589 |
| | 495 |
| |
| | Other Special Funds | 217 |
| | 227 |
| |
| | Goodwill | 16 |
| | 16 |
| |
| | Other Intangibles | 98 |
| | 102 |
| |
| | Derivative Contracts | 24 |
| | 77 |
| |
| | Other | 254 |
| | 231 |
| |
| | Total Noncurrent Assets | 7,530 |
| | 7,502 |
| |
| | TOTAL ASSETS | $ | 40,070 |
| | $ | 37,535 |
| |
| | | | | | |
|
| | | | | | | | | |
| | | | | | |
| | | December 31, | |
| | | 2018 | | 2017 | |
| | ASSETS | |
| | CURRENT ASSETS | | | | |
| | Cash and Cash Equivalents | $ | 177 |
| | $ | 313 |
| |
| | Accounts Receivable, net of allowances of $63 in 2018 and $59 in 2017 | 1,435 |
| | 1,348 |
| |
| | Tax Receivable | 242 |
| | 127 |
| |
| | Unbilled Revenues | 240 |
| | 296 |
| |
| | Fuel | 331 |
| | 289 |
| |
| | Materials and Supplies, net | 571 |
| | 577 |
| |
| | Prepayments | 94 |
| | 118 |
| |
| | Derivative Contracts | 11 |
| | 29 |
| |
| | Regulatory Assets | 389 |
| | 211 |
| |
| | Other | 17 |
| | 4 |
| |
| | Total Current Assets | 3,507 |
| | 3,312 |
| |
| | PROPERTY, PLANT AND EQUIPMENT | 44,201 |
| | 41,231 |
| |
| | Less: Accumulated Depreciation and Amortization | (9,838 | ) | | (9,434 | ) | |
| | Net Property, Plant and Equipment | 34,363 |
| | 31,797 |
| |
| | NONCURRENT ASSETS | | | | |
| | Regulatory Assets | 3,399 |
| | 3,222 |
| |
| | Long-Term Investments | 896 |
| | 932 |
| |
| | Nuclear Decommissioning Trust (NDT) Fund | 1,878 |
| | 2,133 |
| |
| | Long-Term Receivable of VIEs | 624 |
| | 686 |
| |
| | Rabbi Trust Fund | 224 |
| | 231 |
| |
| | Goodwill | 16 |
| | 16 |
| |
| | Other Intangibles | 143 |
| | 114 |
| |
| | Derivative Contracts | 1 |
| | 7 |
| |
| | Other | 275 |
| | 266 |
| |
| | Total Noncurrent Assets | 7,456 |
| | 7,607 |
| |
| | TOTAL ASSETS | $ | 45,326 |
| | $ | 42,716 |
| |
| | | | | | |
See Notes to Consolidated Financial Statements.
PUBLIC SERVICE ENTERPRISE GROUP INCORPORATED
CONSOLIDATED BALANCE SHEETS
Millions
|
| | | | | | | | | |
| | | | | | |
| | | December 31, | |
| | | 2016 | | 2015 | |
| | LIABILITIES AND CAPITALIZATION | |
| | CURRENT LIABILITIES |
| |
| |
| | Long-Term Debt Due Within One Year | $ | 500 |
| | $ | 734 |
| |
| | Commercial Paper and Loans | 388 |
| | 364 |
| |
| | Accounts Payable | 1,459 |
| | 1,369 |
| |
| | Derivative Contracts | 13 |
| | 76 |
| |
| | Accrued Interest | 97 |
| | 96 |
| |
| | Accrued Taxes | 31 |
| | 42 |
| |
| | Clean Energy Program | 142 |
| | 142 |
| |
| | Obligation to Return Cash Collateral | 132 |
| | 128 |
| |
| | Regulatory Liabilities | 88 |
| | 123 |
| |
| | Regulatory Liabilities of VIEs | — |
| | 42 |
| |
| | Other | 426 |
| | 459 |
| |
| | Total Current Liabilities | 3,276 |
| | 3,575 |
| |
| | NONCURRENT LIABILITIES | | | | |
| | Deferred Income Taxes and Investment Tax Credits (ITC) | 8,658 |
| | 8,166 |
| |
| | Regulatory Liabilities | 118 |
| | 175 |
| |
| | Asset Retirement Obligations | 726 |
| | 679 |
| |
| | Other Postretirement Benefit (OPEB) Costs | 1,324 |
| | 1,228 |
| |
| | OPEB Costs of Servco | 452 |
| | 375 |
| |
| | Accrued Pension Costs | 568 |
| | 487 |
| |
| | Accrued Pension Costs of Servco | 128 |
| | 114 |
| |
| | Environmental Costs | 401 |
| | 415 |
| |
| | Derivative Contracts | 3 |
| | 27 |
| |
| | Long-Term Accrued Taxes | 180 |
| | 212 |
| |
| | Other | 211 |
| | 181 |
| |
| | Total Noncurrent Liabilities | 12,769 |
| | 12,059 |
| |
| | COMMITMENTS AND CONTINGENT LIABILITIES (See Note 13) |
|
| |
| |
| | CAPITALIZATION | | | | |
| | LONG-TERM DEBT
| 10,895 |
| | 8,834 |
| |
| | STOCKHOLDERS’ EQUITY | | | | |
| | Common Stock, no par, authorized 1,000 shares; issued, 2016 and 2015— 534 shares | 4,936 |
| | 4,915 |
| |
| | Treasury Stock, at cost, 2016—29 shares; 2015—28 shares | (717 | ) | | (671 | ) | |
| | Retained Earnings | 9,174 |
| | 9,117 |
| |
| | Accumulated Other Comprehensive Loss | (263 | ) | | (295 | ) | |
| | Total Common Stockholders’ Equity | 13,130 |
| | 13,066 |
| |
| | Noncontrolling Interest | — |
| | 1 |
| |
| | Total Stockholders’ Equity | 13,130 |
| | 13,067 |
| |
| | Total Capitalization | 24,025 |
| | 21,901 |
| |
| | TOTAL LIABILITIES AND CAPITALIZATION | $ | 40,070 |
| | $ | 37,535 |
| |
| | | | | | |
|
| | | | | | | | | |
| | | | | | |
| | | December 31, | |
| | | 2018 | | 2017 | |
| | LIABILITIES AND CAPITALIZATION | |
| | CURRENT LIABILITIES |
| |
| |
| | Long-Term Debt Due Within One Year | $ | 1,294 |
| | $ | 1,000 |
| |
| | Commercial Paper and Loans | 1,016 |
| | 542 |
| |
| | Accounts Payable | 1,451 |
| | 1,694 |
| |
| | Derivative Contracts | 11 |
| | 16 |
| |
| | Accrued Interest | 110 |
| | 103 |
| |
| | Accrued Taxes | 26 |
| | 48 |
| |
| | Clean Energy Program | 143 |
| | 128 |
| |
| | Obligation to Return Cash Collateral | 136 |
| | 129 |
| |
| | Regulatory Liabilities | 311 |
| | 47 |
| |
| | Other | 437 |
| | 461 |
| |
| | Total Current Liabilities | 4,935 |
| | 4,168 |
| |
| | NONCURRENT LIABILITIES | | | | |
| | Deferred Income Taxes and Investment Tax Credits (ITC) | 5,713 |
| | 5,240 |
| |
| | Regulatory Liabilities | 3,221 |
| | 2,948 |
| |
| | Asset Retirement Obligations | 1,063 |
| | 1,024 |
| |
| | Other Postretirement Benefit (OPEB) Costs | 704 |
| | 1,455 |
| |
| | OPEB Costs of Servco | 501 |
| | 542 |
| |
| | Accrued Pension Costs | 791 |
| | 537 |
| |
| | Accrued Pension Costs of Servco | 109 |
| | 129 |
| |
| | Environmental Costs | 327 |
| | 357 |
| |
| | Derivative Contracts | 4 |
| | 5 |
| |
| | Long-Term Accrued Taxes | 181 |
| | 175 |
| |
| | Other | 232 |
| | 221 |
| |
| | Total Noncurrent Liabilities | 12,846 |
| | 12,633 |
| |
| | COMMITMENTS AND CONTINGENT LIABILITIES (See Note 14) |
|
| |
| |
| | CAPITALIZATION | | | | |
| | LONG-TERM DEBT
| 13,168 |
| | 12,068 |
| |
| | STOCKHOLDERS’ EQUITY | | | | |
| | Common Stock, no par, authorized 1,000 shares; issued, 2018 and 2017— 534 shares | 4,980 |
| | 4,961 |
| |
| | Treasury Stock, at cost, 2018—30 shares; 2017—29 shares | (808 | ) | | (763 | ) | |
| | Retained Earnings | 10,582 |
| | 9,878 |
| |
| | Accumulated Other Comprehensive Loss | (377 | ) | | (229 | ) | |
| | Total Stockholders’ Equity | 14,377 |
| | 13,847 |
| |
| | Total Capitalization | 27,545 |
| | 25,915 |
| |
| | TOTAL LIABILITIES AND CAPITALIZATION | $ | 45,326 |
| | $ | 42,716 |
| |
| | | | | | |
See Notes to Consolidated Financial Statements.
PUBLIC SERVICE ENTERPRISE GROUP INCORPORATED
CONSOLIDATED STATEMENTS OF CASH FLOWS
|
| | | | | | | | | | | | | | |
| | | | | | | | | |
| | | | Years Ended December 31, | |
| | | | 2016 | | 2015 | | 2014 | |
| | CASH FLOWS FROM OPERATING ACTIVITIES | | | | | | | |
| | Net Income | | $ | 887 |
| | $ | 1,679 |
| | $ | 1,518 |
| |
| | Adjustments to Reconcile Net Income to Net Cash Flows from Operating Activities: | | | | | | | |
| | Depreciation and Amortization | | 1,476 |
| | 1,214 |
| | 1,227 |
| |
| | Amortization of Nuclear Fuel | | 203 |
| | 213 |
| | 200 |
| |
| | Renewable Energy Credit (REC) Compliance Accrual | | 109 |
| | 104 |
| | 69 |
| |
| | Impairment Costs for Early Plant Retirements | | 102 |
| | — |
| | — |
| |
| | Provision for Deferred Income Taxes (Other than Leases) and ITC | | 474 |
| | 685 |
| | 515 |
| |
| | Non-Cash Employee Benefit Plan Costs | | 127 |
| | 161 |
| | 47 |
| |
| | Leveraged Lease Income, Adjusted for Rents Received and Deferred Taxes | | (6 | ) | | 26 |
| | (4 | ) | |
| | Net (Gain) Loss on Lease Investments | | 92 |
| | — |
| | (3 | ) | |
| | Net Realized and Unrealized (Gains) Losses on Energy Contracts and Other Derivatives | | 183 |
| | (143 | ) | | (93 | ) | |
| | Net Change in Regulatory Assets and Liabilities | | (138 | ) | | (48 | ) | | 187 |
| |
| | Cost of Removal | | (131 | ) | | (120 | ) | | (98 | ) | |
| | Net Realized (Gains) Losses and (Income) Expense from NDT Fund | | (26 | ) | | (38 | ) | | (166 | ) | |
| | Net Change in Certain Current Assets and Liabilities | | | | | | | |
| | Tax Receivable | | 303 |
| | (94 | ) | | 30 |
| |
| | Accrued Taxes | | 3 |
| | (91 | ) | | (156 | ) | |
| | Margin Deposit | | (76 | ) | | 122 |
| | (22 | ) | |
| | Other Current Assets and Liabilities | | (180 | ) | | 288 |
| | (31 | ) | |
| | Employee Benefit Plan Funding and Related Payments | | (103 | ) | | (109 | ) | | (95 | ) | |
| | Other | | 12 |
| | 70 |
| | 35 |
| |
| | Net Cash Provided By (Used In) Operating Activities | | 3,311 |
| | 3,919 |
| | 3,160 |
| |
| | CASH FLOWS FROM INVESTING ACTIVITIES | | | | | | | |
| | Additions to Property, Plant and Equipment | | (4,199 | ) | | (3,863 | ) | | (2,820 | ) | |
| | Purchase of Emissions Allowances and RECs | | (99 | ) | | (106 | ) | | (101 | ) | |
| | Proceeds from Sale of Capital Leases and Investments | | — |
| | 14 |
| | 25 |
| |
| | Proceeds from Sales of Available-for-Sale Securities | | 824 |
| | 1,501 |
| | 1,915 |
| |
| | Investments in Available-for-Sale Securities | | (856 | ) | | (1,552 | ) | | (1,934 | ) | |
| | Other | | 82 |
| | 64 |
| | 23 |
| |
| | Net Cash Provided By (Used In) Investing Activities | | (4,248 | ) | | (3,942 | ) | | (2,892 | ) | |
| | CASH FLOWS FROM FINANCING ACTIVITIES | | | | | | | |
| | Net Change in Commercial Paper and Loans | | 24 |
| | 364 |
| | (60 | ) | |
| | Issuance of Long-Term Debt | | 2,675 |
| | 1,350 |
| | 1,250 |
| |
| | Redemption of Long-Term Debt | | (824 | ) | | (600 | ) | | (500 | ) | |
| | Redemption of Securitization Debt | | — |
| | (259 | ) | | (237 | ) | |
| | Cash Dividend Paid on Common Stock | | (830 | ) | | (789 | ) | | (748 | ) | |
| | Other | | (79 | ) | | (51 | ) | | (64 | ) | |
| | Net Cash Provided By (Used In) Financing Activities | | 966 |
| | 15 |
| | (359 | ) | |
| | Net Increase (Decrease) in Cash and Cash Equivalents | | 29 |
| | (8 | ) | | (91 | ) | |
| | Cash and Cash Equivalents at Beginning of Period | | 394 |
| | 402 |
| | 493 |
| |
| | Cash and Cash Equivalents at End of Period | | $ | 423 |
| | $ | 394 |
| | $ | 402 |
| |
| | Supplemental Disclosure of Cash Flow Information: | | | | | | | |
| | Income Taxes Paid (Received) | | $ | (245 | ) | | $ | 447 |
| | $ | 538 |
| |
| | Interest Paid, Net of Amounts Capitalized | | $ | 365 |
| | $ | 381 |
| | $ | 382 |
| |
| | Accrued Property, Plant and Equipment Expenditures | | $ | 664 |
| | $ | 510 |
| | $ | 382 |
| |
| | | | | | | | | |
|
| | | | | | | | | | | | | | |
| | | | | | | | | |
| | | | Years Ended December 31, | |
| | | | 2018 | | 2017 | | 2016 | |
| | CASH FLOWS FROM OPERATING ACTIVITIES | | | | | | | |
| | Net Income | | $ | 1,438 |
| | $ | 1,574 |
| | $ | 887 |
| |
| | Adjustments to Reconcile Net Income to Net Cash Flows from Operating Activities: | | | | | | | |
| | Depreciation and Amortization | | 1,158 |
| | 1,986 |
| | 1,476 |
| |
| | Amortization of Nuclear Fuel | | 187 |
| | 199 |
| | 203 |
| |
| | Emission Allowances and Renewable Energy Credit (REC) Compliance Accrual | | 97 |
| | 103 |
| | 109 |
| |
| | Impairment Costs for Early Plant Retirements | | — |
| | — |
| | 102 |
| |
| | Provision for Deferred Income Taxes (Other than Leases) and ITC | | 568 |
| | (167 | ) | | 474 |
| |
| | Non-Cash Employee Benefit Plan Costs | | 70 |
| | 89 |
| | 127 |
| |
| | Leveraged Lease Income, Adjusted for Rents Received and Deferred Taxes | | (149 | ) | | (159 | ) | | (6 | ) | |
| | Gain on Sale of Hudson and Mercer Units | | (54 | ) | | — |
| | — |
| |
| | Net (Gain) Loss on Lease Investments | | 5 |
| | 48 |
| | 92 |
| |
| | Net Realized and Unrealized (Gains) Losses on Energy Contracts and Other Derivatives | | 116 |
| | 188 |
| | 183 |
| |
| | Net Change in Regulatory Assets and Liabilities | | (153 | ) | | (188 | ) | | (138 | ) | |
| | Cost of Removal | | (160 | ) | | (107 | ) | | (131 | ) | |
| | Net (Gains) Losses and (Income) Expense from NDT Fund | | 98 |
| | (156 | ) | | (26 | ) | |
| | Net Change in Certain Current Assets and Liabilities | | | | | | | |
| | Tax Receivable | | 17 |
| | 65 |
| | 303 |
| |
| | Accrued Taxes | | (69 | ) | | 16 |
| | 3 |
| |
| | Margin Deposit | | (247 | ) | | (90 | ) | | (76 | ) | |
| | Other Current Assets and Liabilities | | 70 |
| | (72 | ) | | (179 | ) | |
| | Employee Benefit Plan Funding and Related Payments | | (101 | ) | | (81 | ) | | (103 | ) | |
| | Other | | 22 |
| | 12 |
| | 13 |
| |
| | Net Cash Provided By (Used In) Operating Activities | | 2,913 |
| | 3,260 |
| | 3,313 |
| |
| | CASH FLOWS FROM INVESTING ACTIVITIES | | | | | | | |
| | Additions to Property, Plant and Equipment | | (3,912 | ) | | (4,190 | ) | | (4,199 | ) | |
| | Purchase of Emissions Allowances and RECs | | (146 | ) | | (117 | ) | | (99 | ) | |
| | Proceeds from Sales of Trust Investments | | 1,501 |
| | 2,319 |
| | 824 |
| |
| | Purchases of Trust Investments | | (1,473 | ) | | (2,340 | ) | | (856 | ) | |
| | Other | | 114 |
| | 72 |
| | 82 |
| |
| | Net Cash Provided By (Used In) Investing Activities | | (3,916 | ) | | (4,256 | ) | | (4,248 | ) | |
| | CASH FLOWS FROM FINANCING ACTIVITIES | | | | | | | |
| | Net Change in Commercial Paper and Loans | | 474 |
| | 154 |
| | 24 |
| |
| | Issuance of Long-Term Debt | | 2,750 |
| | 2,175 |
| | 2,675 |
| |
| | Redemption of Long-Term Debt | | (1,350 | ) | | (500 | ) | | (824 | ) | |
| | Cash Dividends Paid on Common Stock | | (910 | ) | | (870 | ) | | (830 | ) | |
| | Other | | (77 | ) | | (74 | ) | | (79 | ) | |
| | Net Cash Provided By (Used In) Financing Activities | | 887 |
| | 885 |
| | 966 |
| |
| | Net Increase (Decrease) in Cash, Cash Equivalents and Restricted Cash | | (116 | ) | | (111 | ) | | 31 |
| |
| | Cash, Cash Equivalents and Restricted Cash at Beginning of Period | | 315 |
| | 426 |
| | 395 |
| |
| | Cash, Cash Equivalents and Restricted Cash at End of Period | | $ | 199 |
| | $ | 315 |
| | $ | 426 |
| |
| | Supplemental Disclosure of Cash Flow Information: | | | | | | | |
| | Income Taxes Paid (Received) | | $ | 99 |
| | $ | (8 | ) | | $ | (245 | ) | |
| | Interest Paid, Net of Amounts Capitalized | | $ | 454 |
| | $ | 377 |
| | $ | 365 |
| |
| | Accrued Property, Plant and Equipment Expenditures | | $ | 517 |
| | $ | 722 |
| | $ | 664 |
| |
| | | | | | | | | |
See Notes to Consolidated Financial Statements.
PUBLIC SERVICE ENTERPRISE GROUP INCORPORATED
CONSOLIDATED STATEMENTS OF STOCKHOLDERS’ EQUITY
Millions
|
| | | | | | | | | | | | | | | | | | | | | | | | | | | | | | | | |
| | | | | | | | | | | | | | | | | | | |
| | | | Common Stock | | Treasury Stock | | Retained Earnings | | Accumulated Other Comprehensive Income (Loss) | | Noncontrolling Interest | |
| | | | Shs. | | Amount | | Shs. | | Amount | | | Total | |
| | Balance as of January 1, 2014 | | 534 |
| | $ | 4,861 |
| | (28 | ) | | $ | (615 | ) | | $ | 7,457 |
| | $ | (95 | ) | | $ | 1 |
| | $ | 11,609 |
| |
| | Net Income | | — |
| | — |
| | — |
| | — |
| | 1,518 |
| | — |
| | — |
| | 1,518 |
| |
| | Other Comprehensive Income (Loss), net of tax (expense) benefit of $138 | | — |
| | — |
| | — |
| | — |
| | — |
| | (188 | ) | | — |
| | (188 | ) | |
| | Comprehensive Income | | | | | | | | | | | | | | | | 1,330 |
| |
| | Cash Dividends on Common Stock | | — |
| | — |
| | — |
| | — |
| | (748 | ) | | — |
| | — |
| | (748 | ) | |
| | Other | | — |
| | 15 |
| | — |
| | (20 | ) | | — |
| | — |
| | — |
| | (5 | ) | |
| | Balance as of December 31, 2014 | | 534 |
| | $ | 4,876 |
| | (28 | ) | | $ | (635 | ) | | $ | 8,227 |
| | $ | (283 | ) | | $ | 1 |
| | $ | 12,186 |
| |
| | Net Income | | — |
| | — |
| | — |
| | — |
| | 1,679 |
| | — |
| | — |
| | 1,679 |
| |
| | Other Comprehensive Income (Loss), net of tax (expense) benefit of $23 | | — |
| | — |
| | — |
| | — |
| | — |
| | (12 | ) | | — |
| | (12 | ) | |
| | Comprehensive Income | | | | | | | | | | | | | | | | 1,667 |
| |
| | Cash Dividends on Common Stock | | — |
| | — |
| | — |
| | — |
| | (789 | ) | | — |
| | — |
| | (789 | ) | |
| | Other | | — |
| | 39 |
| | — |
| | (36 | ) | | — |
| | — |
| | — |
| | 3 |
| |
| | Balance as of December 31, 2015 | | 534 |
| | $ | 4,915 |
| | (28 | ) | | $ | (671 | ) | | $ | 9,117 |
| | $ | (295 | ) | | $ | 1 |
| | $ | 13,067 |
| |
| | Net Income | | — |
| | — |
| | — |
| | — |
| | 887 |
| | — |
| | — |
| | 887 |
| |
| | Other Comprehensive Income (Loss), net of tax (expense) benefit of $(34) | | — |
| | — |
| | — |
| | — |
| | — |
| | 32 |
| | — |
| | 32 |
| |
| | Comprehensive Income | | | | | | | | | | | | | | | | 919 |
| |
| | Cash Dividends on Common Stock | | — |
| | — |
| | — |
| | — |
| | (830 | ) | | — |
| | — |
| | (830 | ) | |
| | Other | | — |
| | 21 |
| | (1 | ) | | (46 | ) | | — |
| | — |
| | (1 | ) | | (26 | ) | |
| | Balance as of December 31, 2016 | | 534 |
| | $ | 4,936 |
| | (29 | ) | | $ | (717 | ) | | $ | 9,174 |
| | $ | (263 | ) | | $ | — |
| | $ | 13,130 |
| |
| | | | | | | | | | | | | | | | | | | |
|
| | | | | | | | | | | | | | | | | | | | | | | | | | | | | | | | |
| | | | | | | | | | | | | | | | | | | |
| | | | Common Stock | | Treasury Stock | | Retained Earnings | | Accumulated Other Comprehensive Income (Loss) | | Noncontrolling Interest | |
| | | | Shs. | | Amount | | Shs. | | Amount | | | Total | |
| | Balance as of January 1, 2016 | | 534 |
| | $ | 4,915 |
| | (28 | ) | | $ | (671 | ) | | $ | 9,117 |
| | $ | (295 | ) | | $ | 1 |
| | $ | 13,067 |
| |
| | Net Income | | — |
| | — |
| | — |
| | — |
| | 887 |
| | — |
| | — |
| | 887 |
| |
| | Other Comprehensive Income (Loss), net of tax (expense) benefit of $(34) | | — |
| | — |
| | — |
| | — |
| | — |
| | 32 |
| | — |
| | 32 |
| |
| | Comprehensive Income | | | | | | | | | | | | | | | | 919 |
| |
| | Cash Dividends at $1.64 per share on Common Stock | | — |
| | — |
| | — |
| | — |
| | (830 | ) | | — |
| | — |
| | (830 | ) | |
| | Other | | — |
| | 21 |
| | (1 | ) | | (46 | ) | | — |
| | — |
| | (1 | ) | | (26 | ) | |
| | Balance as of December 31, 2016 | | 534 |
| | $ | 4,936 |
| | (29 | ) | | $ | (717 | ) | | $ | 9,174 |
| | $ | (263 | ) | | $ | — |
| | $ | 13,130 |
| |
| | Net Income | | — |
| | — |
| | — |
| | — |
| | 1,574 |
| | — |
| | — |
| | 1,574 |
| |
| | Other Comprehensive Income (Loss), net of tax (expense) benefit of $(40) | | — |
| | — |
| | — |
| | — |
| | — |
| | 34 |
| | — |
| | 34 |
| |
| | Comprehensive Income | | | | | | | | | | | | | | | | 1,608 |
| |
| | Cash Dividends at $1.72 per share on Common Stock | | — |
| | — |
| | — |
| | — |
| | (870 | ) | | — |
| | — |
| | (870 | ) | |
| | Other | | — |
| | 25 |
| | — |
| | (46 | ) | | — |
| | — |
| | — |
| | (21 | ) | |
| | Balance as of December 31, 2017 | | 534 |
| | $ | 4,961 |
| | (29 | ) | | $ | (763 | ) | | $ | 9,878 |
| | $ | (229 | ) | | $ | — |
| | $ | 13,847 |
| |
| | Net Income | | — |
| | — |
| | — |
| | — |
| | 1,438 |
| | — |
| | — |
| | 1,438 |
| |
| | Cumulative Effect Adjustment to Reclassify Unrealized Net Gains on Equity Investments | | — |
| | — |
| | — |
| | — |
| | 176 |
| | (176 | ) | | — |
| | — |
| |
| | Other Comprehensive Income (Loss), net of tax (expense) benefit of $(6) | | — |
| | — |
| | — |
| | — |
| | — |
| | 28 |
| | — |
| | 28 |
| |
| | Comprehensive Income | | | | | | | | | | | | | | | | 1,466 |
| |
| | Cash Dividends at $1.80 per share on Common Stock | | — |
| | — |
| | — |
| | — |
| | (910 | ) | | — |
| | — |
| | (910 | ) | |
| | Other | | — |
| | 19 |
| | (1 | ) | | (45 | ) | | — |
| | — |
| | — |
| | (26 | ) | |
| | Balance as of December 31, 2018 | | 534 |
| | $ | 4,980 |
| | (30 | ) | | $ | (808 | ) | | $ | 10,582 |
| | $ | (377 | ) | | $ | — |
| | $ | 14,377 |
| |
| | | | | | | | | | | | | | | | | | | |
See Notes to Consolidated Financial Statements.
PUBLIC SERVICE ELECTRIC AND GAS COMPANY
CONSOLIDATED STATEMENTS OF OPERATIONS
Millions
|
| | | | | | | | | | | | | | |
| | | | | | | | | |
| | | | Years Ended December 31, | |
| | | | 2016 | | 2015 | | 2014 | |
| | OPERATING REVENUES | | $ | 6,221 |
| | $ | 6,636 |
| | $ | 6,766 |
| |
| | OPERATING EXPENSES | | | | | | | |
| | Energy Costs | | 2,567 |
| | 2,722 |
| | 2,909 |
| |
| | Operation and Maintenance | | 1,475 |
| | 1,560 |
| | 1,558 |
| |
| | Depreciation and Amortization | | 565 |
| | 892 |
| | 906 |
| |
| | Total Operating Expenses | | 4,607 |
| | 5,174 |
| | 5,373 |
| |
| | OPERATING INCOME | | 1,614 |
| | 1,462 |
| | 1,393 |
| |
| | Other Income | | 83 |
| | 79 |
| | 61 |
| |
| | Other Deductions | | (4 | ) | | (4 | ) | | (3 | ) | |
| | Interest Expense | | (289 | ) | | (280 | ) | | (277 | ) | |
| | INCOME BEFORE INCOME TAXES | | 1,404 |
| | 1,257 |
| | 1,174 |
| |
| | Income Tax Expense | | (515 | ) | | (470 | ) | | (449 | ) | |
| | NET INCOME | | $ | 889 |
| | $ | 787 |
| | $ | 725 |
| |
| | | | | | | | | |
|
| | | | | | | | | | | | | | |
| | | | | | | | | |
| | | | Years Ended December 31, | |
| | | | 2018 | | 2017 | | 2016 | |
| | OPERATING REVENUES | | $ | 6,471 |
| | $ | 6,324 |
| | $ | 6,303 |
| |
| | OPERATING EXPENSES | | | | | | | |
| | Energy Costs | | 2,520 |
| | 2,421 |
| | 2,644 |
| |
| | Operation and Maintenance | | 1,575 |
| | 1,458 |
| | 1,465 |
| |
| | Depreciation and Amortization | | 770 |
| | 685 |
| | 565 |
| |
| | Total Operating Expenses | | 4,865 |
| | 4,564 |
| | 4,674 |
| |
| | OPERATING INCOME | | 1,606 |
| | 1,760 |
| | 1,629 |
| |
| | Net Gains (Losses) on Trust Investments | | (1 | ) | | 2 |
| | — |
| |
| | Other Income (Deductions) | | 80 |
| | 85 |
| | 79 |
| |
| | Non-Operating Pension and OPEB Credits (Costs) | | 59 |
| | (8 | ) | | (15 | ) | |
| | Interest Expense | | (333 | ) | | (303 | ) | | (289 | ) | |
| | INCOME BEFORE INCOME TAXES | | 1,411 |
| | 1,536 |
| | 1,404 |
| |
| | Income Tax Expense | | (344 | ) | | (563 | ) | | (515 | ) | |
| | NET INCOME | | $ | 1,067 |
| | $ | 973 |
| | $ | 889 |
| |
| | | | | | | | | |
See disclosures regarding Public Service Electric and Gas Company included in the Notes to Consolidated Financial Statements.
PUBLIC SERVICE ELECTRIC AND GAS COMPANY
CONSOLIDATED STATEMENTS OF COMPREHENSIVE INCOME
Millions
|
| | | | | | | | | | | | | | |
| | | | | | | | | |
| | | Years Ended December 31, | |
| | | | 2016 | | 2015 | | 2014 | |
| | NET INCOME | | $ | 889 |
| | $ | 787 |
| | $ | 725 |
| |
| | Other Comprehensive Income (Loss), net of tax | | | | | | | |
| | Unrealized Gains (Losses) on Available-for-Sale Securities, net of tax (expense) benefit of $0, $0 and $0 for the years ended 2016, 2015 and 2014, respectively | | — |
| | (1 | ) | | 1 |
| |
| | COMPREHENSIVE INCOME | | $ | 889 |
| | $ | 786 |
| | $ | 726 |
| |
| | | | | | | | | |
|
| | | | | | | | | | | | | | |
| | | | | | | | | |
| | | Years Ended December 31, | |
| | | | 2018 | | 2017 | | 2016 | |
| | NET INCOME | | $ | 1,067 |
| | $ | 973 |
| | $ | 889 |
| |
| | Other Comprehensive Income (Loss), net of tax | | | | | | | |
| | Unrealized Gains (Losses) on Available-for-Sale Securities, net of tax (expense) benefit of $1, $0 and $0 for the years ended 2018, 2017 and 2016, respectively | | (1 | ) | | (1 | ) | | — |
| |
| | COMPREHENSIVE INCOME | | $ | 1,066 |
| | $ | 972 |
| | $ | 889 |
| |
| | | | | | | | | |
See disclosures regarding Public Service Electric and Gas Company included in the Notes to Consolidated Financial Statements.
PUBLIC SERVICE ELECTRIC AND GAS COMPANY
CONSOLIDATED BALANCE SHEETS
Millions
|
| | | | | | | | | |
| | | | | | |
| | | December 31, | |
| | | 2016 | | 2015 | |
| | ASSETS | |
| | CURRENT ASSETS | | | | |
| | Cash and Cash Equivalents | $ | 390 |
| | $ | 198 |
| |
| | Accounts Receivable, net of allowances of $68 in 2016 and $67 in 2015 | 810 |
| | 787 |
| |
| | Accounts Receivable-Affiliated Companies | 76 |
| | 222 |
| |
| | Unbilled Revenues | 260 |
| | 197 |
| |
| | Materials and Supplies | 180 |
| | 148 |
| |
| | Prepayments | 9 |
| | 31 |
| |
| | Regulatory Assets | 199 |
| | 164 |
| |
| | Derivative Contracts | — |
| | 13 |
| |
| | Other | 6 |
| | 9 |
| |
| | Total Current Assets | 1,930 |
| | 1,769 |
| |
| | PROPERTY, PLANT AND EQUIPMENT | 26,347 |
| | 23,732 |
| |
| | Less: Accumulated Depreciation and Amortization | (5,760 | ) | | (5,504 | ) | |
| | Net Property, Plant and Equipment | 20,587 |
| | 18,228 |
| |
| | NONCURRENT ASSETS | | | | |
| | Regulatory Assets | 3,319 |
| | 3,196 |
| |
| | Long-Term Investments | 299 |
| | 330 |
| |
| | Other Special Funds | 43 |
| | 49 |
| |
| | Other | 110 |
| | 105 |
| |
| | Total Noncurrent Assets | 3,771 |
| | 3,680 |
| |
| | TOTAL ASSETS | $ | 26,288 |
| | $ | 23,677 |
| |
| | | | | | |
|
| | | | | | | | | |
| | | | | | |
| | | December 31, | |
| | | 2018 | | 2017 | |
| | ASSETS | |
| | CURRENT ASSETS | | | | |
| | Cash and Cash Equivalents | $ | 39 |
| | $ | 242 |
| |
| | Accounts Receivable, net of allowances of $63 in 2018 and $59 in 2017 | 879 |
| | 882 |
| |
| | Tax Receivable | 20 |
| | — |
| |
| | Accounts Receivable—Affiliated Companies | 123 |
| | — |
| |
| | Unbilled Revenues | 240 |
| | 296 |
| |
| | Materials and Supplies | 196 |
| | 197 |
| |
| | Prepayments | 10 |
| | 44 |
| |
| | Regulatory Assets | 389 |
| | 211 |
| |
| | Other | 11 |
| | 4 |
| |
| | Total Current Assets | 1,907 |
| | 1,876 |
| |
| | PROPERTY, PLANT AND EQUIPMENT | 31,633 |
| | 29,117 |
| |
| | Less: Accumulated Depreciation and Amortization | (6,277 | ) | | (6,101 | ) | |
| | Net Property, Plant and Equipment | 25,356 |
| | 23,016 |
| |
| | NONCURRENT ASSETS | | | | |
| | Regulatory Assets | 3,399 |
| | 3,222 |
| |
| | Long-Term Investments | 270 |
| | 280 |
| |
| | Rabbi Trust Fund | 45 |
| | 46 |
| |
| | Other | 132 |
| | 114 |
| |
| | Total Noncurrent Assets | 3,846 |
| | 3,662 |
| |
| | TOTAL ASSETS | $ | 31,109 |
| | $ | 28,554 |
| |
| | | | | | |
See disclosures regarding Public Service Electric and Gas Company included in the Notes to Consolidated Financial Statements.
PUBLIC SERVICE ELECTRIC AND GAS COMPANY
CONSOLIDATED BALANCE SHEETS
Millions
|
| | | | | | | | | |
| | | | | | |
| | | December 31, | |
| | | 2016 | | 2015 | |
| | LIABILITIES AND CAPITALIZATION | |
| | CURRENT LIABILITIES | | | | |
| | Long-Term Debt Due Within One Year | $ | — |
| | $ | 171 |
| |
| | Commercial Paper and Loans | — |
| | 153 |
| |
| | Accounts Payable | 718 |
| | 724 |
| |
| | Accounts Payable—Affiliated Companies | 260 |
| | 292 |
| |
| | Accrued Interest | 76 |
| | 70 |
| |
| | Clean Energy Program | 142 |
| | 142 |
| |
| | Derivative Contracts | 5 |
| | — |
| |
| | Obligation to Return Cash Collateral | 132 |
| | 128 |
| |
| | Regulatory Liabilities | 88 |
| | 123 |
| |
| | Regulatory Liabilities of VIEs | — |
| | 42 |
| |
| | Other | 296 |
| | 297 |
| |
| | Total Current Liabilities | 1,717 |
| | 2,142 |
| |
| | NONCURRENT LIABILITIES | | | | |
| | Deferred Income Taxes and ITC | 5,873 |
| | 5,181 |
| |
| | OPEB Costs | 1,009 |
| | 937 |
| |
| | Accrued Pension Costs | 250 |
| | 202 |
| |
| | Regulatory Liabilities | 118 |
| | 175 |
| |
| | Environmental Costs | 332 |
| | 365 |
| |
| | Asset Retirement Obligations | 213 |
| | 218 |
| |
| | Derivative Contracts | — |
| | 11 |
| |
| | Long-Term Accrued Taxes | 130 |
| | 109 |
| |
| | Other | 116 |
| | 114 |
| |
| | Total Noncurrent Liabilities | 8,041 |
| | 7,312 |
| |
| | COMMITMENTS AND CONTINGENT LIABILITIES (See Note 13) |
| |
| |
| | CAPITALIZATION |
| | | |
| | LONG-TERM DEBT | 7,818 |
| | 6,650 |
| |
| | STOCKHOLDER’S EQUITY | | | | |
| | Common Stock; 150 shares authorized; issued and outstanding, 2016 and 2015—132 shares | 892 |
| | 892 |
| |
| | Contributed Capital | 945 |
| | 695 |
| |
| | Basis Adjustment | 986 |
| | 986 |
| |
| | Retained Earnings | 5,888 |
| | 4,999 |
| |
| | Accumulated Other Comprehensive Income | 1 |
| | 1 |
| |
| | Total Stockholder’s Equity | 8,712 |
| | 7,573 |
| |
| | Total Capitalization | 16,530 |
| | 14,223 |
| |
| | TOTAL LIABILITIES AND CAPITALIZATION | $ | 26,288 |
| | $ | 23,677 |
| |
| | | | | | |
|
| | | | | | | | | |
| | | | | | |
| | | December 31, | |
| | | 2018 | | 2017 | |
| | LIABILITIES AND CAPITALIZATION | |
| | CURRENT LIABILITIES | | | | |
| | Long-Term Debt Due Within One Year | $ | 500 |
| | $ | 750 |
| |
| | Commercial Paper and Loans | 272 |
| | — |
| |
| | Accounts Payable | 713 |
| | 728 |
| |
| | Accounts Payable—Affiliated Companies | 321 |
| | 340 |
| |
| | Accrued Interest | 84 |
| | 78 |
| |
| | Clean Energy Program | 143 |
| | 128 |
| |
| | Obligation to Return Cash Collateral | 136 |
| | 129 |
| |
| | Regulatory Liabilities | 311 |
| | 47 |
| |
| | Other | 345 |
| | 311 |
| |
| | Total Current Liabilities | 2,825 |
| | 2,511 |
| |
| | NONCURRENT LIABILITIES | | | | |
| | Deferred Income Taxes and ITC | 3,830 |
| | 3,391 |
| |
| | OPEB Costs | 486 |
| | 1,103 |
| |
| | Accrued Pension Costs | 400 |
| | 226 |
| |
| | Regulatory Liabilities | 3,221 |
| | 2,948 |
| |
| | Environmental Costs | 268 |
| | 283 |
| |
| | Asset Retirement Obligations | 302 |
| | 212 |
| |
| | Long-Term Accrued Taxes | 69 |
| | 91 |
| |
| | Other | 124 |
| | 114 |
| |
| | Total Noncurrent Liabilities | 8,700 |
| | 8,368 |
| |
| | COMMITMENTS AND CONTINGENT LIABILITIES (See Note 14) |
| |
| |
| | CAPITALIZATION |
| | | |
| | LONG-TERM DEBT | 8,684 |
| | 7,841 |
| |
| | STOCKHOLDER’S EQUITY | | | | |
| | Common Stock; 150 shares authorized; issued and outstanding, 2018 and 2017—132 shares | 892 |
| | 892 |
| |
| | Contributed Capital | 1,095 |
| | 1,095 |
| |
| | Basis Adjustment | 986 |
| | 986 |
| |
| | Retained Earnings | 7,928 |
| | 6,861 |
| |
| | Accumulated Other Comprehensive Loss | (1 | ) | | — |
| |
| | Total Stockholder’s Equity | 10,900 |
| | 9,834 |
| |
| | Total Capitalization | 19,584 |
| | 17,675 |
| |
| | TOTAL LIABILITIES AND CAPITALIZATION | $ | 31,109 |
| | $ | 28,554 |
| |
| | | | | | |
See disclosures regarding Public Service Electric and Gas Company included in the Notes to Consolidated Financial Statements.
PUBLIC SERVICE ELECTRIC AND GAS COMPANY
CONSOLIDATED STATEMENTS OF CASH FLOWS
|
| | | | | | | | | | | | | | |
| | | | | | | | | |
| | | | Years Ended December 31, | |
| | | | 2016 | | 2015 | | 2014 | |
| | CASH FLOWS FROM OPERATING ACTIVITIES | | | | | | | |
| | Net Income | | $ | 889 |
| | $ | 787 |
| | $ | 725 |
| |
| | Adjustments to Reconcile Net Income to Net Cash Flows from Operating Activities: | | | | | | | |
| | Depreciation and Amortization | | 565 |
| | 892 |
| | 906 |
| |
| | Provision for Deferred Income Taxes and ITC | | 658 |
| | 386 |
| | 310 |
| |
| | Non-Cash Employee Benefit Plan Costs | | 72 |
| | 95 |
| | 27 |
| |
| | Cost of Removal | | (131 | ) | | (120 | ) | | (98 | ) | |
| | Net Change in Other Regulatory Assets and Liabilities | | (138 | ) | | (48 | ) | | 187 |
| |
| | Net Change in Certain Current Assets and Liabilities: | | | | | | | |
| | Accounts Receivable and Unbilled Revenues | | (84 | ) | | 165 |
| | 63 |
| |
| | Materials and Supplies | | (7 | ) | | (15 | ) | | (18 | ) | |
| | Prepayments | | 22 |
| | 11 |
| | (18 | ) | |
| | Accounts Payable | | (29 | ) | | 45 |
| | (3 | ) | |
| | Accounts Receivable/Payable-Affiliated Companies, net | | 199 |
| | — |
| | (167 | ) | |
| | Other Current Assets and Liabilities | | 8 |
| | (29 | ) | | 6 |
| |
| | Employee Benefit Plan Funding and Related Payments | | (82 | ) | | (91 | ) | | (83 | ) | |
| | Other | | (48 | ) | | 47 |
| | (4 | ) | |
| | Net Cash Provided By (Used In) Operating Activities | | 1,894 |
| | 2,125 |
| | 1,833 |
| |
| | CASH FLOWS FROM INVESTING ACTIVITIES | | | | | | | |
| | Additions to Property, Plant and Equipment | | (2,816 | ) | | (2,692 | ) | | (2,164 | ) | |
| | Proceeds from Sales of Available-for-Sale Securities | | 22 |
| | 21 |
| | 103 |
| |
| | Investments in Available-for-Sale Securities | | (24 | ) | | (22 | ) | | (101 | ) | |
| | Solar Loan Investments | | 14 |
| | 11 |
| | 7 |
| |
| | Other | | 15 |
| | 11 |
| | — |
| |
| | Net Cash Provided By (Used In) Investing Activities | | (2,789 | ) | | (2,671 | ) | | (2,155 | ) | |
| | CASH FLOWS FROM FINANCING ACTIVITIES | | | | | | | |
| | Net Change in Short-Term Debt | | (153 | ) | | 153 |
| | (60 | ) | |
| | Issuance of Long-Term Debt | | 1,275 |
| | 850 |
| | 1,250 |
| |
| | Redemption of Long-Term Debt | | (271 | ) | | (300 | ) | | (500 | ) | |
| | Redemption of Securitization Debt | | — |
| | (259 | ) | | (237 | ) | |
| | Contributed Capital | | 250 |
| | — |
| | 175 |
| |
| | Other | | (14 | ) | | (10 | ) | | (14 | ) | |
| | Net Cash Provided By (Used In) Financing Activities | | 1,087 |
| | 434 |
| | 614 |
| |
| | Net Increase (Decrease) in Cash and Cash Equivalents | | 192 |
| | (112 | ) | | 292 |
| |
| | Cash and Cash Equivalents at Beginning of Period | | 198 |
| | 310 |
| | 18 |
| |
| | Cash and Cash Equivalents at End of Period | | $ | 390 |
| | $ | 198 |
| | $ | 310 |
| |
| | Supplemental Disclosure of Cash Flow Information: | | | | | | | |
| | Income Taxes Paid (Received) | | $ | (295 | ) | | $ | (28 | ) | | $ | 283 |
| |
| | Interest Paid, Net of Amounts Capitalized | | $ | 273 |
| | $ | 261 |
| | $ | 259 |
| |
| | Accrued Property, Plant and Equipment Expenditures | | $ | 420 |
| | $ | 396 |
| | $ | 292 |
| |
| | | | | | | | | |
|
| | | | | | | | | | | | | | |
| | | | | | | | | |
| | | | Years Ended December 31, | |
| | | | 2018 | | 2017 | | 2016 | |
| | CASH FLOWS FROM OPERATING ACTIVITIES | | | | | | | |
| | Net Income | | $ | 1,067 |
| | $ | 973 |
| | $ | 889 |
| |
| | Adjustments to Reconcile Net Income to Net Cash Flows from Operating Activities: | | | | | | | |
| | Depreciation and Amortization | | 770 |
| | 685 |
| | 565 |
| |
| | Provision for Deferred Income Taxes and ITC | | 405 |
| | 616 |
| | 658 |
| |
| | Non-Cash Employee Benefit Plan Costs | | 37 |
| | 50 |
| | 72 |
| |
| | Cost of Removal | | (160 | ) | | (107 | ) | | (131 | ) | |
| | Net Change in Other Regulatory Assets and Liabilities | | (153 | ) | | (188 | ) | | (138 | ) | |
| | Net Change in Certain Current Assets and Liabilities | | | | | | | |
| | Accounts Receivable and Unbilled Revenues | | 65 |
| | (106 | ) | | (84 | ) | |
| | Materials and Supplies | | 1 |
| | (13 | ) | | (7 | ) | |
| | Prepayments | | 14 |
| | (35 | ) | | 22 |
| |
| | Accounts Payable | | 64 |
| | 1 |
| | (29 | ) | |
| | Accounts Receivable/Payable—Affiliated Companies, net | | (139 | ) | | 101 |
| | 199 |
| |
| | Other Current Assets and Liabilities | | 5 |
| | 15 |
| | 9 |
| |
| | Employee Benefit Plan Funding and Related Payments | | (85 | ) | | (68 | ) | | (82 | ) | |
| | Other | | (38 | ) | | (86 | ) | | (47 | ) | |
| | Net Cash Provided By (Used In) Operating Activities | | 1,853 |
| | 1,838 |
| | 1,896 |
| |
| | CASH FLOWS FROM INVESTING ACTIVITIES | | | | | | | |
| | Additions to Property, Plant and Equipment | | (2,896 | ) | | (2,919 | ) | | (2,816 | ) | |
| | Proceeds from Sales of Trust Investments | | 20 |
| | 36 |
| | 22 |
| |
| | Purchases of Trust Investments | | (22 | ) | | (37 | ) | | (24 | ) | |
| | Solar Loan Investments | | (5 | ) | | 7 |
| | 14 |
| |
| | Other | | 9 |
| | 10 |
| | 15 |
| |
| | Net Cash Provided By (Used In) Investing Activities | | (2,894 | ) | | (2,903 | ) | | (2,789 | ) | |
| | CASH FLOWS FROM FINANCING ACTIVITIES | | | | | | | |
| | Net Change in Short-Term Debt | | 272 |
| | — |
| | (153 | ) | |
| | Issuance of Long-Term Debt | | 1,350 |
| | 775 |
| | 1,275 |
| |
| | Redemption of Long-Term Debt | | (750 | ) | | — |
| | (271 | ) | |
| | Contributed Capital | | — |
| | 150 |
| | 250 |
| |
| | Other | | (14 | ) | | (9 | ) | | (14 | ) | |
| | Net Cash Provided By (Used In) Financing Activities | | 858 |
| | 916 |
| | 1,087 |
| |
| | Net Increase (Decrease) in Cash, Cash Equivalents and Restricted Cash | | (183 | ) | | (149 | ) | | 194 |
| |
| | Cash, Cash Equivalents and Restricted Cash at Beginning of Period | | 244 |
| | 393 |
| | 199 |
| |
| | Cash, Cash Equivalents and Restricted Cash at End of Period | | $ | 61 |
| | $ | 244 |
| | $ | 393 |
| |
| | Supplemental Disclosure of Cash Flow Information: | | | | | | | |
| | Income Taxes Paid (Received) | | $ | 94 |
| | $ | (104 | ) | | $ | (295 | ) | |
| | Interest Paid, Net of Amounts Capitalized | | $ | 318 |
| | $ | 294 |
| | $ | 273 |
| |
| | Accrued Property, Plant and Equipment Expenditures | | $ | 350 |
| | $ | 429 |
| | $ | 420 |
| |
| | | | | | | | | |
See disclosures regarding Public Service Electric and Gas Company included in the Notes to Consolidated Financial Statements.
PUBLIC SERVICE ELECTRIC AND GAS COMPANY
CONSOLIDATED STATEMENTS OF COMMON STOCKHOLDER’S EQUITY
Millions
|
| | | | | | | | | | | | | | | | | | | | | | | | | | |
| | | | | | | | | | | | | | | |
| | | | Common Stock | | Contributed Capital | | Basis Adjustment | | Retained Earnings | | Accumulated Other Comprehensive Income (Loss) | | Total | |
| | Balance as of January 1, 2014 | | $ | 892 |
| | $ | 520 |
| | $ | 986 |
| | $ | 3,487 |
| | $ | 1 |
| | $ | 5,886 |
| |
| | Net Income | | — |
| | — |
| | — |
| | 725 |
| | — |
| | 725 |
| |
| | Other Comprehensive Income, net of tax (expense) benefit of $0 | | — |
| | — |
| | — |
| | — |
| | 1 |
| | 1 |
| |
| | Comprehensive Income | | | | | | | | | | |
| 726 |
| |
| | Contributed Capital | | | | 175 |
| | — |
| | — |
| | — |
| | 175 |
| |
| | Balance as of December 31, 2014 | | $ | 892 |
| | $ | 695 |
| | $ | 986 |
| | $ | 4,212 |
| | $ | 2 |
| | $ | 6,787 |
| |
| | Net Income | | — |
| | — |
| | — |
| | 787 |
| | — |
| | 787 |
| |
| | Other Comprehensive Income, net of tax (expense) benefit of $0 | | — |
| | — |
| | — |
| | — |
| | (1 | ) | | (1 | ) | |
| | Comprehensive Income | | | | | | | | | | |
| 786 |
| |
| | Balance as of December 31, 2015 | | $ | 892 |
| | $ | 695 |
| | $ | 986 |
| | $ | 4,999 |
| | $ | 1 |
| | $ | 7,573 |
| |
| | Net Income | | — |
| | — |
| | — |
| | 889 |
| | — |
| | 889 |
| |
| | Other Comprehensive Income, net of tax (expense) benefit of $0 | | — |
| | — |
| | — |
| | — |
| | — |
| | — |
| |
| | Comprehensive Income | | | | | | | | | | |
| 889 |
| |
| | Contributed Capital | | — |
| | 250 |
| | — |
| | — |
| | — |
| | 250 |
| |
| | Balance as of December 31, 2016 | | $ | 892 |
| | $ | 945 |
| | $ | 986 |
| | $ | 5,888 |
| | $ | 1 |
| | $ | 8,712 |
| |
| | | | | | | | | | | | | | | |
|
| | | | | | | | | | | | | | | | | | | | | | | | | | |
| | | | | | | | | | | | | | | |
| | | | Common Stock | | Contributed Capital | | Basis Adjustment | | Retained Earnings | | Accumulated Other Comprehensive Income (Loss) | | Total | |
| | Balance as of January 1, 2016 | | $ | 892 |
| | $ | 695 |
| | $ | 986 |
| | $ | 4,999 |
| | $ | 1 |
| | $ | 7,573 |
| |
| | Net Income | | — |
| | — |
| | — |
| | 889 |
| | — |
| | 889 |
| |
| | Other Comprehensive Income, net of tax (expense) benefit of $0 | | — |
| | — |
| | — |
| | — |
| | — |
| | — |
| |
| | Comprehensive Income | | | | | | | | | | |
| 889 |
| |
| | Contributed Capital | | — |
| | 250 |
| | — |
| | — |
| | — |
| | 250 |
| |
| | Balance as of December 31, 2016 | | $ | 892 |
| | $ | 945 |
| | $ | 986 |
| | $ | 5,888 |
| | $ | 1 |
| | $ | 8,712 |
| |
| | Net Income | | — |
| | — |
| | — |
| | 973 |
| | — |
| | 973 |
| |
| | Other Comprehensive Income, net of tax (expense) benefit of $0 | | — |
| | — |
| | — |
| | — |
| | (1 | ) | | (1 | ) | |
| | Comprehensive Income | | | | | | | | | | |
| 972 |
| |
| | Contributed Capital | | — |
| | 150 |
| | — |
| | — |
| | — |
| | 150 |
| |
| | Balance as of December 31, 2017 | | $ | 892 |
| | $ | 1,095 |
| | $ | 986 |
| | $ | 6,861 |
| | $ | — |
| | $ | 9,834 |
| |
| | Net Income | | — |
| | — |
| | — |
| | 1,067 |
| | — |
| | 1,067 |
| |
| | Other Comprehensive Income, net of tax (expense) benefit of $1 | | — |
| | — |
| | — |
| | — |
| | (1 | ) | | (1 | ) | |
| | Comprehensive Income | | | | | | | | | | |
| 1,066 |
| |
| | Balance as of December 31, 2018 | | $ | 892 |
| | $ | 1,095 |
| | $ | 986 |
| | $ | 7,928 |
| | $ | (1 | ) | | $ | 10,900 |
| |
| | | | | | | | | | | | | | | |
See disclosures regarding Public Service Electric and Gas Company included in the Notes to Consolidated Financial Statements.
PSEG POWER LLC
CONSOLIDATED STATEMENTS OF OPERATIONS
Millions
|
| | | | | | | | | | | | | | |
| | | | | | | | | |
| | | | Years Ended December 31, | |
| | | | 2016 | | 2015 | | 2014 | |
| | OPERATING REVENUES | | $ | 4,023 |
| | $ | 4,928 |
| | $ | 5,434 |
| |
| | OPERATING EXPENSES | | | | | | | |
| | Energy Costs | | 1,986 |
| | 2,150 |
| | 2,747 |
| |
| | Operation and Maintenance | | 1,143 |
| | 1,057 |
| | 1,186 |
| |
| | Depreciation and Amortization | | 881 |
| | 291 |
| | 292 |
| |
| | Total Operating Expenses | | 4,010 |
| | 3,498 |
| | 4,225 |
| |
| | OPERATING INCOME | | 13 |
| | 1,430 |
| | 1,209 |
| |
| | Income from Equity Method Investments | | 11 |
| | 14 |
| | 14 |
| |
| | Other Income | | 102 |
| | 169 |
| | 222 |
| |
| | Other Deductions | | (57 | ) | | (72 | ) | | (52 | ) | |
| | Other-Than-Temporary Impairments | | (28 | ) | | (53 | ) | | (20 | ) | |
| | Interest Expense | | (84 | ) | | (121 | ) | | (122 | ) | |
| | INCOME (LOSS) BEFORE INCOME TAXES | | (43 | ) | | 1,367 |
| | 1,251 |
| |
| | Income Tax Benefit (Expense) | | 61 |
| | (511 | ) | | (491 | ) | |
| | NET INCOME | | $ | 18 |
| | $ | 856 |
| | $ | 760 |
| |
| | | | | | | | | |
|
| | | | | | | | | | | | | | |
| | | | | | | | | |
| | | | Years Ended December 31, | |
| | | | 2018 | | 2017 | | 2016 | |
| | OPERATING REVENUES | | $ | 4,146 |
| | $ | 3,860 |
| | $ | 3,861 |
| |
| | OPERATING EXPENSES | | | | | | | |
| | Energy Costs | | 2,197 |
| | 1,913 |
| | 1,824 |
| |
| | Operation and Maintenance | | 999 |
| | 1,046 |
| | 1,139 |
| |
| | Depreciation and Amortization | | 354 |
| | 1,268 |
| | 881 |
| |
| | Total Operating Expenses | | 3,550 |
| | 4,227 |
| | 3,844 |
| |
| | OPERATING INCOME (LOSS) | | 596 |
| | (367 | ) | | 17 |
| |
| | Income from Equity Method Investments | | 15 |
| | 14 |
| | 11 |
| |
| | Net Gains (Losses) on Trust Investments | | (140 | ) | | 125 |
| | (6 | ) | |
| | Other Income (Deductions) | | 21 |
| | 20 |
| | 23 |
| |
| | Non-Operating Pension and OPEB (Costs) Credits | | 15 |
| | 8 |
| | (4 | ) | |
| | Interest Expense | | (76 | ) | | (50 | ) | | (84 | ) | |
| | INCOME (LOSS) BEFORE INCOME TAXES | | 431 |
| | (250 | ) | | (43 | ) | |
| | Income Tax Benefit (Expense) | | (66 | ) | | 729 |
| | 61 |
| |
| | NET INCOME | | $ | 365 |
| | $ | 479 |
| | $ | 18 |
| |
| | | | | | | | | |
See disclosures regarding PSEG Power LLC included in the Notes to Consolidated Financial Statements.
PSEG POWER LLC
CONSOLIDATED STATEMENTS OF COMPREHENSIVE INCOME
Millions
|
| | | | | | | | | | | | | | |
| | | | | | | | | |
| | | Years Ended December 31, | |
| | | | 2016 | | 2015 | | 2014 | |
| | NET INCOME | | $ | 18 |
| | $ | 856 |
| | $ | 760 |
| |
| | Other Comprehensive Income (Loss), net of tax | | | | | | | |
| | Unrealized Gains (Losses) on Available-for-Sale Securities, net of tax (expense) benefit of $(41), $32, and $28 for the years ended 2016, 2015 and 2014, respectively | | 42 |
| | (25 | ) | | (30 | ) | |
| | Unrealized Gains (Losses) on Cash Flow Hedges, net of tax (expense) benefit of $0, $7 and $(8) for the years ended 2016, 2015 and 2014, respectively | | — |
| | (11 | ) | | 12 |
| |
| | Pension/OPEB adjustment, net of tax (expense) benefit of $9, $(16), and $101 for the years ended 2016, 2015 and 2014, respectively | | (13 | ) | | 24 |
| | (147 | ) | |
| | Other Comprehensive Income (Loss), net of tax | | 29 |
| | (12 | ) | | (165 | ) | |
| | COMPREHENSIVE INCOME | | $ | 47 |
| | $ | 844 |
| | $ | 595 |
| |
| | | | | | | | | |
|
| | | | | | | | | | | | | | |
| | | | | | | | | |
| | | Years Ended December 31, | |
| | | | 2018 | | 2017 | | 2016 | |
| | NET INCOME | | $ | 365 |
| | $ | 479 |
| | $ | 18 |
| |
| | Other Comprehensive Income (Loss), net of tax | | | | | | | |
| | Unrealized Gains (Losses) on Available-for-Sale Securities, net of tax (expense) benefit of $9, $(39) and $(41) for the years ended 2018, 2017 and 2016, respectively | | (13 | ) | | 46 |
| | 42 |
| |
| | Pension/OPEB adjustment, net of tax (expense) benefit of $(16), $(3) and $9 for the years ended 2018, 2017 and 2016, respectively | | 41 |
| | (7 | ) | | (13 | ) | |
| | Other Comprehensive Income (Loss), net of tax | | 28 |
| | 39 |
| | 29 |
| |
| | COMPREHENSIVE INCOME | | $ | 393 |
| | $ | 518 |
| | $ | 47 |
| |
| | | | | | | | | |
See disclosures regarding PSEG Power LLC included in the Notes to Consolidated Financial Statements.
PSEG POWER LLC
CONSOLIDATED BALANCE SHEETS
Millions
|
| | | | | | | | | |
| | | | | | |
| | | December 31, | |
| | | 2016 | | 2015 | |
| | ASSETS | |
| | CURRENT ASSETS | | | | |
| | Cash and Cash Equivalents | $ | 11 |
| | $ | 12 |
| |
| | Accounts Receivable | 276 |
| | 217 |
| |
| | Accounts Receivable—Affiliated Companies | 205 |
| | 276 |
| |
| | Short-Term Loan to Affiliate | 87 |
| | 363 |
| |
| | Fuel | 326 |
| | 463 |
| |
| | Materials and Supplies, net | 381 |
| | 363 |
| |
| | Derivative Contracts | 162 |
| | 223 |
| |
| | Prepayments | 10 |
| | 25 |
| |
| | Other | 2 |
| | 7 |
| |
| | Total Current Assets | 1,460 |
| | 1,949 |
| |
| | PROPERTY, PLANT AND EQUIPMENT | 12,655 |
| | 11,354 |
| |
| | Less: Accumulated Depreciation and Amortization | (4,135 | ) | | (3,227 | ) | |
| | Net Property, Plant and Equipment | 8,520 |
| | 8,127 |
| |
| | NONCURRENT ASSETS | | | | |
| | NDT Fund | 1,859 |
| | 1,754 |
| |
| | Long-Term Investments | 102 |
| | 119 |
| |
| | Goodwill | 16 |
| | 16 |
| |
| | Other Intangibles | 98 |
| | 102 |
| |
| | Other Special Funds | 53 |
| | 55 |
| |
| | Derivative Contracts | 24 |
| | 77 |
| |
| | Other | 61 |
| | 51 |
| |
| | Total Noncurrent Assets | 2,213 |
| | 2,174 |
| |
| | TOTAL ASSETS | $ | 12,193 |
| | $ | 12,250 |
| |
| | | | | | |
|
| | | | | | | | | |
| | | | | | |
| | | December 31, | |
| | | 2018 | | 2017 | |
| | ASSETS | |
| | CURRENT ASSETS | | | | |
| | Cash and Cash Equivalents | $ | 22 |
| | $ | 32 |
| |
| | Accounts Receivable | 477 |
| | 380 |
| |
| | Accounts Receivable—Affiliated Companies | 274 |
| | 221 |
| |
| | Fuel | 331 |
| | 289 |
| |
| | Materials and Supplies, net | 373 |
| | 376 |
| |
| | Derivative Contracts | 11 |
| | 29 |
| |
| | Prepayments | 14 |
| | 11 |
| |
| | Other | 5 |
| | 3 |
| |
| | Total Current Assets | 1,507 |
| | 1,341 |
| |
| | PROPERTY, PLANT AND EQUIPMENT | 12,224 |
| | 11,755 |
| |
| | Less: Accumulated Depreciation and Amortization | (3,382 | ) | | (3,159 | ) | |
| | Net Property, Plant and Equipment | 8,842 |
| | 8,596 |
| |
| | NONCURRENT ASSETS | | | | |
| | NDT Fund | 1,878 |
| | 2,133 |
| |
| | Long-Term Investments | 86 |
| | 87 |
| |
| | Goodwill | 16 |
| | 16 |
| |
| | Other Intangibles | 143 |
| | 114 |
| |
| | Rabbi Trust Fund | 56 |
| | 57 |
| |
| | Derivative Contracts | 1 |
| | 7 |
| |
| | Other | 65 |
| | 67 |
| |
| | Total Noncurrent Assets | 2,245 |
| | 2,481 |
| |
| | TOTAL ASSETS | $ | 12,594 |
| | $ | 12,418 |
| |
| | | | | | |
See disclosures regarding PSEG Power LLC included in the Notes to Consolidated Financial Statements.
PSEG POWER LLC
CONSOLIDATED BALANCE SHEETS
Millions
|
| | | | | | | | | |
| | | | | | |
| | | December 31, | |
| | | 2016 | | 2015 | |
| | LIABILITIES AND MEMBER’S EQUITY | |
| | CURRENT LIABILITIES | | | | |
| | Long-Term Debt Due Within One Year | $ | — |
| | $ | 553 |
| |
| | Accounts Payable | 539 |
| | 432 |
| |
| | Accounts Payable—Affiliated Companies | 25 |
| | 33 |
| |
| | Derivative Contracts | 8 |
| | 76 |
| |
| | Accrued Interest | 20 |
| | 25 |
| |
| | Other | 88 |
| | 107 |
| |
| | Total Current Liabilities | 680 |
| | 1,226 |
| |
| | NONCURRENT LIABILITIES | | | | |
| | Deferred Income Taxes and ITC | 2,170 |
| | 2,347 |
| |
| | Asset Retirement Obligations | 511 |
| | 457 |
| |
| | OPEB Costs | 251 |
| | 230 |
| |
| | Derivative Contracts | 3 |
| | 16 |
| |
| | Accrued Pension Costs | 191 |
| | 166 |
| |
| | Long-Term Accrued Taxes | 77 |
| | 35 |
| |
| | Other | 129 |
| | 87 |
| |
| | Total Noncurrent Liabilities | 3,332 |
| | 3,338 |
| |
| | COMMITMENTS AND CONTINGENT LIABILITIES (See Note 13) |
| |
| |
| | LONG-TERM DEBT
| 2,382 |
| | 1,684 |
| |
| | MEMBER’S EQUITY | | | | |
| | Contributed Capital | 2,214 |
| | 2,214 |
| |
| | Basis Adjustment | (986 | ) | | (986 | ) | |
| | Retained Earnings | 4,782 |
| | 5,014 |
| |
| | Accumulated Other Comprehensive Loss | (211 | ) | | (240 | ) | |
| | Total Member’s Equity | 5,799 |
| | 6,002 |
| |
| | TOTAL LIABILITIES AND MEMBER’S EQUITY | $ | 12,193 |
| | $ | 12,250 |
| |
| | | | | | |
|
| | | | | | | | | |
| | | | | | |
| | | December 31, | |
| | | 2018 | | 2017 | |
| | LIABILITIES AND MEMBER’S EQUITY | |
| | CURRENT LIABILITIES | | | | |
| | Long-Term Debt Due Within One Year | $ | 44 |
| | $ | 250 |
| |
| | Accounts Payable | 498 |
| | 712 |
| |
| | Accounts Payable—Affiliated Companies | 16 |
| | 57 |
| |
| | Short-Term Loan from Affiliate | 193 |
| | 281 |
| |
| | Derivative Contracts | 11 |
| | 16 |
| |
| | Accrued Interest | 21 |
| | 20 |
| |
| | Other | 59 |
| | 99 |
| |
| | Total Current Liabilities | 842 |
| | 1,435 |
| |
| | NONCURRENT LIABILITIES | | | | |
| | Deferred Income Taxes and ITC | 1,619 |
| | 1,406 |
| |
| | Asset Retirement Obligations | 758 |
| | 810 |
| |
| | OPEB Costs | 176 |
| | 283 |
| |
| | Derivative Contracts | 4 |
| | 5 |
| |
| | Accrued Pension Costs | 246 |
| | 184 |
| |
| | Long-Term Accrued Taxes | 76 |
| | 52 |
| |
| | Other | 122 |
| | 140 |
| |
| | Total Noncurrent Liabilities | 3,001 |
| | 2,880 |
| |
| | COMMITMENTS AND CONTINGENT LIABILITIES (See Note 14) |
| |
| |
| | LONG-TERM DEBT
| 2,791 |
| | 2,136 |
| |
| | MEMBER’S EQUITY | | | | |
| | Contributed Capital | 2,214 |
| | 2,214 |
| |
| | Basis Adjustment | (986 | ) | | (986 | ) | |
| | Retained Earnings | 5,051 |
| | 4,911 |
| |
| | Accumulated Other Comprehensive Loss | (319 | ) | | (172 | ) | |
| | Total Member’s Equity | 5,960 |
| | 5,967 |
| |
| | TOTAL LIABILITIES AND MEMBER’S EQUITY | $ | 12,594 |
| | $ | 12,418 |
| |
| | | | | | |
See disclosures regarding PSEG Power LLC included in the Notes to Consolidated Financial Statements.
PSEG POWER LLC
CONSOLIDATED STATEMENTS OF CASH FLOWS
Millions
|
| | | | | | | | | | | | | | |
| | | | | | | | | |
| | | | Years Ended December 31, | |
| | | | 2016 | | 2015 | | 2014 | |
| | CASH FLOWS FROM OPERATING ACTIVITIES | | | | | | | |
| | Net Income | | $ | 18 |
| | $ | 856 |
| | $ | 760 |
| |
| | Adjustments to Reconcile Net Income to Net Cash Flows from Operating Activities: | | | | | | | |
| | Depreciation and Amortization | | 881 |
| | 291 |
| | 292 |
| |
| | Amortization of Nuclear Fuel | | 203 |
| | 213 |
| | 200 |
| |
| | Provision for Deferred Income Taxes and ITC | | (208 | ) | | 261 |
| | 221 |
| |
| | Interest Accretion on Asset Retirement Obligation | | 26 |
| | 26 |
| | 30 |
| |
| | Net Realized and Unrealized (Gains) Losses on Energy Contracts and Other Derivatives | | 183 |
| | (143 | ) | | (93 | ) | |
| | Renewable Energy Credit (REC) Compliance Accrual | | 109 |
| | 104 |
| | 69 |
| |
| | Impairment Costs for Early Plant Retirements | | 102 |
| | — |
| | — |
| |
| | Non-Cash Employee Benefit Plan Costs | | 39 |
| | 48 |
| | 13 |
| |
| | Net Realized (Gains) Losses and (Income) Expense from NDT Fund | | (26 | ) | | (38 | ) | | (166 | ) | |
| | Net Change in Certain Current Assets and Liabilities: | | | | | | | |
| | Fuel, Materials and Supplies | | 31 |
| | 62 |
| | 19 |
| |
| | Margin Deposit | | (76 | ) | | 122 |
| | (22 | ) | |
| | Accounts Receivable | | (71 | ) | | 63 |
| | (15 | ) | |
| | Accounts Payable | | (22 | ) | | (46 | ) | | (59 | ) | |
| | Accounts Receivable/Payable-Affiliated Companies, net | | 6 |
| | (84 | ) | | 220 |
| |
| | Other Current Assets and Liabilities | | 10 |
| | (36 | ) | | (6 | ) | |
| | Employee Benefit Plan Funding and Related Payments | | (13 | ) | | (11 | ) | | (7 | ) | |
| | Other | | 63 |
| | 18 |
| | (31 | ) | |
| | Net Cash Provided By (Used In) Operating Activities | | 1,255 |
| | 1,706 |
| | 1,425 |
| |
| | CASH FLOWS FROM INVESTING ACTIVITIES | | | | | | | |
| | Additions to Property, Plant and Equipment | | (1,343 | ) | | (1,117 | ) | | (626 | ) | |
| | Purchase of Emissions Allowances and RECs | | (99 | ) | | (106 | ) | | (101 | ) | |
| | Proceeds from Sales of Available-for-Sale Securities | | 739 |
| | 1,422 |
| | 1,557 |
| |
| | Investments in Available-for-Sale Securities | | (766 | ) | | (1,455 | ) | | (1,573 | ) | |
| | Short-Term Loan—Affiliated Company, net | | 276 |
| | 221 |
| | 206 |
| |
| | Other | | 46 |
| | 34 |
| | 13 |
| |
| | Net Cash Provided By (Used In) Investing Activities | | (1,147 | ) | | (1,001 | ) | | (524 | ) | |
| | CASH FLOWS FROM FINANCING ACTIVITIES | | | | | | | |
| | Issuance of Long-Term Debt | | 700 |
| | — |
| | — |
| |
| | Cash Dividend Paid | | (250 | ) | | (400 | ) | | (895 | ) | |
| | Redemption of Long-Term Debt | | (553 | ) | | (300 | ) | | — |
| |
| | Other | | (6 | ) | | (2 | ) | | (3 | ) | |
| | Net Cash Provided By (Used In) Financing Activities | | (109 | ) | | (702 | ) | | (898 | ) | |
| | Net Increase (Decrease) in Cash and Cash Equivalents | | (1 | ) | | 3 |
| | 3 |
| |
| | Cash and Cash Equivalents at Beginning of Period | | 12 |
| | 9 |
| | 6 |
| |
| | Cash and Cash Equivalents at End of Period | | $ | 11 |
| | $ | 12 |
| | $ | 9 |
| |
| | Supplemental Disclosure of Cash Flow Information: | | | | | | | |
| | Income Taxes Paid (Received) | | $ | 50 |
| | $ | 393 |
| | $ | 68 |
| |
| | Interest Paid, Net of Amounts Capitalized | | $ | 81 |
| | $ | 116 |
| | $ | 119 |
| |
| | Accrued Property, Plant and Equipment Expenditures | | $ | 244 |
| | $ | 114 |
| | $ | 91 |
| |
| | | | | | | | | |
|
| | | | | | | | | | | | | | |
| | | | | | | | | |
| | | | Years Ended December 31, | |
| | | | 2018 | | 2017 | | 2016 | |
| | CASH FLOWS FROM OPERATING ACTIVITIES | | | | | | | |
| | Net Income | | $ | 365 |
| | $ | 479 |
| | $ | 18 |
| |
| | Adjustments to Reconcile Net Income to Net Cash Flows from Operating Activities: | | | | | | | |
| | Depreciation and Amortization | | 354 |
| | 1,268 |
| | 881 |
| |
| | Amortization of Nuclear Fuel | | 187 |
| | 199 |
| | 203 |
| |
| | Provision for Deferred Income Taxes and ITC | | 206 |
| | (807 | ) | | (208 | ) | |
| | Interest Accretion on Asset Retirement Obligation | | 41 |
| | 30 |
| | 26 |
| |
| | Net Realized and Unrealized (Gains) Losses on Energy Contracts and Other Derivatives | | 116 |
| | 188 |
| | 183 |
| |
| | Emission Allowances and Renewable Energy Credit (REC) Compliance Accrual | | 97 |
| | 103 |
| | 109 |
| |
| | Impairment Costs for Early Plant Retirements | | — |
| | — |
| | 102 |
| |
| | Non-Cash Employee Benefit Plan Costs | | 23 |
| | 28 |
| | 39 |
| |
| | Gain on Sale of Hudson and Mercer Units | | (54 | ) | | — |
| | — |
| |
| | Net (Gains) Losses and (Income) Expense from NDT Fund | | 98 |
| | (156 | ) | | (26 | ) | |
| | Net Change in Certain Current Assets and Liabilities | | | | | | | |
| | Fuel, Materials and Supplies | | (39 | ) | | 42 |
| | 31 |
| |
| | Margin Deposit | | (247 | ) | | (90 | ) | | (76 | ) | |
| | Accounts Receivable | | 51 |
| | (45 | ) | | (71 | ) | |
| | Accounts Payable | | (13 | ) | | 39 |
| | (22 | ) | |
| | Accounts Receivable/Payable—Affiliated Companies, net | | (56 | ) | | (2 | ) | | 6 |
| |
| | Other Current Assets and Liabilities | | (40 | ) | | 10 |
| | 10 |
| |
| | Employee Benefit Plan Funding and Related Payments | | (9 | ) | | (7 | ) | | (13 | ) | |
| | Other | | 4 |
| | 47 |
| | 63 |
| |
| | Net Cash Provided By (Used In) Operating Activities | | 1,084 |
| | 1,326 |
| | 1,255 |
| |
| | CASH FLOWS FROM INVESTING ACTIVITIES | | | | | | | |
| | Additions to Property, Plant and Equipment | | (996 | ) | | (1,231 | ) | | (1,343 | ) | |
| | Purchase of Emissions Allowances and RECs | | (146 | ) | | (117 | ) | | (99 | ) | |
| | Proceeds from Sales of Trust Investments | | 1,423 |
| | 2,182 |
| | 739 |
| |
| | Purchases of Trust Investments | | (1,392 | ) | | (2,199 | ) | | (766 | ) | |
| | Short-Term Loan—Affiliated Company | | — |
| | 87 |
| | 276 |
| |
| | Other | | 60 |
| | 46 |
| | 46 |
| |
| | Net Cash Provided By (Used In) Investing Activities | | (1,051 | ) | | (1,232 | ) | | (1,147 | ) | |
| | CASH FLOWS FROM FINANCING ACTIVITIES | | | | | | | |
| | Issuance of Long-Term Debt | | 700 |
| | — |
| | 700 |
| |
| | Cash Dividend Paid | | (400 | ) | | (350 | ) | | (250 | ) | |
| | Redemption of Long-Term Debt | | (250 | ) | | — |
| | (553 | ) | |
| | Short-Term Loan—Affiliated Company | | (88 | ) | | 281 |
| | — |
| |
| | Other | | (5 | ) | | (4 | ) | | (6 | ) | |
| | Net Cash Provided By (Used In) Financing Activities | | (43 | ) | | (73 | ) | | (109 | ) | |
| | Net Increase (Decrease) in Cash, Cash Equivalents and Restricted Cash | | (10 | ) | | 21 |
| | (1 | ) | |
| | Cash, Cash Equivalents and Restricted Cash at Beginning of Period | | 32 |
| | 11 |
| | 12 |
| |
| | Cash, Cash Equivalents and Restricted Cash at End of Period | | $ | 22 |
| | $ | 32 |
| | $ | 11 |
| |
| | Supplemental Disclosure of Cash Flow Information: | | | | | | | |
| | Income Taxes Paid (Received) | | $ | (92 | ) | | $ | 77 |
| | $ | 50 |
| |
| | Interest Paid, Net of Amounts Capitalized | | $ | 73 |
| | $ | 48 |
| | $ | 81 |
| |
| | Accrued Property, Plant and Equipment Expenditures | | $ | 167 |
| | $ | 293 |
| | $ | 244 |
| |
| | | | | | | | | |
See disclosures regarding PSEG Power LLC included in the Notes to Consolidated Financial Statements.
PSEG POWER LLC
CONSOLIDATED STATEMENTS OF MEMBER’S EQUITY
Millions
|
| | | | | | | | | | | | | | | | | | | | | | |
| | | | | | | | | | | | | |
| | | | Contributed Capital | | Basis Adjustment | | Retained Earnings | | Accumulated Other Comprehensive Income (Loss) | | Total | |
| | Balance as of January 1, 2014 | | $ | 2,214 |
| | $ | (986 | ) | | $ | 4,693 |
| | $ | (63 | ) | | $ | 5,858 |
| |
| | Net Income | | — |
| | — |
| | 760 |
| | — |
| | 760 |
| |
| | Other Comprehensive Income (Loss), net of tax (expense) benefit of $121 | | — |
| | — |
| | — |
| | (165 | ) | | (165 | ) | |
| | Comprehensive Income | | | | | | | | | | 595 |
| |
| | Cash Dividends Paid | | — |
| | — |
| | (895 | ) | | | | (895 | ) | |
| | Balance as of December 31, 2014 | | $ | 2,214 |
| | $ | (986 | ) | | $ | 4,558 |
| | $ | (228 | ) | | $ | 5,558 |
| |
| | Net Income | | — |
| | — |
| | 856 |
| | — |
| | 856 |
| |
| | Other Comprehensive Income (Loss), net of tax (expense) benefit of $23 | | — |
| | — |
| | — |
| | (12 | ) | | (12 | ) | |
| | Comprehensive Income | | | | | | | | | | 844 |
| |
| | Cash Dividends Paid | | — |
| | — |
| | (400 | ) | | — |
| | (400 | ) | |
| | Balance as of December 31, 2015 | | $ | 2,214 |
| | $ | (986 | ) | | $ | 5,014 |
| | $ | (240 | ) | | $ | 6,002 |
| |
| | Net Income | | — |
| | — |
| | 18 |
| | — |
| | 18 |
| |
| | Other Comprehensive Income (Loss), net of tax (expense) benefit of $(32) | | — |
| | — |
| | — |
| | 29 |
| | 29 |
| |
| | Comprehensive Income | | | | | | | | | | 47 |
| |
| | Cash Dividends Paid | | — |
| | — |
| | (250 | ) | | — |
| | (250 | ) | |
| | Balance as of December 31, 2016 | | $ | 2,214 |
| | $ | (986 | ) | | $ | 4,782 |
| | $ | (211 | ) | | $ | 5,799 |
| |
| | | | | | | | | | | | | |
|
| | | | | | | | | | | | | | | | | | | | | | |
| | | | | | | | | | | | | |
| | | | Contributed Capital | | Basis Adjustment | | Retained Earnings | | Accumulated Other Comprehensive Income (Loss) | | Total | |
| | Balance as of January 1, 2016 | | $ | 2,214 |
| | $ | (986 | ) | | $ | 5,014 |
| | $ | (240 | ) | | $ | 6,002 |
| |
| | Net Income | | — |
| | — |
| | 18 |
| | — |
| | 18 |
| |
| | Other Comprehensive Income (Loss), net of tax (expense) benefit of $(32) | | — |
| | — |
| | — |
| | 29 |
| | 29 |
| |
| | Comprehensive Income | | | | | | | | | | 47 |
| |
| | Cash Dividends Paid | | — |
| | — |
| | (250 | ) | | — |
| | (250 | ) | |
| | Balance as of December 31, 2016 | | $ | 2,214 |
| | $ | (986 | ) | | $ | 4,782 |
| | $ | (211 | ) | | $ | 5,799 |
| |
| | Net Income | | — |
| | — |
| | 479 |
| | — |
| | 479 |
| |
| | Other Comprehensive Income (Loss), net of tax (expense) benefit of $(42) | | — |
| | — |
| | — |
| | 39 |
| | 39 |
| |
| | Comprehensive Income | | | | | | | | | | 518 |
| |
| | Cash Dividends Paid | | — |
| | — |
| | (350 | ) | | — |
| | (350 | ) | |
| | Balance as of December 31, 2017 | | $ | 2,214 |
| | $ | (986 | ) | | $ | 4,911 |
| | $ | (172 | ) | | $ | 5,967 |
| |
| | Net Income | | — |
| | — |
| | 365 |
| | — |
| | 365 |
| |
| | Cumulative Effect Adjustment to Reclassify Unrealized Net Gains on Equity Investments
| | — |
| | — |
| | 175 |
| | (175 | ) | | — |
| |
| | Other Comprehensive Income (Loss), net of tax (expense) benefit of $(7) | | — |
| | — |
| | — |
| | 28 |
| | 28 |
| |
| | Comprehensive Income | | | | | | | | | | 393 |
| |
| | Cash Dividends Paid | | — |
| | — |
| | (400 | ) | | — |
| | (400 | ) | |
| | Balance as of December 31, 2018 | | $ | 2,214 |
| | $ | (986 | ) | | $ | 5,051 |
| | $ | (319 | ) | | $ | 5,960 |
| |
| | | | | | | | | | | | | |
See disclosures regarding PSEG Power LLC included in the Notes to Consolidated Financial Statements.
NOTES TO CONSOLIDATED FINANCIAL STATEMENTS
Note 1. Organization, Basis of Presentation and Summary of Significant Accounting Policies
Public Service Enterprise Group Incorporated (PSEG) is a holding company with a diversified business mix within the energy industry. Its operations are primarily in the Northeastern and Mid-Atlantic United States and in other select markets. PSEG’s principal direct wholly owned subsidiaries are:
Public Service Electric and Gas Company (PSE&G)—which is a public utility engaged principally in the transmission of electricity and distribution of electricity and natural gas in certain areas of New Jersey. PSE&G is subject to regulation by the New Jersey Board of Public Utilities (BPU) and the Federal Energy Regulatory Commission (FERC). PSE&G also invests in regulated solar generation projects and has implemented energy efficiency and demand responserelated programs in New Jersey, which are regulated by the BPU.
PSEG Power LLC (Power)—which is a multi-regional energy supply company that integrates the operations of its merchant nuclear and fossil generating assets with its power marketing businesses and fuel supply functions through competitive energy sales in well-developed energy markets and fuel supply functions primarily in the Northeast and Mid-Atlantic United States through its principal direct wholly owned subsidiaries. In addition, Power owns and operates solar generation in various states. Power’s subsidiaries are subject to regulation by FERC, the Nuclear Regulatory Commission (NRC), the Environmental Protection Agency (EPA) and the states in which they operate.
PSEG’s other direct wholly owned subsidiaries include PSEG Energy Holdings L.L.C. (Energy Holdings), which primarily has investments in leveraged leases;are: PSEG Long Island LLC (PSEG LI), which operates the Long Island Power Authority’s (LIPA) electric transmission and distribution (T&D) system under an Operations Services Agreement (OSA); PSEG Energy Holdings L.L.C. (Energy Holdings), which primarily has investments in leveraged leases; and PSEG Services Corporation (Services), which provides certain management, administrative and general services to PSEG and its subsidiaries at cost.
Basis of Presentation
The respective financial statements included herein have been prepared pursuant to the rules and regulations of the Securities and Exchange Commission (SEC) applicable to Annual Reports on Form 10-K and in accordance with accounting guidance generally accepted in the United States (GAAP).
Significant Accounting Policies
Principles of Consolidation
Each company consolidates those entities in which it has a controlling interest or is the primary beneficiary. See Note 4.5. Variable Interest Entities.Entity. Entities over which the companies exhibit significant influence, but do not have a controlling interest and/or are not the primary beneficiary, are accounted for under the equity method of accounting. For investments in which significant influence does not exist and the investor is not the primary beneficiary, the cost method of accounting is applied. All significant intercompany accounts and transactions are eliminated in consolidation.
PSE&G and Power also have undivided interests in certain jointly-owned facilities, with each responsible for paying its respective ownership share of construction costs, fuel purchases and operating expenses. PSE&G and Power consolidate their portion of any revenues and expenses related to their respective jointly-owned facilities in the appropriate revenue and expense categories.
Accounting for the Effects of Regulation
In accordance with accounting guidance for rate-regulated entities, PSE&G’s financial statements reflect the economic effects of regulation. PSE&G defers the recognition of costs (a Regulatory Asset) or records the recognition of obligations (a Regulatory Liability) if it is probable that, through the rate-making process, there will be a corresponding increase or decrease in future rates. Accordingly, PSE&G has deferred certain costs and recoveries, which are being amortized over various future periods. To the extent that collection of any such costs or payment of liabilities becomes no longer probable as a result of changes in regulation and/or competitive position, the associated Regulatory Asset or Liability is charged or credited to income. Management believes that PSE&G’s transmission and distributionT&D businesses continue to meet the accounting requirements for rate-regulated entities. For additional information, see Note 6.7. Regulatory Assets and Liabilities.
Cash, Cash Equivalents and Restricted Cash
Cash equivalents consist of short-term, highly liquid investments with original maturities of three months or less. Restricted cash consists primarily of deposits received related to various construction projects at PSE&G.
NOTES TO CONSOLIDATED FINANCIAL STATEMENTS
The followingprovides a reconciliation of cash, cash equivalents and restricted cash reported within the Consolidated Balance Sheets that sum to the total of the same such amounts for the beginning (December 31, 2017) and ending periods shown in the Consolidated Statements of Cash Flows for the year ended December 31, 2018.
|
| | | | | | | | | | | | | | | | | |
| | | | | | | | | | |
| | | PSE&G | | Power | | Other (A) | | Consolidated | |
| | | Millions | |
| | As of December 31, 2017 | | | | | | | | |
| | Cash and Cash Equivalents | $ | 242 |
| | $ | 32 |
| | $ | 39 |
| | $ | 313 |
| |
| | Restricted Cash in Other Current Assets | — |
| | — |
| | — |
| | — |
| |
| | Restricted Cash in Other Noncurrent Assets | 2 |
| | — |
| | — |
| | 2 |
| |
| | Cash, Cash Equivalents and Restricted Cash | $ | 244 |
| | $ | 32 |
| | $ | 39 |
| | $ | 315 |
| |
| | As of December 31, 2018 | | | | | | | | |
| | Cash and Cash Equivalents | $ | 39 |
| | $ | 22 |
| | $ | 116 |
| | $ | 177 |
| |
| | Restricted Cash in Other Current Assets | 8 |
| | — |
| | — |
| | 8 |
| |
| | Restricted Cash in Other Noncurrent Assets | 14 |
| | — |
| | — |
| | 14 |
| |
| | Cash, Cash Equivalents and Restricted Cash | $ | 61 |
| | $ | 22 |
| | $ | 116 |
| | $ | 199 |
| |
| | | | | | | | | | |
| |
| (A) | Includes amounts applicable to PSEG (parent corporation), Energy Holdings and Services. |
Derivative Instruments
Each company uses derivative instruments to manage risk pursuant to its business plans and prudent practices.
Within PSEG and its affiliate companies, Power has the most exposure to commodity price risk. Power is exposed to commodity price risk primarily relating to changes in the market price of electricity, fossil fuels and other commodities. Fluctuations in market prices result from changes in supply and demand, fuel costs, market conditions, weather, state and federal regulatory policies, environmental policies, transmission availability and other factors. Power uses a variety of derivative and non-derivative instruments, such as financial options, futures, swaps, fuel purchases and forward purchases and sales of electricity, to manage the exposure to fluctuations in commodity prices and optimize the value of Power’s expected generation. Changes in the fair market value of the derivative contracts are recorded in earnings.
Determining whether a contract qualifies as a derivative requires that management exercise significant judgment, including assessing the contract’s market liquidity. PSEG has determined that contracts to purchase and sell certain products do not meet
NOTES TO CONSOLIDATED FINANCIAL STATEMENTS
the definition of a derivative under the current authoritative guidance since they do not provide for net settlement, or the markets are not sufficiently liquid to conclude that physical forward contracts are readily convertible to cash.
Under current authoritative guidance, all derivatives are recognized on the balance sheet at their fair value, except for derivatives that are designated as normal purchases and normal sales (NPNS). Further, derivatives that qualify for hedge accounting can be designated as fair value or cash flow hedges. For fair value hedges, changes in fair values for both the derivative and the underlying hedged exposure are recognized in earnings each period.
Certain offsetting derivative assets and liabilities are subject to a master netting or similar agreement. In general, the terms of the agreements provide that in the event of an early termination the counterparties have the right to offset amounts owed or owing under that and any other agreement with the same counterparty. Accordingly, these positions are offset on the Consolidated Balance Sheets of Power and PSEG.
For cash flow hedges, the portion of the derivative gain or loss that is effective in offsetting the change in the hedged cash flows of the underlying exposure is deferred in Accumulated Other Comprehensive Income (Loss) until earnings are affected by the variability of cash flows of the hedged transaction. Any hedge ineffectiveness is included in current period earnings.
For derivative contracts that do not qualify or are not designated as cash flow or fair value hedges or as NPNS, changes in fair value are recorded in current period earnings. PSEG does not currently elect fair value or cash flow hedge accounting on its commodity derivative positions.
Contracts that qualify for, and are designated, as NPNS are accounted for upon settlement. Contracts which qualify for NPNS are contracts for which physical delivery is probable, they will not be financially settled, and the quantities under contract are expected to be used or sold in the normal course of business over a reasonable period of time.
For additional information regarding derivative financial instruments, see Note 16.17. Financial Risk Management Activities.
Revenue Recognition
PSE&G’s regulated electric and gas revenues are recorded primarily based on services rendered to customers. PSE&G records unbilled revenues for the estimated amount customers will be billed for services rendered from the time meters were last read to the end of the respective accounting period. The unbilled revenue is estimated each month based on usage per day, the number
NOTES TO CONSOLIDATED FINANCIAL STATEMENTS
of unbilled days in the period, estimated seasonal loads based upon the time of year and the variance of actual degree-days and temperature-humidity-index hours of the unbilled period from expected norms.
Regulated revenues from the transmission of electricity are recognized as services are provided based on a FERC-approved annual formula rate mechanism. This mechanism provides for an annual filing of estimated revenue requirement with rates effective January 1 of each year. After completion of the annual period ending December 31, PSE&G files a true-up whereby it compares its actual revenue requirement to the original estimate to determine any over or under collection of revenue. PSE&G records the estimated financial statement impact of the difference between the actual and the filed revenue requirement as a refund or deferral for future recovery when such amounts are probable and can be reasonably estimated in accordance with accounting guidance for rate-regulated entities.
The majority of Power’s revenues relate to bilateral contracts, which are accounted for on the accrual basis as the energy is delivered. Power’s revenue also includes changes in the value of energy derivative contracts that are not designated as NPNS. See Note 16.17. Financial Risk Management Activities for further discussion.
PJM Interconnection, L.L.C. (PJM), the Independent System Operator-New England (ISO-NE) and the New York Independent System Operator (NYISO) facilitate the dispatch of energy and energy-related products. Power generally reports electricity sales and purchases conducted with those individual ISOs on a net hourly basis in either Revenues or Energy Costs in its Consolidated Statement of Operations, the classification of which depends on the net hourly activity. Capacity revenue and expense is also reported net based on Power’s monthly net sale or purchase position in the individual ISOs.
PSEG LI is the primary beneficiary of Long Island Electric Utility Servco, LLC (Servco). For transactions in which Servco acts as principal, Servco records revenues and the related pass-through expenditures separately in Operating Revenues and Operations and Maintenance (O&M) Expense, respectively. See Note 4.5. Variable Interest EntitiesEntity for further information.
The majority of Energy Holdings' revenues relate to its investments in leveraged leases. Income on leveraged leases is recognized by a method which produces a constant rate of return on the outstanding net investment in the lease, net of the related deferred tax liability, in the years in which the net investment is positive. Any gains or losses incurred as a result of a lease termination are recorded as revenues as these events occur in the ordinary course of business of managing the investment portfolio.
For additional information regarding Revenues, see Note 3. Revenues.
Depreciation and Amortization (D&A)
PSE&G calculates depreciation under the straight-line method based on estimated average remaining lives of the several classes of depreciable property. These estimates are reviewed on a periodic basis and necessary adjustments are made as approved by the BPU or FERC. The depreciation rate stated as a percentage of original cost of depreciable property was as follows:
|
| | | | | | | | | | | |
| | | | | | | | | |
| | | | 2016 | | 2015 | | 2014 | |
| | | | Avg Rate | | Avg Rate | | Avg Rate | |
| | PSE&G Depreciation Rate | | 2.45 | % | | 2.46 | % | | 2.47 | % | |
| | | | | | | | | |
NOTES TO CONSOLIDATED FINANCIAL STATEMENTS
|
| | | | | | | | | | | |
| | | | | | | | | |
| | | | 2018 | | 2017 | | 2016 | |
| | | | Avg Rate | | Avg Rate | | Avg Rate | |
| | Electric Transmission | | 2.42 | % | | 2.41 | % | | 2.39 | % | |
| | Electric Distribution | | 2.51 | % | | 2.51 | % | | 2.49 | % | |
| | Gas Distribution | | 1.61 | % | | 1.63 | % | | 1.63 | % | |
| | | | | | | | | |
Power calculates depreciation on generation-related assets under the straight-line method based on the assets’ estimated useful lives. The estimated useful lives are:
general plant assets—3 years to 20 years
fossil production assets—30 years to 7067 years
nuclear generation assets—approximately 60 years
pumped storage facilities—76 years
solar assets—25 years
Allowance for Funds Used During Construction (AFUDC) and Interest Capitalized During Construction (IDC)
AFUDC represents the cost of debt and equity funds used to finance the construction of new utility assets at PSE&G. IDC represents the cost of debt used to finance construction at Power. The amount of AFUDC or IDC capitalized as Property, Plant and Equipment is included as a reduction of interest charges or other income for the equity portion. The amounts and average rates used to calculate AFUDC or IDC for the years ended December 31, 20162018, 20152017 and 20142016 were as follows:
NOTES TO CONSOLIDATED FINANCIAL STATEMENTS
|
| | | | | | | | | | | | | | | | | | | | | | | |
| | | | | | | | | | | | | | | |
| | | | AFUDC/IDC Capitalized | |
| | | | 2016 | | 2015 | | 2014 | |
| | | | Millions | | Avg Rate | | Millions | | Avg Rate | | Millions | | Avg Rate | |
| | PSE&G | | $ | 66 |
| | 7.81 | % | | $ | 65 |
| | 8.01 | % | | $ | 44 |
| | 8.09 | % | |
| | Power | | $ | 54 |
| | 4.87 | % | | $ | 27 |
| | 5.14 | % | | $ | 24 |
| | 5.14 | % | |
| | | | | | | | | | | | | | | |
|
| | | | | | | | | | | | | | | | | | | | | | | |
| | | | | | | | | | | | | | | |
| | | | AFUDC/IDC Capitalized | |
| | | | 2018 | | 2017 | | 2016 | |
| | | | Millions | | Avg Rate | | Millions | | Avg Rate | | Millions | | Avg Rate | |
| | PSE&G | | $ | 70 |
| | 7.74 | % | | $ | 73 |
| | 7.42 | % | | $ | 66 |
| | 7.81 | % | |
| | Power | | $ | 67 |
| | 4.60 | % | | $ | 78 |
| | 4.60 | % | | $ | 54 |
| | 4.87 | % | |
| | | | | | | | | | | | | | | |
Income Taxes
PSEG and its subsidiaries file a consolidated federal income tax return and income taxes are allocated to PSEG’s subsidiaries based on the taxable income or loss of each subsidiary on a separate return basis in accordance with a tax sharing agreement between PSEG and each of its affiliated subsidiaries. Allocations between PSEG and its subsidiaries are recorded through intercompany accounts. Investment tax credits deferred in prior years are being amortized over the useful lives of the related property.
Uncertain income tax positions are accounted for using a benefit recognition model with a two-step approach, a more-likely-than-not recognition criterion and a measurement attribute that measures the position as the largest amount of tax benefit that is greater than 50% likely of being realized upon ultimate settlement. If it is not more-likely-than-not that the benefit will be sustained on its technical merits, no benefit will be recorded. Uncertain tax positions that relate only to timing of when an item is included on a tax return are considered to have met the recognition threshold. See Note 20.21. Income Taxes for further discussion.
Impairment of Long-Lived Assets and Leveraged Leases
Management evaluates long-lived assets for impairment whenever events or changes in circumstances, such as significant adverse changes in regulation, business climate, counterparty credit worthiness or market conditions, including prolonged periods of adverse commodity and capacity prices or a current expectation that a long-lived asset will be sold or disposed of significantly before the end of its previously estimated useful life, could potentially indicate an asset’s or asset group’s carrying amount may not be recoverable. In such an event, an undiscounted cash flow analysis is performed to determine if an impairment exists. When a long-lived asset’s or asset group’s carrying amount exceeds the associated undiscounted estimated future cash flows, the asset/asset group is considered impaired to the extent that its fair value is less than its carrying amount. An impairment would result in a reduction of the value of the long-lived asset/asset group through a non-cash charge to earnings. See Note 3.4. Early Plant Retirements for more information.
For Power, cash flows for long-lived assets and asset groups are determined at the lowest level for which identifiable cash flows are largely independent of the cash flows of other assets and liabilities. The cash flows from the generation units are generally evaluated at a regional portfolio level (PJM, NYISO, ISO-NE) along with cash flows generated from the customer supply and risk management activities, inclusive of cash flows from contracts, including those that are accounted for as derivatives and meet the NPNS scope exception. In certain cases, generation assets are evaluated on an individual basis where those assets are individually contracted on a long-term basis with a third party and operations are independent of other generation assets (typically Power’s solar plants and Kalaeloa).
CashEnergy Holdings’ leveraged leases are comprised of Lease Receivables (net of non-recourse debt), the estimated residual value of leased assets, and Cash Equivalents
Cash equivalents consistunearned and deferred income. Residual values are the estimated values of short-term, highly liquid investments withthe leased assets at the end of the respective lease per the original maturitieslease terms, net of three months or less.
NOTES TO CONSOLIDATED FINANCIAL STATEMENTS
the residual valuations, which are calculated by discounting the cash flows related to the leased assets after the lease term, is performed at least annually for each plant subject to lease using specific assumptions tailored to each plant. Those valuations are compared to the recorded residual values to determine if an impairment is warranted.
Accounts Receivable—Allowance for Doubtful Accounts
PSE&G’s accounts receivable are reported in the balance sheet as gross outstanding amounts adjusted for doubtful accounts. The allowance for doubtful accounts reflects PSE&G’s best estimates of losses on the accounts receivable balances. The allowance is based on accounts receivable aging, historical experience, write-off forecasts and other currently available evidence.
Accounts receivable are charged off in the period in which the receivable is deemed uncollectible. Recoveries of accounts receivable are recorded when it is known they will be received.
Materials and Supplies and Fuel
PSE&G’s and Power’s materials and supplies are carried at average cost and charged to inventory when purchased and expensed or capitalized to Property, Plant and Equipment, as appropriate, when installed or used. Fuel inventory at Power is valued at the lower of average cost or market and includes stored natural gas, coal, fuel oil and propane used to generate power
NOTES TO CONSOLIDATED FINANCIAL STATEMENTS
and to satisfy obligations under Power’s gas supply contracts with PSE&G. The costs of fuel, including initial transportation costs, are included in inventory when purchased and charged to Energy Costs when used or sold. The cost of nuclear fuel is capitalized within Property, Plant and Equipment and amortized to fuel expense using the units-of-production method.
Property, Plant and Equipment
PSE&G’s additions to and replacements of existing property, plant and equipment are capitalized at cost. The cost of maintenance, repair and replacement of minor items of property is charged to expense as incurred. At the time units of depreciable property are retired or otherwise disposed of, the original cost, adjusted for net salvage value, is charged to accumulated depreciation.
Power capitalizes costs, including those related to its jointly-owned facilities, which increase the capacity, improve or extend the life of an existing asset, represent a newly acquired or constructed asset or represent the replacement of a retired asset. The cost of maintenance, repair and replacement of minor items of property is charged to appropriate expense accounts as incurred. Environmental costs are capitalized if the costs mitigate or prevent future environmental contamination or if the costs improve existing assets’ environmental safety or efficiency. All other environmental expenditures are expensed as incurred. Power also capitalizes spare parts that meet specific criteria. Capitalized spares are depreciated over the remaining lives of their associated assets.
Available-for-Sale SecuritiesTrust Investments
These securities comprise the Nuclear Decommissioning Trust (NDT) Fund, a master independent external trust account maintained to provide for the costs of decommissioning upon termination of operations of Power’s nuclear facilities and amounts that are deposited to fund a Rabbi Trust which was established to meet the obligations related to non-qualified pension plans and deferred compensation plans.
Realized gains and losses on available-for-sale securities are recorded in earnings andEffective January 1, 2018, unrealized gains and losses on suchequity security investments are recorded in Net Income instead of Other Comprehensive Income (Loss). The debt securities arecontinue to be classified as available-for-sale with the unrealized gains and losses recorded as a component of Accumulated Other Comprehensive Income (Loss). Securities with unrealizedRealized gains and losses that are deemed to be other-than-temporarily impairedon both equity and available-for-sale debt security investments are recorded in earnings.earnings and are included with the unrealized gains and losses on equity securities in Net Gains (Losses) on Trust Investments. Other-than-temporary impairments on NDT and Rabbi Trust securities are also included in Net Gains (Losses) on Trust Investments. See Note 9. Available-for-Sale Securities10. Trust Investments for further discussion.
Pension and Other Postretirement Benefits (OPEB) Plans
The market-related value of plan assets held for the qualified pension and OPEB plans is equal to the fair value of those assets as of year-end. Fair value is determined using quoted market prices and independent pricing services based upon the security type as reported by the trustee at the measurement date (December 31) for all plan assets.
PSEG recognizes a long-term receivable primarily related to future funding by LIPA of Servco’s recognized pension and OPEB liabilities. This receivable is presented separately on the Consolidated Balance Sheet of PSEG as a noncurrent asset because it is restricted.asset.
Pursuant to the OSA, Servco records expense only to the extent of itsfor contributions to its pension plan trusts and for OPEB payments made to retirees.
See Note 12.13. Pension, and Other Postretirement Benefits (OPEB) and Savings PlansPlan for further discussion.
Basis Adjustment
PSE&G and Power have recorded a Basis Adjustment in their respective Consolidated Balance Sheets related to the generation assets that were transferred from PSE&G to Power in August 2000 at the price specified by the BPU. Because the transfer was between affiliates, the transaction was recorded at the net book value of the assets and liabilities rather than the transfer price. The difference between the total transfer price and the net book value of the generation-related assets and liabilities, $986 million, net of tax, was recorded as a Basis Adjustment on PSE&G’s and Power’s Consolidated Balance Sheets. The $986
NOTES TO CONSOLIDATED FINANCIAL STATEMENTS
million is an addition to PSE&G’s Common Stockholder’s Equity and a reduction of Power’s Member’s Equity. These amounts are eliminated on PSEG’s consolidated financial statements.
Use of Estimates
The processpreparation of preparing financial statements in conformity with GAAP requires the use ofmanagement to make estimates and assumptions regarding certain typesthat affect the reported amounts of assets and liabilities revenues and expenses. Such estimates primarily relate to unsettled transactionsdisclosure of contingent assets and events as ofliabilities at the date of the financial statements.statements and the reported amounts of revenues and expenses during the reporting period. Actual results could differ from those estimates.
NOTES TO CONSOLIDATED FINANCIAL STATEMENTS
Note 2. Recent Accounting Standards
New Standards Issued and Adopted in 2018
Stock Compensation-Improvements to Employee Share-Based Payment Revenue from Contracts With Customers—Accounting Standard Update (ASU) 2014-09, updated by ASUs 2015-14, 2016-08, 2016-10, 2016-12, 2016-20, 2017-13, 2017-14
This accounting standard, and related updates, were adopted on January 1, 2018 using the full retrospective transition method. There was issued to simplify aspectsno effect on Net Income as a result of the accounting for share-based payment transactions, including the income tax consequences, classification of awards as either equity or liabilities, and classification on the Statement of Cash Flows.
Underadoption. However, certain retrospective adjustments were recorded in accordance with the new guidance, all excess tax benefitsstandard. At PSE&G, retrospective adjustments increased Operating Revenues by $90 million and tax deficiencies related to employee share-based payments will be recognized in income tax expense rather than recognized in additional paid in capital. In$82 million, Energy Costs by $58 million and $77 million and O&M Expense by $32 million and $5 million for the Statement of Cash Flows, excess tax benefitsyears ended December 31, 2017 and deficiencies will be classified with other income tax cash flows as an operating activity rather than a financing activity as currently classified. In addition,2016, respectively. At Power, retrospective adjustments reduced Operating Revenues and Energy Costs by $70 million and $162 million for the minimum statutory tax withholdingyears ended December 31, 2017 and 2016, respectively. For disclosure requirements were simplified in order to facilitate equity classification of the award.
The standard is effective for annual and interim reporting periods beginning after December 15, 2017. Early adoption is permitted for an entity in any interim or annual period. An entity that elects early adoption must adopt all of the amendments in the same period; however, the amendments within this update require different adoption methods. PSEG adoptedunder this standard, in the fourth quarterincluding Nature of 2016. The impact to the financial statements was immaterial.
Disclosure for Investments in Certain Entities that Calculate Net Asset Value (NAV) per Share
This accounting standard eliminates the requirement to categorize, in the fair value hierarchy, investments whose fair values are measured at NAV using the practical expedient provided in the fair value guidance. The practical expedient applies to investments in mutual funds or structures similar to a mutual fund for which there is not a readily determinable fair value. Although not required in the fair value hierarchy, sufficient information must be provided to allow for reconciliation between the fair valueGoods and Services, Disaggregation of assets categorized in the hierarchyRevenues, and the balance sheet.
The standard is effective for annual and interim periods beginning after December 15, 2015 with early adoption permitted. PSEG adopted this standard in the fourth quarter 2016 on a retrospective basis and has reflected the effect of the new disclosure requirements inRemaining Performance Obligations under Fixed Consideration Contracts, see Note 12. Pension, Other Postretirement Benefits (OPEB) and Savings Plan.
Disclosure of Uncertainties about an Entity’s Ability to Continue as a Going Concern
This accounting standard requires management to assess an entity’s ability to continue as a going concern and provide related disclosures in certain circumstances. These disclosures are only required when conditions give rise to substantial doubt about an entity’s ability to continue as a going concern within one year from the financial statement issuance date. The standard is effective for annual and interim periods beginning after December 15, 2016. PSEG adopted this standard in the fourth quarter of 2016; however, no disclosures were required this period based on the above criteria.
New Standards Issued But Not Yet Adopted
Revenue from Contracts with Customers
This accounting standard clarifies the principles for recognizing revenue and removes inconsistencies in revenue recognition requirements; improves comparability of revenue recognition practices across entities, industries, jurisdictions and capital markets; and provides improved disclosures.
The guidance provides a five-step model to be used for recognizing revenue for the transfer of promised goods and services to customers in an amount that reflects the consideration to which the entity expects to be entitled in exchange for those goods and services.
The standard is effective for annual and interim reporting periods beginning after December 15, 2017. Early application is permitted. PSEG expects the new guidance to result in more detailed disclosures of revenue compared to current guidance, and possibly changes in presentation. PSEG continues to evaluate all of its revenue streams and its contracts. Certain implementation issues continue to be debated and are currently being addressed by the AICPA’s Revenue Recognition Working Group and the FASB’s Transition Resource Group, including the ability to recognize revenue for certain contracts where there
NOTES TO CONSOLIDATED FINANCIAL STATEMENTS
is uncertainty regarding collection from customers and accounting for contributions in aid of construction. As the ultimate impact of the new standard has not yet been determined, PSEG has not elected its transition method.3. Revenues.
Recognition and Measurement of Financial Assets and Financial LiabilitiesLiabilities—ASU 2016-01
Power maintains an external master trust fund to provide for the costs of decommissioning upon termination of operations of its nuclear facilities. In addition, PSEG maintains a grantor trust which was established to meet the obligations related to its non-qualified pension plans and deferred compensation plans, commonly referred to as a “Rabbi Trust.”
This accounting standard will change how entities measure equity investments that are not consolidated or accounted for under the equity method.was adopted on January 1, 2018. Under the new guidance, equity investments (other than those accounted for using the equity method) will bein Power’s NDT and PSEG’s Rabbi Trust Funds are measured at fair value with the unrealized gains and losses now recognized through Net Income instead of Other Comprehensive Income (Loss). Entities that have electedA cumulative effect adjustment was made to reclassify the fair value option for financial liabilities will present changes in fair value duenet unrealized gains related to a change in their own credit risk throughequity investments of $342 million ($176 million, net of tax) from Accumulated Other Comprehensive Income (Loss). For equity investments which do not have readily determinable fair values, the impairment assessment will be simplified by requiring a qualitative assessment to identify impairments. The new standard also changes certain disclosures.Retained Earnings on January 1, 2018. See Note 22. Accumulated Other Comprehensive Income (Loss), Net of Tax and Note 10. Trust Investments for further discussion.
The standard is effective for annualStatement of Cash Flows: Classification of Certain Cash Receipts and interim reporting periods beginning after December 15, 2017. PSEG is currently analyzing the impact of this standard on our financial statements; however, PSEG expects increased volatility in Net Income due to changes in fair value of our equity securities within the NDT and Rabbi Trust Funds.
LeasesCash Payments—ASU 2016-15
This accounting standard replacesreduces the diversity in practice in how certain cash receipts and cash payments are presented and classified in the Statement of Cash Flows.
PSEG adopted this standard on January 1, 2018 using a retrospective transition method and had no changes in its presentation of its Statement of Cash Flows for each period presented.
Statement of Cash Flows: Restricted Cash—ASU 2016-18
This accounting standard was adopted on January 1, 2018. PSEG will continue the current balance sheet classification of restricted cash or restricted cash equivalents. PSEG has provided a reconciliation of cash and cash equivalents and restricted cash or restricted cash equivalents and has included a description of these amounts in Note 1. Organization, Basis of Presentation and Significant Accounting Policies. The effect of adoption on the December 31, 2018 Consolidated Statements of Cash Flows was immaterial.
Improving the Presentation of Net Periodic Pension Cost and Net Periodic Postretirement Benefit Cost (OPEB)—ASU 2017-07
This accounting standard was adopted on January 1, 2018. Under the new guidance, entities are required to report the service cost component in the same line item or items as other compensation costs arising from services rendered by their employees during the period. The other components of net benefit cost are required to be presented in the Statement of Operations separately from the service cost component after Operating Income. Additionally, only the service cost component is eligible for capitalization, when applicable. As a result of adopting this standard, PSE&G reduced its charge to expense for the year ended December 31, 2018 by approximately $58 million. The Consolidated Statements of Operations were recast to show retrospective adjustments of the non-service cost components of net benefit credits (costs) of $(8) million and $(15) million at PSE&G and $8 million and $(4) million at Power, for the years ended December 31, 2017 and 2016, respectively, from O&M Expense to a new line item after Operating Income entitled Non-Operating Pension and OPEB Credits (Costs). See Note 13. Pension, Other Postretirement Benefits (OPEB) and Savings Plan.
Stock Compensation - Scope of Modification Accounting—ASU 2017-09
This accounting standard was adopted on January 1, 2018. The standard will be applied prospectively to awards modified on or after January 1, 2018. There was no material impact on PSEG’s consolidated financial statements in 2018 from adoption of this new standard.
NOTES TO CONSOLIDATED FINANCIAL STATEMENTS
New Standards Issued But Not Yet Adopted
Leases—ASU 2016-02, updated by ASUs 2018-01, 2018-10, 2018-11 and 2018-20
This accounting standard, and related updates, replace existing lease accounting guidance and requiresrequire lessees to recognize all leases with a term greater than 12 months on the balance sheet using a right-of-use asset approach. At lease commencement, a lessee will recognize a lease asset and corresponding lease obligation. A lessee will classify its leases as either finance leases or operating leases based on whether control of the underlying assets has transferred to the lessee. Aand a lessor will classify its leases as operating orleases, direct financing leases, or as sales-type leases based on whether control of the underlying assets has transferred to the lessee. Both the lessee and lessor models requireleases. The standard requires additional disclosure of key information. The standard requires lessees and lessors to apply a modified retrospective transition approach for leases existing at, or entered into after, the beginning of the earliest comparative period presented in the financial statements. However, existingExisting guidance related to leveraged leases willdoes not change. Effective January 1, 2019, PSEG elected the prospective transition approach for all existing leases. There was no cumulative effect adjustment required to be recorded to Retained Earnings at adoption.
PSEG elected various practical expedients allowed by the standard, including the package of three practical expedients related to not reassessing existing or expired contracts and initial direct costs; and excluding evaluation of land easements that exist or expired before adoption that were not previously accounted for as leases.
The impact of adoption on PSEG’s Consolidated Balance Sheet was to increase its assets and liabilities by approximately $280 million. PSE&G’s assets and liabilities each increased by approximately $100 million and Power’s assets and liabilities each increased by approximately $50 million. PSEG’s adoption of this standard did not have a material impact on the Consolidated Statements of Operations or Consolidated Statements of Cash Flows of PSEG, PSE&G and Power.
Derivatives and Hedging: Targeted Improvements to Accounting for Hedging Activities—ASU 2017-12, updated by ASU 2018-16
This accounting standard’s amendments more closely align hedge accounting with companies’ risk management activities in the financial statements and ease the operational burden of applying hedge accounting.
The new guidance is effective for annual and interim periods beginning after December 15, 2018 with2018. PSEG adopted this standard on January 1, 2019. The standard requires using a modified retrospective application to previously issued financial statements for 2018 and 2017. Early application is permitted.method upon adoption. PSEG is currently analyzinganalyzed the impact of this standard on its consolidated financial statements and has determined that the standard could enable PSEG to enter into certain transactions that can be deemed hedges that previously would not have qualified. Adoption of this standard is not expected to have a material impact on PSEG’s financial statements.
Premium Amortization on Purchased Callable Debt Securities—ASU 2017-08
This accounting standard was issued to shorten the amortization period for certain callable debt securities held at a premium. Specifically, the standard requires the premium to be amortized to the earliest call date.
The standard is effective for all entities for annual periods and interim periods within those annual periods beginning after December 15, 2018. PSEG adopted this standard on January 1, 2019 on a modified retrospective basis through a cumulative effect adjustment directly to Retained Earnings as of the beginning of 2019. Adoption of this standard did not have a material impact on PSEG’s financial statements.
Reclassification of Certain Tax Effects from Accumulated Other Comprehensive Income—ASU 2018-02
This accounting standard affects any entity that is required to apply the provisions of the Accounting Standards Codification (ASC) topic, “Income Statement-Reporting Comprehensive Income,” and has items of Other Comprehensive Income for which the related tax effects are presented in Other Comprehensive Income as required by GAAP. Specifically, this standard allows entities to record a reclassification from Accumulated Other Comprehensive Income to Retained Earnings for stranded tax effects resulting from the recent decrease in the federal corporate income tax rate.
The standard is effective for all entities for annual periods and interim periods within those annual periods beginning after December 15, 2018. PSEG adopted this standard on January 1, 2019.
The impact of adoption on PSEG’s Consolidated Balance Sheet was to increase Retained Earnings and Accumulated Other Comprehensive Loss by approximately $81 million. Power’s Retained Earnings and Accumulated Other Comprehensive Loss increased by approximately $69 million. The impact on PSE&G’s Consolidated Balance Sheet was immaterial. PSEG’s adoption of this standard did not have a material impact on the Consolidated Statements of Operations or Consolidated Statements of Cash Flows of PSEG, PSE&G and Power.
Measurement of Credit Losses on Financial Instruments—ASU 2016-13, updated by ASU 2018-19
This accounting standard provides a new model for recognizing credit losses on financial assets carried at amortized cost. The new model requires entities to use an estimate of expected credit losses that will be recognized as an impairment allowance rather than a direct write-down of the amortized cost basis. The estimate of expected credit losses is to be based on past events, current conditions and supportable forecasts over a reasonable period. For purchased financial assets with credit deterioration, a similar model is to be used; however, the initial allowance will be added to the purchase price rather than reported as an allowance. Credit losses on available-for-sale securities should be measured in a manner similar to current GAAP; however,
NOTES TO CONSOLIDATED FINANCIAL STATEMENTS
this standard requires those credit losses to be presented as an allowance, rather than a write-down. This new standard also requires additional disclosures of credit quality indicators for each class of financial asset disaggregated by year of origination.
The standard is effective for annual and interim periods beginning after December 15, 2019; however, entities may adopt early beginning in the annual or interim periods after December 15, 2018. PSEG is currently analyzing the impact of this standard on its financial statements.
Statement of Cash Flows: Classification of Certain Cash Receipts and Cash PaymentsDisclosure Framework—Changes to the Disclosure Requirements for Fair Value Measurement—ASU 2018-13
This accounting standard reducesmodifies the diversity in practice in howdisclosure requirements for fair value measurements. Certain current disclosure requirements relating to Level 3 fair value measurements, and transfers between Level 1 and Level 2 fair value measurements will be eliminated. The standard will also add certain cash receipts and cash payments are presented and classified in the Statement of Cash Flows.other disclosure requirements for Level 3 fair value measurements.
The standard is effective for annual and interim periods beginning after December 15, 2017; however, entities may adopt early including2019. Certain amendments in anthe standard should be applied prospectively for only the most recent interim period.or annual period presented in the initial fiscal year of adoption. All other amendments of the standard should be applied retrospectively to all periods presented upon their effective date. Early adoption is permitted. PSEG is currently analyzing the impact of this standard on its financial statements.
Statement of Cash Flows: Restricted CashCustomer’s Accounting for Implementation Costs Incurred in a Cloud Computing Arrangement That Is a Service Contract—ASU 2018-15
This accounting standard aligns the capitalization requirements for implementation costs incurred in a hosting arrangement that is a service contract with capitalization requirements for implementation costs incurred to develop or obtain internal-use software, including hosting arrangements that include an internal-use software license. The standard follows the guidance in ASC 350—Intangibles—Goodwill and Other to determine which implementation costs to capitalize as an asset related to the service contract and which costs to expense. The standard requires entitiesthe amortization of capitalized costs to explainbe presented in O&M Expense. In addition, the change during the periodstandard also adds presentation requirements for these costs in the totalstatements of cash flows and cash equivalents and include amounts described as restricted cash or restricted cash equivalents in its reconciliation of beginning of period and end-of-period amounts in the Statement of Cash Flows.financial position.
The standard is effective for annual and interim periods beginning after December 15, 2017; however, entities may adopt early2019. Early adoption is permitted, including adoption in anany interim period. This standard should be applied either retrospectively or prospectively to all implementation costs incurred after the date of adoption. PSEG will include those amounts that are deemedis currently analyzing the impact of this standard on its financial statements.
Targeted Improvements to be restricted cash and restricted cash equivalents in its cash and cash equivalents balances in the statement of cash flows as well as disclosure regarding the nature of restricted amounts.
NOTES TO CONSOLIDATED FINANCIAL STATEMENTS
Business Combinations: Clarifying the Definition of a BusinessRelated Party Guidance for Variable Interest Entities (VIE)—ASU 2018-17
This accounting standard was issued mainlyimproves the VIE guidance in the area of decision-making fees. Consistent with how indirect interests held through related parties under common control are considered for determining whether a reporting entity must consolidate a VIE, indirect interests held through related parties in common control arrangements should be considered on a proportional basis for determining whether fees paid to provide more consistency in how the definition of a business is applied to acquisitions or dispositions. The new guidance will generally reduce the number of transactions that will require treatment as a business combination. The definition of a business now includes a filter that would consider whether substantially all the fair value of the gross assets acquired or disposed of is concentrated in a single identifiable asset or a group of similar identifiable assets. If this condition is met, the transaction would not qualify as a business.decision makers and service providers are variable interests.
TheThis standard is effective for annual and interim periods beginning after December 15, 2017; however, entities may adopt it for transactions that have closed before2019. The standard is required to be applied retrospectively with a cumulative-effect adjustment to retained earnings at the effective date but have not been reported in financial statements that have been issued or made available for issuance.beginning of the earliest period presented. Early adoption is permitted. PSEG is currently evaluatinganalyzing the impact of this standard on its financial statements; however, PSEG does not expect this guidance to materially impact its financial statements upon adoption.statements.
Simplifying the Test for Goodwill Impairment—ASU 2017-04
This accounting standard requires an entity to perform its annual or interim goodwill impairment test by comparing the fair value of a reporting unit with its carrying amount. An entity should recognize an impairment charge for the amount by which the carrying amount exceeds the reporting unit’s fair value; however, the loss recognized should not exceed the total amount of goodwill allocated to that reporting unit. Additionally, an entity should consider income tax effects from any tax deductible goodwill on the carrying amount of the reporting unit when measuring the goodwill impairment loss, if applicable.
An entity should apply this standard on a prospective basis and will be required to disclose the nature of and reason for the change in accounting principle upon transition. The new standard is effective for impairment tests for periods beginning January 1, 2020. Early adoption is permitted for interim or annual goodwill impairment tests performed on testing dates after January 1, 2017. PSEG does not expect adoption of this standard to have a material impact on its financial statements.
Disclosure Framework—Changes to the Disclosure Requirements for Defined Benefit Plans—ASU 2018-14
This accounting standard modifies the disclosure requirements for employers that sponsor defined benefit pension or other postretirement plans, including the elimination of certain current disclosure requirements. Certain other disclosure requirements related to interest crediting rates have been added and certain clarifications were made to other disclosure requirements.
The standard is effective for fiscal years ending after December 15, 2020 and early adoption is permitted. An entity should apply the amendments in this standard on a retrospective basis to all periods presented. PSEG is currently assessinganalyzing the impact of this guidance uponstandard on its financial statements.
NOTES TO CONSOLIDATED FINANCIAL STATEMENTS
Note 3. Revenues
Nature of Goods and Services
The following is a description of principal activities by reportable segment from which PSEG, PSE&G and Power generate their revenues.
PSE&G
Revenues from Contracts with Customers
Electric and Gas Distribution and Transmission Revenues—PSE&G sells gas and electricity to customers under default commodity supply tariffs. PSE&G’s regulated electric and gas default commodity supply and distribution services are separate tariffs which are satisfied as the product(s) and/or services are delivered to the customer. The electric and gas commodity and delivery tariffs are recurring contracts in effect until cancellation by the customer. Revenue is recognized over time as the service is rendered to the customer. Included in PSE&G’s regulated revenues are unbilled electric and gas revenues which represent the estimated amount customers will be billed for services rendered from the most recent meter reading to the end of the respective accounting period.
PSE&G’s transmission revenues are earned under a separate FERC tariff. The performance obligation of transmission service is satisfied over time as it is provided to and consumed by the customer. Revenue is recognized upon delivery of the transmission service. PSE&G’s revenues from the transmission of electricity are recorded based on a FERC-approved annual formula rate mechanism. This mechanism provides for an annual filing of an estimated revenue requirement with rates effective January 1 of each year and a mechanism true-up to that estimate based on actual revenue requirements. The true-up mechanism is an alternative revenue which is outside the scope of revenue from contracts with customers.
Other Revenues from Contracts with Customers
Other revenues from contracts with customers, which are not a material source of PSE&G revenues, are generated primarily from appliance repair services and solar generation projects. The performance obligations under these contracts are satisfied and revenue is recognized as control of products is delivered or services are rendered.
Payment for services rendered and products transferred are typically due within 30 days of month of delivery.
Revenues Unrelated to Contracts with Customers
Other PSE&G revenues unrelated to contracts with customers are derived from alternative revenue mechanisms recorded pursuant to regulatory accounting guidance. These revenues, which include weather normalization, green energy program true-ups and transmission formula rate true-ups, are not a material source of PSE&G revenues.
Power
Revenues from Contracts with Customers
Electricity and Related Products—Wholesale and retail load contracts are executed in the different Independent System Operator (ISO) regions for the bundled supply of energy, capacity, renewable energy credits (RECs) and ancillary services representing Power’s performance obligations. Revenue for these contracts is recognized over time as the bundled service is provided to the customer. Transaction terms generally run from several months to three years. Power also sells to the ISOs energy and ancillary services which are separately transacted in the day-ahead or real-time energy markets. The energy and ancillary services performance obligations are typically satisfied over time as delivered and revenue is recognized accordingly. Power generally reports electricity sales and purchases conducted with those individual ISOs net on an hourly basis in either Operating Revenues or Energy Costs in its Consolidated Statements of Operations. The classification depends on the net hourly activity.
Power enters into capacity sales and capacity purchases through the ISOs. The transactions are reported on a net basis dependent on Power’s monthly net sale or purchase position through the individual ISOs. The performance obligations with the ISOs are satisfied over time upon delivery of the capacity and revenue is recognized accordingly. In addition to capacity sold through the ISOs, Power sells capacity through bilateral contracts and the related revenue is reported on a gross basis and recognized over time upon delivery of the capacity.
Gas Contracts—Power sells wholesale natural gas, primarily through an index based full requirements Basic Gas Supply Service (BGSS) contract with PSE&G to meet the gas supply requirements of PSE&G’s customers. The BGSS contract, which extends through March 2019, remains in effect thereafter unless terminated by either party with a two-year notice. The performance obligation is primarily delivery of gas which is satisfied over time. Revenue is recognized as gas is delivered. Based upon the availability of natural gas, storage and pipeline capacity beyond PSE&G’s daily needs, Power also sells gas and
NOTES TO CONSOLIDATED FINANCIAL STATEMENTS
pipeline capacity to other counterparties under bilateral contracts. The performance obligation under these contracts is satisfied over time upon delivery of the gas or capacity, and revenue is recognized accordingly.
Other Revenues from Contracts with Customers
Power enters into bilateral contracts to sell solar power and solar RECs from its solar facilities. Contract terms range from 15 to 30 years. The performance obligations are generally solar power and RECs which are transferred to customers upon generation. Revenue is recognized upon generation of the solar power.
Power has entered into long-term contracts with LIPA for energy management and fuel procurement services. Revenue is recognized over time as services are rendered.
Revenues Unrelated to Contracts with Customers
Power’s revenues unrelated to contracts with customers include electric, gas and certain energy-related transactions accounted for in accordance with Derivatives and Hedging accounting guidance. See Note 17. Financial Risk Management Activities for further discussion. Power is also a party to solar contracts that qualify as leases and are accounted for in accordance with lease accounting guidance.
Other
Revenues from Contracts with Customers
PSEG LI has a contract with LIPA which generates revenues. PSEG LI’s subsidiary, Servco records costs which are recovered from LIPA and records the recovery of those costs as revenues when Servco is a principal in the transaction.
Revenues Unrelated to Contracts with Customers
Energy Holdings generates lease revenues which are recorded pursuant to lease accounting guidance.
Disaggregation of Revenues |
| | | | | | | | | | | | | | | | | | | | | |
| | | | | | | | | | | | |
| | | PSE&G | | Power | | Other | | Eliminations | | Consolidated | |
| | | Millions | |
| | Year Ended December 31, 2018 | | | | | | | | | | |
| | Revenues from Contracts with Customers | | | | | | | | | | |
| | Electric Distribution | $ | 3,131 |
| | $ | — |
| | $ | — |
| | $ | — |
| | $ | 3,131 |
| |
| | Gas Distribution | 1,756 |
| | — |
| | — |
| | (18 | ) | | 1,738 |
| |
| | Transmission | 1,236 |
| | — |
| | — |
| | — |
| | 1,236 |
| |
| | Electricity and Related Product Sales | | | | | | | | | | |
| | PJM | | | | | | | | | | |
| | Third Party Sales | — |
| | 1,933 |
| | — |
| | — |
| | 1,933 |
| |
| | Sales to Affiliates | — |
| | 609 |
| | — |
| | (609 | ) | | — |
| |
| | New York ISO | — |
| | 209 |
| | — |
| | — |
| | 209 |
| |
| | ISO New England | — |
| | 92 |
| | — |
| | — |
| | 92 |
| |
| | Gas Sales | | | | | | | | | | |
| | Third Party Sales | — |
| | 151 |
| | — |
| | — |
| | 151 |
| |
| | Sales to Affiliates | — |
| | 861 |
| | — |
| | (861 | ) | | — |
| |
| | Other Revenues from Contracts with Customers (A) | 275 |
| | 44 |
| | 532 |
| | (4 | ) | | 847 |
| |
| | Total Revenues from Contracts with Customers | 6,398 |
| | 3,899 |
| | 532 |
| | (1,492 | ) | | 9,337 |
| |
| | Revenues Unrelated to Contracts with Customers (B) | 73 |
| | 247 |
| | 39 |
| | — |
| | 359 |
| |
| | Total Operating Revenues | $ | 6,471 |
| | $ | 4,146 |
| | $ | 571 |
| | $ | (1,492 | ) | | $ | 9,696 |
| |
| | | | | | | | | | | | |
NOTES TO CONSOLIDATED FINANCIAL STATEMENTS
|
| | | | | | | | | | | | | | | | | | | | | |
| | | | | | | | | | | | |
| | | PSE&G | | Power | | Other | | Eliminations | | Consolidated | |
| | | Millions | |
| | Year Ended December 31, 2017 | | | | | | | | | | |
| | Revenues from Contracts with Customers | | | | | | | | | | |
| | Electric Distribution | $ | 3,088 |
| | $ | — |
| | $ | — |
| | $ | — |
| | $ | 3,088 |
| |
| | Gas Distribution | 1,684 |
| | — |
| | — |
| | (14 | ) | | 1,670 |
| |
| | Transmission | 1,222 |
| | — |
| | — |
| | — |
| | 1,222 |
| |
| | Electricity and Related Product Sales | | | | | | | | | | |
| | PJM | | | | | | | | | | |
| | Third Party Sales | — |
| | 1,199 |
| | — |
| | — |
| | 1,199 |
| |
| | Sales to Affiliates | — |
| | 734 |
| | — |
| | (734 | ) | | — |
| |
| | New York ISO | — |
| | 181 |
| | — |
| | — |
| | 181 |
| |
| | ISO New England | — |
| | 39 |
| | — |
| | — |
| | 39 |
| |
| | Gas Sales | | | | | | | | | | |
| | Third Party Sales | — |
| | 134 |
| | — |
| | — |
| | 134 |
| |
| | Sales to Affiliates | — |
| | 804 |
| | — |
| | (804 | ) | | — |
| |
| | Other Revenues from Contracts with Customers (A) | 265 |
| | 42 |
| | 511 |
| | (4 | ) | | 814 |
| |
| | Total Revenues from Contracts with Customers | 6,259 |
| | 3,133 |
| | 511 |
| | (1,556 | ) | | 8,347 |
| |
| | Revenues Unrelated to Contracts with Customers (B) | 65 |
| | 727 |
| | (45 | ) | | — |
| | 747 |
| |
| | Total Operating Revenues | $ | 6,324 |
| | $ | 3,860 |
| | $ | 466 |
| | $ | (1,556 | ) | | $ | 9,094 |
| |
| | | | | | | | | | | | |
|
| | | | | | | | | | | | | | | | | | | | | |
| | | | | | | | | | | | |
| | | PSE&G | | Power | | Other | | Eliminations | | Consolidated | |
| | | Millions | |
| | Year Ended December 31, 2016 | | | | | | | | | | |
| | Revenues from Contracts with Customers | | | | | | | | | | |
| | Electric Distribution | $ | 3,327 |
| | $ | — |
| | $ | — |
| | $ | — |
| | $ | 3,327 |
| |
| | Gas Distribution | 1,582 |
| | — |
| | — |
| | (22 | ) | | 1,560 |
| |
| | Transmission | 1,084 |
| | — |
| | — |
| | — |
| | 1,084 |
| |
| | Electricity and Related Product Sales | | | | | | | | | | |
| | PJM | | | | | | | | | | |
| | Third Party Sales | — |
| | 1,060 |
| | — |
| | — |
| | 1,060 |
| |
| | Sales to Affiliates | — |
| | 805 |
| | — |
| | (805 | ) | | — |
| |
| | New York ISO | — |
| | 169 |
| | — |
| | — |
| | 169 |
| |
| | ISO New England | — |
| | 55 |
| | — |
| | — |
| | 55 |
| |
| | Gas Sales | | | | | | | | | | |
| | Third Party Sales | — |
| | 114 |
| | — |
| | — |
| | 114 |
| |
| | Sales to Affiliates | — |
| | 737 |
| | — |
| | (737 | ) | | — |
| |
| | Other Revenues from Contracts with Customers (A) | 292 |
| | 35 |
| | 482 |
| | (4 | ) | | 805 |
| |
| | Total Revenues from Contracts with Customers | 6,285 |
| | 2,975 |
| | 482 |
| | (1,568 | ) | | 8,174 |
| |
| | Revenues Unrelated to Contracts with Customers (B) | 18 |
| | 886 |
| | (112 | ) | | — |
| | 792 |
| |
| | Total Operating Revenues | $ | 6,303 |
| | $ | 3,861 |
| | $ | 370 |
| | $ | (1,568 | ) | | $ | 8,966 |
| |
| | | | | | | | | | | | |
| |
| (A) | Includes primarily revenues from appliance repair services at PSE&G, solar power projects and energy management and fuel service contracts with LIPA at Power, and PSEG LI’s OSA with LIPA in Other. |
| |
| (B) | Includes primarily alternative revenues at PSE&G, derivative contracts at Power, and lease contracts in Other. For the years ended December 31, 2018, 2017 and 2016, Other includes losses of $8 million, $77 million and $147 million, respectively, related to Energy Holdings’ investments in leases. For additional information, see Note 8. Long-Term Investments. |
Contract Balances
PSE&G
PSE&G does not have any material contract balances (rights to consideration for services already provided or obligations to provide services in the future for consideration already received) as of December 31, 2018 and 2017. Substantially all of
NOTES TO CONSOLIDATED FINANCIAL STATEMENTS
PSE&G’s accounts receivable result from contracts with customers. Allowances represented approximately seven percent and six percent of accounts receivable as of December 31, 2018 and 2017, respectively.
Power
Power generally collects consideration upon satisfaction of performance obligations, and therefore, Power had no material contract balances as of December 31, 2018 and 2017.
Power’s accounts receivable include amounts resulting from contracts with customers and other contracts which are out of scope of accounting guidance for revenues from contracts with customers. The majority of these accounts receivable are subject to master netting agreements. As a result, accounts receivable resulting from contracts with customers and receivables unrelated to contracts with customers are netted within Accounts Receivable and Accounts Payable on the Consolidated Balance Sheets. In the wholesale energy markets in which Power operates, payment for services rendered and products transferred are typically due within 30 days of month of delivery. As such, there is little credit risk associated with these receivables and Power typically records no allowances.
Other
PSEG LI does not have any material contract balances as of December 31, 2018 and 2017.
Remaining Performance Obligations under Fixed Consideration Contracts
Power and PSE&G primarily record revenues as allowed by the guidance, which states that if an entity has a right to consideration from a customer in an amount that corresponds directly with the value to the customer of the entity's performance completed to date, the entity may recognize revenue in the amount to which the entity has a right to invoice. PSEG has future performance obligations under contracts with fixed consideration as follows:
Power
As stated above, capacity transactions with ISOs are reported on a net basis dependent on Power’s monthly net sale or purchase position through the individual ISOs.
Capacity Payments from the PJM Reliability Pricing Model (RPM) Annual Base Residual and Incremental Auctions—The Base Residual Auction is conducted annually three years in advance of the operating period. Power expects to realize the following average capacity prices for capacity obligations to be satisfied resulting from the base and incremental auctions which have been completed:
|
| | | | | | | |
| | | | | | | |
| | Delivery Year | | $ per MW-Day | | MW Cleared | |
| | June 2018 to May 2019 | | $205 | | 9,200 |
| |
| | June 2019 to May 2020 | | $116 | | 8,900 |
| |
| | June 2020 to May 2021 | | $170 | | 8,100 |
| |
| | June 2021 to May 2022 | | $178 | | 7,700 |
| |
| | | | | | | |
Capacity Payments from the New England ISO Forward Capacity Market—The Forward Capacity Market (FCM) Auction is conducted annually three years in advance of the operating period. The table below includes Power’s cleared capacity in the FCM Auction for the Bridgeport Harbor Station 5, which cleared the 2019/2020 auction at $231/MW-day for seven years, with escalations based on the Handy-Whitman Index and the planned retirement of Bridgeport Harbor Station 3 in 2021. Power expects to realize the following average capacity prices for capacity obligations to be satisfied resulting from the FCM auctions which have been completed:
|
| | | | | | | |
| | | | | | | |
| | Delivery Year | | $ per MW-Day | | MW Cleared | |
| | June 2018 to May 2019 | | $314 | | 820 |
| |
| | June 2019 to May 2020 | | $231 | | 1,330 |
| |
| | June 2020 to May 2021 | | $195 | | 1,330 |
| |
| | June 2021 to May 2022 | | $192 | | 950 |
| |
| | June 2022 to May 2023 | | $231 | | 480 |
| |
| | June 2023 to May 2024 | | $231 | | 480 |
| |
| | June 2024 to May 2025 | | $231 | | 480 |
| |
| | June 2025 to May 2026 | | $231 | | 480 |
| |
| | | | | | | |
NOTES TO CONSOLIDATED FINANCIAL STATEMENTS
Bilateral capacity contracts—Capacity obligations pursuant to contract terms through 2029 are anticipated to result in revenues totaling $170 million.
Other
The LIPA OSA is a 12-year services contract ending in 2025 with annual fixed and incentive components. The fixed fee for the provision of services thereunder in 2018 is $64 million and could increase each year based on the change in the Consumer Price Index (CPI). The incentive for 2018 can range from zero to approximately $10 million and could increase each year thereafter based on the change in the CPI.
Note 3.4. Early Plant Retirements
Nuclear
In May 2018, the governor of New Jersey signed legislation, referred to as the ZEC legislation, that recognizes that nuclear power is a critical component of New Jersey’s clean energy portfolio and an important element of a diverse energy generation portfolio that currently meets approximately 40 percent of New Jersey’s electric power needs. The ZEC legislation creates a Zero Emission Certificate (ZEC) program to be administered by the BPU. The BPU subsequently established processes to evaluate applications by qualified nuclear plants and to review and approve changes to the New Jersey’s electric distribution companies’ tariffs to provide for the purchase of ZECs from selected nuclear plants and recover those ZEC payments through a non-bypassable distribution charge (ZEC charge) in the amount of $0.004 per kilowatt-hour (which is equivalent to approximately $10 per MWh in payments to selected nuclear plants). ZECs will be awarded to selected nuclear plants, if any, in April 2019 at which time ZEC revenue would commence and would continue for approximately three years. Nuclear plants receiving ZEC payments will be obligated to maintain operations, subject to exceptions specified in the ZEC legislation. The ZEC legislation requires nuclear plants to reapply for any subsequent three year periods. The ZEC payment may be adjusted by the BPU (a) at any time to offset environmental or fuel diversity payments that a selected nuclear plant may receive from another source or (b) at certain times specified in the ZEC legislation if the BPU determines that the purposes of the ZEC legislation can be achieved through a reduced charge that will nonetheless be sufficient to achieve the state’s air quality and other environmental objectives by preventing the retirement of nuclear plants.
In December 2018, Power submitted applications to the BPU for the Salem 1 and 2 and Hope Creek nuclear plants. These were the only applications received by the BPU. As required, Power’s three applications each included a certification pursuant to which Power confirmed that each of the Salem 1, Salem 2 and Hope Creek plants will cease operations within three years absent a material financial change. Power’s submittal further attested that the nuclear plants are not expected to cover their costs and operating and market risks as defined in the ZEC legislation, absent a material financial change. As a result, absent a material financial change, Power will retire all three plants unless all of the plants receive ZECs. Power operates its nuclear plants as an interdependent fleet on a common site with shared costs and services, which allows them to achieve economies of scale. A decision to retire one nuclear plant would also adversely impact Power’s ability to attract and retain qualified employees at its remaining plants. Power believes that the retirement of any individual nuclear plant would have the effect of decreasing the scale of its nuclear operations; however, the complex nature of operating nuclear plants would not decrease the attention required from management for the safe operation of the remaining nuclear operations. As a result, Power’s decision to retire any nuclear plant would be made at the site level and would result in the retirement of all of these New Jersey nuclear plants.
Given the anticipated timing of the BPU’s decision on which nuclear plants, if any, have been selected to receive ZECs, which is expected in April 2019, in March 2019 Power will submit to the PJM Independent Market Monitor and the PJM Office of Interconnection a request for a preliminary exception to PJM’s RPM must-offer requirement with respect to Power’s interest for each of the Salem 1, Salem 2 and Hope Creek plants in connection with the 2022/2023 capacity auction expected to be held in August 2019. Power will also submit a deactivation notice to the extent that its filing deadline occurs prior to the award of ZECs by the BPU. If all of the Salem and Hope Creek plants are selected to receive ZECs, the preliminary exception and requested deactivation notice, as applicable, would be withdrawn.
In the event that any of the Salem 1, Salem 2 and Hope Creek plants is not selected to receive ZEC payments in April 2019 by the BPU and do not otherwise experience a material financial change, Power will take all necessary steps to retire all of these plants at or prior to their refueling outages scheduled for the Fall 2019 in the case of Hope Creek, Spring 2020 in the case of Salem 2 and Fall 2020 in the case of Salem 1. Alternatively, if all of the Salem 1, Salem 2 and Hope Creek plants are selected to receive ZEC payments in April 2019 but the financial condition of the plants is materially adversely impacted by potential changes to the capacity market construct being considered by FERC (absent sufficient capacity revenues provided under a program approved by the BPU in accordance with a FERC authorized capacity mechanism), Power would still take all necessary steps to retire all of these plants. The costs and accounting charges associated with any such retirement, which may include, among other things, accelerated D&A or impairment charges, potential penalties associated with the early termination of capacity obligations and fuel
NOTES TO CONSOLIDATED FINANCIAL STATEMENTS
contracts, accelerated asset retirement costs, severance costs, environmental remediation costs and, in certain circumstances, potential additional funding of the NDT Fund, would be material to both PSEG and Power.
The following table provides the balance sheet amounts by generating station as of December 31, 2018 for significant assets and liabilities associated with Power’s owned share of its nuclear assets.
|
| | | | | | | | | | | | | | | | | | |
| | | | | | | | | | | |
| | | | As of December 31, 2018 | |
| | | | Hope Creek | | Salem | | Support Facilities and Other (A) | | Peach Bottom | |
| | | | Millions | |
| | Assets | | | | | | | | | |
| | Materials and Supplies Inventory | | $ | 84 |
| | $ | 65 |
| | $ | — |
| | $ | 41 |
| |
| | Nuclear Production, net of Accumulated Depreciation | | 635 |
| | 626 |
| | 197 |
| | 777 |
| |
| | Nuclear Fuel In-Service, net of Accumulated Depreciation | | 139 |
| | 110 |
| | — |
| | 148 |
| |
| | Construction Work in Progress (including nuclear fuel) | | 131 |
| | 132 |
| | 5 |
| | 20 |
| |
| | Total Assets | | $ | 989 |
| | $ | 933 |
| | $ | 202 |
| | $ | 986 |
| |
| | Liabilities | | | | | | | | | |
| | Asset Retirement Obligation | | $ | 253 |
| | $ | 240 |
| | $ | — |
| | $ | 215 |
| |
| | Total Liabilities | | $ | 253 |
| | $ | 240 |
| | $ | — |
| | $ | 215 |
| |
| | Net Assets | | $ | 736 |
| | $ | 693 |
| | $ | 202 |
| | $ | 771 |
| |
| | NRC License Renewal Term | | 2046 | | 2036/2040 |
| | N/A |
| | 2033/2034 |
| |
| | % Owned | | 100 | % | | 57 | % | | Various |
| | 50 | % | |
| | | | | | | | | | | |
| |
| (A) | Includes Hope Creek’s and Salem’s shared support facilities and other nuclear development capital. |
Fossil
On October 3, 2016,June 1, 2017, Power determined that it would ceasecompleted its previously announced retirement of the generation operations of the existing coal/gas units at the Hudson and Mercer generating stations on June 1, 2017. Power has filed deactivation notices with PJM for these existing units at both stations and final must-offer exception requests forstations.
In the 2020-2021 PJM capacity auction to the PJM Independent Market Monitor. Power expects the units to continue to be available to generate electricity and receive previously cleared capacity payments through the date the units cease operations. The exact timinglatter half of the early retirement of these units may be impacted by operational and other conditions that could subsequently arise.
PSEG and Power undertake their annual five-year strategic planning process primarily during the third and fourth quarters of each year. The primary factors considered during this process that contributed to the decision to retire these units early include significant declines in revenues and margin caused by a sustained period of depressed wholesale power prices and reduced capacity factors caused by lower natural gas prices making coal generation less economically competitive than natural gas-fired generation. Despite experiencing recent warmer than normal weather in PJM this summer, Power did not experience the usual increase in electricity prices in PJM as it had in past hot summers. This trend has a further adverse economic impact to these units because they generally dispatch and earn energy margin on peak hot and cold days. In addition, the upcoming PJM capacity auction in May 2017 for the capacity period from June 2020 to May 2021 will be the first to require all generating units to meet the increased operating performance standards of PJM’s new capacity performance regulations. During the current annual five-year strategic planning process, Power determined, on October 3, 2016, that the costs to upgrade the existing units at the Hudson and Mercer stations to comply with these higher reliability standards to be too significant and not economic given current market conditions, including anticipated future capacity prices, current forward energy prices and past operational performance results of the units. While these units have the capability to run on both coal and natural gas, they have higher operating costs and fuel consumption as well as longer start-up times compared to newer combined cycle gas units.
NOTES TO CONSOLIDATED FINANCIAL STATEMENTS
The decision to retire the Hudson and Mercer units early had and will continue to have a material effect on PSEG’s and Power’s results of operations. In 2016, PSEG and Power recognized the following pre-tax charges in Energy Costs Operation and MaintenanceO&M of $62 million and Depreciation expense during the period following the announcement of the early retirement of the plants:
|
| | | | | |
| | | | |
| | | Year Ended December 31, 2016 | |
| | | Millions | |
| | Statement of Operations Expense (pre-tax) | | |
| | Energy Costs | | |
| | Coal Inventory Lower of Cost or Market Adjustments and Capacity Penalties | $ | 62 |
| |
| | Operation and Maintenance | | |
| | Materials and Supplies Obsolescence | 31 |
| |
| | Write-down of Construction Work in Progress | 14 |
| |
| | Other (A) | 8 |
| |
| | Depreciation and Amortization | | |
| | Depreciation including Asset Retirement Costs | 571 |
| |
| | Total Pre-Tax Expense | $ | 686 |
| |
| | | | |
| |
(A) | Includes severance and miscellaneous costs. Power recorded $7 million of severance expense which it expects to pay in 2017. |
$53 million, respectively, related to coal inventory adjustments, capacity penalties, materials and supplies inventory reserve adjustments for parts that cannot be used at other generating units, employee-related severance benefits costs and construction work in progress impairments, among other shutdown items. In addition to these charges, Power expects to recognize the remaining Depreciation and Amortizationrecognized D&A during 2016 of $958$571 million in 2017 due to the significant shortening of the expected economic useful lives of Hudson and Mercer. Additional employee-related salary continuance and severance costs and various miscellaneous costs may also be incurred during
During the period prior to retirement. Finally,year ended December 31, 2017, Power currently anticipates using the sitesrecognized total D&A of $964 million for alternative industrial activity. However, if Power determines not to use the sites for alternative industrial activity, the early retirement of the units at such sites would trigger obligations under certain environmental regulations, including possible remediation. The amounts for any such environmental remediation are neither currently probable nor estimable but may be material.
Because the Hudson and Mercer generating units will cease operations significantly beforeto reflect the endsignificant shortening of their previously estimatedexpected economic useful lives,lives. During the year ended December 31, 2017, Power performed a recoverability testrecognized pre-tax charges in Energy Costs of $15 million, primarily for its portfoliocoal inventory lower of generating assetscost or market adjustments. Power also recognized pre-tax charges in O&M of $23 million, including shut down costs and an increase in the PJM regionAsset Retirement Obligation due to determine if an impairment exists. Assettlements and changes in cash flow estimates, partially offset by changes in employee-related severance costs. During the year ended December 31, 2018, Power recognized pre-tax charges in Energy costs of September 30, 2016,$3 million for coal inventory lower of cost or market adjustments.
In December 2018, Power completed the estimated undiscounted future cash flowssale of the PJM asset group exceededsites of the carrying amountretired Hudson and no impairment was identified. For additional informationMercer units. Power transferred all land rights and structures on impairmentthe sites to a third party purchaser, along with the assumption of long-lived assets, see Note 1. Organization, Basisthe environmental liabilities for the sites. As a result of Presentationthe sale and Summarytransfer of Significant Accounting Policies.liabilities, Power recorded a pre-tax gain in 2018 of $54 million in O&M Expense.
In addition, Power has reduced the estimated useful life of Bridgeport Harbor Station unit 3 from 2025 to the summer of 2021 as it is more likely than not it will retire the unit by this time. The change in the estimated useful life is not expected to have a material impact on Power’s future financial results. PSEG and Power continue to monitor their other coal assets, including their interest in the Keystone and Conemaugh generating stations, to assess their economic viability through the end of their designated useful lives and their continued classification as held for use. The precise timing of a change in useful lives may be dependent upon events out of PSEG’s and Power’s control and may impact their ability to operate or maintain thesecertain assets in the future. These generating stations may be impacted by factors such as environmental legislation, co-owner capital requirements and continued depressed wholesale power prices or capacity factors, among other things. Any early retirement or change in the classification as held for use classification of our remaining coal units may have a material adverse impact on PSEG’s and Power’s future financial results.
Note 4. Variable Interest Entities (VIEs)
VIEs for which PSE&G is the Primary Beneficiary
PSE&G is the primary beneficiary and consolidates two marginally capitalized VIEs, PSE&G Transition Funding LLC (Transition Funding) and PSE&G Transition Funding II LLC (Transition Funding II), which were created for the purpose of issuing transition bonds and purchasing bond transitional property of PSE&G, which was pledged as collateral to a trustee. PSE&G acted as the servicer for these entities to collect securitization transition charges authorized by the BPU. These funds were remitted to Transition Funding and Transition Funding II and were used for interest and principal payments on the transition bonds and related costs. During 2015, Transition Funding and Transition Funding II paid their final securitization bond payments and as of December 31, 2015, no further debt or related costs remained with these VIEs. During 2016,
NOTES TO CONSOLIDATED FINANCIAL STATEMENTS
Transition Funding and Transition Funding II refunded final over-collected transition charges to ratepayers and as of December 31, 2016 the securitization program was completed.Note 5. Variable Interest Entity (VIE)
VIE for which PSEG LI is the Primary Beneficiary
PSEG LI consolidates Servco, a marginally capitalized VIE, which was created for the purpose of operating LIPA’s T&D system in Long Island, New York as well as providing administrative support functions to LIPA. PSEG LI is the primary beneficiary of Servco because it directs the operations of Servco, the activity that most significantly impacts Servco’s economic performance and it has the obligation to absorb losses of Servco that could potentially be significant to Servco. Such losses would be immaterial to PSEG.
Pursuant to the OSA, Servco’s operating costs are reimbursable entirely by LIPA, and therefore, PSEG LI’s risk is limited related to the activities of Servco. PSEG LI has no current obligation to provide direct financial support to Servco. In addition to reimbursement of Servco’s operating costs as provided for in the OSA, PSEG LI receives an annual contract management fee. PSEG LI’s annual contractual management fee, in certain situations, could be partially offset by Servco’s annual storm costs not approved by the Federal Emergency Management Agency, limited contingent liabilities and penalties for failing to meet certain performance metrics.
For transactions in which Servco acts as principal and controls the services provided to LIPA, such as transactions with its employees for labor and labor-related activities, including pension and OPEB-related transactions, Servco records revenues and the related pass-through expenditures separately in Operating Revenues and O&M Expense, respectively. In 2016, 20152018, 2017 and 2014,2016, Servco recorded $410$458 million, $375$438 million and $389$410 million, respectively, of O&M costs, the full reimbursement of which was reflected in Operating Revenues. For transactions in which Servco acts as an agent for LIPA, it records revenues and the related expenses on a net basis, resulting in no impact on PSEG’s Consolidated Statement of Operations.
Note 5.6. Property, Plant and Equipment and Jointly-Owned Facilities
Information related to Property, Plant and Equipment as of December 31, 20162018 and 20152017 is detailed below:
|
| | | | | | | | | | | | | | | | | |
| | | | | | | | | | |
| | | PSE&G | | Power | | Other | | PSEG Consolidated | |
| | | Millions | |
| | 2016 | | | | | | | | |
| | Transmission and Distribution: | | | | | | | | |
| | Electric Transmission | $ | 9,132 |
| | $ | — |
| | $ | — |
| | $ | 9,132 |
| |
| | Electric Distribution | 7,974 |
| | — |
| | — |
| | 7,974 |
| |
| | Gas Transmission | 89 |
| | — |
| | — |
| | 89 |
| |
| | Gas Distribution | 6,369 |
| | — |
| | — |
| | 6,369 |
| |
| | Construction Work in Progress | 1,501 |
| | — |
| | — |
| | 1,501 |
| |
| | Plant Held for Future Use | 19 |
| | — |
| | — |
| | 19 |
| |
| | Other | 439 |
| | — |
| | — |
| | 439 |
| |
| | Total Transmission and Distribution | 25,523 |
| | — |
| | — |
| | 25,523 |
| |
| | Generation: | | | | | | | | |
| | Fossil Production | — |
| | 7,096 |
| | — |
| | 7,096 |
| |
| | Nuclear Production | — |
| | 2,516 |
| | — |
| | 2,516 |
| |
| | Nuclear Fuel in Service | — |
| | 783 |
| | — |
| | 783 |
| |
| | Other Production-Solar | 591 |
| | 687 |
| | — |
| | 1,278 |
| |
| | Construction Work in Progress | — |
| | 1,483 |
| | — |
| | 1,483 |
| |
| | Total Generation | 591 |
| | 12,565 |
| | — |
| | 13,156 |
| |
| | Other | 233 |
| | 90 |
| | 335 |
| | 658 |
| |
| | Total | $ | 26,347 |
| | $ | 12,655 |
| | $ | 335 |
| | $ | 39,337 |
| |
| | | | | | | | | | |
Table of Contents |
| | | | | | | | | | | | | | | | | |
| | | | | | | | | | |
| | | PSE&G | | Power | | Other | | PSEG Consolidated | |
| | | Millions | |
| | 2018 | | | | | | | | |
| | Transmission and Distribution: | | | | | | | | |
| | Electric Transmission | $ | 11,991 |
| | $ | — |
| | $ | — |
| | $ | 11,991 |
| |
| | Electric Distribution | 8,989 |
| | — |
| | — |
| | 8,989 |
| |
| | Gas Distribution and Transmission | 7,854 |
| | — |
| | — |
| | 7,854 |
| |
| | Construction Work in Progress | 1,170 |
| | — |
| | — |
| | 1,170 |
| |
| | Other | 624 |
| | — |
| | — |
| | 624 |
| |
| | Total Transmission and Distribution | 30,628 |
| | — |
| | — |
| | 30,628 |
| |
| | Generation: | | | | | | | | |
| | Fossil Production | — |
| | 6,541 |
| | — |
| | 6,541 |
| |
| | Nuclear Production | — |
| | 2,971 |
| | — |
| | 2,971 |
| |
| | Nuclear Fuel in Service | — |
| | 765 |
| | — |
| | 765 |
| |
| | Other Production-Solar | 623 |
| | 833 |
| | — |
| | 1,456 |
| |
| | Construction Work in Progress | — |
| | 1,011 |
| | — |
| | 1,011 |
| |
| | Total Generation | 623 |
| | 12,121 |
| | — |
| | 12,744 |
| |
| | Other | 382 |
| | 103 |
| | 344 |
| | 829 |
| |
| | Total | $ | 31,633 |
| | $ | 12,224 |
| | $ | 344 |
| | $ | 44,201 |
| |
| | | | | | | | | | |
NOTES TO CONSOLIDATED FINANCIAL STATEMENTS
|
| | | | | | | | | | | | | | | | | | |
| | | | | | | | | | | |
| | | | PSE&G | | Power | | Other | | PSEG Consolidated | |
| | | | Millions | |
| | 2015 | | | | | | | | | |
| | Transmission and Distribution: | | | | | | | | | |
| | Electric Transmission | | $ | 7,554 |
| | $ | — |
| | $ | — |
| | $ | 7,554 |
| |
| | Electric Distribution | | 7,553 |
| | — |
| | — |
| | 7,553 |
| |
| | Gas Transmission | | 89 |
| | — |
| | — |
| | 89 |
| |
| | Gas Distribution | | 5,875 |
| | — |
| | — |
| | 5,875 |
| |
| | Construction Work in Progress | | 1,459 |
| | — |
| | — |
| | 1,459 |
| |
| | Plant Held for Future Use | | 26 |
| | — |
| | — |
| | 26 |
| |
| | Other | | 411 |
| | — |
| | — |
| | 411 |
| |
| | Total Transmission and Distribution | | 22,967 |
| | — |
| | — |
| | 22,967 |
| |
| | Generation: | | | | | | | | | |
| | Fossil Production | | — |
| | 7,005 |
| | — |
| | 7,005 |
| |
| | Nuclear Production | | — |
| | 2,202 |
| | — |
| | 2,202 |
| |
| | Nuclear Fuel in Service | | — |
| | 785 |
| | — |
| | 785 |
| |
| | Other Production-Solar | | 569 |
| | 389 |
| | — |
| | 958 |
| |
| | Construction Work in Progress | | — |
| | 892 |
| | — |
| | 892 |
| |
| | Total Generation | | 569 |
| | 11,273 |
| | — |
| | 11,842 |
| |
| | Other | | 196 |
| | 81 |
| | 408 |
| | 685 |
| |
| | Total | | $ | 23,732 |
| | $ | 11,354 |
| | $ | 408 |
| | $ | 35,494 |
| |
| | | | | | | | | | | |
|
| | | | | | | | | | | | | | | | | | |
| | | | | | | | | | | |
| | | | PSE&G | | Power | | Other | | PSEG Consolidated | |
| | | | Millions | |
| | 2017 | | | | | | | | | |
| | Transmission and Distribution: | | | | | | | | | |
| | Electric Transmission | | $ | 10,425 |
| | $ | — |
| | $ | — |
| | $ | 10,425 |
| |
| | Electric Distribution | | 8,455 |
| | — |
| | — |
| | 8,455 |
| |
| | Gas Distribution and Transmission | | 7,122 |
| | — |
| | — |
| | 7,122 |
| |
| | Construction Work in Progress | | 1,735 |
| | — |
| | — |
| | 1,735 |
| |
| | Other | | 512 |
| | — |
| | — |
| | 512 |
| |
| | Total Transmission and Distribution | | 28,249 |
| | — |
| | — |
| | 28,249 |
| |
| | Generation: | | | | | | | | | |
| | Fossil Production | | — |
| | 4,923 |
| | — |
| | 4,923 |
| |
| | Nuclear Production | | — |
| | 2,893 |
| | — |
| | 2,893 |
| |
| | Nuclear Fuel in Service | | — |
| | 745 |
| | — |
| | 745 |
| |
| | Other Production-Solar | | 593 |
| | 757 |
| | — |
| | 1,350 |
| |
| | Construction Work in Progress | | — |
| | 2,339 |
| | — |
| | 2,339 |
| |
| | Total Generation | | 593 |
| | 11,657 |
| | — |
| | 12,250 |
| |
| | Other | | 275 |
| | 98 |
| | 359 |
| | 732 |
| |
| | Total | | $ | 29,117 |
| | $ | 11,755 |
| | $ | 359 |
| | $ | 41,231 |
| |
| | | | | | | | | | | |
As part of its solar production portfolio, Power owns and operates two California-based solar facilities with an aggregate capacity of approximately 30 MW direct current whose output is sold to Pacific Gas and Electric Company (PG&E) under power purchase agreements (PPAs) with twenty year terms. The net book value of these solar facilities was approximately $57 million as of December 31, 2018. In January 2019, PG&E and its parent company PG&E Corporation filed for Chapter 11 bankruptcy protection. Power cannot predict the ultimate outcome that this bankruptcy proceeding will have on its ability to collect all of the future revenues from these facilities due under the PPAs; however, any adverse changes to the terms of Power’s PPAs as a result of this bankruptcy proceeding could result in the future impairment of these assets in amounts up to their current net book value.
PSE&G and Power have ownership interests in and are responsible for providing their respective shares of the necessary financing for the following jointly-owned facilities to which they are a party. All amounts reflect PSE&G’s or Power’s share of the jointly-owned projects and the corresponding direct expenses are included in the Consolidated Statements of Operations as operating expenses.Operating Expenses.
|
| | | | | | | | | | | | | | | | | | | | | |
| | | | | | | | | | | | | |
| | | | | | As of December 31, | |
| | | | | | 2016 | | 2015 | |
| | | | Ownership | | | | Accumulated | | | | Accumulated | |
| | | | Interest | | Plant | | Depreciation | | Plant | | Depreciation | |
| | | | | | Millions | |
| | PSE&G: | | | | | | | | | | | |
| | Transmission Facilities | | Various |
| | $ | 169 |
| | $ | 65 |
| | $ | 166 |
| | $ | 72 |
| |
| | Power: | | | | | | | | | | | |
| | Coal Generating: | | | | | | | | | | | |
| | Conemaugh | | 23 | % | | $ | 408 |
| | $ | 166 |
| | $ | 404 |
| | $ | 154 |
| |
| | Keystone | | 23 | % | | $ | 409 |
| | $ | 176 |
| | $ | 408 |
| | $ | 163 |
| |
| | Nuclear Generating: | | | | | | | | | | | |
| | Peach Bottom | | 50 | % | | $ | 1,272 |
| | $ | 306 |
| | $ | 1,219 |
| | $ | 262 |
| |
| | Salem | | 57 | % | | $ | 1,077 |
| | $ | 304 |
| | $ | 990 |
| | $ | 276 |
| |
| | Nuclear Support Facilities | | Various |
| | $ | 238 |
| | $ | 71 |
| | $ | 226 |
| | $ | 60 |
| |
| | Pumped Storage Facilities: | | | | | | | | | | | |
| | Yards Creek | | 50 | % | | $ | 42 |
| | $ | 25 |
| | $ | 42 |
| | $ | 24 |
| |
| | Merrill Creek Reservoir | | 14 | % | | $ | 1 |
| | $ | — |
| | $ | 1 |
| | $ | — |
| |
| | | | | | | | | | | | | |
|
| | | | | | | | | | | | | | | | | | | | | |
| | | | | | | | | | | | | |
| | | | | | As of December 31, | |
| | | | | | 2018 | | 2017 | |
| | | | Ownership | | | | Accumulated | | | | Accumulated | |
| | | | Interest | | Plant | | Depreciation | | Plant | | Depreciation | |
| | | | | | Millions | |
| | PSE&G: | | | | | | | | | | | |
| | Transmission Facilities | | Various |
| | $ | 162 |
| | $ | 58 |
| | $ | 162 |
| | $ | 58 |
| |
| | Power: | | | | | | | | | | | |
| | Coal Generating: | | | | | | | | | | | |
| | Conemaugh | | 23 | % | | $ | 417 |
| | $ | 192 |
| | $ | 408 |
| | $ | 178 |
| |
| | Keystone | | 23 | % | | $ | 416 |
| | $ | 200 |
| | $ | 409 |
| | $ | 187 |
| |
| | Nuclear Generating: | | | | | | | | | | | |
| | Peach Bottom | | 50 | % | | $ | 1,334 |
| | $ | 389 |
| | $ | 1,328 |
| | $ | 348 |
| |
| | Salem | | 57 | % | | $ | 1,196 |
| | $ | 333 |
| | $ | 1,147 |
| | $ | 277 |
| |
| | Nuclear Support Facilities | | Various |
| | $ | 244 |
| | $ | 95 |
| | $ | 239 |
| | $ | 81 |
| |
| | Pumped Storage Facilities: | | | | | | | | | | | |
| | Yards Creek | | 50 | % | | $ | 48 |
| | $ | 26 |
| | $ | 44 |
| | $ | 26 |
| |
| | Merrill Creek Reservoir | | 14 | % | | $ | 1 |
| | $ | — |
| | $ | 1 |
| | $ | — |
| |
| | | | | | | | | | | | | |
NOTES TO CONSOLIDATED FINANCIAL STATEMENTS
Power holds undivided ownership interests in the jointly-owned facilities above. Power is entitled to shares of the generating capability and output of each unit equal to its respective ownership interests. Power also pays its ownership share of additional construction costs, fuel inventory purchases and operating expenses. Power’s share of expenses for the jointly-owned facilities
NOTES TO CONSOLIDATED FINANCIAL STATEMENTS
is included in the appropriate expense category. Each owner is responsible for any financing with respect to its pro rata share of capital expenditures.
Power co-owns Salem and Peach Bottom with Exelon Generation. Power is the operator of Salem and Exelon Generation is the operator of Peach Bottom. A committee appointed by the co-owners provides oversight. Proposed O&M budgets and requests for major capital expenditures are reviewed and approved as part of the normal Power governance process.
GenOn Northeast Management Company is a co-owner and the operator for Keystone Generating Station and Conemaugh Generating Station. A committee appointed by the co-owners provides oversight. Proposed O&M budgets and requests for major capital expenditures are reviewed and approved as part of the normal Power governance process.
Power is a co-owner in the Yards Creek Pumped Storage Generation Facility. Jersey Central Power & Light Company (JCP&L) is also a co-owner and the operator of this facility. JCP&L submits separate capital and O&M budgets, subject to Power’s approval as part of the normal Power governance process.
Power is a minority owner in the Merrill Creek Reservoir and Environmental Preserve in Warren County, New Jersey. Merrill Creek Owners Group is the owner-operator of this facility. The operator submits separate capital and O&M budgets, subject to Power’s approval as part of the normal Power governance process.
Note 6.7. Regulatory Assets and Liabilities
PSE&G prepares its financial statements in accordance with GAAP for regulated utilities as described in Note 1. Organization, Basis of Presentation and Summary of Significant Accounting Policies. PSE&G has deferred certain costs based on rate orders issued by the BPU or FERC or based on PSE&G’s experience with prior rate cases.proceedings. Most of PSE&G’s Regulatory Assets and Liabilities as of December 31, 20162018 are supported by written orders, either explicitly or implicitly through the BPU’s treatment of various cost items. These costs will be recovered and amortized over various future periods.
Regulatory Assets and other investments and costs incurred under our various infrastructure filings and clause mechanisms are subject to prudence reviews and can be disallowed in the future by regulatory authorities. To the extent that collection of any infrastructure or clause mechanism revenue, Regulatory Assets or payments of Regulatory Liabilities is no longer probable, the amounts would be charged or credited to income.
NOTES TO CONSOLIDATED FINANCIAL STATEMENTS
PSE&G had the following Regulatory Assets and Liabilities: |
| | | | | | | | | | | | |
| | | | | | | | | |
| | | | As of December 31, | | | |
| | | | 2016 | | 2015 | | Recovery/Refund Period | |
| | | | Millions | | | |
| | Regulatory Assets | | | | | | | |
| | Current | | | | | | | |
| | New Jersey Clean Energy Program | | $ | 142 |
| | $ | 142 |
| | Annual filing for recovery (2) | |
| | Weather Normalization Clause (WNC) | | 49 |
| | 10 |
| | Annual filing for recovery (2) | |
| | Underrecovered Electric Energy Costs—Basic Generation Service | | 2 |
| | 11 |
| | Annual filing for recovery (1) (2) | |
| | Other | | 6 |
| | 1 |
| | Various | |
| | Total Current Regulatory Assets | | $ | 199 |
| | $ | 164 |
| | | |
| | Noncurrent | | | | | | | |
| | Pension and OPEB Costs | | $ | 1,403 |
| | $ | 1,270 |
| | Various | |
| | Deferred Income Taxes | | 507 |
| | 467 |
| | Various | |
| | Manufactured Gas Plant (MGP) Remediation Costs | | 403 |
| | 431 |
| | Various (2) | |
| | Storm Damage Deferrals | | 239 |
| | 233 |
| | To be determined | |
| | Electric Transmission and Gas Cost of Removal | | 189 |
| | 160 |
| | Through depreciation rates | |
| | Remediation Adjustment Charge (RAC) (Other SBC) | | 180 |
| | 174 |
| | Through 2022 (1) (2) | |
| | Conditional Asset Retirement Obligation | | 157 |
| | 152 |
| | Various | |
| | Green Program Recovery Charges (GPRC) | | 91 |
| | 104 |
| | Various (1) (2) | |
| | Unamortized Loss on Reacquired Debt and Debt Expense | | 61 |
| | 67 |
| | Over remaining debt life | |
| | Mark-to-Market (MTM) Contracts | | — |
| | 63 |
| | Through 2017 | |
| | Other | | 89 |
| | 75 |
| | Various | |
| | Total Noncurrent Regulatory Assets | | $ | 3,319 |
| | $ | 3,196 |
| | | |
| | Total Regulatory Assets | | $ | 3,518 |
| | $ | 3,360 |
| | | |
| | | | | | | | | |
NOTES TO CONSOLIDATED FINANCIAL STATEMENTS
|
| | | | | | | | | | |
| | | | | | | |
| | | | As of December 31, | |
| | | | 2018 | | 2017 | |
| | | | Millions | |
| | Regulatory Assets | | | | | |
| | Current | | | | | |
| | New Jersey Clean Energy Program | | $ | 143 |
| | $ | 128 |
| |
| | Electric Energy Costs—Basic Generation Service (BGS) | | 115 |
| | 23 |
| |
| | Storm Damage and Other | | 56 |
| | — |
| |
| | Green Program Recovery Charges (GPRC) | | 34 |
| | 8 |
| |
| | Weather Normalization Clause (WNC) | | 2 |
| | 40 |
| |
| | Other | | 39 |
| | 12 |
| |
| | Total Current Regulatory Assets | | $ | 389 |
| | $ | 211 |
| |
| | Noncurrent | | | | | |
| | Pension and OPEB Costs | | $ | 1,090 |
| | $ | 1,488 |
| |
| | Deferred Income Tax Regulatory Assets | | 896 |
| | 282 |
| |
| | Manufactured Gas Plant (MGP) Remediation Costs | | 321 |
| | 358 |
| |
| | Electric Transmission and Gas Cost of Removal | | 223 |
| | 199 |
| |
| | Storm Damage and Other | | 214 |
| | 241 |
| |
| | Remediation Adjustment Charge (RAC) (Other Societal Benefits Charge (SBC)) | | 175 |
| | 172 |
| |
| | Asset Retirement Obligation | | 166 |
| | 162 |
| |
| | GPRC | | 95 |
| | 98 |
| |
| | Unamortized Loss on Reacquired Debt and Debt Expense | | 49 |
| | 55 |
| |
| | Gas Costs—BGSS | | 31 |
| | 30 |
| |
| | Other | | 139 |
| | 137 |
| |
| | Total Noncurrent Regulatory Assets | | $ | 3,399 |
| | $ | 3,222 |
| |
| | Total Regulatory Assets | | $ | 3,788 |
| | $ | 3,433 |
| |
| | | | | | | |
|
| | | | | | | | | | | | |
| | | | | | | | | |
| | | | As of December 31, | | | |
| | | | 2016 | | 2015 | | Recovery/Refund Period | |
| | | | Millions | | | |
| | Regulatory Liabilities | | | | | | | |
| | Current | | | | | | | |
| | FERC Formula Rate True-up | | $ | 34 |
| | $ | 19 |
| | Annual filing for recovery (1) (2) | |
| | GPRC | | 28 |
| | 36 |
| | Annual filing for recovery (1) (2) | |
| | Gas Margin Adjustment Clause | | 11 |
| | 13 |
| | Annual filing for recovery (1) (2) | |
| | Overrecovered Gas Costs —Basic Gas Supply Service | | 6 |
| | 1 |
| | Annual filing for recovery (1) (2) | |
| | Overrecovered Non-Utility Generation Charge (NGC) | | 5 |
| | 1 |
| | Annual filing for recovery (1) (2) | |
| | Societal Benefit Clause (SBC) | | 4 |
| | 31 |
| | Various (1) (2) | |
| | Stranded Costs (including $42 in 2015 related to VIEs) | | — |
| | 64 |
| | Through December 2016 (2) | |
| | Total Current Regulatory Liabilities | | $ | 88 |
| | $ | 165 |
| | | |
| | Noncurrent | | | | | | | |
| | Electric Distribution Cost of Removal | | $ | 94 |
| | $ | 122 |
| | Through depreciation rates | |
| | MTM Contracts | | 20 |
| | — |
| | Various | |
| | FERC Formula Rate True-up | | 1 |
| | 49 |
| | Annual filing for recovery (1) (2) | |
| | Other | | 3 |
| | 4 |
| | Various | |
| | Total Noncurrent Regulatory Liabilities | | $ | 118 |
| | $ | 175 |
| | | |
| | Total Regulatory Liabilities | | $ | 206 |
| | $ | 340 |
| | | |
| | | | | | | | | |
|
| | | | | | | | | | |
| | | | | | | |
| | | | As of December 31, | |
| | | | 2018 | | 2017 | |
| | | | Millions | |
| | Regulatory Liabilities | | | | | |
| | Current | | | | | |
| | Deferred Income Tax Regulatory Liabilities | | $ | 299 |
| | $ | — |
| |
| | Gas Costs —BGSS | | — |
| | 30 |
| |
| | Gas Margin Adjustment Clause | | 8 |
| | 12 |
| |
| | Other | | 4 |
| | 5 |
| |
| | Total Current Regulatory Liabilities | | $ | 311 |
| | $ | 47 |
| |
| | Noncurrent | | | | | |
| | Deferred Income Tax Regulatory Liabilities | | $ | 3,170 |
| | $ | 2,868 |
| |
| | Electric Distribution Cost of Removal | | 51 |
| | 80 |
| |
| | Total Noncurrent Regulatory Liabilities | | $ | 3,221 |
| | $ | 2,948 |
| |
| | Total Regulatory Liabilities | | $ | 3,532 |
| | $ | 2,995 |
| |
| | | | | | | |
| |
(1) | Recovered/Refunded with interest. |
| |
(2) | Recoverable/Refundable per specific rate order. |
All Regulatory Assets and Liabilities are excluded from PSE&G’s rate base unless otherwise noted. The Regulatory Assets and Liabilities in the table above are defined as follows:
Conditional Asset Retirement Obligation: These costs represent the differences between rate regulatedrate-regulated cost of removal accounting and asset retirement accounting under GAAP. These costs will be recovered in future rates.rates as assets are retired.
NOTES TO CONSOLIDATED FINANCIAL STATEMENTS
Deferred Income Taxes:Tax Regulatory Assets: These amounts represent the portion of deferred income taxes that will be recovered or refunded through future rates, based upon established regulatory practices.practices and orders from the BPU.
Deferred Income Tax Regulatory Liabilities: These amounts represent the future refunds to customers of PSE&G’s excess Accumulated Deferred Income Tax liabilities as a result of the reduction in the federal corporate income tax rate effective January 1, 2018 and the flow-back of tax repair-related accumulated deferred income taxes that PSE&G agreed to as part of the settlement of its 2018 distribution base rate proceeding.
Electric and Gas Cost of Removal: PSE&G accrues and collects in rates for the cost of removing, dismantling and disposing of its transmission and distributionT&D assets upon retirement. The regulatory assetRegulatory Asset or liabilityLiability for non-legally required cost of removal represents the difference between amounts collected in rates and costs actually incurred.
FERC Formula Rate True-up:Electric Energy Costs Overcollection or undercollection of transmission earnings calculated using a FERC approved formula.
Gas Margin Adjustment Clause:— This mechanism credits Firm delivery customers for net distribution margin revenue collected from Transportation Gas Service Non-Firm (TSG-NF) delivery customers. The balance represents the difference between the net margin collected from the TSG-NF Customers versus bill credits provided to Firm delivery customers.
GPRC: These costs are amounts associated with various renewable energy and energy efficiency programs. Components of the GPRC include: Carbon Abatement, Energy Efficiency Economic Stimulus Program, Energy Efficiency Economic (EEE) Extension Program, EEE Extension II Program, the Demand Response Program, Solar Generation Investment Program (Solar 4 All), Solar 4 All Extension, Solar 4 All Extension II, Solar Loan II Program and Solar Loan III Program.
MGP Remediation Costs: Represents the low end of the range for the remaining environmental investigation and remediation program cleanup costs for manufactured gas plants that are probable of recovery in future rates. Once these costs are incurred, they are recovered through the RAC in the SBC.
MTM Contracts: The estimated fair value of gas hedge contracts and gas cogeneration supply contract. The regulatory asset/liability is offset by a derivative asset/liability and, with respect to the gas hedge contracts only, an intercompany receivable/payable on the Consolidated Balance Sheets.
NOTES TO CONSOLIDATED FINANCIAL STATEMENTS
New Jersey Clean Energy Program: The BPU approved future funding requirements for Energy Efficiency and Renewable Energy Programs through the first half of 2017. The BPU funding requirements are recovered through the SBC.
NGC:BGS: These costs represent the difference betweenover or under recovered amounts associated with BGS, as approved by the costBPU. Pursuant to BPU requirements, PSE&G serves as the supplier of non-utility generation andlast resort for electric customers within its service territory that are not served by another supplier. Pricing for those services are set by the benefit realized from the energy received at market rates.BPU as a pass-through, resulting in no margin for PSE&G’s operations. Over or under recovered balances with interest are returned or recovered through monthly filings.
Overrecovered Gas Costs:Costs—BGSS: These costs represent the overrecoveredover or under recovered amounts associated with Basic Gas Supply Service (BGSS),BGSS, as approved by the BPU. Pursuant to BPU requirements, PSE&G serves as the supplier of last resort for gas customers within its service territory that are not served by another supplier. Pricing for those services are set by the BPU as a pass-through, resulting in no margin for PSE&G’s operations. For BGSS, interestOver or under collected balances are returned or recovered through an annual filing. Interest is accrued only on overrecoveredover recovered balances.
Gas Margin Adjustment Clause: This mechanism credits Firm delivery customers for net distribution margin revenue collected from Transportation Gas Service Non-Firm (TSG-NF) delivery customers. The balance represents the difference between the net margin collected from the TSG-NF Customers versus bill credits provided to Firm delivery customers. Over or under recovered balances with interest are returned or recovered through the subsequent annual filing.
| |
| • | GPRC: This amount represents costs of the over or under collected balances associated with various renewable energy and energy efficiency programs. PSE&G files annually with the BPU for recovery of amounts that include a return on and of its investment over the lives of the underlying investments and capital assets which range from five to ten years. Interest is accrued monthly on any over or under recovered balances. Components of the GPRC include: Carbon Abatement, Energy Efficiency Economic Stimulus Program (EEE), EEE Extension Program, EEE Extension II Program, the Demand Response Program, Solar Generation Investment Program (Solar 4 All®), Solar 4 All® Extension, Solar 4 All® Extension II, Solar Loan II Program, Solar Loan III Program and the Energy Efficiency 2017 Program. |
MGP Remediation Costs: Represents the low end of the range for the remaining environmental investigation and remediation program cleanup costs for MGPs that are probable of recovery in future rates. Once these costs are incurred, they are recovered through the RAC in the SBC over a seven year period with interest.
New Jersey Clean Energy Program: The BPU approved future funding requirements for Energy Efficiency and Renewable Energy Programs through the first half of 2018. The BPU funding requirements are recovered through the SBC.
Pension and OPEB Costs: Pursuant to the adoption of accounting guidance for employers’ defined benefit pension and OPEB plans, PSE&G recorded the unrecognized costs for defined benefit pension and other OPEB plans on the balance sheet as a Regulatory Asset. These costs represent actuarial gains or losses and prior service costs and transition obligations as a result of adoption, which have not been expensed. These costs are amortized and recovered in future rates.
RAC (Other SBC): Costs incurred to clean up manufactured gas plantsMGPs which are recovered over seven years.years with interest through an annual filing.
SBC: The SBC, as authorized by the BPU and the New Jersey Electric Discount and Energy Competition Act, includes costs related to PSE&G’s electric and gas business as follows: (1) the Universal Service Fund (USF); (2) Energy Efficiency and Renewable Energy Programs; (3) Electric bad debt expense; and (4) the RAC for incurred MGP remediation expenditures. All components accrueOver or under recovered balances with interest on both over and underrecoveries.are to be returned or recovered through an annual filing.
NOTES TO CONSOLIDATED FINANCIAL STATEMENTS
Storm Damage Deferrals:and Other: CostsRepresents deferred costs, primarily comprised of storm costs incurred in the cleanup of major storms infrom 2010 through 2016. As of December 31, 2016, this includes the $220 million of storm costs, net of insurance recoveries, primarily as a result of Hurricane Irene and Superstorm Sandy, approved for recovery in a future base rate case proceeding under a BPU order received in September 2014.
Stranded Costs: As of December 31, 2015, the balance represented overrecovered costs,2018, which were collected by PSE&G as servicer on behalf of Transition Funding and Transition Funding II, respectively through the securitization transition charges authorized by the BPU in irrevocable financing. Collected funds were remitted to Transition Funding and Transition Funding II and used for interest and principal payments on the transition bonds and related costs and taxes. During 2015, Transition Funding and Transition Funding II paid their final securitization bond payments and as of December 31, 2015, no further debt or related costs remained. In 2016, PSE&G refunded over-collections from customers associated with Stranded Costs and as of December 31, 2016, there were no remaining Regulatory Assets or Liabilities associated with this program.are being amortized over five years.
Unamortized Loss on Reacquired Debt and Debt Expense: Represents losses on reacquired long-term debt and expenses associated with issuances of new debt, which are recovered through rates over the remaining life of the debt.
Underrecovered Electric Energy Costs: These costs represent the underrecovered amounts associated with BGS, as approved by the BPU. For BGS, interest is accrued on both overrecovered and underrecovered balances.
WNC: This represents the over-over or under- collectionunder recovery of gas margin refundable or recoverable underwhich is filed annually with the BPU’s weather normalization clause.BPU. The WNC requires PSE&G to calculate, at the end of each October-to-May period, the level by which margin revenues differed from what would have resulted if normal weather had occurred. Over recoveries are refundedreturned to customers in the next winter season while under recoveries (subject to an earnings cap) are collectedrecovered from customers in the next winter season.
Significant 20162018 regulatory orders received and currently pending rate filings with FERC and the BPU by PSE&G are as follows:
Electric and Gas Distribution Base Rate Filings—In October 2018, the BPU issued an Order approving the settlement of PSE&G’s distribution base rate proceeding with new rates effective November 1, 2018. The settlement resulted in a net reduction in overall annual revenues of approximately $13 million, comprised of a $212 million increase in base revenues, including recovery of deferred storm costs, offset by the return of tax benefits of approximately $225 million. The tax benefits include the flow-back to customers of excess accumulated deferred income taxes resulting from the reduction of the federal income tax rates provided in the Tax Cuts and Jobs Act of 2017 (Tax Act) as well as the accumulated deferred income taxes from previously realized tax repair deductions and tax benefits from future tax repair deductions as realized. The Order provided for a $9.5 billion rate base, a 9.6% return on equity for PSE&G’s distribution business and a 54% equity component of its capitalization structure. In addition to the $13 million annual revenue reduction, the Order provided for a $28 million one-time refund to customers in November and December 2018 for taxes collected at the higher federal income tax rate for the January 1 to March 31, 2018 period. Previously, the BPU had approved a rate reduction effective April 1, 2018, to PSE&G’s then current electric and gas base rates of approximately $71 million and $43 million, respectively, on an annual basis, to reflect the lower federal income tax rate for the period April 1 and forward. As a result of the agreement to flow back tax repair-related accumulated deferred income taxes in the settlement, PSE&G has recognized a Regulatory Liability and a corresponding Regulatory Asset.
Transmission Formula Rate Filings—In June 2016,October 2018, PSE&G made two FERC filings with respect to its Transmission Formula Rate. PSE&G filed its 20152019 Annual Transmission Formula Rate Update with FERC requesting new rates for 2019 with an effective date of January 1, 2019. In addition, PSE&G filed a Section 205 filing that sought FERC approval to modify its existing Formula Rate template in order to refund approximately $114 million of transmission-related “unprotected excess deferred income tax benefits” in 2019. In December 2018, FERC approved PSE&G’s Section 205 filing, subject to the submission of a compliance filing which was submitted to FERC in January 2019. As a result, PSE&G filed a revised 2019 Annual Transmission Formula Rate Update to include the refund of the approved excess deferred income tax benefits. The revised 2019 Annual Transmission Formula Rate, as filed with FERC in January 2019, decreases overall annual transmission revenues by approximately $54 million, subject to true-up.
In June 2018, PSE&G filed its 2017 true-up adjustment pertaining to its transmission formula rates in effect for 2015.2017. This resulted in an adjustment of $34$27 million lessmore than the 20152017 originally filed revenues, primarily due to the impact of bonus depreciation legislation enacted after PSE&G filed its 2015 formula rate requirement in October 2014.which PSE&G had primarily recognized the majority of this adjustment in its Consolidated Statement of Operations for the year ended December 31, 2015. For the year ended December 31, 2016, PSE&G does not anticipate a significant true-up adjustment to its 2016 Annual Formula rate. That true-up will be filed
NOTES TO CONSOLIDATED FINANCIAL STATEMENTS
by no later than June 15, 2017. In October 2016, the 2017 Annual Formula Rate Update was filed with FERC and requests approximately $121 million in increased annual transmission revenues effective January 1, 2017, subject to true-up.
Energy Strong Recovery Filing—In March and September of each year, PSE&G files with the BPU for base rate recovery of Energy Strong investments which include a return of and on its investment. In June 2016, PSE&G updated its March cost recovery petition to include Energy Strong investments in service as of May 31, 2016 which represents estimated annual increases in electric and gas revenues of $16 million and $23 million, respectively. In August 2016, the BPU approved these rate increases effective September 1, 2016.
In September 2016, PSE&G filed its Energy Strong electric cost recovery petition seeking BPU approval to recover the revenue requirements associated with Energy Strong capitalized investment costs placed in service from June 1, 2016 through November 30, 2016. In February 2017, the BPU approved PSE&G’s request for an annualized increase in electric revenue requirements of $12 million with rates effective March 1, 2017.
Gas System Modernization Program (GSMP)I (GSMP I)—In December 2016,2018, the BPU approved recovery of PSE&G’s GSMP I capital investment recovery petition for an annual gas revenue requirement increase of $21 million effective January 1, 2019.
RAC—In January 2019, PSE&G updated its RAC 26 recovery request with the BPU seeking recovery of $73 million of net MGP costs from August 1, 2017 through July 31, 2018. This matter is pending. In October 2018, the BPU approved PSE&G’s initial annual GSMP costfiling with respect to its RAC 25 petition allowing recovery petition which results in an annual revenue increase of $10$63 million effective JanuaryNovember 1, 2017. This increase represents the return of and on investment for GSMP infrastructure in service2018 related to MGP expenditures from August 1, 2016 through September 30, 2016.July 31, 2017.
Green Program Recovery Charges (GPRC)GPRC—Each year PSE&G files withIn October 2018, the BPU for annual recovery of its Green Program investments which include a return on its investment and recovery of expenses. In July 2016,approved PSE&G filed its 2016&G’s 2017 GPRC cost recovery petition requesting recovery for the nine combined components of the electric and gas GPRC. In September 2016, the BPU approved rates on a provisional basis effective October 1, 2016 designed to recover approximately $44$58 million and $13$15 million in electric and gas revenues, respectively, on an annual basis associated with PSE&G’s implementation of these BPU approved programs.basis.
In June 2018, PSE&G filed its 2018 GPRC cost recovery petition requesting recovery of approximately $65 million and $6 million in electric and gas revenues, respectively, on an annual basis.
NOTES TO CONSOLIDATED FINANCIAL STATEMENTS
Energy Strong Program I (ES I) Recovery Filing—In August 2018, the BPU approved recovery of PSE&G’s ES I capital investment petition for an annual revenue requirement increase of $0.6 million and $0.1 million associated with electric and gas investment costs, respectively. This represents the final recovery of electric and gas ES I capital investment costs consistent with the BPU Order of Approval of the Energy Strong Program.
In February 2018, the BPU approved recovery of an annual revenue requirement of $8 million associated with electric ES I capital investment costs placed in service from June 1, 2017 through November 2016,30, 2017.
WNC—In October 2018, the BPU approved PSE&G’s 2017-2018 WNC petition for a Solar 4 All Extension II Program for an additional 33 MWs of solar development on brownfields and closed landfills. The order allows PSE&G to extend the program under the same clause recovery process as its existing Solar 4 All Programs, with an estimated initial capital investment (excluding AFUDC) of approximately $80 million with a 9.75% ROE. The Solar 4 All Extension II Program is the tenth component of the GPRC.
BGSS—In June 2016, PSE&G made its annual BGSS filing with the BPU requesting a reduction of $87 million in annual BGSS revenues. In September 2016, the BPU approved a Stipulation in this matter on a provisional basis andallowing a net recovery of $14 million to be collected over the BGSS rate was reduced from approximately 40 cents to 34 cents per therm effective October 1, 2016. The rate is subject to final settlement. In December 2016, PSE&G filed2018-2019 Winter Period with the BPU for a self-implementing two-month bill creditnew rate effective November 1, 2018. The $14 million net recovery is the result of 7.5 cents per therm for$9 million of excess revenues from the monthscolder than normal 2017-2018 Winter Period offset by $23 million of January and February 2017. remaining prior Winter Period undercollection.
In February 2017, PSE&G filed withApril 2018, the BPU to extend the self-implementing bill credit of 7.5 cents per therm to customers through March 2017. The 3-month bill credits are estimated to provide approximately $47 million in customer credits. The specific amount returned will depend on actual usage over that period.
Weather Normalization Clause—In July 2016, PSE&G filed a petition requestinggave final approval to PSE&G’s petition to collect $54$55 million in net deficiency gas revenues as a result of the warmer than normal 2016-2017 Winter Period, which resulted in a deficiency of $31 million, plus a carryover balance of $24 million from the 2015-2016 Winter Period. The deficiency gas revenues would be collected from customers over the 2016-2017 and 2017-2018 Winter Periods (October 1 through May 31).
SBC—In September 2016,February 2018, the BPU approved PSE&G’s filingpetition to increase electric rates by approximately $20 million on a provisionalan annual basis with respectand to decrease gas rates by approximately $0.8 million on an annual basis, in order to recover electric and gas costs incurred through May 31, 2017 under its Energy Efficiency and Renewable Energy and Social Programs. The new rates were effective April 1, 2018.
BGSS—In September 2018, the $54 million in deficiencyBPU provisionally approved PSE&G’s request to decrease its BGSS rates which will decrease annual BGSS revenues by $26 million. The BGSS rate decreased from approximately 37 cents to be collected from35 cents per therm for residential gas customers effective October 1, 2016. This matter is pending.2018.
Remediation Adjustment Charge (RAC)—In April 2016,2018, the BPU approved PSE&G’s filing with respect to its RAC 23 petition allowing recovery of $54 million effective May 7, 2016 related to net Manufactured Gas Plant expenditures from August 1, 2014 through July 31, 2015. In November 2016, PSE&G filed a RAC 24 Petition with the BPU requesting recovery of $41 million of net Manufactured Gas Plant expenditures from August 1, 2015 through July 31, 2016. This matter is pending.
Universal Service Fund (USF)/Lifeline—In September 2016, the BPU approvedfinal BGSS rates set to recover state-wide costs incurred by New Jersey electric and gas distribution companies under the State’s USF/Lifeline energy assistance programswhich were effective October 1, 2016. PSE&G earns no margin on the collection of the USF and Lifeline programs resulting in no impact on its Consolidated Statement of Operations.2017.
NOTES TO CONSOLIDATED FINANCIAL STATEMENTS
Note 7.8. Long-Term Investments
Long-Term Investments as of December 31, 20162018 and 20152017 included the following:
|
| | | | | | | | | | |
| | | | | | | |
| | | | As of December 31, | |
| | | | 2016 | | 2015 | |
| | | | Millions | |
| | PSE&G | | | | | |
| | Life Insurance and Supplemental Benefits | | $ | 140 |
| | $ | 150 |
| |
| | Solar Loans | | 159 |
| | 175 |
| |
| | Other Investments | | — |
| | 5 |
| |
| | Power | | | |
| | Partnerships and Corporate Joint Ventures (Equity Method Investments) (A) | | 102 |
| | 119 |
| |
| | Energy Holdings | | | | | |
| | Lease Investments | | 649 |
| | 784 |
| |
| | Total Long-Term Investments | | $ | 1,050 |
| | $ | 1,233 |
| |
| | | | | | | |
|
| | | | | | | | | | |
| | | | | | | |
| | | | As of December 31, | |
| | | | 2018 | | 2017 | |
| | | | Millions | |
| | PSE&G | | | | | |
| | Life Insurance and Supplemental Benefits | | $ | 121 |
| | $ | 130 |
| |
| | Solar Loans | | 149 |
| | 150 |
| |
| | Power | | | |
| | Partnerships and Corporate Joint Ventures (Equity Method Investments) (A) | | 86 |
| | 87 |
| |
| | Energy Holdings | | | | | |
| | Lease Investments | | 540 |
| | 565 |
| |
| | Total Long-Term Investments | | $ | 896 |
| | $ | 932 |
| |
| | | | | | | |
| |
| (A) | During the three years ended December 31, 2016, 20152018, 2017 and 20142016, dividends from these investments were $1816 million, $1618 million and $1718 million, respectively. |
Leases
Energy Holdings, through several of its indirect subsidiary companies, has investments in domestic energy and real estate assets subject primarily to leveraged lease accounting. A leveraged lease is typically comprised of an investment by an equity investor and debt provided by a third-party debt investor. The debt is recourse only to the assets subject to lease and is not included on PSEG’s Consolidated Balance Sheets. As an equity investor, Energy Holdings’ equity investments in the leases are comprised of the total expected lease receivables over the lease terms plus the estimated residual values at the end of the lease terms, reduced for any income not yet earned on the leases. This amount is included in Long-Term Investments on PSEG’s Consolidated Balance Sheets. The more rapid depreciation of the leased property for tax purposes creates tax cash flow that will be repaid to the taxing authority in later periods. As such, the liability for such taxes due is recorded in Deferred Income Taxes on PSEG’s Consolidated Balance Sheets.
During the third quarter of 2016, Energy Holdings completed its annual review of estimated residual values embedded in theNOTES TO CONSOLIDATED FINANCIAL STATEMENTS
Due to liquidity issues facing NRG REMA, LLC (REMA) leveraged leases. The outcome indicated that the revised residual value estimates were lower than
the recorded residual values and the decline was deemedprior to be other than temporary due to the adverseits emergence from bankruptcy protection, economic conditions
experienced bychallenges facing coal generation in PJM as discussed in Note 3.4. Early Plant Retirements, negatively impacting the economic
outlookand based upon ongoing reviews of the leased assets. As a result, aavailable alternatives as well as certain discussions with REMA management leading up to and in connection with REMA’s bankruptcy, Energy Holdings recorded pre-tax write-downcharges of $20 million, $77 million and $147 million in 2018, 2017 and 2016, respectively. Included in these charges were residual value impairments of $7 million and $137 million wasin 2017 and 2016, respectively. Pre-tax charges were reflected in Operating Revenues in the
quarter ended September 30, 2016, calculated by comparing the gross investment in the leases beforeeach year and after the revised
residual estimates. During the fourth quarter of 2016, Energy Holdings recorded a $10 million charge for its best estimate of loss as a result of the current liquidity issues facing REMA, which was reflected in Operating Revenues and isare included in Gross InvestmentsInvestment in Leases as of December 31, 2016. For additional information, see Note 8. Financing Receivables.2018.
In December 2018, REMA emerged from its in-court proceeding under Chapter 11 of the Bankruptcy Code. Upon emergence, PSEG received $31.5 million in cash in exchange for transferring the ownership interests in Keystone and Conemaugh to the debtholders of REMA and satisfaction of all other claims asserted against REMA, as well as certain amendments to the Shawville lease. The Shawville lease amendments, among other things, will allow REMA to express interest in a renewal on or after November 24, 2019. In addition, REMA has agreed to fund qualifying credit support up to $36 million. As a result of the restructuring, Energy Holdings recognized a pre-tax gain in Operating Revenues of approximately $12 million ($9 million after tax). In addition, the remaining deferred tax liabilities related to these lease investments were reclassified to current tax liabilities. PSEG expects to pay approximately $120 million to taxing authorities in 2019 resulting from this restructuring activity.
The following table shows Energy Holdings’ gross and net lease investment as of December 31, 20162018 and 2015, respectively.2017.
|
| | | | | | | | | | |
| | | | | | | |
| | | | As of December 31, | |
| | | | 2016 | | 2015 | |
| | | | Millions | |
| | Lease Receivables (net of Non-Recourse Debt) | | $ | 629 |
| | $ | 631 |
| |
| | Estimated Residual Value of Leased Assets | | 346 |
| | 519 |
| |
| | Total Investment in Rental Receivables | | 975 |
| | 1,150 |
| |
| | Unearned and Deferred Income | | (326 | ) | | (366 | ) | |
| | Gross Investments in Leases | | 649 |
| | 784 |
| |
| | Deferred Tax Liabilities | | (674 | ) | | (724 | ) | |
| | Net Investments in Leases | | $ | (25 | ) | | $ | 60 |
| |
| | | | | | | |
|
| | | | | | | | | | |
| | | | | | | |
| | | | As of December 31, | |
| | | | 2018 | | 2017 | |
| | | | Millions | |
| | Lease Receivables (net of Non-Recourse Debt) | | $ | 504 |
| | $ | 546 |
| |
| | Estimated Residual Value of Leased Assets | | 326 |
| | 326 |
| |
| | Total Investment in Rental Receivables | | 830 |
| | 872 |
| |
| | Unearned and Deferred Income | | (290 | ) | | (307 | ) | |
| | Gross Investments in Leases | | 540 |
| | 565 |
| |
| | Deferred Tax Liabilities | | (354 | ) | | (480 | ) | |
| | Net Investments in Leases | | $ | 186 |
| | $ | 85 |
| |
| | | | | | | |
NOTES TO CONSOLIDATED FINANCIAL STATEMENTS
35% to 21%, effective January 1, 2018. PSEG is subject to ASC 740, which requires that the effect on deferred tax assets and liabilities of a change in tax rates be recognized in the period the tax rate was enacted. The impact of the reduced tax rate is the primary reason for the decrease in Deferred Tax Liabilities. For additional information, see Note 21. Income Taxes.
The pre-tax income (loss) and income tax effects related to investments in leases, excluding gains and losses on sales related to investments in leasesand the impacts of the Tax Act, were as follows:
|
| | | | | | | | | | | | | | |
| | | | | | | | | |
| | | | Years Ended December 31, | |
| | | | 2016 | | 2015 | | 2014 | |
| | | | Millions | |
| | Pre-Tax Income (Loss) from Leases | | $ | (135 | ) | | $ | 12 |
| | $ | 24 |
| |
| | Income Tax Expense (Benefit) on Income from Leases | | $ | (51 | ) | | $ | 5 |
| | $ | 32 |
| |
| | | | | | | | | |
|
| | | | | | | | | | | | | | |
| | | | | | | | | |
| | | | Years Ended December 31, | |
| | | | 2018 | | 2017 | | 2016 | |
| | | | Millions | |
| | Pre-Tax Income (Loss) from Leases | | $ | 17 |
| | $ | (69 | ) | | $ | (135 | ) | |
| | Income Tax Expense (Benefit) on Income from Leases | | $ | 6 |
| | $ | (26 | ) | | $ | (51 | ) | |
| | | | | | | | | |
Equity Method Investments
Power had the following equity method investments as of December 31, 20162018 and 2015:2017:
|
| | | | | | | | | | | | | |
| | | | | | | | |
| | | As of December 31, | | | | | |
| | Name | 2016 | | 2015 | | Location | | % Owned | |
| | | Millions | | | | | |
| | Power | | | | | | | | |
| | Keystone Fuels, LLC | $ | 7 |
| | $ | 16 |
| | PA | | 23% | |
| | Conemaugh Fuels, LLC | $ | 8 |
| | $ | 14 |
| | PA | | 23% | |
| | PennEast Pipeline | $ | 11 |
| | $ | 5 |
| | PA | | 10% | |
| | Kalaeloa | $ | 76 |
| | $ | 84 |
| | HI | | 50% | |
| | | | | | | | | | |
|
| | | | | | | | | | | | | | |
| | | | | | | | | |
| | | | As of December 31, | | | | | |
| | Name | | 2018 | | 2017 | | Location | | % Owned | |
| | | | Millions | | | | | |
| | Power | | | | | | | | | |
| | Keystone Fuels, LLC | | $ | 9 |
| | $ | 8 |
| | PA | | 23% | |
| | Conemaugh Fuels, LLC | | 8 |
| | 8 |
| | PA | | 23% | |
| | Kalaeloa | | 69 |
| | 71 |
| | HI | | 50% | |
| | Total | | $ | 86 |
| | $ | 87 |
| | | | | |
| | | | | | | | | | | |
NOTES TO CONSOLIDATED FINANCIAL STATEMENTS
Note 8.9. Financing Receivables
PSE&G
PSE&G sponsors a solar loan program designed to help finance the installation of solar power systems throughout its electric service area. Interest income on the loans is recorded on an accrual basis. The loans are generally paid back with solar renewable energy certificates (SRECs) generated from the installed solar electric system. In the event of a loan default, the basis of the solar loan would be recovered through a regulatory recovery mechanism. None of the solar loans are impaired; however, in the event a loan becomes impaired, the basis of the loan would be recovered through a regulatory recovery mechanism. A substantial portion of these amounts are noncurrent and reported in Long-Term Investments on PSEG’s and PSE&G’s Consolidated Balance Sheets. The following table reflects the outstanding loans including the noncurrent portion reported in Note 7. Long-Term Investments, by class of customer, none of which would be considered “non-performing.”
|
| | | | | | | | | | |
| | | | | | | |
| | Outstanding Loans by Class of Customer | |
| | | | As of December 31, | |
| | Consumer Loans | | 2016 | | 2015 | |
| | | | Millions | |
| | Commercial/Industrial | | $ | 164 |
| | $ | 177 |
| |
| | Residential | | 11 |
| | 12 |
| |
| | Total | | $ | 175 |
| | $ | 189 |
| |
| | | | | | | |
|
| | | | | | | | | | |
| | | | | | | |
| | Outstanding Loans by Class of Customer | |
| | | | As of December 31, | |
| | Consumer Loans | | 2018 | | 2017 | |
| | | | Millions | |
| | Commercial/Industrial | | $ | 164 |
| | $ | 158 |
| |
| | Residential | | 9 |
| | 10 |
| |
| | Total | | $ | 173 |
| | $ | 168 |
| |
| | Current Portion (included in Other Current Assets) | | (24 | ) | | (18 | ) | |
| | Noncurrent Portion (included in Long-Term Investments) | | $ | 149 |
| | $ | 150 |
| |
| | | | | | | |
Energy Holdings
Energy Holdings had a net investment in domestic energy and real estate assets subject to leveraged lease accounting of $(25)$186 million as of December 31, 20162018 and $60$85 million as of December 31, 20152017 (See Note 7.8. Long-Term Investments).
NOTES TO CONSOLIDATED FINANCIAL STATEMENTS
The corresponding receivables associated with the lease portfolio are reflected as follows, net of non-recourse debt. The ratings in the table represent the ratings of the entities providing payment assurance to Energy Holdings.
|
| | | | | | |
| | | | | |
| | | | Lease Receivables, Net of Non-Recourse Debt | |
| | Counterparties’ Credit Rating Standard & Poor’s (S&P) as of December 31, 2016 | | As of December 31, 2016 | |
| | | | Millions | |
| | AA | | $ | 16 |
| |
| | BBB+ — BBB- | | 316 |
| |
| | BB- | | 133 |
| |
| | CCC | | 164 |
| |
| | Total | | $ | 629 |
| |
| | | | | |
|
| | | | | | |
| | | | | |
| | | | Lease Receivables, Net of Non-Recourse Debt | |
| | Counterparties’ Credit Rating Standard & Poor’s (S&P) as of December 31, 2018 | | As of December 31, 2018 | |
| | | | Millions | |
| | AA | | $ | 14 |
| |
| | BBB+ — BBB- | | 316 |
| |
| | BB | | 133 |
| |
| | NR | | 41 |
| |
| | Total | | $ | 504 |
| |
| | | | | |
The “BB-”“BB” and the “CCC”“NR” ratings in the preceding table represent lease receivables related to coal and gas-fired assets in Illinois and Pennsylvania, respectively. As of December 31, 2016,2018, the gross investment in the leases of such assets, net of non-recourse debt, was $426$296 million, ($(131)10 million, net of deferred taxes). A more detailed description of such assets under lease is presented in the following table.follows:
|
| | | | | | | | | | | | | | | | | | | | |
| | | | | | | | | | | | | | | | | |
| | Asset | | Location | | Gross Investment | | % Owned | | Total MW | | Fuel Type | | Counterparties’ S&P Credit Ratings | | Counterparty | |
| | | | | | Millions | | | | | | | | | | | |
| | Powerton Station Units 5 and 6 | | IL | | $ | 134 |
| | 64 | % | | 1,538 |
| | Coal | | BB- | | NRG Energy, Inc. | |
| | Joliet Station Units 7 and 8 | | IL | | $ | 83 |
| | 64 | % | | 1,036 |
| | Gas | | BB- | | NRG Energy, Inc. | |
| | Keystone Station Units 1 and 2 | | PA | | $ | 55 |
| | 17 | % | | 1,711 |
| | Coal | | CCC (A) | | REMA | |
| | Conemaugh Station Units 1 and 2 | | PA | | $ | 55 |
| | 17 | % | | 1,711 |
| | Coal | | CCC (A) | | REMA | |
| | Shawville Station Units 1, 2, 3 and 4 | | PA | | $ | 99 |
| | 100 | % | | 596 |
| | Gas | | CCC (A) | | REMA | |
| | | | | | | | | | | | | | | | | |
|
| | | | | | | | | | | | | | | | | | | | |
| | | | | | | | | | | | | | | | | |
| | Asset | | Location | | Gross Investment | | % Owned | | Total MW | | Fuel Type | | Counterparties’ S&P Credit Ratings | | Counterparty | |
| | | | | | Millions | | | | | | | | | | | |
| | Powerton Station Units 5 and 6 | | IL | | $ | 133 |
| | 64 | % | | 1,538 |
| | Coal | | BB | | NRG Energy, Inc. | |
| | Joliet Station Units 7 and 8 | | IL | | $ | 85 |
| | 64 | % | | 1,036 |
| | Gas | | BB | | NRG Energy, Inc. | |
| | Shawville Station Units 1, 2, 3 and 4 | | PA | | $ | 78 |
| | 100 | % | | 596 |
| | Gas | | NR | | REMA (A) | |
| | | | | | | | | | | | | | | | | |
| |
| (A) | REMA’s parent company, GenOn Energy Inc. (GenOn), reported in August 2016 that GenOn did not expect to have sufficient liquidity to repay its senior unsecured notes due in June 2017. In January 2017, S&P further lowered its corporate credit rating on GenOn and its affiliates (including REMA) to “CCC - “REMA emerged from “CCC” reflecting the primary credit concernChapter 11 of the near-term maturity of GenOn’s senior unsecured notesU.S. Bankruptcy Code in June 2017 and expressed a negative outlook reflecting the continuing pressure on financial measures. In October 2016, Moody’s downgraded the GenOn Corporate Family Rating to “Caa3” to reflect its high debt burden relative to cash flow.December 2018. For additional information, see Note 8. Long-Term Investments. |
NOTES TO CONSOLIDATED FINANCIAL STATEMENTS
The credit exposure for lessors is partially mitigated through various credit enhancement mechanisms within the lease structures. These credit enhancement features vary from lease to lease and may include letters of credit or affiliate guarantees.lease. Upon the occurrence of certain defaults, indirect subsidiary companies of Energy Holdings would exercise their rights and seek recovery of their investment, potentially including stepping into the lease directly to protect their investments. While these actions could ultimately protect or mitigate the loss of value, they could require the use of significant capital and trigger certain material tax obligations which could, for certain leases, wholly or partially be mitigated by tax indemnification claims against the counterparty. A bankruptcy of a lessee would likely delay and potentially limit any efforts on the part of the lessors to assert their rights upon default and could delay the monetization of claims. Failure to recover adequate value could ultimately lead to a foreclosure on the assets under lease by the lenders. Although all lease payments are current, PSEG cannot predict the outcome of GenOn’s efforts to restructure its portfolio and improve its liquidity and the possible related impact on REMA. PSEG continues to monitor any changes to REMA’s and GenOn’s status and potential impacts on Energy Holdings’ lease investments. If lease rejections or foreclosures were to occur, Energy Holdings could potentially record a pre-tax write-off up to its gross investment in these facilities and may also be required to pay significant cash tax liabilities to the Internal Revenue Service.
NOTES TO CONSOLIDATED FINANCIAL STATEMENTS
Additional factors that may impact future lease cash flows include, but are not limited to, new environmental legislation and regulation regarding air quality, water and other discharges in the process of generating electricity, market prices for fuel, electricity and capacity, overall financial condition of lease counterparties and their affiliates and the quality and condition of assets under lease.
Note 9. Available-for-Sale Securities10. Trust Investments
NDT Fund
In accordance with NRC regulations, entities owning an interest in nuclear generating facilities are required to determine the costs and funding methods necessary to decommission such facilities upon termination of operation. As a general practice, each nuclear owner places funds in independent external trust accounts it maintains to provide for decommissioning. Power is required to file periodic reports with the NRC demonstrating that its NDT Fund meets the formula-based minimum NRC funding requirements.
Power maintains an external master NDT to fund its share of decommissioning for its five nuclear facilities upon their respective termination of operation. The trust contains two separate funds: a qualified fund and a non-qualified fund. Section 468A of the Internal Revenue Code limits the amount of money that can be contributed into a qualified fund. Power’s share of decommissioning costs related to its five nuclear units was estimated to be between $2.8 billion and $3.0 billion, including contingencies. The liability for decommissioning recorded on a discounted basis as of December 31, 20162018 was approximately $454708 million and is included in the Asset Retirement Obligation. The funds are managed by third-party investment managers who operate under investment guidelines developed by Power.
Power classifies investments in the NDT Fund as available-for-sale. The following tables show the fair values and gross unrealized gains and losses for the securities held in the NDT Fund.
|
| | | | | | | | | | | | | | | | | | |
| | | | | | | | | | | |
| | | | As of December 31, 2016 | |
| | | | Cost | | Gross Unrealized Gains | | Gross Unrealized Losses | | Fair Value | |
| | | | Millions | |
| | Equity Securities | | $ | 705 |
| | $ | 263 |
| | $ | (11 | ) | | $ | 957 |
| |
| | Debt Securities | | | | | | | | | |
| | Government | | 518 |
| | 8 |
| | (6 | ) | | 520 |
| |
| | Corporate | | 337 |
| | 4 |
| | (4 | ) | | 337 |
| |
| | Total Debt Securities | | 855 |
| | 12 |
| | (10 | ) | | 857 |
| |
| | Other Securities | | 44 |
| | — |
| | — |
| | 44 |
| |
| | Total NDT Available-for-Sale Securities (A) | | $ | 1,604 |
| | $ | 275 |
| | $ | (21 | ) | | $ | 1,858 |
| |
| | | | | | | | | |
|
| |
| |
(A) | The NDT available-for-sale securities table excludes cash of $1 million which is part of the NDT Fund. |
|
| | | | | | | | | | | | | | | | | | |
| | | | | | | | | | | |
| | | | As of December 31, 2015 | |
| | | | Cost | | Gross Unrealized Gains | | Gross Unrealized Losses | | Fair Value | |
| | | | Millions | |
| | Equity Securities | | $ | 693 |
| | $ | 185 |
| | $ | (13 | ) | | $ | 865 |
| |
| | Debt Securities | | | | | | | | | |
| | Government | | 483 |
| | 8 |
| | (3 | ) | | 488 |
| |
| | Corporate | | 366 |
| | 3 |
| | (10 | ) | | 359 |
| |
| | Total Debt Securities | | 849 |
| | 11 |
| | (13 | ) | | 847 |
| |
| | Other Securities | | 42 |
| | — |
| | — |
| | 42 |
| |
| | Total NDT Available-for-Sale Securities | | $ | 1,584 |
| | $ | 196 |
| | $ | (26 | ) | | $ | 1,754 |
| |
| | | | | | | | | | | |
Table of Contents |
| | | | | | | | | | | | | | | | | | |
| | | | | | | | | | | |
| | | | As of December 31, 2018 | |
| | | | Cost | | Gross Unrealized Gains | | Gross Unrealized Losses | | Fair Value | |
| | | | Millions | |
| | Equity Securities | | | | | | | | | |
| | Domestic | | $ | 447 |
| | $ | 153 |
| | $ | (29 | ) | | $ | 571 |
| |
| | International | | 323 |
| | 36 |
| | (30 | ) | | 329 |
| |
| | Total Equity Securities | | 770 |
| | 189 |
| | (59 | ) | | 900 |
| |
| | Available-for Sale Debt Securities | | | | | | | | | |
| | Government | | 498 |
| | 2 |
| | (9 | ) | | 491 |
| |
| | Corporate | | 501 |
| | 1 |
| | (15 | ) | | 487 |
| |
| | Total Available-for-Sale Debt Securities | | 999 |
| | 3 |
| | (24 | ) | | 978 |
| |
| | Total NDT Fund Investments | | $ | 1,769 |
| | $ | 192 |
| | $ | (83 | ) | | $ | 1,878 |
| |
| | | | | | | | | |
|
| |
NOTES TO CONSOLIDATED FINANCIAL STATEMENTS
|
| | | | | | | | | | | | | | | | | | | |
| | | | | | | | | | | |
| | | | As of December 31, 2017 | |
| | | | Cost | | Gross Unrealized Gains | | Gross Unrealized Losses | | Fair Value | |
| | | | Millions | |
| | Equity Securities | | | | | | | | | |
| | Domestic | | $ | 497 |
| | $ | 245 |
| | $ | (2 | ) | | $ | 740 |
| |
| | International | | 311 |
| | 99 |
| — |
| (3 | ) | | 407 |
| |
| | Total Equity Securities | | 808 |
| | 344 |
| | (5 | ) | | 1,147 |
| |
| | Available-for Sale Debt Securities | | | | | | | | | |
| | Government | | 586 |
| | 2 |
| | (4 | ) | | 584 |
| |
| | Corporate | | 400 |
| | 4 |
| | (2 | ) | | 402 |
| |
| | Total Available-for-Sale Debt Securities | | 986 |
| | 6 |
| | (6 | ) | | 986 |
| |
| | Total NDT Fund Investments | | $ | 1,794 |
| | $ | 350 |
| | $ | (11 | ) | | $ | 2,133 |
| |
| | | | | | | | | | | |
Net unrealized gains (losses) on debt securities of $(12) million (after-tax) were included in Accumulated Other Comprehensive Loss on PSEG’s and Power’s Consolidated Balance Sheets as of December 31, 2018. The portion of net unrealized gains (losses) recognized during 2018 related to equity securities still held at the end of December 31, 2018 was $(127) million.
The amounts in the preceding tables do not include receivables and payables for NDT Fund transactions which have not settled at the end of each period. Such amounts are included in Accounts Receivable and Accounts Payable on the Consolidated Balance Sheets as shown in the following table.
|
| | | | | | | | | | |
| | | | | | | |
| | | | As of December 31, 2016 | | As of December 31, 2015 | |
| | | | Millions | |
| | Accounts Receivable | | $ | 8 |
| | $ | 17 |
| |
| | Accounts Payable | | $ | 5 |
| | $ | 10 |
| |
| | | | | | | |
|
| | | | | | | | | | |
| | | | | | | |
| | | | As of December 31, 2018 | | As of December 31, 2017 | |
| | | | Millions | |
| | Accounts Receivable | | $ | 17 |
| | $ | 24 |
| |
| | Accounts Payable | | $ | 5 |
| | $ | 74 |
| |
| | | | | | | |
The following table shows the value of securities in the NDT Fund that have been in an unrealized loss position for less than 12 months and greater than 12 months.
|
| | | | | | | | | | | | | | | | | | | | | | | | | | | | | | | | | | |
| | | | | | | | | | | | | | | | | | | |
| | | | As of December 31, 2016 | | As of December 31, 2015 | |
| | | | Less Than 12 Months | | Greater Than 12 Months | | Less Than 12 Months | | Greater Than 12 Months | |
| | | | Fair Value | | Gross Unrealized Losses | | Fair Value | | Gross Unrealized Losses | | Fair Value | | Gross Unrealized Losses | | Fair Value | | Gross Unrealized Losses | |
| | | | Millions | |
| | Equity Securities (A) | | $ | 120 |
| | $ | (10 | ) | | $ | 8 |
| | $ | (1 | ) | | $ | 151 |
| | $ | (13 | ) | | $ | 1 |
| | $ | — |
| |
| | Debt Securities | | | | | | | | | | | | | | | | | |
| | Government (B) | | 276 |
| | (6 | ) | | 4 |
| | — |
| | 245 |
| | (2 | ) | | 19 |
| | (1 | ) | |
| | Corporate (C) | | 139 |
| | (3 | ) | | 15 |
| | (1 | ) | | 222 |
| | (7 | ) | | 36 |
| | (3 | ) | |
| | Total Debt Securities | | 415 |
| | (9 | ) | | 19 |
| | (1 | ) | | 467 |
| | (9 | ) | | 55 |
| | (4 | ) | |
| | NDT Available-for-Sale Securities | | $ | 535 |
| | $ | (19 | ) | | $ | 27 |
| | $ | (2 | ) | | $ | 618 |
| | $ | (22 | ) | | $ | 56 |
| | $ | (4 | ) | |
| | | | | | | | | | | | | | | | | | | |
|
| | | | | | | | | | | | | | | | | | | | | | | | | | | | | | | | | | |
| | | | | | | | | | | | | | | | | | | |
| | | | As of December 31, 2018 | | As of December 31, 2017 | |
| | | | Less Than 12 Months | | Greater Than 12 Months | | Less Than 12 Months | | Greater Than 12 Months | |
| | | | Fair Value | | Gross Unrealized Losses | | Fair Value | | Gross Unrealized Losses | | Fair Value | | Gross Unrealized Losses | | Fair Value | | Gross Unrealized Losses | |
| | | | Millions | |
| | Equity Securities (A) | | | | | | | | | | | | | | | | | |
| | Domestic | | $ | 147 |
| | $ | (26 | ) | | $ | 5 |
| | $ | (3 | ) | | $ | 40 |
| | $ | (2 | ) | | $ | — |
| | $ | — |
| |
| | International | | 131 |
| | (28 | ) | | 5 |
| | (2 | ) | | 29 |
| | (3 | ) | | 2 |
| | — |
| |
| | Total Equity Securities | | 278 |
| | (54 | ) | | 10 |
| | (5 | ) | | 69 |
| | (5 | ) | | 2 |
| | — |
| |
| | Available-for-Sale Debt Securities | | | | | | | | | | | | | | | | | |
| | Government (B) | | 51 |
| | — |
| | 317 |
| | (9 | ) | | 343 |
| | (2 | ) | | 91 |
| | (2 | ) | |
| | Corporate (C) | | 150 |
| | (5 | ) | | 222 |
| | (10 | ) | | 191 |
| | (1 | ) | | 27 |
| | (1 | ) | |
| | Total Available-for-Sale Debt Securities | | 201 |
| | (5 | ) | | 539 |
| | (19 | ) | | 534 |
| | (3 | ) | | 118 |
| | (3 | ) | |
| | NDT Trust Investments | | $ | 479 |
| | $ | (59 | ) | | $ | 549 |
| | $ | (24 | ) | | $ | 603 |
| | $ | (8 | ) | | $ | 120 |
| | $ | (3 | ) | |
| | | | | | | | | | | | | | | | | | | |
| |
| (A) | Equity Securities—Investments in marketable equity securities within the NDT Fund are primarily in common stocks within a broad range of industries and sectors. The unrealized losses are distributed over a broad range of securities with limited impairment durations. Power does not consider these securities to be other-than-temporarily impaired as of December 31, 2016. |
NOTES TO CONSOLIDATED FINANCIAL STATEMENTS
within a broad range of industries and sectors. Effective January 1, 2018, unrealized gains and losses on these securities are recorded in Net Income.
| |
| (B) | Debt Securities (Government)—Unrealized gains and losses on these securities are recorded in Accumulated Other Comprehensive Income (Loss). The unrealized losses on Power’s NDT investments in U.S. Treasury obligations and Federal Agency mortgage-backed securities were caused by interest rate changes. These investments are guaranteed by the U.S. government or an agency of the U.S. government. Power also has investments in municipal bonds that are primarily in investment grade securities. It is not expected that these securities will settle for less than their amortized cost. Since Power does not intend to sell these securities nor will it be more-likely-than-not required to sell, Power does not consider these debt securities to be other-than-temporarily impaired as of December 31, 2016.2018. |
| |
| (C) | Debt Securities (Corporate)—Unrealized gains and losses on these securities are recorded in Accumulated Other Comprehensive Income (Loss). Power’s investments in corporate bonds are primarily in investment grade securities. It is not expected that these securities would settle for less than their amortized cost. Since Power does not intend to sell these securities nor will it be more-likely-than-not required to sell, Power does not consider these debt securities to be other-than-temporarily impaired as of December 31, 2016.2018. |
NOTES TO CONSOLIDATED FINANCIAL STATEMENTS
The proceeds from the sales of and the net realized gains (losses) on securities in the NDT Fund were:
|
| | | | | | | | | | | | | | |
| | | | | | | | | |
| | | | Years Ended December 31, | |
| | | | 2016 | | 2015 | | 2014 | |
| | | | Millions | |
| | Proceeds from Sales (A) | | $ | 711 |
| | $ | 1,397 |
| | $ | 1,448 |
| |
| | Net Realized Gains (Losses): | | | | | | | |
| | Gross Realized Gains | | $ | 53 |
| | $ | 97 |
| | $ | 177 |
| |
| | Gross Realized Losses | | (32 | ) | | (37 | ) | | (23 | ) | |
| | Net Realized Gains (Losses) on NDT Fund | | $ | 21 |
| | $ | 60 |
| | $ | 154 |
| |
| | | | | | | | | |
|
| | | | | | | | | | | | | | |
| | | | | | | | | |
| | | | Years Ended December 31, | |
| | | | 2018 | | 2017 | | 2016 | |
| | | | Millions | |
| | Proceeds from Sales (A) | | $ | 1,398 |
| | $ | 2,137 |
| | $ | 711 |
| |
| | Net Realized Gains (Losses): | | | | | | | |
| | Gross Realized Gains | | $ | 121 |
| | $ | 157 |
| | $ | 53 |
| |
| | Gross Realized Losses | | (51 | ) | | (23 | ) | | (32 | ) | |
| | Net Realized Gains (Losses) on NDT Fund (B) | | $ | 70 |
| | $ | 134 |
| | $ | 21 |
| |
| | Unrealized Gains (Losses) on Equity Securities in NDT Fund (C) | | (209 | ) | | N/A |
| | N/A |
| |
| | Other-Than-Temporary-Impairments (OTTI) | | — |
| | (12 | ) | | (28 | ) | |
| | Net Gains (Losses) on NDT Fund Investments | | $ | (139 | ) | | $ | 122 |
| | $ | (7 | ) | |
| | | | | | | | | |
| |
| (A) | Includes activity in accounts related to the liquidation of funds being transitioned to new managers. |
Gross realized gains and gross realized losses disclosed in the preceding table were recognized in Other Income and Other Deductions, respectively, in PSEG’s and Power’s Consolidated Statements of Operations. Net unrealized gains of $128 million (after-tax) are included in Accumulated Other Comprehensive Loss on PSEG’s and Power’s Consolidated Balance Sheets as of December 31, 2016.
| |
| (B) | The cost of these securities was determined on the basis of specific identification. |
| |
| (C) | Effective January 1, 2018, unrealized gains (losses) on equity securities are recorded in Net Income instead of Other Comprehensive Income (Loss). |
The available-for-saleNDT Fund debt securities held as of December 31, 20162018 had the following maturities:
|
| | | | | | |
| | | | | |
| | Time Frame | | Fair Value | |
| | | | Millions | |
| | Less than one year | | $ | 15 |
| |
| | 1 - 5 years | | 257 |
| |
| | 6 - 10 years | | 193 |
| |
| | 11 - 15 years | | 50 |
| |
| | 16 - 20 years | | 60 |
| |
| | Over 20 years | | 282 |
| |
| | Total NDT Available-for-Sale Debt Securities | | $ | 857 |
| |
| | | | | |
The cost of these securities was determined on the basis of specific identification. |
| | | | | | |
| | | | | |
| | Time Frame | | Fair Value | |
| | | | Millions | |
| | Less than one year | | $ | 13 |
| |
| | 1 - 5 years | | 254 |
| |
| | 6 - 10 years | | 211 |
| |
| | 11 - 15 years | | 40 |
| |
| | 16 - 20 years | | 77 |
| |
| | Over 20 years | | 383 |
| |
| | Total NDT Available-for-Sale Debt Securities | | $ | 978 |
| |
| | | | | |
Power periodically assesses individual debt securities whose fair value is less than amortized cost to determine whether the investments are considered to be other-than-temporarily impaired. For equity securities, management considers the ability and intent to hold for a reasonable time to permit recovery in addition to the severity and duration of the loss. For fixed incomethese securities, management considers its intent to sell or requirement to sell a security prior to expected recovery. In those cases where a sale is expected, any impairment would be recorded through earnings. For fixed income securities where there is no intent to sell or likely requirement to sell, management evaluates whether credit loss is a component of the impairment. If so, that portion is recorded through earnings while the noncredit loss component is recorded through Accumulated Other Comprehensive Income (Loss). In 2016, other-than-temporary impairments of $28 million were recognized on securities in the NDT Fund. Any subsequent recoveries in the value of these securities would be recognized in Accumulated Other Comprehensive Income (Loss) unless the securities are
NOTES TO CONSOLIDATED FINANCIAL STATEMENTS
sold, in which case, any gain would be recognized in income. The assessment of fair market value compared to cost is applied on a weighted average basis taking into account various purchase dates and initial cost of the securities.
Rabbi Trust
PSEG maintains certain unfunded nonqualified benefit plans to provide supplemental retirement and deferred compensation benefits to certain key employees. Certain assets related to these plans have been set aside in a grantor trust commonly known as a “Rabbi Trust.”
NOTES TO CONSOLIDATED FINANCIAL STATEMENTS
PSEG classifies investments in the Rabbi Trust as available-for-sale. The following tables show the fair values, gross unrealized gains and losses and amortized cost basesbasis for the securities held in the Rabbi Trust.
|
| | | | | | | | | | | | | | | | | | |
| | | | | | | | | | | |
| | | | As of December 31, 2016 | |
| | | | Cost | | Gross Unrealized Gains | | Gross Unrealized Losses | | Fair Value | |
| | | | Millions | |
| | Equity Securities | | $ | 11 |
| | $ | 11 |
| | $ | — |
| | $ | 22 |
| |
| | Debt Securities | | | | | | | | | |
| | Government | | 105 |
| | — |
| | (2 | ) | | 103 |
| |
| | Corporate | | 92 |
| | 1 |
| | (2 | ) | | 91 |
| |
| | Total Debt Securities | | 197 |
| | 1 |
| | (4 | ) | | 194 |
| |
| | Other Securities | | 1 |
| | — |
| | — |
| | 1 |
| |
| | Total Rabbi Trust Available-for-Sale Securities | | $ | 209 |
| | $ | 12 |
| | $ | (4 | ) | | $ | 217 |
| |
| | | | | | | | | | | |
|
| | | | | | | | | | | | | | | | | | |
| | | | | | | | | | | |
| | | | As of December 31, 2018 | |
| | | | Cost | | Gross Unrealized Gains | | Gross Unrealized Losses | | Fair Value | |
| | | | Millions | |
| | Equity Securities | | | | | | | | | |
| | Domestic | | $ | 22 |
| | $ | 1 |
| | $ | — |
| | $ | 23 |
| |
| | International | | — |
| | — |
| | — |
| | — |
| |
| | Total Equity Securities | | 22 |
| | 1 |
| | — |
| | 23 |
| |
| | Available-for-Sale Debt Securities | | | | | | | | | |
| | Government | | 110 |
| | 1 |
| | (2 | ) | | 109 |
| |
| | Corporate | | 96 |
| | — |
| | (4 | ) | | 92 |
| |
| | Total Available-for-Sale Debt Securities | | 206 |
| | 1 |
| | (6 | ) | | 201 |
| |
| | Total Rabbi Trust Investments | | $ | 228 |
| | $ | 2 |
| | $ | (6 | ) | | $ | 224 |
| |
| | | | | | | | | | | |
|
| | | | | | | | | | | | | | | | | | |
| | | | | | | | | | | |
| | | | As of December 31, 2015 | |
| | | | Cost | | Gross Unrealized Gains | | Gross Unrealized Losses | | Fair Value | |
| | | | Millions | |
| | Equity Securities | | $ | 12 |
| | $ | 10 |
| | $ | — |
| | $ | 22 |
| |
| | Debt Securities | | | | | | | | | |
| | Government | | 108 |
| | 1 |
| | (1 | ) | | 108 |
| |
| | Corporate | | 82 |
| | — |
| | (1 | ) | | 81 |
| |
| | Total Debt Securities | | 190 |
| | 1 |
| | (2 | ) | | 189 |
| |
| | Other Securities | | 2 |
| | — |
| | — |
| | 2 |
| |
| | Total Rabbi Trust Available-for-Sale Securities | | $ | 204 |
| | $ | 11 |
| | $ | (2 | ) | | $ | 213 |
| |
| | | | | | | | | | �� | |
|
| | | | | | | | | | | | | | | | | | |
| | | | | | | | | | | |
| | | | As of December 31, 2017 | |
| | | | Cost | | Gross Unrealized Gains | | Gross Unrealized Losses | | Fair Value | |
| | | | Millions | |
| | Equity Securities | | | | | | | | | |
| | Domestic | | $ | 24 |
| | $ | 3 |
| | $ | — |
| | $ | 27 |
| |
| | International | | — |
| | — |
| | — |
| | — |
| |
| | Total Equity Securities | | 24 |
| | 3 |
| | — |
| | 27 |
| |
| | Available-for-Sale Debt Securities | | | | | | | | | |
| | Government | | 85 |
| | 1 |
| | (1 | ) | | 85 |
| |
| | Corporate | | 118 |
| | 2 |
| | (1 | ) | | 119 |
| |
| | Total Available-for-Sale Debt Securities | | 203 |
| | 3 |
| | (2 | ) | | 204 |
| |
| | Total Rabbi Trust Investments | | $ | 227 |
| | $ | 6 |
| | $ | (2 | ) | | $ | 231 |
| |
| | | | | | | | | | | |
Net unrealized gains (losses) on debt securities of $(4) million (after-tax) were included in Accumulated Other Comprehensive Loss on PSEG’s Consolidated Balance Sheet as of December 31, 2018. The portion of net unrealized gains (losses) recognized during 2018 related to equity securities still held at the end of December 31, 2018 was $(2) million.
The amounts in the preceding tables do not include receivables and payables for Rabbi Trust Fund transactions which have not settled at the end of each period. Such amounts are included in Accounts Receivable and Accounts Payable on the Consolidated Balance Sheets as shown in the following table.
|
| | | | | | | | | | |
| | | | | | | |
| | | | As of December 31, 2016 | | As of December 31, 2015 | |
| | | | Millions | |
| | Accounts Receivable | | $ | 5 |
| | $ | 1 |
| |
| | Accounts Payable | | $ | 3 |
| | $ | — |
| |
| | | | | | | |
NOTES TO CONSOLIDATED FINANCIAL STATEMENTS
|
| | | | | | | | | | |
| | | | | | | |
| | | | As of December 31, 2018 | | As of December 31, 2017 | |
| | | | Millions | |
| | Accounts Receivable | | $ | 2 |
| | $ | 2 |
| |
| | Accounts Payable | | $ | — |
| | $ | 1 |
| |
| | | | | | | |
The following table shows the value of securities in the Rabbi Trust Fund that have been in an unrealized loss position for less than 12 months and greater than 12 months:
|
| | | | | | | | | | | | | | | | | | | | | | | | | | | | | | | | | | |
| | | | | | | | | | | | | | | | | | | |
| | | | As of December 31, 2016 | | As of December 31, 2015 | |
| | | | Less Than 12 Months | | Greater Than 12 Months | | Less Than 12 Months | | Greater Than 12 Months | |
| | | | Fair Value | | Gross Unrealized Losses | | Fair Value | | Gross Unrealized Losses | | Fair Value | | Gross Unrealized Losses | | Fair Value | | Gross Unrealized Losses | |
| | | | Millions | |
| | Equity Securities (A) | | $ | — |
| | $ | — |
| | $ | — |
| | $ | — |
| | $ | — |
| | $ | — |
| | $ | — |
| | $ | — |
| |
| | Debt Securities | | | | | | | | | | | | | | | | | |
| | Government (B) | | 60 |
| | (2 | ) | | 1 |
| | — |
| | 53 |
| | (1 | ) | | 2 |
| | — |
| |
| | Corporate (C) | | 46 |
| | (2 | ) | | 3 |
| | — |
| | 46 |
| | (1 | ) | | 9 |
| | — |
| |
| | Total Debt Securities | | 106 |
| | (4 | ) | | 4 |
| | — |
| | 99 |
| | (2 | ) | | 11 |
| | — |
| |
| | Rabbi Trust Available-for-Sale Securities | | $ | 106 |
| | $ | (4 | ) | | $ | 4 |
| | $ | — |
| | $ | 99 |
| | $ | (2 | ) | | $ | 11 |
| | $ | — |
| |
| | | | | | | | | | | | | | | | | | | |
|
| | | | | | | | | | | | | | | | | | | | | | | | | | | | | | | | | | |
| | | | | | | | | | | | | | | | | | | |
| | | | As of December 31, 2018 | | As of December 31, 2017 | |
| | | | Less Than 12 Months | | Greater Than 12 Months | | Less Than 12 Months | | Greater Than 12 Months | |
| | | | Fair Value | | Gross Unrealized Losses | | Fair Value | | Gross Unrealized Losses | | Fair Value | | Gross Unrealized Losses | | Fair Value | | Gross Unrealized Losses | |
| | | | Millions | |
| | Available-for-Sale Debt Securities | | | | | | | | | | | | | | | | | |
| | Government (A) | | $ | 18 |
| | $ | — |
| | $ | 59 |
| | $ | (2 | ) | | $ | 28 |
| | $ | — |
| | $ | 25 |
| | $ | (1 | ) | |
| | Corporate (B) | | 50 |
| | (3 | ) | | 29 |
| | (1 | ) | | 39 |
| | (1 | ) | | 9 |
| | — |
| |
| | Total Available-for-Sale Debt Securities | | 68 |
| | (3 | ) | | 88 |
| | (3 | ) | | 67 |
| | (1 | ) | | 34 |
| | (1 | ) | |
| | Rabbi Trust Investments | | $ | 68 |
| | $ | (3 | ) | | $ | 88 |
| | $ | (3 | ) | | $ | 67 |
| | $ | (1 | ) | | $ | 34 |
| | $ | (1 | ) | |
| | | | | | | | | | | | | | | | | | | |
| |
| (A) | Equity Securities—Investments in marketable equity securities within the Rabbi Trust Fund are through a mutual fund which invests primarily in common stocks within a broad range of industries and sectors. |
| |
(B) | Debt Securities (Government)—Unrealized gains and losses on these securities are recorded in Accumulated Other Comprehensive Income (Loss). The unrealized losses on PSEG’s Rabbi Trust investments in U.S. Treasury obligations and Federal Agency mortgage-backed securities were caused by interest rate changes. These investments are guaranteed by the U.S. government or an agency of the U.S. government. PSEG also has investments in municipal bonds that are primarily in investment grade securities. It is not expected that these securities will settle for less than their amortized cost. Since PSEG does not intend to sell these securities nor will it be more-likely-than-not required to sell, PSEG does not consider these debt securities to be other-than-temporarily impaired as of December 31, 2016.2018. |
| |
(C)(B) | Debt Securities (Corporate)—Unrealized gains and losses on these securities are recorded in Accumulated Other Comprehensive Income (Loss). PSEG’s investments in corporate bonds are primarily in investment grade securities. It is not expected that these securities would settle for less than their amortized cost. Since PSEG does not intend to sell these securities nor will it be more-likely-than-not required to sell, PSEG does not consider these debt securities to be other-than-temporarily impaired as of December 31, 2016.2018. |
The proceeds from the sales of and the net realized gains (losses) on securities in the Rabbi Trust Fund were:
|
| | | | | | | | | | | | | | |
| | | | | | | | | |
| | | | Years Ended December 31, | |
| | | | 2016 | | 2015 | | 2014 | |
| | | | Millions | |
| | Proceeds from Rabbi Trust Sales (A) | | $ | 113 |
| | $ | 104 |
| | $ | 467 |
| |
| | Net Realized Gains (Losses): | | | | | | | |
| | Gross Realized Gains | | $ | 6 |
| | $ | 3 |
| | $ | 4 |
| |
| | Gross Realized Losses | | (5 | ) | | (2 | ) | | (3 | ) | |
| | Net Realized Gains (Losses) on Rabbi Trust | | $ | 1 |
| | $ | 1 |
| | $ | 1 |
| |
| | | | | | | | | |
|
| | | | | | | | | | | | | | |
| | | | | | | | | |
| | | | Years Ended December 31, | |
| | | | 2018 | | 2017 | | 2016 | |
| | | | Millions | |
| | Proceeds from Rabbi Trust Sales (A) | | $ | 103 |
| | $ | 182 |
| | $ | 113 |
| |
| | Net Realized Gains (Losses): | | | | | | | |
| | Gross Realized Gains | | $ | 2 |
| | $ | 17 |
| | $ | 6 |
| |
| | Gross Realized Losses | | (4 | ) | | (5 | ) | | (5 | ) | |
| | Net Realized Gains (Losses) on Rabbi Trust (B) | | (2 | ) | | 12 |
| | 1 |
| |
| | Unrealized Gains (Losses) on Equity Securities in Rabbi Trust (C) | | (2 | ) | | N/A |
| | N/A |
| |
| | Net Gains (Losses) on Rabbi Trust Investments | | $ | (4 | ) | | $ | 12 |
| | $ | 1 |
| |
| | | | | | | | | |
| |
| (A) | Includes activity in accounts related to the liquidation of funds being transitioned to new managers. |
| |
| (B) | The cost of these securities was determined on the basis of specific identification. |
NOTES TO CONSOLIDATED FINANCIAL STATEMENTS
| |
| (C) | Effective January 1, 2018, unrealized gains (losses) on equity securities are recorded in Net Income instead of Other Comprehensive Income (Loss). |
Gross realized gains and gross realized losses disclosed in the above table were recognized in Other Income and Other Deductions, respectively, in the Consolidated Statements of Operations. Net unrealized gains of $5 million (after-tax) were recognized in Accumulated Other Comprehensive Loss on the Consolidated Balance Sheets as of December 31, 2016. The Rabbi Trust available-for-sale debt securities held as of December 31, 20162018 had the following maturities:
|
| | | | | | |
| | | | | |
| | Time Frame | | Fair Value | |
| | | | Millions | |
| | Less than one year | | $ | 1 |
| |
| | 1 - 5 years | | 35 |
| |
| | 6 - 10 years | | 27 |
| |
| | 11 - 15 years | | 8 |
| |
| | 16 - 20 years | | 21 |
| |
| | Over 20 years | | 109 |
| |
| | Total Rabbi Trust Available-for-Sale Debt Securities | | $ | 201 |
| |
| | | | | |
|
| | | | | | |
| | | | | |
| | Time Frame | | Fair Value | |
| | | | Millions | |
| | Less than one year | | $ | 8 |
| |
| | 1 - 5 years | | 44 |
| |
| | 6 - 10 years | | 44 |
| |
| | 11 - 15 years | | 9 |
| |
| | 16 - 20 years | | 8 |
| |
| | Over 20 years | | 81 |
| |
| | Total Rabbi Trust Available-for-Sale Debt Securities | | $ | 194 |
| |
| | | | | |
The cost of these securities was determined on the basis of specific identification.
PSEG periodically assesses individual debt securities whose fair value is less than amortized cost to determine whether the investments are considered to be other-than-temporarily impaired. For equity securities, the Rabbi Trust is invested in a commingled indexed mutual fund. Due to the commingled nature of this fund, PSEG does not have the ability to hold these securities until expected recovery. As a result, any declines in fair market value below cost are recorded as a charge to earnings. For fixed income securities, management considers its intent to sell or requirement to sell a security prior to expected recovery. In those cases where a sale is expected, any impairment would be recorded through earnings. For fixed income securities where there is no intent to sell or likely requirement to sell, management evaluates whether credit loss is a component of the impairment. If so, that portion is recorded through earnings while the noncredit loss component is recorded through Accumulated Other Comprehensive Income (Loss). The assessment of fair market value compared to cost is applied on a weighted average basis taking into account various purchase dates and initial cost of the securities. In 2016, there were no other-than-temporary impairments recognized on investments of the Rabbi Trust.
The fair value of the Rabbi Trust related to PSEG, PSE&G and Power are detailed as follows:
|
| | | | | | | | | | |
| | | | | | | |
| | | | As of December 31, 2016 | | As of December 31, 2015 | |
| | | | Millions | |
| | PSE&G | | $ | 43 |
| | $ | 42 |
| |
| | Power | | 53 |
| | 52 |
| |
| | Other | | 121 |
| | 119 |
| |
| | Total Rabbi Trust Available-for-Sale Securities | | $ | 217 |
| | $ | 213 |
| |
| | | | | | | |
|
| | | | | | | | | | |
| | | | | | | |
| | | | As of December 31, | | As of December 31, | |
| | | | 2018 | | 2017 | |
| | | | Millions | |
| | PSE&G | | $ | 45 |
| | $ | 46 |
| |
| | Power | | 56 |
| | 57 |
| |
| | Other | | 123 |
| | 128 |
| |
| | Total Rabbi Trust Investments | | $ | 224 |
| | $ | 231 |
| |
| | | | | | | |
NOTES TO CONSOLIDATED FINANCIAL STATEMENTS
Note 10.11. Goodwill and Other Intangibles
As of December 31, 20162018 and 2015,2017, Power had goodwill of $16 million related to the Bethlehem Energy Center facility. Power conducted an annual review for goodwill impairment in the fourth quarter of 20162018 and concluded that goodwill was not impaired.continues to remain unimpaired. In addition to goodwill, as of December 31, 20162018 and 2015,2017, Power had intangible assets of $98143 million and $102114 million, respectively, related to emissions allowances and renewable energy credits.RECs. Emissions allowances and RECs are recorded at cost and evaluated for impairment at least annually. Emissions expense includes impairments of emissions allowances, if any, and costs for emissions, which is recorded as emissions occur. As load is served under contracts requiring energy from renewable sources, the related expense is recorded. Such expenses forThe changes to Power’s intangible assets during 2017 and 2018 are presented in the years ended December 31, 2016, 2015 and 2014 were as follows:following table:
|
| | | | | | | | | | | | | | |
| | | | | | | | | |
| | | | Years Ended December 31, | |
| | | | 2016 | | 2015 | | 2014 | |
| | | | Millions | |
| | Emissions Expense | | $ | 14 |
| | $ | 13 |
| | $ | 10 |
| |
| | Renewable Energy Expense | | $ | 95 |
| | $ | 91 |
| | $ | 59 |
| |
| | | | | | | | | |
|
| | | | | | | | | | | | | | |
| | | | | | | | | |
| | | | Emissions Allowances | | RECs | | Total Other Intangibles | |
| | | | Millions | |
| | Balance as of January 1, 2017 | | $ | 54 |
| | $ | 44 |
| | $ | 98 |
| |
| | Retirements | | (7 | ) | | (93 | ) | | (100 | ) | |
| | Purchases | | 27 |
| | 90 |
| | 117 |
| |
| | Sales and Transfers, net | | — |
| | (1 | ) | | (1 | ) | |
| | Balance as of December 31, 2017 | | $ | 74 |
| | $ | 40 |
| | $ | 114 |
| |
| | Retirements | | (26 | ) | | (90 | ) | | (116 | ) | |
| | Purchases | | 36 |
| | 110 |
| | 146 |
| |
| | Sales and Transfers, net | | — |
| | (1 | ) | | (1 | ) | |
| | Balance as of December 31, 2018 | | $ | 84 |
| | $ | 59 |
| | $ | 143 |
| |
| | | | | | | | | |
NOTES TO CONSOLIDATED FINANCIAL STATEMENTS
Note 11.12. Asset Retirement Obligations (AROs)
PSEG, PSE&G and Power have recorded various AROsrecognize liabilities for the expected cost of retiring long-lived assets for which representa legal obligationsobligation exists to remove or dispose of an asset or some component of an asset at retirement. These AROs are recorded at fair value in the period in which they are incurred and are capitalized as part of the carrying amount of the related long-lived assets. PSE&G, as a rate-regulated entity, recognizes Regulatory Assets or Liabilities as a result of timing differences between the recording of costs and costs recovered through the rate-making process. We accrete the ARO liability to reflect the passage of time with the corresponding expense recorded in O&M.
PSE&G has conditional AROs primarily for legal obligations related to the removal of treated wood poles and the requirement to seal natural gas pipelines at all sources of gas when the pipelines are no longer in service. PSE&G does not record an ARO for its protected steel and poly-based natural gas lines, as management believes that these categories of gas lines have an indeterminable life.
Power’s ARO liability primarily relates to the decommissioning of its nuclear power plants in accordance with NRC requirements. Power has an independent external trust that is intended to fund decommissioning of its nuclear facilities upon termination of operation. For additional information, see Note 9. Available-for-Sale Securities.10. Trust Investments. Power also identified conditional AROs primarily related to Power’s fossil generation units and solar facilities, including liabilities for removal of asbestos, ash ponds, stored hazardous liquid material and underground storage tanks from industrial power sites, and demolition of certain plants, and the restoration of the sites at which they reside, when the plants are no longer in service. To estimate the fair value of its AROs, Power uses a probability weighted, discounted cash flow model which, on a unit by unit basis, considers multiple outcome scenarios that include significant estimates and assumptions, and are based on third-party decommissioning cost estimates, cost escalation rates, inflation rates and discount rates.
Updated cost studies are obtained triennially unless new information necessitates more frequent updates. The most recent cost study was done in 2015.2018. When assumptions are revised to calculate fair values of existing AROs, generally, the ARO balance and corresponding long-lived asset are adjusted which impact the amount of accretion and depreciation expense recognized in future periods. For PSE&G, Regulatory Assets and Regulatory Liabilities result when accretion and amortization are adjusted to match rates established by regulators resulting in the regulatory deferral of any gain or loss.
NOTES TO CONSOLIDATED FINANCIAL STATEMENTS
The changes to the ARO liabilities for PSEG, PSE&G and Power during 20152017 and 20162018 are presented in the following table:
|
| | | | | | | | | | | | | | | | | | |
| | | | | | | | | | | |
| | | | PSEG | | PSE&G | | Power | | Other | |
| | | | Millions | |
| | ARO Liability as of January 1, 2015 | | $ | 743 |
| | $ | 290 |
| | $ | 450 |
| | $ | 3 |
| |
| | Liabilities Settled | | (5 | ) | | (4 | ) | | (1 | ) | | — |
| |
| | Liabilities Incurred | | 14 |
| | 1 |
| | 12 |
| | 1 |
| |
| | Accretion Expense | | 26 |
| | — |
| | 26 |
| | — |
| |
| | Accretion Expense Deferred and Recovered in Rate Base (A) | | 16 |
| | 16 |
| | — |
| | — |
| |
| | Revision to Present Values of Estimated Cash Flows | | (115 | ) | | (85 | ) | | (30 | ) | | — |
| |
| | ARO Liability as of December 31, 2015 | | $ | 679 |
| | $ | 218 |
| | $ | 457 |
| | $ | 4 |
| |
| | Liabilities Settled | | (13 | ) | | (9 | ) | | (4 | ) | | — |
| |
| | Liabilities Incurred | | 25 |
| | 2 |
| | 23 |
| | — |
| |
| | Accretion Expense | | 26 |
| | — |
| | 26 |
| | — |
| |
| | Accretion Expense Deferred and Recovered in Rate Base (A) | | 12 |
| | 12 |
| | — |
| | — |
| |
| | Revision to Present Values of Estimated Cash Flows | | (3 | ) | | (10 | ) | | 9 |
| | (2 | ) | |
| | ARO Liability as of December 31, 2016 | | $ | 726 |
| | $ | 213 |
| | $ | 511 |
| | $ | 2 |
| |
| | | | | | | | | | | |
|
| | | | | | | | | | | | | | | | | | |
| | | | | | | | | | | |
| | | | PSEG | | PSE&G | | Power | | Other | |
| | | | Millions | |
| | ARO Liability as of January 1, 2017 | | $ | 726 |
| | $ | 213 |
| | $ | 511 |
| | $ | 2 |
| |
| | Liabilities Settled | | (29 | ) | | (8 | ) | | (21 | ) | | — |
| |
| | Liabilities Incurred | | 1 |
| | — |
| | 1 |
| | — |
| |
| | Accretion Expense | | 30 |
| | — |
| | 30 |
| | — |
| |
| | Accretion Expense Deferred and Recovered in Rate Base (A) | | 12 |
| | 12 |
| | — |
| | — |
| |
| | Revision to Present Values of Estimated Cash Flows | | 284 |
| | (5 | ) | | 289 |
| | — |
| |
| | ARO Liability as of December 31, 2017 | | $ | 1,024 |
| | $ | 212 |
| | $ | 810 |
| | $ | 2 |
| |
| | Liabilities Settled | | (10 | ) | | (9 | ) | | (1 | ) | | — |
| |
| | Liabilities Incurred | | 1 |
| | — |
| | 1 |
| | — |
| |
| | Accretion Expense | | 41 |
| | — |
| | 41 |
| | — |
| |
| | Accretion Expense Deferred and Recovered in Rate Base (A) | | 12 |
| | 12 |
| | — |
| | — |
| |
| | Revision to Present Values of Estimated Cash Flows | | (5 | ) | | 87 |
| | (93 | ) | | 1 |
| |
| | ARO Liability as of December 31, 2018 | | $ | 1,063 |
| | $ | 302 |
| | $ | 758 |
| | $ | 3 |
| |
| | | | | | | | | | | |
| |
| (A) | Not reflected as expense in Consolidated Statements of Operations |
During 2016,2018, PSE&G recorded a reduction inan increase to its ARO liabilities primarily due to the impact of settlements and changes to cash flow estimates.an increase in labor rates. These changes had no impact in PSE&G’s Consolidated Statement of Operations.
During 2016,2017, Power recorded $23 millionan increase to its ARO liabilities primarily due to a higher assumed probability of early retirement of its nuclear units of $276 million. During 2018, Power recorded a reduction to its ARO liabilities, primarily due to changes in discount rates and decommissioning assumptions related to new ARO liabilities at itsnuclear. The changes in decommissioning assumptions, including a reduction for the lower probability of early retirement of the nuclear units, were due in part to the enactment of the New Jersey ZEC legislation in May 2018 and that the Salem and Hope Creek Units were the sole applicants under the ZEC program. This reduction was also due to the sale of the Hudson and Mercer units, partially offset by increases in estimated costs
NOTES TO CONSOLIDATED FINANCIAL STATEMENTS
to decommission Power’s fossil units coupled with new solar generation ARO liabilities.pursuant to its most recent cost study. These changes had an immaterial impact in Power’s Consolidated Statement of Operations. See Note 4. Early Plant Retirements for additional information.
Note 12.13. Pension, Other Postretirement Benefits (OPEB) and Savings Plans
PSEG sponsors qualified and nonqualified pension plans and OPEB plans covering PSEG’s and its participating affiliates’ current and former employees who meet certain eligibility criteria. Eligible employees participate in non-contributory pension and OPEB plans sponsored by PSEG and administered by Services. In addition, represented and nonrepresented employees are eligible for participation in PSEG’s two defined contribution plans described below.
PSEG, PSE&G and Power are required to record the under or over funded positions of their defined benefit pension and OPEB plans on their respective balance sheets. Such funding positions of each PSEG company are required to be measured as of the date of its respective year-end Consolidated Balance Sheets. For underfunded plans, the liability is equal to the difference between the plan’s benefit obligation and the fair value of plan assets. For defined benefit pension plans, the benefit obligation is the projected benefit obligation. For OPEB plans, the benefit obligation is the accumulated postretirement benefit obligation. In addition, GAAP requires that the total unrecognized costs for defined benefit pension and OPEB plans be recorded as an after-tax charge to Accumulated Other Comprehensive Income (Loss), a separate component of Stockholders’ Equity. However, for PSE&G, because the amortization of the unrecognized costs is being collected from customers, the accumulated unrecognized costs are recorded as a Regulatory Asset. The unrecognized costs represent actuarial gains or losses and prior service costs which had not been expensed.
For PSE&G, the Regulatory Asset is amortized and recorded as net periodic pension cost in the Consolidated Statements of Operations. For Power, the charge to Accumulated Other Comprehensive Income (Loss) is amortized and recorded as net periodic pension cost in the Consolidated Statements of Operations.
In December 2018, PSEG amended certain provisions of its OPEB plans applicable to all current and future Medicare-eligible retirees and spouses who receive or will receive subsidized healthcare from PSEG. Effective January 1, 2016,2021, the PSEG-sponsored Medicare-eligible plans will be replaced by a Medicare private exchange. For each Medicare-eligible retiree and spouse, PSEG changed the approachwill provide annual credits to a Health Reimbursement Arrangement, which can be used to measure future servicepay for medical, prescription drug, and interest costs for pension benefits. For 2015 and prior, PSEG calculated service and interest costs utilizingdental plan premiums, as well as certain out-of-pocket costs. The amendment resulted in a single weighted-average discount rate derived from the yield curve used to measure the plan obligations. For 2016 and beyond, PSEG has elected to calculate service and interest costs by applying the specific spot rates along that yield curve to the plans’ liability cash flows. PSEG believes the new approach provides a more precise measurement of service and interest costs by aligning the timing of the plans’ liability cash flows to the corresponding spot rates on the yield curve. This change does not affect the measurement of the plan obligations. As a change$559 million reduction in accounting estimate, this change was reflected prospectively. Pension andPSEG’s OPEB costs, net of amounts capitalized, were reduced by $34 million and $13 million, respectively,obligation as compared to the 2016 amounts that would have been derived from applying PSEG’s 2015 and prior years’ methodology.
NOTES TO CONSOLIDATED FINANCIAL STATEMENTS
As of December 31, 2016, PSEG merged its three qualified defined benefit pension plans (excluding Servco plans) into one plan, thereby also merging all of the pension plans’ assets. No changes were made to the benefit formulas, the vesting provisions, or to the employees covered by the plans.2018.
Amounts for Servco are not included in any of the following pension and OPEB benefit information for PSEG and its affiliates but rather are separately disclosed later in this note.
The following table provides a roll-forward of the changes in the benefit obligation and the fair value of plan assets during each of the two years in the periods ended December 31, 20162018 and 2015.2017. It also provides the funded status of the plans and the amounts recognized and amounts not recognized on the Consolidated Balance Sheets at the end of both years.
NOTES TO CONSOLIDATED FINANCIAL STATEMENTS
|
| | | | | | | | | | | | | | | | | | |
| | | | | | | | | | | |
| | | | Pension Benefits | | Other Benefits | |
| | | | 2016 | | 2015 | | 2016 | | 2015 | |
| | | | Millions | |
| | Change in Benefit Obligation | | | | | | | | | |
| | Benefit Obligation at Beginning of Year (A) | | $ | 5,522 |
| | $ | 5,722 |
| | $ | 1,612 |
| | $ | 1,638 |
| |
| | Service Cost | | 109 |
| | 123 |
| | 17 |
| | 22 |
| |
| | Interest Cost | | 202 |
| | 234 |
| | 59 |
| | 67 |
| |
| | Actuarial (Gain) Loss (B) | | 219 |
| | (289 | ) | | 127 |
| | (45 | ) | |
| | Gross Benefits Paid | | (282 | ) | | (268 | ) | | (57 | ) | | (70 | ) | |
| | Plan Amendments | | 2 |
| | — |
| | (4 | ) | | — |
| |
| | Benefit Obligation at End of Year (A) | | $ | 5,772 |
| | $ | 5,522 |
| | $ | 1,754 |
| | $ | 1,612 |
| |
| | Change in Plan Assets | | | | | | | | | |
| | Fair Value of Assets at Beginning of Year | | $ | 5,039 |
| | $ | 5,293 |
| | $ | 374 |
| | $ | 361 |
| |
| | Actual Return on Plan Assets | | 403 |
| | (11 | ) | | 32 |
| | (1 | ) | |
| | Employer Contributions | | 33 |
| | 25 |
| | 71 |
| | 84 |
| |
| | Gross Benefits Paid | | (282 | ) | | (268 | ) | | (57 | ) | | (70 | ) | |
| | Fair Value of Assets at End of Year | | $ | 5,193 |
| | $ | 5,039 |
| | $ | 420 |
| | $ | 374 |
| |
| | Funded Status | | | | | | | | | |
| | Funded Status (Plan Assets less Benefit Obligation) | | $ | (579 | ) | | $ | (483 | ) | | $ | (1,334 | ) | | $ | (1,238 | ) | |
| | Additional Amounts Recognized in the Consolidated Balance Sheets | | | | | | | | | |
| | Noncurrent Assets (included in Other Special Funds) | | $ | — |
| | $ | 14 |
| | $ | — |
| | $ | — |
| |
| | Current Accrued Benefit Cost | | (11 | ) | | (10 | ) | | (10 | ) | | (10 | ) | |
| | Noncurrent Accrued Benefit Cost | | (568 | ) | | (487 | ) | | (1,324 | ) | | (1,228 | ) | |
| | Amounts Recognized | | $ | (579 | ) | | $ | (483 | ) | | $ | (1,334 | ) | | $ | (1,238 | ) | |
| | Additional Amounts Recognized in Accumulated Other Comprehensive Income (Loss), Regulated Assets and Deferred Assets (B) | | | |
| | Prior Service Cost | | $ | (63 | ) | | $ | (83 | ) | | $ | (14 | ) | | $ | (25 | ) | |
| | Net Actuarial Loss | | 1,763 |
| | 1,710 |
| | 523 |
| | 438 |
| |
| | Total | | $ | 1,700 |
| | $ | 1,627 |
| | $ | 509 |
| | $ | 413 |
| |
| | | | | | | | | | | |
|
| | | | | | | | | | | | | | | | | | |
| | | | | | | | | | | |
| | | | Pension Benefits | | Other Benefits | |
| | | | 2018 | | 2017 | | 2018 | | 2017 | |
| | | | Millions | |
| | Change in Benefit Obligation | | | | | | | | | |
| | Benefit Obligation at Beginning of Year (A) | | $ | 6,359 |
| | $ | 5,772 |
| | $ | 1,976 |
| | $ | 1,754 |
| |
| | Service Cost | | 130 |
| | 114 |
| | 18 |
| | 17 |
| |
| | Interest Cost | | 208 |
| | 204 |
| | 66 |
| | 63 |
| |
| | Actuarial (Gain) Loss | | (460 | ) | | 564 |
| | (222 | ) | | 199 |
| |
| | Gross Benefits Paid | | (316 | ) | | (295 | ) | | (76 | ) | | (57 | ) | |
| | Plan Amendments | | — |
| | — |
| | (559 | ) | | — |
| |
| | Benefit Obligation at End of Year (A) | | $ | 5,921 |
| | $ | 6,359 |
| | $ | 1,203 |
| | $ | 1,976 |
| |
| | Change in Plan Assets | | | | | | | | | |
| | Fair Value of Assets at Beginning of Year | | $ | 5,812 |
| | $ | 5,193 |
| | $ | 511 |
| | $ | 420 |
| |
| | Actual Return on Plan Assets | | (388 | ) | | 903 |
| | (36 | ) | | 77 |
| |
| | Employer Contributions | | 12 |
| | 11 |
| | 89 |
| | 71 |
| |
| | Gross Benefits Paid | | (316 | ) | | (295 | ) | | (76 | ) | | (57 | ) | |
| | Fair Value of Assets at End of Year | | $ | 5,120 |
| | $ | 5,812 |
| | $ | 488 |
| | $ | 511 |
| |
| | Funded Status | | | | | | | | | |
| | Funded Status (Plan Assets less Benefit Obligation) | | $ | (801 | ) | | $ | (547 | ) | | $ | (715 | ) | | $ | (1,465 | ) | |
| | Additional Amounts Recognized in the Consolidated Balance Sheets | | | | | | | | | |
| | Current Accrued Benefit Cost | | (10 | ) | | (10 | ) | | (11 | ) | | (10 | ) | |
| | Noncurrent Accrued Benefit Cost | | (791 | ) | | (537 | ) | | (704 | ) | | (1,455 | ) | |
| | Amounts Recognized | | $ | (801 | ) | | $ | (547 | ) | | $ | (715 | ) | | $ | (1,465 | ) | |
| | Additional Amounts Recognized in Accumulated Other Comprehensive Income (Loss), Regulated Assets and Deferred Assets (B) | | | |
| | Prior Service Cost | | $ | (28 | ) | | $ | (46 | ) | | $ | (561 | ) | | $ | (3 | ) | |
| | Net Actuarial Loss | | 2,005 |
| | 1,721 |
| | 420 |
| | 629 |
| |
| | Total | | $ | 1,977 |
| | $ | 1,675 |
| | $ | (141 | ) | | $ | 626 |
| |
| | | | | | | | | | | |
| |
| (A) | Represents projected benefit obligation for pension benefits and the accumulated postretirement benefit obligation for other benefits. The vested benefit obligation is the actuarial present value of the vested benefits to which the employee is currently entitled but based on the employee’s expected date of separation of retirement. |
| |
| (B) | Includes $679$619 million ($398360 million, after-tax) and $658$683 million ($386406 million, after-tax) in Accumulated Other Comprehensive Loss related to Pension and OPEB as of December 31, 20162018 and 2015,2017, respectively. Also includes Regulatory Assets of $1,090 million and Deferred Assets of $127 million as of December 31, 2018 and Regulatory Assets of $1,485 million and Deferred Assets of $133 million as of December 31, 2017. |
The pension benefits table above provides information relating to the funded status of the qualified and nonqualified pension and OPEB plans on an aggregate basis. As of December 31, 2016,2018, PSEG had funded approximately 90%86% of its projected benefit obligation. This percentage does not include $217224 million of assets in the Rabbi Trust as of December 31, 20162018 which were used partially to fund the nonqualified pension plans. As of December 31, 2016,2018, the nonqualified pension plans included in the projected benefit obligation in the above table were $161$156 million. The fair values of the Rabbi Trust assets are included in Other Special Funds on the Consolidated Balance Sheets.
NOTES TO CONSOLIDATED FINANCIAL STATEMENTS
Accumulated Benefit Obligation
The accumulated benefit obligation for all PSEG’s defined benefit pension plans was $5.65.7 billion as of December 31, 20162018 and $5.46.1 billion as of December 31, 2015.2017.
The following table provides the components of net periodic benefit cost relating to all qualified and nonqualified pension and OPEB plans on an aggregate basis for PSEG, excluding Servco for the years ended December 31, 2016, 20152018, 2017 and 20142016. Amounts shown do not reflect the impacts of capitalization and co-owner allocations. Effective with the adoption of ASU 2017-07 on January 1, 2018, only the service cost component is eligible for capitalization, when applicable. For additional information, see Note 2. Recent Accounting Standards.
|
| | | | | | | | | | | | | | | | | | | | | | | | | | |
| | | | | | | | | | | | | | | |
| | | | Pension Benefits Years Ended December 31, | | Other Benefits Years Ended December 31, | |
| | | | 2016 | | 2015 | | 2014 | | 2016 | | 2015 | | 2014 | |
| | | | Millions | |
| | Components of Net Periodic Benefit Cost (Credit) | | | | | | | | | | | | | |
| | Service Cost | | $ | 109 |
| | $ | 123 |
| | $ | 104 |
| | $ | 17 |
| | $ | 22 |
| | 18 |
| |
| | Interest Cost | | 202 |
| | 234 |
| | 234 |
| | 59 |
| | 67 |
| | 69 |
| |
| | Expected Return on Plan Assets | | (394 | ) | | (414 | ) | | (399 | ) | | (31 | ) | | (31 | ) | | (26 | ) | |
| | Amortization of Net | | | | | | | | | | | | | |
| | Prior Service Credit | | (19 | ) | | (19 | ) | | (18 | ) | | (14 | ) | | (14 | ) | | (14 | ) | |
| | Actuarial Loss | | 158 |
| | 150 |
| | 56 |
| | 40 |
| | 43 |
| | 23 |
| |
| | Net Periodic Benefit Cost (Credit) | | $ | 56 |
| | $ | 74 |
| | $ | (23 | ) | | $ | 71 |
| | $ | 87 |
| | $ | 70 |
| |
| | | | | | | | | | | | | | | |
|
| | | | | | | | | | | | | | | | | | | | | | | | | | |
| | | | | | | | | | | | | | | |
| | | | Pension Benefits Years Ended December 31, | | Other Benefits Years Ended December 31, | |
| | | | 2018 | | 2017 | | 2016 | | 2018 | | 2017 | | 2016 | |
| | | | Millions | |
| | Components of Net Periodic Benefit (Credits) Costs | | | | | | | | | | | | | |
| | Service Cost (included in O&M Expense) | | $ | 130 |
| | $ | 114 |
| | $ | 109 |
| | $ | 18 |
| | $ | 17 |
| | $ | 17 |
| |
| | Non-Service Components of Pension and OPEB (Credits) Costs | | | | | | | | | | | | | |
| | Interest Cost | | 208 |
| | 204 |
| | 202 |
| | 66 |
| | 63 |
| | 59 |
| |
| | Expected Return on Plan Assets | | (441 | ) | | (394 | ) | | (394 | ) | | (41 | ) | | (34 | ) | | (31 | ) | |
| | Amortization of Net | | | | | | | | | | | | | |
| | Prior Service Credit | | (18 | ) | | (18 | ) | | (19 | ) | | (1 | ) | | (11 | ) | | (14 | ) | |
| | Actuarial Loss | | 85 |
| | 97 |
| | 158 |
| | 64 |
| | 51 |
| | 40 |
| |
| | Non-Service Components of Pension and OPEB (Credits) Costs | | (166 | ) | | (111 | ) | | (53 | ) | | 88 |
| | 69 |
| | 54 |
| |
| | Total Benefit (Credits) Costs | | $ | (36 | ) | | $ | 3 |
| | $ | 56 |
| | $ | 106 |
| | $ | 86 |
| | $ | 71 |
| |
| | | | | | | | | | | | | | | |
Pension costs and OPEB costs for PSEG, PSE&G and Power are detailed as follows:
|
| | | | | | | | | | | | | | | | | | | | | | | | | | |
| | | | | | | | | | | | | | | |
| | | | Pension Benefits Years Ended December 31, | | Other Benefits Years Ended December 31, | |
| | | | 2016 | | 2015 | | 2014 | | 2016 | | 2015 | | 2014 | |
| | | | Millions | |
| | PSE&G | | $ | 29 |
| | $ | 40 |
| | $ | (19 | ) | | $ | 43 |
| | $ | 55 |
| | $ | 46 |
| |
| | Power | | 16 |
| | 21 |
| | (7 | ) | | 23 |
| | 27 |
| | 20 |
| |
| | Other | | 11 |
| | 13 |
| | 3 |
| | 5 |
| | 5 |
| | 4 |
| |
| | Total Benefit Cost (Credit) | | $ | 56 |
| | $ | 74 |
| | $ | (23 | ) | | $ | 71 |
| | $ | 87 |
| | $ | 70 |
| |
| | | | | | | | | | | | | | | |
|
| | | | | | | | | | | | | | | | | | | | | | | | | | |
| | | | | | | | | | | | | | | |
| | | | Pension Benefits Years Ended December 31, | | Other Benefits Years Ended December 31, | |
| | | | 2018 | | 2017 | | 2016 | | 2018 | | 2017 | | 2016 | |
| | | | Millions | |
| | PSE&G | | $ | (31 | ) | | $ | (4 | ) | | $ | 29 |
| | $ | 68 |
| | $ | 54 |
| | $ | 43 |
| |
| | Power | | (9 | ) | | 1 |
| | 16 |
| | 32 |
| | 27 |
| | 23 |
| |
| | Other | | 4 |
| | 6 |
| | 11 |
| | 6 |
| | 5 |
| | 5 |
| |
| | Total Benefit (Credits) Costs | | $ | (36 | ) | | $ | 3 |
| | $ | 56 |
| | $ | 106 |
| | $ | 86 |
| | $ | 71 |
| |
| | | | | | | | | | | | | | | |
The following table provides the pre-tax changes recognized in Accumulated Other Comprehensive Income (Loss), Regulatory Assets and Deferred Assets:
|
| | | | | | | | | | | | | | | | | | |
| | | | | | | | | | | |
| | | | Pension | | OPEB | |
| | | | 2016 | | 2015 | | 2016 | | 2015 | |
| | | | Millions | |
| | Net Actuarial (Gain) Loss in Current Period | | $ | 211 |
| | $ | 136 |
| | $ | 125 |
| | $ | (14 | ) | |
| | Amortization of Net Actuarial Gain (Loss) | | (158 | ) | | (150 | ) | | (40 | ) | | (43 | ) | |
| | Prior Service Cost (Credit) in current period | | 1 |
| | — |
| | (3 | ) | | — |
| |
| | Amortization of Prior Service Credit | | 19 |
| | 19 |
| | 14 |
| | 14 |
| |
| | Total | | $ | 73 |
| | $ | 5 |
| | $ | 96 |
| | $ | (43 | ) | |
| | | | | | | | | | | |
|
| | | | | | | | | | | | | | | | | | |
| | | | | | | | | | | |
| | | | Pension | | OPEB | |
| | | | 2018 | | 2017 | | 2018 | | 2017 | |
| | | | Millions | |
| | Net Actuarial (Gain) Loss in Current Period | | $ | 369 |
| | $ | 55 |
| | $ | (145 | ) | | $ | 156 |
| |
| | Amortization of Net Actuarial Gain (Loss) | | (85 | ) | | (97 | ) | | (64 | ) | | (50 | ) | |
| | Prior Service Cost (Credit) in current period | | — |
| | — |
| | (559 | ) | | — |
| |
| | Amortization of Prior Service Credit | | 18 |
| | 18 |
| | 1 |
| | 11 |
| |
| | Total | | $ | 302 |
| | $ | (24 | ) | | $ | (767 | ) | | $ | 117 |
| |
| | | | | | | | | | | |
NOTES TO CONSOLIDATED FINANCIAL STATEMENTS
Amounts that are expected to be amortized from Accumulated Other Comprehensive Loss, Regulatory Assets and Deferred Assets into Net Periodic Benefit Cost in 20172019 are as follows:
|
| | | | | | | | | | |
| | | | | | | |
| | | | Pension Benefits | | Other Benefits | |
| | | | 2017 | | 2017 | |
| | | | Millions | |
| | Actuarial (Gain) Loss | | $ | 97 |
| | $ | 51 |
| |
| | Prior Service Cost | | $ | (18 | ) | | $ | (11 | ) | |
| | | | | | | |
|
| | | | | | | | | | |
| | | | | | | |
| | | | Pension Benefits | | Other Benefits | |
| | | | 2019 | | 2019 | |
| | | | Millions | |
| | Actuarial Loss | | $ | 107 |
| | $ | 50 |
| |
| | Prior Service Credit | | $ | (18 | ) | | $ | (128 | ) | |
| | | | | | | |
The following assumptions were used to determine the benefit obligations and net periodic benefit costs: |
| | | | | | | | | | | | | | | | | | | | | | | |
| | | | | | | | | | | | | | | |
| | | | Pension Benefits | | Other Benefits | |
| | | | 2016 | | 2015 | | 2014 | | 2016 | | 2015 | | 2014 | |
| | Weighted-Average Assumptions Used to Determine Benefit Obligations as of December 31 | | | |
| | Discount Rate | | 4.29 | % | | 4.54 | % | | 4.20 | % | | 4.37 | % | | 4.58 | % | | 4.21 | % | |
| | Rate of Compensation Increase | | 3.61 | % | | 3.61 | % | | 3.61 | % | | 3.61 | % | | 3.61 | % | | 3.61 | % | |
| | Weighted-Average Assumptions Used to Determine Net Periodic Benefit Cost for Years Ended December 31 | | | |
| | Discount Rate | | 4.54 | % | | 4.20 | % | | 5.00 | % | | 4.58 | % | | 4.21 | % | | 5.01 | % | |
| | Service Cost Interest Rate | | 4.81 | % | | 4.20 | % | | 5.00 | % | | 4.87 | % | | 4.21 | % | | 5.01 | % | |
| | Interest Cost Interest Rate | | 3.75 | % | | 4.20 | % | | 5.00 | % | | 3.76 | % | | 4.21 | % | | 5.01 | % | |
| | Expected Return on Plan Assets | | 8.00 | % | | 8.00 | % | | 8.00 | % | | 8.00 | % | | 8.00 | % | | 8.00 | % | |
| | Rate of Compensation Increase | | 3.61 | % | | 3.61 | % | | 4.61 | % | | 3.61 | % | | 3.61 | % | | 4.61 | % | |
| | Assumed Health Care Cost Trend Rates as of December 31 | | | | | | | | | |
| | Administrative Expense | | | | | | | | 3.00 | % | | 3.00 | % | | 3.00 | % | |
| | Health Care Costs | | | | | | | | | | | | | |
| | Immediate Rate | | | | | | | | 7.55 | % | | 7.75 | % | | 7.40 | % | |
| | Ultimate Rate | | | | | | | | 4.75 | % | | 4.75 | % | | 5.00 | % | |
| | Year Ultimate Rate Reached | | | | | | | | 2025 |
| | 2025 |
| | 2022 |
| |
| | | | | | | | | | Millions | |
| | Effect of a 1% Increase in the Assumed Rate of Increase in Health Care Benefit Costs | | | |
| | Total of Service Cost and Interest Cost | | | | | | | | $ | 11 |
| | $ | 12 |
| | $ | 13 |
| |
| | Postretirement Benefit Obligation | | | | | | | | $ | 191 |
| | $ | 194 |
| | $ | 201 |
| |
| | Effect of a 1% Decrease in the Assumed Rate of Increase in Health Care Benefit Costs | | | |
| | Total of Service Cost and Interest Cost | | | | | | | | $ | (9 | ) | | $ | (10 | ) | | $ | (10 | ) | |
| | Postretirement Benefit Obligation | | | | | | | | $ | (160 | ) | | $ | (160 | ) | | $ | (165 | ) | |
| | | | | | | | | | | | | | | |
|
| | | | | | | | | | | | | | | | | | | | | | | |
| | | | | | | | | | | | | | | |
| | | | Pension Benefits | | Other Benefits | |
| | | | 2018 | | 2017 | | 2016 | | 2018 | | 2017 | | 2016 | |
| | Weighted-Average Assumptions Used to Determine Benefit Obligations as of December 31 | | | |
| | Discount Rate | | 4.41 | % | | 3.73 | % | | 4.29 | % | | 4.31 | % | | 3.76 | % | | 4.37 | % | |
| | Rate of Compensation Increase | | 3.90 | % | | 3.90 | % | | 3.61 | % | | 3.90 | % | | 3.90 | % | | 3.61 | % | |
| | Weighted-Average Assumptions Used to Determine Net Periodic Benefit Cost for Years Ended December 31 | | | |
| | Discount Rate | | 3.73 | % | | 4.29 | % | | 4.54 | % | | 3.76 | % | | 4.37 | % | | 4.58 | % | |
| | Service Cost Interest Rate | | 3.88 | % | | 4.53 | % | | 4.81 | % | | 3.90 | % | | 4.64 | % | | 4.87 | % | |
| | Interest Cost Interest Rate | | 3.35 | % | | 3.63 | % | | 3.75 | % | | 3.39 | % | | 3.69 | % | | 3.76 | % | |
| | Expected Return on Plan Assets | | 7.80 | % | | 7.80 | % | | 8.00 | % | | 7.80 | % | | 7.80 | % | | 8.00 | % | |
| | Rate of Compensation Increase | | 3.90 | % | | 3.61 | % | | 3.61 | % | | 3.90 | % | | 3.61 | % | | 3.61 | % | |
| | Assumed Health Care Cost Trend Rates as of December 31 | | | | | | | | | |
| | Health Care Costs | | | | | | | | | | | | | |
| | Immediate Rate | | | | | | | | 7.28 | % | | 7.93 | % | | 7.55 | % | |
| | Ultimate Rate | | | | | | | | 4.75 | % | | 4.75 | % | | 4.75 | % | |
| | Year Ultimate Rate Reached | | | | | | | | 2026 |
| | 2026 |
| | 2025 |
| |
| | | | | | | | | | Millions | |
| | Effect of a 1% Increase in the Assumed Rate of Increase in Health Care Benefit Costs | | | |
| | Total of Service Cost and Interest Cost | | | | | | | | $ | 1 |
| | $ | 13 |
| | $ | 11 |
| |
| | Postretirement Benefit Obligation | | | | | | | | $ | 21 |
| | $ | 240 |
| | $ | 191 |
| |
| | Effect of a 1% Decrease in the Assumed Rate of Increase in Health Care Benefit Costs | | | |
| | Total of Service Cost and Interest Cost | | | | | | | | $ | (1 | ) | | $ | (10 | ) | | $ | (9 | ) | |
| | Postretirement Benefit Obligation | | | | | | | | $ | (20 | ) | | $ | (198 | ) | | $ | (160 | ) | |
| | | | | | | | | | | | | | | |
Plan Assets
The investments of pension and OPEB plans are held in a trust account by the Trustee and consist of an undivided interest in an investment account of the Master Trust. The investments in the pension and OPEB plans are measured at fair value within a hierarchy that prioritizes the inputs to fair value measurements into three levels. See Note 17.18. Fair Value Measurements for more information on fair value guidance. Use of the Master Trust permits the commingling of pension plan assets and OPEB plan assets for investment and administrative purposes. Although assets of the plans are commingled in the Master Trust, the Trustee maintains supporting records for the purpose of allocating the net gain or loss of the investment account to the respective participating plans. The net investment income of the investment assets is allocated by the Trustee to each participating plan based on the relationship of the interest of each plan to the total of the interests of the participating plans. As of December 31, 2016,2018, the pension plan interest and OPEB plan interest in such assets of the Master Trust were approximately 93%91% and 7%9%, respectively.
NOTES TO CONSOLIDATED FINANCIAL STATEMENTS
The following tables present information about the investments measured at fair value on a recurring basis as of December 31, 20162018 and 2015,2017, including the fair value measurements and the levels of inputs used in determining those fair values.
NOTES TO CONSOLIDATED FINANCIAL STATEMENTS
|
| | | | | | | | | | | | | | | | | | |
| | | | | | | | | | | |
| | | | Recurring Fair Value Measurements as of December 31, 2016 | |
| | | | | | Quoted Market Prices for Identical Assets | | Significant Other Observable Inputs | | Significant Unobservable Inputs | |
| | Description | | Total | | (Level 1) | | (Level 2) | | (Level 3) | |
| | | | Millions | |
| | Cash Equivalents (A) | | $ | 107 |
| | $ | 105 |
| | $ | 2 |
| | $ | — |
| |
| | Equities (B) | |
|
| | | | | | | |
| | Common Stock | | 944 |
| | 944 |
| | — |
| | — |
| |
| | Commingled (C) | | 1,387 |
| | 1,247 |
| | 140 |
| | — |
| |
| | Preferred Stock | | 1 |
| | 1 |
| | — |
| | — |
| |
| | Bonds (D) | |
|
| | | | | | | |
| | US Treasury | | 441 |
| | — |
| | 441 |
| | — |
| |
| | Government—Other | | 263 |
| | — |
| | 263 |
| | — |
| |
| | Corporate | | 836 |
| | — |
| | 836 |
| | — |
| |
| | Subtotal Fair Value | | $ | 3,979 |
| | $ | 2,297 |
| | $ | 1,682 |
| | $ | — |
| |
| | Measured at net asset value practical expedient (C) | | | | | | | | | |
| | Commingled—Equities | | 1,604 |
| | | | | | | |
| | Private Equity (E) | | 16 |
| | | | | | | |
| | Total Fair Value (F) | | $ | 5,599 |
| |
|
| |
|
| |
|
| |
| | | | | | | | | | | |
|
| | | | | | | | | | | | | | | | | | |
| | | | | | | | | | | |
| | | | Recurring Fair Value Measurements as of December 31, 2018 | |
| | | | | | Quoted Market Prices for Identical Assets | | Significant Other Observable Inputs | | Significant Unobservable Inputs | |
| | Description | | Total | | (Level 1) | | (Level 2) | | (Level 3) | |
| | | | Millions | |
| | Cash Equivalents (A) | | $ | 99 |
| | $ | 88 |
| | $ | 11 |
| | $ | — |
| |
| | Equity Securities | |
|
| | | | | | | |
| | Common Stock (B) | | 1,156 |
| | 1,156 |
| | — |
| | — |
| |
| | Commingled (C) | | 1,338 |
| | 960 |
| | 378 |
| | — |
| |
| | Preferred Stock (B) | | 7 |
| | 7 |
| | — |
| | — |
| |
| | Other (D) | | 1 |
| | 1 |
| | — |
| | — |
| |
| | Debt Securities (E) | |
|
| | | | | | | |
| | U.S. Treasury | | 526 |
| | — |
| | 526 |
| | — |
| |
| | Government—Other | | 302 |
| | — |
| | 302 |
| | — |
| |
| | Corporate | | 948 |
| | — |
| | 948 |
| | — |
| |
| | Subtotal Fair Value | | $ | 4,377 |
| | $ | 2,212 |
| | $ | 2,165 |
| | $ | — |
| |
| | Measured at net asset value practical expedient | | | | | | | | | |
| | Commingled—Equities (F) | | 1,208 |
| | | | | | | |
| | Private Equity (G) | | 10 |
| | | | | | | |
| | Total Fair Value (H) | | $ | 5,595 |
| |
|
| |
|
| |
|
| |
| | | | | | | | | | | |
|
| | | | | | | | | | | | | | | | | | |
| | | | | | | | | | | |
| | | | Recurring Fair Value Measurements as of December 31, 2015 | |
| | | | | | Quoted Market Prices for Identical Assets | | Significant Other Observable Inputs | | Significant Unobservable Inputs | |
| | Description | | Total | | (Level 1) | | (Level 2) | | (Level 3) | |
| | | | Millions | |
| | Cash Equivalents (A) | | $ | 96 |
| | $ | 95 |
| | $ | 1 |
| | $ | — |
| |
| | Equities (B) | |
|
| | | | | | | |
| | Common Stock | | 816 |
| | 816 |
| | — |
| | — |
| |
| | Commingled (C) | | 1,463 |
| | 1,269 |
| | 194 |
| | — |
| |
| | Bonds (D) | |
|
| | | | | | | |
| | US Treasury | | 322 |
| | — |
| | 322 |
| | — |
| |
| | Government—Other | | 279 |
| | — |
| | 279 |
| | — |
| |
| | Corporate | | 906 |
| | — |
| | 906 |
| | — |
| |
| | Subtotal Fair Value | | $ | 3,882 |
| | $ | 2,180 |
| | $ | 1,702 |
| | $ | — |
| |
| | Measured at net asset value practical expedient (C) | | | | | | | | | |
| | Commingled—Equities | | 1,504 |
| | | | | | | |
| | Private Equity (E) | | 19 |
| | | | | | | |
| | Total Fair Value (F) | | $ | 5,405 |
| |
|
| |
|
| |
|
| |
| | | | | | | | | | | |
|
| | | | | | | | | | | | | | | | | | |
| | | | | | | | | | | |
| | | | Recurring Fair Value Measurements as of December 31, 2017 | |
| | | | | | Quoted Market Prices for Identical Assets | | Significant Other Observable Inputs | | Significant Unobservable Inputs | |
| | Description | | Total | | (Level 1) | | (Level 2) | | (Level 3) | |
| | | | Millions | |
| | Cash Equivalents (A) | | $ | 133 |
| | $ | 117 |
| | $ | 16 |
| | $ | — |
| |
| | Equity Securities | |
|
| | | | | | | |
| | Common Stock (B) | | 1,275 |
| | 1,275 |
| | — |
| | — |
| |
| | Commingled (C) | | 1,401 |
| | 1,218 |
| | 183 |
| | — |
| |
| | Preferred Stock (B) | | 6 |
| | 6 |
| | — |
| | — |
| |
| | Debt Securities (E) | |
|
| | | | | | | |
| | U.S. Treasury | | 571 |
| | — |
| | 571 |
| | — |
| |
| | Government—Other | | 272 |
| | — |
| | 272 |
| | — |
| |
| | Corporate | | 963 |
| | — |
| | 963 |
| | — |
| |
| | Subtotal Fair Value | | $ | 4,621 |
| | $ | 2,616 |
| | $ | 2,005 |
| | $ | — |
| |
| | Measured at net asset value practical expedient | | | | | | | | | |
| | Commingled—Equities (F) | | 1,675 |
| | | | | | | |
| | Private Equity (G) | | 14 |
| | | | | | | |
| | Total Fair Value (H) | | $ | 6,310 |
| |
|
| |
|
| |
|
| |
| | | | | | | | | | | |
| |
| (A) | Certain open-ended mutual funds with mainly short-term investments are valued based on unadjusted quoted prices in active marketThe Collective Investment Fund publishes a daily net asset value (NAV) which participants may use for daily redemptions without restrictions (Level 1). Certain temporary investments are valued using inputs such as time-to-maturity, coupon rate, quality rating and current yield (Level 2). |
NOTES TO CONSOLIDATED FINANCIAL STATEMENTS
| |
| (B) | Common stocks and preferred stocks are measured using observable data in active markets and considered Level 1. Investments in certain commingled equity funds are measured |
NOTES TO CONSOLIDATED FINANCIAL STATEMENTS
| |
| (C) | Commingled Funds that allow daily redemption at their daily published daily net asset value (NAV) available to investors; if they are redeemable dailyNAV without restrictions they are classified as Level 1 or, if they have1. Commingled Funds that publish daily NAV but with certain near-term redemption restrictions which prevent redemption at the published daily redemptions, theyNAV are classified as Level 2. |
| |
(C)(D) | In 2016, PSEG re-evaluatedInvestment in a publicly traded limited partnership. |
| |
| (E) | Debt securities include mainly investment grade corporate and municipal bonds, U.S. Treasury obligations and Federal Agency asset-backed securities with a wide range of maturities. These investments are valued using an evaluated pricing approach that varies by asset class and reflects observable market information such as the classification, withinmost recent exchange price or quoted bid for similar securities. Market-based standard inputs typically include benchmark yields, reported trades, broker/dealer quotes and issuer spreads or the fair value hierarchy, of its commingled equity funds. Asmost recent quotes for similar securities which are a result, PSEG determined that certain commingled funds in the amount of $1,698 million at December 31, 2015 should have been classified as Level 2 instead of Level 1, as previously presented for 2015, due to the funds having certain redemption restrictions which prevent daily redemptions at their published price. PSEG has determined that this error is immaterial to its previously filed financial reports and, accordingly, has corrected the error by revising the amounts disclosed for 2015 to report such investments as Level 2. In addition, as part of our implementation of the new accounting guidance on investments measured at fair value using NAV as a practical expedient in 2016, the majority of these samemeasure. |
| |
| (F) | Certain commingled equity funds have been removed fromare not included in the fair value hierarchy as they are measured at fair value using the NAV per share (or its equivalent) practical expedient. See Note 2. Recent Accounting Standards. These funds do not meet the definition of readily determinable fair value due to limitations in published NAV (last business day of the month) and include certain redemption restrictions ranging from one to fifteen days advance notice prior to redemption days and limitations on withdrawals over 25% of the total fund. The objectives of these funds are mainly tracking the S&P Index or achieving long-term growth through investment in foreign equity securities and the MSCI Emerging Markets Index. As a result of the error correction for the $1,698 million that should have been classified as Level 2 for 2015 and $1,504 million that was removed from the fair value hierarchy as part of the new guidance on NAV practical expedient implementation, $194 million has been reclassified to Level 2 as of December 31, 2015. |
| |
(D) | Fixed income securities include mainly investment grade corporate and municipal bonds, US Treasury obligations and Federal Agency asset-backed securities with a wide range of maturities. These investments are valued using an evaluated pricing approach that varies by asset class and reflects observable market information such as the most recent exchange price or quoted bid for similar securities. Market-based standard inputs typically include benchmark yields, reported trades, broker/dealer quotes and issuer spreads or the most recent quoted for similar securities which are a Level 2 measure. |
| |
(E)(G) | Private equity investments primarily include various limited partnerships that invest in either operating companies through acquisitions or developing a portfolio of non-US distressed investments.investments to maximize total return on capital. These investments are valued at NAV (or its equivalent) on an annual basis and have significant redemption restrictions preventing redemption until fund liquidation and limited ability to sell these investments. Fund liquidation is not expected to occur for several more years. These investments have been removed from the fair value hierarchy in accordance with the new guidance on NAV practical expedient. |
| |
(F)(H) | Excludes net receivablereceivables of $14 million and $8$13 million at December 31, 20162018 and 2015,2017, respectively, which consistsconsist of interest, dividends and dividend, receivables and payables related to pending securities sales and purchases. |
The following table provides the percentage of fair value of total plan assets for each major category of plan assets held for the qualified pension and OPEB plans as of the measurement date, December 31:
|
| | | | | | | | |
| | | | | | | |
| | | | As of December 31, | |
| | Investments | | 2016 | | 2015 | |
| | Equity Securities | | 70 | % | | 70 | % | |
| | Fixed Income Securities | | 28 |
| | 28 |
| |
| | Other Investments | | 2 |
| | 2 |
| |
| | Total Percentage | | 100 | % | | 100 | % | |
| | | | | | | |
|
| | | | | | | | |
| | | | | | | |
| | | | As of December 31, | |
| | Investments | | 2018 | | 2017 | |
| | Equity Securities | | 66 | % | | 69 | % | |
| | Debt Securities | | 32 |
| | 29 |
| |
| | Other Investments | | 2 |
| | 2 |
| |
| | Total Percentage | | 100 | % | | 100 | % | |
| | | | | | | |
PSEG utilizes forecasted returns, risk, and correlation of all asset classes in order to develop a portfolio designed to produce the maximum return opportunity per unit of risk.an efficient portfolio. PSEG’s latest asset/liability study indicates that a long-term target asset allocation of 70% equities and 30% fixed income is consistent with the funds’ financial objectives. Derivative financial instruments are used by the plans’ investment managers primarily to adjust the fixed income duration of the portfolio and hedge the currency risk component of foreign investments. The expected long-term rate of return on plan assets was 8.0%7.8% for 20162018 and will be 7.8% for 2017.2019. This expected return was determined based on the study discussed above, including a premium for active management and considered the plans’ historical annualized rate of return since inception, which was 9.3%.inception.
Plan Contributions
PSEG has no planned contributions to its pension plans in 2019. PSEG plans to contribute $14make discretionary contributions of $10 million into its OPEB plan during 2017.
NOTES TO CONSOLIDATED FINANCIAL STATEMENTS
2019.
Estimated Future Benefit Payments
The following pension benefit and postretirement benefit payments are expected to be paid to plan participants.
NOTES TO CONSOLIDATED FINANCIAL STATEMENTS
|
| | | | | | | | | | | |
| | | | | | | | |
| | Year | | | Pension Benefits | | Other Benefits | |
| | | | | Millions | |
| | 2017 | | | $ | 310 |
| | $ | 82 |
| |
| | 2018 | | | 307 |
| | 86 |
| |
| | 2019 | | | 319 |
| | 90 |
| |
| | 2020 | | | 331 |
| | 94 |
| |
| | 2021 | | | 343 |
| | 99 |
| |
| | 2022-2026 | | | 1,887 |
| | 534 |
| |
| | Total | | | $ | 3,497 |
| | $ | 985 |
| |
| | | | | | | | |
|
| | | | | | | | | | | |
| | | | | | | | |
| | Year | | | Pension Benefits | | Other Benefits | |
| | | | | Millions | |
| | 2019 | | | $ | 345 |
| | $ | 91 |
| |
| | 2020 | | | 341 |
| | 95 |
| |
| | 2021 | | | 352 |
| | 87 |
| |
| | 2022 | | | 364 |
| | 88 |
| |
| | 2023 | | | 373 |
| | 89 |
| |
| | 2024-2028 | | | 2,004 |
| | 428 |
| |
| | Total | | | $ | 3,779 |
| | $ | 878 |
| |
| | | | | | | | |
401(k) Plans
PSEG sponsors two 401(k) plans, which are defined contribution retirement plans subject to the Employee Retirement Income Security Act (ERISA) defined contribution retirement plans.. Eligible represented employees of PSEG’s subsidiaries participate in the PSEG Employee Savings Plan (Savings Plan), while eligible non-represented employees of PSEG’s subsidiaries participate in the PSEG Thrift and Tax-Deferred Savings Plan (Thrift Plan). Eligible employees may contribute up to 50% of their compensation to these plans, not to exceed the IRSInternal Revenue Service (IRS) maximums, including any catch-up contributions for those employees age 50 and above. PSEG matches 50% of such employee contributions up to 7% of pay for Savings Plan participants and up to 8% of pay for Thrift Plan participants.
The amount paid for employer matching contributions to the plans for PSEG, PSE&G and Power are detailed as follows:
|
| | | | | | | | | | | | | | |
| | | | | | | | | |
| | | | Thrift Plan and Savings Plan | |
| | | | Years Ended December 31, | |
| | | | 2016 | | 2015 | | 2014 | |
| | | | Millions | |
| | PSE&G | | $ | 24 |
| | $ | 22 |
| | $ | 20 |
| |
| | Power | | 12 |
| | 12 |
| | 11 |
| |
| | Other | | 5 |
| | 5 |
| | 5 |
| |
| | Total Employer Matching Contributions | | $ | 41 |
| | $ | 39 |
| | $ | 36 |
| |
| | | | | | | | | |
|
| | | | | | | | | | | | | | |
| | | | | | | | | |
| | | | Thrift Plan and Savings Plan | |
| | | | Years Ended December 31, | |
| | | | 2018 | | 2017 | | 2016 | |
| | | | Millions | |
| | PSE&G | | $ | 26 |
| | $ | 25 |
| | $ | 24 |
| |
| | Power | | 10 |
| | 11 |
| | 12 |
| |
| | Other | | 5 |
| | 5 |
| | 5 |
| |
| | Total Employer Matching Contributions | | $ | 41 |
| | $ | 41 |
| | $ | 41 |
| |
| | | | | | | | | |
Servco Pension and OPEB
At the direction of LIPA, effective January 1, 2014, Servco established benefit plans that provide substantially the same benefits to its employees as those previously provided by National Grid Electric Services LLC (NGES), the predecessor T&D system manager for LIPA. Since the vast majority of Servco’s employees had worked under NGES’ T&D operations services arrangement with LIPA, Servco’s plans provide certain of those employees with pension and OPEB vested credit for prior years’ services earned while working for NGES. The benefit plans cover all employees of Servco for current service. Under the OSA, all of these and any future employee benefit costs are to be funded by LIPA. See Note 4.5. Variable Interest Entities.Entity. These obligations, as well as the offsetting long-term receivable, are separately presented on the Consolidated Balance Sheet of PSEG.
The following table provides a roll-forward of the changes in Servco’s benefit obligation and the fair value of its plan assets during the years ended December 31, 20162018 and 2015.2017. It also provides the funded status of the plans and the amounts recognized and amounts not recognized on the Consolidated Balance Sheets at the end of both years.
NOTES TO CONSOLIDATED FINANCIAL STATEMENTS
|
| | | | | | | | | | | | | | | | | | |
| | | | | | | | | | | |
| | | | Pension Benefits | | Other Benefits | |
| | | | 2016 | | 2015 | | 2016 | | 2015 | |
| | | | | | Millions | |
| | Change in Benefit Obligation | | | | | | | | | |
| | Benefit Obligation at Beginning of Year | | $ | 211 |
| | $ | 195 |
| | $ | 375 |
| | $ | 452 |
| |
| | Service Cost | | 24 |
| | 26 |
| | 12 |
| | 17 |
| |
| | Interest Cost | | 9 |
| | 9 |
| | 17 |
| | 21 |
| |
| | Actuarial (Gain) Loss | | 14 |
| | (20 | ) | | 50 |
| | (114 | ) | |
| | Gross Benefits Paid | | (1 | ) | | — |
| | (2 | ) | | (1 | ) | |
| | Plan Amendments | | 5 |
| | 1 |
| | — |
| | — |
| |
| | Benefit Obligation at End of Year (A) | | $ | 262 |
| | $ | 211 |
| | $ | 452 |
| | $ | 375 |
| |
| | Change in Plan Assets | | | | | | | | | |
| | Fair Value of Assets at Beginning of Year | | $ | 97 |
| | $ | 69 |
| | $ | — |
| | $ | — |
| |
| | Actual Return on Plan Assets | | 10 |
| | (2 | ) | | — |
| | — |
| |
| | Employer Contributions | | 28 |
| | 30 |
| | 2 |
| | 1 |
| |
| | Gross Benefits Paid | | (1 | ) | | — |
| | (2 | ) | | (1 | ) | |
| | Fair Value of Assets at End of Year | | $ | 134 |
| | $ | 97 |
| | $ | — |
| | $ | — |
| |
| | Funded Status | | | | | | | | | |
| | Funded Status (Plan Assets less Benefit Obligation) | | $ | (128 | ) | | $ | (114 | ) | | $ | (452 | ) | | $ | (375 | ) | |
| | Additional Amounts Recognized in the Consolidated Balance Sheets | | | | | | | | | |
| | Accrued Pension Costs of Servco | | $ | (128 | ) | | $ | (114 | ) | | N/A |
| | N/A |
| |
| | OPEB Costs of Servco | | N/A |
| | N/A |
| | (452 | ) | | (375 | ) | |
| | Amounts Recognized (B) | | $ | (128 | ) | | $ | (114 | ) | | $ | (452 | ) | | $ | (375 | ) | |
| | | | | | | | | | | |
|
| | | | | | | | | | | | | | | | | | |
| | | | | | | | | | | |
| | | | Pension Benefits | | Other Benefits | |
| | | | 2018 | | 2017 | | 2018 | | 2017 | |
| | | | Millions | |
| | Change in Benefit Obligation | | | | | | | | | |
| | Benefit Obligation at Beginning of Year | | $ | 320 |
| | $ | 262 |
| | $ | 542 |
| | $ | 452 |
| |
| | Service Cost | | 30 |
| | 27 |
| | 18 |
| | 15 |
| |
| | Interest Cost | | 12 |
| | 11 |
| | 20 |
| | 19 |
| |
| | Actuarial (Gain) Loss | | (38 | ) | | 22 |
| | (73 | ) | | 60 |
| |
| | Gross Benefits Paid | | (3 | ) | | (2 | ) | | (6 | ) | | (4 | ) | |
| | Plan Amendments | | — |
| | — |
| | — |
| | — |
| |
| | Benefit Obligation at End of Year (A) | | $ | 321 |
| | $ | 320 |
| | $ | 501 |
| | $ | 542 |
| |
| | Change in Plan Assets | | | | | | | | | |
| | Fair Value of Assets at Beginning of Year | | $ | 191 |
| | $ | 134 |
| | $ | — |
| | $ | — |
| |
| | Actual Return on Plan Assets | | (16 | ) | | 24 |
| | — |
| | — |
| |
| | Employer Contributions | | 40 |
| | 35 |
| | 6 |
| | 4 |
| |
| | Gross Benefits Paid | | (3 | ) | | (2 | ) | | (6 | ) | | (4 | ) | |
| | Fair Value of Assets at End of Year | | $ | 212 |
| | $ | 191 |
| | $ | — |
| | $ | — |
| |
| | Funded Status | | | | | | | | | |
| | Funded Status (Plan Assets less Benefit Obligation) | | $ | (109 | ) | | $ | (129 | ) | | $ | (501 | ) | | $ | (542 | ) | |
| | Additional Amounts Recognized in the Consolidated Balance Sheets | | | | | | | | | |
| | Accrued Pension Costs of Servco | | $ | (109 | ) | | $ | (129 | ) | | N/A |
| | N/A |
| |
| | OPEB Costs of Servco | | N/A |
| | N/A |
| | (501 | ) | | (542 | ) | |
| | Amounts Recognized (B) | | $ | (109 | ) | | $ | (129 | ) | | $ | (501 | ) | | $ | (542 | ) | |
| | | | | | | | | | | |
| |
| (A) | Represents projected benefit obligation for pension benefits and the accumulated postretirement benefit obligation for other benefits. The vested benefit obligation is the actuarial present value of the vested benefits to which the employee is currently entitled but based on the employee’s expected date of separation of retirement. |
| |
| (B) | Amounts equal to the accrued pension and OPEB costs of Servco are offset in Long-Term Receivable of VIE on PSEG’s Consolidated Balance Sheets. |
Pension and OPEB costs of Servco are accounted for according to the OSA. Servco recognizes expenses for contributions to its pension plan trusts and for OPEB payments made to retirees. Operating Revenues are recognized for the reimbursement of these costs. The pension-related revenues and costs for 2018, 2017 and 2016 2015 and 2014 were $28$40 million, $30$35 million and $67$28 million, respectively. Servco has contributed its entire planned contribution amount to its pension plan trusts during 2016.2018. The OPEB-related revenues earned and costs incurred in 2016 waswere $6 million, $4 million and $2 million in 2018, 2017 and were immaterial 2015 and 2014.
2016, respectively. The following assumptions were used to determine the benefit obligations of Servco:
|
| | | | | | | | | | | | | | | | | | | | | | | |
| | | | | | | | | | | | | | | |
| | | | Pension Benefits | | Other Benefits | |
| | | | 2016 | | 2015 | | 2014 | | 2016 | | 2015 | | 2014 | |
| | Weighted-Average Assumptions Used to Determine Benefit Obligations as of December 31 | | | |
| | Discount Rate | | 4.61 | % | | 4.92 | % | | 4.50 | % | | 4.71 | % | | 4.97 | % | | 4.60 | % | |
| | Rate of Compensation Increase | | 3.25 | % | | 3.25 | % | | 3.25 | % | | 3.25 | % | | 3.25 | % | | 3.25 | % | |
| | Assumed Health Care Cost Trend Rates as of December 31 | | | | | | | | | |
| | Administrative Expense | | | | | | | | 5.00 | % | | 5.00 | % | | 5.00 | % | |
| | Health Care Costs | | | | | | | | | | | | | |
| | Immediate Rate | | | | | | | | 7.55 | % | | 7.55 | % | | 7.33 | % | |
| | Ultimate Rate | | | | | | | | 4.75 | % | | 4.75 | % | | 5.00 | % | |
| | Year Ultimate Rate Reached | | | | | | | | 2025 |
| | 2025 |
| | 2021 |
| |
| | | | | | | | | | Millions | |
| | Effect of a 1% Increase in the Assumed Rate of Increase in Health Care Benefit Costs | | | |
| | Postretirement Benefit Obligation | | | | | | | | $ | 97 |
| | $ | 75 |
| | $ | 160 |
| |
| | Effect of a 1% Decrease in the Assumed Rate of Increase in Health Care Benefit Costs | | | |
| | Postretirement Benefit Obligation | | | | | | | | $ | (75 | ) | | $ | (60 | ) | | $ | (106 | ) | |
| | | | | | | | | | | | | | | |
Table of Contents |
| | | | | | | | | | | | | | | | | | | | | | | |
| | | | | | | | | | | | | | | |
| | | | Pension Benefits | | Other Benefits | |
| | | | 2018 | | 2017 | | 2016 | | 2018 | | 2017 | | 2016 | |
| | Weighted-Average Assumptions Used to Determine Benefit Obligations as of December 31 | | | |
| | Discount Rate | | 4.60 | % | | 3.90 | % | | 4.61 | % | | 4.67 | % | | 3.96 | % | | 4.71 | % | |
| | Rate of Compensation Increase | | 3.25 | % | | 3.25 | % | | 3.25 | % | | 3.25 | % | | 3.25 | % | | 3.25 | % | |
| | Assumed Health Care Cost Trend Rates as of December 31 | | | | | | | | | |
| | Health Care Costs | | | | | | | | | | | | | |
| | Immediate Rate | | | | | | | | 8.03 | % | | 7.69 | % | | 7.55 | % | |
| | Ultimate Rate | | | | | | | | 4.75 | % | | 4.75 | % | | 4.75 | % | |
| | Year Ultimate Rate Reached | | | | | | | | 2026 |
| | 2026 |
| | 2025 |
| |
| | | | | | | | | | Millions | |
| | Effect of a 1% Increase in the Assumed Rate of Increase in Health Care Benefit Costs | | | |
| | Postretirement Benefit Obligation | | | | | | | | $ | 108 |
| | $ | 131 |
| | $ | 97 |
| |
| | Effect of a 1% Decrease in the Assumed Rate of Increase in Health Care Benefit Costs | | | |
| | Postretirement Benefit Obligation | | | | | | | | $ | (83 | ) | | $ | (99 | ) | | $ | (75 | ) | |
| | | | | | | | | | | | | | | |
NOTES TO CONSOLIDATED FINANCIAL STATEMENTS
Plan Assets
All the investments of Servco’s pension plans are held in a trust account by the Trustee and consist of an undivided interest in an investment account of the Master Trust. The investments in the pension are measured at fair value within a hierarchy that prioritizes the inputs to fair value measurements into three levels. See Note 17.18. Fair Value Measurements for more information on fair value guidance. The Actuary maintains supporting records for the purpose of allocating the net gain or loss of the investment account to the respective participating plans. The net investment income of the investment assets is allocated by the Actuary to each participating plan based on the relationship of the interest of each plan to the total of the interests of the participating plans.
The following tables present information about Servco’s investments measured at fair value on a recurring basis as of December 31, 20162018 and 2015,2017, including the fair value measurements and the levels of inputs used in determining those fair values. |
| | | | | | | | | | | | | | | | | | |
| | | | | | | | | | | |
| | | | Recurring Fair Value Measurements as of December 31, 2018 | |
| | | | | | Quoted Market Prices for Identical Assets | | Significant Other Observable Inputs | | Significant Unobservable Inputs | |
| | Description | | Total | | (Level 1) | | (Level 2) | | (Level 3) | |
| | | | Millions | |
| | Commingled Equities (A) | | $ | 141 |
| | $ | — |
| | $ | 141 |
| | $ | — |
| |
| | Commingled Bonds (A) | | 71 |
| | — |
| | 71 |
| | — |
| |
| | Total | | $ | 212 |
| | $ | — |
| | $ | 212 |
| | $ | — |
| |
| | | | | | | | | | | |
|
| | | | | | | | | | | | | | | | | | |
| | | | | | | | | | | |
| | | | Recurring Fair Value Measurements as of December 31, 2017 | |
| | | | | | Quoted Market Prices for Identical Assets | | Significant Other Observable Inputs | | Significant Unobservable Inputs | |
| | Description | | Total | | (Level 1) | | (Level 2) | | (Level 3) | |
| | | | Millions | |
| | Commingled Equities (A)
| | $ | 137 |
| | $ | — |
| | $ | 137 |
| | $ | — |
| |
| | Commingled Bonds (A)
| | 54 |
| | — |
| | 54 |
| | — |
| |
| | Total | | $ | 191 |
| | $ | — |
| | $ | 191 |
| | $ | — |
| |
| | | | | | | | | | | |
|
| | | | | | | | | | | | | | | | | | |
| | | | | | | | | | | |
| | | | Recurring Fair Value Measurements as of December 31, 2016 | |
| | | | | | Quoted Market Prices for Identical Assets | | Significant Other Observable Inputs | | Significant Unobservable Inputs | |
| | Description | | Total | | (Level 1) | | (Level 2) | | (Level 3) | |
| | | | Millions | |
| | Commingled Equities (A) | | $ | 96 |
| | $ | — |
| | $ | 96 |
| | $ | — |
| |
| | Commingled Bonds (A) | | 38 |
| | — |
| | 38 |
| | — |
| |
| | Total | | $ | 134 |
| | $ | — |
| | $ | 134 |
| | $ | — |
| |
| | | | | | | | | | | |
|
| | | | | | | | | | | | | | | | | | |
| | | | | | | | | | | |
| | | | Recurring Fair Value Measurements as of December 31, 2015 | |
| | | | | | Quoted Market Prices for Identical Assets | | Significant Other Observable Inputs | | Significant Unobservable Inputs | |
| | Description | | Total | | (Level 1) | | (Level 2) | | (Level 3) | |
| | | | Millions | |
| | Commingled Equities (A)
| | $ | 68 |
| | $ | — |
| | $ | 68 |
| | $ | — |
| |
| | Commingled Bonds (A)
| | 29 |
| | — |
| | 29 |
| | — |
| |
| | Total | | $ | 97 |
| | $ | — |
| | $ | 97 |
| | $ | — |
| |
| | | | | | | | | | | |
| |
| (A) | Investments in commingled equity and bond funds have a readily determinable fair value as they publish a daily NAV available to investors which is the basis for current transactions and contain certain redemption restrictions requiring advance notice of one to two days for withdrawals (Level 2). In 2016, PSEG re-evaluated the classification, within the fair value hierarchy, of its commingled funds. As a result, PSEG determined that the commingled equity funds should have been classified as Level 2 instead of Level 1, as previously presented for 2015, due to the funds having certain redemption restrictions which prevent daily redemptions at the published price. In addition to the advance notice of one or two days, redemption days may be limited to twice per month for certain funds. PSEG has determined that this error is immaterial to its previously filed financial reports and, accordingly, has corrected the error by revising the amounts disclosed for 2015 to report the commingled equity fund balance of $68 million as of December 31, 2015 as Level 2. |
The following table provides the percentage of fair value of total plan assets for each major category of plan assets held for the qualified pension and OPEB plans of Servco as of the measurement date, December 31:
|
| | | | | | | | |
| | | | | | | |
| | | | As of December 31, | |
| | Investments | | 2016 | | 2015 | |
| | Equity Securities | | 71 | % | | 71 | % | |
| | Fixed Income Securities | | 29 |
| | 29 |
| |
| | Total Percentage | | 100 | % | | 100 | % | |
| | | | | | | |
NOTES TO CONSOLIDATED FINANCIAL STATEMENTS
|
| | | | | | | | |
| | | | | | | |
| | | | As of December 31, | |
| | Investments | | 2018 | | 2017 | |
| | Equity Securities | | 67 | % | | 72 | % | |
| | Debt Securities | | 33 |
| | 28 |
| |
| | Total Percentage | | 100 | % | | 100 | % | |
| | | | | | | |
Servco utilizes forecasted returns, risk, and correlation of all asset classes in order to develop a portfolio designed to produce the maximum return opportunity per unit of risk.an efficient portfolio. The results from Servco’s latest asset/liability study indicated that a long-term target asset allocation of 70% equities and 30% fixed income is consistent with the funds’ financial objectives. The expected long-term rate of return on plan assets was 7.7%7.6% for 20162018 and will be 7.6% for 2017.2019. This expected return was determined based on the study discussed above, including a premium for active management.
NOTES TO CONSOLIDATED FINANCIAL STATEMENTS
Plan Contributions
Servco plans to contribute $35$28 million into its pension plan during 2017.2019.
Estimated Future Benefit Payments
The following pension benefit and postretirement benefit payments are expected to be paid to Servco’s plan participants:
|
| | | | | | | | | | | |
| | | | | | | | |
| | Year | | | Pension Benefits | | Other Benefits | |
| | | | | Millions | |
| | 2017 | | | $ | 2 |
| | $ | 4 |
| |
| | 2018 | | | 3 |
| | 6 |
| |
| | 2019 | | | 5 |
| | 9 |
| |
| | 2020 | | | 7 |
| | 11 |
| |
| | 2021 | | | 8 |
| | 13 |
| |
| | 2022-2026 | | | 76 |
| | 96 |
| |
| | Total | | | $ | 101 |
| | $ | 139 |
| |
| | | | | | | | |
|
| | | | | | | | | | | |
| | | | | | | | |
| | Year | | | Pension Benefits | | Other Benefits | |
| | | | | Millions | |
| | 2019 | | | $ | 4 |
| | $ | 6 |
| |
| | 2020 | | | 6 |
| | 8 |
| |
| | 2021 | | | 7 |
| | 10 |
| |
| | 2022 | | | 9 |
| | 12 |
| |
| | 2023 | | | 11 |
| | 14 |
| |
| | 2024-2028 | | | 91 |
| | 99 |
| |
| | Total | | | $ | 128 |
| | $ | 149 |
| |
| | | | | | | | |
Servco 401(k) Plans
Servco sponsors two 401(k) plans, which are defined contribution retirement plans subject to ERISA. Eligible non-represented employees of Servco participate in the Long Island Electric Utility Servco LLC Incentive Thrift Plan I (Thrift Plan I), and eligible represented employees of Servco participate in the Long Island Electric Utility Servco LLC Incentive Thrift Plan II (Thrift Plan II). Participants in the Plansplans may contribute up to 50% of their eligible compensation to these plans, not to exceed the IRS maximums, including any Catch-Up Contributionscatch-up contributions for those employees age 50 and above. Servco does not provide an employer match or core contribution for employees in Thrift Plan II. For employees in Thrift Plan I, Servco matches 50% of such employee contributions up to 8% of eligible compensation and provides core contributions (based on years of service and age) to employees who do not participate in Servco’s Retirement Income Plan. The amounts expensed by Servco for employer matching contributions for the years ended December 31, 2018, 2017 and 2016 2015 and 2014 were $5$7 million, $4$6 million and $3$5 million, respectively, and pursuant to the OSA, Servco recognizes Operating Revenues for the reimbursement of these costs.
Note 13.14. Commitments and Contingent Liabilities
Guaranteed Obligations
Power’s activities primarily involve the purchase and sale of energy and related products under transportation, physical, financial and forward contracts at fixed and variable prices. These transactions are with numerous counterparties and brokers that may require cash, cash-related instruments or guarantees as a form of collateral.
Power has unconditionally guaranteed payments to counterparties by its subsidiaries in commodity-related transactions in order to
support current exposure, interest and other costs on sums due and payable in the ordinary course of business, and
obtain credit.
Power is subject to
counterparty collateral calls related to commodity contracts, and
certain creditworthiness standards as guarantor under performance guarantees of its subsidiaries.
Under these agreements, guarantees cover lines of credit between entities and are often reciprocal in nature. The exposure between counterparties can move in either direction.
In order for Power to incur a liability for the face value of the outstanding guarantees, its subsidiaries would have to
NOTES TO CONSOLIDATED FINANCIAL STATEMENTS
fully utilize the credit granted to them by every counterparty to whom Power has provided a guarantee, and
the net position of the related contracts would have to be “out-of-the-money” (if the contracts are terminated, Power would owe money to the counterparties).
NOTES TO CONSOLIDATED FINANCIAL STATEMENTS
Power believes the probability of this result is unlikely. For this reason, Power believes that the current exposure at any point in time is a more meaningful representation of the potential liability under these guarantees. Current exposure consists of the net of accounts receivable and accounts payable and the forward value on open positions, less any collateral posted.
Changes in commodity prices can have a material impact on collateral requirements under such contracts, which are posted and received primarily in the form of cash and letters of credit. Power also routinely enters into futures and options transactions for electricity and natural gas as part of its operations. These futures contracts usually require a cash margin deposit with brokers, which can change based on market movement and in accordance with exchange rules.
In addition to the guarantees discussed above, Power has also provided payment guarantees to third parties on behalf of its affiliated companies. These guarantees support various other non-commodity related contractual obligations.
The following table shows the face value of Power’s outstanding guarantees, current exposure and margin positions as of December 31, 20162018 and 2015.2017. |
| | | | | | | | | | |
| | | | | | | |
| | | | As of December 31, 2016 | | As of December 31, 2015 | |
| | | | Millions | |
| | Face Value of Outstanding Guarantees | | $ | 1,806 |
| | $ | 1,734 |
| |
| | Exposure under Current Guarantees | | $ | 139 |
| | $ | 172 |
| |
| | | | | | | |
| | Letters of Credit Margin Posted | | $ | 157 |
| | $ | 122 |
| |
| | Letters of Credit Margin Received | | $ | 99 |
| | $ | 192 |
| |
| | | | | | | |
| | Cash Deposited and Received | | | | | |
| | Counterparty Cash Margin Deposited | | $ | — |
| | $ | — |
| |
| | Counterparty Cash Margin Received | | $ | (1 | ) | | $ | (15 | ) | |
| | Net Broker Balance Deposited (Received) | | $ | 57 |
| | $ | (5 | ) | |
| | | | | | | |
| | Additional Amounts Posted | | | | | |
| | Other Letters of Credit | | $ | 51 |
| | $ | 51 |
| |
| | | | | | | |
|
| | | | | | | | | | |
| | | | | | | |
| | | | As of December 31, 2018 | | As of December 31, 2017 | |
| | | | Millions | |
| | Face Value of Outstanding Guarantees | | $ | 1,772 |
| | $ | 1,701 |
| |
| | Exposure under Current Guarantees | | $ | 198 |
| | $ | 153 |
| |
| | | | | | | |
| | Letters of Credit Margin Posted | | $ | 115 |
| | $ | 103 |
| |
| | Letters of Credit Margin Received | | $ | 26 |
| | $ | 32 |
| |
| | | | | | | |
| | Cash Deposited and Received | | | | | |
| | Counterparty Cash Margin Deposited | | $ | — |
| | $ | — |
| |
| | Counterparty Cash Margin Received | | $ | (10 | ) | | $ | (1 | ) | |
| | Net Broker Balance Deposited (Received) | | $ | 403 |
| | $ | 147 |
| |
| | | | | | | |
| | Additional Amounts Posted | | | | | |
| | Other Letters of Credit | | $ | 52 |
| | $ | 61 |
| |
| | | | | | | |
As part of determining credit exposure, Power nets receivables and payables with the corresponding net fair values of energy contract balances.contracts. See Note 16.17. Financial Risk Management Activities for further discussion. In accordance with PSEG’s accounting policy, where it is applicable, cash (received)/deposited is allocated against derivative asset and liability positions with the same counterparty on the face of the Consolidated Balance Sheet. The remaining balances of net cash (received)/deposited after allocation are generally included in Accounts Payable and Receivable, respectively.
In addition to amounts for outstanding guarantees, current exposure and margin positions, PSEG and Power hadhave posted letters of credit to support Power’s various other non-energy contractual and environmental obligations. See preceding table. PSEG also issued a $106 million guarantee to support Power’s payment obligations related to its equity interest in the PennEast natural gas pipeline and a $21 million guarantee to support Power’s payment obligations related to construction of a 755 MW gas-fired combined cycle generating station in Maryland. In the event that PSEG were to be downgraded to below investment grade and failed to meet minimum net worth requirements, these guarantees would each have to be replaced by a letter of credit.
Environmental Matters
Passaic River
Historic operations of PSEG companies and the operations of hundreds of other companies along the Passaic and Hackensack Rivers are alleged by Federal and State agencies to have discharged substantial contamination into the Passaic River/Newark Bay Complex in violation of various statutes as discussed as follows.
NOTES TO CONSOLIDATED FINANCIAL STATEMENTS
Federal Comprehensive Environmental Response, Compensation and Liability Act of 1980 (CERCLA)
In 2002, theThe U.S. Environmental Protection Agency (EPA) has determined that a 17-mile stretch of the lower Passaic River from Newark to Clifton, New Jersey is a “Superfund” site under CERCLA. This designation allows the EPA to clean up such sitesCERCLA and to compel responsible parties to perform cleanups or reimburse the government for cleanups led by the EPA.
The EPA determined that there was a need to perform a comprehensive study of the entire 17 miles of the lower Passaic River.River needed to be performed. PSE&G and certain of its predecessors conducted operations at properties in this area of the Passaic River. The properties included one operating electric generating station (Essex Site), which was transferred to Power, one former generating station and four former manufactured gas plant (MGP) sites.
In early 2007, 73certain Potentially Responsible Parties (PRPs), including PSE&G and Power, formed a Cooperating Parties Group (CPG) and agreed to assume responsibility for conducting a Remedial Investigation and Feasibility Study (RI/FS) of the 17 miles of the lower Passaic River. At such time, theThe CPG alsohas agreed to allocate, on an interim basis, the associated costs of the RI/FS among its members on the basis of a mutually agreed upon formula. For the purpose of this interim allocation, which has been revised as parties have exited the CPG, approximately seven7.6 percent of the RI/FS costs are currently deemed attributable to PSE&G’s former MGP sites and approximately one1.9 percent is attributable to Power’s generating stations. These interim
NOTES TO CONSOLIDATED FINANCIAL STATEMENTS
allocations are not binding on PSE&G or Power in terms of their respective shares of the costs that will be ultimately required to remediate the 17 miles of the lower Passaic River. PSEG has provided notice to insurers concerning this potential claim.
In June 2008, the EPA and Tierra Solutions, Inc. (Tierra) and Maxus Energy Corporation (Maxus) entered into an early action agreement whereby Tierra/Maxus agreed to remove a portion of the heavily dioxin-contaminated sediment located in the lower Passaic River. The portion of the Passaic River identified in this agreement was located immediately adjacent to Tierra/Maxus’ predecessor company’s (Diamond Shamrock) facility. Pursuant to the agreement between the EPA and Tierra/Maxus, the estimated cost for the work to remove the sediment in this location was $80 million. Phase I of the removal work has been completed. Pursuant to this agreement, Tierra/Maxus have reserved their rights to seek contribution for these removal costs from the other PRPs, including Power and PSE&G.
In 2012, Tierra/Maxus withdrew from the CPG and refused to participate as members going forward, other than with respect to their obligation to fund the EPA’s portion of its RI/FS oversight costs. At such time, the remaining members of the CPG, in agreement with the EPA, commenced the removal of certain contaminated sediments at Passaic River Mile 10.9 at an estimated cost of $25 million to $30 million. Construction is complete. The CPG is awaiting EPA approval of the construction report, long-term monitoring plan and confirmatory sampling plan. PSE&G’s and Power’s combined share of the cost of that effort is approximately three percent. The remaining CPG members, PSE&G and Power included, have reserved their rights to seek reimbursement from Tierra/Maxus for the costs of the River Mile 10.9 removal.
On April 11, 2014, the EPA released its revised draft “Focused Feasibility Study” (FFS) which contemplates the removal of 4.3 million cubic yards of sediment from the bottom of the lower eight miles of the 17-mile stretch of the Passaic River. The revised draft FFS sets forth various alternatives for remediating this portion of the Passaic River.
The CPG, which consisted of 52 members as of December 31, 2016, provided a draft RI and draft FS, both relating to the entire 17 miles of the lower Passaic River, to the EPA on February 18, 2015 and April 30, 2015, respectively. The estimated total cost of the RI/FS is approximately $190 million, which the CPG continues to incur. Of the estimated $190 million, as of December 31, 2016, the CPG had spent approximately $158 million, of which PSEG’s total share was approximately $11 million.
The CPG’s draft FS set forth various alternatives for remediating the lower Passaic River. It set forth the CPG’sRiver with an estimated costscost to remediate the lower 17 miles of the Passaic River which rangeranging from approximately $518 million to $3.2 billion on an undiscounted basis. The CPG identified a targeted remedy in the draft FS which would involve removal, treatment and disposal of contaminated sediments taken from targeted locations within the entire 17 miles of the lower Passaic River. The estimated cost in the draft FS for the targeted remedy ranged from approximately $518 million to $772 million. Based on (i) the low end of the range of the current estimates of costs to remediate, (ii) PSE&G’s and Power’s estimated share of those costs, and (iii) the continued ability of PSE&G to recover such costs in its rates, PSE&G accrued a $10 million Environmental Costs Liability and a corresponding Regulatory Asset and Power accrued a $3 million Other Noncurrent Liability and a corresponding O&M Expense in the first quarter of 2015.
In March 2016, the EPA released its Record of Decision (ROD) for the FFSEPA’s own Focused Feasibility Study (FFS) which requires the removal of 3.5 million cubic yards of sediment from the Passaic River’s lower 8.3 miles at an estimated cost of $2.3 billion on an undiscounted basis (ROD Remedy). The ROD Remedy requires a bank-to-bank dredge ranging from approximately 5 to 30 feet deep in the federal navigation channel from River Mile 0 to River Mile 1.7 and an approximately 2.5 foot deep dredge everywhere else in the lower 8.3 miles of the river. An engineered cap approximately two feet thick will be placed over the dredged areas. Dredged sediments will be transported to facilities and landfills out-of-state. The EPA estimatesestimated the total project length to be about 11 years, including a one year period of negotiation with the PRPs, three to four years to design the project and six years for implementation. Occidental Chemical Corporation (OCC), one of the PRPs, has commenced performance of the remedial design required by the ROD Remedy, reserving its right of cost contribution from all other PRPs.
NOTES TO CONSOLIDATED FINANCIAL STATEMENTS
In October 2018, the EPA Region 2 issued a Directive to the CPG instructing the CPG to focus the ongoing RI/FS evaluation on various adaptive management scenarios for remediation of the upper 9 miles of the Passaic River, which approach has been agreed to in concept by the EPA and the CPG. The Directive does not contain estimates for anticipated costs. Adaptive management focuses on removing targeted “hot spots” of contaminated sediments rather than removing all of the Passaic River’s sediments as in a “bank to bank” approach.
In a separate matter, two PRPs, Tierra Solutions, Inc. (Tierra) and Maxus Energy Corporation (Maxus), filed for Chapter 11 bankruptcy in Delaware Federal Bankruptcy Court. In June 2018, the trust representing the creditors in this proceeding filed a complaint asserting claims against the current and former parent entities of Tierra and Maxus, among other parties, for up to $14 billion. Any damages awarded may be used to fund, in part, the remediation costs of the lower 8.3 miles of the Passaic River. The creditor trust has reserved its right to file contribution claims against 28 PRPs, including PSEG. This matter is ongoing.
In June 2018, OCC filed a complaint in Federal District Court in Newark against various defendants, including PSE&G, seeking cost recovery and contribution under CERCLA for the remediation of the lower 8.3 miles of the Passaic River. The complaint does not quantify damages sought.
The Complaint alleges that “no single hazardous substance” is to blame for the contamination of the lower Passaic River and lists the eight Contaminants of Concern (COCs) identified by the EPA in the ROD. OCC alleges PSE&G is responsible for a portion of six of the eight COCs. PSE&G cannot predict the outcome of this matter.
Based upon the estimated cost of the ROD Remedy and PSEG’s estimate of PSE&G’s and Power’s shares of that cost, and the continued abilityas of December 31, 2018, PSEG has accrued approximately $57 million. Of this amount, PSE&G to recover such costs in its rates, PSE&Ghas accrued $46 million as an additional $36 million Environmental Costs Liability and a corresponding Regulatory Asset andbased on its continued ability to recover such costs in its rates. Power has accrued $11 million as an additional $8 million Other Noncurrent Liability and awith the corresponding O&M Expense recorded in prior years when the first quarter of 2016. As of December 31, 2016, these accruals bring the total liability to approximately $57 million, $46 million applicable to PSE&G and $11 million applicable to Power.
Also in March 2016, the EPA sent a notice letter to 105 PRPs, including PSE&G, all other past and present members of the CPG, including Occidental Chemical Corporation (OCC), and the towns of Newark, Kearny and Harrison and the Passaic Valley Sewerage Commission stating that the EPA wants to determine whether OCC, a successor company to Diamond Shamrock, would voluntarily perform the remedial design for the ROD Remedy. On September 30, 2016, OCC and the EPA executed an Administrative Settlement Agreement and Order on Consent for Remedial Design under which OCC agreed to conduct the remedial design for the ROD. With OCC’s commitment to perform the remedial design, it is anticipated that the EPA will begin negotiation of a remedial action consent decree, under which OCC and the other “major PRPs” will implement and/or pay for the EPA’s ROD Remedy for the lower 8.3 miles. The EPA has not defined “major PRPs.”
On June 16, 2016, Tierra and Maxus, successors to Diamond Shamrock, filed for reorganization under Chapter 11 of the U.S. Bankruptcy Code. Although PSEG does not currently anticipate that the filing for bankruptcy by Tierra and Maxus will affect its allocable share or total liability for the Passaic River matter, PSEG, through the CPG and independently, will monitor the bankruptcy proceedings to identify any potential impact on PSEG’s share of the costs.was accrued.
The EPA has broad authority to implement its selected remedy through the ROD and PSEG cannot at this time predict how the implementation of the ROD might impact PSE&G’s and Power’s ultimate liability. Until (i) the RI/FS, which covers the entire 17 miles of the lower Passaic River, is finalized either in whole or in part, (ii) an agreement by the PRPs to perform either the ROD Remedy as issued, or an amended ROD Remedy determined through negotiation or litigation, and an agreed upon remedy for the remaining 8.7 miles of the river, are reached, (iii) PSE&G’s and Power’s respective shares of the costs, both in the aggregate as well as individually, are determined, and (iv) PSE&G’s continued ability to recover the costs in its rates is determined, it is not possible to predict this matter’s ultimate impact on PSEG’s financial statements. It is possible that PSE&G and Power will record additional costs beyond what they have accrued, and that such costs could be material, but PSEG cannot at the current time estimate the amount or range of any additional costs.
Natural Resource Damage Claims
In 2003, the New Jersey Department of Environmental Protection (NJDEP) directed PSEG, PSE&G and 56 other PRPs to arrange for a natural resource damage assessment and interim compensatory restoration of natural resource injuries along the lower Passaic River and its tributaries pursuant to the New Jersey Spill Compensation and Control Act. The NJDEP alleged that hazardous substances had been discharged from the Essex Site and the Harrison Site. The NJDEP estimated the cost of interim natural resource injury restoration activities along the lower Passaic River at approximately $950 million. In 2007, agencies of the U.S. Department of Commerce and the U.S. Department of the Interior (the Passaic River federal trustees) sent letters to PSE&G and other PRPs inviting participation in an assessment of injuries to natural resources that the agencies intended to perform. In 2008, PSEG and a number of other PRPs agreed to share certain immaterial costs the trustees have incurred and
NOTES TO CONSOLIDATED FINANCIAL STATEMENTS
will incur going forward, and to work with the trustees to explore whether some or all of the trustees’ claims can be resolved in a cooperative fashion. That effort is continuing. PSE&G and Power are unable to estimate their respective portions of the possible loss or range of loss related to this matter.
Newark Bay Study Area
The EPA has established the Newark Bay Study Area, which it defines as Newark Bay and portions of the Hackensack River, the Arthur Kill and the Kill Van Kull. In August 2006, the EPA sent PSEG and 11 other entities notices that it considered each of the entities to be a PRP with respect to contamination in the Study Area. The notice letter requested that the PRPs fund an EPA-approved study in the Newark Bay Study Area. The notice stated the EPA’s belief that hazardous substances were released from sites owned by PSEG companies and located on the Hackensack River, including two operating electric generating stations (Hudson and Kearny sites) and one former MGP site. PSEG has participated in and partially funded the second phase of this study. Notices to fund the next phase of the study have been received but PSEG has not consented to fund the third phase. PSE&G and Power are unable to estimate their respective portions of the possible loss or range of loss related to this matter.
NOTES TO CONSOLIDATED FINANCIAL STATEMENTS
the site of the Hudson electric generating station. Power transferred all land rights and structures on the site to a third party purchaser, along with the assumption of the environmental liabilities for the site.
MGP Remediation Program
PSE&G is working with the NJDEP to assess, investigate and remediate environmental conditions at its former MGP sites. To date, 38 sites requiring some level of remedial action have been identified. Based on its current studies, PSE&G has determined that the estimated cost to remediate all MGP sites to completion could range between $403$321 million and $460$366 million on an undiscounted basis through 2021, including its $46 million share for the Passaic River as discussed above. Since no amount within the range is considered to be most likely, PSE&G has recorded a liability of $403$321 million as of December 31, 2016.2018. Of this amount, $81$56 million was recorded in Other Current Liabilities and $322$265 million was reflected as Environmental Costs in Noncurrent Liabilities. PSE&G has recorded a $403$321 million Regulatory Asset with respect to these costs. PSE&G periodically updates its studies taking into account any new regulations or new information which could impact future remediation costs and adjusts its recorded liability accordingly. NJDEP, PSEG and EPA representatives have had discussions regarding whetherto what extent sampling in the Passaic River is required to delineate coal tar from MGP sites that abut the Passaic River Superfund site. PSEG cannot determine at this time whether this will have an impact on the Passaic River Superfund remedy.
Prevention of Significant Deterioration (PSD)/New Source Review (NSR)
The PSD/NSR regulations, promulgated under the Clean Air Act (CAA), require major sources of certain air pollutants to obtain permits, install pollution control technology and obtain offsets, in some circumstances, when those sources undergo a “major modification,” as defined in the regulations. The federal government may order companies that are not in compliance with the PSD/NSR regulations to install the best available control technology at the affected plants and to pay monetary penalties ranging from $25,000 to $37,500 per day for each violation, depending upon when the alleged violation occurred.
In 2009, the EPA issued a notice of violation to Power and the other owners of the Keystone coal-fired plant in Pennsylvania, alleging, among other things, that various capital improvement projects were completed at the plant which are considered modifications (or major modifications) causing significant net emission increases of PSD/NSR air pollutants, beginning in 1985 for Keystone Unit 1 and in 1984 for Keystone Unit 2. The notice of violation states that none of these modifications underwent the PSD/NSR permitting process prior to being put into service, which the EPA alleges was required under the CAA. The notice of violation states that the EPA may issue an order requiring compliance with the relevant CAA provisions and may seek injunctive relief and/or civil penalties. Power owns approximately 23% of the plant. Power cannot predict the outcome of this matter.
Clean Water Act (CWA) Permit Renewals
Pursuant to the Federal Water Pollution Control Act, (FWPCA), National Pollutant Discharge Elimination System permits expire within five years of their effective date. In order to renew these permits, but allow a plant to continue to operate, an owner or operator must file a permit application no later than six months prior to expiration of the permit. States with delegated federal authority for this program manage these permits. The NJDEP manages the permits under the New Jersey Pollutant Discharge Elimination System (NJPDES) program. Connecticut and New York also have permits to manage their respective pollutant discharge elimination system programs.
In May 2014, the EPA issued a final cooling water intake rule that establishes new requirements for the regulation of cooling water intake structuresintakes at existing power plants and industrial facilities with a design flow of more than two million gallons of water per day.
The EPA has structured the rule so that each state Permitting Director will continue to consider renewal permits for existing
power facilities on a case by case basis. In connection with the assessment of the best technology available for minimizing
adverse environmental impacts of each facility that seeks a permit renewal, the rule requires that facilities conduct a wide range
ofbasis, based on studies related to impingement mortality and entrainment and submitby the results with their permit applications.facilities seeking renewal permits.
In September 2014, severalSeveral environmental non-governmental groupsorganizations and certain energy industry groups filed petitions for
review of the rule and the case has been assigned to the U.S. Second Circuit Court of Appeals (Second Circuit). Environmental
organizations, including but not limited to the environmental petitioners in the Second Circuit, have also filed suit under the
CWA and the Endangered Species Act. The cases were subsequently consolidated at the Second Circuit, and ain July 2018 the Second Circuit upheld the EPA’s final cooling water intake rule. The Court’s decision is expected by
mid-2017.allows Permitting Directors to continue to issue permits in accordance with the flexible, site-specific provisions of the final rule.
In June 2016, the NJDEP issued a final NJPDES permit for Salem with an effective date of August 1, 2016. The final permit does not require installation of cooling towers and allows Salem to continue to operate utilizing the existing once-through cooling water system.Salem. The final permit does not mandate specific service water system modifications, but consistent with Section 316 (b) of the Clean Water Act,CWA, it requires additional studies and the selection of technology to address impingement for the service water system. In July 2016, the Delaware Riverkeeper Network (Riverkeeper) filed a request challenging the NJDEP’s issuance of the final NJPDES renewal permit for Salem. NJDEP has granted the hearing request, but it has not yet been scheduled. The Riverkeeper’s filing does not change the effective date of the permit. If the Riverkeeper’s challenge were successful, Power may be required to incur additional costs to comply with the Clean Water Act. Such serviceCWA. Potential cooling water system modification costs could be material and could adversely impact the economic competitiveness of this facility.
NOTES TO CONSOLIDATED FINANCIAL STATEMENTS
State permitting decisions at Bridgeport and possibly New Haven could also have a material impact on Power’s ability to renew permits at its existing larger once-through cooled plants without making significant upgrades to existing intake structuresintakes and cooling systems.
NOTES TO CONSOLIDATED FINANCIAL STATEMENTS
Power is unable to predict the outcome of these permitting decisions and the effect, if any, that they may have on Power’s future capital requirements, financial condition or results of operations.
Power is actively engaged with the Connecticut Department of Energy and Environmental Protection (CTDEEP) regarding renewal of the current permit for the cooling water intake structure at Bridgeport Harbor Station Unit 3 (BH3). To address compliance with the EPA’s Clean Water ActCWA Section 316(b) final rule, the current proposal under consideration is that, if a final permit is issued, Power wouldhas proposed to continue to operate BH3 without making the capital expenditures for modification to the existing intake structure and retire BH3 in 2021, which is four years earlier than the previously estimated useful life ending in 2025. Based on current discussions withPower is currently awaiting action by the CTDEEP if the proposal is accepted,to issue a draft and then a final permit could be issued in 2017. See Note 3. Early Plant Retirements.permit.
Separately, Power has also negotiatedentered into a Community Environmental Benefit Agreement (CEBA) with the City of Bridgeport, Connecticut.Connecticut and local community organizations. That CEBA provides that Power would retire BH3 early if all of its conditions precedent conditions occur, which include receipt of all final permits to build and operate a proposed new combined cycle generating facility on the same site that BH3 currently operates. The receipt of permits to allow construction and operation of the new facility could occur in 2017. Absent those conditions being met, and the permit for the cooling water intake structure referred to above not being issued, Power may seek to operate BH3 through the previously estimated useful life.
In February 2016, the proposed new generating facility at Bridgeport Harbor was awarded a capacity obligation. The Connecticut Siting Council issued an order to approve siting BH5. All major environmental permits have been obtained except for the New Source air permit that is currently in draft form for public comment.Bridgeport Harbor Station Unit 5. Operations are expected to begin in mid-2019.
Bridgeport Harbor National Pollutant Discharge Elimination System (NPDES) Permit Compliance
In April 2015, Power determined that monitoring Power’s obligations under the CEBA are being monitored regularly and reporting practices related to certain permitted wastewater discharges at its Bridgeport Harbor station may have violated conditions of the station’s NPDES permit and applicable regulations and could subject it to fines and penalties. Power has notified the CTDEEP of the issues and has taken actions to investigate and resolve the potential non-compliance. Power cannot predict the impact of this matter.carried out as needed.
Jersey City, New Jersey Subsurface Feeder Cable Matter
In early October 2016, a discharge of mineral oil dielectric fluid from subsurface feeder cables located in the Hudson River near Jersey City, New Jersey, was identified and reported to the NJDEP. The feeder cables are located within a subsurface easement granted to PSE&G by the property owners, Newport Associates Development Company (NADC) and Newport Associates Phase I Developer Limited Partnership. The feeder cables are subject to agreements between PSE&G and Consolidated Edison Company of New York, Inc. (Con Edison) and are jointly owned by PSE&G and Con Edison, with PSE&G owning the portion of the cables located in New Jersey and Con Edison owning the portion of the cables located in New York. The NJDEP has declared an emergency and an emergency response action has beenwas undertaken to investigate, contain, remediate and stop the fluid discharge; to assess, repair and restore the cables to good working order;order, if feasible; and to restore the property. The regulatory agencies overseeing the emergency response, including the U.S. Coast Guard, the NJDEP and the Army Corps of Engineers, have issued multiple notices, orders and directives to the various parties related to this matter and the parties may also be subject to the assessment of civil penalties related to the discharge and response. The U.S. Coast Guard transitioned control of the federal response to the EPA in May 2018. In August 2018, the EPA ended the federal response to the matter. The investigationresponse has now transitioned to the NJDEP site remediation program.
The impacted cable was repaired in late September 2017; however, small amounts of residual dielectric fluid believed to be contained within the marina sediment continue to appear on the surface and response actions related to the fluid discharge are ongoing. The investigationongoing, although at a significantly reduced scale. PSE&G remains concerned about future leaks and potential environmental impacts as a result of reintroduction of fluid back into these lines and has determined that retirement of the dischargeaffected facilities is appropriate. PSE&G has been unable to reach an agreement with Con Edison and, its potential causeas a result, in May 2018, PSE&G filed an action at FERC to resolve the matter. FERC dismissed PSE&G’s Complaint against Con Edison in September 2018 andPSE&G has challenged FERC’s decision. Also ongoing is the lawsuit in the preliminary stages, making it difficultfederal court to determine ultimate responsibility for the timing and potential costs to resolve this matter, as well as responsibility for such costs betweenaddress the leak among PSE&G, Con Edison and NADC. Based on currently available information and the potential scope of the necessary repair and remediation work, the costs will likely be material. In addition, the timeline for completing the repairs has been extended due to the presence of debris within PSE&G’s easement. In November 2016, PSE&GCon Edison filed an action in New Jersey Federal Court seeking an order requiring NADC to remove its debris from PSE&G’s easement so thatcounter claims against PSE&G and Con EdisonNADC, including seeking injunctive relief and damages. Based on the information currently available and depending on the outcome of the federal court action, PSE&G’s portion of the costs to address the leak may comply with NJDEP and U.S. Coast Guard directives and complete the necessary repairs. NADC subsequently informedbe material; however, PSE&G anticipates that it would comply with the U.S. Coast Guard’s order and undertake debris removal activities so that PSE&G and Con Edison can complete the necessary repairs. NADC’s debris removal activities are ongoing. will recover these costs through regulatory proceedings.
Steam Electric Effluent Guidelines
In September 2015, the EPA issued a new Effluent Limitation Guidelines Limitation Rule (ELG Rule) for steam electric generating units. The rule establishes new best available technology economically achievable (BAT) standards for fly ash transport water, bottom ash transport water, flue gas desulfurization and flue gas mercury control wastewater. The EPA provides an implementation period for currently existing discharges of three years or up to eight years if a facility needs more time to implement equipment upgrades and provide supporting information to its permitting authority. In the intervening time period, existing discharge standards continue to apply. Power’s Bridgeport Harbor station and the jointly-owned Keystone and Conemaugh stations, have
NOTES TO CONSOLIDATED FINANCIAL STATEMENTS
bottom ash transport water discharges that are regulated under this rule.the ELG Rule. Keystone and Conemaugh also have flue gas desulfurization wastewaters regulated by the ELG Rule.
Through various orders, the EPA has stayed the compliance dates in the ELG Rule and has announced plans to further revise the requirements and compliance dates of the ELG Rule. Power is unable to predict ifdetermine how this rule will have a materialultimately impact on its future capitalcompliance requirements or its financial condition and results of operations.
Coal Combustion Residuals (CCRs)
On December 19, 2014, the EPA issued a final rule that regulates CCRs as non-hazardous and requires that facility owners implement a series of actions to close or upgrade existing CCR surface impoundments and/or landfills. It also establishes new provisions for the construction of new surface impoundments and landfills. Power’s Hudson and Mercer generating stations, along with its co-owned Keystone and Conemaugh stations, are subject to the provisions of this rule. On April 17, 2015, the final rule was published with an effective date of October 19, 2015. Accordingly in June 2015, Power recorded an additional asset retirement obligation to comply with the final CCR rule which was not material to Power’s results of operations, financial condition or cash flows.
Basic Generation Service (BGS) and Basic Gas Supply Service (BGSS)
PSE&G obtains its electric supply requirements through the annual New Jersey BGS auctions for two categories of customers who choose not to purchase electric supply from third-party suppliers. The first category, which represents about 80% of PSE&G’s load requirement, is residential and smaller commercial and industrial customers (BGS-Residential Small
NOTES TO CONSOLIDATED FINANCIAL STATEMENTS
Commercial Pricing (RSCP)). The second category is larger customers that exceed a BPU-established load (kW) threshold (BGS-Commercial and Industrial Energy Pricing (CIEP)). Pursuant to applicable BPU rules, PSE&G enters into the Supplier Master Agreement with the winners of these BGS auctions following the BPU’s approval of the auction results. PSE&G has entered into contracts with winning BGS suppliers, including Power, to purchase BGS for PSE&G’s load requirements. The winners of the auction (including Power) are responsible for fulfilling all the requirements of a PJM Load ServingLoad-Serving Entity including the provision of capacity, energy, ancillary services, transmission and any other services required by PJM. BGS suppliers assume all volume risk and customer migration risk and must satisfy New Jersey’s renewable portfolio standards.
The BGS-CIEP auction is for a one-year supply period from June 1 to May 31 with the BGS-CIEP auction price measured in dollars per MW-day for capacity. The final price for the BGS-CIEP auction year commencing June 1, 20172019 is $276.83$281.78 per MW-day, replacing the BGS-CIEP auction year price ending May 31, 20172019 of $335.33$287.76 per MW-day. Energy for BGS-CIEP is priced at hourly PJM locational marginal prices for the contract period.
PSE&G contracts for its anticipated BGS-RSCP load on a three-year rolling basis, whereby each year one-third of the load is procured for a three-year period. The contract prices in dollars per MWh for the BGS-RSCP supply, as well as the approximate load, are as follows:
|
| | | | | | | | | | | | | | |
| | | | | | | | | | | |
| | | Auction Year | | |
| | | 2014 | | 2015 | | 2016 | | 2017 | | |
| | 36-Month Terms Ending | May 2017 |
| | May 2018 |
| | May 2019 |
| | May 2020 |
| (A) | |
| | Load (MW) | 2,800 |
| | 2,900 |
| | 2,800 |
| | 2,800 |
| | |
| | $ per MWh | $97.39 | | $99.54 | | $96.38 | | $90.78 | | |
| | | | | | | | | | | |
|
| | | | | | | | | | | | | | |
| | | | | | | | | | | |
| | | Auction Year | | |
| | | 2016 | | 2017 | | 2018 | | 2019 | | |
| | 36-Month Terms Ending | May 2019 |
| | May 2020 |
| | May 2021 |
| | May 2022 |
| (A) | |
| | Load (MW) | 2,800 |
| | 2,800 |
| | 2,900 |
| | 2,800 |
| | |
| | $ per MWh | $96.38 | | $90.78 | | $91.77 | | $98.04 | | |
| | | | | | | | | | | |
| |
| (A) | Prices set in the 20172019 BGS auction will become effective on June 1, 20172019 when the 20142016 BGS auction agreements expire. |
Power seeks to mitigate volatility in its results by contracting in advance for the sale of most of its anticipated electric output as well as its anticipated fuel needs. As part of its objective, Power has entered into contracts to directly supply PSE&G and other New Jersey electric distribution companies (EDCs) with a portion of their respective BGS requirements through the New Jersey BGS auction process, described above.
PSE&G has a full-requirements contract with Power to meet the gas supply requirements of PSE&G’s gas customers. Power has entered into hedges for a portion of these anticipated BGSS obligations, as permitted by the BPU. The BPU permits PSE&G to recover the cost of gas hedging up to 115 billion cubic feet or 80% of its residential gas supply annual requirements through the BGSS tariff. Current plans call for Power to hedge on behalf of PSE&G approximately 70 billion cubic feet or 50% of its residential gas supply annual requirements. For additional information, see Note 24.25. Related-Party Transactions.
Minimum Fuel Purchase Requirements
Power’s nuclear fuel strategy is to maintain certain levels of uranium and to make periodic purchases to support such levels. As such, the commitments referred to in the following table may include estimated quantities to be purchased that deviate from contractual nominal quantities. Power’s nuclear fuel commitments cover approximately 100% of its estimated uranium, enrichment and fabrication requirements through 20182020 and a significant portion through 2021 at Salem, Hope Creek and Peach Bottom.
NOTES TO CONSOLIDATED FINANCIAL STATEMENTS
Power has various multi-year contracts for natural gas and firm transportation and storage capacity for natural gas that are primarily used to meet its obligations to PSE&G. When there is excess delivery capacity available beyond the needs of PSE&G’s customers, Power can use the gas to supply its fossil generating stations.stations in New Jersey.
Power also has various long-term fuel purchase commitments for coal through 20182023 to support its fossil generation stations.
NOTES TO CONSOLIDATED FINANCIAL STATEMENTS
As of December 31, 2016,2018, the total minimum purchase requirements included in these commitments were as follows:
|
| | | | | | |
| | | | | |
| | Fuel Type | | Power's Share of Commitments through 2021 | |
| | | | Millions | |
| | Nuclear Fuel | | | |
| | Uranium | | $ | 301 |
| |
| | Enrichment | | $ | 356 |
| |
| | Fabrication | | $ | 192 |
| |
| | Natural Gas | | $ | 1,029 |
| |
| | Coal | | $ | 215 |
| |
| | | | | |
|
| | | | | | |
| | | | | |
| | Fuel Type | | Power's Share of Commitments through 2023 | |
| | | | Millions | |
| | Nuclear Fuel | | | |
| | Uranium | | $ | 222 |
| |
| | Enrichment | | $ | 358 |
| |
| | Fabrication | | $ | 167 |
| |
| | Natural Gas | | $ | 1,102 |
| |
| | Coal | | $ | 429 |
| |
| | | | | |
Regulatory Proceedings
Pending FERC Compliance
PJM Bidding MatterMatters
In June 2015, Transource LLC, a merchant transmission developer, filed a complaint against PJM claiming that PJM wrongfully refused to provide data and a transparent process for evaluating transmission network upgrade requests that the first quartertransmission developer had submitted to PJM. Although not named as a respondent, the complaint identifies PSE&G as one of 2014, Power discoveredthe companies claimed to have been involved. In January 2018, a FERC administrative law judge (ALJ) issued an order generally finding that it incorrectly calculated certain componentsPJM and transmission owners, including PSE&G, did not engage in wrongful conduct. In addition, the developer’s assertion of its cost-based bidsan entitlement to monetary damages was expressly denied. However, in a determination disputed by PSE&G, the order found that the PJM process lacked transparency. The judge’s order has been briefed by all parties for itsadditional determinations by FERC. We are unable to predict the outcome of these proceedings.
Subsequent to the ALJ decision, PSE&G received requests for information from FERC’s Office of Enforcement concerning a transmission project. PSE&G is complying with these requests and cannot predict the outcome of this matter.
Litigation
Sewaren 7 Construction
In June 2018, a complaint was filed in federal court in Newark, New Jersey fossil generating unitsagainst PSEG Fossil LLC, a wholly owned subsidiary of Power, regarding an ongoing dispute with Durr Mechanical Construction, Inc. (Durr), a contractor on the Sewaren 7 project. Among other things, Durr seeks damages of $93 million and alleges that Power withheld money owed to Durr and that Power’s intentional conduct led to the inability of Durr to obtain prospective contracts. Power intends to vigorously defend against these allegations. In December 2018, Durr filed for Chapter 11 bankruptcy in the PJM energy market. Upon discoveryfederal court in the Southern District of New York (SDNY). The SDNY bankruptcy court has allowed the New Jersey litigation to proceed. Power has accrued an amount related to outstanding invoices which does not reflect an assessment of claims and potential counterclaims in this matter. Due to its preliminary nature, Power cannot predict the outcome of this matter.
Newark Customer Incident
On the morning of July 5, 2018, PSE&G discontinued electricity to the home of a customer residing in Newark because of outstanding arrears on that customer’s account. Subsequent to the discontinuation of electricity, that customer died on the afternoon of July 5th. The family of the errors, PSEG retained outside counsel to assistcustomer, who was on hospice care, raised allegations in the media regarding PSE&G’s conduct surrounding the discontinuation and restoration of electricity to the home of the customer, claiming that the discontinuation of electric service prevented the customer from using life sustaining medical equipment. The BPU initiated an investigation into the matter and self-reported the errors. As the internal investigation proceeded, additional pricing errors in the bids were identified. It was further determined that the quantity of energy that Power offered into the energy market for its fossil peaking units differed from the amount for which Power was compensated in the capacity market for those units. PSEG informed FERC, PJM and the PJM Independent Market Monitor (IMM) of these additional issues, corrected the identified errors, and modified the bid quantities for Power’s peaking units. Power continues to implement procedures to help mitigate the risk of similar issues occurring in the future.
During the three month period ended March 31, 2014, based upon its best estimate available at the time, Power recorded a charge to income in the amount of $25 million related to this matter. No additional charges to income have been recorded for this matter since that time.
Since September 2014, FERC Staff has been conducting a preliminary, non-public staff investigation into the matter and issued data requests covering a period from 2002 through the date of the self-report. This investigation is ongoing. Since that time, Power has responded to data requestsIn addition, PSE&G received a grand jury subpoena from FERC Staff, including recent data requests in which Power has recalculated certain of its energy bids in PJMthe Essex County Prosecutor’s Office (ECPO) for a five year period,records and may receive additional data requests or other fact finding. The FERC Staff investigation is still in the fact finding stage and there is considerable uncertainty around FERC’s response to PSEG’s legal argumentscorrespondence between PSE&G and the amount of disgorgement or other remedies FERC may ultimately seek.
PSEGcustomer. PSE&G is unable to reasonably estimatefully cooperating with the range of possible loss for this matter; however, the amounts of potential disgorgement and other potential penalties that Power may incur span a wide range depending on the success of PSEG’s legal arguments. These arguments include that Power’s energy market bids in a substantial majority of the hours were below the allowed rate under the Tariff and therefore any errors in those hours were immaterial and that it is unclear whether the quantity of the bids violated any legal requirement. If PSEG’s legal arguments do not prevail in whole or in part with FERC or in ajudicial challenge that PSEG may choose to pursue, it is likely that Power would record additional losses and that such additional losses would be material to PSEG’s and Power’s Consolidated Statements of Operations in the quarterly and annual periods in which they are recorded.
Financial Transmission Rights (FTR) Auction Matter
In January 2017, ER&T received requests from the FERC Office of Enforcement relating to the planning and implementation of ER&T’s participation in the annual FTR auction in PJM for the 2016-2017 planning yearBPU and the monthly FTR auctionsECPO in PJM for February, March and April 2016. PSEG is cooperating with FERC in this matter.both proceedings. PSEG cannot predict the outcome of the pending proceedings regarding this matterincident at this time.
TableThe PSEG Board of ContentsDirectors (PSEG Board) retained outside counsel to conduct an independent investigation of the facts surrounding this incident with the full support and cooperation of management. The independent investigation concluded that the disconnection itself was not improper; however, it did identify issues related to PSE&G’s response once it was notified of the disconnection. The PSEG Board reviewed and considered the findings and conclusions of the investigation and PSE&G’s proposed corrective actions. PSE&G’s progress on implementation of the corrective actions will continue to be overseen by the PSEG Board.Caithness Energy, L.L.C. (Caithness)
In August 2018, Caithness, a Long Island power plant developer, filed a complaint in federal district court in the Eastern District of New York against PSEG and PSEG LI alleging violations of state and federal antitrust laws and a claim of intentional interference of prospective business relations. Caithness alleges that PSEG and PSEG LI interfered with LIPA’s
NOTES TO CONSOLIDATED FINANCIAL STATEMENTS
consideration of the Caithness proposal for a 750 MW combined cycle generation project that was identified as a finalist for a Request For Proposal issued by LIPA. In addition, Caithness claims that PSEG and PSEG LI induced LIPA to agree to eliminate the proposed project as a potential competitor to other PSEG affiliates with power supply operations. The complaint alleges hundreds of millions of dollars of harm and seeks treble and punitive damages. PSEG intends to vigorously defend against these allegations. Based upon the preliminary nature of this matter, a loss is not considered probable nor is the amount of loss, if any, estimable as of December 31, 2018.
Transource LLC (Transource)
In January 2019, Transource filed a complaint against PJM, PSE&G and three other transmission owners in Pennsylvania state court. Transource has sued the transmission owner defendants for fraud and intentional misrepresentation relating to information provided to PJM and FERC regarding the costs of upgrades for Transource’s proposed project. These allegations appear to be based on alleged conduct that is the subject of the pending FERC proceeding discussed under “Pending FERC Matters.” Based upon the preliminary nature of this matter, a loss is not considered probable nor is the amount of loss, if any, estimable as of December 31, 2018.
Other Litigation and Legal Proceedings
PSEG and its subsidiaries are party to various lawsuits in the ordinary course of business. In view of the inherent difficulty in predicting the outcome of such matters, PSEG, PSE&G and Power generally cannot predict the eventual outcome of the pending matters, the timing of the ultimate resolution of these matters, or the eventual loss, fines or penalties related to each pending matter.
In accordance with applicable accounting guidance, a liability is accrued when those matters present loss contingencies that are both probable and reasonably estimable. In such cases, there may be an exposure to loss in excess of any amounts accrued. PSEG will continue to monitor the matter for further developments that could affect the amount of the accrued liability that has been previously established.
Based on current knowledge, management does not believe that loss contingencies arising from pending matters, other than the matters described herein, could have a material adverse effect on PSEG’s, PSE&G’s or Power’s consolidated financial position or liquidity. However, in light of the inherent uncertainties involved in these matters, some of which are beyond PSEG’s control, and the large or indeterminate damages sought in some of these matters, an adverse outcome in one or more of these matters could be material to PSEG’s, PSE&G’s or Power’s results of operations or liquidity for any particular reporting period.
Nuclear Insurance Coverages and Assessments
Power is a member of the joint underwriting association, American Nuclear Insurers (ANI), which provides nuclear liability insurance coverage at the Salem and Hope Creek site and the Peach Bottom site. The ANI policies are designed to satisfy the financial protection requirements outlined in the Price-Anderson Act, which sets the limit of liability for claims that could arise from an incident involving any licensed nuclear facility in the United States. The limit of liability per incident per site is composed of primary and excess layers. As of December 31, 2018, nuclear sites were required to purchase $450 million of primary liability coverage for each site (through ANI). The primary layer is supplemented by an excess layer, which is an industry self-insurance pool. In the event a nuclear site, which is part of the industry self-insurance pool, has a claim that exceeds the primary layer, each licensee would be assessed a prorated share of the excess layer. The excess layer limit is $13.6 billion. Power’s maximum aggregate assessment per incident is $433 million (based on Power’s ownership interests in Salem, Hope Creek and Peach Bottom) and its maximum aggregate annual assessment per incident is $65 million. If the damages exceed the limit of liability, Congress could impose further revenue-raising measures on the nuclear industry to pay claims. Further, a decision by the U.S. Supreme Court, not involving Power, held that the Price-Anderson Act did not preclude punitive damage awards based on state law claims.
Power is also a member of an industry mutual insurance company, Nuclear Electric Insurance Limited (NEIL), which provides the property, decontamination and decommissioning liability insurance at the Salem/Salem and Hope Creek site and the Peach Bottom sites.site. NEIL also provides replacement power coverage through its accidental outage policy. NEIL policies may make retrospective premium assessments in the case of adverse loss experience. Power’sThe current maximum potential liabilities under these assessments are included in the table and notes below.aggregate annual retrospective premium obligation for Power is approximately $62 million. NEIL requires its members to maintain an investment grade credit rating or to ensure collectability of their annual retrospective premium obligation by providing a financial guarantee, letter of credit, deposit premium, or some other means of assurance. Certain provisions in the NEIL policies provide that the insurer may suspend coverage with respect to all nuclear units on a site without notice if the NRC suspends or revokes the operating license for any unit on that site, issues a shutdown order with respect to such unit or issues a confirmatory order keeping such unit down.
Power is also a member of the joint underwriting association, American Nuclear Insurers (ANI), which provides nuclear liability insurance coverage at the Salem/Hope Creek and Peach Bottom sites. The ANI policies are designed to satisfy the financial protection requirements outlined in the Price-Anderson Act.
The ANI and NEIL policies all include coverage for claims arising out of acts of terrorism, however,terrorism. However, NEIL policies are subject to an industry aggregate limit of $3.2$3.2 billion plus such additional amounts as NEIL recovers for such losses from reinsurance, indemnity and any other source applicable to such losses.
The Price-Anderson Act sets the “limit of liability” for claims that could arise from an incident involving any licensed nuclear facility in the United States. The “limit of liability” is based on the number of licensed nuclear reactors and is adjusted at least every five years based on the Consumer Price Index. The “limit of liability” per incident per site is comprised of a primary and excess layer. As of December 31, 2016, nuclear sites were required to purchase $375 million of primary liability coverage for each site (through ANI). This limit was increased to $450 million effective January 1, 2017.The primary layer is supplemented by an excess layer, which is an industry self-insurance pool. In the event a nuclear site has a claim that exceeds the primary layer, each licensee would be assessed a prorated share of the excess, up to $127 million per reactor, payable at not more than $19 million per reactor per incident per year. With 102 reactors currently in the insurance pool, the excess layer limit is $13.0 billion. If the damages exceed the “limit of liability,” Congress could impose further revenue-raising measures on the nuclear industry to pay claims. Power’s maximum aggregate assessment per incident is $401 million (based on Power’s ownership interests in Hope Creek, Peach Bottom and Salem) and its maximum aggregate annual assessment per incident is $60 million. Further, a decision by the U.S. Supreme Court, not involving Power, has held that the Price-Anderson Act did not preclude awards based on state law claims for punitive damages.
Power’s insurance coverages and maximum retrospective assessments for its nuclear operations as of December 31, 2016 were as follows:
|
| | | | | | | | | | | | |
| | | | | | | | | |
| | Type and Source of Coverages | | Site Coverage | | | | Retrospective Assessments | |
| | | | Millions | |
| | Public and Nuclear Worker Liability (Primary Layer): | | | | | | | |
| | ANI | | $ | 375 |
| | (A) | | $ | — |
| |
| | Nuclear Liability (Excess Layer): | | | | | | | |
| | Price-Anderson Act | | 12,986 |
| | (B) | | 401 |
| |
| | Nuclear Liability Total | | $ | 13,361 |
| | (C) | | $ | 401 |
| |
| | | | | | | | | |
| | Property Damage (Primary Layer): | | | | | | | |
| | NEIL Primary (Salem/Hope Creek) | | $ | 1,500 |
| | | | $ | 35 |
| |
| | NEIL Primary (Peach Bottom) | | $ | 1,500 |
| | | | 14 |
| |
| | Property Damage (Excess Layers): | | | | | | | |
| | NEIL Excess (Salem/Hope Creek - Nuclear) | | $ | 300 |
| | (D) | | 2 |
| |
| | NEIL Excess (Peach Bottom - Nuclear) | | $ | 300 |
| | (D) | | 1 |
| |
| | NEIL Excess (Salem/Hope Creek - Non - Nuclear) | | $ | 300 |
| | (D) | | 1 |
| |
| | NEIL Excess (Peach Bottom - Non - Nuclear) | | $ | 600 |
| | (D) | | 1 |
| |
| | Accidental Outage - PSEG Share:(Nuclear / Non-Nuclear) | | | | | | | |
| | NEIL I (Peach Bottom) | | $245 / $164 |
| | (E) | | 8 |
| |
| | NEIL I (Salem) | | $281 / $188 |
| | (E) | | 9 |
| |
| | NEIL I (Hope Creek) | | $490 / $328 |
| | (E) | | 7 |
| |
| | Nuclear Property Total | |
|
| | | | $ | 78 |
| |
| | | | | | | | | |
NOTES TO CONSOLIDATED FINANCIAL STATEMENTS
| |
(A) | The primary limit for Public Liability is a per site aggregate limit with no potential for retrospective assessment. The Nuclear Worker Liability represents the potential liability from third-party workers claiming exposure to the nuclear energy hazard. This coverage is subject to an industry aggregate limit that is subject to reinstatement at ANI discretion. |
| |
(B) | Retrospective premium program under the Price-Anderson Act liability provisions of the Atomic Energy Act of 1954, as amended. Power is subject to retrospective assessment with respect to loss from an incident at any licensed nuclear reactor in the United States that produces greater than 100 MW of electrical power. This retrospective assessment can be adjusted for inflation every five years. The last adjustment was effective as of September 10, 2013. The next adjustment is due on or before September 10, 2018. This retrospective program is in excess of the Public and Nuclear Worker Liability primary layers. |
| |
(C) | Maximum limit of liability under the Price-Anderson Act for each nuclear incident per site. |
| |
(D) | For nuclear event property limits in excess of $1.5 billion, Power purchases a $300 million Excess Policy for the Salem/Hope Creek site, and a $300 million Excess Policy only for Power’s 50% interest in Peach Bottom. This limit is not subject to reinstatement in the event of a loss. In addition, for non-nuclear event limits in excess of $1.5 billion, Power maintains a $300 million limit for the combined Salem/Hope Creek sites. Exelon maintains a $600 million non-nuclear event limit for Peach Bottom.
|
| |
(E) | Peach Bottom 2 and 3 have an aggregate nuclear indemnity limit based on a weekly indemnity of $2.3 million for 52 weeks followed by 80% of the weekly indemnity for 68 weeks. Peach Bottom 2 and 3 have an aggregate non-nuclear indemnity limit based on a weekly indemnity of $2.3 million for 52 weeks followed by 80% of the weekly indemnity for 24 weeks. Salem 1 and 2 have an aggregate nuclear indemnity limit based on a weekly indemnity of $2.5 million for 52 weeks followed by 80% of the weekly indemnity for 76 weeks. Salem 1 and 2 have an aggregate non-nuclear indemnity limit based on a weekly indemnity of $2.5 million for 52 weeks followed by 80% of the weekly indemnity for 29 weeks. Hope Creek has an aggregate nuclear indemnity limit based on a weekly indemnity of $4.5 million for 52 weeks followed by 80% of the weekly indemnity for 71 weeks. Hope Creek has an aggregate non-nuclear indemnity limit based on a weekly indemnity of $4.5 million for 52 weeks followed by 80% of the weekly indemnity for 26 weeks. |
Minimum Lease Payments
The total future minimum payments under various operating leases as of December 31, 20162018 are:
|
| | | | | | | | | | | | | | | | | | | | | | |
| | | | | | | | | | | | | |
| | | | PSE&G | | Power | | Services | | Other | | Total | |
| | | | Millions | | | |
| | 2017 | | $ | 12 |
| | $ | 3 |
| | $ | 13 |
| | $ | 1 |
| | $ | 29 |
| |
| | 2018 | | 8 |
| | 3 |
| | 13 |
| | 1 |
| | 25 |
| |
| | 2019 | | 7 |
| | 3 |
| | 13 |
| | 1 |
| | 24 |
| |
| | 2020 | | 6 |
| | 2 |
| | 13 |
| | 1 |
| | 22 |
| |
| | 2021 | | 6 |
| | 2 |
| | 14 |
| | 1 |
| | 23 |
| |
| | Thereafter | | 61 |
| | 39 |
| | 132 |
| | — |
| | 232 |
| |
| | Total Minimum Lease Payments | | $ | 100 |
| | $ | 52 |
| | $ | 198 |
| | $ | 5 |
| | $ | 355 |
| |
| | | | | | | | | | | | | |
|
| | | | | | | | | | | | | | | | | | | | | | |
| | | | | | | | | | | | | |
| | | | PSE&G | | Power | | Services | | Other | | Total | |
| | | | Millions | | | |
| | 2019 | | $ | 15 |
| | $ | 11 |
| | $ | 14 |
| | $ | 1 |
| | $ | 41 |
| |
| | 2020 | | 11 |
| | 13 |
| | 14 |
| | 2 |
| | 40 |
| |
| | 2021 | | 10 |
| | 13 |
| | 15 |
| | 1 |
| | 39 |
| |
| | 2022 | | 8 |
| | 14 |
| | 15 |
| | 1 |
| | 38 |
| |
| | 2023 | | 8 |
| | 8 |
| | 15 |
| | — |
| | 31 |
| |
| | Thereafter | | 66 |
| | 51 |
| | 105 |
| | — |
| | 222 |
| |
| | Total Minimum Lease Payments | | $ | 118 |
| | $ | 110 |
| | $ | 178 |
| | $ | 5 |
| | $ | 411 |
| |
| | | | | | | | | | | | | |
NOTES TO CONSOLIDATED FINANCIAL STATEMENTS
Note 14.15. Debt and Credit Facilities
Long-Term Debt
|
| | | | | | | | | | | | |
| | | | | | | | | |
| | | | | | As of December 31, | |
| | | | Maturity | | 2016 | | 2015 | |
| | | | | | Millions | |
| | PSEG | | | | | | | |
| | Term Loan: | | | | | | | |
| | Variable | | 2017 | | $ | 500 |
| | $ | 500 |
| |
| | Total Term Loan | | | | 500 |
| | 500 |
| |
| | Senior Notes: | | | | | | | |
| | 1.60% | | 2019 | | 400 |
| | — |
| |
| | 2.00% | | 2021 | | 300 |
| | — |
| |
| | Total Senior Notes | | | | 700 |
| | — |
| |
| | Principal Amount Outstanding | | | | 1,200 |
| | 500 |
| |
| | Fair Value of Swaps (A) | | | | — |
| | 6 |
| |
| | Amounts Due Within One Year | | | | (500 | ) | | (6 | ) | |
| | Net Unamortized Discount and Debt Issuance Costs | | | | (5 | ) | | — |
| |
| | Total Long-Term Debt of PSEG | | | | $ | 695 |
| | $ | 500 |
| |
| | | | | | | | | |
|
| | | | | | | | | | | | |
| | | | | | | | | |
| | | | | | As of December 31, | |
| | | | Maturity | | 2018 | | 2017 | |
| | | | | | Millions | |
| | PSEG | | | | | | | |
| | Term Loan: | | | | | | | |
| | Variable | | 2019 | | $ | 350 |
| | $ | 700 |
| |
| | Variable | | 2020 | | 700 |
| | — |
| |
| | Total Term Loan | | | | 1,050 |
| | 700 |
| |
| | Senior Notes: | | | | | | | |
| | 1.60% | | 2019 | | 400 |
| | 400 |
| |
| | 2.00% | | 2021 | | 300 |
| | 300 |
| |
| | 2.65% | | 2022 | | 700 |
| | 700 |
| |
| | Total Senior Notes | | | | 1,400 |
| | 1,400 |
| |
| | Principal Amount Outstanding | | | | 2,450 |
| | 2,100 |
| |
| | Amounts Due Within One Year | | | | (750 | ) | | — |
| |
| | Net Unamortized Discount and Debt Issuance Costs | | | | (7 | ) | | (9 | ) | |
| | Total Long-Term Debt of PSEG | | | | $ | 1,693 |
| | $ | 2,091 |
| |
| | | | | | | | | |
NOTES TO CONSOLIDATED FINANCIAL STATEMENTS
|
| | | | | | | | | | | | |
| | | | | | | | | |
| | | | | | As of December 31, | |
| | | | Maturity | | 2016 | | 2015 | |
| | | | | | Millions | |
| | PSE&G | | | | | | | |
| | First and Refunding Mortgage Bonds (B): | | | | | | | |
| | 6.75% | | 2016 | | $ | — |
| | $ | 171 |
| |
| | 9.25% | | 2021 | | 134 |
| | 134 |
| |
| | 8.00% | | 2037 | | 7 |
| | 7 |
| |
| | 5.00% | | 2037 | | 8 |
| | 8 |
| |
| | Total First and Refunding Mortgage Bonds | | | | 149 |
| | 320 |
| |
| | Pollution Control Bonds (B): | | | | | | | |
| | Floating Rate (C) | | 2033 | | — |
| | 50 |
| |
| | Floating Rate (C) | | 2046 | | — |
| | 50 |
| |
| | Total Pollution Control Bonds | | | | — |
| | 100 |
| |
| | Medium-Term Notes (MTNs) (B): | | | | | | | |
| | 5.30% | | 2018 | | 400 |
| | 400 |
| |
| | 2.30% | | 2018 | | 350 |
| | 350 |
| |
| | 1.80% | | 2019 | | 250 |
| | 250 |
| |
| | 2.00% | | 2019 | | 250 |
| | 250 |
| |
| | 7.04% | | 2020 | | 9 |
| | 9 |
| |
| | 3.50% | | 2020 | | 250 |
| | 250 |
| |
| | 1.90% | | 2021 | | 300 |
| | — |
| |
| | 2.38% | | 2023 | | 500 |
| | 500 |
| |
| | 3.75% | | 2024 | | 250 |
| | 250 |
| |
| | 3.15% | | 2024 | | 250 |
| | 250 |
| |
| | 3.05% | | 2024 | | 250 |
| | 250 |
| |
| | 3.00% | | 2025 | | 350 |
| | 350 |
| |
| | 2.25% | | 2026 | | 425 |
| | — |
| |
| | 5.25% | | 2035 | | 250 |
| | 250 |
| |
| | 5.70% | | 2036 | | 250 |
| | 250 |
| |
| | 5.80% | | 2037 | | 350 |
| | 350 |
| |
| | 5.38% | | 2039 | | 250 |
| | 250 |
| |
| | 5.50% | | 2040 | | 300 |
| | 300 |
| |
| | 3.95% | | 2042 | | 450 |
| | 450 |
| |
| | 3.65% | | 2042 | | 350 |
| | 350 |
| |
| | 3.80% | | 2043 | | 400 |
| | 400 |
| |
| | 4.00% | | 2044 | | 250 |
| | 250 |
| |
| | 4.05% | | 2045 | | 250 |
| | 250 |
| |
| | 4.15% | | 2045 | | 250 |
| | 250 |
| |
| | 3.80% | | 2046 | | 550 |
| | — |
| |
| | Total MTNs | | | | 7,734 |
| | 6,459 |
| |
| | Principal Amount Outstanding | | | | 7,883 |
| | 6,879 |
| |
| | Amounts Due Within One Year | | | | — |
| | (171 | ) | |
| | Net Unamortized Discount and Debt Issuance Costs | | | | (65 | ) | | (58 | ) | |
| | Total Long-Term Debt of PSE&G | | | | $ | 7,818 |
| | $ | 6,650 |
| |
| | | | | | | | | |
|
| | | | | | | | | | | | |
| | | | | | | | | |
| | | | | | As of December 31, | |
| | | | Maturity | | 2018 | | 2017 | |
| | | | | | Millions | |
| | PSE&G | | | | | | | |
| | First and Refunding Mortgage Bonds (A): | | | | | | | |
| | 9.25% | | 2021 | | $ | 134 |
| | $ | 134 |
| |
| | 8.00% | | 2037 | | 7 |
| | 7 |
| |
| | 5.00% | | 2037 | | 8 |
| | 8 |
| |
| | Total First and Refunding Mortgage Bonds | | | | 149 |
| | 149 |
| |
| | Medium-Term Notes (MTNs) (A): | | | | | | | |
| | 5.30% | | 2018 | | — |
| | 400 |
| |
| | 2.30% | | 2018 | | — |
| | 350 |
| |
| | 1.80% | | 2019 | | 250 |
| | 250 |
| |
| | 2.00% | | 2019 | | 250 |
| | 250 |
| |
| | 3.50% | | 2020 | | 250 |
| | 250 |
| |
| | 7.04% | | 2020 | | 9 |
| | 9 |
| |
| | 1.90% | | 2021 | | 300 |
| | 300 |
| |
| | 2.38% | | 2023 | | 500 |
| | 500 |
| |
| | 3.25% | | 2023 | | 325 |
| | — |
| |
| | 3.75% | | 2024 | | 250 |
| | 250 |
| |
| | 3.15% | | 2024 | | 250 |
| | 250 |
| |
| | 3.05% | | 2024 | | 250 |
| | 250 |
| |
| | 3.00% | | 2025 | | 350 |
| | 350 |
| |
| | 2.25% | | 2026 | | 425 |
| | 425 |
| |
| | 3.00% | | 2027 | | 425 |
| | 425 |
| |
| | 3.70% | | 2028 | | 375 |
| | — |
| |
| | 3.65% | | 2028 | | 325 |
| | — |
| |
| | 5.25% | | 2035 | | 250 |
| | 250 |
| |
| | 5.70% | | 2036 | | 250 |
| | 250 |
| |
| | 5.80% | | 2037 | | 350 |
| | 350 |
| |
| | 5.38% | | 2039 | | 250 |
| | 250 |
| |
| | 5.50% | | 2040 | | 300 |
| | 300 |
| |
| | 3.95% | | 2042 | | 450 |
| | 450 |
| |
| | 3.65% | | 2042 | | 350 |
| | 350 |
| |
| | 3.80% | | 2043 | | 400 |
| | 400 |
| |
| | 4.00% | | 2044 | | 250 |
| | 250 |
| |
| | 4.05% | | 2045 | | 250 |
| | 250 |
| |
| | 4.15% | | 2045 | | 250 |
| | 250 |
| |
| | 3.80% | | 2046 | | 550 |
| | 550 |
| |
| | 3.60% | | 2047 | | 350 |
| | 350 |
| |
| | 4.05% | | 2048 | | 325 |
| | — |
| |
| | Total MTNs | | | | 9,109 |
| | 8,509 |
| |
| | Principal Amount Outstanding | | | | 9,258 |
| | 8,658 |
| |
| | Amounts Due Within One Year | | | | (500 | ) | | (750 | ) | |
| | Net Unamortized Discount and Debt Issuance Costs | | | | (74 | ) | | (67 | ) | |
| | Total Long-Term Debt of PSE&G | | | | $ | 8,684 |
| | $ | 7,841 |
| |
| | | | | | | | | |
NOTES TO CONSOLIDATED FINANCIAL STATEMENTS
|
| | | | | | | | | | | | |
| | | | | | | | | |
| | | | | | As of December 31, | |
| | | | Maturity | | 2016 | | 2015 | |
| | | | | | Millions | |
| | Power | | | | | | | |
| | Senior Notes: | | | | | | | |
| | 5.32% | | 2016 | | $ | — |
| | $ | 303 |
| |
| | 2.75% | | 2016 | | — |
| | 250 |
| |
| | 2.45% | | 2018 | | 250 |
| | 250 |
| |
| | 5.13% | | 2020 | | 406 |
| | 406 |
| |
| | 4.15% | | 2021 | | 250 |
| | 250 |
| |
| | 3.00% | | 2021 | | 700 |
| | — |
| |
| | 4.30% | | 2023 | | 250 |
| | 250 |
| |
| | 8.63% | | 2031 | | 500 |
| | 500 |
| |
| | Total Senior Notes | | | | 2,356 |
| | 2,209 |
| |
| | Pollution Control Notes: | | | | | | | |
| | Floating Rate (C) | | 2019 | | 44 |
| | 44 |
| |
| | Total Pollution Control Notes | | | | 44 |
| | 44 |
| |
| | Principal Amount Outstanding | | | | 2,400 |
| | 2,253 |
| |
| | Amounts Due Within One Year | | | | — |
| | (553 | ) | |
| | Net Unamortized Discount and Debt Issuance Costs | | | | (18 | ) | | (16 | ) | |
| | Total Long-Term Debt of Power | | | | $ | 2,382 |
| | $ | 1,684 |
| |
| | | | | | | | | |
|
| | | | | | | | | | | | |
| | | | | | | | | |
| | | | | | As of December 31, | |
| | | | Maturity | | 2018 | | 2017 | |
| | | | | | Millions | |
| | Power | | | | | | | |
| | Senior Notes: | | | | | | | |
| | 2.45% | | 2018 | | $ | — |
| | $ | 250 |
| |
| | 5.13% | | 2020 | | 406 |
| | 406 |
| |
| | 3.00% | | 2021 | | 700 |
| | 700 |
| |
| | 4.15% | | 2021 | | 250 |
| | 250 |
| |
| | 3.85% | | 2023 | | 700 |
| | — |
| |
| | 4.30% | | 2023 | | 250 |
| | 250 |
| |
| | 8.63% | | 2031 | | 500 |
| | 500 |
| |
| | Total Senior Notes | | | | 2,806 |
| | 2,356 |
| |
| | Pollution Control Notes: | | | | | | | |
| | Floating Rate (B) | | 2019 | | 44 |
| | 44 |
| |
| | Total Pollution Control Notes | | | | 44 |
| | 44 |
| |
| | Principal Amount Outstanding | | | | 2,850 |
| | 2,400 |
| |
| | Amounts Due Within One Year | | | | (44 | ) | | (250 | ) | |
| | Net Unamortized Discount and Debt Issuance Costs | | | | (15 | ) | | (14 | ) | |
| | Total Long-Term Debt of Power | | | | $ | 2,791 |
| | $ | 2,136 |
| |
| | | | | | | | | |
| |
| (A) | PSEG entered into various interest rate swaps to hedge the fair value of certain debt at Power. The fair value adjustments from these hedges are reflected as offsets to long-term debt on the Consolidated Balance Sheets. For additional information, see Note 16. Financial Risk Management Activities. |
| |
(B) | Secured by essentially all property of PSE&G pursuant to its First and Refunding Mortgage. |
| |
(C)(B) | The Pollution Control Financing Authority of Salem County bonds (Salem Bonds), which were repurchased and retired in 2016, and the Pennsylvania Economic Development Authority (PEDFA) bond that areis serviced and secured by PSE&G Pollution Control Bonds and Power Pollution Control Notes respectively, wereis a variable rate bondsbond that wereis in weekly reset mode. |
Long-Term Debt Maturities
The aggregate principal amounts of maturities for each of the five years following December 31, 20162018 are as follows:
|
| | | | | | | | | | | | | | | | | | |
| | | | | | | | | | | |
| | Year | | PSEG | | PSE&G | | Power | | Total | |
| | | | | |
| | 2017 | | $ | 500 |
| | $ | — |
| | $ | — |
| | $ | 500 |
| |
| | 2018 | | — |
| | 750 |
| | 250 |
| | 1,000 |
| |
| | 2019 | | 400 |
| | 500 |
| | 44 |
| | 944 |
| |
| | 2020 | | — |
| | 259 |
| | 406 |
| | 665 |
| |
| | 2021 | | 300 |
| | 434 |
| | 950 |
| | 1,684 |
| |
| | Thereafter | | — |
| | 5,940 |
| | 750 |
| | 6,690 |
| |
| | Total | | $ | 1,200 |
| | $ | 7,883 |
| | $ | 2,400 |
| | $ | 11,483 |
| |
| | | | | | | | | | | |
|
| | | | | | | | | | | | | | | | | | |
| | | | | | | | | | | |
| | Year | | PSEG | | PSE&G | | Power | | Total | |
| | | | | |
| | 2019 | | $ | 750 |
| | $ | 500 |
| | $ | 44 |
| | $ | 1,294 |
| |
| | 2020 | | 700 |
| | 259 |
| | 406 |
| | 1,365 |
| |
| | 2021 | | 300 |
| | 434 |
| | 950 |
| | 1,684 |
| |
| | 2022 | | 700 |
| | — |
| | — |
| | 700 |
| |
| | 2023 | | — |
| | 825 |
| | 950 |
| | 1,775 |
| |
| | Thereafter | | — |
| | 7,240 |
| | 500 |
| | 7,740 |
| |
| | Total | | $ | 2,450 |
| | $ | 9,258 |
| | $ | 2,850 |
| | $ | 14,558 |
| |
| | | | | | | | | | | |
Long-Term Debt Financing Transactions
During 2016,2018, PSEG and its subsidiaries had the following Long-Term Debt issuances, maturities and redemptions:
PSEG
issued $400entered into an agreement for a new term loan maturing November 2020. The term loan has a balance of $700 million at an interest rate of 1 month LIBOR + 0.60% and can be terminated at any time without penalty, and
redeemed $350 million of 1.60% Seniora $700 million term loan at an interest rate of 1 month LIBOR + 0.80% maturing June 2019.
PSE&G
issued $375 million of 3.70% Secured Medium-Term Notes, Series M, due November 2019, and
NOTES TO CONSOLIDATED FINANCIAL STATEMENTS
issued $300$325 million of 2.00% Senior Notes due November 2021
PSE&G
issued $300 million of 1.90%4.05% Secured Medium-Term Notes, Series KM, due March 2021,May 2048,
issued $550$325 million of 3.80%3.25% Secured Medium-Term Notes, Series KM, due March 2046,September 2023,
issued $425$325 million of 2.25%3.65% Secured Medium-Term Notes, Series LM, due September 2026,2028,
retired $171$400 million of 6.75% Secured First and Refunding Mortgage Bonds Series VV5.30% Medium-Term Notes at maturity, and
repurchased at par $100retired $350 million of Salem Bonds and retired a like aggregate principal amount of its First and Refunding Mortgage Bonds which serviced and secured the Salem Bonds.2.30% Medium-Term Notes at maturity.
Power
•issued $700 million of 3.00%3.85% Senior Notes due June 2021,2023, and
•retired $303$250 million of 5.32%2.45% Senior Notes due September 2016, andat maturity.
•retired $250 million of 2.75% Senior Notes due September 2016.
Short-Term Liquidity
PSEG meets its short-term liquidity requirements, as well as those of Power, primarily with cash and through the issuance of commercial paper. PSE&G maintains its own separate commercial paper program to meet its short-term liquidity requirements. Each commercial paper program is fully back-stopped by its own separate credit facilities.
The commitments under the $4.2 billion credit facilities are provided by a diverse bank group. As of December 31, 2016,2018, the total available credit capacity was $3.5$3.0 billion.
As of December 31, 2016,2018, no single institution represented more than 7%9% of the total commitments in the credit facilities.
As of December 31, 2016,2018, the total credit capacity was in excess of the anticipated maximum liquidity requirements.requirements over PSEG’s 12-month planning horizon.
Each of the credit facilities is restricted as to availability and use to the specific companies as listed in the following table; however, if necessary, the PSEG facilities can also be used to support our subsidiaries’ liquidity needs.
The total credit facilities and available liquidity as of December 31, 20162018 were as follows:
|
| | | | | | | | | | | | | | | | | | |
| | | | | | | | | | | | | |
| | | | As of December 31, 2016 | | | |
| | Company/Facility | | Total Facility | | Usage (D) | | Available Liquidity | | Expiration Date | | Primary Purpose | |
| | | | Millions | | | | | |
| | PSEG | | | | | | | | | | | |
| | 5-year Credit Facility | | $ | 500 |
| | $ | 10 |
| | $ | 490 |
| | Mar 2019 | | Commercial Paper Support/Funding/Letters of Credit | |
| | 5-year Credit Facility (A) | | 500 |
| | 388 |
| | 112 |
| | Apr 2020 | | Commercial Paper Support/Funding/Letters of Credit | |
| | Total PSEG | | $ | 1,000 |
| | $ | 398 |
| | $ | 602 |
| | | | | |
| | PSE&G | | | | | | | | | | | |
| | 5-year Credit Facility (B) | | $ | 600 |
| | $ | 14 |
| | $ | 586 |
| | Apr 2020 | | Commercial Paper Support/Funding/Letters of Credit | |
| | Total PSE&G | | $ | 600 |
| | $ | 14 |
| | $ | 586 |
| | | | | |
| | Power | | | | | | | | | | | |
| | 5-year Credit Facility | | $ | 1,600 |
| | $ | 195 |
| | $ | 1,405 |
| | Mar 2019 | | Funding/Letters of Credit | |
| | 5-year Credit Facility (C) | | 953 |
| | 3 |
| | 950 |
| | Apr 2020 | | Funding/Letters of Credit | |
| | Total Power | | $ | 2,553 |
| | $ | 198 |
| | $ | 2,355 |
| | | | | |
| | Total | | $ | 4,153 |
| | $ | 610 |
| | $ | 3,543 |
| | | | | |
| | | | | | | | | | | | | |
|
| | | | | | | | | | | | | | | | | | |
| | | | | | | | | | | | | |
| | | | As of December 31, 2018 | | | |
| | Company/Facility | | Total Facility | | Usage | | Available Liquidity | | Expiration Date | | Primary Purpose | |
| | | | Millions | | | | | |
| | PSEG | | | | | | | | | | | |
| | 5-year Credit Facilities (A) | | $ | 1,500 |
| | $ | 759 |
| | $ | 741 |
| | Mar 2022 | | Commercial Paper Support/Funding/Letters of Credit | |
| | Total PSEG | | $ | 1,500 |
| | $ | 759 |
| | $ | 741 |
| | | | | |
| | PSE&G | | | | | | | | | | | |
| | 5-year Credit Facility (A) | | $ | 600 |
| | $ | 288 |
| | $ | 312 |
| | Mar 2022 | | Commercial Paper Support/Funding/Letters of Credit | |
| | Total PSE&G | | $ | 600 |
| | $ | 288 |
| | $ | 312 |
| | | | | |
| | Power | | | | | | | | | | | |
| | 3-year Letter of Credit Facilities | | $ | 200 |
| | $ | 114 |
| | $ | 86 |
| | Sept 2021 | | Letters of Credit | |
| | 5-year Credit Facilities | | 1,900 |
| | 40 |
| | 1,860 |
| | Mar 2022 | | Funding/Letters of Credit | |
| | Total Power | | $ | 2,100 |
| | $ | 154 |
| | $ | 1,946 |
| | | | | |
| | Total | | $ | 4,200 |
| | $ | 1,201 |
| | $ | 2,999 |
| | | | | |
| | | | | | | | | | | | | |
| |
| (A) | PSEG facility will be reduced by $12 million in March 2018. |
| |
(B) | PSE&G facility will be reduced by $14 million in March 2018. |
NOTES TO CONSOLIDATED FINANCIAL STATEMENTS
| |
(C) | Power facility will be reduced by $24 million in March 2018. |
| |
(D) | The primary use of PSEG’s and PSE&G’s credit facilities is to support their respective Commercial Paper Programs under which as of December 31, 2016,2018, PSEG had $388$744 million outstanding at a weighted average interest rate of 1.03%2.95%. PSE&G had no amounts$272 million outstanding at a weighted average interest rate of 2.96% under its Commercial Paper Program as of December 31, 2016.2018. |
NOTES TO CONSOLIDATED FINANCIAL STATEMENTS
Fair Value of Debt
The estimated fair values, carrying amounts and methods used to determine fair value of long-term debt as of December 31, 20162018 and 20152017 are included in the following table and accompanying notes as of December 31, 20162018 and 2015.2017. See Note 17.18. Fair Value Measurements for more information on fair value guidance and the hierarchy that prioritizes the inputs to fair value measurements into three levels.
|
| | | | | | | | | | | | | | | | | | |
| | | | | | | | | | | |
| | | | December 31, 2016 | | December 31, 2015 | |
| | | | Carrying Amount | | Fair Value | | Carrying Amount | | Fair Value | |
| | | | Millions | |
| | Long-Term Debt: | | | | | | | | | |
| | PSEG (A) (B) | | $ | 1,195 |
| | $ | 1,185 |
| | $ | 503 |
| | $ | 506 |
| |
| | PSE&G (B) | | 7,818 |
| | 8,240 |
| | 6,821 |
| | 7,235 |
| |
| | Power - Recourse Debt (B) | | 2,382 |
| | 2,578 |
| | 2,237 |
| | 2,508 |
| |
| | Energy Holdings: | | | | | | | | | |
| | Project Level, Non-Recourse Debt (C) | | — |
| | — |
| | 7 |
| | 7 |
| |
| | | | $ | 11,395 |
| | $ | 12,003 |
| | $ | 9,568 |
| | $ | 10,256 |
| |
| | | | | | | | | | | |
|
| | | | | | | | | | | | | | | | | | |
| | | | | | | | | | | |
| | | | December 31, 2018 | | December 31, 2017 | |
| | | | Carrying Amount | | Fair Value | | Carrying Amount | | Fair Value | |
| | | | Millions | |
| | Long-Term Debt: | | | | | | | | | |
| | PSEG (A) (B) | | $ | 2,443 |
| | $ | 2,397 |
| | $ | 2,091 |
| | $ | 2,081 |
| |
| | PSE&G (B) | | 9,184 |
| | 9,374 |
| | 8,591 |
| | 9,322 |
| |
| | Power (B) | | 2,835 |
| | 2,996 |
| | 2,386 |
| | 2,659 |
| |
| | Total Long-Term Debt | | $ | 14,462 |
| | $ | 14,767 |
| | $ | 13,068 |
| | $ | 14,062 |
| |
| | | | | | | | | | | |
| |
| (A) | FairAs of December 31, 2018 and 2017, fair value includes a $500 million floating rate term loanloans of $1,050 million and net offsets.$700 million, respectively. The fair value of the term loan debt (Level 2 measurement) was considered to be equal toapproximates the carrying value because the interest payments are based on LIBOR rates that are reset monthly. As of December 31, 2015, carrying amount includes such fairmonthly and the debt is redeemable at face value reduced by the unamortized premium resulting from a debt exchange entered into between Power and Energy Holdings.PSEG at any time. |
| |
| (B) | Given that mostthese bonds do not trade actively, the fair value amounts of taxable debt securities (primarily Level 2 measurements) are generally determined by a valuation model that is based on a conventional discounted cash flow methodology and utilizes assumptions of current market pricing curves. In order to incorporate the credit risk into the discount rates, pricing is obtained (i.e. U.S. Treasury rate plus credit spread) based on expected new issue pricing across each of the companies’ respective debt maturity spectrum. The credit spreads of various tenors obtained from this information are added to the appropriate benchmark U.S. Treasury rates in order to determine the current market yields for the various tenors. The yields are then converted into discount rates of various tenors that are used for discounting the respective cash flows of the same tenor for each bond or note. |
| |
(C) | Non-recourse project debt was valued as equivalent to the amortized cost and is classified as a Level 3 measurement. |
Note 15.16. Schedule of Consolidated Capital Stock
|
| | | | | | | | | | | | | | | | |
| | | | | | | | | | | |
| | | | As of December 31, | |
| | | | Outstanding Shares | | Book Value | |
| | | | 2016 | | 2015 | | 2016 | | 2015 | |
| | | | | | | | Millions | |
| | PSEG Common Stock (no par value) (A) | | | | | | | | | |
| | Authorized 1,000,000,000 shares | | 504,866,212 |
| | 505,282,421 |
| | $ | 4,219 |
| | $ | 4,244 |
| |
| | | | | | | | | | | |
|
| | | | | | | | | | | | | | | | |
| | | | | | | | | | | |
| | | | As of December 31, | |
| | | | Outstanding Shares | | Book Value | |
| | | | 2018 | | 2017 | | 2018 | | 2017 | |
| | | | Millions | |
| | PSEG Common Stock (no par value) (A) | | | | | | | | | |
| | Authorized 1,000 shares | | 504 |
| | 505 |
| | $ | 4,172 |
| | $ | 4,198 |
| |
| | | | | | | | | | | |
| |
| (A) | PSEG did not issue any new shares under the Dividend Reinvestment and Stock Purchase Plan (DRASPP) or the Employee Stock Purchase Plan (ESPP) in 20162018 or 2015. Total authorized and unissued shares of common stock available for issuance through PSEG’s DRASPP, ESPP and various employee benefit plans amounted to approximately 7 million shares as of December 31, 2016. 2017. |
As of December 31, 20162018, PSE&G had an aggregate of 7.5 million shares of $100 par value and 10 million shares of $25 par value Cumulative Preferred Stock, which were authorized and unissued and which, upon issuance, may or may not provide for mandatory sinking fund redemption.
NOTES TO CONSOLIDATED FINANCIAL STATEMENTS
Note 16.17. Financial Risk Management Activities
Derivative accounting guidance requires that a derivative instrument be recognized as either an asset or a liability at fair value, with changes in fair value of the derivative recognized in earnings each period. Other accounting treatments are available through special election and designation provided that the derivative instrument meets specific, restrictive criteria, both at the time of designation and on an ongoing basis. These alternative permissible treatments include NPNS, cash flow hedge and fair value hedge accounting. PSEG, Power and PSE&G have applied the NPNS scope exception to certain derivative contracts for the forward sale of generation, power procurement agreements and fuel agreements. PSEG uses interest rate swaps and other derivatives, which are designated and effective as cash flow or fair value hedges. Power and PSE&G enterenters into additional contracts that are derivatives, but are not designated as either cash flow hedges or fair value hedges. These transactions are economic hedges and are recorded at fair market value.
Commodity Prices
Within PSEG and its affiliate companies, Power has the most exposure to commodity price risk. Power is exposed to commodity price risk primarily relating to changes in the market price of electricity, fossil fuels and other commodities. Fluctuations in market prices result from changes in supply and demand, fuel costs, market conditions, weather, state and federal regulatory policies, environmental policies, transmission availability and other factors. Power uses a variety of derivative and non-derivative instruments, such as financial options, futures, swaps, fuel purchases and forward purchases and sales of electricity, to manage the exposure to fluctuations in commodity prices and optimize the value of Power’s expected generation. Power also uses derivatives to hedge a portion of its anticipated BGSS obligations with PSE&G. For additional information see Note 14. Commitments and Contingent Liabilities. Changes in the fair market value of thethese derivative contracts are recorded in earnings.
Interest Rates
PSEG, Power and PSE&G are subject to the risk of fluctuating interest rates in the normal course of business. Exposure to this risk is managed by targeting a balanced debt maturity profile which limits refinancing in any given period or interest rate environment. In addition, they have used a mix of fixed and floating rate debt and interest rate swaps.
Fair Value Hedges
PSEG enters into fair value hedges to convert fixed-rate debt into variable-rate debt. The changes in fair value of the interest rate swaps are fully offset by changes in the fair value of the underlying forecasted interest payments of the debt. Interest rate swaps totaling $550 million that converted Power’s Senior Notes due September 2016 into variable-rate debt matured in the third quarter of 2016. There were no outstanding interest rate swaps as of December 31, 2016. As of December 31, 2015, the fair value of all the underlying hedges was $6 million.2018 or 2017. The fair value hedges reduced interest expense by $6 million $19 million and $20 million for the yearsyear ended December 31, 2016, 2015 and 2014, respectively.2016.
Cash Flow Hedges
PSEG uses interest rate swaps and other derivatives, which are designated and effective as cash flow hedges, to manage its exposure to the variability of cash flows, primarily related to variable-rate debt instruments. As of December 31, 2016, PSEG had interest rate hedges outstanding totaling $500 million. These hedgesmillion were executed and terminated during the firstsecond quarter of 20162018 and convert PSEG’s $500a loss of $(1) million variable rate term loanwas recorded in Accumulated Other Comprehensive Income (Loss) (after tax) and will amortize to interest expense over the remaining life of Power’s $700 million of 3.85% Senior Notes due November 2017 into a fixed rate loan. The fair value of these hedges was $1 millionJune 2023. For additional information see Note 15. Debt and there was no ineffectiveness as of December 31, 2016.Credit Facilities. There were no outstanding interest rate hedges as of December 31, 2015.
PSEG executed forward starting swaps totaling $400 million during the first quarter of 2016 which were terminated upon the issuance of Power’s $700 million of 3.00% Senior Notes due June 2021. In the fourth quarter of 2016, PSEG executed $500 million of forward starting swaps which were terminated upon the issuance of PSEG’s $400 million of 1.6% Senior Notes due November 20192018 and $300 million of 2.0% Senior Notes due November 2021. For additional information see Note 14. Debt and Credit Facilities.
December 31, 2017. The Accumulated Other Comprehensive Income (Loss) (after tax) related to existing and terminated interest rate derivatives designated as cash flow hedges was $(1) million as of December 31, 2018, immaterial as of December 31, 2017 and $2 million as of December 31, 2016 and immaterial as of December 31, 2015.2016. The after-tax unrealized gains (losses) on these hedges expected to be reclassified to earnings during the next 12 months is $1 million.immaterial.
Fair Values of Derivative Instruments
The following are the fair values of derivative instruments on the Consolidated Balance Sheets. The following tables also include disclosures for offsetting derivative assets and liabilities which are subject to a master netting or similar agreement. In general, the terms of the agreements provide that in the event of an early termination the counterparties have the right to offset amounts owed or owing under that and any other agreement with the same counterparty. Accordingly, and in accordance with PSEG’s accounting policy, these positions are offset on the Consolidated Balance Sheets of Power and PSEG.
NOTES TO CONSOLIDATED FINANCIAL STATEMENTS
The following tabular disclosure does not include the offsetting of trade receivables and payables.
|
| | | | | | | | | | | | | | | | | | | | | | | | | | |
| | | | | | | | | | | | | | | |
| | | As of December 31, 2016 | |
| | | Power (A) | | PSE&G (A) | | PSEG (A) | | Consolidated | |
| | | | Not Designated | | | | | | Not Designated | | Cash Flow Hedges | | | |
| | Balance Sheet Location | | Energy- Related Contracts | | Netting (B) | | Total Power | | Energy- Related Contracts | | Interest Rate Swaps | | Total Derivatives | |
| | | Millions | |
| | Derivative Contracts | | | | | | | | | | | | | |
| | Current Assets | | $ | 435 |
| | $ | (273 | ) | | $ | 162 |
| | $ | — |
| | $ | 1 |
| | $ | 163 |
| |
| | Noncurrent Assets | | 122 |
| | (98 | ) | | 24 |
| | — |
| | — |
| | 24 |
| |
| | Total Mark-to-Market Derivative Assets | | $ | 557 |
| | $ | (371 | ) | | $ | 186 |
| | $ | — |
| | $ | 1 |
| | $ | 187 |
| |
| | Derivative Contracts | | | | | | | | | | | | | |
| | Current Liabilities | | $ | (285 | ) | | $ | 277 |
| | $ | (8 | ) | | $ | (5 | ) | | $ | — |
| | $ | (13 | ) | |
| | Noncurrent Liabilities | | (98 | ) | | 95 |
| | (3 | ) | | — |
| | — |
| | (3 | ) | |
| | Total Mark-to-Market Derivative (Liabilities) | | $ | (383 | ) | | $ | 372 |
| | $ | (11 | ) | | $ | (5 | ) | | $ | — |
| | $ | (16 | ) | |
| | Total Net Mark-to-Market Derivative Assets (Liabilities) | | $ | 174 |
| | $ | 1 |
| | $ | 175 |
| | $ | (5 | ) | | $ | 1 |
| | $ | 171 |
| |
| | | | | | | | | | | | | | | |
|
| | | | | | | | | | | | | | | | | | |
| | | | | | | | | | | |
| | | As of December 31, 2018 | |
| | | Power (A) | | Consolidated | |
| | | | Not Designated | | | | | | | |
| | Balance Sheet Location | | Energy- Related Contracts | | Netting (B) | | Total Power | | Total Derivatives | |
| | | Millions | |
| | Derivative Contracts | | | | | | | | | |
| | Current Assets | | $ | 426 |
| | $ | (415 | ) | | $ | 11 |
| | $ | 11 |
| |
| | Noncurrent Assets | | 137 |
| | (136 | ) | | 1 |
| | 1 |
| |
| | Total Mark-to-Market Derivative Assets | | $ | 563 |
| | $ | (551 | ) | | $ | 12 |
| | $ | 12 |
| |
| | Derivative Contracts | | | | | | | | | |
| | Current Liabilities | | $ | (521 | ) | | $ | 510 |
| | $ | (11 | ) | | $ | (11 | ) | |
| | Noncurrent Liabilities | | (198 | ) | | 194 |
| | (4 | ) | | (4 | ) | |
| | Total Mark-to-Market Derivative (Liabilities) | | $ | (719 | ) | | $ | 704 |
| | $ | (15 | ) | | $ | (15 | ) | |
| | Total Net Mark-to-Market Derivative Assets (Liabilities) | | $ | (156 | ) | | $ | 153 |
| | $ | (3 | ) | | $ | (3 | ) | |
| | | | | | | | | | | |
|
| | | | | | | | | | | | | | | | | | | | | | | | | | |
| | | | | | | | | | | | | | | |
| | | As of December 31, 2015 | |
| | | Power (A) | | PSE&G (A) | | PSEG (A) | | Consolidated | |
| | | | Not Designated | | | | | | Not Designated | | Fair Value Hedges | | | |
| | Balance Sheet Location | | Energy- Related Contracts | | Netting (B) | | Total Power | | Energy- Related Contracts | | Interest Rate Swaps | | Total Derivatives | |
| | | Millions | |
| | Derivative Contracts | | | | | | | | | | | | | |
| | Current Assets | | $ | 700 |
| | $ | (477 | ) | | $ | 223 |
| | $ | 13 |
| | $ | 6 |
| | $ | 242 |
| |
| | Noncurrent Assets | | 208 |
| | (131 | ) | | 77 |
| | — |
| | — |
| | 77 |
| |
| | Total Mark-to-Market Derivative Assets | | $ | 908 |
| | $ | (608 | ) | | $ | 300 |
| | $ | 13 |
| | $ | 6 |
| | $ | 319 |
| |
| | Derivative Contracts | | | | | | | | | | | | | |
| | Current Liabilities | | $ | (513 | ) | | $ | 437 |
| | $ | (76 | ) | | $ | — |
| | $ | — |
| | $ | (76 | ) | |
| | Noncurrent Liabilities | | (132 | ) | | 116 |
| | (16 | ) | | (11 | ) | | — |
| | (27 | ) | |
| | Total Mark-to-Market Derivative (Liabilities) | | $ | (645 | ) | | $ | 553 |
| | $ | (92 | ) | | $ | (11 | ) | | $ | — |
| | $ | (103 | ) | |
| | Total Net Mark-to-Market Derivative Assets (Liabilities) | | $ | 263 |
| | $ | (55 | ) | | $ | 208 |
| | $ | 2 |
| | $ | 6 |
| | $ | 216 |
| |
| | | | | | | | | | | | | | | |
|
| | | | | | | | | | | | | | | | | | |
| | | | | | | | | | | |
| | | As of December 31, 2017 | |
| | | Power (A) | | Consolidated | |
| | | | Not Designated | | | | | | | |
| | Balance Sheet Location | | Energy- Related Contracts | | Netting (B) | | Total Power | | Total Derivatives | |
| | | Millions | |
| | Derivative Contracts | | | | | | | | | |
| | Current Assets | | $ | 391 |
| | $ | (362 | ) | | $ | 29 |
| | $ | 29 |
| |
| | Noncurrent Assets | | 78 |
| | (71 | ) | | 7 |
| | 7 |
| |
| | Total Mark-to-Market Derivative Assets | | $ | 469 |
| | $ | (433 | ) | | $ | 36 |
| | $ | 36 |
| |
| | Derivative Contracts | | | | | | | | | |
| | Current Liabilities | | $ | (403 | ) | | $ | 387 |
| | $ | (16 | ) | | $ | (16 | ) | |
| | Noncurrent Liabilities | | (95 | ) | | 90 |
| | (5 | ) | | (5 | ) | |
| | Total Mark-to-Market Derivative (Liabilities) | | $ | (498 | ) | | $ | 477 |
| | $ | (21 | ) | | $ | (21 | ) | |
| | Total Net Mark-to-Market Derivative Assets (Liabilities) | | $ | (29 | ) | | $ | 44 |
| | $ | 15 |
| | $ | 15 |
| |
| | | | | | | | | | | |
| |
| (A) | Substantially all of Power's and PSEG's derivative instruments are contracts subject to master netting agreements. Contracts not subject to master netting or similar agreements are immaterial and did not have any collateral posted or received as of December 31, 20162018 and 2015.2017. PSE&G does not have any derivative contracts subject to master netting or similar agreements. |
| |
| (B) | Represents the netting of fair value balances with the same counterparty (where the right of offset exists) and the application of collateral. All cash collateral received or posted that has been allocated to derivative positions, where the right of offset exists, has been offset on the Consolidated Balance Sheets. As of December 31, 20162018 and 2015,2017, Power had net cash collateral (received) paidcollateral/margin payments to counterparties of $1$393 million and $(55)$146 million,, respectively, respectively. Of these net cash collateral/margin payments, $153 million as of December 31, 2018 and $44 million as of December 31, 2017 were netted against the corresponding net derivative contract positions. Of the $153 million as of December 31, 2018, $(2) million was netted against current assets, $(3) million was netted against noncurrent assets, $96 million was netted against current liabilities and $62 million was netted against noncurrent |
NOTES TO CONSOLIDATED FINANCIAL STATEMENTS
derivative contract positions.liabilities. Of the $1$44 million as of December 31, 2016,2017, $(3) million was netted against noncurrentcurrent assets, and $4$28 million was netted against current liabilities. Of the $(55)liabilities and $19 million as of December 31, 2015, cash collateral of $(53) million and $(16) million werewas netted against current assets and noncurrent assets, respectively, and $12 million and $2 million were netted against current liabilities and noncurrent liabilities, respectively.liabilities.
Certain of Power’s derivative instruments contain provisions that require Power to post collateral. This collateral may be posted in the form of cash or credit support with thresholds contingent upon Power’s credit rating from each of the major credit rating agencies. The collateral and credit support requirements vary by contract and by counterparty. These credit risk-related contingent features stipulate that if Power were to be downgraded to a below investment grade rating by S&P or Moody’s, it would be required to provide additional collateral. A below investment grade credit rating for Power would represent a three level downgrade from its current S&P or Moody’s ratings. This incremental collateral requirement can offset collateral requirements related to other derivative instruments that are assets with the same counterparty, where the contractual right of offset exists under applicable master agreements. Power also enters into commodity transactions on the New York Mercantile Exchange (NYMEX) and Intercontinental Exchange (ICE). The NYMEX and ICE clearing houses act as counterparties to each trade. Transactions on the NYMEX and ICE must adhere to comprehensive collateral and margin requirements.
The aggregate fair value of all derivative instruments with credit risk-related contingent features in a liability position that are not fully collateralized (excluding transactions on the NYMEX and ICE that are fully collateralized) was $19$22 million and $78$30 million as of December 31, 20162018 and 2015,2017, respectively. As of December 31, 20162018 and 2015,2017, Power had the contractual right of offset of $9$7 million and $12$13 million, respectively, related to derivative instruments that are assets with the same counterparty under master agreements and net of margin posted. If Power had been downgraded to a below investment grade rating, it would have had additional collateral obligations of $10$15 million and $66$17 million as of December 31, 20162018 and 2015,2017, respectively, related to its derivatives, net of the contractual right of offset under master agreements and the application of collateral.
The following shows the effect on the Consolidated Statements of Operations and on Accumulated Other Comprehensive Income (AOCI)Loss (AOCL) of derivative instruments designated as cash flow hedges for the years ended December 31, 2016, 20152018, 2017 and 2014.2016.
|
| | | | | | | | | | | | | | | | | | | | | | | | | | | | |
| | | | | | | | | | | | | | | | | |
| | | | Amount of Pre-Tax Gain (Loss) Recognized in AOCI on Derivatives (Effective Portion) | | Location of Pre-Tax Gain (Loss) Reclassified from AOCI into Income | | Amount of Pre-Tax Gain (Loss) Reclassified from AOCI into Income (Effective Portion) | |
| | Derivatives in Cash Flow Hedging Relationships | Years Ended December 31, | | | | Years Ended December 31, | |
| | | | 2016 | | 2015 | | 2014 | | | | 2016 | | 2015 | | 2014 | |
| | | | Millions | | | | Millions | |
| | PSEG | | | | | | | | | | | | | | | |
| | Energy-Related Contracts | | $ | — |
| | $ | 3 |
| | $ | 12 |
| | Operating Revenues | | $ | — |
| | $ | 20 |
| | $ | (9 | ) | |
| | Interest Rate Swaps | | 3 |
| | — |
| | — |
| | Interest Expense | | — |
| | — |
| | — |
| |
| | Total PSEG | | $ | 3 |
| | $ | 3 |
| | $ | 12 |
| | | | $ | — |
| | $ | 20 |
| | $ | (9 | ) | |
| | Power | | | | | | | | | | | | | | | |
| | Energy-Related Contracts | | $ | — |
| | $ | 3 |
| | $ | 12 |
| | Operating Revenues | | $ | — |
| | $ | 20 |
| | $ | (9 | ) | |
| | Total Power | | $ | — |
| | $ | 3 |
| | $ | 12 |
| | | | $ | — |
| | $ | 20 |
| | $ | (9 | ) | |
| | | | | | | | | | | | | | | | | |
|
| | | | | | | | | | | | | | | | | | | | | | | | | | | | |
| | | | | | | | | | | | | | | | | |
| | | | Amount of Pre-Tax Gain (Loss) Recognized in AOCL on Derivatives (Effective Portion) | | Location of Pre-Tax Gain (Loss) Reclassified from AOCL into Income | | Amount of Pre-Tax Gain (Loss) Reclassified from AOCL into Income (Effective Portion) | |
| | Derivatives in Cash Flow Hedging Relationships | Years Ended December 31, | | | | Years Ended December 31, | |
| | | | 2018 | | 2017 | | 2016 | | | | 2018 | | 2017 | | 2016 | |
| | | | Millions | | | | Millions | |
| | PSEG | | | | | | | | | | | | | | | |
| | Interest Rate Swaps | | $ | (2 | ) | | $ | — |
| | $ | 3 |
| | Interest Expense | | $ | — |
| | $ | 3 |
| | $ | — |
| |
| | Total PSEG | | $ | (2 | ) | | $ | — |
| | $ | 3 |
| | | | $ | — |
| | $ | 3 |
| | $ | — |
| |
| | | | | | | | | | | | | | | | | |
There were no pre-tax gain (loss)gains (losses) recognized in income on derivatives (ineffective portion) as of December 31, 2016, 20152018, 2017 and 2014.
NOTES TO CONSOLIDATED FINANCIAL STATEMENTS
2016.
The following reconciles the AOCIAccumulated Other Comprehensive Income (Loss) for derivative activity included in the Accumulated Other Comprehensive LossAOCL of PSEG on a pre-tax and after-tax basis.
|
| | | | | | | | | | |
| | | | | | | |
| | Accumulated Other Comprehensive Income | | Pre-Tax | | After-Tax | |
| | | | Millions | |
| | Balance as of December 31, 2014 | | $ | 17 |
| | $ | 10 |
| |
| | Gain Recognized in AOCI | | 3 |
| | 2 |
| |
| | Less: Gain Reclassified into Income | | (20 | ) | | (12 | ) | |
| | Balance as of December 31, 2015 | | $ | — |
| | $ | — |
| |
| | Gain Recognized in AOCI | | 3 |
| | 2 |
| |
| | Less: Gain Reclassified into Income | | — |
| | — |
| |
| | Balance as of December 31, 2016 | | $ | 3 |
| | $ | 2 |
| |
| | | | | | | |
|
| | | | | | | | | | |
| | | | | | | |
| | Accumulated Other Comprehensive Income (Loss) | | Pre-Tax | | After-Tax | |
| | | | Millions | |
| | Balance as of December 31, 2016 | | $ | 3 |
| | $ | 2 |
| |
| | Gain Recognized in AOCI | | — |
| | — |
| |
| | Less: Gain Reclassified into Income | | (3 | ) | | (2 | ) | |
| | Balance as of December 31, 2017 | | $ | — |
| | $ | — |
| |
| | Loss Recognized in AOCI | | (2 | ) | | (1 | ) | |
| | Less: Loss Reclassified into Income | | — |
| | — |
| |
| | Balance as of December 31, 2018 | | $ | (2 | ) | | $ | (1 | ) | |
| | | | | | | |
The following shows the effect on the Consolidated Statements of Operations of derivative instruments not designated as hedging instruments or as NPNS for the years ended December 31, 20162018, 20152017 and 20142016.
|
| | | | | | | | | | | | | | | | |
| | | | | | | | | | | |
| | Derivatives Not Designated as Hedges | | Location of Pre-Tax Gain (Loss) Recognized in Income on Derivatives | | Pre-Tax Gain (Loss) Recognized in Income on Derivatives | |
| | | | | | Years Ended December 31, | |
| | | | | | 2016 | | 2015 | | 2014 | |
| | | | | | Millions | |
| | PSEG and Power | | | | | | | | | |
| | Energy-Related Contracts | | Operating Revenues | | $ | 230 |
| | $ | 412 |
| | $ | (348 | ) | |
| | Energy-Related Contracts | | Energy Costs | | (8 | ) | | (8 | ) | | 32 |
| |
| | Total PSEG and Power | | | | $ | 222 |
| | $ | 404 |
| | $ | (316 | ) | |
| | | | | | | | | | | |
Power’s derivative contracts reflected in the preceding tablesthis table include contracts to hedge the purchase and sale of electricity and natural gas, and the purchase of fuel. The tables above dotable does not include contracts for which Power has designated as NPNS, such as its BGS contracts and certain other energy supply
NOTES TO CONSOLIDATED FINANCIAL STATEMENTS
contracts that it has with other utilities and companies with retail load.
|
| | | | | | | | | | | | | | | | |
| | | | | | | | | | | |
| | Derivatives Not Designated as Hedges | | Location of Pre-Tax Gain (Loss) Recognized in Income on Derivatives | | Pre-Tax Gain (Loss) Recognized in Income on Derivatives | |
| | | | | | Years Ended December 31, | |
| | | | | | 2018 | | 2017 | | 2016 | |
| | | | | | Millions | |
| | PSEG and Power | | | | | | | | | |
| | Energy-Related Contracts | | Operating Revenues | | $ | (182 | ) | | $ | 66 |
| | $ | 218 |
| |
| | Energy-Related Contracts | | Energy Costs | | (9 | ) | | (11 | ) | | 4 |
| |
| | Total PSEG and Power | | | | $ | (191 | ) | | $ | 55 |
| | $ | 222 |
| |
| | | | | | | | | | | |
The following reflectstable summarizes the grossnet notional volume on an absolute value basis,purchases/(sales) of derivativesopen derivative transactions by commodity as of December 31, 20162018 and 2015.2017.
|
| | | | | | | | | | | | | | | | |
| | | | | | | | | | | | | |
| | Type | | Notional | | Total | | PSEG | | Power | | PSE&G | |
| | | | Millions | |
| | As of December 31, 2016 | | | | | | | | | | | |
| | Natural Gas | | Dth | | 357 |
| | — |
| | 348 |
| | 9 |
| |
| | Electricity | | MWh | | 323 |
| | — |
| | 323 |
| | — |
| |
| | Financial Transmission Rights (FTRs) | | MWh | | 9 |
| | — |
| | 9 |
| | — |
| |
| | Interest Rate Swaps | | U.S. Dollars | | 500 |
| | 500 |
| | — |
| | — |
| |
| | As of December 31, 2015 | | | | | | | | | | | |
| | Natural Gas | | Dth | | 201 |
| | — |
| | 168 |
| | 33 |
| |
| | Electricity | | MWh | | 299 |
| | — |
| | 299 |
| | — |
| |
| | FTRs | | MWh | | 23 |
| | — |
| | 23 |
| | — |
| |
| | Interest Rate Swaps | | U.S. Dollars | | 550 |
| | 550 |
| | — |
| | — |
| |
| | | | | | | | | | | | | |
NOTES TO CONSOLIDATED FINANCIAL STATEMENTS
|
| | | | | | | | | | | | | | | | |
| | | | | | | | | | | | | |
| | Type | | Notional | | Total | | PSEG | | Power | | PSE&G | |
| | | | Millions | |
| | As of December 31, 2018 | | | | | | | | | | | |
| | Natural Gas | | Dth | | 358 |
| | — |
| | 358 |
| | — |
| |
| | Electricity | | MWh | | (74 | ) | | — |
| | (74 | ) | | — |
| |
| | Financial Transmission Rights (FTRs) | | MWh | | 18 |
| | — |
| | 18 |
| | — |
| |
| | As of December 31, 2017 | | | | | | | | | | | |
| | Natural Gas | | Dth | | 154 |
| | — |
| | 154 |
| | — |
| |
| | Electricity | | MWh | | (63 | ) | | — |
| | (63 | ) | | — |
| |
| | FTRs | | MWh | | 6 |
| | — |
| | 6 |
| | — |
| |
| | | | | | | | | | | | | |
Credit Risk
Credit risk relates to the risk of loss that Power would incur as a result of non-performance by counterparties pursuant to the terms of their contractual obligations. PSEG has established credit policies that it believes significantly minimize credit risk. These policies include an evaluation of potential counterparties’ financial condition (including credit rating), collateral requirements under certain circumstances and the use of standardized agreements, which allow for the netting of positive and negative exposures associated with a single counterparty. In the event of non-performance or non-payment by a major counterparty, there may be a material adverse impact on Power’s and PSEG’s financial condition, results of operations or net cash flows.
As of December 31, 2016, 93% of the net credit exposure for Power’s operations was with investment grade counterparties. Credit exposure is defined as any positive results of netting accounts receivable/accounts payable and the forward value of open positions (which includes all financial instruments including derivatives, NPNS and non-derivatives).
The following table provides information on Power’s credit risk from others,wholesale counterparties, net of collateral, as of December 31, 2016.2018. It further delineates that exposure by the credit rating of the counterparties, which is determined by the lowest rating from S&P, Moody’s or an internal scoring model. In addition, it provides guidance on the concentration of credit risk to individual counterparties and an indication of the quality of Power’s credit risk by credit rating of the counterparties.
As of December 31, 2018, 99% of the net credit exposure for Power’s operations was with investment grade counterparties. Credit exposure is defined as any positive results of netting accounts receivable/accounts payable and the forward value of open positions (which includes all financial instruments including derivatives, NPNS and non-derivatives).
|
| | | | | | | | | | | | | | | | | | | | | | |
| | | | | | | | | | | | | | |
| | Rating | | Current Exposure | | Securities held as Collateral | | Net Exposure | | Number of Counterparties >10% | | Net Exposure of Counterparties >10% | | |
| | | | Millions | | | | Millions | | |
| | Investment Grade | | $ | 423 |
| | $ | 94 |
| | $ | 329 |
| | 1 |
| | $ | 219 |
| (A) | |
| | Non-Investment Grade | | 26 |
| | 1 |
| | 25 |
| | — |
| | — |
| | |
| | Total | | $ | 449 |
| | $ | 95 |
| | $ | 354 |
| | 1 |
| | $ | 219 |
| | |
| | | | | | | | | | | | | | |
|
| | | | | | | | | | | | | | | | | | | | | | |
| | | | | | | | | | | | | | |
| | Rating | | Current Exposure | | Securities held as Collateral | | Net Exposure | | Number of Counterparties >10% | | Net Exposure of Counterparties >10% | | |
| | | | Millions | | | | Millions | | |
| | Investment Grade | | $ | 264 |
| | $ | 12 |
| | $ | 252 |
| | 1 |
| | $ | 179 |
| (A) | |
| | Non-Investment Grade | | 1 |
| | — |
| | 1 |
| | — |
| | — |
| | |
| | Total | | $ | 265 |
| | $ | 12 |
| | $ | 253 |
| | 1 |
| | $ | 179 |
| | |
| | | | | | | | | | | | | | |
| |
| (A) | Represents net exposure with PSE&G. |
NOTES TO CONSOLIDATED FINANCIAL STATEMENTS
As of December 31, 2016,2018, collateral held from counterparties where Power had credit exposure included $1 million in cash collateral and $94includes $12 million in letters of credit.
As of December 31, 20162018, Power had 149151 active counterparties.
PSE&G’s supplier master agreements are approved by the BPU and govern the terms of its electric supply procurement contracts. These agreements define a supplier’s performance assurance requirements and allow a supplier to meet its credit requirements with a certain amount of unsecured credit. The amount of unsecured credit is determined based on the supplier’s credit ratings from the major credit rating agencies and the supplier’s tangible net worth. The credit position is based on the initial market price, which is the forward price of energy on the day the procurement transaction is executed, compared to the forward price curve for energy on the valuation day. To the extent that the forward price curve for energy exceeds the initial market price, the supplier is required to post a parental guaranty or other security instrument such as a letter of credit or cash, as collateral to the extent the credit exposure is greater than the supplier’s unsecured credit limit. As of December 31, 2016,2018, primarily all of the posted collateral was in the form of parental guarantees. The unsecured credit used by the suppliers represents PSE&G’s net credit exposure. PSE&G’s BGS suppliers’ credit exposure is calculated each business day. As of December 31, 2016,2018, PSE&G had no net credit exposure with suppliers, including Power.
PSE&G is permitted to recover its costs of procuring energy through the BPU-approved BGS tariffs. PSE&G’s counterparty credit risk is mitigated by its ability to recover realized energy costs through customer rates.
NOTES TO CONSOLIDATED FINANCIAL STATEMENTS
Note 17.18. Fair Value Measurements
Fair value is the price that would be received to sell an asset or paid to transfer a liability in an orderly transaction between market participants at the measurement date. Accounting guidance for fair value measurement emphasizes that fair value is a market-based measurement, not an entity-specific measurement, and establishes a fair value hierarchy that distinguishes between assumptions based on market data obtained from independent sources and those based on an entity’s own assumptions. The hierarchy prioritizes the inputs to fair value measurement into three levels:
Level 1—measurements utilize quoted prices (unadjusted) in active markets for identical assets or liabilities that PSEG, PSE&G and Power have the ability to access. These consist primarily of listed equity securities and money market mutual funds, as well as natural gas futures contracts executed on NYMEX.
Level 2—measurements include quoted prices for similar assets and liabilities in active markets, quoted prices for identical or similar assets or liabilities in markets that are not active, and other observable inputs such as interest rates and yield curves that are observable at commonly quoted intervals. These consist primarily of non-exchange traded derivatives such as forward contracts or options and most fixed income securities.
Level 3—measurements use unobservable inputs for assets or liabilities, based on the best information available and might include an entity’s own data and assumptions. In some valuations, the inputs used may fall into different levels of the hierarchy. In these cases, the financial instrument’s level within the fair value hierarchy is based on the lowest level of input that is significant to the fair value measurement. As of December 31, 2016,2018, these consisted primarily of gas supply contracts and certain electric load contracts and gas contracts.
Certain derivative transactions may transfer from Level 2 to Level 3 if inputs become unobservable and internal modeling techniques are employed to determine fair value. Conversely, measurements may transfer from Level 3 to Level 2 if the inputs become observable.
The following tables present information about PSEG’s, PSE&G’s and Power’s respective assets and (liabilities) measured at fair value on a recurring basis as of December 31, 20162018 and December 31, 2015,2017, including the fair value measurements and the levels of inputs used in determining those fair values. Amounts shown for PSEG include the amounts shown for PSE&G and Power.
NOTES TO CONSOLIDATED FINANCIAL STATEMENTS
|
| | | | | | | | | | | | | | | | | | | | | | |
| | | | | | | | | | | | | |
| | | | Recurring Fair Value Measurements as of December 31, 2018 | |
| | Description | | Total | | Netting (D) | | Quoted Market Prices for Identical Assets (Level 1) | | Significant Other Observable Inputs (Level 2) | | Significant Unobservable Inputs (Level 3) | |
| | | | Millions | |
| | PSEG | | | | | | | | | | | |
| | Assets: | | | | | | | | | | | |
| | Cash Equivalents (A) | | $ | 100 |
| | $ | — |
| | $ | 100 |
| | $ | — |
| | $ | — |
| |
| | Derivative Contracts: | | | | | | | | | | | |
| | Energy-Related Contracts (B) | | $ | 12 |
| | $ | (551 | ) | | $ | 29 |
| | $ | 527 |
| | $ | 7 |
| |
| | NDT Fund (C) | | | | | | | | | | | |
| | Equity Securities | | $ | 900 |
| | $ | — |
| | $ | 898 |
| | $ | 2 |
| | $ | — |
| |
| | Debt Securities—U.S. Treasury | | $ | 171 |
| | $ | — |
| | $ | — |
| | $ | 171 |
| | $ | — |
| |
| | Debt Securities—Govt Other | | $ | 320 |
| | $ | — |
| | $ | — |
| | $ | 320 |
| | $ | — |
| |
| | Debt Securities—Corporate | | $ | 487 |
| | $ | — |
| | $ | — |
| | $ | 487 |
| | $ | — |
| |
| | Rabbi Trust (C) | | | | | | | | | | | |
| | Equity Securities | | $ | 23 |
| | $ | — |
| | $ | 23 |
| | $ | — |
| | $ | — |
| |
| | Debt Securities—U.S. Treasury | | $ | 69 |
| | $ | — |
| | $ | — |
| | $ | 69 |
| | $ | — |
| |
| | Debt Securities—Govt Other | | $ | 40 |
| | $ | — |
| | $ | — |
| | $ | 40 |
| | $ | — |
| |
| | Debt Securities—Corporate | | $ | 92 |
| | $ | — |
| | $ | — |
| | $ | 92 |
| | $ | — |
| |
| | Liabilities: | | | | | | | | | | | |
| | Derivative Contracts: | | | | | | | | | | | |
| | Energy-Related Contracts (B) | | $ | (15 | ) | | $ | 704 |
| | $ | (36 | ) | | $ | (677 | ) | | $ | (6 | ) | |
| | PSE&G | | | | | | | | | | | |
| | Assets: | | | | | | | | | | | |
| | Rabbi Trust (C) | | | | | | | | | | | |
| | Equity Securities | | $ | 5 |
| | $ | — |
| | $ | 5 |
| | $ | — |
| | $ | — |
| |
| | Debt Securities—U.S. Treasury | | $ | 14 |
| | $ | — |
| | $ | — |
| | $ | 14 |
| | $ | — |
| |
| | Debt Securities—Govt Other | | $ | 8 |
| | $ | — |
| | $ | — |
| | $ | 8 |
| | $ | — |
| |
| | Debt Securities—Corporate | | $ | 18 |
| | $ | — |
| | $ | — |
| | $ | 18 |
| | $ | — |
| |
| | Power | | | | | | | | | | | |
| | Assets: | | | | | | | | | | | |
| | Derivative Contracts: | | | | | | | | | | | |
| | Energy-Related Contracts (B) | | $ | 12 |
| | $ | (551 | ) | | $ | 29 |
| | $ | 527 |
| | $ | 7 |
| |
| | NDT Fund (C) | | | | | | | | | | | |
| | Equity Securities | | $ | 900 |
| | $ | — |
| | $ | 898 |
| | $ | 2 |
| | $ | — |
| |
| | Debt Securities—U.S. Treasury | | $ | 171 |
| | $ | — |
| | $ | — |
| | $ | 171 |
| | $ | — |
| |
| | Debt Securities—Govt Other | | $ | 320 |
| | $ | — |
| | $ | — |
| | $ | 320 |
| | $ | — |
| |
| | Debt Securities—Corporate | | $ | 487 |
| | $ | — |
| | $ | — |
| | $ | 487 |
| | $ | — |
| |
| | Rabbi Trust (C) | | | | | | | | | | | |
| | Equity Securities | | $ | 6 |
| | $ | — |
| | $ | 6 |
| | $ | — |
| | $ | — |
| |
| | Debt Securities—U.S. Treasury | | $ | 17 |
| | $ | — |
| | $ | — |
| | $ | 17 |
| | $ | — |
| |
| | Debt Securities—Govt Other | | $ | 10 |
| | $ | — |
| | $ | — |
| | $ | 10 |
| | $ | — |
| |
| | Debt Securities—Corporate | | $ | 23 |
| | $ | — |
| | $ | — |
| | $ | 23 |
| | $ | — |
| |
| | Liabilities: | | | | | | | | | | | |
| | Derivative Contracts: | | | | | | | | | | | |
| | Energy-Related Contracts (B) | | $ | (15 | ) | | $ | 704 |
| | $ | (36 | ) | | $ | (677 | ) | | $ | (6 | ) | |
| | | | | | | | | | | | | |
NOTES TO CONSOLIDATED FINANCIAL STATEMENTS
|
| | | | | | | | | | | | | | | | | | | | | | |
| | | | | | | | | | | | | |
| | | | Recurring Fair Value Measurements as of December 31, 2016 | |
| | Description | | Total | | Netting (E) | | Quoted Market Prices for Identical Assets (Level 1) | | Significant Other Observable Inputs (Level 2) | | Significant Unobservable Inputs (Level 3) | |
| | | | Millions | |
| | PSEG | | | | | | | | | | | |
| | Assets: | | | | | | | | | | | |
| | Cash Equivalents (A) | | $ | 365 |
| | $ | — |
| | $ | 365 |
| | $ | — |
| | $ | — |
| |
| | Derivative Contracts: | | | | | | | | | | | |
| | Energy-Related Contracts (B) | | $ | 186 |
| | $ | (371 | ) | | $ | 17 |
| | $ | 533 |
| | $ | 7 |
| |
| | Interest Rate Swaps (C) | | $ | 1 |
| | $ | — |
| | $ | — |
| | $ | 1 |
| | $ | — |
| |
| | NDT Fund (D) | | | | | | | | | | | |
| | Equity Securities | | $ | 957 |
| | $ | — |
| | $ | 954 |
| | $ | 3 |
| | $ | — |
| |
| | Debt Securities—US Treasury | | $ | 227 |
| | $ | — |
| | $ | — |
| | $ | 227 |
| | $ | — |
| |
| | Debt Securities—Govt Other | | $ | 293 |
| | $ | — |
| | $ | — |
| | $ | 293 |
| | $ | — |
| |
| | Debt Securities—Corporate | | $ | 337 |
| | $ | — |
| | $ | — |
| | $ | 337 |
| | $ | — |
| |
| | Other Securities | | $ | 44 |
| | $ | — |
| | $ | 44 |
| | $ | — |
| | $ | — |
| |
| | Rabbi Trust (D) | | | | | | | | | | | |
| | Equity Securities—Mutual Funds | | $ | 22 |
| | $ | — |
| | $ | 22 |
| | $ | — |
| | $ | — |
| |
| | Debt Securities—US Treasury | | $ | 37 |
| | $ | — |
| | $ | — |
| | $ | 37 |
| | $ | — |
| |
| | Debt Securities—Govt Other | | $ | 66 |
| | $ | — |
| | $ | — |
| | $ | 66 |
| | $ | — |
| |
| | Debt Securities—Corporate | | $ | 91 |
| | $ | — |
| | $ | — |
| | $ | 91 |
| | $ | — |
| |
| | Other Securities | | $ | 1 |
| | $ | — |
| | $ | 1 |
| | $ | — |
| | $ | — |
| |
| | Liabilities: | | | | | | | | | | | |
| | Derivative Contracts: | | | | | | | | | | | |
| | Energy-Related Contracts (B) | | $ | (16 | ) | | $ | 372 |
| | $ | (18 | ) | | $ | (364 | ) | | $ | (6 | ) | |
| | PSE&G | | | | | | | | | | | |
| | Assets: | | | | | | | | | | | |
| | Cash Equivalents (A) | | $ | 365 |
| | $ | — |
| | $ | 365 |
| | $ | — |
| | $ | — |
| |
| | Derivative Contracts: | | | | | | | | | | | |
| | Energy Related Contracts (B) | | $ | — |
| | $ | — |
| | $ | — |
| | $ | — |
| | $ | — |
| |
| | Rabbi Trust (D) | | | | | | | | | | | |
| | Equity Securities—Mutual Funds | | $ | 5 |
| | $ | — |
| | $ | 5 |
| | $ | — |
| | $ | — |
| |
| | Debt Securities—US Treasury | | $ | 7 |
| | $ | — |
| | $ | — |
| | $ | 7 |
| | $ | — |
| |
| | Debt Securities—Govt Other | | $ | 13 |
| | $ | — |
| | $ | — |
| | $ | 13 |
| | $ | — |
| |
| | Debt Securities—Corporate | | $ | 18 |
| | $ | — |
| | $ | — |
| | $ | 18 |
| | $ | — |
| |
| | Other Securities | | $ | — |
| | $ | — |
| | $ | — |
| | $ | — |
| | $ | — |
| |
| | Liabilities: | | | | | | | | | | | |
| | Derivative Contracts: | | | | | | | | | | | |
| | Energy-Related Contracts (B) | | $ | (5 | ) | | $ | — |
| | $ | — |
| | $ | — |
| | $ | (5 | ) | |
| | Power | | | | | | | | | | | |
| | Assets: | | | | | | | | | | | |
| | Derivative Contracts: | | | | | | | | | | | |
| | Energy-Related Contracts (B) | | $ | 186 |
| | $ | (371 | ) | | $ | 17 |
| | $ | 533 |
| | $ | 7 |
| |
| | NDT Fund (D) | | | | | | | | | | | |
| | Equity Securities | | $ | 957 |
| | $ | — |
| | $ | 954 |
| | $ | 3 |
| | $ | — |
| |
| | Debt Securities—US Treasury | | $ | 227 |
| | $ | — |
| | $ | — |
| | $ | 227 |
| | $ | — |
| |
| | Debt Securities—Govt Other | | $ | 293 |
| | $ | — |
| | $ | — |
| | $ | 293 |
| | $ | — |
| |
| | Debt Securities—Corporate | | $ | 337 |
| | $ | — |
| | $ | — |
| | $ | 337 |
| | $ | — |
| |
| | Other Securities | | $ | 44 |
| | $ | — |
| | $ | 44 |
| | $ | — |
| | $ | — |
| |
| | Rabbi Trust (D) | | | | | | | | | | | |
| | Equity Securities—Mutual Funds | | $ | 5 |
| | $ | — |
| | $ | 5 |
| | $ | — |
| | $ | — |
| |
| | Debt Securities—US Treasury | | $ | 9 |
| | $ | — |
| | $ | — |
| | $ | 9 |
| | $ | — |
| |
| | Debt Securities—Govt Other | | $ | 16 |
| | $ | — |
| | $ | — |
| | $ | 16 |
| | $ | — |
| |
| | Debt Securities—Corporate | | $ | 23 |
| | $ | — |
| | $ | — |
| | $ | 23 |
| | $ | — |
| |
| | Other Securities | | $ | — |
| | $ | — |
| | $ | — |
| | $ | — |
| | $ | — |
| |
| | Liabilities: | | | | | | | | | | | |
| | Derivative Contracts: | | | | | | | | | | | |
| | Energy-Related Contracts (B) | | $ | (11 | ) | | $ | 372 |
| | $ | (18 | ) | | $ | (364 | ) | | $ | (1 | ) | |
| | | | | | | | | | | | | |
|
| | | | | | | | | | | | | | | | | | | | | | |
| | | | | | | | | | | | | |
| | | | Recurring Fair Value Measurements as of December 31, 2017 | |
| | Description | | Total | | Netting (D) | | Quoted Market Prices for Identical Assets (Level 1) | | Significant Other Observable Inputs (Level 2) | | Significant Unobservable Inputs (Level 3) | |
| | | | Millions | |
| | PSEG | | | | | | | | | | | |
| | Assets: | | | | | | | | | | | |
| | Cash Equivalents (A) | | $ | 223 |
| | $ | — |
| | $ | 223 |
| | $ | — |
| | $ | — |
| |
| | Derivative Contracts: | | | | | | | | | | | |
| | Energy-Related Contracts (B) | | $ | 36 |
| | $ | (433 | ) | | $ | 15 |
| | $ | 442 |
| | $ | 12 |
| |
| | NDT Fund (C) | | | | | | | | | | | |
| | Equity Securities | | $ | 1,147 |
| | $ | — |
| | $ | 1,145 |
| | $ | 2 |
| | $ | — |
| |
| | Debt Securities—U.S. Treasury | | $ | 314 |
| | $ | — |
| | $ | — |
| | $ | 314 |
| | $ | — |
| |
| | Debt Securities—Govt Other | | $ | 270 |
| | $ | — |
| | $ | — |
| | $ | 270 |
| | $ | — |
| |
| | Debt Securities—Corporate | | $ | 402 |
| | $ | — |
| | $ | — |
| | $ | 402 |
| | $ | — |
| |
| | Rabbi Trust (C) | | | | | | | | | | | |
| | Equity Securities | | $ | 27 |
| | $ | — |
| | $ | 27 |
| | $ | — |
| | $ | — |
| |
| | Debt Securities—U.S. Treasury | | $ | 51 |
| | $ | — |
| | $ | — |
| | $ | 51 |
| | $ | — |
| |
| | Debt Securities—Govt Other | | $ | 34 |
| | $ | — |
| | $ | — |
| | $ | 34 |
| | $ | — |
| |
| | Debt Securities—Corporate | | $ | 119 |
| | $ | — |
| | $ | — |
| | $ | 119 |
| | $ | — |
| |
| | Liabilities: | | | | | | | | | | | |
| | Derivative Contracts: | | | | | | | | | | | |
| | Energy-Related Contracts (B) | | $ | (21 | ) | | $ | 477 |
| | $ | (8 | ) | | $ | (485 | ) | | $ | (5 | ) | |
| | PSE&G | | | | | | | | | | | |
| | Assets: | | | | | | | | | | | |
| | Cash Equivalents (A) | | $ | 223 |
| | $ | — |
| | $ | 223 |
| | $ | — |
| | $ | — |
| |
| | Rabbi Trust (C) | | | | | | | | | | | |
| | Equity Securities | | $ | 5 |
| | $ | — |
| | $ | 5 |
| | $ | — |
| | $ | — |
| |
| | Debt Securities—U.S. Treasury | | $ | 10 |
| | $ | — |
| | $ | — |
| | $ | 10 |
| | $ | — |
| |
| | Debt Securities—Govt Other | | $ | 7 |
| | $ | — |
| | $ | — |
| | $ | 7 |
| | $ | — |
| |
| | Debt Securities—Corporate | | $ | 24 |
| | $ | — |
| | $ | — |
| | $ | 24 |
| | $ | — |
| |
| | Power | | | | | | | | | | | |
| | Assets: | | | | | | | | | | | |
| | Derivative Contracts: | | | | | | | | | | | |
| | Energy-Related Contracts (B) | | $ | 36 |
| | $ | (433 | ) | | $ | 15 |
| | $ | 442 |
| | $ | 12 |
| |
| | NDT Fund (C) | | | | | | | | | | | |
| | Equity Securities | | $ | 1,147 |
| | $ | — |
| | $ | 1,145 |
| | $ | 2 |
| | $ | — |
| |
| | Debt Securities—U.S. Treasury | | $ | 314 |
| | $ | — |
| | $ | — |
| | $ | 314 |
| | $ | — |
| |
| | Debt Securities—Govt Other | | $ | 270 |
| | $ | — |
| | $ | — |
| | $ | 270 |
| | $ | — |
| |
| | Debt Securities—Corporate | | $ | 402 |
| | $ | — |
| | $ | — |
| | $ | 402 |
| | $ | — |
| |
| | Rabbi Trust (C) | | | | | | | | | | | |
| | Equity Securities | | $ | 6 |
| | $ | — |
| | $ | 6 |
| | $ | — |
| | $ | — |
| |
| | Debt Securities—U.S. Treasury | | $ | 13 |
| | $ | — |
| | $ | — |
| | $ | 13 |
| | $ | — |
| |
| | Debt Securities—Govt Other | | $ | 8 |
| | $ | — |
| | $ | — |
| | $ | 8 |
| | $ | — |
| |
| | Debt Securities—Corporate | | $ | 30 |
| | $ | — |
| | $ | — |
| | $ | 30 |
| | $ | — |
| |
| | Liabilities: | | | | | | | | | | | |
| | Derivative Contracts: | | | | | | | | | | | |
| | Energy-Related Contracts (B) | | $ | (21 | ) | | $ | 477 |
| | $ | (8 | ) | | $ | (485 | ) | | $ | (5 | ) | |
| | | | | | | | | | | | | |
NOTES TO CONSOLIDATED FINANCIAL STATEMENTS
|
| | | | | | | | | | | | | | | | | | | | | | |
| | | | | | | | | | | | | |
| | | | Recurring Fair Value Measurements as of December 31, 2015 | |
| | Description | | Total | | Netting (E) | | Quoted Market Prices for Identical Assets (Level 1) | | Significant Other Observable Inputs (Level 2) | | Significant Unobservable Inputs (Level 3) | |
| | | | Millions | |
| | PSEG | | | | | | | | | | | |
| | Assets: | | | | | | | | | | | |
| | Cash Equivalents (A) | | $ | 326 |
| | $ | — |
| | $ | 326 |
| | $ | — |
| | $ | — |
| |
| | Derivative Contracts: | | | | | | | | | | | |
| | Energy-Related Contracts (B) | | $ | 313 |
| | $ | (608 | ) | | $ | — |
| | $ | 896 |
| | $ | 25 |
| |
| | Interest Rate Swaps (C) | | $ | 6 |
| | $ | — |
| | $ | — |
| | $ | 6 |
| | $ | — |
| |
| | NDT Fund (D) | | | | | | | | | | | |
| | Equity Securities | | $ | 865 |
| | $ | — |
| | $ | 865 |
| | $ | — |
| | $ | — |
| |
| | Debt Securities—US Treasury | | $ | 177 |
| | $ | — |
| | $ | — |
| | $ | 177 |
| | $ | — |
| |
| | Debt Securities—Govt Other | | $ | 311 |
| | $ | — |
| | $ | — |
| | $ | 311 |
| | $ | — |
| |
| | Debt Securities—Corporate | | $ | 359 |
| | $ | — |
| | $ | — |
| | $ | 359 |
| | $ | — |
| |
| | Other Securities | | $ | 42 |
| | $ | — |
| | $ | 42 |
| | $ | — |
| | $ | — |
| |
| | Rabbi Trust (D) | | | | | | | | | | | |
| | Equity Securities—Mutual Funds | | $ | 22 |
| | $ | — |
| | $ | 22 |
| | $ | — |
| | $ | — |
| |
| | Debt Securities—US Treasury | | $ | 48 |
| | $ | — |
| | $ | — |
| | $ | 48 |
| | $ | — |
| |
| | Debt Securities—Govt Other | | $ | 60 |
| | $ | — |
| | $ | — |
| | $ | 60 |
| | $ | — |
| |
| | Debt Securities—Corporate | | $ | 81 |
| | $ | — |
| | $ | — |
| | $ | 81 |
| | $ | — |
| |
| | Other Securities | | $ | 2 |
| | $ | — |
| | $ | 2 |
| | $ | — |
| | $ | — |
| |
| | Liabilities: | | | | | | | | | | | |
| | Derivative Contracts: | | | | | | | | | | | |
| | Energy-Related Contracts (B) | | $ | (103 | ) | | $ | 553 |
| | $ | — |
| | $ | (644 | ) | | $ | (12 | ) | |
| | PSE&G | | | | | | | | | | | |
| | Assets: | | | | | | | | | | | |
| | Cash Equivalents (A) | | $ | 160 |
| | $ | — |
| | $ | 160 |
| | $ | — |
| | $ | — |
| |
| | Derivative Contracts: | | | | | | | | | | | |
| | Energy Related Contracts (B) | | $ | 13 |
| | $ | — |
| | $ | — |
| | $ | — |
| | $ | 13 |
| |
| | Rabbi Trust (D) | | | | | | | | | | | |
| | Equity Securities—Mutual Funds | | $ | 5 |
| | $ | — |
| | $ | 5 |
| | $ | — |
| | $ | — |
| |
| | Debt Securities—US Treasury | | $ | 9 |
| | $ | — |
| | $ | — |
| | $ | 9 |
| | $ | — |
| |
| | Debt Securities—Govt Other | | $ | 12 |
| | $ | — |
| | $ | — |
| | $ | 12 |
| | $ | — |
| |
| | Debt Securities—Corporate | | $ | 16 |
| | $ | — |
| | $ | — |
| | $ | 16 |
| | $ | — |
| |
| | Other Securities | | $ | — |
| | $ | — |
| | $ | — |
| | $ | — |
| | $ | — |
| |
| | Liabilities: | | | | | | | | | | | |
| | Derivative Contracts: | | | | | | | | | | | |
| | Energy-Related Contracts (B) | | $ | (11 | ) | | $ | — |
| | $ | — |
| | $ | — |
| | $ | (11 | ) | |
| | Power | | | | | | | | | | | |
| | Assets: | | | | | | | | | | | |
| | Derivative Contracts: | | | | | | | | | | | |
| | Energy-Related Contracts (B) | | $ | 300 |
| | $ | (608 | ) | | $ | — |
| | $ | 896 |
| | $ | 12 |
| |
| | NDT Fund (D) | | | | | | | | | | | |
| | Equity Securities | | $ | 865 |
| | $ | — |
| | $ | 865 |
| | $ | — |
| | $ | — |
| |
| | Debt Securities—US Treasury | | $ | 177 |
| | $ | — |
| | $ | — |
| | $ | 177 |
| | $ | — |
| |
| | Debt Securities—Govt Other | | $ | 311 |
| | $ | — |
| | $ | — |
| | $ | 311 |
| | $ | — |
| |
| | Debt Securities—Corporate | | $ | 359 |
| | $ | — |
| | $ | — |
| | $ | 359 |
| | $ | — |
| |
| | Other Securities | | $ | 42 |
| | $ | — |
| | $ | 42 |
| | $ | — |
| | $ | — |
| |
| | Rabbi Trust (D) | | | | | | | | | | | |
| | Equity Securities—Mutual Funds | | $ | 5 |
| | $ | — |
| | $ | 5 |
| | $ | — |
| | $ | — |
| |
| | Debt Securities—US Treasury | | $ | 12 |
| | $ | — |
| | $ | — |
| | $ | 12 |
| | $ | — |
| |
| | Debt Securities—Govt Other | | $ | 14 |
| | $ | — |
| | $ | — |
| | $ | 14 |
| | $ | — |
| |
| | Debt Securities—Corporate | | $ | 20 |
| | $ | — |
| | $ | — |
| | $ | 20 |
| | $ | — |
| |
| | Other Securities | | $ | 1 |
| | $ | — |
| | $ | 1 |
| | $ | — |
| | $ | — |
| |
| | Liabilities: | | | | | | | | | | | |
| | Derivative Contracts: | | | | | | | | | | | |
| | Energy-Related Contracts (B) | | $ | (92 | ) | | $ | 553 |
| | $ | — |
| | $ | (644 | ) | | $ | (1 | ) | |
| | | | | | | | | | | | | |
| |
| (A) | Represents money market mutual funds. |
NOTES TO CONSOLIDATED FINANCIAL STATEMENTS
| |
| (B) | Level 1—During 2016 a net fair value of $1 million relating to energy-related contracts was transferred from Level 2 into Level 1. These contracts represent natural gas futures contracts executed on NYMEX, and are being valued solely on settled pricing inputs which come directly from the exchange. |
Level 2—Fair values for energy-related contracts are obtained primarily using a market-based approach. Most derivative contracts (forward purchase or sale contracts and swaps) are valued using settled prices from similar assets and liabilities from an exchange, such as NYMEX, Intercontinental ExchangeICE and Nodal Exchange, or auction prices. Prices used in the valuation process are also corroborated independently by management to determine that values are based on actual transaction data or, in the absence of transactions, bid and offers for the day. Examples may include certain exchange and non-exchange traded capacity and electricity contracts and natural gas physical or swap contracts based on market prices, basis adjustments and other premiums where adjustments and premiums are not considered significant to the overall inputs.
Level 3—For energy-related contracts, which includeUnobservable inputs are used for the valuation of certain contracts. See “Additional Information Regarding Level 3 Measurements” below for more complex agreements where limited observable inputs or pricing information are available, modeling techniques are employed using assumptions reflectiveon the utilization of contractual terms, current market rates, forward price curves, discount rates and risk factors, as applicable. Fair values of other energy contracts may be based on broker quotes that we cannot corroborate with actual market transaction data.unobservable inputs.
| |
| (C) | Interest rate swaps are valued using quoted prices on commonly quoted intervals, which are interpolated for periods different than the quoted intervals, as inputs to a market valuation model. Market inputs can generally be verified and model selection does not involve significant management judgment. |
| |
(D) | The fair value measurement table excludes cash of $1 million which is part of the NDT Fund, The NDT Fund maintains investments in various equity and fixed income securities classified as “available for sale.”securities. The Rabbi Trust maintains investments in an S&P 500a Russell 3000 index fund and various fixed income securities classified as “available for sale.”securities. These securities are generally valued with prices that are either exchange provided (equity securities) or market transactions for comparable securities and/or broker quotes (fixed income securities). |
Level 1—Investments in marketable equity securities within the NDT Fund are primarily investments in common stocks across a broad range of industries and sectors. Most equity securities are priced utilizing the principal market close price or, in some cases, midpoint, bid or ask price. Certain open-ended mutualother equity securities in the NDT and Rabbi Trust Funds consist primarily of investments in Dreyfus money market funds which seek a high level of current income as is consistent with mainlythe preservation of capital and the maintenance of liquidity. To pursue its goals, the funds normally invest in diversified portfolios of high quality, short-term, investments are valued based on unadjusted quoted prices in active markets.dollar-denominated debt securities and government securities. The funds’ NAV is priced and published daily. The Rabbi Trust also has an equity index fund which is valued based on quoted prices in an active market.
Level 2—NDT and Rabbi Trust fixed income securities include investment grade corporate bonds, collateralized mortgage obligations, asset-backed securities and certain government and USU.S. Treasury obligations or Federal Agency asset-backed securities and municipal bonds with a wide range of maturities. Since many fixed income securities do not trade on a daily basis, they are priced using an evaluated pricing methodology that varies by asset class and reflects observable market information such as the most recent exchange price or quoted bid for similar securities. Market-based standard inputs typically include benchmark yields, reported trades, broker/dealer quotes and issuer spreads. The preferred stocks are not actively traded on a daily basis and therefore, are also priced using an evaluated pricing methodology. Certain short-term investments are valued using observable market prices or market parameters such as time-to-maturity, coupon rate, quality rating and current yield.
| |
(E)(D) | Represents the netting of fair value balances with the same counterparty (where the right of offset exists) and the application of collateral. All cash collateral received or posted that has been allocated to derivative positions, where the right of offset exists, has been offset in the Condensed Consolidated Balance Sheets. As of December 31, 2016, net cash collateral (received) paid of $1 million was netted against the corresponding net derivative contract positions. Of the $1 million of cash collateral as of December 31, 2016, $(3) million was netted against assets, and $4 million was netted against liabilities. As of December 31, 2015, net cash collateral (received) paid of $(55) million was netted against the corresponding net derivative contract positions. Of the $(55) million of cash collateral as of December 31, 2015, $(69) million was netted against assets and $14 million was netted against liabilities.See Note 17. Financial Risk Management Activities for additional detail. |
Additional Information Regarding Level 3 Measurements
For valuations that include both observable and unobservable inputs, if the unobservable input is determined to be significant to the overall inputs, the entire valuation is categorized in Level 3. This includes derivatives valued using indicative price quotations for contracts with tenors that extend into periods with no observable pricing. In instances where observable data is unavailable, consideration is given to the assumptions that market participants would use in valuing the asset or liability. This includes assumptions about market risks such as liquidity, volatility and contract duration. Such instruments are categorized in Level 3 because the model inputs generally are not observable. PSEG’s Risk Management Committee (RMC) approves risk management policies and objectives for risk assessment, control and valuation, counterparty credit approval and the monitoring and reporting of risk exposures. The Risk Management CommitteeRMC reports to the Corporate Governance and Audit CommitteeCommittees of the PSEG Board of Directors on the scope of the risk management activities and is responsible for approving all valuation procedures at PSEG.
NOTES TO CONSOLIDATED FINANCIAL STATEMENTS
Forward price curves for the power market utilized by Power to manage the portfolio are maintained and reviewed by PSEG’s Enterprise Risk Management market pricing group and used for financial reporting purposes. PSEG considers credit and nonperformance risk in the valuation of derivative contracts categorized in Levels 2 and 3, including both historical and current market data, in its assessment of credit and nonperformance risk by counterparty. The impacts of credit and nonperformance risk were not material to the financial statements.
For PSE&G, the natural gas supply contract is measured at fair value using modeling techniques taking into account the current price of natural gas adjusted for appropriate risk factors, as applicable, and internal assumptions about transportation costs, and accordingly, the fair value measurements are classified in Level 3. The fair value of Power’s electric load contracts in which load consumption may change hourly based on demand are measured using certain unobservable inputs, such as historic load variability and, accordingly, are categorized as Level 3. The fair value of Power’s gas physical contracts at certain illiquid delivery locations are measured using average historical basis and, accordingly, are categorized as Level 3. While these physical gas contracts have an unobservable component in their respective
NOTES TO CONSOLIDATED FINANCIAL STATEMENTS
forward price curves, the fluctuations in fair value have been driven primarily by changes in the observable inputs. The following tables provide details surrounding significant Level 3 valuations as of December 31, 20162018 and 2015.2017.
|
| | | | | | | | | | | | | | | | | | |
| | | | | | | | | | | | | | | |
| | | | Quantitative Information About Level 3 Fair Value Measurements | | | |
| | Commodity | | Level 3 Position | | Fair Value as of December 31, 2016 | | Valuation Technique(s) | | Significant Unobservable Input | | Range | |
| | | | | | | |
| | | | | | Assets | | (Liabilities) | | | | | | | |
| | | | | | Millions | | | | | | | |
| | PSE&G | | | | | | | | | | | | | |
| | Gas | | Natural Gas Supply Contract | | $ | — |
| | $ | (5 | ) | | Discounted Cash Flow | | Transportation Costs | | $0.60 to $0.80/Dth | |
| | Total PSE&G | | | | $ | — |
| | $ | (5 | ) | | | | | | | |
| | Power | | | | | | | | | | | | | |
| | Electricity | | Electric Load Contracts | | $ | 7 |
| | $ | (1 | ) | | Discounted Cash flow | | Historic Load Variability | | 0% to +10% | |
| | Gas (A) | | Other | | — |
| | — |
| | | | | | | |
| | Total Power | | | | $ | 7 |
| | $ | (1 | ) | | | | | | | |
| | Total PSEG | | | | $ | 7 |
| | $ | (6 | ) | | | | | | | |
| | | | | | | | | | | | | | | |
|
| | | | | | | | | | | | | | | | | | |
| | | | | | | | | | | | | | | |
| | | | Quantitative Information About Level 3 Fair Value Measurements | | | |
| | Commodity | | Level 3 Position | | Fair Value as of December 31, 2018 | | Valuation Technique(s) | | Significant Unobservable Input | | Range | |
| | | | | | | |
| | | | | | Assets | | (Liabilities) | | | | | | | |
| | | | | | Millions | | | | | | | |
| | Power | | | | | | | | | | | | | |
| | Electricity | | Electric Load Contracts | | $ | 2 |
| | $ | (5 | ) | | Discounted Cash flow | | Historic Load Variability | | 0% to 15% | |
| | Gas | | Gas Physical Contracts | | 5 |
| | (1 | ) | | Discounted Cash flow | | Average Historical Basis | | -40% to 0% | |
| | Total Power | | | | $ | 7 |
| | $ | (6 | ) | | | | | | | |
| | Total PSEG | | | | $ | 7 |
| | $ | (6 | ) | | | | | | | |
| | | | | | | | | | | | | | | |
|
| | | | | | | | | | | | | | | | | | |
| | | | | | | | | | | | | | | |
| | | | Quantitative Information About Level 3 Fair Value Measurements | | | |
| | Commodity | | Level 3 Position | | Fair Value as of December 31, 2015 | | Valuation Technique(s) | | Significant Unobservable Input | | Range | |
| | | | | | | |
| | | | | | Assets | | (Liabilities) | | | | | | | |
| | | | | | Millions | | | | | | | |
| | PSE&G | | | | | | | | | | | | | |
| | Gas | | Natural Gas Supply Contract | | $ | 13 |
| | $ | (11 | ) | | Discounted Cash Flow | | Transportation Costs | | $0.60 to $0.80/Dth | |
| | Total PSE&G | | | | $ | 13 |
| | $ | (11 | ) | | | | | | | |
| | Power | | | | | | | | | | | | | |
| | Electricity | | Electric Load Contracts | | $ | 11 |
| | $ | (1 | ) | | Discounted Cash Flow | | Historic Load Variability | | 0% to +10% | |
| | Electricity | | Other | | 1 |
| | — |
| | | | | | | |
| | Total Power | | | | $ | 12 |
| | $ | (1 | ) | | | | | | | |
| | Total PSEG | | | | $ | 25 |
| | $ | (12 | ) | | | | | | | |
| | | | | | | | | | | | | | | |
|
| | | | | | | | | | | | | | | | | | |
| | | | | | | | | | | | | | | |
| | | | Quantitative Information About Level 3 Fair Value Measurements | | | |
| | Commodity | | Level 3 Position | | Fair Value as of December 31, 2017 | | Valuation Technique(s) | | Significant Unobservable Input | | Range | |
| | | | | | | |
| | | | | | Assets | | (Liabilities) | | | | | | | |
| | | | | | Millions | | | | | | | |
| | Power | | | | | | | | | | | | | |
| | Electricity | | Electric Load Contracts | | $ | 1 |
| | $ | (3 | ) | | Discounted Cash flow | | Historic Load Variability | | 0% to 10% | |
| | Gas | | Gas Physical Contracts | | 11 |
| | (2 | ) | | Discounted Cash flow | | Average Historical Basis | | -40% to -10% | |
| | Total Power | | | | $ | 12 |
| | $ | (5 | ) | | | | | | | |
| | Total PSEG | | | | $ | 12 |
| | $ | (5 | ) | | | | | | | |
| | | | | | | | | | | | | | | |
| |
(A) | Includes gas supply positions which were immaterial as of December 31, 2016. |
Significant unobservable inputs listed above would have a direct impact on the fair values of the above Level 3 instruments if they were adjusted. For gas supply contracts where PSE&G is a seller, an increase in gas transportation cost would increase the fair value. For energy-related contracts in cases where Power is a seller, an increase in the load variability would decrease the fair value. For gas-related contracts in cases where Power is a buyer, an increase in the average historical basis would increase the fair value.
NOTES TO CONSOLIDATED FINANCIAL STATEMENTS
A reconciliation of the beginning and ending balances of Level 3 derivative contracts and securities for the years ended December 31, 20162018 and 2015,2017, respectively, follows:
Changes in Level 3 Assets and (Liabilities) Measured at Fair Value on a Recurring Basis
for the Year Ended December 31, 20162018 |
| | | | | | | | | | | | | | | | | | | | | | | | | | | | | | |
| | | | | | | | | | | | | | | | | |
| | | | | | Total Gains or (Losses) Realized/Unrealized | | | | | | | | | |
| | Description | | Balance as of January 1, 2016 | | Included in Income (A) | | Included in Regulatory Assets/ Liabilities (B) | | Purchases, (Sales) | | Issuances/ Settlements (C) | | Transfers In/Out | | Balance as of December 31, 2016 | |
| | | | Millions | |
| | PSEG | | | | | | | | | | | | | | | |
| | Net Derivative Assets (Liabilities) | | $ | 13 |
| | $ | 13 |
| | $ | (7 | ) | | $ | 3 |
| | $ | (21 | ) | | $ | — |
| | $ | 1 |
| |
| | PSE&G | | | | | | | | | | | | | | | |
| | Net Derivative Assets (Liabilities) | | $ | 2 |
| | $ | — |
| | $ | (7 | ) | | $ | — |
| | $ | — |
| | $ | — |
| | $ | (5 | ) | |
| | Power | | | | | | | | | | | | | | | |
| | Net Derivative Assets (Liabilities) | | $ | 11 |
| | $ | 13 |
| | $ | — |
| | $ | 3 |
| | $ | (21 | ) | | $ | — |
| | $ | 6 |
| |
| | | | | | | | | | | | | | | | | |
|
| | | | | | | | | | | | | | | | | | | | | | | | | | | | | | |
| | | | | | | | | | | | | | | | | |
| | | | | | Total Gains or (Losses) Realized/Unrealized | | | | | | | | | |
| | Description | | Balance as of January 1, 2018 | | Included in Income (A) | | Included in Regulatory Assets/ Liabilities (B) | | Purchases, (Sales) | | Issuances/ Settlements (C) | | Transfers In/Out | | Balance as of December 31, 2018 | |
| | | | Millions | |
| | PSEG | | | | | | | | | | | | | | | |
| | Net Derivative Assets (Liabilities) | | $ | 7 |
| | $ | (6 | ) | | $ | — |
| | $ | — |
| | $ | — |
| | $ | — |
| | $ | 1 |
| |
| | Power | | | | | | | | | | | | | | | |
| | Net Derivative Assets (Liabilities) | | $ | 7 |
| | $ | (6 | ) | | $ | — |
| | $ | — |
| | $ | — |
| | $ | — |
| | $ | 1 |
| |
| | | | | | | | | | | | | | | | | |
Changes in Level 3 Assets and (Liabilities) Measured at Fair Value on a Recurring Basis
for the Year Ended December 31, 20152017 |
| | | | | | | | | | | | | | | | | | | | | | | | | | | | | | |
| | | | | | | | | | | | | | | | | |
| | | | | | Total Gains or (Losses) Realized/Unrealized | | | | | | | | | |
| | Description | | Balance as of January 1, 2015 | | Included in Income (A) | | Included in Regulatory Assets/ Liabilities (B) | | Purchases, (Sales) | | Issuances/ Settlements (C) | | Transfers In/Out | | Balance as of December 31, 2015 | |
| | | | Millions | |
| | PSEG | | | | | | | | | | | | | | | |
| | Net Derivative Assets (Liabilities) | | $ | 37 |
| | $ | 20 |
| | $ | (24 | ) | | $ | — |
| | $ | (20 | ) | | $ | — |
| | $ | 13 |
| |
| | PSE&G | | | | | | | | | | | | | | | |
| | Net Derivative Assets (Liabilities) | | $ | 26 |
| | $ | — |
| | $ | (24 | ) | | $ | — |
| | $ | — |
| | $ | — |
| | $ | 2 |
| |
| | Power | | | | | | | | | | | | | | | |
| | Net Derivative Assets (Liabilities) | | $ | 11 |
| | $ | 20 |
| | $ | — |
| | $ | — |
| | $ | (20 | ) | | $ | — |
| | $ | 11 |
| |
| | | | | | | | | | | | | | | | | |
|
| | | | | | | | | | | | | | | | | | | | | | | | | | | | | | |
| | | | | | | | | | | | | | | | | |
| | | | | | Total Gains or (Losses) Realized/Unrealized | | | | | | | | | |
| | Description | | Balance as of January 1, 2017 | | Included in Income (A) | | Included in Regulatory Assets/ Liabilities (B) | | Purchases, (Sales) | | Issuances/ Settlements (C) | | Transfers In/Out (D) | | Balance as of December 31, 2017 | |
| | | | Millions | |
| | PSEG | | | | | | | | | | | | | | | |
| | Net Derivative Assets (Liabilities) | | $ | 1 |
| | $ | 26 |
| | $ | 5 |
| | $ | — |
| | $ | (24 | ) | | $ | (1 | ) | | $ | 7 |
| |
| | PSE&G | | | | | | | | | | | | | | | |
| | Net Derivative Assets (Liabilities) | | $ | (5 | ) | | $ | — |
| | $ | 5 |
| | $ | — |
| | $ | — |
| | $ | — |
| | $ | — |
| |
| | Power | | | | | | | | | | | | | | | |
| | Net Derivative Assets (Liabilities) | | $ | 6 |
| | $ | 26 |
| | $ | — |
| | $ | — |
| | $ | (24 | ) | | $ | (1 | ) | | $ | 7 |
| |
| | | | | | | | | | | | | | | | | |
(A)Unrealized gains (losses) in the following table represent the change in derivative assets and liabilities still held as of December 31, 2018 and 2017. | |
(A) | PSEG’s and Power’s gains and losses attributable to changes in net derivative assets and liabilities include $13 million and $20 million in Operating Income in 2016 and 2015, respectively. Of the $13 million in Operating Income in 2016 $(5) million is unrealized. The $20 million in Operating Income in 2015 is realized. |
|
| | | | | | | | | | | | | | | | | | |
| | | | | | | | | | | |
| | | | Years Ended December 31, | |
| | | | 2018 | | 2017 | |
| | | | Total Gains (Losses) | | Unrealized Gains (Losses) | | Total Gains (Losses) | | Unrealized Gains (Losses) | |
| | | | Millions | |
| | PSEG and Power | | | | | | | | | |
| | Operating Revenues | | $ | (2 | ) | | $ | — |
| | $ | 14 |
| | $ | (9 | ) | |
| | Energy Costs | | (4 | ) | | (6 | ) | | 12 |
| | 12 |
| |
| | Total | | $ | (6 | ) | | $ | (6 | ) | | $ | 26 |
| | $ | 3 |
| |
| | | | | | | | | | | |
| |
| (B) | Mainly includes gains/losses on PSE&G’s derivative contracts that are not included in either earnings or Accumulated Other Comprehensive Income, as they are deferred as a Regulatory Asset/Liability and are expected to be recovered from/returned to PSE&G’s customers. |
NOTES TO CONSOLIDATED FINANCIAL STATEMENTS
| |
| (C) | Represents $(21) million and $(20)$(24) million in settlements for derivative contracts in 2016 and 2015, respectively.2017. |
| |
| (D) | During the year ended December 31, 2017, $(1) million of net derivatives assets/liabilities were transferred from Level 2 to Level 3. There were no transfers in 2018. |
As of December 31, 2016,2018, PSEG carried $2.6$2.2 billion of net assets that are measured at fair value on a recurring basis, of which $1 million of net assets were measured using unobservable inputs and classified as Level 3 within the fair value hierarchy.
As of December 31, 2015,2017, PSEG carried $2.5$2.6 billion of net assets that are measured at fair value on a recurring basis, of which $13$7 million of net assets were measured using unobservable inputs and classified as Level 3 within the fair value hierarchy.
Note 18.19. Stock Based Compensation
PSEG’s Amended and Restated 2004 Long-Term Incentive Plan (LTIP) is a broad-based equity compensation program that provides for grants of various long-term incentive compensation awards, such as stock options, stock appreciation rights, performance share units, restricted stock, restricted stock units, cash awards or any combination thereof. The types of long-term incentive awards that have been granted and remain outstanding under the LTIP are non-qualified options to purchase shares of PSEG’s common stock, restricted stock unit awards and performance share unit awards. The type of equity award that is granted and the details of that award may vary from time to time and is subject to the approval of the Organization and Compensation Committee of PSEG’s Board of Directors (O&CC), the LTIP’s administrative committee.
The LTIP currently provides for the issuance of equity awards with respect to approximately 16 million shares of common stock. As of December 31, 2016,2018, there were approximately 1513 million shares available for future awards under the LTIP.
Stock Options
Under the LTIP, non-qualified options to acquire shares of PSEG common stock may be granted to officers and other key employees selected by the O&CC. Option awards are granted with an exercise price equal to the market price of PSEG’s common stock at the grant date. The options generally vest over four years of continuous service. Vesting schedules may be accelerated upon the occurrence of certain events, such as a change-in-control (unless substituted with an equity award of equal value), retirement, death or disability. Options are exercisable over a period of time designated by the O&CC (but not prior to one year or longer than ten years from the date of grant) and are subject to such other terms and conditions as the O&CC determines. Payment by option holders upon exercise of an option may be made in cash or, with the consent of the O&CC, by delivering previously acquired shares of PSEG common stock. No options have been issuedgranted since 2009.
Restricted Stock Units
Under the LTIP, PSEG has granted restricted stock unit awards to officers and other key employees. These awards, which are bookkeeping entries only, are subject to risk of forfeiture until vested by continued employment. Until distributed, the units are credited with dividend equivalents proportionate to the dividends paid on PSEG common stock. Distributions are made in shares of common stock. The restricted stock unit grants for 20162018 and 20152017 generally vest at the end of three years. Vesting may be accelerated (pro-rated basis or full vesting) upon certain events such as change-in-control, retirement, disability change-in-control or death.
Performance Share Units
Under the LTIP, PSEG has granted performance share units to officers and other key employees. These provide for paymentdistribution in shares of PSEG common stock based on achievement of certain financial goals over a three-year performance period. Following the end of the performance period, the payout varies from 0% to 200% of the number of performance units granted depending on PSEG’s performance with respect to certain financial targets, including targets related to comparative performance against other companies in a peer group of energy companies. The performance share units are credited with dividend equivalents proportionate to the dividends paid on PSEG common stock. Distributions are made in shares of common stock. Vesting may be accelerated on a pro-rated basis for the period of the employee’s service during the performance period as a result of certain events, such as change-in-control, (unless substituted with an equity award of equal value), retirement, death or disability.
Stock-Based Compensation
PSEG recognizes compensation expense for stock options based on their grant date fair values, which are determined using the Black-Scholes option-pricing model. Stock option awards are expensed on a tranche-specific basis over the requisite service period of the award. Ultimately, compensation expense for stock options is recognized for awards that vest.
PSEG recognizes compensation expense for restricted stock units over the vesting period based on the grant date fair value of the shares, which is equal to the market price of PSEG’s common stock on the date of the grant.
PSEG recognizes compensation expense for the total shareholder return target for its performance share unit awards based on the grant date fair values of the award, which are determined using the Monte Carlo model. The accrual of compensation cost is based on the probable achievement of the performance conditions, which result in a payout from 0% to 200% of the initial grant. PSEG recognizes compensation expense for the return on invested capital target for its performance share units based on
NOTES TO CONSOLIDATED FINANCIAL STATEMENTS
the grant date fair value of the awards, which is equal to the market price of PSEG’s common stock on the date of the grant. The
NOTES TO CONSOLIDATED FINANCIAL STATEMENTS
accrual during the year of grant is estimated at 100% of the original grant. Such accrual may be adjusted to reflect the actual outcome.
|
| | | | | | | | | | | | | | |
| | | | | | | | | |
| | | | 2016 | | 2015 | | 2014 | |
| | | | Millions | |
| | Compensation Cost included in Operation and Maintenance Expense | | $ | 29 |
| | $ | 34 |
| | $ | 32 |
| |
| | Income Tax Benefit Recognized in Consolidated Statement of Operations | | $ | 12 |
| | $ | 14 |
| | $ | 13 |
| |
| | | | | | | | | |
|
| | | | | | | | | | | | | | |
| | | | | | | | | |
| | | | 2018 | | 2017 | | 2016 | |
| | | | Millions | |
| | Compensation Cost included in Operation and Maintenance Expense | | $ | 30 |
| | $ | 31 |
| | $ | 29 |
| |
| | Income Tax Benefit Recognized in Consolidated Statement of Operations | | $ | 9 |
| | $ | 13 |
| | $ | 12 |
| |
| | | | | | | | | |
For 20162018, 2017 and 20152016 the excess tax benefit wasof $3 million, $4 million and $3$4 million, respectively. Thererespectively was no excess tax benefit for 2014.included as financing cash flows on the Consolidated Statements of Cash Flow.
PSEG recognizes compensation cost of awards issued over the shorter of the original vesting period or the period beginning on the date of grant and ending on the date an individual is eligible for retirement and the award vests.
Stock Options
Changes in stock options for 20162018 are summarized as follows:
|
| | | | | | | | | | | | | | | |
| | | | | | | | | | | |
| | | | Options | | Weighted Average Exercise Price | | Weighted Average Remaining Years Contractual Term | | Aggregate Intrinsic Value | |
| | Outstanding as of January 1, 2016 | | 1,707,250 |
| | $ | 36.00 |
| | | | | |
| | Exercised | | 677,350 |
| | $ | 33.06 |
| | | | | |
| | Canceled/Forfeited | | — |
| | $ | — |
| | | | | |
| | Outstanding as of December 31, 2016 | | 1,029,900 |
| | $ | 37.93 |
| | 2.0 | | $ | 7,640,178 |
| |
| | Exercisable at December 31, 2016 | | 1,029,900 |
| | $ | 37.93 |
| | 2.0 | | $ | 7,640,178 |
| |
| | | | | | | | | | | |
|
| | | | | | | | | | | | | | | |
| | | | | | | | | | | |
| | | | Options | | Weighted Average Exercise Price | | Weighted Average Remaining Years Contractual Term | | Aggregate Intrinsic Value | |
| | Outstanding as of January 1, 2018 | | 347,900 |
| | $ | 33.49 |
| | | | | |
| | Exercised | | 115,967 |
| | $ | 33.49 |
| | | | | |
| | Canceled/Forfeited | | — |
| | $ | — |
| | | | | |
| | Outstanding as of December 31, 2018 | | 231,933 |
| | $ | 33.49 |
| | 1.0 | | $ | 4,304,676 |
| |
| | Exercisable at December 31, 2018 | | 231,933 |
| | $ | 33.49 |
| | 1.0 | | $ | 4,304,676 |
| |
| | | | | | | | | | | |
The fair value of each option grant is estimated on the date of grant using the Black-Scholes option-pricing model. There were no option grants in 2016, 20152018, 2017 and 20142016.
Activity for options exercised for the years ended December 31, 2016, 20152018, 2017 and 20142016 is shown below:
|
| | | | | | | | | | | | | | |
| | | | | | | | | |
| | | | 2016 | | 2015 | | 2014 | |
| | | | Millions | |
| | Total Intrinsic Value of Options Exercised | | $ | 7 |
| | $ | 3 |
| | $ | 4 |
| |
| | Cash Received from Options Exercised | | $ | 22 |
| | $ | 12 |
| | $ | 16 |
| |
| | Tax Benefit Realized from Options Exercised | | $ | 1 |
| | $ | — |
| | $ | — |
| |
| | | | | | | | | |
|
| | | | | | | | | | | | | | |
| | | | | | | | | |
| | | | 2018 | | 2017 | | 2016 | |
| | | | Millions | |
| | Total Intrinsic Value of Options Exercised | | $ | 2 |
| | $ | 5 |
| | $ | 7 |
| |
| | Cash Received from Options Exercised | | $ | 4 |
| | $ | 26 |
| | $ | 22 |
| |
| | Tax Benefit Realized from Options Exercised | | $ | — |
| | $ | — |
| | $ | 1 |
| |
| | | | | | | | | |
No options were vested during the years ended December 31, 2016, 20152018, 2017 and 2014.2016.
Restricted Stock Units
Changes in restricted stock units for the year ended December 31, 20162018 are summarized as follows:
|
| | | | | | | | | | | | | | | |
| | | | | | | | | | | |
| | | | Shares | | Weighted Average Grant Date Fair Value | | Weighted Average Remaining Years Contractual Term | | Aggregate Intrinsic Value | |
| | Non-vested as of January 1, 2016 | | 408,507 |
| | $ | 34.95 |
| | | | | |
| | Granted | | 285,258 |
| | $ | 42.28 |
| | | | | |
| | Vested | | 362,098 |
| | $ | 37.23 |
| | | | | |
| | Canceled/Forfeited | | 9,471 |
| | $ | 39.67 |
| | | | | |
| | Non-vested as of December 31, 2016 | | 322,196 |
| | $ | 38.75 |
| | 1.0 | | $ | 14,137,960 |
| |
| | | |
|
| | | | | | | |
|
| | | | | | | | | | | | | | | |
| | | | | | | | | | | |
| | | | Shares | | Weighted Average Grant Date Fair Value | | Weighted Average Remaining Years Contractual Term | | Aggregate Intrinsic Value | |
| | Non-vested as of January 1, 2018 | | 213,899 |
| | $ | 42.32 |
| | | | | |
| | Granted | | 277,261 |
| | $ | 49.34 |
| | | | | |
| | Vested | | 220,105 |
| | $ | 46.02 |
| | | | | |
| | Canceled/Forfeited | | 13,472 |
| | $ | 44.94 |
| | | | | |
| | Non-vested as of December 31, 2018 | | 257,583 |
| | $ | 46.58 |
| | 1.2 | | $ | 13,407,195 |
| |
| | | |
|
| | | | | | | |
The weighted average grant date fair value per share for restricted stock units during the years ended December 31, 2016, 20152018, 2017 and 20142016 was $42.28, $39.65$49.34, $44.33 and $35.16$42.28 per share, respectively.
NOTES TO CONSOLIDATED FINANCIAL STATEMENTS
The total intrinsic value of restricted stock units vesteddistributed during the years ended December 31, 2016, 20152018, 2017 and 20142016 was
$12 million, $13 million and $17 million, $11 million and $12 million, respectively.
As of December 31, 2016,2018, there was approximately $4$5 million of unrecognized compensation cost related to the restricted stock units, which is expected to be recognized over a weighted average period of ten months.1.2 years. Dividend equivalents units of 35,53726,987 accrued on the restricted stock units during the year.
Performance Share Units
Changes in performance share units for the year ended December 31, 20162018 are summarized as follows:
|
| | | | | | | | | | | | | | | |
| | | | | | | | | | | |
| | | | Shares | | Weighted Average Grant Date Fair Value | | Weighted Average Remaining Years Contractual Term | | Aggregate Intrinsic Value | |
| | Non-vested as of January 1, 2016 | | 403,961 |
| | $ | 40.42 |
| | | | | |
| | Granted | | 319,718 |
| | $ | 45.97 |
| | | | | |
| | Vested | | 301,554 |
| | $ | 41.22 |
| | | | | |
| | Canceled/Forfeited | | 28,313 |
| | $ | 42.04 |
| | | | | |
| | Non-vested as of December 31, 2016 | | 393,812 |
| | $ | 44.20 |
| | 1.6 | | $ | 17,280,471 |
| |
| | | | | | | | | | | |
|
| | | | | | | | | | | | | | | |
| | | | | | | | | | | |
| | | | Shares | | Weighted Average Grant Date Fair Value | | Weighted Average Remaining Years Contractual Term | | Aggregate Intrinsic Value | |
| | Non-vested as of January 1, 2018 | | 332,461 |
| | $ | 45.29 |
| | | | | |
| | Granted | | 378,800 |
| | $ | 54.95 |
| | | | | |
| | Vested | | 310,425 |
| | $ | 49.63 |
| | | | | |
| | Canceled/Forfeited | | 23,295 |
| | $ | 48.57 |
| | | | | |
| | Non-vested as of December 31, 2018 | | 377,541 |
| | $ | 51.94 |
| | 1.7 | | $ | 19,651,009 |
| |
| | | | | | | | | | | |
The weighted average grant date fair value per share for performance share units during the years ended December 31, 2016, 20152018, 2017 and 20142016 was $45.97, $41.32$54.95, $45.02 and $38.94$45.97 per share, respectively.
The total intrinsic value of performance share units vesteddistributed during the years ended December 31, 2018, 2017 and 2016 2015 and 2014 was $17
$17 million, $13$18 million and $6$17 million, respectively.
As of December 31, 2016,2018, there was approximately $13$21 million of unrecognized compensation cost related to the performance share units, which is expected to be recognized over a weighted average period of one year.1.7 years. Dividend equivalents units of 36,85637,156 accrued on the performance share units during the year.
Outside Directors
Under the Directors Equity Plan, annually, on the first business day of May, each non-employee member of the Board of Directors is awarded stock units based on the amount of annual compensation to be paid at the closing price of PSEG common stock on that date. Dividend equivalents are credited quarterly and distributions will commence upon the director leaving the Board as specified by him/her in accordance with the provisions of the Directors Equity Plan.
The fair value of these awards is recorded as compensation expense in the Consolidated Statements of Operations. Compensation expense for the plan was immaterial for each of the years ended December 31, 2016, 20152018, 2017 and 20142016 was approximately $1 million..
Employee Stock Purchase Plan (ESPP)
PSEG maintains an ESPP for all eligible employees of PSEG and its subsidiaries. Under the ESPP, shares of PSEG common stock may be purchased at 95% of the fair market value for represented employees and 90% for non-represented employees through payroll deductions. Dividends will be reinvested for all employees at 95% of the fair market price unless the participant elects to receive a cash dividend. All employees are required to hold the shares purchased under the ESPP for at least three months from the purchase date. In any year, employees may purchase shares having a value not exceeding 10% of their base pay. Compensation expense recognized under this program was immaterial for each of the years ended December 31, 2016, 20152018, 2017 and 2014.2016.
During the years ended December 31, 2016, 20152018, 2017 and 20142016, employees purchased 262,763286,559 shares, 250,499288,527 shares and 207,248262,763 shares, respectively, at an average price of $40.70, $36.66$47.44, $42.07 and $36.07$40.70 per share, respectively. As of December 31, 2016, 3.52018, 2.9 million shares were available for future issuance under this plan.
Note 19.20. Other Income and Deductions(Deductions)
|
| | | | | | | | | | | | | | | | | | |
| | | | | | | | | | | |
| | Other Income | | PSE&G | | Power | | Other (A) | | Consolidated Total | |
| | | | Millions | |
| | Year Ended December 31, 2016 | | | | | | | | | |
| | NDT Fund Gains, Interest, Dividend and Other Income | | $ | — |
| | $ | 96 |
| | $ | — |
| | $ | 96 |
| |
| | Allowance for Funds Used During Construction | | 49 |
| | — |
| | — |
| | 49 |
| |
| | Solar Loan Interest | | 22 |
| | — |
| | — |
| | 22 |
| |
| | Other | | 12 |
| | 6 |
| | 6 |
| | 24 |
| |
| | Total Other Income | | $ | 83 |
| | $ | 102 |
| | $ | 6 |
| | $ | 191 |
| |
| | Year Ended December 31, 2015 | | | | | | | | | |
| | NDT Fund Gains, Interest, Dividend and Other Income | | $ | — |
| | $ | 138 |
| | $ | — |
| | $ | 138 |
| |
| | Allowance for Funds Used During Construction | | 48 |
| | — |
| | — |
| | 48 |
| |
| | Solar Loan Interest | | 23 |
| | — |
| | — |
| | 23 |
| |
| | Gain on Insurance Recovery | | — |
| | 28 |
| | — |
| | 28 |
| |
| | Other | | 8 |
| | 3 |
| | 6 |
| | 17 |
| |
| | Total Other Income | | $ | 79 |
| | $ | 169 |
| | $ | 6 |
| | $ | 254 |
| |
| | Year Ended December 31, 2014 | | | | | | | | | |
| | NDT Fund Gains, Interest, Dividend and Other Income | | $ | — |
| | $ | 219 |
| | $ | — |
| | $ | 219 |
| |
| | Allowance for Funds Used During Construction | | 31 |
| | — |
| | — |
| | 31 |
| |
| | Solar Loan Interest | | 24 |
| | — |
| | — |
| | 24 |
| |
| | Other | | 6 |
| | 3 |
| | 7 |
| | 16 |
| |
| | Total Other Income | | $ | 61 |
| | $ | 222 |
| | $ | 7 |
| | $ | 290 |
| |
| | | | | | | | | | | |
|
| | | | | | | | | | | | | | | | | | |
| | | | | | | | | | | |
| | | | PSE&G | | Power | | Other (A) | | Consolidated Total | |
| | | | Millions | |
| | Year Ended December 31, 2018 | | | | | | | | | |
| | NDT Fund Interest and Dividends | | $ | — |
| | $ | 52 |
| | $ | — |
| | $ | 52 |
| |
| | Allowance for Funds Used During Construction | | 54 |
| | — |
| | — |
| | 54 |
| |
| | Solar Loan Interest | | 18 |
| | — |
| | — |
| | 18 |
| |
| | Donations | | — |
| | — |
| | (17 | ) | | (17 | ) | |
| | Other | | 8 |
| | (31 | ) | | 1 |
| | (22 | ) | |
| | Total Other Income (Deductions) | | $ | 80 |
| | $ | 21 |
| | $ | (16 | ) | | $ | 85 |
| |
| | Year Ended December 31, 2017 | | | | | | | | | |
| | NDT Fund Interest and Dividends | | $ | — |
| | $ | 45 |
| | $ | — |
| | $ | 45 |
| |
| | Allowance for Funds Used During Construction | | 56 |
| | — |
| | — |
| | 56 |
| |
| | Solar Loan Interest | | 21 |
| | — |
| | — |
| | 21 |
| |
| | Donations | | (1 | ) | | (2 | ) | | (25 | ) | | (28 | ) | |
| | Other | | 9 |
| | (23 | ) | | 2 |
| | (12 | ) | |
| | Total Other Income (Deductions) | | $ | 85 |
| | $ | 20 |
| | $ | (23 | ) | | $ | 82 |
| |
| | Year Ended December 31, 2016 | | | | | | | | | |
| | NDT Fund Interest and Dividends | | $ | — |
| | $ | 43 |
| | $ | — |
| | $ | 43 |
| |
| | Allowance for Funds Used During Construction | | 49 |
| | — |
| | — |
| | 49 |
| |
| | Solar Loan Interest | | 22 |
| | — |
| | — |
| | 22 |
| |
| | Donations | | (1 | ) | | (1 | ) | | — |
| | (2 | ) | |
| | Other | | 9 |
| | (19 | ) | | — |
| | (10 | ) | |
| | Total Other Income (Deductions) | | $ | 79 |
| | $ | 23 |
| | $ | — |
| | $ | 102 |
| |
| | | | | | | | | | | |
|
| | | | | | | | | | | | | | | | | | |
| | | | | | | | | | | |
| | Other Deductions | | PSE&G | | Power | | Other (A) | | Consolidated Total | |
| | | | Millions | |
| | Year Ended December 31, 2016 | | | | | | | | | |
| | NDT Fund Realized Losses and Expenses | | $ | — |
| | $ | 40 |
| | $ | — |
| | $ | 40 |
| |
| | Other | | 4 |
| | 17 |
| | 6 |
| | 27 |
| |
| | Total Other Deductions | | $ | 4 |
| | $ | 57 |
| | $ | 6 |
| | $ | 67 |
| |
| | Year Ended December 31, 2015 | | | | | | | | | |
| | NDT Fund Realized Losses and Expenses | | $ | — |
| | $ | 45 |
| | $ | — |
| | $ | 45 |
| |
| | Other | | 4 |
| | 27 |
| | 26 |
| | 57 |
| |
| | Total Other Deductions | | $ | 4 |
| | $ | 72 |
| | $ | 26 |
| | $ | 102 |
| |
| | Year Ended December 31, 2014 | | | | | | | | | |
| | NDT Fund Realized Losses and Expenses | | $ | — |
| | $ | 31 |
| | $ | — |
| | $ | 31 |
| |
| | Other | | 3 |
| | 21 |
| | 6 |
| | 30 |
| |
| | Total Other Deductions | | $ | 3 |
| | $ | 52 |
| | $ | 6 |
| | $ | 61 |
| |
| | | | | | | | | | | |
| |
| (A) | Other consists of activity at PSEG (as parent company), Energy Holdings, Services, PSEG LI and intercompany eliminations. |
NOTES TO CONSOLIDATED FINANCIAL STATEMENTS
Note 20.21. Income Taxes
A reconciliation of reported income tax expense for PSEG with the amount computed by multiplying pre-tax income by the statutory federal income tax rate of 21% in 2018 and 35% in 2017 and 2016 is as follows: |
| | | | | | | | | | | | | | |
| | | | | | | | | |
| | | | Years Ended December 31, | |
| | PSEG | | 2016 | | 2015 | | 2014 | |
| | | | Millions | |
| | Net Income | | $ | 887 |
| | $ | 1,679 |
| | $ | 1,518 |
| |
| | Income Taxes: | | | | | | | |
| | Operating Income: | | | | | | | |
| | Current Expense: | | | | | | | |
| | Federal | | $ | (74 | ) | | $ | 243 |
| | $ | 335 |
| |
| | State | | 61 |
| | 85 |
| | 58 |
| |
| | Total Current | | (13 | ) | | 328 |
| | 393 |
| |
| | Deferred Expense: | | | | | | | |
| | Federal | | 311 |
| | 540 |
| | 262 |
| |
| | State | | 28 |
| | 104 |
| | 260 |
| |
| | Total Deferred | | 339 |
| | 644 |
| | 522 |
| |
| | Investment Tax Credit (ITC) | | 85 |
| | 29 |
| | 23 |
| |
| | Total Income Taxes | | $ | 411 |
| | $ | 1,001 |
| | $ | 938 |
| |
| | Pre-Tax Income | | $ | 1,298 |
| | $ | 2,680 |
| | $ | 2,456 |
| |
| | Tax Computed at Statutory Rate @ 35% | | $ | 454 |
| | $ | 938 |
| | $ | 860 |
| |
| | Increase (Decrease) Attributable to Flow-Through of Certain Tax Adjustments: | | | | | | | |
| | State Income Taxes (net of federal income tax) | | 56 |
| | 129 |
| | 145 |
| |
| | Uncertain Tax Positions | | (31 | ) | | 7 |
| | (9 | ) | |
| | Manufacturing Deduction | | (17 | ) | | (10 | ) | | (16 | ) | |
| | NDT Fund | | 3 |
| | 7 |
| | 14 |
| |
| | Plant-Related Items | | (20 | ) | | (20 | ) | | (13 | ) | |
| | Tax Credits | | (25 | ) | | (13 | ) | | (14 | ) | |
| | Audit Settlement | | — |
| | — |
| | (12 | ) | |
| | Nuclear Decommissioning Tax Carryback | | — |
| | (33 | ) | | — |
| |
| | Other | | (9 | ) | | (4 | ) | | (17 | ) | |
| | Sub-Total | | (43 | ) | | 63 |
| | 78 |
| |
| | Total Income Tax Provision | | $ | 411 |
| | $ | 1,001 |
| | $ | 938 |
| |
| | Effective Income Tax Rate | | 31.7 | % | | 37.4 | % | | 38.2 | % | |
| | | | | | | | | |
|
| | | | | | | | | | | | | | |
| | | | | | | | | |
| | | | Years Ended December 31, | |
| | PSEG | | 2018 | | 2017 | | 2016 | |
| | | | Millions | |
| | Net Income | | $ | 1,438 |
| | $ | 1,574 |
| | $ | 887 |
| |
| | Income Taxes: | | | | | | | |
| | Operating Income: | | | | | | | |
| | Current (Benefit) Expense: | | | | | | | |
| | Federal | | $ | (97 | ) | | $ | 86 |
| | $ | (74 | ) | |
| | State | | 83 |
| | (31 | ) | | 61 |
| |
| | Total Current | | (14 | ) | | 55 |
| | (13 | ) | |
| | Deferred Expense (Benefit): | | | | | | | |
| | Federal | | 373 |
| | (482 | ) | | 311 |
| |
| | State | | 71 |
| | 92 |
| | 28 |
| |
| | Total Deferred | | 444 |
| | (390 | ) | | 339 |
| |
| | Investment Tax Credit (ITC) | | (13 | ) | | 29 |
| | 85 |
| |
| | Total Income Tax Expense (Benefit) | | $ | 417 |
| | $ | (306 | ) | | $ | 411 |
| |
| | Pre-Tax Income | | $ | 1,855 |
| | $ | 1,268 |
| | $ | 1,298 |
| |
| | Tax Computed at Statutory Rate @ 21% in 2018 and 35% in 2017 and 2016 | | $ | 390 |
| | $ | 444 |
| | $ | 454 |
| |
| | Increase (Decrease) Attributable to Flow-Through of Certain Tax Adjustments: | | | | | | | |
| | State Income Taxes (net of federal income tax) | | 123 |
| | 36 |
| | 56 |
| |
| | Uncertain Tax Positions | | (24 | ) | | (3 | ) | | (31 | ) | |
| | Manufacturing Deduction | | — |
| | (13 | ) | | (17 | ) | |
| | NDT Fund | | (13 | ) | | 19 |
| | 3 |
| |
| | Plant-Related Items | | (10 | ) | | (23 | ) | | (20 | ) | |
| | Tax Credits | | (16 | ) | | (22 | ) | | (25 | ) | |
| | Audit Settlement | | — |
| | 6 |
| | — |
| |
| | Tax Adjustment Credit | | (30 | ) | | — |
| | — |
| |
| | Deferred Tax Expense (Benefit) - Tax Act | | 3 |
| | (755 | ) | | — |
| |
| | Other | | (6 | ) | | 5 |
| | (9 | ) | |
| | Sub-Total | | 27 |
| | (750 | ) | | (43 | ) | |
| | Total Income Tax Expense (Benefit) | | $ | 417 |
| | $ | (306 | ) | | $ | 411 |
| |
| | Effective Income Tax Rate | | 22.5 | % | | (24.1 | )% | | 31.7 | % | |
| | | | | | | | | |
NOTES TO CONSOLIDATED FINANCIAL STATEMENTS
The following is an analysis of deferred income taxes for PSEG:
|
| | | | | | | | | | |
| | | | | | | |
| | | | As of December 31, | |
| | PSEG | | 2016 | | 2015 | |
| | | | Millions | |
| | Deferred Income Taxes | | | | | |
| | Assets: | | | | | |
| | Noncurrent | | | | | |
| | OPEB | | $ | 283 |
| | $ | 256 |
| |
| | Related to Uncertain Tax Position | | 155 |
| | 160 |
| |
| | Securitization-Overcollection | | — |
| | 27 |
| |
| | Total Noncurrent Assets | | $ | 438 |
| | $ | 443 |
| |
| | | | | | | |
| | Liabilities: | | | | | |
| | Noncurrent: | | | | | |
| | Plant-Related Items | | $ | 6,593 |
| | $ | 6,174 |
| |
| | New Jersey Corporate Business Tax | | 674 |
| | 615 |
| |
| | Leasing Activities | | 565 |
| | 612 |
| |
| | Pension Costs | | 197 |
| | 218 |
| |
| | AROs and NDT Fund | | 398 |
| | 393 |
| |
| | Taxes Recoverable Through Future Rate (net) | | 208 |
| | 191 |
| |
| | Other | | 212 |
| | 244 |
| |
| | Total Noncurrent Liabilities | | $ | 8,847 |
| | $ | 8,447 |
| |
| | Summary of Accumulated Deferred Income Taxes: | | | | | |
| | Net Noncurrent Deferred Income Tax Liabilities | | $ | 8,409 |
| | $ | 8,004 |
| |
| | ITC | | 249 |
| | 162 |
| |
| | Net Total Noncurrent Deferred Income Taxes and ITC | | $ | 8,658 |
| | $ | 8,166 |
| |
| | | | | | | |
|
| | | | | | | | | | |
| | | | | | | |
| | | | As of December 31, | |
| | PSEG | | 2018 | | 2017 | |
| | | | Millions | |
| | Deferred Income Taxes | | | | | |
| | Assets: | | | | | |
| | Noncurrent | | | | | |
| | Regulatory Liability Excess Deferred Tax | | $ | 606 |
| | $ | 602 |
| |
| | OPEB | | 163 |
| | 217 |
| |
| | Related to Uncertain Tax Position | | 71 |
| | 142 |
| |
| | Total Noncurrent Assets | | $ | 840 |
| | $ | 961 |
| |
| | | | | | | |
| | Liabilities: | | | | | |
| | Noncurrent: | | | | | |
| | Plant-Related Items | | $ | 4,817 |
| | $ | 4,257 |
| |
| | New Jersey Corporate Business Tax | | 756 |
| | 674 |
| |
| | Leasing Activities | | 307 |
| | 384 |
| |
| | AROs and NDT Fund | | 196 |
| | 233 |
| |
| | Pension Costs | | 111 |
| | 123 |
| |
| | Taxes Recoverable Through Future Rates (net) | | 89 |
| | 80 |
| |
| | Other | | 12 |
| | 171 |
| |
| | Total Noncurrent Liabilities | | $ | 6,288 |
| | $ | 5,922 |
| |
| | Summary of Accumulated Deferred Income Taxes: | | | | | |
| | Net Noncurrent Deferred Income Tax Liabilities | | $ | 5,448 |
| | $ | 4,961 |
| |
| | ITC | | 265 |
| | 279 |
| |
| | Net Total Noncurrent Deferred Income Taxes and ITC | | $ | 5,713 |
| | $ | 5,240 |
| |
| | | | | | | |
The deferred tax effect of certain assets and liabilities is presented in the table above net of the deferred tax effect associated with the respective regulatory deferrals. Also,
In December 2017, new tax legislation was enacted, reducing the statutory U.S. corporate income tax rate from a maximum of 35% to 21%, effective January 1, 2018. PSEG is subject to ASC 740, which requires that the effect on deferred tax effectassets and liabilities of AROs is presented net ofa change in tax rates be recognized in the deferredperiod the tax effect of the associated funding of those obligations.rate was enacted.
NOTES TO CONSOLIDATED FINANCIAL STATEMENTS
A reconciliation of reported income tax expense for PSE&G with the amount computed by multiplying pre-tax income by the statutory federal income tax rate of 21% in 2018 and 35% in 2017 and 2016 is as follows:
|
| | | | | | | | | | | | | | |
| | | | | | | | | |
| | | | Years Ended December 31, | |
| | PSE&G | | 2016 | | 2015 | | 2014 | |
| | | | Millions | |
| | Net Income | | $ | 889 |
| | $ | 787 |
| | $ | 725 |
| |
| | Income Taxes: | | | | | | | |
| | Operating Income: | | | | | | | |
| | Current Expense: | | | | | | | |
| | Federal | | $ | (153 | ) | | $ | 32 |
| | $ | 124 |
| |
| | State | | 10 |
| | 52 |
| | 16 |
| |
| | Total Current | | (143 | ) | | 84 |
| | 140 |
| |
| | Deferred Expense: | | | | | | | |
| | Federal | | 551 |
| | 325 |
| | 214 |
| |
| | State | | 102 |
| | 52 |
| | 84 |
| |
| | Total Deferred | | 653 |
| | 377 |
| | 298 |
| |
| | ITC | | 5 |
| | 9 |
| | 11 |
| |
| | Total Income Taxes | | $ | 515 |
| | $ | 470 |
| | $ | 449 |
| |
| | Pre-Tax Income | | $ | 1,404 |
| | $ | 1,257 |
| | $ | 1,174 |
| |
| | Tax Computed at Statutory Rate @ 35% | | $ | 491 |
| | $ | 440 |
| | $ | 411 |
| |
| | Increase (Decrease) Attributable to Flow-Through of Certain Tax Adjustments: | | | | | | | |
| | State Income Taxes (net of federal income tax) | | 72 |
| | 67 |
| | 65 |
| |
| | Uncertain Tax Positions | | (18 | ) | | (14 | ) | | — |
| |
| | Plant-Related Items | | (20 | ) | | (20 | ) | | (13 | ) | |
| | Tax Credits | | (7 | ) | | (6 | ) | | (7 | ) | |
| | Audit Settlement | | — |
| | — |
| | 1 |
| |
| | Other | | (3 | ) | | 3 |
| | (8 | ) | |
| | Sub-Total | | 24 |
| | 30 |
| | 38 |
| |
| | Total Income Tax Provision | | $ | 515 |
| | $ | 470 |
| | $ | 449 |
| |
| | Effective Income Tax Rate | | 36.7 | % | | 37.4 | % | | 38.2 | % | |
| | | | | | | | | |
|
| | | | | | | | | | | | | | |
| | | | | | | | | |
| | | | Years Ended December 31, | |
| | PSE&G | | 2018 | | 2017 | | 2016 | |
| | | | Millions | |
| | Net Income | | $ | 1,067 |
| | $ | 973 |
| | $ | 889 |
| |
| | Income Taxes: | | | | | | | |
| | Operating Income: | | | | | | | |
| | Current (Benefit) Expense: | | | | | | | |
| | Federal | | $ | (62 | ) | | $ | (52 | ) | | $ | (153 | ) | |
| | State | | 1 |
| | (1 | ) | | 10 |
| |
| | Total Current | | (61 | ) | | (53 | ) | | (143 | ) | |
| | Deferred Expense: | | | | | | | |
| | Federal | | 287 |
| | 492 |
| | 551 |
| |
| | State | | 122 |
| | 129 |
| | 102 |
| |
| | Total Deferred | | 409 |
| | 621 |
| | 653 |
| |
| | ITC | | (4 | ) | | (5 | ) | | 5 |
| |
| | Total Income Tax Expense | | $ | 344 |
| | $ | 563 |
| | $ | 515 |
| |
| | Pre-Tax Income | | $ | 1,411 |
| | $ | 1,536 |
| | $ | 1,404 |
| |
| | Tax Computed at Statutory Rate @ 21% in 2018 and 35% in 2017 and 2016 | | $ | 296 |
| | $ | 538 |
| | $ | 491 |
| |
| | Increase (Decrease) Attributable to Flow-Through of Certain Tax Adjustments: | | | | | | | |
| | State Income Taxes (net of federal income tax) | | 98 |
| | 83 |
| | 72 |
| |
| | Uncertain Tax Positions | | (1 | ) | | (9 | ) | | (18 | ) | |
| | Plant-Related Items | | (10 | ) | | (23 | ) | | (20 | ) | |
| | Tax Credits | | (8 | ) | | (9 | ) | | (7 | ) | |
| | Tax Adjustment Credit | | (30 | ) | | — |
| | — |
| |
| | Deferred Tax Benefit - Tax Act | | — |
| | (10 | ) | | — |
| |
| | Other | | (1 | ) | | (7 | ) | | (3 | ) | |
| | Sub-Total | | 48 |
| | 25 |
| | 24 |
| |
| | Total Income Tax Expense | | $ | 344 |
| | $ | 563 |
| | $ | 515 |
| |
| | Effective Income Tax Rate | | 24.4 | % | | 36.7 | % | | 36.7 | % | |
| | | | | | | | | |
NOTES TO CONSOLIDATED FINANCIAL STATEMENTS
The following is an analysis of deferred income taxes for PSE&G:
|
| | | | | | | | | | |
| | | | | | | |
| | | | As of December 31, | |
| | PSE&G | | 2016 | | 2015 | |
| | | | Millions | |
| | Deferred Income Taxes | | | | | |
| | Assets: | | | | | |
| | Noncurrent: | | | | | |
| | OPEB | | $ | 189 |
| | $ | 164 |
| |
| | Securitization-Overcollection | | — |
| | 27 |
| |
| | Total Noncurrent Assets | | $ | 189 |
| | $ | 191 |
| |
| | Liabilities: | | | | | |
| | Noncurrent: | | | | | |
| | Plant-Related Items | | $ | 4,983 |
| | $ | 4,435 |
| |
| | New Jersey Corporate Business Tax | | 385 |
| | 312 |
| |
| | Conservation Costs | | 33 |
| | 40 |
| |
| | Pension Costs | | 252 |
| | 262 |
| |
| | Taxes Recoverable Through Future Rate (net) | | 208 |
| | 191 |
| |
| | Other | | 118 |
| | 54 |
| |
| | Total Noncurrent Liabilities | | $ | 5,979 |
| | $ | 5,294 |
| |
| | Summary of Accumulated Deferred Income Taxes: | | | | | |
| | Net Noncurrent Deferred Income Tax Liabilities | | $ | 5,790 |
| | $ | 5,103 |
| |
| | ITC | | 83 |
| | 78 |
| |
| | Net Total Noncurrent Deferred Income Taxes and ITC | | $ | 5,873 |
| | $ | 5,181 |
| |
| | | | | | | |
|
| | | | | | | | | | |
| | | | | | | |
| | | | As of December 31, | |
| | PSE&G | | 2018 | | 2017 | |
| | | | Millions | |
| | Deferred Income Taxes | | | | | |
| | Assets: | | | | | |
| | Noncurrent: | | | | | |
| | Regulatory Liability Excess Deferred Tax | | $ | 606 |
| | $ | 602 |
| |
| | OPEB | | 114 |
| | 116 |
| |
| | Total Noncurrent Assets | | $ | 720 |
| | $ | 718 |
| |
| | Liabilities: | | | | | |
| | Noncurrent: | | | | | |
| | Plant-Related Items | | $ | 3,622 |
| | $ | 3,311 |
| |
| | New Jersey Corporate Business Tax | | 486 |
| | 378 |
| |
| | Pension Costs | | 159 |
| | 152 |
| |
| | Conservation Costs | | 36 |
| | 24 |
| |
| | Taxes Recoverable Through Future Rates (net) | | 89 |
| | 80 |
| |
| | Other | | 84 |
| | 86 |
| |
| | Total Noncurrent Liabilities | | $ | 4,476 |
| | $ | 4,031 |
| |
| | Summary of Accumulated Deferred Income Taxes: | | | | | |
| | Net Noncurrent Deferred Income Tax Liabilities | | $ | 3,756 |
| | $ | 3,313 |
| |
| | ITC | | 74 |
| | 78 |
| |
| | Net Total Noncurrent Deferred Income Taxes and ITC | | $ | 3,830 |
| | $ | 3,391 |
| |
| | | | | | | |
The deferred tax effect of certain assets and liabilities is presented in the table above net of the deferred tax effect associated with the respective regulatory deferrals.
In December 2017, new tax legislation was enacted, reducing the statutory U.S. corporate income tax rate from a maximum of 35% to 21%, effective January 1, 2018. PSE&G is subject to ASC 740, which requires that the effect on deferred tax assets and liabilities of a change in tax rates be recognized in the period the tax rate was enacted.
NOTES TO CONSOLIDATED FINANCIAL STATEMENTS
A reconciliation of reported income tax expense for Power with the amount computed by multiplying pre-tax income by the statutory federal income tax rate of 21% in 2018 and 35% in 2017 and 2016 is as follows:
|
| | | | | | | | | | | | | | |
| | | | | | | | | |
| | | | Years Ended December 31, | |
| | Power | | 2016 | | 2015 | | 2014 | |
| | | | Millions | |
| | Net Income | | $ | 18 |
| | $ | 856 |
| | $ | 760 |
| |
| | Income Taxes: | | | | | | | |
| | Operating Income: | | | | | | | |
| | Current Expense: | | | | | | | |
| | Federal | | $ | 107 |
| | $ | 220 |
| | $ | 231 |
| |
| | State | | 40 |
| | 30 |
| | 39 |
| |
| | Total Current | | 147 |
| | 250 |
| | 270 |
| |
| | Deferred Expense: | | | | | | | |
| | Federal | | (222 | ) | | 189 |
| | 163 |
| |
| | State | | (68 | ) | | 52 |
| | 48 |
| |
| | Total Deferred | | (290 | ) | | 241 |
| | 211 |
| |
| | ITC | | 82 |
| | 20 |
| | 10 |
| |
| | Total Income Taxes | | $ | (61 | ) | | $ | 511 |
| | $ | 491 |
| |
| | Pre-Tax Income | | $ | (43 | ) | | $ | 1,367 |
| | $ | 1,251 |
| |
| | Tax Computed at Statutory Rate @ 35% | | $ | (15 | ) | | $ | 478 |
| | $ | 438 |
| |
| | Increase (Decrease) Attributable to Flow-Through of Certain Tax Adjustments: | | | | | | | |
| | State Income Taxes (net of federal income tax) | | (18 | ) | | 59 |
| | 58 |
| |
| | Manufacturing Deduction | | (17 | ) | | (10 | ) | | (16 | ) | |
| | NDT Fund | | 3 |
| | 7 |
| | 15 |
| |
| | Tax Credits | | (18 | ) | | (7 | ) | | (6 | ) | |
| | Uncertain Tax Positions | | 9 |
| | 22 |
| | (8 | ) | |
| | Audit Settlement | | — |
| | — |
| | (4 | ) | |
| | Nuclear Decommissioning Tax Carryback | | — |
| | (33 | ) | | — |
| |
| | Other | | (5 | ) | | (5 | ) | | 14 |
| |
| | Sub-Total | | (46 | ) | | 33 |
| | 53 |
| |
| | Total Income Tax Provision | | $ | (61 | ) | | $ | 511 |
| | $ | 491 |
| |
| | Effective Income Tax Rate | | 141.9 | % | | 37.4 | % | | 39.2 | % | |
| | | | | | | | | |
|
| | | | | | | | | | | | | | |
| | | | | | | | | |
| | | | Years Ended December 31, | |
| | Power | | 2018 | | 2017 | | 2016 | |
| | | | Millions | |
| | Net Income | | $ | 365 |
| | $ | 479 |
| | $ | 18 |
| |
| | Income Taxes: | | | | | | | |
| | Operating Income: | | | | | | | |
| | Current (Benefit) Expense: | | | | | | | |
| | Federal | | $ | (164 | ) | | $ | 95 |
| | $ | 107 |
| |
| | State | | 24 |
| | (17 | ) | | 40 |
| |
| | Total Current | | (140 | ) | | 78 |
| | 147 |
| |
| | Deferred Expense (Benefit): | | | | | | | |
| | Federal | | 214 |
| | (804 | ) | | (222 | ) | |
| | State | | 1 |
| | (37 | ) | | (68 | ) | |
| | Total Deferred | | 215 |
| | (841 | ) | | (290 | ) | |
| | ITC | | (9 | ) | | 34 |
| | 82 |
| |
| | Total Income Tax Expense (Benefit) | | $ | 66 |
| | $ | (729 | ) | | $ | (61 | ) | |
| | Pre-Tax Income (Loss) | | $ | 431 |
| | $ | (250 | ) | | $ | (43 | ) | |
| | Tax Computed at Statutory Rate @ 21% in 2018 and 35% in 2017 and 2016 | | $ | 91 |
| | $ | (88 | ) | | $ | (15 | ) | |
| | Increase (Decrease) Attributable to Flow-Through of Certain Tax Adjustments: | | | | | | | |
| | State Income Taxes (net of federal income tax) | | 21 |
| | (36 | ) | | (18 | ) | |
| | Manufacturing Deduction | | — |
| | (13 | ) | | (17 | ) | |
| | NDT Fund | | (13 | ) | | 19 |
| | 3 |
| |
| | Tax Credits | | (7 | ) | | (12 | ) | | (18 | ) | |
| | Uncertain Tax Positions | | (24 | ) | | 7 |
| | 9 |
| |
| | Audit Settlement | | — |
| | 1 |
| | — |
| |
| | Deferred Tax Benefit - Tax Act | | (1 | ) | | (610 | ) | | — |
| |
| | Other | | (1 | ) | | 3 |
| | (5 | ) | |
| | Sub-Total | | (25 | ) | | (641 | ) | | (46 | ) | |
| | Total Income Tax Expense (Benefit) | | $ | 66 |
| | $ | (729 | ) | | $ | (61 | ) | |
| | Effective Income Tax Rate | | 15.3 | % | | 291.6 | % | | 141.9 | % | |
| | | | | | | | | |
NOTES TO CONSOLIDATED FINANCIAL STATEMENTS
The following is an analysis of deferred income taxes for Power:
|
| | | | | | | | | | |
| | | | | | | |
| | | | As of December 31, | |
| | Power | | 2016 | | 2015 | |
| | | | Millions | |
| | Deferred Income Taxes | | | | | |
| | Assets: | | | | | |
| | Noncurrent: | | | | | |
| | Pension Costs | | $ | 68 |
| | $ | 56 |
| |
| | Contractual Liabilities & Environmental Costs | | 18 |
| | 18 |
| |
| | Related to Uncertain Tax Positions | | 53 |
| | 47 |
| |
| | Other | | 76 |
| | — |
| |
| | Total Noncurrent Assets | | $ | 215 |
| | $ | 121 |
| |
| | Liabilities: | | | | | |
| | Noncurrent: | | | | | |
| | Plant-Related Items | | $ | 1,605 |
| | $ | 1,736 |
| |
| | New Jersey Corporate Business Tax | | 214 |
| | 243 |
| |
| | AROs and NDT Fund | | 400 |
| | 395 |
| |
| | Other | | — |
| | 10 |
| |
| | Total Noncurrent Liabilities | | $ | 2,219 |
| | $ | 2,384 |
| |
| | Summary of Accumulated Deferred Income Taxes: | | | | | |
| | Net Noncurrent Deferred Income Tax Liabilities | | $ | 2,004 |
| | $ | 2,263 |
| |
| | ITC | | 166 |
| | 84 |
| |
| | Net Total Noncurrent Deferred Income Taxes and ITC | | $ | 2,170 |
| | $ | 2,347 |
| |
| | | | | | | |
In the above table, the deferred tax effect of asset retirement obligations is presented net of the deferred tax effect of the associated funding of those obligations. |
| | | | | | | | | | |
| | | | | | | |
| | | | As of December 31, | |
| | Power | | 2018 | | 2017 | |
| | | | Millions | |
| | Deferred Income Taxes | | | | | |
| | Assets: | | | | | |
| | Noncurrent: | | | | | |
| | Related to Uncertain Tax Positions | | $ | 60 |
| | $ | 45 |
| |
| | Pension Costs | | 52 |
| | 40 |
| |
| | Contractual Liabilities & Environmental Costs | | 9 |
| | 12 |
| |
| | Other | | 98 |
| | 93 |
| |
| | Total Noncurrent Assets | | $ | 219 |
| | $ | 190 |
| |
| | Liabilities: | | | | | |
| | Noncurrent: | | | | | |
| | Plant-Related Items | | $ | 1,189 |
| | $ | 935 |
| |
| | AROs and NDT Fund | | 197 |
| | 235 |
| |
| | New Jersey Corporate Business Tax | | 260 |
| | 225 |
| |
| | Total Noncurrent Liabilities | | $ | 1,646 |
| | $ | 1,395 |
| |
| | Summary of Accumulated Deferred Income Taxes: | | | | | |
| | Net Noncurrent Deferred Income Tax Liabilities | | $ | 1,427 |
| | $ | 1,205 |
| |
| | ITC | | 192 |
| | 201 |
| |
| | Net Total Noncurrent Deferred Income Taxes and ITC | | $ | 1,619 |
| | $ | 1,406 |
| |
| | | | | | | |
PSEG, PSE&G and Power each provide deferred taxes at the enacted statutory tax rate for all temporary differences between the financial statement carrying amounts and the tax bases of existing assets and liabilities irrespective of the treatment for rate-making purposes. Management believes that it is probable that the accumulated tax benefits that previously have been treated as a flow-through item to PSE&G customers will be recovered from or refunded to PSE&G’s customers in the future. These amounts were determined using the enacted federal income tax rate of 35% and state income tax rate of 9%. For additional information, seeSee Note 6.7. Regulatory Assets and Liabilities.
In December 2014,2017, the U.S. government enacted comprehensive tax legislation. The Tax Increase Prevention Act establishes new tax laws that took effect in 2018, including, but not limited to (1) reduction of 2014 was enacted, which extended the 50%U.S. federal corporate tax rate from a maximum of 35% to 21%; (2) elimination of the corporate alternative minimum tax (AMT); (3) a new limitation on deductible interest expense; (4) the repeal of the manufacturing deduction; (5) limitations on the deductibility of certain executive compensation; and (6) limitations on net operating losses (NOLs) generated after December 31, 2017, to 80% of taxable income with an indefinite carryforward period. In addition, certain changes were made to the bonus depreciation rules that impacted 2017. In 2018 and beyond, it is expected that Power will be entitled to 100% expensing and bonus depreciation will no longer apply to PSE&G.
As required under ASC 740, the ending 2017 deferred tax balances were adjusted to reflect the enacted lower tax rate, which resulted in a deferred tax benefit of $755 million, including $610 million related to Power and $149 million related to Energy Holdings (including other impacts related to the new tax legislation, PSEG’s net non-cash provisional earnings benefit was $745 million, including $588 million related to Power and $147 million related to Energy Holdings). There were no further material deferred tax benefits recorded in 2018 as a result of the Tax Act. In addition, PSE&G had excess deferred taxes of approximately $2.1 billion as of December 31, 2017 and recorded a $2.9 billion revenue impact of these excess deferred taxes as Regulatory Liabilities. In 2018, PSE&G recorded an additional $34 million of excess deferred taxes and a $46 million revenue impact of these excess taxes as Regulatory Liabilities associated with the 2017 return to accrual. PSEG, PSE&G and Power completed their accounting for qualified property that was placed into service before January 1, 2015the Tax Act based on the current regulatory guidance available at the end of the Staff Accounting Bulletin No. 118 measurement period, not to extend beyond one year from the enactment date of the Tax Act.
The Tax Act has led to lower customer rates due to lower income tax expense recoveries and the BPU and FERC have approved our proposals to refund excess deferred income tax Regulatory Liabilities. See Note 7. Regulatory Assets and Liabilities for long production property that was placed into service in 2015.additional information.
In December 2015, Congress passedAugust 2018, the IRS issued a Notice of Proposed Rulemaking (Notice) regarding the application of tax depreciation rules as amended by the Tax Act. While the Notice provides some guidance as to the application of the changes made by the Tax Act to the bonus depreciation rules, certain aspects still remain unclear. Further, in November 2018 the IRS issued Proposed Regulations addressing the interest disallowance rules contained in the Tax Act. For non-regulated businesses, these rules set a
NOTES TO CONSOLIDATED FINANCIAL STATEMENTS
cap on the amount of interest that can be deducted in a given year. Any amount that is disallowed can be carried forward indefinitely. For 2018, PSEG and Power expect that a portion of the interest will be disallowed in the current period but realized in future periods. As a result, PSEG and Power recorded a deferred tax asset of $54 million and $8 million, respectively, in 2018. However, certain aspects of the proposed regulations are unclear; therefore, PSEG recorded taxes based on its interpretation of the relevant statute.
Depreciation amounts recorded in 2018 were based on PSEG’s interpretation of the Tax Act and the depreciation rules contained in the Notice. Such amounts are subject to change based on several factors, including but not limited to, the IRS and state taxing authorities issuing final guidance and/or further clarification. Any further guidance or clarification could impact PSEG’s, PSE&G’s and Power’s financial statements.
The Protecting Americans from Tax Hikes Act of 2015 (Tax(2015 Tax Act). Among, among other provisions, the Tax Act includesincluded an extension of the bonus depreciation rules and the 30% ITCinvestment tax credit for qualified property placed into service after 2016. Qualified property that is placed ininto service from January 1, 2015 through December 31, 2017 is eligible for the 50% bonus depreciation. The rate is reduced to 40% and 30% for eligible property placed in service in 2018 and 2019, respectively. In addition, long production property placed in service in 2020 will also qualify for 30% bonus depreciation. The ITC rate has been extended through December 31, 2019 but is reduced to 26% and 22% for projects commenced in 2020 and 2021, respectively. The financial impactprovisions of the extensions of the ITC rate will depend upon future transactions.
These provisions2015 Tax Act have generated significant cash tax benefits for PSEG, PSE&G and Power through tax benefits related to the accelerated depreciation. TheseFor the period beginning September 28, 2017, subject to the transition rules, the Tax Act has modified the bonus depreciation rules of the 2015 Tax Act.
In 2018, Power generated a $14 million consolidated federal income tax benefits would have otherwise been received over an estimated average 20 year period. However, theseNOL and PSE&G generated a $21 million New Jersey Corporate Business tax benefits will have a negative impact on the rate base of several ofNOL. Both PSE&G’s programs.&G and Power expect to fully realize their respective NOLs. There are no other material tax carryforwards in other jurisdictions.
NOTES TO CONSOLIDATED FINANCIAL STATEMENTS
PSEG recorded the following amounts related to its unrecognized tax benefits, which were primarily comprised of amounts recorded for PSE&G, Power and Energy Holdings:
|
| | | | | | | | | | | | | | | | | | |
| | | | | | | | | | | |
| | 2016 | | PSEG | | PSE&G | | Power | | Energy Holdings | �� |
| | | | Millions | |
| | Total Amount of Unrecognized Tax Benefits as of January 1, 2016 | | $ | 386 |
| | $ | 181 |
| | $ | 111 |
| | $ | 93 |
| |
| | Increases as a Result of Positions Taken in a Prior Period | | 12 |
| | 3 |
| | 6 |
| | 2 |
| |
| | Decreases as a Result of Positions Taken in a Prior Period | | (62 | ) | | (23 | ) | | (1 | ) | | (38 | ) | |
| | Increases as a Result of Positions Taken during the Current Period | | 19 |
| | 6 |
| | 12 |
| | — |
| |
| | Decreases as a Result of Positions Taken during the Current Period | | — |
| | — |
| | — |
| | — |
| |
| | Decreases as a Result of Settlements with Taxing Authorities | | — |
| | — |
| | — |
| | — |
| |
| | Decreases due to Lapses of Applicable Statute of Limitations | | (27 | ) | | (27 | ) | | — |
| | — |
| |
| | Total Amount of Unrecognized Tax Benefits as of December 31, 2016 | | $ | 328 |
| | $ | 140 |
| | $ | 128 |
| | $ | 57 |
| |
| | Accumulated Deferred Income Taxes Associated with Unrecognized Tax Benefits | | (200 | ) | | (106 | ) | | (74 | ) | | (20 | ) | |
| | Regulatory Asset—Unrecognized Tax Benefits | | (31 | ) | | (31 | ) | | — |
| | — |
| |
| | Total Amount of Unrecognized Tax Benefits that if Recognized, would Impact the Effective Tax Rate (including Interest and Penalties) | | $ | 97 |
| | $ | 3 |
| | $ | 54 |
| | $ | 37 |
| |
| | | | | | | | | | | |
|
| | | | | | | | | | | | | | | | | | |
| | | | | | | | | | | |
| | 2015 | | PSEG | | PSE&G | | Power | | Energy Holdings | |
| | | | Millions | |
| | Total Amount of Unrecognized Tax Benefits as of January 1, 2015 | | $ | 332 |
| | $ | 165 |
| | $ | 70 |
| | $ | 95 |
| |
| | Increases as a Result of Positions Taken in a Prior Period | | 87 |
| | 55 |
| | 28 |
| | 4 |
| |
| | Decreases as a Result of Positions Taken in a Prior Period | | (50 | ) | | (43 | ) | | (6 | ) | | (1 | ) | |
| | Increases as a Result of Positions Taken during the Current Period | | 28 |
| | 5 |
| | 23 |
| | — |
| |
| | Decreases as a Result of Positions Taken during the Current Period | | (1 | ) | | (1 | ) | | — |
| | — |
| |
| | Decreases as a Result of Settlements with Taxing Authorities | | (10 | ) | | — |
| | (4 | ) | | (5 | ) | |
| | Decreases due to Lapses of Applicable Statute of Limitations | | — |
| | — |
| | — |
| | — |
| |
| | Total Amount of Unrecognized Tax Benefits as of December 31, 2015 | | $ | 386 |
| | $ | 181 |
| | $ | 111 |
| | $ | 93 |
| |
| | Accumulated Deferred Income Taxes Associated with Unrecognized Tax Benefits | | (264 | ) | | (162 | ) | | (68 | ) | | (34 | ) | |
| | Regulatory Asset—Unrecognized Tax Benefits | | (27 | ) | | (27 | ) | | — |
| | — |
| |
| | Total Amount of Unrecognized Tax Benefits that if Recognized, would Impact the Effective Tax Rate (including Interest and Penalties) | | $ | 95 |
| | $ | (8 | ) | | $ | 43 |
| | $ | 59 |
| |
| | | | | | | | | | | |
|
| | | | | | | | | | | | | | | | | | |
| | | | | | | | | | | |
| | 2014 | | PSEG | | PSE&G | | Power | | Energy Holdings | |
| | | | Millions | |
| | Total Amount of Unrecognized Tax Benefits as of January 1, 2014 | | $ | 478 |
| | $ | 208 |
| | $ | 156 |
| | $ | 110 |
| |
| | Increases as a Result of Positions Taken in a Prior Period | | 82 |
| | 65 |
| | 17 |
| | — |
| |
| | Decreases as a Result of Positions Taken in a Prior Period | | (190 | ) | | (92 | ) | | (80 | ) | | (18 | ) | |
| | Increases as a Result of Positions Taken during the Current Period | | 30 |
| | 16 |
| | 9 |
| | 5 |
| |
| | Decreases as a Result of Positions Taken during the Current Period | | (8 | ) | | — |
| | (8 | ) | | — |
| |
| | Decreases as a Result of Settlements with Taxing Authorities | | (60 | ) | | (32 | ) | | (24 | ) | | (2 | ) | |
| | Decreases due to Lapses of Applicable Statute of Limitations | | — |
| | — |
| | — |
| | — |
| |
| | Total Amount of Unrecognized Tax Benefits as of December 31, 2014 | | $ | 332 |
| | $ | 165 |
| | $ | 70 |
| | $ | 95 |
| |
| | Accumulated Deferred Income Taxes Associated with Unrecognized Tax Benefits | | (225 | ) | | (138 | ) | | (52 | ) | | (35 | ) | |
| | Regulatory Asset—Unrecognized Tax Benefits | | (27 | ) | | (27 | ) | | — |
| | — |
| |
| | Total Amount of Unrecognized Tax Benefits that if Recognized, would Impact the Effective Tax Rate (including Interest and Penalties) | | $ | 80 |
| | $ | — |
| | $ | 18 |
| | $ | 60 |
| |
| | | | | | | | | | | |
Table of Contents |
| | | | | | | | | | | | | | | | | | |
| | | | | | | | | | | |
| | 2018 | | PSEG | | PSE&G | | Power | | Energy Holdings | |
| | | | Millions | |
| | Total Amount of Unrecognized Tax Benefits as of January 1, 2018 | | $ | 334 |
| | $ | 135 |
| | $ | 142 |
| | $ | 53 |
| |
| | Increases as a Result of Positions Taken in a Prior Period | | 11 |
| | 4 |
| | 4 |
| | 3 |
| |
| | Decreases as a Result of Positions Taken in a Prior Period | | (70 | ) | | (31 | ) | | (37 | ) | | (2 | ) | |
| | Increases as a Result of Positions Taken during the Current Period | | 52 |
| | 3 |
| | 48 |
| | — |
| |
| | Decreases as a Result of Positions Taken during the Current Period | | (3 | ) | | (3 | ) | | — |
| | — |
| |
| | Decreases as a Result of Settlements with Taxing Authorities | | (6 | ) | | — |
| | (6 | ) | | — |
| |
| | Decreases due to Lapses of Applicable Statute of Limitations | | — |
| | — |
| | — |
| | — |
| |
| | Total Amount of Unrecognized Tax Benefits as of December 31, 2018 | | $ | 318 |
| | $ | 108 |
| | $ | 151 |
| | $ | 54 |
| |
| | Accumulated Deferred Income Taxes Associated with Unrecognized Tax Benefits | | (173 | ) | | (57 | ) | | (104 | ) | | (12 | ) | |
| | Regulatory Asset—Unrecognized Tax Benefits | | (46 | ) | | (46 | ) | | — |
| | — |
| |
| | Total Amount of Unrecognized Tax Benefits that if Recognized, would Impact the Effective Tax Rate (including Interest and Penalties) | | $ | 99 |
| | $ | 5 |
| | $ | 47 |
| | $ | 42 |
| |
| | | | | | | | | | | |
NOTES TO CONSOLIDATED FINANCIAL STATEMENTS
|
| | | | | | | | | | | | | | | | | | |
| | | | | | | | | | | |
| | 2017 | | PSEG | | PSE&G | | Power | | Energy Holdings | |
| | | | Millions | |
| | Total Amount of Unrecognized Tax Benefits as of January 1, 2017 | | $ | 328 |
| | $ | 140 |
| | $ | 128 |
| | $ | 57 |
| |
| | Increases as a Result of Positions Taken in a Prior Period | | 40 |
| | 15 |
| | 18 |
| | 8 |
| |
| | Decreases as a Result of Positions Taken in a Prior Period | | (32 | ) | | (11 | ) | | (10 | ) | | (13 | ) | |
| | Increases as a Result of Positions Taken during the Current Period | | 12 |
| | 5 |
| | 6 |
| | 1 |
| |
| | Decreases as a Result of Positions Taken during the Current Period | | (1 | ) | | (1 | ) | | — |
| | — |
| |
| | Decreases as a Result of Settlements with Taxing Authorities | | — |
| | — |
| | — |
| | — |
| |
| | Decreases due to Lapses of Applicable Statute of Limitations | | (13 | ) | | (13 | ) | | — |
| | — |
| |
| | Total Amount of Unrecognized Tax Benefits as of December 31, 2017 | | $ | 334 |
| | $ | 135 |
| | $ | 142 |
| | $ | 53 |
| |
| | Accumulated Deferred Income Taxes Associated with Unrecognized Tax Benefits | | (157 | ) | | (73 | ) | | (72 | ) | | (12 | ) | |
| | Regulatory Asset—Unrecognized Tax Benefits | | (56 | ) | | (56 | ) | | — |
| | — |
| |
| | Total Amount of Unrecognized Tax Benefits that if Recognized, would Impact the Effective Tax Rate (including Interest and Penalties) | | $ | 121 |
| | $ | 6 |
| | $ | 70 |
| | $ | 41 |
| |
| | | | | | | | | | | |
|
| | | | | | | | | | | | | | | | | | |
| | | | | | | | | | | |
| | 2016 | | PSEG | | PSE&G | | Power | | Energy Holdings | |
| | | | Millions | |
| | Total Amount of Unrecognized Tax Benefits as of January 1, 2016 | | $ | 386 |
| | $ | 181 |
| | $ | 111 |
| | $ | 93 |
| |
| | Increases as a Result of Positions Taken in a Prior Period | | 12 |
| | 3 |
| | 6 |
| | 2 |
| |
| | Decreases as a Result of Positions Taken in a Prior Period | | (62 | ) | | (23 | ) | | (1 | ) | | (38 | ) | |
| | Increases as a Result of Positions Taken during the Current Period | | 19 |
| | 6 |
| | 12 |
| | — |
| |
| | Decreases as a Result of Positions Taken during the Current Period | | — |
| | — |
| | — |
| | — |
| |
| | Decreases as a Result of Settlements with Taxing Authorities | | — |
| | — |
| | — |
| | — |
| |
| | Decreases due to Lapses of Applicable Statute of Limitations | | (27 | ) | | (27 | ) | | — |
| | — |
| |
| | Total Amount of Unrecognized Tax Benefits as of December 31, 2016 | | $ | 328 |
| | $ | 140 |
| | $ | 128 |
| | $ | 57 |
| |
| | Accumulated Deferred Income Taxes Associated with Unrecognized Tax Benefits | | (200 | ) | | (106 | ) | | (74 | ) | | (20 | ) | |
| | Regulatory Asset—Unrecognized Tax Benefits | | (31 | ) | | (31 | ) | | — |
| | — |
| |
| | Total Amount of Unrecognized Tax Benefits that if Recognized, would Impact the Effective Tax Rate (including Interest and Penalties) | | $ | 97 |
| | $ | 3 |
| | $ | 54 |
| | $ | 37 |
| |
| | | | | | | | | | | |
PSEG and its subsidiaries include accrued interest and penalties related to uncertain tax positions required to be recorded, as Income Tax Expense in the Consolidated Statements of Operations. Accumulated interest and penalties that are recorded on the Consolidated Balance Sheets on uncertain tax positions were as follows:
|
| | | | | | | | | | | | | | |
| | | | | | | | | |
| | | | Accumulated Interest and Penalties on Uncertain Tax Positions as of December 31, | |
| | | | 2016 | | 2015 | | 2014 | |
| | | | Millions | |
| | PSE&G | | $ | 22 |
| | $ | 20 |
| | $ | 15 |
| |
| | Power | | 17 |
| | 6 |
| | 9 |
| |
| | Energy Holdings | | 20 |
| | 40 |
| | 45 |
| |
| | Total | | $ | 59 |
| | $ | 66 |
| | $ | 69 |
| |
| | | | | | | | | |
|
| | | | | | | | | | | | | | |
| | | | | | | | | |
| | | | Accumulated Interest and Penalties on Uncertain Tax Positions as of December 31, | |
| | | | 2018 | | 2017 | | 2016 | |
| | | | Millions | |
| | PSE&G | | $ | 12 |
| | $ | 25 |
| | $ | 22 |
| |
| | Power | | 9 |
| | 24 |
| | 17 |
| |
| | Energy Holdings | | 22 |
| | 21 |
| | 20 |
| |
| | Total | | $ | 43 |
| | $ | 70 |
| | $ | 59 |
| |
| | | | | | | | | |
It is reasonably possible that total unrecognized tax benefits will significantly increase or decrease within the next twelve months due to either agreements with various taxing authorities upon audit, the expiration of the Statute of Limitations, or other pending tax matters. These potential increases or decreases are as follows:
NOTES TO CONSOLIDATED FINANCIAL STATEMENTS
|
| | | | | | |
| | | | | |
| | Possible (Increase)/Decrease in Total Unrecognized Tax Benefits | | Over the next 12 Months | |
| | | | Millions | |
| | PSEG | | $ | 14 |
| |
| | PSE&G | | $ | 3 |
| |
| | Power | | $ | 7 |
| |
| | | | | |
|
| | | | | | |
| | | | | |
| | Possible (Increase)/Decrease in Total Unrecognized Tax Benefits | | Over the next 12 Months | |
| | | | Millions | |
| | PSEG | | $ | 112 |
| |
| | PSE&G | | $ | 62 |
| |
| | Power | | $ | 34 |
| |
| | | | | |
A description of income tax years that remain subject to examination by material jurisdictions, where an examination has not already concluded are:
|
| | | | | | | | |
| | | | | | | | |
| | | PSEG | | PSE&G | | Power | |
| United States | | | | | | | |
| Federal | | 2011-2015 | | N/A | | N/A | |
| New Jersey | | 2006-2015 | | 2011-2015 | | N/A | |
| Pennsylvania | | 2006-2015 | | 2007-2015 | | N/A | |
| Connecticut | | 2007-2015 | | N/A | | N/A | |
| Texas | | 2008-2015 | | N/A | | N/A | |
| California | | 2006-2015 | | N/A | | N/A | |
| New York | | 2014-2015 | | N/A | | 2014-2015 | |
| | | | | | | | |
|
| | | | | | | | |
| | | | | | | | | |
| | | | PSEG | | PSE&G | | Power | |
| | United States | | | | | | | |
| | Federal | | 2011-2017 | | N/A | | N/A | |
| | New Jersey | | 2006-2017 | | 2011-2017 | | N/A | |
| | Pennsylvania | | 2015-2017 | | 2015-2017 | | N/A | |
| | Connecticut | | 2016-2017 | | N/A | | N/A | |
| | California | | 2006-2017 | | N/A | | N/A | |
| | New York | | 2017 | | N/A | | 2017 | |
| | | | | | | | | |
New Jersey State Tax Reform
TableIn July 2018, the State of ContentsNew Jersey made changes to its income tax laws, including imposing a temporary surtax on allocated corporate taxable income of 2.5% effective January 1, 2018 and 2019 and 1.5% in 2020 and 2021, as well as requiring corporate taxpayers to file in a combined reporting group as defined under New Jersey law starting in 2019. Both provisions include an exemption for public utilities. At this time, PSEG believes PSE&G meets the definition of a public utility and, therefore, will not be impacted by the temporary surtax or be included in the combined reporting group. In 2018, PSEG’s non-utility business recorded $7 million of surtax as a result of these new provisions. This New Jersey tax legislation did not have a material impact on PSEG’s deferred income tax balance.NOTES TO CONSOLIDATED FINANCIAL STATEMENTS
Note 21.22. Accumulated Other Comprehensive Income (Loss), Net of Tax |
| | | | | | | | | | | | | | | | | | |
| | | | | | | | | | | |
| | PSEG | | Other Comprehensive Income (Loss) | |
| | Accumulated Other Comprehensive Income (Loss) | | Cash Flow Hedges | | Pension and OPEB Plans | | Available-for -Sale Securities | | Total | |
| | | | Millions | |
| | Balance as of December 31, 2013 | | $ | (2 | ) | | $ | (238 | ) | | $ | 145 |
| | $ | (95 | ) | |
| | Other Comprehensive Income before Reclassifications | | 7 |
| | (184 | ) | | 42 |
| | (135 | ) | |
| | Amounts Reclassified from Accumulated Other Comprehensive Income (Loss) | | 5 |
| | 11 |
| | (69 | ) | | (53 | ) | |
| | Net Current Period Other Comprehensive Income (Loss) | | 12 |
| | (173 | ) | | (27 | ) | | (188 | ) | |
| | Balance as of December 31, 2014 | | $ | 10 |
| | $ | (411 | ) | | $ | 118 |
| | $ | (283 | ) | |
| | Other Comprehensive Income before Reclassifications | | 2 |
| | (7 | ) | | (25 | ) | | (30 | ) | |
| | Amounts Reclassified from Accumulated Other Comprehensive Income (Loss) | | (12 | ) | | 32 |
| | (2 | ) | | 18 |
| |
| | Net Current Period Other Comprehensive Income (Loss) | | (10 | ) | | 25 |
| | (27 | ) | | (12 | ) | |
| | Balance as of December 31, 2015 | | $ | — |
| | $ | (386 | ) | | $ | 91 |
| | $ | (295 | ) | |
| | Other Comprehensive Income before Reclassifications | | 2 |
| | (45 | ) | | 40 |
| | (3 | ) | |
| | Amounts Reclassified from Accumulated Other Comprehensive Income (Loss) | | — |
| | 33 |
| | 2 |
| | 35 |
| |
| | Net Current Period Other Comprehensive Income (Loss) | | 2 |
| | (12 | ) | | 42 |
| | 32 |
| |
| | Balance as of December 31, 2016 | | $ | 2 |
| | $ | (398 | ) | | $ | 133 |
| | $ | (263 | ) | |
| | | | | | | | | | | |
| | Power | | Other Comprehensive Income (Loss) | |
| | Accumulated Other Comprehensive Income (Loss) | | Cash Flow Hedges | | Pension and OPEB Plans | | Available-for -Sale Securities | | Total | |
| | | | Millions | |
| | Balance as of December 31, 2013 | | $ | (1 | ) | | $ | (204 | ) | | $ | 142 |
| | $ | (63 | ) | |
| | Other Comprehensive Income before Reclassifications | | 7 |
| | (156 | ) | | 39 |
| | (110 | ) | |
| | Amounts Reclassified from Accumulated Other Comprehensive Income (Loss) | | 5 |
| | 9 |
| | (69 | ) | | (55 | ) | |
| | Net Current Period Other Comprehensive Income (Loss) | | 12 |
| | (147 | ) | | (30 | ) | | (165 | ) | |
| | Balance as of December 31, 2014 | | $ | 11 |
| | $ | (351 | ) | | $ | 112 |
| | $ | (228 | ) | |
| | Other Comprehensive Income before Reclassifications | | 1 |
| | (4 | ) | | (24 | ) | | (27 | ) | |
| | Amounts Reclassified from Accumulated Other Comprehensive Income (Loss) | | (12 | ) | | 28 |
| | (1 | ) | | 15 |
| |
| | Net Current Period Other Comprehensive Income (Loss) | | (11 | ) | | 24 |
| | (25 | ) | | (12 | ) | |
| | Balance as of December 31, 2015 | | $ | — |
| | $ | (327 | ) | | $ | 87 |
| | $ | (240 | ) | |
| | Other Comprehensive Income before Reclassifications | | — |
| | (42 | ) | | 39 |
| | (3 | ) | |
| | Amounts Reclassified from Accumulated Other Comprehensive Income (Loss) | | — |
| | 29 |
| | 3 |
| | 32 |
| |
| | Net Current Period Other Comprehensive Income (Loss) | | — |
| | (13 | ) | | 42 |
| | 29 |
| |
| | Balance as of December 31, 2016 | | $ | — |
| | $ | (340 | ) | | $ | 129 |
| | $ | (211 | ) | |
| | | | | | | | | | | |
|
| | | | | | | | | | | | | | | | | | |
| | | | | | | | | | | |
| | PSEG | | Other Comprehensive Income (Loss) | |
| | Accumulated Other Comprehensive Income (Loss) | | Cash Flow Hedges | | Pension and OPEB Plans | | Available-for -Sale Securities | | Total | |
| | | | Millions | |
| | Balance as of December 31, 2015 | | $ | — |
| | $ | (386 | ) | | $ | 91 |
| | $ | (295 | ) | |
| | Other Comprehensive Income before Reclassifications | | 2 |
| | (45 | ) | | 40 |
| | (3 | ) | |
| | Amounts Reclassified from Accumulated Other Comprehensive Income (Loss) | | — |
| | 33 |
| | 2 |
| | 35 |
| |
| | Net Current Period Other Comprehensive Income (Loss) | | 2 |
| | (12 | ) | | 42 |
| | 32 |
| |
| | Balance as of December 31, 2016 | | $ | 2 |
| | $ | (398 | ) | | $ | 133 |
| | $ | (263 | ) | |
| | Other Comprehensive Income before Reclassifications | | — |
| | (32 | ) | | 109 |
| | 77 |
| |
| | Amounts Reclassified from Accumulated Other Comprehensive Income (Loss) | | (2 | ) | | 24 |
| | (65 | ) | | (43 | ) | |
| | Net Current Period Other Comprehensive Income (Loss) | | (2 | ) | | (8 | ) | | 44 |
| | 34 |
| |
| | Balance as of December 31, 2017 | | $ | — |
| | $ | (406 | ) | | $ | 177 |
| | $ | (229 | ) | |
| | Cumulative Effect Adjustment to Reclassify Unrealized Net Gains on Equity Investments to Retained Earnings | | — |
| | — |
| | (176 | ) | | (176 | ) | |
| | Current Period Other Comprehensive Income (Loss) | | | | | | | | | |
| | Other Comprehensive Income before Reclassifications | | (1 | ) | | 17 |
| | (25 | ) | | (9 | ) | |
| | Amounts Reclassified from Accumulated Other Comprehensive Income (Loss) | | — |
| | 29 |
| | 8 |
| | 37 |
| |
| | Net Current Period Other Comprehensive Income (Loss) | | (1 | ) | | 46 |
| | (17 | ) | | 28 |
| |
| | Net Change in Accumulated Other Comprehensive Income (Loss) | | (1 | ) | | 46 |
| | (193 | ) | | (148 | ) | |
| | Balance as of December 31, 2018 | | $ | (1 | ) | | $ | (360 | ) | | $ | (16 | ) | | $ | (377 | ) | |
| | | | | | | | | | | |
| | Power | | Other Comprehensive Income (Loss) | |
| | Accumulated Other Comprehensive Income (Loss) | | Cash Flow Hedges | | Pension and OPEB Plans | | Available-for -Sale Securities | | Total | |
| | | | Millions | |
| | Balance as of December 31, 2015 | | $ | — |
| | $ | (327 | ) | | $ | 87 |
| | $ | (240 | ) | |
| | Other Comprehensive Income before Reclassifications | | — |
| | (42 | ) | | 39 |
| | (3 | ) | |
| | Amounts Reclassified from Accumulated Other Comprehensive Income (Loss) | | — |
| | 29 |
| | 3 |
| | 32 |
| |
| | Net Current Period Other Comprehensive Income (Loss) | | — |
| | (13 | ) | | 42 |
| | 29 |
| |
| | Balance as of December 31, 2016 | | $ | — |
| | $ | (340 | ) | | $ | 129 |
| | $ | (211 | ) | |
| | Other Comprehensive Income before Reclassifications | | — |
| | (28 | ) | | 106 |
| | 78 |
| |
| | Amounts Reclassified from Accumulated Other Comprehensive Income (Loss) | | — |
| | 21 |
| | (60 | ) | | (39 | ) | |
| | Net Current Period Other Comprehensive Income (Loss) | | — |
| | (7 | ) | | 46 |
| | 39 |
| |
| | Balance as of December 31, 2017 | | $ | — |
| | $ | (347 | ) | | $ | 175 |
| | $ | (172 | ) | |
| | Cumulative Effect Adjustment to Reclassify Unrealized Net Gains on Equity Investments to Retained Earnings | | — |
| | — |
| | (175 | ) | | (175 | ) | |
| | Current Period Other Comprehensive Income (Loss) | | | | | | | | | |
| | Other Comprehensive Income before Reclassifications | | — |
| | 16 |
| | (19 | ) | | (3 | ) | |
| | Amounts Reclassified from Accumulated Other Comprehensive Income (Loss) | | — |
| | 25 |
| | 6 |
| | 31 |
| |
| | Net Current Period Other Comprehensive Income (Loss) | | — |
| | 41 |
| | (13 | ) | | 28 |
| |
| | Net Change in Accumulated Other Comprehensive Income (Loss) | | — |
| | 41 |
| | (188 | ) | | (147 | ) | |
| | Balance as of December 31, 2018 | | $ | — |
| | $ | (306 | ) | | $ | (13 | ) | | $ | (319 | ) | |
| | | | | | | | | | | |
NOTES TO CONSOLIDATED FINANCIAL STATEMENTS
|
| | | | | | | | | | | | | | | | |
| | | | | | | | | | | |
| | | | | | | | | | | |
| | PSEG | | | | Amounts Reclassified from Accumulated Other Comprehensive Income (Loss) to Income Statement | |
| | | | | | Year Ended December 31, 2016 | |
| | Description of Amounts Reclassified from Accumulated Other Comprehensive Income (Loss) | | Location of Pre-Tax Amount In Statement of Operations | | Pre-Tax Amount | | Tax (Expense) Benefit | | After-Tax Amount | |
| | | | | | Millions | |
| | Pension and OPEB Plans | | | | | | | | | |
| | Amortization of Prior Service (Cost) Credit | | Non-Operating Pension and OPEB Credits (Costs) | | $ | 12 |
| | $ | (5 | ) | | $ | 7 |
| |
| | Amortization of Actuarial Loss | | Non-Operating Pension and OPEB Credits (Costs) | | (68 | ) | | 28 |
| | (40 | ) | |
| | Total Pension and OPEB Plans | | | | (56 | ) | | 23 |
| | (33 | ) | |
| | Available-for-Sale Securities | | | | | | | | | |
| | Realized Gains (Losses) and Other-Than-Temporary Impairments (OTTI) | | Net Gains (Losses) on Trust Investments | | (6 | ) | | 4 |
| | (2 | ) | |
| | Total Available-for-Sale Securities | | | | (6 | ) | | 4 |
| | (2 | ) | |
| | Total | | | | $ | (62 | ) | | $ | 27 |
| | $ | (35 | ) | |
| | | | | | | | | | | |
| | Power | | | | Amounts Reclassified from Accumulated Other Comprehensive Income (Loss) to Income Statement | |
| | | | | | Year Ended December 31, 2016 | |
| | Description of Amounts Reclassified from Accumulated Other Comprehensive Income (Loss) | | Location of Pre-Tax Amount In Statement of Operations | | Pre-Tax Amount | | Tax (Expense) Benefit | | After-Tax Amount | |
| | | | | | Millions | |
| | Pension and OPEB Plans | | | | | | | | | |
| | Amortization of Prior Service (Cost) Credit | | Non-Operating Pension and OPEB Credits (Costs) | | $ | 11 |
| | $ | (5 | ) | | $ | 6 |
| |
| | Amortization of Actuarial Loss | | Non-Operating Pension and OPEB Credits (Costs) | | (59 | ) | | 24 |
| | (35 | ) | |
| | Total Pension and OPEB Plans | | | | (48 | ) | | 19 |
| | (29 | ) | |
| | Available-for-Sale Securities | | | | | | | | | |
| | Realized Gains (Losses) and OTTI | | Net Gains (Losses) on Trust Investments | | (6 | ) | | 3 |
| | (3 | ) | |
| | Total Available-for-Sale Securities | | | | (6 | ) | | 3 |
| | (3 | ) | |
| | Total | | | | $ | (54 | ) | | $ | 22 |
| | $ | (32 | ) | |
| | | | | | | | | | | |
NOTES TO CONSOLIDATED FINANCIAL STATEMENTS
|
| | | | | | | | | | | | | | | | |
| | | | | | | | | | | |
| | | | | | | | | | | |
| | PSEG | | | | Amounts Reclassified from Accumulated Other Comprehensive Income (Loss) to Income Statement | |
| | | | | | Year Ended December 31, 2014 | |
| | Description of Amounts Reclassified from Accumulated Other Comprehensive Income (Loss) | | Location of Pre-Tax Amount In Statement of Operations | | Pre-Tax Amount | | Tax (Expense) Benefit | | After-Tax Amount | |
| | | | | | Millions | |
| | Cash Flow Hedges | | | | | | | | | |
| | Energy-Related Contracts | | Operating Revenues | | $ | (9 | ) | | $ | 4 |
| | $ | (5 | ) | |
| | Total Cash Flow Hedges | | | | (9 | ) | | 4 |
| | (5 | ) | |
| | Pension and OPEB Plans | | | | | | | | | |
| | Amortization of Prior Service (Cost) Credit | | O&M Expense | | 10 |
| | (4 | ) | | 6 |
| |
| | Amortization of Actuarial Loss | | O&M Expense | | (28 | ) | | 11 |
| | (17 | ) | |
| | Total Pension and OPEB Plans | | | | (18 | ) | | 7 |
| | (11 | ) | |
| | Available-for-Sale Securities | | | | | | | | | |
| | Realized Gains | | Other Income | | 181 |
| | (89 | ) | | 92 |
| |
| | Realized Losses | | Other Deductions | | (26 | ) | | 13 |
| | (13 | ) | |
| | Other-Than-Temporary Impairments (OTTI) | | OTTI | | (20 | ) | | 10 |
| | (10 | ) | |
| | Total Available-for-Sale Securities | | | | 135 |
| | (66 | ) | | 69 |
| |
| | Total | | | | $ | 108 |
| | $ | (55 | ) | | $ | 53 |
| |
| | | | | | | | | | | |
| | Power | | | | Amounts Reclassified from Accumulated Other Comprehensive Income (Loss) to Income Statement | |
| | | | | | Year Ended December 31, 2014 | |
| | Description of Amounts Reclassified from Accumulated Other Comprehensive Income (Loss) | | Location of Pre-Tax Amount In Statement of Operations | | Pre-Tax Amount | | Tax (Expense) Benefit | | After-Tax Amount | |
| | | | | | Millions | |
| | Cash Flow Hedges | | | | | | | | | |
| | Energy-Related Contracts | | Operating Revenues | | $ | (9 | ) | | $ | 4 |
| | $ | (5 | ) | |
| | Total Cash Flow Hedges | | | | (9 | ) | | 4 |
| | (5 | ) | |
| | Pension and OPEB Plans | | | | | | | | | |
| | Amortization of Prior Service (Cost) Credit | | O&M Expense | | 9 |
| | (4 | ) | | 5 |
| |
| | Amortization of Actuarial Loss | | O&M Expense | | (25 | ) | | 11 |
| | (14 | ) | |
| | Total Pension and OPEB Plans | | | | (16 | ) | | 7 |
| | (9 | ) | |
| | Available-for-Sale Securities | | | | | | | | | |
| | Realized Gains | | Other Income | | 178 |
| | (87 | ) | | 91 |
| |
| | Realized Losses | | Other Deductions | | (24 | ) | | 12 |
| | (12 | ) | |
| | OTTI | | OTTI | | (20 | ) | | 10 |
| | (10 | ) | |
| | Total Available-for-Sale Securities | | | | 134 |
| | (65 | ) | | 69 |
| |
| | Total | | | | $ | 109 |
| | $ | (54 | ) | | $ | 55 |
| |
| | | | | | | | | | | |
Table of Contents |
| | | | | | | | | | | | | | | | |
| | | | | | | | | | | |
| | | | | | | | | | | |
| | PSEG | | | | Amounts Reclassified from Accumulated Other Comprehensive Income (Loss) to Income Statement | |
| | | | | | Year Ended December 31, 2017 | |
| | Description of Amounts Reclassified from Accumulated Other Comprehensive Income (Loss) | | Location of Pre-Tax Amount In Statement of Operations | | Pre-Tax Amount | | Tax (Expense) Benefit | | After-Tax Amount | |
| | | | | | Millions | |
| | Cash Flow Hedges | | | | | | | | | |
| | Interest Rate Swaps | | Interest Expense | | $ | 3 |
| | $ | (1 | ) | | $ | 2 |
| |
| | Total Cash Flow Hedges | | | | 3 |
| | (1 | ) | | 2 |
| |
| | Pension and OPEB Plans | | | | | | | | | |
| | Amortization of Prior Service (Cost) Credit | | Non-Operating Pension and OPEB Credits (Costs) | | 10 |
| | (4 | ) | | 6 |
| |
| | Amortization of Actuarial Loss | | Non-Operating Pension and OPEB Credits (Costs) | | (51 | ) | | 21 |
| | (30 | ) | |
| | Total Pension and OPEB Plans | | | | (41 | ) | | 17 |
| | (24 | ) | |
| | Available-for-Sale Securities | | | | | | | | | |
| | Realized Gains (Losses) and OTTI | | Net Gains (Losses) on Trust Investments | | 134 |
| | (69 | ) | | 65 |
| |
| | Total Available-for-Sale Securities | | | | 134 |
| | (69 | ) | | 65 |
| |
| | Total | | | | $ | 96 |
| | $ | (53 | ) | | $ | 43 |
| |
| | | | | | | | | | | |
| | Power | | | | Amounts Reclassified from Accumulated Other Comprehensive Income (Loss) to Income Statement | |
| | | | | | Year Ended December 31, 2017 | |
| | Description of Amounts Reclassified from Accumulated Other Comprehensive Income (Loss) | | Location of Pre-Tax Amount In Statement of Operations | | Pre-Tax Amount | | Tax (Expense) Benefit | | After-Tax Amount | |
| | | | | | Millions | |
| | Pension and OPEB Plans | | | | | | | | | |
| | Amortization of Prior Service (Cost) Credit | | Non-Operating Pension and OPEB Credits (Costs) | | $ | 9 |
| | $ | (4 | ) | | $ | 5 |
| |
| | Amortization of Actuarial Loss | | Non-Operating Pension and OPEB Credits (Costs) | | (44 | ) | | 18 |
| | (26 | ) | |
| | Total Pension and OPEB Plans | | | | (35 | ) | | 14 |
| | (21 | ) | |
| | Available-for-Sale Securities | | | | | | | | | |
| | Realized Gains (Losses) and OTTI | | Net Gains (Losses) on Trust Investments | | 125 |
| | (65 | ) | | 60 |
| |
| | Total Available-for-Sale Securities | | | | 125 |
| | (65 | ) | | 60 |
| |
| | Total | | | | $ | 90 |
| | $ | (51 | ) | | $ | 39 |
| |
| | | | | | | | | | | |
NOTES TO CONSOLIDATED FINANCIAL STATEMENTS
|
| | | | | | | | | | | | | | | | |
| | | | | | | | | | | |
| | | | | | | | | | | |
| | PSEG | | | | Amounts Reclassified from Accumulated Other Comprehensive Income (Loss) to Income Statement | |
| | | | | | Year Ended December 31, 2015 | |
| | Description of Amounts Reclassified from Accumulated Other Comprehensive Income (Loss) | | Location of Pre-Tax Amount In Statement of Operations | | Pre-Tax Amount | | Tax (Expense) Benefit | | After-Tax Amount | |
| | | | | | Millions | |
| | Cash Flow Hedges | | | | | | | | | |
| | Energy-Related Contracts | | Operating Revenues | | $ | 20 |
| | $ | (8 | ) | | $ | 12 |
| |
| | Total Cash Flow Hedges | | | | 20 |
| | (8 | ) | | 12 |
| |
| | Pension and OPEB Plans | | | | | | | | | |
| | Amortization of Prior Service (Cost) Credit | | O&M Expense | | 12 |
| | (3 | ) | | 9 |
| |
| | Amortization of Actuarial Loss | | O&M Expense | | (68 | ) | | 27 |
| | (41 | ) | |
| | Total Pension and OPEB Plans | | | | (56 | ) | | 24 |
| | (32 | ) | |
| | Available-for-Sale Securities | | | | | | | | | |
| | Realized Gains | | Other Income | | 100 |
| | (52 | ) | | 48 |
| |
| | Realized Losses | | Other Deductions | | (39 | ) | | 20 |
| | (19 | ) | |
| | OTTI | | OTTI | | (53 | ) | | 26 |
| | (27 | ) | |
| | Total Available-for-Sale Securities | | | | 8 |
| | (6 | ) | | 2 |
| |
| | Total | | | | $ | (28 | ) | | $ | 10 |
| | $ | (18 | ) | |
| | | | | | | | | | | |
| | Power | | | | Amounts Reclassified from Accumulated Other Comprehensive Income (Loss) to Income Statement | |
| | | | | | Year Ended December 31, 2015 | |
| | Description of Amounts Reclassified from Accumulated Other Comprehensive Income (Loss) | | Location of Pre-Tax Amount In Statement of Operations | | Pre-Tax Amount | | Tax (Expense) Benefit | | After-Tax Amount | |
| | | | | | Millions | |
| | Cash Flow Hedges | | | | | | | | | |
| | Energy-Related Contracts | | Operating Revenues | | $ | 20 |
| | $ | (8 | ) | | $ | 12 |
| |
| | Total Cash Flow Hedges | | | | 20 |
| | (8 | ) | | 12 |
| |
| | Pension and OPEB Plans | | | | | | | | | |
| | Amortization of Prior Service (Cost) Credit | | O&M Expense | | 11 |
| | (3 | ) | | 8 |
| |
| | Amortization of Actuarial Loss | | O&M Expense | | (60 | ) | | 24 |
| | (36 | ) | |
| | Total Pension and OPEB Plans | | | | (49 | ) | | 21 |
| | (28 | ) | |
| | Available-for-Sale Securities | | | | | | | | | |
| | Realized Gains | | Other Income | | 98 |
| | (51 | ) | | 47 |
| |
| | Realized Losses | | Other Deductions | | (38 | ) | | 19 |
| | (19 | ) | |
| | OTTI | | OTTI | | (53 | ) | | 26 |
| | (27 | ) | |
| | Total Available-for-Sale Securities | | | | 7 |
| | (6 | ) | | 1 |
| |
| | Total | | | | $ | (22 | ) | | $ | 7 |
| | $ | (15 | ) | |
| | | | | | | | | | | |
NOTES TO CONSOLIDATED FINANCIAL STATEMENTS
|
| | | | | | | | | | | | | | | | |
| | | | | | | | | | | |
| | | | | | | | | | | |
| | PSEG | | | | Amounts Reclassified from Accumulated Other Comprehensive Income (Loss) to Income Statement | |
| | | | | | Year Ended December 31, 2018 | |
| | Description of Amounts Reclassified from Accumulated Other Comprehensive Income (Loss) | | Location of Pre-Tax Amount In Statement of Operations | | Pre-Tax Amount | | Tax (Expense) Benefit | | After-Tax Amount | |
| | | | | | Millions | |
| | Pension and OPEB Plans | | | | | | | | | |
| | Amortization of Prior Service (Cost) Credit | | Non-Operating Pension and OPEB Credits (Costs) | | $ | 6 |
| | $ | (2 | ) | | $ | 4 |
| |
| | Amortization of Actuarial Loss | | Non-Operating Pension and OPEB Credits (Costs) | | (47 | ) | | 14 |
| | (33 | ) | |
| | Total Pension and OPEB Plans | | | | (41 | ) | | 12 |
| | (29 | ) | |
| | Available-for-Sale Securities | | | | | | | | | |
| | Realized Gains (Losses) and OTTI | | Net Gains (Losses) on Trust Investments | | (13 | ) | | 5 |
| | (8 | ) | |
| | Total Available-for-Sale Securities | | | | (13 | ) | | 5 |
| | (8 | ) | |
| | Total | | | | $ | (54 | ) | | $ | 17 |
| | $ | (37 | ) | |
| | | | | | | | | | | |
| | Power | | | | Amounts Reclassified from Accumulated Other Comprehensive Income (Loss) to Income Statement | |
| | | | | | Year Ended December 31, 2018 | |
| | Description of Amounts Reclassified from Accumulated Other Comprehensive Income (Loss) | | Location of Pre-Tax Amount In Statement of Operations | | Pre-Tax Amount | | Tax (Expense) Benefit | | After-Tax Amount | |
| | | | | | Millions | |
| | Pension and OPEB Plans | | | | | | | | | |
| | Amortization of Prior Service (Cost) Credit | | Non-Operating Pension and OPEB Credits (Costs) | | $ | 5 |
| | $ | (1 | ) | | $ | 4 |
| |
| | Amortization of Actuarial Loss | | Non-Operating Pension and OPEB Credits (Costs) | | (40 | ) | | 11 |
| | (29 | ) | |
| | Total Pension and OPEB Plans | | | | (35 | ) | | 10 |
| | (25 | ) | |
| | Available-for-Sale Securities | | | | | | | | | |
| | Realized Gains (Losses) and OTTI | | Net Gains (Losses) on Trust Investments | | (11 | ) | | 5 |
| | (6 | ) | |
| | Total Available-for-Sale Securities | | | | (11 | ) | | 5 |
| | (6 | ) | |
| | Total | | | | $ | (46 | ) | | $ | 15 |
| | $ | (31 | ) | |
| | | | | | | | | | | |
|
| | | | | | | | | | | | | | | | |
| | | | | | | | | | | |
| | | | | | | | | | | |
| | PSEG | | | | Amounts Reclassified from Accumulated Other Comprehensive Income (Loss) to Income Statement | |
| | | | | | Year Ended December 31, 2016 | |
| | Description of Amounts Reclassified from Accumulated Other Comprehensive Income (Loss) | | Location of Pre-Tax Amount In Statement of Operations | | Pre-Tax Amount | | Tax (Expense) Benefit | | After-Tax Amount | |
| | | | | | Millions | |
| | Pension and OPEB Plans | | | | | | | | | |
| | Amortization of Prior Service (Cost) Credit | | O&M Expense | | $ | 12 |
| | $ | (5 | ) | | $ | 7 |
| |
| | Amortization of Actuarial Loss | | O&M Expense | | (68 | ) | | 28 |
| | (40 | ) | |
| | Total Pension and OPEB Plans | | | | (56 | ) | | 23 |
| | (33 | ) | |
| | Available-for-Sale Securities | | | | | | | | | |
| | Realized Gains | | Other Income | | 59 |
| | (29 | ) | | 30 |
| |
| | Realized Losses | | Other Deductions | | (37 | ) | | 19 |
| | (18 | ) | |
| | OTTI | | OTTI | | (28 | ) | | 14 |
| | (14 | ) | |
| | Total Available-for-Sale Securities | | | | (6 | ) | | 4 |
| | (2 | ) | |
| | Total | | | | $ | (62 | ) | | $ | 27 |
| | $ | (35 | ) | |
| | | | | | | | | | | |
| | Power | | | | Amounts Reclassified from Accumulated Other Comprehensive Income (Loss) to Income Statement | |
| | | | | | Year Ended December 31, 2016 | |
| | Description of Amounts Reclassified from Accumulated Other Comprehensive Income (Loss) | | Location of Pre-Tax Amount In Statement of Operations | | Pre-Tax Amount | | Tax (Expense) Benefit | | After-Tax Amount | |
| | | | | | Millions | |
| | Pension and OPEB Plans | | | | | | | | | |
| | Amortization of Prior Service (Cost) Credit | | O&M Expense | | $ | 11 |
| | $ | (5 | ) | | $ | 6 |
| |
| | Amortization of Actuarial Loss | | O&M Expense | | (59 | ) | | 24 |
| | (35 | ) | |
| | Total Pension and OPEB Plans | | | | (48 | ) | | 19 |
| | (29 | ) | |
| | Available-for-Sale Securities | | | | | | | | | |
| | Realized Gains | | Other Income | | 55 |
| | (28 | ) | | 27 |
| |
| | Realized Losses | | Other Deductions | | (33 | ) | | 17 |
| | (16 | ) | |
| | OTTI | | OTTI | | (28 | ) | | 14 |
| | (14 | ) | |
| | Total Available-for-Sale Securities | | | | (6 | ) | | 3 |
| | (3 | ) | |
| | Total | | | | $ | (54 | ) | | $ | 22 |
| | $ | (32 | ) | |
| | | | | | | | | | | |
NOTES TO CONSOLIDATED FINANCIAL STATEMENTS
Note 22.23. Earnings Per Share (EPS) and Dividends
EPS
Diluted EPS is calculated by dividing Net Income by the weighted average number of shares of common stock outstanding, including shares issuable upon exercise of stock options outstanding or vesting of restricted stock awards granted under PSEG’s stock compensation plans and upon payment of performance units or restricted stock units. For additional information on PSEG’s stock compensation plans see Note 19. Stock Based Compensation. The following table shows the effect of these stock options, performance units and restricted stock units on the weighted average number of shares outstanding used in calculating diluted EPS:
|
| | | | | | | | | | | | | | | | | | | | | | | | |
| | | | | | | | | | | | | | | |
| | | | Years Ended December 31, | |
| | | | 2016 | | 2015 | | 2014 | |
| | | | Basic | | Diluted | | Basic | | Diluted | | Basic | | Diluted | |
| | EPS Numerator: | | | | | | | | | | | | | |
| | (Millions) | | | | | | | | | | | | | |
| | Net Income | | $ | 887 |
| | $ | 887 |
| | 1,679 |
| | 1,679 |
| | $ | 1,518 |
| | $ | 1,518 |
| |
| | EPS Denominator: | | | | | | | | | | | | | |
| | (Millions) | | | | | | | | | | | | | |
| | Weighted Average Common Shares Outstanding | | 505 |
| | 505 |
| | 505 |
| | 505 |
| | 506 |
| | 506 |
| |
| | Effect of Stock Based Compensation Awards | | — |
| | 3 |
| | — |
| | 3 |
| | — |
| | 2 |
| |
| | Total Shares | | 505 |
| | 508 |
| | 505 |
| | 508 |
| | 506 |
| | 508 |
| |
| | EPS: | | | | | | | | | | | | | |
| | Net Income | | $ | 1.76 |
| | $ | 1.75 |
| | 3.32 |
| | 3.30 |
| | $ | 3.00 |
| | $ | 2.99 |
| |
| | | | | | | | | | | | | | | |
|
| | | | | | | | | | | | | | | | | | | | | | | | | | |
| | | | | | | | | | | | | | | |
| | | | Years Ended December 31, | |
| | | | 2018 | | 2017 | | 2016 | |
| | | | Basic | | Diluted | | Basic | | Diluted | | Basic | | Diluted | |
| | EPS Numerator: | | | | | | | | | | | | | |
| | (Millions) | | | | | | | | | | | | | |
| | Net Income | | $ | 1,438 |
| | $ | 1,438 |
| | $ | 1,574 |
| | $ | 1,574 |
| | $ | 887 |
| | $ | 887 |
| |
| | EPS Denominator: | | | | | | | | | | | | | |
| | (Millions) | | | | | | | | | | | | | |
| | Weighted Average Common Shares Outstanding | | 504 |
| | 504 |
| | 505 |
| | 505 |
| | 505 |
| | 505 |
| |
| | Effect of Stock Based Compensation Awards | | — |
| | 3 |
| | — |
| | 2 |
| | — |
| | 3 |
| |
| | Total Shares | | 504 |
| | 507 |
| | 505 |
| | 507 |
| | 505 |
| | 508 |
| |
| | EPS: | | | | | | | | | | | | | |
| | Net Income | | $ | 2.85 |
| | $ | 2.83 |
| | $ | 3.12 |
| | $ | 3.10 |
| | $ | 1.76 |
| | $ | 1.75 |
| |
| | | | | | | | | | | | | | | |
There were approximately 0.4 million, 0.5 million and 0.4 million stock options excluded from the weighted average common shares used for diluted EPS due to their antidilutive effect for the yearsyear ended December 31, 2016, 2015 and 2014, respectively. No other stock options had an antidilutive effect for2016.
For additional information on all the years ended December 31, 2016, 2015 or 2014.types of long-term incentive awards, see Note 19. Stock Based Compensation.
Dividends
|
| | | | | | | | | | | | | | |
| | | | | | | | | |
| | | | Years Ended December 31, | |
| | Dividend Payments on Common Stock | | 2016 | | 2015 | | 2014 | |
| | Per Share | | $ | 1.64 |
| | $ | 1.56 |
| | $ | 1.48 |
| |
| | in Millions | | $ | 830 |
| | $ | 789 |
| | $ | 748 |
| |
| | | | | | | | | |
|
| | | | | | | | | | | | | | |
| | | | | | | | | |
| | | | Years Ended December 31, | |
| | Dividend Payments on Common Stock | | 2018 | | 2017 | | 2016 | |
| | Per Share | | $ | 1.80 |
| | $ | 1.72 |
| | $ | 1.64 |
| |
| | in Millions | | $ | 910 |
| | $ | 870 |
| | $ | 830 |
| |
| | | | | | | | | |
On February 21, 2017,19, 2019, PSEG’s Board of Directors approved a $0.43$0.47 per share common stock dividend for the first quarter of 2017.2019.
NOTES TO CONSOLIDATED FINANCIAL STATEMENTS
Note 23.24. Financial Information by Business Segment
Basis of Organization
PSEG’s, PSE&G’s and Power’s operating segments were determined by management in accordance with GAAP. These segments were determined based on how management measures performance based on segment Net Income, as illustrated in the following table, and how resources are allocated to each business. PSEG’s reportable segments are PSE&G and Power. PSE&G and Power each represent a single reportable segment and therefore no separate segment information is provided for these Registrants.
PSE&G
PSE&G earns revenues from its tariffs, under which it provides electric transmission and electric and gas distribution services to residential, commercial and industrial customers in New Jersey. The rates charged for electric transmission are regulated by FERC while the rates charged for electric and gas distribution are regulated by the BPU. Revenues are also earned from several
NOTES TO CONSOLIDATED FINANCIAL STATEMENTS
other activities such as solar investments, sundry sales, the appliance service business, wholesale transmission services and other miscellaneous services.
Power
Power earns revenues by selling energy, capacity and ancillary services on a wholesale basis under contract to power marketers and to load servingload-serving entities and by bidding energy, capacity and ancillary services into the markets for these products. A significant portion of Power’s revenue is obtained from the various ISOs in which Power operates. The ISOs act similarly to a clearing house for all of its members in that all revenues paid out are collected from market participants based on their consumption of energy and energy-related products. Power also enters into bilateral contracts for energy, capacity, FTRs, gas, emission allowances and other energy-related contracts to optimize the value of its portfolio of generating assets and its electric and gas supply obligations.
Other
This category includes amounts applicable to Energy Holdings and PSEG LI, which are below the quantitative threshold for separate disclosure as reportable segments. Other also includes amounts applicable to PSEG (parent corporation) and Services.
|
| | | | | | | | | | | | | | | | | | | | | | |
| | | | | | | | | | | | | |
| | | | PSE&G | | Power | | Other (A) | | Eliminations (B) | | Consolidated Total | |
| | | | Millions | |
| | Year Ended December 31, 2016 | | | | | | | | | | | |
| | Operating Revenues | | $ | 6,221 |
| | $ | 4,023 |
| | $ | 370 |
| | $ | (1,553 | ) | | $ | 9,061 |
| |
| | Depreciation and Amortization | | 565 |
| | 881 |
| | 30 |
| | — |
| | 1,476 |
| |
| | Operating Income (Loss) | | 1,614 |
| | 13 |
| | (51 | ) | | — |
| | 1,576 |
| |
| | Income from Equity Method Investments | | — |
| | 11 |
| | — |
| | — |
| | 11 |
| |
| | Interest Income | | 24 |
| | 4 |
| | 4 |
| | (2 | ) | | 30 |
| |
| | Interest Expense | | 289 |
| | 84 |
| | 14 |
| | (2 | ) | | 385 |
| |
| | Income (Loss) before Income Taxes | | 1,404 |
| | (43 | ) | | (63 | ) | | — |
| | 1,298 |
| |
| | Income Tax Expense (Benefit) | | 515 |
| | (61 | ) | | (43 | ) | | — |
| | 411 |
| |
| | Net Income (Loss) | | 889 |
| | 18 |
| | (20 | ) | | — |
| | 887 |
| |
| | Gross Additions to Long-Lived Assets | | $ | 2,816 |
| | $ | 1,343 |
| | $ | 40 |
| | $ | — |
| | $ | 4,199 |
| |
| | As of December 31, 2016 | | | | | | | | | | | |
| | Total Assets | | $ | 26,288 |
| | $ | 12,193 |
| | $ | 2,373 |
| | $ | (784 | ) | | $ | 40,070 |
| |
| | Investments in Equity Method Subsidiaries | | $ | — |
| | $ | 102 |
| | $ | — |
| | $ | — |
| | $ | 102 |
| |
| | | | | | | | | | | | | |
|
| | | | | | | | | | | | | | | | | | | | | | |
| | | | | | | | | | | | | |
| | | | PSE&G | | Power | | Other (A) | | Eliminations (B) | | Consolidated Total | |
| | | | Millions | |
| | Year Ended December 31, 2015 | | | | | | | | | | | |
| | Operating Revenues | | $ | 6,636 |
| | $ | 4,928 |
| | $ | 462 |
| | $ | (1,611 | ) | | $ | 10,415 |
| |
| | Depreciation and Amortization | | 892 |
| | 291 |
| | 31 |
| | — |
| | 1,214 |
| |
| | Operating Income (Loss) | | 1,462 |
| | 1,430 |
| | 70 |
| | — |
| | 2,962 |
| |
| | Income from Equity Method Investments | | — |
| | 14 |
| | (2 | ) | | — |
| | 12 |
| |
| | Interest Income | | 25 |
| | 2 |
| | 33 |
| | (29 | ) | | 31 |
| |
| | Interest Expense | | 280 |
| | 121 |
| | 21 |
| | (29 | ) | | 393 |
| |
| | Income (Loss) before Income Taxes | | 1,257 |
| | 1,367 |
| | 56 |
| | — |
| | 2,680 |
| |
| | Income Tax Expense (Benefit) | | 470 |
| | 511 |
| | 20 |
| | — |
| | 1,001 |
| |
| | Net Income (Loss) | | 787 |
| | 856 |
| | 36 |
| | — |
| | 1,679 |
| |
| | Gross Additions to Long-Lived Assets | | $ | 2,692 |
| | $ | 1,117 |
| | $ | 54 |
| | $ | — |
| | $ | 3,863 |
| |
| | As of December 31, 2015 | | | | | | | | | | | |
| | Total Assets | | $ | 23,677 |
| | $ | 12,250 |
| | $ | 2,810 |
| | $ | (1,202 | ) | | $ | 37,535 |
| |
| | Investments in Equity Method Subsidiaries | | $ | — |
| | $ | 119 |
| | $ | — |
| | $ | — |
| | $ | 119 |
| |
| | | | | | | | | | | | | |
Table of Contents |
| | | | | | | | | | | | | | | | | | | | | | |
| | | | | | | | | | | | | |
| | | | PSE&G | | Power | | Other (A) | | Eliminations (B) | | Consolidated Total | |
| | | | Millions | |
| | Year Ended December 31, 2018 | | | | | | | | | | | |
| | Operating Revenues | | $ | 6,471 |
| | $ | 4,146 |
| | $ | 571 |
| | $ | (1,492 | ) | | $ | 9,696 |
| |
| | Depreciation and Amortization | | 770 |
| | 354 |
| | 34 |
| | — |
| | 1,158 |
| |
| | Operating Income (Loss) | | 1,606 |
| | 596 |
| | 96 |
| | — |
| | 2,298 |
| |
| | Income from Equity Method Investments | | — |
| | 15 |
| | — |
| | — |
| | 15 |
| |
| | Interest Income | | 21 |
| | 5 |
| | 9 |
| | (6 | ) | | 29 |
| |
| | Interest Expense | | 333 |
| | 76 |
| | 73 |
| | (6 | ) | | 476 |
| |
| | Income (Loss) before Income Taxes | | 1,411 |
| | 431 |
| | 13 |
| | — |
| | 1,855 |
| |
| | Income Tax Expense (Benefit) | | 344 |
| | 66 |
| | 7 |
| | — |
| | 417 |
| |
| | Net Income (Loss) | | $ | 1,067 |
| | $ | 365 |
| | $ | 6 |
| | $ | — |
| | $ | 1,438 |
| |
| | Gross Additions to Long-Lived Assets | | $ | 2,896 |
| | $ | 996 |
| | $ | 20 |
| | $ | — |
| | $ | 3,912 |
| |
| | As of December 31, 2018 | | | | | | | | | | | |
| | Total Assets | | $ | 31,109 |
| | $ | 12,594 |
| | $ | 2,604 |
| | $ | (981 | ) | | $ | 45,326 |
| |
| | Investments in Equity Method Subsidiaries | | $ | — |
| | $ | 86 |
| | $ | — |
| | $ | — |
| | $ | 86 |
| |
| | | | | | | | | | | | | |
NOTES TO CONSOLIDATED FINANCIAL STATEMENTS
|
| | | | | | | | | | | | | | | | | | | | | | |
| | | | | | | | | | | | | |
| | | | PSE&G | | Power | | Other (A) | | Eliminations (B) | | Consolidated Total | |
| | | | Millions | |
| | Year Ended December 31, 2014 | | | | | | | | | | | |
| | Operating Revenues | | $ | 6,766 |
| | $ | 5,434 |
| | $ | 455 |
| | $ | (1,769 | ) | | $ | 10,886 |
| |
| | Depreciation and Amortization | | 906 |
| | 292 |
| | 29 |
| | — |
| | 1,227 |
| |
| | Operating Income (Loss) | | 1,393 |
| | 1,209 |
| | 21 |
| | — |
| | 2,623 |
| |
| | Income from Equity Method Investments | | — |
| | 14 |
| | (1 | ) | | — |
| | 13 |
| |
| | Interest Income | | 26 |
| | 1 |
| | 25 |
| | (22 | ) | | 30 |
| |
| | Interest Expense | | 277 |
| | 122 |
| | 12 |
| | (22 | ) | | 389 |
| |
| | Income (Loss) before Income Taxes | | 1,174 |
| | 1,251 |
| | 31 |
| | — |
| | 2,456 |
| |
| | Income Tax Expense (Benefit) | | 449 |
| | 491 |
| | (2 | ) | | — |
| | 938 |
| |
| | Net Income (Loss) | | 725 |
| | 760 |
| | 33 |
| | — |
| | 1,518 |
| |
| | Gross Additions to Long-Lived Assets | | $ | 2,164 |
| | $ | 626 |
| | $ | 30 |
| | $ | — |
| | $ | 2,820 |
| |
| | As of December 31, 2014 | | | | | | | | | | | |
| | Total Assets | | $ | 22,186 |
| | $ | 12,037 |
| | $ | 2,799 |
| | $ | (1,735 | ) | | $ | 35,287 |
| |
| | Investments in Equity Method Subsidiaries | | $ | — |
| | $ | 121 |
| | $ | 2 |
| | $ | — |
| | $ | 123 |
| |
| | | | | | | | | | | | | |
|
| | | | | | | | | | | | | | | | | | | | | | |
| | | | | | | | | | | | | |
| | | | PSE&G | | Power | | Other (A) | | Eliminations (B) | | Consolidated Total | |
| | | | Millions | |
| | Year Ended December 31, 2017 | | | | | | | | | | | |
| | Operating Revenues | | $ | 6,324 |
| | $ | 3,860 |
| | $ | 466 |
| | $ | (1,556 | ) | | $ | 9,094 |
| |
| | Depreciation and Amortization | | 685 |
| | 1,268 |
| | 33 |
| | — |
| | 1,986 |
| |
| | Operating Income (Loss) | | 1,760 |
| | (367 | ) | | 36 |
| | — |
| | 1,429 |
| |
| | Income from Equity Method Investments | | — |
| | 14 |
| | — |
| | — |
| | 14 |
| |
| | Interest Income | | 24 |
| | 3 |
| | 5 |
| | (2 | ) | | 30 |
| |
| | Interest Expense | | 303 |
| | 50 |
| | 40 |
| | (2 | ) | | 391 |
| |
| | Income (Loss) before Income Taxes | | 1,536 |
| | (250 | ) | | (18 | ) | | — |
| | 1,268 |
| |
| | Income Tax Expense (Benefit) | | 563 |
| | (729 | ) | | (140 | ) | | — |
| | (306 | ) | |
| | Net Income (Loss) | | $ | 973 |
| | $ | 479 |
| | $ | 122 |
| | $ | — |
| | $ | 1,574 |
| |
| | Gross Additions to Long-Lived Assets | | $ | 2,919 |
| | $ | 1,231 |
| | $ | 40 |
| | $ | — |
| | $ | 4,190 |
| |
| | As of December 31, 2017 | | | | | | | | | | | |
| | Total Assets | | $ | 28,554 |
| | $ | 12,418 |
| | $ | 2,666 |
| | $ | (922 | ) | | $ | 42,716 |
| |
| | Investments in Equity Method Subsidiaries | | $ | — |
| | $ | 87 |
| | $ | — |
| | $ | — |
| | $ | 87 |
| |
| | | | | | | | | | | | | |
|
| | | | | | | | | | | | | | | | | | | | | | |
| | | | | | | | | | | | | |
| | | | PSE&G | | Power | | Other (A) | | Eliminations (B) | | Consolidated Total | |
| | | | Millions | |
| | Year Ended December 31, 2016 | | | | | | | | | | | |
| | Operating Revenues | | $ | 6,303 |
| | $ | 3,861 |
| | $ | 370 |
| | $ | (1,568 | ) | | $ | 8,966 |
| |
| | Depreciation and Amortization | | 565 |
| | 881 |
| | 30 |
| | — |
| | 1,476 |
| |
| | Operating Income (Loss) | | 1,629 |
| | 17 |
| | (48 | ) | | — |
| | 1,598 |
| |
| | Income from Equity Method Investments | | — |
| | 11 |
| | — |
| | — |
| | 11 |
| |
| | Interest Income | | 24 |
| | 4 |
| | 4 |
| | (2 | ) | | 30 |
| |
| | Interest Expense | | 289 |
| | 84 |
| | 14 |
| | (2 | ) | | 385 |
| |
| | Income (Loss) before Income Taxes | | 1,404 |
| | (43 | ) | | (63 | ) | | — |
| | 1,298 |
| |
| | Income Tax Expense (Benefit) | | 515 |
| | (61 | ) | | (43 | ) | | — |
| | 411 |
| |
| | Net Income (Loss) | | $ | 889 |
| | $ | 18 |
| | $ | (20 | ) | | $ | — |
| | $ | 887 |
| |
| | Gross Additions to Long-Lived Assets | | $ | 2,816 |
| | $ | 1,343 |
| | $ | 40 |
| | $ | — |
| | $ | 4,199 |
| |
| | As of December 31, 2016 | | | | | | | | | | | |
| | Total Assets | | $ | 26,288 |
| | $ | 12,193 |
| | $ | 2,373 |
| | $ | (784 | ) | | $ | 40,070 |
| |
| | Investments in Equity Method Subsidiaries | | $ | — |
| | $ | 102 |
| | $ | — |
| | $ | — |
| | $ | 102 |
| |
| | | | | | | | | | | | | |
| |
| (A) | Includes amounts applicable to Energy Holdings and PSEG LI, which are below the quantitative threshold for separate disclosure as reportable segments. Other also includes amounts applicable to PSEG (parent corporation) and Services. |
| |
| (B) | Intercompany eliminations primarily relate to intercompany transactions between PSE&G and Power. No gains or losses are recorded on any intercompany transactions; rather, all intercompany transactions are at cost or, in the case of the BGS and BGSS contracts between PSE&G and Power, at rates prescribed by the BPU. For a further discussion of the intercompany transactions between PSE&G and Power, see Note 24.25. Related-Party Transactions. |
NOTES TO CONSOLIDATED FINANCIAL STATEMENTS
Note 24.25. Related-Party Transactions
The following discussion relates to intercompany transactions, which are eliminated during the PSEG consolidation process in accordance with GAAP.
PSE&G
The financial statements for PSE&G include transactions with related parties presented as follows:
|
| | | | | | | | | | | | | | |
| | | | | | | | | |
| | | | Years Ended December 31, | |
| | Related Party Transactions | | 2016 | | 2015 | | 2014 | |
| | | | Millions | |
| | Billings from Affiliates: | | | | | | | |
| | Net Billings from Power primarily through BGS and BGSS (A) | | $ | 1,587 |
| | $ | 1,630 |
| | $ | 1,771 |
| |
| | Administrative Billings from Services (B) | | 312 |
| | 274 |
| | 248 |
| |
| | Total Billings from Affiliates | | $ | 1,899 |
| | $ | 1,904 |
| | $ | 2,019 |
| |
| | | | | | | | | |
NOTES TO CONSOLIDATED FINANCIAL STATEMENTS
|
| | | | | | | | | | | | | | |
| | | | | | | | | |
| | | | Years Ended December 31, | |
| | Related Party Transactions | | 2018 | | 2017 | | 2016 | |
| | | | Millions | |
| | Billings from Affiliates: | | | | | | | |
| | Net Billings from Power primarily through BGS and BGSS (A) | | $ | 1,514 |
| | $ | 1,580 |
| | $ | 1,587 |
| |
| | Administrative Billings from Services (B) | | 333 |
| | 331 |
| | 312 |
| |
| | Total Billings from Affiliates | | $ | 1,847 |
| | $ | 1,911 |
| | $ | 1,899 |
| |
| | | | | | | | | |
|
| | | | | | | | | | |
| | | | | | | |
| | | | Years Ended December 31, | |
| | Related Party Transactions | | 2016 | | 2015 | |
| | | | Millions | |
| | Receivables from PSEG (C) | | $ | 76 |
| | $ | 222 |
| |
| | Payable to Power (A) | | $ | 193 |
| | $ | 212 |
| |
| | Payable to Services (B) | | 67 |
| | 80 |
| |
| | Accounts Payable—Affiliated Companies | | $ | 260 |
| | $ | 292 |
| |
| | Working Capital Advances to Services (D) | | $ | 33 |
| | $ | 33 |
| |
| | Long-Term Accrued Taxes Payable | | $ | 130 |
| | $ | 109 |
| |
| | | | | | | |
|
| | | | | | | | | | |
| | | | | | | |
| | | | Years Ended December 31, | |
| | Related Party Transactions | | 2018 | | 2017 | |
| | | | Millions | |
| | Receivables from PSEG (C) | | $ | 123 |
| | $ | — |
| |
| | Payable to Power (A) | | $ | 245 |
| | $ | 221 |
| |
| | Payable to Services (B) | | 76 |
| | 78 |
| |
| | Payable to PSEG (C) | | — |
| | 41 |
| |
| | Accounts Payable—Affiliated Companies | | $ | 321 |
| | $ | 340 |
| |
| | Working Capital Advances to Services (D) | | $ | 33 |
| | $ | 33 |
| |
| | Long-Term Accrued Taxes Payable | | $ | 69 |
| | $ | 91 |
| |
| | | | | | | |
Power
The financial statements for Power include transactions with related parties presented as follows:
|
| | | | | | | | | | | | | | |
| | | | | | | | | |
| | | | Years Ended December 31, | |
| | Related Party Transactions | | 2016 | | 2015 | | 2014 | |
| | | | Millions | |
| | Billings to Affiliates: | | | | | | | |
| | Net Billings to PSE&G primarily through BGS and BGSS (A) | | $ | 1,587 |
| | $ | 1,630 |
| | $ | 1,771 |
| |
| | Billings from Affiliates: | | | | | | | |
| | Administrative Billings from Services (B) | | $ | 179 |
| | $ | 187 |
| | $ | 165 |
| |
| | | | | | | | | |
|
| | | | | | | | | | | | | | |
| | | | | | | | | |
| | | | Years Ended December 31, | |
| | Related Party Transactions | | 2018 | | 2017 | | 2016 | |
| | | | Millions | |
| | Billings to Affiliates: | | | | | | | |
| | Net Billings to PSE&G primarily through BGS and BGSS (A) | | $ | 1,514 |
| | $ | 1,580 |
| | 1,587 |
| |
| | Billings from Affiliates: | | | | | | | |
| | Administrative Billings from Services (B) | | $ | 145 |
| | $ | 168 |
| | $ | 179 |
| |
| | | | | | | | | |
|
| | | | | | | | | | |
| | | | | | | |
| | | | Years Ended December 31, | |
| | Related Party Transactions | | 2016 | | 2015 | |
| | | | Millions | |
| | Receivable from PSE&G (A) | | $ | 193 |
| | $ | 212 |
| |
| | Receivable from PSEG (C) | | 12 |
| | 64 |
| |
| | Accounts Receivable—Affiliated Companies | | $ | 205 |
| | $ | 276 |
| |
| | Payable to Services (B) | | $ | 25 |
| | $ | 33 |
| |
| | Accounts Payable—Affiliated Companies | | $ | 25 |
| | $ | 33 |
| |
| | Short-Term Loan due (to) from Affiliate (E) | | $ | 87 |
| | $ | 363 |
| |
| | Working Capital Advances to Services (D) | | $ | 17 |
| | $ | 17 |
| |
| | Long-Term Accrued Taxes Payable | | $ | 77 |
| | $ | 35 |
| |
| | | | | | | |
|
| | | | | | | | | | |
| | | | | | | |
| | | | Years Ended December 31, | |
| | Related Party Transactions | | 2018 | | 2017 | |
| | | | Millions | |
| | Receivable from PSE&G (A) | | $ | 245 |
| | $ | 221 |
| |
| | Receivables from PSEG (C) | | 29 |
| | — |
| |
| | Accounts Receivable—Affiliated Companies | | $ | 274 |
| | $ | 221 |
| |
| | Payable to Services (B) | | $ | 16 |
| | $ | 28 |
| |
| | Payable to PSEG (C) | | — |
| | 29 |
| |
| | Accounts Payable—Affiliated Companies | | $ | 16 |
| | $ | 57 |
| |
| | Short-Term Loan due to Affiliate (E) | | $ | 193 |
| | $ | 281 |
| |
| | Working Capital Advances to Services (D) | | $ | 17 |
| | $ | 17 |
| |
| | Long-Term Accrued Taxes Payable | | $ | 76 |
| | $ | 52 |
| |
| | | | | | | |
NOTES TO CONSOLIDATED FINANCIAL STATEMENTS
| |
| (A) | PSE&G has entered into a requirements contract with Power under which Power provides the gas supply services needed to meet PSE&G’s BGSS and other contractual requirements. Power has also entered into contracts to supply energy, capacity and ancillary services to PSE&G through the BGS auction process. The rates in the BGS and BGSS contracts are prescribed by the BPU. In addition, Power and PSE&G provide certain technical services for each other generally at cost in compliance with FERC and BPU affiliate rules. |
| |
| (B) | Services provides and bills administrative services to PSE&G and Power at cost. In addition, PSE&G and Power have other payables to Services, including amounts related to certain common costs, such as pension and OPEB costs, which Services pays on behalf of each of the operating companies. |
| |
| (C) | PSEG files a consolidated federal income tax return with its affiliated companies. A tax allocation agreement exists between PSEG and each of its affiliated companies. The general operation of these agreements is that the subsidiary company will compute its taxable income on a stand-alone basis. If the result is a net tax liability, such amount shall be paid to PSEG. If there are net operating losses and/or tax credits, the subsidiary shall receive payment for the tax savings from PSEG to the extent that PSEG is able to utilize those benefits. |
| |
| (D) | PSE&G and Power have advanced working capital to Services. The amounts are included in Other Noncurrent Assets on PSE&G’s and Power’s Consolidated Balance Sheets. |
NOTES TO CONSOLIDATED FINANCIAL STATEMENTS
| |
| (E) | Power’s short-term loans with PSEG are for working capital and other short-term needs. Interest Income and Interest Expense relating to these short-term funding activities were immaterial. |
Note 25.26. Selected Quarterly Data (Unaudited)
The information shown in the following tables, in the opinion of PSEG, PSE&G and Power includes all adjustments, consisting only of normal recurring accruals, necessary to fairly present such amounts.
|
| | | | | | | | | | | | | | | | | | | | | | | | | | | | | | | | | | |
| | | | | | | | | | | | | | | | | | | |
| | | | Quarter Ended | |
| | | | March 31, | | June 30, | | September 30, | | December 31, (A) | |
| | | | 2016 | | 2015 | | 2016 | | 2015 | | 2016 | | 2015 | | 2016 | | 2015 | |
| | PSEG Consolidated: | | Millions, except per share data | |
| | Operating Revenues | | $ | 2,616 |
| | $ | 3,135 |
| | $ | 1,905 |
| | $ | 2,314 |
| | $ | 2,450 |
| | $ | 2,688 |
| | $ | 2,090 |
| | $ | 2,278 |
| |
| | Operating Income | | $ | 827 |
| | $ | 1,048 |
| | $ | 347 |
| | $ | 568 |
| | $ | 577 |
| | $ | 814 |
| | $ | (175 | ) | | $ | 532 |
| |
| | Net Income (Loss) | | $ | 471 |
| | $ | 586 |
| | $ | 187 |
| | $ | 345 |
| | $ | 327 |
| | $ | 439 |
| | $ | (98 | ) | | $ | 309 |
| |
| | Earnings Per Share: | | | | | | | | | | | | | | | | | |
| | Basic: | | | | | | | | | | | | | | | | | |
| | Net Income (Loss) | | $ | 0.93 |
| | $ | 1.16 |
| | $ | 0.37 |
| | $ | 0.68 |
| | $ | 0.65 |
| | $ | 0.87 |
| | $ | (0.19 | ) | | $ | 0.61 |
| |
| | Diluted: | | | | | | | | | | | | | | | | | |
| | Net Income (Loss) | | $ | 0.93 |
| | $ | 1.15 |
| | $ | 0.37 |
| | $ | 0.68 |
| | $ | 0.64 |
| | $ | 0.87 |
| | $ | (0.19 | ) | | $ | 0.60 |
| |
| | Weighted Average Common Shares Outstanding: | | | | | | | | | | | | | | | | | |
| | Basic | | 505 |
| | 506 |
| | 505 |
| | 506 |
| | 505 |
| | 505 |
| | 505 |
| | 505 |
| |
| | Diluted | | 508 |
| | 508 |
| | 508 |
| | 508 |
| | 508 |
| | 508 |
| | 508 |
| | 508 |
| |
| | | | | | | | | | | | | | | | | | | |
|
| | | | | | | | | | | | | | | | | | | | | | | | | | | | | | | | | | |
| | | | | | | | | | | | | | | | | | | |
| | | | Quarter Ended | |
| | | | March 31, (A) | | June 30, (A) | | September 30, | | December 31, (A) | |
| | | | 2018 | | 2017 | | 2018 | | 2017 | | 2018 | | 2017 | | 2018 | | 2017 | |
| | PSEG Consolidated: | | Millions, except per share data | |
| | Operating Revenues | | $ | 2,818 |
| | $ | 2,591 |
| | $ | 2,016 |
| | $ | 2,142 |
| | $ | 2,394 |
| | $ | 2,254 |
| | $ | 2,468 |
| | $ | 2,107 |
| |
| | Operating Income | | $ | 832 |
| | $ | 178 |
| | $ | 411 |
| | $ | 195 |
| | $ | 554 |
| | $ | 693 |
| | $ | 501 |
| | $ | 363 |
| |
| | Net Income | | $ | 558 |
| | $ | 114 |
| | $ | 269 |
| | $ | 109 |
| | $ | 412 |
| | $ | 395 |
| | $ | 199 |
| | $ | 956 |
| |
| | Earnings Per Share: | | | | | | | | | | | | | | | | | |
| | Basic: | | | | | | | | | | | | | | | | | �� |
| | Net Income | | $ | 1.11 |
| | $ | 0.23 |
| | $ | 0.53 |
| | $ | 0.22 |
| | $ | 0.82 |
| | $ | 0.78 |
| | $ | 0.39 |
| | $ | 1.89 |
| |
| | Diluted: | | | | | | | | | | | | | | | | | |
| | Net Income | | $ | 1.10 |
| | $ | 0.22 |
| | $ | 0.53 |
| | $ | 0.22 |
| | $ | 0.81 |
| | $ | 0.78 |
| | $ | 0.39 |
| | $ | 1.88 |
| |
| | Weighted Average Common Shares Outstanding: | | | | | | | | | | | | | | | | | |
| | Basic | | 504 |
| | 505 |
| | 504 |
| | 505 |
| | 504 |
| | 505 |
| | 504 |
| | 505 |
| |
| | Diluted | | 507 |
| | 508 |
| | 507 |
| | 507 |
| | 507 |
| | 507 |
| | 508 |
| | 508 |
| |
| | | | | | | | | | | | | | | | | | | |
|
| | | | | | | | | | | | | | | | | | | | | | | | | | | | | | | | | | |
| | | | | | | | | | | | | | | | | | | |
| | | | Quarter Ended | |
| | | | March 31, | | June 30, | | September 30, | | December 31, | |
| | | | 2016 | | 2015 | | 2016 | | 2015 | | 2016 | | 2015 | | 2016 | | 2015 | |
| | PSE&G: | | Millions | |
| | Operating Revenues | | $ | 1,712 |
| | $ | 2,002 |
| | $ | 1,350 |
| | $ | 1,466 |
| | $ | 1,684 |
| | $ | 1,766 |
| | $ | 1,475 |
| | $ | 1,402 |
| |
| | Operating Income | | $ | 462 |
| | $ | 451 |
| | $ | 333 |
| | $ | 320 |
| | $ | 450 |
| | $ | 404 |
| | $ | 369 |
| | $ | 287 |
| |
| | Net Income | | $ | 262 |
| | $ | 242 |
| | $ | 179 |
| | $ | 167 |
| | $ | 255 |
| | $ | 222 |
| | $ | 193 |
| | $ | 156 |
| |
| | | | | | | | | | | | | | | | | | | |
|
| | | | | | | | | | | | | | | | | | | | | | | | | | | | | | | | | | |
| | | | | | | | | | | | | | | | | | | |
| | | | Quarter Ended | |
| | | | March 31, | | June 30, | | September 30, | | December 31, | |
| | | | 2018 | | 2017 | | 2018 | | 2017 | | 2018 | | 2017 | | 2018 | | 2017 | |
| | PSE&G: | | Millions | |
| | Operating Revenues | | $ | 1,845 |
| | $ | 1,826 |
| | $ | 1,386 |
| | $ | 1,393 |
| | $ | 1,595 |
| | $ | 1,530 |
| | $ | 1,645 |
| | $ | 1,575 |
| |
| | Operating Income | | $ | 482 |
| | $ | 523 |
| | $ | 358 |
| | $ | 380 |
| | $ | 421 |
| | $ | 461 |
| | $ | 345 |
| | $ | 396 |
| |
| | Net Income | | $ | 319 |
| | $ | 299 |
| | $ | 231 |
| | $ | 208 |
| | $ | 278 |
| | $ | 246 |
| | $ | 239 |
| | $ | 220 |
| |
| | | | | | | | | | | | | | | | | | | |
NOTES TO CONSOLIDATED FINANCIAL STATEMENTS
|
| | | | | | | | | | | | | | | | | | | | | | | | | | | | | | | | | | |
| | | | | | | | | | | | | | | | | | | |
| | | | Quarter Ended | |
| | | | March 31, | | June 30, | | September 30, | | December 31, (A) | |
| | | | 2016 | | 2015 | | 2016 | | 2015 | | 2016 | | 2015 | | 2016 | | 2015 | |
| | Power: | | Millions | |
| | Operating Revenues | | $ | 1,313 |
| | $ | 1,725 |
| | $ | 714 |
| | $ | 1,025 |
| | $ | 1,075 |
| | $ | 1,096 |
| | $ | 921 |
| | $ | 1,082 |
| |
| | Operating Income (Loss) | | $ | 343 |
| | $ | 584 |
| | $ | (12 | ) | | $ | 228 |
| | $ | 238 |
| | $ | 391 |
| | $ | (556 | ) | | $ | 227 |
| |
| | Net Income (Loss) | | $ | 192 |
| | $ | 335 |
| | $ | (11 | ) | | $ | 166 |
| | $ | 139 |
| | $ | 206 |
| | $ | (302 | ) | | $ | 149 |
| |
| | | | | | | | | | | | | | | | | | | |
|
| | | | | | | | | | | | | | | | | | | | | | | | | | | | | | | | | | |
| | | | | | | | | | | | | | | | | | | |
| | | | Quarter Ended | |
| | | | March 31, (A) | | June 30, (A) | | September 30, | | December 31, (A) | |
| | | | 2018 | | 2017 | | 2018 | | 2017 | | 2018 | | 2017 | | 2018 | | 2017 | |
| | Power: | | Millions | |
| | Operating Revenues | | $ | 1,403 |
| | $ | 1,269 |
| | $ | 767 |
| | $ | 918 |
| | $ | 868 |
| | $ | 846 |
| | $ | 1,108 |
| | $ | 827 |
| |
| | Operating Income (Loss) | | $ | 329 |
| | $ | (305 | ) | | $ | 42 |
| | $ | (189 | ) | | $ | 112 |
| | $ | 211 |
| | $ | 113 |
| | $ | (84 | ) | |
| | Net Income (Loss) | | $ | 234 |
| | $ | (170 | ) | | $ | 41 |
| | $ | (97 | ) | | $ | 125 |
| | $ | 136 |
| | $ | (35 | ) | | $ | 610 |
| |
| | | | | | | | | | | | | | | | | | | |
| |
| (A) | The decreasesincreases in Operating Income at PSEG consolidated and Power in the first and second quarters of 2018 as compared to the same quarters in 2017 were primarily due to higher costs in 2017 related to closing the coal/gas Hudson and Mercer units, which were fully depreciated as of June 1, 2017. The increases in Operating Income at PSEG consolidated and Power in the fourth quarter 20162018 as compared to the same quarter in 20152017 were primarily due to costs related to closinglower MTM losses and a gain on the coal/gassale of the Hudson and Mercer units and higher MTM losses in 2016.units. |
NOTES TO CONSOLIDATED FINANCIAL STATEMENTS
Note 26.27. Guarantees of Debt
Power’s Senior Notes are fully and unconditionally and jointly and severally guaranteed by its subsidiaries, PSEG Fossil LLC, PSEG Nuclear LLC and PSEG Energy Resources & Trade LLC. The following tables present condensed financial information for the guarantor subsidiaries, as well as Power’s non-guarantor subsidiaries, as of December 31, 20162018 and 20152017 and for the years ended December 31, 2016, 20152018, 2017 and 20142016.
|
| | | | | | | | | | | | | | | | | | | | | | |
| | | | | | | | | | | | | |
| | | | Power | | Guarantor Subsidiaries | | Other Subsidiaries | | Consolidating Adjustments | | Total | |
| | | | Millions | |
| | Year Ended December 31, 2016 | | | | | | | | | | | |
| | Operating Revenues | | $ | — |
| | $ | 3,971 |
| | $ | 173 |
| | $ | (121 | ) | | $ | 4,023 |
| |
| | Operating Expenses | | 8 |
| | 3,962 |
| | 161 |
| | (121 | ) | | 4,010 |
| |
| | Operating Income (Loss) | | (8 | ) | | 9 |
| | 12 |
| | — |
| | 13 |
| |
| | Equity Earnings (Losses) of Subsidiaries | | 36 |
| | (3 | ) | | 11 |
| | (33 | ) | | 11 |
| |
| | Other Income | | 71 |
| | 120 |
| | — |
| | (89 | ) | | 102 |
| |
| | Other Deductions | | (18 | ) | | (39 | ) | | — |
| | — |
| | (57 | ) | |
| | Other-Than-Temporary Impairments | | — |
| | (28 | ) | | — |
| | — |
| | (28 | ) | |
| | Interest Expense | | (115 | ) | | (40 | ) | | (18 | ) | | 89 |
| | (84 | ) | |
| | Income Tax Benefit (Expense) | | 52 |
| | (11 | ) | | 20 |
| | — |
| | 61 |
| |
| | Net Income (Loss) | | $ | 18 |
| | $ | 8 |
| | $ | 25 |
| | $ | (33 | ) | | $ | 18 |
| |
| | Comprehensive Income (Loss) | | $ | 47 |
| | $ | 50 |
| | $ | 25 |
| | $ | (75 | ) | | $ | 47 |
| |
| | As of December 31, 2016 | | | | | | | | | | | |
| | Current Assets | | $ | 4,412 |
| | $ | 1,593 |
| | $ | 152 |
| | $ | (4,697 | ) | | $ | 1,460 |
| |
| | Property, Plant and Equipment, net | | 55 |
| | 6,145 |
| | 2,320 |
| | — |
| | 8,520 |
| |
| | Investment in Subsidiaries | | 4,249 |
| | 344 |
| | — |
| | (4,593 | ) | | — |
| |
| | Noncurrent Assets | | 168 |
| | 2,016 |
| | 129 |
| | (100 | ) | | 2,213 |
| |
| | Total Assets | | $ | 8,884 |
| | $ | 10,098 |
| | $ | 2,601 |
| | $ | (9,390 | ) | | $ | 12,193 |
| |
| | Current Liabilities | | $ | 171 |
| | $ | 3,752 |
| | $ | 1,454 |
| | $ | (4,697 | ) | | $ | 680 |
| |
| | Noncurrent Liabilities | | 532 |
| | 2,398 |
| | 502 |
| | (100 | ) | | 3,332 |
| |
| | Long-Term Debt | | 2,382 |
| | — |
| | — |
| | — |
| | 2,382 |
| |
| | Member’s Equity | | 5,799 |
| | 3,948 |
| | 645 |
| | (4,593 | ) | | 5,799 |
| |
| | Total Liabilities and Member’s Equity | | $ | 8,884 |
| | $ | 10,098 |
| | $ | 2,601 |
| | $ | (9,390 | ) | | $ | 12,193 |
| |
| | Year Ended December 31, 2016 | | | | | | | | | | | |
| | Net Cash Provided By (Used In) Operating Activities | | $ | 97 |
| | $ | 1,442 |
| | $ | 323 |
| | $ | (607 | ) | | $ | 1,255 |
| |
| | Net Cash Provided By (Used In) Investing Activities | | $ | 60 |
| | $ | (707 | ) | | $ | (789 | ) | | $ | 289 |
| | $ | (1,147 | ) | |
| | Net Cash Provided By (Used In) Financing Activities | | $ | (157 | ) | | $ | (736 | ) | | $ | 466 |
| | $ | 318 |
| | $ | (109 | ) | |
| | | | | | | | | | | | | |
|
| | | | | | | | | | | | | | | | | | | | | | |
| | | | | | | | | | | | | |
| | | | Power | | Guarantor Subsidiaries | | Other Subsidiaries | | Consolidating Adjustments | | Total | |
| | | | Millions | |
| | Year Ended December 31, 2018 | | | | | | | | | | | |
| | Operating Revenues | | $ | — |
| | $ | 4,078 |
| | $ | 224 |
| | $ | (156 | ) | | $ | 4,146 |
| |
| | Operating Expenses | | 14 |
| | 3,460 |
| | 232 |
| | (156 | ) | | 3,550 |
| |
| | Operating Income (Loss) | | (14 | ) | | 618 |
| | (8 | ) | | — |
| | 596 |
| |
| | Equity Earnings (Losses) of Subsidiaries | | 406 |
| | (28 | ) | | 15 |
| | (378 | ) | | 15 |
| |
| | Net Gains (Losses) on Trust Investments | | (1 | ) | | (139 | ) | | — |
| | — |
| | (140 | ) | |
| | Other Income (Deductions) | | 135 |
| | 166 |
| | — |
| | (280 | ) | | 21 |
| |
| | Non-Operating Pension and OPEB Credits (Costs) | | — |
| | 13 |
| | 2 |
| | — |
| | 15 |
| |
| | Interest Expense | | (230 | ) | | (96 | ) | | (30 | ) | | 280 |
| | (76 | ) | |
| | Income Tax Benefit (Expense) | | 69 |
| | (143 | ) | | 8 |
| | — |
| | (66 | ) | |
| | Net Income (Loss) | | $ | 365 |
| | $ | 391 |
| | $ | (13 | ) | | $ | (378 | ) | | $ | 365 |
| |
| | Comprehensive Income (Loss) | | $ | 393 |
| | $ | 379 |
| | $ | (13 | ) | | $ | (366 | ) | | $ | 393 |
| |
| | As of December 31, 2018 | | | | | | | | | | | |
| | Current Assets | | $ | 4,317 |
| | $ | 1,479 |
| | $ | 304 |
| | $ | (4,593 | ) | | $ | 1,507 |
| |
| | Property, Plant and Equipment, net | | 49 |
| | 4,971 |
| | 3,822 |
| | — |
| | 8,842 |
| |
| | Investment in Subsidiaries | | 5,062 |
| | 1,107 |
| | — |
| | (6,169 | ) | | — |
| |
| | Noncurrent Assets | | 273 |
| | 2,109 |
| | 101 |
| | (238 | ) | | 2,245 |
| |
| | Total Assets | | $ | 9,701 |
| | $ | 9,666 |
| | $ | 4,227 |
| | $ | (11,000 | ) | | $ | 12,594 |
| |
| | Current Liabilities | | $ | 437 |
| | $ | 2,971 |
| | $ | 2,027 |
| | $ | (4,593 | ) | | $ | 842 |
| |
| | Noncurrent Liabilities | | 513 |
| | 1,996 |
| | 730 |
| | (238 | ) | | 3,001 |
| |
| | Long-Term Debt | | 2,791 |
| | — |
| | — |
| | — |
| | 2,791 |
| |
| | Member’s Equity | | 5,960 |
| | 4,699 |
| | 1,470 |
| | (6,169 | ) | | 5,960 |
| |
| | Total Liabilities and Member’s Equity | | $ | 9,701 |
| | $ | 9,666 |
| | $ | 4,227 |
| | $ | (11,000 | ) | | $ | 12,594 |
| |
| | Year Ended December 31, 2018 | | | | | | | | | | | |
| | Net Cash Provided By (Used In) Operating Activities | | $ | (74 | ) | | $ | 1,007 |
| | $ | 42 |
| | $ | 109 |
| | $ | 1,084 |
| |
| | Net Cash Provided By (Used In) Investing Activities | | $ | (402 | ) | | $ | (1,034 | ) | | $ | (406 | ) | | $ | 791 |
| | $ | (1,051 | ) | |
| | Net Cash Provided By (Used In) Financing Activities | | $ | 476 |
| | $ | 27 |
| | $ | 354 |
| | $ | (900 | ) | | $ | (43 | ) | |
| | | | | | | | | | | | | |
NOTES TO CONSOLIDATED FINANCIAL STATEMENTS
|
| | | | | | | | | | | | | | | | | | | | | | |
| | | | | | | | | | | | | |
| | | | Power | | Guarantor Subsidiaries | | Other Subsidiaries | | Consolidating Adjustments | | Total | |
| | | | Millions | |
| | Year Ended December 31, 2015 | | | | | | | | | | | |
| | Operating Revenues | | $ | — |
| | $ | 4,883 |
| | $ | 179 |
| | $ | (134 | ) | | $ | 4,928 |
| |
| | Operating Expenses | | 12 |
| | 3,451 |
| | 169 |
| | (134 | ) | | 3,498 |
| |
| | Operating Income (Loss) | | (12 | ) | | 1,432 |
| | 10 |
| | — |
| | 1,430 |
| |
| | Equity Earnings (Losses) of Subsidiaries | | 906 |
| | (4 | ) | | 14 |
| | (902 | ) | | 14 |
| |
| | Other Income | | 48 |
| | 174 |
| | — |
| | (53 | ) | | 169 |
| |
| | Other Deductions | | (27 | ) | | (45 | ) | | — |
| | — |
| | (72 | ) | |
| | Other-Than-Temporary Impairments | | — |
| | (53 | ) | | — |
| | — |
| | (53 | ) | |
| | Interest Expense | | (116 | ) | | (39 | ) | | (19 | ) | | 53 |
| | (121 | ) | |
| | Income Tax Benefit (Expense) | | 57 |
| | (574 | ) | | 6 |
| | — |
| | (511 | ) | |
| | Net Income (Loss) | | $ | 856 |
| | $ | 891 |
| | $ | 11 |
| | $ | (902 | ) | | $ | 856 |
| |
| | Comprehensive Income (Loss) | | $ | 844 |
| | $ | 855 |
| | $ | 11 |
| | $ | (866 | ) | | $ | 844 |
| |
| | As of December 31, 2015 | | | | | | | | | | | |
| | Current Assets | | $ | 4,501 |
| | $ | 1,912 |
| | $ | 364 |
| | $ | (4,828 | ) | | $ | 1,949 |
| |
| | Property, Plant and Equipment, net | | 83 |
| | 6,502 |
| | 1,542 |
| | — |
| | 8,127 |
| |
| | Investment in Subsidiaries | | 4,501 |
| | 346 |
| | — |
| | (4,847 | ) | | — |
| |
| | Noncurrent Assets | | 155 |
| | 1,959 |
| | 136 |
| | (76 | ) | | 2,174 |
| |
| | Total Assets | | $ | 9,240 |
| | $ | 10,719 |
| | $ | 2,042 |
| | $ | (9,751 | ) | | $ | 12,250 |
| |
| | Current Liabilities | | $ | 1,112 |
| | $ | 3,866 |
| | $ | 1,076 |
| | $ | (4,828 | ) | | $ | 1,226 |
| |
| | Noncurrent Liabilities | | 442 |
| | 2,597 |
| | 375 |
| | (76 | ) | | 3,338 |
| |
| | Long-Term Debt | | 1,684 |
| | — |
| | — |
| | — |
| | 1,684 |
| |
| | Member’s Equity | | 6,002 |
| | 4,256 |
| | 591 |
| | (4,847 | ) | | 6,002 |
| |
| | Total Liabilities and Member’s Equity | | $ | 9,240 |
| | $ | 10,719 |
| | $ | 2,042 |
| | $ | (9,751 | ) | | $ | 12,250 |
| |
| | Year Ended December 31, 2015 | | | | | | | | | | | |
| | Net Cash Provided By (Used In) Operating Activities | | $ | 571 |
| | $ | 2,089 |
| | $ | 80 |
| | $ | (1,034 | ) | | $ | 1,706 |
| |
| | Net Cash Provided By (Used In) Investing Activities | | $ | (366 | ) | | $ | (1,519 | ) | | $ | (430 | ) | | $ | 1,314 |
| | $ | (1,001 | ) | |
| | Net Cash Provided By (Used In) Financing Activities | | $ | (205 | ) | | $ | (571 | ) | | $ | 354 |
| | $ | (280 | ) | | $ | (702 | ) | |
| | | | | | | | | | | | | |
|
| | | | | | | | | | | | | | | | | | | | | | |
| | | | | | | | | | | | | |
| | | | Power | | Guarantor Subsidiaries | | Other Subsidiaries | | Consolidating Adjustments | | Total | |
| | | | Millions | |
| | Year Ended December 31, 2017 | | | | | | | | | | | |
| | Operating Revenues | | $ | — |
| | $ | 3,821 |
| | $ | 174 |
| | $ | (135 | ) | | $ | 3,860 |
| |
| | Operating Expenses | | 8 |
| | 4,159 |
| | 195 |
| | (135 | ) | | 4,227 |
| |
| | Operating Income (Loss) | | (8 | ) | | (338 | ) | | (21 | ) | | — |
| | (367 | ) | |
| | Equity Earnings (Losses) of Subsidiaries | | 567 |
| | 60 |
| | 14 |
| | (627 | ) | | 14 |
| |
| | Net Gains (Losses) on Trust Investments | | 3 |
| | 122 |
| | — |
| | — |
| | 125 |
| |
| | Other Income (Deductions) | | 71 |
| | 91 |
| | 2 |
| | (144 | ) | | 20 |
| |
| | Non-Operating Pension and OPEB Credits (Costs) | | — |
| | 8 |
| | — |
| | — |
| | 8 |
| |
| | Interest Expense | | (128 | ) | | (49 | ) | | (17 | ) | | 144 |
| | (50 | ) | |
| | Income Tax Benefit (Expense) | | (26 | ) | | 588 |
| | 167 |
| | — |
| | 729 |
| |
| | Net Income (Loss) | | $ | 479 |
| | $ | 482 |
| | $ | 145 |
| | $ | (627 | ) | | $ | 479 |
| |
| | Comprehensive Income (Loss) | | $ | 518 |
| | $ | 529 |
| | $ | 145 |
| | $ | (674 | ) | | $ | 518 |
| |
| | As of December 31, 2017 | | | | | | | | | | | |
| | Current Assets | | $ | 4,327 |
| | $ | 1,500 |
| | $ | 200 |
| | $ | (4,686 | ) | | $ | 1,341 |
| |
| | Property, Plant and Equipment, net | | 54 |
| | 5,778 |
| | 2,764 |
| | — |
| | 8,596 |
| |
| | Investment in Subsidiaries | | 4,844 |
| | 404 |
| | — |
| | (5,248 | ) | | — |
| |
| | Noncurrent Assets | | 100 |
| | 2,349 |
| | 110 |
| | (78 | ) | | 2,481 |
| |
| | Total Assets | | $ | 9,325 |
| | $ | 10,031 |
| | $ | 3,074 |
| | $ | (10,012 | ) | | $ | 12,418 |
| |
| | Current Liabilities | | $ | 689 |
| | $ | 3,586 |
| | $ | 1,846 |
| | $ | (4,686 | ) | | $ | 1,435 |
| |
| | Noncurrent Liabilities | | 533 |
| | 1,966 |
| | 459 |
| | (78 | ) | | 2,880 |
| |
| | Long-Term Debt | | 2,136 |
| | — |
| | — |
| | — |
| | 2,136 |
| |
| | Member’s Equity | | 5,967 |
| | 4,479 |
| | 769 |
| | (5,248 | ) | | 5,967 |
| |
| | Total Liabilities and Member’s Equity | | $ | 9,325 |
| | $ | 10,031 |
| | $ | 3,074 |
| | $ | (10,012 | ) | | $ | 12,418 |
| |
| | Year Ended December 31, 2017 | | | | | | | | | | | |
| | Net Cash Provided By (Used In) Operating Activities | | $ | (42 | ) | | $ | 1,185 |
| | $ | 238 |
| | $ | (55 | ) | | $ | 1,326 |
| |
| | Net Cash Provided By (Used In) Investing Activities | | $ | 506 |
| | $ | (448 | ) | | $ | (525 | ) | | $ | (765 | ) | | $ | (1,232 | ) | |
| | Net Cash Provided By (Used In) Financing Activities | | $ | (464 | ) | | $ | (736 | ) | | $ | 307 |
| | $ | 820 |
| | $ | (73 | ) | |
| | | | | | | | | | | | | |
NOTES TO CONSOLIDATED FINANCIAL STATEMENTS
|
| | | | | | | | | | | | | | | | | | | | | | |
| | | | | | | | | | | | | |
| | | | Power | | Guarantor Subsidiaries | | Other Subsidiaries | | Consolidating Adjustments | | Total | |
| | | | Millions | |
| | Year Ended December 31, 2014 | | | | | | | | | | | |
| | Operating Revenues | | $ | — |
| | $ | 5,390 |
| | $ | 153 |
| | $ | (109 | ) | | $ | 5,434 |
| |
| | Operating Expenses | | 16 |
| | 4,175 |
| | 143 |
| | (109 | ) | | 4,225 |
| |
| | Operating Income (Loss) | | (16 | ) | | 1,215 |
| | 10 |
| | — |
| | 1,209 |
| |
| | Equity Earnings (Losses) of Subsidiaries | | 799 |
| | (5 | ) | | 14 |
| | (794 | ) | | 14 |
| |
| | Other Income | | 34 |
| | 222 |
| | — |
| | (34 | ) | | 222 |
| |
| | Other Deductions | | (20 | ) | | (32 | ) | | — |
| | — |
| | (52 | ) | |
| | Other-Than-Temporary Impairments | | — |
| | (20 | ) | | — |
| | — |
| | (20 | ) | |
| | Interest Expense | | (102 | ) | | (35 | ) | | (19 | ) | | 34 |
| | (122 | ) | |
| | Income Tax Benefit (Expense) | | 65 |
| | (558 | ) | | 2 |
| | — |
| | (491 | ) | |
| | Net Income (Loss) | | $ | 760 |
| | $ | 787 |
| | $ | 7 |
| | $ | (794 | ) | | $ | 760 |
| |
| | Comprehensive Income (Loss) | | $ | 595 |
| | $ | 768 |
| | $ | 7 |
| | $ | (775 | ) | | $ | 595 |
| |
| | Year Ended December 31, 2014 | | | | | | | | | | | |
| | Net Cash Provided By (Used In) Operating Activities | | $ | 577 |
| | $ | 1,674 |
| | $ | 76 |
| | $ | (902 | ) | | $ | 1,425 |
| |
| | Net Cash Provided By (Used In) Investing Activities | | $ | 148 |
| | $ | (856 | ) | | $ | (42 | ) | | $ | 226 |
| | $ | (524 | ) | |
| | Net Cash Provided By (Used In) Financing Activities | | $ | (724 | ) | | $ | (818 | ) | | $ | (32 | ) | | $ | 676 |
| | $ | (898 | ) | |
| | | | | | | | | | | | | |
|
| | | | | | | | | | | | | | | | | | | | | | |
| | | | | | | | | | | | | |
| | | | Power | | Guarantor Subsidiaries | | Other Subsidiaries | | Consolidating Adjustments | | Total | |
| | | | Millions | |
| | Year Ended December 31, 2016 | | | | | | | | | | | |
| | Operating Revenues | | $ | — |
| | $ | 3,809 |
| | $ | 173 |
| | $ | (121 | ) | | $ | 3,861 |
| |
| | Operating Expenses | | 8 |
| | 3,796 |
| | 161 |
| | (121 | ) | | 3,844 |
| |
| | Operating Income (Loss) | | (8 | ) | | 13 |
| | 12 |
| | — |
| | 17 |
| |
| | Equity Earnings (Losses) of Subsidiaries | | 36 |
| | (3 | ) | | 11 |
| | (33 | ) | | 11 |
| |
| | Net Gains (Losses) on Trust Investments | | 1 |
| | (7 | ) | | — |
| | — |
| | (6 | ) | |
| | Other Income (Deductions) | | 52 |
| | 60 |
| | — |
| | (89 | ) | | 23 |
| |
| | Non-Operating Pension and OPEB Credits (Costs) | | — |
| | (4 | ) | | — |
| | — |
| | (4 | ) | |
| | Interest Expense | | (115 | ) | | (40 | ) | | (18 | ) | | 89 |
| | (84 | ) | |
| | Income Tax Benefit (Expense) | | 52 |
| | (11 | ) | | 20 |
| | — |
| | 61 |
| |
| | Net Income (Loss) | | $ | 18 |
| | $ | 8 |
| | $ | 25 |
| | $ | (33 | ) | | $ | 18 |
| |
| | Comprehensive Income (Loss) | | $ | 47 |
| | $ | 50 |
| | $ | 25 |
| | $ | (75 | ) | | $ | 47 |
| |
| | Year Ended December 31, 2016 | | | | | | | | | | | |
| | Net Cash Provided By (Used In) Operating Activities | | $ | 97 |
| | $ | 1,442 |
| | $ | 323 |
| | $ | (607 | ) | | $ | 1,255 |
| |
| | Net Cash Provided By (Used In) Investing Activities | | $ | 60 |
| | $ | (707 | ) | | $ | (789 | ) | | $ | 289 |
| | $ | (1,147 | ) | |
| | Net Cash Provided By (Used In) Financing Activities | | $ | (157 | ) | | $ | (736 | ) | | $ | 466 |
| | $ | 318 |
| | $ | (109 | ) | |
| | | | | | | | | | | | | |
ITEM 9. CHANGES IN AND DISAGREEMENTS WITH ACCOUNTANTS ON
ACCOUNTING AND FINANCIAL DISCLOSURE
None.
ITEM 9A. CONTROLS AND PROCEDURES
Disclosure Controls and Procedures
PSEG, PSE&G and Power
We have established and maintain disclosure controls and procedures as defined under Rule 13a-15(e) and 15d-15(e) promulgated under the Securities Exchange Act of 1934, as amended (the “Exchange Act”) that are designed to provide reasonable assurance that information required to be disclosed in the reports that are filed or submitted under the Exchange Act is recorded, processed, summarized and reported and is accumulated and communicated to the Chief Executive Officer (CEO) and Chief Financial Officer (CFO) of each respective company, as appropriate, by others within the entities to allow timely decisions regarding required disclosure. We have established a disclosure committee which includes several key management employees and which reports directly to the CFO and CEO of each of PSEG, PSE&G and Power. The committee monitors and evaluates the effectiveness of these disclosure controls and procedures. The CFO and CEO of each of PSEG, PSE&G and Power have evaluated the effectiveness of the disclosure controls and procedures and, based on this evaluation, have concluded that disclosure controls and procedures at each respective company were effective at a reasonable assurance level as of the end of the period covered by the report.
Internal Controls
PSEG, PSE&G and Power
We have conducted assessments of our internal control over financial reporting as of December 31, 20162018, as required by Section 404 of the Sarbanes-Oxley Act, using the framework promulgated by the Committee of Sponsoring Organizations of the Treadway Commission, commonly referred to as “COSO.” Managements’ reports on PSEG’s, PSE&G’s and Power’s internal control over financial reporting are included on pages 180, 181182, 183 and 182,184, respectively. The Independent Registered Public Accounting Firm’s report with respect to the effectiveness of PSEG’s internal control over financial reporting is included on page 183.185. Management has concluded that internal control over financial reporting is effective as of December 31, 20162018.
We continually review our disclosure controls and procedures and make changes, as necessary, to ensure the quality of our financial reporting. There have been no changes in internal control over financial reporting that occurred during the fourth quarter of 20162018 that have materially affected, or are reasonably likely to materially affect, each registrant’s internal control over financial reporting.
ITEM 9B. OTHER INFORMATION
None.
MANAGEMENT REPORT ON INTERNAL CONTROL OVER
FINANCIAL REPORTING—PSEG
Management of Public Service Enterprise Group Incorporated (PSEG) is responsible for establishing and maintaining effective internal control over financial reporting and for the assessment of the effectiveness of internal control over financial reporting. As defined by the SEC in Rules 13a-15(f) and 15d-15(f) under the Securities Exchange Act of 1934, internal control over financial reporting is a process designed by, or under the supervision of, the company’s principal executive and principal financial officers, or persons performing similar functions, and implemented by the company’s management and other personnel, with oversight by the Audit Committee of the Board of Directors to provide reasonable assurance regarding the reliability of financial reporting and the preparation of financial statements for external purposes in accordance with accounting principles generally accepted in the United States of America (generally accepted accounting principles).
PSEG’s internal control over financial reporting includes those policies and procedures that (1) pertain to the maintenance of records that, in reasonable detail, accurately and fairly reflect the transactions and dispositions of PSEG’s assets; (2) provide reasonable assurance that transactions are recorded as necessary to permit preparation of financial statements in accordance with generally accepted accounting principles, and that receipts and expenditures of PSEG are being made only in accordance with authorizations of PSEG’s management and directors; and (3) provide reasonable assurance regarding prevention or timely detection of unauthorized acquisition, use or disposition of PSEG’s assets that could have a material effect on the financial statements.
In connection with the preparation of PSEG’s annual financial statements, management of PSEG has undertaken an assessment, which includes the design and operational effectiveness of PSEG’s internal control over financial reporting based on criteria established in the Internal Control - Integrated Framework (2013) issued by the Committee of Sponsoring Organizations of the Treadway Commission, commonly referred to as “COSO”. The COSO framework is based upon five integrated components of control: control environment, risk assessment, control activities, information and communications and ongoing monitoring.
Because of its inherent limitations, internal control over financial reporting may not prevent or detect misstatements. Also, projection of any evaluation of effectiveness to future periods is subject to the risk that controls may become inadequate because of changes in conditions, or that the degree of compliance with the policies or procedures may deteriorate.
Based on the assessment performed, management has concluded that PSEG’s internal control over financial reporting is effective and provides reasonable assurance regarding the reliability of PSEG’s financial reporting and the preparation of its financial statements as of December 31, 20162018 in accordance with generally accepted accounting principles. Further, management has not identified any material weaknesses in internal control over financial reporting as of December 31, 2016.2018.
PSEG’s external auditors, Deloitte & Touche LLP, have audited PSEG’s financial statements for the year ended December 31, 20162018 included in this annual report on Form 10-K and, as part of that audit, have issued a report on the effectiveness of PSEG’s internal control over financial reporting, a copy of which is included in this annual report on Form 10-K.
|
| |
| | |
/s/ RALPH IZZO | |
| Chief Executive Officer | |
| | |
/s/ DANIEL J. CREGG | |
| Chief Financial Officer | |
February 27, 20172019 | |
MANAGEMENT REPORT ON INTERNAL CONTROL OVER
FINANCIAL REPORTING—PSE&G
Management of Public Service Electric and Gas Company (PSE&G) is responsible for establishing and maintaining effective internal control over financial reporting and for the assessment of the effectiveness of internal control over financial reporting. As defined by the SEC in Rules 13a-15(f) and 15d-15(f) under the Securities Exchange Act of 1934, internal control over financial reporting is a process designed by, or under the supervision of, the company’s principal executive and principal financial officers, or persons performing similar functions, and implemented by the company’s management and other personnel, with oversight by the Audit Committee of the Board of Directors of its parent, Public Service Enterprise Group Incorporated, to provide reasonable assurance regarding the reliability of financial reporting and the preparation of financial statements for external purposes in accordance with accounting principles generally accepted in the United States of America (generally accepted accounting principles).
PSE&G’s internal control over financial reporting includes those policies and procedures that (1) pertain to the maintenance of records that, in reasonable detail, accurately and fairly reflect the transactions and dispositions of PSE&G’s assets; (2) provide reasonable assurance that transactions are recorded as necessary to permit preparation of financial statements in accordance with generally accepted accounting principles, and that receipts and expenditures of PSE&G are being made only in accordance with authorizations of PSE&G’s management and directors; and (3) provide reasonable assurance regarding prevention or timely detection of unauthorized acquisition, use or disposition of PSE&G’s assets that could have a material effect on the financial statements.
In connection with the preparation of PSE&G’s annual financial statements, management of PSE&G has undertaken an assessment, which includes the design and operational effectiveness of PSE&G’s internal control over financial reporting based on criteria established in the Internal Control - Integrated Framework (2013) issued by the Committee of Sponsoring Organizations of the Treadway Commission, commonly referred to as “COSO”. The COSO framework is based upon five integrated components of control: control environment, risk assessment, control activities, information and communications and ongoing monitoring.
Because of its inherent limitations, internal control over financial reporting may not prevent or detect misstatements. Also, projection of any evaluation of effectiveness to future periods is subject to the risk that controls may become inadequate because of changes in conditions, or that the degree of compliance with the policies or procedures may deteriorate.
Based on the assessment performed, management has concluded that PSE&G’s internal control over financial reporting is effective and provides reasonable assurance regarding the reliability of PSE&G’s financial reporting and the preparation of its financial statements as of December 31, 20162018 in accordance with generally accepted accounting principles. Further, management has not identified any material weaknesses in internal control over financial reporting as of December 31, 2016.2018.
|
| |
| | |
/s/ RALPH IZZO | |
| Chief Executive Officer | |
| | |
/s/ DANIEL J. CREGG | |
| Chief Financial Officer | |
February 27, 20172019 | |
MANAGEMENT REPORT ON INTERNAL CONTROL OVER
FINANCIAL REPORTING—Power
Management of PSEG Power LLC (Power) is responsible for establishing and maintaining effective internal control over financial reporting and for the assessment of the effectiveness of internal control over financial reporting. As defined by the SEC in Rules 13a-15(f) and 15d-15(f) under the Securities Exchange Act of 1934, internal control over financial reporting is a process designed by, or under the supervision of, the company’s principal executive and principal financial officers, or persons performing similar functions, and implemented by the company’s management and other personnel, with oversight by the Audit Committee of the Board of Directors of its parent, Public Service Enterprise Group Incorporated, to provide reasonable assurance regarding the reliability of financial reporting and the preparation of financial statements for external purposes in accordance with accounting principles generally accepted in the United States of America (generally accepted accounting principles).
Power’s internal control over financial reporting includes those policies and procedures that (1) pertain to the maintenance of records that, in reasonable detail, accurately and fairly reflect the transactions and dispositions of Power’s assets; (2) provide reasonable assurance that transactions are recorded as necessary to permit preparation of financial statements in accordance with generally accepted accounting principles, and that receipts and expenditures of Power are being made only in accordance with authorizations of Power’s management and directors; and (3) provide reasonable assurance regarding prevention or timely detection of unauthorized acquisition, use or disposition of Power’s assets that could have a material effect on the financial statements.
In connection with the preparation of Power’s annual financial statements, management of Power has undertaken an assessment, which includes the design and operational effectiveness of Power’s internal control over financial reporting based on criteria established in the Internal Control - Integrated Framework (2013) issued by the Committee of Sponsoring Organizations of the Treadway Commission, commonly referred to as “COSO”. The COSO framework is based upon five integrated components of control: control environment, risk assessment, control activities, information and communications and ongoing monitoring.
Because of its inherent limitations, internal control over financial reporting may not prevent or detect misstatements. Also, projection of any evaluation of effectiveness to future periods is subject to the risk that controls may become inadequate because of changes in conditions, or that the degree of compliance with the policies or procedures may deteriorate.
Based on the assessment performed, management has concluded that Power’s internal control over financial reporting is effective and provides reasonable assurance regarding the reliability of Power’s financial reporting and the preparation of its financial statements as of December 31, 20162018 in accordance with generally accepted accounting principles. Further, management has not identified any material weaknesses in internal control over financial reporting as of December 31, 2016.2018.
|
| |
| | |
/s/ RALPH IZZO | |
| Chief Executive Officer | |
| | |
/s/ DANIEL J. CREGG | |
| Chief Financial Officer | |
February 27, 20172019 | |
REPORT OF INDEPENDENT REGISTERED PUBLIC ACCOUNTING FIRM
To the Board of Directors and Stockholders of
Public Service Enterprise Group Incorporated
Newark, New Jersey
Opinion on Internal Control over Financial Reporting
We have audited the internal control over financial reporting of Public Service Enterprise Group Incorporated and subsidiaries (the “Company”) as of December 31, 2016,2018, based on criteria established in Internal Control - Integrated Framework(2013) issued by the Committee of Sponsoring Organizations of the Treadway Commission. Commission (“COSO”). In our opinion, the Company maintained, in all material respects, effective internal control over financial reporting as of December 31, 2018, based on criteria established in Internal Control Integrated Framework (2013) issued by COSO.
We have also auditedin accordance with the standards of the Public Company Accounting Oversight Board (United States) (“PCAOB”), the consolidated financial statements and the consolidated financial statement schedule listed in the Index at Item 15(B)(a) as of and for the year ended December 31, 2018 of the Company, and our report dated February 27, 2019, expressed an unqualified opinion on those financial statements.
Basis for Opinion
The Company’s management is responsible for maintaining effective internal control over financial reporting and for its assessment of the effectiveness of internal control over financial reporting, included in the accompanying Management Report on Internal Control Over Financial Reporting - PSEG. Our responsibility is to express an opinion on the Company’s internal control over financial reporting based on our audit. We are a public accounting firm registered with the PCAOB and are required to be independent with respect to the Company in accordance with the U.S. federal securities laws and the applicable rules and regulations of the Securities and Exchange Commission and the PCAOB.
We conducted our audit in accordance with the standards of the Public Company Accounting Oversight Board (United States). PCAOB.Those standards require that we plan and perform the audit to obtain reasonable assurance about whether effective internal control over financial reporting was maintained in all material respects. Our audit included obtaining an understanding of internal control over financial reporting, assessing the risk that a material weakness exists, testing and evaluating the design and operating effectiveness of internal control based on the assessed risk, and performing such other procedures as we considered necessary in the circumstances. We believe that our audit provides a reasonable basis for our opinion.
Definition and Limitations of Internal Control over Financial Reporting
A company’s internal control over financial reporting is a process designed by, or under the supervision of, the company’s principal executive and principal financial officers, or persons performing similar functions, and effected by the company’s board of directors, management, and other personnel to provide reasonable assurance regarding the reliability of financial reporting and the preparation of financial statements for external purposes in accordance with generally accepted accounting principles. A company’s internal control over financial reporting includes those policies and procedures that (1) pertain to the maintenance of records that, in reasonable detail, accurately and fairly reflect the transactions and dispositions of the assets of the company; (2) provide reasonable assurance that transactions are recorded as necessary to permit preparation of financial statements in accordance with generally accepted accounting principles, and that receipts and expenditures of the company are being made only in accordance with authorizations of management and directors of the company; and (3) provide reasonable assurance regarding prevention or timely detection of unauthorized acquisition, use, or disposition of the company’s assets that could have a material effect on the financial statements.
Because of theits inherent limitations, of internal control over financial reporting including the possibility of collusion or improper management override of controls, material misstatements due to error or fraud may not be preventedprevent or detected on a timely basis.detect misstatements. Also, projections of any evaluation of the effectiveness of the internal control over financial reporting to future periods are subject to the risk that the controls may become inadequate because of changes in conditions, or that the degree of compliance with the policies or procedures may deteriorate.
In our opinion, the Company maintained, in all material respects, effective internal control over financial reporting as of December 31, 2016, based on the criteria established in Internal Control - Integrated Framework (2013) issued by the Committee of Sponsoring Organizations of the Treadway Commission.
We have also audited, in accordance with the standards of the Public Company Accounting Oversight Board (United States), the consolidated financial statements and consolidated financial statement schedule listed in the Index at Item 15 (B)(a) as of and for the year ended December 31, 2016 of the Company and our report dated February 27, 2017 expressed an unqualified opinion on those consolidated financial statements and the consolidated financial statement schedule.
/s/ DELOITTEDELOITTE & TOUCHETOUCHE LLP
Parsippany, New Jersey
February 27, 20172019
PART III
ITEM 10. DIRECTORS, EXECUTIVE OFFICERS AND CORPORATE
GOVERNANCE
Executive Officers
PSEG
The information required by Item 10 of Form 10-K with respect to executive officers is set forth in Part I. Executive Officers of the Registrant (PSEG).
PSE&G and Power
Omitted pursuant to conditions set forth in General Instruction I of Form 10-K.
Directors
PSEG
The information required by Item 10 of Form 10-K with respect to (i) present directors of PSEG who are nominees for election as directors at PSEG’s 20172019 Annual Meeting of Stockholders, (ii) the director nomination process, and (iii) the composition of the Audit Committee of the Board, is set forth under the headings “Nominees and Election-Board Composition and Individual Qualifications,Election-Biographical Information of Director Nominees,” “Nominees and Election-Nomination Process,Election,” and “Corporate Governance-Board Committee Responsibilities-Audit Committee,” respectively, in PSEG’s definitive Proxy Statement for such Annual Meeting of Stockholders, which definitive Proxy Statement is expected to be filed with the U.S. Securities and Exchange Commission (SEC) on or about March 14, 201712, 2019 and which information set forth under said heading is incorporated herein by this reference thereto.
PSE&G and Power
Omitted pursuant to conditions set forth in General Instruction I of Form 10-K.
CodeStandards of EthicsConduct
Our Standards of IntegrityConduct (Standards) is a code of ethics applicable to us and our subsidiaries. The Standards are an integral part of our business conduct compliance program and embody our commitment to conduct operations in accordance with the highest legal and ethical standards. The Standards apply to all of our directors and employees (including PSE&G’s, Power’s, Energy Holdings’ and Services’ respective principal executive officer, principal financial officer, principal accounting officer or Controller and persons performing similar functions). Each such person is responsible for understanding and complying with the Standards. The Standards are posted on our website, www.pseg.com/info/investors/governance/document.jsphttp://corporate.pseg.com/aboutpseg/leadershipandgovernance/standardsofintegrity. We will send you a copy on request.
The Standards establish a set of common expectations for behavior to which each employee must adhere in dealings with investors, customers, fellow employees, competitors, vendors, government officials, the media and all others who may associate their words and actions with us. The Standards have been developed to provide reasonable assurance that, in conducting our business, employees behave ethically and in accordance with the law and do not take advantage of investors, regulators or customers through manipulation, abuse of confidential information or misrepresentation of material facts.
We will post on our website, www.pseg.com/info/investors/governance/document.jsp:http://corporate.pseg.com/aboutpseg/leadershipandgovernance/standardsofintegrity:
Any amendment (other than one that is technical, administrative or non-substantive) that we adopt to our Standards; and
Any grant by us of a waiver from the Standards that applies to any director principalor executive officer principal financial officer, principal accounting officer or Controller, or persons performing similar functions, for us or our direct subsidiaries noted above, and that relates to any element enumerated by the SEC.
In 2016,2018, we did not grant any waivers to the Standards.
Section 16(a) Beneficial Ownership Reporting Compliance
PSEG
The information required by Item 10 of Form 10-K with respect to compliance with Section 16(a) of the Securities Exchange Act of 1934, as amended, is set forth under the heading “Section 16(a) Beneficial Ownership Reporting Compliance,” in
PSEG’s definitive Proxy Statement for the 20172019 Annual Meeting of Stockholders, which definitive Proxy Statement is expected to be filed with the SEC on or about March 14, 201712, 2019 and which information set forth under said heading is incorporated herein by this reference thereto.
Power and PSE&G
Omitted pursuant to conditions set forth in General Instruction I of Form 10-K.
ITEM 11. EXECUTIVE COMPENSATION
PSEG
The information required by Item 11 of Form 10-K is set forth in PSEG’s definitive Proxy Statement for the 20172019 Annual Meeting of Stockholders which definitive Proxy Statement is expected to be filed with the SEC on or about March 14, 201712, 2019 and such information set forth under such heading is incorporated herein by this reference thereto.
Power and PSE&G
Omitted pursuant to conditions set forth in General Instruction I of Form 10-K.
ITEM 12. SECURITY OWNERSHIP OF CERTAIN BENEFICIAL OWNERS AND
MANAGEMENT AND RELATED STOCKHOLDERS MATTERS
PSEG
The information required by Item 12 of Form 10-K with respect to directors, executive officers and certain beneficial owners is set forth under the heading “Security Ownership of Directors, Management and Certain Beneficial Owners” in PSEG’s definitive Proxy Statement for the 20172019 Annual Meeting of Stockholders which definitive Proxy Statement is expected to be filed with the SEC on or about March 14, 201712, 2019 and such information set forth under such heading is incorporated herein by this reference thereto.
For information relating to securities authorized for issuance under equity compensation plans, see Item 5. Market for Registrant’s Common Equity, Related Stockholder Matters and Issuer Purchases of Equity Securities.
Power and PSE&G
Omitted pursuant to conditions set forth in General Instruction I of Form 10-K.
ITEM 13. CERTAIN RELATIONSHIPS AND RELATED TRANSACTIONS, AND
DIRECTOR INDEPENDENCE
PSEG
The information required by Item 13 of Form 10-K is set forth under the heading “Corporate Governance—Transactions with Related Persons” in PSEG’s definitive Proxy Statement for the 20172019 Annual Meeting of Stockholders which definitive Proxy Statement is expected to be filed with the SEC on or about March 14, 201712, 2019 and such information set forth under such heading is incorporated herein by this reference thereto.
Power and PSE&G
Omitted pursuant to conditions set forth in General Instruction I of Form 10K.
ITEM 14. PRINCIPAL ACCOUNTING FEES AND SERVICES
The information required by Item 14 of Form 10-K is set forth under the heading “Fees Billed by Deloitte & Touche LLP for 20162018 and 2015”2017” in PSEG’s definitive Proxy Statement for the 20172019 Annual Meeting of Stockholders which definitive Proxy Statement is expected to be filed with the SEC on or about March 14, 2017.12, 2019. Such information set forth under such heading is incorporated herein by this reference hereto.
PART IV
ITEM 15. EXHIBITS, FINANCIAL STATEMENT SCHEDULES
(A) The following Financial Statements are filed as a part of this report:
| |
| a. | Public Service Enterprise Group Incorporated’s Consolidated Balance Sheets as of December 31, 20162018 and 20152017 and the related Consolidated Statements of Operations, Comprehensive Income, Cash Flows and Stockholders’ Equity for the three years ended December 31, 20162018 on pages 7875 through 83.80. |
| |
| b. | Public Service Electric and Gas Company’s Consolidated Balance Sheets as of December 31, 20162018 and 20152017 and the related Consolidated Statements of Operations, Comprehensive Income, Cash Flows and Common Stockholder’s Equity for the three years ended December 31, 20162018 on pages 8481 through 89.86. |
| |
| c. | PSEG Power LLC’s Consolidated Balance Sheets as of December 31, 20162018 and 20152017 and the related Consolidated Statements of Operations, Comprehensive Income, Cash Flows and Capitalization and Member’s Equity for the three years ended December 31, 20162018 on pages 9087 through 95.92. |
(B) The following documents are filed as a part of this report:
| |
| a. | PSEG’s Financial Statement Schedules: |
Schedule II—Valuation and Qualifying Accounts for each of the three years in the period ended December 31, 20162018 (page 192)194).
| |
| b. | PSE&G’s Financial Statement Schedules: |
Schedule II—Valuation and Qualifying Accounts for each of the three years in the period ended December 31, 20162018 (page 192)194).
| |
| c. | Power’s Financial Statement Schedules: |
Schedule II—Valuation and Qualifying Accounts for each of the three years in the period ended December 31, 20162018 (page 192)194).
Schedules other than those listed above are omitted for the reason that they are not required or are not applicable, or the required information is shown in the consolidated financial statements or notes thereto.
(C) The following documents are filed as part of this report:
| LIST OF EXHIBITS: |
| | |
| a. | | PSEG: |
| | |
| | |
| | |
| | |
Table of Contents
LIST OF EXHIBITS: | | | | 4a | | | | | | | | | 10a(2) | | Retirement Income Reinstatement Plan for Non-Represented Employees as amended May 31, 2011(8)
| 10a(3) | | Employment Agreement with William Levis dated December 8, 2006(9)
| 10a(4) | | Amended and Restated 2007 Equity Compensation Plan for Outside Directors, effective July 19, 2011(10)
| 10a(5) | | Deferred Compensation Plan for Directors, amended July 19, 2011(11)
| 10a(6) | | Deferred Compensation Plan for Certain Employees, amended November 1, 2011(12)
| 10a(7) | | 1989 Long-Term Incentive Plan, as amended(13)
| 10a(8) | | 2001 Long-Term Incentive Plan(14)
| 10a(9) | | Senior Management Incentive Compensation Plan(15)
| 10a(10) | | Key Executive Severance Plan of Public Service Enterprise Group Incorporated, Amended effective February 20,10, 2017 | 10a(11) | | Severance Agreement with Ralph Izzo dated December 16, 2008(16)
| 10a(12) | | Stock Plan for Outside Directors, as amended(17)
| 10a(13) | | Compensation Plan for Outside Directors(18)
| 10a(14) | | 2004 Long-Term Incentive Plan, amended and restated as of April 16, 2013(19)
| 10a(15) | | Form of Agreement for Advancement of Expenses with Outside Directors(20)
| 10a(16) | | Equity Deferral Plan, effective November 1, 2011, amended December 9, 2011(21)
| 10a(17) | | Amendment to Employment Agreement with William Levis, dated September 19, 2011(22)
| 10a(18) | | Agreement with Tamara L. Linde dated June 18, 2014(23)
| 10a(19) | | Agreement with Daniel J. Cregg dated September 22, 2015(24)
| 10a(20) | | Clawback Practice, effective December 15, 2015(25)
| 12 | | Computation of Ratios of Earnings to Fixed Charges | 21 | | Subsidiaries of the Registrant | 23 | | Consent of Independent Registered Public Accounting Firm | 31 | | Certification by Ralph Izzo, pursuant to Rules 13a-14 and 15d-14 of the Securities Exchange Act of 1934 (1934 Act) | 31a | | Certification by Daniel J. Cregg, pursuant to Rules 13a-14 and 15d-14 of the 1934 Act | 32 | | Certification by Ralph Izzo, pursuant to Section 1350 of Chapter 63 of Title 18 of the U.S. Code | 32a | | Certification by Daniel J. Cregg, pursuant to Section 1350 of Chapter 63 of Title 18 of the U.S. Code | 101.INS | | XBRL Instance Document | 101.SCH | | XBRL Taxonomy Extension Schema | 101.CAL | | XBRL Taxonomy Calculation Linkbase | 101.LAB | | XBRL Taxonomy Extension Labels Linkbase | 101.PRE | | XBRL Taxonomy Extension Presentation Linkbase | 101.DEF | | XBRL Taxonomy Extension Definition Document | b. | | Power: | 3a | | Certificate of Formation of PSEG Power LLC(26)
| 3b | | PSEG Power LLC Limited Liability Company Agreement(27)
| 4a | | Indenture dated April 16, 2001 between and among PSEG Power, PSEG Fossil, PSEG Nuclear, PSEG Energy Resources & Trade and The Bank of New York Mellon and form of Subsidiary Guaranty included therein(28)
| 4b | | First Supplemental Indenture, supplemental to Exhibit 4a, dated as of March 13, 2002(29)
| 10a(1) | | Supplemental Executive Retirement Income Plan, effective as of May 31, 2011(7)
|
| LIST OF EXHIBITS: | | | | | | | | | | | | | | | | 10a(5) | | | 10a(6) | | | 10a(7) | | | 10a(8) |
| | 10a(9) | | | 10a(10) | | | | | | | | | 10a(11) | | | | | | 10a(12) | | Amendment to Employment Agreement with William Levis, dated September 19, 2011(22)
| 10a(13) | | | 10a(14) | | | 10a(15) | | | 12a | | Computation of Ratio of Earnings to Fixed Charges | 23a | | | | | | | | | 31b | | | 31c | | | 32b | | | 32c | | | | 101.INS | | XBRL Instance Document | | 101.SCH | | XBRL Taxonomy Extension Schema | | 101.CAL | | XBRL Taxonomy Calculation Linkbase | | 101.LAB | | XBRL Taxonomy Extension Labels Linkbase | | 101.PRE | | XBRL Taxonomy Extension Presentation Linkbase | | 101.DEF | | XBRL Taxonomy Extension Definition Document | cb.
| | PSE&G | | | | | | | | | | | | | | | | | | |
| LIST OF EXHIBITS: | | | | | 4a(1) | | Indenture between PSE&G and Fidelity Union Trust Company (now, Wachovia Bank, National Association), as Trustee, dated August 1, 1924(36)(27), securing First and Refunding Mortgage Bond and Supplemental Indentures between PSE&G and U.S. Bank National Association, successor, as Trustee, supplemental to Exhibit 4a(1), dated as follows: | | 4a(2) | | June 1, 1937(37)(28) | | 4a(3) | | July 1, 1937(38)(29) | | 4a(4) | | March 1, 1942(39)
| 4a(5) | | June 1, 1991 (No. 1)(40)(30) |
LIST OF EXHIBITS: | | | | 4a(6)4a(5) | | July 1, 1993(41)(31) | 4a(7) | | | 4a(8) | | | 4a(9) | | | 4a(10) | | | 4a(11) | | | 4a(12) | | | 4a(13) | | | 4a(14) | | | | | | | 4b | | Indenture of Trust between PSE&G and Chase Manhattan Bank (National Association) (The Bank of New York Mellon, successor), as Trustee, providing for Secured Medium-Term Notes dated July 1, 1993(49)(41) | | | | | | | | | | | | | | | | | | | | | | | | | | | | | | | | | | | | | | | | | | | | | | | | | | | | | | | | | | 12b | | Computation of Ratios of Earnings to Fixed Charges Plus Preferred Stock Dividend Requirements | 23b | | | 31d | | | 31e | | | 32d | | | 32e | | |
| LIST OF EXHIBITS: | | | | | 101.INS | | XBRL Instance Document | | 101.SCH | | XBRL Taxonomy Extension Schema | | 101.CAL | | XBRL Taxonomy Calculation Linkbase | | 101.LAB | | XBRL Taxonomy Extension Labels Linkbase | | 101.PRE | | XBRL Taxonomy Extension Presentation Linkbase | | 101.DEF | | XBRL Taxonomy Extension Definition Document | | c. | | Power: | | | | | | | | | | | | | | | | | | | | | | | | | | | | | | | | | | | | | | | | | | | | | | | | | | | | | | | | | | | | | | | | | | | | | | | 101.INS | | XBRL Instance Document | | 101.SCH | | XBRL Taxonomy Extension Schema | | 101.CAL | | XBRL Taxonomy Calculation Linkbase | | 101.LAB | | XBRL Taxonomy Extension Labels Linkbase | | 101.PRE | | XBRL Taxonomy Extension Presentation Linkbase | | 101.DEF | | XBRL Taxonomy Extension Definition Document |
| | | (1) | Filed as Exhibit 3.1a with Quarterly Report on Form 10-Q for the quarter ended March 31, 2007, File No. 001-09120, on May 4, 2007 and incorporated herein by this reference. |
| | | (2) | Filed as Exhibit 3.1b with Quarterly Report on Form 10-Q for the quarter ended March 31, 2007, File No. 001-09120, on May 4, 2007 and incorporated herein by this reference. |
| | | (3) | Filed as Exhibit 3.1c with Quarterly Report on Form 10-Q for the quarter ended March 31, 2007, File No. 001-09120, on May 4, 2007 and incorporated herein by this reference. |
| | | (4) | Filed as Exhibit 99.1 with Current Report on Form 8-K, File No. 001-09120, on December 16, 2015 and incorporated herein by this reference. |
| | | (5) | Filed as Exhibit 4(f) with Quarterly Report on Form 10-Q for the quarter ended March 31, 1998, File No. 001-09120, on May 13, 1998 and incorporated herein by this reference. |
| | | (6) | Filed as Exhibit 4(f) to the Annual Report on Form 10-K for the year ended December 31, 1998, File No. 001-09120, on February 23, 1999 and incorporated herein by this reference |
| | | (7) | Filed as Exhibit 10.1 with Quarterly Report on Form 10-Q for the quarter ended SeptemberJune 30, 2011,2017, File No. 001-09120, on November 1, 2011July 28, 2017 and incorporated herein by this reference. |
| | | (8) | Filed as Exhibit 10.2 with Quarterly Report on Form 10-Q for the quarter ended SeptemberJune 30, 2011,2017, File No. 001-09120, on November 1, 2011July 28, 2017 and incorporated herein by this reference. |
| | | (9) | Filed as Exhibit 10a (4) with Annual Report on Form 10-K for the year ended December 31, 2007, File Nos. 001-09120 on February 28, 2008 and 000-49614, and incorporated herein by reference. |
| | (10) | Filed as Exhibit 10.5 with Quarterly Report on Form 10-Q for the quarter ended September 30, 2011, File No. 001-09120, on November 1, 2011 and incorporated herein by this reference. |
| | (11) | Filed as Exhibit 10.6 with Quarterly Report on Form 10-Q for the quarter ended September 30, 2011, File No. 001-09120, on November 1, 2011 and incorporated herein by this reference. |
| | (12) | Filed as Exhibit 10a(7) with Annual Report on Form 10-K for the quarter ended December 31, 2011, File No. 001-09120, on February 27, 2012 and incorporated herein by this reference. |
| | (13) | Filed as Exhibit 10 with Quarterly Report on Form 10-Q for the quarter ended September 30, 2002, File No. 001-09120, on November 4, 2002 and incorporated herein by this reference. |
| | (14)(10) | Filed as Exhibit 10a(7) with Annual Report on Form 10-K for the year ended December 31, 2000, File No. 001-09120, on March 6, 2001 and incorporated herein by this reference. |
| | (15)(11) | Filed as Exhibit 10a(11) with Annual Report on Form 10-K for the year ended December 31, 2008, File No. 001-09120, on February 26, 2009 and incorporated herein by this reference. |
| | (16)(12) | Filed as Exhibit 99 with Current Report on Form 8-K, File Nos. 001-09120, 000-49614 and 001-00973, on December 22, 2008 and incorporated herein by this reference. |
| | (17)(13) | Filed as Exhibit 10a(17) with Annual Report on Form 10-K for the year ended December 31, 2002, File No. 001-09120, on February 26, 2003 and incorporated herein by this reference. |
| | (18)(14) | Filed as Exhibit 10a(20) with Annual Report on Form 10-K for the year ended December 31, 2002, File No. 001-09120, on February 26, 2003 and incorporated herein by this reference. |
| | (19)(15) | Filed as Exhibit 10 with Quarterly Report on Form 10-Q for the quarter ended March 31, 2013, File No. 001-09120, on May 1, 2013 and incorporated herein by this reference. |
| | (20)(16) | Filed as Exhibit 10.1 with Current Report on Form 8-K, File No. 001-09120, on February 19, 2009 and incorporated herein by this reference. |
| | (21) | Filed as Exhibit 10a(19) with Annual Report on Form 10-K for the year ended December 31, 2011, File No. 001-09120, on February 27, 2012. |
| | (22) | Filed as Exhibit 10 with Quarterly Report on Form 10-Q for the quarter ended September 30, 2011, File No. 001-09120, on November 1, 2011 and incorporated herein by reference. |
| | (23)(17) | Filed as Exhibit 10a with Annual Report on Form 10-K for the year ended December 31, 2014, File No. 001-09120, on February 26, 2015.2015, and incorporated herein by this reference. |
| | (24)(18) | Filed as Exhibit 10 with Quarterly Report on Form 10-Q for the quarter ended September 30, 2015, File No. 001-09120, on October 30, 2015.2015, and incorporated herein by this reference. |
| | (25)(19) | Filed as Exhibit 10a(20) with Annual Report on Form 10-K for the year ended December 31, 2015,2017, File No. 001-09120 on February 26, 20162018 and incorporated herein by this reference. |
| | (26)(20) | Filed as Exhibit 3.1 to Registration Statement10a(21) with Annual Report on Form S-4,10-K for the year ended December 31, 2017, File No. 333-69228, filed001-09120 on September 10, 2001February 26, 2018 and incorporated herein by this reference. |
| | (27) | Filed as Exhibit 3.2 to Registration Statement on Form S-4, No. 333-69228, filed on September 10, 2001 and incorporated herein by this reference. |
| | (28) | Filed as Exhibit 4.1 to Registration Statement on Form S-4, No. 333-69228, filed on September 10, 2001 and incorporated herein by this reference. |
| | (29) | Filed as Exhibit 4.7 with Quarterly Report on Form 10-Q for the quarter ended March 31, 2002, File No. 000-49614, on May 15, 2002 and incorporated herein by this reference. |
| | (30)(21) | Filed as Exhibit 3(a) with Quarterly Report on Form 10-Q for the quarter ended June 30, 1986, File No. 001-00973, on August 28, 1986 and incorporated herein by this reference. |
| | (31)(22) | Filed as Exhibit 3a(2) with Annual Report on Form 10-K for the year ended December 31, 1987, File No. 001-00973, on March 28, 1988 and incorporated herein by this reference. |
| | (32)(23) | Filed as Exhibit 3a(3) on Form 8-A, File No. 001-00973, on February 4, 1994 and incorporated herein by this reference. |
| | (33)(24) | Filed as Exhibit 3a(4) on Form 8-A, File No. 001-00973, on February 4, 1994 and incorporated herein by this reference. |
| | (34)(25) | Filed as Exhibit 3a(5) on Form 8-A, File No. 001-00973, on February 4, 1994 and incorporated herein by this reference. |
| | (35)(26) | Filed as Exhibit 3.3 with Quarterly Report on Form 10-Q for the quarter ended March 31, 2007, File No. 001-00973, on May 4, 2007 and incorporated herein by this reference. |
| | (36)(27) | Filed as Exhibit 4b(1) with Annual Report on Form 10-K for the year ended December 31, 1980, File No. 001-00973, on February 18, 1981 and incorporated herein by this reference. |
| | (37)(28) | Filed as Exhibit 4b(3) with Annual Report on Form 10-K for the year ended December 31, 1980, File No. 001-00973, on February 18, 1981 and incorporated herein by this reference. |
| | (38)(29) | Filed as Exhibit 4b(4) with Annual Report on Form 10-K for the year ended December 31, 1980, File No. 001-00973, on February 18, 1981 and incorporated herein by this reference. |
| | (39)(30) | Filed as Exhibit 4b(6) with Annual Report on Form 10-K for the year ended December 31, 1980, File No. 001-00973, on February 18, 1981 and incorporated herein by this reference. |
| | (40) | Filed as Exhibit 44(i) on Form 8-A, File No. 001-00973, on June 1, 1991 and incorporated herein by this reference. |
| | (41)(31) | Filed as Exhibit 4(i)4(ii) on Form 8-A, File No. 001-00973, on December 1,May 25, 1993 and incorporated herein by this reference. |
| | (42)(32) | Filed as Exhibit 4a(28) with Annual Report on Form 10-K for the year ended December 31, 2004, File No. 001-00973, on March 1, 2005 and incorporated herein by this reference. |
| | (43)(33) | Filed as Exhibit 4a(28) with Annual Report on Form 10-K for the year ended December 31, 2007, File No. 001-00973, on February 28, 2008 and incorporated herein by this reference. |
| | (44)(34) | Filed as Exhibit 4a(30) with Annual Report on Form 10-K for the year ended December 31, 2009, File No. 001-00973, on February 25, 2010 and incorporated herein by this reference. |
| | | (35) | Filed as Exhibit 4a(32) with Annual Report on Form 10-K for the year ended December 31, 2012, File No. 001-00973, on February 26, 2013.2013, and incorporated herein by this reference. |
| | (45) | Filed as Exhibit 4a(33) with Annual Report on Form 10-K for the year ended December 31, 2012, File No. 001-00973, on February 26, 2013. |
| | (46)(36) | Filed as Exhibit 4 with Quarterly Report on Form 10-Q for the quarter ended June 30, 2013, File No. 001-00973, on July 30, 2013.2013, and incorporated herein by this reference. |
| | (47)(37) | Filed as Exhibit 4a(22) with Quarterly Report on Form 10-Q for the quarter ended September 30, 2014, File No. 001-09120, on October 30, 2014 and incorporated herein by this reference. |
| | (48)(38) | Filed as Exhibit 4a(23) with Quarterly Report on Form 10-Q for the quarter ended June 30, 2015, File No. 001-09120, on July 31, 2015 and incorporated herein by this reference. |
| | (49)(39) | Filed as Exhibit 4a(14) with Annual Report on Form 10-K for the year ended December 31, 2016, File No. 001-00973, on February 27, 2017 and incorporated herein by this reference. |
| | | (40) | Filed as Exhibit 4a(15) with Quarterly Report on Form 10-Q for the quarter ended March 31, 2018, File No. 001-00973, on April 30, 2018 and incorporated herein by this reference. |
| | | (41) | Filed as Exhibit 4 with Current Report on Form 8-K, File No. 001-00973, on December 1, 1993 and incorporated herein by this reference. |
| | (50)(42) | Filed as Exhibit 4.64-6 to Registration Statement on Form S-3, File No. 333-76020, filed on December 27, 2001 and incorporated herein by this reference. |
| | (51)(43) | Filed as Exhibit 10.2 with Current Report on Form 8-K, File No. 001-00973, on February 19, 2009 and incorporated herein by this reference. |
| | | (44) | Filed as Exhibit 3.1 to Registration Statement on Form S-4, No. 333-69228, filed on September��10, 2001 and incorporated herein by this reference. |
| | | (45) | Filed as Exhibit 3.2 to Registration Statement on Form S-4, No. 333-69228, filed on September 10, 2001 and incorporated herein by this reference. |
| | | (46) | Filed as Exhibit 4.1 to Registration Statement on Form S-4, No. 333-69228, filed on September 10, 2001 and incorporated herein by this reference. |
| | | (47) | Filed as Exhibit 4.7 with Quarterly Report on Form 10-Q for the quarter ended March 31, 2002, File No. 000-49614, on May 15, 2002 and incorporated herein by this reference. |
Schedule II—Valuation and Qualifying Accounts Years Ended December 31, 2016—2018—December 31, 20142016 PUBLIC SERVICE ENTERPRISE GROUP INCORPORATED | | | | | | | | | | | | | | | | | | | | | | | | | | | | | | | | | | | | | | | | | | | | Column A | | Column B | | Column C Additions | | Column D | | | | Column E | | | | Description | | Balance at Beginning of Period | | Charged to cost and expenses | | Charged to other accounts- describe | | Deductions- describe | | | | Balance at End of Period | | | | | | Millions | | | | 2016 | | | | | | | | | | | | | | | | Allowance for Doubtful Accounts | | $ | 67 |
| | $ | 85 |
| | $ | — |
| | $ | 84 |
| | (A) | | $ | 68 |
| | | | Materials and Supplies Valuation Reserve | | 11 |
| | 32 |
| | — |
| | 6 |
| | (B) | | 37 |
| | | | 2015 | | | | | | | | | | | | | | | | Allowance for Doubtful Accounts | | $ | 52 |
| | $ | 101 |
| | $ | — |
| | $ | 86 |
| | (A) | | $ | 67 |
| | | | Materials and Supplies Valuation Reserve | | 15 |
| | 2 |
| | — |
| | 6 |
| | (B) | | 11 |
| | | | 2014 | | | | | | | | | | | | | | | | Allowance for Doubtful Accounts | | $ | 56 |
| | $ | 86 |
| | $ | — |
| | $ | 90 |
| | (A) | | $ | 52 |
| | | | Materials and Supplies Valuation Reserve | | 8 |
| | 9 |
| | — |
| | 2 |
| | (B) | | 15 |
| | | | | | | | | | | | | | | | | |
| | | | | | | | | | | | | | | | | | | | | | | | | | | | | | | | | | | | | | | | | | | | Column A | | Column B | | Column C Additions | | Column D | | | | Column E | | | | Description | | Balance at Beginning of Period | | Charged to cost and expenses | | Charged to other accounts- describe | | Deductions- describe | | | | Balance at End of Period | | | | | | Millions | | | | 2018 | | | | | | | | | | | | | | | | Allowance for Doubtful Accounts | | $ | 59 |
| | $ | 91 |
| | $ | — |
| | $ | 87 |
| | (A) | | $ | 63 |
| | | | Materials and Supplies Valuation Reserve | | 7 |
| | 4 |
| | — |
| | 2 |
| | (B) | | 9 |
| | | | 2017 | | | | | | | | | | | | | | | | Allowance for Doubtful Accounts | | $ | 68 |
| | $ | 76 |
| | $ | — |
| | $ | 85 |
| | (A) | | $ | 59 |
| | | | Materials and Supplies Valuation Reserve | | 37 |
| | 2 |
| | — |
| | 32 |
| | (C) | | 7 |
| | | | 2016 | | | | | | | | | | | | | | | | Allowance for Doubtful Accounts | | $ | 67 |
| | $ | 85 |
| | $ | — |
| | $ | 84 |
| | (A) | | $ | 68 |
| | | | Materials and Supplies Valuation Reserve | | 11 |
| | 32 |
| | — |
| | 6 |
| | (B) | | 37 |
| | | | | | | | | | | | | | | | | |
| | | (A) | Accounts Receivable written off. |
| | | (B) | ReducedReduce reserve to appropriate level and to remove obsolete inventory. |
| | | (C) | Hudson and Mercer inventory written off. |
PUBLIC SERVICE ELECTRIC AND GAS COMPANY | | | | | | | | | | | | | | | | | | | | | | | | | | | | | | | | | | | | | | | | | | | | Column A | | Column B | | Column C Additions | | Column D | | | | Column E | | | | Description | | Balance at Beginning of Period | | Charged to cost and expenses | | Charged to other accounts- describe | | Deductions- describe | | | | Balance at End of Period | | | | | | Millions | | | | 2016 | | | | | | | | | | | | | | | | Allowance for Doubtful Accounts | | $ | 67 |
| | $ | 85 |
| | $ | — |
| | $ | 84 |
| | (A) | | $ | 68 |
| | | | Materials and Supplies Valuation Reserve | | 1 |
| | — |
| | — |
| | 1 |
| | (B) | | — |
| | | | 2015 | | | | | | | | | | | | | | | | Allowance for Doubtful Accounts | | $ | 52 |
| | $ | 101 |
| | $ | — |
| | $ | 86 |
| | (A) | | $ | 67 |
| | | | Materials and Supplies Valuation Reserve | | 2 |
| | — |
| | — |
| | 1 |
| | (B) | | 1 |
| | | | 2014 | | | | | | | | | | | | | | | | Allowance for Doubtful Accounts | | $ | 56 |
| | $ | 86 |
| | $ | — |
| | $ | 90 |
| | (A) | | $ | 52 |
| | | | Materials and Supplies Valuation Reserve | | — |
| | 2 |
| | — |
| | — |
| | | | 2 |
| | | | | | | | | | | | | | | | | |
| | | | | | | | | | | | | | | | | | | | | | | | | | | | | | | | | | | | | | | | | | | | Column A | | Column B | | Column C Additions | | Column D | | | | Column E | | | | Description | | Balance at Beginning of Period | | Charged to cost and expenses | | Charged to other accounts- describe | | Deductions- describe | | | | Balance at End of Period | | | | | | Millions | | | | 2018 | | | | | | | | | | | | | | | | Allowance for Doubtful Accounts | | $ | 59 |
| | $ | 91 |
| | $ | — |
| | $ | 87 |
| | (A) | | $ | 63 |
| | | | Materials and Supplies Valuation Reserve | | — |
| | 2 |
| | — |
| | — |
| | | | 2 |
| | | | 2017 | | | | | | | | | | | | | | | | Allowance for Doubtful Accounts | | $ | 68 |
| | $ | 76 |
| | $ | — |
| | $ | 85 |
| | (A) | | $ | 59 |
| | | | Materials and Supplies Valuation Reserve | | — |
| | — |
| | — |
| | — |
| | | | — |
| | | | 2016 | | | | | | | | | | | | | | | | Allowance for Doubtful Accounts | | $ | 67 |
| | $ | 85 |
| | $ | — |
| | $ | 84 |
| | (A) | | $ | 68 |
| | | | Materials and Supplies Valuation Reserve | | 1 |
| | — |
| | — |
| | 1 |
| | (B) | | — |
| | | | | | | | | | | | | | | | | |
| | | (A) | Accounts Receivable written off. |
| | | (B) | ReducedReduce reserve to appropriate level and to remove obsolete inventory. |
| | | | | | | | | | | | | | | | | | | | | | | | | | | | | | | | | | | | | | | | | | | | Column A | | Column B | | Column C Additions | | Column D | | | | Column E | | | | Description | | Balance at Beginning of Period | | Charged to cost and expenses | | Charged to other accounts- describe | | Deductions- describe | | | | Balance at End of Period | | | | | | | | | | Millions | | | | | | | | | | 2016 | | | | | | | | | | | | | | | | Materials and Supplies Valuation Reserve | | $ | 10 |
| | $ | 32 |
| | $ | — |
| | $ | 5 |
| | (A) | | $ | 37 |
| | | | 2015 | | | | | | | | | | | | | | | | Materials and Supplies Valuation Reserve | | $ | 13 |
| | $ | 2 |
| | $ | — |
| | $ | 5 |
| | (A) | | $ | 10 |
| | | | 2014 | | | | | | | | | | | | | | | | Materials and Supplies Valuation Reserve | | $ | 8 |
| | $ | 7 |
| | $ | — |
| | $ | 2 |
| | (A) | | $ | 13 |
| | | | | | | | | | | | | | | | | |
| | | | | | | | | | | | | | | | | | | | | | | | | | | | | | | | | | | | | | | | | | | | Column A | | Column B | | Column C Additions | | Column D | | | | Column E | | | | Description | | Balance at Beginning of Period | | Charged to cost and expenses | | Charged to other accounts- describe | | Deductions- describe | | | | Balance at End of Period | | | | | | | | | | Millions | | | | | | | | | | 2018 | | | | | | | | | | | | | | | | Materials and Supplies Valuation Reserve | | $ | 7 |
| | $ | 2 |
| | $ | — |
| | $ | 2 |
| | (A) | | $ | 7 |
| | | | 2017 | | | | | | | | | | | | | | | | Materials and Supplies Valuation Reserve | | $ | 37 |
| | $ | 2 |
| | $ | — |
| | $ | 32 |
| | (B) | | $ | 7 |
| | | | 2016 | | | | | | | | | | | | | | | | Materials and Supplies Valuation Reserve | | $ | 10 |
| | $ | 32 |
| | $ | — |
| | $ | 5 |
| | (A) | | $ | 37 |
| | | | | | | | | | | | | | | | | |
| | | (A) | ReducedReduce reserve to appropriate level and to remove obsolete inventory. |
GLOSSARY OF TERMS
When the following terms and abbreviations appear in the text of this report, they have the meanings indicated below:
Term Phrase/Description | | | | Base load(B) | | Minimum amount of electric power delivered or required over a given period of time at a constant rate, this is the level of demand that is seen as a minimum during a 24-hour day | BGS | | Basic Generation Service | | | PSE&G is required to provide BGS for all customers in New Jersey who are not supplied by a third-party supplier. | BGS-RSCP | | Basic Generation Service-Residential Small Commercial Product | | | Seasonally adjusted fixed prices charged for a three-year term for electric supply service to smaller industrialHudson and commercial customers and residential customers who are not supplied by a TPS | BGSS | | Basic Gas Supply Service | | | Mechanism approved by the BPU for NJ utilities to recover all commodity costs related to supplying gas to residential customers | BPU | | New Jersey Board of Public Utilities | | | Agency responsible for regulating public utilities doing business in New Jersey | Capacity | | Amount of electricity that can be produced by a specific generating facility | Combined Cycle | | A method of generation whereby electricity and process steam are produced from otherwise lost waste heat exiting from one or more combustion turbines. The exiting heat is routed to a conventional boiler or to a heat recovery steam generator for use by a steam turbine in the production of electricity | Congestion | | Condition when the available capacity of a transmission line is being closely approached (or exceeded) by the electric power trying to go through it; at such times, alternative power line pathways (or local generators near the load) must be used instead | Distribution | | The delivery of electricity to the retail customer’s home, business or industrial facility through low voltage distribution lines | EPA | | U.S. Environmental Protection Agency | FASB | | Financial Accounting Standards Board | | | A private, not-for-profit organization whose primary purpose, as designated by the SEC, is to develop accounting standards for public companies in the U.S. | FERC | | U.S. Federal Energy Regulatory Commission | Forward contracts | | A customized, non-exchange traded contract in which the buyer is obligated to deliver a specified amount of a commodity with a predetermined price formula on a specified future date, at which time payment is due in full | GAAP | | Generally Accepted Accounting Principles | | | Standard framework of guidelines issued by the FASB for financial accounting used in the U.S. | GHG | | Greenhouse gas emissions (including carbon dioxide, methane, nitrous oxide, ozone, and chlorofluorocarbon) that trap the heat of the sun in the Earth’s atmosphere, increasing the mean global surface temperature of the earth | Hedging | | Entering into a contract or transaction designed to reduce exposure to various risks, such as changes in market prices | ISO | | Independent System Operator | | | An independent, regulated entity established to manage a regional electric transmission system in a non-discriminatory manner and to help ensure the safety and reliability of the bulk of the power system | ITC | | Investment Tax Credit | | | A credit against income taxes, usually computed as a percent of the cost of investment in certain types of assetsMercer inventory written off. |
Term Phrase/Description | | | | Load | | Amount of electric power delivered or required at any specific point or points on a system. The requirement originates at the energy-consuming equipment of consumers. | MBR | | Market Based Rates | | | Electric service prices determined in an open market system of supply and demand under which the price is set solely by agreement as to what a buyer will pay and a seller will accept | MGP | | Manufactured Gas Plant | ISO-NE | | New England Power Pool | | | An ISO comprised of an alliance of approximately 100 utility companies who manage and direct all major energy production and transmission in the New England states | NJDEP | | New Jersey Department of Environmental Protection | NRC | | U.S. Nuclear Regulatory Commission | NUG | | Non-Utility Generation | | | Power produced by independent power producers, exempt wholesale generators and other companies that have been exempted from traditional utility regulation | OPEB | | Other Postretirement Benefits | | | Benefits other than pensions payable to former employees | Outage | | The period during which a generating unit, transmission line, or other facility is out of service due to scheduled (planned) or unscheduled maintenance | PJM | | PJM Interconnection, L.L.C. | | | A regional transmission organization that coordinates the movement of wholesale electricity in all or parts of 13 northeastern states and the District of Columbia | Power | | PSEG Power LLC | Power Pool | | An association of two or more interconnected electric systems having an agreement to coordinate operations and planning for improved reliability and efficiencies | PSE&G | | Public Service Electric and Gas Company | PSEG | | Public Service Enterprise Group Incorporated | Renewable Energy | | Energy derived from resources that are regenerative or that cannot be depleted (i.e. moving water (hydro, tidal and wave power), thermal gradients in ocean water, biomass, geothermal energy, solar energy, and wind energy) | Regulatory Asset | | Costs deferred by a regulated utility company in accordance with Accounting Standard Codification Topic 980: Regulated operations (ASC 980) | Regulatory Liability | | Costs recognized by a regulated utility company in accordance with ASC 980 | RPM | | Reliability Pricing Model (PJM market) | | | A process for pricing generation capacity based on overall system reliability requirements; using multi-year forward auctions, participants could bid capacity in the form of generation, demand response, or transmission to meet reliability needs by location and/or an ISO market | SBC | | Societal Benefits Charge | SEC | | U.S. Securities and Exchange Commission | Transmission | | The high-voltage wires and networks that move electricity through states and regions in large quantities - from power plants where it is produced, to the distribution networks that deliver it to homes and businesses |
SIGNATURES Pursuant to the requirements of Section 13 or 15(d) of the Securities Exchange Act of 1934, the registrant has duly caused this report to be signed on its behalf by the undersigned, thereunto duly authorized. The signature of the undersigned company shall be deemed to relate only to matters having reference to such company and any subsidiaries thereof. | | | | | | | | | | | | | | PUBLIC SERVICE ENTERPRISE GROUP INCORPORATED | | | | | | | | | By: | /s/ RALPH IZZO | | | | | Ralph Izzo | | | | | Chairman of the Board, President and | | | | | Chief Executive Officer |
Date: February 27, 20172019 Pursuant to the requirements of the Securities Exchange Act of 1934, this report has been signed below by the following persons on behalf of the registrant and in the capacities and on the dates indicated. The signatures of the undersigned shall be deemed to relate only to matters having reference to such company and any subsidiaries thereof. | | | | | | | | | | | | | Signature | | Title | | Date | | | | | /s/ RALPH IZZO | | Chairman of the Board, President, Chief Executive Officer and | | February 27, 20172019 | | Ralph Izzo | | Director (Principal Executive Officer) | | | | | | | /s/ DANIEL J. CREGG | | Executive Vice President and Chief Financial Officer | | February 27, 20172019 | | Daniel J. Cregg | | (Principal Financial Officer) | | | | | | | /s/ STUART J. BLACK | | Vice President and Controller | | February 27, 20172019 | | Stuart J. Black | | (Principal Accounting Officer) | | | | | | | /s/ WILLIE A. DEESE | | Director | | February 27, 20172019 | | Willie A. Deese | | | | | | | | | | | /s/ ALBERT R. GAMPER, JR. | | Director | | February 27, 2017 | Albert R. Gamper, Jr. | | | | | | | | /s/ WILLIAM V. HICKEY
| | Director | | February 27, 20172019 | | William V. Hickey | | | | | | | | | /s/ SHIRLEY ANN JACKSON | | Director | | February 27, 20172019 | | Shirley Ann Jackson | | | | | | | | | /s/ DAVID LILLEY | | Director | | February 27, 20172019 | | David Lilley | | | | | | | | | | /s/ BARRY H. OSTROWSKY | | Director | | February 27, 2019 | | Barry H. Ostrowsky | | | | | | | | | /s/ THOMAS A. RENYI | | Director | | February 27, 20172019 | | Thomas A. Renyi | | | | | | | | | /s/ HLAKAURA CHEOLA. SHINUGG | | Director | | February 27, 20172019 | Hak Cheol ShinLaura A. Sugg | | | | | | | | | /s/ RICHARD J. SWIFT | | Director | | February 27, 20172019 | | Richard J. Swift | | | | | | | | | | | /s/ SUSAN TOMASKY | | Director | | February 27, 20172019 | | Susan Tomasky | | | | | | | | | | | /s/ ALFRED W. ZOLLAR | | Director | | February 27, 20172019 | | Alfred W. Zollar | | | | | | | | | | |
SIGNATURES Pursuant to the requirements of Section 13 or 15(d) of the Securities Exchange Act of 1934, the registrant has duly caused this report to be signed on its behalf by the undersigned, thereunto duly authorized. The signature of the undersigned company shall be deemed to relate only to matters having reference to such company and any subsidiaries thereof. | | | | | | | | | | | | | | PUBLIC SERVICE ELECTRIC AND GAS COMPANY | | | | | | | | | By: | /s/ RALPH LAROSSA DAVID M. DALY | | | | | Ralph LaRossaDavid M. Daly | | | | | President and Chief Operating Officer |
Date: February 27, 20172019 Pursuant to the requirements of the Securities Exchange Act of 1934, this report has been signed below by the following persons on behalf of the registrant and in the capacities and on the dates indicated. The signatures of the undersigned shall be deemed to relate only to matters having reference to such company and any subsidiaries thereof. | | | | | | | | | | | | | Signature | | Title | | Date | | | | | /s/ RALPH IZZO | | Chairman of the Board and Chief Executive Officer and | | February 27, 20172019 | | Ralph Izzo | | Director (Principal Executive Officer) | | | | | | | /s/ DANIEL J. CREGG | | Executive Vice President and Chief Financial Officer | | February 27, 20172019 | | Daniel J. Cregg | | (Principal Financial Officer) | | | | | | | /s/ STUART J. BLACK | | Vice President and Controller | | February 27, 20172019 | | Stuart J. Black | | (Principal Accounting Officer) | | | | | | | /s/ AWLBERTILLIAM R. GV. HAMPER, JR.ICKEY | | Director | | February 27, 20172019 | Albert R. Gamper Jr.William V. Hickey | | | | | | | | | | /s/ SHIRLEY ANN JACKSON | | Director | | February 27, 20172019 | | Shirley Ann Jackson | | | | | | | | | | | /s/ RICHARD J. SWIFT | | Director | | February 27, 20172019 | | Richard J. Swift | | | | |
SIGNATURES Pursuant to the requirements of Section 13 or 15(d) of the Securities Exchange Act of 1934, the registrant has duly caused this report to be signed on its behalf by the undersigned, thereunto duly authorized. The signature of the undersigned company shall be deemed to relate only to matters having reference to such company and any subsidiaries thereof. | | | | | | | | | | | | | | PSEG POWER LLC | | | | | | | | | By: | /s/ WRILLIAMALPH A. LEVISAROSSA | | | | | William LevisRalph A. LaRossa | | | | | President and Chief Operating Officer | | | | | Chief Operating Officer |
Date: February 27, 20172019 Pursuant to the requirements of the Securities Exchange Act of 1934, this report has been signed below by the following persons on behalf of the registrant and in the capacities and on the dates indicated. The signatures of the undersigned shall be deemed to relate only to matters having reference to such company and any subsidiaries thereof. | | | | | | | | | | | | | Signature | | Title | | Date | | | | | /s/ RALPH IZZO | | Chairman of the Board and Chief Executive Officer and | | February 27, 20172019 | | Ralph Izzo | | Director (Principal Executive Officer) | | | | | | | /s/ DANIEL J. CREGG | | Executive Vice President and Chief Financial Officer and | | February 27, 20172019 | | Daniel J. Cregg | | Director (Principal Financial Officer) | | | | | | | /s/ STUART J. BLACK | | Vice President and Controller | | February 27, 20172019 | | Stuart J. Black | | (Principal Accounting Officer) | | | | | | | /s/ DEREK M. DIRISIO | | Director | | February 27, 20172019 | | Derek M. DiRisio | | | | | | | | | /s/ WRILLIAMALPH A. LEVISAROSSA | | Director | | February 27, 20172019 | William LevisRalph A. LaRossa | | | | | | | | | | | /s/ TAMARA L. LINDE | | Director | | February 27, 20172019 | | Tamara L. Linde | | | | | | | | | | | /s/ MARGARET M. PEGO | | Director | | February 27, 20172019 | | Margaret M. Pego | | | | |
EXHIBIT INDEX
The following documents are filed as a part of this report: | | | | a. PSEG: | | | Exhibit 10a(10) | | Key Executive Severance Plan of Public Service Enterprise Group Incorporated, Amended effective February 20, 2017
| Exhibit 12: | | Computation of Ratios of Earnings to Fixed Charges | Exhibit 21: | | Subsidiaries of the Registrant | Exhibit 23: | | Consent of Independent Registered Public Accounting Firm | Exhibit 31: | | Certification by Ralph Izzo Pursuant to Rules 13a-14 and 15d-14 of the 1934 Act | Exhibit 31a: | | Certification by Daniel J. Cregg Pursuant to Rules 13a-14 and 15d-14 of the 1934 Act | Exhibit 32: | | Certification by Ralph Izzo Pursuant to Section 1350 of Chapter 63 of Title 18 of the U.S. Code | Exhibit 32a: | | Certification by Daniel J. Cregg Pursuant to Section 1350 of Chapter 63 of Title 18 of the U.S. Code | Exhibit 101.INS: | | XBRL Instance Document | Exhibit 101.SCH: | | XBRL Taxonomy Extension Schema | Exhibit 101.CAL: | | XBRL Taxonomy Calculation Linkbase | Exhibit 101.LAB: | | XBRL Taxonomy Extension Labels Linkbase | Exhibit 101.PRE: | | XBRL Taxonomy Extension Presentation Linkbase | Exhibit 101.DEF: | | XBRL Taxonomy Extension Definition Document | b. Power: | | | Exhibit 10a(8) | | Key Executive Severance Plan of Public Service Enterprise Group Incorporated, Amended effective February 20, 2017 | Exhibit 12a: | | Computation of Ratios of Earnings to Fixed Charges | Exhibit 23a: | | Consent of Independent Registered Public Accounting Firm | Exhibit 31b: | | Certification by Ralph Izzo Pursuant to Rules 13a-14 and 15d-14 of the 1934 Act | Exhibit 31c: | | Certification by Daniel J. Cregg Pursuant to Rules 13a-14 and 15d-14 of the 1934 Act | Exhibit 32b: | | Certification by Ralph Izzo Pursuant to Section 1350 of Chapter 63 of Title 18 of the U.S. Code | Exhibit 32c: | | Certification by Daniel J. Cregg Pursuant to Section 1350 of Chapter 63 of Title 18 of the U.S. Code | Exhibit 101.INS: | | XBRL Instance Document | Exhibit 101.SCH: | | XBRL Taxonomy Extension Schema | Exhibit 101.CAL: | | XBRL Taxonomy Calculation Linkbase | Exhibit 101.LAB: | | XBRL Taxonomy Extension Labels Linkbase | Exhibit 101.PRE: | | XBRL Taxonomy Extension Presentation Linkbase | Exhibit 101.DEF: | | XBRL Taxonomy Extension Definition Document | c. PSE&G: | | | Exhibit 4a(14) | | Supplemental Indenture dated September 1, 2016 | Exhibit 10(a)9 | | Key Executive Severance Plan of Public Service Enterprise Group Incorporated, Amended effective February 20, 2017 | Exhibit 12b: | | Computation of Ratios of Earnings to Fixed Charges Plus Preferred Stock Dividend Requirements | Exhibit 23b: | | Consent of Independent Registered Public Accounting Firm | Exhibit 31d: | | Certification by Ralph Izzo Pursuant to Rules 13a-14 and 15d-14 of the 1934 Act | Exhibit 31e: | | Certification by Daniel J. Cregg Pursuant to Rules 13a-14 and 15d-14 of the 1934 Act | Exhibit 32d: | | Certification by Ralph Izzo Pursuant to Section 1350 of Chapter 63 of Title 18 of the U.S. Code | Exhibit 32e: | | Certification by Daniel J. Cregg Pursuant to Section 1350 of Chapter 63 of Title 18 of the U.S. Code | Exhibit 101.INS: | | XBRL Instance Document | Exhibit 101.SCH: | | XBRL Taxonomy Extension Schema | Exhibit 101.CAL: | | XBRL Taxonomy Calculation Linkbase | Exhibit 101.LAB: | | XBRL Taxonomy Extension Labels Linkbase | Exhibit 101.PRE: | | XBRL Taxonomy Extension Presentation Linkbase | Exhibit 101.DEF: | | XBRL Taxonomy Extension Definition Document |
|