UNITED STATES
SECURITIES AND EXCHANGE COMMISSION
Washington, D.C. 20549
Form 10-K
ý ANNUAL REPORT PURSUANT TO SECTION 13 OR 15(d) OF THE SECURITIES EXCHANGE ACT OF 1934
For the fiscal year ended November 30, 20122015
or
¨ TRANSITION REPORT PURSUANT TO SECTION 13 OR 15(d) OF THE SECURITIES EXCHANGE ACT OF 1934
For the transition period from to .
Commission File No. 001-09195
KB HOME
(Exact name of registrant as specified in its charter)
|
| |
| Delaware | 95-3666267 |
(State or other jurisdiction of incorporation or organization) | (I.R.S. Employer Identification No.) |
10990 Wilshire Boulevard, Los Angeles, California 90024
(Address of principal executive offices) (Zip Code)
Registrant’s telephone number, including area code: (310) 231-4000
Securities Registered Pursuant to Section 12(b) of the Act:
|
| |
| Title of each class | Name of each exchange on which registered |
| Common Stock (par value $1.00 per share) | New York Stock Exchange |
| Rights to Purchase Series A Participating Cumulative Preferred Stock | New York Stock Exchange |
Securities Registered Pursuant to Section 12(g) of the Act: None
Indicate by check mark if the registrant is a well-known seasoned issuer, as defined in Rule 405 of the Securities Act. Yes ý No ¨
Indicate by check mark if the registrant is not required to file reports pursuant to Section 13 or Section 15(d) of the Act. Yes ¨ No ý
Indicate by check mark whether the registrant (1) has filed all reports required to be filed by Section 13 or 15(d) of the Securities Exchange Act of 1934 during the preceding 12 months (or for such shorter period that the registrant was required to file such reports), and (2) has been subject to such filing requirements for the past 90 days. Yes ý No ¨
Indicate by check mark whether the registrant has submitted electronically and posted on its corporate Web site, if any, every Interactive Data File required to be submitted and posted pursuant to Rule 405 of Regulation S-T during the preceding 12 months (or for such shorter period that the registrant was required to submit and post such files). Yes ý No ¨
Indicate by check mark if disclosure of delinquent filers pursuant to Item 405 of Regulation S-K is not contained herein, and will not be contained, to the best of registrant’s knowledge, in definitive proxy or information statements incorporated by reference in Part III of this Form 10-K or any amendment to this Form 10-K. ¨ý
Indicate by check mark whether the registrant is a large accelerated filer, an accelerated filer, a non-accelerated filer, or a smaller reporting company. See the definitions of “large accelerated filer,” “accelerated filer” and “smaller reporting company” in Rule 12b-2 of the Exchange Act.
Large accelerated filer ý Accelerated filer ¨ Non-accelerated filer ¨ Smaller reporting company ¨
Indicate by check mark whether the registrant is a shell company (as defined in Rule 12b-2 of the Exchange Act). Yes ¨ No ý
The aggregate market value of the voting common stock held by non-affiliates of the registrant on May 31, 20122015 was $637,684,7631,512,772,004, including 10,839,35110,335,461 shares held by the registrant’s grantor stock ownership trust and excluding 27,214,17413,116,459 shares held in treasury.
There were 77,221,78592,275,658 shares of the registrant’s common stock, par value $1.00 per share, outstanding on December 31, 2012.2015. The registrant’s grantor stock ownership trust held an additional 10,615,93410,135,461 shares of the registrant’s common stock on that date.
Documents Incorporated by Reference
Portions of the registrant’s definitive Proxy Statement for the 20132016 Annual Meeting of Stockholders (incorporated into Part III).
KB HOME
FORM 10-K
FOR THE YEAR ENDED NOVEMBER 30, 20122015
TABLE OF CONTENTS
|
| | |
| | | Page Number |
|
| Item 1. | | |
| Item 1A. | | |
| Item 1B. | | |
| Item 2. | | |
| Item 3. | | |
| Item 4. | | |
| |
| |
|
| Item 5. | | |
| Item 6. | | |
| Item 7. | | |
| Item 7A. | | |
| Item 8. | | |
| Item 9. | | |
| Item 9A. | | |
| Item 9B. | | |
| |
|
| Item 10. | | |
| Item 11. | | |
| Item 12. | | |
| Item 13. | | |
| Item 14. | | |
| |
|
| Item 15. | | |
| |
PART I
General
KB Home is one of the largest and most recognized homebuilding companies in the U.S. and has been building homes for more than 50nearly 60 years. We construct and sell homes through our operating divisions under the name KB Home. Unless the context indicates otherwise, the terms “we,” “our” and “us” used in this report refer to KB Home, a Delaware corporation, and its predecessors and subsidiaries.
Beginning in 1957 and continuing until 1986, our business was conducted by various subsidiaries of Kaufman and Broad, Inc. (“KBI”) and its predecessors. In 1986, KBI transferred all of its homebuilding and mortgage banking operations to us. Shortly after the transfer, we completed an initial public offering of 8% of our common stock and began operating under the name Kaufman and Broad Home Corporation. In 1989, we were spun-off from KBI, which then changed its name to Broad Inc., and we became an independent public company, operating primarily in California and France. In 2001, we changed our name to KB Home. Today, having sold our French operations in 2007, we operate a homebuilding and financial services business serving homebuyers in various markets across the U.S.
Our homebuilding operations offer a variety of new homes designed primarily for first-time, move-up and active adult homebuyers, including attached and detached single-family residential homes, townhomes and condominiums. We offer homes in development communities, at urban in-fill locations and as part of mixed-use projects. InOur homebuilding operations represent most of our business, accounting for 99.6% of our total revenues in 2015. Our financial services operations, which accounted for .4% of our total revenues in 2015, offer certain insurance products to our homebuyers and title services in certain markets. Since July 2014, our financial services operations have also provided mortgage banking services, including residential consumer mortgage loan (“mortgage loan”) originations, to our homebuyers indirectly through Home Community Mortgage, LLC (“HCM”). HCM is an unconsolidated joint venture we formed with Nationstar Mortgage LLC (“Nationstar”).
Unless the context indicates otherwise, the terms “we,” “our” and “us” used in this report we use the termrefer to KB Home, a Delaware corporation, and its predecessors and subsidiaries. Also as used in this report, “home” to refer tois a single-family residence, whether it is a single-family home or other type of residential property, and we use the termproperty; “community” to refer tois a single development in which new homes are constructed as part of an integrated plan.plan; and “community count” is the number of communities we have open for sales with at least five homes/lots left to sell.
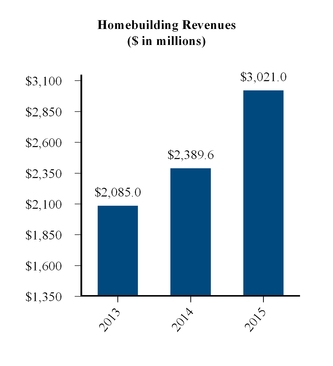
Through ourThe following charts present homes delivered and homebuilding reporting segments, we delivered 6,282 homes at an average selling price of $246,500 duringrevenues for the yearyears ended November 30, 2012, compared to 5,812 homes delivered at an average selling price of $224,600 during the year ended November 30, 2011. Our homebuilding operations represent most of our business, accounting for 99.3% of our total revenues in 20122013, 2014 and 99.2% of our total revenues in 2011.2015:
Our financial services reporting segment provides insurance services to our homebuyers in the same markets where we build homes and provides title services in the majority of our markets located within our Central and Southeast homebuilding reporting segments. In addition, since the third quarter of 2011, this segment has earned revenues pursuant to the terms of a marketing services agreement with a preferred mortgage lender that offers mortgage banking services, including mortgage loan originations, to our homebuyers. Our financial services operations accounted for .7% of our total revenues in 2012 and .8% of our total revenues in 2011.
In 2012, we generated total revenues of $1.56 billion and a net loss of $59.0 million, compared to total revenues of $1.32 billion and a net loss of $178.8 million in 2011.
Our principal executive offices are located at 10990 Wilshire Boulevard, Los Angeles, California 90024. The telephone number of our corporate headquarters is (310) 231-4000 and our primary website address is www.kbhome.com. In addition, community location and information is available at (888) KB-HOMES.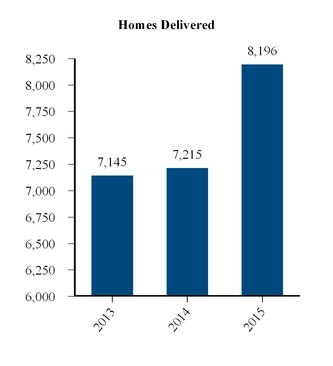
Markets
Reflecting the geographic reach of our homebuilding business, as of the date of this report, our principalwe have ongoing operations are in the 10nine states and 3339 major markets presented below. We also operate in various submarkets within these major markets. From time to time, we refer to these markets and submarkets collectively as our “served markets.” For reporting purposes, we organize our homebuilding operations into four segments — West Coast, Southwest, Central and Southeast.
|
| | | | |
| Segment | | State(s) | | Major Market(s) |
| | | | |
| West Coast | | California | | Contra Costa County, Fresno, Los Angeles, Madera, Oakland, Orange County, Riverside, Sacramento, San Bernardino, San Diego, San Francisco, San Jose, Santa Rosa-Petaluma, Stockton, Vallejo, Ventura and Yuba City |
| Southwest | | Arizona | | Phoenix and Tucson |
| | | Nevada | | Las Vegas and Reno |
| | New Mexico | | Albuquerque |
| Central | | Colorado | | Denver |
| | | Texas | | Austin, Dallas/Dallas, Fort Worth, Houston and San Antonio |
| Southeast | | Florida | | Daytona Beach, Fort Myers, Jacksonville, Lakeland, Orlando, Palm Coast, Punta Gorda, Sarasota, Sebastian-Vero Beach and Tampa |
| | | Maryland | | Washington, D.C.Baltimore and Rockville |
| | | North Carolina | | Raleigh |
| | | Virginia | | Washington, D.C. |
Segment Operating Information. The following table presents certain operating information for our homebuilding reporting segments for the years ended November��November 30, 2012, 20112015, 2014 and 20102013 (dollars in millions, except average selling price):
| | | | Years Ended November 30, | Years Ended November 30, |
| | 2012 | | 2011 | | 2010 | 2015 | | 2014 | | 2013 |
| West Coast: | | | | | | | | | | |
| Homes delivered | 1,945 |
| | 1,757 |
| | 2,023 |
| 2,258 |
| | 1,913 |
| | 2,179 |
|
| Percentage of total homes delivered | 31 | % | | 30 | % | | 27 | % | 27 | % | | 27 | % | | 31 | % |
| Average selling price | $ | 388,300 |
| | $ | 335,500 |
| | $ | 346,300 |
| $ | 587,000 |
| | $ | 569,700 |
| | $ | 467,800 |
|
| Total revenues (in millions) (a) | $ | 755.3 |
| | $ | 589.4 |
| | $ | 700.7 |
| |
| Total revenues (a) | | $ | 1,402.3 |
| | $ | 1,089.9 |
| | $ | 1,020.2 |
|
| Southwest: | | | | | | | | | | |
| Homes delivered | 683 |
| | 843 |
| | 1,150 |
| 1,311 |
| | 736 |
| | 738 |
|
| Percentage of total homes delivered | 11 | % | | 15 | % | | 16 | % | 16 | % | | 10 | % | | 10 | % |
| Average selling price | $ | 193,900 |
| | $ | 165,800 |
| | $ | 158,200 |
| $ | 284,600 |
| | $ | 271,100 |
| | $ | 237,500 |
|
| Total revenues (in millions) (a) | $ | 132.4 |
| | $ | 139.9 |
| | $ | 187.7 |
| |
| Total revenues (a) | | $ | 398.2 |
| | $ | 199.5 |
| | $ | 175.3 |
|
| Central: | | | | | | | | | | |
| Homes delivered | 2,566 |
| | 2,155 |
| | 2,663 |
| 3,183 |
| | 3,098 |
| | 2,841 |
|
| Percentage of total homes delivered | 41 | % | | 37 | % | | 36 | % | 39 | % | | 43 | % | | 40 | % |
| Average selling price | $ | 170,100 |
| | $ | 171,500 |
| | $ | 163,700 |
| $ | 252,200 |
| | $ | 223,800 |
| | $ | 198,900 |
|
| Total revenues (in millions) (a) | $ | 436.4 |
| | $ | 369.7 |
| | $ | 436.4 |
| |
| Total revenues (a) | | $ | 809.7 |
| | $ | 698.4 |
| | $ | 565.1 |
|
| Southeast: | | | | | | | | | | |
| Homes delivered | 1,088 |
| | 1,057 |
| | 1,510 |
| 1,444 |
| | 1,468 |
| | 1,387 |
|
| Percentage of total homes delivered | 17 | % | | 18 | % | | 21 | % | 18 | % | | 20 | % | | 19 | % |
| Average selling price | $ | 206,200 |
| | $ | 195,500 |
| | $ | 170,200 |
| $ | 281,900 |
| | $ | 263,600 |
| | $ | 233,900 |
|
| Total revenues (in millions) (a) | $ | 224.3 |
| | $ | 206.6 |
| | $ | 257.0 |
| |
| Total revenues (a) | | $ | 410.8 |
| | $ | 401.9 |
| | $ | 324.4 |
|
| Total: | | | | | | | | | | |
| Homes delivered | 6,282 |
| | 5,812 |
| | 7,346 |
| 8,196 |
| | 7,215 |
| | 7,145 |
|
| Average selling price | $ | 246,500 |
| | $ | 224,600 |
| | $ | 214,500 |
| $ | 354,800 |
| | $ | 328,400 |
| | $ | 291,700 |
|
| Total revenues (in millions) (a) | $ | 1,548.4 |
| | $ | 1,305.6 |
| | $ | 1,581.8 |
| |
| Total revenues (a) | | $ | 3,021.0 |
| | $ | 2,389.6 |
| | $ | 2,085.0 |
|
| |
| (a) | Total revenues include revenues from housing and land sales. |
Additional financial and operational information related to our homebuilding reporting segments, including revenues, pretax income (losses), inventories and assets, is provided below in the “Management’s Discussion and Analysis of Financial Condition
and Results of Operations” section and in Note 2. Segment Information in the Notes to Consolidated Financial Statements in this report.
Unconsolidated Joint Ventures. The above table does not include homes delivered or revenues from unconsolidated joint ventures in which we participate. These unconsolidated joint ventures acquire and develop land in various markets where our homebuilding operations are located and, in some cases, build and deliver homes on the land developed. Over the last five years, we have reduced the number of homebuilding joint ventures in which we participate. Our unconsolidated joint ventures delivered no homes in 2012, one home in 2011, and 102 homes in 2010.
Strategy
Since 1997, we have operated our homebuilding business followingfollowed the principles of an operational business model that we call KBnxt. KBnxt provides the core framework under which we have established the primary strategic goals for our main operational objectives and near-term strategic goals.homebuilding business. We believe the principles of KBnxt set us apart from other large-productionhigh-production homebuilders and provide the foundation for our long-term growth.
KBnxt. With KBnxt, we seek to generate greaterimproved operating efficiencies and return on investment through a disciplined, fact-based and process-driven approach to homebuilding that is founded on a constant and systematic assessment of consumer preferences and market opportunities. The key principles of KBnxt include the following:
gaining a detailed understanding of consumer location and home design and interior/exterior design option preferences through regular surveys and research. In this report and elsewhere, we refer to our home designs and design options as our “products;”
managing our working capital and reducing our operating risks by primarily acquiring primarily developed and entitled land at reasonable prices in identified preferred markets with perceived high growth potentialand submarkets that meet our investment return standards and market positioning (or “marketing”) standards ;strategy;
using our knowledge of consumer preferences to design, offer, construct and deliver products that meet the needs and interests of the largest demographic of homebuyers desire;in our served markets. Historically, this demographic has been comprised of first-time and move-up homebuyers;
in general, commencing construction of a home only after we have a signed purchase contract has been signedwith a buyer and have obtained preliminary credit approval has been received;or other evidence of the buyer’s financial ability to purchase the home;
building a backlog of net orders to maintain an even flow production of homes, and minimizing the cycle time from initialthe start of construction to the delivery of homes to customers;
establishing an even flow of production of high-quality homes at the lowest possible cost;buyers; and
offering customers a distinctive homebuying experience designed to offer the best combination of value and choice through affordable basesales prices andplus the opportunity to customize their homes through choice ofas they desire by selecting a lot location within a community, elevationvarious house elevations and floor plans, and choices fornumerous interior and exterior design options and upgrades available at our KB Home Studios.design studios. As part of this process, in-house teams of sales representatives, design consultants and other personnel work with each buyer to create a home that meets the buyer’s needs and budget.
While weWe consider KBnxt to be integral to our success in the homebuilding industry,industry. However, there have been instancesmay be market-driven circumstances where market conditions have madewe believe it is necessary in our view,or appropriate to temporarily deviate from certain of itsKBnxt principles. For example, at times we have been unable to maintain an even flow production of homes in a particular area because of slow sales activity. Also, in specific targeted communities with strong demand, we have startedThese deviations may include starting construction on a small number of homes in a community before a corresponding purchase contract wascontracts are signed with buyers to more quickly meet thecustomer delivery expectations of homebuyers and generate revenues. Theserevenues; or acquiring undeveloped or unentitled land that otherwise fits within our marketing strategy and meets our investment return standards. In addition, other market-driven circumstances maycould arise in the future andthat may lead us to make specific short-term shifts from the principles of KBnxt.our KBnxt principles.
Strategic and Operational ObjectivesFocus. Guided by our KBnxt principles, we have since 2012 implemented an aggressive land acquisition and development investment strategy targeted at positioning more of our main areascommunities in attractive, land-constrained locations featuring higher-income homebuyers. We have also refined our product offerings to meet these buyers’ preferences both for larger homes with the option for more lot and product premiums and the choice of operational focus are as follows:
Asset Positioning. We seekdesign options and upgrades to maintain a long-term growth platforminclude with the construction of new home communities throughtheir homes. Over the last three years, we have invested approximately $3.57 billion in land and land development investments that enable us to own or control a forecasted three-to-five year supplyand substantially expanded our operating platform and community count. To further accelerate our growth, we have prioritized enhancing the profitability of developed or developable land in preferred locationseach home delivered and generating higher revenues, as well as improving our asset efficiency and return on invested capital. Through this integrated strategic framework and its corresponding initiatives, we have produced significant improvement in our served markets.financial results and have been profitable for each of the last three fiscal years. We manage this growth platform through an ongoing allocation of resources to capitalize on identified opportunities, which may involve withdrawing and reallocating resources from underperforming markets. We also will expand and contract our geographic footprint and corresponding resource commitments over time in line with housing market conditions, particularly prevailing and expected levels of home sales activity.
Product Sales and Customer Satisfaction. We aim to generate sales volume and high levels of customer satisfaction by providing the best combination of value, quality and choice in homes and design options along with attentive service to our core customers — first-time, move-up and active adult homebuyers. In addition to our focus on operating from new home communities in attractive locations, we believe we stand out from other homebuilders and resale homes throughcan sustain our distinct Builtprogress in 2016 by continuing to Order™ approachadvance our top strategic priorities, which are discussed further in this report, subject to homebuying and our longstanding commitment to sustainability. With Built to Order, we offer customers affordable base pricesconditions in the overall economy and the opportunity to significantly customize the floor planshousing, capital, credit and design options for their new homes. With our homes, we also offer several standard features and options that are among the most energy- and water-efficient commercially available. These features and options provide increased value to our homebuyers by helping to lower the relative cost of homeownership over time.financial markets.
Organizational and Production Efficiency. We strive to enhance our performance by aligning our management resources, personnel levels and overhead costs with our growth platform, sales activity expectations and business needs, and by streamlining and constantly improving, to the extent possible, our home construction process. In addition to even flow
production scheduling, our home construction process includes developing and refining a set of value-engineered home designs in ways that allow us to meet the needs of consumers in a variety of different markets, shorten cycle times and lower direct construction costs. It also includes taking advantage of economies of scale in contracting for building materials and skilled trade labor.
Near-Term Strategic Goals. As 2012 unfolded, the overall housing market showed increasing signs that it had stabilized and was recovering from the severe and widespread downturn that began in mid-2006, and some stronger housing markets experienced sustained positive momentum in sales activity and selling prices. Optimistic that the housing recovery could be at the beginning of a new upward business cycle for homebuilding, but mindful of the several challenges facing housing markets, we continued to execute on the following three primary integrated strategic goals that have been our focus during the past few years of the housing downturn:
achieving and maintaining profitability at the scale of prevailing market conditions, our highest priority in 2012;
generating cash and strengthening our balance sheet; and
positioning our business to capitalize on future growth opportunities.
In pursuing these goals, we have broadly transformed and refocused the scope, scale and position of our business both geographically and operationally, compared to the peak pre-housing downturn years of the prior decade, to adapt to changing housing market dynamics and volatile home sales activity. Several housing markets experienced challenging conditions during the housing downturn, which was deepened and extended by the negative impacts of the 2007-2009 economic recession and subsequent slow recovery, including high unemployment; sluggish economic growth; weak consumer confidence; elevated residential consumer mortgage loan delinquencies, defaults and foreclosures; turbulent financial and credit markets and tight mortgage lending standards and practices. These factors, to varying degrees, still affect housing markets. Given the difficult homebuilding environment, we, among other things, shifted resources from underperforming areas to markets offering perceived higher growth prospects, particularly land-constrained locations in coastal areas of California and in Texas, to maintain a solid growth platform; implemented measures to generate and conserve cash through reduced spending and asset sales, strengthen our balance sheet, improve our operating efficiencies and lower our overhead costs; and redesigned and re-engineered our products.
While these efforts to refocus our operations contributed to reduced inventory levels, lower community counts, and declines in our backlog, deliveries and revenues, and we posted operating losses, we believe they have strengthened our overall business relative to where we stood at the outset of the housing downturn and have positioned us to operate profitably to the extent there is continued progress in the present housing recovery. We generated net income in the second half of 2012 and our full-year deliveries and revenues were each higher than in 2011. In addition, our backlog at November 30, 2012, in terms of both homes and potential future housing revenues, was significantly higher than our backlog at November 30, 2011. We expect our community count to increase in 2013 largely as a result of a land acquisition initiative we began in late 2009 and accelerated in 2012, and the investments in land and land development we plan to make in 2013. We use the term “community count” to refer to the number of new home communities we have open for sales in a given period, and for this report our community count reflects as of a given period or date the number of our new home communities with at least one home left to sell.
Encouraged by the results of our efforts to reposition the company during the housing downturn and the steadily emerging indications during 2012 that the housing market is now past stabilization and into recovery, in the latter part of 2012, we expanded our primary integrated strategic goals to target both profitability and growing our business and, among other things, implemented the following initiatives:
Building on our focused geographic and operational positioning strategy of the past few years by aggressively investing in land and land development, subject to our investment return and marketing standards, in higher-performing, choice locations that feature higher household incomes within our core homebuyer demographic. These consumers are more likely to choose larger home sizes and purchase more design options, key drivers for our home selling prices and housing gross profit margins. This investment orientation, which we began in late 2009, yielded improved results in 2012, contributing to our higher revenues and average selling prices. During 2012, we invested approximately $565 million in land and land development.
Optimizing our assets by increasing revenues per new home community open for sales through an intense focus on sales performance and continued improvement in our product offerings, including our energy- and water-efficient product offerings, to meet higher-income consumers’ demand for larger home sizes and more design options. We consider a community that has one or more homes left to sell at the end of a quarter to be a “new home community open for sales.”
Broadening our performing asset base by activating certain inventory in stabilizing markets that was previously held for future development. In 2012, we identified 21 communities for activation, primarily in Florida and Arizona, representing
more than 1,000 lots. We expect to generate deliveries and to realize the associated revenues from these activated assets in 2013.
Bringing additional resources to targeted markets where we operate to further strengthen our local field management teams and talent where appropriate, while leveraging our existing infrastructure and carefully managing overhead costs, to help ensure the effective and efficient execution of our strategic initiatives. In 2012, we expanded our management teams in Northern California, Southern California and Central Texas to provide heightened attention to key submarkets within those regions.
In 2013, we intend to continue and may expand on our strategic growth initiatives, subject to conditions in the housing markets, the overall economy and the capital, credit and financial markets.
Promotional Marketing Strategy. Our promotional marketing efforts are centered on differentiating the KB Home brand in the minds of our core homebuyer demographic from resale homes and from new homes sold by other homebuilders. These efforts increasingly involve using interactive Internet-based applications, social media channels and resourcesoutlets and other evolving communication technologies. We believe that our Built to Order message and approach generate a high perceived value for our products and our company among consumers and are unique among large-production homebuilders. In marketing our Built to Order approach, we emphasize how we partner with our homebuyers to create a home built to their individual preferences in design, layout, square footage and lot location, and give them the ability to significantly customize their home with design options that suit their needs and interests. In essence, Built to Order serves as the consumer face of core elements of our KBnxt operational business model and is designed to ensure that our promotional marketing strategy and advertising campaigns are closely aligned with our overall operational focus. For greater consistency with our promotional marketing messages and in the execution of our Built to Order approach, the selling of our homes is carried out by in-house teams of sales representatives and other personnel who work personally with each homebuyer to create a home that meets the homebuyer’s preferences and budget.
Our KB Home Studiosdesign studios are a key component of the Built to Orderour distinct homebuying experience we offer to our homebuyers and help increase the revenues we generate from home sales. These showrooms, which are generally centrally located close towithin our new home communities open for sales,served markets and utilize electronic displays and virtual design tools, allow our homebuyers to selectcustomize their home by selecting from a wide variety of design options and upgrades that are available at no cost or for purchase as part of the original construction of their homes.home. The coordinated efforts of our sales representatives and KB Home Studiodesign studio consultants are intended to generate higher customer satisfaction and lead to enhanced customer retention and referrals.
SustainabilityCustomer Service. . We have made a dedicated effort to further differentiate ourselves from other homebuilders and resale homes through our ongoing commitment to become a leading national company in environmental sustainability. Under this commitment, we:
refined our products to reduce the amount of building materials needed to construct them, and have taken steps to reduce construction waste;
build all of our new homes to U.S. Environmental Protection Agency’s (“EPA”) ENERGY STAR® standards;
build an increasing percentage of our homes to meet the U.S. EPA’s Watersense® specifications for water use efficiency;
build our homes with Watersense labeled fixtures;
developed an Energy Performance Guide®, or EPG®, that informs our homebuyers of the relative energy efficiency (and related estimated monthly energy costs and potential energy cost savings) of each of our homes as designed compared to typical new and existing homes; and
introduced net-zero energy design options, in a program called ZeroHouse 2.0™, in select markets.
This commitment and the related initiatives we have implemented stem in part from growing sensitivities and regulatory attention to the potential impact that the construction and use of homes can have on the environment, and from our homebuyers’ interest in reducing this impact and in lowering their consumption of energy and water resources and their utility bills. More information about our sustainability commitment can be found in our annual sustainability reports, which we have published on our website since 2008. To date, we are the only national homebuilder to publish a comprehensive annual sustainability report. As we see environmental issues related to housing becoming increasingly important to consumers and government authorities at all levels, we intend to continue to research, evaluate and utilize new or improved products and construction and business practices consistent with our commitment. In addition to making good business sense, we believe our sustainability initiatives can help put us in a better position, compared to resales and homebuilders with less-developed programs, to comply with evolving local, state and federal rules and regulations intended to protect natural resources and to address climate change and similar environmental concerns.
Customer Service and Quality Control
Customer satisfaction is a high priority for us. Our goal is for our customers to be 100% satisfied with their new homes. Our on-site construction supervisors perform regular pre-closing quality checks and our sales representatives maintain regular contact with our homebuyers during the home construction process in an effort to ensure our homes meet our standards and our homebuyers’ expectations. We believe our prompt and courteous responses to homebuyers’ needs throughout the homebuying process help reduce post-closing repair costs, enhance our reputation for quality and service, and help encourage repeat and referral business from homebuyers and the real estate community. We also have employees who are responsible for responding to homebuyers’ post-closing needs, including warranty claims.
We provide a Information about our limited warranty on allprogram is provided in Note 15. Commitments and Contingencies in the Notes to Consolidated Financial Statements in this report.
Operational Structure. We operate our homebuilding business through divisions with experienced management teams who have in-depth local knowledge of our homes. The specific termstheir particular served markets, which helps us acquire land in preferred locations; develop communities with products that meet local demand; and conditions vary depending on the market where we do business. We generally provide a structural warranty of 10 years, a warranty on electrical, heating, cooling, plumbingunderstand local regulatory environments. Our division management teams exercise considerable autonomy in identifying land acquisition opportunities; developing land and other building systems each varying from two to five years based on geographic marketcommunities; implementing product, marketing and state law,sales strategies; and a warranty of one year for other components of a home.
Local Expertise
controlling costs. To maximize KBnxt’s effectiveness and help ensure itsmaintain consistent execution within our organization, our division management teams and other employees are continuously trained on KBnxt principles and are evaluated, in part, based on their achievement of relevant operational objectives. We also believe that our business requires in-depth knowledge of local markets in order to acquire land in preferred locations
Our corporate management and on favorable terms, to engage subcontractors, tosupport personnel develop communities that meet local demand, to anticipate consumer tastes in specific markets, and to assess local regulatory environments. Accordingly, we operate our business through divisions with trained personnel who have local market expertise. We have experienced management teams in eachoversee the implementation of our divisions. Though we centralize certainoverall operational policies and internal control standards, and perform various centralized functions, (such as promotional marketing, legal, purchasing administration, product development, architectureincluding treasury and accounting) to benefit from economies of scale, our local management exercises considerable autonomy in identifyingcash management; land acquisition opportunities, developingapproval; accounting and implementing productfinancial reporting; internal audit and sales strategies,compliance activities; and controlling costs.investor and media relations.
Community Development and Land Inventory Management
Developable land for the production of homes is a core resource for our business. Based on our current strategic plans, we seek to own or control land sufficient to meet our forecasted production goals for the next three to five years. In 2016, we intend to continue to selectively acquire or control additional land that meets our investment return and marketing standards. However, we may decide to sell certain land interests as part of our capital allocation and marketing strategy, or to monetize land previously held for future development, or for other reasons.
Our community development process generally consists of four phases: land acquisition, land development into finished lots for a community (if necessary), home construction and deliveries.delivery of completed homes to buyers. Historically, our community development process has ranged from six to 24 months in our West Coast homebuilding reporting segment, with a somewhat shorter duration in our other homebuilding reporting segments. TheOur community development process varies based on, among other things, the extent and speed of required government approvals required,and utility service activations, the overall size of a particular community, the scope of necessary site preparation activities, the type of product(s) that will be offered, weather conditions, time of year, promotional marketing results, the availability of construction resources, consumer demand, and local and general economic and housing market conditions.conditions, and other factors.
Although they vary significantly in size and complexity, our communities typically consist of 5030 to 250 lots ranging in size from 2,2001,900 to 13,00011,500 square feet. In our communities, we typically offer from three to 15 home design choices. We also generally build one to three model homes at each community so that prospective buyers can preview various products available. Depending on the community, we may offer premium lots containing more square footage, better views and/or location benefits.
The following table summarizes our community count in each Some of our homebuilding reporting segments:
|
| | | | | | | | | | | | | | | |
| As of November 30, | | West Coast | | Southwest | | Central | | Southeast | | Total |
| 2012 | | 46 |
| | 17 |
| | 91 |
| | 37 |
| | 191 |
|
| 2011 | | 72 |
| | 25 |
| | 93 |
| | 44 |
| | 234 |
|
Land Acquisition and Land Development. We continuously evaluate land acquisition opportunities as they arise against our investment return and marketing standards, balancing competing needs for financial strength, liquidity and land inventory for future growth. When we acquire land, we generally focus on land parcels containing fewer than 250with lots that are fully entitled for residential construction and are either physically developed to start home construction (referred to as “finished lots”) or partially finished. Acquiring finished or partially finished lots enables us to construct and deliver homes with minimal additional development work or expenditures. We believe this is a more efficient way to use our working capital and reduces the operating risks associated with having to develop and/or entitle land, such as unforeseen improvement costs and/or changes in market conditions. However, depending on market conditions and available opportunities, including opportunities to secure certain finished lots, we may acquire undeveloped and/or unentitled land. We may also invest in land that requires us to repurpose and re-entitle the property for residential use, such as in-fill developments. We expect that the overall balance of undeveloped, unentitled, entitled, partially finished and finished lots in our inventory will vary over time, and in
implementing our strategic growth initiatives, we may acquire a greater proportion of undeveloped or unentitled land in the future.
Consistentreasonably-priced land with our KBnxt operational business model, wefinished or partially finished lots diminishes.
We target geographic areas for potential land acquisitions and community development based on the results of periodic surveys of both new and resale homebuyers in particular markets, prevailing local economic conditions, the supply and type of homes available for sale, and other research activities. Local, in-house land acquisition specialists analyze specific geographic areas to identify desirable land acquisition targets or to evaluate whether to dispose of an existing land interest. We also use studies performed by third-party specialists. Using this internal and external data, some of the factors we consider in evaluating land acquisition targets are consumer preferences; general economic conditions; prevailing and expected home sales activity and the selling prices and pricing trends of comparable new and resale homes in the subject submarket; proximity to metropolitan areas and employment centers; population, household formation and employment and commercial growth patterns; household income levels; availability of developable land parcels at reasonable cost, including estimated costs of completing land development and selling homes; our operational scale and experience in the subject submarket; and environmental compliance matters.
We generally structure our land acquisitionsacquisition and land development activities to minimize, or to defer the timing of, expenditures which enhances our returnsin order to reduce both the market risks associated with land-related investments. While we use a variety of techniques to accomplish this, weholding land and our working capital and financial commitments, including interest and other carrying costs. We typically use contracts that in exchange for a small initial option or earnest money deposit payment give us an option or similar right to acquire land at a future date, usually at a predeterminedpre-determined price and for a small initial option pending our satisfaction with the feasibility of developing and selling homes on the land and/or earnest money deposit payment. These contracts may also permit us to partially develop thean underlying land prior to our acquisition.seller’s completion of certain obligations, such as securing entitlements, developing infrastructure or finishing lots. We refer to land subject to such option or similar contractual rights as being “controlled.” Our decision to exercise a particular land option or similar right is based on the results of our due diligence and continued market viability analysis we conduct after entering into such a contract. In some cases,Information related to our decision to exercise a land option or similar right may be conditioned on the land seller obtaining necessary entitlements, such as zoning rights and environmental and development approvals, and/or physically developing the underlying land by a pre-determined date.
In addition, we may acquire land under contracts that condition our acquisition obligation on our satisfaction with the feasibility of developing the subject land and selling homes on the land by a certain future date, consistent with our investment return and marketing standards. Our land option contracts and other similar contracts may also allow us to phase our land acquisitions and/or land development over a period of time and/or upon the satisfaction of certain conditions. We may also acquire land with seller financing that is non-recourse to us, or by workingprovided in conjunction with third-party land developers. The use of these land option contractsNote 7. Inventory Impairments and other similar contracts generally allows us to reduce the market risks associated with direct land ownership and development, and to reduce our capital and financial commitments, including interest and other carrying costs.
Our land option contracts and other similar contracts generally do not contain provisions requiring our specific performance. However, depending on the circumstances, our initial option or earnest money deposit may or may not be refundable to us if we abandon the related land option contract or other similar contract and do not complete the acquisition of the underlying land. In addition, if we abandon a land option contract or other similar contract, we usually cannot recover the pre-acquisition costs we incurred after we entered into the contract, including those related to our due diligence and other evaluation activities and/or partial development of the subject land, if any.
Before we commit to any land acquisition, our senior corporate and regional management evaluate the asset based on the results of our local specialists’ due diligence, third-party data and a set of defined financial measures, including, but not limited to, housing gross profit margin analyses and specific discounted, after-tax cash flow internal rate of return requirements. The criteria guiding our land acquisition and disposition decisions have resulted in our maintaining inventory in areas that we believe generally offer better returns for lower risk and lower our upfront investment in inventory.
Our inventories include land we are holding for future development, which is comprised of land where we have suspended development activity or development has not yet begun but is expected to occurLand Option Contract Abandonments in the future. These assets held for future development are locatedNotes to Consolidated Financial Statements in various submarkets where conditions do not presently support further investment or development, or are subject to a building permit moratorium or regulatory restrictions, or are portions of larger land parcels that we plan to build out over several years and/or parcels that have not yet been entitled and, therefore, have an extended development timeline. Land we are holding for future development also includes land where we have deferred development activity based on our belief that we can generate greater returns and/or maximize the economic performance of a community by delaying improvements for a period of time to allow earlier phases of a long-term, multi-phase community or a neighboring community to generate sales momentum or for market conditions to improve.this report.
The following table presents the number of inventory lots we owned, in various stages of development, or controlled under land option contracts andor other similar contracts in ourby homebuilding reporting segmentssegment as of November 30, 20122015 and 2011. The table does not include approximately 326 acres owned as of November 30, 2012 and November 30, 2011 that are not currently expected to be approved for subdivision into lots.2014:
| | | | Homes Under Construction and Land Under Development | | Land Held for Future Development | | Land Under Option | | Total Land Owned or Under Option | Homes Under Construction and Land Under Development | | Land Held for Future Development | | Land Under Option | | Total Land Owned or Under Option |
| | 2012 | | 2011 | | 2012 | | 2011 | | 2012 | | 2011 | | 2012 | | 2011 | 2015 | | 2014 | | 2015 | | 2014 | | 2015 | | 2014 | | 2015 | | 2014 |
| West Coast | 2,899 |
| | 3,424 |
| | 3,936 |
| | 4,102 |
| | 3,613 |
| | 1,491 |
| | 10,448 |
| | 9,017 |
| 4,526 |
| | 5,467 |
| | 2,768 |
| | 3,157 |
| | 4,126 |
| | 4,210 |
| | 11,420 |
| | 12,834 |
|
| Southwest | 1,275 |
| | 1,013 |
| | 7,743 |
| | 8,219 |
| | 534 |
| | 33 |
| | 9,552 |
| | 9,265 |
| 6,349 |
| | 6,985 |
| | 1,871 |
| | 2,255 |
| | 761 |
| | 317 |
| | 8,981 |
| | 9,557 |
|
| Central | 7,859 |
| | 7,681 |
| | 2,055 |
| | 1,837 |
| | 4,612 |
| | 3,215 |
| | 14,526 |
| | 12,733 |
| 13,793 |
| | 13,692 |
| | 1,254 |
| | 1,339 |
| | 2,700 |
| | 4,098 |
| | 17,747 |
| | 19,129 |
|
| Southeast | 1,922 |
| | 1,123 |
| | 4,934 |
| | 5,567 |
| | 3,370 |
| | 2,465 |
| | 10,226 |
| | 9,155 |
| 3,999 |
| | 4,618 |
| | 3,500 |
| | 3,879 |
| | 1,752 |
| | 2,181 |
| | 9,251 |
| | 10,678 |
|
| Total | 13,955 |
| | 13,241 |
| | 18,668 |
| | 19,725 |
| | 12,129 |
| | 7,204 |
| | 44,752 |
| | 40,170 |
| 28,667 |
| | 30,762 |
| | 9,393 |
| | 10,630 |
| | 9,339 |
| | 10,806 |
| | 47,399 |
| | 52,198 |
|
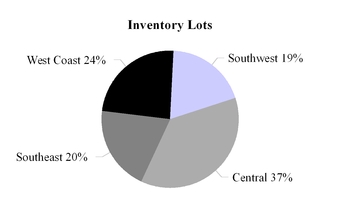
Reflecting our geographic diversity and relatively balanced operational footprint, asThe following charts present the percentage ofNovember 30, 2012, 23% of the inventory lots we owned or controlled were located in our West Coast homebuilding reporting segment, 21% were in our Southwest homebuilding reporting segment, 33% were in our Centralunder land option contracts or other similar contracts by homebuilding reporting segment and 23% were in our Southeast homebuilding reporting segment.
The following table presents the carrying valuepercentage of inventorytotal lots we owned in various stages of development, orand controlled under land option contracts and other similar contracts in our homebuilding reporting segments as of November 30, 2012 and 2011 (in thousands):2015:
|
| | | | | | | | | | | | | | | | | | | | | | | | | | | | | | | |
| | Homes Under Construction and Land Under Development | | Land Held for Future Development | | Land Under Option | | Total Land Owned or Under Option |
| | 2012 | | 2011 | | 2012 | | 2011 | | 2012 | | 2011 | | 2012 | | 2011 |
| West Coast | $ | 471,650 |
| | $ | 508,731 |
| | $ | 337,229 |
| | $ | 344,702 |
| | $ | 33,718 |
| | $ | 62,370 |
| | $ | 842,597 |
| | $ | 915,803 |
|
| Southwest | 63,456 |
| | 66,770 |
| | 156,159 |
| | 163,413 |
| | 1,830 |
| | 307 |
| | 221,445 |
| | 230,490 |
|
| Central | 292,475 |
| | 265,946 |
| | 21,806 |
| | 23,086 |
| | 5,443 |
| | 2,834 |
| | 319,724 |
| | 291,866 |
|
| Southeast | 154,992 |
| | 87,144 |
| | 153,661 |
| | 195,542 |
| | 14,152 |
| | 10,784 |
| | 322,805 |
| | 293,470 |
|
| Total | $ | 982,573 |
| | $ | 928,591 |
| | $ | 668,855 |
| | $ | 726,743 |
| | $ | 55,143 |
| | $ | 76,295 |
| | $ | 1,706,571 |
| | $ | 1,731,629 |
|
Home Construction and Deliveries. Following the acquisition of land and, if necessary, the development of the land into finished lots, we typically begin constructing model homes and marketing homes for sale. The time required forWe have developed and refined a standardized set of value-engineered home designs to enhance our construction of our homes depends on the weather, time of year, availability of local trade labor and building materials and other factors.efficiency. To minimize the costs and risks of unsold homes in production, we generally begin construction of a home only whenafter we have a signed purchase contract with a homebuyer.buyer and we have obtained preliminary credit approval or other evidence of the buyer’s financial ability to purchase the home. However, cancellations of home purchase contracts prior to the delivery of the underlying homes, the construction of attached products with some unsold units, or specific strategic considerations will result in our having unsold completed or partially-completed homes in production.our inventory.
We act as the general contractor for the majority of our communities, and hire experiencedengage outside general contractors in all other instances. We, or the outside general contractors we engage, contract with a variety of independent subcontractors, who are typically locally-based, to supply the trade laborperform all land development and to procurehome construction work through their own employees or subcontractors. We do not self-perform any land development or home construction work. These independent subcontractors also supply some of the building materials required for allsuch production activities. Our contracts with ourthese independent subcontractors require that they comply with all laws applicable to their work, including laborwage and safety laws, meet performance standards, and follow local building codes and permits.
Raw Materials. Outside of land, the principal raw materials used in our production process are concrete and forest products. Other primary materials used in home construction include drywall and plumbing and electrical items. We source all of our building materials from third parties. We attempt to enhance the efficiency of our operations by using, where practical, standardized materials that are commercially available on competitive terms from a variety of outside sources. In addition, we have established national and regional purchasing programs for certain building materials, appliances, fixtures and other items that allow us to take advantage of economies of scale and garner better pricing and more reliable supplybenefit from large-quantity purchase discounts and, where available, participate in manufacturers’outside manufacturer or suppliers’supplier rebate programs. At all stagesWhen possible, we arrange for bulk purchases of production,these products at favorable prices from such manufacturers and suppliers. Although our administrativepurchasing strategies have helped us in negotiating favorable prices for raw materials, in recent years we have encountered higher prices for lumber, drywall and on-site supervisory personnel coordinate the activities of subcontractors to meet our production schedules and quality standards.concrete.
Backlog
We sell our homes under standard purchase contracts, which generally require a homebuyer to pay a deposit at the time of signing. The amount of the deposit required varies among markets and communities. Homebuyers also may be required to pay additional deposits when they select design options for their homes. Most of our home purchase contracts stipulate that if a homebuyer cancels a contract with us, we have the right to retain the homebuyer’s deposits. However, we generally permit our homebuyers to cancel their obligations and obtain refunds of all or a portion of their deposits in the event mortgage financing cannot be obtained within a certain period of time, as specified in their contract. We define our cancellation rate in a given period as the total number of contracts for new homes canceled divided by the total new (gross) orders for homes during the same period. For further discussion of our cancellation rates and the factors affecting our cancellation rates, see below under “Item 1A. Risk Factors” and “Part II — Item 7. Management’s Discussion and Analysis of Financial Condition and Results of Operations.”
Our “backlog” consists of homes that are under a home purchase contract but have not yet been delivered to a homebuyer.buyer. Ending backlog represents the number of homes in backlog from the previous period plus the number of net orders (new orders for homes less cancellations) generated during the current period minus the number of homes delivered during the current period. Our backlog at any given time will be affected by cancellations, homes delivered and by our community count. Our cancellation rates and the factors affecting our cancellation rates are further discussed below in both the “Risk Factors” and “Management’s Discussion and Analysis of Financial Condition and Results of Operations” sections in this report. The number of homes deliveredwe deliver has historically increased from the first to the fourth quarter in any year.
Our backlog at November 30, 2012 consisted Substantially all of 2,577 homes, an increase of 20% from the 2,156our homes in backlog at November 30, 2011. 2015 are expected to be delivered during the year ended November 30, 2016.
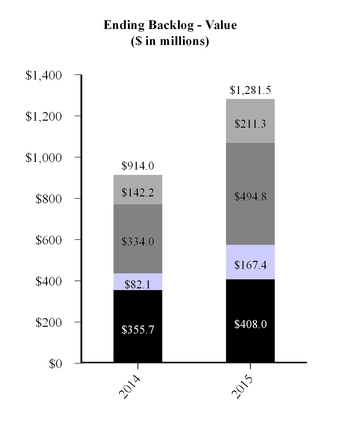
Our backlog at November 30, 20122015 increased 36% to 3,966 homes from 2,909 homes at November 30, 2014, largely due to a year-over-year increase in our net orders in 2015. Our backlog at November 30, 2015 represented potential future housing revenues of approximately $618.6 million,$1.28 billion, a 35%40% increase from potential future housing revenues of approximately $459.0$914.0 million at November 30, 2011, resulting from2014, reflecting the higherlarger number of homes in our backlog and a higher overall average selling price. Our backlog ratio, defined as homes delivered in the quarter as a percentageprice of backlog at the beginning of the quarter, will vary from quarter to quarter, depending on what portion of our backlog is under construction, and how many unsold homes we may sell and close within a quarter.those homes.
Our net orders for the year ended November 30, 2012 increased to 6,703 from 6,632 for the year ended November 30, 2011, representing the second consecutive year that full-year net orders have increased from the previous year. The value of the net orders we generated for the year ended November 30, 2012 increased 15% to $1.73 billion from $1.51 billion in the prior year. Our cancellation rate for the year was 31% in 2012, compared to a cancellation rate of 29% in 2011. Our cancellation rate was 35% in the fourth quarter of 2012, compared to 34% in the fourth quarter of 2011.6
The following tablescharts present our ending backlog (number of homes delivered, net orders and cancellation ratesvalue) by homebuilding reporting segment for each quarter during the years ended as of November 30, 20122014 and 20112015, and our ending backlog at the end of each quarter within those years::
|
| | | | | | | | | | | | | | | | | | | |
| | West Coast | | Southwest | | Central | | Southeast | | Total |
| Homes delivered | | | | | | | | | |
| 2012 | | | | | | | | | |
| First | 309 |
| | 170 |
| | 487 |
| | 184 |
| | 1,150 |
|
| Second | 330 |
| | 157 |
| | 536 |
| | 267 |
| | 1,290 |
|
| Third | 541 |
| | 186 |
| | 700 |
| | 293 |
| | 1,720 |
|
| Fourth | 765 |
| | 170 |
| | 843 |
| | 344 |
| | 2,122 |
|
| Total | 1,945 |
| | 683 |
| | 2,566 |
| | 1,088 |
| | 6,282 |
|
| 2011 | | | | | | | | | |
| First | 224 |
| | 158 |
| | 363 |
| | 204 |
| | 949 |
|
| Second | 353 |
| | 183 |
| | 475 |
| | 254 |
| | 1,265 |
|
| Third | 524 |
| | 232 |
| | 611 |
| | 236 |
| | 1,603 |
|
| Fourth | 656 |
| | 270 |
| | 706 |
| | 363 |
| | 1,995 |
|
| Total | 1,757 |
| | 843 |
| | 2,155 |
| | 1,057 |
| | 5,812 |
|
| Net orders | | | | | | | | | |
| 2012 | | | | | | | | | |
| First | 289 |
| | 140 |
| | 547 |
| | 221 |
| | 1,197 |
|
| Second | 600 |
| | 229 |
| | 900 |
| | 320 |
| | 2,049 |
|
| Third | 658 |
| | 154 |
| | 765 |
| | 323 |
| | 1,900 |
|
| Fourth | 619 |
| | 140 |
| | 485 |
| | 313 |
| | 1,557 |
|
| Total | 2,166 |
| | 663 |
| | 2,697 |
| | 1,177 |
| | 6,703 |
|
| 2011 | | | | | | | | | |
| First | 404 |
| | 206 |
| | 448 |
| | 244 |
| | 1,302 |
|
| Second | 542 |
| | 270 |
| | 838 |
| | 348 |
| | 1,998 |
|
| Third | 581 |
| | 259 |
| | 677 |
| | 321 |
| | 1,838 |
|
| Fourth | 490 |
| | 172 |
| | 517 |
| | 315 |
| | 1,494 |
|
| Total | 2,017 |
| | 907 |
| | 2,480 |
| | 1,228 |
| | 6,632 |
|
| | | | | | | | | | |
|
| | | | | | | | | | | | | | | | | | | |
| | West Coast | | Southwest | | Central | | Southeast | | Total |
| Cancellation rates | | | | | | | | | |
| 2012 | | | | | | | | | |
| First | 34 | % | | 24 | % | | 39 | % | | 37 | % | | 36 | % |
| Second | 24 |
| | 17 |
| | 28 |
| | 28 |
| | 26 |
|
| Third | 23 |
| | 16 |
| | 35 |
| | 27 |
| | 29 |
|
| Fourth | 25 |
| | 21 |
| | 47 |
| | 31 |
| | 35 |
|
| Total | 26 | % | | 19 | % | | 37 | % | | 30 | % | | 31 | % |
| 2011 | | | | | | | | | |
| First | 15 | % | | 18 | % | | 39 | % | | 33 | % | | 29 | % |
| Second | 22 |
| | 18 |
| | 29 |
| | 24 |
| | 25 |
|
| Third | 27 |
| | 20 |
| | 34 |
| | 30 |
| | 29 |
|
| Fourth | 28 |
| | 27 |
| | 41 |
| | 33 |
| | 34 |
|
| Total | 24 | % | | 21 | % | | 35 | % | | 30 | % | | 29 | % |
| Ending backlog — homes | | | | | | | | |
| 2012 | | | | | | | | | |
| First | 443 |
| | 173 |
| | 1,078 |
| | 509 |
| | 2,203 |
|
| Second | 713 |
| | 245 |
| | 1,442 |
| | 562 |
| | 2,962 |
|
| Third | 830 |
| | 213 |
| | 1,507 |
| | 592 |
| | 3,142 |
|
| Fourth | 684 |
| | 183 |
| | 1,149 |
| | 561 |
| | 2,577 |
|
| 2011 | | | | | | | | | |
| First | 383 |
| | 187 |
| | 778 |
| | 341 |
| | 1,689 |
|
| Second | 572 |
| | 274 |
| | 1,141 |
| | 435 |
| | 2,422 |
|
| Third | 629 |
| | 301 |
| | 1,207 |
| | 520 |
| | 2,657 |
|
| Fourth | 463 |
| | 203 |
| | 1,018 |
| | 472 |
| | 2,156 |
|
| Ending backlog — value, in thousands | | | | | | |
| 2012 | | | | | | | | | |
| First | $ | 150,638 |
| | $ | 32,139 |
| | $ | 177,998 |
| | $ | 99,176 |
| | $ | 459,951 |
|
| Second | 301,652 |
| | 43,518 |
| | 237,558 |
| | 110,680 |
| | 693,408 |
|
| Third | 327,528 |
| | 40,727 |
| | 251,900 |
| | 124,589 |
| | 744,744 |
|
| Fourth | 248,790 |
| | 40,206 |
| | 204,473 |
| | 125,157 |
| | 618,626 |
|
| 2011 | | | | | | | | | |
| First | $ | 126,258 |
| | $ | 27,970 |
| | $ | 132,164 |
| | $ | 67,242 |
| | $ | 353,634 |
|
| Second | 172,147 |
| | 43,572 |
| | 199,350 |
| | 86,475 |
| | 501,544 |
|
| Third | 211,360 |
| | 51,262 |
| | 199,503 |
| | 97,205 |
| | 559,330 |
|
| Fourth | 161,987 |
| | 37,071 |
| | 168,512 |
| | 91,380 |
| | 458,950 |
|
Land and Raw Materials
Based on our current strategic plans, we strive to own or control land sufficient to meet our forecasted production goals for the next three to five years. As discussed above under “Strategy,” in 2013 we intend to acquire additional land subject to conditions in the housing markets, the overall economy and the capital, credit and financial markets. However, we may also decide to sell certain land or land interests as part of our marketing strategy or for other reasons.
The principal raw materials used in the construction of our homes are concrete and forest products. In addition, we use a variety of other construction materials in the homebuilding process, including drywall and plumbing and electrical items. We attempt to enhance the efficiency of our operations by using, where practical, standardized materials that are commercially available on competitive terms from a variety of sources. In addition, our national and regional purchasing programs for certain building
materials, appliances, fixtures and other items allow us to benefit from large quantity purchase discounts and, where available, manufacturer or supplier rebates. When possible, we arrange for bulk purchases of these products at favorable prices from manufacturers and suppliers. Although our purchasing strategies have helped us in negotiating favorable prices for raw materials, in 2012, we encountered higher prices for lumber, drywall, concrete and other materials, and labor due to increased residential construction activity, and we expect to see additional cost increases if and as the present housing recovery progresses, as discussed further below under “Competition, Seasonality, Delivery Mix and Other Factors.”
Customer Financing
Our homebuyers may obtain mortgage financing to purchase our homes from any provider of their choice. We do not directly offer mortgage banking services or originate residential consumer mortgage loans (“mortgage loans”) for our customers. Prior to late June 2011, KBA Mortgage, LLC (“KBA Mortgage”), a former unconsolidated mortgage banking joint venture of a subsidiary of ours and a subsidiary of Bank of America, N.A., provided mortgage banking services to a significant proportion of our homebuyers. KBA Mortgage ceased offering mortgage banking services after June 30, 2011.
Since the third quarter of 2011, we have had a marketing services agreement with a preferred mortgage lender that offers mortgage banking services, including mortgage loan originations, to our homebuyers who elect to use the lender. The mortgage banking services are described further below under “Part II — Item 7. Management’s Discussion and Analysis of Financial Condition and Results of Operations — Financial Services Segment.” Our preferred mortgage lender and its respective parent company are not affiliates of ours or any of our subsidiaries. We do not have any ownership, joint venture or other interests in or with our preferred mortgage lender or its respective parent company or with respect to the revenues or income that may be generated from our preferred mortgage lender providing mortgage banking services to, or originating mortgage loans for, our homebuyers. Until the first quarter of 2012, our preferred mortgage lender was MetLife Home Loans, a division of MetLife Bank, N.A., which announced in January 2012 that it was ceasing to offer forward mortgage banking services as part of its business. In March 2012, Nationstar Mortgage LLC (“Nationstar”) became our preferred mortgage lender. Nationstar began accepting new mortgage loan applications from our homebuyers on May 1, 2012.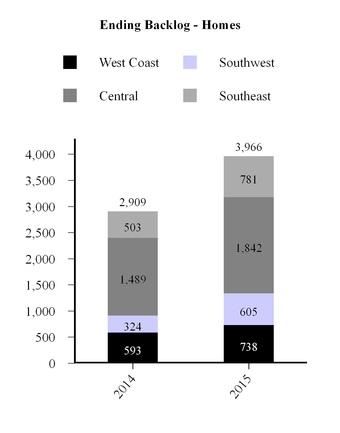
Employees
We employ a trained staff of land acquisition specialists, architects, planners, engineers, construction supervisors, marketing and sales personnel, and finance and accounting personnel, supplemented as necessary by outside consultants, who guide the development of our communities from their conception through the promotional marketing and delivery of completed homes.
At both December 31, 20122015 and 2011,2014, we had approximately 1,2001,680 and 1,590 full-time employees.employees, respectively. None of our employees are represented by a collective bargaining agreement.
Competition, Seasonality, Delivery Mix and Other Factors
Competition.The homebuilding industry and housing market are highly competitive with respect to selling homes; hiring trade labor,contracting for construction services, such as carpenters, roofers, electricianscarpentry, roofing, electrical and plumbers;plumbing; and acquiring attractive developable land.land, though the intensity of competition can vary and fluctuate between and within individual markets and submarkets. We compete for homebuyers, skilled trade workers and management talentconstruction resources and desirable land against numerous homebuilders, ranging from regional and national firms to small local enterprises. As to homebuyers, we primarily compete with other homebuilders on the basis of selling price, community location and amenities, availability of financing options, home designs, reputation, home construction cycle time, and the design reputation, qualityoptions and amenities, includingupgrades that can be included in a home. In some cases, this competition occurs within larger residential development projects containing separate sections designed, planned and developed by such other homebuilders. In addition, weWe also compete for homebuyers against housing alternatives other thanto new homes, including resale homes, apartments, single-family rentals and other rental housing. In certain markets experiencing heavy construction activity, there can be severe craft and at times when housing demand is high, we also compete with other homebuilders and commercial and remodeling contractors to hire skilled trade labor, primarily on the basis of preexisting relationships, contract price and volume and consistency of available work. During the housing downturn, many skilled workers leftshortages that limit independent subcontractors’ ability to supply construction for other industries, andservices to us, which in markets where there was increased residentialturn tends to drive up our costs and/or extend our production schedules. Elevated construction activity in 2012, the smaller workforce and higher demand for trade labor created shortages of certain skilled workers, driving up costs and/or extending land development and home construction schedules. This elevated residential construction activityhas also caused notablecontributed to measurable increases in the cost of certain building materials, such as lumber, drywall and concrete, reflecting in part a smaller supplier base and lower production capacity than existed before the housing downturn. In 2012,concrete. Since 2013, we also sawhave seen higher prices for desirable land amid heightened competition with homebuilders and other developers and investors, particularly in the land-constrained areas we are strategically targeting. We expect these upward cost trends in construction labor, building materials and land costs to continue and possibly intensify, in 20132016 if and as the present housing recovery progressesmarket activity grows and there is greater competition for these resources.
Seasonality. Our performance is affected by seasonal demand trends for housing. Traditionally, there has been more consumer demand for home purchases and we tend to generate more net orders in the mid- to late-springspring and early summer months (corresponding to most of our second quarter and part of our third quarters)quarter) than at other times of the year. With our Built to Orderdistinct homebuying approach and typical
home construction cycle times, this “selling season” demand results in our delivering more homes and generating
higher revenues from late summer through the fall months (corresponding to part of our third quarter and all of our fourth quarters)quarter). On a relative basis, the winter and early spring months within our first quarter and part of our second quartersquarter usually produce the fewest net orders, homes delivered and revenues, and the sequential difference from our fourth quarter to our first quarter can be significant. During the housing downturn
Delivery Mix and in 2012, these seasonal trends were somewhat less pronounced, and our overall net orders, homes delivered and revenues were generally lower than before the housing downturn. We currently expect the traditional seasonality cycle and its impact on our results to become more prominent if and as the present housing recovery progresses and the housing markets and homebuilding industry return to a more normal operating environment.
Other Factors. In addition to the overall volume of homes we sell and deliver, our results in a given period are significantly affected by the geographic mix of markets and submarkets in which we operate; the number and characteristics of the new home communities we have open for sales in those markets and submarkets; and the products we sell from those communities during the period. While there are some similarities, there are differences within and between our served markets and submarkets in terms of the quantity, size and nature of the new home communities we operate and the products we offer to consumers. These differences reflect, among other things, local homebuyer preferences; household demographics (e.g.(e.g., large families or working professionals; income levels); and geographic context (e.g.(e.g., urban or suburban; availability of reasonably-pricedreasonably priced finished lots; development constraints; residential density),; and the shifts that can occur in these factors over time. These structural factors in each market and submarketof our served markets will affect the costs we incur and the time it takes to locate, acquire rights to and develop land, open new home communities for sales, and market and build homes; the size of our homes; our selling prices (including the contribution from homebuyers’ purchases of design options)options and upgrades); and the pace at which we sell and deliver homes and close out communities.communities; and our housing gross profits and housing gross profit margins. Therefore, our results in any given period will fluctuate compared to other periods based on the proportion of homes delivered from areas with higher or lower selling prices and on the corresponding land and overhead costs incurred to generate those deliveries, as well as from our overall community count. In 2012, we targeted opening more of our new home communities for sales in higher-performing, choice locations — predominately in land-constrained areas that feature higher household incomes — where customers are more likely to choose larger home sizes and purchase more design options, key drivers for our home selling prices and housing gross profit margins. Due in part to this strategic focus, in the second, third and fourth quarters of 2012, we posted favorable year-over-year results in revenues as we delivered more homes from these submarkets. At the same time, we had modest year-over-year growth in net orders in each period due largely to sequential declines in our overall community count, as we closed out older communities more quickly than we were able to develop and open new communities in our strategically-targeted areas. In 2013, we plan to continue our approach of opening new home communities for sales in locations with the above-described demand characteristics, and we anticipate that we will have more new home communities open for sales than we did in 2012.
Financing
We do not generally finance the development of our communities with project financing. By “project financing,” we mean proceeds of loans from parties other than land sellers that are specifically obtained for, or secured by, particular communities or other inventory assets. Instead, ourOur operations have historically been funded by resultsinternally generated cash flows, public equity and debt issuances, land option contracts and other similar contracts and land seller financing, and performance bonds and letters of operations, public debt and equity financing.credit. We also have the ability to borrow funds under our unsecured revolving credit facility with various banks (“Credit Facility”). Depending on market conditions in 2013,and available opportunities, we may obtain project financing, or secure external financing with community or other inventory assets that we own or control. By “project financing,” we mean loans that are specifically obtained for, or secured by, particular communities or other inventory assets. We may also arrange or engage in equity or debt capital markets, bank loan, credit facility, project debt or other financial transactions. These transactions may include repurchases from time to time of our outstanding senior notes or other debt through tender offers, exchange offers, private exchanges, open market purchases or other means, and may include potential new issuances of equity or senior notes or other debt through public offerings, private placements or other arrangements to raise new capital for land acquisition, land development and other business purposes and/or to effect repurchasesexpand the capacity of our outstanding senior notes or other debt. Our ability to engage in such financial transactions, however, may be constrained by economic or capital markets or bank lending conditions, investor interest and/the Credit Facility or our current leverage ratios, and we can provide no assurancecash-collateralized letter of the successcredit facilities with various financial institutions (the “LOC Facilities”) or costs of anyenter into additional such transactions.facilities.
Environmental Compliance Matters and Sustainability
As part of our due diligence process for land acquisitions, we often use third-party environmental consultants to investigate potential environmental risks, and we require disclosures, and representations and warranties from land sellers regarding environmental risks. Despite these efforts, there can be no assurance that we will avoid material liabilities relating to the existence or removal of toxic wastes, site restoration, monitoring or other environmental matters affecting properties currently or previously owned or controlled by us. No estimate of any potential liabilities can be made although we may, from time to time, acquire property that requires us to incur environmental clean-up costs after conducting appropriate due diligence, including, but not limited to, using detailed investigations performed by environmental consultants. In such instances, we take steps prior to our acquisition of the land to gain reasonable assurance as to the precise scope of work required and the costs associated with removal, site restoration and/or monitoring. To the extent contamination or other environmental issues have occurred in the past, we will attempt to recover restoration costs from third parties, such as the generators of hazardous waste, land sellers or others in the prior
chain of title and/or their insurers. Based on these practices, we anticipate that it is unlikely that environmental clean-up costs will have a material effect on our consolidated financial statements. We have not been notified by any governmental agency of any claim that any of the properties owned or formerly owned by us are identified by the EPAU.S. Environmental Protection Agency (or similar state or local agency) as being a “Superfund” (or similar state or local) clean-up site requiring remediation, which could have a material effect on our future consolidated financial statements. Costs associated with the use of environmental consultants are not material to our consolidated financial statements.
We have made a dedicated effort to further differentiate ourselves from other homebuilders and resale homes through our ongoing commitment to become a leading national company in environmental sustainability. We continually seek out and utilize innovative technologies and systems to further improve the energy and water efficiency of our homes, as well as engage in campaigns and other educational efforts, sometimes together with other companies, organizations and groups, to increase consumer awareness of the importance and impact of sustainability in selecting a home and the products within a home. Under our commitment to sustainability, we, among other things:
build energy- and water-efficient new homes;
developed an Energy Performance Guide®, or EPG®, that informs our homebuyers of the relative energy efficiency and the related estimated monthly energy costs of each of our homes as designed, compared to typical new and existing homes; and
created and are adding more net-zero energy and zero freshwater design options, under a program called Double ZeroHouse™ 3.0, that are available in select markets.
More information about our sustainability commitment can be found in our annual sustainability reports, which we have published on our website since 2008. We intend to continue to research, evaluate and utilize new or improved products and construction and business practices consistent with our commitment and believe our sustainability initiatives can help put us in a better position, compared to resale homes and homebuilders with less-developed programs, to comply with evolving local, state and federal rules and regulations intended to protect natural resources and to address climate change and similar environmental concerns.
Access to Our Information
We fileOur annual reports on Form 10-K, quarterly andreports on Form 10-Q, current reports on Form 8-K, beneficial ownership reports on Forms 3, 4 and 5 and proxy statements, and other informationas well as all amendments to those reports are available free of charge through our investor relations website at http://investor.kbhome.com, as soon as reasonably practicable after such reports are electronically filed with, or furnished to, the Securities and Exchange Commission (“SEC”). We make our public SEC filings available, at no cost, through our investor relations website at www.investor.kbhome.com, as soon as reasonably practicable after the report is electronically filed with, or furnished to, the SEC. We will also provide these reports in electronic or paper format free of charge upon request made to our investor relations department at investorrelations@kbhome.com or at our principal executive offices. We intend for our investor relations website to be the primary location where investors and the general public can obtain announcements regarding, and can learn more about, our financial and operational performance, business plans and prospects, and our board of directors, our senior executive management team, and our corporate governance policies, including our articles of incorporation, by-laws, corporate governance principles, board committee charters, and ethics policy. We webcast and archive quarterly earnings calls and other investor events in which we participatemay from time to time choose to disclose or host, and post related materials,important information about our business on our investor relations website. Interested persons can register onor through our investor relations website, to receive prompt notifications of new SEC filings, press releasesand/or through other electronic channels, including social media outlets, such as Twitter (Twitter.com/KBHome), and other information posted there. However, theevolving communication technologies. The content available on or through our primary website at www.kbhome.com, or our investor relations website, including our sustainability reports, or social media outlets and other evolving communication technologies is not incorporated by reference in this report or in any other filing we make with the SEC. OurSEC, and our references in our SEC filings or otherwise to materials posted on or to anysuch content available on or through our websites are intended to be inactive textual or oral references only. Our SEC filings are also available to the public over the Internet at the SEC’s website at www.sec.gov. The public may also read and copy any document we file at the SEC’s public reference room located at 100 F Street N.E., Washington, D.C. 20549. Please call the SEC at 1-800-SEC-0330 for further information on the operation of the public reference room.
The following important factors could adversely impact our business. These factors could cause our actual results to differ materially from the forward-looking and other statements that (i)(a) we make in registration statements, periodic reports and other filings with the SEC and from time to time in our news releases, annual reports and other written reports or communications, (ii)(b) we post on or make available through our primary website at www.kbhome.com websites and/or our investor relations website at www.investor.kbhome.com,through other electronic channels, and (iii)(c) our personnel and representatives make orally from time to time.
The recent improvement inSoft or negative economic or housing market conditions following a prolonged and severe housing downturn may not continue, and any slowing or reversal of the present housing recovery generally or in our served markets or for the homebuilding industry may materially and adversely affect our business and consolidated financial statements.
InSince 2012, the housing market has continued to improve compared to the several housing markets stabilized and began recovering afterdifficult years of weak demand and excess supply during the housing downturn. In these markets, there were generally more salesdownturn from mid-2006 through 2011. The improvement has been driven primarily by steady demand for homes, fairly low inventories of new and resale homes, higher selling prices and fewer homes available for sale in each case as compared to the prior year. There were also more overall housing starts and construction permits authorized in the U.S., reflecting increased residential construction activity. These trends have been driven in large part by record-low interest rates for mortgage loans that, in combination with relatively low home selling prices, have made homeownership more affordable compared to historical levelsgenerally healthy economic and to rental housing costs, which have been rising over the past few years.
With the emerging housing recovery, we and other homebuilders for the most part reported higher orders and deliveries and better financial results in 2012 than in 2011, a year in which a record-low number of new homes were sold in the country.demographic factors. However, the improved conditions did not (and may not) extend to a numberperformance of individual housing markets we serve,varied throughout 2015, with home sales activity and someselling price appreciation robust in certain markets have been stronger than others. and tepid in others due to, among other things, rising housing prices and/or inventory levels.
We expect that such unevenness will continue in 2013 and beyond whether or not the present housing recovery progresses, and that prevailing conditions in various housing markets will fluctuate, perhaps significantly and unfavorably in future periods. In addition, while some of the many negative factors that contributed to the housing downturn may have moderated in 2012, several remain, and they could return and/or intensify to inhibit any future improvement in housing market conditions will continue in 2013.2016 and beyond, and that there will be fluctuations among and within individual housing markets. These negative factors include (a) fluctuations may be significant and unfavorable, and could be more pronounced and/or prolonged in our served markets. Our operations and consolidated financial statements can be substantially affected by adverse changes in prevailing business conditions, including, among others:
weak general economic, income and employment growth;
diminished population growth, that, amonghousehold formations and other things, restrainsnegative demographic changes;
high consumer incomes, consumer confidence and demand for homes; (b)debt levels, including elevated levels of mortgagestudent loan balances;
delinquencies, defaults and foreclosures that could add to a “shadow inventory” of lender-owned homes that may be soldon mortgage loans;
increases in competition with new and other resale homes at low “distressed” prices or that generate short sales activity at such price levels; (c) a significant number of homeowners whose outstanding principal balance on their mortgage loan exceeds the market value of their home, which underminesinterest rates;
their ability to purchase another home that they otherwise might desire and be able to afford; (d) volatility and uncertainty in domestic and international financial, creditcapital and consumer lending markets amid slow growthmarkets;
lack of availability of or recessionary conditions in various regions around the world; and (e) tight lending standards and practicesprohibitive costs for mortgage loans that limit consumers’ ability to qualifyloans;
increased personal income tax rates and/or more restrictive personal income tax deduction provisions, including for the deduction of mortgage financing to purchaseloan interest payments, real estate taxes and other homeownership-related expenses;
limited homebuyer interest in our product designs and/or community locations; and
lack of consumer interest in purchasing a home including increased minimum credit score requirements, credit risk/mortgage loan insurance premiums and/orcompared to other fees and required down payment amounts, more conservative appraisals, higher loan-to-value ratios and extensive buyer income and asset documentation requirements. Additional headwinds may come from the efforts and proposals of lawmakers to reduce the debt of the federal government through tax increases and/or spending cuts, and financial markets’ and businesses’ reactions to those efforts and proposals, which could impair economic growth. Given these factors, wehousing alternatives.
We can provide no assurance that these factors, which are outside of our control, will not occur, persist for an extended period and/or worsen, or that the presentgenerally favorable housing recoverymarket conditions at present will continue for any length of time. Inclement weather, natural disasters (such as earthquakes, hurricanes, tornadoes, floods, droughts and fires), and other environmental conditions can delay the delivery of our homes and/or gain further momentum, whether overall or inincrease our served markets.costs. Civil unrest and acts of terrorism, and government responses to such acts, can also have a negative effect on our business.
The present housing recovery is relative to an extremely low level of consumer demand for homes, home sales and new residential construction activity, reflecting the severity of the housing downturn. Even with the upturn in 2012, our and the homebuilding industry’s sales, deliveries, revenues and profitability remain well below, and may not return to, the peak levels reached shortly before the housing downturn began. If, on an overall basis or in our served markets, the presenteconomic or housing recovery stallsenvironment becomes more challenging; home sales or doesselling prices do not continue to advance at the same pace as in recent years or decline; or any or all of the negative factors or events described above occur, persist and/or worsen, particularly if there is limited economic growth or a decline, low growth or decreases in employment and consumer incomes, and/or continued tight mortgage lending standards and practices, there would likely be a corresponding adverse effect on our business and our consolidated financial statements, including, but not limited to, the number of homes we deliver, our average selling prices, the amount of revenues we generate, our housing gross profit margins and our ability to operate profitably, and the effect may be material.
Continued or additional tightening of mortgage lending standards and practices and/or mortgage financing requirements or volatility in financial, credit and consumer lending marketsinterest rate increases could adversely affect the availability or affordability of mortgage loans for potential purchasersbuyers of our homes and thereby reduce our sales.net orders.
Since 2008, theMortgage lenders have stopped offering certain mortgage lendingloan products and mortgage finance industries have experienced significant instabilitysignificantly tightened their credit standards primarily due to among other things,the relatively high rates of delinquencies, defaults and foreclosures on mortgage loans and a corresponding declinefluctuations in their market value and the market value of securities backed by such loans althoughduring the housing downturn, and regulatory rules and enforcement actions (including sanctions, penalties and fines). As a result, it is generally difficult for some potential borrowers to finance the purchase of a home, causing volatility in and elevating cancellation rates for us and other homebuilders, and reducing demand for homes, including our homes. If mortgage lending standards further tighten, or mortgage lenders further curtail their product offerings, there was some modest improvement in these areas in 2012. The delinquencies, defaultscould be a material adverse effect on our business and foreclosures have been driven in part by persistent poor economic and employment conditions, which have negatively affected borrowers’ incomes, and by a decline in the values of many existing homes in various markets below the principal balance of theour consolidated financial statements, as we depend on such lenders (including HCM) to provide mortgage loans securedthat our buyers typically require to purchase our homes. Higher mortgage loan interest rates, which may result from the Federal Reserve deciding to increase the federal funds rate and/or investors’ expectations as to the Federal Reserve’s potential actions to influence interest rates, could also measurably reduce demand for our homes by such homes. A numberincreasing borrowers’ financing costs, and thereby have a material adverse effect on our consolidated financial statements.
In addition, federal regulators and lawmakers have considered steps that may significantly reduce the ability or authority of providers, purchasers and insurers of mortgage loans and mortgage loan-backed securities have gone out of business or exited the market, with most mortgage loans currently being originated under programs offered or supported by government agencies or government-sponsored enterprises — principally, the Federal Housing Administration (“FHA”), the Veterans Administration (“VA”), the Federal National Mortgage Association (also known as “Fannie Mae”) and the Federal Home Loan Mortgage Corporation (also known as “Freddie Mac”). Compared to prior periods, this instability and increased government role inpurchase or insure mortgage loans under their respective programs. Further, given federal budget deficits, the U.S. Treasury may not be able to continue, or may be required by future legislation or regulation to cease, supporting the mortgage financing market has led to reducedloan-related activities of Fannie Mae, Freddie Mac, the FHA and the Veterans Administration (“VA”) at present levels. The availability and affordability of mortgage loans, including interest rates or the costs for such loans, could be significantly diminished by a scaling back, tightening or termination of the federal government’s mortgage loan-related programs. Because Fannie Mae-, Freddie Mac-, FHA- and VA-backed mortgage loans have been a critical source of liquidity for the mortgage finance industry and an important factor in marketing and selling many of our homes, any limitations or restrictions on the availability of, or higher consumer costs for, such government-backed financing could reduce our net orders and adversely affect our business and consolidated financial statements, and the effect could be material. Given the above and other factors, we can provide no assurance as to mortgage lenders’ (including HCM’s) ability or willingness to provide mortgage loans and other mortgage banking services to our homebuyers in future periods or as to their performance in doing so.
The mortgage banking operations of HCM are heavily regulated and subject to rules and regulations promulgated by a number of governmental and quasi-governmental agencies. If Nationstar, which provides management oversight of HCM’s operations, decides to end, or we decide to terminate, our relationship with respect to HCM or otherwise, or there is a finding that Nationstar or HCM materially violated any applicable rules or regulations and as a result is restricted from or unable to originate mortgage loans, our customers may experience significant mortgage loan products (particularly subprimefunding issues, which could lower our net orders and nonconforming loans),revenues, and, tighter lending standards and practices for mortgage loans, as described above. As a result, it is generally more difficult for some categories of borrowers to finance the purchase of homes, including our homes. Overall, these factorsin turn, have slowed the housing market’s recovery, caused volatility in and generally elevated cancellation rates for us and other homebuilders, and reduced demand for homes, including our homes. If these factors continue, or if mortgage lending standards and practices further tighten, we expect that there would be a material adverse effectimpact on our business and our consolidated financial statements, particularly since we depend on third-party lenders (including our preferred mortgage lender Nationstar) to providestatements. In addition, while substantially all of the mortgage loans to our homebuyers.
Further tighteningoriginated by HCM are sold within a short period of time in the secondary mortgage lending standardsmarket on a servicing released, non-recourse basis, HCM remains potentially responsible for certain limited representations and practices and/or reduced credit availability for mortgages may also result from the implementation of regulations under the 2010 Dodd-Frank Wall Street Reform and Consumer Protection Act (the “Dodd-Frank Act”). Among other things, the Dodd-Frank Act established several requirements (including risk retention obligations) relating to the origination, securitizing and servicing of, and consumer disclosures for,warranties it makes in connection with such mortgage loans. In addition, U.S. and international banking regulators have proposed or enacted higher capital standards and requirements for financial institutions. These standards and requirements, as and when implemented, are expected to further reduce the availability of and/or increase the costs to borrowers to obtain mortgage loans. Federal regulators and lawmakers are also considering steps that may significantly reduce the ability or authority ofloan sales. Mortgage investors, including the FHA, Fannie Mae and Freddie Mac, could seek to purchase or insurehave HCM buy back mortgage loans underor compensate them for losses incurred on mortgage loans HCM has sold based on claims that it breached its limited representations or warranties. HCM has established reserves for potential losses. However, there can be no assurance that HCM will not have significant liabilities with respect to such claims in the programsfuture, which could exceed its reserves, or that manythe impact of such claims will not be material to HCM’s financial condition or ability to operate, or cause us to recognize losses with respect to our equity interest in HCM, or cause our customers to seek mortgage loans from other lenders use to originate mortgage loans. Further, since 2010, lenders and other mortgage banking services providers, brokers and other institutions, and/or their agents, have been under intense regulatory scrutiny and the targets of several civil actions by investors and government agencies regardingexperience mortgage loan underwriting practicesfunding issues that could delay our delivering homes to them and/or representations made in connectioncause them to cancel their home purchase contracts with selling mortgage loans into private or Fannie Mae- or Freddie Mac-backed securitized pools. If such scrutiny and civil actions result in lenders and other mortgage banking services providers and brokers having to adjust their operations and/or pay significant amounts in damages or fines, they may further curtail or cease their mortgage loan origination activities due to reduced liquidity or to mitigate perceived risks.
In 2012, the Federal Reserve announced that it would purchase each month billions of dollars of longer-term Treasury securities and mortgage loan-backed securities of Fannie Mae, Freddie Mac and the Government National Mortgage Association (or “Ginnie Mae,” which guarantees securities composed of FHA- and VA-qualified mortgage loans) until it determines that there is sufficient improvement in U.S. employment levels. It expects that this action will maintain downward pressure on longer-term interest rates, support mortgage markets and help to make broader financial conditions more accommodative. While the Federal Reserve’s action has helped to lower mortgage loan interest rates, it is unclear whether the program will be successful in keeping such interest rates low or in meeting the Federal Reserve’s policy goals, or for how long it will be in place. Even if the program does keep mortgage loan interest rates at low levels, many potential homebuyers may still be unable to obtain mortgage loans to purchase homes, including our homes, if mortgage lending standards and practices remain tight or tighten further, or if lenders curtail or cease mortgage loan origination activity due to regulatory requirements and/or liquidity or risk concerns.us.
Third-party lenders may not complete mortgage loan originations for our homebuyers in a timely manner or at all, which can lead to cancellations and a lower our backlog of net orders, or to significant delays in our delivering homes and our recognizing revenues from those home sales.homes.
Our homebuyersbuyers may obtain mortgage financing for their home purchases from any lender or other provider of their choice.choice, including HCM. If, due to credit or consumer lending market conditions, reduced liquidity, increased risk retention or minimum capital level obligations and/or regulatory restrictions related to the Dodd-Frank Act or other laws,requirements, or other factors or business decisions, these lenders refuse or are unable to provide mortgage loans to our homebuyers,buyers, the number of homes we deliver, our business and our consolidated financial statements may be materially and adversely affected. For instance, tight
Based on the number of homes we delivered in 2015, approximately 61% of our buyers who obtained mortgage lending standards and practices forfinancing used HCM to finance the purchase of their home. Although we expect an increasing percentage of our homebuyers will choose to use HCM, many of our homebuyers will continue to seek mortgage loans have in recent periods ledfrom other lenders and be subject to significant delays in delivering homes and/or have caused some potential homebuyersthose lenders’ ability to cancel their home purchase contracts with us.perform. We can provide no assurance that these tight mortgage lending conditions will relaxas to other lenders’ ability or reverse in the foreseeable future.
In addition, in the first half of 2012, as we ended a preferred mortgage lender relationship with a provider that had decided to cease offering forward mortgage banking services and were transitioning to Nationstar as our preferred mortgage lender, we experienced significant disruptions to our business due to the inability or unwillingness of several independent third-party lenderswillingness to complete, in a timely fashion or at all, the mortgage loan originations they had startedstart for our homebuyers. As aSuch inability or unwillingness may result in our first quarter and for part of the second quarter of 2012, we had an elevated level of cancellations and delayed closings, which negatively affected our net orders and revenues. Nationstar began accepting new mortgage loan applications from our homebuyers on May 1, 2012, and is providing more consistent execution and completion of mortgage loan originations for our homebuyers who choose to use Nationstar. Based on the number of homes delivered in the month of November 2012, approximately 58% of our homebuyers used Nationstar to finance the purchase of their home. Compared to most of the first half of 2012, Nationstar’s performance as our preferred lender has helped to provide more stability in the conversion of our backlog into home deliveries and revenues. Although we expect continued improvement in this area as our relationship with Nationstar as our preferred mortgage lender further matures and Nationstar becomes more closely integrated with our operations, we can provide no assurance as to Nationstar’s ability or willingness to provide mortgage loans and other mortgage banking services to our homebuyers in future periods (whether due to the factors discussed above or otherwise), or as to its performance in doing so, or that Nationstar will remain our preferred mortgage lender. If Nationstar’s performance declines or Nationstar decides to end, or we decide to terminate, our relationship, we may experience mortgage loan funding issues similar to those we experiencedthat slow deliveries of our homes and/or cause cancellations, which in the first half of 2012 (as described in Note 6. Inventory Impairments and Land Option Contract Abandonments in the Notes to Consolidated Financial Statements in this report), whicheach case would likely have a material adverse impacteffect on our business and our consolidated financial statements. Our strategic intention isIn addition, recent changes to reestablish a mortgage banking joint venture with a lender or other provider, but we can provide no assurance that we will be ableloan disclosure requirements to do so.consumers may potentially delay lenders’ (including HCM’s) completion of the mortgage loan funding process for borrowers and, therefore, extend the delivery of homes to our buyers beyond the time anticipated.
Our current strategies may not generate improved financial and operational performance, and the continued implementation of these and other strategies may not be successful.
We believe the integrated strategic actions we have taken during the housing downturn strengthened our overall business and that our current primary strategies as described above under “Item 1. Business — Strategy,”and initiatives will enable us to continue to profitably grow our business in 2016. However, our strategic and achieve and maintain profitability at the scale of prevailing market conditions for 2013. However, these strategiesoperational actions, including, but not limited to, our plans to expand our community count, may prove to be unsuitable for some or all of our served markets in 2013, and wemarkets. We can provide no guarantee that theseour strategies, initiatives or actions will be successfully or productively implemented or, even if they are implemented as designed,successful, that they will generate growth andor earnings or returns at any level or within any time frame, or that we will achieve in 20132016 or beyond positive operational or financial results or results in any particular metric or measure equal to or better than our 20122015 performance, or perform in any period as well as other homebuilders. In particular,addition, we can provide no assurance that our strategic effortcommunity locations and products (or any refining of our products) will successfully attract consumers, command selling prices, or generate orders, revenues and/or housing gross profit margins at the levels we have experienced in the past or anticipate in future periods, at levels sufficient for us to broaden our performing asset base by activating certain inventory that was previously held for future development may not generate positive results as many of these assets are located in submarkets that have only recently begun to stabilize.be profitable or at levels higher than other homebuilders. We also cannot provide any assurance that we will be able to maintain these strategies, initiatives or actions in 20132016 and, due to unexpectedly favorable or unfavorable market conditions or other factors, we may determine that we need to adjust, refine or abandon all or portions of these
strategies, initiatives or actions, although we cannot guarantee that any such changes will be successful. The failure of any one or more of our present strategies, initiatives or actions, or the failure of any adjustments or alternative strategies, initiatives or actions that we may pursue or implement, to be successful willwould likely have an adverse effect on our ability to grow and increase the value and profitability of our business, to meet our debt service and other obligations necessary to operate our business in the ordinary course, and on our consolidated financial statements, as well as on our overall liquidity, and the effect in each case could be material.
The success of our present strategies, growth initiatives and our long-term performance depends on the availability of finished and partially finished lots and undevelopeddevelopable land that meetmeets our investment return and marketing standards.
The availability of developable land, particularly finished and partially finished lots, and undeveloped land that meetmeets our investment return and marketing standards depends on a number of factors outside of our control, including, among other things, land availability in general, geographical/topographical constraints, land sellers’ business relationships, with other homebuilders, developers or investors, climate conditions, competition with other homebuilders and land buyers for desirable property, financial and credit market conditions, legal or government agency processes (particularly for land that is part of bankruptcy estates or is held by financial institutions taken over by government agencies), inflation in land prices, zoning, allowable housing density,utility service company processes, our ability and the costs to obtain building permits the amount of environmental impact fees, property tax rates and other regulatory requirements.approvals and prevailing conditions in the marketplace for land. Should suitable lots or land become less available, the number of homes that we may be able to build and sell could be reduced, andreduced. In addition, the cost of attractive land could continue to increase perhaps substantially, which couldand adversely impact our consolidated financial statements including, but not limited to, our housing gross profit margins, our consolidated financial statements and our ability to maintain ownership or control of a sufficient supply of developed or developable land inventory.to meet our production goals. The availability of suitable land could also affect the success of our current strategies and growth initiatives. Further, if we decide to reduce our land acquisition of new landactivity in 20132016 below our current plans due to a lack of available assets that meet our standards, our ability to increase our community count, to maintain or grow our revenues and housing gross profit margins,profits and to achievemaintain or maintainincrease our profitability in 2016 and beyond, would likely be constrained and could have a material adverse effect on our business and consolidated financial statements.
The value of the land and housing inventory we own or control may fall significantly.
The value of the land and housing inventory we currently own or control depends on market conditions, including estimates of future demand for, and the revenues that can be generated from, this inventory. The market value of our inventory can vary considerably because there is often a significant amount of time between our acquiring control or taking ownership of land and the delivery of homes on that land. The negative conditions of the housing downturn, which generally depressed home sales and selling prices, caused the fair value of certain of our owned land, particularly undeveloped and/or controlled inventory to fall, in some cases well below the estimated fair value at the time we acquired ownership or control. Even with the improved housing market conditions in 2012, local submarket-specific or other factors led to a decrease in the fair value of certain of our inventory and such decreases may occur in 2013 whether or not the present housing recovery progresses.unentitled land. Based on our periodic assessments of our inventory for recoverability, during the housing downturn and in 2012, we have from time to time written down the carrying value of certain of our inventory to its estimated fair value, including inventory that wevalue. We have previously written down, andalso recorded corresponding charges against our earnings to reflect the impaired value. We have also taken charges in connection with activating or selling certain land held for future development and with abandoning our interests in certain land controlled under land option contracts and other similar contracts that no longer met our investment return or marketing standards. If, in 20132016, the present economic or housing recovery slows or reverses, orenvironment weakens, if particular markets or submarkets experience challenging or unfavorable changes in prevailing business conditions, or if we elect to revise our marketing strategy relating to certain land positions, we may need to takerecord additional charges against our earnings for inventory impairments or land option contract abandonments, or both, or in connection with land sales to reflect changes in fair value of land or land interests in our inventory, including assets we have previously written down. Any such charges could have a material adverse effect on our consolidated financial statements, including our ability to achieve or maintain profitability.
Our business is cyclical and is significantly affected by changes in general and local economic conditions.
Our operations and consolidated financial statements can be substantially affected by adverse changes in general economic or business conditions that are outside of our control, including changes in:
short- and long-term interest rates;
employment levels and job and personal income growth;
housing demand from population growth, household formation and other demographic changes, among other factors;
availability and pricing of mortgage financing for homebuyers;
consumer confidence generally and the confidence of potential homebuyers in particular;
U.S. and global financial system and credit market stability;
private party and government mortgage loan programs (including changes in FHA, Fannie Mae- and Freddie Mac-
conforming mortgage loan limits, credit risk/mortgage loan insurance premiums and/or other fees, down payment requirements and underwriting standards), and federal and state regulation, oversight and legal action regarding lending, appraisal, foreclosure and short sale practices;
federal and state personal income tax rates and provisions, including provisions for the deduction of mortgage loan interest payments, real estate taxes and other expenses;
supply of and prices for available new or resale homes (including lender-owned homes) and other housing alternatives, such as apartments, single-family rentals and other rental housing;
homebuyer interest in our current or new product designs and new home community locations, and general consumer interest in purchasing a home compared to choosing other housing alternatives; and
real estate taxes.
Adverse changes in these conditions may affect our business nationally or may be more prevalent or concentrated in particular submarkets in which we operate.
Inclement weather, natural disasters (such as earthquakes, hurricanes, tornadoes, floods, droughts and fires), and other environmental conditions can delay the delivery of our homes and/or increase our costs. Civil unrest or acts of terrorism can also have a negative effect on our business.
The potential difficulties described above can cause demand and prices for our homes to fall or cause us to take longer and incur more costs to develop the land and build our homes. We may not be able to recover these increased costs by raising prices because of market conditions and because the price of each home we sell is usually set several months before the home is delivered, as our customers typically sign their home purchase contracts before home construction begins. The potential difficulties could also lead some homebuyers to cancel or refuse to honor their home purchase contracts altogether. Reflecting the difficult conditions in our served markets during the housing downturn, we have experienced volatility in our net orders and cancellation rates in recent years, and if the present housing recovery slows or reverses, we may experience similar or increased volatility in 2013. If we do, there could be a material adverse effect on our consolidated financial statements.profitability.
Home selling prices and sales activity in the particular markets and regions in which we do business materially affect our consolidated financial statements because our business is concentrated in these markets.
Home sales activity and selling prices and sales activity in some of our key served markets have declinedvaried from time to time for market-specific and other reasons, including adverse weather, high levels of foreclosures, short sales and sales of lender-owned homes, and lack of affordability or economic contraction due to, among other things, the departure or decline of key industries, higher-wage jobs and employers.employers that could effectively price potential homebuyers out of purchasing homes, including our homes. If home sales activity or selling prices or sales activity decline in one or more of our key served markets, including California, Florida, Nevada or Texas, our costs may not decline at all or at the same rate and, as a result, our consolidated financial statements may be materially and adversely affected. Adverse conditions in California where we are the state’s largest homebuilder based on new home sales, would have a particularly material effect on our consolidated financial statements as our average selling price in the state is higher than our average selling prices in the states within our other homebuilding reporting segments, a large percentage of our housing revenues is generated from California, and a significant proportion of our inventory-related investments since late 2009 werein land and land development have been made, and in 20132016 are expected to be made, in that state. California’s
In recent years, many state, government and many of its regional and local governments in our served markets have struggled to balance their budgets due to a number of factors that in part reflect the impact of the 2007-2009 economic recession. These include lower tax revenues; higher debt service, public employee pension and social welfare obligations; lower federal government support; and, for regional and local governments and redevelopment agencies, various reductions, eliminations or reversals of state government support.factors. As a result, there have been and lawmakers have proposed making additional, significant cuts to government departments, subsidies, programs and public employee staffing levels, andwhile taxes and fees have been raised, and lawmakers have proposed additional tax and fee increases, in an effort to balance governmental budgets. A few municipalities have declared bankruptcy, and others are considering such a step. California lawmakers’increased. Lawmakers’ efforts at all governmental levels to address ongoing and/or projectedthese budget deficits through spending cutsdeficit issues and/or efforts to increase governmental revenues, could, among other things, cause businesses and residents to leave, the state, or discourage businesses or households from coming to, the state, which would limitaffected served markets, thereby limiting economic growth; causegrowth and/or resulting in significant delays and/or higher costs in obtaining required inspections, permits or approvals with respect to residentialthe development atof our new home communities located in the state, or result in higher costs for such permits or approvals; and could delay or prevent the release or repayment by applicable municipalities and other government agencies of performance bonds, letters of credit and/or similar deposits we have made in connection with our residential development activities.markets. These negative impacts could adversely affect our ability to generate net orders and revenues and/or to maintain or increase our housing gross profit margins fromin such markets, and the impact could be material and adverse to our California operations.consolidated financial statements.
Negative environmental impacts from, and legal and regulatory requirements in response to, severe and prolonged drought conditions in Arizona, California and Nevada could adversely affect our business and results of Contentsoperations in those regions and our consolidated financial statements.
Certain areas in which we operate, particularly parts of Arizona, California and Nevada, are experiencing extreme or exceptional drought conditions. In response to these conditions and concerns that they may continue for an extended period of time or worsen, government officials have taken, or have proposed taking, a number of steps to preserve potable water supplies. For instance, in 2015, California declared a state of emergency and mandated that local water agencies and other water suppliers achieve specific reductions in potable urban water use through at least February 28, 2016. The state also prohibited irrigation with potable water outside certain newly constructed homes and buildings with landscape areas larger than 2,500 square feet.
To address the state’s mandate and their own available potable water supplies, local water agencies/suppliers could potentially restrict, delay the issuance of, or proscribe new water connection permits for homes or businesses; increase the costs for securing such permits, either directly or by requiring participation in impact mitigation programs; adopt higher efficiency requirements for water-using appliances or fixtures; limit or ban the use of water for construction activities; impose requirements as to the types of allowed plant material or irrigation for outdoor landscaping that are more strict than state standards and less desired by consumers; and/or impose fines and penalties for noncompliance with any such measures. These local water agencies/suppliers could also increase rates and charges to residential users for the water they use, potentially increasing the cost of homeownership. We can offer no assurance whether, where and the extent to which these or additional conservation measures might be imposed by local water agencies/suppliers in California or by other federal, state or local lawmakers or regulators in Arizona, California and Nevada. However, if potable water supplies become further constrained due to persistent drought conditions, tighter conservation requirements may be imposed that could limit, impair or delay our ability to acquire and develop land, and/or build and deliver homes (even if we have obtained water connection permits); increase our production costs; or cause the fair value of affected land or land interests in our inventory to decline, which could result in inventory impairment or land option contract abandonment charges, or both; or negatively affect the economies of, or diminish consumer interest in living in, water-constrained areas. These impacts, individually or collectively, could adversely affect our business and consolidated financial statements, and the effect could be material.
Supply shortages and other risks related to demand for building materials and/or skilled trade laborconstruction resources could increase our costs and delay our deliveries.
As discussed above under “Item 1. Business — Competition, Seasonality, Delivery Mix and Other Factors,” there is a high level of competition in the homebuilding industry and the housing market for skilled trade labor and building materials that can, among other things, cause increases in land development and home construction costs and development and construction delays. Also, in 2012, a smaller pool of skilled trade labor due to the housing downturn led to shortages in some markets that experienced increased residential construction activity, and such shortages could occur in 2013 if and as the present housing recovery progresses. Shortages or upward price fluctuations in lumber, drywall, concrete and other building materials, and labor,construction services, whether due to a small supplier baseindependent subcontractor or outside supplier capacity constraints, increasedheavy residential construction activity, international demand,competition with other homebuilders or construction firms, the occurrence of or rebuilding after natural disasters or other reasons, can also have an adverse effect on our business.business by increasing our production costs and/or extending our production schedules. We generally are unable to pass on increases in land development and home construction costs to homebuyers who have already entered into home purchase contracts, as the purchase contracts generally fix the price of the home at the time the contract is signed, and may be signed well in advance of when home construction commences. We also may not be able to raise our selling prices to cover such cost increases in land development and home construction costsor delays because of market conditions, including competition for homebuyers withfrom other homebuilders and resale homes. Sustained increases in land development and home constructionour production costs due to higher trade labor rates construction resource prices and/or elevated lumber, drywall, concrete and other building materials pricesour limited ability to successfully contain these costs may, among other things, decrease our housing gross profit margins, while construction resource shortages of skilled trade labor or building materials due to competition or other factors may delay deliveries of our homes to buyers and our recognition of revenues. As a result, these negative items, individually or together, cancould have a material and adverse impact on our consolidated financial statements.
Inflation may adversely affect us by increasing costs that we may not be able to recover, particularly if our home selling prices decrease, and the impact on our performance and our consolidated financial statements could be material.
Inflation can have an adverse impact on our business and consolidated financial statements because increasing production costs for land, skilled trade labor or building materials could require us to increase our home selling prices in an effort to maintain satisfactory housing gross profit margins. In 2010 and 2011, worldwide demand for certain commodities and monetary policy actions led to price increases and price volatility for raw materials that are used in land development and home construction, including lumber and metals. Additionally, increased residential construction activity in 2012 in combination with a relatively small supplier base boosted prices for lumber, drywall, concrete and other raw materials, and these trends are expected to continue in 2013 if and as the present housing recovery progresses. These pricing trends, taken together with U.S. and international central bank and governmental policies and programs designed to boost economic growth, may lead to a general increase in inflation. However, we may not be able to increase our home selling prices to cover cost inflation in production costs due to market conditions, and we may need to hold or reduce our selling prices, or offer sales incentives or discounts, in order to compete for home sales. If determined necessary, our lowering of home selling prices and/or using sales incentives or discounts, in addition to impacting our housing gross profit margins, may also reduce the value of our land inventory, including the assets we have purchased in recent years, and make it more difficult for us to fully recover the costcosts of previously purchasedour land withand any related community development through our home selling prices or, if we choose, in disposing of land.through land sales. In addition, depressed land values may cause us to abandon and forfeit deposits on land option contracts and other similar contracts if we cannot satisfactorily renegotiate the purchase price of the subject land. We may incurrecord charges against our earnings for inventory impairments if the value of our owned inventory, including land we decide to sell, is reduced, or for land option contract abandonments if we choose not to exercise land option contracts or other similar contracts, and these charges may be substantial as we experienced in certain periods during the housing downturn.substantial. Inflation may also increase interest rates for mortgage loans and thereby reduce demand for our homes and lead to lower revenues, as well as increase the interest rates we may need to accept to obtain external financing for external financing.our business operations.
Reduced home sales may impair our ability to recoup development costs or force us to absorb additional costs.
We incur many costs before we begin to build homes in a community. Depending on the stage of development a land parcel is in when acquired, we may incur expenditures for developing land into a community, such costs may include costs of preparing land;as entitling and finishing lots and entitling lots; installing roads, sewers, water systems and other utilities; taxes and other costslevies related to ownership of the land on which we plan to buildland; constructing model homes; and promotional marketing and overhead expenses to prepare for the opening of a new homethe community for home sales. In addition,Moreover, local municipalities may impose various and sometimes unanticipated development-related requirements resulting in additional costs.costs or delays. If the rate at which we sell and deliver homes slows or falls, or if we delay theour opening of new home communities for home sales is delayed due to adjustments in our marketing strategy, protracted governmental approval processes or utility service activations, or other reasons, each of which has occurred throughout the housing downturn, we may incur additional costs, which would adversely affect our housing gross profit margins, and it will take a longer period of time for us to recover our costs, including the costs we incurred in acquiring and developing land in recent years. Furthermore, due to market conditions during the housing downturn, we have abandoned some land option contracts and other similar contracts to purchase land, resulting in the forfeiture of non-refundable deposits and unrecoverable pre-acquisition costs. If the present housing recovery slows or reverses in 2013, weWe may also decide to abandon certain land option contracts and other similar contracts, and sell certain land at a loss, and the costs of doing so and any related charges recorded against our earnings may be adverse and material to our consolidated financial statements.
Some homebuyers may cancel their home purchases because the required deposits are small and sometimes refundable.An increase in our cancellation rates could negatively impact our business.
Our backlog at a given point in time reflects the number of homes under a home purchase contract that have not yet been delivered to a homebuyer.buyer. Our home purchase contracts typicallywith our customers require only a relatively small deposit at the time of signing and, in some circumstances,cases, when design studio options or upgrades are selected. The deposit(s) required vary among markets and communities. Generally, we have the deposit is refundable priorright to closing. Ifretain deposits from customers that cancel their purchase contract. However, we generally permit our customers to cancel their obligations and obtain refunds of all or a portion of their deposits if they cannot obtain a mortgage loan within a certain period of time, and we may choose to provide full or partial refunds in other cases. As a result, if home prices decline, the pricesavailability of mortgage financing diminishes or interest rates increase, customers may cancel their existing home purchase contracts with us because they are unable to finalize a mortgage loan for the purchase. In addition, if new homes decline,home competitors increase their use of sales incentives, lenders and others increase their efforts to sell resale homes trade laborthrough incentives or building materials shortages delayprice cuts, our home construction cycle times mortgage loan interest rates increase, the availability of mortgage financing further diminishesare delayed, or there is continued weakness or a downturn in local or regional economies or the national economy andand/or in consumer confidence, customers may cancel, or propose to cancel, their existing home purchase contracts with us because they have been unable to finalize their mortgage financing for the purchase, desire to move into a home earlier than we can deliver it, or in order to attempt to negotiate for a lower selling price or explore other options, or for other reasons they are otherwise unable or unwilling to complete the purchase. In recent years, we have experienced volatile cancellation rates, in part due to these reasons and in part due to the mortgage loan funding issues arising from the 2012 transition of our preferred mortgage lending relationship. To the extent they continue, volatileVolatile cancellation rates resulting from these conditions, or otherwise, may reduce the rate at which we sell and deliver homes and could have a material adverse effect on our business and our consolidated financial statements.
Interest rate increases or changes in federal lending programs or regulations could lower demand for our homes.
Nearly all of our customers finance the purchase of their homes. Before the housing downturn began, historically low interest rates and the increased availability of specialized mortgage loan products, including products requiring no or low down payments, and interest-only and adjustable-rate mortgage loans, made purchasing a home more affordable for a number of customers and more available to customers with lower credit scores. Increases in interest rates and/or decreases in the availability of mortgage financing or of certain mortgage loan products or programs may lead to fewer mortgage loans being provided, higher credit risk/mortgage loan insurance premiums and/or other fees, increased down payment and extensive buyer income and asset documentation requirements, or a combination of the foregoing, and, as a result, reduce demand for our homes and increase our cancellation rates.
Due to the volatility and uncertainty in the credit markets and in the mortgage lending and mortgage finance industries since 2008, the federal government has taken on a significant role in supporting mortgage lending through its conservatorship of Fannie Mae and Freddie Mac, both of which purchase or insure mortgage loans and mortgage loan-backed securities, and its insurance of mortgage loans through the FHA and the VA. FHA backing of mortgage loans has been particularly important to the mortgage finance industry and to our business. The availability and affordability of mortgage loans, including interest rates for such loans, could be adversely affected by a scaling back or termination of the federal government’s mortgage loan-related programs or policies. The FHA, for instance, intends to increase its annual insurance premiums in 2013, and could, among other actions, extend the period that such premiums are charged to borrowers, further increase such premiums or other fees and/or raise its standards on the loans it will insure in order to address the significant cash reserve deficit (relative to its projected losses from delinquent loans) it reported in November 2012. These steps, whether individually or collectively taken, could prevent some homebuyers from qualifying for mortgage loans to purchase homes, including our homes. In addition, given growing federal budget deficits, the U.S. Treasury may not be able to continue, or may be required by future legislation or regulation to cease, supporting the mortgage loan-related activities of Fannie Mae, Freddie Mac, the FHA and the VA at present levels.
Because Fannie Mae-, Freddie Mac-, FHA- and VA-backed mortgage loans have been an important factor in marketing and selling many of our homes, any limitations or restrictions in the availability of, or higher consumer costs for, such government-backed financing could reduce our net orders and adversely affect our consolidated financial statements, and the effect could be material.
Tax law changes could make home ownership more expensive or less attractive.
Under current tax law, and policy, significant expenses of owning a home, including mortgage loan interest costs and real estate taxes, generally are deductible expenses for the purpose of calculating an individual’s or household’s federal, and in some cases state, taxable income subject to various limitations. For instance, under the American Taxpayer Relief Act of 2012, which was signed into law in January 2013, the federal government enacted higher income tax rates and limits on the value of tax deductions for certain high-income individuals and households. If the federal government or a state government changes or further changes its income tax laws as some lawmakers have proposed, by eliminating, limiting or substantially reducing these income tax benefits, the after-tax cost of owning a home could increase substantially. Any additional increases in personal income tax rates and/or additional tax deduction limits or restrictions enacted at the federal or state levels could adversely impact demand for and/or selling prices of new homes, including our homes, and the effect on our consolidated financial statements could be adverse and material.
We are subject to substantial legal and regulatory requirements regarding the development of land, the homebuilding process and the protection of the environment, which can cause us to suffer production delays and incur costs associated with compliance, and which canand/or prohibit or restrict homebuilding activity in some regions or areas. Our business is also subject to a number of local, state and federal laws, statutes, ordinances, rules, policies and other legal and regulatory requirements. The impact of such requirements or our failure to comply with such requirements, individually or collectively, could be adverse and material to the implementation of our strategic growth initiatives and our consolidated financial statements.
Our homebuilding business is heavily regulated and subject to a significant amount of local, state and federal regulation concerning zoning, allowable housing density, natural and other resource protection, building designs, landland/community development and home construction methods, worksite safety and similar matters, as well as governmental taxes, fees and levies on the acquisition and development of land parcels.land. These regulations often provide broad discretion to government authorities that oversee these matters, which can result in unanticipated delays, adjustments in the allowable scope, size or characteristics, and/or increases in the cost of a specified development project or a number of projects in particular markets. We may also experience delays due to a building permit moratorium or regulatory restrictions in any of the locations in which we operate, which can, among other things, affect the balance of land held for future development in our inventory. Further, there is no assurance that these governmental regulations, or other laws, statutes, ordinances, rules and policies applicable to our business, will not be interpreted or revised in ways that will require us to change our strategies or operations, incur significant compliance costs or
record charges against our earnings, and/or restrict the manner in which we conduct our activities, and any such actions or events, and associated costs and charges, could adversely and materially affect our consolidated financial statements.
In addition, we are subject to a variety of local, state and federal laws, statutes, ordinances, rules and regulations concerning the environment. As discussed below with respectenvironment, including requirements to potential climate changemanage and/or mitigate storm water runoff, dust particles and other environmental impacts theseof our production activities at our communities. These laws, statutes, ordinances, rules and regulations, and/or evolving interpretations thereof, may cause production delays, in our land development and in our construction and delivery of new homes, may cause us to incur substantial compliance, litigation and other costs, and can prohibit or restrict homebuilding activity in certain regions or areas.
As discussed above under “Item 1. Business —areas, any of which could also reduce the fair value of affected inventory and require us to record significant impairment charges against our earnings. Environmental Compliance Matters,” environmental laws may also impose liability for the costs of removal or remediation of hazardous or toxic substances whether or not the developer or owner of the property knew of, or was responsible for, the presence of those substances. The actual or potential presence of those substances on or nearby our properties may prevent us from selling our homes and we may also be liable, under applicable laws and regulations or lawsuits brought by private parties, for hazardous or toxic substances on land that we have sold in the past.
Further, a significant portion of our business is conducted in California, one of the most highly regulated and litigious states in the country. Therefore, our potential exposure to losses and expenses due to new laws, regulations or litigation may be greater than other homebuilders with a less significant California presence.
We have experienced, and may in the future experience, legal claims from government and private parties, regulatory investigations and/or proceedings, and significant unfavorable litigation, administrative and arbitral outcomes resulting in losses (including monetary damages awards or other direct or indirect payments to or for the benefit of government or private parties), penalties, fines, injunctions establishing restrictions or adjustments to our business practices, expenses and charges recorded against our earnings (as well as losses, penalties, fines, voluntary injunctions/consent decrees, expenses and charges associated with settlements of any such claims, investigations and proceedings) with respect to our operations in California and those in our other reporting segments. Any such losses, penalties, fines, injunctions, expenses and charges could be beyond our expectations and/or accruals at particular points in time and be material to our business and consolidated financial statements. Unfavorable litigation, administrative or arbitral outcomes may also generate negative publicity in various media outlets that could be detrimental to our reputation and adversely affect our efforts to sell homes.
The homebuilding industry and housing market are very competitive, and competitive conditions could adversely affect our business or our consolidated financial statements.
As discussed above under “Item 1. Business — Competition, Seasonality, Delivery Mix and Other Factors,” weWe face significant competition in several areas of our business from other homebuilders and participants in the overall housing industry.industry, including landlords and other rental housing operators. These competitive conditions can result in:
our delivering fewer homes;
our selling homes at lower prices;
our offering or increasing sales incentives, discounts or price concessionsreductions for our homes;
our experiencing lower housing gross profit margins, particularly if we cannot raise our selling prices to cover increased land acquisition, land/community development, home constructionproduction or overhead costs;costs or inflation;
our selling fewer homes or experiencing a higher number of cancellations by homebuyers;buyers;
impairments in the value of our inventory and other assets;
difficulty in acquiring desirable land that meets our investment return or marketing standards, and in selling our interests in land that no longer meet such standards on favorable terms;terms, or at all;
difficulty in our acquiring raw materials and skilled management and trade laborobtaining construction resources at acceptable prices;
delays in the development of land and/or the construction of our homes;production schedules; and/or
difficulty in securing external financing, performance bonds or letterletters of credit facilitiesfor our business operations on favorable terms.
These competitive conditions may have a material adverse effect on our business and consolidated financial statements by decreasing our revenues, impairing our ability to successfully implement our current strategies, initiatives or actions, increasing our costs and/or diminishing growth in our local or regional homebuilding businesses. During the housing downturn in particular, actions taken by our new home and housing alternative competitors reduced the effectiveness of our efforts to achieve stability or increases in
home selling prices, to generate higher deliveries of homes, revenues and housing gross profit margins, and to achievemaintain
or increase our profitability. We cannot provide any assurance that such conditions and maintain profitability.their negative impacts will not occur in 2016 or beyond.
Homebuilding is subject to warranty and liability claims in the ordinary course of business that can be significant.
In the ordinary course of our homebuilding business, we are subject to home warranty and construction defect claims. We record warranty and other liabilities for the homes we deliver based primarily on historical experience in our served markets and our judgment of the risks associated with the types of homes we build. As further described in Note 13.15. Commitments and Contingencies in the Notes to Consolidated Financial Statements in this report, we maintain, and require the majority of our independent subcontractors to maintain, general liability insurance (including construction defect and bodily injury coverage) and workers’ compensation insurance. These insurance policies protect us against a portion of our risk of loss from claims related to our homebuilding activities, subject to certain self-insured retentions, deductibles and other coverage limits. In Arizona, California, Colorado and Nevada, our subcontractors' general liability insurance primarily takes the form of a wrap-up policy, where eligible subcontractors are enrolled as insureds on each project.limits. We self-insure a portion of our overall risk through the use of a captive insurance subsidiary. We also maintain certain other insurance policies. In addition, if we discover improper construction practices or the installation of defective materials in our homes, we will pursue recoveries of the related repair and other costs we incur from potentially responsible parties and/or their or our insurers.
Because of the uncertainties inherent to these matters, we cannot provide assurance that our various insurance arrangements, recorded warranty and ourother liabilities willand efforts to recover related repair and other costs may not be adequate to address all of our expenditures associated with home warranty and construction defect claims in the future, or thatand any potentialsuch inadequacies will notcould have an adverse effect on our consolidated financial statements. Additionally, the coverage offered by and the availability of general liability insurance for construction defects are currently limited and costly. There can be no assurancecostly, and, in our case, have relatively high self-insured retentions that limit coverage will notsignificantly. Coverage could be further restricted in future periods, increasing our risks and financial exposure to claims, and/or become more costly.costly and to a material degree. Home warranty and construction defect issues may also generate negative publicity in various media outlets that could be detrimental to our reputation and adversely affect our efforts to sell homes.
We engage subcontractors to perform the actual construction of our homes, andcan provide no assurance that in many cases, to obtain the necessary building materials. Our contracts with our subcontractors require that they comply with all laws applicable to their work, including labor laws, meet performance standards, and follow local building codes and permits. However, we may encounter improper construction practices or the installation of defective materials in our homes, among other things. When we discover these issues,2016 we will evaluate and if necessary, repair the homes in accordance with our newnot face additional home warranty and as required by law. The adverse construction defect claims and/or incur additional related repair and other costs, of satisfyingor not need to record charges against our earnings to adjust our warranty liability, or experience negative publicity/reputational harm or be successful in obtaining any recoveries of related repair and other legal obligations incosts, and that any of these instances may be significantitems — if they occur, or with respect to recoveries of related repair and we may be unableother costs, fail to recover the costs of warranty-related repairs from subcontractors, suppliers and insurers, whichoccur — could, individually or collectively, have a material and adverse impact on our business and consolidated financial statements.
Because of the seasonal nature of our business, our quarterly operating results fluctuate.
As discussed above under “Item 1. Business — Competition,in the “Competition, Seasonality, Delivery Mix and Other Factors,”Factors” section in this report, we have experiencedexperience seasonal fluctuations in our quarterly operating results that can have a material impact on our results and our consolidated financial statements. Historically, a significant percentage of our home purchase contracts are entered into in the spring and early summer months, and we deliver a corresponding significant percentage of our homes in the late summer and fall months. As a result, we historically have experienced uneven quarterly results, with generally fewer homes delivered and lower revenues and operating income generally during the first and second quarters of our fiscal year. During the housing downturn and in 2012, these seasonal trends were somewhat less pronounced, and our overall net orders, homes delivered and revenues were generally lower than before the housing downturn. We currentlyThough we expect to experience the traditional seasonality cycle and its impactimpacts on our results to become more prominent if and as the present housing recovery progresses, and the homebuilding industry returns to a more normal operating environment, but we can makeprovide no assurancesassurance as to the degree to which oursuch historical seasonal patterns will occur in 20132016 and beyond, if at all.
We may have difficulty in continuing to obtain additional financing and/or may be restricted in accessing external capital, and to the extent we can access external capital,financing, it may increase our costs of capital or result in stockholder dilution.
Our homebuilding operations and our present strategies require significant amounts of cash and/or the availability of external financing. We have historically funded our operations with internally generated cash flows, public equity and external sources of debt issuances (including common stock, senior notes and equity financing. However, during the housing downturn, we relied primarily on the positive operating cash flow we generated, principally through the receipt of federal income tax refunds,convertible senior notes), land option contracts and from homeother similar contracts and land salesseller financing, and performance bonds and letters of credit. In addition, we have entered into the Credit Facility and the LOC Facilities in order to support certain aspects of our efforts to reduce our overhead costs, to meet our working capital needs and repay outstanding indebtedness. In recent years, the impact of the housing downturn in reducing our stockholders’ equity and increasing our debt-to-capital ratio and volatilityoperations in the financial and credit markets made external sources of liquidity less available and more costly to us. In 2012, relatively favorable housing and credit market conditions enabled us to refinance and measurably extend the maturity of certainordinary course of our business, including land acquisitions, community development and other strategic growth initiatives. We anticipate that we will need to maintain the Credit Facility and the LOC Facilities in 2016, and, if necessary or desirable, we may seek to expand their capacities or enter into additional such facilities, or other similar facility arrangements with the same or other financial institutions. We may also issue additional senior notes, due in 2014 and 2015 through the issuance of newconvertible senior notes albeit at somewhat higher interest rates than the refinanced debt, and to raise unrestricted cash for general business purposes. Weor equity. However, we can provide no assurances, however,assurance that we will be able to generate cash flows from our operations or access external creditfinancing in 2016 or equity markets in 2013beyond at favorable terms or at all.all, or that our stockholders’ equity and ratio of debt to capital will remain at, or further improve from, their respective 2015 year-end levels.
Market conditions in 20132016 and beyond may significantly limit our ability to replace or refinance indebtedness, particularly givenin part due to provisions within our outstanding senior notes that may restrict the amount and nature of debt we may incur in the future and the ratings of our senior notes by the three principal nationally recognized registered credit rating agencies, as discussed further below.
further below. The terms of potential future issuances of indebtedness by us may be more restrictive than the terms governing our current indebtedness, and the issuance, interest and debt service expenses are likely toobligations could be higher. A higher as was the case with the new senior notes we issued in 2012.interest rate on or more restrictive terms governing our debt could materially and adversely affect our business and consolidated financial statements. In addition, the relatively low market value of our lowcommon stock price compared to the level reached before the housing downturn began,and volatility in the stocksecurities markets the reduction in our stockholders’ equity relative to our debt, and a decline in our unrestricted cash balance could also impede our access to the equity markets or increase the amount of dilution our stockholders would experience should we seek to raise capital or complete strategic transactions through the issuance of new equity or convertible securities.
While we believe we can meet our forecasted capital requirements from our cash resources, expected future cash flow, capital markets accessflows from our operations, and the external financing sources that we anticipate will be available to us, we can provide no assurance that we will be able to do so, or do so without incurring substantially higher costs or significantly diluting existing stockholders’ equity interests. If conditions in the financial and credit markets continue to be volatile or worsen, whether generally, or for homebuilders or us in particular, it could reduce our ability to implement our strategies, initiatives and actions and profitably grow our business. Current and future federal and state regulations limiting the investment activities of financial institutions could also impact our ability to access the capital markets, to obtain additional external financing and/or maintain or, if necessary or desirable, expand the capacities of the Credit Facility or the LOC Facilities or enter into additional such facilities, or other similar facilities, in each case on acceptable terms or at all. The adverse effects of these conditions on our business, liquidity and consolidated financial statements could be material to us.our consolidated financial statements.
We have a substantial amount of indebtedness in relation to our tangible net worth and unrestricted cash balance, which may restrict our ability to meet our operational and strategic goals.
As of November 30, 2012, we had total outstanding debt of $1.72 billion, total stockholders’ equity of $376.8 million, and an unrestricted cash balance of $524.8 million. The amount of our debt overall and relative to our total stockholders’ equity and unrestricted cash balance could have important consequences. For example, it could:
limit our ability to obtain future financing for working capital, capital expenditures, acquisitions, inventory-related investments, strategic transactions, debt service requirementsobligations or other business needs;needs, including, but not limited to, supporting our strategic growth initiatives and operational actions;
limit our ability to maintain compliance with the Credit Facility’s financial covenants, or to renew or, if necessary or desirable, expand the capacity of the Credit Facility;
limit our ability to renew or, if necessary or desirable, expand the capacity of any letter of credit facilities to obtain a revolving credit facility,(including the LOC Facilities), or enter into additional facilities, or other similar facilities, and to obtain performance bonds in the ordinary course of our business;
limit our ability to pay dividends on shares of our common stock;
require us to dedicate a substantial portion of our cash flowflows from our operations to the collateralization or payment of our debt service obligations and reduce our ability to use our cash flowflows for other purposes;purposes, including investments in our business and acquisitions;
impact our flexibility in planning for, or reacting to, changes in our business;
limit our ability to implement our present strategies, particularly our land acquisition and development plans and asset activation initiatives,community count expansion initiative, in part due to competition from other homebuilders, developers and investors with greater available liquidity or balance sheet strength;
place us at a competitive disadvantage because we have more debt or debt-related restrictions than some of our competitors; and
make us more vulnerable in the event of weakness or a downturn in our business or in general economic or housing market conditions.
Our ability to meet our debt service and other obligations necessary to operate our business in the ordinary course will depend on our future performance. Our businessAs of the date of this report, our next scheduled maturity of senior notes is substantially affected by changeson September 15, 2017 with respect to $265.0 million in economic cycles. Our revenues, earnings and cash flows vary with the levelaggregate principal amount of general economic activity and competition in the markets in which we operate. They could also be affected by financial, political, regulatory, environmental and other factors, many of which are beyond our control. A higher interest rate on our debt could materially and adversely affect our consolidated financial statements.9.10% senior notes due 2017 (“9.10% Senior Notes due 2017”).
Our business may not generate sufficient cash flowflows from our operations, and sufficient external financing at a reasonable cost may not be available to us, in an amount sufficient to meet our debt service obligations fulfilland other obligations necessary to operate our business in the ordinary course, comply with the Credit Facility’s financial covenants, or operational obligations we may have under certain unconsolidated joint venture transactions, support our letter of credit facilities (including our cash-collateralized letter of credit facilities with various financial institutions (the “LOC Facilities”)), orthe LOC Facilities). Further, as described in Note 13. Notes Payable in the Notes to fund our other liquidity or operational needs. Further,Consolidated Financial Statements in this report, if a change of control were to occur as defined in the instrumentinstruments governing our $265.0 millionsenior notes, or if a fundamental change under the terms of 9.10%our 1.375% convertible senior notes due 2017 (the “$265 Million 9.10%2019 (“1.375% Convertible Senior Notes”Notes due 2019”), our $350.0 millionwhich includes a change of 8.00% senior notes due 2020 (the “$350 Million 8.00% Senior Notes”) and our $350.0 million of 7.50% senior notes due 2022 (the “$350 Million 7.50% Senior Notes”), control, occurs prior to their stated maturity date, we wouldmay be required to offer to purchase thesecertain of our senior notes (but not our other outstandingand/or all
of the convertible senior notes) at 101% of their principal amount, together with allnotes, plus accrued interest and unpaid interest, if any. If In such circumstances, if we are unable to generate sufficient cash flowflows from our operations, we may, given our unrestricted cash balance, need to refinance and/or restructure with our lenders or other creditors all or a portion of our outstanding debt obligations on or before their maturity, which we may not be able to do on favorable terms or at all, or raise capital through equity or convertible security issuances that wouldcould significantly dilute existing stockholders’ interests, and the impact of such circumstances on our liquidity and consolidated financial statements would be material and adverse.
Failure to comply with the covenants and other requirements imposed by the Credit Facility and the instruments governing our indebtedness could restrict future borrowing or cause any outstanding indebtedness to become immediately due and payable.
22
TableUnder the terms of Contentsthe Credit Facility, we are required, among other things, to maintain compliance with various covenants, including financial covenants relating to our consolidated tangible net worth, leverage, and interest coverage or liquidity. The Credit Facility is also governed by a borrowing base test and includes a limitation on investments in joint ventures and non-guarantor subsidiaries. Among other things, these covenants and other requirements can influence our operating decisions of whether to enter into, or the manner in which we can structure certain transactions, in order to maintain compliance. If we fail to comply with these covenants and other requirements, the participating financial institutions could terminate the Credit Facility, cause borrowings under the Credit Facility, if any, to become immediately due and payable and/or could demand that we compensate them for waiving instances of noncompliance. In addition, a default under the Credit Facility under certain circumstances or a default under any series of our senior notes or convertible senior notes could cause a default with respect to our other series of such notes and result in the acceleration of the maturity of all of our senior and/or convertible senior notes and our inability to borrow under the Credit Facility, as well as incurring penalties and additional fees, all of which would have a material adverse impact on our liquidity and on our consolidated financial statements. Moreover, we may need to curtail our investment activities and other uses of cash to maintain compliance with the covenants and other requirements under the Credit Facility.The indenture governing our outstanding senior notes and convertible senior notes imposes restrictions on our business operations and activities. Though it does not contain any financial covenants, the indenture contains certain restrictive covenants that, among other things and subject to specified exceptions, limit our ability to incur secured indebtedness, to engage in sale-leaseback transactions involving property or assets above a specified value, and, in the case of six series of our outstanding senior notes and our convertible senior notes, to engage in mergers, consolidations, and sales of assets. Due to financial and credit market conditions, we may in the future need to include additional covenants, obligations or restrictions in our indenture or with respect to a specific issuance of securities or to our currently outstanding securities. If we fail to comply with any of these covenants, obligations or restrictions, the holders of our senior notes or convertible senior notes could cause such debt to become due and payable prior to maturity or could demand that we compensate them for waiving instances of noncompliance, and, if they are successful in doing so, the impact on our liquidity and consolidated financial statements would be material and adverse. In addition, a default under any series of our senior notes or convertible senior notes could cause a default with respect to our other series of such notes and result in the acceleration of the maturity of all such defaulted indebtedness and other debt obligations, as well as penalties and additional fees, which would have a material adverse impact on our liquidity and consolidated financial statements.
Our ability to obtain external financing could be adversely affected by a negative change in our credit rating by a third-party rating agency.
Our abilityaccess to access the capital markets and external financing sources on favorable terms is a key factor in our ability to fund our operations and to grow our business. As of the date of this report, our credit rating by Fitch Ratings is B+, with a stable outlook, our credit rating by Moody’s Investor Services is B2, with a stablepositive outlook, and our credit rating by Standard and Poor’s Financial Services is B, with a negativestable outlook. Downgrades of our credit rating by any of these principal nationally recognized registered credit rating agencies may make it more difficult and costly for us to access the capital markets and external financing sources, and could have a material adverse effect on our consolidated financial statements.
We may have difficulty in continuing to obtain the additional financing required to operateliquidity and develop our business.
Our homebuilding operations and our present strategies require significant amounts of cash and/or the availability of external financing. We have established our LOC Facilities in order to support certain aspects of our operations in the ordinary course of our business, including our acquisition of land and our development of new home communities. We anticipate that we will need to maintain these facilities in 2013, and, if necessary or desirable, we may seek to expand their capacities or enter into additional such facilities, or enter into a revolving credit facility. It is not possible to predict the future terms or availability of additional external capital or for maintaining or, if necessary or desirable, expanding the capacity of our LOC Facilities or entering into additional such facilities, or entering into a revolving credit facility. Moreover, our outstanding senior notes contain provisions that may restrict the amount and nature of debt we may incur in the future. As the financial and credit markets worldwide have been experiencing and may continue to experience volatility, there can be no assurance that we can at reasonable cost actually borrow additional funds, raise additional capital through other means, or successfully maintain or, if necessary or desirable, expand the capacity of our LOC Facilities or enter into additional such facilities or enter into a revolving credit facility, each of which depends, among other factors, on conditions in the capital markets and our perceived credit worthiness, as discussed above. If conditions in the financial and credit markets continue to be volatile or worsen, it could reduce our ability to generate sales and may hinder our future growth and impair our consolidated financial statements. Potential federal and state regulations limiting the investment activities of financial institutions, including regulations that have been or may be issued under the Dodd-Frank Act, could also impact our ability to access the capital markets, to obtain additional external financing and to maintain or, if necessary or desirable, expand our LOC Facilities or enter into additional such facilities or enter into a revolving credit facility, in each case on acceptable terms or at all.
Failure to comply with the covenants and conditions imposed by the agreements governing our indebtedness could restrict future borrowing or cause our debt to become immediately due and payable.
The indenture governing our outstanding senior notes imposes restrictions on our business operations and activities. Though it does not contain any financial maintenance covenants, the indenture contains certain restrictive covenants that, among other things, limit our ability to incur secured indebtedness, to engage in sale-leaseback transactions involving property or assets above a specified value, and, as in the case of three of our outstanding senior notes, to engage in mergers, consolidations, and sales of assets. Due to financial and credit market conditions, we may also need to include additional covenants, obligations or restrictions in our indenture or with respect to a specific issuance of securities or to our currently outstanding securities. If we fail to comply with these covenants, obligations or restrictions, the holders of our senior notes could cause our debt to become due and payable prior to maturity or could demand that we compensate them for waiving instances of noncompliance, and, if they are successful in doing so, the impact on our consolidated financial statements would be material and adverse. In addition, a default under any series of our senior notes could cause a default with respect to our other senior notes and result in the acceleration of the maturity of all such defaulted indebtedness and other debt obligations, as well as penalties or additional fees, which would have a material adverse impact on our consolidated financial statements.
We may not realize our significant deferred income tax assets. In addition, our net operating loss carryforwards could be substantially limited if we experience an ownership change as defined in the Internal Revenue Code.
Since the end of our 2007 fiscal year, we have generated significant net operating losses (“NOL”), and we may generate additional NOL in 2013. Under federal tax laws, we can use our NOL (and certain related tax credits) to reduce our future taxable income for up to 20 years, after which they expire for such purposes. Until they expire, we can carry forward our NOL (and certain related tax credits) that we do not use in any particular year to reduce our taxable income in future years, and we have recorded a valuation allowance against our net deferred tax assets that include the NOL (and certain related tax credits) that we have generated but have not yet realized. At November 30, 2012,2015, we had deferred tax assets, net of deferred tax liabilities, totaling $880.1of $820.0 million, against which we had a valuation allowance of $37.8 million. While we have provided a full valuation allowance.allowance against certain of our net deferred tax assets, the valuation allowance is subject to adjustment as facts and circumstances change. The accounting for deferred income taxes is based upon estimates of our future results. A housing downturn or other adverse circumstances that negatively affect our future taxable income could require us to record a larger valuation allowance against our net deferred tax assets as well as related charges against our earnings. Differences between estimated and actual results could have a material impact on our consolidated financial statements, and the impact may be adverse. Our ability to realize our net deferred tax assets is based on the extent to which we
generate sustained profitsfuture taxable income, and we cannot provide any assurancesassurance as to when and to what extent we will generate sufficient future taxable income to realize our net deferred tax assets, whether in whole or in any part.
The majorityChanges in tax laws could also affect our actual tax results, the valuation of our net deferred tax asset is federal relatedassets and is valued atour ability to realize our net deferred tax assets. Specifically, a 35%decrease in enacted corporate income tax rate. If, as some lawmakers have proposed,rates in our major jurisdictions, especially in the U.S.federal corporate income tax rate, is lowered, we would be required to write down a roughly proportionate amount ofdecrease the value of our federal net deferred tax asset to account for this lower rate. We would also need to recordassets and result in a corresponding write down of our valuation allowance. The lowercharge to income tax rate wouldexpense, which could be material, as well as reduce our future federal taxes, which may putability to use our net deferred tax assets.
In addition, notwithstanding the reversal of a substantial portion of our deferred tax creditsasset valuation allowance at risk of expiring before we could use them.
In addition,November 30, 2014, the benefits of our NOL,net deferred tax assets, including our net operating losses (“NOLs”), built-in losses and tax credits, would be reduced or potentially eliminated if we experienceexperienced an “ownership change,” as determinedchange” under Internal Revenue Code Section 382 (“Section 382”). A Section 382 ownership change occurs if a stockholder or a group of stockholders who are deemed to own at least 5% of our common stock increase their ownership by more than 50 percentage points over their lowest ownership percentage within a rolling three-year period. If an ownership change were to occur, Section 382 would impose an annual limit on the amount of NOLNOLs we could use to reduce our taxable income equal to the product of the total value of our outstanding equity immediately prior to the ownership change (reduced by certain items specified in Section 382) and the federal long-term tax-exempt interest rate in effect for the month of the ownership change.income. A number of complex rules apply in calculating this annual limit.
While the complexity of Section 382’s provisions and the limited knowledge any public company has about the ownership of its publicly-tradedpublicly traded stock make it difficult to determine whether an ownership change has occurred, we currently believe that an ownership change has not occurred. However, if an ownership change were to occur, the annual limit Section 382 may impose could result in a material amount of our NOLNOLs expiring unused. This would significantly impair the value of our NOLnet deferred tax assets and, as a result, have a material negative impact on our consolidated financial statements.
In 2009, our stockholders approved an amendment to our restated certificate of incorporation that is designed to block transfers of our common stock that could result in an ownership change, and a rights agreement pursuant to which we have issued certain stock purchase rights with terms designed to deter transfers of our common stock that could result in an ownership change. However, these measures cannot guarantee complete protection against an ownership change and it remains possible that one may occur.
Our cash flows, liquidity and consolidated financial statements could be materially and adversely affected if we are unable to obtain performance bonds and/or letters of credit.
In the course of developing our communities, we are often required to provide to various municipalities and other government agencies performance bonds and/or letters of credit to secure the completion of our projects and/or in support of obligations to build community improvements such as roads, sewers, water systems and other utilities, and to support similar development activities by certain of our unconsolidated joint ventures. We may also be required to provide performance bonds and/or letters of credit to secure our performance under various escrow agreements, financial guarantees and other arrangements. Our ability to obtain such bonds or letters of credit and the cost to do so depend on our credit rating, overall market capitalization, available capital, past operational and financial performance, management expertise and other factors, including prevailing surety market conditions, which have been tight since 2010 as providers have exited the market or substantially reduced their issuances of performance bonds and letters of credit, and the underwriting practices and resources of performance bond and/or lettersletter of credit issuers. If we are unable to obtain performance bonds and/or letters of credit when required or the cost or operational restrictions or conditions imposed by issuers to obtain them increases significantly in 20132016 or later,beyond, we may not be able to develop or we may be significantly delayed in developing a community or communities, we may be required to post cash collateral, decreasing our unrestricted cash balance, and/or we may incur significant additional expenses, and, asexpenses. As a result, our business and consolidated financial statements, cash flows and/or liquidity could be materially and adversely affected.
Our ability to attract and retain talent is critical to the success of our business and a failure to do so may materially and adversely affect our performance.
Our officers and employees are an important resource, and we see attracting and retaining a dedicated and talented team to execute our KBnxt operational business model as crucial to our ability to achieve and maintain an advantage over other homebuilders. We face intense competition for qualified personnel, particularly at senior management levels, from other homebuilders, from other companies in the housing and real estate industries, particularly with the increased residential construction activity in 2012, and from companies in various other industries with respect to certain roles or functions. Moreover, the prolonged housing downturn and the decline in the market value of our common stock during the housing downturn havehas made it difficult for us to attract and retain talent, even as we are making a targeted effort to strengthen and expand certain of our local field management teams and talent as part of our strategic growth initiatives.talent. If we are unable to continue to retain and attract qualified employees, or if we need to significantly increase compensation and benefits to do so (including as a result of complying with health care coverage requirements under the federal Patient Protection and Affordable Care Act and the Health Care Education Reconciliation Act of 2010), or, alternatively, if we are required or believe it is appropriate to reduce our overhead expenses through significant personnel reductions or adjustments to compensation and benefits, our performance, our ability to achieve our top strategic priorities and maintain a competitive advantage, and our consolidated financial statements could be materially and adversely affected.
Changes in global or regional environmental conditions and governmental actions in response to such changes may adversely affect us by increasing the costs of or restricting our planned or future growth activities.
There is growing concern from members of the scientific community and the general public that an increase in global average temperatures due to emissions of greenhouse gases and other human activities have or will cause significant changes in weather patterns and increase the frequency and severity of natural disasters. An increased frequency or duration of extreme weather conditions and environmental events could limit, delay and/or increase the costs to develop land and build new homes and reduce the value of our land and housing inventory in locations that become less desirable to consumers or blocked to development. Projected climate change, if it occurs, may exacerbate the scarcity of water and other natural resources in affected regions, which could limit, prevent or increase the costs of residential development in certain areas. In addition, government mandates, standards or regulations intended to mitigate or reduce greenhouse gas emissions or projected climate change impacts could result in prohibitions or severe restrictions on land development in certain areas, increased energy, transportation and raw material costs that make building materials less available or more expensive, or cause us to incur compliance expenses and other financial obligations to meet permitting or land development- or home construction-related requirements that we will be unable to fully recover (due to market conditions or other factors), and reduce our housing gross profit margins and adversely effect our consolidated financial statements, potentially to a material degree. As a result, climate change impacts, and laws and land development and home construction standards, and/or the manner in which they are interpreted or implemented, to address potential climate change impacts, could increase our costs and have a long-term adverse impact on our business and our consolidated financial statements. This is a particular concern with respect to our key West Coast homebuilding reporting segment, as California has instituted some of the most extensive and stringent environmental laws and residential building construction standards in the country.
Information technology failures and data security breaches could harm our business.
We use information technology, digital telecommunications and other computer resources to carry out important operational and promotional marketing activities and to maintain our business records. Many of these resources are provided to us and/or maintained on our behalf by third-party service providers pursuant to agreements that specify to varying degrees certain security and service level standards. Although we and our service providers employ what we believe are adequate security, disaster recovery and other preventative and corrective measures, our ability to conduct our business may be impaired if these resources, including our primary website,websites or e-mail system, are compromised, degraded, damaged or fail, whether due to a virus or other harmful circumstance, intentional penetration or disruption of our information technology resources by a third party, natural disaster, hardware or software corruption or failure or error or poor product or vendor/developer selection (including a failure of security controls incorporated into or applied to such hardware or software), telecommunications system failure, service provider error or failure, intentional or unintentional personnel actions (including the failure to follow our security protocols), or lost connectivity to our networked resources. A significant and extended disruption in the functioning of these resources, including our primary website,websites or e-mail system, could damage our reputation and cause us to lose customers, orders, deliveries of homes and revenues, result in the unintended and/or unauthorized public disclosure or the misappropriation of proprietary, personal identifying and confidential information (including information about our homebuyersbuyers and business partners), impair the effectiveness of our internal control over financial reporting, and require us to incur significant expenseexpenses to address and remediate or otherwise resolve these kinds of issues. We may not be able to recover these expenses in whole or in any part from our service providers or responsible parties, and/or their or our insurers. The release of confidential information may also lead to litigation or other proceedings against us by affected individuals, and/or business partners and/or by regulators, and the outcome of such proceedings, which could include losses, penalties, or fines, injunctions, expenses and charges recorded against our earnings and cause us reputational harm, could have a material and adverse effect on our business and consolidated financial statements. Depending on its nature, a particular data security breach, penetration or compromise, or a series of breaches, penetrations or compromises, may result in the unauthorized use or loss of our assets or financial resources on a one-time or continuing basis, and such unauthorized use(s) or loss(es), which could be significant, may not be detected for some period of time. In addition, the costs of maintaining adequate protection against suchdata security threats, dependingbased on considerations of their evolution, pervasiveness and frequency and/or government-mandated standards or obligations regarding protective efforts, could be material to our consolidated financial statements in a particular period or over various periods.
| |
| Item 1B. | UNRESOLVED STAFF COMMENTS |
None.
We lease our corporate headquarters in Los Angeles, California. Our homebuilding division offices (except for our San Antonio, Texas office) and our KB Home Studiosdesign studios are located in leased space in the markets where we conduct business. We own the premises for our San Antonio office.
We believe that such properties, including the equipment located therein, are suitable and adequate to meet the needs of our businesses.
Nevada Development Contract Litigation
On November 4, 2011, the Eighth Judicial District Court, Clark County, Nevada set for trial a consolidated action against KB HOME Nevada Inc., a wholly owned subsidiary of ours (“KB Nevada”),Our legal proceedings are discussed in a case entitled Las Vegas Development Associates, LLC, Essex Real Estate Partners, LLC, et al. v. KB HOME Nevada Inc. In 2007, Las Vegas Development Associates, LLC (“LVDA”) agreed to purchase from KB Nevada approximately 83 acres of land located near Las Vegas, Nevada. LVDA subsequently assigned its rights to Essex Real Estate Partners, LLC (“Essex”). KB Nevada and Essex entered into a development agreement relating to certain major infrastructure improvements. LVDA’s and Essex’s complaint, initially filed in 2008, alleged that KB Nevada breached the development agreement, and also alleged that KB Nevada fraudulently induced them to enter into the purchase and development agreements. LVDA’s and Essex’s lenders subsequently filed related actions that were consolidated into the LVDA/Essex matter. The consolidated plaintiffs sought rescission of the agreements or,Note 16. Legal Matters in the alternative, compensatory damages of$55 million plus unspecified punitive damages and other damages, and related loan interest charges in excess of $41 million (the “Claimed Damages”). KB Nevada has denied the allegations, and believes it has meritorious defensesNotes to the consolidated plaintiffs’ claims. At a November 19, 2012 hearing, the court denied all of the consolidated plaintiffs’ motions for summary judgment on their claims. In addition, the court granted several of KB Nevada's motions for summary judgment, eliminating, among other of the consolidated plaintiffs’ claims, all claims for fraud, negligent misrepresentation, and punitive damages. With the court’s decisions, the only remaining claims against KB Nevada are for contract damages and rescission. While the ultimate outcome is uncertain — we believe it is reasonably possible that the lossConsolidated Financial Statements in this matter could range from zero to the amount of the Claimed Damages (now excluding any punitive damages per the court’s action) plus prejudgment interest, which could be material to our consolidated financial statements — KB Nevada believes it will be successful in defending against the consolidated plaintiffs’ remaining claims and that the consolidated plaintiffs will not be awarded rescission or damages. A non-jury trial, originally set for September 2012 and then continued until January 2013, has now been further continued to October 15, 2013.
Other Matters
In addition to the specific proceeding described above, we are involved in other litigation and regulatory proceedings incidental to our business that are in various procedural stages. We believe that the accruals we have recorded for probable and reasonably estimable losses with respect to these proceedings are adequate and that, as of November 30, 2012, it was not reasonably possible that an additional material loss had been incurred in an amount in excess of the estimated amounts already recognized on our consolidated financial statements. We evaluate our accruals for litigation and regulatory proceedings at least quarterly and, as appropriate, adjust them to reflect (i) the facts and circumstances known to us at the time, including information regarding negotiations, settlements, rulings and other relevant events and developments; (ii) the advice and analyses of counsel; and (iii) the assumptions and judgment of management. Similar factors and considerations are used in establishing new accruals for proceedings as to which losses have become probable and reasonably estimable at the time an evaluation is made. Based on our experience, we believe that the amounts that may be claimed or alleged against us in these proceedings are not a meaningful indicator of our potential liability. The outcome of any of these proceedings, including the defense and other litigation-related costs and expenses we may incur, however, is inherently uncertain and could differ significantly from the estimate reflected in a related accrual, if made. Therefore, it is possible that the ultimate outcome of any proceeding, if in excess of a related accrual or if no accrual had been made, could be material to our consolidated financial statements.report.
| |
| Item 4. | MINE SAFETY DISCLOSURES |
Not applicable.
EXECUTIVE OFFICERS OF THE REGISTRANT
The following table presents certain information regarding our executive officers as of December 31, 2012:2015: | | | Name | | Age | | Present Position | | Year Assumed Present Position | | Years at KB Home | | Other Positions and Other Business Experience within the Last Five Years (a) | | From – To | | Age | | Present Position | | Year Assumed Present Position | | Years at KB Home | | Other Positions and Other Business Experience within the Last Five Years (a) | | From – To |
| | | |
| Jeffrey T. Mezger | | 57 | | President and Chief Executive Officer (b) | | 2006 | | 19 | | | 60 | | President and Chief Executive Officer (b) | | 2006 | | 22 | |
| Nicholas S. Franklin | | | 47 | | Executive Vice President, Strategic Operations | | 2015 | | 1 | | Executive Vice President, Next Generation Experience, Walt Disney Parks and Resorts Worldwide, Inc. (an international family entertainment and media enterprise) | | 2009-2014 |
| Jeff J. Kaminski | | 51 | | Executive Vice President and Chief Financial Officer | | 2010 | | 2 | | Senior Vice President, Chief Financial Officer and Strategy Board member, Federal-Mogul Corporation (a global supplier of component parts and systems to the automotive, heavy-duty, industrial and transport markets) | | 2008-2010 | | 54 | | Executive Vice President and Chief Financial Officer | | 2010 | | 5 | |
| | | Senior Vice President, Global Purchasing and Strategy Board Member, Federal-Mogul Corporation | | 2005-2008 | |
| Albert Z. Praw | | 64 | | Executive Vice President, Real Estate and Business Development | | 2011 | | 16 (c) | | Chief Executive Officer, Landstone Communities, LLC (a real estate development company) | | 2006-2011 | | 67 | | Executive Vice President, Real Estate and Business Development | | 2011 | | 19 (c) | | Chief Executive Officer, Landstone Communities, LLC (a real estate development company) | | 2006-2011 |
| Brian J. Woram | | 52 | | Executive Vice President, General Counsel and Secretary | | 2010 | | 2 | | Senior Vice President and Chief Legal Officer, H&R Block, Inc. (a provider of tax, banking and business and consulting services) | | 2009-2010 | | 55 | | Executive Vice President and General Counsel | | 2010 | | 5 | |
| | | Senior Vice President, Chief Legal Officer and Chief Compliance Officer, Centex Corporation (a homebuilder and provider of mortgage banking services) | | 2005-2009 | |
| William R. Hollinger | | 54 | | Senior Vice President and Chief Accounting Officer | | 2007 | | 25 | | | 57 | | Senior Vice President and Chief Accounting Officer | | 2007 | | 28 | |
| Thomas F. Norton | | 42 | | Senior Vice President, Human Resources | | 2009 | | 4 | | Chief Human Resources Officer, BJ’s Restaurants, Inc. (an owner and operator of national full service restaurants) | | 2006-2009 | | 45 | | Senior Vice President, Human Resources | | 2009 | | 7 | |
| Tom Silk | | 44 | | Senior Vice President, Marketing and Communications | | 2011 | | 1 | | Vice President of Marketing for Hydration and Juice Brands, PepsiCo Beverages Americas (a beverage marketing and distribution company) | | 2009-2011 | |
| | | Senior Director, Global Brand Management, Activision Blizzard, Inc. (a game publisher of interactive entertainment software) | | 2006-2009 | |
| |
| (a) | All positions described were with us, unless otherwise indicated. |
| |
| (b) | Mr. Mezger has served as a director since 2006. |
| |
| (c) | We employed Mr. Praw was employed by us from 1989-1992 and from 1994-2006. He was elected to his present position in October 2011. |
There is no family relationship between any of our executive officers or between any of our executive officers and any of our directors.
PART II
| |
| Item 5. | MARKET FOR REGISTRANT’S COMMON EQUITY, RELATED STOCKHOLDER MATTERS AND ISSUER PURCHASES OF EQUITY SECURITIES |
As of December 31, 2012,2015, there were 735635 holders of record of our common stock. Our common stock is traded on the New York Stock Exchange under the ticker symbol “KBH.” The following table presents, for the periods indicated, the price ranges of our common stock, and cash dividends declared and paid per share:
| | | | Year Ended November 30, 2012 | | Year Ended November 30, 2011 | Year Ended November 30, 2015 | | Year Ended November 30, 2014 |
| | High | | Low | | Dividends Declared | | Dividends Paid | | High | | Low | | Dividends Declared | | Dividends Paid | High | | Low | | Dividends Declared | | Dividends Paid | | High | | Low | | Dividends Declared | | Dividends Paid |
| First Quarter | $ | 12.91 |
| | $ | 6.17 |
| | $ | .0625 |
| | $ | .0625 |
| | $ | 16.11 |
| | $ | 11.41 |
| | $ | .0625 |
| | $ | .0625 |
| $ | 17.57 |
| | $ | 11.76 |
| | $ | .0250 |
| | $ | .0250 |
| | $ | 20.78 |
| | $ | 16.38 |
| | $ | .0250 |
| | $ | .0250 |
|
| Second Quarter | 13.12 |
| | 6.77 |
| | .0250 |
| | .0250 |
| | 13.67 |
| | 10.86 |
| | .0625 |
| | .0625 |
| 16.37 |
| | 13.21 |
| | .0250 |
| | .0250 |
| | 20.72 |
| | 15.40 |
| | .0250 |
| | .0250 |
|
| Third Quarter | 11.25 |
| | 6.46 |
| | .0250 |
| | .0250 |
| | 12.27 |
| | 5.09 |
| | .0625 |
| | .0625 |
| 17.42 |
| | 13.50 |
| | .0250 |
| | .0250 |
| | 18.98 |
| | 16.06 |
| | .0250 |
| | .0250 |
|
| Fourth Quarter | 17.30 |
| | 10.89 |
| | .0250 |
| | .0250 |
| | 8.00 |
| | 5.02 |
| | .0625 |
| | .0625 |
| 15.53 |
| | 12.72 |
| | .0250 |
| | .0250 |
| | 18.10 |
| | 13.75 |
| | .0250 |
| | .0250 |
|
The declaration and payment of cash dividends on shares of our common stock, whether at current levels or at all, are at the discretion of our board of directors, and depend upon, among other things, our expected future earnings, cash flows from our operations, capital
requirements, access to external financing, debt structure and adjustments thereto, covenants and other requirements under the Credit Facility or other of our debt obligations, operational and financial investment strategy and general financial condition, as well as general business conditions.
The descriptionInformation regarding the shares of our common stock that may be issued under our equity compensation plans required by Item 201(d) of Regulation S-K is incorporated herein by reference to “Part III — Item 12. Securityprovided below in the “Security Ownership of Certain Beneficial Owners and Management and Related Stockholder Matters” ofsection in this report.
The following table summarizes our purchases of our own equity securities during the three months ended November 30, 2015:
|
| | | | | | | | | | | | | |
| Period | | Total Number of Shares Purchased | | Average Price Paid per Share | | Total Number of Shares Purchased as Part of Publicly Announced Plans or Programs | | Maximum Number of Shares That May Yet be Purchased Under the Plans or Programs |
| September 1-30 | | — |
| | $ | — |
| | — |
| | 4,000,000 |
|
| October 1-31 | | — |
| | — |
| | — |
| | 4,000,000 |
|
| November 1-30 | | 20,104 |
| | 13.27 |
| | — |
| | 4,000,000 |
|
| Total | | 20,104 |
| | $ | 13.27 |
| | — |
| | |
As of November 30, 2015, we were authorized to repurchase 4,000,000 shares of our common stock under a share repurchase program approved by our board of directors in December 2005. We did not repurchase any shares of our equity securitiescommon stock under this program in the year ended November 30, 2015. The shares purchased during the fourth quarterthree months ended November 30, 2015 were previously issued shares delivered to us by employees to satisfy withholding taxes on the vesting of 2012.restricted stock awards as well as shares forfeited by individuals upon their termination of employment. These transactions are not considered repurchases under the share repurchase program.
As discussed in Note 24. Subsequent Event in the Notes to Consolidated Financial Statements in this report, on January 12, 2016, our board of directors authorized us to repurchase a total of up to 10,000,000 shares of our outstanding common stock. This authorization reaffirmed and incorporated the then-current balance of 4,000,000 shares that remained under the prior board-approved share repurchase program.
Stock Performance Graph
The following graph below compares the five-year cumulative total return of KB Home common stock, the S&P 500 Index the S&P Homebuilding Index and the Dow Jones US Home Construction Index for the last five year-end periods ended November 30.30:
Comparison of Five-Year Cumulative Total Return
Among KB Home, S&P 500 Index S&P Homebuildingand
Index and Dow Jones US Home Construction Index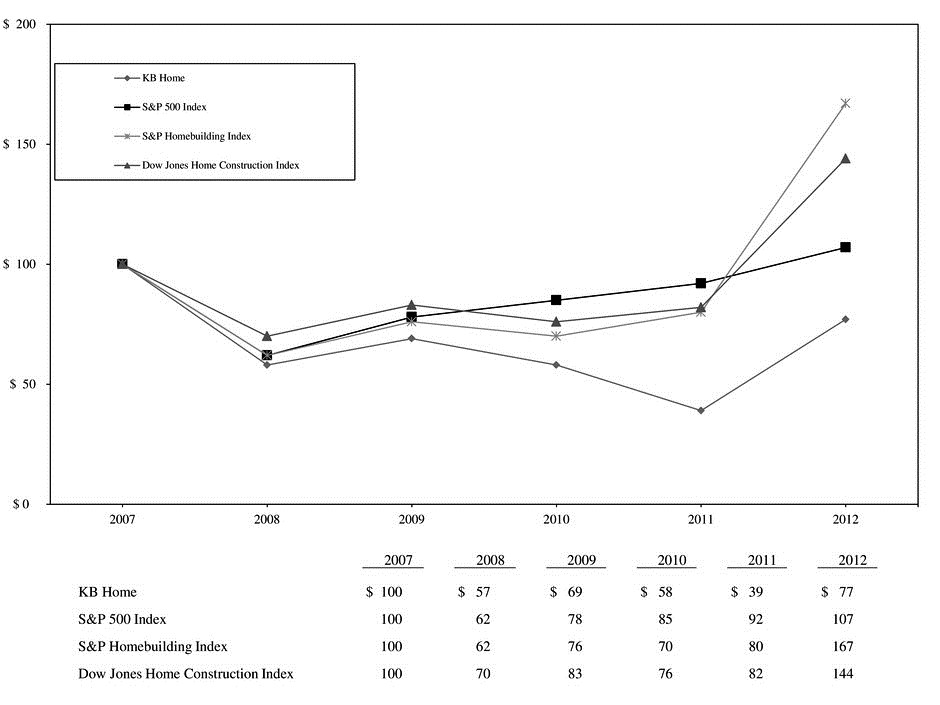
|
| | | | | | | | | | | | | | | | | | | | | | | |
| | 2010 | | 2011 | | 2012 | | 2013 | | 2014 | | 2015 |
| KB Home | $ | 100 |
| | $ | 67 |
| | $ | 132 |
| | $ | 162 |
| | $ | 164 |
| | $ | 132 |
|
| S&P 500 Index | 100 |
| | 108 |
| | 125 |
| | 163 |
| | 191 |
| | 196 |
|
| Dow Jones US Home Construction Index | 100 |
| | 108 |
| | 190 |
| | 198 |
| | 238 |
| | 270 |
|
The above graph is based on the KB Home common stock and index prices calculated as of the last trading day before December 1 of the year-end periods presented. As of November 30, 2012, theThe closing price of KB Home common stock on the New York Stock Exchange was $14.36$14.09 per share.share on November 30, 2015 and $17.57 per share on November 30, 2014. The performance of our common stock depicted in the graphsas presented above representsreflects past performance only and is not indicative of future performance. Total return assumes $100 invested at market close on November 30, 20072010 in KB Home common stock, the S&P 500 Index the S&P Homebuilding Index and the Dow Jones US Home Construction Index, including reinvestment of dividends.
| |
| Item 6. | SELECTED FINANCIAL DATA |
The data in this table should be read in conjunction with “Item 7. Management’sthe “Management’s Discussion and Analysis of Financial Condition and Results of Operations” and our Consolidated Financial Statements and the Notes thereto, which are included in “Item 8. Financial“Financial Statements and Supplementary Data.” Both are includedData” sections in this report.
KB HOME
SELECTED FINANCIAL INFORMATION
(Dollars In Thousands, Except Per Share Amounts)
| | | | Years Ended November 30, | Years Ended November 30, |
| | 2012 | | 2011 | | 2010 | | 2009 | | 2008 | 2015 | | 2014 | | 2013 | | 2012 | | 2011 |
| Statement of Operations Data: | | | | | | | | | | | | | | | | | | |
| Revenues: | | | | | | | | | | | | | | | | | | |
| Homebuilding | $ | 1,548,432 |
| | $ | 1,305,562 |
| | $ | 1,581,763 |
| | $ | 1,816,415 |
| | $ | 3,023,169 |
| $ | 3,020,987 |
| | $ | 2,389,643 |
| | $ | 2,084,978 |
| | $ | 1,548,432 |
| | $ | 1,305,562 |
|
| Financial services | 11,683 |
| | 10,304 |
| | 8,233 |
| | 8,435 |
| | 10,767 |
| 11,043 |
| | 11,306 |
| | 12,152 |
| | 11,683 |
| | 10,304 |
|
| Total revenues | $ | 1,560,115 |
| | $ | 1,315,866 |
| | $ | 1,589,996 |
| | $ | 1,824,850 |
| | $ | 3,033,936 |
| |
| Total | | $ | 3,032,030 |
| | $ | 2,400,949 |
| | $ | 2,097,130 |
| | $ | 1,560,115 |
| | $ | 1,315,866 |
|
| Operating income (loss): | | | | | | | | | | | | | | | | | | |
| Homebuilding | $ | (20,256 | ) | | $ | (103,074 | ) | | $ | (16,045 | ) | | $ | (236,520 | ) | | $ | (860,643 | ) | $ | 138,621 |
| | $ | 115,969 |
| | $ | 92,084 |
| | $ | (20,256 | ) | | $ | (103,074 | ) |
| Financial services | 8,692 |
| | 6,792 |
| | 5,114 |
| | 5,184 |
| | 6,278 |
| 7,332 |
| | 7,860 |
| | 9,110 |
| | 8,692 |
| | 6,792 |
|
| Operating loss | $ | (11,564 | ) | | $ | (96,282 | ) | | $ | (10,931 | ) | | $ | (231,336 | ) | | $ | (854,365 | ) | |
| Pretax loss | $ | (79,053 | ) | | $ | (181,168 | ) | | $ | (76,368 | ) | | $ | (311,184 | ) | | $ | (967,931 | ) | |
| Net loss | $ | (58,953 | ) | | $ | (178,768 | ) | | $ | (69,368 | ) | | $ | (101,784 | ) | | $ | (976,131 | ) | |
| Basic and diluted loss per share | $ | (.76 | ) | | $ | (2.32 | ) | | $ | (.90 | ) | | $ | (1.33 | ) | | $ | (12.59 | ) | |
| Total | | $ | 145,953 |
| | $ | 123,829 |
| | $ | 101,194 |
| | $ | (11,564 | ) | | $ | (96,282 | ) |
| Pretax income (loss) | | $ | 127,043 |
| | $ | 94,949 |
| | $ | 38,363 |
| | $ | (79,053 | ) | | $ | (181,168 | ) |
| Net income (loss) (a) | | $ | 84,643 |
| | $ | 918,349 |
| | $ | 39,963 |
| | $ | (58,953 | ) | | $ | (178,768 | ) |
| Earnings (loss) per share: | | | | | | | | | | |
| Basic | | $ | .92 |
| | $ | 10.26 |
| | $ | .48 |
| | $ | (.76 | ) | | $ | (2.32 | ) |
| Diluted | | $ | .85 |
| | $ | 9.25 |
| | $ | .46 |
| | $ | (.76 | ) | | $ | (2.32 | ) |
| Cash dividends declared per common share | $ | .1375 |
| | $ | .2500 |
| | $ | .2500 |
| | $ | .2500 |
| | $ | .8125 |
| $ | .1000 |
| | $ | .1000 |
| | $ | .1000 |
| | $ | .1375 |
| | $ | .2500 |
|
| Balance Sheet Data: | | | | | | | | | | | | | | | | | | |
| Assets: | | | | | | | | | | | | | | | | | | |
| Homebuilding | $ | 2,557,243 |
| | $ | 2,480,369 |
| | $ | 3,080,306 |
| | $ | 3,402,565 |
| | $ | 3,992,148 |
| $ | 5,001,343 |
| | $ | 4,747,064 |
| | $ | 3,183,595 |
| | $ | 2,557,243 |
| | $ | 2,480,369 |
|
| Financial services | 4,455 |
| | 32,173 |
| | 29,443 |
| | 33,424 |
| | 52,152 |
| 14,028 |
| | 10,486 |
| | 10,040 |
| | 4,455 |
| | 32,173 |
|
| Total assets | $ | 2,561,698 |
| | $ | 2,512,542 |
| | $ | 3,109,749 |
| | $ | 3,435,989 |
| | $ | 4,044,300 |
| |
| Mortgages and notes payable | $ | 1,722,815 |
| | $ | 1,583,571 |
| | $ | 1,775,529 |
| | $ | 1,820,370 |
| | $ | 1,941,537 |
| |
| Total | | $ | 5,015,371 |
| | $ | 4,757,550 |
| | $ | 3,193,635 |
| | $ | 2,561,698 |
| | $ | 2,512,542 |
|
| Notes payable | | $ | 2,625,536 |
| | $ | 2,576,525 |
| | $ | 2,150,498 |
| | $ | 1,722,815 |
| | $ | 1,583,571 |
|
| Stockholders’ equity | $ | 376,806 |
| | $ | 442,657 |
| | $ | 631,878 |
| | $ | 707,224 |
| | $ | 830,605 |
| $ | 1,690,834 |
| | $ | 1,595,910 |
| | $ | 536,086 |
| | $ | 376,806 |
| | $ | 442,657 |
|
| Homebuilding Data: | | | | | | | | | | | | | | | | | | |
| Net orders | 6,703 |
| | 6,632 |
| | 6,556 |
| | 8,341 |
| | 8,274 |
| 9,253 |
| | 7,567 |
| | 7,125 |
| | 6,703 |
| | 6,632 |
|
| Unit backlog | 2,577 |
| | 2,156 |
| | 1,336 |
| | 2,126 |
| | 2,269 |
| 3,966 |
| | 2,909 |
| | 2,557 |
| | 2,577 |
| | 2,156 |
|
| Homes delivered | 6,282 |
| | 5,812 |
| | 7,346 |
| | 8,488 |
| | 12,438 |
| 8,196 |
| | 7,215 |
| | 7,145 |
| | 6,282 |
| | 5,812 |
|
| |
| (a) | Net income for the year ended November 30, 2014 included the impact of an $825.2 million deferred tax asset valuation allowance reversal in the 2014 fourth quarter. |
| |
| Item 7. | MANAGEMENT’S DISCUSSION AND ANALYSIS OF FINANCIAL CONDITION AND RESULTS OF OPERATIONS |
RESULTS OF OPERATIONS
Overview. Revenues are generated from our homebuilding and financial services operations. The following table presents a summary of our consolidated results of operations for the years ended November 30, 2012, 2011 and 2010 (in(dollars in thousands, except per share amounts):
| | | | Years Ended November 30, | | Variance | Years Ended November 30, | | Variance |
| | 2012 | | 2011 | | 2010 | | 2012 vs 2011 | | 2011 vs 2010 | 2015 | | 2014 | | 2013 | | 2015 vs 2014 | | 2014 vs 2013 |
| Revenues: | | | | | | | | | | | | | | | | | | |
| Homebuilding | $ | 1,548,432 |
| | $ | 1,305,562 |
| | $ | 1,581,763 |
| | 19 | % | | (17 | )% | $ | 3,020,987 |
| | $ | 2,389,643 |
| | $ | 2,084,978 |
| | 26 | % | | 15 | % |
| Financial services | 11,683 |
| | 10,304 |
| | 8,233 |
| | 13 |
| | 25 |
| 11,043 |
| | 11,306 |
| | 12,152 |
| | (2 | ) | | (7 | ) |
| Total | $ | 1,560,115 |
| | $ | 1,315,866 |
| | $ | 1,589,996 |
| | 19 | % | | (17 | )% | $ | 3,032,030 |
| | $ | 2,400,949 |
| | $ | 2,097,130 |
| | 26 | % | | 14 | % |
| Pretax income (loss): | | | | | | | | | | |
| Pretax income: | | | | | | | | | | |
| Homebuilding | $ | (89,936 | ) | | $ | (207,246 | ) | | $ | (88,511 | ) | | 57 | % | | (134 | )% | $ | 115,419 |
| | $ | 86,403 |
| | $ | 28,179 |
| | 34 | % | | 207 | % |
| Financial services | 10,883 |
| | 26,078 |
| | 12,143 |
| | (58 | ) | | 115 |
| 11,624 |
| | 8,546 |
| | 10,184 |
| | 36 |
| | (16 | ) |
| Total pretax loss | (79,053 | ) | | (181,168 | ) | | (76,368 | ) | | 56 |
| | (137 | ) | |
| Income tax benefit | 20,100 |
| | 2,400 |
| | 7,000 |
| | 738 |
| | (66 | ) | |
| Net loss | $ | (58,953 | ) | | $ | (178,768 | ) | | $ | (69,368 | ) | | 67 | % | | (158 | )% | |
| Basic and diluted loss per share | $ | (.76 | ) | | $ | (2.32 | ) | | $ | (.90 | ) | | 67 | % | | (158 | )% | |
| Total pretax income | | 127,043 |
| | 94,949 |
| | 38,363 |
| | 34 |
| | 148 | % |
| Income tax benefit (expense) | | (42,400 | ) | | 823,400 |
| | 1,600 |
| | (a) |
| | (a) |
|
| Net income | | $ | 84,643 |
| | $ | 918,349 |
| | $ | 39,963 |
| | (91 | )% | | (a) |
|
| Earnings per share: | | | | | | | | | | |
| Basic | | $ | .92 |
| | $ | 10.26 |
| | $ | .48 |
| | (91 | )% | | (a) |
|
| Diluted | | $ | .85 |
| | $ | 9.25 |
| | $ | .46 |
| | (91 | )% | | (a) |
|
(a) Percentage not meaningful.
In 2012,2015, we produced strong operational and financial results largely through our focused execution on four primary strategic priorities — grow our community count; enhance the overall housing market showed steadily encouraging signsprofitability of stabilizingeach home delivered; generate higher revenues; and recovering fromimprove our asset efficiency and return on invested capital. Our 2015 performance also reflected generally favorable conditions in most of our served markets, with healthy supply and demand dynamics fueled by steady employment and economic gains over the severe downturn that begancourse of the year. Among our achievements, compared to 2014, we increased homes delivered by 14%, total revenues by 26%, and pretax income by 34%. We accomplished these results notwithstanding external headwinds in mid-2006, with the benefits extending to both the new homefourth quarter, including inclement weather conditions and resale segments. The pace of stabilization and recovery between and within individual housing markets, however, was uneven, withtrade shortages in certain markets, that tempered home deliveries and submarkets exhibiting greater upward momentum than others in housing starts, home salesrevenues, and home selling prices. We expect these dynamics — overall improvement with regionaldespite higher land, land development and local market-to-market variability — to continue in 2013. We also believe that in this environment, our ongoing strategic focus on higher-performing, choice locations enabled us to achieve improved results in 2012, and has positioned us for growth in 2013 and beyond.
The present housing recovery that began in 2012 has been driven by growing demand and a tightening supply of homes available for sale. This demand has been fueled by historically high housing affordability, particularly compared to rising rentalconstruction costs reflecting record-low interest rates for mortgage loans and relatively low home selling prices due to the significant reductions that occurred during the housing downturn. Demand is also emergingyear that, along with growth in household formations amid a gradually improving economic and employment environment. The number of homes available for sale has fallen in several markets with the upturn in demand, including from investors purchasing homes to convert into rental properties. Also affecting supply are a reductionan increase in the numberamortization of lender-owned and other distressed homes available for sale, a reluctance of some current homeowners to sell at existing price levels, including homeowners who have mortgage loan balances that exceed such levels, and the impact of diminished new home construction activity during the housing downturn.
The present housing recovery has had a positive impact on our business and on the homebuilding industry, but the improvement was from a low base — annual U.S. new home sales in 2011 were the lowest on record — and we believe the favorable trends that emerged in 2012 will need to strengthen and continue for some time before the majority of housing markets returnpreviously capitalized interest, contributed to a more historically typical state. Moreover, to varying degrees, many180 basis point year-over-year decrease in our full-year housing markets continue to face significant challenges. These include uncertain economic conditions, tepid job and wage growth, tight mortgage lending standards, reduced credit availability for mortgage loans, continued elevated levels of mortgage loan delinquencies and defaults, and increased construction labor and building materials costs. If these challenges do not abate, or if they deepen, they could slow or stopgross profit margin.
During the present housing recovery and negatively affectyear, through our performance. Therefore, although we are encouraged by the healthier housing market environment, and believe that it could be the beginning of a new upward business cycle for homebuilding, and are planning to make additional investments in land and land development, we made additional progress in expanding our community count and other strategic growth initiativespositioning our communities in 2013attractive locations to further expand our business, our future performance andsustain the success of the strategies we implement (and adjust or refine as necessary or appropriate) will significantly depend on prevailing economic and credit and financial market conditions.
As discussed above under “Part I — Item 1. Business — Strategy,” we transformed and refocused the scope, scale and positionupward momentum of our business both geographicallyin 2015 and operationally, and executedbeyond. Our average community count in 2015 rose 22% on three primary and integrated strategic goals, with achieving and maintaining profitability at the scale of prevailing market conditions our highest priority. Within this strategic framework, we improved and refined our products; moved to align our overhead to market activity levels through a dedicated effort to control costs while maintaining a solid growth platform; improved our operating efficiencies; shifted resources from underperforming areas; and made investmentsyear-over-year basis, which helped drive measurable increases in our business in preferred locations with perceived strong growth prospects. With these strategic actions, we believe we strengthenednet orders, net order value and backlog levels. Our 2015 ending community count of 247 was 9% higher than our overall business and felt we entered 2012 well-positioned for profitability if and as housing market conditions improved.2014 year-end number.
With the housing recovery gaining traction, in the latter half of 2012, weour expanded onyear-end community count and our primary strategic goals to target both profitability and growth. As further described above under “Part I — Item 1. Business — Strategy,” this encompassed implementing four main strategic growth initiatives: (1) aggressively investingcurrent plans for new investments in land and land development in higher-performing, choice locations. In 2012, we invested approximately $565 million in land and land development in such preferred locations; (2) increasing revenues per new home community open for sales through an intense focus on sales performance; (3) activating certain inventory in stabilizing markets that was previously held for future development; and (4) bringing additional resources to targeted markets where we operate.
In addition to our strategic growth initiatives, we believe we further strengthened our business in 2012 by implementing an operational transition to Nationstar as our preferred mortgage lender. Since May 1, when it began accepting applications under our preferred relationship, Nationstar’s performance as our preferred lender has helped to provide more stability in the conversion of our backlog into home deliveries and revenues. We also extended our senior debt maturity schedule through the issuance of the $350 Million 8.00% Senior Notes and the $350 Million 7.50% Senior Notes in the first and third quarters, respectively, to fund the related simultaneous applicable tender offers for certain of our senior notes due in 2014 and 2015 that were initially made on January 19, 2012 (the “January 2012 Tender Offers”) and on July 11, 2012 (the “July 2012 Tender Offers”).
We believe that through our execution of our strategic growth initiatives, combined with the actions we have taken through the housing downturn and the recent improvement in housing market conditions, we were able to generate positive year-over-year results in 2012 in several areas of our business, as discussed below.
Revenues. Total revenues of $1.56 billion for the year ended November 30, 2012 increased 19% from $1.32 billion in 2011. The year-over-year increase in total revenues was primarily due to an increase in housing revenues to $1.55 billion from $1.31 billion in 2011, reflecting an increaseincreases in the number of homes in our backlog and corresponding backlog value at November 30, 2015, each of which reached their highest year-end levels since 2007; and our expectation of positive housing market conditions in the coming year, we believe we are well-positioned for further growth in 2016, including in homes delivered and an increase inrevenues.
The following table provides a summary of the overall average selling price of those homes. We had no land sale revenues in 2012, compared to total land sale revenues of $.3 million in 2011. Included in our total revenues were financial services revenues of $11.7 million in 2012current-year and $10.3 million in 2011. The year-over-year increase in financial services revenues reflected higher marketing services fees as a resultpotential future productivity of our having a marketing services agreementoperating platform in placeterms of our net orders, net order value, cancellation rate, ending backlog, and community count for all of 2012, compared to only a portion of 2011,the years ended November 30, 2015 and higher title services revenues.2014 (dollars in thousands):
|
| | | | | | | | |
| | | Years Ended November 30, |
| | | 2015 | | 2014 |
| Net orders | | 9,253 |
| | 7,567 |
|
| Net order value (a) | | $ | 3,255,170 |
| | $ | 2,579,951 |
|
| Cancellation rate (b) | | 27 | % | | 31 | % |
| Ending backlog — homes | | 3,966 |
| | 2,909 |
|
| Ending backlog — value | | $ | 1,281,478 |
| | $ | 914,025 |
|
| Ending community count | | 247 |
| | 227 |
|
| Average community count | | 244 |
| | 200 |
|
| |
◦(a) | Homes Delivered. We delivered 6,282Net order value represents the potential future housing revenues associated with net orders generated during the period as well as homebuyer spending on design studio options and upgrades for homes in 2012, up 8% from 5,812 homes delivered in 2011, partly due to our relatively higher backlog atduring the beginning of the year, which was up 61% on a year-over-year basis largely as a result of a 39% increase in net orders in the latter half of 2011.
same period. |
| |
◦(b) | Average Selling Price. Our overall average selling priceThe cancellation rates represent the total number of contracts for new homes delivered increased 10% in 2012 (and 5% in 2011 compared to 2010), primarily due to changes in community and product mix, as we delivered morecanceled during a period divided by the total (gross) orders for new homes from markets with stronger economies that featured higher household incomes, with customers who chose larger home sizes at higher selling prices and spent more on design options at our KB Home Studios.
generated during the same period. |
Operating Loss. Our homebuilding operating loss improved by $82.8 million to $20.3 million in 2012, compared to $103.1 million in 2011, reflecting higher housing gross profits, partly offset by higher selling, general and administrative expenses. The year-over-year improvement in 2012 also reflected a $30.8 million loss on loan guaranty recorded in 2011 related to our investment in a residential development joint venture located near Las Vegas, Nevada that underwent a bankruptcy reorganization in that year as discussed in Note 9. Investments in Unconsolidated Joint Ventures in the Notes to Consolidated Financial Statements in this report. As a percentage of homebuilding revenues, our operating loss was 1.3% in 2012, compared to 7.9% in 2011.
| |
◦ | Housing Gross Profits. Housing gross profits increased by $55.4 million to $230.9 million in 2012 from $175.5 million in 2011. Our housing gross profit margin was 14.9% in 2012 compared to 13.4% in 2011. Our housing gross profits for 2012 reflected insurance recoveries of $26.5 million related to repair costs and costs to handle claims with respect to previously delivered homes, including homes affected by allegedly defective drywall manufactured in China, and favorable net warranty adjustments of $8.6 million that reflected trends in our overall warranty claims experience, which were partly offset by inventory impairment and land option contract abandonment charges of $28.5
|
millionNet Orders. In 2011, our housing gross profits included $25.8 million of inventory impairment and land option contract abandonment charges, which were partially offset by $7.4 million of favorable warranty adjustments. Our housing gross profit margin, excluding inventory impairment and land option contract abandonment charges, was 16.8% in 2012 compared to 15.4% in 2011. Our calculation of this measure of housing gross profit margin is described below under “Non-GAAP Financial Measures.”
| |
◦ | Selling, General and Administrative Expenses. Selling, general and administrative expenses totaled $251.2 million in 2012, up from $247.9 million in 2011. The year-over-year increase was primarily due to an $8.8 million charge recorded in 2012 as a result of an unfavorable court decision that is being appealed, as discussed in Note 14. Legal Matters in the Notes to Consolidated Financial Statements in this report, and costs associated with the year-over-year increase in the volume of homes delivered, partly offset by cost-saving initiatives. In addition, selling, general and administrative expenses for 2011 included the favorable impact of legal expense recoveries of $8.3 million. As a percentage of housing revenues, to which these expenses are most closely correlated, selling, general and administrative expenses improved to 16.2% in 2012, compared to 19.0% in 2011. The percentage improved in 2012 compared to 2011, primarily due to the 19% year-over-year increase in housing revenues.
|
Net Loss. We generated a2015, net loss of $59.0 million, or $.76 per diluted share, in 2012, compared to a net loss of $178.8 million, or $2.32 per diluted share, in 2011. Our 2012 net loss included insurance recoveries and favorable net warranty adjustments, which were partly offset by inventory impairment and land option contract abandonment charges and the court decision charge, all as noted above. The net loss in 2012 also included an income tax benefit of $20.1 million, reflecting the resolution of federal and state tax audits. In 2011, our net loss included inventory impairment and land option contract abandonment charges of $25.8 million, and a joint venture impairment charge of $53.7 million and a loss on loan guaranty of $30.8 million, both related to our investment in the residential development joint venture located near Las Vegas, Nevada noted above. Our net loss for 2011 also included a gain of $19.8 million associated with the wind down of KBA Mortgage, which ceased offering mortgage banking services in late June 2011, legal expense recoveries of $8.3 million, a favorable warranty adjustment of $7.4 million, and an income tax benefit of $2.4 million.
Cash, Cash Equivalents and Restricted Cash. Our cash, cash equivalents and restricted cash totaled $567.1 million at November 30, 2012, up from $479.5 million at November 30, 2011. Of our total cash, cash equivalents and restricted cash at November 30, 2012 and 2011, $524.8 million and $415.1 million, respectively, was unrestricted.
Inventories. While we made substantial investments in land and land development in 2012, our inventory balance of $1.71 billion at November 30, 2012 was slightly lower than the $1.73 billion balance at November 30, 2011. This decrease reflected the higher number of homes delivered and the inventory impairment and land option contract abandonment charges of $28.5 million recorded in 2012. It also reflected that our land investments during 2012 resulted in our having 4,925 more lots controlled under land option contracts or other similar contracts, which required a lower upfront investment, at November 30, 2012 than we had at November 30, 2011. Overall, we had a higher percentage of lots controlled under land option contracts or other similar contracts at the end of the year— 27% in 2012 compared to 18% in 2011. We ended our 2012 fiscal year with a land inventory portfolio comprised of 44,752 lots owned or controlled, representing an increase of 11% from the 40,170 lots owned or controlled at November 30, 2011.
Mortgages and Notes Payable. Our debt balance at November 30, 2012 was $1.72 billion, up from $1.58 billion at November 30, 2011. Our debt balance at the end of our 2012 fiscal year reflected the issuance during the year of the $350 Million 8.00% Senior Notes and the $350 Million 7.50% Senior Notes, which was largely offset by the total purchase of $584.9 million in aggregate principal amount of certain of our senior notes due in 2014 and 2015 pursuant to the applicable tender offers noted above. Our ratio of debt to total capital was 82.1% at November 30, 2012, compared to 78.2% at November 30, 2011. Our ratio of net debt to total capital (a calculation that is described below under “Non-GAAP Financial Measures”) was 75.4% at November 30, 2012 and 71.4% at November 30, 2011.
Net Orders and Backlog. Net orders from our homebuilding operations increased 1% in 2012, despite an 18%22% from 2014, largely due to the year-over-year decreasegrowth in our average community count at the endcount. The combination of the year. Compared to the prior year,higher net orders in 2012 increased 7%and 9% in our West Coast and Central homebuilding reporting segments, respectively, and decreased 27% and 4% in our Southwest and Southeast homebuilding reporting segments, respectively. The year-over-year decreases reflected our strategic repositioning from certain underperforming locationsa higher overall average selling price resulted in the affected segments, and a significant downsizingvalue of our business in Arizona and Charlotte, North Carolina in 2011 and into 2012. The value of the2015 net orders we generatedincreasing 26% from 2014. Our cancellation rate also improved on a year-over-year basis in 2012 increased 2015.
15% to $1.73 billion from $1.51 billion in 2011, also reflecting the impact of our strategic repositioning initiatives. Three of our four homebuilding reporting segments generated year-over-year increases in net order value, with our West Coast homebuilding reporting segment up 23% to $859.3 million, our Central homebuilding reporting segment up 16% to $484.6 million, and our Southeast homebuilding reporting segment up 5% to $254.2 millionBacklog. The number of homes in our ending backlog at November 30, 2015 rose 20%36% from the previous year, over year, primarilylargely due to a higher number of homes in backlog at the
beginning of 2012 and the slightyear-over-year increase in our net orders for the year.in 2015. The potential future housing revenues in our backlog at November 30, 2012 increased 35%2015 grew 40% from the prior year, reflecting the higherlarger number of homes in our backlog and athe higher average selling price of those homes. Substantially all of the homes in our backlog at November 30, 2015 are expected to be delivered during the year ending November 30, 2016.
Community Count. The year-over-year growth in our overall average selling price.
The following table presents information concerningand ending community counts was primarily due to the strong inventory pipeline we have strategically built over the past few years through substantial investment in land and land development and by increasing the proportion of those investments dedicated to land development. While we moderated our overall investment level in 2015 to $967.2 million from $1.47 billion in 2014, approximately 68% of our total investment in the current year related to land development, compared to approximately 46% in the previous year, reflecting our emphasis in 2015 on converting our owned land into new communities open for sales to promote growth in our net orders, cancellation rate, ending backlog, homes delivered and ending community count for the years ended November 30, 2012 and 2011 (dollars in thousands):
|
| | | | | | | | |
| | | Years Ended November 30, |
| | | 2012 | | 2011 |
| Net orders | | 6,703 |
| | 6,632 |
|
| Net order value | | $ | 1,733,146 |
| | $ | 1,511,654 |
|
| Cancellation rate | | 31 | % | | 29 | % |
| Ending backlog — homes | | 2,577 |
| | 2,156 |
|
| Ending backlog — value | | $ | 618,626 |
| | $ | 458,950 |
|
| Ending community count | | 191 |
| | 234 |
|
Our lower community count in 2012 compared to 2011 reflected the impact of our strategic repositioning efforts to focus on higher-performing, choice locations and, in part, the close-out of older communities during 2012 at a faster pace than openings of new communities for sales. With the substantial inventory-related investments we made in 2012 and are planning to make in 2013, however, we expect that our overall community count will increase in 2013. Our cancellation rate was 31% in 2012, which was slightly higher than the 29% in 2011, due in part to the mortgage loan funding issues we encountered in 2012 before we transitioned to Nationstar as our preferred mortgage lender, as further described in Note 6. Inventory Impairments and Land Option Contract Abandonments in the Notes to Consolidated Financial Statements in this report.revenues.
HOMEBUILDING
We have grouped our homebuilding activities into four reportable segments, which we refer to as West Coast, Southwest, Central and Southeast. As of November 30, 2012, our homebuilding reporting segments consisted of ongoing operations located in the following states: West Coast — California; Southwest — Arizona, Nevada and New Mexico; Central — Colorado and Texas; and Southeast — Florida, Maryland, North Carolina and Virginia.
The following table presents a summary of certain financial and operational data for our homebuilding operations (dollars in thousands, except average selling price):
| | | | Years Ended November 30, | Years Ended November 30, |
| | 2012 | | 2011 | | 2010 | 2015 | | 2014 | | 2013 |
| Revenues: | | | | | | | | | | |
| Housing | $ | 1,548,432 |
| | $ | 1,305,299 |
| | $ | 1,575,487 |
| $ | 2,908,236 |
| | $ | 2,369,633 |
| | $ | 2,084,103 |
|
| Land | — |
| | 263 |
| | 6,276 |
| 112,751 |
| | 20,010 |
| | 875 |
|
| Total | 1,548,432 |
| | 1,305,562 |
| | 1,581,763 |
| 3,020,987 |
| | 2,389,643 |
| | 2,084,978 |
|
| Costs and expenses: | | | | | | | | | | |
| Construction and land costs | | | | | | | | | | |
| Housing | (1,317,529 | ) | | (1,129,785 | ) | | (1,301,677 | ) | (2,433,683 | ) | | (1,940,100 | ) | | (1,736,320 | ) |
| Land | — |
| | (200 | ) | | (6,611 | ) | (105,685 | ) | | (45,551 | ) | | (766 | ) |
| Total | (1,317,529 | ) | | (1,129,985 | ) | | (1,308,288 | ) | (2,539,368 | ) | | (1,985,651 | ) | | (1,737,086 | ) |
| Selling, general and administrative expenses | (251,159 | ) | | (247,886 | ) | | (289,520 | ) | (342,998 | ) | | (288,023 | ) | | (255,808 | ) |
| Loss on loan guaranty | — |
| | (30,765 | ) | | — |
| |
| Total | (1,568,688 | ) | | (1,408,636 | ) | | (1,597,808 | ) | (2,882,366 | ) | | (2,273,674 | ) | | (1,992,894 | ) |
| Operating loss | $ | (20,256 | ) | | $ | (103,074 | ) | | $ | (16,045 | ) | |
| Operating income | | $ | 138,621 |
| | $ | 115,969 |
| | $ | 92,084 |
|
| Homes delivered | 6,282 |
| | 5,812 |
| | 7,346 |
| 8,196 |
| | 7,215 |
| | 7,145 |
|
| Average selling price | $ | 246,500 |
| | $ | 224,600 |
| | $ | 214,500 |
| $ | 354,800 |
| | $ | 328,400 |
| | $ | 291,700 |
|
| Housing gross profit margin as a percentage of housing revenues | 14.9 | % | | 13.4 | % | | 17.4 | % | 16.3 | % | | 18.1 | % | | 16.7 | % |
| Adjusted housing gross profit margin as a percentage of housing revenues | | 21.0 | % | | 22.5 | % | | 22.6 | % |
| Selling, general and administrative expenses as a percentage of housing revenues | 16.2 | % | | 19.0 | % | | 18.4 | % | 11.8 | % | | 12.2 | % | | 12.3 | % |
| Operating loss as a percentage of homebuilding revenues | (1.3 | )% | | (7.9 | )% | | (1.0 | )% | |
| Operating income as a percentage of homebuilding revenues | | 4.6 | % | | 4.9 | % | | 4.4 | % |
The following tables present homes delivered, net orders, cancellation rates, net order value, average community count, and ending backlog (number of homes and value) by homebuilding reporting segment (dollars in thousands):
|
| | | | | | | | | | | | | | | | | | |
| | | Years Ended November 30, |
| | | Homes Delivered | | Net Orders | | Cancellation Rates |
| Segment | | 2015 | | 2014 | | 2015 | | 2014 | | 2015 | | 2014 |
| West Coast | | 2,258 |
| | 1,913 |
| | 2,403 |
| | 2,086 |
| | 21 | % | | 21 | % |
| Southwest | | 1,311 |
| | 736 |
| | 1,592 |
| | 872 |
| | 22 |
| | 25 |
|
| Central | | 3,183 |
| | 3,098 |
| | 3,536 |
| | 3,239 |
| | 33 |
| | 37 |
|
| Southeast | | 1,444 |
| | 1,468 |
| | 1,722 |
| | 1,370 |
| | 26 |
| | 34 |
|
| Total | | 8,196 |
| | 7,215 |
| | 9,253 |
| | 7,567 |
| | 27 | % | | 31 | % |
|
| | | | | | | | | | | | | | | | | | | | | | |
| | | Years Ended November 30, |
| | | Net Order Value | | Average Community Count |
| Segment | | 2015 | | 2014 | | Variance | | 2015 | | 2014 | | Variance |
| West Coast | | $ | 1,378,644 |
| | $ | 1,217,590 |
| | 13 | % | | 53 |
| | 43 |
| | 23 | % |
| Southwest | | 455,918 |
| | 230,632 |
| | 98 |
| | 37 |
| | 21 |
| | 76 |
|
| Central | | 943,568 |
| | 755,684 |
| | 25 |
| | 93 |
| | 84 |
| | 11 |
|
| Southeast | | 477,040 |
| | 376,045 |
| | 27 |
| | 61 |
| | 52 |
| | 17 |
|
| Total | | $ | 3,255,170 |
| | $ | 2,579,951 |
| | 26 | % | | 244 |
| | 200 |
| | 22 | % |
| | | | | | | | | | | | | |
| | | | | | | | | | | | | |
| | | November 30, |
| | | Backlog – Homes | | Backlog – Value |
| Segment | | 2015 | | 2014 | | Variance | | 2015 | | 2014 | | Variance |
| West Coast | | 738 |
| | 593 |
| | 24 | % | | $ | 407,972 |
| | $ | 355,651 |
| | 15 | % |
| Southwest | | 605 |
| | 324 |
| | 87 |
| | 167,425 |
| | 82,140 |
| | 104 |
|
| Central | | 1,842 |
| | 1,489 |
| | 24 |
| | 494,836 |
| | 334,007 |
| | 48 |
|
| Southeast | | 781 |
| | 503 |
| | 55 |
| | 211,245 |
| | 142,227 |
| | 49 |
|
| Total | | 3,966 |
| | 2,909 |
| | 36 | % | | $ | 1,281,478 |
| | $ | 914,025 |
| | 40 | % |
Revenues. Homebuilding revenues totaled $1.55$3.02 billion in 2012, increasing 19%2015, up 26% from $1.31 billion in 2011,2014, which had decreased 17%increased 15% from $1.58 billion in 2010.2013. The year-over-year increaseincreases in our homebuilding revenues in 2012 was due to higher housing revenues, while the year-over-year decrease2015 and 2014 reflected growth in 2011 reflected lowerour housing and land sale revenues.revenues in each of those years.
Housing revenues were $1.55 billionin 2012, compared to $1.31 billion in 2011 and $1.58 billion in 2010. Housing revenues rose 19% in 20122015 grew 23% from the previous year, reflecting an 8%a 14% increase in the number of homes delivered and a 10%an 8% increase in the overall average selling price of those homes. In 2011,2014, housing revenues declined 17%rose 14% from 20102013 due to a 21% decrease1% increase in the number of homes delivered partly offset byand a 5%13% increase in the overall average selling price.
We delivered 6,282a total of 8,196 homes in 2012,2015, up from 5,8127,215 homes delivered in 2014. This increase primarily reflected the 14% higher backlog we had at the beginning of 2015 as compared to the previous year. Theyear and the 22% increase in our net orders during the year. In 2014, the number of homes delivered was partly due to our relatively higher backlog at the beginning of the year, which was up 61% on a year-over-year basis largelyrose from 7,145 in 2013 mainly as a result of a 39% increase6% growth in our net orders induring the latter half of 2011. Within our homebuilding reporting segments, the numberyear. The overall average selling price of homes delivered advanced to $354,800 in 20122015 from $328,400 in 2014, which had increased by 11%, 19% and 3%from $291,700 in our West Coast, Central and Southeast homebuilding reporting segments, respectively, and decreased by 19% in our Southwest homebuilding reporting segment, in each case as compared to the year-earlier period. The decrease in homes delivered in our Southwest homebuilding reporting segment reflected a strategic reduction in our investments in certain underperforming locations in the segment and the significant downsizing of our business in Arizona during 2011 and into 2012, each part of an overall repositioning of our operations to focus on better-performing markets.
In 2011, we delivered 5,812 homes, down from 7,346 homes in 2010. The decrease in the number of homes delivered was partly due to our relatively low backlog level at the beginning of 2011, which was down 37% on a year-over-year basis. The lower beginning backlog reflected softness in net orders in the third and fourth quarters of 2010 due to generally weak housing market conditions, depressed demand and sales activity following a temporary surge in the first two quarters of 2010 that was motivated by the expiration of a federal homebuyer tax credit (the “Tax Credit”), and, to a lesser extent, the implementation of our strategic repositioning initiatives. Each of our homebuilding reporting segments delivered fewer homes in 2011 compared to 2010, with decreases ranging from 13% in our West Coast homebuilding reporting segment to 30% in our Southeast homebuilding reporting segment.2013.
The overall average selling price of homes delivered increased on a year-over-year basis in both 2015 and 2014 as a result of our continued strategic focus on positioning our new home communities in attractive, land-constrained locations featuring higher-income homebuyers who prefer larger homes and prefer to $246,500 in 2012 primarily due to changes in communityinclude more lot and product mix, as we delivered more homes from marketspremiums and design options and upgrades with economic and consumer demand dynamics that supported largerthe construction of their homes; higher median home sizes and higher selling prices. Our higher overall average selling price of homes delivered in 2012 reflected year-over-year increases of 16%, 17% and 5% inprices; our West Coast, Southwest and Southeast homebuilding reporting segments, respectively. In our Central homebuilding reporting segment, the average selling price of homes delivered in 2012 remained essentially even with 2011.
Our 2011 overall average selling price of homes delivered roseactions to $224,600 from $214,500 in 2010, as averagebalance home selling prices increasedand sales pace to optimize revenues and profits; and generally favorable market conditions.
Our land sale revenues totaled $112.8 million in three2015, $20.0 million in 2014 and $.9 million in 2013. The substantial increase in land sale revenues in 2015 reflected activity in each of our four homebuilding reporting segments. Year over year, average selling prices in 2011 increased 5% in bothsegments as part of an ongoing focus on improving our Southwest and Central homebuilding reporting segments and 15% in our Southeast homebuilding reporting segment. In our West Coast homebuilding reporting segment, the 2011 average selling price of homes delivered decreased 3% from the prior year.asset efficiency by executing on targeted opportunities to monetize certain land positions. The increase in our overall average selling price in 2011 was mainly due to changes in the proportion of homes delivered from communities with higher-priced homes, and a shift in product mix to larger homes.
We had no land sales in 2012. Land2015 were mainly comprised of the sale revenues totaled $.3 millionof a large land parcel in 2011northern California and $6.3 million in 2010.sales of certain land previously held for future development. Generally, land sale revenues fluctuate with our decisions to maintain or decrease our land ownership position in certain markets based upon the volume of our holdings, our marketing strategy, the strength and number of competing developers enteringand other land buyers in particular markets at given points in time, the availability of land at reasonable prices and prevailing market conditions.
Operating Loss.Income. Our homebuilding business generated operating losses of $20.3income increased 20% to $138.6 million in 2012, $103.12015 compared to $116.0 million in 2011 and $16.02014, which had increased 26% from $92.1 million in 2010.2013. Our homebuilding operating lossincome as a percentage of homebuilding revenues was 1.3%4.6% in 2012, 7.9%2015, 4.9% in 2011,2014 and 1.0%4.4% in 2010.
2013. The year-over-year improvementgrowth in our 2012homebuilding operating results was primarily due toincome for 2015 reflected higher housing gross profits and improved land sale results that were partly offset by higher selling, general and administrative expenses. The improvementIn 2014, the increase in 2012 also reflectedour homebuilding operating income from the previous year was primarily due to higher housing gross profits that were partially offset by higher selling, general and administrative expenses and land sale losses.$30.8
In 2015, our housing gross profits increased by $45.0 million, loss on loan guaranty recorded or 10%, from $429.5 million in 2011 related2014 due to the higher volume of homes delivered, partly offset by a lower housing gross profit margin. Housing gross profits for 2015 included $9.6 million of inventory impairment and land option contract abandonment charges. In 2014, our investmenthousing gross profits increased by $81.7 million, or 24%, from $347.8 million in the previous year due to the higher volume of homes delivered and a residential development joint venture located near Las Vegas, Nevada that underwenthigher housing gross profit margin. Housing gross profits for 2014 included $12.8 million of inventory impairment and land option contract abandonment charges. In 2013, housing gross profits included a bankruptcy reorganizationnet warranty charge of $32.0 million for water intrusion-related repairs of homes at certain of our communities in that yearcentral and southwest Florida, as discussed in Note 9. Investments in Unconsolidated Joint Ventures15. Commitments and Contingencies in the Notes to Consolidated Financial Statements in this report. Our housing gross profits for 2012 increased by $55.4 million from $175.5 million for the year-earlier period. Housing gross profits for 2012 included $26.5 million of insurance recoveries related to repair costsreport, and costs to handle claims with respect to previously delivered homes, including homes affected by allegedly defective drywall manufactured in China, and favorable net warranty adjustments of $8.6 million that reflected trends in our overall warranty claims experience. The impact of these items was mostly offset by inventory impairment and land option contract abandonment charges of $28.5 million. Our 2012 housing gross profit margin improved by 1.5 percentage points to 14.9% from 13.4% in 2011. Our housing gross profit margin, excluding inventory impairment and land option contract abandonment charges, was 16.8% in 2012 and 15.4% in 2011.
In 2011, the year-over-year increase in our operating loss reflected lower housing gross profits compared to 2010 and the loss on loan guaranty, partly offset by reduced selling, general and administrative expenses. The decrease in housing gross profits in 2011 resulted from fewer homes delivered and a lower housing gross profit margin. Our housing gross profit margin was 13.4% in 2011, compared to 17.4% in 2010. In 2011, our housing gross profits included $25.8$3.6 million of inventory impairment and land option contract abandonment charges, which were partly offset by $7.4 million of favorable warranty adjustments that were made based on downward trends in our overall warranty claims experience on homes previously delivered. In 2010, our housing gross profits included $19.6 million of inventory impairment and land option contract abandonment charges.
Our housing gross profit margin excluding inventory impairmentdecreased 180 basis points to 16.3% in 2015 from 18.1% in the previous year, primarily due to higher land, land development and land option contract abandonmentconstruction costs (approximately 210 basis points) and an increase in the amortization of previously capitalized interest (approximately 60 basis points). The impact of these items was partly offset by a decrease in inventory-related charges was 15.4% in 2011,(approximately 30 basis points) and improved operating leverage as a result of our higher volume of homes delivered and revenues compared to 18.6% in 2010. The year-over-year decrease in our2014 (approximately 60 basis points). Our 2014 housing gross profit margin improved by 140 basis points as compared to 16.7% in 2011 reflected reduced operating leverage2013, reflecting decreases in warranty-related charges (approximately 150 basis points), land, land development and construction costs (approximately 50 basis points), and the amortization of previously capitalized interest (approximately 40 basis points). The impact of these items was partly offset by an increase in start-up field overhead costs associated with new community openings (approximately 40 basis points), higher inventory-related charges (approximately 40 basis points), and other items (approximately 20 basis points). Sales incentives did not have a significant impact on our year-over-year housing gross profit margin comparisons in 2015 or 2014.
Excluding the amortization of previously capitalized interest associated with housing operations of $126.8 million, $90.8 million and $87.4 million in 2015, 2014 and 2013, respectively, and the above-mentioned inventory-related and warranty-related charges in the applicable periods, our adjusted housing gross profit margin decreased 150 basis points to 21.0% in 2015 from the lower volume of homes delivered; comparatively fewer homes delivered22.5% in 2014, which had decreased slightly from higher-margin communities22.6% in 2011, largely as a result of higher-margin communities that were closed out in 2010; and a shift in product mix.2013.
We had no land sale income in 2012. Our land sales generated incomeprofits of $.1$7.1 million in 2011 and2015, losses of $.3$25.5 million in 2010.2014 and profits of $.1 million in 2013. The land sale results in 2011 and 20102014 included inventory impairment charges of $.1$26.6 million and $.3 million, respectively, related to planned futurethen-planned land sales.
As describeddiscussed in Note 6.7. Inventory ImpairmentImpairments and Land Option Contract Abandonments in the Notes to Consolidated Financial Statements in this report, each community or land parcel in our owned inventory is assessed to determine if indicators of potential impairment exist. Based on our evaluations, we recognized charges for inventory impairments of $28.1 million in 2012, $22.7 million in 2011 and $9.8 million in 2010. Thetotal inventory impairment charges of $8.0 million in all three years reflected challenging economic2015, $37.6 million in 2014 and housing market conditions in certain of our served markets. In addition, the inventory impairment charges we recognized in 2012 were partly due to changes to our operational or selling strategy for certain communities in an effort to accelerate our return on investment. In 2011, the inventory impairment charges included an $18.1 million adjustment to the fair value of real estate collateral that we took back on a note receivable. Deterioration in the supply and demand factors in the overall housing market or in an individual market, or changes to our operational or selling strategy at certain communities may lead to additional inventory impairment charges, future charges associated with land sales or the abandonment of land option contracts related to certain assets. Due to the nature or location of the projects, land held for future development that we activate as part of our strategic growth initiatives may have a somewhat greater likelihood of being impaired than other of our active inventory.
When we decide not to exercise certain land option contracts or other similar contracts due to market conditions and/or changes in our marketing strategy, we write off the related inventory costs, including non-refundable deposits and unrecoverable pre-acquisition costs. We recognized abandonment charges associated with land option contracts and other similar contracts of $.4 million in 2012, $3.1 million in 2011 and $10.1 million in 2010. Inventory impairment2013, and land option contract abandonment charges are includedof $1.6 million in construction2015, $1.8 million in 2014 and land costs$3.2 million in our consolidated statements of operations.2013.
Selling, general and administrative expenses totaled $251.2$343.0 million in 2012,2015, up from $247.9$288.0 million in 2011,2014, which had decreasedincreased from $289.5$255.8 million in 2010.2013. The year-over-year increase in 2012 was largely due to the above-mentioned court decision charge and costs associated with the year-over-year increase in the volume of homes delivered, partly offset by cost-saving initiatives. In addition, selling, general and administrative expenses for 2011 included the favorable impact of legal expense recoveries of $8.3 million. In 2011, the year-over-year decreaseincreases in selling, general and administrative expenses alsoin 2015 and 2014 mainly reflected ongoing actionshigher variable expenses associated with the increases in both homes delivered and revenues. Also contributing to streamlinethe year-over-year increase in 2015 were higher staffing levels and new community and related operating platform investments to support both our organizational structurecommunity count expansion strategy and reduce overhead costs, including personnel-anticipated growth in homes delivered, the acceleration of compensation expense associated with stock options due to certain recipients meeting retirement provisions, and payroll-related costs,legal settlements. In 2013, selling, general and administrative expenses were favorably impacted by the lower volumereversal of homes delivered.a previously established accrual of $8.2 million due to a court decision. As a percentage of housing revenues, to which these expenses are most closely correlated, selling, general and administrative expenses were 16.2%11.8% in 2012, 19.0%2015, 12.2% in 20112014 and 18.4%12.3% in 2010.2013. The percentage greatlypercentages improved on a year-over-year basis in 2012 compared to 2011,both 2015 and 2014 primarily due to the 19% year-over-year increase in housing revenues. In 2011, the percentage increased from 2010 as the year-over-year decrease in our housing revenues was larger than the corresponding reduction in each of those years and our expenses.
Lossongoing focus on Loan Guaranty. As discussed in Note 9. Investments in Unconsolidated Joint Ventures in the Notes to Consolidated Financial Statements in this report, the loss on loan guaranty of $30.8 million recognized in 2011 relatedcontaining our overhead costs to the Nevada joint venture noted above under “Operating Loss” and reflected the consummation of a consensual plan of reorganization of the venture, known as South Edge, that was confirmed by a bankruptcy court in November 2011 (the “South Edge Plan”) and included, among other things, the elimination of a limited several repayment guaranty (the “Springing Guaranty”) that we had provided to the administrative agent for the lenders to South Edge (the “Administrative Agent”).extent possible.
Interest Income. Interest income, which is generated from short-term investments, totaled $.5 million in 2015, $.4 million in 2014 and mortgages receivable, totaled $.5$.8 million in 2012, $.9 million in 2011 and $2.1 million in 2010.2013. Generally, increases and decreases in interest income are attributable to changes in the interest-bearing average balances of short-term investments and mortgages receivable, as well as fluctuations in interest rates. Mortgages receivable are primarily related to land sales.
Interest Expense. Interest expense results principally from borrowings to finance land purchases, housing inventory and other operating and capital needs. Our interest expense, net of amounts capitalized, totaled $69.8decreased to $21.9 million in 2012, $49.22015 compared to $30.8 million in 20112014, which had decreased from $62.7 million in 2013. The year-over-year decrease in each of the years ended November 30, 2015 and $68.3 million2014 reflected an increase in 2010. Interest expenseinterest incurred, stemming from our higher average debt level, that was more than offset by an increase in the amount of interest capitalized due to a higher amount of inventory qualifying for 2012 includedinterest capitalization. Also contributing to the year-over-year decrease in 2014 was the inclusion of a $10.3$10.4 million loss on the early extinguishment of debt in 2013 as a result of completingour retiring certain of our senior notes that were scheduled to mature in 2014 and 2015. The increase in the applicable January 2012amount of inventory qualifying for capitalization during 2015 and July 2012 Tender Offers. 2014 was primarily due to our
substantial investments in land and land development during those years, as well as the activation of land previously held for future development.
Interest expense for 2011 included a $3.6incurred rose 9% to $186.9 million gain on the early extinguishment of secured debt. In 2010, interest expense included $1.8in 2015 from $171.5 million in 2014, which rose 15% from $149.1 million in 2013, due to our higher average debt outstanding in 2015 and 2014, respectively. We capitalized $165.0 million, $140.8 million and $86.4 million of debt issuance costs written offthe interest incurred in connection with our voluntary reduction of the aggregate commitment under our unsecured revolving credit facility with various financial institutions (the “Credit Facility”)2015, 2014 and our subsequent voluntary termination of the Credit Facility.2013, respectively. The percentage of interest capitalized was 51%88% in 2012, 54%2015, 82% in 20112014 and 45%62% in 2010.2013. The percentage of interest capitalized generally fluctuates based on the amount of our inventory qualifying for interest capitalization. Gross
Interest amortized to construction and land costs totaled $143.3 million in 2015, $90.8 million in 2014 and $87.4 million in 2013. The year-over-year increases in interest incurred during 2012 increased by $20.7 millionamortized in 2015 and 2014 reflected increases in the number of homes delivered and higher construction and land costs attributable to $132.7 million from $112.0 millionthose homes. Additionally, interest amortized in 2011 as a result of the $10.3 million loss on the early extinguishment of debt in 2012, compared to the $3.6 million gain on the early extinguishment of secured debt in 2011, a higher average debt level in 2012 and the higher interest rates on the senior notes we issued in 2012 compared to the interest rates on the senior notes we purchased under the applicable January 2012 and July 2012 Tender Offers. Gross interest incurred during 2011 decreased by $10.2 million, from $122.2 million in 2010, as a result of a lower average debt level and the $3.6 million gain on the early extinguishment of secured debt2015 included in 2011, compared to the write off of $1.8$16.4 million of debt issuanceamortization of previously capitalized interest related to land sales that occurred during the year. Further information regarding our interest capitalized to inventories and interest amortized to construction and land costs includedis provided in 2010.Note 6. Inventories in the Notes to Consolidated Financial Statements in this report.
Equity in LossIncome (Loss) of Unconsolidated Joint Ventures. Our unconsolidated joint ventures operate in various markets, typically
where our homebuilding operations are located. These unconsolidated joint ventures posted combined revenues of $31.8 million in 2012, $.2 million in 2011 and $122.2 million in 2010. The year-over-year increase in 2012 was primarily due to land sales completed by our unconsolidated joint venture in Maryland. The marked year-over-year decrease in unconsolidated joint venture revenues in 2011 was primarily due to substantially fewer homes delivered by, and no land sales from, our unconsolidated joint ventures during 2011, reflecting the significant reduction in our participation in unconsolidated joint ventures over the past several years. Activities performed by our unconsolidated joint ventures generally include acquiring, developing and selling land, and, in some cases, constructing and delivering homes. Our unconsolidated joint ventures delivered no homes in 2012, one home in 2011 and 102 homes in 2010. Our unconsolidated joint ventures generated combined income of $8.3 million in 2012, compared to combined losses of $4.3 million in 2011 and $17.2 million in 2010. Our equity in loss of unconsolidated joint ventures totaled $.4was $1.8 million in 2012, $55.82015 and $2.0 million in 20112013, and$6.3 million in 2010. The year-over-year change in our equity in lossincome of unconsolidated joint ventures was $.7 million in 2012 and 2011 was mainly due2014. In 2014, our equity in income of unconsolidated joint ventures included a $3.2 million gain on the sale of our interest in an unconsolidated joint venture in Maryland. Further information regarding our investments in unconsolidated joint ventures is provided in Note 9. Investments in Unconsolidated Joint Ventures in the Notes to a charge of $53.7 million incurredConsolidated Financial Statements in 2011 to write off our remaining investment in South Edge, as discussed below under “Off-Balance Sheet Arrangements.” There were no such charges in 2012 or 2010.this report.
Non-GAAP Financial Measures
This report contains information about our adjusted housing gross profit margin excluding inventory impairment and land option contract abandonment charges, and our ratio of net debt to total capital, both of which are not calculated in accordance with generally accepted accounting principles (“GAAP”). We believe these non-GAAP financial measures are relevant and useful to investors in understanding our operations and the leverage employed in our operations, and may be helpful in comparing us with other companies in the homebuilding industry to the extent they provide similar information. However, because the adjusted housing gross profit margin excluding inventory impairment and land option contract abandonment charges, and the ratio of net debt to total capital are not calculated in accordance with GAAP, these financial measures may not be completely comparable to other companies in the homebuilding industry and thus, should not be considered in isolation or as an alternative to operating performance and/or financial measures prescribed by GAAP. Rather, these non-GAAP financial measures should be used to supplement their respective most directly comparable GAAP financial measures in order to provide a greater understanding of the factors and trends affecting our operations.
Adjusted Housing Gross Profit Margin, Excluding Inventory Impairment and Land Option Contract Abandonment Charges.Margin. The following table reconciles our housing gross profit margin calculated in accordance with GAAP to the non-GAAP financial measure of our adjusted housing gross profit margin excluding inventory impairment and land option contract abandonment charges (dollars in thousands):
| | | | Years Ended November 30, | Years Ended November 30, |
| | 2012 | | 2011 | | 2010 | 2015 | | 2014 | | 2013 |
| Housing revenues | $ | 1,548,432 |
| | $ | 1,305,299 |
| | $ | 1,575,487 |
| $ | 2,908,236 |
| | $ | 2,369,633 |
| | $ | 2,084,103 |
|
| Housing construction and land costs | (1,317,529 | ) | | (1,129,785 | ) | | (1,301,677 | ) | (2,433,683 | ) | | (1,940,100 | ) | | (1,736,320 | ) |
| Housing gross profits | 230,903 |
| | 175,514 |
| | 273,810 |
| 474,553 |
| | 429,533 |
| | 347,783 |
|
| Add: Inventory impairment and land option contract abandonment charges | 28,533 |
| | 25,740 |
| | 19,577 |
| |
| Housing gross profits, excluding inventory impairment and land option contract abandonment charges | $ | 259,436 |
| | $ | 201,254 |
| | $ | 293,387 |
| |
| Add: Amortization of previously capitalized interest (a) | | 126,817 |
| | 90,804 |
| | 87,414 |
|
| Inventory-related charges (b) | | 9,591 |
| | 12,788 |
| | 3,581 |
|
| Warranty-related charges | | — |
| | — |
| | 31,959 |
|
| Adjusted housing gross profits | | $ | 610,961 |
| | $ | 533,125 |
| | $ | 470,737 |
|
| Housing gross profit margin as a percentage of housing revenues | 14.9 | % | | 13.4 | % | | 17.4 | % | 16.3 | % | | 18.1 | % | | 16.7 | % |
| Housing gross profit margin, excluding inventory impairment and land option contract abandonment charges, as a percentage of housing revenues | 16.8 | % | | 15.4 | % | | 18.6 | % | |
| Adjusted housing gross profit margin as a percentage of housing revenues | | 21.0 | % | | 22.5 | % | | 22.6 | % |
Housing gross profit margin, excluding | |
| (a) | Represents the amortization of previously capitalized interest associated with housing operations. |
| |
| (b) | Represents inventory impairment and land option contract abandonment charges associated with housing operations. |
Adjusted housing gross profit margin is a non-GAAP financial measure, which we calculate by dividing housing revenues less housing construction and land costs beforeexcluding (1) amortization of previously capitalized interest associated with housing operations, (2) housing inventory impairment and land option contract abandonment charges and (3) warranty-related charges (as
applicable) associated with housing operations recorded during a given period, by housing revenues. The most directly comparable GAAP financial measure is housing gross profit margin. We believe adjusted housing gross profit margin excluding inventory impairment and land option contract abandonment charges, is a relevant and useful financial measure to investors in evaluating our performance as it measures the gross profitprofits we generated specifically on the homes delivered during a given period and enhances the comparability of housing gross profit margin between periods.period. This non-GAAP financial measure assists us in making strategic decisions regarding product mix, product pricing and construction pace. We also believe investors will findisolates the impact that the amortization of previously capitalized interest associated with housing gross profit margin, excludingoperations, housing inventory impairment and land option contract abandonment charges, and warranty-related charges have on housing gross profit margins, and allows investors to make comparisons with our competitors that adjust housing gross profit margins in a similar manner. We also believe investors will find adjusted housing gross profit margin relevant and useful because it represents a profitability measure that may be compared to a prior period without regard to variability of charges foramortization of previously capitalized interest associated with housing operations, housing inventory impairments orimpairment and land option contract abandonments.abandonment charges, and warranty-related charges. This financial measure assists us in making strategic decisions regarding community location and product mix, product pricing and construction pace.
Ratio of Net Debt to Total Capital. The following table reconciles our ratio of debt to total capital calculated in accordance with GAAP to the non-GAAP financial measure of our ratio of net debt to total capital (dollars in thousands):
| | | | November 30, | November 30, |
| | 2012 | | 2011 | 2015 | | 2014 |
| Mortgages and notes payable | $ | 1,722,815 |
| | $ | 1,583,571 |
| |
| Notes payable | | $ | 2,625,536 |
| | $ | 2,576,525 |
|
| Stockholders’ equity | 376,806 |
| | 442,657 |
| 1,690,834 |
| | 1,595,910 |
|
| Total capital | $ | 2,099,621 |
| | $ | 2,026,228 |
| $ | 4,316,370 |
| | $ | 4,172,435 |
|
| Ratio of debt to total capital | 82.1 | % | | 78.2 | % | |
| Ratio of debt to capital | | 60.8 | % | | 61.8 | % |
| | | | | | | |
| Mortgages and notes payable | $ | 1,722,815 |
| | $ | 1,583,571 |
| |
| Notes payable | | $ | 2,625,536 |
| | $ | 2,576,525 |
|
| Less: Cash and cash equivalents and restricted cash | (567,127 | ) | | (479,531 | ) | (568,386 | ) | | (383,601 | ) |
| Net debt | 1,155,688 |
| | 1,104,040 |
| 2,057,150 |
| | 2,192,924 |
|
| Stockholders’ equity | 376,806 |
| | 442,657 |
| 1,690,834 |
| | 1,595,910 |
|
| Total capital | $ | 1,532,494 |
| | $ | 1,546,697 |
| $ | 3,747,984 |
| | $ | 3,788,834 |
|
| Ratio of net debt to total capital | 75.4 | % | | 71.4 | % | |
| Ratio of net debt to capital | | 54.9 | % | | 57.9 | % |
The ratio of net debt to total capital is a non-GAAP financial measure, which we calculate by dividing mortgages and notes payable, net of homebuilding cash and cash equivalents and restricted cash, by total capital (mortgages and notes(notes payable, net of homebuilding cash and cash equivalents and restricted cash, plus stockholders’ equity). The most directly comparable GAAP financial measure is the ratio of debt to total capital. We believe the ratio of net debt to total capital is a relevant and useful financial measure to investors in understanding the leverage employed in our operations.
HOMEBUILDING REPORTING SEGMENTS
West Coast. The following table presents financial information related to our West Coast homebuilding reporting segmentssegment for the years indicated (dollars in thousands)thousands, except average selling price):
|
| | | | | | | | | | | | | | | | | |
| | Years Ended November 30, | | Variance |
| | 2012 | | 2011 | | 2010 | | 2012 vs 2011 | | 2011 vs 2010 |
| West Coast: | | | | | | | | | |
| Revenues | $ | 755,259 |
| | $ | 589,387 |
| | $ | 700,645 |
| | 28 | % | | (16 | )% |
| Construction and land costs | (658,586 | ) | | (488,883 | ) | | (545,983 | ) | | (35 | ) | | 10 |
|
| Selling, general and administrative expenses | (74,386 | ) | | (56,616 | ) | | (64,459 | ) | | (31 | ) | | 12 |
|
| Operating income | 22,287 |
| | 43,888 |
| | 90,203 |
| | (49 | ) | | (51 | ) |
| Other, net | (32,754 | ) | | (24,249 | ) | | (29,953 | ) | | (35 | ) | | 19 |
|
| Pretax income (loss) | $ | (10,467 | ) | | $ | 19,639 |
| | $ | 60,250 |
| | (153 | )% | | (67 | )% |
| | | | | | | | | | |
| Southwest: | | | | | | | | | |
| Revenues | $ | 132,438 |
| | $ | 139,872 |
| | $ | 187,736 |
| | (5 | )% | | (25 | )% |
| Construction and land costs | (106,382 | ) | | (129,468 | ) | | (141,883 | ) | | 18 |
| | 9 |
|
| Selling, general and administrative expenses | (17,989 | ) | | (29,402 | ) | | (45,463 | ) | | 39 |
| | 35 |
|
| Loss on loan guaranty | — |
| | (30,765 | ) | | — |
| | 100 |
| | (100 | ) |
| Operating income (loss) | 8,067 |
| | (49,763 | ) | | 390 |
| | 116 |
| | (12,860 | ) |
| Other, net | (18,261 | ) | | (58,502 | ) | | (16,192 | ) | | 69 |
| | (261 | ) |
| Pretax loss | $ | (10,194 | ) | | $ | (108,265 | ) | | $ | (15,802 | ) | | 91 | % | | (585 | )% |
| | | | | | | | | | |
| Central: | | | | | | | | | |
| Revenues | $ | 436,407 |
| | $ | 369,705 |
| | $ | 436,404 |
| | 18 | % | | (15 | )% |
| Construction and land costs | (371,875 | ) | | (316,408 | ) | | (364,736 | ) | | (18 | ) | | 13 |
|
| Selling, general and administrative expenses | (56,579 | ) | | (59,709 | ) | | (62,550 | ) | | 5 |
| | 5 |
|
| Operating income (loss) | 7,953 |
| | (6,412 | ) | | 9,118 |
| | 224 |
| | (170 | ) |
| Other, net | (6,504 | ) | | (6,512 | ) | | (10,890 | ) | | — |
| | 40 |
|
| Pretax income (loss) | $ | 1,449 |
| | $ | (12,924 | ) | | $ | (1,772 | ) | | 111 | % | | (629 | )% |
| | | | | | | | | | |
| Southeast: | | | | | | | | | |
| Revenues | $ | 224,328 |
| | $ | 206,598 |
| | $ | 256,978 |
| | 9 | % | | (20 | )% |
| Construction and land costs | (177,502 | ) | | (189,221 | ) | | (245,416 | ) | | 6 |
| | 23 |
|
| Selling, general and administrative expenses | (34,694 | ) | | (39,347 | ) | | (36,055 | ) | | 12 |
| | (9 | ) |
| Operating income (loss) | 12,132 |
| | (21,970 | ) | | (24,493 | ) | | 155 |
| | 10 |
|
| Other, net | (13,315 | ) | | (16,013 | ) | | (18,308 | ) | | 17 |
| | 13 |
|
| Pretax loss | $ | (1,183 | ) | | $ | (37,983 | ) | | $ | (42,801 | ) | | 97 | % | | 11 | % |
The following table presents information concerning our housing revenues, homes delivered and average selling price by homebuilding reporting segment: |
| | | | | | | | | | | | | | | | | |
| | Years Ended November 30, | | Variance |
| | 2015 | | 2014 | | 2013 | | 2015 vs 2014 | | 2014 vs 2013 |
| Revenues | $ | 1,402,264 |
| | $ | 1,089,857 |
| | $ | 1,020,218 |
| | 29 | % | | 7 | % |
| Construction and land costs | (1,179,222 | ) | | (889,345 | ) | | (811,921 | ) | | (33 | ) | | (10 | ) |
| Selling, general and administrative expenses | (84,875 | ) | | (69,774 | ) | | (62,357 | ) | | (22 | ) | | (12 | ) |
| Operating income | 138,167 |
| | 130,738 |
| | 145,940 |
| | 6 |
| | (10 | ) |
| Other expense, net | (10,221 | ) | | (14,413 | ) | | (27,676 | ) | | 29 |
| | 48 |
|
| Pretax income | $ | 127,946 |
| | $ | 116,325 |
| | $ | 118,264 |
| | 10 | % | | (2 | ) % |
| | | | | | | | | | |
| Homes delivered | 2,258 |
| | 1,913 |
| | 2,179 |
| | 18 | % | | (12 | ) % |
| Average selling price | $ | 587,000 |
| | $ | 569,700 |
| | $ | 467,800 |
| | 3 | % | | 22 | % |
| Housing gross profit margin | 16.4 | % | | 20.5 | % | | 20.4 | % | | (410 | )bps | | 10 | bps |
|
| | | | | | | | | | | | | | | | | |
| Years Ended November 30, | | Housing Revenues | | Percentage of Total Housing Revenues | | Homes Delivered | | Percentage of Total Homes Delivered | | Average Selling Price |
| | | (in thousands) | | | | | | | | |
| 2012 | | | | | | | | | | |
| West Coast | | $ | 755,259 |
| | 49 | % | | 1,945 |
| | 31 | % | | $ | 388,300 |
|
| Southwest | | 132,438 |
| | 9 |
| | 683 |
| | 11 |
| | 193,900 |
|
| Central | | 436,407 |
| | 28 |
| | 2,566 |
| | 41 |
| | 170,100 |
|
| Southeast | | 224,328 |
| | 14 |
| | 1,088 |
| | 17 |
| | 206,200 |
|
| Total | | $ | 1,548,432 |
| | 100 | % | | 6,282 |
| | 100 | % | | $ | 246,500 |
|
| | | | | | | | | | | |
| 2011 | | | | | | | | | | |
| West Coast | | $ | 589,387 |
| | 45 | % | | 1,757 |
| | 30 | % | | $ | 335,500 |
|
| Southwest | | 139,762 |
| | 11 |
| | 843 |
| | 15 |
| | 165,800 |
|
| Central | | 369,552 |
| | 28 |
| | 2,155 |
| | 37 |
| | 171,500 |
|
| Southeast | | 206,598 |
| | 16 |
| | 1,057 |
| | 18 |
| | 195,500 |
|
| Total | | $ | 1,305,299 |
| | 100 | % | | 5,812 |
| | 100 | % | | $ | 224,600 |
|
| | | | | | | | | | | |
| 2010 | | | | | | | | | | |
| West Coast | | $ | 700,645 |
| | 44 | % | | 2,023 |
| | 27 | % | | $ | 346,300 |
|
| Southwest | | 181,917 |
| | 12 |
| | 1,150 |
| | 16 |
| | 158,200 |
|
| Central | | 435,947 |
| | 28 |
| | 2,663 |
| | 36 |
| | 163,700 |
|
| Southeast | | 256,978 |
| | 16 |
| | 1,510 |
| | 21 |
| | 170,200 |
|
| Total | | $ | 1,575,487 |
| | 100 | % | | 7,346 |
| | 100 | % | | $ | 214,500 |
|
West Coast. Our West Coast homebuilding reportingThis segment’s total revenues in 2012, 20112015 and 20102013 were comprised of revenues from both housing operations and land sales. In 2014, this segment’s revenues were generated entirely from housing operations. Housing revenues of $1.33 billion in 2012 increased 28%2015 rose 22% from 2011$1.09 billion in 2014 due to an 11% increaseincreases in both the number of homes delivered and the average selling price of those homes. The year-over-year growth in the number of homes delivered in 2015 occurred mostly in our coastal submarkets and a 16% increase in the average selling price. Homes delivered increased in 2012 from 2011 largely due toreflected a higher number of homes in backlog level at the beginning of 20122015 as compared to the prior year.year-earlier period. The average selling price for 2015 rose in 2012 primarilyfrom the previous year due to the combination of a greater proportion of homes delivered from higher-priced communities reflecting our strategic repositioning initiatives discussed above andlocated in coastal submarkets, a changeshift in product mix, to largerand generally rising home sizes.prices. In 2011, the 16% year-over-year decrease in2014, housing revenues reflectedincreased 7% from 2013 due to an increase in the average selling price that was partially offset by a13% decrease in the number of homes delivered and a 3% decline in the average selling price. Homes delivered decreased in 2011 due to the factors described above under “Homebuilding.”
In 2012, the pretax results for this segment declined from 2011, primarily reflecting lower housing gross profits and higher selling, general and administrative expenses. The housing gross profit margin decreased to 12.8% in 2012 from 17.1% in 2011, primarily due to higher inventory-related charges, a shift in product mix of homes delivered and a lower proportion of deliveries from higher-margin communities, partially offset by favorable warranty adjustments. Inventory impairment charges totaled $19.2 million in 2012, compared to inventory impairment and land option contract abandonment charges of $3.3 million in 2011. These charges represented 3% of segment total revenues in 2012 and less than 1% in 2011. Inventory impairment charges were higher in 2012 due to challenging economic and housing market conditions in certain of our served markets and changes to our operational or selling strategy for certain communities in an effort to accelerate our return on investment. The year-over-year increase in selling, general and administrative expenses in 2012 primarily reflected the $8.8 million court decision charge, as discussed in Note 14. Legal Matters in the Notes to Consolidated Financial Statements in this report, an increase in the number of homes delivered in 2012, and the impact of the gain recognized in 2011 on the sale of a multi-level residential building that we had operated as a rental property.
delivered. The year-over-year decrease in pretax income in 2011 was primarily due to lower housing gross profits, partly offset by a
decrease in selling, general and administrative expenses. The housing gross profit margin decreased to 17.1% in 2011 from 22.1% in 2010. This decline was primarily due to comparatively fewer homes delivered from higher-margin communities, largely as a result of our closing out of certain higher-margin communities in the prior year, and reduced leverage from the lower volume of homes delivered in 2011, partially offset by favorable warranty adjustments. Inventory impairment and land option contract abandonment charges totaled $3.3 million in 2011 and $4.6 million in 2010. These charges represented less than 1% of segment total revenues in both 2011 and 2010. The decrease in selling, general and administrative expenses in 2011 was primarily due to the impact of the gain on the sale of the multi-level residential building mentioned above, partly offset by increased legal expenses in 2011.
Southwest. In 2012, our Southwest homebuilding reporting segment’s total revenues were generated solely from housing operations. In 2011 and 2010, this segment’s total revenues also included land sale revenues of $.1 million and $5.8 million, respectively. Housing revenues in 2012 decreased 5% from the previous year due to a 19% decrease in the number of homes delivered, partly offset by a 17% increase in the average selling price. Homes delivered decreased in 2012 due to the significant downsizing of our business in Arizona during 2011 and into 2012 as discussed above. The average selling price increased in 2012 mainly due to a change in community and product mix of homes delivered. The 23% year-over-year decline in housing revenues in 2011 reflected a 27% decrease in the number of homes delivered, partly offset by a 5% increase in the average selling price. Homes delivered decreased in 2011 due to the factors described above under “Homebuilding.” The average selling price increased in 2011 mainly due to a shift in community and product mix.
This segment’s pretax results improved significantly in 2012 compared to 2011 largely due to the impact of the South Edge-related joint venture impairment charge of $53.7 million and loss on loan guaranty of $30.8 million recorded in 2011. The housing gross profit margin increased to 19.7% in 2012 from 7.4% in 2011, primarily due to a decrease in inventory-related charges, and favorable warranty adjustments. Inventory impairment charges totaled $2.1 million in 2012, compared to inventory impairment and land option contract abandonment charges of $19.0 million in 2011, which included an $18.1 million adjustment to the fair value of real estate collateral that we took back on a note receivable. These inventory-related charges represented 2% of segment total revenues in 2012 and 14% in 2011. Selling, general and administrative expenses decreased in 2012 compared to 2011, mainly due to overhead cost reductions and the lower volume of homes delivered. Other, net expenses in 2011 included the South Edge-related joint venture impairment charge. There was no such charge in 2012.
In 2011, the pretax loss from this segment increased from the previous year, mainly due to the South Edge-related charges recorded in 2011 as mentioned above. The housing gross profit margin decreased to 7.4% in 2011 from 24.4% in 2010, primarily reflecting higher inventory impairment and land option contract abandonment charges and reduced operating leverage from the lower volume of homes delivered in 2011, partially offset by favorable warranty adjustments. Inventory impairment and land option contract abandonment charges increased to $19.0 million in 2011 compared to $1.0 million in the year-earlier period, primarily due to the above-noted adjustment to the fair value of real estate collateral. These inventory-related charges represented 14% of segment total revenues in 2011 and less than 1% of segment total revenues in 2010. Selling, general and administrative expenses decreased on a year-over-year basis in 2011 as a result of ongoing overhead cost reductions, lower legal expenses and the lower volume of homes delivered. Other, net expenses in 2011 included the South Edge-related joint venture impairment charge discussed above. In 2010, there was no such charge.
Central. Our Central homebuilding reporting segment’s total revenues in 2012 were generated solely from housing operations; total revenues in 2011 and 2010 also included land sale revenues of $.2 million and $.5 million, respectively. Housing revenues rose 18% in 2012 compared to the previous year as a result of a 19% increase in the number of homes delivered, partly offset by a 1% decrease in the average selling price. Homes delivered increased in 2012 largely due to the higher number of homes in backlog at the start of 2012, while the average selling price declined primarily due to a change in community and product mix. In 2011, housing revenues decreased 15% compared to 2010 as a result of a 19% decrease in the number of homes delivered, partly offset by a 5% increase in the average selling price. Homes delivered declined in 2011 due to the lower backlog level at the start of the year, reflecting the factors described above under “Homebuilding.” The average selling price rose in 2011 compared to 2010 primarily due to a shift in community and product mix to larger homes.
The pretax results in this segment improved in 2012 mainly due to higher housing gross profits, reflecting the increase in homes delivered and a higher housing gross profit margin, and reduced selling, general and administrative expenses. The housing gross profit margin increased to 14.8% in 2012 from 14.4% in 2011, primarily due to favorable warranty adjustments, which were largely offset by inventory impairment and land option contract abandonment charges. Inventory impairment and land option contract abandonment charges in this segment totaled $1.4 million in each of 2012 and 2011 and were less than 1% of segment total revenues in each year. Selling, general and administrative expenses decreased in 2012 compared to 2011, due to overhead cost reductions and other cost-saving initiatives.
In 2011, the pretax loss from this segment increased from the previous year due to lower housing gross profits, partly offset by reduced selling, general and administrative expenses. The pretax loss included $1.4 million of inventory impairment and land
option contract abandonment charges, compared to $6.9 million in 2010. As a percentage of segment total revenues, these inventory- related charges were less than 1% in 2011 and 2% in 2010. The housing gross profit margin decreased to 14.4% in 2011 from 16.4% in 2010, primarily reflecting reduced operating leverage from the lower volume of homes delivered. Selling, general and administrative expenses decreased by 5% in 2011 from 2010, reflecting the lower volume of homes delivered.
Southeast. Our Southeast homebuilding reporting segment’s total revenues in 2012, 2011 and 2010 were generated solely from housing operations. In 2012, housing revenues increased 9% from the previous year due to a 5% increase in the average selling price and a 3% increase in the number of homes delivered. We delivered more homes in 2012 compared to 2011 largely due to this segment having more39% fewer homes in backlog at the beginning of 20122014 as compared to 2011. In 2011, housing revenues decreased 20% from the previous year due to a 30% decrease in the number of homes delivered,2013, partly offset by the impact of a 15%9% increase in the average selling price. We delivered fewer homesnet orders in 2011 compared to 2010 due to the factors described above under “Homebuilding.”2014. The average selling price for 2014 rose in 2011 compared to 2010from 2013 due to the combination of a changegreater proportion of homes delivered from higher-priced communities located in coastal submarkets within this segment, particularly those in northern California, a shift in product mix to larger homeshome sizes, an increase in design studio option and upgrade revenues per home, and generally rising home prices. This segment generated land sale revenues of $76.8 million in 2015, primarily reflecting sales of a large parcel in northern California and a higher number of homes deliveredparcel located in an inland southern California submarket. There were no land sale revenues from markets that supported higher selling prices in 2011.
The significant improvement in pretax results for this segment in 2012 reflected an increase2014, and $.9 million of revenues from land sales in housing gross profits2013.
In 2015, pretax income from this segment increased by $11.6 million from 2014, reflecting improved land sale results and a decrease in selling, general and administrative expenses. The housing gross profit margin improved to 20.9% in 2012 from 8.4% in 2011, mainly due to $26.5 million of insurance recoveries recorded in 2012 as described above under “Homebuilding,” partly offset by unfavorable warranty adjustments. In 2012, this segment had $5.8 million of inventory impairment and land option contract abandonment charges, compared to $2.1 million in the year-earlier period. As a percentage of segment total revenues, these charges were 3% in 2012 and 1% in 2011.
The pretax loss in 2011 narrowed on a year-over-year basis due to an increase in the housing gross profit margin,other expense, net, partly offset by an increase in selling, general and administrative expenses.expenses and a decrease in housing gross profits. The housing gross profit margin improveddeclined to 8.4%16.4% in 20112015 from 4.5%20.5% in 2010, largely2014, mainly due to the reduction in charges for inventory impairmentshigher construction and land option contract abandonmentscosts, a shift in product and geographic mix, including the increaseclose-out of certain higher margin communities in the average selling price. In 2011, inventorylatter part of 2014, and increased pricing pressures in some markets, partly offset by increased operating leverage as a result of the higher home delivery volume and corresponding revenues. Inventory impairment and land option contract abandonment charges impacting the segment’s housing gross profit margin totaled $2.1$1.0 million, in 2015 and $4.6 million in 2014. In 2015, land sales produced profits of $6.2 million, compared to $7.5losses of $23.2 million in 2010. As a percentage of segment total revenues, these charges were 1% in 2011 and 3% in 2010. Selling, general and administrative expenses in 2011 increased 9% compared to 2010.
FINANCIAL SERVICES SEGMENT
Our financial services reporting segment provides insurance services to our homebuyersin the same markets as our homebuilding reporting segmentsand provides title services in the majority of our markets located within our Central and Southeast homebuilding reporting segments.In addition, since the third quarter of 2011, this segment has earned revenues pursuant2014 that reflected an inventory impairment charge related to the termsthen-planned sale of a marketing services agreement with a preferred mortgage lender that offers mortgage banking services, including mortgage loan originations, to our homebuyerswho elect to use the lender. Our homebuyers are under no obligation to use our preferred mortgage lenderinland southern California land parcel noted above, and may select any lender of their choice to obtain mortgage financing for the purchase of a home. Prior to late June 2011, this segment provided mortgage banking services to our homebuyers indirectly through KBA Mortgage, a former unconsolidated joint venture of a subsidiary of ours and a subsidiary of Bank of America, N.A., with each partner having had a 50% interest in the venture. The Bank of America, N.A. subsidiary partner operated KBA Mortgage. We accounted for KBA Mortgage as an unconsolidated joint venture in the financial services reporting segment of our consolidated financial statements.
Effective June 27, 2011 and into the second quarter of 2012, we had a preferred mortgage lender relationship with MetLife Home Loans, a division of MetLife Bank, N.A. Under this relationship, MetLife Home Loans’ personnel, located on site at several of our new home communities, could offer (i) financing options and mortgage loan products to our homebuyers, (ii) to prequalify homebuyers for mortgage loans, and (iii) to commence the mortgage loan origination process for our homebuyers electing to use MetLife Home Loans. We made available to our homebuyers marketing materials and other information regarding MetLife Home Loans’ financing options and mortgage loan products, and were compensated solely for the fair market value of these services. MetLife Home Loans and its parent company, MetLife Bank, N.A., were not affiliates of us or any of our subsidiaries. We had no ownership, joint venture or other interests in or with MetLife Home Loans or MetLife Bank, N.A. or with respect to the revenues or income that may have been generated from MetLife Home Loans’ provision of mortgage banking services to, or origination of mortgage loans for, our homebuyers.
Following MetLife Bank, N.A.’s announcement in January 2012 that it would cease offering forward mortgage banking services as part of its business, we evaluated various options and, in March 2012, we entered into an agreement with Nationstar, a subsidiary of Nationstar Mortgage Holdings Inc., under which Nationstar became our new preferred mortgage lender, offering mortgage banking services to our homebuyers at our new home communities. The terms of our relationship with Nationstar are substantially similar to the terms of our prior relationship with MetLife Home Loans, as are the mortgage banking services offered by Nationstar. Nationstar began accepting new mortgage loan applications from our homebuyers on May 1, 2012.
Nationstar and Nationstar Mortgage Holdings Inc. are not affiliates of us or any of our subsidiaries. We have no ownership,
joint venture or other interests in or with Nationstar or Nationstar Mortgage Holdings Inc. or with respect to the revenues or income that may be generated from Nationstar’s provision of mortgage banking services to, or origination of mortgage loans for, our homebuyers.
Nationstar’s performance since May 1, 2012 as our preferred mortgage lender has resulted in a reduction in the mortgage loan funding issues that disrupted the ability of some of our homebuyers to obtain mortgage financing and contributed to an elevated level of cancellations in the first and into the second quarter of 2012. These mortgage loan funding issues arefurther described in Note 6.7. Inventory Impairments and Land Option Contract Abandonments in the Notes to Consolidated Financial Statements in this report. Nationstar is providing more consistent executionSelling, general and completion of mortgage loan originationsadministrative expenses for our homebuyers who choose2015 rose from 2014 primarily due to use Nationstar, which an increasing percentage are electing to do. Compared to most ofincreased variable expenses associated with the first half of 2012, Nationstar’s performance has helped to provide more stabilityincrease in the conversion of our backlog into home deliveries and revenues. Based onboth the number of homes delivered and housing revenues, and higher staffing levels to support delivery growth. Other expense, net for 2015 declined from the previous year, reflecting lower interest expense as a result of an increase in the monthamount of November 2012, approximately 58%interest capitalized.
In 2014, pretax income from this segment decreased by $1.9 million from the prior year, mainly due to the above-mentioned $23.2 million land impairment charge. The year-over-year decrease in pretax income also reflected an increase in selling, general and administrative expenses, that was partly offset by higher housing gross profits and a decrease in other expense, net. The housing gross profit margin increased slightly in 2014 from 2013. The housing gross profit margin in 2014 was tempered by higher direct construction costs and an increased use of sales incentives and price reductions on completed homes in the fourth quarter as compared to the prior year. The 2013 housing gross profit margin reflected land option contract abandonment charges totaling $3.2 million. Selling, general and administrative expenses for 2014 rose $7.4 million from 2013 largely due to increased costs associated with the higher number of new community openings in 2014. Other expense, net for 2014 declined from the previous year due to lower interest expense as a result of an increase in the amount of interest capitalized.
Southwest. The following table presents financial information related to our Southwest homebuilding reporting segment for the years indicated (dollars in thousands, except average selling price):
|
| | | | | | | | | | | | | | | | | |
| | Years Ended November 30, | | Variance |
| | 2015 | | 2014 | | 2013 | | 2015 vs 2014 | | 2014 vs 2013 |
| Revenues | $ | 398,242 |
| | $ | 199,504 |
| | $ | 175,252 |
| | 100 | % | | 14 | % |
| Construction and land costs | (329,203 | ) | | (162,560 | ) | | (135,024 | ) | | (103 | ) | | (20 | ) |
| Selling, general and administrative expenses | (31,228 | ) | | (22,069 | ) | | (17,439 | ) | | (42 | ) | | (27 | ) |
| Operating income | 37,811 |
| | 14,875 |
| | 22,789 |
| | 154 |
| | (35 | ) |
| Other expense, net | (6,093 | ) | | (8,860 | ) | | (19,886 | ) | | 31 |
| | 55 |
|
| Pretax income | $ | 31,718 |
| | $ | 6,015 |
| | $ | 2,903 |
| | 427 | % | | 107 | % |
| | | | | | | | | | |
| Homes delivered | 1,311 |
| | 736 |
| | 738 |
| | 78 | % | | — | % |
| Average selling price | $ | 284,600 |
| | $ | 271,100 |
| | $ | 237,500 |
| | 5 | % | | 14 | % |
| Housing gross profit margin | 18.4 | % | | 18.5 | % | | 23.0 | % | | (10 | )bps | | (450 | )bps |
In 2015, this segment’s revenues were comprised of revenues from both housing operations and land sales, while revenues in 2014 and 2013 were generated entirely from housing operations. Housing revenues of $373.1 million in 2015 grew 87% from 2014, largely driven by increases in the number of homes delivered from both our Arizona and Nevada operations as we delivered homes from more communities in those markets. In addition, the average selling price of the homes delivered increased from the previous year, primarily due to a shift in the community and product mix of homes delivered. Housing revenues for 2014 rose 14% from 2013 due to a 14% increase in the average selling price, with the number of homes delivered essentially flat year over year. The average selling price for 2014 increased from the year-earlier period due to a shift in community and product mix of homes delivered to higher-priced communities and larger homes within our Arizona operations, and generally rising home prices. This segment’s revenues for 2015 included revenues of $25.2 million associated with land sales in Nevada.
In 2015, pretax income from this segment rose $25.7 million from the previous year as the impact of an increase in housing gross profits and a decrease in other expense, net, was partly offset by an increase in selling, general and administrative expenses. Housing gross profits increased in 2015 primarily due to the higher volume of homes delivered as the housing gross profit margin was nearly even with 2014. In 2015, housing gross profits included $3.3 million of inventory impairment charges, while housing gross profits in 2014 included $6.4 million of such charges. Sales incentives as a percentage of housing revenues in 2015 were slightly lower on a year-over-year basis. The land sale activity in 2015 generated gross profits of $.3 million. Selling, general and administrative expenses rose in 2015 from 2014, primarily due to the increase in both the number of homes delivered and housing revenues, and higher community opening-related expenses in connection with our operating platform expansion strategy. Other expense, net in 2015 decreased from the year-earlier quarter due to lower interest expense as a result of an increase in the amount of interest capitalized.
This segment’s pretax income improved by $3.1 million in 2014 compared to 2013 mainly due to a decrease in other expense, net that was partly offset by a decline in housing gross profits and an increase in selling, general and administrative expenses. This segment’s housing gross profit margin decreased to 18.5% in 2014 from 23.0% in 2013, reflecting the inventory impairment charges in 2014, compared to no such charges in the previous year, as well as a change in the mix of homes delivered. Selling, general and administrative expenses increased from the previous year mainly due to a higher number of new community openings in 2014 as compared to 2013. Other expense, net decreased from the previous year due to lower interest expense as a result of an increase in the amount of interest capitalized.
Central. The following table presents financial information related to our Central homebuilding reporting segment for the years indicated (dollars in thousands, except average selling price):
|
| | | | | | | | | | | | | | | | | |
| | Years Ended November 30, | | Variance |
| | 2015 | | 2014 | | 2013 | | 2015 vs 2014 | | 2014 vs 2013 |
| Revenues | $ | 809,738 |
| | $ | 698,429 |
| | $ | 565,120 |
| | 16 | % | | 24 | % |
| Construction and land costs | (657,316 | ) | | (578,711 | ) | | (474,220 | ) | | (14 | ) | | (22 | ) |
| Selling, general and administrative expenses | (82,400 | ) | | (72,742 | ) | | (62,928 | ) | | (13 | ) | | (16 | ) |
| Operating income | 70,022 |
| | 46,976 |
| | 27,972 |
| | 49 |
| | 68 |
|
| Other income (expense), net | 937 |
| | 238 |
| | (5,697 | ) | | 294 |
| | (a) |
|
| Pretax income | $ | 70,959 |
| | $ | 47,214 |
| | $ | 22,275 |
| | 50 | % | | 112 | % |
| | | | | | | | | | |
| Homes delivered | 3,183 |
| | 3,098 |
| | 2,841 |
| | 3 | % | | 9 | % |
| Average selling price | $ | 252,200 |
| | $ | 223,800 |
| | $ | 198,900 |
| | 13 | % | | 13 | % |
| Housing gross profit margin | 19.0 | % | | 17.2 | % | | 16.1 | % | | 180 | bps | | 110 | bps |
| |
| (a) | Percentage not meaningful. |
This segment’s revenues in 2015 and 2014 were comprised of revenues from both housing operations and land sales. In 2013, this segment’s revenues were generated entirely from housing operations. Housing revenues in 2015 rose 16% to $802.6 million from $693.3 million in the previous year due to increases in both the number of homes delivered and the average selling price of those homes. The year-over-year growth in the number of homes delivered for 2015 primarily reflected an increase in our Colorado operations as a result of a higher number of communities delivering homes. The increase in the average selling price from 2014 was mainly due to a greater proportion of homes delivered from higher-priced communities and generally rising home prices. Housing revenues in 2014 rose 23% compared to 2013, reflecting increases in both the number of homes delivered and the average selling price of those homes. The increase in homes delivered principally reflected a 16% higher backlog level at the beginning of 2014 compared to the previous year and a 7% increase in net orders. The year-over-year growth in homes delivered in this segment for 2014 was attributable to both our Texas and Colorado operations. The average selling price for 2014 rose from the prior year primarily due to a greater proportion of homes delivered from higher-priced communities, a change in product mix to larger homes, and generally rising home prices. This segment’s land sale revenues totaled $7.1 million in 2015 and $5.2 million in 2014.
The pretax income generated by this segment in 2015 improved by $23.7 million from 2014, reflecting higher housing gross profits and an increase in other income, net, partly offset by higher selling, general and administrative expenses. The housing gross profit margin increased to 19.0% from 17.2% for 2014, mainly due to an increased proportion of homes delivered from higher margin communities, and improved operating leverage. Housing gross profits included $.2 million of land option contract abandonment charges in 2015, compared to $1.0 million of such charges included in 2014. Land sale activity in 2015 generated nominal profits. The year-over-year increase in selling, general and administrative expenses for 2015 was primarily due to higher variable expenses associated with the increase in housing revenues. Other income, net increased from 2014 due to lower interest expense as a result of an increase in the amount of interest capitalized.
In 2014, the pretax income from this segment improved by $24.9 million from the previous year, reflecting higher housing gross profits and a change in other income, net that were partly offset by higher selling, general and administrative expenses. The housing gross profit margin increased to 17.2% in 2014 from 16.1% in 2013 due to an increased proportion of homes delivered from higher-margin communities, partly offset by higher direct construction costs. The housing gross profit margin expanded year over year despite the inclusion of land option contract abandonment charges in 2014. In 2014, this segment also produced gross profits of $.2 million from land sales. The year-over-year increase in selling, general and administrative expenses in 2014 was primarily due to higher variable expenses associated with the increase in both the number of homes delivered and housing revenues. This segment generated other income, net in 2014, compared to other expense, net in 2013, mainly due to a decrease in interest expense that reflected an increase in the amount of interest capitalized.
Southeast. The following table presents financial information related to our Southeast homebuilding reporting segment for the years indicated (dollars in thousands, except average selling price):
|
| | | | | | | | | | | | | | | | | |
| | Years Ended November 30, | | Variance |
| | 2015 | | 2014 | | 2013 | | 2015 vs 2014 | | 2014 vs 2013 |
| Revenues | $ | 410,743 |
| | $ | 401,853 |
| | $ | 324,388 |
| | 2 | % | | 24 | % |
| Construction and land costs | (367,668 | ) | | (351,634 | ) | | (312,733 | ) | | (5 | ) | | (12 | ) |
| Selling, general and administrative expenses | (57,552 | ) | | (54,412 | ) | | (44,699 | ) | | (6 | ) | | (22 | ) |
| Operating income (loss) | (14,477 | ) | | (4,193 | ) | | (33,044 | ) | | (245 | ) | | 87 |
|
| Other expense, net | (8,281 | ) | | (6,965 | ) | | (12,948 | ) | | (19 | ) | | 46 |
|
| Pretax loss | $ | (22,758 | ) | | $ | (11,158 | ) | | $ | (45,992 | ) | | (104 | ) % | | 76 | % |
| | | | | | | | | | |
| Homes delivered | 1,444 |
| | 1,468 |
| | 1,387 |
| | (2 | ) % | | 6 | % |
| Average selling price | $ | 281,900 |
| | $ | 263,600 |
| | $ | 233,900 |
| | 7 | % | | 13 | % |
| Housing gross profit margin | 10.4 | % | | 13.6 | % | | 3.6 | % | | (320 | )bps | | (a) |
|
| |
| (a) | Percentage not meaningful. |
This segment’s revenues in 2015 and 2014 were comprised of revenues from both housing operations and land sales. In 2013, this segment’s revenues were generated solely from housing operations. Housing revenues of $407.1 million in 2015 grew 5% from $387.0 million in 2014 due to an increase in the average selling price, as the number of homes delivered remained nearly flat with the year-earlier period. The year-over-year increase in the average selling price for 2015 was primarily due to a greater proportion of homes delivered from higher-priced communities, a change in product mix and generally rising home prices. In 2014, housing revenues grew 19% from the prior year, driven by increases in both the number of homes delivered and the average selling price of those homes. The increase in homes delivered reflected a 7% higher backlog at the beginning of 2014 compared to the previous year. Most of the year-over-year growth in homes delivered was generated from our Florida operations. The year-over-year increase in the average selling price in 2014 was primarily due to a greater proportion of homes delivered from higher-priced communities, a shift in product mix to larger home sizes, and generally rising home prices. This segment generated land sale revenues of $3.6 million in 2015 and $14.8 million in 2014.
The pretax loss from this segment in 2015 increased by $11.6 million from 2014 as a result of a decrease in housing gross profits and increases in both selling, general and administrative expenses and other expense, net. These impacts were partly offset by a year-over-year improvement in land sale results. The housing gross profit margin declined to 10.4% in 2015, compared to 13.6% in 2014, primarily due to the combined impact of higher land and construction costs, lower margins on homes delivered from recently activated communities that were previously held for future development, $5.1 million of inventory impairment and land option contract abandonment charges, and unfavorable warranty adjustments recognized in the current year. In addition, sales incentives as a percentage of housing revenues in 2015 were slightly higher on a year-over-year basis. In 2014, inventory impairment and land option contract abandonment charges impacting this segment’s housing gross profit margin totaled $.8 million. Land sale profits were $.6 million in 2015, compared to land sale losses of $2.6 million in 2014, which included an inventory impairment charge of $3.4 million related to a then-planned land sale of our homebuyers used Nationstarlast remaining land parcel in Atlanta, Georgia, as further described in Note 7. Inventory Impairments and Land Option Contract Abandonments in the Notes to financeConsolidated Financial Statements in this report. Selling, general and administrative expenses rose from 2014, primarily due to increased variable expenses associated with the purchaseincrease in housing revenues, higher overhead costs to support new community openings, and an increase in the accrual for the estimated minimum probable loss with respect to a Florida legal inquiry that is further discussed in Note 15. Commitments and Contingencies in the Notes to Consolidated Financial Statements in this report. Other expense, net for 2015 reflected a decrease in interest expense that resulted from an increase in the amount of their home. We expectinterest capitalized. Nonetheless, other expense, net for 2015 increased compared to see improvementthe previous year due to the inclusion of a $3.2 million gain on the sale of our interest in future periods ifan unconsolidated joint venture in 2014.
The pretax results from this segment for 2014 improved by $34.8 million from 2013, reflecting an increase in housing gross profits and a decrease in other expense, net that were partially offset by higher selling, general and administrative expenses and the above-mentioned $3.4 million inventory impairment charge. This segment’s housing gross profit margin expanded to 13.6% in 2014 from 3.6% in 2013, largely due to a net warranty charge of $32.0 million associated with water intrusion-related repairs at certain of our communities in central and southwest Florida in 2013 that is further discussed in Note 15. Commitments and Contingencies in the Notes to Consolidated Financial Statements in this report. The housing gross profit margin expanded year over year despite the inclusion of inventory-related charges in 2014. In 2013, inventory impairment charges impacting the segment’s housing gross profit margin totaled $.4 million. Other expense, net for 2014 decreased from 2013 due to lower interest expense
as a greater percentageresult of an increase in the amount of interest capitalized, and the gain on the sale of our homebuyers obtain mortgage financing from Nationstar. Our strategic intention remains to establish a long-term mortgage bankinginterest in an unconsolidated joint venture that is more closely integrated with our operations.in 2014.
FINANCIAL SERVICES REPORTING SEGMENT
The following table presents a summary of selected financial and operational data for our financial services reporting segment (dollars in thousands):
| | | | Years Ended November 30, | Years Ended November 30, |
| | 2012 | | 2011 | | 2010 | 2015 | | 2014 | | 2013 |
| Revenues | $ | 11,683 |
| | $ | 10,304 |
| | $ | 8,233 |
| $ | 11,043 |
| | $ | 11,306 |
| | $ | 12,152 |
|
| Expenses | (2,991 | ) | | (3,512 | ) | | (3,119 | ) | (3,711 | ) | | (3,446 | ) | | (3,042 | ) |
| Equity in income/gain on wind down of unconsolidated joint venture | 2,191 |
| | 19,286 |
| | 7,029 |
| |
| Equity in income of unconsolidated joint venture | | 4,292 |
| | 686 |
| | 1,074 |
|
| Pretax income | $ | 10,883 |
| | $ | 26,078 |
| | $ | 12,143 |
| $ | 11,624 |
| | $ | 8,546 |
| | $ | 10,184 |
|
| | | | | | | | | | | |
| Total originations (a): | | | | | | | | | | |
| Loans | — |
| | 1,633 |
| | 5,706 |
| 4,460 |
| | 1,501 |
| | — |
|
| Principal | $ | — |
| | $ | 315,899 |
| | $ | 1,092,508 |
| $ | 1,132,479 |
| | $ | 374,263 |
| | $ | — |
|
| Percentage of homebuyers using KBA Mortgage | — |
| | 67 | % | | 82 | % | |
| Mortgage loans sold to third parties (a): | | | | | | |
| Loans | — |
| | 1,862 |
| | 5,850 |
| |
| Percentage of homebuyers using HCM | | 61 | % | | 64 | % | | — | % |
| Average FICO score | | 718 |
| | 716 |
| | — |
|
| | | | | | | |
| Loans sold (a): | | | | | | |
| Loans sold to Nationstar | | 4,168 |
| | 1,035 |
| | — |
|
| Principal | $ | — |
| | $ | 370,599 |
| | $ | 1,092,739 |
| $ | 1,055,551 |
| | $ | 252,583 |
| | $ | — |
|
| Loans sold to other third parties | | 176 |
| | — |
| | — |
|
| Principal | | $ | 32,521 |
| | $ | — |
| | $ | — |
|
| |
(a) | Loan originations and sales occurred within KBA Mortgage, which ceased offering mortgage banking services after June 30, 2011. |
|
| | | | | | | | |
| Mortgage loan origination mix (a): | | | | | |
| Conventional/non-conventional loans | 45 | % | | 52 | % | | — | % |
| FHA loans | 37 |
| | 26 |
| | — |
|
| Other government loans | 18 |
| | 22 |
| | — |
|
| | | | | | |
| Loan type (a): | | | | | |
| Fixed | 98 | % | | 91 | % | | — | % |
| ARM | 2 |
| | 9 |
| | — |
|
(a) Loan originations and sales occurred within HCM, which began operations on July 21, 2014.
Revenues. Our financial services reporting segment generates revenues primarily from insurance commissions and title services,services. These operations also earned marketing services fees, and interest income.pursuant to a marketing services agreement with a preferred lender, until July 21, 2014. Financial services revenues totaled $11.7 million in 2012, $10.3 million in 2011 and $8.2 million in 2010. The year-over-year increasedecrease in our financial services revenues in 20122015 reflected higherthe absence of marketing services fees resulting from having a marketing services agreementrevenues, which was largely offset by an increase in place for all of 2012, compared to only a portion of 2011, and higher title services revenues. In 2011, the year-over-year increase was due to revenues associated with the marketing services agreement we entered into during the year, and higher title services revenues.
Financial services revenues included revenues from insurance commissions and title services totaling $9.5 millionrevenues. In 2014, the year-over-year decrease in 2012, $9.2 million in 2011 and $8.2 million in 2010, and a nominal amount of interest income in each year, which was earned primarily from money market deposits. In 2012 and 2011,our financial services revenues also included $2.2was mainly due to a decline in marketing services fees and insurance commissions, partly offset by an increase in title services revenues. In 2014 and 2013, marketing services fees totaled $1.1 million and $1.1$1.8 million, respectively, of revenues from marketing services fees. These fees are associated with the marketing services agreements in effect during each year and representrepresented the fair value of the services we provided in connection with the agreements.marketing services agreement.
Expenses. General and administrative expenses totaled $3.7 million in 2015, $3.4 million in 2014 and $3.0 million in 2012, $3.5 million in 2011 and $3.1 million in 2010.2013.
Equity in Income/Gain on Wind DownIncome of Unconsolidated Joint Venture.Ventures. The equity in income/gain on wind downincome of unconsolidated joint venture ofventures was $4.3 million in 2015, $.7 million in 2014 and $2.21.1 million in 2012, $19.32013. The equity in income of unconsolidated joint ventures for 2015 and 2014 was primarily comprised of income from HCM. The amount for 2013 included a gain of $1.1 million in 2011 and $7.0 million in 2010 related to our 50% interest in KBA Mortgage. The amounts for 2012 and 2011 included gains of $2.1 million and $19.8 million, respectively, recognized in connection
with the wind down of KBA Mortgage. Excluding these gains, our equity in incomethe business operations of thea former unconsolidated
mortgage banking joint venture (i.e., KBA Mortgage) totaled $.1 million in 2012 and our equity in loss of the former unconsolidatedthat ceased offering mortgage banking joint venture totaled $.5 millionservices in 2011. KBA Mortgage originated 1,633 loans
Based on the number of homes delivered in 20112015, approximately 61% of our homebuyers who obtained mortgage financing used HCM to finance the purchase of their home, compared to approximately 62% that used HCM or Nationstar in 2014 and 5,706 loans59% that used Nationstar in 2010.2013. We expect to see increases in future periods if and as a greater percentage of our homebuyers obtain mortgage financing from HCM.
INCOME TAXES
We recognized income tax expense of $42.4 million in 2015, and income tax benefits of $823.4 million in 2014 and $20.11.6 million in 2012, $2.42013. Our income tax expense for 2015 reflected the favorable net impact of $5.6 million of federal energy tax credits we earned from building energy-efficient homes, resulting in 2011 and $7.0 million in 2010.an effective tax rate of 33.4%. The income tax benefit in 20122014 was primarily due to the reversal of a substantial portion of our deferred tax asset valuation allowance at November 30, 2014. In 2013, the income tax benefit reflected the resolution of federal anda state tax audits,audit, which resulted in an income tax benefita refund receivable of $20.1$1.4 million, and as well as the realizationrecognition of$1.2 million of deferred tax assets. The income tax benefit in 2011 reflected the reversal of a $2.6 million liability for unrecognized tax benefits due toof $1.0 million, partly offset by the status of federal and state tax audits. The income tax benefit in 2010 reflected the recognitionliability of a $5.4 million federal income tax benefit from an additional carryback of our 2009 NOL to offset earnings we generated in 2004 and 2005, and the reversal of a $1.6 million liability for unrecognized tax benefits due to the status of federal and state tax audits. $.8 million. Due to the effects of our deferred tax asset valuation allowances carrybacks of our NOL, and changes in our unrecognized tax benefits, our effective tax rates in 2012, 20112014 and 20102013 are not meaningful items as our income tax amounts are not directly correlated to the amount of our pretax lossesincome for those periods.
DueOn December 18, 2015, the Protecting Americans from Tax Hikes Act of 2015 (“PATH”) was enacted into law. Among other things, PATH extended the availability of a business tax credit for building new energy-efficient homes through December 31, 2016. Prior to this legislation, the prolonged housing downturn,tax credit expired on December 31, 2014. The extension of the asset impairment and land option contract abandonment charges we have incurred andtax credit for building new energy-efficient homes may benefit our effective tax rate for the NOL we have posted, we have generated substantial deferred tax assets and established a corresponding valuation allowance against those deferred tax assets. In accordance with Accounting Standards Codification Topic No. 740, “Income Taxes” (“ASC 740”), weyear ended November 30, 2016.
We evaluate our deferred tax assets quarterly to determine if adjustments to theour valuation allowance are required. ASC 740 requires that companies assess whether a valuation allowance should be establishedrequired based on the consideration of all available positive and negative evidence using a “more likely than not” standard with respect to whether deferred tax assets will be realized. During 2012 Our evaluation considers, among other factors, our historical operating results; our expectation of future profitability; the duration of the applicable statutory carryforward periods; and 2011,conditions in the housing market and the broader economy. In our evaluation, we recordedgive more significant weight to evidence that is objective in nature as compared to subjective evidence. Also, more significant weight is given to evidence that directly relates to our then-current financial performance as compared to indirect or less current evidence. The ultimate realization of our deferred tax assets depends primarily on our ability to generate future taxable income during the periods in which the related temporary differences in the financial basis and the tax basis of the assets become deductible. The value of our deferred tax assets depends on applicable income tax rates.
At November 30, 2015 and 2014, we had deferred tax assets of $820.0 million and $866.4 million, respectively, that were partially offset by valuation allowances of $32.3$37.8 million and $76.7$41.2 million,, respectively, against net respectively. The valuation allowances at November 30, 2015 and 2014 were primarily related to foreign tax credits and certain state NOLs that had not met the “more likely than not” realization standard as of those dates. We evaluated our deferred tax assets generatedas of November 30, 2015 to determine whether any adjustment to our deferred tax asset valuation allowance was necessary. We determined that most of our deferred tax assets as of November 30, 2015 would be realized. We reduced our valuation allowance by $3.4 million in 2015, to account primarily fromfor the pretax lossesexpiration of federal tax credits and state NOLs that were not utilized.
During the fourth quarter of 2014, consistent with the above process, we evaluated the need for those years. During 2010, we recorded a net increase of $21.1 million to the valuation allowance against netour deferred tax assets reflecting a $26.6 million valuation allowance recorded against the netand determined, based on all available positive and negative evidence, that it was more likely than not that most of our deferred tax assets generated from the pretax loss for the year that was partially offset by the $5.4asset would be realized. As a result, we recognized an $824.2 million federal income tax benefit fromin the additional carrybackfourth quarter of 2014 that included the reversal of $825.2 million of our 2009 NOL.deferred tax asset valuation allowance.
WeThe principal positive evidence that led us to determine at November 30, 2014 that a significant portion of our deferred tax asset valuation allowance could be reversed included our emergence from a three-year cumulative pretax loss position in 2014 as well as the underlying momentum in our business and generally improved housing market and broader economic conditions that had noenabled us to achieve and maintain a three-year cumulative pretax income position as of and after the 2014 third quarter; the significant pretax income we generated during 2014 and 2013, including six consecutive quarters of pretax income as of November 30, 2014; improvement in key financial metrics in 2014 when compared to the previous year (including in our revenues; housing gross profits; selling, general and administrative expenses as a percentage of housing revenues; net orders and backlog); our expectation of future profitability; our strong financial position; significant evidence that conditions in the U.S. housing industry were more favorable than in recent years and our belief that such conditions would continue to be favorable over the long term; and our belief that we would be able to make operational adjustments to address any potential changes in market conditions to maintain long-term profitability and realize our deferred tax assets.
The most significant changes in our evaluation of the realizability of our deferred tax assets at November 30, 2012. Our2014 compared to earlier periods were the development of significant positive evidence related to our year-over-year growth in pretax income, net deferred tax assets totaled $1.2 million atorders and backlog levels during 2014; our expectation that we would realize all of our federal NOLs and absorb substantially all federal deductible temporary differences as they reverse in future years based on then-projected 2015 pretax income levels; our expectation of sustained and increasing profitability in future years; and the reduced significance of the negative evidence we considered before November 30, 2011. The deferred tax asset valuation allowance increased2014 related to $880.1 million at November 30, 2012 from $847.8 million at November 30, 2011, reflectingour pretax losses incurred in prior years, because we had generated six consecutive quarters of pretax income and cumulative pretax income for the net impact of the $32.3 million valuation allowance recorded in 2012. The deferred tax asset valuation allowance at November 30, 2011 increased from $771.1 million at November 30, 2010, reflecting the net impact of the $76.7 million valuation allowance recorded in 2011.
The benefits of our NOL, built-in losses and tax credits would be reduced or potentially eliminated if we experienced an “ownership change” under Section 382. Based on our analysis performedpast three years as of November 30, 2012, we do2014. These significant changes in evidence at November 30, 2014 led us to determine that it was more likely than not believe that we have experienced an ownership change as defined by Section 382, and, therefore,most of our deferred tax assets would be realized. We reversed the NOL, built-in losses andvaluation allowance on all of our federal deferred tax assets, except for the portion related to foreign tax credits due to the utilization of federal NOLs to offset taxable income in the years through tax credit expiration. We estimated the amount of the valuation allowance needed for our state NOL carryforwards based on an analysis of the amount of our NOL carryforwards associated with each state in which we operate as compared to our expected level of taxable income under existing apportionment rules in each state and the carryforward periods allowed in each state’s tax code.
We will continue to evaluate both the positive and negative evidence on a quarterly basis to determine the need for a valuation allowance with respect to our deferred tax assets. The accounting for deferred tax assets is based upon estimates of future results. Changes in positive and negative evidence, including differences between estimated and actual results, could result in changes in the valuation of our deferred tax assets that could have generated should not be subject to a Section 382 limitation asmaterial impact on our consolidated financial statements. Changes in existing tax laws could also affect actual tax results and the realization of this reporting date.
deferred tax assets over time.
LIQUIDITY AND CAPITAL RESOURCES
Overview. We historically have funded our homebuilding and financial services activities with over the last several years with:
internally generated cash flows and external sourcesflows;
public issuances of our common stock;
public issuances of debt securities;
land option contracts and equity financing.other similar contracts and seller notes; and
letters of credit and performance bonds.
We also have the ability to borrow funds under the Credit Facility. We manage our use of cash in the operation of our business to support the execution of our primary strategic goals. In addition, to support our strategic repositioning initiatives, from late 2009Over the past several years, we have primarily used cash for:
land acquisition and continuing through 2012, we used our unrestricted land development;
home construction;
operating expenses;
principal and interest payments on notes payable; and
cash balance to acquire land and to investcollateral.
Our investments in land development in higher-performing, choice locations — many of which are in California and Texas. Our land and land development investments totaled approximately $565$967.2 million in 2012,2015, $1.47 billion in 2014 and $1.14 billion in 2013. The decrease in our inventory investments in 2015 reflected our strategic focus on generating cash from operations in 2015 after having built a strong inventory pipeline over the past few years. Approximately 68% of our total investments in 2015 related to land development, compared to approximately $478 million46% in 20112014 and approximately $560 million38% in 2010.2013. While we made strategic investments in land and land development in each of our homebuilding reporting segments in each of these years, most were made in our West Coast segment. Our investmentinvestments in land and land development in the future will depend significantly on market conditions and available opportunities that meet our investment return and marketing standards.standards, though we expect our investment in land and land development in 2016 will increase on an overall basis compared to 2015 to support growth in homes delivered in 2017 and beyond.
The following table presents the number of lots and carrying value of inventory we owned or controlled under land option contracts and other similar contracts by homebuilding reporting segment (dollars in thousands):
|
| | | | | | | | | | | | | | |
| | November 30, | | Variance |
| | 2012 | | 2011 | | Lots/$ | | % |
| Number of lots owned or controlled under land option contracts or other similar contracts | 44,752 |
| | 40,170 |
| | 4,582 |
| | 11 | % |
| Carrying value of inventory owned or controlled under land option contracts or other similar contracts | $ | 1,706,571 |
| | $ | 1,731,629 |
| | $ | (25,058 | ) | | (1 | )% |
|
| | | | | | | | | | | | | | | | | | | | | |
| | | November 30, 2015 | | November 30, 2014 | | Variance |
| Segment | | Lots | | $ | | Lots | | $ | | Lots | | $ |
| West Coast | | 11,420 |
| | $ | 1,602,356 |
| | 12,834 |
| | $ | 1,596,480 |
| | (1,414 | ) | | $ | 5,876 |
|
| Southwest | | 8,981 |
| | 534,040 |
| | 9,557 |
| | 538,705 |
| | (576 | ) | | (4,665 | ) |
| Central | | 17,747 |
| | 707,210 |
| | 19,129 |
| | 588,054 |
| | (1,382 | ) | | 119,156 |
|
| Southeast | | 9,251 |
| | 470,141 |
| | 10,678 |
| | 495,148 |
| | (1,427 | ) | | (25,007 | ) |
| Total | | 47,399 |
| | $ | 3,313,747 |
| | 52,198 |
| | $ | 3,218,387 |
| | (4,799 | ) | | $ | 95,360 |
|
The year-over-year increase in the number of lots owned or controlled under land option contracts orand other similar contracts at November 30, 20122015 decreased from November 30, 2014 largely due to homes delivered in 2015. The year-over-year increase in the carrying value of lots owned or controlled under land option and other similar contracts at November 30, 2015 reflected the investments we made in land and land development during 2012. The slight year-over-year decrease in 2015.
Overall, the carrying valuenumber of inventory owned orlots we controlled under land option contracts orand other similar contracts for the same period reflected the higher numberas a percentage of homes deliveredtotal lots was 20% at November 30, 2015 and inventory impairment and land option contract abandonment charges in 2012. It also reflected that21% at November 30, 2014. Generally, this percentage fluctuates with our land investments during 2012 resulted in our having 4,925 moredecisions to control (or abandon) lots controlled under land option contracts orand other similar contracts which required a lower upfrontor to purchase (or sell owned) lots based on available opportunities and our investment at November 30, 2012 than we had at November 30, 2011. Overall, we had a higher percentage of lots controlled under land option contracts or other similar contracts at the end of the year— 27% in 2012 compared to 18% in 2011.return and marketing standards.
We ended our 20122015 fiscal year with $567.1$568.4 million of cash and cash equivalents and restricted cash, compared to $479.5$383.6 million at November 30, 2011.2014. Our balance of unrestricted cash and cash equivalents was $524.8increased to $559.0 million at November 30, 2012 and $415.12015 from $356.4 million at November 30, 2011. The year-over-year increase in our unrestricted cash balance reflected in part our raising approximately $91 million of unrestricted cash through the issuance of the $350 Million 7.50% Senior Notes.2014. The majority of our cash and cash equivalents at November 30, 20122015 and 20112014 were invested in money market funds and interest-bearing bank deposit accounts.
Capital Resources. Our mortgages and notes payable consisted of the following (in thousands):
|
| | | | | | | | | | | |
| | November 30, | | Variance |
| | 2012 | | 2011 | | $ |
| Mortgages and land contracts due to land sellers and other loans (6% to 7% at November 30, 2012 and 2011) | $ | 52,311 |
| | $ | 24,984 |
| | $ | 27,327 |
|
| Senior notes due February 1, 2014 at 5 3/4% | 75,911 |
| | 249,647 |
| | (173,736 | ) |
| Senior notes due January 15, 2015 at 5 7/8% | 101,999 |
| | 299,273 |
| | (197,274 | ) |
| Senior notes due June 15, 2015 at 6 1/4% | 236,826 |
| | 449,795 |
| | (212,969 | ) |
| Senior notes due September 15, 2017 at 9.10% | 261,430 |
| | 260,865 |
| | 565 |
|
| Senior notes due June 15, 2018 at 7 1/4% | 299,129 |
| | 299,007 |
| | 122 |
|
| Senior notes due March 15, 2020 at 8.00% | 345,209 |
| | — |
| | 345,209 |
|
| Senior notes due September 15, 2022 at 7.50% | 350,000 |
| | — |
| | 350,000 |
|
| Total | $ | 1,722,815 |
| | $ | 1,583,571 |
| | $ | 139,244 |
|
|
| | | | | | | | | | | |
| | November 30, | | Variance |
| | 2015 | | 2014 | | $ |
| Mortgages and land contracts due to land sellers and other loans | $ | 35,664 |
| | $ | 38,250 |
| | $ | (2,586 | ) |
| Senior notes | 2,359,872 |
| | 2,308,275 |
| | 51,597 |
|
| Convertible senior notes | 230,000 |
| | 230,000 |
| | — |
|
| Total | $ | 2,625,536 |
| | $ | 2,576,525 |
| | $ | 49,011 |
|
Our higher debt balance at November 30, 2012 reflected2015 compared to November 30, 2014 was mainly due to the issuance of the $350 Million 8.00% Senior Notes in the first quarter of 2012, which was largely offset by the purchase of $56.3$250.0 million in aggregate principal amount of the $250.0 million of 5 3/4%7.625% senior notes due 2014 (the “$250 Million 5 3/4%2023 (“7.625% Senior Notes”Notes due 2023”), $130.0 in the first quarter of 2015. We used the net proceeds of $245.4 million from this issuance to retire the remaining $199.9 million in aggregate principal amount of the $300.0 million of 5 7/8%our 6 1/4% senior notes due 2015 (the “$300 Million 5 7/8%(“6 1/4% Senior Notes”Notes due 2015”), at their maturity on June 15, 2015. The remainder of the net proceeds was used for general corporate purposes, including working capital, land acquisition and $153.7land development. Our next scheduled debt maturity is in September 2017 with respect to $265.0 million in aggregate principal amount of the $450.0 million of 6 1/4% senior notesour 9.10% Senior Notes due 2015 (the “$450 Million 6 1/4% Senior Notes”) pursuant2017. Based on our current capital position, we believe that we will have adequate resources and sufficient access to the applicable January 2012 Tender Offers. Ourcapital markets and external financing sources to satisfy this debt balance at November 30, 2012 also reflected the issuance of the $350 Million 7.50% Senior Noteswhen it matures in the third quarter of 2012, which was largely offset by the purchase of $117.7 million in aggregate principal amount of the $250 Million 5 3/4% Senior Notes, $67.8 million in aggregate principal amount of the $300 Million 5 7/8% Senior Notes, and $59.4 million in aggregate principal amount of the $450 Million 6 1/4% Senior Notes pursuant to the applicable July 2012 Tender Offers. The remaining net proceeds from these debt issuances were used for general corporate purposes. The terms of the $350 Million 8.00% Senior Notes and the $350 Million 7.50% Senior Notes are described2017. Further information regarding our notes payable is provided in Note 12. Mortgages and13. Notes Payable in the Notes to Consolidated Financial Statements in this report. The above-described transactions effectively extended the maturity of $584.9 million of our outstanding senior debt by more than five years. Our next scheduled debt maturity is in 2014, when the remaining $76.0 million in aggregate principal amount of our $250 Million 5 3/4% Senior Notes becomes due.
Our financial leverage, as measured by the ratio of debt to total capital, was 82.1%60.8% at November 30, 2012,2015, compared to 78.2%61.8% at November 30, 2011. The increase in our financial leverage reflected the increase in our mortgages and notes payable balance stemming largely from the issuance of the $350 Million 7.50% Senior Notes and the decrease in our stockholders’ equity, which resulted from the net losses we incurred during 2012.2014. Our ratio of net debt to total capital (a calculation that is described above under “Non-GAAP Financial Measures”) at November 30, 20122015 was 75.4%54.9%, compared to 71.4%57.9% at November 30, 2011.2014.
We maintain our LOC Facilities with various financial institutions to obtain letters of credit in the ordinary course of operating our business.. As of November 30, 20122015 and 2011,2014, we had $41.9$9.1 million and $63.8$26.7 million,, respectively, of letters of credit outstanding under ourthe LOC Facilities. OurThe LOC Facilities require us to deposit and maintain cash with the issuing financial institutions as collateral for our letters of credit outstanding. The amount of cash maintained for our LOC Facilities totaled $42.4$9.3 million at November 30, 20122015 and $64.5$27.2 million at November 30, 2011,2014, and these amounts were included in restricted cash onin our consolidated balance sheets as of those dates.
Unsecured Revolving Credit FacilityWe may maintain, revise or, if necessary or desirable, enter. On August 7, 2015, we entered into additional or expanded letteran amendment to the Credit Facility that increased the commitment from $200.0 million to $275.0 million and extended its maturity from March 12, 2016 to August 7, 2019. The amount of our Credit Facility available for cash borrowings and the issuance of letters of credit facilities,depends on the total cash borrowings and letters of credit outstanding under the Credit Facility and the maximum available amount under the terms of the Credit Facility.
As of November 30, 2015, we had no cash borrowings and $24.3 million of letters of credit outstanding under the Credit Facility. Therefore, as of November 30, 2015, we had $250.7 million available for cash borrowings under the Credit Facility, with up to $113.2 million of that amount available for the issuance of letters of credit. The Credit Facility is further described in Note 13. Notes Payable in the Notes to Consolidated Financial Statements in this report.
Under the terms of the Credit Facility, we are required, among other things, to maintain compliance with various covenants, including financial covenants regarding our consolidated tangible net worth, consolidated leverage ratio (“Leverage Ratio”), and either a consolidated interest coverage ratio (“Interest Coverage Ratio”) or enter into a revolving credit facility,minimum liquidity level, each as defined therein. Our compliance with these financial covenants is measured by calculations and metrics that are specifically defined or described by the sameterms of the Credit Facility and can differ in certain respects from comparable GAAP or other commonly used terms. The financial institutions.covenant requirements are set forth below:
Consolidated Tangible Net Worth.
We must maintain a minimum consolidated tangible net worth at the end of any fiscal quarter equal to the sum of (a) $1.13 billion, plus (b) an amount equal to 50% of the aggregate of the cumulative consolidated net income for each fiscal quarter commencing after May 31, 2015 and ending as of the last day of such fiscal quarter (though there is no reduction if there is a consolidated net loss in any fiscal quarter), plus (c) an amount equal to 50% of the cumulative net proceeds we receive from the issuance of our capital stock after May 31, 2015. As of November 30, 2015, our applicable minimum consolidated tangible net worth requirement was $1.16 billion.
Leverage Ratio. We must also maintain a Leverage Ratio of less than or equal to .700 for each fiscal quarter through and including the fourth quarter of 2016. This requirement adjusts to less than or equal to .650 for the first quarter of 2017 and each quarter thereafter for the term of the Credit Facility. The Leverage Ratio is calculated as the ratio of our consolidated total indebtedness to the sum of consolidated total indebtedness and consolidated tangible net worth, all as defined under the Credit Facility.
Interest Coverage Ratio or Liquidity. We are also required to maintain either (a) an Interest Coverage Ratio of greater than or equal to 1.40 for each fiscal quarter through and including the second quarter of 2016. This ratio adjusts to greater than or equal to 1.50 for the third quarter of 2016 and each quarter thereafter for the term of the Credit Facility; or (b) a minimum level of liquidity, but not both. The Interest Coverage Ratio is the ratio of our consolidated adjusted EBITDA to consolidated interest incurred, each as defined under the Credit Facility, in each case for the previous 12 months. Our minimum liquidity level is required to be greater than or equal to consolidated interest incurred, as defined under the Credit Facility, for the four most recently-ended fiscal quarters in the aggregate. As of November 30, 2015, our minimum liquidity requirement was $184.9 million.
In addition, under the Credit Facility, our investments in joint ventures and non-guarantor subsidiaries (which are shown, respectively, in Note 9. Investments in Unconsolidated Joint Ventures and in Note 22. Supplemental Guarantor Information in the Notes to Consolidated Financial Statements in this report) cannot exceed the sum of (a) $117.4 million and (b) 20% of consolidated tangible net worth; and our borrowing base indebtedness, which is the aggregate principal amount of our outstanding indebtedness for borrowed money and non-collateralized financial letters of credit, cannot be greater than our borrowing base (a measure relating to our inventory and unrestricted cash assets).
The covenants and other requirements under our Credit Facility represent the most restrictive provisions that we are subject to with respect to our notes payable. The following table summarizes the financial covenants and other requirements under the Credit Facility, and our actual levels or ratios (as applicable) with respect to those covenants and other requirements, in each case as of November 30, 2015:
|
| | | | | | | | | |
| Financial Covenants and Other Requirements | | Covenant Requirement | | Actual |
| Consolidated tangible net worth | | > | $ | 1.16 | billion | | $ | 1.69 | billion |
| Leverage Ratio | | < | .700 |
| | .608 |
|
| Interest Coverage Ratio (a) | | > | 1.400 |
| | 1.681 |
|
| Minimum liquidity (a) | | > | $ | 184.9 | million | | $ | 559.0 | million |
| Investments in joint ventures and non-guarantor subsidiaries | | < | $ | 455.6 | million | | $ | 110.9 | million |
| Borrowing base in excess of borrowing base indebtedness (as defined) | | | n/a | | $ | 413.2 | million |
| |
| (a) | Under the terms of the Credit Facility, we are required to meet either the Interest Coverage Ratio or a minimum level of liquidity, but not both. As of November 30, 2015, we met both the Interest Coverage Ratio and the minimum liquidity requirements. |
The indenture governing ourthe senior notes does not contain any financial maintenance covenants. Subject to specified exceptions, the indenture contains certain restrictive covenants that, among other things, limit our ability to incur secured indebtedness, or engage in sale-leaseback transactions involving property or assets above a certain specified value. Unlike our otherIn addition, the senior notes (with the terms governingexception of the $265 Million 9.10%7 1/4% senior notes due 2018 (“7 1/4% Senior Notes the $350 Million 8.00% Senior Notes, and the $350 Million 7.50% Senior Notesdue 2018”)) contain certain limitations related to mergers, consolidations, and sales of assets.
Under the terms of the indenture, we must causeOur obligations to pay principal, premium, if any, subsidiary of ours that is or becomes a “significant subsidiary,” as definedand interest under Rule 1-02 of Regulation S-X (as in effect on June 1, 1996), to provide a guarantee with respect to our senior notes (the “Guarantorand borrowings, if any, under the Credit Facility are guaranteed on a joint and several basis by certain of our subsidiaries (“Guarantor Subsidiaries”). In addition, weThe guarantees are full and unconditional and the Guarantor Subsidiaries are 100% owned by us. We may also cause other subsidiaries of ours to provide such a guaranteebecome Guarantor Subsidiaries if we believe it to be in our or the relevant subsidiary’s best interests. Condensed consolidating financial information for our subsidiaries considered to be Guarantor Subsidiaries is provided in Note 21.22. Supplemental Guarantor Information in the Notes to Consolidated Financial Statements in this report.
As of November 30, 2012,2015, we were in compliance with the applicable terms of all of our covenants and other requirements under ourthe Credit Facility, the senior notes, the indenture, and the mortgages and land contracts due to land sellers and other loans. Our ability to access the Credit Facility for cash borrowings and letters of credit and our ability to secure future debt financing may depend, in part, on our ability to remain in such compliance. There are no agreements that restrict our payment of dividends other than to maintain compliance with the financial covenant requirements under the Credit Facility, which would restrict our payment of dividends if a default under the Credit Facility exists at the time of any such payment, or if any such payment would result in such a default.
Depending on available terms, we finance certain land acquisitions with purchase-money financing from land sellers or with other forms of financing from third parties. At November 30, 2012,2015, we had outstanding mortgages and land contracts due to land sellers and other loans payable in connection with such financing of $52.3$35.7 million,, secured primarily by the underlying property, which had aan aggregate carrying value of $94.1 million.$136.1 million.
Consolidated Cash Flows. The following table presents a summary of net cash provided by (used in) our operating, investing and financing activities (in thousands):
| | | | Years Ended November 30, | Years Ended November 30, |
| | 2012 | | 2011 | | 2010 | 2015 | | 2014 | | 2013 |
| Net cash provided by (used in): | | | | | | | | | | |
| Operating activities | $ | 34,617 |
| | $ | (347,545 | ) | | $ | (133,964 | ) | $ | 181,185 |
| | $ | (630,691 | ) | | $ | (443,486 | ) |
| Investing activities | (760 | ) | | 13,098 |
| | (16,089 | ) | (11,303 | ) | | (44,782 | ) | | (16,750 | ) |
| Financing activities | 73,757 |
| | (155,909 | ) | | (119,478 | ) | 31,691 |
| | 501,718 |
| | 467,071 |
|
| Net increase (decrease) in cash and cash equivalents | $ | 107,614 |
| | $ | (490,356 | ) | | $ | (269,531 | ) | $ | 201,573 |
| | $ | (173,755 | ) | | $ | 6,835 |
|
Operating Activities. Operating activities provided net cash of $34.6$181.2 million in 20122015 and used net cash of $347.5$630.7 million in 20112014 and $134.0$443.5 million in 2010. The year-over-year change in2013. Generally, our net operating cash flows fluctuate primarily based on changes in 2012our inventories and our profitability for the year. Our net cash provided by operating activities in 2015 was primarily due tomainly driven by net income and a decrease in inventories (excluding the lower net loss incurred in 2012 and the substantial payments we made in 2011 in connection with the South Edge Plan and in resolving other matters surrounding the underlying joint venture.noncash activities described below). In 2011,2014, the year-over-year change in net operating cash flows was largely due to a sizeable federal income tax refund we receivedan increase in cash used for investments in land and land development during 2010; there was no such refund receivedthat year in 2011.support of our strategic growth initiatives, partly offset by an increase in net income.
In 2012,Our net cash was provided by operating activities in 2015 primarily reflected net income of $84.6 million, a net decrease in inventories of $30.3$34.9 million (excluding $53.6a $106.8 million increase in consolidated inventories not owned, $20.3 million of inventories acquired through seller financing, a $12.7 million distribution of land from an unconsolidated joint venture, and $9.6 million of inventory impairment and land option contract abandonment charges of $28.5 millioncharges), and a decrease of $19.8 million in consolidated inventories not owned) and a decrease in receivables of $25.0 million. Partially offsetting the cash provided was a net loss of $59.0 million, a net decreaseincrease in accounts payable, accrued expenses and other liabilities of $2.1 million, and other operating uses of $12.5 million.
In 2011, our uses$2.0 million. These sources of cash forwere partly offset by a net increase in receivables of $20.5 million. In 2014, our net cash used by operating activities includedprimarily reflected net cash of $780.1 million used to increase our inventories through investments in land and land development, partly offset by pretax income of $94.9 million. In 2013, our net cash used by operating activities was largely due to $563.2 million of net cash used for investments in land and land development, partially offset by cash provided by a net loss of $178.8 million, a net decreasechange in accounts payable, accrued expenses and other liabilities of $253.5$59.8 million,, a net increase in inventories and pretax income of $12.3 million (excluding the real estate collateral in our Southwest homebuilding reporting segment that we took back on a $40.0 million note receivable, inventory impairment and land option contract abandonment charges of $25.8 million, and an increase of $8.4 million in consolidated inventories not owned), a net increase in receivables of $2.2 million and other operating uses of $2.3 million. The net decrease in accounts payable, accrued expenses and other liabilities was largely due to payments we made in connection with the South Edge Plan and in resolving other matters surrounding the underlying joint venture.
Our uses of operating cash in 2010 included a net decrease in accounts payable, accrued expenses and other liabilities of $199.2 million, a net increase in inventories of $129.3 million (excluding inventory impairments and land option contract abandonments, $55.2 million of inventories acquired through seller financing and a decrease of $41.6 million in consolidated inventories not owned), a net loss of $69.4 million, and other operating uses of $1.7 million. Partially offsetting the cash used was a decrease in receivables of $211.3 million, mainly due to the $190.7 million federal income tax refund we received during the first quarter as a result of the carryback of our 2009 NOL to offset earnings we generated in 2004 and 2005.$38.4 million.
Investing Activities. Investing activities used net cash of $.8$11.3 million in 20122015, $44.8 million in 2014 and $16.1$16.8 million in 2010 and provided net cash of $13.1 million in 2011.2013. The year-over-year changedecrease in netcash used in investing cash flowsactivities in 2012 and 20112015 was mainlyprimarily due to proceeds of $80.6 million we receiveda decrease in 2011 from the sale of a multi-level residential building we had operated as a rental property in our West Coast homebuilding reporting segment, partly offset by investments incontributions to unconsolidated joint ventures that year.
In 2012, $1.7to $20.6 million was and a slight decrease in cash used for net purchases of property and equipment. The cash used was largelyequipment, which
were partially offset by $1.0 million of cash provided by a return of investment in unconsolidated joint ventures. In 2011, the $80.6 million we received from the sale of the multi-level residential building was partly offset by $67.2 million used for investments in unconsolidated joint ventures and $.3of $14.0 million. In 2014, the year-over-year increase in net cash used in investing activities was largely due to increased contributions of $49.1 million used for net purchases of property and equipment. In 2010, cash of $15.7 million was used for investments into unconsolidated joint ventures, andpartly offset by proceeds of $10.1 million from the sale of our investment in an unconsolidated joint venture in Maryland. In 2013, we used net cash primarily for $.414.4 million was used for net purchases of propertycontributions to HCM and equipment.two other unconsolidated joint ventures within our homebuilding operations.
Financing Activities. Financing activities provided net cash of $31.7 million in 2015, $501.7 million in 2014 and $73.8467.1 million in 2012 and used net cash of $155.9 million in 2011 and $119.5 million in 2010. We generated cash from financing activities in 2012 mainly as a result of the issuances of the $350 Million 8.00% Senior Notes and the $350 Million 7.50% Senior Notes, partly offset by the purchase of certain of our senior notes due in 2014 and2013. In 2015, pursuant to the applicable January 2012 Tender Offers and July 2012 Tender Offers. In 2011, the year-over-year change in cash used forprovided by financing activities was largely due to the repaymentissuance of debt, partly offset by a decreasesenior notes and common stock in restricted cash.
2014. In 2012,2015, cash was mainly provided by net proceeds of $694.8$250.0 million received from the issuancesissuance of the $350 Million 8.00%7.625% Senior Notes due 2023 and the $350 Million 7.50% Senior Notes, a decrease of $22.1$17.9 million in our restricted cash balance and $.6 million of cash provided from the issuance of common stock under employee stock plans.balance. The cash provided was partiallypartly offset by $592.6 millioncash used to purchase $340.0retire the remaining $199.9 million in aggregate principal amount of certain of our senior notes due 2014 and 2015 pursuant to the applicable January 2012 Tender Offers and $244.9 million in aggregate principal amount of certain of our senior notes due 2014 and 2015 pursuant to the applicable July 2012 Tender Offers, including expenses associated with the applicable tender offers and with the issuance of the $350 Million 8.00%6 1/4% Senior Notes and the $350 Million 7.50% Senior Notes. Uses of cash in 2012 also includeddue 2015 at their maturity on June 15, 2015, payments on mortgages and land contracts due to land sellers and other loans of $26.3$22.9 million,, the payment of senior note issuance costs of $12.4 million, dividend payments on our common stock of $10.6$9.2 million,, and stock repurchasesthe payment of $1.8debt issuance costs of $4.6 million in connection associated with the satisfaction of employee withholding taxes on vested restricted stock.
In 2011, cash was used for the repaymentissuance of the remaining 7.625% Senior Notes due 2023 and the Credit Facility.$100.0 million
In 2014, the year-over-year increase in aggregate principal amountcash provided from financing activities primarily reflected $400.0 million from the issuance of $350.0 million of 6 3/8%the 4.75% senior notes due 2011 (the “$350 Million 6 3/8%2019 (“4.75% Senior Notes”Notes due 2019”) at their August 15, 2011 maturity, and for net proceeds of $137.0 million from the underwritten public issuance of 7,986,111 shares of our common stock. In 2013, net cash provided by financing activities was mainly due to the concurrent underwritten public issuances of the 1.375% Convertible Senior Notes due 2019 and 6,325,000 shares of our common stock, which together generated total net proceeds of $332.2 million, and the underwritten public issuance of our 7.00% senior notes due 2021 (“7.00% Senior Notes due 2021”), partly offset by the retirement of certain of our senior notes that were scheduled to mature in 2014 and 2015, and payments on mortgages and land contracts due to land sellers and other loans of $89.5 million, primarily related to the repayment of debt secured by the multi-level residential building we sold during the year. Uses of cash in 2011 also included dividend payments on our common stock of $19.2 million. The cash used was partially offset by a $51.0 million decrease in our restricted cash balance, of which $26.8 million related to cash collateral no longer required on a surety bond, and $1.8 million of cash provided from the issuance of common stock under employee stock plans.
In 2010, cash was used for net payments on mortgages and land contracts due to land sellers and other loans of $101.2 million, dividend payments on our common stock of $19.2 million, an increase in the restricted cash balance of $1.2 million, and stock repurchases of $.4 million in connection with the satisfaction of employee withholding taxes on vested restricted stock. The cash used was partially offset by $1.9 million provided from the issuance of common stock under employee stock plans and $.6 million from excess tax benefits associated with the exercise of stock options.loans.
Our board of directors declared a quarterly dividend of$.0625per share of common stock in the first quarter of 2012 and quarterly dividends of$.0250per share of common stock in each of the second, third and fourth quarters of 2012. All dividends declared in 2012 were paid during the year. In the second quarter of 2012, our board of directors decided to reduce the quarterly
cash dividend from $.0625 per share to enable the redeployment of our unrestricted cash to help support our strategic growth initiatives. Our board of directors declared four quarterly cash dividends of$.0625 $.0250 per share of common stock in 2015, 2014 and 2013. Cash dividends declared and paid during both 2011each of the years ended November 30, 2015, 2014 and 2010.2013 totaled $.10 per share of common stock. The declaration and payment of future cash dividends on our common stock are at the discretion of our board of directors, and depend upon, among other things, our expected future earnings, cash flows, capital requirements, debt structure and any adjustments thereto, operational and financial investment strategy and general financial condition, as well as general business conditions.
Shelf Registration Statement. We have an automatically effective universal shelf registration statement (“2014 Shelf Registration”), which was filed on July 18, 2014, on file with the SEC, which was filed on September 20, 2011 (the “2011 Shelf Registration”). The 2011 Shelf Registration registers the offeringSEC. Issuances of debt and equity securities that we may issue from time to time in amountsunder our 2014 Shelf Registration require the filing of a prospectus supplement identifying the amount and terms of the securities to be determined. In 2012, we issued the $350 Million 8.00% Senior Notesissued. Our ability to issue equity and/or debt is subject to market conditions and the $350 Million 7.50% Senior Notes under the 2011 Shelf Registration.other factors impacting our borrowing capacity.
Share Repurchase Program. As of November 30, 2012,2015, we were authorized to repurchase 4,000,000 shares of our common stock under a board-approved share repurchase program. We did notAs discussed in Note 24. Subsequent Event in the Notes to Consolidated Financial Statements in this report, on January 12, 2016, our board of directors authorized us to repurchase anya total of up to 10,000,000 shares of our outstanding common stock. This authorization reaffirmed and incorporated the then-current balance of 4,000,000 shares that remained under the prior board-approved share repurchase program.
Unrelated to the common stock repurchase plan, as further discussed in Note 17. Stockholders’ Equity in the Notes to Consolidated Financial Statements in this report, in connection with an amendment of the Amended and Restated KB Home Non-Employee Directors Compensation Plan (“Director Plan”) in 2014, our board of directors authorized the repurchase of no more than 680,000 shares of our common stock solely as necessary for director elections with respect to settling outstanding stock appreciation rights awards granted under this program in 2012, 2011 or 2010. We have notthe Director Plan (“Director Plan SARs”). As of November 30, 2015, no Director Plan SARs had been settled. During 2013, we repurchased through open market transactions 478,294 shares of our common sharesstock at an aggregate price of $7.9 million pursuant to a board of directors authorization to repurchase no more than 482,000 shares of our common stock repurchase plansolely as necessary for director elections in respect of outstanding stock units under the past several years andDirector Plan. We do not anticipate any resumption of such stockadditional repurchases will be at the discretion of our common stock pursuant to this board of directors.
directors authorization.
In the present environment, we are managing our use of cash for investments to maintain and grow our business. Based on our current capital position, weWe believe we will have adequate capital resources and sufficient access to the credit and capital markets and external financing sources to satisfy our current and reasonably anticipated long-term requirements for funds to acquire capitalassets and land, to use and/or develop acquired assets and land, to construct homes, to finance our financial services operations and to meet any other needs in the ordinary course of our business. Although our land acquisition and land development activities for 2013 will be subjectIn addition to market conditions and available opportunities, we will likely use a portion of our unrestricted cash resources to acquireacquiring and/or developdeveloping land that meets our investment return and marketing standards. In 2013,standards, in 2016, we may also use or redeploy our unrestricted cash resources or cash borrowings under the Credit Facility to support other business purposes that are aligned with our primary strategic goals, including our growth initiatives. In addition, wegoals. We may also arrange or engage in capital markets, bank loan, credit facility, project debt or other financial transactions. These transactions may include repurchases from time to time of our outstanding common stock. They may also include repurchases from time to time of our outstanding senior notes or other debt through
redemptions, tender offers, exchange offers, private exchanges, open market or private purchases or other means, and may include potential new issuances of equity or senior or convertible senior notes or other debt through public offerings, private placements or other arrangements to raise newor access additional capital to support our current land acquisition and land development investment targets, to complete strategic transactions and for other business purposes and/or to effect repurchases or redemptions of our outstanding senior notes or other debt. As necessary or desirable, we may adjust or amend the terms of and/or expand the capacity of the Credit Facility or the LOC Facilities, or enter into additional letter of credit facilities, or other similar facility arrangements, in each case with the same or other financial institutions, or allow any such facilities to mature or expire. Our ability to engage in such financial transactions, however, may be constrained by economic, capital, credit and/or financial market conditions, investor interest and/or our current leverage ratios, and we can provide no assurance of the success or costs of any such transactions.
OFF-BALANCE SHEET ARRANGEMENTS
We have investments in unconsolidated joint ventures that conduct land acquisition, land development and/or other homebuilding activities in various markets where our homebuilding operations are located. Our partners in these unconsolidated joint ventures are unrelated homebuilders, and/or land developers and other real estate entities, or commercial enterprises. These investments are designed primarily to reduce market and development risks and to increase the number of lots owned and controlled by us. In some instances, participating in unconsolidated joint ventures has enabled us to acquire and develop land that we might not otherwise have had access to due to a project’s size, financing needs, duration of development or other circumstances. While we consider our participation in unconsolidated joint ventures as potentially beneficial to our homebuilding activities, we do not view such participation as essential and have unwound our participation in a number of unconsolidated joint ventures in the past few years.
We typically have obtained rights to acquire portions of the land held by the unconsolidated joint ventures in which we currently participate. When an unconsolidated joint venture sells land to our homebuilding operations, we defer recognition of our share of such unconsolidated joint venture’s earnings until a home sale is closed and title passes to a homebuyer, at which time we account for those earnings as a reduction of the cost of purchasing the land from the unconsolidated joint venture.
We and our unconsolidated joint venture partners make initial and/or ongoing capital contributions to these unconsolidated joint ventures, typically on a pro rata basis equal to our respective equity interests. The obligations to make capital contributions are governed by each unconsolidated joint venture’s respective operating agreement and related governing documents.Unconsolidated Joint Ventures. We also share in the profits and losses of these unconsolidated joint ventures generally in accordance with our respective equity interests. These unconsolidated joint ventures had total assets of $389.8 million at November 30, 2012 and $396.9 million at November 30, 2011. Our investments in unconsolidated joint ventures totaled $123.7 million at November 30, 2012 and $127.9 million at November 30, 2011.
Our unconsolidated joint ventures finance land and inventory investments for a project through a variety of arrangements,
and certain of our unconsolidated joint ventures have obtained loans from third-party lenders that are secured by the underlying property and related project assets. However, none of our unconsolidated joint ventures had outstanding debt at November 30, 2012 or 2011.
In certain instances, we and/or our partner(s) in an unconsolidated joint venture have provided completion and/or carve-out guarantees to the unconsolidated joint venture’s lenders. A completion guaranty refers to the physical completion of improvements for a project and/or the obligation to contribute capital to an unconsolidated joint venture to enable it to fund its completion obligations. Our potential responsibility under our completion guarantees, if triggered, is highly dependent on the facts of a particular case. A carve-out guaranty refers to the payment of losses a lender suffers due to certain bad acts or omissions by an unconsolidated joint venture or its partners, such as fraud or misappropriation, or due to environmental liabilities arising with respect to the relevant project. As none of our unconsolidated joint ventures had outstanding debt at November 30, 2012 or 2011, we did not have exposure with respect to any related completion or carve-out guarantees as of those dates.
As further discussed in Note 9. Investments in Unconsolidated Joint Ventures in the Notes to Consolidated Financial Statements in this report, ourwe have investments in unconsolidated joint ventures asin various markets where our homebuilding operations are located. Our unconsolidated joint ventures had total combined assets of $207.0 million at November 30, 2015 and $182.2 million at November 30, 2014. Our investments in unconsolidated joint ventures totaled $71.6 million at November 30, 2015 and $79.4 million at November 30, 2014. As of November 30, 20122015, one of our unconsolidated joint ventures had outstanding secured debt of $39.1 million under a construction loan agreement. The unconsolidated joint venture’s outstanding secured debt is non-recourse to us and 2011 includedis scheduled to mature in August 2018. While we and our investments of $71.0 million and $75.5 million, respectively,partner in Inspirada Builders, LLC, anthe unconsolidated joint venture that was formed in 2011 in connection withprovided certain guarantees and indemnities to the South Edge Plan, and in whichlender, we do not have a wholly owned subsidiary of ours is a member. As partguaranty or any other obligation to repay or to support the value of the termscollateral underlying the unconsolidated joint venture’s outstanding secured debt under the construction loan agreement. We do not believe that our existing exposure under our guaranty and indemnity obligations related to the unconsolidated joint venture’s outstanding secured debt under the construction loan agreement is material to our consolidated financial statements. None of the South Edge Plan, land previously owned by the South Edge joint venture, including our share that consists of approximately 600 developable acres, was acquired by Inspirada Builders, LLC in November 2011. We anticipate that we will acquire our share of the land from Inspirada Builders, LLC through a future distribution.
Our investments in other unconsolidated joint ventures may create a variable interest in a variable interest entity (“VIE”), depending on the contractual termshad outstanding debt at November 30, 2015. None of the arrangement. We analyze our unconsolidated joint ventures in accordance with Accounting Standards Codification No. 810, “Consolidation” (“ASC 810”) to determine whether they are VIEs and, if so, whether we are the primary beneficiary. Allhad outstanding debt at November 30, 2014. In addition, none of our joint ventures at November 30, 2012 and 2011 2015 or November 30, 2014 were determined under the provisions of ASC 810 to be unconsolidatedVIEs. All of our joint ventures were unconsolidated and were accounted for under the equity method either because they were not VIEs and we did not have a controlling financial interest or, if they were VIEs, we were not the primary beneficiary of the VIEs.
interest.
InLand Option Contracts and Other Similar Contracts. As discussed in Note 8. Variable Interest Entities in the Notes to Consolidated Financial Statements in this report, in the ordinary course of our business, we enter into land option contracts and other similar contracts with third parties and unconsolidated entities to acquire rights to land for the construction of homes. The useAt November 30, 2015, we had total cash deposits of these$54.5 million to purchase land having an aggregate purchase price of $1.19 billion. At November 30, 2014, we had total deposits of $33.2 million, comprised of $33.1 million of cash deposits and $.1 million of letters of credit, to purchase land having an aggregate purchase price of $958.5 million. Our land option contracts and other similar contracts generally allows usdo not contain provisions requiring our specific performance. Our decision to reduceexercise a particular land option contract or other similar contract depends on the results of our due diligence reviews and ongoing market risks associated with directand project feasibility analysis that we conduct after entering into such a contract. In some cases, our decision to exercise a land ownership and development, and to reduce our capital and financial commitments, including interest andoption contract or other carrying costs. Under such contracts, we typically pay a specified option or earnest money deposit in consideration for the right to purchase land in the future, usually at a predetermined price. Under the requirements of ASC 810, certain of these contractssimilar contract may create a variable interest for us, withbe conditioned on the land seller being identifiedobtaining necessary entitlements, such as zoning rights and environmental and development approvals, and/or physically developing the underlying land by a VIE.
In compliance with ASC 810,pre-determined date. We typically have the ability not to exercise our rights to the underlying land for any reason and forfeit our deposits without further penalty or obligation to the sellers. If we analyzewere to acquire all of the land we controlled under our land option contracts and other similar contracts at November 30, 2015, we estimate the remaining purchase price to determine whether the corresponding land sellers are VIEsbe paid would be as follows: 2016 – $611.7 million; 2017 – $228.1 million; 2018 – $79.2 million; 2019 – $55.9 million; 2020 – $49.6 million; and if so, whether we are the primary beneficiary. Although we do not have legal titlethereafter – $108.7 million.
In addition to the underlyingcash deposits, our exposure to loss related to our land ASC 810 requires us to consolidate a VIE if we are determined to be the primary beneficiary. In determining whether we are the primary beneficiary, we consider, amongoption contracts and other things, whether we have the power to direct the activitiessimilar contracts consisted of the VIE that most significantly impact the VIE’s economic performance. Such activities would include, among other things, determining or limiting the scope or purposepre-acquisition costs of the VIE, selling or transferring property owned or controlled by the VIE, or arranging financing for the VIE. As a result of$65.6 million at November 30, 2015 and $48.0 million at November 30, 2014. These pre-acquisition costs and cash deposits were included in inventories in our analyses, weconsolidated balance sheets.
We determined that as of November 30, 20122015 and 2011November 30, 2014 we were not the primary beneficiary of any VIEs from which we have acquired rights to land under land option contracts and other similar contracts.
The following table presents a summary of our interests in land option contracts and other similar contracts (in thousands):
|
| | | | | | | | | | | | | | | |
| | November 30, 2012 | | November 30, 2011 |
| | Cash Deposits | | Aggregate Purchase Price | | Cash Deposits | | Aggregate Purchase Price |
| Unconsolidated VIEs | $ | 8,463 |
| | $ | 327,196 |
| | $ | 8,097 |
| | $ | 122,125 |
|
| Other land option contracts and other similar contracts | 17,219 |
| | 298,139 |
| | 12,830 |
| | 222,940 |
|
| | $ | 25,682 |
| | $ | 625,335 |
| | $ | 20,927 |
| | $ | 345,065 |
|
In addition to the cash deposits presented in the table above, our exposure to loss related to our land option contracts and other similar contracts with third parties and unconsolidated entities consisted of pre-acquisition costs of $25.4 million at November 30, 2012 and $31.5 million at November 30, 2011. These pre-acquisition costs and cash deposits were included in inventories on our consolidated balance sheets. We also had outstanding letters of credit of $.5 million at November 30, 2012 and $1.7 million
at November 30, 2011 in lieu of cash deposits under certain land option contracts and other similar contracts.
We also evaluate our land option contracts and other similar contracts for financing arrangements, in accordance with Accounting Standards Codification Topic No. 470, “Debt” (“ASC 470”), and, as a result of our evaluations, increased inventories, with a corresponding increase to accrued expenses and other liabilities, in our consolidated balance sheets by $4.1$110.0 million at November 30, 2015 and $3.1 million at November 30, 2012 and $23.9 million at November 30, 2011.2014.
CONTRACTUAL OBLIGATIONS AND COMMERCIAL COMMITMENTS
The following table presents our future cash requirements under contractual obligations as of November 30, 20122015 (in millions):
| | | | Payments due by Period | Payments due by Period |
| | Total | | 2013 | | 2014-2015 | | 2016-2017 | | Thereafter | Total | | 2016 | | 2017-2018 | | 2019-2020 | | Thereafter |
| Contractual obligations: | | | | | | | | | | | | | | | | | | |
| Long-term debt | $ | 1,722.8 |
| | $ | 37.9 |
| | $ | 429.2 |
| | $ | 261.4 |
| | $ | 994.3 |
| $ | 2,630.7 |
| | $ | 35.7 |
| | $ | 565.0 |
| | $ | 980.0 |
| | $ | 1,050.0 |
|
| Interest | 751.6 |
| | 125.3 |
| | 230.5 |
| | 195.2 |
| | 200.6 |
| 809.6 |
| | 174.1 |
| | 309.0 |
| | 199.9 |
| | 126.6 |
|
| Inventory-related obligations (a) | | 148.8 |
| | 74.8 |
| | 39.7 |
| | 3.4 |
| | 30.9 |
|
| Operating lease obligations | 14.3 |
| | 5.9 |
| | 8.1 |
| | .3 |
| | — |
| 35.4 |
| | 7.6 |
| | 10.7 |
| | 7.7 |
| | 9.4 |
|
| Inventory-related obligations (a) | 11.7 |
| | 1.8 |
| | 3.8 |
| | 1.4 |
| | 4.7 |
| |
| Total (b) | $ | 2,500.4 |
| | $ | 170.9 |
| | $ | 671.6 |
| | $ | 458.3 |
| | $ | 1,199.6 |
| $ | 3,624.5 |
| | $ | 292.2 |
| | $ | 924.4 |
| | $ | 1,191.0 |
| | $ | 1,216.9 |
|
| |
| (a) | Represents liabilities related tofor inventory not owned andassociated with financing arrangements as discussed in Note 8. Variable Interest Entities in the Notes to Consolidated Financial Statements in this report, as well as liabilities for fixed or determinable amounts associated with debt of a tax increment financing entityactivities (“TIFE”). assessments. As homes are delivered, the obligation to pay the remaining TIFE assessments associated with each underlying lot is transferred to the homebuyer. As such, the TIFE debtthese assessment obligations will be paid by us only to the extent we do not deliver thehomes on applicable homeslots before the debt matures.related TIFE obligations mature. |
| |
| (b) | Total contractual obligations exclude our accrual for uncertain tax positions recorded for financial reporting purposes as of November 30, 20122015 because we are unable to make a reasonable estimate of cash settlements with the respective taxing authorities for all periods presented. We anticipate these potential cash settlement requirements for 20132016 to range from $.2 millionzero to $1.1$.1 million. |
We are often requiredAs discussed in Note 15. Commitments and Contingencies in the Notes to provide to various municipalities and other government agencies performance bonds and/or letters of credit to secure the completion of our projects and/orConsolidated Financial Statements in support of obligations to build community improvements such as roads, sewers, water systems and other utilities, and to support similar development activities by certain of our unconsolidated joint ventures. At November 30, 2012,this report, we had $286.1$565.4 million of performance bonds and $41.9$33.4 million of letters of credit outstanding.outstanding at November 30, 2015. At November 30, 2011,2014, we had $361.6$541.6 million of performance bonds and $63.8$26.7 million of letters of credit outstanding.If any such performance bonds or letters of credit are called, we would be obligated to reimburse the issuer of the performance bond or letter of credit. We do not believe that a material amount of any currently outstanding performance bonds or letters of credit will be called. Performance bonds do not have stated expiration dates. Rather, we are released from the performance bonds as the underlying performance is completed. The expiration dates of some letters of credit issued in connection with community improvements coincide with the expected completion dates of the related projects or obligations. Most letters of credit, however, are issued with an initial term of one year and are typically extended on a year-to-year basis until the related performance obligations are completed.
CRITICAL ACCOUNTING POLICIES AND ESTIMATES
Discussed belowThe accompanying consolidated financial statements were prepared in conformity with GAAP. The preparation of these financial statements requires the use of estimates, judgments and assumptions that affect the reported amounts of assets and liabilities at the date of the financial statements and reported amounts of revenues and expenses during the periods presented. Actual results could differ from those estimates and assumptions. See Note 1. Summary of Significant Accounting Policies in the Notes to Consolidated Financial Statements in this report for a discussion of our significant accounting policies. The following are accounting policies that we believe are critical because of the significance of the activity to which they relate or because they require the use of significant judgmentestimates, judgments and/or other assumptions in their application.
Homebuilding Revenue Recognition. As discussed in Note 1. Summary of Significant Accounting Policies in the Notes to Consolidated Financial Statements in this report, revenuesRevenues from housing and other real estate sales are recognized in accordance with Accounting Standards Codification Topic No. 360, “Property, Plant and Equipment” (“ASC 360”) when sales are closed and title passes to the buyer. Sales are closed when all of the following conditions are met: a sale is consummated, a sufficient down payment is received, the earnings process is complete and the collection of any remaining receivables is reasonably assured.Concurrent with the recognition of revenues in our consolidated statements of operations, sales incentives in the form of price concessions on the selling price of a home are recorded as a reduction of revenues, while the cost of sales incentives in the form of free products or services to homebuyers, including option upgrades and closing cost allowances used to cover a portion of the fees and costs charged to a homebuyer, is reflected as construction and land costs.
Inventories and Cost of Sales. As discussed in Note 1. Summary of Significant Accounting Policies in the Notes to Consolidated Financial Statements in this report, hHousing and land inventories are stated at cost, unless the carrying value is determined not to be recoverable, in which case the affected inventories are written down to fair value in accordance with ASC 360.or fair value less costs to sell. Fair value is determined based on estimated future net cash flows discounted for inherent risks associated with the real estate assets, or other
valuation techniques. Due to uncertainties in the estimation process and other factors beyond our control, it is possible that actual results could differ from those estimated. Our inventories typically do not consist of completed unsold homes. However, cancellations or strategic considerations may result in our having some inventory of unsold completed or partially completed homes.partially-completed homes in our inventory.
Our inventories include land we are holding for future development, which is comprised of land where development activity has been suspended or has not yet begun but is expected to occur in the future. These assets held for future development are located in various submarkets where conditions do not presently support further investment or development, or are subject to a building permit moratorium or regulatory restrictions, or are portions of larger land parcels that we plan to build out over several years and/or that have not yet been entitled. We may also suspend development activity if we believe it will result in greater returns and/or maximize the economic performance of a community.particular community by delaying improvements for a period of time to, for instance, allow earlier phases of a long-term, multi-phase community or a neighboring community to generate sales momentum or for market
Weconditions to improve. In some instances, we may activate or resume development activity when we believe our investment infor this inventory will be optimized, and weto accelerate sales and/or our return on investment. We have activated assets previously held for future development in certain markets as part of our strategic growth initiatives. Interest isand real estate taxes are not capitalized on land held for future development. As discussed in Note 5. Inventories in the Notes to Consolidated Financial Statements in this report, for those communities for which development activity has been suspended, applicable interest is expensed as incurred.
We rely on certain estimates to determine our construction and land costs and resulting housing gross profit margins associated with revenues recognized. Construction and land costs are comprised of direct and allocated costs, including estimated future costs for warrantiesthe limited warranty we provide on our homes and amenities.certain amenities within a community. Land acquisition, land development and other common costs are generally allocated on a relative fair value basis to the homes or lots within athe applicable community or land parcel. Land acquisition and land development costs include related interest and real estate taxes.
In determining a portion of the construction and land costs recognized for each period, we rely on project budgets that are based on a variety of assumptions, including future construction schedules and costs to be incurred. It is possible that actual results could differ from budgeted amounts for various reasons, including construction delays, labor or materialsconstruction resource shortages, increases in costs that have not yet been committed, changes in governmental requirements, unforeseen environmental hazard discoveries or other unanticipated issues encountered during construction and other factors beyond our control. While the actual results for a particular construction project are accurately reported over time, variances between the budgeted and actual costs of a project could result in the understatement or overstatement of construction and land costs and homebuilding gross profits in a particular reporting period. To reduce the potential for such distortion, we have set forth procedures that collectively comprise a “criticalcritical accounting policy.” These procedures, which we have applied on a consistent basis, include assessing, updating and revising project budgets on a monthly basis, obtaining commitments from independent subcontractors and vendors for future costs to be incurred, reviewing the adequacy of warranty accruals and historical warranty claims experience, and utilizing the most current information available to estimate construction and land costs to be charged to expense. Variances to the budgeted costs after an estimate has been charged to expense that are related to project costs are generally allocated on a relative fair value basis to the remaining homes to be delivered within the community or land parcel, while such variances related to direct construction costs are generally expensed as incurred. The variances between budgeted and actual costs have historically not been material to our consolidated financial statements. We believe that our policies provide for reasonably dependable estimates to be used in the calculation and reporting of construction and land costs.
Inventory Impairments and Land Option Contract Abandonments. As discussed in Note 6. Inventory Impairments and Land Option Contract Abandonments in the Notes to Consolidated Financial Statements in this report, eEach community or land parcel in our owned inventory is assessed to determine if indicators of potential impairment exist. Impairment indicators are assessed separately for each community or land parcel on a quarterly basis and include, but are not limited to:to, the following: significant decreases in net orders, average selling prices, volume of homes delivered, gross profit margins on homes delivered or projected gross profit margins on homes in backlog or future housing sales;deliveries; significant increases in budgeted land development and home construction costs or cancellation rates; or projected losses on expected future land sales. If indicators of potential impairment exist for a community or land parcel, the identified asset is evaluated for recoverability in accordance with ASC 360.recoverability.
The following table presents information regarding inventory impairment and land option contract abandonment charges included in construction and land costs in our consolidated statements of operations (dollars in thousands):
| | | | Years Ended November 30, | Years Ended November 30, |
| | 2012 | | 2011 | | 2010 | 2015 | | 2014 | | 2013 |
| Inventory impairments: | | | | | | | | | | |
| Number of communities or land parcels evaluated for recoverability (a) | 135 |
| | 138 |
| | 118 |
| 35 |
| | 32 |
| | 31 |
|
| Number of communities or land parcels impaired (b) | 14 |
| | 12 |
| | 8 |
| |
| Carrying value of communities or land parcels evaluated for recoverability (a) | | $ | 286,333 |
| | $ | 266,850 |
| | $ | 145,980 |
|
| | | | | | | | | | | |
| Pre-impairment carrying value of communities or land parcels impaired | $ | 67,958 |
| | $ | 56,752 |
| | $ | 21,385 |
| |
| Inventory impairment charges (b) | (28,107 | ) | | (22,730 | ) | | (9,815 | ) | |
| Number of communities or land parcels written down to fair value | | 4 |
| | 8 |
| | 1 |
|
| Pre-impairment carrying value of communities or land parcels written down to fair value | | $ | 20,018 |
| | $ | 68,223 |
| | $ | 1,534 |
|
| Inventory impairment charges | | (8,030 | ) | | (37,628 | ) | | (391 | ) |
| Post-impairment fair value | $ | 39,851 |
| | $ | 34,022 |
| | $ | 11,570 |
| $ | 11,988 |
| | $ | 30,595 |
| | $ | 1,143 |
|
| | | | | | | | | | | |
| Land option contract abandonment charges: | | | | | | | | | | |
| Number of lots abandoned | 446 |
| | 830 |
| | 1,007 |
| 1,166 |
| | 1,306 |
| | 295 |
|
| Land option contract abandonment charges | $ | 426 |
| | $ | 3,061 |
| | $ | 10,110 |
| $ | 1,561 |
| | $ | 1,803 |
| | $ | 3,190 |
|
| |
| (a) | As impairment indicators are assessed on a quarterly basis, some of the communities or land parcels evaluated during the years ended November 30, 2012, 20112015, 2014 and 20102013 were evaluated in more than one quarterly period. |
| |
(b) | The inventory impairment charges we recorded during 2012, 2011 and 2010 reflected challenging economic and housing market conditions in certain of our served markets. In addition, the inventory impairment charges in 2012 were partly due to changes to our operational or selling strategy for certain communities in an effort to accelerate our return on investment. The inventory impairment charges in 2011 also included an $18.1 million adjustment to the fair value of real estate collateral in our Southwest homebuilding reporting segment that we took back on a note receivable. In some cases, we have recognized impairment charges for particular communities Communities or land parcels evaluated for recoverability in multiple years.
more than one quarterly period, if any, are counted only once for each year shown. |
When an indicator of potential impairment is identified for a community or land parcel, we test the asset for recoverability by comparing the carrying value of the asset to the undiscounted future net cash flows expected to be generated by the asset. The undiscounted future net cash flows are impacted by then-current conditions and trends in the market in which the asset is located as well as factors known to us at the time the cash flows are calculated. With the undiscounted future net cash flows, we also consider recent trends in our orders, backlog, cancellation rates and volume of homes delivered, as well as our expectations related to the following: product offerings; market supply and demand, including estimated average selling prices and related price appreciation; and land development, home construction and overhead costs to be incurred and related cost inflation.With respect to the year ended November 30, 2012, these expectations reflected our experience that, although there were at times measurable quarterly fluctuations in our year-over-year and sequential net orders, backlog levels and housing gross profit margin, these were primarily due to certain period-specific and/or company-specific factors that we believed would be largely mitigated by various strategic actions and/or by observed market trends. These factors included mortgage loan funding issues arising from a change in the nature of our relationships with mortgage lenders; the before and after effects of the Tax Credit that expired in 2010; and a lower community count as a result of our strategic repositioning efforts. We believe the impact of these factors was moderated by our operational transition to our new preferred mortgage lender; our strategic growth initiatives; and our continued ability to generate a consistent or higher average selling price as a result of the demand from our homebuyers for larger home sizes and more design options. By comparison, market conditions for our assets in inventory where impairment indicators were identified have been generally stable in 2011 and 2012, with no significant or sustained deterioration identified as to revenue and cost drivers that would prevent or otherwise impact recoverability. Based on this experience, and taking into account the signs of stability and improvement in many markets for new home sales, our inventory assessments as of November 30, 2012 considered an expected steady, if slightly improved, overall sales pace and average selling price performance for 2013 relative to the pace and performance in recent quarters.
Given the inherent challenges and uncertainties in forecasting future results, our inventory assessments at the time they are made take into consideration whether a community or land parcel is active, meaning whether it is open for sales and/or undergoing development, or whether it is being held for future development. ForDue to the short-term nature of active communities and land parcels due to their short-term nature as compared to land held for future development, our inventory assessments generally assume the continuation of then-current market conditions, subject to identifying information suggesting a significant sustained deterioration or other changes in
such conditions. These assessments, at the time made, generally anticipate net orders, average selling prices, volume of homes delivered and costs for land development and home construction to continue at or near then-current levels through the affectedparticular asset’s estimated remaining life. Inventory assessments for our land held for future development consider then-current market conditions as well as subjective forecasts regarding the timing and costs of land development and home construction and related cost inflation; the product(s) to be offered; and the net orders, volume of homes delivered, and selling prices and related price appreciation of the offered product(s) when an associated community is anticipated to open for sales. We evaluate various factors to develop these forecasts, including the availability of and demand for homes and finished lots within the relevant marketplace; historical, current and expected future sales trends for the marketplace; and third-party data, if available. These various estimates, trends, expectations and assumptions used in each of our inventory assessments are specific to each community or land parcel based on what we believe are reasonable forecasts for performance and may vary among communities or land parcels and may vary over time.
We record an inventory impairment charge when the carrying value of a real estate asset is greater than the undiscounted future net cash flows the asset is expected to generate. These real estate assets are written down to fair value, which is primarily based on the estimated future net cash flows discounted for inherent risk associated with each such asset. Inputs used in theour calculation of estimated discounted future net cash flows are specific to each affected community or land parcelreal estate asset and are based on our expectations for each such asset as of the applicable measurement date, including, among others, expectations related to average selling prices and delivery rates.volume of homes delivered. The discount rates used in our estimated discounted cash flows ranged from 17% to 20% during 2012, 20112015, 2014 and 2010.2013. The discount rates we use areused were impacted by the following:following at the time the calculation was made: the risk-free rate of return; expected risk premium based on estimated land development, home construction and delivery timelines; market risk from potential future price erosion; cost uncertainty due to land development or home construction cost increases; and other risks specific to the asset or conditions in the market in which the asset is locatedlocated.
Inventories associated with planned future land sales are stated at the time the assessment was made.lower of cost or fair value less costs to sell. The estimated fair value of such assets is generally based on an executed contract, broker quotes or similar information.
As of November 30, 2012,2015, the aggregate carrying value of our inventory that had been impacted by inventory impairment charges was $307.2$254.2 million,, representing 4628 communities and various other land parcels. As of November 30, 2011,2014, the aggregate carrying value of our inventory that had been impacted by inventory impairment charges was $338.5$266.6 million,, representing 5333 communities and various other land parcels.
Our inventory controlled under land option contracts and other similar contracts is assessed to determine whether it continues to meet our internal investment and marketing standards. Assessments are made separately for each optioned land parcel on a quarterly basis and are affected by the following factors relative to the market in which the asset is located, among others: current and/or anticipated net orders, average selling prices and home delivery volume;volume of homes delivered; estimated land development and home construction costs; and projected profitability on expected future housing or land sales. When a decision is made not to exercise certain land option contracts and other similar contracts due to market conditions and/or changes in our marketing strategy, we write off the related inventory costs, including non-refundable deposits and unrecoverable pre-acquisition costs.
The estimated remaining life of each community or land parcel in our inventory depends on various factors, such as the total number of lots remaining; the expected timeline to acquire and entitle land and develop lots to build homes; the anticipated future net order and cancellation rates; and the expected timeline to build and deliver homes sold. While it is difficult to determine a precise timeframe for any particular inventory asset, we estimate our inventory assets’ remaining operating lives under current and expected future market conditions to range generally from one year to in excess of 10 years. Basedbased on current market conditions and expected delivery timelines, we estimate our inventory assets’ remaining operating lives to range generally from one year to in excess of 10 years and expect to
realize, on an overall basis, the majority of our current inventory balance within five years. The following table presents our inventory balance as of November 30, 2012,2015, based on our current estimated timeframe of delivery for the last home within an applicable community or land parcel (in millions):
|
| | | | | | | | | | | | | | | | | | | |
| | 0-2 years | | 3-5 years | | 6-10 years | | Greater than 10 years | | Total |
| Inventories as of November 30, 2012 | $ | 731.5 |
| | $ | 357.6 |
| | $ | 453.1 |
| | $ | 164.4 |
| | $ | 1,706.6 |
|
|
| | | | | | | | | | | | | | | | | | | |
| | 0-2 years | | 3-5 years | | 6-10 years | | Greater than 10 years | | Total |
| Inventories | $ | 1,466.8 |
| | $ | 1,357.7 |
| | $ | 341.5 |
| | $ | 147.7 |
| | $ | 3,313.7 |
|
The inventory balancebalances in the six to 100-2 years category as of November 30, 2012 wasand 3-5 years categories were located throughout all of our homebuilding reporting segments, though mostly in our West Coast and SouthwestCentral homebuilding reporting segments, and collectively represented 85% of our total inventory balance at November 30, 2015. The inventory balance in the 6-10 years category as of November 30, 2015 was located across all of our homebuilding reporting segments. The inventory balance in the greater than 10 years category as of November 30, 20122015 was mainlyprimarily located in our West Coast Southwest, and SoutheastSouthwest homebuilding reporting segments. The inventory balances in the six to 106-10 years and greater than 10 years categories which collectively represented 36% of our total inventory at November 30, 2012, were primarily comprised of land held for future development.
Due to the judgment and assumptions applied in the estimation process with respect toour inventory impairments,impairment and land option contract abandonments,abandonment assessment processes, and in our estimations of the remaining operating lives of our inventory assets and the realization of our inventory balances, particularly as to land held for future development, it is possible that actual results could differ substantially from those estimated.
Deterioration in the supply and demand factors in the overall housing market or in an individual market or submarket, or changes to our operational or selling strategy at certain communities may lead to additional inventory impairment charges, future charges associated with land sales or the abandonment of land option contracts or other similar contracts related to certain assets. Due to the nature or location of the projects, land held for future development that we activate as part of our strategic growth initiatives or to accelerate sales and/or our return on investment may have a somewhat greater likelihood of being impaired than other of our active inventory.
We believe that the carrying value of our inventory balance as of November 30, 20122015 is recoverable. Our considerations in making this determination include the factors and trends incorporated into our impairment analyses, and as applicable, the prevailing
regulatory environment, competition from other homebuilders, inventory levels and sales activity of resale homes, (including lender-owned homes), and the local economic conditions where an asset is located. In addition, we consider the financial and operational status and expectations of our inventories as well as unique attributes of each community or land parcel that could be viewed as indicators for potential future impairments. However, if conditions in the overall housing market or in a specific marketsmarket or submarket worsen in the future beyond our current expectations, if future changes in our marketing strategy significantly affect any key assumptions used in our projections of future cash flows, or if there are material changes in any of the other items we consider in assessing recoverability, we may recognize charges in future periods for inventory impairments or land option contract abandonments, or both, related to our current inventory assets. Any such charges could be material to our consolidated financial statements.
Fair Value Measurements. As discussed in Note 7. Fair Value Disclosures in the Notes to Consolidated Financial Statements in this report, Accounting Standards Codification Topic No. 820, “Fair Value Measurements and Disclosures,” (“ASC 820”) provides a framework for measuring the fair value of assets and liabilities under GAAP, and establishes a fair value hierarchy that requires an entity to maximize the use of observable inputs and minimize the use of unobservable inputs when measuring fair value. The fair value hierarchy can be summarized as follows:
| |
Level 1 | Fair value determined based on quoted prices in active markets for identical assets or liabilities. |
| |
Level 2 | Fair value determined using significant observable inputs, such as quoted prices for similar assets or liabilities or quoted prices for identical or similar assets or liabilities in markets that are not active, inputs other than quoted prices that are observable for the asset or liability, or inputs that are derived principally from or corroborated by observable market data, by correlation or other means. |
| |
Level 3 | Fair value determined using significant unobservable inputs, such as pricing models, discounted cash flows, or similar techniques. |
Fair value measurements are used for inventories on a nonrecurring basis when events and circumstances indicate the carrying value is not recoverable.The fair values for our long-lived assets held and used that were determined using Level 2 inputs were based on an executed contract. The fair values for long-lived assets held and used that were determined using Level 3 inputs were primarily based on the estimated future net cash flows discounted for inherent risk associated with each asset as described in Note 6. Inventory Impairments and Land Option Contract Abandonments in the Notes to Consolidated Financial Statements in this report. The discount rates we use are impacted by the following: the risk-free rate of return; expected risk premium based on estimated land development, home construction and delivery timelines; market risk from potential future price erosion; cost uncertainty due to land development or home construction cost increases; and other risks specific to the asset or conditions in the market in which the asset is located at the time the assessment was made. These factors were specific to each affected community or land parcel and may have varied among communities or land parcels. Due to uncertainties in the estimation process, it is possible that actual results could differ from those estimated.
Our financial instruments consist of cash and cash equivalents, restricted cash, mortgages and notes receivable, senior notes, and mortgages and land contracts due to land sellers and other loans. Fair value measurements of financial instruments are determined by various market data and other valuation techniques, as appropriate. When available, we use quoted market prices in active markets to determine fair value.
Warranty Costs. As discussed in Note 13. Commitments and Contingencies in the Notes to Consolidated Financial Statements in this report, we We provide a limited warranty on all of our homes.The specific terms and conditions of theseour limited warrantieswarranty program vary depending upon the markets in which we do business. We generally provide a structural warranty of 10 years, a warranty on electrical, heating, cooling, plumbing and other building systems each varying from two to five years based on geographic market and state law, and a warranty of one year for other components of the home. We estimate the costs that may be incurred under each limited warranty and record a liability in the amount of such costs at the time the revenue associated with the sale of each home is recognized. Our expense associated with In assessing our overall warranty liability at a reporting date, we evaluate the issuancecosts for warranty-related items on a combined basis for all of these warranties totaled $8.4 million in 2012, $4.9 million in 2011 and $5.2 million in 2010.our previously delivered homes that are under our limited warranty program.
Our primary assumption in estimating the amounts we accrue for warranty costs is that historical claims experience is a strong indicator of future claims experience. Factors that affect our warranty liability include the number of homes delivered, historical and anticipated rates of warranty claims, and cost per claim. We periodically assess the adequacy of our accrued warranty liability,, which is included in accrued expenses and other liabilities in theour consolidated balance sheets, and adjust the amount as necessary based on our assessment.Our assessment includes the review of our actual warranty costs incurred to identify trends and changes in our warranty claims experience, and considers our home construction quality and customer service initiatives and outside events. Based on our assessments, we determined that our overall warranty liability at each reporting date was sufficient to cover our overall warranty obligations on previously delivered homes that are under our limited warranty. Additionally, based on our assessment of the trends in our warranty claims experience, and taking into account the decrease in the overall number of homes
we have delivered over the past several years before 2012 and the steady reduction in our estimated remaining repair costs and actual repair costs incurred for homes identified as affected or potentially affected by the allegedly defective drywall, we recorded favorable warranty adjustments of $11.2 million in the second quarter of 2012 and $7.4 million in the third quarter of 2011, as reductions to construction and land costs in our consolidated statements of operations in those periods. As of November 30, 2012, based on our assessment of our overall warranty liability on a combined basis for all of our previously delivered homes that are under our limited warranty, including the homes identified as affected or potentially affected by the allegedly defective drywall and the increased number of homes potentially affected by water intrusion-related issues, we recorded an adjustment to increase our overall warranty liability by $2.6 million in the fourth quarter of 2012 with a corresponding charge to construction and land costs in our consolidated statement of operations.
While we believe the warranty liability currently reflected in our consolidated balance sheets to be adequate, unanticipated changes or developments in the legal environment, local weather, land or environmental conditions, quality of materials or methods used in the construction of homes or customer service practices and our warranty claims experience could have a significant impact on our actual warranty costs in the future periods and such amounts could differ significantly from our current estimates. A 10% change in the historical warranty rates used to estimate our warranty accrual would not result in a material change in our accrual.
Insurance.Self-Insurance. As discussed in Note 13. Commitments and Contingencies in the Notes to Consolidated Financial Statements in this report, weWe maintain, and require the majority of our independent subcontractors to maintain, general liability insurance (including construction defect and bodily injury coverage) and workers’ compensation insurance. These insurance policies protect
us against a portion of our risk of loss from claims related to our homebuilding activities, subject to certain self-insured retentions, deductibles and other coverage limits. In Arizona, California, Colorado and Nevada, our subcontractors' general liability insurance primarily takes the form of a wrap-up policy, where eligible subcontractors are enrolled as insureds on each project.We self-insure a portion of our overall risk through the use of a captive insurance subsidiary. We also maintain certain other insurance policies. In Arizona, California, Colorado and Nevada, our subcontractors’ general liability insurance primarily takes the form of a wrap-up policy, where eligible independent subcontractors are enrolled as insureds on each project. Enrolled subcontractors contribute toward the cost of the insurance and agree to pay a contractual amount in the future if there is a claim related to their work.
We record expenses and liabilities based on the estimated costs required to cover our self-insured retention and deductible amounts under our insurance policies, and the estimated costs of potential claims and claim adjustment expenses that are above our coverage limits or that are not covered by our insurance policies. These estimated costs are based on an analysis of our historical claims and industry data, and include an estimate of construction defect claims incurred but not yet reported. Our estimated liabilities for such items were $93.3 million at November 30, 2012 and $94.9 million at November 30, 2011. These amounts are included in accrued expenses and other liabilities in our consolidated balance sheets. Our expenses associated with self-insurance totaled $8.7 million in 2012, $7.2 million in 2011 and $7.4 million in 2010. These expenses were largely offset by contributions from subcontractors participating in the wrap-up policy.
We engage a third-party actuary that uses our historical claim and expense data, as well as industry data, to estimate our liabilities related to unpaid claims, claim adjustment expenses, third-party recoveries and incurred but not yet reported claims liabilities forassociated with the risks that we are assuming underwith respect to our self-insurance. Projectionself-insurance and insurance policy deductibles. These estimates are subject to uncertainty due to a variety of factors, the most significant being the long period of time between the delivery of a home to a homebuyer and when a structural warranty or construction defect claim may be made, and the ultimate resolution of any such construction defect claim. Though state regulations vary, structural warranty or construction defect claims can be reported and resolved over a long period of time, which can extend for 10 years or more. As a result, the majority of the estimated liability relates to incurred but not yet reported claims and thus, adjustments related to individual existing claims generally do not significantly impact the overall estimated liability. Adjustments to our liabilities related to homes delivered in prior years are recorded in the period in which a change in our estimate occurs.
The projection of losses related to these liabilities requires the use of actuarial assumptions. Key assumptions thatused in these estimates include claim frequencies, severities and resolution patterns, which can occur over an extended period of time. These estimates are subject to variability due to the length of time between the delivery of a home to a homebuyer and when a structural warranty or construction defect claim is made, and the ultimate resolution of such claim; uncertainties regarding construction defectsuch claims relative to our markets and the types of product we build, claim settlement patterns,build; insurance industry practicespractices; and legal or regulatory actions and/or interpretations, among other factors. Because ofDue to the degree of judgment requiredinvolved and the potential for variability in thethese underlying assumptions, used in determining these estimated liability amounts,our actual future costs could differ from those estimated. In addition, changes in the frequency and severity of reported claims and the estimates to resolve claims can impact the trends and assumptions used in the actuarial analysis, which could be material to our estimated amounts.consolidated financial statements. Based on the actuarial analysis performed, we believe it is reasonably possible that our losses related to construction defect claims as of November 30, 2015 could range from $65 million to $95 million; however, there can be no assurance that the actual costs will fall within this range and they could be higher.
Stock-Based Compensation. As discussed in Note 1. Summary of Significant Accounting Policies in the Notes to Consolidated Financial Statements in this report, weWe measure and recognize compensation expense associated with our grantgrants of equity-based awards in accordance with Accounting Standards Codification Topic No. 718, “Compensation—Stock Compensation” (“ASC 718”), which requires that companies measure and recognize compensation expense at an amount equal to the fair value of such share-based payments granted under compensation arrangements over thetheir applicable vesting period. As discussed in Note 17. Employee Benefit and Stock Plans in the Notes to Consolidated Financial Statements in this report, we We have provided some compensation benefits to certain of our employees and non-employee directors in the form of stock options, restricted stock, performance-based restricted stock units (each a “PSU”), phantom shares and stock appreciation rights (“SARs”). Determining the fair value of share-based awards requires judgment to identify the appropriate valuation model and develop the assumptions to be used in the calculation, including the expected term of the stock options or SARs, expected stock-price volatility and dividend yield, to be used in the calculation. Judgment is also required in estimating the percentage of share-based awards that are expected to vest.yield. We estimate the fair value of stock options and SARs granted using the Black-Scholes option-pricing model with assumptions based primarily on historical data. The expected volatility factor wasis based on a combination of the historical volatility of our common stock and the implied volatility of publicly traded options on our common stock. Additionally, judgment is required in estimating the percentage of share-based awards that are expected to vest, and in the case of PSUs, the level of performance that will be achieved and the number of shares that will be earned. If actual results differ significantly from these estimates, stock-based compensation expense could be higher and have a material impact on our consolidated financial statements could be materially impacted.statements.
Income Taxes. As discussed in Note 1. Summary of Significant Accounting Policies12. Income Taxes in the Notes to the Consolidated Financial Statements in this report, we account for income taxes in accordance with ASC 740. The provision for, or benefit from, income taxes is calculated using the asset and liability method, under whichevaluate our deferred tax assets and liabilities are recorded based on the difference between the financial statement and tax basis of assets and liabilities using enacted tax rates in effect for the year in
which the differences are expected to reverse. Deferred tax assets are evaluated on a quarterly basis to determine if adjustments to theour valuation allowance are required. In accordance with ASC 740, we assess whether a valuation allowance should be establishedrequired based on the consideration of all available positive and negative evidence using a “more likely than not” standard with respect to whether deferred tax assets will be realized. This evaluation considers, among other factors, our historical operating results, our expectation of future profitability, the duration of the applicable statutory carryforward periods, and conditions in the housing market and the broader economy. The ultimate realization of our deferred tax assets depends primarily on the generation ofour ability to generate future taxable income during the periods in which the related temporary differences in the financial basis and the tax basis of the assets become deductible. The value of our deferred tax assets will dependdepends on applicable income tax rates. We base our estimate of deferred tax assets and liabilities on current tax laws and rates. In certain cases, we also base this estimate on business plan forecasts and other expectations about future outcomes. Changes in positive and negative evidence, including differences between our future operating results and estimates, could result in the establishment of an additional valuation allowance against our deferred tax assets. Accounting for deferred taxes is based upon estimates of future results. Judgment is required in determining the future tax
consequences of events that have been recognized in our consolidated financial statements and/or tax returns. Differences between the anticipated and actual outcomes of these future tax consequencesresults could have a material impact on our consolidated financial statements. Also, changes in existing federal and state tax laws and tax rates could affect future tax results and the valuation allowance against our deferred tax assets.
As discussed in Note 15. Income Taxes in the Notes to Consolidated Financial Statements in this report, wWe recognize accrued interest and penalties related to unrecognized tax benefits in our consolidated financial statements as a component of the provision for or benefit from income taxes. Our liability for unrecognized tax benefits, combined with accrued interest and penalties, is reflected as a component of accrued expenses and other liabilities in our consolidated balance sheets. Judgment is required in evaluating uncertain tax positions. We evaluate our uncertain tax positions quarterly based on various factors, including changes in facts or circumstances, tax laws or the status of audits by tax authorities. Changes in the recognition or measurement of uncertain tax positions could have a material impact on our consolidated financial statements in the period in which we make the change.
RECENT ACCOUNTING PRONOUNCEMENTS
In May 2011, the FinancialRecent accounting pronouncements are discussed in Note 1. Summary of Significant Accounting Standards Board (“FASB”) issued Accounting Standards Update No. 2011-04, “Amendments to Achieve Common Fair Value Measurement and Disclosure Requirements in GAAP and IFRS” (“ASU 2011-04”), which changes the wording used to describe the requirements in GAAP for measuring fair value and for disclosing information about fair value measurements in order to improve consistencyPolicies in the application and description of fair value between GAAP and InternationalNotes to Consolidated Financial Reporting Standards. ASU 2011-04 clarifies how the concepts of highest and best use and valuation premiseStatements in a fair value measurement are relevant only when measuring the fair value of nonfinancial assets and are not relevant when measuring the fair value of financial assets or liabilities. In addition, the guidance expanded the disclosures for the unobservable inputs for Level 3 fair value measurements, requiring quantitative information to be disclosed related to (1) the valuation processes used, (2) the sensitivity of recurring fair value measurements to changes in unobservable inputs and the interrelationships between those unobservable inputs, and (3) use of a nonfinancial asset in a way that differs from the asset’s highest and best use. The revised guidance was effective for interim and annual periods beginning after December 15, 2011. Our adoption of this guidance as of March 1, 2012 did not have a material impact on our consolidated financial position or results of operations.
In June 2011, the FASB issued Accounting Standards Update No. 2011-05, “Presentation of Comprehensive Income” (“ASU 2011-05”). The amendments in ASU 2011-05 allow an entity the option to present the total of comprehensive income, the components of net income, and the components of other comprehensive income either in a single continuous statement of comprehensive income or in two separate but consecutive statements. In both instances, an entity is required to present each component of net income along with total net income, each component of other comprehensive income along with a total for other comprehensive income, and a total amount for comprehensive income. ASU 2011-05 eliminates the option to present the components of other comprehensive income as part of the statement of changes in stockholders’ equity. The amendments in ASU 2011-05 do not change the items that must be reported in other comprehensive income or when an item of other comprehensive income must be reclassified to net income. However, in December 2011, the FASB issued Accounting Standards Update No. 2011-12, “Deferral of the Effective Date for Amendments to the Presentation of Reclassifications of Items Out of Accumulated Other Comprehensive Income in Accounting Standards Update No. 2011-05” (“ASU 2011-12”), which deferred the guidance on whether to require entities to present reclassification adjustments out of accumulated other comprehensive income by component in both the statement where net income is presented and the statement where other comprehensive income is presented for both interim and annual financial statements. ASU 2011-12 reinstated the requirements for the presentation of reclassifications that were in place prior to the issuance of ASU 2011-05 and did not change the effective date for ASU 2011-05. For public entities, the amendments in ASU 2011-05 and ASU 2011-12 are effective for fiscal years, and interim periods within those years, beginning after December 15, 2011, and should be applied retrospectively. The adoption of this guidance concerns disclosure only and will not have an impact on our consolidated financial position or results of operations.report.
OUTLOOK
In 2012, several2016, we intend to remain focused on executing on our core strategies and further accelerating the momentum we generated in 2015. Based on our ending community count and backlog levels at November 30, 2015, we believe we are well-positioned to extend the upward trajectory of our business into 2016. We expect the generally favorable conditions in most of our served markets to continue, though likely to varying degrees, based on their current supply and demand dynamics and fundamental trends in population, demographic and household formation growth. However, the pace and strength of demand across our served markets, and in the overall U.S. housing markets acrossmarket, will largely depend on consumer employment, income and confidence levels as well as mortgage lending standards and interest rates. Our present outlook for 2016 is as follows:
We expect our full-year housing revenues to be in the country showed clear signsrange of recovery$3.35 billion to $3.65 billion, an increase from the severe$3.02 billion in 2015, driven by both a higher volume of homes delivered and a higher overall average selling price.
We expect to generate year-over-year improvement in our full-year housing downturn that begangross profit margin. This improvement is anticipated to result primarily through an increasing proportion of homes delivered from recently opened communities, which in mid-2006. Though home sales activity,many cases are projected to produce higher housing gross profit margins compared to those achieved in 2015; raising home selling prices as market conditions allow and housing starts remain below historically typical levelscapturing incremental revenue opportunities through various lot and product premiums, and design studio options and upgrades; containing increases in most markets, we believe the factors discussed above in this report, including gradually improving economic and job growth trends, suggest that the housing market turned a corner in 2012 and that we could be at the beginning of a new upward business cycle for homebuilding.
In adaptingdirect construction costs to the changing housing market dynamics of the past few years, we have broadly transformed the geographicextent feasible; and operational scope of our business through our execution on the three primary integrated strategic goals described above under “Part I — Item 1. Business — Strategy.” In our pursuit of these goals, we have expanded our investment in housing markets and submarkets that we believe offer the strongest growth prospects, based primarily on consumer preferences, population demographics and household formation activity; economic and employment infrastructure and trends; prevailing and expected home sales activity and home pricing trends; household income levels and availability of developable land at reasonable cost; and where we felt we could best leverage our scale, our KBnxt operational business model and experience to capitalize on identified opportunities. We believe we have builtdelivering a geographically diverse operational platform in largely higher-performing, choice locations featuring higher household incomes, become more efficient and strengthened our overall business relative to where we stood at the outset of the housing downturn, and are poised for growth if and as the present housing recovery continues to progress.
We believe our 2012 results demonstrate that our strategic approach is working. We generated year-over-year improvement in a number of key financialhomes, which will allow us to benefit from economies of scale and operational metrics, including revenues; homes delivered; net orders (reflecting an increase in average net orders per community in 2012, partly offset by an 18% year-over-year decrease inbetter operating leverage.
We expect our community count at the end of 2012); net order value; selling, general and administrative expense ratio;expenses as a percentage of revenues to improve on a year-over-year basis, continuing the trend of the past several years, due to our cost containment efforts and anticipated improved operating leverage from a higher volume of homes delivered and increased housing gross profit margin,revenues.
We currently own and control all of the lots needed to meet our current 2016 delivery forecasts and a majority of the lots we currently expect to need for 2017. In order to bolster our land pipeline to support further growth in our bottom line, with net incomecommunity count and revenues in future years, we anticipate investing in the third and fourth quarters. We have momentum heading into 2013, with 2,577 homes in backlog at November 30, 2012, a 20% increase over the previous year, and potential future housing revenues in backlogrange of $618.6 million, up 35% year over year. To build on our progress, we are planning additional investments$1.0 billion to $1.3 billion in land and land development (inclusive of fees) in 2016, subject to both housing market conditions and otherthe investment return potential relating to identified land acquisition opportunities. The anticipated investment level for 2016 considers our current capital allocation plans, including the share repurchase program that was recently approved by our board of directors, as further discussed in Note 24. Subsequent Event in the Notes to Consolidated Financial Statements in this report.
We plan to maintain a balanced approach in managing our financial strength and financial leverage as we pursue our strategic initiatives and seek to enhance stockholder returns. We also believe we will have the liquidity and flexibility to continue to invest in 2013our business in 2016 to further expandsupport future growth while also opportunistically repurchasing our business. Implementingoutstanding common stock (per our current strategic plans may also involve accessing the capital marketsboard authorization) and/or obtaining external financial resources, as further described below.
The healthier conditions in our served housing markets, albeit to varying degrees, werepotentially retiring a substantial contributor to our improved performance in 2012, and we anticipate that the positive trends we saw over the course of the year will continue in 2013. To take advantage of this environment, in 2012, we expanded on our primary strategic goals to target both profitability and growth and implemented the following four main strategic growth initiatives: (1) aggressively investing in land and land development in higher-performing, choice locations, reinforcing our strategic repositioning during the housing downturn; (2) optimizing our assets by increasing revenues per new home community open for sales through an intense focus on sales performance; (3) broadening our performing asset base by activating certain inventory in stabilizing markets that was previously held for future development; and (4) bringing additional resources to targeted markets where we operate to further strengthen our local field management teams and talent.
As part of our strategic growth initiatives, we intend to open additional new home communities for sales throughout 2013, and we plan to drive sales performance with these additional communities by maintaining one of the highest per-community sales rates in the homebuilding industry, as we have done for most of the last few years, and by generating higher selling prices where possible. We also plan to explore opportunities to obtain external debt and/or equity capital and/or enter into revolving credit facilities or other financing arrangements to support our current land acquisition and land development investment targets and for other business purposes and/or to effect repurchasesportion of our outstanding senior notes before their maturity (through open market or other debt.privately negotiated transactions) using internally generated cash.
With the strategic actions we have taken and the results we have achieved through the period of the housing downturn and in 2012, we believe that we are favorably situated to accomplish our top profitability and growth goals, particularly in view of the longer-term demographic and population growth trends that we expect will continue to drive future demand for homeownership in our served markets. In particular, we believe we are well-positioned in California, which accounted for nearly half of our 2012 revenues and where we are the largest homebuilder based on new home sales. California, with its large population base, diverse business ecosystem and desirable climate and lifestyle, is experiencing significant demand for housing and has a relatively limited supply of homes available for sale, and we believe we can use our competitive strengths and long history in the state to capitalize on these trends.
The strength and durability of the present housing recovery, ourOur future performance and the strategies we implement (and adjust or refine as necessary or appropriate) will depend significantly on prevailing economic and capital, credit and financial market conditions and on a fairly stable and constructive political and regulatory environment (particularly in regards to housing and mortgage loan financing policies), among other factors, and we caution that our quarterly results could fluctuate. We expect we will be profitable for 2013 and achieve solid growth in the years ahead if and as housing markets continue to improve and housing resumes its historical role of contributing to national economic growth.factors.
FORWARD-LOOKING STATEMENTS
Investors are cautioned that certain statements contained in this report, as well as some statements by us in periodic press releases and other public disclosures and some oral statements by us to securities analysts, stockholders and others during presentations, are “forward-looking statements” within the meaning of the Private Securities Litigation Reform Act of 1995 (the “Act”). Statements that are predictive in nature, that depend upon or refer to future events or conditions, or that include words such as “expects,” “anticipates,” “intends,” “plans,” “believes,” “estimates,” “hopes,” and similar expressions constitute forward-
lookingforward-looking statements. In addition, any statements that we may make or provide concerning future financial or operating performance (including, without limitation, future revenues, community count, homes delivered, net orders, selling prices, sales pace per new community, expenses, expense ratios, housing gross profits, housing gross profit margins, earnings or earnings per share, or growth or growth rates), future market conditions, future interest rates, and other economic conditions, ongoing business strategies or prospects, future dividends and changes in dividend levels, the value of our backlog (including amounts that we expect to realize upon delivery of homes included in our backlog and the timing of those deliveries), the value of our net orders, potential future asset acquisitions and the impact of completed acquisitions, future share issuances or repurchases, future debt issuances, repurchases or redemptions and other possible future actions which may be provided by us, are also forward-looking statements as defined by the Act. Forward-looking statements are based on our current expectations and projections about future events and are subject to risks, uncertainties, and assumptions about our operations, economic and market factors, and the homebuilding industry, among other things. These statements are not guarantees of future performance, and we have no specific policy or intention to update these statements. In addition, forward-looking and other statements in this report and in other public or oral disclosures that express or contain opinions, views or assumptions about market or economic conditions; the success, performance, effectiveness and/or relative positioning of our strategies, initiatives or operational activities; and other matters, may be based in whole or in part on general observations of our management, limited or anecdotal evidence and/or business or industry experience without in-depth or any particular empirical investigation, inquiry or analysis.
Actual events and results may differ materially from those expressed or forecasted in forward-looking statements due to a number of factors. The most important risk factors that could cause our actual performance and future events and actions to differ materially from such forward-looking statements include, but are not limited to the following:
general economic, employment and business conditions;
population growth, household formations and demographic trends;
adverse market conditions, including an increased supply of unsold homes, declining home prices and greater foreclosure and short sale activity, among other things, that could result in, among other negative impacts onnegatively affect our consolidated financial statements, including due to additional inventory impairment or land option contract abandonment charges, lower revenues and operating and other losses;
conditions in the capital, credit and financial markets (including mortgage lending standards, the availability of mortgage financing and mortgage foreclosure rates);
material prices and availability; labor
trade costs and availability;
changes in interest rates;
inflation;
our debt level, including our ratio of debt to total capital, and our ability to adjust our debt level, maturity schedule and structure and to access the equity, credit, capital or other financial markets or other external financing sources, including raising capital through the public or private issuance of common stock, debt or other securities, and/or obtaining a credit or similar facility or project financing, on favorable terms;
our compliance with the terms and covenants of the Credit Facility;
weak or declining consumer confidence, either generally or specifically with respect to purchasing homes;
competition for home sales from other sellers of new and resale homes, including lenders and other sellers of homes obtained through foreclosures or short sales;
the impact of weather conditions,events, significant natural disasters and other climate and environmental factors; factors, including the severe prolonged drought and related water-constrained conditions in the southwest United States and California;
government actions, policies, programs and regulations directed at or affecting the housing market (including but not limited to, the Dodd-Frank Act, tax credits, tax incentives and/or subsidies for home purchases, tax deductions for mortgage interest payments and property taxes, tax exemptions for profits on home sales, and programs intended to modify existing mortgage loans and to prevent mortgage foreclosures)foreclosures and the standards, fees and size limits applicable to the purchase or insuring of mortgage loans by government-sponsored enterprises and government agencies), the homebuilding industry, or construction activities;
decisions by lawmakers onregarding federal fiscal and monetary policies, including those relating to taxation, government spending, interest rates and government spending; economic stimulus measures;
the availability and cost of land in desirable areas;
our warranty claims experience with respect to homes previously delivered and actual warranty costs incurred;incurred, including our warranty claims and costs experience at certain of our communities in Florida;
costs and/or charges arising from regulatory compliance requirements or from legal, arbitral or regulatory proceedings, investigations, claims or claims; settlements, including unfavorable outcomes in any such matters resulting in actual or potential monetary damage awards, penalties, fines or other direct or indirect payments, or injunctions, consent decrees or other voluntary or involuntary restrictions or adjustments to our business operations or practices that are beyond our current expectations and/or accruals;
our ability to use/realize the net deferred tax assets we have generated;
our ability to successfully implement our current and planned strategies and initiatives with respect to product, geographic and market positioning (including but not limited to, our efforts to expand our inventory base/pipeline with desirable land positions or interests at reasonable cost and to expand our community count, open additional new home communities for sales, and sell higher-priced homes and more design options, increase the size and value of our backlog, and our operational and investment concentration in markets in California and Texas)California), revenue growth, asset optimization (including by effectively balancing home sales prices and sales pace in our communities), asset activation and/or monetization, local field management and talent investment, containing and leveraging overhead costs, gaining share and other cost management strategiesscale in our served markets and initiatives; increasing our housing gross profit margins and profitability;
consumer traffic to our new home communities and consumer interest in our product designs and offerings, particularly higher-income consumers;
cancellations and our ability to realize our backlog by converting net orders to home deliveries; deliveries and revenues;
our home sales and delivery performance, particularly in key markets in California and Texas; California;
our ability to generate cash from our operations, enhance our asset efficiency, increase our operating income margin and/or improve our return on invested capital;
the manner in which our homebuyers are offered and whether they are able to obtain mortgage loans and mortgage banking services, including from our preferred mortgage lender, Nationstar; HCM;
the performance of Nationstar as our preferred mortgage lender; HCM;
information technology failures and data security breaches; and
other events outside of our control.
| |
| Item 7A. | QUANTITATIVE AND QUALITATIVE DISCLOSURES ABOUT MARKET RISK |
We enter into debt obligations primarily to support general corporate purposes, including the operations of our subsidiaries. We are subject to interest rate risk on our senior notes. For fixed rate debt, changes in interest rates generally affect the fair value of the debt instrument, but not our earnings or cash flows. Under our current policies, we do not use interest rate derivative instruments to manage our exposure to changes in interest rates.
The following tables present principal cash flows by scheduled maturity, weighted average effective interest rates and the estimated fair value of our long-term fixed rate debt obligations as of November 30, 20122015 and 20112014 (dollars in thousands):
| | | | As of November 30, 2012 for the Years Ended November 30, | | Fair Value at November 30, 2012 | As of November 30, 2015 for the Years Ended November 30, | | Fair Value at November 30, 2015 |
| | 2013 | | 2014 | | 2015 | | 2016 | | 2017 | | Thereafter | | Total | | 2016 | | 2017 | | 2018 | | 2019 | | 2020 | | Thereafter | | Total | |
| Long-term debt | | | | | | | | | | | | | | | | | | | | | | | | | | | | | | |
| Fixed Rate | $ | — |
| | $ | 75,911 |
| | $ | 338,825 |
| | $ | — |
| | $ | 261,430 |
| | $ | 994,338 |
| | $ | 1,670,504 |
| | $ | 1,831,596 |
| $ | — |
| | $ | 265,000 |
| | $ | 300,000 |
| | $ | 630,000 |
| | $ | 350,000 |
| | $ | 1,050,000 |
| | $ | 2,595,000 |
| | $ | 2,589,872 |
|
| Weighted Average Interest Rate | — | % | | 5.8 | % | | 6.1 | % | | — | % | | 9.1 | % | | 7.6 | % | | 7.5 | % | | | |
| Weighted Average Effective Interest Rate | | — | % | | 9.5 | % | | 7.3 | % | | 3.5 | % | | 8.3 | % | | 7.3 | % | | 6.7 | % | | |
| | | | As of November 30, 2011 for the Years Ended November 30, | | Fair Value at November 30, 2011 | As of November 30, 2014 for the Years Ended November 30, | | Fair Value at November 30, 2014 |
| | 2012 | | 2013 | | 2014 | | 2015 | | 2016 | | Thereafter | | Total | | 2015 | | 2016 | | 2017 | | 2018 | | 2019 | | Thereafter | | Total | |
| Long-term debt | | | | | | | | | | | | | | | | | | | | | | | | | | | | | | |
| Fixed Rate | $ | — |
| | $ | — |
| | $ | 249,647 |
| | $ | 749,068 |
| | $ | — |
| | $ | 559,872 |
| | $ | 1,558,587 |
| | $ | 1,391,269 |
| $ | 199,906 |
| | $ | — |
| | $ | 265,000 |
| | $ | 300,000 |
| | $ | 630,000 |
| | $ | 1,150,000 |
| | $ | 2,544,906 |
| | $ | 2,698,565 |
|
| Weighted Average Interest Rate | — | % | | — | % | | 5.8 | % | | 6.1 | % | | — | % | | 8.1 | % | | 6.8 | % | | | |
| Weighted Average Effective Interest Rate | | 6.3 | % | | — | % | | 9.5 | % | | 7.3 | % | | 3.5 | % | | 7.5 | % | | 6.6 | % | | |
| |
| Item 8. | FINANCIAL STATEMENTS AND SUPPLEMENTARY DATA |
KB HOME
INDEX TO CONSOLIDATED FINANCIAL STATEMENTS
Separate combined financial statements of our unconsolidated joint venture activities have been omitted because, if considered in the aggregate, they would not constitute a significant subsidiary as defined by Rule 3-09 of Regulation S-X.
KB HOME
CONSOLIDATED STATEMENTS OF OPERATIONS
(In Thousands, Except Per Share Amounts)
| | | | Years Ended November 30, | Years Ended November 30, |
| | 2012 | | 2011 | | 2010 | 2015 | | 2014 | | 2013 |
| Total revenues | $ | 1,560,115 |
| | $ | 1,315,866 |
| | $ | 1,589,996 |
| $ | 3,032,030 |
| | $ | 2,400,949 |
| | $ | 2,097,130 |
|
| Homebuilding: | | | | | | | | | | |
| Revenues | $ | 1,548,432 |
| | $ | 1,305,562 |
| | $ | 1,581,763 |
| $ | 3,020,987 |
| | $ | 2,389,643 |
| | $ | 2,084,978 |
|
| Construction and land costs | (1,317,529 | ) | | (1,129,985 | ) | | (1,308,288 | ) | (2,539,368 | ) | | (1,985,651 | ) | | (1,737,086 | ) |
| Selling, general and administrative expenses | (251,159 | ) | | (247,886 | ) | | (289,520 | ) | (342,998 | ) | | (288,023 | ) | | (255,808 | ) |
| Loss on loan guaranty | — |
| | (30,765 | ) | | — |
| |
| Operating loss | (20,256 | ) | | (103,074 | ) | | (16,045 | ) | |
| Operating income | | 138,621 |
| | 115,969 |
| | 92,084 |
|
| Interest income | 518 |
| | 871 |
| | 2,098 |
| 458 |
| | 443 |
| | 792 |
|
| Interest expense | (69,804 | ) | | (49,204 | ) | | (68,307 | ) | (21,856 | ) | | (30,750 | ) | | (62,690 | ) |
| Equity in loss of unconsolidated joint ventures | (394 | ) | | (55,839 | ) | | (6,257 | ) | |
| Homebuilding pretax loss | (89,936 | ) | | (207,246 | ) | | (88,511 | ) | |
| Equity in income (loss) of unconsolidated joint ventures | | (1,804 | ) | | 741 |
| | (2,007 | ) |
| Homebuilding pretax income | | 115,419 |
| | 86,403 |
| | 28,179 |
|
| Financial services: | | | | | | | | | | |
| Revenues | 11,683 |
| | 10,304 |
| | 8,233 |
| 11,043 |
| | 11,306 |
| | 12,152 |
|
| Expenses | (2,991 | ) | | (3,512 | ) | | (3,119 | ) | (3,711 | ) | | (3,446 | ) | | (3,042 | ) |
| Equity in income/gain on wind down of unconsolidated joint venture | 2,191 |
| | 19,286 |
| | 7,029 |
| |
| Equity in income of unconsolidated joint ventures | | 4,292 |
| | 686 |
| | 1,074 |
|
| Financial services pretax income | 10,883 |
| | 26,078 |
| | 12,143 |
| 11,624 |
| | 8,546 |
| | 10,184 |
|
| Total pretax loss | (79,053 | ) | | (181,168 | ) | | (76,368 | ) | |
| Income tax benefit | 20,100 |
| | 2,400 |
| | 7,000 |
| |
| Net loss | $ | (58,953 | ) | | $ | (178,768 | ) | | $ | (69,368 | ) | |
| Basic and diluted loss per share | $ | (.76 | ) | | $ | (2.32 | ) | | $ | (.90 | ) | |
| Basic and diluted average shares outstanding | 77,106 |
| | 77,043 |
| | 76,889 |
| |
| Total pretax income | | 127,043 |
| | 94,949 |
| | 38,363 |
|
| Income tax benefit (expense) | | (42,400 | ) | | 823,400 |
| | 1,600 |
|
| Net income | | $ | 84,643 |
| | $ | 918,349 |
| | $ | 39,963 |
|
| Earnings per share: | | | | | | |
| Basic | | $ | .92 |
| | $ | 10.26 |
| | $ | .48 |
|
| Diluted | | $ | .85 |
| | $ | 9.25 |
| | $ | .46 |
|
| Weighted average shares outstanding: | | | | | | |
| Basic | | 92,054 |
| | 89,265 |
| | 82,630 |
|
| Diluted | | 102,857 |
| | 99,314 |
| | 91,559 |
|
See accompanying notes.
KB HOME
CONSOLIDATED STATEMENTS OF COMPREHENSIVE INCOME
(In Thousands)
|
| | | | | | | | | | | |
| | Years Ended November 30, |
| | 2015 | | 2014 | | 2013 |
| Net income | $ | 84,643 |
| | $ | 918,349 |
| | $ | 39,963 |
|
| Other comprehensive income (loss): | | | | | |
| Postretirement benefit plan adjustments: | | | | | |
| Net actuarial gain (loss) arising during the period | 3,745 |
| | (3,801 | ) | | 7,083 |
|
| Amortization of net actuarial loss | 848 |
| | 357 |
| | 1,803 |
|
| Amortization of prior service cost | 1,556 |
| | 1,556 |
| | 1,556 |
|
| Other comprehensive income (loss) before tax | 6,149 |
| | (1,888 | ) | | 10,442 |
|
| Income tax expense related to items of other comprehensive income | (2,460 | ) | | (1,604 | ) | | — |
|
| Other comprehensive income (loss), net of tax | 3,689 |
| | (3,492 | ) | | 10,442 |
|
| Comprehensive income | $ | 88,332 |
| | $ | 914,857 |
| | $ | 50,405 |
|
See accompanying notes.
Table of Contents
KB HOME
CONSOLIDATED BALANCE SHEETS
(In Thousands, Except Shares)
| | | | November 30, | November 30, |
| | 2012 | | 2011 | 2015 | | 2014 |
| Assets | | | | | | |
| Homebuilding: | | | | | | |
| Cash and cash equivalents | $ | 524,765 |
| | $ | 415,050 |
| $ | 559,042 |
| | $ | 356,366 |
|
| Restricted cash | 42,362 |
| | 64,481 |
| 9,344 |
| | 27,235 |
|
| Receivables | 64,821 |
| | 66,179 |
| 152,682 |
| | 125,488 |
|
| Inventories | 1,706,571 |
| | 1,731,629 |
| 3,313,747 |
| | 3,218,387 |
|
| Investments in unconsolidated joint ventures | 123,674 |
| | 127,926 |
| 71,558 |
| | 79,441 |
|
| Deferred tax assets, net | | 782,196 |
| | 825,232 |
|
| Other assets | 95,050 |
| | 75,104 |
| 112,774 |
| | 114,915 |
|
| | 2,557,243 |
| | 2,480,369 |
| 5,001,343 |
| | 4,747,064 |
|
| Financial services | 4,455 |
| | 32,173 |
| 14,028 |
| | 10,486 |
|
| Total assets | $ | 2,561,698 |
| | $ | 2,512,542 |
| $ | 5,015,371 |
| | $ | 4,757,550 |
|
| | | | | | | |
| Liabilities and stockholders’ equity | | | | | | |
| Homebuilding: | | | | | | |
| Accounts payable | $ | 118,544 |
| | $ | 104,414 |
| $ | 183,770 |
| | $ | 172,716 |
|
| Accrued expenses and other liabilities | 340,345 |
| | 374,406 |
| 513,414 |
| | 409,882 |
|
| Mortgages and notes payable | 1,722,815 |
| | 1,583,571 |
| |
| Notes payable | | 2,625,536 |
| | 2,576,525 |
|
| | 2,181,704 |
| | 2,062,391 |
| 3,322,720 |
| | 3,159,123 |
|
| Financial services | 3,188 |
| | 7,494 |
| 1,817 |
| | 2,517 |
|
| Stockholders’ equity: | | | | | | |
| Preferred stock — $1.00 par value; authorized, 10,000,000 shares; none issued | — |
| | — |
| |
| Common stock — $1.00 par value; authorized, 290,000,000 shares at November 30, 2012 and 2011; 115,178,187 and 115,170,693 shares issued at November 30, 2012 and 2011, respectively | 115,178 |
| | 115,171 |
| |
| Preferred stock — $1.00 par value; 10,000,000 shares authorized; none issued | | — |
| | — |
|
| Common stock — $1.00 par value; 290,000,000 shares authorized at November 30, 2015 and 2014; 115,547,682 and 115,386,512 shares issued at November 30, 2015 and 2014, respectively | | 115,548 |
| | 115,387 |
|
| Paid-in capital | 888,579 |
| | 884,190 |
| 682,871 |
| | 668,857 |
|
| Retained earnings | 450,292 |
| | 519,844 |
| 1,466,713 |
| | 1,391,256 |
|
| Accumulated other comprehensive loss | (27,958 | ) | | (26,152 | ) | (17,319 | ) | | (21,008 | ) |
| Grantor stock ownership trust, at cost: 10,615,934 and 10,884,151 shares at November 30, 2012 and 2011, respectively | (115,149 | ) | | (118,059 | ) | |
| Treasury stock, at cost: 27,340,468 and 27,214,174 shares at November 30, 2012 and 2011, respectively | (934,136 | ) | | (932,337 | ) | |
| Grantor stock ownership trust, at cost: 10,135,461 and 10,335,461 shares at November 30, 2015 and 2014, respectively | | (109,936 | ) | | (112,106 | ) |
| Treasury stock, at cost: 13,136,563 and 13,097,140 shares at November 30, 2015 and 2014, respectively | | (447,043 | ) | | (446,476 | ) |
| Total stockholders’ equity | 376,806 |
| | 442,657 |
| 1,690,834 |
| | 1,595,910 |
|
| Total liabilities and stockholders’ equity | $ | 2,561,698 |
| | $ | 2,512,542 |
| $ | 5,015,371 |
| | $ | 4,757,550 |
|
See accompanying notes.
KB HOME
CONSOLIDATED STATEMENTS OF STOCKHOLDERS’ EQUITY
(In Thousands)
|
| | | | | | | | | | | | | | | | | | | | | | | | | | | | | | | | | | | | |
| | Years Ended November 30, 2012, 2011, and 2010 |
| | Number of Shares | | Common Stock | | Paid-in Capital | | Retained Earnings | | Accumulated Other Comprehensive Loss | | Grantor Stock Ownership Trust | | Treasury Stock | | Total Stockholders’ Equity |
Common Stock | | Grantor Stock Ownership Trust | | Treasury Stock | |
| Balance at November 30, 2009 | 115,120 |
| | (11,229 | ) | | (27,047 | ) | | $ | 115,120 |
| | $ | 860,772 |
| | $ | 806,443 |
| | $ | (22,244 | ) | | $ | (122,017 | ) | | $ | (930,850 | ) | | $ | 707,224 |
|
| Comprehensive loss: | | | | | | | | | | | | | | | | | | | |
| Net loss | — |
| | — |
| | — |
| | — |
| | — |
| | (69,368 | ) | | — |
| | — |
| | — |
| | (69,368 | ) |
| Postretirement benefits adjustment | — |
| | — |
| | — |
| | — |
| | — |
| | — |
| | (413 | ) | | — |
| | — |
| | (413 | ) |
| Total comprehensive loss | — |
| | — |
| | — |
| | — |
| | — |
| | — |
| | — |
| | — |
| | — |
| | (69,781 | ) |
| Dividends on common stock | — |
| | — |
| | — |
| | — |
| | — |
| | (19,223 | ) | | — |
| | — |
| | — |
| | (19,223 | ) |
| Employee stock options and other | 29 |
| | — |
| | — |
| | 29 |
| | 2,074 |
| | — |
| | — |
| | — |
| | — |
| | 2,103 |
|
| Restricted stock awards | — |
| | — |
| | — |
| | — |
| | (307 | ) | | — |
| | — |
| | 307 |
| | — |
| | — |
|
| Restricted stock amortization | — |
| | — |
| | — |
| | — |
| | 2,297 |
| | — |
| | — |
| | — |
| | — |
| | 2,297 |
|
| Stock-based compensation | — |
| | — |
| | — |
| | — |
| | 5,777 |
| | — |
| | — |
| | — |
| | — |
| | 5,777 |
|
| Cash-settled stock appreciation rights exchange | — |
| | — |
| | — |
| | — |
| | 2,348 |
| | — |
| | — |
| | — |
| | — |
| | 2,348 |
|
| Grantor stock ownership trust | — |
| | 146 |
| | — |
| | — |
| | 215 |
| | — |
| | — |
| | 1,268 |
| | — |
| | 1,483 |
|
| Stock repurchases | — |
| | — |
| | (48 | ) | | — |
| | 343 |
| | — |
| | — |
| | — |
| | (693 | ) | | (350 | ) |
| Balance at November 30, 2010 | 115,149 |
| | (11,083 | ) | | (27,095 | ) | | 115,149 |
| | 873,519 |
| | 717,852 |
| | (22,657 | ) | | (120,442 | ) | | (931,543 | ) | | 631,878 |
|
| Comprehensive loss: | | | | | | | | | | | | | | | | | | | |
| Net loss | — |
| | — |
| | — |
| | — |
| | — |
| | (178,768 | ) | | — |
| | — |
| | — |
| | (178,768 | ) |
| Postretirement benefits adjustment | — |
| | — |
| | — |
| | — |
| | — |
| | — |
| | (3,495 | ) | | — |
| | — |
| | (3,495 | ) |
| Total comprehensive loss | — |
| | — |
| | — |
| | — |
| | — |
| | — |
| | — |
| | — |
| | — |
| | (182,263 | ) |
| Dividends on common stock | — |
| | — |
| | — |
| | — |
| | — |
| | (19,240 | ) | | — |
| | — |
| | — |
| | (19,240 | ) |
| Employee stock options and other | 22 |
| | — |
| | — |
| | 22 |
| | 2,410 |
| | — |
| | — |
| | — |
| | — |
| | 2,432 |
|
| Restricted stock amortization | — |
| | — |
| | — |
| | — |
| | 2,154 |
| | — |
| | — |
| | — |
| | — |
| | 2,154 |
|
| Forfeited restricted stock | — |
| | — |
| | (119 | ) | | — |
| | 794 |
| | — |
| | — |
| | — |
| | (794 | ) | | — |
|
| Stock-based compensation | — |
| | — |
| | — |
| | — |
| | 5,900 |
| | — |
| | — |
| | — |
| | — |
| | 5,900 |
|
| Grantor stock ownership trust | — |
| | 199 |
| | — |
| | — |
| | (587 | ) | | — |
| | — |
| | 2,383 |
| | — |
| | 1,796 |
|
| Balance at November 30, 2011 | 115,171 |
| | (10,884 | ) | | (27,214 | ) | | 115,171 |
| | 884,190 |
| | 519,844 |
| | (26,152 | ) | | (118,059 | ) | | (932,337 | ) | | 442,657 |
|
| Comprehensive loss: | | | | | | | | | | | | | | | | | | | |
| Net loss | — |
| | — |
| | — |
| | — |
| | — |
| | (58,953 | ) | | — |
| | — |
| | — |
| | (58,953 | ) |
| Postretirement benefits adjustment | — |
| | — |
| | — |
| | — |
| | — |
| | — |
| | (1,806 | ) | | — |
| | — |
| | (1,806 | ) |
| Total comprehensive loss | — |
| | — |
| | — |
| | — |
| | — |
| | — |
| | — |
| | — |
| | — |
| | (60,759 | ) |
| Dividends on common stock | — |
| | — |
| | — |
| | — |
| | — |
| | (10,599 | ) | | — |
| | — |
| | — |
| | (10,599 | ) |
| Employee stock options and other | 7 |
| | — |
| | — |
| | 7 |
| | 97 |
| | — |
| | — |
| | — |
| | — |
| | 104 |
|
| Restricted stock awards | — |
| | 208 |
| | — |
| | — |
| | (2,253 | ) | | — |
| | — |
| | 2,253 |
| | — |
| | — |
|
| Restricted stock amortization | — |
| | — |
| | — |
| | — |
| | 1,708 |
| | — |
| | — |
| | — |
| | — |
| | 1,708 |
|
| Stock-based compensation | — |
| | — |
| | — |
| | — |
| | 5,005 |
| | — |
| | — |
| | — |
| | — |
| | 5,005 |
|
| Grantor stock ownership trust | — |
| | 60 |
| | — |
| | — |
| | (168 | ) | | — |
| | — |
| | 657 |
| | — |
| | 489 |
|
| Stock repurchases | — |
| | — |
| | (126 | ) | | — |
| | — |
| | — |
| | — |
| | — |
| | (1,799 | ) | | (1,799 | ) |
| Balance at November 30, 2012 | 115,178 |
| | (10,616 | ) | | (27,340 | ) | | $ | 115,178 |
| | $ | 888,579 |
| | $ | 450,292 |
| | $ | (27,958 | ) | | $ | (115,149 | ) | | $ | (934,136 | ) | | $ | 376,806 |
|
|
| | | | | | | | | | | | | | | | | | | | | | | | | | | | | | | | | | | | |
| | Years Ended November 30, 2015, 2014 and 2013 |
| | Number of Shares | | Common Stock | | Paid-in Capital | | Retained Earnings | | Accumulated Other Comprehensive Loss | | Grantor Stock Ownership Trust | | Treasury Stock | | Total Stockholders’ Equity |
Common Stock | | Grantor Stock Ownership Trust | | Treasury Stock | |
| Balance at November 30, 2012 | 115,178 |
| | (10,616 | ) | | (27,340 | ) | | $ | 115,178 |
| | $ | 888,579 |
| | $ | 450,292 |
| | $ | (27,958 | ) | | $ | (115,149 | ) | | $ | (934,136 | ) | | $ | 376,806 |
|
| Net income | — |
| | — |
| | — |
| | — |
| | — |
| | 39,963 |
| | — |
| | — |
| | — |
| | 39,963 |
|
| Other comprehensive income, net of tax | — |
| | — |
| | — |
| | — |
| | — |
| | — |
| | 10,442 |
| | — |
| | — |
| | 10,442 |
|
| Dividends on common stock | — |
| | — |
| | — |
| | — |
| | — |
| | (8,366 | ) | | — |
| | — |
| | — |
| | (8,366 | ) |
| Employee stock options/other | 118 |
| | — |
| | — |
| | 118 |
| | 1,474 |
| | — |
| | — |
| | — |
| | — |
| | 1,592 |
|
| Conversion of liability awards to equity awards | — |
| | — |
| | 478 |
| | — |
| | 412 |
| | — |
| | — |
| | — |
| | 7,934 |
| | 8,346 |
|
| Restricted stock awards | — |
| | 88 |
| | — |
| | — |
| | (954 | ) | | — |
| | — |
| | 954 |
| | — |
| | — |
|
| Stock-based compensation | — |
| | — |
| | — |
| | — |
| | 5,699 |
| | — |
| | — |
| | — |
| | — |
| | 5,699 |
|
| Issuance of common stock | — |
| | — |
| | 6,325 |
| | — |
| | (106,622 | ) | | — |
| | — |
| | — |
| | 216,125 |
| | 109,503 |
|
| Grantor stock ownership trust | — |
| | 26 |
| | — |
| | — |
| | 305 |
| | — |
| | — |
| | 284 |
| | — |
| | 589 |
|
| Stock repurchases | — |
| | — |
| | (513 | ) | | — |
| | — |
| | — |
| | — |
| | — |
| | (8,488 | ) | | (8,488 | ) |
| Balance at November 30, 2013 | 115,296 |
| | (10,502 | ) | | (21,050 | ) | | 115,296 |
| | 788,893 |
| | 481,889 |
| | (17,516 | ) | | (113,911 | ) | | (718,565 | ) | | 536,086 |
|
| Net income | — |
| | — |
| | — |
| | — |
| | — |
| | 918,349 |
| | — |
| | — |
| | — |
| | 918,349 |
|
| Other comprehensive loss, net of tax | — |
| | — |
| | — |
| | — |
| | — |
| | — |
| | (3,492 | ) | | — |
| | — |
| | (3,492 | ) |
| Dividends on common stock | — |
| | — |
| | — |
| | — |
| | — |
| | (8,982 | ) | | — |
| | — |
| | — |
| | (8,982 | ) |
| Employee stock options/other | 37 |
| | — |
| | — |
| | 37 |
| | 1,859 |
| | — |
| | — |
| | — |
| | — |
| | 1,896 |
|
| Conversion of liability awards to equity awards | — |
| | — |
| | — |
| | — |
| | 6,455 |
| | — |
| | — |
| | — |
| | — |
| | 6,455 |
|
| Restricted stock awards | 54 |
| | 166 |
| | — |
| | 54 |
| | (1,859 | ) | | — |
| | — |
| | 1,805 |
| | — |
| | — |
|
| Stock-based compensation | — |
| | — |
| | — |
| | — |
| | 9,099 |
| | — |
| | — |
| | — |
| | — |
| | 9,099 |
|
| Issuance of common stock | — |
| | — |
| | 7,986 |
| | — |
| | (135,590 | ) | | — |
| | — |
| | — |
| | 272,635 |
| | 137,045 |
|
| Stock repurchases | — |
| | — |
| | (33 | ) | | — |
| | — |
| | — |
| | — |
| | — |
| | (546 | ) | | (546 | ) |
| Balance at November 30, 2014 | 115,387 |
| | (10,336 | ) | | (13,097 | ) | | 115,387 |
| | 668,857 |
| | 1,391,256 |
| | (21,008 | ) | | (112,106 | ) | | (446,476 | ) | | 1,595,910 |
|
| Net income | — |
| | — |
| | — |
| | — |
| | — |
| | 84,643 |
| | — |
| | — |
| | — |
| | 84,643 |
|
| Other comprehensive income, net of tax | — |
| | — |
| | — |
| | — |
| | — |
| | — |
| | 3,689 |
| | — |
| | — |
| | 3,689 |
|
| Dividends on common stock | — |
| | — |
| | — |
| | — |
| | — |
| | (9,186 | ) | | — |
| | — |
| | — |
| | (9,186 | ) |
| Employee stock options/other | 76 |
| | — |
| | — |
| | 76 |
| | (874 | ) | | — |
| | — |
| | — |
| | — |
| | (798 | ) |
| Restricted stock awards | 85 |
| | 200 |
| | — |
| | 85 |
| | (2,255 | ) | | — |
| | — |
| | 2,170 |
| | — |
| | — |
|
| Stock-based compensation | — |
| | — |
| | — |
| | — |
| | 17,143 |
| | — |
| | — |
| | — |
| | — |
| | 17,143 |
|
| Stock repurchases | — |
| | — |
| | (40 | ) | | — |
| | — |
| | — |
| | — |
| | — |
| | (567 | ) | | (567 | ) |
| Balance at November 30, 2015 | 115,548 |
| | (10,136 | ) | | (13,137 | ) | | $ | 115,548 |
| | $ | 682,871 |
| | $ | 1,466,713 |
| | $ | (17,319 | ) | | $ | (109,936 | ) | | $ | (447,043 | ) | | $ | 1,690,834 |
|
See accompanying notes.
KB HOME
CONSOLIDATED STATEMENTS OF CASH FLOWS
(In Thousands)
| | | | Years Ended November 30, | Years Ended November 30, |
| | 2012 | | 2011 | | 2010 | 2015 | | 2014 | | 2013 |
| Cash flows from operating activities: | | | | | | | | | | |
| Net loss | $ | (58,953 | ) | | $ | (178,768 | ) | | $ | (69,368 | ) | |
| Adjustments to reconcile net loss to net cash provided by (used in) operating activities: | | | | | | |
| Equity in (income) loss/(gain) on wind down of unconsolidated joint ventures | (1,797 | ) | | 36,553 |
| | (772 | ) | |
| Net income | | $ | 84,643 |
| | $ | 918,349 |
| | $ | 39,963 |
|
| Adjustments to reconcile net income to net cash provided by (used in) operating activities: | | | | | | |
| Equity in (income) loss of unconsolidated joint ventures | | (2,488 | ) | | (1,427 | ) | | 933 |
|
| Distributions of earnings from unconsolidated joint ventures | 3,316 |
| | 8,703 |
| | 20,410 |
| — |
| | 364 |
| | 1,949 |
|
| Loss on loan guaranty | — |
| | 30,765 |
| | — |
| |
| Gain on sale of operating property | — |
| | (8,825 | ) | | — |
| |
| Amortization of discounts and issuance costs | 3,016 |
| | 2,150 |
| | 2,149 |
| 7,738 |
| | 7,124 |
| | 5,347 |
|
| Depreciation and amortization | 1,622 |
| | 2,031 |
| | 3,289 |
| 3,411 |
| | 2,420 |
| | 1,857 |
|
| Provision for deferred income taxes | 1,152 |
| | — |
| | — |
| |
| Loss (gain) on early extinguishment of debt/loss on voluntary termination of revolving credit facility | 10,278 |
| | (3,612 | ) | | 1,802 |
| |
| Tax benefits from stock-based compensation | — |
| | — |
| | (583 | ) | |
| Deferred income taxes | | 43,036 |
| | (825,232 | ) | | — |
|
| Loss on early extinguishment of debt | | — |
| | — |
| | 10,448 |
|
| Excess tax benefits from stock-based compensation | | (157 | ) | | — |
| | — |
|
| Stock-based compensation | 6,713 |
| | 8,054 |
| | 8,074 |
| 17,143 |
| | 9,099 |
| | 5,699 |
|
| Inventory impairments and land option contract abandonments | 28,533 |
| | 25,791 |
| | 19,925 |
| 9,591 |
| | 39,431 |
| | 3,581 |
|
| Changes in assets and liabilities: | | | | | | | | | | |
| Receivables | 24,994 |
| | (2,220 | ) | | 211,318 |
| (20,463 | ) | | (31,283 | ) | | (11,153 | ) |
| Inventories | 30,347 |
| | (12,345 | ) | | (129,334 | ) | 34,852 |
| | (780,131 | ) | | (563,189 | ) |
| Accounts payable, accrued expenses and other liabilities | (2,143 | ) | | (253,547 | ) | | (199,205 | ) | 1,991 |
| | 35,504 |
| | 59,763 |
|
| Other, net | (12,461 | ) | | (2,275 | ) | | (1,669 | ) | 1,888 |
| | (4,909 | ) | | 1,316 |
|
| Net cash provided by (used in) operating activities | 34,617 |
| | (347,545 | ) | | (133,964 | ) | 181,185 |
| | (630,691 | ) | | (443,486 | ) |
| Cash flows from investing activities: | | | | | | | | | | |
| Return of investments in (contributions to) unconsolidated joint ventures | 989 |
| | (67,260 | ) | | (15,669 | ) | |
| Proceeds from sale of operating property | — |
| | 80,600 |
| | — |
| |
| Contributions to unconsolidated joint ventures | | (20,626 | ) | | (49,097 | ) | | (14,359 | ) |
| Return of investments in unconsolidated joint ventures | | 14,000 |
| | — |
| | — |
|
| Proceeds from sale of investment in unconsolidated joint venture | | — |
| | 10,110 |
| | — |
|
| Purchases of property and equipment, net | (1,749 | ) | | (242 | ) | | (420 | ) | (4,677 | ) | | (5,795 | ) | | (2,391 | ) |
| Net cash provided by (used in) investing activities | (760 | ) | | 13,098 |
| | (16,089 | ) | |
| Net cash used in investing activities | | (11,303 | ) | | (44,782 | ) | | (16,750 | ) |
| Cash flows from financing activities: | | | | | | | | | | |
| Change in restricted cash | 22,119 |
| | 50,996 |
| | (1,185 | ) | 17,891 |
| | 14,671 |
| | 456 |
|
| Proceeds from issuance of senior notes | 694,831 |
| | — |
| | — |
| |
| Payment of senior notes issuance costs | (12,445 | ) | | — |
| | — |
| |
| Proceeds from issuance of debt | | 250,000 |
| | 400,000 |
| | 680,000 |
|
| Payment of debt issuance costs | | (4,561 | ) | | (5,448 | ) | | (16,525 | ) |
| Repayment of senior notes | (592,645 | ) | | (100,000 | ) | | — |
| (199,906 | ) | | — |
| | (225,394 | ) |
| Payments on mortgages and land contracts due to land sellers and other loans | (26,298 | ) | | (89,461 | ) | | (101,154 | ) | (22,877 | ) | | (36,918 | ) | | (66,296 | ) |
| Proceeds from issuance of common stock, net | | — |
| | 137,045 |
| | 109,503 |
|
| Issuance of common stock under employee stock plans | 593 |
| | 1,796 |
| | 1,851 |
| 740 |
| | 1,896 |
| | 2,181 |
|
| Excess tax benefit associated with exercise of stock options | — |
| | — |
| | 583 |
| |
| Excess tax benefits from stock-based compensation | | 157 |
| | — |
| | — |
|
| Payments of cash dividends | (10,599 | ) | | (19,240 | ) | | (19,223 | ) | (9,186 | ) | | (8,982 | ) | | (8,366 | ) |
| Stock repurchases | (1,799 | ) | | — |
| | (350 | ) | (567 | ) | | (546 | ) | | (8,488 | ) |
| Net cash provided by (used in) financing activities | 73,757 |
| | (155,909 | ) | | (119,478 | ) | |
| Net cash provided by financing activities | | 31,691 |
| | 501,718 |
| | 467,071 |
|
| Net increase (decrease) in cash and cash equivalents | 107,614 |
| | (490,356 | ) | | (269,531 | ) | 201,573 |
| | (173,755 | ) | | 6,835 |
|
| Cash and cash equivalents at beginning of year | 418,074 |
| | 908,430 |
| | 1,177,961 |
| 358,768 |
| | 532,523 |
| | 525,688 |
|
| Cash and cash equivalents at end of year | $ | 525,688 |
| | $ | 418,074 |
| | $ | 908,430 |
| $ | 560,341 |
| | $ | 358,768 |
| | $ | 532,523 |
|
See accompanying notes.
KB HOME
NOTES TO CONSOLIDATED FINANCIAL STATEMENTS
| |
| Note 1. | Summary of Significant Accounting Policies |
Operations. KB Home is a builder of attached and detached single-family residential homes, townhomes and condominiums. We hadAs of November 30, 2015, we conducted ongoing operations in Arizona, California, Colorado, Florida, Maryland, Nevada, New Mexico, North Carolina, Texas and Virginia as of November 30, 2012.Virginia. We also offer titleproperty and casualty insurance servicesand, in certain instances, earthquake, flood and personal property insurance to our homebuyers throughin the same markets where we build homes, and provide title services in the majority of our financial services subsidiary, KB Home Mortgage Company (“KBHMC”). From 2005 until June 30, 2011,markets located within our Central and Southeast homebuilding reporting segments. Since July 2014, we have also offered mortgage banking services, including mortgage loan originations, to our homebuyers indirectly through KBA Mortgage,HCM, a former unconsolidated joint venture of a subsidiary of ours and a subsidiary of Bank of America, N.A., with each partner having a 50% interest in the venture. KBA Mortgage ceased offering mortgage banking services after June 30, 2011. KBA Mortgage wasNationstar. HCM is accounted for as an unconsolidated joint venture within our financial services reporting segment.
Basis of Presentation. TheOur consolidated financial statements have been prepared in accordance with GAAP and include our accounts and all significantthose of the consolidated subsidiaries and joint ventures in which we have a controlling interest is held, as well as certain VIEs required to be consolidated pursuant to ASC 810.financial interest. All intercompany balances and transactions have been eliminated.eliminated in consolidation. Investments in unconsolidated joint ventures in which we have less than a controlling financial interest are accounted for using the equity method.
Use of Estimates. The accompanying consolidatedpreparation of financial statements have been prepared in conformity with GAAP and, therefore, include amounts based onrequires management to make informed estimates and judgments of management.that affect the amounts reported in our consolidated financial statements and accompanying notes. Actual results could differ from thesethose estimates.
Cash and Cash Equivalents and Restricted Cash. We consider all highly liquid short-term investments purchased with an original maturity of three months or less to be cash equivalents. Our cash equivalents totaled $396.3$342.3 million at November 30, 20122015 and $212.8$197.7 million at November 30, 20112014. The majority of our cash and cash equivalents were invested in money market funds and interest-bearing bank deposit accounts.
Restricted cash of $42.4 millionat November 30, 20122015 and $64.5 million at November 30, 20112014 consisted of cash deposited with various financial institutions that was required as collateral for our LOC Facilities.
Property and Equipment and Depreciation. Property and equipment are recorded at cost and are depreciated over their estimated useful lives, which generally range from two to 10 years, using the straight-line method. Repair and maintenance costs are charged to earningsexpensed as incurred. Property and equipment are included in other assets on the consolidated balance sheets. Property and equipment totaled $7.9$13.1 million,, net of accumulated depreciation of $18.5$15.3 million,, at November 30, 2012,2015 and $7.8$11.8 million,, net of accumulated depreciation of $18.0$15.0 million,, at November 30, 2011.2014. Depreciation expense totaled $3.4 million in 2015, $1.62.4 million in 20122014, and $2.01.9 million in 2011 and $3.3 million in 20102013.
Homebuilding Operations. Revenues from housing and other real estate sales are recognized in accordance with ASC 360 when sales are closed and title passes to the buyer. Sales are closed when all of the following conditions are met: a sale is consummated, a sufficient down payment is received, the earnings process is complete and the collection of any remaining receivables is reasonably assured. Concurrent with the recognition of revenues in our consolidated statements of operations, sales incentives in the form of price concessions on the selling price of a home are recorded as a reduction of revenues, while the cost of sales incentives in the form of free products or services to homebuyers, including option upgrades and closing cost allowances used to cover a portion of the fees and costs charged to a homebuyer, is reflected as construction and land costs.
Construction and land costs are comprised of direct and allocated costs, including estimated future costs for the limited warranty we provide on our homes and certain amenities within a community. Land acquisition, land development and other common costs are generally allocated on a relative fair value basis to the homes or lots within athe applicable community or land parcel. Land acquisition and land development costs include related interest and real estate taxes.
Housing and land inventories are stated at cost, unless the carrying value is determined not to be recoverable, in which case the affected inventories are written down to fair value in accordance with ASC 360.or fair value less costs to sell. ASC 360 requires that realReal estate assets, such as our housing and land inventories, beare tested for recoverability whenever events or changes in circumstances indicate that their carrying value may not be recoverable. Recoverability is measured by comparing the carrying value of an asset to the undiscounted future net cash flows expected to be generated by the asset. These impairment evaluations are significantly impacted by estimates for the amounts and timing of future revenues, costs and expenses, and other factors. If the carrying value of real estate assets is determined not to be recoverable, the impairment charge to be recognized is measured by the amount by which the carrying value of the affected asset exceeds its estimated fair value. For land held for sale, if the fair value less costs to sell exceeds the asset’s carrying value, no impairment charge is recognized.
Capitalized Interest. Interest is capitalized to inventories while the related communities are being actively developed and until homes are completed. Capitalized interest is amortized to construction and land costs as the related inventories are delivered to homebuyers or land buyers (as applicable). For land held for future development, applicable interest is expensed as incurred.
Fair Value Measurements. ASC 820 provides a framework for measuring the fair value of assets and liabilities under GAAP and establishes a fair value hierarchy that requires an entity to maximize the use of observable inputs and minimize the use of unobservable inputs when measuring fair value.
Fair value measurements are used for inventories on a nonrecurring basis when events and circumstances indicate thethat their carrying value is not recoverable. Fair value is determined based on estimated future net cash flows discounted for inherent risks associated with the real estate assets, or other valuation techniques.
Our financial instruments consist of cash and cash equivalents, restricted cash, mortgages andsenior notes, receivable,convertible senior notes, and mortgages and land contracts due to land sellers and other loans. Fair value measurements of financial instruments are determined by various market data and other valuation techniques as appropriate. When available, we use quoted market prices in active markets to determine fair value.
Financial Services Operations. Our financial services reporting segment generates revenues primarily from insurance commissions and title services,services. These operations also earned marketing services fees, and interest income.pursuant to a marketing services agreement with a preferred lender, until July 21, 2014. Marketing services fees were recognized when earned. Insurance commissions are recognized when policies are issued. Title services revenues are recorded when closing services are rendered and title insurance policies are issued, both of which generally occur at the time each applicable home is closed. Marketing services fees are recognized when earned and interest income is accrued as earned.
Warranty Costs. We provide a limited warranty on all of our homes.We estimate the costs that may be incurred under each limited warranty and record a liability in the amount of such costs at the time the revenue associated with the sale of each home is recognized.Our primary assumption in estimating the amounts we accrue for warranty costs is that historical claims experience is a strong indicator of future claims experience. Factors that affect our warranty liability include the number of homes delivered, historical and anticipated rates of warranty claims, and cost per claim. We periodically assess the adequacy of our accrued warranty liabilityand adjust the amount as necessary based on our assessment.
Insurance.Self-Insurance. We self-insure a portion of our overall risk through the use of a captive insurance subsidiary. We also maintain certain other insurance policies.We record expenses and liabilities based on the estimated costs required to cover our self-insured retention and deductible amounts under our insurance policies, and the estimated costs of potential claims and claim adjustment expenses that are above our coverage limits or that are not covered by our insurance policies. These estimated costs are based on an analysis of our historical claims and industry data, and include an estimate of construction defect claims incurred but not yet reported.
We engage a third-party actuary that uses our historical claim and expense data, as well as industry data, to estimate our liabilities related to unpaid claims, claim adjustment expenses, third-party recoveries and incurred but not yet reported claims liabilities forassociated with the risks that we are assuming underwith respect to our self-insurance. Projectionself-insurance and insurance policy deductibles. The projection of losses related to these liabilities requires actuarial assumptions that are subject to variability due to uncertainties regarding construction defect claims relative to differences in our markets and the types of product we build, claim settlement patterns, insurance industry practices and legal or regulatory interpretations, among other factors. Because of the degree of judgment required and the potential for variability in the underlyingKey assumptions used in determining these estimated liability amounts, actual future costs could differ from our estimated amounts.estimates include claim frequencies, severities and settlement patterns, which can occur over an extended period of time.
Advertising Costs. We expense advertising costs as incurred. We incurred advertising costs of $33.4 million in 2015, $24.630.2 million in 2012,2014 and $32.425.3 million in 2011 and $25.9 million2013 in 2010..
Legal Fees. Legal fees associated with litigation and similar proceedings that are not expected to provide a benefit in future periods are generally expensed as incurred. Legal fees associated with land acquisition and development and other activities that are expected to provide a benefit in future periods are capitalized as incurred in our consolidated balance sheets. We expensed legal fees of $12.6$11.7 million in 20122015, $16.9$10.9 million in 20112014 and $33.7$10.1 million in 20102013.
Stock-Based Compensation. With the approval of the management development and compensation committee, consisting entirely of independent members of our board of directors, we have provided compensation benefits to certain of our employees in the form of stock options, restricted stock, PSUs, phantom shares and SARs.
WeWe measure and recognize compensation expense associated with our grant of equity-based awards in accordance with ASC 718, which requires that companies measure and recognize compensation expense at an amount equal to the fair value of share-based payments granted under compensation arrangements over the vesting period.We estimate the fair value of stock options and SARs granted using the Black-Scholes option-pricing model with assumptions based primarily on historical data. ASC 718 also requiresWe report the tax benefit resulting from tax deductions in excess of the compensation expense recognized for thosestock options to be reportedand SARs in the statementour consolidated statements of cash flows as an operating cash outflow and a financing cash inflow.
Income Taxes.Income taxes are accounted for in accordance with ASC 740. The provision for, or benefit from, income taxes is calculated using the asset and liability method, under which deferred tax assets and liabilities are recorded based on the difference between the financial statement and tax basis of assets and liabilities using enacted tax rates in effect for the year in which the differences are expected to reverse. Deferred tax assets are evaluated on a quarterly basis to determine if adjustments to the valuation allowance are required. In accordance with ASC 740, we assess whether a valuation allowance should be establishedThis evaluation is based on the consideration of all available positive and negative evidence using a “more likely than not” standard with respect to whether deferred tax
deferred tax assets will be realized. The ultimate realization of our deferred tax assets depends primarily on the generation ofour ability to generate future taxable income during the periods in which the related temporary differences in the financial basis and the tax basis of the assets become deductible. The value of our deferred tax assets will dependdepends on applicable income tax rates.Judgment is required in determining the future tax consequences of events that have been recognized in our consolidated financial statements and/or tax returns. Differences between anticipated and actual outcomes of these future tax consequences could have a material impact on our consolidated financial statements.
Accumulated Other Comprehensive Loss. The accumulated balances of other comprehensive loss in the consolidated balance sheets as of November 30, 20122015 and 20112014 were comprised solely of adjustments recorded directly to accumulated other comprehensive loss in accordance with Accounting Standards Codification Topic No. 715, “Compensation — Retirement Benefits” (“ASC 715”). ASC 715 requires an employerrelated to recognize the funded statusour benefit plan obligations. Such adjustments are made annually as of defined postretirementNovember 30, when our benefit plans as an asset or liability on the balance sheet and requires any unrecognized prior service costs and actuarial gains/losses to be recognized in accumulated other comprehensive income (loss).plan obligations are remeasured.
LossEarnings Per Share. Basic and diluted lossWe compute earnings per share were calculated as follows (in thousands, exceptusing the two-class method, which is an allocation of earnings between the holders of common stock and a company’s participating security holders. Our outstanding nonvested shares of restricted stock contain non-forfeitable rights to dividends and, therefore, are considered participating securities for purposes of computing earnings per share amounts):
|
| | | | | | | | | | | |
| | Years Ended November 30, |
| | 2012 | | 2011 | | 2010 |
| Numerator: | | | | | |
| Net loss | $ | (58,953 | ) | | $ | (178,768 | ) | | $ | (69,368 | ) |
| Denominator: | | | | | |
| Basic and diluted average shares outstanding | 77,106 |
| | 77,043 |
| | 76,889 |
|
| Basic and diluted loss per share | $ | (.76 | ) | | $ | (2.32 | ) | | $ | (.90 | ) |
All outstanding stock options were excluded frompursuant to the diluted loss per share calculations for the years ended two-class method. We had no other participating securities at November 30, 20122015, 20112014 andor 20102013 because the effect of their inclusion would be antidilutive, or would decrease the reported loss per share..
Recent Accounting Pronouncements. In May 2011,April 2014, the FASB issued Accounting Standards Update No. 2014-08, “Presentation of Financial Statements (Topic 205) and Property, Plant and Equipment (Topic 360): Reporting Discontinued Operations and Disclosures of Disposals of Components of an Entity” (“ASU 2011-04, 2014-08”), which changesraises the wording usedthreshold for a disposal to describequalify as a discontinued operation and requires new disclosures of both discontinued operations and certain other disposals that do not meet the requirementsnew definition of a discontinued operation. It also allows an entity to present a discontinued operation even when it has continuing cash flows and significant continuing involvement with the disposed component. The amendments in GAAPASU 2014-08 are effective prospectively for measuring fair valuedisposals (or classifications as held for sale) of components of an entity that occur within annual periods beginning on or after December 15, 2014, and interim periods within those years. Early adoption is permitted but only for disclosing information about fair value measurementsdisposals (or classifications as held for sale) that have not been reported in orderfinancial statements previously issued or available for issuance. We believe the adoption of this guidance will not have a material effect on our consolidated financial statements.
In May 2014, the FASB issued Accounting Standards Update No. 2014-09, “Revenue from Contracts with Customers (Topic 606)” (“ASU 2014-09”). The core principle of ASU 2014-09 is that an entity should recognize revenue to improve consistencydepict the transfer of promised goods or services to customers in an amount that reflects the application and description of fair value between GAAP and International Financial Reporting Standards. ASU 2011-04 clarifies howconsideration to which the concepts of highest and best use and valuation premise in a fair value measurement are relevant only when measuring the fair value of nonfinancial assets and are not relevant when measuring the fair value of financial assets or liabilities. In addition, the guidance expanded the disclosures for the unobservable inputs for Level 3 fair value measurements, requiring quantitative informationentity expects to be disclosed relatedentitled in exchange for those goods or services. Companies may use either a full retrospective or a modified retrospective approach to (1)adopt ASU 2014-09. In August 2015, the valuation processes used, (2)FASB issued Accounting Standards Update No. 2015-14, “Revenue from Contracts with Customers (Topic 606): Deferral of the sensitivityEffective Date,” which delayed the effective date of recurring fair value measurements to changes in unobservable inputs and the interrelationships between those unobservable inputs, and (3) use of a nonfinancial asset in a way that differs from the asset’s highest and best use. The revised guidance wasASU 2014-09 by one year. ASU 2014-09, as amended, is effective for public companies for annual reporting periods beginning after December 15, 2017, including interim reporting periods within that reporting period. Earlier application is permitted only as of annual reporting periods beginning after December 15, 2016, including interim reporting periods within that reporting period. We are currently evaluating the potential impact of adopting this guidance on our consolidated financial statements.
In June 2014, the FASB issued Accounting Standards Update No. 2014-12, “Compensation — Stock Compensation (Topic 718): Accounting for Share-Based Payments When the Terms of an Award Provide That a Performance Target Could Be Achieved after the Requisite Service Period” (“ASU 2014-12”). The amendments in ASU 2014-12 require that a performance target that affects vesting and that could be achieved after the requisite service period be treated as a performance condition. A reporting entity should apply existing guidance in ASC 718, as it relates to awards with performance conditions that affect vesting to account for such awards. The amendments in ASU 2014-12 are effective for annual periods and interim periods within those annual periods beginning after December 15, 2011. Our2015. Early adoption is permitted. Entities may apply the amendments in ASU 2014-12 either: (a) prospectively to all awards granted or modified after the effective date; or (b) retrospectively to all awards with performance targets that are outstanding as of the beginning of the earliest annual period presented in the financial statements and to all new or modified awards thereafter. We believe the adoption of this guidance as of March 1, 2012 didwill not have a material impacteffect on our consolidated financial position or results of operations.statements.
In June 2011,August 2014, the FASB issued Accounting Standards Update No. 2014-15, “Presentation of Financial Statements — Going Concern (Subtopic 205-40): Disclosure of Uncertainties about an Entity’s Ability to Continue as a Going Concern” (“ASU 2011-05,2014-15”), which allows requires management to evaluate, in connection with preparing financial statements for each annual and interim reporting period, whether there are conditions or events, considered in the aggregate, that raise substantial doubt about an entityentity’s ability to continue as a going concern within one year after the optiondate that the financial statements are issued (or within one year after the date that the financial statements are available to presentbe issued when applicable) and provide related disclosures. ASU 2014-15 is effective for the totalannual period ending after December 15, 2016, and for annual and interim periods thereafter. Early adoption is permitted. We believe the adoption of comprehensive income,this guidance will not have a material effect on our consolidated financial statements.
In January 2015, the componentsFASB issued Accounting Standards Update No. 2015-01, “Income Statement — Extraordinary and Unusual Items (Subtopic 225-20): Simplifying Income Statement Presentation by Eliminating the Concept of net income, and the components of other comprehensive income either in a single continuous statement of comprehensive income or in two separate but consecutive statements. In both instances, an entity is required to present each component of net income along with total net income, each component of other comprehensive income along with a total for other comprehensive income, and a total amount for comprehensive income. Extraordinary Items”(“ASU 2011-052015-01”). ASU 2015-01 eliminates the option to presentconcept of extraordinary items from GAAP but retains the components of other comprehensive income as part of the statement of changes in stockholders’ equity. The amendments in ASU 2011-05 do not change thepresentation and disclosure guidance for items that must be reportedare unusual in other comprehensive incomenature or when an item of other comprehensive income must be reclassified to net income. However, in December 2011, the FASB issued ASU 2011-12, which deferredoccur infrequently and expands the guidance on whether to require entities to present reclassification adjustments out of accumulated other comprehensive income by componentinclude items that
are both unusual in both the statement where net incomenature and infrequently occurring. ASU 2015-01 is presented and the statement where other comprehensive income is presented for both interim and annual financial statements. ASU 2011-12 reinstated the requirements for the presentation of reclassifications that were in place prior to the issuance of ASU 2011-05 and did not change the effective date for ASU 2011-05. For public entities, the amendments in ASU 2011-05 and ASU 2011-12 are effective for fiscal years, and interim periods within those years, beginning after December 15, 2011, and should be applied retrospectively. The2015. A reporting entity may apply ASU 2015-01 prospectively. A reporting entity may also apply ASU 2015-01 retrospectively to all periods presented in the financial statements. We believe the adoption of this guidance concerns disclosure only and will not have an impacta material effect on our consolidated financial position or resultsstatements.
In February 2015, the FASB issued Accounting Standards Update No. 2015-02, “Consolidation (Topic 810): Amendments to the Consolidation Analysis”(“ASU 2015-02”). ASU 2015-02 changes the analysis that a reporting entity must perform to determine whether it should consolidate certain types of operations.legal entities. ASU 2015-02 is effective for fiscal years, and interim periods within those years, beginning after December 15, 2015. Early adoption is permitted, including adoption in an interim period. We believe the adoption of this guidance will not have a material effect on our consolidated financial statements.
In April 2015, the FASB issued Accounting Standards Update No. 2015-03, “Interest — Imputation of Interest (Subtopic 835-30): Simplifying the Presentation of Debt Issuance Costs”(“ASU 2015-03”). ASU 2015-03 requires that debt issuance costs related to a recognized debt liability be presented in the balance sheet as a direct deduction from the carrying amount of that debt liability, consistent with debt discounts. For public entities, ASU 2015-03 is effective for fiscal years beginning after December 15, 2015, and interim periods within those fiscal years. Early adoption is permitted for financial statements that have not been previously issued. ASU 2015-03 is to be applied on a retrospective basis and represents a change in accounting principle. We believe the adoption of this guidance will not have a material effect on our consolidated financial statements.
In August 2015, the FASB issued Accounting Standards Update No. 2015-15, “Interest — Imputation of Interest (Subtopic 835-30): Presentation and Subsequent Measurement of Debt Issuance Costs Associated with Line-of-Credit Arrangements — Amendments to SEC Paragraphs Pursuant to Staff Announcement at June 18, 2015 EITF Meeting”(“ASU 2015-15”), which clarifies the treatment of debt issuance costs from line-of-credit arrangements after the adoption of ASU 2015-03. In particular, ASU 2015-15 clarifies that the SEC staff would not object to an entity deferring and presenting debt issuance costs related to a line-of-credit arrangement as an asset and subsequently amortizing the deferred debt issuance costs ratably over the term of such arrangement, regardless of whether there are any outstanding borrowings on the line-of-credit arrangement. We believe the adoption of this guidance will not have a material effect on our consolidated financial statements.
Reclassifications. Certain amounts in theour consolidated financial statements of prior years have been reclassified to conform to the 2012current period presentation.
| |
| Note 2. | Segment Information |
As of November 30, 20122015, we had identified five operating reporting segments, comprised of four homebuilding reporting segments and one financial services reporting segment, within our consolidated operations in accordance with Accounting Standards Codification Topic No. 280, “Segment Reporting.”operations. As of November 30, 20122015, our homebuilding reporting segments conducted ongoing operations in the following states:
West Coast: California
Southwest: Arizona Nevada and New MexicoNevada
Central: Colorado and Texas
Southeast: Florida, Maryland, North Carolina and Virginia
Our homebuilding reporting segments are engaged in the acquisition and development of land primarily for residential purposes and offer a wide variety of homes that are designed to appeal to first-time, move-up and active adult homebuyers. Our homebuilding operations generate most of their revenues from the delivery of completed homes to homebuyers. They also earn revenues from the sale of land.
Our homebuilding reporting segments were identified based primarily on similarities in economic and geographic characteristics, product types, regulatory environments, methods used to sell and construct homes and land acquisition characteristics. We evaluate segment performance primarily based on segment pretax results.
Our financial services reporting segment providesoffers property and casualty insurance servicesand, in certain instances, earthquake, flood and personal property insurance to our homebuyers in the same markets as our homebuilding reporting segments, and provides title services in the majority of our markets located within our Central and Southeast homebuilding reporting segments.In addition, since This segment earns revenues primarily from insurance commissions and from the third quarterprovision of 2011,title services. Prior to July 21, 2014, this segment hasalso earned revenues pursuant to the terms of a marketing services agreement with aNationstar, under which Nationstar was our preferred mortgage lender that offersand offered mortgage banking services, including mortgage loan originations, to our homebuyerswho electelected to use the lender. Since July 21, 2014, we have offered mortgage banking services, including mortgage loan originations, to our homebuyers indirectly through HCM, a joint venture of a subsidiary of ours and a subsidiary of Nationstar. Through these respective subsidiaries, we have a 49.9% ownership interest and Nationstar has a 50.1% ownership interest in HCM, with Nationstar
providing management oversight of HCM’s operations. Our homebuyers are under no obligation to use our preferred mortgage lender and may select any lender of their choice to obtain mortgage financing for the purchase of a home. We make available
Corporate and other is a non-operating segment that develops and oversees the implementation of company-wide strategic initiatives and provides support to our homebuyers marketing materialsreporting segments by centralizing certain administrative functions. Corporate and other information regardingincludes general and administrative expenses related to operating our preferred mortgage lender’s financing optionscorporate headquarters. A portion of the expenses incurred by Corporate and mortgage loan products, and are compensated solely for the fair market value of these services. Prior to late June 2011, this segment provided mortgage banking servicesother is allocated to our homebuyers indirectly through KBA Mortgage, a former unconsolidated joint venture of a subsidiary of ours and a subsidiary of Bank of America, N.A., with each partner having had a 50% interest in the venture.homebuilding reporting segments.
Our reporting segments follow the same accounting policies used for our consolidated financial statements as described in Note 1. Summary of Significant Accounting Policies in this report. OperationalPolicies. The results of each segment are not necessarily indicative of the results that would have occurred had the segment been an independent, stand-alone entity during the periods presented, nor are they indicative of the results to be expected in future periods.
The following tables present financial information relating to our reporting segments (in thousands):
| | | | Years Ended November 30, | Years Ended November 30, |
| | 2012 | | 2011 | | 2010 | 2015 | | 2014 | | 2013 |
| Revenues: | | | | | | | | | | |
| West Coast | $ | 755,259 |
| | $ | 589,387 |
| | $ | 700,645 |
| $ | 1,402,264 |
| | $ | 1,089,857 |
| | $ | 1,020,218 |
|
| Southwest | 132,438 |
| | 139,872 |
| | 187,736 |
| 398,242 |
| | 199,504 |
| | 175,252 |
|
| Central | 436,407 |
| | 369,705 |
| | 436,404 |
| 809,738 |
| | 698,429 |
| | 565,120 |
|
| Southeast | 224,328 |
| | 206,598 |
| | 256,978 |
| 410,743 |
| | 401,853 |
| | 324,388 |
|
| Total homebuilding revenues | 1,548,432 |
| | 1,305,562 |
| | 1,581,763 |
| 3,020,987 |
| | 2,389,643 |
| | 2,084,978 |
|
| Financial services | 11,683 |
| | 10,304 |
| | 8,233 |
| 11,043 |
| | 11,306 |
| | 12,152 |
|
| Total | $ | 1,560,115 |
| | $ | 1,315,866 |
| | $ | 1,589,996 |
| $ | 3,032,030 |
| | $ | 2,400,949 |
| | $ | 2,097,130 |
|
| | | | | | | |
|
| | | | | | | | | | | |
| Pretax income (loss): | | | | | |
| West Coast | $ | 127,946 |
| | $ | 116,325 |
| | $ | 118,264 |
|
| Southwest | 31,718 |
| | 6,015 |
| | 2,903 |
|
| Central | 70,959 |
| | 47,214 |
| | 22,275 |
|
| Southeast | (22,758 | ) | | (11,158 | ) | | (45,992 | ) |
| Corporate and other | (92,446 | ) | | (71,993 | ) | | (69,271 | ) |
| Total homebuilding pretax income | 115,419 |
| | 86,403 |
| | 28,179 |
|
| Financial services | 11,624 |
| | 8,546 |
| | 10,184 |
|
| Total | $ | 127,043 |
| | $ | 94,949 |
| | $ | 38,363 |
|
| | | | | | |
| Equity in income (loss) of unconsolidated joint ventures: | | | | | |
| West Coast | $ | (1,106 | ) | | $ | (374 | ) | | $ | (148 | ) |
| Southwest | (696 | ) | | (2,176 | ) | | (2,355 | ) |
| Central | — |
| | — |
| | — |
|
| Southeast | (2 | ) | | 3,291 |
| | 496 |
|
| Total | $ | (1,804 | ) | | $ | 741 |
| | $ | (2,007 | ) |
| | | | | | |
| Inventory impairment charges: | | | | | |
| West Coast | $ | 645 |
| | $ | 27,285 |
| | $ | — |
|
| Southwest | 3,253 |
| | 6,392 |
| | — |
|
| Central | — |
| | — |
| | — |
|
| Southeast | 4,132 |
| | 3,951 |
| | 391 |
|
| Total | $ | 8,030 |
| | $ | 37,628 |
| | $ | 391 |
|
| | | | | | |
| | | | Years Ended November 30, | Years Ended November 30, |
| | 2012 | | 2011 | | 2010 | |
| Pretax income (loss): | | | | | | |
| West Coast | $ | (10,467 | ) | | $ | 19,639 |
| | $ | 60,250 |
| |
| Southwest | (10,194 | ) | | (108,265 | ) | | (15,802 | ) | |
| Central | 1,449 |
| | (12,924 | ) | | (1,772 | ) | |
| Southeast | (1,183 | ) | | (37,983 | ) | | (42,801 | ) | |
| Corporate and other (a) | (69,541 | ) | | (67,713 | ) | | (88,386 | ) | |
| Total homebuilding pretax loss | (89,936 | ) | | (207,246 | ) | | (88,511 | ) | |
| Financial services | 10,883 |
| | 26,078 |
| | 12,143 |
| |
| Total | $ | (79,053 | ) | | $ | (181,168 | ) | | $ | (76,368 | ) | |
| | | | | | | |
| Equity in income (loss) of unconsolidated joint ventures: | | | | | | |
| West Coast | $ | (174 | ) | | $ | 68 |
| | $ | 1,476 |
| |
| Southwest | (811 | ) | | (55,902 | ) | | (8,631 | ) | |
| Central | — |
| | — |
| | — |
| |
| Southeast | 591 |
| | (5 | ) | | 898 |
| |
| Total | $ | (394 | ) | | $ | (55,839 | ) | | $ | (6,257 | ) | |
| | | | | | | |
| Inventory impairments: | | | | | | |
| West Coast | $ | 19,235 |
| | $ | 2,598 |
| | $ | 3,828 |
| |
| Southwest | 2,135 |
| | 18,715 |
| | 962 |
| |
| Central | 1,267 |
| | 51 |
| | 348 |
| |
| Southeast | 5,470 |
| | 1,366 |
| | 4,677 |
| |
| Total | $ | 28,107 |
| | $ | 22,730 |
| | $ | 9,815 |
| |
| | | | | | | 2015 | | 2014 | | 2013 |
| Land option contract abandonments: | | | | | | | | | | |
| West Coast | $ | — |
| | $ | 704 |
| | $ | 797 |
| $ | 352 |
| | $ | 554 |
| | $ | 3,190 |
|
| Southwest | — |
| | 296 |
| | — |
| — |
| | — |
| | — |
|
| Central | 133 |
| | 1,310 |
| | 6,511 |
| 225 |
| | 995 |
| | — |
|
| Southeast | 293 |
| | 751 |
| | 2,802 |
| 984 |
| | 254 |
| | — |
|
| Total | $ | 426 |
| | $ | 3,061 |
| | $ | 10,110 |
| $ | 1,561 |
| | $ | 1,803 |
| | $ | 3,190 |
|
| | | | | | | |
| Joint venture impairments: | | | | | | |
| West Coast | $ | — |
| | $ | — |
| | $ | — |
| |
| Southwest | — |
| | 53,727 |
| | — |
| |
| Central | — |
| | — |
| | — |
| |
| Southeast | — |
| | — |
| | — |
| |
| Total | $ | — |
| | $ | 53,727 |
| | $ | — |
| |
| |
(a) | Corporate and other includes corporate general and administrative expenses. |
|
| | | | | | | |
| | November 30, |
| | 2015 | | 2014 |
| Inventories: | | | |
| Homes under construction | | | |
| West Coast | $ | 535,795 |
| | $ | 536,843 |
|
| Southwest | 112,032 |
| | 65,647 |
|
| Central | 263,345 |
| | 201,164 |
|
| Southeast | 120,184 |
| | 124,618 |
|
| Subtotal | 1,031,356 |
| | 928,272 |
|
| Land under development | | | |
| West Coast | 788,607 |
| | 765,577 |
|
| Southwest | 317,331 |
| | 334,691 |
|
| Central | 421,783 |
| | 363,933 |
|
| Southeast | 238,324 |
| | 245,948 |
|
| Subtotal | 1,766,045 |
| | 1,710,149 |
|
| Land held for future development | | | |
| West Coast | 277,954 |
| | 294,060 |
|
| Southwest | 104,677 |
| | 138,367 |
|
| Central | 22,082 |
| | 22,957 |
|
| Southeast | 111,633 |
| | 124,582 |
|
| Subtotal | 516,346 |
| | 579,966 |
|
| Total | $ | 3,313,747 |
| | $ | 3,218,387 |
|
| | | | |
| Investments in unconsolidated joint ventures: | | | |
| West Coast | $ | 54,360 |
| | $ | 59,552 |
|
| Southwest | 14,697 |
| | 17,388 |
|
| Central | — |
| | — |
|
| Southeast | 2,501 |
| | 2,501 |
|
| Total | $ | 71,558 |
| | $ | 79,441 |
|
| | | | |
| | | | November 30, | November 30, |
| | 2012 | | 2011 | 2015 | | 2014 |
| Assets: | | | | | | |
| West Coast | $ | 930,450 |
| | $ | 995,888 |
| $ | 1,740,299 |
| | $ | 1,695,753 |
|
| Southwest | 319,863 |
| | 338,586 |
| 582,030 |
| | 579,201 |
|
| Central | 369,294 |
| | 336,553 |
| 829,811 |
| | 678,139 |
|
| Southeast | 341,460 |
| | 317,308 |
| 507,844 |
| | 531,011 |
|
| Corporate and other | 596,176 |
| | 492,034 |
| 1,341,359 |
| | 1,262,960 |
|
| Total homebuilding assets | 2,557,243 |
| | 2,480,369 |
| 5,001,343 |
| | 4,747,064 |
|
| Financial services | 4,455 |
| | 32,173 |
| 14,028 |
| | 10,486 |
|
| Total assets | $ | 2,561,698 |
| | $ | 2,512,542 |
| |
| | | | | |
| Investments in unconsolidated joint ventures: | | | | |
| West Coast | $ | 38,372 |
| | $ | 38,405 |
| |
| Southwest | 75,920 |
| | 80,194 |
| |
| Central | — |
| | — |
| |
| Southeast | 9,382 |
| | 9,327 |
| |
| Total | $ | 123,674 |
| | $ | 127,926 |
| $ | 5,015,371 |
| | $ | 4,757,550 |
|
| |
| Note 3. | Financial Services |
The following tables present financial information relating to our financial services reporting segment (in thousands):
| | | | Years Ended November 30, | Years Ended November 30, |
| | 2012 | | 2011 | | 2010 | 2015 | | 2014 | | 2013 |
| Revenues | | | | | | | | | | |
| Insurance commissions | $ | 7,140 |
| | $ | 7,188 |
| | $ | 7,235 |
| $ | 7,137 |
| | $ | 6,566 |
| | $ | 7,177 |
|
| Title services | 2,362 |
| | 1,983 |
| | 992 |
| 3,905 |
| | 3,593 |
| | 3,172 |
|
| Marketing services fees | 2,175 |
| | 1,125 |
| | — |
| — |
| | 1,147 |
| | 1,800 |
|
| Interest income | 6 |
| | 8 |
| | 6 |
| 1 |
| | — |
| | 3 |
|
| Total | 11,683 |
| | 10,304 |
| | 8,233 |
| 11,043 |
| | 11,306 |
| | 12,152 |
|
| Expenses | | | | | | | | | | |
| General and administrative | (2,991 | ) | | (3,512 | ) | | (3,119 | ) | (3,711 | ) | | (3,446 | ) | | (3,042 | ) |
| Operating income | 8,692 |
| | 6,792 |
| | 5,114 |
| 7,332 |
| | 7,860 |
| | 9,110 |
|
| Equity in income/gain on wind down of unconsolidated joint venture | 2,191 |
| | 19,286 |
| | 7,029 |
| |
| Equity in income of unconsolidated joint ventures | | 4,292 |
| | 686 |
| | 1,074 |
|
| Pretax income | $ | 10,883 |
| | $ | 26,078 |
| | $ | 12,143 |
| $ | 11,624 |
| | $ | 8,546 |
| | $ | 10,184 |
|
| | | | November 30, | November 30, |
| | 2012 | | 2011 | 2015 | | 2014 |
| Assets | | | | | | |
| Cash and cash equivalents | $ | 923 |
| | $ | 3,024 |
| $ | 1,299 |
| | $ | 2,402 |
|
| Receivables | 1,859 |
| | 25,495 |
| 2,245 |
| | 1,738 |
|
| Investment in unconsolidated joint venture | 1,630 |
| | 3,639 |
| |
| Investments in unconsolidated joint ventures | | 10,440 |
| | 6,149 |
|
| Other assets | 43 |
| | 15 |
| 44 |
| | 197 |
|
| Total assets | $ | 4,455 |
| | $ | 32,173 |
| $ | 14,028 |
| | $ | 10,486 |
|
| Liabilities | | | | | | |
| Accounts payable and accrued expenses | $ | 3,188 |
| | $ | 7,494 |
| $ | 1,817 |
| | $ | 2,517 |
|
| Total liabilities | $ | 3,188 |
| | $ | 7,494 |
| $ | 1,817 |
| | $ | 2,517 |
|
In the fourth quarterThe equity in income of 2011, we receivedunconsolidated joint ventures for 2013 included a distributiongain of $13.8$1.1 million and established a receivable of $23.5 million recognized in connection with the wind down of KBA Mortgage’sthe business operations. We recordedoperations of a gain of $19.8 millionformer mortgage banking joint venture, which ceased offering mortgage banking services in the fourth quarter of 2011 that was included in equity in income/gain on wind down of unconsolidated joint venture. The receivable was collected in December 2011. In the third quarter of 2012, we recognized an additional gain of $2.1 million in connection with the wind down of KBA Mortgage.
Although KBHMCKB HOME Mortgage Company, which is 100% owned by us, ceased originating and selling mortgage loans onin September 1, 2005, it may be required to repurchase, or provide indemnification with respect to, an individual loan that it funded on or before August 31, 2005 and sold to an investor if the representations or warranties that it made in connection with the sale of the loan are breached, in the event of an early payment default, if the loan does not comply with the underwriting standards or other requirements of the ultimate investor or an applicable insurer, or due to a delinquency or other matters arising in connection with the loan. KB HOME Mortgage Company was not required to repurchase any loans in the past few years.
| |
| Note 4. | Earnings Per Share |
Basic and diluted earnings per share were calculated as follows (in thousands, except per share amounts):
|
| | | | | | | | | | | |
| | Years Ended November 30, |
| | 2015 | | 2014 | | 2013 |
| Numerator: | | | | | |
| Net income | $ | 84,643 |
| | $ | 918,349 |
| | $ | 39,963 |
|
| Less: Distributed earnings allocated to nonvested restricted stock | (33 | ) | | (26 | ) | | (24 | ) |
| Less: Undistributed earnings allocated to nonvested restricted stock | (273 | ) | | (2,667 | ) | | (90 | ) |
| Numerator for basic earnings per share | 84,337 |
| | 915,656 |
| | 39,849 |
|
| Effect of dilutive securities: | | | | | |
| Interest expense and amortization of debt issuance costs associated with convertible senior notes, net of taxes | 2,667 |
| | 2,667 |
| | 2,230 |
|
| Add: Undistributed earnings allocated to nonvested restricted stock | 273 |
| | 2,667 |
| | 90 |
|
| Less: Undistributed earnings reallocated to nonvested restricted stock | (244 | ) | | (2,398 | ) | | (81 | ) |
| Numerator for diluted earnings per share | $ | 87,033 |
| | $ | 918,592 |
| | $ | 42,088 |
|
| Denominator: | | | | | |
| Weighted average shares outstanding — basic | 92,054 |
| | 89,265 |
| | 82,630 |
|
| Effect of dilutive securities: | | | | | |
| Share-based payments | 2,401 |
| | 1,647 |
| | 1,885 |
|
| Convertible senior notes | 8,402 |
| | 8,402 |
| | 7,044 |
|
| Weighted average shares outstanding — diluted | 102,857 |
| | 99,314 |
| | 91,559 |
|
| Basic earnings per share | $ | .92 |
| | $ | 10.26 |
| | $ | .48 |
|
| Diluted earnings per share | $ | .85 |
| | $ | 9.25 |
| | $ | .46 |
|
As discussed in Note 13. Notes Payable, in 2013, we issued the 1.375% Convertible Senior Notes due 2019 that, from issuance, have been convertible into shares of our common stock at a conversion rate of 36.5297 shares for each $1,000 principal amount of the notes. Outstanding stock options to purchase 8.0 million, 5.2 million and 5.2 million shares of common stock were excluded from the diluted earnings per share calculations for 2015, 2014 and 2013, respectively, because the effect of their inclusion would be antidilutive. Contingently issuable shares associated with outstanding PSUs were not included in the basic earnings per share calculations for the periods presented as the vesting conditions have not been satisfied.
Receivables of $64.8$152.7 million at November 30, 20122015 and $66.2$125.5 million at November 30, 20112014 primarily included amounts due from municipalities and utility companies state income taxesand municipalities; escrow deposits to be refunded; and estimated minimum probable recoveries of water intrusion-related repair costs, as described in Note 15. Commitments and Contingencies. Receivables from utility companies and municipalities typically relate to infrastructure improvements we make with respect to our communities. We are generally reimbursed for the cost of such improvements when they are accepted by the utility company or municipality, or after certain events occur, depending on the terms of the applicable agreements. These events may include, but are not limited to, the connection of utilities or the issuance of bonds by the respective municipalities.
Each receivable is evaluated for collectibility at least quarterly, and escrow deposits. At November 30, 2011,allowances for potential losses are established or maintained on applicable receivables also included mortgageswhen collection becomes doubtful, taking into account historical experience, prevailing economic conditions and notes receivable.other relevant factors. Receivables were net of allowances for doubtful accounts of $21.3$12.2 million in 20122015 and $23.7$15.3 million in 20112014.
Inventories consisted of the following (in thousands):
| | | | November 30, | November 30, |
| | 2012 | | 2011 | 2015 | | 2014 |
| Homes under construction | $ | 454,108 |
| | $ | 417,304 |
| $ | 1,031,356 |
| | $ | 928,272 |
|
| Land under development | 567,470 |
| | 572,660 |
| 1,766,045 |
| | 1,710,149 |
|
| Land held for future development | 684,993 |
| | 741,665 |
| 516,346 |
| | 579,966 |
|
| Total | $ | 1,706,571 |
| | $ | 1,731,629 |
| $ | 3,313,747 |
| | $ | 3,218,387 |
|
Homes under construction is comprised of costs associated with homes in various stages of construction and includes direct construction and related land acquisition and land development costs. Land under development primarily consists of land acquisition and land development costs. Land development costs also include capitalized interest and real estate taxestaxes. When home construction begins, the associated with land undergoing improvement activity.acquisition and land development costs are included in homes under construction. Land held for future development principally reflects land acquisition and land development costs related to land where development activity has been suspended or has not yet begun but is expected to occur in the future. These assets held for future development are located in various submarkets where conditions do not presently support further investment or development, or are subject to a building permit moratorium or regulatory restrictions, or are portions of larger land parcels that we plan to build out over several years and/or that have not yet been entitled. We may also suspend development activity if we believe it will result in greater returns and/or maximize the economic performance of a community.
Interest is capitalizedparticular community by delaying improvements for a period of time to, inventories while the related communities are being actively developed and until homes are completed. Capitalized interest is amortized in construction and land costs as the related inventories are deliveredfor instance, allow earlier phases of a long-term, multi-phase community or a neighboring community to homebuyers. For those
communities wheregenerate sales momentum or for market conditions to improve. In some instances, we may activate or resume development activity has been suspended, applicable interest is expensedfor this inventory to accelerate sales and/or our return on investment. We have activated assets previously held for future development in certain markets as incurred. part of our strategic growth initiatives. Interest and real estate taxes are not capitalized on land held for future development.
Our interest costs arewere as follows (in thousands):
| | | | Years Ended November 30, | Years Ended November 30, |
| | 2012 | | 2011 | | 2010 | 2015 | | 2014 | | 2013 |
| Capitalized interest at beginning of year | $ | 233,461 |
| | $ | 249,966 |
| | $ | 291,279 |
| $ | 266,668 |
| | $ | 216,681 |
| | $ | 217,684 |
|
| Capitalized interest related to consolidation of previously unconsolidated joint ventures | — |
| | — |
| | 9,914 |
| |
| Interest incurred (a) | 132,657 |
| | 112,037 |
| | 122,230 |
| 186,885 |
| | 171,541 |
| | 149,101 |
|
| Interest expensed (a) | (69,804 | ) | | (49,204 | ) | | (68,307 | ) | (21,856 | ) | | (30,750 | ) | | (62,690 | ) |
| Interest amortized to construction and land costs | (78,630 | ) | | (79,338 | ) | | (105,150 | ) | |
| Capitalized interest at end of year (b) | $ | 217,684 |
| | $ | 233,461 |
| | $ | 249,966 |
| |
| Interest amortized to construction and land costs (b) | | (143,255 | ) | | (90,804 | ) | | (87,414 | ) |
| Capitalized interest at end of year (c) | | $ | 288,442 |
| | $ | 266,668 |
| | $ | 216,681 |
|
| |
| (a) | Amounts for the year ended November 30, 2012 include a $10.3 million loss2013 included losses on the early extinguishment of debt. Amounts for the year endeddebt of November 30, 2011 include a $3.610.4 million gain onassociated with the early extinguishmentpurchase and retirement of secured debt. Amounts for the year ended November 30, 2010 include a totalcertain senior notes ahead of $1.8 million of debt issuance costs written off in connection with our voluntary reduction of the aggregate commitment under the Credit Facility from $650.0 million to $200.0 million and the voluntary termination of the Credit Facility effective March 31, 2010.their maturity. |
| |
| (b) | Inventory impairment charges are recognized against all inventory costs of a community, such as land acquisition, land development, cost of homeInterest amortized to construction and capitalized interest. land costs for the year ended November 30, 2015 included $16.4 million related to land sales during the period. |
| |
| (c) | Capitalized interest amounts presented in the table reflect the gross amount of capitalized interest, as inventory impairment charges recognized, if any, are not generally allocated to specific components of inventory. |
| |
Note 6.7. | Inventory Impairments and Land Option Contract Abandonments |
EachEach community or land parcel in our owned inventory is assessed to determine if indicators of potential impairment exist. Impairment indicators are assessed separately for each community or land parcel on a quarterly basis and include, but are not
limited to:to, the following: significant decreases in net orders, average selling prices, volume of homes delivered, gross profit margins on homes delivered or projected gross profit margins on homes in backlog or future housing sales;deliveries; significant increases in budgeted land development and home construction costs or cancellation rates; or projected losses on expected future land sales. If indicators of potential impairment exist for a community or land parcel, the identified asset is evaluated for recoverability in accordance with ASC 360.recoverability. We evaluated 135, 13835, 32 and 11831 communities or land parcels for recoverability during the years ended November 30, 20122015, 20112014 and 20102013, respectively. The carrying value of those communities or land parcels evaluated was $286.3 million, $266.9 million and $146.0 million during the years ended November 30, 2015, 2014 and 2013, respectively. As impairment indicators are assessed on a quarterly basis, some of the communities or land parcels evaluated during these years were evaluated in more than one quarterly period. Communities or land parcels evaluated for recoverability in more than one quarterly period, if any, are counted only once for each year shown. In some cases, we have recognized inventory impairment charges for particular communities or land parcels in multiple years. Inventory impairment charges are included in construction and land costs in our consolidated statements of operations.
When an indicator of potential impairment is identified for a community or land parcel, we test the asset for recoverability by comparing the carrying value of the asset to the undiscounted future net cash flows expected to be generated by the asset. The undiscounted future net cash flows are impacted by then-current conditions and trends in the market in which the asset is located as well as factors known to us at the time the cash flows are calculated. With the undiscounted future net cash flows, we also consider recent trends in our orders, backlog, cancellation rates and volume of homes delivered, as well as our expectations related to the following: product offerings; market supply and demand, including estimated average selling prices and related price appreciation; and land development, home construction and overhead costs to be incurred and related cost inflation. With respect to the years ended November 30, 20122015 and 2011, 2014, these expectations reflected our experience that, although there were at times measurable quarterlynotwithstanding fluctuations in our year-over-year and sequentialcompany-wide net orders, backlog levels, homes delivered and housing gross profit margin, these were primarily due to certain period-specific and/or company-specific factors that we believed would be largely mitigated by various strategic actions and/or by observed market trends. These factors included mortgage loan funding issues arising fromon a changeyear-over-year basis, conditions in the nature of our relationships with mortgage lenders; the before and after effects of the Tax Credit that expired in 2010; and a lower community count as a result of our strategic repositioning efforts. We believe the impact of these factors was moderated by our operational transition to our new preferred mortgage lender; our strategic growth initiatives; and our continued ability to generate a consistent or higher average selling price as a result of the demand from our homebuyers for larger home sizes and more design options. By comparison, market conditions for ourmarkets where assessed assets in inventory where impairment indicators were identifiedlocated have been generally stable in 2011 and 2012,or improved, with no significant or sustained deterioration identified, or projected, as to revenue and cost drivers that would prevent or otherwise impact recoverability. Based on this experience, and taking into account the signsgenerally healthy conditions in many of stability and improvement in manyour served markets for new home sales, our inventory assessments as of November 30, 20122015 considered an expected steady if slightly improved, overall sales pace and average selling price performance for 20132016 relative to the pace and performance in recent quarters.
Given the inherent challenges and uncertainties in forecasting future results, our inventory assessments at the time they are made take into consideration whether a community or land parcel is active, meaning whether it is open for sales and/or undergoing development, or whether it is being held for future development. ForDue to the short-term nature of active communities and land parcels due to their short-term nature as compared to land held for future development, our inventory assessments generally assume the continuation of then-current market conditions, subject to identifying information suggesting a significant sustained deterioration or other changes in such conditions. These assessments, at the time made, generally anticipate net orders, average selling prices, volume of homes delivered and costs for land development and home construction to continue at or near then-current levels through the affectedparticular asset’s estimated remaining life. Inventory assessments for our land held for future development consider then-current market conditions as well as subjective forecasts regarding the timing and costs of land development and home construction and related cost inflation; the product(s) to be offered; and the net orders, volume of homes delivered, and selling prices and related price appreciation of the offered product(s) when an associated community is anticipated to open for sales. We evaluate various factors to develop these forecasts, including the availability of and demand for homes and finished lots within the relevant marketplace; historical, current and expected future sales trends for the marketplace; and third-party data, if available. These various estimates, trends, expectations and assumptions used in each of our inventory assessments are specific to each community or land parcel based on what we believe are reasonable forecasts for performance and may vary among communities or land parcels and may vary over time.
We record an inventory impairment charge when the carrying value of a real estate asset is greater than the undiscounted future net cash flows the asset is expected to generate. These real estate assets are written down to fair value, which is primarily based on the estimated future net cash flows discounted for inherent risk associated with each such asset. Inputs used in theour calculation of estimated discounted future net cash flows are specific to each affected community or land parcelreal estate asset and are based on our expectations for each such asset as of the applicable measurement date, including, among others, expectations related to average selling prices and delivery rates.volume of homes delivered. The discount rates we use areused were impacted by the following:following at the time the calculation was made: the risk-free rate of return; expected risk premium based on estimated land development, home construction and delivery timelines; market risk from potential future price erosion; cost uncertainty due to land development or home construction cost increases; and other risks specific to the asset or conditions in the market in which the asset is locatedlocated.
Inventories associated with planned future land sales are stated at the time the assessment was made.
lower of cost or fair value less costs to sell. The estimated fair value of such assets is generally based on an executed contract, broker quotes or similar information.
The following table summarizes ranges for significant quantitative unobservable inputs we utilized in our fair value measurements with respect to the impaired communities, orother than land parcelsheld for sale, written down to fair value during the years presented:
| | | | | Years Ended November 30, | | Years Ended November 30, |
| Unobservable Input (a) | | 2012 | | 2011 | | 2010 | | 2015 | | 2014 | | 2013 |
| Average selling price | | $115,200 - $556,300 | | $142,900 - $391,900 | | $96,600 - $256,400 | | $178,100 - $509,400 | | $216,100 - $316,800 | | $339,700 |
| Deliveries per month | | 1 - 6 | | 1 - 10 | | 3 - 6 | | 2 - 4 | | 1 - 4 | | 1 |
| Discount rate | | 17% - 20% | | 17% - 20% | | 17% - 20% | | 17% - 20% | | 17% - 19% | | 17% |
| |
| (a) | The ranges of inputs used in each period primarily reflect differences between the underlying variability among the various housing markets where each of the impacted communities or land parcels are located, rather than fluctuations in prevailing market conditions. |
Based on the results of our evaluations, we recognized inventory impairment charges of $28.1$8.0 million in 2012 associated with 142015 related to four communities with a post-impairment fair value of $39.9 million. $12.0 million. We decided to change our operational and marketing strategy for these communities in order to monetize our investment more quickly primarily through lowering the average selling price of these homes or by accelerating the overall timing and pace for selling, building and delivering homes on land that had been held for future development. If we change our strategy on any given asset, it is possible that we may have additional impairments in the future.
In 2011,2014, we recognized inventory impairment charges of $22.7$37.6 million associated with 12eight communities or land parcels with a post-impairment fair value of $34.0$30.6 million. Of these charges, $26.6 million. These charges included an $18.1 related to two properties, located in inland southern California and Atlanta, Georgia, where we decided to change our strategy and monetize our investment through land sales rather than build and sell homes on the parcels as previously intended. The remaining $11.0 million adjustment related to six communities primarily located in inland California and Arizona, reflecting decisions we made to monetize our investment in these land positions sooner by accelerating the fair value of real estate collateraloverall timing and pace for selling, building and delivering homes on land that had been held for future development, and/or softening conditions in our Southwest homebuilding reporting segment that we took back on a note receivable in 2011.the relevant submarkets. In 2010,2013, we recognized an inventory impairment chargescharge of $9.8$.4 million associated with eight communities or land parcels,one community, with a post-impairment fair value of $11.6 million. The inventory impairment charges we recognized during 2012, 2011 and 2010 reflected challenging economic and housing market conditions in certain of our served markets. In addition, the inventory impairment charges in 2012 were partly due to changes to our operational or selling strategy for certain communities in an effort to accelerate our return on investment. In some cases, we have recognized inventory impairment charges for particular communities or land parcels in multiple years.$1.1 million.
As of November 30, 20122015, the aggregate carrying value of our inventory that had been impacted by inventory impairment charges was $307.2$254.2 million,, representing 4628 communities and various other land parcels. As of November 30, 20112014, the aggregate carrying value of our inventory that had been impacted by inventory impairment charges was $338.5$266.6 million,, representing 5333 communities and various other land parcels.
Our inventory controlled under land option contracts and other similar contracts is assessed to determine whether it continues to meet our internal investment and marketing standards. Assessments are made separately for each optioned land parcel on a quarterly basis and are affected by the following factors relative to the market in which the asset is located, among others: current and/or anticipated net orders, average selling prices and home delivery volume;volume of homes delivered; estimated land development and home construction costs; and projected profitability on expected future housing or land sales. When a decision is made not to exercise certain land
option contracts and other similar contracts due to market conditions and/or changes in our marketing strategy, we write off the related inventory costs, including non-refundable deposits and unrecoverable pre-acquisition costs. Based on the results of our assessments, we recognized land option contract abandonment charges of $.4$1.6 million corresponding to 4461,166 lots in 20122015, $3.1$1.8 million corresponding to 8301,306 lots in 20112014, and $10.1$3.2 million corresponding to 1,007295 lots in 20102013. Inventory impairmentWe sometimes abandon land option contracts or other similar contracts when we have incurred costs of less than $100,000; such costs and landthe corresponding lots, which totaled 78 lots in 2015, 7,292 lots in 2014 and 9,406 lots in 2013, are not included in the amounts above. Land option contract abandonment charges are included in construction and land costs in our consolidated statements of operations.
The estimated remaining life of each community or land parcel in our inventory depends on various factors, such as the total number of lots remaining; the expected timeline to acquire and entitle land and develop lots to build homes; the anticipated future net order and cancellation rates; and the expected timeline to build and deliver homes sold. While it is difficult to determine a precise timeframe for any particular inventory asset, we estimate our inventory assets’ remaining operating lives under current and expected future market conditions to range generally fromone year to in excess of 10 years. Basedbased on current market conditions and expected delivery timelines, we estimate our inventory assets’ remaining operating lives to range generally from one year to in excess of 10 years, and expect to realize, on an overall basis, the majority of our current inventory balance withinfive years.
Due to the judgment and assumptions applied in the estimation process with respect toour inventory impairments,impairment and land option contract abandonments,abandonment assessment processes, and in our estimations of the remaining operating lives of our inventory assets and the realization of our inventory balances, particularly as to land held for future development, it is possible that actual results could differ substantially from those estimated.
| |
Note 7. | Fair Value Disclosures |
ASC 820 provides a framework for measuring the fair value of assets and liabilities under GAAP, and establishes a fair value hierarchy that requires an entity to maximize the use of observable inputs and minimize the use of unobservable inputs when measuring fair value. The fair value hierarchy can be summarized as follows:
| |
Level 1 | Fair value determined based on quoted prices in active markets for identical assets or liabilities.
|
| |
Level 2 | Fair value determined using significant observable inputs, such as quoted prices for similar assets or liabilities or quoted prices for identical or similar assets or liabilities in markets that are not active, inputs other than quoted prices that are observable for the asset or liability, or inputs that are derived principally from or corroborated by observable market data, by correlation or other means.
|
| |
Level 3 | Fair value determined using significant unobservable inputs, such as pricing models, discounted cash flows, or similar techniques.
|
Fair value measurements are used for inventories on a nonrecurring basis when events and circumstances indicate the carrying value is not recoverable. The following table presents our assets measured at fair value on a nonrecurring basis for the year ended November 30, 2012 and 2011 (in thousands):
|
| | | | | | | | | | |
| | | Fair Value |
| Description | | Hierarchy | | November 30,
2012 (a) | | November 30, 2011 (a) |
| Long-lived assets held and used | | Level 2 | | $ | — |
| | $ | 75 |
|
| Long-lived assets held and used | | Level 3 | | 39,851 |
| | 33,947 |
|
| Total | | | | $ | 39,851 |
| | $ | 34,022 |
|
| |
(a) | Amounts represent the aggregate fair value for communities or land parcels where we recognized inventory impairment charges during the period, as of the date that the fair value measurements were made. The carrying value for these communities or land parcels may have subsequently increased or decreased from the fair value reflected due to activity that has occurred since the measurement date. |
In accordance with the provisions of ASC 360, long-lived assets held and used with a carrying value of $68.0 million were written down to their fair value of $39.9 million during the year ended November 30, 2012, resulting in inventory impairment charges of $28.1 million. Long-lived assets held and used with a carrying value of $56.7 million were written down to their fair value of $34.0 million during the year ended November 30, 2011, resulting in inventory impairment charges of $22.7 million.
The fair values for our long-lived assets held and used that were determined using Level 2 inputs were based on an executed contract. The fair values for long-lived assets held and used that were determined using Level 3 inputs were primarily based on the estimated future net cash flows discounted for inherent risk associated with each asset as described in Note 6. Inventory Impairments and Land Option Contract Abandonments in this report. The discount rates we use are impacted by the following: the risk-free rate of return; expected risk premium based on estimated land development, home construction and delivery timelines;
market risk from potential future price erosion; cost uncertainty due to land development or home construction cost increases; and other risks specific to the asset or conditions in the market in which the asset is located at the time the assessment was made. These factors were specific to each affected community or land parcel and may have varied among communities or land parcels.
Our financial instruments consist of cash and cash equivalents, restricted cash, mortgages and notes receivable, senior notes, and mortgages and land contracts due to land sellers and other loans. Fair value measurements of financial instruments are determined by various market data and other valuation techniques, as appropriate. When available, we use quoted market prices in active markets to determine fair value.
The following table presents the fair value hierarchy, carrying values and estimated fair values of our financial instruments, except those for which the carrying values approximate fair values (in thousands):
|
| | | | | | | | | | | | | | | | | |
| | | | November 30, |
| | | | 2012 | | 2011 |
| | Fair Value Hierarchy | | Carrying Value | | Estimated Fair Value | | Carrying Value | | Estimated Fair Value |
| Financial Liabilities: | | | | | | | | | |
| Senior notes due February 1, 2014 at 5 3/4% | Level 2 | | $ | 75,911 |
| | $ | 77,679 |
| | $ | 249,647 |
| | $ | 232,500 |
|
| Senior notes due January 15, 2015 at 5 7/8% | Level 2 | | 101,999 |
| | 106,003 |
| | 299,273 |
| | 270,000 |
|
| Senior notes due June 15, 2015 at 6 1/4% | Level 2 | | 236,826 |
| | 248,751 |
| | 449,795 |
| | 401,625 |
|
| Senior notes due September 15, 2017 at 9.10% | Level 2 | | 261,430 |
| | 305,413 |
| | 260,865 |
| | 235,519 |
|
| Senior notes due June 15, 2018 at 7 1/4% | Level 2 | | 299,129 |
| | 325,500 |
| | 299,007 |
| | 251,625 |
|
| Senior notes due March 15, 2020 at 8.00% | Level 2 | | 345,209 |
| | 390,250 |
| | — |
| | — |
|
| Senior notes due September 15, 2022 at 7.50% | Level 2 | | 350,000 |
| | 378,000 |
| | — |
| | — |
|
The fair values of our senior notes are generally estimated based on quoted market prices for these instruments. The carrying values reported for cash and cash equivalents, restricted cash, mortgages and notes receivable, and mortgages and land contracts due to land sellers and other loans approximate fair values.
| |
| Note 8. | Variable Interest Entities |
We participate in joint ventures from time to time that conduct land acquisition, land development and/or other homebuilding activities in various markets where our homebuilding operations are located. Our investments in these joint ventures may create
a variable interest in a VIE, depending on the contractual terms of the arrangement. We analyze our joint ventures in accordance with ASC 810 to determine whether they are VIEs and, if so, whether we are the primary beneficiary. All None of our joint ventures at November 30, 20122015 and 20112014were determined under the provisions of ASC 810 to be unconsolidatedVIEs. All of our joint ventures were unconsolidated and were accounted for under the equity method either because they were not VIEs and we did not have a controlling financial interest or, if they were VIEs, we were not the primary beneficiary of the VIEs.interest.
In the ordinary course of our business, we enter into land option contracts and other similar contracts to acquire rights to land for the construction of homes. The use of these land option contracts and other similar contracts generally allows us to reduce the market risks associated with direct land ownership and development, and to reduce our capital and financial commitments, including interest and other carrying costs. Under suchthese contracts, we typically pay a specified option or earnest money deposit in consideration for the right to purchase land in the future, usually at a predetermined price. Under the requirements
We analyze each of ASC 810, certain of these contracts may create a variable interest for us, with the land seller being identified as a VIE.
In compliance with ASC 810, we analyze our land option contracts and other similar contracts to determine whether the corresponding land sellers are VIEsseller is a VIE and, if so, whether we are the primary beneficiary. Although we do not have legal title to the underlying land, ASC 810 requires uswe are required to consolidate a VIE if we are determined to be the primary beneficiary. In determining whether we are the primary beneficiary, we consider, among other things, whether we have the power to direct the activities of the VIE that most significantly impact the VIE’s economic performance. Such activities would include, among other things, determining or limiting the scope or purpose of the VIE, selling or transferring property owned or controlled by the VIE, or arranging financing for the VIE. As a result of our analyses, we determined that as of November 30, 20122015 and 20112014 we were not the primary beneficiary of any VIEs from which we have acquired rights to land under land option contracts and other similar contracts.
whether we are the primary beneficiary of a VIE.
The following table presents a summary of our interests in land option contracts and other similar contracts (in thousands):
| | | | November 30, 2012 | | November 30, 2011 | November 30, 2015 | | November 30, 2014 |
| | Cash Deposits | | Aggregate Purchase Price | | Cash Deposits | | Aggregate Purchase Price | Cash Deposits | | Aggregate Purchase Price | | Cash Deposits | | Aggregate Purchase Price |
| Unconsolidated VIEs | $ | 8,463 |
| | $ | 327,196 |
| | $ | 8,097 |
| | $ | 122,125 |
| $ | 32,436 |
| | $ | 611,567 |
| | $ | 10,633 |
| | $ | 520,628 |
|
| Other land option contracts and other similar contracts | 17,219 |
| | 298,139 |
| | 12,830 |
| | 222,940 |
| 22,101 |
| | 576,140 |
| | 22,426 |
| | 437,842 |
|
| | $ | 25,682 |
| | $ | 625,335 |
| | $ | 20,927 |
| | $ | 345,065 |
| |
| Total | | $ | 54,537 |
| | $ | 1,187,707 |
| | $ | 33,059 |
| | $ | 958,470 |
|
In addition to the cash deposits presented in the table above, our exposure to loss related to our land option contracts and other similar contracts with third parties and unconsolidated entities consisted of pre-acquisition costs of $65.6 million at $25.4November 30, 2015 and $48.0 million at November 30, 2012 and $31.5 million at November 30, 2011.2014. These pre-acquisition costs and cash deposits were included in inventories in our consolidated balance sheets. We also had outstanding letters of credit of $.1 million at $.5 million at November 30, 2012 and 2014$1.7 million at November 30, 2011 in lieu of cash deposits under certain land option contracts and other similar contracts. There were no such outstanding letters of credit at November 30, 2015.
We also evaluate our land option contracts and other similar contracts for financing arrangements, in accordance with ASC 470, and, as a result of our evaluations, increased inventories, with a corresponding increase to accrued expenses and other liabilities, in our consolidated balance sheets by$4.1 $110.0 million at November 30, 20122015 and $23.9$3.1 million at November 30, 20112014.
| |
| Note 9. | Investments in Unconsolidated Joint Ventures |
We have investments in unconsolidated joint ventures that conduct land acquisition, land development and/or other homebuilding activities in various markets where our homebuilding operations are located. Our partners in these unconsolidated joint ventures are unrelated homebuilders, and/or land developers and other real estate entities, or commercial enterprises. These investments are designed primarily to reduce market and development risks and to increase the number of lots owned and controlled by us.we own or control. In some instances, participating in unconsolidated joint ventures has enabled us to acquire and develop land that we might not otherwise have had access to due to a project’s size, financing needs, duration of development or other circumstances. While we consider our participation in unconsolidated joint ventures as potentially beneficial to our homebuilding activities, we do not view such participation as essential and have unwound our participation in a number of unconsolidated joint ventures in the past few years.
essential.
We typically have obtained rights to acquire portions of the land held by the unconsolidated joint ventures in which we currently participate. When an unconsolidated joint venture sells land to our homebuilding operations, we defer recognition of our share of such unconsolidated joint venture’s earnings (losses) until a home sale is closed and title passes to a homebuyer, at which time we account for those earnings (losses) as a reduction of(increase) to the cost of purchasing the land from the unconsolidated joint venture. We defer recognition of our share of such unconsolidated joint venture losses only to the extent profits are to be generated from the sale of the home to a homebuyer.
We and our unconsolidated joint venture partners make initial and/or ongoing capital contributions to these unconsolidated joint ventures, typically on a pro rata basis, equalaccording to our respective equity interests. The obligations to make capital contributions are governed by each such unconsolidated joint venture’s respective operating agreement and related governing documents.
Each unconsolidated joint venture is obligated to maintain financial statements in accordance with GAAP. We share in the profits and lossesearnings (losses) of these unconsolidated joint ventures generally in accordance with our respective equity interests. In some instances, we recognize profits and lossesearnings (losses) related to our investment in an unconsolidated joint venture that differ from our equity interest in the unconsolidated joint venture. This may arisetypically arises from impairments that we recognize related to our investment that differ from the impairments the unconsolidated joint venture recognizes with respect to the unconsolidated joint venture’s assets; differences between our basis in assets we have transferred to the unconsolidated joint venture and the unconsolidated joint venture’s basis in those assets; our deferral of the unconsolidated joint venture’s profitsearnings (losses) from land sales to us;us, or other items.
With respect to our investments in unconsolidated joint ventures, our equity in loss of unconsolidated joint ventures included impairment charges of $53.7 million in 2011. There were no such impairment charges in 2012 or 2010. In 2011, the impairment charge reflected the write off of our remaining investment in South Edge, a residential development joint venture in our Southwest reporting segment. We wrote off our remaining investment based on our determination that South Edge was no longer able to perform its activities as originally intended following a court decision in the first quarter of 2011 to enter into an order for relief on a Chapter 11 involuntary bankruptcy petition (the “Petition”) filed against South Edge.
The following table presents combined condensed information from the statements of operations of our unconsolidated joint ventures (in thousands):
| | | | Years Ended November 30, | Years Ended November 30, |
| | 2012 | | 2011 | | 2010 | 2015 | | 2014 | | 2013 |
| Revenues | $ | 31,772 |
| | $ | 230 |
| | $ | 122,200 |
| $ | 15,322 |
| | $ | 12,538 |
| | $ | 17,446 |
|
| Construction and land costs | (21,467 | ) | | (54 | ) | | (120,010 | ) | (23,123 | ) | | (10,790 | ) | | (10,709 | ) |
| Other expenses, net | (2,009 | ) | | (4,506 | ) | | (19,362 | ) | (3,360 | ) | | (1,476 | ) | | (4,042 | ) |
| Income (loss) | $ | 8,296 |
| | $ | (4,330 | ) | | $ | (17,172 | ) | $ | (11,161 | ) | | $ | 272 |
| | $ | 2,695 |
|
For the years ended November 30, 2015, 2014 and 2013, combined revenues and construction and land costs were generated primarily from land sales.
The following table presents combined condensed balance sheet information for our unconsolidated joint ventures (in thousands):
| | | | November 30, | November 30, |
| | 2012 | | 2011 | 2015 | | 2014 |
| Assets | | | | | | |
| Cash | $ | 29,721 |
| | $ | 8,923 |
| $ | 23,309 |
| | $ | 23,699 |
|
| Receivables | 6,104 |
| | 19,503 |
| 7,546 |
| | 5,106 |
|
| Inventories | 352,791 |
| | 368,306 |
| 175,196 |
| | 153,427 |
|
| Other assets | 1,175 |
| | 151 |
| 910 |
| | — |
|
| Total assets | $ | 389,791 |
| | $ | 396,883 |
| $ | 206,961 |
| | $ | 182,232 |
|
| Liabilities and equity | | | | | | |
| Accounts payable and other liabilities | $ | 88,027 |
| | $ | 96,981 |
| $ | 17,108 |
| | $ | 10,824 |
|
| Notes payable (a) | | 39,064 |
| | — |
|
| Equity | 301,764 |
| | 299,902 |
| 150,789 |
| | 171,408 |
|
| Total liabilities and equity | $ | 389,791 |
| | $ | 396,883 |
| $ | 206,961 |
| | $ | 182,232 |
|
| |
| (a) | In August 2015, one of our unconsolidated joint ventures entered into a construction loan agreement with a third-party lender to finance its land development activities that is secured by the underlying property and related project assets. The unconsolidated joint venture’s outstanding secured debt is non-recourse to us and is scheduled to mature in August 2018. None of our other unconsolidated joint ventures had outstanding debt at November 30, 2015. None of our unconsolidated joint ventures had outstanding debt at November 30, 2014. |
The following table presents additional information relating to our investments in unconsolidated joint ventures (dollars in thousands):
| | | | November 30, | November 30, |
| | 2012 | | 2011 | 2015 | | 2014 |
| Number of investments in unconsolidated joint ventures | 8 |
| | 8 |
| 7 |
| | 6 |
|
| Investments in unconsolidated joint ventures | $ | 123,674 |
| | $ | 127,926 |
| $ | 71,558 |
| | $ | 79,441 |
|
| Number of unconsolidated joint venture lots controlled under land option contracts and other similar contracts | | 677 |
| | 618 |
|
Our unconsolidated joint ventures finance land and inventory investments for a project through a variety of arrangements, and certain of
In 2014, we sold our unconsolidated joint ventures have obtained loans from third-party lenders that are secured by the underlying property and related project assets. However, none of our unconsolidated joint ventures had outstanding debt at November 30, 2012 or 2011.
In certain instances, we and/or our partner(s)interest in an unconsolidated joint venture have provided completion and/or carve-out guarantees toin Maryland for $10.1 million, which resulted in a gain of $3.2 million that was included in equity in income of unconsolidated joint ventures in our consolidated statement of operations for the year ended November 30, 2014.
We and our partner in the unconsolidated joint venture’s lenders. A completion guaranty refersventure that entered into the construction loan agreement described above provided certain guarantees and indemnities to the physical completionlender, including a guaranty to complete the construction of improvements for the project; a project and/orguaranty against losses the obligation to contribute capital to an unconsolidated joint venture to enable it to fund its completion obligations. Our potential responsibility under our completion guarantees, if triggered, is highly dependent on the facts of a particular case. A carve-out guaranty refers to the payment of losses a lender suffers due to certain bad acts or omissionsfailures to act by anthe unconsolidated joint venture or its partners, such as fraudpartners; a guaranty of interest payments on the outstanding balance of the secured debt under the construction loan agreement; and an indemnity of the lender from environmental issues. In each case, our actual responsibility under the foregoing guaranty and indemnity obligations is limited to our pro rata interest in the unconsolidated joint venture. We do not have a guaranty or misappropriation,any other obligation to repay or due to environmental liabilities arisingsupport the value of the collateral underlying the unconsolidated joint venture’s outstanding secured debt under the construction loan agreement. However, various financial and non-financial covenants apply with respect to the relevant project.outstanding secured debt under the construction loan agreement and the related guaranty and indemnity obligations, and a failure to comply with such covenants could result in a default and cause the lender to seek to enforce such guaranty and indemnity obligations, if and as may be applicable. As noneof November 30, 2015, we were in compliance with the applicable terms of our unconsolidated joint ventures had outstanding debt at November 30, 2012 or 2011, we did not have exposurerelevant covenants with respect to any related completion or carve-out guarantees as of those dates.
In addition to completionthe construction loan agreement. We do not believe that our existing exposure under our guaranty and carve-out guarantees, we provided the Springing Guaranty to the Administrative Agent in connection with secured loans made to South Edge. On February 3, 2011, a bankruptcy court entered an order for relief on the Petition filed against South Edge and appointed a Chapter 11 trustee for South Edge. Although we believed that there were potential offsets or defenses to prevent or minimize the enforcement of the Springing Guaranty, as a result of the February 3, 2011 order
for relief on the Petition, we considered it probable, based on the terms of the Springing Guaranty, that we became responsible to pay certain amounts to the Administrative Agentindemnity obligations related to the Springing Guaranty. Therefore, beginning inunconsolidated joint venture’s outstanding secured debt under the first quarter of 2011,construction loan agreement is material to our consolidated financial statements reflected a net payment obligation, representing our estimate of the probable amount that we would pay to the Administrative Agent (on behalf of the South Edge lenders) related to the Springing Guaranty and to pay for certain fees, expenses and charges and for certain allowed general unsecured claims in the South Edge bankruptcy case. This estimate was evaluated at the end of each subsequent quarterly period in 2011 and updated to reflect our belief of our probable net payment obligation at the time. In connection with the South Edge Plan and the resolution of other matters surrounding South Edge, we made payments of $251.9 million in the fourth quarter of 2011, including a payment to the Administrative Agent, which satisfied the respective liens of the Administrative Agent and most of the South Edge lenders on the land South Edge owned. Accordingly, our obligations under the Springing Guaranty were eliminated. As a result of recording a probable obligation related to the Springing Guaranty and the bankruptcy court’s confirmation of the South Edge Plan, and taking into account accruals we had previously established with respect to our investment in South Edge, we recognized an aggregate loss on loan guaranty charge of $30.8 million in our consolidated statements of operations for the year ended November 30, 2011. This charge was in addition to the joint venture impairment charge of $53.7 million that we recognized in 2011 to write off our remaining investment in South Edge.
Our investments in unconsolidated joint ventures as of November 30, 2012 and 2011 included our investment of $71.0 million and $75.5 million, respectively, in Inspirada Builders, LLC, an unconsolidated joint venture that was formed in 2011 in connection with the South Edge Plan and in which a wholly owned subsidiary of ours is a member. As part of the terms of the South Edge Plan, land previously owned by the South Edge joint venture, including our share that consists of approximately 600 developable acres, was acquired by Inspirada Builders, LLC in November 2011. We anticipate that we will acquire our share of the land from Inspirada Builders, LLC through a future distribution.
Our initial investment of $75.5 million in Inspirada Builders, LLC consisted of $75.2 million, the estimated fair value as of November 30, 2011 of our share of the land the venture holds, and a $.3 million initial capital contribution to fund the venture’s operations. We calculated this estimated fair value of our share of the land using a present value methodology and assumed that we would develop the land, build and sell homes on most of the land, and sell the remainder of the developed land. This fair value estimate at November 30, 2011 reflected our expectations of the price we would receive for our share of the land in the land’s then-current state in an orderly (not a forced) transaction under then-prevailing market conditions. This fair value estimate of our share of the land reflected judgments and assumptions believed to be appropriate based on the information known to us at the time concerning, among other things, (a) southern Nevada housing market supply and demand conditions, including estimates of average selling prices; (b) potential future home sales and cancellation rates; (c) entitlements and development plans for the land; (d) land development, home construction and overhead costs to be incurred; and (e) a risk-free rate of return and an expected risk premium, in each case in relation to an expected 15-year life for the project. This fair value estimate was corroborated by a third-party appraisal conducted in the fourth quarter of 2011. Due to the judgments and assumptions applied in the fair value estimation process, it is possible that actual results could differ substantially from those estimated; however, we did not identify any impairment to our investment in Inspirada Builders, LLC as of November 30, 2012.statements.
Other assets consisted of the following (in thousands):
| | | | November 30, | November 30, |
| | 2012 | | 2011 | 2015 | | 2014 |
| Cash surrender value of insurance contracts | $ | 64,757 |
| | $ | 59,718 |
| $ | 67,786 |
| | $ | 70,571 |
|
| Debt issuance costs | | 25,408 |
| | 27,082 |
|
| Property and equipment, net | 7,920 |
| | 7,801 |
| 13,100 |
| | 11,831 |
|
| Debt issuance costs (a) | 14,563 |
| | 4,219 |
| |
| Prepaid expenses | 7,810 |
| | 2,214 |
| 6,480 |
| | 5,431 |
|
| Net deferred tax assets | — |
| | 1,152 |
| |
| Total | $ | 95,050 |
| | $ | 75,104 |
| $ | 112,774 |
| | $ | 114,915 |
|
| |
(a) | The increase in debt issuance costs as of November 30, 2012 compared to November 30, 2011 primarily reflected the costs associated with our issuance of the $350 Million8.00% Senior Notes and the $350 Million7.50% Senior Notes during 2012.
|
| |
| Note 11. | Accrued Expenses and Other Liabilities |
Accrued expenses and other liabilities consisted of the following (in thousands):
| | | | November 30, | November 30, |
| | 2012 | | 2011 | 2015 | | 2014 |
| Construction defect and other litigation liabilities | $ | 107,111 |
| | $ | 101,017 |
| |
| Inventory-related obligations (a) | | $ | 148,887 |
| | $ | 52,009 |
|
| Employee compensation and related benefits | 97,189 |
| | 76,960 |
| 114,456 |
| | 113,875 |
|
| Self-insurance and other litigation liabilities | | 96,496 |
| | 89,606 |
|
| Accrued interest payable | | 62,645 |
| | 63,275 |
|
| Warranty liability | 47,822 |
| | 67,693 |
| 49,085 |
| | 45,196 |
|
| Accrued interest payable | 47,392 |
| | 43,129 |
| |
| Liabilities related to inventory not owned | 4,100 |
| | 23,903 |
| |
| Customer deposits | | 14,563 |
| | 15,197 |
|
| Real estate and business taxes | 8,453 |
| | 10,770 |
| 14,255 |
| | 13,684 |
|
| Other | 28,278 |
| | 50,934 |
| 13,027 |
| | 17,040 |
|
| Total | $ | 340,345 |
| | $ | 374,406 |
| $ | 513,414 |
| | $ | 409,882 |
|
| |
| (a) | Represents liabilities for inventory not owned associated with financing arrangements discussed in Note 8. Variable Interest Entities, as well as liabilities for fixed or determinable amounts associated with TIFE assessments. As homes are delivered, the obligation to pay the remaining TIFE assessments associated with each underlying lot is transferred to the homebuyer. As such, these assessment obligations will be paid by us only to the extent we do not deliver homes on applicable lots before the related TIFE obligations mature. |
| |
| Note 12. | Mortgages and Notes PayableIncome Taxes |
Mortgages and notes payable consisted of the following (in thousands):
|
| | | | | | | |
| | November 30, |
| | 2012 | | 2011 |
| Mortgages and land contracts due to land sellers and other loans (6% to 7% at November 30, 2012 and 2011) | $ | 52,311 |
| | $ | 24,984 |
|
| Senior notes due February 1, 2014 at 5 3/4% | 75,911 |
| | 249,647 |
|
| Senior notes due January 15, 2015 at 5 7/8% | 101,999 |
| | 299,273 |
|
| Senior notes due June 15, 2015 at 6 1/4% | 236,826 |
| | 449,795 |
|
| Senior notes due September 15, 2017 at 9.10% | 261,430 |
| | 260,865 |
|
| Senior notes due June 15, 2018 at 7 1/4% | 299,129 |
| | 299,007 |
|
| Senior notes due March 15, 2020 at 8.00% | 345,209 |
| | — |
|
| Senior notes due September 15, 2022 at 7.50% | 350,000 |
| | — |
|
| Total | $ | 1,722,815 |
| | $ | 1,583,571 |
|
Letter of Credit Facilities.Income Tax Benefit (Expense). We maintain our LOC Facilities with various financial institutions to obtain letters of credit in the ordinary course of operating our business. As of November 30, 2012 and 2011, $41.9 million and $63.8 million, respectively, of letters of credit were outstanding under our LOC Facilities. Our LOC Facilities require us to deposit and maintain cash with the issuing financial institutions as collateral for our letters of credit outstanding. As of November 30, 2012 and 2011, the amount of cash maintained for our LOC Facilities totaled $42.4 million and $64.5 million, respectively, and was included in restricted cash on our consolidated balance sheets as of those dates. We may maintain, revise or, if necessary or desirable, enter into additional or expanded letter of credit facilities, or enter into a revolving credit facility, with the same or other financial institutions.
Mortgages and Land Contracts Due to Land Sellers and Other Loans. During 2011, we repaid debt that was secured by a multi-level residential building we operated as a rental property, which we sold during that year. As the secured debt was repaid at a discount prior to its scheduled maturity, we recognized a gain of $3.6 million on the early extinguishment of secured debt. Inventories having a carrying value of $94.1 million as of November 30, 2012 are pledged to collateralize mortgages and land contracts due to land sellers and other loans.
Shelf Registration. On September 20, 2011, we filed the 2011 Shelf Registration with the SEC, registering debt and equity securities that we may issue from time to time in amounts to be determined. The 2011 Shelf Registration replaced our previously effective shelf registration statement filed with the SEC on October 17, 2008 (the “2008 Shelf Registration”).
Senior Notes. All of our senior notes outstanding at November 30, 2012 and 2011 represent senior unsecured obligations, rank equally in right of payment with all of our existing and future indebtedness and are unconditionally guaranteed jointly and severally by the Guarantor Subsidiaries on a senior unsecured basis.At our option, these notes may be redeemed, in whole at any time or from time to time in part, at a redemption price equal to the greater of (i) 100% of the principal amount of the notes being redeemed and (ii) the sum of the present values of the remaining scheduled payments of principal and interest on the notes being
redeemed discounted to the redemption date at a defined rate, plus, in each case, accrued and unpaid interest on the notes being redeemed to the applicable redemption date.
On June 30, 2004, we issued the $350 Million 6 3/8% Senior Notes at 99.3% of the principal amount of the notes in a private placement. On December 3, 2004, we exchanged all of the privately placed $350 Million 6 3/8% Senior Notes for notes that were substantially identical except that the new $350 Million 6 3/8% Senior Notes were registered under the Securities Act of 1933. On July 30, 2009, we purchased $250.0 million in aggregate principal amount of the $350 Million 6 3/8% Senior Notes pursuant to a tender offer simultaneous with the issuance of the $265 Million9.10% Senior Notes. On August 15, 2011, we repaid the remaining $100.0 million in aggregate principal amount of the $350 Million 6 3/8% Senior Notes at their maturity.
On January 28, 2004, we issued the $250 Million 5 3/4% Senior Notes at 99.474% of the principal amount of the notes in a private placement. On June 16, 2004, we exchanged all of the privately placed $250 Million 5 3/4% Senior Notes for notes that are substantially identical except that the new $250 Million 5 3/4% Senior Notes are registered under the Securities Act of 1933.
On December 15, 2004, pursuant to the shelf registration statement filed with the SEC on November 12, 2004 (the “2004 Shelf Registration”), we issued the $300 Million 5 7/8% Senior Notes at 99.357% of the principal amount of the notes.
On June 2, 2005, pursuant to the 2004 Shelf Registration, we issued the $450 Million 6 1/4% Senior Notes at 100.614% of the principal amount of the notes.
During 2012, we purchased a portion of each of the $250 Million 5 3/4% Senior Notes, the $300 Million 5 7/8% Senior Notes and the $450 Million 6 1/4% Senior Notes, in each case pursuant to the terms of the applicable January 2012 Tender Offers and the applicable July 2012 Tender Offers, as discussed below.
On July 30, 2009, pursuant to the 2008 Shelf Registration, we issued the $265 Million9.10% Senior Notes at 98.014% of the principal amount of the notes. We used substantially all of the net proceeds from the issuance of the $265 Million9.10% Senior Notes to purchase, pursuant to a simultaneous tender offer, $250.0 million in aggregate principal amount of the $350 Million 6 3/8% Senior Notes.
On April 3, 2006, pursuant to the 2004 Shelf Registration, we issued $300.0 million of 7 1/4% senior notes due 2018 at 99.486% of the principal amount of the notes.
On February 7, 2012, pursuant to the 2011 Shelf Registration, we issued the $350 Million8.00% Senior Notes at 101% of the principal amount of the notes. We used substantially all of the net proceeds from this issuance to purchase, pursuant to the terms of the applicable January 2012 Tender Offers, $56.3 million in aggregate principal amount of the $250 Million 5 3/4% Senior Notes, $130.0 million in aggregate principal amount of the $300 Million 5 7/8% Senior Notes, and $153.7 million in aggregate principal amount of the $450 Million 6 1/4% Senior Notes. The applicable January 2012 Tender Offers expired on February 15, 2012. The total amount paid to purchase these senior notes was $340.5 million. We incurred a loss of $2.0 million in the first quarter of 2012 related to the early redemption of debt due to a premium paid under the applicable January 2012 Tender Offers and the unamortized original issue discount.
On July 31, 2012, pursuant to the 2011 Shelf Registration, we issued the $350 Million7.50% Senior Notes at 100% of the principal amount of the notes. We used $252.2 million of the net proceeds from this issuance to purchase, pursuant to the terms of the applicable July 2012 Tender Offers, $117.7 million in aggregate principal amount of the $250 Million 5 3/4% Senior Notes, $67.8 million in aggregate principal amount of the $300 Million 5 7/8% Senior Notes, and $59.4 million in aggregate principal amount of the $450 Million 6 1/4% Senior Notes. The applicable July 2012 Tender Offers expired on August 7, 2012. We used the remaining net proceeds from this issuance for general corporate purposes. We incurred a loss of $8.3 million in the third quarter of 2012 related to the early redemption of debt due to a premium paid under the applicable July 2012 Tender Offers and the unamortized original issue discount.
If a change in control occurs as defined in the instruments governing each of the $265 Million 9.10% Senior Notes, the $350 Million 8.00% Senior Notes, and the $350 Million 7.50% Senior Notes, we would be required to offer to purchase these notes (but not our other outstanding senior notes) at 101% of their principal amount, together with all accrued and unpaid interest, if any.
The indenture governing our senior notes does not contain any financial maintenance covenants. Subject to specified exceptions, the indenture contains certain restrictive covenants that, among other things, limit our ability to incur secured indebtedness, or engage in sale-leaseback transactions involving property or assets above a certain specified value. Unlike our other senior notes, the terms governing the $265 Million 9.10% Senior Notes, the $350 Million 8.00% Senior Notes, and the $350 Million 7.50% Senior Notes contain certain limitations related to mergers, consolidations, and sales of assets.
As of November 30, 2012, we were in compliance with the applicable terms of all of our covenants under our senior notes, the indenture, and mortgages and land contracts due to land sellers and other loans. Our ability to secure future debt financing
may depend in part on our ability to remain in such compliance.
Principal payments on senior notes, mortgages and land contracts due to land sellers and other loans are due as follows: 2013 — $37.9 million; 2014 —$88.8 million; 2015 — $340.4 million; 2016 — $0; 2017 — $261.4 million; and thereafter — $994.3 million.
| |
Note 13. | Commitments and Contingencies |
Commitments and contingencies include typical obligations of homebuilders for the completion of contracts and those incurred in the ordinary course of business.
Warranty. We provide a limited warranty on all of our homes.The specific terms and conditions of these limited warranties vary depending upon the markets in which we do business. We generally provide a structural warranty of10 years, a warranty on electrical, heating, cooling, plumbing and other building systems each varying from two to five years based on geographic market and state law, and a warranty of one year for other components of the home. We estimate the costs that may be incurred under each limited warranty and record a liability in the amount of such costs at the time the revenue associated with the sale of each home is recognized.Our primary assumption in estimating the amounts we accrue for warranty costs is that historical claims experience is a strong indicator of future claims experience. Factors that affect our warranty liability include the number of homes delivered, historical and anticipated rates of warranty claims, and cost per claim. We periodically assess the adequacy of our accrued warranty liability, which is included in accrued expenses and other liabilities in the consolidated balance sheets, and adjust the amount as necessary based on our assessment.Our assessment includes the review of our actual warranty costs incurred to identify trends and changes in our warranty claims experience, and considers our home construction quality and customer service initiatives and outside events.While we believe the warranty liability currently reflected in our consolidated balance sheets to be adequate, unanticipated changes in the legal environment, local weather, land or environmental conditions, quality of materials or methods used in the construction of homes, or customer service practices could have a significant impact on our actual warranty costs in the future and such amounts could differ from our current estimates.
The changes in our warranty liability are as follows (in thousands):
|
| | | | | | | | | | | |
| | Years Ended November 30, |
| | 2012 | | 2011 | | 2010 |
| Balance at beginning of year | $ | 67,693 |
| | $ | 93,988 |
| | $ | 135,749 |
|
| Warranties issued | 8,416 |
| | 4,852 |
| | 5,173 |
|
| Payments | (19,866 | ) | | (25,024 | ) | | (44,973 | ) |
| Adjustments | (8,421 | ) | | (6,123 | ) | | (1,961 | ) |
| Balance at end of year | $ | 47,822 |
| | $ | 67,693 |
| | $ | 93,988 |
|
Our overall warranty liability at November 30, 2012 included $1.5 million for estimated remaining repair costs associated with 17homes that have been identified as containing or potentially containing allegedly defective drywall manufactured in China. These homes are located in Florida and were primarily delivered in 2006 and 2007. Our overall warranty liability at November 30, 2011 and 2010 included $4.8 million for estimated remaining repair costs associated with 87 such homes and $11.3 million associated with 296 such homes, respectively. The decreases in the liability for estimated repair costs associated with such homes at November 30, 2012 and 2011 reflected the lower number of homes with unresolved repairs at each date as compared to the respective previous year. Since 2009, we have identified a total of 469 such homes and resolved repairs on 452 of them through November 30, 2012. We consider warranty-related repairs for homes to be resolved when all repairs are complete and all repair costs are fully paid, and/or when we determine that we are not obligated to or will not need to repair a home under our limited warranty. During the years ended November 30, 2012, 2011 and 2010, we paid $2.9 million, $13.7 million and $25.5 million, respectively, to repair homes identified as affected or potentially affected by the allegedly defective drywall. As of November 30, 2012, we have paid $43.4 million of the total estimated repair costs of $44.9 million associated with all such homes.
The drywall used in the construction of our homes is purchased and installed by subcontractors. Our subcontractors obtained drywall material from multiple domestic and foreign sources through late 2008. In late 2008, we directed our subcontractors to obtain only domestically sourced drywall. Based on the significantly reduced warranty claim rate on the issue (only two additional homes were identified in 2012 as containing or potentially containing allegedly defective drywall manufactured in China), community-wide reviews we have conducted, and the domestic sourcing of drywall material since late 2008, we believe that we have identified substantially all such homes and will receive at most only nominal additional claims in future periods.
We have tendered claims with our liability insurance carriers, seeking reimbursement of costs we have incurred to make repairs
on and to handle claims with respect to previously delivered homes, including homes identified as affected or potentially affected by the allegedly defective drywall. During 2012, we recognized insurance recoveries of $26.5 million as a reduction to construction and land costsincome tax benefit (expense) in our consolidated statements of operations representing amounts we received from one of our insurance carriers for a portion of the claims we have tendered. We intend to continue to seek and are undertaking efforts, including legal proceedings, to obtain reimbursement from various sources, including suppliers and their insurers, for the costs we have incurred or expect to incur to investigate and complete repairs and to defend ourselves in litigation associated with homes previously delivered, including homes identified as affected or potentially affected by the allegedly defective drywall. Given uncertainties in the potential outcomes of these efforts, we have not recorded any amounts for potential future recoveries as of November 30, 2012.
As of November 30, 2012, we were a defendant in 10 lawsuits relating to the allegedly defective drywall. Seven of these lawsuits are “omnibus” class actions purportedly filed on behalf of numerous homeowners asserting claims for damages against drywall manufacturers, homebuilders and other parties in the supply chain of the allegedly defective drywall material. We are also a defendant in two lawsuits brought in Florida state court and one lawsuit brought in Louisiana federal court, in each case by individual homeowners. On May 31, 2012, a global settlement of claims relating to the allegedly defective drywall material, including those brought against us, was preliminarily approved by the federal court judge overseeing a multidistrict litigation case — In re: Chinese Manufactured Drywall Products Liability Litigation (MDL-2047). A fairness hearing on the preliminary global settlement was held on November 13, 2012. The hearing is not yet concluded. If the global settlement is finally approved and is accepted by all parties in its current form, it will resolve all current claims against us and bar any future claims against all participating defendants, including us. Some of the plaintiffs have opted out of the global settlement, and we will defend cases by those plaintiffs against us. While the ultimate outcomes of the drywall-related lawsuits are uncertain, based on the current status of the proceedings, we do not believe the outcomes will be material to our consolidated financial statements.
During 2012, we received warranty claims from homeowners in certain of our communities in Florida for water intrusion-related issues on homes we delivered between 2003 and 2009. While we initially believed these issues were isolated, after additional investigation, we determined in the fourth quarter of 2012 that more homes and communities may have been affected. Given the early stage of our investigation into the scope of the water intrusion-related issues in Florida, we are currently unable to determine whether we will need to record additional charges for repair costs. Our investigation into these issues, including estimating the number of homes affected and the overall repair costs, is ongoing.
In assessing our overall warranty liability at a reporting date, we evaluate the costs for warranty-related items on a combined basis for all of our previously delivered homes that are under our limited warranty. Accordingly, since 2009, we have evaluated the costs related to homes identified as affected or potentially affected by allegedly defective drywall manufactured in China, and in 2012, we also evaluated the costs related to homes potentially affected by water intrusion-related issues, in each case together with all of our other warranty-related items. Notwithstanding our actual or estimated remaining repair costs related to the allegedly defective drywall and water intrusion-related issues, since 2009 we have experienced favorable trends in our actual warranty costs incurred with respect to claims relating to other warranty-related items, reflecting, among other things, our ongoing focus on construction quality and customer service. Based on our assessments of these and other relevant factors on a combined basis, we determined that our overall warranty liability at each reporting date was sufficient to cover our overall warranty obligations on previously delivered homes that are under our limited warranty. Additionally, based on our assessment of the trends in our warranty claims experience, and taking into account the decrease in the overall number of homes we have delivered over the past several years before 2012 and the steady reduction in our estimated remaining repair costs and actual repair costs incurred for homes identified as affected or potentially affected by the allegedly defective drywall, we recorded favorable warranty adjustments of $11.2 million in the second quarter of 2012 and $7.4 million in the third quarter of 2011 as reductions to construction and land costs in our consolidated statements of operations in those periods. As of November 30, 2012, based on our assessment of our overall warranty liability on a combined basis for all of our previously delivered homes that are under our limited warranty, including the homes identified as affected or potentially affected by the allegedly defective drywall and the increased number of homes potentially affected by water intrusion-related issues, we recorded an adjustment to increase our overall warranty liability by$2.6 millionin the fourth quarter of 2012 with a corresponding charge to construction and land costs in our consolidated statement of operations.
Depending on the number of additional homes identified as affected or potentially affected by allegedly defective drywall manufactured in China or by water intrusion-related issues, if any, and the actual costs we incur in future periods to repair such homes and/or homes affected by other warranty-related issues, including costs to provide affected homeowners with temporary housing, we may revise the estimated amount of our liability, which could result in an increase or decrease in our overall warranty liability.
Guarantees. In the normal course of our business, we issue certain representations, warranties and guarantees related to our home sales and land sales that may be affected by Accounting Standards Codification Topic No. 460, “Guarantees.” Based on historical evidence, we do not believe any potential liability with respect to these representations, warranties or guarantees would be material to our consolidated financial statements.
Insurance. We maintain, and require the majority of our subcontractors to maintain, general liability insurance (including construction defect and bodily injury coverage) and workers’ compensation insurance. These insurance policies protect us against a portion of our risk of loss from claims related to our homebuilding activities, subject to certain self-insured retentions, deductibles and other coverage limits. In Arizona, California, Colorado and Nevada, our subcontractors' general liability insurance primarily takes the form of a wrap-up policy, where eligible subcontractors are enrolled as insureds on each project.We self-insure a portion of our overall risk through the use of a captive insurance subsidiary. We also maintain certain other insurance policies. We record expenses and liabilities based on the estimated costs required to cover our self-insured retention and deductible amounts under our insurance policies, and the estimated costs of potential claims and claim adjustment expenses that are above our coverage limits or that are not covered by our insurance policies. These estimated costs are based on an analysis of our historical claims and include an estimate of construction defect claims incurred but not yet reported. Our estimated liabilities for such items were $93.3 million at November 30, 2012 and $94.9 million at November 30, 2011. These amounts are included in accrued expenses and other liabilities in our consolidated balance sheets. Our expenses associated with self-insurance totaled $8.7 million in 2012, $7.2 million in 2011 and $7.4 million in 2010. These expenses were largely offset by contributions from subcontractors participating in the wrap-up policy.
Performance Bonds and Letters of Credit. We are often required to provide to various municipalities and other government agencies performance bonds and/or letters of credit to secure the completion of our projects and/or in support of obligations to build community improvements such as roads, sewers, water systems and other utilities, and to support similar development activities by certain of our unconsolidated joint ventures. At November 30, 2012, we had $286.1 million of performance bonds and $41.9 million of letters of credit outstanding. At November 30, 2011, we had $361.6 million of performance bonds and $63.8 million of letters of credit outstanding. If any such performance bonds or letters of credit are called, we would be obligated to reimburse the issuer of the performance bond or letter of credit. We do not believe that a material amount of any currently outstanding performance bonds or letters of credit will be called. Performance bonds do not have stated expiration dates. Rather, we are released from the performance bonds as the underlying performance is completed. The expiration dates of some letters of credit issued in connection with community improvements coincide with the expected completion dates of the related projects or obligations. Most letters of credit, however, are issued with an initial term of one year and are typically extended on a year-to-year basis until the related performance obligations are completed.
Land Option Contracts. In the ordinary course of business, we enter into land option contracts and other similar contracts to acquire rights to land for the construction of homes. At November 30, 2012, we had total deposits of $26.2 million, comprised of $25.7 million of cash deposits and $.5 million of letters of credit, to purchase land having an aggregate purchase price of $625.3 million. Our land option contracts and other similar contracts generally do not contain provisions requiring our specific performance.
Leases. We lease certain property and equipment under noncancelable operating leases. Office and equipment leases are typically for terms of three to five years and generally provide renewal options for terms up to an additional five years. In most cases, we expect that leases that expire will be renewed or replaced by other leases with similar terms. The future minimum rental payments under operating leases, which primarily consist of office leases having initial or remaining noncancelable lease terms in excess of one year, are as follows (in thousands):
|
| | | | |
| Years Ending November 30, | | |
| 2013 | | $ | 5,873 |
|
| 2014 | | 5,338 |
|
| 2015 | | 2,728 |
|
| 2016 | | 289 |
|
| 2017 | | — |
|
| Thereafter | | — |
|
| Total minimum lease payments | | $ | 14,228 |
|
|
| | | | | | | | | | | |
| | Federal | | State | | Total |
| 2015 | | | | | |
| Current | $ | (1,400 | ) | | $ | (2,000 | ) | | $ | (3,400 | ) |
| Deferred | (35,900 | ) | | (3,100 | ) | | (39,000 | ) |
| Income tax expense | $ | (37,300 | ) | | $ | (5,100 | ) | | $ | (42,400 | ) |
| 2014 | | | | | |
| Current | $ | 100 |
| | $ | (1,900 | ) | | $ | (1,800 | ) |
| Deferred | 646,000 |
| | 179,200 |
| | 825,200 |
|
| Income tax benefit | $ | 646,100 |
| | $ | 177,300 |
| | $ | 823,400 |
|
| 2013 | | | | | |
| Current | $ | — |
| | $ | 1,600 |
| | $ | 1,600 |
|
| Deferred | — |
| | — |
| | — |
|
| Income tax benefit | $ | — |
| | $ | 1,600 |
| | $ | 1,600 |
|
RentalOur income tax expense on our operating leasesfor 2015 reflected the favorable net impact of $5.6 million of federal energy tax credits we earned from building energy-efficient homes, resulting in an effective tax rate of 33.4%. The income tax benefit in 2014 was $5.5 million in 2012, $6.7 million in 2011 and $8.5 million in 2010.
Nevada Development Contract Litigation. On November 4, 2011, the Eighth Judicial District Court, Clark County, Nevada set for trial a consolidated action against KB Nevada, in a case entitled Las Vegas Development Associates, LLC, Essex Real Estate Partners, LLC, et al. v. KB HOME Nevada Inc. In 2007, LVDA agreed to purchase from KB Nevada approximately 83 acres of land located near Las Vegas, Nevada. LVDA subsequently assigned its rights to Essex. KB Nevada and Essex entered into a development agreement relating to certain major infrastructure improvements. LVDA’s and Essex’s complaint, initially filed in 2008, alleged that KB Nevada breached the development agreement, and also alleged that KB Nevada fraudulently induced them to enter into the purchase and development agreements. LVDA’s and Essex’s lenders subsequently filed related actions that were consolidated into the LVDA/Essex matter. The consolidated plaintiffs sought rescission of the agreements or, in the alternative, compensatory damages of$55 million plus the Claimed Damages. KB Nevada has denied the allegations, and believes it has meritorious defensesprimarily due to the consolidated plaintiffs’ claims. At a November 19, 2012 hearing, the court denied all of the consolidated plaintiffs’ motions for summary judgment on their claims. In addition, the court granted several of KB Nevada's motions for summary judgment, eliminating, among other of the consolidated plaintiffs’ claims, all claims for fraud, negligent misrepresentation, and punitive damages. With the court’s decisions, the only remaining claims against KB Nevada are for contract damages and rescission. While the ultimate outcome is uncertain — we believe it is reasonably possible that the loss in this matter could range fromzeroto the amount of the Claimed Damages (now excluding any punitive damages per the court’s action) plus prejudgment interest, which could be material to our consolidated financial statements — KB Nevada believes it will be successful in defending against the consolidated plaintiffs’ remaining claims and that the consolidated plaintiffs will not be awarded rescission or damages. A non-jury trial, originally set for September 2012 and then continued until January 2013, has now been further continued to October 15, 2013.
Southern California Project Development Case. On December 27, 2011, the jury in a case entitled Estancia Coastal, LLC v. KB HOME Coastal Inc. et al. returned a verdict against KB HOME Coastal Inc., a wholly owned subsidiary, and us for $9.8 million, excluding legal fees and interest. The case related to a land option contract and a construction agreement between KB HOME Coastal Inc. and the plaintiff. Based on pre-trial analysis, the verdict was not expected, and KB HOME Coastal Inc. and we jointly filed a motion for judgment notwithstanding the verdict and a motion for a new trial, which were heard on May 18, 2012. On May 23, 2012, the trial court denied the motions and on June 4, 2012 entered a judgment in favor of the plaintiff in the amount of $9.2 million plus pre-judgment interest of approximately $.9 million. The judgment entered reflects an earlier payment by us to the plaintiffreversal of a substantial portion of the jury’s award and does not include legal fees and costs and post-judgment interest. We had established an accrual for this matter based on our pre-judgment estimate of the probable loss. However, as a result of the trial court’s decision and probable legal fees and costs award, we recorded a charge ofdeferred tax asset valuation allowance at $8.8 million in the second quarter of 2012 to increase the accrual for this matter to $11.7 million. The charge was included in selling, general and administrative expenses in our consolidated statement of operations. On September 14, 2012, following a hearing, the trial court awarded legal fees and costs to the plaintiff of approximately $1.4 millionNovember 30, 2014. In light of2013, the legal fees and costs awarded on September 14, 2012, we continue to believe our accrual at November 30, 2012 reflects the probable outcome of the matter. We and KB HOME Coastal Inc. have appealed the entry of judgment. While the ultimate outcome is uncertain, we and KB HOME Coastal Inc. believe we will be successful in resolving the matter for an amount less than the judgment.
Other Matters. In addition to the specific proceedings described above, we are involved in other litigation and regulatory proceedings incidental to our business that are in various procedural stages. We believe that the accruals we have recorded for probable and reasonably estimable losses with respect to these proceedings are adequate and that, as of November 30, 2012, it was not reasonably possible that an additional material loss had been incurred in an amount in excess of the estimated amounts already recognized on our consolidated financial statements. We evaluate our accruals for litigation and regulatory proceedings at least quarterly and, as appropriate, adjust them to reflect (i) the facts and circumstances known to us at the time, including information regarding negotiations, settlements, rulings and other relevant events and developments; (ii) the advice and analyses of counsel; and (iii) the assumptions and judgment of management. Similar factors and considerations are used in establishing new accruals for proceedings as to which losses have become probable and reasonably estimable at the time an evaluation is made. Based on our experience, we believe that the amounts that may be claimed or alleged against us in these proceedings are not a meaningful indicator of our potential liability. The outcome of any of these proceedings, including the defense and other litigation-related costs and expenses we may incur, however, is inherently uncertain and could differ significantly from the estimate reflected in a related accrual, if made. Therefore, it is possible that the ultimate outcome of any proceeding, if in excess of a related accrual or if no accrual had been made, could be material to our consolidated financial statements.
The components of income tax benefit (expense)reflected the resolution of a state tax audit, which resulted in a refund receivable of $1.4 million, as well as the consolidated statementsrecognition of operations areunrecognized tax benefits of $1.0 million, partly offset by the state tax liability of $.8 million. Due to the effects of our deferred tax asset valuation allowances and changes in our unrecognized tax benefits, our effective tax rates in 2014 and 2013 were not meaningful items as follows (in thousands):our income tax amounts were not directly correlated to our pretax income for those periods.
|
| | | | | | | | | | | |
| | Federal | | State | | Total |
| 2012 | | | | | |
| Current | $ | 16,500 |
| | $ | 3,600 |
| | $ | 20,100 |
|
| Deferred | — |
| | — |
| | — |
|
| Income tax benefit | $ | 16,500 |
| | $ | 3,600 |
| | $ | 20,100 |
|
| 2011 | | | | | |
| Current | $ | 2,600 |
| | $ | (200 | ) | | $ | 2,400 |
|
| Deferred | — |
| | — |
| | — |
|
| Income tax benefit (expense) | $ | 2,600 |
| | $ | (200 | ) | | $ | 2,400 |
|
| 2010 | | | | | |
| Current | $ | 6,500 |
| | $ | 500 |
| | $ | 7,000 |
|
| Deferred | — |
| | — |
| | — |
|
| Income tax benefit | $ | 6,500 |
| | $ | 500 |
| | $ | 7,000 |
|
Deferred Tax Assets, Net. Deferred income taxes result from temporary differences in the financial and tax basis of assets and liabilities. Significant components of our deferred tax liabilities and assets are as follows (in thousands):
| | | | November 30, | November 30, |
| | 2012 | | 2011 | 2015 | | 2014 |
| Deferred tax liabilities: | | | | | | |
| Capitalized expenses | $ | 76,112 |
| | $ | 98,677 |
| $ | 110,408 |
| | $ | 103,196 |
|
| State taxes | 64,577 |
| | 61,550 |
| 68,866 |
| | 72,258 |
|
| Other | 218 |
| | 190 |
| 196 |
| | 310 |
|
| Total | $ | 140,907 |
| | $ | 160,417 |
| 179,470 |
| | 175,764 |
|
| | | | | |
| Deferred tax assets: | | | | | | |
| NOLs from 2006 through 2015 | | 423,274 |
| | 459,393 |
|
| Tax credits | | 186,169 |
| | 176,234 |
|
| Inventory impairments and land option contract abandonments | $ | 132,099 |
| | $ | 219,457 |
| 179,828 |
| | 229,264 |
|
| NOL from 2006 through 2012 | 442,621 |
| | 412,901 |
| |
| Employee benefits | | 93,395 |
| | 82,776 |
|
| Warranty, legal and other accruals | 54,744 |
| | 61,189 |
| 49,655 |
| | 42,621 |
|
| Employee benefits | 68,644 |
| | 57,699 |
| |
| Capitalized expenses | | 34,887 |
| | 24,155 |
|
| Partnerships and joint ventures | 132,851 |
| | 83,693 |
| 18,557 |
| | 15,672 |
|
| Depreciation and amortization | 7,467 |
| | 13,577 |
| 9,146 |
| | 9,022 |
|
| Capitalized expenses | 6,646 |
| | 6,233 |
| |
| Tax credits | 169,173 |
| | 151,300 |
| |
| Deferred income | 668 |
| | 830 |
| |
| Other | 6,107 |
| | 2,517 |
| 4,537 |
| | 3,009 |
|
| Total | 1,021,020 |
| | 1,009,396 |
| 999,448 |
| | 1,042,146 |
|
| Valuation allowance | (880,113 | ) | | (847,827 | ) | (37,782 | ) | | (41,150 | ) |
| Total | 140,907 |
| | 161,569 |
| 961,666 |
| | 1,000,996 |
|
| Net deferred tax assets | $ | — |
| | $ | 1,152 |
| |
| Deferred tax assets, net | | $ | 782,196 |
| | $ | 825,232 |
|
Reconciliation of Expected Income Tax Benefit (Expense). The income tax benefit (expense) computed at the statutory U.S. federal income tax rate and the income tax benefit (expense) provided in theour consolidated statements of operations differ as follows (in(dollars in thousands):
|
| | | | | | | | | | | |
| | Years Ended November 30, |
| | 2012 | | 2011 | | 2010 |
| Income tax benefit computed at statutory rate | $ | 27,672 |
| | $ | 63,397 |
| | $ | 26,729 |
|
| Increase (decrease) resulting from: | | | | | |
| State taxes, net of federal income tax benefit | 9,948 |
| | 4,691 |
| | 4,010 |
|
| Reserve and deferred income | (9,146 | ) | | (1,161 | ) | | 1,204 |
|
| Capitalized expenses | 7,960 |
| | (3,501 | ) | | (88 | ) |
| Basis in joint ventures | 42,503 |
| | 4,401 |
| | 13,729 |
|
| NOL reconciliation | (5,345 | ) | | 715 |
| | (24,749 | ) |
| Inventory impairments | (59,401 | ) | | (1,852 | ) | | (2,736 | ) |
| Recognition of federal tax benefits | 17,650 |
| | 2,600 |
| | 1,621 |
|
| Tax credits | 17,889 |
| | 5,477 |
| | 5,384 |
|
| Valuation allowance for deferred tax assets | (32,286 | ) | | (76,747 | ) | | (21,115 | ) |
| Other, net | 2,656 |
| | 4,380 |
| | 3,011 |
|
| Income tax benefit | $ | 20,100 |
| | $ | 2,400 |
| | $ | 7,000 |
|
We recognized income tax benefits of $20.1 million in 2012, $2.4 million in 2011 and $7.0 million in 2010. The income tax benefit in 2012 primarily reflected the resolution of federal and state tax audits, which resulted in an income tax benefit of $20.1 |
| | | | | | | | | | | | | | | | | | | | |
| | Years Ended November 30, |
| | 2015 | | 2014 | | 2013 |
| | $ | | % | | $ | | % | | $ | | % |
| Income tax expense computed at statutory rate | $ | (44,462 | ) | | (35.0 | )% | | $ | (33,232 | ) | | (35.0 | )% | | $ | (13,427 | ) | | (35.0 | )% |
| Tax credits | 8,220 |
| | 6.5 |
| | 2,884 |
| | 3.0 |
| | 2,675 |
| | 7.0 |
|
| Valuation allowance for deferred tax assets | 3,356 |
| | 2.6 |
| | 825,232 |
| | 869.1 |
| | 20,673 |
| | 53.9 |
|
| Depreciation and amortization | 3,183 |
| | 2.5 |
| | 15,765 |
| | 16.6 |
| | 4,523 |
| | 11.8 |
|
| Basis in joint ventures | 1,617 |
| | 1.3 |
| | 10,441 |
| | 11.0 |
| | (9,598 | ) | | (25.0 | ) |
| Inventory impairments | (1,701 | ) | | (1.3 | ) | | — |
| | — |
| | 2,827 |
| | 7.4 |
|
| Reserve and deferred income | (2,259 | ) | | (1.8 | ) | | — |
| | — |
| | (1,808 | ) | | (4.7 | ) |
| NOL reconciliation | (3,379 | ) | | (2.7 | ) | | 12,973 |
| | 13.7 |
| | (3,806 | ) | | (9.9 | ) |
| State taxes, net of federal income tax benefit | (5,155 | ) | | (4.1 | ) | | (13,907 | ) | | (14.7 | ) | | (1,947 | ) | | (5.1 | ) |
| Capitalized expenses | — |
| | — |
| | 1,249 |
| | 1.3 |
| | — |
| | — |
|
| Recognition of federal and state tax benefits | — |
| | — |
| | 59 |
| | .1 |
| | 1,600 |
| | 4.2 |
|
| Other, net | (1,820 | ) | | (1.4 | ) | | 1,936 |
| | 2.1 |
| | (112 | ) | | (.3 | ) |
| Income tax benefit (expense) | $ | (42,400 | ) | | (33.4 | )% | | $ | 823,400 |
| | 867.2 | % | | $ | 1,600 |
| | 4.3 | % |
millionDeferred Tax Asset Valuation Allowance. and the realization of $1.2 million of deferred tax assets. The income tax benefit in 2011 reflected the reversal of a $2.6 million liability for unrecognized tax benefits due to the status of federal and state tax audits. The income tax benefit in 2010 reflected the recognition of a $5.4 million federal income tax benefit from an additional carryback of our 2009 NOL to offset earnings we generated in 2004 and 2005, and the reversal of a $1.6 million liability for unrecognized tax benefits due to the status of federal and state tax audits. Due to the effects of our deferred tax asset valuation allowances, carrybacks of our NOL, and changes in our unrecognized tax benefits, our effective tax rates in 2012, 2011 and 2010 are not meaningful items as our income tax amounts are not directly correlated to the amount of our pretax losses for those periods.
In accordance with ASC 740, weWe evaluate our deferred tax assets quarterly to determine if adjustments to theour valuation allowance are required. ASC 740 requires that companies assess whether a valuation allowance should be establishedrequired based on the consideration of all available positive and negative evidence using a “more likely than not” standard with respect to whether deferred tax assets will be realized. Our evaluation considers, among other factors, our historical operating results, our expectation of future profitability, the duration of the applicable statutory carryforward periods, and conditions in the housing market and the broader economy. The ultimate realization of our deferred tax assets depends primarily on the generation ofour ability to generate future taxable income during the periods in which the related temporary differences in the financial basis and the tax basis of the assets become deductible. The value of our deferred tax assets will dependdepends on applicable income tax rates. During 2012
At November 30, 2015 and 2011,2014, we recordedhad deferred tax assets of $820.0 million and $866.4 million, respectively, that were partially offset by valuation allowances of $32.3$37.8 million and $76.7$41.2 million,, respectively, against net respectively. The valuation allowances at November 30, 2015 and 2014 were primarily related to foreign tax credits and certain state NOLs that had not met the “more likely than not” realization standard as of those dates. As of November 30, 2015, we needed to generate approximately $2 billion of pretax income in future periods before 2035 to realize our deferred tax assets. Based on our evaluation of our deferred tax assets as of November 30, 2015, we determined that most of our deferred tax assets would be realized. We reduced our deferred tax assets and valuation allowance by $3.4 million in 2015 to account primarily for the expiration of federal tax credits and state NOLs that were not utilized.
At November 30, 2014, we determined through our evaluation process that it was more likely than not that most of our deferred tax assets would be realized. As a result, we recognized an $824.2 million income tax benefit in the fourth quarter of 2014, which included the reversal of all but $41.2 million of our deferred tax asset valuation allowance. The principal positive evidence that led us to determine at November 30, 2014 that most of our deferred tax asset valuation allowance could be reversed included our emergence from a three-year cumulative pretax loss position in 2014 as well as the underlying momentum in our business and generally improved housing market and broader economic conditions that had enabled us to achieve and maintain a three-year cumulative pretax income position as of and after the 2014 third quarter; the significant pretax income we generated primarily fromduring 2014 and 2013, including six consecutive quarters of pretax income as of November 30, 2014; improvement in key financial metrics in 2014 when compared to the pretax losses for those years. During 2010,previous year (including in our revenues; housing gross profits; selling, general and administrative expenses as a percentage of housing revenues; net orders and backlog); our expectation of future profitability; our strong financial position; significant evidence that conditions in the U.S. housing industry were more favorable than in recent years and our belief that such conditions would continue to be favorable over the long term; and our belief that we recorded a net increase of $21.1 millionwould be able to make operational adjustments to address any potential changes in market conditions to maintain long-term profitability and realize our deferred tax assets.
In 2013, we reduced the valuation allowance against netby $20.7 million to account for adjustments to our deferred tax assets reflectingassociated with the pretax income generated during the year and the loss of state NOLs due to the expiration of the applicable statute of limitations.
We will continue to evaluate both the positive and negative evidence on a $26.6 millionquarterly basis in determining the need for a valuation allowance recorded against the netwith respect to our deferred tax assets. The accounting for deferred tax assets generated fromis based upon estimates of future results. Changes in positive and negative evidence, including differences between estimated and actual results, could result in changes in the pretax loss for the year that was partially offset by the $5.4 million federal income tax benefit from the additional carrybackvaluation of our 2009 NOL.deferred tax assets that could have a material impact on our consolidated financial statements. Changes in existing tax laws could also affect actual tax results and the realization of deferred tax assets over time.
The majority of the tax benefits associated with our NOLNOLs can be carried forward for 20 years (as we did not have taxable income in the allowable two-year carryback period) and applied to offset future taxable income. The federal NOL carryforwards of $313.5$267.1 million,, if not utilized, will begin to expire in 2030 through 20322033. TheDepending on their applicable statutory period, the state NOL carryforwards of $129.1$156.1 million, if not utilized, will begin to expire between 20132016 and 2032 if not utilized.2035. During 2015, $1.7 million of state NOL carryforwards expired.
In addition, $80.0$95.5 million of our tax credits, if not utilized, will begin to expire in 20152016 through 2032.2034. Included in the $80.0$95.5 million are $7.8$3.2 million of investment tax credits, of which $7.0$2.4 million and $.8$.8 million will expire in 2026 and 2027,, respectively. respectively, as well as foreign tax credits of $14.0 million that will expire in 2016.
We had no net deferred tax assets at November 30, 2012. Our net deferred tax assets totaledUnrecognized Tax Benefits. $1.2 million at November 30, 2011. The deferred tax asset valuation allowance increased to $880.1 million at November 30, 2012 from $847.8 million at November 30, 2011, reflecting the net impact of the $32.3 million valuation allowance recorded in 2012. To the extent we generate sufficient taxable income in the future to fully utilize the tax benefits of the related deferred tax assets, we expect our effective tax rate to decrease as the valuation allowance is reversed.
Gross unrecognized tax benefits are the differences between a tax position taken or expected to be taken in a tax return, and the benefit recognized for accounting purposes. A reconciliation of the beginning and ending balances of the gross unrecognized tax benefits, excluding interest and penalties, is as follows (in thousands):
|
| | | | | | | | | | | |
| | Years Ended November 30, |
| | 2012 | | 2011 | | 2010 |
| Balance at beginning of year | $ | 1,899 |
| | $ | 11,308 |
| | $ | 11,024 |
|
| Additions for tax positions related to prior years | — |
| | 5 |
| | 1,720 |
|
| Reductions for tax positions related to prior years | (165 | ) | | — |
| | (1,183 | ) |
| Reductions related to settlement | — |
| | (264 | ) | | — |
|
| Reductions due to lapse of statute of limitations | (63 | ) | | (2,476 | ) | | — |
|
| Reductions due to resolution of federal and state audits | — |
| | (6,674 | ) | | (253 | ) |
| Balance at end of year | $ | 1,671 |
| | $ | 1,899 |
| | $ | 11,308 |
|
|
| | | | | | | | | | | |
| | Years Ended November 30, |
| | 2015 | | 2014 | | 2013 |
| Balance at beginning of year | $ | 206 |
| | $ | 206 |
| | $ | 1,671 |
|
| Reductions due to lapse of statute of limitations | (150 | ) | | — |
| | (1,465 | ) |
| Balance at end of year | $ | 56 |
| | $ | 206 |
| | $ | 206 |
|
We recognize accrued interest and penalties related to unrecognized tax benefits in our consolidated financial statements as a component of the provision for or benefit from income taxes. As of November 30, 20122015, 20112014 and 20102013, there were $1.3$.1 million,, $1.8 $.1 million and $6.9$.3 million,, respectively, of gross unrecognized tax benefits (including interest and penalties), that, if recognized, would affect our annual effective tax rate. Our total accrued interest and penalties related to unrecognized income tax benefits was $.6 millionzero at November 30, 20122015 and $.9$.1 million at November 30, 2011.2014. Our liabilities for unrecognized tax benefits at November 30, 20122015 and 20112014 are included in accrued expenses and other liabilities in our consolidated balance sheets.
Included in the balance of gross unrecognized tax benefits at both November 30, 20122015 and 2011 are2014 were tax positions of $1.0zero and $.2 million, for each year, respectively, for which the ultimate deductibility is highly certain but there is uncertainty about the timing of such deductibility.deductibility is uncertain. Because of the impact of deferred tax accounting, other than interest and penalties, the disallowance of the shorter deductibility period would not affect theour annual effective tax rate, but would accelerate the payment of cash to a tax authority to an earlier period.
As of November 30, 20122015, our gross unrecognized tax benefits (including interest and penalties) totaled $2.3 million.$.1 million. We anticipate that these gross unrecognized tax benefits will decrease by an amount ranging from $.2zero to $.1 million to $1.1 million during the 12 months from this reporting date due to various state filings associated with the resolutionexpiration of a federal audit.
the statute of limitations. The fiscal years ending 20052012 and later remain open to federal examinations, while 2011 and later remain open to state examinations.
TheNotwithstanding the reversal of a substantial portion of our deferred tax asset valuation allowance at November 30, 2014, the benefits of our NOL,deferred tax assets, including our NOLs, built-in losses and tax credits would be reduced or potentially eliminated if we experienced an “ownership change” under Section 382. Based on our analysis performed as of November 30, 2012,2015, we do not believe that we have experienced an ownership change as defined by Section 382, and, therefore, the NOL,NOLs, built-in losses and tax credits we have generated should not be subject to a Section 382 limitation as of this reporting date.
Notes payable consisted of the following (in thousands):
|
| | | | | | | |
| | November 30, |
| | 2015 | | 2014 |
| Mortgages and land contracts due to land sellers and other loans (at interest rates of 4% to 7% at November 30, 2015 and 5% to 7% at November 30, 2014) | $ | 35,664 |
| | $ | 38,250 |
|
| 6 1/4% Senior notes due June 15, 2015 | — |
| | 199,891 |
|
| 9.10% Senior notes due September 15, 2017 | 263,475 |
| | 262,729 |
|
| 7 1/4% Senior notes due June 15, 2018 | 299,554 |
| | 299,402 |
|
| 4.75% Senior notes due May 15, 2019 | 400,000 |
| | 400,000 |
|
| 8.00% Senior notes due March 15, 2020 | 346,843 |
| | 346,253 |
|
| 7.00% Senior notes due December 15, 2021 | 450,000 |
| | 450,000 |
|
| 7.50% Senior notes due September 15, 2022 | 350,000 |
| | 350,000 |
|
| 7.625% Senior notes due May 15, 2023 | 250,000 |
| | — |
|
| 1.375% Convertible senior notes due February 1, 2019 | 230,000 |
| | 230,000 |
|
| Total | $ | 2,625,536 |
| | $ | 2,576,525 |
|
Unsecured Revolving Credit Facility. On August 7, 2015, we entered into an amendment to the Credit Facility that increased the commitment from $200.0 million to $275.0 million and extended its maturity from March 12, 2016 to August 7, 2019. The Credit Facility contains an uncommitted accordion feature under which its aggregate principal amount of available loans can be increased to a maximum of $450.0 million under certain conditions, including obtaining additional bank commitments, as well as a sublimit of $137.5 million for the issuance of letters of credit, which may be utilized in combination with, or to replace, the LOC
Facilities. Interest on amounts borrowed under the Credit Facility is payable quarterly in arrears at a rate based on either a Eurodollar or a base rate, plus a spread that depends on our Leverage Ratio, as defined under the Credit Facility. The Credit Facility also requires the payment of a commitment fee ranging from .30% to .50% of the unused commitment, based on our Leverage Ratio. The terms of the Credit Facility require us, among other things, to maintain compliance with various covenants, including financial covenants relating to our consolidated tangible net worth, Leverage Ratio, and either an Interest Coverage Ratio or a minimum level of liquidity, each as defined therein. The amount of the Credit Facility available for cash borrowings or the issuance of letters of credit depends on the total cash borrowings and letters of credit outstanding under the Credit Facility and the maximum available amount under the terms of the Credit Facility. As of November 30, 2015, we had no cash borrowings and $24.3 million of letters of credit outstanding under the Credit Facility. Therefore, as of November 30, 2015, we had $250.7 million available for cash borrowings under the Credit Facility, with up to $113.2 million of that amount available for the issuance of letters of credit.
LOC Facilities. We maintain the LOC Facilities with various financial institutions to obtain letters of credit in the ordinary course of operating our business. As of November 30, 2015 and 2014, we had $9.1 million and $26.7 million, respectively, of letters of credit outstanding under the LOC Facilities. The LOC Facilities require us to deposit and maintain cash with the issuing financial institutions as collateral for our letters of credit outstanding.
Mortgages and Land Contracts Due to Land Sellers and Other Loans. As of November 30, 2015, inventories having a carrying value of $136.1 million were pledged to collateralize mortgages and land contracts due to land sellers and other loans.
Shelf Registration. Issuances of debt and equity securities under our 2014 Shelf Registration require the filing of a prospectus supplement identifying the amount and terms of the securities to be issued. Our ability to issue equity and/or debt is subject to market conditions and other factors impacting our borrowing capacity.
Senior Notes. All of our senior notes outstanding at November 30, 2015 and 2014 represent senior unsecured obligations and rank equally in right of payment with all of our existing and future indebtedness. All of our outstanding senior notes were issued in underwritten public offerings.
The key terms of each of our senior notes outstanding as of November 30, 2015 were as follows (dollars in thousands):
|
| | | | | | | | | | | | | |
| | | | | | | | | Redeemable Prior to Maturity | | Effective Interest Rate |
| | | | | | | | | |
| Notes Payable | | Principal | | Issuance Date | | Maturity Date | | |
| 9.10% Senior notes | | $ | 265,000 |
| | July 30, 2009 | | September 15, 2017 | | Yes (a) | | 9.5 | % |
| 7 1/4% Senior notes | | 300,000 |
| | April 3, 2006 | | June 15, 2018 | | Yes (a) | | 7.3 |
|
| 4.75% Senior notes | | 400,000 |
| | March 25, 2014 | | May 15, 2019 | | Yes (b) | | 4.8 |
|
| 8.00% Senior notes | | 350,000 |
| | February 7, 2012 | | March 15, 2020 | | Yes (a) | | 8.3 |
|
| 7.00% Senior notes | | 450,000 |
| | October 29, 2013 | | December 15, 2021 | | Yes (b) | | 7.0 |
|
| 7.50% Senior notes | | 350,000 |
| | July 31, 2012 | | September 15, 2022 | | Yes (a) | | 7.5 |
|
| 7.625% Senior notes | | 250,000 |
| | February 17, 2015 | | May 15, 2023 | | Yes (b) | | 7.6 |
|
| 1.375% Convertible senior notes | | 230,000 |
| | January 29, 2013 | | February 1, 2019 | | Yes (c) | | 1.4 |
|
| |
| (a) | At our option, these notes may be redeemed, in whole at any time or from time to time in part, at a redemption price equal to the greater of (i) 100% of the principal amount of the notes being redeemed and (ii) the sum of the present values of the remaining scheduled payments of principal and interest on the notes being redeemed (exclusive of interest accrued to the applicable redemption date), discounted to the redemption date at a defined rate, plus, in each case, accrued and unpaid interest on the notes being redeemed to the applicable redemption date. |
| |
| (b) | At our option, these notes may be redeemed, in whole at any time or from time to time in part, at a redemption price equal to the greater of (i) 100% of the principal amount of the notes being redeemed and (ii) the sum of the present values of the remaining scheduled payments of principal and interest on the notes being redeemed (exclusive of interest accrued to the applicable redemption date), discounted to the redemption date at a defined rate, plus, in each case, accrued and unpaid interest on the notes being redeemed to, but excluding, the applicable redemption date, except that three months prior to the stated maturity dates for the 4.75% Senior Notes due 2019 and the 7.00% Senior Notes due 2021 and until their respective maturity, and six months prior to the stated maturity date for the 7.625% Senior Notes due 2023 and until their maturity, the redemption price will be equal to 100% of the principal amount of the notes being redeemed, plus, in each case, accrued and unpaid interest on the notes being redeemed to, but excluding, the applicable redemption date. |
| |
| (c) | We may not redeem the notes prior to November 6, 2018. On or after November 6, 2018, and prior to the stated maturity date, we may, at our option, redeem all or part of the notes at a redemption price equal to 100% of the principal amount of the notes being redeemed plus accrued and unpaid interest to, but excluding the redemption date. |
If a change in control occurs as defined in the instruments governing our senior notes, we would be required to offer to purchase all of our outstanding senior notes (with the exception of the amount outstanding related to our 7 1/4% Senior Notes due 2018) at 101% of their principal amount, together with all accrued and unpaid interest, if any. If a fundamental change, as defined in the instruments governing the 1.375% Convertible Senior Notes due 2019, occurs prior to the stated maturity date, the holders may require us to purchase for cash all or any portion of their 1.375% Convertible Senior Notes due 2019 at 100% of the principal amount of the notes, plus accrued and unpaid interest to, but not including, the fundamental change purchase date.
In 2015, we used a portion of the total net proceeds of $245.4 million from the issuance of the 7.625% Senior Notes due 2023 to retire the remaining $199.9 million in aggregate principal amount of our 6 1/4% Senior Notes due 2015 at their maturity on June 15, 2015. The remainder of the net proceeds was used for general corporate purposes, including working capital, land acquisition and land development.
In 2014, we used the $394.6 million in total net proceeds from the issuance of the 4.75% Senior Notes due 2019 together with the total net proceeds from a concurrent underwritten public offering of our common stock, which is discussed below in Note 17. Stockholders’ Equity, for general corporate purposes, including without limitation land acquisition and land development.
In 2013, we used $225.4 million of the total net proceeds from the issuance of the 7.00% Senior Notes due 2021 to purchase $215.1 million in aggregate principal amount of certain senior notes that were scheduled to mature in 2014 and 2015. The remainder of the net proceeds was used for general corporate purposes, including without limitation land acquisition and land development. We incurred a $10.4 million loss on the early extinguishment of debt in 2013 due to a premium paid under the applicable tender offers, premiums paid to redeem the applicable remaining senior notes, and the unamortized original issue discount associated with these senior notes.
In 2013, we also used the $222.7 million in total net proceeds from the issuance of the 1.375% Convertible Senior Notes due 2019 together with the total net proceeds from a concurrent underwritten public offering of our common stock, which is described in Note 17. Stockholders’ Equity, for general corporate purposes, including for investments in land and land/community development.
At any time prior to the close of business on the business day immediately preceding the maturity date, holders may convert all or any portion of the 1.375% Convertible Senior Notes due 2019. These notes are initially convertible into shares of our common stock at a conversion rate of 36.5297 shares for each $1,000 principal amount of the notes, which represents an initial conversion price of approximately $27.37 per share. This initial conversion rate equates to 8,401,831 shares of our common stock and is subject to adjustment upon the occurrence of certain events, including: subdivisions and combinations of our common stock; the issuance of stock dividends, or certain rights, options or warrants, capital stock, indebtedness, assets or cash dividends to all or substantially all holders of our common stock; and certain issuer tender or exchange offers. The conversion rate will not, however, be adjusted for other events, such as a third party tender or exchange offer or an issuance of common stock for cash or an acquisition, that may adversely affect the trading price of the notes or our common stock. On conversion, holders of the 1.375% Convertible Senior Notes due 2019 will not be entitled to receive cash in lieu of shares of our common stock, except for cash in lieu of fractional shares.
The indenture governing the senior notes does not contain any financial covenants. Subject to specified exceptions, the indenture contains certain restrictive covenants that, among other things, limit our ability to incur secured indebtedness, or engage in sale-leaseback transactions involving property or assets above a certain specified value. In addition, the senior notes (with the exception of the 7 1/4% Senior Notes due 2018) contain certain limitations related to mergers, consolidations, and sales of assets.
As of November 30, 2015, we were in compliance with the applicable terms of all our covenants and other requirements under the Credit Facility, the senior notes, the indenture, and the mortgages and land contracts due to land sellers and other loans. Our ability to access the Credit Facility for cash borrowings and letters of credit and our ability to secure future debt financing depend, in part, on our ability to remain in such compliance. There are no agreements that restrict our payment of dividends other than to maintain compliance with the financial covenant requirements under the Credit Facility, which would restrict our payment of dividends if a default under the Credit Facility exists at the time of any such payment, or if any such payment would result in such a default.
Principal payments on senior notes, mortgages and land contracts due to land sellers and other loans are due during each year ended November 30 as follows: 2016 — $35.7 million; 2017— $265.0 million; 2018 —$300.0 million; 2019 — $630.0 million; 2020 —$350.0 million; and thereafter —$1.05 billion.
| |
| Note 14. | Fair Value Disclosures |
Fair value measurements of assets and liabilities are categorized based on the following hierarchy:
| |
| Level 1 | Fair value determined based on quoted prices in active markets for identical assets or liabilities. |
| |
| Level 2 | Fair value determined using significant observable inputs, such as quoted prices for similar assets or liabilities or quoted prices for identical or similar assets or liabilities in markets that are not active, inputs other than quoted prices that are observable for the asset or liability, or inputs that are derived principally from or corroborated by observable market data, by correlation or other means. |
| |
| Level 3 | Fair value determined using significant unobservable inputs, such as pricing models, discounted cash flows, or similar techniques. |
Fair value measurements are used for inventories on a nonrecurring basis when events and circumstances indicate that their carrying value is not recoverable. The following table presents the fair value hierarchy and our assets measured at fair value on a nonrecurring basis (in thousands):
|
| | | | | | | | | | |
| | | | | For the Years Ended November 30, |
| Description | | Fair Value Hierarchy | | 2015 | | 2014 |
| Inventories (a) | | Level 2 | | $ | — |
| | $ | 6,421 |
|
| Inventories (a) | | Level 3 | | 11,988 |
| | 24,174 |
|
| |
| (a) | Amounts represent the aggregate fair value for real estate assets impacted by inventory impairment charges during the period, as of the date that the fair value measurements were made. The carrying value for these real estate assets may have subsequently increased or decreased from the fair value reflected due to activity that has occurred since the measurement date. |
Inventories with a carrying value of $20.0 million were written down to their fair value of $12.0 million during the year ended November 30, 2015, resulting in inventory impairment charges of $8.0 million. Inventories with a carrying value of $68.2 million were written down to their fair value of $30.6 million during the year ended November 30, 2014, resulting in inventory impairment charges of $37.6 million.
The fair values for inventories that were determined using Level 2 inputs were based on an executed contract. The fair values for inventories that were determined using Level 3 inputs were primarily based on the estimated future net cash flows discounted for inherent risk associated with each underlying asset, as described in Note 7. Inventory Impairments and Land Option Contract Abandonments. The fair values for inventories determined using Level 3 inputs that involved a planned future land sale were estimated based on a broker quote.
The following table presents the fair value hierarchy, carrying values and estimated fair values of our financial instruments, except those for which the carrying values approximate fair values (in thousands):
|
| | | | | | | | | | | | | | | | | |
| | | | November 30, |
| | | | 2015 | | 2014 |
| | Fair Value Hierarchy | | Carrying Value | | Estimated Fair Value | | Carrying Value | | Estimated Fair Value |
| Financial Liabilities: | | | | | | | | | |
| Senior notes | Level 2 | | $ | 2,359,872 |
| | $ | 2,429,850 |
| | $ | 2,308,275 |
| | $ | 2,468,852 |
|
| Convertible senior notes | Level 2 | | 230,000 |
| | 211,313 |
| | 230,000 |
| | 229,713 |
|
The fair values of our senior notes and convertible senior notes are generally estimated based on quoted market prices for these instruments. The carrying values reported for cash and cash equivalents, restricted cash, and mortgages and land contracts due to land sellers and other loans approximate fair values.
| |
| Note 15. | Commitments and Contingencies |
Commitments and contingencies include typical obligations of homebuilders for the completion of contracts and those incurred in the ordinary course of business.
Warranty. We provide a limited warranty on all of our homes. The specific terms and conditions of our limited warranty program vary depending upon the markets in which we do business. We generally provide a structural warranty of 10 years, a warranty on electrical, heating, cooling, plumbing and certain other building systems each varying from two to five years based on geographic market and state law, and a warranty of one year for other components of the home. Our limited warranty program is ordinarily how we respond to and account for homeowners’ requests to local division offices seeking repairs, including claims where we could have liability under applicable state statutes or tort law for a defective condition in or damages to a home.
We estimate the costs that may be incurred under each limited warranty and record a liability in the amount of such costs at the time the revenue associated with the sale of each home is recognized.Our primary assumption in estimating the amounts we accrue for warranty costs is that historical claims experience is a strong indicator of future claims experience. Factors that affect our warranty liability include the number of homes delivered, historical and anticipated rates of warranty claims, and cost per claim. We periodically assess the adequacy of our accrued warranty liability, which is included in accrued expenses and other liabilities in our consolidated balance sheets, and adjust the amount as necessary based on our assessment.Our assessment includes the review of our actual warranty costs incurred to identify trends and changes in our warranty claims experience, and considers our home construction quality and customer service initiatives and outside events.While we believe the warranty liability currently reflected in our consolidated balance sheets to be adequate, unanticipated changes or developments in the legal environment, local weather, land or environmental conditions, quality of materials or methods used in the construction of homes or customer service practices and our warranty claims experience could have a significant impact on our actual warranty costs in future periods and such amounts could differ significantly from our current estimates.
The changes in our warranty liability are as follows (in thousands):
|
| | | | | | | | | | | |
| | Years Ended November 30, |
| | 2015 | | 2014 | | 2013 |
| Balance at beginning of year | $ | 45,196 |
| | $ | 48,704 |
| | $ | 47,822 |
|
| Warranties issued | 23,018 |
| | 18,479 |
| | 14,261 |
|
| Payments | (26,367 | ) | | (39,458 | ) | | (45,338 | ) |
| Adjustments (a) | 7,238 |
| | 17,471 |
| | 31,959 |
|
| Balance at end of year | $ | 49,085 |
| | $ | 45,196 |
| | $ | 48,704 |
|
| |
| (a) | As discussed below, adjustments in 2015 and 2014 were primarily comprised of the reclassification of estimated minimum probable recoveries to receivables. Adjustments in 2014 also included a reclassification of estimated minimum probable recoveries to establish a separate accrual for a water intrusion-related inquiry. Adjustments in 2013 were comprised of charges associated with water intrusion-related issues in central and southwest Florida. |
Central and Southwest Florida Claims. Since 2012, we have received warranty claims from homeowners in certain of our communities in central and southwest Florida primarily involving framing, stucco, roofing and/or sealant matters on homes we delivered between 2003 and 2009, with many concerning water intrusion-related issues. Based on the status of our ongoing investigation and repair efforts with respect to homes affected by these water intrusion-related issues, our overall warranty liability at November 30, 2015, 2014 and 2013 included $2.2 million, $9.4 million and $28.9 million, respectively, for estimated remaining repair costs associated with (a) 69, 324 and 710 identified affected homes, respectively, and (b) similarly affected homes that we believed at each respective date may be identified in the future. The $2.2 million at November 30, 2015 encompasses what we believe to be the probable overall cost of the repair effort remaining with respect to affected homes before insurance and other recoveries. However, our actual costs to fully resolve repairs on affected homes could differ from the overall costs we have estimated depending on the identification of additional affected homes in future periods, if any, and the nature of the work that is undertaken to complete repairs on identified affected homes. In 2015, we resolved repairs on 356 identified affected homes and identified 101 additional affected homes. During 2014, we resolved repairs on 536 identified affected homes and identified 150 additional affected homes, most of which were in one attached home community. During 2013, repairs were resolved on 754 identified affected homes. We consider repairs for identified affected homes to be resolved when all repairs are completed and all repair costs are fully paid. In 2015, 2014 and 2013, we paid $8.4 million, $26.6 million and $32.7 million, respectively, to repair identified affected homes. Since first identifying affected homes in 2012, we have identified a total of 1,715 affected homes requiring more than minor repairs and resolved repairs on 1,646 of those homes through November 30, 2015. As of November 30, 2015, we had paid $71.7 million of the probable total repair costs of $73.9 million that we have estimated for the overall repair effort.
We believe it is probable that we will recover a portion of our repair costs associated with affected homes from various sources, including our insurers and independent subcontractors involved with the original construction of the homes and their insurers. In
2015 and 2014, we collected $7.0 million and $.9 million, respectively, of such recoveries. Based on a review of our estimated potential recoveries in 2015, we increased our estimate of minimum probable recoveries. As of November 30, 2015, our estimated minimum probable recoveries, net of amounts collected, totaled $20.6 million, of which $2.2 million was included as an offset to our overall warranty liability and the remainder was included in receivables. During 2014, we recorded adjustments to increase our warranty liability mainly to reflect additional affected homes identified at one attached home community and our updated estimate of repair costs on identified affected homes. We also recorded adjustments to increase our estimated minimum probable recoveries during the period based on our updated estimate of repair costs. Together, these items did not have an impact on our consolidated statement of operations for 2014. As of November 30, 2014, our estimated minimum probable recoveries, net of amounts collected, totaled $26.6 million, of which $9.4 million was included as an offset to our overall warranty liability and the remainder was included in receivables. As of November 30, 2013, our estimated minimum probable recoveries, all of which were included as an offset to our overall warranty liability, totaled $19.4 million. The estimated minimum probable recoveries pertaining to affected homes are included in receivables to the extent they exceed the estimated remaining repair costs in our overall warranty liability associated with such homes. During 2015 and 2014, we reclassified $7.2 million and $18.1 million, respectively, of estimated minimum probable recoveries that were in excess of the estimated remaining repair costs to a receivable. Our assessment of the water intrusion-related issues in central and southwest Florida, including the process of determining potentially responsible parties and our efforts to obtain recoveries, is ongoing, and as a result, our estimate of minimum probable recoveries may change as additional information is obtained.
In 2013, based on our assessment of our overall warranty liability, we recorded adjustments to increase our warranty liability by $32.0 million with a corresponding charge to construction and land costs in our consolidated statement of operations. The adjustments reflected our then-current estimate of remaining repair costs associated with homes in central and southwest Florida that had been identified as having water intrusion-related issues and our estimate of repair costs associated with similarly affected homes in central and southwest Florida then-believed likely to be identified in the future, net of an increase in estimated minimum probable recoveries of such repair costs and other adjustments.
Overall Warranty Liability Assessment. In assessing our overall warranty liability at a reporting date, we evaluate the costs for warranty-related items on a combined basis for all of our previously delivered homes that are under our limited warranty program, which would include homes in central and southwest Florida that have been or may in the future be identified as affected by water intrusion-related issues. Based on this evaluation, we believe our overall warranty liability as of November 30, 2015 is adequate. Depending on the number of additional homes in central and southwest Florida that are identified as affected by water intrusion-related issues, if any, and the actual costs we incur in future periods to repair such affected homes and/or homes affected by other issues, we may revise the amount of our estimated liability, which could result in an increase or decrease in our overall warranty liability. Based on our assessment of the water intrusion-related issues in central and southwest Florida, and the substantial wind down of these issues in 2015, we believe that our overall warranty liability as of November 30, 2015 is adequate to cover the estimated probable total repair costs with respect to affected homes.
Florida Attorney General’s Office Inquiry. In 2013, we were notified by the Florida Attorney General’s Office that it was making a preliminary inquiry into the status of our communities in Florida affected by water intrusion-related issues. We established an accrual for the estimated minimum probable loss with respect to this inquiry during 2014 and increased the accrual during 2015. We anticipate that this inquiry will be resolved through an agreement with the Florida Attorney General’s Office, requiring approval by a Florida circuit court in order to become effective. We believe that the amount accrued for this matter is adequate as of November 30, 2015.
Guarantees. In the normal course of our business, we issue certain representations, warranties and guarantees related to our home and land sales. Based on historical evidence, we do not believe any potential liability with respect to these representations, warranties or guarantees would be material to our consolidated financial statements.
Self-Insurance. We maintain, and require the majority of our independent subcontractors to maintain, general liability insurance (including construction defect and bodily injury coverage) and workers’ compensation insurance. These insurance policies protect us against a portion of our risk of loss from claims related to our homebuilding activities, subject to certain self-insured retentions, deductibles and other coverage limits. We self-insure a portion of our overall risk through the use of a captive insurance subsidiary. We also maintain certain other insurance policies. In Arizona, California, Colorado and Nevada, our subcontractors’ general liability insurance primarily takes the form of a wrap-up policy, where eligible independent subcontractors are enrolled as insureds on each project. Enrolled subcontractors contribute toward the cost of the insurance and agree to pay a contractual amount in the future if there is a claim related to their work. To the extent provided under the wrap-up program, we absorb the enrolled subcontractors’ general liability associated with the work performed on our homes within the applicable projects as part of our overall general liability insurance and our self-insurance through our captive insurance subsidiary. We record expenses and liabilities based on the estimated costs required to cover our self-insured retention and deductible amounts under our insurance policies, and the estimated costs of potential claims and claim adjustment expenses that are above our coverage limits or that are
not covered by our insurance policies. These estimated costs are based on an analysis of our historical claims and industry data, and include an estimate of construction defect claims incurred but not yet reported.
We engage a third-party actuary that uses our historical claim and expense data, as well as industry data, to estimate our liabilities related to unpaid claims, claim adjustment expenses, third-party recoveries and incurred but not yet reported claims associated with the risks that we are assuming with respect to our self-insurance and insurance policy deductibles. Key assumptions used in these estimates include claim frequencies, severities and resolution patterns, which can occur over an extended period of time. These estimates are subject to variability due to the length of time between the delivery of a home to a homebuyer and when a structural warranty or construction defect claim is made, and the ultimate resolution of such claim; uncertainties regarding such claims relative to our markets and the types of product we build; insurance industry practices; and legal or regulatory actions and/or interpretations, among other factors. Due to the degree of judgment involved and the potential for variability in these underlying assumptions, our actual future costs could differ from those estimated. In addition, changes in the frequency and severity of reported claims and the estimates to resolve claims can impact the trends and assumptions used in the actuarial analysis, which could be material to our consolidated financial statements. Though state regulations vary, structural warranty or construction defect claims can be reported and resolved over a long period of time, which can extend for 10 years or more. As a result, the majority of the estimated liability relates to incurred but not yet reported claims and thus, adjustments related to individual existing claims generally do not significantly impact the overall estimated liability. Adjustments to our liabilities related to homes delivered in prior years are recorded in the period in which a change in our estimate occurs.
The changes in our self-insurance liability were as follows (in thousands):
|
| | | | | | | | | | | |
| | Years Ended November 30, |
| | 2015 | | 2014 | | 2013 |
| Balance at beginning of year | $ | 86,574 |
| | $ | 92,214 |
| | $ | 93,349 |
|
| Self-insurance expense (a) | 18,590 |
| | 13,491 |
| | 8,239 |
|
| Payments, net of recoveries (b) | (22,989 | ) | | (19,131 | ) | | (9,374 | ) |
| Balance at end of year | $ | 82,175 |
| | $ | 86,574 |
| | $ | 92,214 |
|
| |
| (a) | These expenses are included in selling, general and administrative expenses and are largely offset by contributions from independent subcontractors participating in the wrap-up policy. |
| |
| (b) | Recoveries are reflected in the period we receive funds from independent subcontractors and/or their insurers. |
Performance Bonds and Letters of Credit. We are often required to provide to various municipalities and other government agencies performance bonds and/or letters of credit to secure the completion of our projects and/or in support of obligations to build community improvements such as roads, sewers, water systems and other utilities, and to support similar development activities by certain of our unconsolidated joint ventures. At November 30, 2015, we had $565.4 million of performance bonds and $33.4 million of letters of credit outstanding. At November 30, 2014, we had $541.6 million of performance bonds and $26.7 million of letters of credit outstanding. If any such performance bonds or letters of credit are called, we would be obligated to reimburse the issuer of the performance bond or letter of credit. We do not believe that a material amount of any currently outstanding performance bonds or letters of credit will be called. Performance bonds do not have stated expiration dates. Rather, we are released from the performance bonds as the underlying performance is completed. The expiration dates of some letters of credit issued in connection with community improvements coincide with the expected completion dates of the related projects or obligations. Most letters of credit, however, are issued with an initial term of one year and are typically extended on a year-to-year basis until the related performance obligations are completed.
Land Option Contracts and Other Similar Contracts. In the ordinary course of business, we enter into land option contracts and other similar contracts to acquire rights to land for the construction of homes. At November 30, 2015, we had total cash deposits of $54.5 million to purchase land having an aggregate purchase price of $1.19 billion. Our land option contracts and other similar contracts generally do not contain provisions requiring our specific performance.
Leases. We lease certain property and equipment under noncancelable operating leases. Office and equipment leases are typically for terms of three to five years and generally provide renewal options for terms up to an additional five years. In most cases, we expect that leases that expire will be renewed or replaced by other leases with similar terms. The future minimum rental payments under operating leases, which primarily consist of office leases having initial or remaining noncancelable lease terms in excess of one year, are as follows (in thousands):
|
| | | | |
| Years Ending November 30, | | |
| 2016 | | $ | 7,552 |
|
| 2017 | | 5,805 |
|
| 2018 | | 4,924 |
|
| 2019 | | 4,316 |
|
| 2020 | | 3,417 |
|
| Thereafter | | 9,442 |
|
| Total minimum lease payments | | $ | 35,456 |
|
Rental expense on our operating leases was $8.5 million in 2015, $7.7 million in 2014 and $6.5 million in 2013.
Nevada Development Contract Litigation. KB HOME Nevada Inc., a wholly owned subsidiary of ours (“KB Nevada”), is a defendant in a case in the Eighth Judicial District Court in Clark County, Nevada entitled Las Vegas Development Associates, LLC, Essex Real Estate Partners, LLC, et al. v. KB HOME Nevada Inc. In 2007, Las Vegas Development Associates, LLC (“LVDA”) agreed to purchase from KB Nevada approximately 83 acres of land located near Las Vegas, Nevada. LVDA subsequently assigned its rights to Essex Real Estate Partners, LLC (“Essex”). KB Nevada and Essex entered into a development agreement relating to certain major infrastructure improvements. LVDA’s and Essex’s complaint, initially filed in 2008, alleged that KB Nevada breached the development agreement, and also alleged that KB Nevada fraudulently induced them to enter into the purchase and development agreements. LVDA’s and Essex’s lenders subsequently filed related actions that were consolidated into the LVDA/Essex matter. The consolidated plaintiffs sought rescission of the agreements or, in the alternative, compensatory damages of $55 million plus unspecified punitive damages and other damages, and interest charges in excess of $41 million (“Claimed Damages”). KB Nevada has denied the allegations, and believes it has meritorious defenses to the consolidated plaintiffs’ claims. On March 15, 2013, the court entered orders denying the consolidated plaintiffs’ motions for summary judgment and granting the majority of KB Nevada’s motions for summary judgment, eliminating, among other of the consolidated plaintiffs’ claims, those for fraud, negligent misrepresentation, and punitive damages. With the court’s decisions, the only remaining claims against KB Nevada are for contract damages and rescission. In August 2013, the court granted motions that further narrowed the scope of the Claimed Damages. While the ultimate outcome is uncertain — we believe it is reasonably possible that the loss in this matter could exceed the amount accrued by a range of zero to approximately $55 million plus prejudgment interest, which could be material to our consolidated financial statements — KB Nevada believes it will be successful in defending against the consolidated plaintiffs’ remaining claims and that the consolidated plaintiffs will not be awarded rescission or damages. The non-jury trial was originally set for September 2012 and extended multiple times by the court. On October 28, 2015, the court scheduled a new trial date of January 12, 2016, which the court subsequently set aside and the establishment of a new date is pending.
Wage and Hour Litigation. In May 2011, a group of current and former sales representatives filed a collective action lawsuit in the United States District Court for the Southern District of Texas, Galveston Division entitled Edwards, K. v. KB Home. The lawsuit alleged that we misclassified sales representatives and failed to pay minimum and overtime wages in violation of the Fair Labor Standards Act (29 U.S.C. §§ 206-07). In September 2012, the Edwards court conditionally certified a nationwide class, and in May 2015, scheduled an initial trial involving a portion of the plaintiffs for December 2015. In September 2013, some of the plaintiffs in the Edwards case filed a lawsuit in Los Angeles Superior Court entitled Andrea L. Bejenaru, et. al. v. KB Home, et. al. The lawsuit alleged violations of California laws relating to overtime, meal period and rest break pay, itemized wage statements, waiting time penalties and unfair business practices for a class of sales representatives. Although the case involved a putative class of individuals who were our sales representatives from September 2009 forward, the Bejenaru case was not certified as a class action. In the second quarter of 2015, plaintiff representatives in the Edwards and the Bejenaru cases claimed $66 million in compensatory damages, penalties and interest, as well as injunctive relief, attorneys’ fees and costs for both matters. On November 18, 2015, we reached a tentative mediated settlement with the plaintiff representatives in both cases that remains subject to judicial approval. We established an accrual for these matters in 2015, and increased the accrual by an immaterial amount in the fourth quarter to reflect the tentative settlement.
San Diego Water Board Notice of Violation. In August 2015, the California Regional Water Quality Control Board, San Diego Region (“RWQCB”) issued to us and another homebuilder a Notice of Violation (“NOV”) alleging violations of the California Water Code and waste discharge prohibitions of the water quality control plan for the San Diego Region (Basin Plan). According to the NOV, the alleged violations involved the unpermitted discharge of fill material into the waters of the United States/California during the grading of a required secondary access road for a community located in San Diego County, California, which was performed pursuant to a County-issued grading permit. In its NOV, the RWQCB requested to meet with us to discuss the alleged
violations as part of its process to determine whether to bring any enforcement action. We have met with the RWQCB and are currently in discussions to resolve the matters alleged in the NOV. While the ultimate outcome is uncertain, we believe that any penalties and related corrective measures the RWQCB may impose under the NOV could exceed $100,000 (the threshold for the required disclosure of this type of environmental proceeding) but they are not expected to be material to our consolidated financial statements.
Other Matters. In addition to the specific proceedings described above, we are involved in other litigation and regulatory proceedings incidental to our business that are in various procedural stages. We believe that the accruals we have recorded for probable and reasonably estimable losses with respect to these proceedings are adequate and that, as of November 30, 2015, it was not reasonably possible that an additional material loss had been incurred in an amount in excess of the estimated amounts already recognized in our consolidated financial statements. We evaluate our accruals for litigation and regulatory proceedings at least quarterly and, as appropriate, adjust them to reflect (a) the facts and circumstances known to us at the time, including information regarding negotiations, settlements, rulings and other relevant events and developments; (b) the advice and analyses of counsel; and (c) the assumptions and judgment of management. Similar factors and considerations are used in establishing new accruals for proceedings as to which losses have become probable and reasonably estimable at the time an evaluation is made. Based on our experience, we believe that the amounts that may be claimed or alleged against us in these proceedings are not a meaningful indicator of our potential liability. The outcome of any of these proceedings, including the defense and other litigation-related costs and expenses we may incur, however, is inherently uncertain and could differ significantly from the estimate reflected in a related accrual, if made. Therefore, it is possible that the ultimate outcome of any proceeding, if in excess of a related accrual or if an accrual had not been made, could be material to our consolidated financial statements.
| |
| Note 17. | Stockholders’ Equity |
Preferred Stock. OnTo help protect the benefits of our NOLs, built-in losses and tax credits from the impact of an ownership change under Section 382, on January 22, 2009, we adopted a Rights Agreement between us and Computershare Shareowner Services LLC (successor to Mellon Investor Services LLC), as rights agent, dated as of that date (the “2009 Rights Agreement”), and we declared a dividend distribution of one preferred share purchase right for each outstanding share of common stock that was payable to stockholders of record as of the close of business on March 5, 2009. Subject to the terms, provisions and conditions of the 2009 Rights Agreement, if these rights become exercisable, each right would initially represent the right to purchase from us 1/100th of a share of our Series A Participating Cumulative Preferred Stock for a purchase price of $85.00 (the “Purchase(“Purchase Price”). If issued, each fractional share of preferred stock would generally give a stockholder approximately the same dividend, voting and liquidation rights as does one share of our common stock. However, prior to exercise, a right does not give its holder any rights as a stockholder, including without limitation any dividend, voting or liquidation rights. The rights will not be exercisable until the earlier of (i)(a) 10 calendar days after a public announcement by us that a person or group has become an Acquiring Person (as defined under the 2009 Rights Agreement) and (ii)(b) 10 business days after the commencement of a tender or exchange offer by a person or group if upon consummation of the offer the person or group would beneficially own 4.9% or more of our outstanding common stock.
Until these rights become exercisable (the “Distribution Date”), common stock certificates will evidence the rights and may contain a notation to that effect. Any transfer of shares of our common stock prior to the Distribution Date will constitute a transfer of the associated rights. After the Distribution Date, the rights may be transferred other than in connection with the transfer of the underlying shares of our common stock. If there is an Acquiring Person on the Distribution Date or a person or group becomes an Acquiring Person after the Distribution Date, each holder of a right, other than rights that are or were beneficially owned by an Acquiring Person, which will be void, will thereafter have the right to receive upon exercise of a right and payment of the Purchase Price, that number of shares of our common stock having a market value of two times the Purchase Price. After the later of the Distribution Date and the time we publicly announce that an Acquiring Person has become such, our board of directors may exchange the rights, other than rights that are or were beneficially owned by an Acquiring Person, which will be void, in whole or in part, at an exchange ratio of one share of common stock per right, subject to adjustment.
At any time prior to the later of the Distribution Date and the time we publicly announce that an Acquiring Person becomes such, our board of directors may redeem all of the then-outstanding rights in whole, but not in part, at a price of $.001 per right, subject to adjustment (the “Redemption(“Redemption Price”). The redemption will be effective immediately upon the board of directors’ action, unless the action provides that such redemption will be effective at a subsequent time or upon the occurrence or nonoccurrence of one or more specified events, in which case the redemption will be effective in accordance with the provisions of the action. Immediately upon the effectiveness of the redemption of the rights, the right to exercise the rights will terminate and the only right of the holders of rights will be to receive the Redemption Price, with interest thereon. The rights issued pursuant to the 2009 Rights Agreement will expire on the earliest of (a) the close of business on March 5, 2019, (b) the time at which the rights are redeemed, (c) the time at which the rights are exchanged, (d) the time at which our board of directors determines that a related provision in our Restated Certificate of Incorporation is no longer necessary, and (e) the close of business on the first day of a
taxable year of ours to which our board of directors determines that no tax benefits may be carried forward. At our annual meeting of stockholders on April 2, 2009, our stockholders approved the 2009 Rights Agreement.
Common Stock. In 2014, we issued 7,986,111 shares of our common stock, par value $1.00 per share, in underwritten public offerings at a price of $18.00 per share. We used shares of treasury stock for the issuance and received net proceeds of $137.0 million after underwriting discounts, commissions and transaction expenses. In 2013, we issued 6,325,000 shares of our common stock, par value $1.00 per share, in an underwritten public offering at a price of $18.25 per share. We used shares of treasury stock for the issuance and received net proceeds of $109.5 million after underwriting discounts, commissions and transaction expenses.
We maintain a common stock reserve account with our transfer agent to reserve the maximum number of shares of our common stock potentially deliverable upon conversion to holders of the 1.375% Convertible Senior Notes due 2019 based on the terms of their governing instruments. Accordingly, the common stock reserve account had a balance of 12,602,735 shares at November 30, 2015 and 2014. The maximum number of shares would potentially be deliverable to holders only in certain limited circumstances as set forth in the instruments governing these notes.
Each share of our common stock issued in the 2013 and 2014 offerings includes a preferred share purchase right associated with and subject to the terms of the Rights Agreement. Any shares of our common stock delivered upon conversion to holders of the 1.375% Convertible Senior Notes due 2019 will also include such preferred share purchase rights.
In 2014, our board of directors amended the Director Plan to provide directors with a one-time opportunity to irrevocably elect to receive an equivalent value of shares of our common stock in lieu of the cash payments that are otherwise due upon the respective settlement of their outstanding and any future Director Plan SARs under the terms of the plan. Concurrent with the amendment of the Director Plan, for the purpose of effecting any such Director Plan SAR settlements, our board of directors authorized the repurchase of no more than 680,000 shares of our common stock, and also authorized potential future grants of up to 680,000 stock payment awards under the KB Home 2014 Equity Incentive Plan (“2014 Plan”), in each case solely as necessary for director elections in respect of outstanding Director Plan SARs. The 2014 Plan is discussed in Note 19. Employee Benefit and Stock Plans. During 2014, following the amendment of the Director Plan, directors made irrevocable elections to receive an aggregate of 679,815 shares of our common stock upon the respective settlement of their outstanding Director Plan SARs. As of November 30, 2012,2015, we had not settled any Director Plan SARs. In addition, we had not repurchased any shares and no stock payment awards had been granted under the 2014 Plan pursuant to the respective board of directors authorizations.
In 2013, directors were provided a one-time opportunity to elect and they made irrevocable elections to receive an equivalent value of shares of our common stock in lieu of the cash payments that are otherwise due upon the settlement of their outstanding stock units under the terms of the Director Plan. At that date, there were a total of 481,554 outstanding stock units. Concurrent with the amendment of the Director Plan, our board of directors authorized the repurchase of no more than 482,000 shares of our common stock solely as necessary for director elections in respect of outstanding stock units. During 2013, following the amendment of the Director Plan, directors made irrevocable elections to receive an aggregate of 478,294 shares of our common stock upon the respective settlement of their outstanding stock units, and we repurchased through open market transactions such shares pursuant to the authorization at an aggregate price of $7.9 million. We do not anticipate any additional repurchases of our common stock pursuant to this board of directors authorization.
The above-described director elections made in 2014 and 2013 changed only the method of settlement of the outstanding Director Plan SARs and stock units, respectively, and did not change any of the other terms of these awards or impact the value to the directors. As a result of the directors’ elections, the relevant outstanding Director Plan SARs and stock units were effectively converted to stock-settled awards, which are accounted for as equity awards, instead of cash-settled liability awards, thereby reducing the degree of variability in the expense associated with such stock units in future quarters.
As of November 30, 2015, we were authorized to repurchase 4,000,000 shares of our common stock under a stand-alone board-approved share repurchase program. We did not repurchase any of our common stock under this program in 2012, 20112015, 2014 or 2010. We have not repurchased common shares pursuant to a common stock repurchase plan for the past several years and any resumption of such stock repurchases will be at the discretion of our board of directors.
2013.
Our board of directors declared a quarterly dividend of$.0625per share of common stock in the first quarter of 2012 and quarterly dividends of$.0250per share of common stock in each of the second, third and fourth quarters of 2012. All dividends declared in 2012 were paid during the year. During 2011 and 2010, our board of directors declared four quarterly cash dividends of$.0625 $.0250 per share of common stock in 2015, 2014 and 2013. thatAll dividends declared during 2015, 2014 and 2013 were also paid during those years.
Treasury Stock. We acquired $1.8$.6 million, $.5 million and $8.5 million of our common stock in 20122015, 2014 and $.4 million2013, respectively. All of the common stock acquired in 2010, which were2015 and 2014 and a portion of the common stock acquired in 2013 consisted of previously issued shares delivered to us by employees to satisfy their withholding tax obligations on the vesting of restricted stock awards or of forfeitures of previous restricted stock awards. We did not acquire any shares of ourThe common stock acquired in 2011.2013 was primarily related to director elections in respect of outstanding stock units under the Director Plan, as described above. Treasury stock is recorded at cost. Differences between the cost of treasury stock and the reissuance proceeds are recorded to paid-in capital. These transactions are not considered repurchases under the 4,000,000 share repurchase program.program described above.
| |
Note 17.18. | Employee Benefit and Stock PlansAccumulated Other Comprehensive Loss |
Most of our employees are eligible to participateThe following table presents the changes in the KB Home 401(k) Savings Plan (the “401(k) Plan”) under which contributions by employees are partially matched by us. The aggregate costbalances of the 401(k) Plan to us was $2.6 million in 2012, $2.8 million in 2011 and $3.2 million in 2010. The assetseach component of the 401(k) Plan are held by a third-party trustee. The 401(k) plan participants may direct the investment of their funds among one or more of the several fund options offered by the 401(k) Plan. A fund consisting of our common stock is one of the investment choices available to participants. As of November 30, 2012, 2011 and 2010, approximately 7%, 4% and 5%, respectively, of the 401(k) Plan’s net assets were invested in the fund consisting of our common stock.
At our Annual Meeting of Stockholders held on April 1, 2010, our stockholders approved the KB Home 2010 Equity Incentive Plan (the “2010 Plan”), authorizing, amongaccumulated other things, the issuance of up to 3,500,000 shares of our common stock for grants of stock-based awards to our employees, non-employee directors and consultants. This pool of shares includes all of the shares that were available for grant as of April 1, 2010 under our 2001 Stock Incentive Plan, under which no new awards may be made. Accordingly, as of April 1, 2010, the 2010 Plan became our only active equity compensation plan. Under the 2010 Plan, grants of stock options and other similar awards reduce the 2010 Plan’s share capacity on a 1-for-1 basis, and grants of restricted stock and other similar “full value” awards reduce the 2010 Plan’s share capacity on a 1.78-for-1 basis. In addition, subject to the 2010 Plan’s terms and conditions, a stock-based award may also be granted under the 2010 Plan to replace an outstanding award granted under another of our plans (subject to the terms of such other plan) with terms substantially identical to those of the award being replaced.
At our Annual Meeting of Stockholders held on April 7, 2011, our stockholders approved an amendment to the 2010 Plan (the “Plan Amendment”) to increase the number of shares of our common stock that may be issued under the 2010 Plan by an additional 4,000,000 shares.
The 2010 Plan provides that stock options, performance stock, restricted stock and stock units may be awarded for periods of up to 10 years. The 2010 Plan also enables us to grant cash bonuses, SARs and other stock-based awards. In addition to awards outstanding under the 2010 Plan, we have awards outstanding under our Amended and Restated 1999 Incentive Plan (the “1999 Plan”), which provided for generally the same types of awards as the 2010 Plan. We also have awards outstanding under our 1988 Employee Stock Plan and our Performance-Based Incentive Plan for Senior Management, each of which provides for generally the same types of awards as the 2010 Plan, but stock option awards granted under these plans have terms of up to 15 years.
Stock Options. Stock option transactions are summarized as follows:comprehensive loss (in thousands):
|
| | | | | | | | | | | | | | | | | | | | |
| | Years Ended November 30, |
| | 2012 | | 2011 | | 2010 |
| | Options | | Weighted Average Exercise Price | | Options | | Weighted Average Exercise Price | | Options | | Weighted Average Exercise Price |
| Options outstanding at beginning of year | 10,160,396 |
| | $ | 21.27 |
| | 8,798,613 |
| | $ | 24.19 |
| | 5,711,701 |
| | $ | 27.39 |
|
| Granted | 30,000 |
| | 9.08 |
| | 1,716,000 |
| | 6.36 |
| | 3,572,237 |
| | 18.71 |
|
| Exercised | (7,494 | ) | | 13.93 |
| | — |
| | — |
| | (28,281 | ) | | 13.00 |
|
| Cancelled | (77,356 | ) | | 17.96 |
| | (354,217 | ) | | 21.47 |
| | (457,044 | ) | | 22.05 |
|
| Options outstanding at end of year | 10,105,546 |
| | $ | 21.27 |
| | 10,160,396 |
| | $ | 21.27 |
| | 8,798,613 |
| | $ | 24.19 |
|
| Options exercisable at end of year | 8,533,224 |
| | $ | 23.76 |
| | 7,142,568 |
| | $ | 26.43 |
| | 6,146,605 |
| | $ | 28.73 |
|
| Options available for grant at end of year | 1,721,847 |
| | | | 2,477,219 |
| | | | 21,703 |
| | |
The total intrinsic value of stock options exercised was less than $.1 million for the year ended November 30, 2012 and was $.1 million for the year ended November 30, 2010. There were no stock options exercised during the year ended November 30,
2011. The aggregate intrinsic value of stock options outstanding was $18.2 million, $1.7 million and $.3 million at November 30, 2012, 2011 and 2010, respectively. The intrinsic value of stock options exercisable was $7.8 million at November 30, 2012. Stock options exercisable had no intrinsic value at November 30, 2011 and an intrinsic value of less than $.1 million at November 30, 2010. The intrinsic value of a stock option is the amount by which the market value of the underlying stock exceeds the price of the option.
On August 13, 2010, we consummated an exchange offer (the “August 2010 Exchange Offer”) pursuant to which eligible employees had the opportunity to exchange their outstanding cash-settled SARs granted on October 2, 2008 and January 22, 2009 for non-qualified options to purchase shares of our common stock granted under the 2010 Plan. On November 9, 2010, we consummated a separate exchange offer (the “November 2010 Exchange Offer”) pursuant to which eligible employees had the opportunity to exchange their outstanding cash-settled SARs granted on July 12, 2007 and October 4, 2007 for non-qualified options to purchase shares of our common stock granted under the 2010 Plan.
Pursuant to both the August 2010 Exchange Offer and the November 2010 Exchange Offer, each stock option granted in exchange for a SAR had an exercise price equal to the SAR’s exercise price and the same number of underlying shares, vesting schedule and expiration date as each such SAR. The August 2010 Exchange Offer and the November 2010 Exchange Offer did not include a re-pricing or any other changes impacting the value to the employees. We conducted the August 2010 Exchange Offer and November 2010 Exchange Offer in an effort to reduce the overall degree of variability in the expense recorded for employee equity-based compensation by replacing the SARs, which are accounted for as liability awards, with stock options, which are accounted for as equity awards.
Pursuant to the August 2010 Exchange Offer, 19 eligible employees returned a total of 1,116,030 SARs to us, and those SARs were cancelled on August 13, 2010 in exchange for corresponding grants of stock options to 18 of those employees to purchase an aggregate of 1,073,737 shares of our common stock at $19.90 per share and one grant of stock options to one employee to purchase 42,293 shares of our common stock at $11.25 per share.
Pursuant to the November 2010 Exchange Offer, nine eligible employees returned a total of 925,705 SARs to us, and those SARs were cancelled on November 9, 2010 in exchange for corresponding grants of stock options to those nine employees to purchase an aggregate of 732,170 shares of our common stock at $28.10 per share and grants of stock options to seven of those employees to purchase an aggregate of 193,535 shares of our common stock at $36.19 per share. |
| | | | | |
| Postretirement Benefit Plan Adjustments | | | Total Accumulated Other Comprehensive Loss |
| Balance at November 30, 2013 | | | $ | (17,516 | ) |
| Other comprehensive loss before reclassifications | | | (3,801 | ) |
| Amounts reclassified from accumulated other comprehensive loss | | | 1,913 |
|
| Income tax expense related to items of other comprehensive income | | | (1,604 | ) |
| Other comprehensive loss, net of tax | | | (3,492 | ) |
| Balance at November 30, 2014 | | | (21,008 | ) |
| Other comprehensive income before reclassifications | | | 3,745 |
|
| Amounts reclassified from accumulated other comprehensive loss | | | 2,404 |
|
| Income tax expense related to items of other comprehensive income | | | (2,460 | ) |
| Other comprehensive income, net of tax | | | 3,689 |
|
| Balance at November 30, 2015 | | | $ | (17,319 | ) |
The stock options granted pursuant to the August 2010 Exchange Offer and the November 2010 Exchange Offer are included in the stock options granted total in the above table.
On October 6, 2011, our president and chief executive officer was granted an award of performance-based stock options to purchase an aggregate of 365,000 shares of our common stock at the purchase price of $6.32 per share. The performance-based stock options shall vest and become exercisable if our president and chief executive officer does not experience a termination of service prior to the applicable dates described in his performance option agreement, and if the performance goal, as set forth in that agreement, has been satisfied. The number of performance-based stock options that ultimately vest depends on the achievement of oneamounts reclassified from accumulated other comprehensive loss consisted of the following three performance metrics: positive cumulative operating margin; relative operating margin; and customer satisfaction, as set forth in the agreement. In accordance with ASC 718, we used the Black-Scholes option-pricing model to estimate the grant date fair value per performance-based stock option of $2.54.
On October 7, 2010, our president and chief executive officer was granted an award of performance-based stock options to purchase an aggregate of 260,000 shares of our common stock at the purchase price of $11.06 per share. The performance-based stock options shall vest and become exercisable if our president and chief executive officer does not experience a termination of service prior to the applicable dates described in his performance option agreement, and if the performance goal, as set forth in that agreement, has been satisfied. The number of performance-based stock options that ultimately vest depends on the achievement of one of the following three performance metrics: positive cumulative operating margin; relative operating margin; and relative customer satisfaction, as set forth in the agreement. In accordance with ASC 718, we used the Black-Scholes option-pricing model to estimate the grant date fair value per performance-based stock option of $4.59.
Stock options outstanding and stock options exercisable at November 30, 2012 are as follows:(in thousands):
|
| | | | | | | | | | | | | | | | | | | | |
| | | Options Outstanding | | Options Exercisable |
| Range of Exercise Price | | Options | | Weighted Average Exercise Price | | Weighted Average Remaining Contractual Life | | Options | | Weighted Average Exercise Price | | Weighted Average Remaining Contractual Life |
$ 6.32 to $10.54 | | 1,704,998 |
| | $ | 6.43 |
| | 8.8 |
| | 567,674 |
| | $ | 6.44 |
| | |
| $10.55 to $14.96 | | 2,030,550 |
| | 12.07 |
| | 6.6 |
| | 1,595,552 |
| | 12.34 |
| | |
| $14.97 to $20.08 | | 2,211,772 |
| | 17.69 |
| | 6.3 |
| | 2,211,772 |
| | 17.69 |
| | |
| $20.09 to $33.92 | | 2,024,721 |
| | 27.35 |
| | 5.1 |
| | 2,024,721 |
| | 27.35 |
| | |
| $33.93 to $69.63 | | 2,133,505 |
| | 39.81 |
| | 5.4 |
| | 2,133,505 |
| | 39.81 |
| | |
| $ 6.32 to $69.63 | | 10,105,546 |
| | $ | 21.27 |
| | 6.3 |
| | 8,533,224 |
| | $ | 23.76 |
| | 5.9 |
|
|
| | | | | | | | | | | | |
| | | Years Ended November 30, |
| Details About Accumulated Other Comprehensive Loss Components | | 2015 | | 2014 | | 2013 |
| Postretirement benefit plan adjustments | | | | | | |
| Amortization of net actuarial loss | | $ | 848 |
| | $ | 357 |
| | $ | 1,803 |
|
| Amortization of prior service cost | | 1,556 |
| | 1,556 |
| | 1,556 |
|
| Total reclassifications (a) | | $ | 2,404 |
| | $ | 1,913 |
| | $ | 3,359 |
|
The weighted average grant date fair value of stock options granted in 2012, 2011 and 2010 was $4.18, $2.56 and $2.81, respectively. The fair value of each stock option grant is estimated on the date of grant using the Black-Scholes option-pricing model with the following assumptions:
|
| | | | | | | | |
| | Years Ended November 30, |
| | 2012 | | 2011 | | 2010 |
| Risk-free interest rate | .7 | % | | .9 | % | | .7 | % |
| Expected volatility factor | 65.6 | % | | 65.6 | % | | 61.7 | % |
| Expected dividend yield | 1.9 | % | | 3.9 | % | | 2.2 | % |
| Expected term | 5 years |
| | 5 years |
| | 3 years |
|
| |
| (a) | The accumulated other comprehensive loss components are included in the computation of net periodic benefit costs as further discussed in Note 20. Postretirement Benefits. |
The risk-free interest rate assumption is determined based on observed interest rates appropriate for the expected term of our stock options. The expected volatility factor is based on a combination of the historical volatility of our common stockestimated net actuarial loss and the implied volatility of publicly traded options on our stock. The expected dividend yield assumption is based on our history of dividend payouts. The expected term of employee stock options is estimated using historical data.
Our stock-based compensation expense related to stock option grants was $5.0 million in 2012, $5.9 million in 2011 and $5.8 million in 2010. As of November 30, 2012, there was $1.7 million of total unrecognized stock-based compensation expense related to unvested stock option awards. This expense isprior service cost expected to be recognized over a weighted average period of 1.3 years.
We record proceedsamortized from the exercise of stock options as additions to common stockaccumulated other comprehensive loss into net periodic benefit cost during 2016 are $.1 million and paid-in capital. The tax shortfalls of $.3$1.6 million, in 2012, $1.0 million in 2011 and $2.8 million in 2010 resulting from the cancellation of stock awards, were reflected in paid-in capital. In 2012 and 2011, the consolidated statement of cash flows reflected no excess tax benefit associated with the exercise of stock options since December 1, 2005, in accordance with the cash flow classification requirements of ASC 718. In 2010, the consolidated statement of cash flows reflected $.6 million of excess tax benefit associated with the exercise of stock options.
Other Stock-Based Awards. From time to time, we grant restricted stock to various employees as a compensation benefit. During the restriction periods, these employees are entitled to vote and to receive cash dividends on such shares. The restrictions imposed with respect to the shares granted lapse over periods of three years if certain conditions are met. respectively.
Restricted stock transactions are summarized as follows:
|
| | | | | | | | | | | | | |
| | Years Ended November 30, |
| | 2012 | | 2011 |
| | Shares | | Weighted Average per Share Grant Date Fair Value | | Shares | | Weighted Average per Share Grant Date Fair Value |
| Outstanding at beginning of year | 338,912 |
| | $ | 15.03 |
| | 402,477 |
| | $ | 15.09 |
|
| Granted | 207,617 |
| | 16.23 |
| | — |
| | — |
|
| Vested | (176,135 | ) | | 14.25 |
| | (10,930 | ) | | 13.49 |
|
| Cancelled | (140,670 | ) | | 15.44 |
| | (52,635 | ) | | 15.44 |
|
| Outstanding at end of year | 229,724 |
| | $ | 15.81 |
| | 338,912 |
| | $ | 15.03 |
|
As of November 30, 2012, we had $3.3 million of total unrecognized compensation cost related to restricted stock awards that will be recognized over a weighted average period of approximately three years.
On November 8, 2012, we granted PSUs to certain employees. Each PSU grant corresponds to a target amount of our common stock (the “Award Shares”). Each PSU entitles the recipient to receive a grant of between 0% and 200% of the recipient’s Award Shares, and will vest based on our achieving, over a three-year period commencing on December 1, 2012 and ending on November 30, 2015, specified levels of (a) average return on equity performance and (b) revenue growth relative to a peer group of high-production homebuilding companies, subject to the recipient’s continued employment with us through to and including the date on which the management development and compensation committee of our board of directors determines performance for each of the measures. The grant date fair value of each such PSU was $16.23. As of November 30, 2012, there were 227,049 PSUs outstanding. The number of shares of our common stock actually granted to a recipient, if any, when a PSU vests will depend on the degree of achievement of the applicable performance measures during the three-year performance period. Compensation cost for PSUs is initially estimated based on target performance achievement and adjusted as appropriate throughout the performance period. Accordingly, future compensation costs associated with outstanding PSUs may increase or decrease based on the probability of our achievement with respect to the applicable performance measures. At November 30, 2012, we had $3.6 million of total unrecognized compensation cost related to unvested PSUs, which is expected to be recognized over a weighted-average period of approximately three years.
In 2009 and 2008, we granted phantom shares to various employees. In 2008, we also granted SARs to various employees. These cash-settled awards have been accounted for as liabilities in our consolidated financial statements. Each phantom share represented the right to receive a cash payment equal to the closing price of our common stock on the applicable vesting date. Each SAR represents a right to receive a cash payment equal to the positive difference, if any, between the grant price and the market value of a share of our common stock on the date of exercise. The phantom shares vested in full at the end of three years, while the SARs vested in equal annual installments over three years. There were no phantom shares outstanding as of November 30, 2012, compared to 5,556 and 268,762 phantom shares outstanding as of November 30, 2011 and 2010, respectively. We had 29,939 SARs outstanding at both November 30, 2012 and 2011, compared to 37,517 SARs outstanding as of November 30, 2010. The year-over-year decrease in the number of outstanding SARs in 2011 from 2010 reflects the impact of the August 2010 Exchange Offer and the November 2010 Exchange Offer.
We recognized total compensation expense of $1.7 million in 2012, $1.2 million in 2011 and $.7 million in 2010 related to restricted stock, PSUs, phantom shares and SARs.
Grantor Stock Ownership Trust. On August 27, 1999, we established a grantor stock ownership trust (the “Trust”) into which certain shares repurchased in 2000 and 1999 were transferred. The Trust, administered by a third-party trustee, holds and distributes the shares of common stock acquired to support certain employee compensation and employee benefit obligations under our existing stock option, the 401(k) Plan and other employee benefit plans. The existence of the Trust has no impact on the amount of benefits or compensation that is paid under these plans.
For financial reporting purposes, the Trust is consolidated with us, and therefore any dividend transactions between us and the Trust are eliminated. Acquired shares held by the Trust remain valued at the market price on the date of purchase and are shown as a reduction to stockholders’ equity in the consolidated balance sheets. The difference between the Trust share value and the market value on the date shares are released from the Trust is included in paid-in capital. Common stock held in the Trust is not considered outstanding in the computations of earnings (loss) per share. The Trust held 10,615,934 and 10,884,151 shares of common stock at November 30, 2012 and 2011, respectively. The trustee votes shares held by the Trust in accordance with voting directions from eligible employees, as specified in a trust agreement with the trustee.
| |
Note 18.19. | Employee Benefit and Stock Plans |
Most of our employees are eligible to participate in the KB Home 401(k) Savings Plan (“401(k) Plan”) under which we partially match employee contributions. The aggregate cost of the 401(k) Plan to us was $4.6 million in 2015, $3.8 million in 2014 and $3.3 million in 2013. The assets of the 401(k) Plan are held by a third-party trustee. The 401(k) Plan participants may direct the investment of their funds among one or more of the several fund options offered by the 401(k) Plan. As of November 30, 2015, 2014 and 2013, approximately 5%, 6% and 7%, respectively, of the 401(k) Plan’s net assets were invested in our common stock.
KB Home 2014 Plan. At our Annual Meeting of Stockholders held on April 3, 2014, our stockholders approved the 2014 Plan, authorizing, among other things, the issuance for grants of stock-based awards to our employees, non-employee directors and consultants of up to 4,800,000 shares of our common stock, plus any shares that were available for grant as of April 3, 2014 under our 2010 Equity Incentive Plan (“2010 Plan”), and any shares subject to then-outstanding awards under the 2010 Plan that subsequently expire or are canceled, forfeited, tendered or withheld to satisfy tax withholding obligations with respect to full value awards, or settled for cash, subject to the terms of the 2014 Plan. No new awards may be made under the 2010 Plan. As a result, as of April 3, 2014, the 2014 Plan became our only active equity compensation plan. Under the 2014 Plan, grants of stock options and other similar awards reduce the 2014 Plan’s share capacity on a 1-for-1 basis, and grants of restricted stock and other similar “full value” awards reduce the 2014 Plan’s share capacity on a 1.78-for-1 basis. In addition, subject to the 2014 Plan’s terms and conditions, a stock-based award may also be granted under the 2014 Plan to replace an outstanding award granted under another plan of ours (subject to the terms of such other plan) with terms substantially identical to those of the award being replaced.
The 2014 Plan provides that stock options and SARs may be awarded for periods of up to 10 years. The 2014 Plan also enables us to grant cash bonuses and other stock-based awards. As of November 30, 2015, 2014, and 2013, in addition to awards outstanding under the 2014 Plan, we had awards outstanding under the 2010 Plan and our Amended and Restated 1999 Incentive Plan, both of which provided for generally the same types of awards as the 2014 Plan. We also had awards outstanding under our Performance-Based Incentive Plan for Senior Management, which provided for generally the same types of awards as the 2014 Plan, but stock option awards granted under this plan had terms of up to 15 years.
Stock-Based Compensation. With the approval of the management development and compensation committee, consisting entirely of independent members of our board of directors, we have provided compensation benefits to certain of our employees in the form of stock options, restricted stock, PSUs and SARs. Certain stock-based compensation benefits are also provided to our non-employee directors pursuant to the Director Plan. Compensation expense related to equity-based awards is included in selling, general and administrative expenses in our consolidated statements of operations.
The following table presents our stock-based compensation expense (in thousands): |
| | | | | | | | | | | |
| | Years Ended November 30, |
| | 2015 | | 2014 | | 2013 |
| Stock options (a) | $ | 7,576 |
| | $ | 3,024 |
| | $ | 2,285 |
|
| Restricted stock | 2,499 |
| | 1,750 |
| | 1,365 |
|
| PSUs | 5,404 |
| | 3,699 |
| | 2,049 |
|
| Director awards | 1,664 |
| | (91 | ) | | 4,023 |
|
| Total | $ | 17,143 |
| | $ | 8,382 |
| | $ | 9,722 |
|
| |
| (a) | Compensation expense associated with stock options accelerated in 2015 as a result of retirement provisions being met for certain stock option recipients. |
Stock Options. Stock option transactions are summarized as follows:
|
| | | | | | | | | | | | | | | | | | | | |
| | Years Ended November 30, |
| | 2015 | | 2014 | | 2013 |
| | Options | | Weighted Average Exercise Price | | Options | | Weighted Average Exercise Price | | Options | | Weighted Average Exercise Price |
| Options outstanding at beginning of year | 11,735,042 |
| | $ | 20.45 |
| | 10,531,938 |
| | $ | 21.11 |
| | 10,105,546 |
| | $ | 21.27 |
|
| Granted | 1,262,000 |
| | 14.92 |
| | 1,273,647 |
| | 14.62 |
| | 550,000 |
| | 16.63 |
|
| Exercised | (76,164 | ) | | 9.69 |
| | (36,665 | ) | | 7.92 |
| | (118,208 | ) | | 13.46 |
|
| Cancelled | (285,234 | ) | | 45.80 |
| | (33,878 | ) | | 20.25 |
| | (5,400 | ) | | 24.24 |
|
| Options outstanding at end of year | 12,635,644 |
| | $ | 19.39 |
| | 11,735,042 |
| | $ | 20.45 |
| | 10,531,938 |
| | $ | 21.11 |
|
| Options exercisable at end of year | 10,389,722 |
| | $ | 20.35 |
| | 10,103,739 |
| | $ | 21.32 |
| | 9,414,935 |
| | $ | 22.26 |
|
| Options available for grant at end of year | 1,544,195 |
| | | | 3,514,077 |
| | | | 746,043 |
| | |
The total intrinsic value of stock options exercised was $.4 million for the year ended November 30, 2015, $.3 million for the year ended November 30, 2014 and $1.2 million for the year ended November 30, 2013. The aggregate intrinsic value of stock options outstanding was $16.4 million, $35.8 million and $32.3 million at November 30, 2015, 2014 and 2013, respectively. The intrinsic value of stock options exercisable was $16.4 million at November 30, 2015, $31.7 million at November 30, 2014, and $25.5 million at November 30, 2013. The intrinsic value of a stock option is the amount by which the market value of the underlying stock exceeds the price of the option.
Stock options outstanding and stock options exercisable at November 30, 2015 are summarized as follows:
|
| | | | | | | | | | | | | | | | | | | | |
| | | Options Outstanding | | Options Exercisable |
| Range of Exercise Price | | Options | | Weighted Average Exercise Price | | Weighted Average Remaining Contractual Life | | Options | | Weighted Average Exercise Price | | Weighted Average Remaining Contractual Life |
$ 6.32 to $11.06 | | 2,771,667 |
| | $ | 8.33 |
| | 5.4 |
| | 2,771,667 |
| | $ | 8.33 |
| | |
| $11.07 to $14.95 | | 3,166,036 |
| | 14.49 |
| | 7.7 |
| | 1,088,448 |
| | 13.89 |
| | |
| $14.96 to $19.90 | | 2,652,671 |
| | 17.31 |
| | 4.2 |
| | 2,484,337 |
| | 17.35 |
| | |
| $19.91 to $33.92 | | 2,092,746 |
| | 26.99 |
| | 2.1 |
| | 2,092,746 |
| | 26.99 |
| | |
| $33.93 to $69.63 | | 1,952,524 |
| | 37.73 |
| | 2.6 |
| | 1,952,524 |
| | 37.73 |
| | |
| $ 6.32 to $69.63 | | 12,635,644 |
| | $ | 19.39 |
| | 4.7 |
| | 10,389,722 |
| | $ | 20.35 |
| | 3.8 |
|
The weighted average grant date fair value of stock options granted in 2015, 2014 and 2013 was $5.49, $5.07 and $6.96, respectively. The fair value of each stock option grant is estimated on the date of grant using the Black-Scholes option-pricing model with the following assumptions:
|
| | | | | | | | |
| | Years Ended November 30, |
| | 2015 | | 2014 | | 2013 |
| Risk-free interest rate | 1.4 | % | | 1.6 | % | | 1.3 | % |
| Expected volatility factor | 43.6 | % | | 41.0 | % | | 52.3 | % |
| Expected dividend yield | .7 | % | | .7 | % | | .6 | % |
| Expected term | 5 years |
| | 5 years |
| | 5 years |
|
The risk-free interest rate assumption is determined based on observed interest rates appropriate for the expected term of our stock options. The expected volatility factor is based on a combination of the historical volatility of our common stock and the implied volatility of publicly traded options on our stock. The expected dividend yield assumption is based on our history of dividend payouts. The expected term of employee stock options is estimated using historical data.
As of November 30, 2015, there was $5.0 million of total unrecognized stock-based compensation expense related to unvested stock option awards. This expense is expected to be recognized over a weighted average period of 1.7 years.
We record proceeds from the exercise of stock options as additions to common stock and paid-in capital. The tax shortfalls of $1.7 million in 2015, $1.2 million in 2014 and $.7 million in 2013 resulting from the cancellation of stock awards were reflected in paid-in capital. In 2015, the consolidated statement of cash flows reflected $.2 million excess tax benefit associated with the exercise of stock options. In 2014 and 2013, the consolidated statement of cash flows reflected no excess tax benefit associated with the exercise of stock options.
Restricted Stock. From time to time, we grant restricted stock to various employees as a compensation benefit. During the restriction periods, these employees are entitled to vote and to receive cash dividends on such shares. The restrictions imposed with respect to the shares granted generally lapse over periods of three years if certain conditions are met.
Restricted stock transactions are summarized as follows:
|
| | | | | | | | | | | | | | | | | | | | |
| | Years Ended November 30, |
| | 2015 | | 2014 | | 2013 |
| | Shares | | Weighted Average per Share Grant Date Fair Value | | Shares | | Weighted Average per Share Grant Date Fair Value | | Shares | | Weighted Average per Share Grant Date Fair Value |
| Outstanding at beginning of year | 355,294 |
| | $ | 15.81 |
| | 219,628 |
| | $ | 16.23 |
| | 229,724 |
| | $ | 15.81 |
|
| Granted | 285,006 |
| | 15.19 |
| | 219,835 |
| | 15.34 |
| | 88,000 |
| | 17.50 |
|
| Vested | (204,663 | ) | | 14.83 |
| | (73,908 | ) | | 16.52 |
| | (91,312 | ) | | 15.18 |
|
| Cancelled | (18,660 | ) | | 15.45 |
| | (10,261 | ) | | 18.55 |
| | (6,784 | ) | | 17.24 |
|
| Outstanding at end of year | 416,977 |
| | $ | 15.88 |
| | 355,294 |
| | $ | 15.81 |
| | 219,628 |
| | $ | 16.23 |
|
As of November 30, 2015, we had $4.7 million of total unrecognized compensation cost related to restricted stock awards that will be recognized over a weighted average period of approximately three years.
Performance-Based Restricted Stock Units. On October 8, 2015, we granted PSUs to certain employees. Each PSU grant corresponds to a target amount of our common stock (“Award Shares”). Each PSU entitles the recipient to receive a grant of between 0% and 200% of the recipient’s Award Shares, and will vest based on our achieving, over a three-year period commencing on December 1, 2015 and ending on November 30, 2018, specified levels of (a) adjusted cumulative earnings per share (b) average adjusted return on invested capital and (c) revenue growth performance relative to a peer group of high-production public homebuilding companies. The grant date fair value of each such PSU was $14.92. On October 9, 2014, we granted PSUs to certain employees with similar terms as the 2015 PSU grants, except that the applicable performance period commenced on December 1, 2014 and ends on November 30, 2017. The grant date fair value of each such 2014 PSU was $14.62. On October 10, 2013, we granted PSUs to certain employees with similar terms as the 2015 PSU grants, except that the applicable performance period commenced on December 1, 2013 and ends on November 30, 2016 and the applicable performance measures are specified levels of (a) average return on equity performance and (b) revenue growth performance relative to a peer group of high-production public homebuilding companies. The grant date fair value of each such 2013 PSU was $16.63.
PSU transactions are summarized as follows:
|
| | | | | | | | | | | | | | | | | | | | |
| | Years Ended November 30, |
| | 2015 | | 2014 | | 2013 |
| | Shares | | Weighted Average per Share Grant Date Fair Value | | Shares | | Weighted Average per Share Grant Date Fair Value | | Shares | | Weighted Average per Share Grant Date Fair Value |
| Outstanding at beginning of year | 628,209 |
| | $ | 15.70 |
| | 385,049 |
| | $ | 16.39 |
| | 227,049 |
| | $ | 16.23 |
|
| Granted | 192,000 |
| | 14.92 |
| | 243,160 |
| | 14.62 |
| | 158,000 |
| | 16.63 |
|
| Outstanding at end of year | 820,209 |
| | $ | 15.52 |
| | 628,209 |
| | $ | 15.70 |
| | 385,049 |
| | $ | 16.39 |
|
| | | | | | | | | | | | |
The number of shares of our common stock actually granted to a recipient, if any, when a PSU vests will depend on the degree of achievement of the applicable performance measures during the applicable three-year period. The PSUs have no dividend or voting rights during the performance period. Compensation cost for PSUs is initially estimated based on target performance achievement and adjusted as appropriate throughout the performance period. Accordingly, future compensation costs associated with outstanding PSUs may increase or decrease based on the probability of achievement with respect to the applicable performance measures. At November 30, 2015, we had $9.8 million of total unrecognized compensation cost related to unvested PSUs, which is expected to be recognized over a weighted-average period of approximately three years.
Stock Appreciation Rights. In 2008, we granted SARs to various employees. These cash-settled awards have been accounted for as liabilities in our consolidated financial statements. Each SAR represents a right to receive a cash payment equal to the positive difference, if any, between the grant price and the market value of a share of our common stock on the date of exercise. The SARs vested in equal annual installments over three years. At November 30, 2015, 2014 and 2013, we had 29,939 SARs outstanding, which are fully vested and will expire in July 2017.
Director Awards. We have granted Director Plan SARs and stock units to our non-employee directors pursuant to the terms of the Director Plan and elections made by each director. All of these stock-settled awards were fully vested as of November 30, 2015. Director Plan SARs have terms of up to 15 years and may be exercised when the director leaves the board or sooner if stock ownership requirements have been met, while each stock unit may be settled for one share of common stock only when the director leaves the board. All Director Plan SARs were granted at an exercise price equal to the closing price of our common stock on the date of grant. As of November 30, 2015, 2014 and 2013, our non-employee directors had 452,983, 452,983 and 388,884, respectively, of outstanding Director Plan SARs and 419,962, 358,404 and 322,379, respectively, of outstanding stock units. In addition, we granted common stock to our non-employee directors pursuant to the Director Plan and elections made by each director. Such common stock was issued to the applicable recipients on the date of grant and is unrestricted.
Grantor Stock Ownership Trust. We have a grantor stock ownership trust (“Trust”), administered by a third-party trustee, that holds and distributes the shares of common stock acquired to support certain employee compensation and employee benefit obligations under our existing stock option plan, the 401(k) Plan and other employee benefit plans. The existence of the Trust has no impact on the amount of benefits or compensation that is paid under these plans.
For financial reporting purposes, the Trust is consolidated with us, and therefore any dividend transactions between us and the Trust are eliminated. Acquired shares held by the Trust remain valued at the market price on the date of purchase and are shown as a reduction to stockholders’ equity in the consolidated balance sheets. The difference between the Trust share value and the market value on the date shares are released from the Trust is included in paid-in capital. Common stock held in the Trust is not considered outstanding in the computations of earnings per share. The Trust held 10,135,461 and 10,335,461 shares of common stock at November 30, 2015 and 2014, respectively. The trustee votes shares held by the Trust in accordance with voting directions from eligible employees, as specified in a trust agreement with the trustee.
| |
| Note 20. | Postretirement Benefits |
We have a supplemental non-qualified, unfunded retirement plan, the KB Home Retirement Plan (“Retirement Plan”), effective as of July 11, 2002, pursuant to which we have offered to pay supplemental pension benefits to certain designated individuals (consisting of current and former employees) in connection with their retirement. The planRetirement Plan was closed to new participants in 2004. We also have an unfunded death benefit plan, the KB Home Death Benefit Only Plan (“DBO Plan”), implemented on November 1, 2001, for certain designated individuals (consisting of current and former employees). The DBO Plan was closed to new participants in 2006.
In connection with the plan,these plans, we have purchased cost recovery life insurance contracts on the lives of the designated individuals. The insurance contracts associated with the planplans are held by a trust, established as part of the plan to implement and carry out the provisions of the plan and to finance the benefits offered under the plan.trust. The trust is the owner and beneficiary of such insurance contracts. The amount of the insurance coverage under the contracts is designed to provide sufficient funds to cover all costs of the planplans if assumptions made as to employment term, mortality experience, policy earnings and other factors, as applicable, are realized. The cash surrender value of thesethe Retirement Plan life insurance contracts was $42.445.7 million at November 30, 20122015 and $41.748.1 million at November 30, 20112014. We recognized an investment loss on the cash surrender value of the Retirement Plan life insurance contracts of $1.3 million in 2015, and investment gains of $1.8 million in 2014 and $3.1 million in 2013. In 20122015, 2014, and 2011,2013, we paid $.51.4 million, $1.2 million and $.11.1 million, respectively, in benefits under the planRetirement Plan to eligible former employees.
We also have an unfunded death benefit plan, the KB Home Death Benefit Only Plan, implemented on November 1, 2001, for certain designated individuals (consisting of current and former employees). The plan was closed to new participants in 2004. In connection with the plan, we have purchased cost recovery life insurance contracts on the lives of the designated individuals. The insurance contracts associated with the plan are held by a trust, established as part of the plan to implement and carry out the provisions of the plan and to finance the benefits offered under the plan. The trust is the owner and beneficiary of such insurance contracts. The amount of the insurance coverage under the contracts is designed to provide sufficient funds to cover all costs of the plan if assumptions made as to employment term, mortality experience, policy earnings and other factors are realized. The cash surrender value of thesethe DBO Plan life insurance contracts was $14.8$16.8 million at November 30, 20122015 and $13.7$17.1 million at November 30, 2011.2014. We recognized an investment loss on the cash surrender value of the DBO Plan life insurance contracts of $.3 million in 2015, and investment gains of $.7 million in 2014 and $1.4 million in 2013. We have not paid out any benefits under the plan.DBO Plan.
The net periodic benefit cost of our postretirement benefit plans forRetirement Plan and DBO Plan consisted of the year ended November 30, 2012 was $6.6 million, which included service costs of $1.3 million, interest costs of $2.3 million, amortization of unrecognized loss of $1.4 million and amortization of prior service costs of $1.6 million. The net periodic benefit cost of these plans for the year ended November 30, 2011 was $5.5 million, which included service costs of $1.2 million, interest costs of $2.3 million, amortization of unrecognized loss of $.6 million, and amortization of prior service costs of $1.5 million, partly offset by other income of $.1 million. For the year ended November 30, 2010, the net periodic benefit cost of these plans was $5.5 million, which included service costs of $1.2 million, interest costs of $2.2 million, amortization of unrecognized loss of $.3 million, amortization of prior service costs of $1.6 million and other costs of $.2 million. following (in thousands):
|
| | | | | | | | | | | | |
| | | Years Ended November 30, |
| | | 2015 | | 2014 | | 2013 |
| Interest cost | | $ | 2,270 |
| | $ | 2,456 |
| | $ | 2,078 |
|
| Amortization of prior service cost | | 1,556 |
| | 1,556 |
| | 1,556 |
|
| Service cost | | 1,142 |
| | 1,184 |
| | 1,504 |
|
| Amortization of net actuarial loss | | 848 |
| | 357 |
| | 1,803 |
|
| Total | | $ | 5,816 |
| | $ | 5,553 |
| | $ | 6,941 |
|
The liabilities related to these plans were $60.9$60.8 million at November 30, 20122015 and $53.1$62.6 million at November 30, 2011,2014, and are included in accrued expenses and other liabilities in the consolidated balance sheets. For the years ended November 30,2012 2015 and 2011,2014, the discount rates we used for the plans were 3.3%3.6% and 4.4%3.5%, respectively.
Benefit payments under our postretirement benefit plansRetirement Plan and DBO Plan are expected to be paid during each year ended November 30 as follows: 2013 — $1.2 million; 2014 — $1.4 million; 2015 — $1.8 million; 2016 — $2.4 million;$1.7 million; 2017 — $2.7 million;$1.8 million; 2018 — $2.7 million; 2019 — $3.2 million; 2020 — $3.4 million; and for the five years ended November 30, 20222025 — $17.819.2 million in the aggregate.
| |
Note 19. | Supplemental Disclosure to Consolidated Statements of Cash Flows |
The following are supplemental disclosures to the consolidated statements of cash flows (in thousands):
|
| | | | | | | | | | | |
| | Year Ended November 30, |
| | 2012 | | 2011 | | 2010 |
| Summary of cash and cash equivalents at the end of the year: | | | | | |
| Homebuilding | $ | 524,765 |
| | $ | 415,050 |
| | $ | 904,401 |
|
| Financial services | 923 |
| | 3,024 |
| | 4,029 |
|
| Total | $ | 525,688 |
| | $ | 418,074 |
| | $ | 908,430 |
|
| Supplemental disclosure of cash flow information: | | | | | |
| Interest paid, net of amounts capitalized | $ | 65,541 |
| | $ | 48,038 |
| | $ | 71,647 |
|
| Income taxes paid | 826 |
| | 335 |
| | 807 |
|
| Income taxes refunded | 22,342 |
| | 213 |
| | 196,868 |
|
| Supplemental disclosure of noncash activities: | | | | | |
| Increase in inventories in connection with consolidation of joint ventures | $ | — |
| | $ | — |
| | $ | 72,300 |
|
| Increase in accounts payable, accrued expenses and other liabilities in connection with consolidation of joint ventures | — |
| | — |
| | 38,861 |
|
| Stock appreciation rights exchanged for stock options | — |
| | — |
| | 2,348 |
|
| Cost of inventories acquired through seller financing | 53,625 |
| | — |
| | 55,244 |
|
| Increase (decrease) in consolidated inventories not owned | (19,803 | ) | | 8,354 |
| | (41,626 | ) |
| Acquired property securing note receivable | — |
| | 40,000 |
| | — |
|
| |
Note 20. | Quarterly Results (unaudited) |
The following tables present our consolidated quarterly results for the years ended November 30, 2012 and 2011 (in thousands, except per share amounts):
|
| | | | | | | | | | | | | | | |
| | First | | Second | | Third | | Fourth |
| 2012 | | | | | | | |
| Revenues | $ | 254,558 |
| | $ | 302,852 |
| | $ | 424,504 |
| | $ | 578,201 |
|
| Gross profits | 26,365 |
| | 52,490 |
| | 75,887 |
| | 84,853 |
|
| Pretax income (loss) | (45,402 | ) | | (28,636 | ) | | (7,439 | ) | | 2,424 |
|
| Net income (loss) | (45,802 | ) | | (24,136 | ) | | 3,261 |
| | 7,724 |
|
| Basic and diluted earnings (loss) per share | $ | (.59 | ) | | $ | (.31 | ) | | $ | .04 |
| | $ | .10 |
|
| 2011 | | | | | | | |
| Revenues | $ | 196,940 |
| | $ | 271,738 |
| | $ | 367,316 |
| | $ | 479,872 |
|
| Gross profits | 25,279 |
| | 20,570 |
| | 63,579 |
| | 72,941 |
|
| Pretax income (loss) | (114,126 | ) | | (68,804 | ) | | (9,649 | ) | | 11,411 |
|
| Net income (loss) | (114,526 | ) | | (68,504 | ) | | (9,649 | ) | | 13,911 |
|
| Basic and diluted earnings (loss) per share | $ | (1.49 | ) | | $ | (.89 | ) | | $ | (.13 | ) | | $ | .18 |
|
Gross profits in the first, second, third and fourth quarters of 2012 included inventory impairment charges of $6.6 million, $9.9 million, $6.4 million and $5.2 million, respectively, and no land option contract abandonment charges in the first, second and third quarters and $.4 million in the fourth quarter. Gross profits in the second and third quarters of 2012 also included insurance recoveries of $10.0 million and $16.5 million, respectively.
Gross profits in the first, second, third and fourth quarters of 2011 included inventory impairment charges of $1.0 million, $20.1 million, $.3 million and $1.3 million, respectively, and land option contract abandonment charges of $.8 million, $.5 million,
$.8 million and $1.0 million, respectively.
The pretax loss in the first and second quarters of 2011 included a loss on loan guaranty of $22.8 million and $14.6 million, respectively. The pretax income in the fourth quarter of 2011 included a gain on loan guaranty of $6.6 million. The pretax loss in the first quarter of 2011 also included a joint venture impairment charge of $53.7 million.
Quarterly and year-to-date computations of per share amounts are made independently. Therefore, the sum of per share amounts for the quarters may not agree with per share amounts for the year.
| |
| Note 21. | Supplemental Guarantor InformationDisclosure to Consolidated Statements of Cash Flows |
Our obligations to pay principal, premium, if any, and interest under our senior notesThe following are guaranteed on a joint and several basis by the Guarantor Subsidiaries. The guarantees are full and unconditional and the Guarantor Subsidiaries are 100% owned by us. Pursuantsupplemental disclosures to the terms of the indenture governing our senior notes, if any of the Guarantor Subsidiaries ceases to be a “significant subsidiary” as defined by Rule 1-02 of Regulation S-X (as in effect on June 1, 1996), it will be automatically and unconditionally released and discharged from its guarantee of our senior notes so long as all guarantees by such Guarantor Subsidiary of any other of our or our subsidiaries’ indebtedness are terminated at or prior to the time of such release. As of November 30, 2012, we determined that five of our subsidiaries ceased to be “significant subsidiaries,” and, pursuant to the terms of the senior note indenture, they were automatically and unconditionally released and discharged from their respective guarantees of our senior notes. We also determined that a wholly owned subsidiary that previously was not a Guarantor Subsidiary was a “significant subsidiary,” and, pursuant to the terms of the senior note indenture, we caused that subsidiary to become a Guarantor Subsidiary. We have determined that separate, full financialconsolidated statements of the Guarantor Subsidiaries would not be material to investors and, accordingly, supplemental financial information for the Guarantor Subsidiaries is presented below.
The supplemental financial information for the periods presented below reflects the relevant subsidiaries that were Guarantor Subsidiaries as of and for the respective periods then ended. Accordingly, information for any period presented does not reflect subsequent changes, if any, in the subsidiaries considered to be Guarantor Subsidiaries.
CONDENSED CONSOLIDATING STATEMENTS OF OPERATIONS
(In Thousands)
cash flows (in thousands):
|
| | | | | | | | | | | | | | | | | | | |
| | Year Ended November 30, 2012 |
| | KB Home Corporate | | Guarantor Subsidiaries | | Non-Guarantor Subsidiaries | | Consolidating Adjustments | | Total |
| Revenues | $ | — |
| | $ | 978,064 |
| | $ | 582,051 |
| | $ | — |
| | $ | 1,560,115 |
|
| Homebuilding: | | | | | | | | | |
| Revenues | $ | — |
| | $ | 978,064 |
| | $ | 570,368 |
| | $ | — |
| | $ | 1,548,432 |
|
| Construction and land costs | — |
| | (844,982 | ) | | (472,547 | ) | | — |
| | (1,317,529 | ) |
| Selling, general and administrative expenses | (60,101 | ) | | (119,431 | ) | | (71,627 | ) | | — |
| | (251,159 | ) |
| Operating income (loss) | (60,101 | ) | | 13,651 |
| | 26,194 |
| | — |
| | (20,256 | ) |
| Interest income | 480 |
| | — |
| | 38 |
| | — |
| | 518 |
|
| Interest expense | 49,686 |
| | (78,879 | ) | | (40,611 | ) | | — |
| | (69,804 | ) |
| Equity in income (loss) of unconsolidated joint ventures | — |
| | (983 | ) | | 589 |
| | — |
| | (394 | ) |
| Homebuilding pretax loss | (9,935 | ) | | (66,211 | ) | | (13,790 | ) | | — |
| | (89,936 | ) |
| Financial services pretax income | — |
| | — |
| | 10,883 |
| | — |
| | 10,883 |
|
| Total pretax loss | (9,935 | ) | | (66,211 | ) | | (2,907 | ) | | — |
| | (79,053 | ) |
| Income tax benefit | 2,500 |
| | 16,900 |
| | 700 |
| | — |
| | 20,100 |
|
| Equity in net loss of subsidiaries | (51,518 | ) | | — |
| | — |
| | 51,518 |
| | — |
|
| Net loss | $ | (58,953 | ) | | $ | (49,311 | ) | | $ | (2,207 | ) | | $ | 51,518 |
| | $ | (58,953 | ) |
|
| | | | | | | | | | | |
| | Years Ended November 30, |
| | 2015 | | 2014 | | 2013 |
| Summary of cash and cash equivalents at the end of the year: | | | | | |
| Homebuilding | $ | 559,042 |
| | $ | 356,366 |
| | $ | 530,095 |
|
| Financial services | 1,299 |
| | 2,402 |
| | 2,428 |
|
| Total | $ | 560,341 |
| | $ | 358,768 |
| | $ | 532,523 |
|
| Supplemental disclosure of cash flow information: | | | | | |
| Interest paid, net of amounts capitalized | $ | 22,486 |
| | $ | 13,037 |
| | $ | 64,520 |
|
| Income taxes paid | 3,612 |
| | 1,619 |
| | 800 |
|
| Income taxes refunded | 11 |
| | 1,728 |
| | 61 |
|
| Supplemental disclosure of noncash activities: | | | | | |
| Reclassification of warranty recoveries to receivables | $ | 7,238 |
| | $ | 18,110 |
| | $ | — |
|
| Increase (decrease) in consolidated inventories not owned | 106,807 |
| | (5,755 | ) | | 4,798 |
|
| Increase in inventories due to distributions of land and land development from an unconsolidated joint venture | 12,705 |
| | 90,115 |
| | — |
|
| Inventories and inventory-related obligations associated with TIFE assessments tied to distribution of land from an unconsolidated joint venture | — |
| | 33,197 |
| | — |
|
| Inventories acquired through seller financing | 20,291 |
| | 61,553 |
| | 27,600 |
|
| Conversion of liability awards to equity awards | — |
| | 6,455 |
| | 8,346 |
|
|
| | | | | | | | | | | | | | | | | | | |
| | Year Ended November 30, 2011 |
| | KB Home Corporate | | Guarantor Subsidiaries | | Non-Guarantor Subsidiaries | | Consolidating Adjustments | | Total |
| Revenues | $ | — |
| | $ | 745,965 |
| | $ | 569,901 |
| | $ | — |
| | $ | 1,315,866 |
|
| Homebuilding: | | | | | | | | | |
| Revenues | $ | — |
| | $ | 745,965 |
| | $ | 559,597 |
| | $ | — |
| | $ | 1,305,562 |
|
| Construction and land costs | — |
| | (638,802 | ) | | (491,183 | ) | | — |
| | (1,129,985 | ) |
| Selling, general and administrative expenses | (52,784 | ) | | (93,288 | ) | | (101,814 | ) | | — |
| | (247,886 | ) |
| Loss on loan guaranty | — |
| | (30,765 | ) | | — |
| | — |
| | (30,765 | ) |
| Operating loss | (52,784 | ) | | (16,890 | ) | | (33,400 | ) | | — |
| | (103,074 | ) |
| Interest income | 715 |
| | 36 |
| | 120 |
| | — |
| | 871 |
|
| Interest expense | 51,957 |
| | (69,309 | ) | | (31,852 | ) | | — |
| | (49,204 | ) |
| Equity in loss of unconsolidated joint ventures | — |
| | (55,831 | ) | | (8 | ) | | — |
| | (55,839 | ) |
| Homebuilding pretax loss | (112 | ) | | (141,994 | ) | | (65,140 | ) | | — |
| | (207,246 | ) |
| Financial services pretax income | — |
| | — |
| | 26,078 |
| | — |
| | 26,078 |
|
| Total pretax loss | (112 | ) | | (141,994 | ) | | (39,062 | ) | | — |
| | (181,168 | ) |
| Income tax benefit | — |
| | 1,900 |
| | 500 |
| | — |
| | 2,400 |
|
| Equity in net loss of subsidiaries | (178,656 | ) | | — |
| | — |
| | 178,656 |
| | — |
|
| Net loss | $ | (178,768 | ) | | $ | (140,094 | ) | | $ | (38,562 | ) | | $ | 178,656 |
| | $ | (178,768 | ) |
|
| | | | | | | | | | | | | | | | | | | |
| | Year Ended November 30, 2010 |
| | KB Home Corporate | | Guarantor Subsidiaries | | Non-Guarantor Subsidiaries | | Consolidating Adjustments | | Total |
| Revenues | $ | — |
| | $ | 429,917 |
| | $ | 1,160,079 |
| | $ | — |
| | $ | 1,589,996 |
|
| Homebuilding: | | | | | | | | | |
| Revenues | $ | — |
| | $ | 429,917 |
| | $ | 1,151,846 |
| | $ | — |
| | $ | 1,581,763 |
|
| Construction and land costs | — |
| | (360,450 | ) | | (947,838 | ) | | — |
| | (1,308,288 | ) |
| Selling, general and administrative expenses | (68,149 | ) | | (48,233 | ) | | (173,138 | ) | | — |
| | (289,520 | ) |
| Operating income (loss) | (68,149 | ) | | 21,234 |
| | 30,870 |
| | — |
| | (16,045 | ) |
| Interest income | 1,770 |
| | 30 |
| | 298 |
| | — |
| | 2,098 |
|
| Interest expense | 20,353 |
| | (41,686 | ) | | (46,974 | ) | | — |
| | (68,307 | ) |
| Equity in loss of unconsolidated joint ventures | — |
| | (186 | ) | | (6,071 | ) | | — |
| | (6,257 | ) |
| Homebuilding pretax loss | (46,026 | ) | | (20,608 | ) | | (21,877 | ) | | — |
| | (88,511 | ) |
| Financial services pretax income | — |
| | — |
| | 12,143 |
| | — |
| | 12,143 |
|
| Total pretax loss | (46,026 | ) | | (20,608 | ) | | (9,734 | ) | | — |
| | (76,368 | ) |
| Income tax benefit | 4,200 |
| | 1,900 |
| | 900 |
| | — |
| | 7,000 |
|
| Equity in net loss of subsidiaries | (27,542 | ) | | — |
| | — |
| | 27,542 |
| | — |
|
| Net loss | $ | (69,368 | ) | | $ | (18,708 | ) | | $ | (8,834 | ) | | $ | 27,542 |
| | $ | (69,368 | ) |
CONDENSED CONSOLIDATING BALANCE SHEETS
(In Thousands)
|
| | | | | | | | | | | | | | | | | | | |
| | November 30, 2012 |
| | KB Home Corporate | | Guarantor Subsidiaries | | Non-Guarantor Subsidiaries | | Consolidating Adjustments | | Total |
| Assets | | | | | | | | | |
| Homebuilding: | | | | | | | | | |
| Cash and cash equivalents | $ | 457,007 |
| | $ | 22,642 |
| | $ | 45,116 |
| | $ | — |
| | $ | 524,765 |
|
| Restricted cash | 42,362 |
| | — |
| | — |
| | — |
| | 42,362 |
|
| Receivables | 121 |
| | 49,518 |
| | 15,182 |
| | — |
| | 64,821 |
|
| Inventories | — |
| | 1,075,011 |
| | 631,560 |
| | — |
| | 1,706,571 |
|
| Investments in unconsolidated joint ventures | — |
| | 109,346 |
| | 14,328 |
| | — |
| | 123,674 |
|
| Other assets | 85,901 |
| | 7,491 |
| | 1,658 |
| | — |
| | 95,050 |
|
| | 585,391 |
| | 1,264,008 |
| | 707,844 |
| | — |
| | 2,557,243 |
|
| Financial services | — |
| | — |
| | 4,455 |
| | — |
| | 4,455 |
|
| Investments in subsidiaries | 11,411 |
| | — |
| | — |
| | (11,411 | ) | | — |
|
| Total assets | $ | 596,802 |
| | $ | 1,264,008 |
| | $ | 712,299 |
| | $ | (11,411 | ) | | $ | 2,561,698 |
|
| Liabilities and stockholders’ equity | | | | | | | | | |
| Homebuilding: | | | | | | | | | |
| Accounts payable, accrued expenses and other liabilities | $ | 134,314 |
| | $ | 147,563 |
| | $ | 177,012 |
| | $ | — |
| | $ | 458,889 |
|
| Mortgages and notes payable | 1,645,394 |
| | 69,596 |
| | 7,825 |
| | — |
| | 1,722,815 |
|
| | 1,779,708 |
| | 217,159 |
| | 184,837 |
| | — |
| | 2,181,704 |
|
| Financial services | — |
| | — |
| | 3,188 |
| | — |
| | 3,188 |
|
| Intercompany | (1,559,712 | ) | | 1,046,849 |
| | 512,863 |
| | — |
| | — |
|
| Stockholders’ equity | 376,806 |
| | — |
| | 11,411 |
| | (11,411 | ) | | 376,806 |
|
| Total liabilities and stockholders’ equity | $ | 596,802 |
| | $ | 1,264,008 |
| | $ | 712,299 |
| | $ | (11,411 | ) | | $ | 2,561,698 |
|
|
| | | | | | | | | | | | | | | | | | | |
| | November 30, 2011 |
| | KB Home Corporate | | Guarantor Subsidiaries | | Non-Guarantor Subsidiaries | | Consolidating Adjustments | | Total |
| Assets | | | | | | | | | |
| Homebuilding: | | | | | | | | | |
| Cash and cash equivalents | $ | 340,957 |
| | $ | 32,876 |
| | $ | 41,217 |
| | $ | — |
| | $ | 415,050 |
|
| Restricted cash | 64,475 |
| | 6 |
| | — |
| | — |
| | 64,481 |
|
| Receivables | 801 |
| | 29,250 |
| | 36,128 |
| | — |
| | 66,179 |
|
| Inventories | — |
| | 1,256,468 |
| | 475,161 |
| | — |
| | 1,731,629 |
|
| Investments in unconsolidated joint ventures | — |
| | 113,921 |
| | 14,005 |
| | — |
| | 127,926 |
|
| Other assets | 67,059 |
| | 730 |
| | 7,315 |
| | — |
| | 75,104 |
|
| | 473,292 |
| | 1,433,251 |
| | 573,826 |
| | — |
| | 2,480,369 |
|
| Financial services | — |
| | — |
| | 32,173 |
| | — |
| | 32,173 |
|
| Investments in subsidiaries | 34,235 |
| | — |
| | — |
| | (34,235 | ) | | — |
|
| Total assets | $ | 507,527 |
| | $ | 1,433,251 |
| | $ | 605,999 |
| | $ | (34,235 | ) | | $ | 2,512,542 |
|
| Liabilities and stockholders’ equity | | | | | | | | | |
| Homebuilding: | | | | | | | | | |
| Accounts payable, accrued expenses and other liabilities | $ | 121,572 |
| | $ | 181,835 |
| | $ | 175,413 |
| | $ | — |
| | $ | 478,820 |
|
| Mortgages and notes payable | 1,533,477 |
| | 45,925 |
| | 4,169 |
| | — |
| | 1,583,571 |
|
| | 1,655,049 |
| | 227,760 |
| | 179,582 |
| | — |
| | 2,062,391 |
|
| Financial services | — |
| | — |
| | 7,494 |
| | — |
| | 7,494 |
|
| Intercompany | (1,590,179 | ) | | 1,205,491 |
| | 384,688 |
| | — |
| | — |
|
| Stockholders’ equity | 442,657 |
| | — |
| | 34,235 |
| | (34,235 | ) | | 442,657 |
|
| Total liabilities and stockholders’ equity | $ | 507,527 |
| | $ | 1,433,251 |
| | $ | 605,999 |
| | $ | (34,235 | ) | | $ | 2,512,542 |
|
CONDENSED CONSOLIDATING STATEMENTS OF CASH FLOWS
(In Thousands)
|
| | | | | | | | | | | | | | | | | | | |
| | Year Ended November 30, 2012 |
| | KB Home Corporate | | Guarantor Subsidiaries | | Non-Guarantor Subsidiaries | | Consolidating Adjustments | | Total |
| Cash flows from operating activities: | | | | | | | | | |
| Net loss | $ | (58,953 | ) | | $ | (49,311 | ) | | $ | (2,207 | ) | | $ | 51,518 |
| | $ | (58,953 | ) |
| Adjustments to reconcile net loss to net cash provided by (used in) operating activities: | | | | | | | | | |
| Equity in (income) loss of unconsolidated joint ventures | — |
| | 983 |
| | (2,780 | ) | | — |
| | (1,797 | ) |
| Inventory impairments and land option contract abandonments | — |
| | 10,417 |
| | 18,116 |
| | — |
| | 28,533 |
|
| Changes in assets and liabilities: | | | | | | | | |
|
| Receivables | 680 |
| | (7,716 | ) | | 32,030 |
| | — |
| | 24,994 |
|
| Inventories | — |
| | (59,875 | ) | | 90,222 |
| | — |
| | 30,347 |
|
| Accounts payable, accrued expenses and other liabilities | 11,281 |
| | 20,858 |
| | (34,282 | ) | | — |
| | (2,143 | ) |
| Other, net | 6,507 |
| | 660 |
| | 6,469 |
| | — |
| | 13,636 |
|
| Net cash provided by (used in) operating activities | (40,485 | ) | | (83,984 | ) | | 107,568 |
| | 51,518 |
| | 34,617 |
|
| Cash flows from investing activities: | | | | | | | | | |
| Return of investments in (contributions to) unconsolidated joint ventures | — |
| | 1,656 |
| | (667 | ) | | — |
| | 989 |
|
| Purchases of property and equipment, net | (175 | ) | | (855 | ) | | (719 | ) | | — |
| | (1,749 | ) |
| Net cash provided by (used in) investing activities | (175 | ) | | 801 |
| | (1,386 | ) | | — |
| | (760 | ) |
| Cash flows from financing activities: | | | | | | | | | |
| Change in restricted cash | 22,119 |
| | — |
| | — |
| | — |
| | 22,119 |
|
| Proceeds from issuance of senior notes | 694,831 |
| | — |
| | — |
| | — |
| | 694,831 |
|
| Payment of senior notes issuance costs | (12,445 | ) | | — |
| | — |
| | — |
| | (12,445 | ) |
| Repayment of senior notes | (592,645 | ) | | — |
| | — |
| | — |
| | (592,645 | ) |
| Payments on mortgages and land contracts due to land sellers and other loans | — |
| | (26,298 | ) | | — |
| | — |
| | (26,298 | ) |
| Issuance of common stock under employee stock plans | 593 |
| | — |
| | — |
| | — |
| | 593 |
|
| Payments of cash dividends | (10,599 | ) | | — |
| | — |
| | — |
| | (10,599 | ) |
| Stock repurchases | (1,799 | ) | | — |
| | — |
| | — |
| | (1,799 | ) |
| Intercompany | 56,655 |
| | 103,275 |
| | (108,412 | ) | | (51,518 | ) | | — |
|
| Net cash provided by (used in) financing activities | 156,710 |
| | 76,977 |
| | (108,412 | ) | | (51,518 | ) | | 73,757 |
|
| Net increase (decrease) in cash and cash equivalents | 116,050 |
| | (6,206 | ) | | (2,230 | ) | | — |
| | 107,614 |
|
| Cash and cash equivalents at beginning of year | 340,957 |
| | 28,848 |
| | 48,269 |
| | — |
| | 418,074 |
|
| Cash and cash equivalents at end of year | $ | 457,007 |
| | $ | 22,642 |
| | $ | 46,039 |
| | $ | — |
| | $ | 525,688 |
|
|
| | | | | | | | | | | | | | | | | | | |
| | Year Ended November 30, 2011 |
| | KB Home Corporate | | Guarantor Subsidiaries | | Non-Guarantor Subsidiaries | | Consolidating Adjustments | | Total |
| Cash flows from operating activities: | | | | | | | | | |
| Net loss | $ | (178,768 | ) | | $ | (140,094 | ) | | $ | (38,562 | ) | | $ | 178,656 |
| | $ | (178,768 | ) |
| Adjustments to reconcile net loss to net cash used in operating activities: | | | | | | | | | |
| Equity in (income) loss/(gain) on wind down of unconsolidated joint ventures | — |
| | 55,831 |
| | (19,278 | ) | | — |
| | 36,553 |
|
| Loss on loan guaranty | — |
| | 30,765 |
| | — |
| | — |
| | 30,765 |
|
| Gain on sale of operating property | — |
| | (8,825 | ) | | — |
| | — |
| | (8,825 | ) |
| Inventory impairments and land option contract abandonments | — |
| | 21,511 |
| | 4,280 |
| | — |
| | 25,791 |
|
| Changes in assets and liabilities: | | | | | | | | |
|
| Receivables | 3,404 |
| | (9,726 | ) | | 4,102 |
| | — |
| | (2,220 | ) |
| Inventories | — |
| | (40,973 | ) | | 28,628 |
| | — |
| | (12,345 | ) |
| Accounts payable, accrued expenses and other liabilities | (3,035 | ) | | (247,292 | ) | | (3,220 | ) | | — |
| | (253,547 | ) |
| Other, net | 9,186 |
| | 4,277 |
| | 1,588 |
| | — |
| | 15,051 |
|
| Net cash used in operating activities | (169,213 | ) | | (334,526 | ) | | (22,462 | ) | | 178,656 |
| | (347,545 | ) |
| Cash flows from investing activities: | | | | | | | | | |
| Return of investments in (contributions to) unconsolidated joint ventures | — |
| | (77,090 | ) | | 9,830 |
| | — |
| | (67,260 | ) |
| Proceeds from sale of operating property | — |
| | 80,600 |
| | — |
| | — |
| | 80,600 |
|
| Sales (purchases) of property and equipment, net | (200 | ) | | (202 | ) | | 160 |
| | — |
| | (242 | ) |
| Net cash provided by (used in) investing activities | (200 | ) | | 3,308 |
| | 9,990 |
| | — |
| | 13,098 |
|
| Cash flows from financing activities: | | | | | | | | | |
| Change in restricted cash | 24,239 |
| | 26,757 |
| | — |
| | — |
| | 50,996 |
|
| Repayment of senior notes | (100,000 | ) | | — |
| | — |
| | — |
| | (100,000 | ) |
| Payments on mortgages and land contracts due to land sellers and other loans | 3,397 |
| | (87,941 | ) | | (4,917 | ) | | — |
| | (89,461 | ) |
| Issuance of common stock under employee stock plans | 1,796 |
| | — |
| | — |
| | — |
| | 1,796 |
|
| Payments of cash dividends | (19,240 | ) | | — |
| | — |
| | — |
| | (19,240 | ) |
| Intercompany | (170,425 | ) | | 411,309 |
| | (62,228 | ) | | (178,656 | ) | | — |
|
| Net cash provided by (used in) financing activities | (260,233 | ) | | 350,125 |
| | (67,145 | ) | | (178,656 | ) | | (155,909 | ) |
| Net increase (decrease) in cash and cash equivalents | (429,646 | ) | | 18,907 |
| | (79,617 | ) | | — |
| | (490,356 | ) |
| Cash and cash equivalents at beginning of year | 770,603 |
| | 13,969 |
| | 123,858 |
| | — |
| | 908,430 |
|
| Cash and cash equivalents at end of year | $ | 340,957 |
| | $ | 32,876 |
| | $ | 44,241 |
| | $ | — |
| | $ | 418,074 |
|
|
| | | | | | | | | | | | | | | | | | | |
| | Year Ended November 30, 2010 |
| | KB Home Corporate | | Guarantor Subsidiaries | | Non-Guarantor Subsidiaries | | Consolidating Adjustments | | Total |
| Cash flows from operating activities: | | | | | | | | | |
| Net loss | $ | (69,368 | ) | | $ | (18,708 | ) | | $ | (8,834 | ) | | $ | 27,542 |
| | $ | (69,368 | ) |
| Adjustments to reconcile net loss to net cash provided by (used in) operating activities: | | | | | | | | | |
| Equity in (income) loss of unconsolidated joint ventures | — |
| | 186 |
| | (958 | ) | | — |
| | (772 | ) |
| Inventory impairments and land option contract abandonments | — |
| | 1,980 |
| | 17,945 |
| | — |
| | 19,925 |
|
| Changes in assets and liabilities: | | | | | | | | |
|
| Receivables | 187,542 |
| | 3,557 |
| | 20,219 |
| | — |
| | 211,318 |
|
| Inventories | — |
| | (99,216 | ) | | (30,118 | ) | | — |
| | (129,334 | ) |
| Accounts payable, accrued expenses and other liabilities | (16,973 | ) | | (65,878 | ) | | (116,354 | ) | | — |
| | (199,205 | ) |
| Other, net | (8,461 | ) | | 1,608 |
| | 40,325 |
| | — |
| | 33,472 |
|
| Net cash provided by (used in) operating activities | 92,740 |
| | (176,471 | ) | | (77,775 | ) | | 27,542 |
| | (133,964 | ) |
| Cash flows from investing activities: | | | | | | | | | |
| Contributions to unconsolidated joint ventures | — |
| | (517 | ) | | (15,152 | ) | | — |
| | (15,669 | ) |
| Purchases of property and equipment, net | (229 | ) | | (70 | ) | | (121 | ) | | — |
| | (420 | ) |
| Net cash used in investing activities | (229 | ) | | (587 | ) | | (15,273 | ) | | — |
| | (16,089 | ) |
| Cash flows from financing activities: | | | | | | | | | |
| Change in restricted cash | 25,578 |
| | — |
| | (26,763 | ) | | — |
| | (1,185 | ) |
| Payments on mortgages and land contracts due to land sellers and other loans | — |
| | (81,041 | ) | | (20,113 | ) | | — |
| | (101,154 | ) |
| Issuance of common stock under employee stock plans | 1,851 |
| | — |
| | — |
| | — |
| | 1,851 |
|
| Excess tax benefit associated with exercise of stock options | 583 |
| | — |
| | — |
| | — |
| | 583 |
|
| Payments of cash dividends | (19,223 | ) | | — |
| | — |
| | — |
| | (19,223 | ) |
| Stock repurchases | (350 | ) | | — |
| | — |
| | — |
| | (350 | ) |
| Intercompany | (325,469 | ) | | 217,240 |
| | 135,771 |
| | (27,542 | ) | | — |
|
| Net cash provided by (used in) financing activities | (317,030 | ) | | 136,199 |
| | 88,895 |
| | (27,542 | ) | | (119,478 | ) |
| Net decrease in cash and cash equivalents | (224,519 | ) | | (40,859 | ) | | (4,153 | ) | | — |
| | (269,531 | ) |
| Cash and cash equivalents at beginning of year | 995,122 |
| | 44,478 |
| | 138,361 |
| | — |
| | 1,177,961 |
|
| Cash and cash equivalents at end of year | $ | 770,603 |
| | $ | 3,619 |
| | $ | 134,208 |
| | $ | — |
| | $ | 908,430 |
|
REPORT OF INDEPENDENT REGISTERED PUBLIC ACCOUNTING FIRM
The Board of Directors and Stockholders of KB Home:
We have audited the accompanying consolidated balance sheets of KB Home as of November 30, 2012 and 2011, and the related consolidated statements of operations, stockholders’ equity, and cash flows for each of the three years in the period ended November 30, 2012. These financial statements are the responsibility of the Company’s management. Our responsibility is to express an opinion on these financial statements based on our audits.
We conducted our audits in accordance with the standards of the Public Company Accounting Oversight Board (United States). Those standards require that we plan and perform the audit to obtain reasonable assurance about whether the financial statements are free of material misstatement. An audit includes examining, on a test basis, evidence supporting the amounts and disclosures in the financial statements. An audit also includes assessing the accounting principles used and significant estimates made by management, as well as evaluating the overall financial statement presentation. We believe that our audits provide a reasonable basis for our opinion.
In our opinion, the financial statements referred to above present fairly, in all material respects, the consolidated financial position of KB Home at November 30, 2012 and 2011, and the consolidated results of its operations and its cash flows for each of the three years in the period ended November 30, 2012, in conformity with U.S. generally accepted accounting principles.
We also have audited, in accordance with the standards of the Public Company Accounting Oversight Board (United States), KB Home’s internal control over financial reporting as of November 30, 2012, based on criteria established in Internal Control — Integrated Framework issued by the Committee of Sponsoring Organizations of the Treadway Commission and our report dated January 18, 2013 expressed an unqualified opinion thereon.
Los Angeles, California
January 18, 2013
| |
| Note 22. | Supplemental Guarantor Information |
Our obligations to pay principal, premium, if any, and interest on the senior notes and borrowings, if any, under the Credit Facility are guaranteed on a joint and several basis by certain of our subsidiaries (“Guarantor Subsidiaries”). The guarantees are full and unconditional and the Guarantor Subsidiaries are 100% owned by us. Pursuant to the terms of the indenture governing the senior notes and the terms of the Credit Facility, if any of the Guarantor Subsidiaries ceases to be a “significant subsidiary” as defined by Rule 1-02 of Regulation S-X (as in effect on June 1, 1996) using a 5% rather than a 10% threshold (provided that the assets of our non-guarantor subsidiaries do not in the aggregate exceed 10% of an adjusted measure of our consolidated total assets), it will be automatically and unconditionally released and discharged from its guaranty of the senior notes and the Credit Facility so long as all guarantees by such Guarantor Subsidiary of any other of our or our subsidiaries’ indebtedness are terminated
at or prior to the time of such release. We have determined that separate, full financial statements of the Guarantor Subsidiaries would not be material to investors and, accordingly, supplemental financial information for the Guarantor Subsidiaries is presented.
The supplemental financial information for all periods presented below reflects those subsidiaries that were Guarantor Subsidiaries as of November 30, 2015.
Condensed Consolidating Statements of Operations (in thousands)
|
| | | | | | | | | | | | | | | | | | | |
| | Year Ended November 30, 2015 |
| | KB Home Corporate | | Guarantor Subsidiaries | | Non-Guarantor Subsidiaries | | Consolidating Adjustments | | Total |
| Revenues | $ | — |
| | $ | 2,653,372 |
| | $ | 378,658 |
| | $ | — |
| | $ | 3,032,030 |
|
| Homebuilding: | | | | | | | | | |
| Revenues | $ | — |
| | $ | 2,653,372 |
| | $ | 367,615 |
| | $ | — |
| | $ | 3,020,987 |
|
| Construction and land costs | — |
| | (2,209,472 | ) | | (329,896 | ) | | — |
| | (2,539,368 | ) |
| Selling, general and administrative expenses | (86,053 | ) | | (213,292 | ) | | (43,653 | ) | | — |
| | (342,998 | ) |
| Operating income (loss) | (86,053 | ) | | 230,608 |
| | (5,934 | ) | | — |
| | 138,621 |
|
| Interest income | 451 |
| | 6 |
| | 1 |
| | — |
| | 458 |
|
| Interest expense | (180,701 | ) | | (6,184 | ) | | — |
| | 165,029 |
| | (21,856 | ) |
| Intercompany interest | 289,727 |
| | (109,208 | ) | | (15,490 | ) | | (165,029 | ) | | — |
|
| Equity in loss of unconsolidated joint ventures | — |
| | (1,803 | ) | | (1 | ) | | — |
| | (1,804 | ) |
| Homebuilding pretax income (loss) | 23,424 |
| | 113,419 |
| | (21,424 | ) | | — |
| | 115,419 |
|
| Financial services pretax income | — |
| | — |
| | 11,624 |
| | — |
| | 11,624 |
|
| Total pretax income (loss) | 23,424 |
| | 113,419 |
| | (9,800 | ) | | — |
| | 127,043 |
|
| Income tax benefit (expense) | 2,000 |
| | (42,700 | ) | | (1,700 | ) | | — |
| | (42,400 | ) |
| Equity in net income of subsidiaries | 59,219 |
| | — |
| | — |
| | (59,219 | ) | | — |
|
| Net income (loss) | $ | 84,643 |
| | $ | 70,719 |
| | $ | (11,500 | ) | | $ | (59,219 | ) | | $ | 84,643 |
|
|
| | | | | | | | | | | | | | | | | | | |
| | Year Ended November 30, 2014 |
| | KB Home Corporate | | Guarantor Subsidiaries | | Non-Guarantor Subsidiaries | | Consolidating Adjustments | | Total |
| Revenues | $ | — |
| | $ | 2,031,564 |
| | $ | 369,385 |
| | $ | — |
| | $ | 2,400,949 |
|
| Homebuilding: | | | | | | | | | |
| Revenues | $ | — |
| | $ | 2,031,564 |
| | $ | 358,079 |
| | $ | — |
| | $ | 2,389,643 |
|
| Construction and land costs | — |
| | (1,673,916 | ) | | (311,735 | ) | | — |
| | (1,985,651 | ) |
| Selling, general and administrative expenses | (68,717 | ) | | (176,795 | ) | | (42,511 | ) | | — |
| | (288,023 | ) |
| Operating income (loss) | (68,717 | ) | | 180,853 |
| | 3,833 |
| | — |
| | 115,969 |
|
| Interest income | 432 |
| | 9 |
| | 2 |
| | — |
| | 443 |
|
| Interest expense | (165,485 | ) | | (6,056 | ) | | — |
| | 140,791 |
| | (30,750 | ) |
| Intercompany interest | 287,017 |
| | (127,191 | ) | | (19,035 | ) | | (140,791 | ) | | — |
|
| Equity in income (loss) of unconsolidated joint ventures | — |
| | (2,549 | ) | | 3,290 |
| | — |
| | 741 |
|
| Homebuilding pretax income (loss) | 53,247 |
| | 45,066 |
| | (11,910 | ) | | — |
| | 86,403 |
|
| Financial services pretax income | — |
| | — |
| | 8,546 |
| | — |
| | 8,546 |
|
| Total pretax income (loss) | 53,247 |
| | 45,066 |
| | (3,364 | ) | | — |
| | 94,949 |
|
| Income tax benefit | 215,691 |
| | 551,203 |
| | 56,506 |
| | — |
| | 823,400 |
|
| Equity in net income of subsidiaries | 649,411 |
| | — |
| | — |
| | (649,411 | ) | | — |
|
| Net income | $ | 918,349 |
| | $ | 596,269 |
| | $ | 53,142 |
| | $ | (649,411 | ) | | $ | 918,349 |
|
|
| | | | | | | | | | | | | | | | | | | |
| | Year Ended November 30, 2013 |
| | KB Home Corporate | | Guarantor Subsidiaries | | Non-Guarantor Subsidiaries | | Consolidating Adjustments | | Total |
| Revenues | $ | — |
| | $ | 1,792,040 |
| | $ | 305,090 |
| | $ | — |
| | $ | 2,097,130 |
|
| Homebuilding: | | | | | | | | | |
| Revenues | $ | — |
| | $ | 1,792,040 |
| | $ | 292,938 |
| | $ | — |
| | $ | 2,084,978 |
|
| Construction and land costs | — |
| | (1,480,822 | ) | | (256,264 | ) | | — |
| | (1,737,086 | ) |
| Selling, general and administrative expenses | (60,545 | ) | | (151,923 | ) | | (43,340 | ) | | — |
| | (255,808 | ) |
| Operating income (loss) | (60,545 | ) | | 159,295 |
| | (6,666 | ) | | — |
| | 92,084 |
|
| Interest income | 768 |
| | 18 |
| | 6 |
| | — |
| | 792 |
|
| Interest expense | (143,902 | ) | | (5,199 | ) | | — |
| | 86,411 |
| | (62,690 | ) |
| Intercompany interest | 203,096 |
| | (102,172 | ) | | (14,513 | ) | | (86,411 | ) | | — |
|
| Equity in income (loss) of unconsolidated joint ventures | — |
| | (2,503 | ) | | 496 |
| | — |
| | (2,007 | ) |
| Homebuilding pretax income (loss) | (583 | ) | | 49,439 |
| | (20,677 | ) | | — |
| | 28,179 |
|
| Financial services pretax income | — |
| | — |
| | 10,184 |
| | — |
| | 10,184 |
|
| Total pretax income (loss) | (583 | ) | | 49,439 |
| | (10,493 | ) | | — |
| | 38,363 |
|
| Income tax benefit (expense) | 100 |
| | 1,800 |
| | (300 | ) | | — |
| | 1,600 |
|
| Equity in net income of subsidiaries | 40,446 |
| | — |
| | — |
| | (40,446 | ) | | — |
|
| Net income (loss) | $ | 39,963 |
| | $ | 51,239 |
| | $ | (10,793 | ) | | $ | (40,446 | ) | | $ | 39,963 |
|
Condensed Consolidating Statements of Comprehensive Income (Loss) (in thousands)
|
| | | | | | | | | | | | | | | | | | | |
| | Year Ended November 30, 2015 |
| | KB Home Corporate | | Guarantor Subsidiaries | | Non-Guarantor Subsidiaries | | Consolidating Adjustments | | Total |
| Net income (loss) | $ | 84,643 |
| | $ | 70,719 |
| | $ | (11,500 | ) | | $ | (59,219 | ) | | $ | 84,643 |
|
| Other comprehensive income: | | | | | | | | | |
| Postretirement benefit plan adjustments | 6,149 |
| | — |
| | — |
| | — |
| | 6,149 |
|
| Other comprehensive income before tax | 6,149 |
| | — |
| | — |
| | — |
| | 6,149 |
|
| Income tax expense related to items of other comprehensive income | (2,460 | ) | | — |
| | — |
| | — |
| | (2,460 | ) |
| Other comprehensive income, net of tax | 3,689 |
| | — |
| | — |
| | — |
| | 3,689 |
|
| Comprehensive income (loss) | $ | 88,332 |
| | $ | 70,719 |
| | $ | (11,500 | ) | | $ | (59,219 | ) | | $ | 88,332 |
|
|
| | | | | | | | | | | | | | | | | | | |
| | Year Ended November 30, 2014 |
| | KB Home Corporate | | Guarantor Subsidiaries | | Non-Guarantor Subsidiaries | | Consolidating Adjustments | | Total |
| Net income | $ | 918,349 |
| | $ | 596,269 |
| | $ | 53,142 |
| | $ | (649,411 | ) | | $ | 918,349 |
|
| Other comprehensive loss: | | | | | | | | | |
| Postretirement benefit plan adjustments | (1,888 | ) | | — |
| | — |
| | — |
| | (1,888 | ) |
| Other comprehensive loss before tax | (1,888 | ) | | — |
| | — |
| | — |
| | (1,888 | ) |
| Income tax expense related to items of other comprehensive income | (1,604 | ) | | — |
| | — |
| | — |
| | (1,604 | ) |
| Other comprehensive loss, net of tax | (3,492 | ) | | — |
| | — |
| | — |
| | (3,492 | ) |
| Comprehensive income | $ | 914,857 |
| | $ | 596,269 |
| | $ | 53,142 |
| | $ | (649,411 | ) | | $ | 914,857 |
|
|
| | | | | | | | | | | | | | | | | | | |
| | Year Ended November 30, 2013 |
| | KB Home Corporate | | Guarantor Subsidiaries | | Non-Guarantor Subsidiaries | | Consolidating Adjustments | | Total |
| Net income (loss) | $ | 39,963 |
| | $ | 51,239 |
| | $ | (10,793 | ) | | $ | (40,446 | ) | | $ | 39,963 |
|
| Other comprehensive income: | | | | | | | | | |
| Postretirement benefit plan adjustments | 10,442 |
| | — |
| | — |
| | — |
| | 10,442 |
|
| Other comprehensive income, net of tax | 10,442 |
| | — |
| | — |
| | — |
| | 10,442 |
|
| Comprehensive income (loss) | $ | 50,405 |
| | $ | 51,239 |
| | $ | (10,793 | ) | | $ | (40,446 | ) | | $ | 50,405 |
|
Condensed Consolidating Balance Sheets (in thousands)
|
| | | | | | | | | | | | | | | | | | | |
| | November 30, 2015 |
| | KB Home Corporate | | Guarantor Subsidiaries | | Non-Guarantor Subsidiaries | | Consolidating Adjustments | | Total |
| Assets | | | | | | | | | |
| Homebuilding: | | | | | | | | | |
| Cash and cash equivalents | $ | 444,850 |
| | $ | 98,281 |
| | $ | 15,911 |
| | $ | — |
| | $ | 559,042 |
|
| Restricted cash | 9,344 |
| | — |
| | — |
| | — |
| | 9,344 |
|
| Receivables | 39 |
| | 148,338 |
| | 4,305 |
| | — |
| | 152,682 |
|
| Inventories | — |
| | 2,979,617 |
| | 334,130 |
| | — |
| | 3,313,747 |
|
| Investments in unconsolidated joint ventures | — |
| | 69,057 |
| | 2,501 |
| | — |
| | 71,558 |
|
| Deferred tax assets, net | 190,770 |
| | 501,454 |
| | 89,972 |
| | — |
| | 782,196 |
|
| Other assets | 97,590 |
| | 11,783 |
| | 3,401 |
| | — |
| | 112,774 |
|
| | 742,593 |
| | 3,808,530 |
| | 450,220 |
| | — |
| | 5,001,343 |
|
| Financial services | — |
| | — |
| | 14,028 |
| | — |
| | 14,028 |
|
| Intercompany receivables | 3,627,150 |
| | — |
| | 102,103 |
| | (3,729,253 | ) | | — |
|
| Investments in subsidiaries | 39,383 |
| | — |
| | — |
| | (39,383 | ) | | — |
|
| Total assets | $ | 4,409,126 |
| | $ | 3,808,530 |
| | $ | 566,351 |
| | $ | (3,768,636 | ) | | $ | 5,015,371 |
|
| Liabilities and stockholders’ equity | | | | | | | | | |
| Homebuilding: | | | | | | | | | |
| Accounts payable, accrued expenses and other liabilities | $ | 136,352 |
| | $ | 442,529 |
| | $ | 118,303 |
| | $ | — |
| | $ | 697,184 |
|
| Notes payable | 2,564,762 |
| | 60,774 |
| | — |
| | — |
| | 2,625,536 |
|
| | 2,701,114 |
| | 503,303 |
| | 118,303 |
| | — |
| | 3,322,720 |
|
| Financial services | — |
| | — |
| | 1,817 |
| | — |
| | 1,817 |
|
| Intercompany payables | 17,178 |
| | 3,305,227 |
| | 406,848 |
| | (3,729,253 | ) | | — |
|
| Stockholders’ equity | 1,690,834 |
| | — |
| | 39,383 |
| | (39,383 | ) | | 1,690,834 |
|
| Total liabilities and stockholders’ equity | $ | 4,409,126 |
| | $ | 3,808,530 |
| | $ | 566,351 |
| | $ | (3,768,636 | ) | | $ | 5,015,371 |
|
|
| | | | | | | | | | | | | | | | | | | |
| | November 30, 2014 |
| | KB Home Corporate | | Guarantor Subsidiaries | | Non-Guarantor Subsidiaries | | Consolidating Adjustments | | Total |
| Assets | | | | | | | | | |
| Homebuilding: | | | | | | | | | |
| Cash and cash equivalents | $ | 303,280 |
| | $ | 37,112 |
| | $ | 15,974 |
| | $ | — |
| | $ | 356,366 |
|
| Restricted cash | 27,235 |
| | — |
| | — |
| | — |
| | 27,235 |
|
| Receivables | 15 |
| | 120,857 |
| | 4,616 |
| | — |
| | 125,488 |
|
| Inventories | — |
| | 2,847,415 |
| | 370,972 |
| | — |
| | 3,218,387 |
|
| Investments in unconsolidated joint ventures | — |
| | 76,940 |
| | 2,501 |
| | — |
| | 79,441 |
|
| Deferred tax assets, net | 215,923 |
| | 552,653 |
| | 56,656 |
| | — |
| | 825,232 |
|
| Other assets | 99,099 |
| | 13,136 |
| | 2,680 |
| | — |
| | 114,915 |
|
| | 645,552 |
| | 3,648,113 |
| | 453,399 |
| | — |
| | 4,747,064 |
|
| Financial services | — |
| | — |
| | 10,486 |
| | — |
| | 10,486 |
|
| Intercompany receivables | 3,582,612 |
| | — |
| | 112,919 |
| | (3,695,531 | ) | | — |
|
| Investments in subsidiaries | 39,356 |
| | — |
| | — |
| | (39,356 | ) | | — |
|
| Total assets | $ | 4,267,520 |
| | $ | 3,648,113 |
| | $ | 576,804 |
| | $ | (3,734,887 | ) | | $ | 4,757,550 |
|
| Liabilities and stockholders’ equity | | | | | | | | | |
| Homebuilding: | | | | | | | | | |
| Accounts payable, accrued expenses and other liabilities | $ | 138,298 |
| | $ | 317,550 |
| | $ | 126,750 |
| | $ | — |
| | $ | 582,598 |
|
| Notes payable | 2,513,165 |
| | 63,360 |
| | — |
| | — |
| | 2,576,525 |
|
| | 2,651,463 |
| | 380,910 |
| | 126,750 |
| | — |
| | 3,159,123 |
|
| Financial services | — |
| | — |
| | 2,517 |
| | — |
| | 2,517 |
|
| Intercompany payables | 20,147 |
| | 3,267,203 |
| | 408,181 |
| | (3,695,531 | ) | | — |
|
| Stockholders’ equity | 1,595,910 |
| | — |
| | 39,356 |
| | (39,356 | ) | | 1,595,910 |
|
| Total liabilities and stockholders’ equity | $ | 4,267,520 |
| | $ | 3,648,113 |
| | $ | 576,804 |
| | $ | (3,734,887 | ) | | $ | 4,757,550 |
|
Condensed Consolidating Statements of Cash Flows (in thousands)
|
| | | | | | | | | | | | | | | | | | | |
| | Year Ended November 30, 2015 |
| | KB Home Corporate | | Guarantor Subsidiaries | | Non-Guarantor Subsidiaries | | Consolidating Adjustments | | Total |
| Net cash provided by operating activities | $ | 44,422 |
| | $ | 125,068 |
| | $ | 11,695 |
| | $ | — |
| | $ | 181,185 |
|
| Cash flows from investing activities: | | | | | | | | | |
| Contributions to unconsolidated joint ventures | — |
| | (20,625 | ) | | (1 | ) | | — |
| | (20,626 | ) |
| Return of investments in unconsolidated joint ventures | — |
| | 14,000 |
| | — |
| | — |
| | 14,000 |
|
| Purchases of property and equipment, net | (2,890 | ) | | (1,704 | ) | | (83 | ) | | — |
| | (4,677 | ) |
| Intercompany | 45,470 |
| | — |
| | — |
| | (45,470 | ) | | — |
|
| Net cash provided by (used in) investing activities | 42,580 |
| | (8,329 | ) | | (84 | ) | | (45,470 | ) | | (11,303 | ) |
| Cash flows from financing activities: | | | | | | | | | |
| Change in restricted cash | 17,891 |
| | — |
| | — |
| | — |
| | 17,891 |
|
| Proceeds from issuance of debt | 250,000 |
| | — |
| | — |
| | — |
| | 250,000 |
|
| Payment of debt issuance costs | (4,561 | ) | | — |
| | — |
| | — |
| | (4,561 | ) |
| Repayment of senior notes | (199,906 | ) | | — |
| | — |
| | — |
| | (199,906 | ) |
| Payments on mortgages and land contracts due to land sellers and other loans | — |
| | (22,877 | ) | | — |
| | — |
| | (22,877 | ) |
| Issuance of common stock under employee stock plans | 740 |
| | — |
| | — |
| | — |
| | 740 |
|
| Excess tax benefits from stock-based compensation | 157 |
| | — |
| | — |
| | — |
| | 157 |
|
| Payments of cash dividends | (9,186 | ) | | — |
| | — |
| | — |
| | (9,186 | ) |
| Stock repurchases | (567 | ) | | — |
| | — |
| | — |
| | (567 | ) |
| Intercompany | — |
| | (32,693 | ) | | (12,777 | ) | | 45,470 |
| | — |
|
| Net cash provided by (used in) financing activities | 54,568 |
| | (55,570 | ) | | (12,777 | ) | | 45,470 |
| | 31,691 |
|
| Net increase (decrease) in cash and cash equivalents | 141,570 |
| | 61,169 |
| | (1,166 | ) | | — |
| | 201,573 |
|
| Cash and cash equivalents at beginning of year | 303,280 |
| | 37,112 |
| | 18,376 |
| | — |
| | 358,768 |
|
| Cash and cash equivalents at end of year | $ | 444,850 |
| | $ | 98,281 |
| | $ | 17,210 |
| | $ | — |
| | $ | 560,341 |
|
|
| | | | | | | | | | | | | | | | | | | |
| | Year Ended November 30, 2014 |
| | KB Home Corporate | | Guarantor Subsidiaries | | Non-Guarantor Subsidiaries | | Consolidating Adjustments | | Total |
| Net cash provided by (used in) operating activities | $ | 82,629 |
| | $ | (643,702 | ) | | $ | (69,618 | ) | | $ | — |
| | $ | (630,691 | ) |
| Cash flows from investing activities: | | | | | | | | | |
| Contributions to unconsolidated joint ventures | — |
| | (48,846 | ) | | (251 | ) | | — |
| | (49,097 | ) |
| Proceeds from sale of investment in unconsolidated joint venture | — |
| | — |
| | 10,110 |
| | — |
| | 10,110 |
|
| Purchases of property and equipment, net | (208 | ) | | (4,412 | ) | | (1,175 | ) | | — |
| | (5,795 | ) |
| Intercompany | (794,624 | ) | | — |
| | — |
| | 794,624 |
| | — |
|
| Net cash provided by (used in) investing activities | (794,832 | ) | | (53,258 | ) | | 8,684 |
| | 794,624 |
| | (44,782 | ) |
| Cash flows from financing activities: | | | | | | | | | |
| Change in restricted cash | 14,671 |
| | — |
| | — |
| | — |
| | 14,671 |
|
| Proceeds from issuance of debt | 400,000 |
| | — |
| | — |
| | — |
| | 400,000 |
|
| Payment of debt issuance costs | (5,448 | ) | | — |
| | — |
| | — |
| | (5,448 | ) |
| Payments on mortgages and land contracts due to land sellers and other loans | — |
| | (36,918 | ) | | — |
| | — |
| | (36,918 | ) |
| Proceeds from issuance of common stock, net | 137,045 |
| | — |
| | — |
| | — |
| | 137,045 |
|
| Issuance of common stock under employee stock plans | 1,896 |
| | — |
| | — |
| | — |
| | 1,896 |
|
| Payments of cash dividends | (8,982 | ) | | — |
| | — |
| | — |
| | (8,982 | ) |
| Stock repurchases | (546 | ) | | — |
| | — |
| | — |
| | (546 | ) |
| Intercompany | — |
| | 733,033 |
| | 61,591 |
| | (794,624 | ) | | — |
|
| Net cash provided by financing activities | 538,636 |
| | 696,115 |
| | 61,591 |
| | (794,624 | ) | | 501,718 |
|
| Net increase (decrease) in cash and cash equivalents | (173,567 | ) | | (845 | ) | | 657 |
| | — |
| | (173,755 | ) |
| Cash and cash equivalents at beginning of year | 476,847 |
| | 37,957 |
| | 17,719 |
| | — |
| | 532,523 |
|
| Cash and cash equivalents at end of year | $ | 303,280 |
| | $ | 37,112 |
| | $ | 18,376 |
| | $ | — |
| | $ | 358,768 |
|
|
| | | | | | | | | | | | | | | | | | | |
| | Year Ended November 30, 2013 |
| | KB Home Corporate | | Guarantor Subsidiaries | | Non-Guarantor Subsidiaries | | Consolidating Adjustments | | Total |
| Net cash provided by (used in) operating activities | $ | 4,795 |
| | $ | (457,390 | ) | | $ | 9,109 |
| | $ | — |
| | $ | (443,486 | ) |
| Cash flows from investing activities: | | | | | | | | | |
| Contributions to unconsolidated joint ventures | — |
| | (9,334 | ) | | (5,025 | ) | | — |
| | (14,359 | ) |
| Purchases of property and equipment, net | (519 | ) | | (1,254 | ) | | (618 | ) | | — |
| | (2,391 | ) |
| Intercompany | (517,803 | ) | | — |
| | — |
| | 517,803 |
| | — |
|
| Net cash used in investing activities | (518,322 | ) | | (10,588 | ) | | (5,643 | ) | | 517,803 |
| | (16,750 | ) |
| Cash flows from financing activities: | | | | | | | | | |
| Change in restricted cash | 456 |
| | — |
| | — |
| | — |
| | 456 |
|
| Proceeds from issuance of debt | 680,000 |
| | — |
| | — |
| | — |
| | 680,000 |
|
| Payment of debt issuance costs | (16,525 | ) | | — |
| | — |
| | — |
| | (16,525 | ) |
| Repayment of senior notes | (225,394 | ) | | — |
| | — |
| | — |
| | (225,394 | ) |
| Payments on mortgages and land contracts due to land sellers and other loans | — |
| | (66,296 | ) | | — |
| | — |
| | (66,296 | ) |
| Proceeds from issuance of common stock, net | 109,503 |
| | — |
| | — |
| | — |
| | 109,503 |
|
| Issuance of common stock under employee stock plans | 2,181 |
| | — |
| | — |
| | — |
| | 2,181 |
|
| Payments of cash dividends | (8,366 | ) | | — |
| | — |
| | — |
| | (8,366 | ) |
| Stock repurchases | (8,488 | ) | | — |
| | — |
| | — |
| | (8,488 | ) |
| Intercompany | — |
| | 523,013 |
| | (5,210 | ) | | (517,803 | ) | | — |
|
| Net cash provided by (used in) financing activities | 533,367 |
| | 456,717 |
| | (5,210 | ) | | (517,803 | ) | | 467,071 |
|
| Net increase (decrease) in cash and cash equivalents | 19,840 |
| | (11,261 | ) | | (1,744 | ) | | — |
| | 6,835 |
|
| Cash and cash equivalents at beginning of year | 457,007 |
| | 49,218 |
| | 19,463 |
| | — |
| | 525,688 |
|
| Cash and cash equivalents at end of year | $ | 476,847 |
| | $ | 37,957 |
| | $ | 17,719 |
| | $ | — |
| | $ | 532,523 |
|
| |
| Note 23. | Quarterly Results (unaudited) |
The following tables present our consolidated quarterly results for the years ended November 30, 2015 and 2014 (in thousands, except per share amounts):
|
| | | | | | | | | | | | | | | |
| | First Quarter | | Second Quarter | | Third Quarter | | Fourth Quarter |
| 2015 | | | | | | | |
| Revenues | $ | 580,121 |
| | $ | 622,969 |
| | $ | 843,157 |
| | $ | 985,783 |
|
| Gross profits | 86,739 |
| | 97,631 |
| | 133,099 |
| | 171,482 |
|
| Pretax income | 10,499 |
| | 12,673 |
| | 33,954 |
| | 69,917 |
|
| Net income | 7,799 |
| | 9,573 |
| | 23,254 |
| | 44,017 |
|
| Earnings per share: | | | | | | | |
| Basic | $ | .08 |
| | $ | .10 |
| | $ | .25 |
| | $ | .48 |
|
| Diluted | $ | .08 |
| | $ | .10 |
| | $ | .23 |
| | $ | .43 |
|
| | | | | | | | |
| 2014 | | | | | | | |
| Revenues | $ | 450,687 |
| | $ | 565,007 |
| | $ | 589,214 |
| | $ | 796,041 |
|
| Gross profits | 80,561 |
| | 107,595 |
| | 108,931 |
| | 114,765 |
|
| Pretax income | 10,763 |
| | 26,924 |
| | 28,661 |
| | 28,601 |
|
| Net income | 10,563 |
| | 26,624 |
| | 28,361 |
| | 852,801 |
|
| Earnings per share: | | | | | | | |
| Basic | $ | .13 |
| | $ | .30 |
| | $ | .31 |
| | $ | 9.25 |
|
| Diluted | $ | .12 |
| | $ | .27 |
| | $ | .28 |
| | $ | 8.36 |
|
Gross profits in the fourth quarter of 2014 included inventory impairment charges of $34.2 million. Pretax income in the first quarter of 2014 included a $3.2 million gain on the sale of our interest in an unconsolidated joint venture. Net income in the fourth quarter of 2014 included the impact of an $825.2 million deferred tax asset valuation allowance reversal.
Quarterly and year-to-date computations of per share amounts are made independently. Therefore, the sum of per share amounts for the quarters may not agree with per share amounts for the year.
On January 12, 2016, our board of directors authorized us to repurchase a total of up to 10,000,000 shares of our outstanding common stock. This authorization reaffirmed and incorporated the then-current balance of 4,000,000 shares that remained under the prior board-approved share repurchase program. The amount and timing of shares purchased under this 10,000,000 share repurchase program will be subject to market and business conditions and other factors, and purchases may be made from time to time and at any time through open market or privately negotiated transactions. This share repurchase authorization will continue in effect until fully used or earlier terminated or suspended by the board of directors. As of January 22, 2016, we had repurchased 3,025,000 shares of our common stock pursuant to this authorization, at a total cost of $30.5 million.
REPORT OF INDEPENDENT REGISTERED PUBLIC ACCOUNTING FIRM
The Board of Directors and Stockholders of KB Home:
We have audited the accompanying consolidated balance sheets of KB Home as of November 30, 2015 and 2014, and the related consolidated statements of operations, comprehensive income, stockholders’ equity, and cash flows for each of the three years in the period ended November 30, 2015. These financial statements are the responsibility of the Company’s management. Our responsibility is to express an opinion on these financial statements based on our audits.
We conducted our audits in accordance with the standards of the Public Company Accounting Oversight Board (United States). Those standards require that we plan and perform the audit to obtain reasonable assurance about whether the financial statements are free of material misstatement. An audit includes examining, on a test basis, evidence supporting the amounts and disclosures in the financial statements. An audit also includes assessing the accounting principles used and significant estimates made by management, as well as evaluating the overall financial statement presentation. We believe that our audits provide a reasonable basis for our opinion.
In our opinion, the financial statements referred to above present fairly, in all material respects, the consolidated financial position of KB Home at November 30, 2015 and 2014, and the consolidated results of its operations and its cash flows for each of the three years in the period ended November 30, 2015, in conformity with U.S. generally accepted accounting principles.
We also have audited, in accordance with the standards of the Public Company Accounting Oversight Board (United States), KB Home’s internal control over financial reporting as of November 30, 2015, based on criteria established in Internal Control — Integrated Framework issued by the Committee of Sponsoring Organizations of the Treadway Commission (2013 Framework) and our report dated January 22, 2016 expressed an unqualified opinion thereon.
/s/ Ernst & Young LLP
Los Angeles, California
January 22, 2016
| |
| Item 9. | CHANGES IN AND DISAGREEMENTS WITH ACCOUNTANTS ON ACCOUNTING AND FINANCIAL DISCLOSURE |
None.
| |
| Item 9A. | CONTROLS AND PROCEDURES |
Disclosure Controls and Procedures
We have established disclosure controls and procedures to ensure that information we are required to disclose in the reports we file or submit under the Securities and Exchange Act of 1934, as amended (“Exchange Act”), is recorded, processed, summarized and reported within the time periods specified in the SEC’s rules and forms, and accumulated and communicated to management, including theour President and Chief Executive Officer (the “Principal(“Principal Executive Officer”) and Executive Vice President and Chief Financial Officer (the “Principal(“Principal Financial Officer”), as appropriate, to allow timely decisions regarding required disclosure. Under the supervision and with the participation of senior management, including our Principal Executive Officer and Principal Financial Officer, we evaluated our disclosure controls and procedures, as such term is defined under Rule 13a-15(e) promulgated under the Securities Exchange Act of 1934.Act. Based on this evaluation, our Principal Executive Officer and Principal Financial Officer concluded that our disclosure controls and procedures were effective as of November 30, 2012.2015.
Internal Control Over Financial Reporting
| |
| (a) | Management’s Annual Report on Internal Control Over Financial Reporting |
Our management is responsible for establishing and maintaining adequate internal control over financial reporting, as such term is defined in Rule 13a-15(f) under the Securities and Exchange Act of 1934.Act. Under the supervision and with the participation of senior management, including our Principal Executive Officer and Principal Financial Officer, we evaluated the effectiveness of our internal control over financial reporting based on the framework in Internal Control-IntegratedControl — Integrated Framework (2013) issuedestablished by the Committee of Sponsoring Organizations of the Treadway Commission. Based on the evaluation under that framework and applicable SEC rules, our management concluded that our internal control over financial reporting was effective as of November 30, 2012.2015.
Ernst & Young LLP, the independent registered public accounting firm that audited our consolidated financial statements included in this annual report, has issued its report on the effectiveness of our internal control over financial reporting as of November 30, 2012.2015, which is presented below.
| |
| (b) | Report of Independent Registered Public Accounting Firm |
The Board of Directors and Stockholders of KB Home:
We have audited KB Home’s internal control over financial reporting as of November 30, 2012,2015, based on criteria established in Internal Control — Integrated Framework issued by the Committee of Sponsoring Organizations of the Treadway Commission (2013 Framework) (the COSO criteria). KB Home’s management is responsible for maintaining effective internal control over financial reporting, and for its assessment of the effectiveness of internal control over financial reporting included in the accompanying Management’s Annual Report on Internal Control Over Financial Reporting. Our responsibility is to express an opinion on the company’s internal control over financial reporting based on our audit.
We conducted our audit in accordance with the standards of the Public Company Accounting Oversight Board (United States). Those standards require that we plan and perform the audit to obtain reasonable assurance about whether effective internal control over financial reporting was maintained in all material respects. Our audit included obtaining an understanding of internal control over financial reporting, assessing the risk that a material weakness exists, testing and evaluating the design and operating effectiveness of internal control based on the assessed risk, and performing such other procedures as we considered necessary in the circumstances. We believe that our audit provides a reasonable basis for our opinion.
A company’s internal control over financial reporting is a process designed to provide reasonable assurance regarding the reliability of financial reporting and the preparation of financial statements for external purposes in accordance with generally accepted accounting principles. A company’s internal control over financial reporting includes those policies and procedures that (1) pertain to the maintenance of records that, in reasonable detail, accurately and fairly reflect the transactions and dispositions of the assets of the company; (2) provide reasonable assurance that transactions are recorded as necessary to permit preparation of financial statements in accordance with generally accepted accounting principles, and that receipts and expenditures of the company are being made only in accordance with authorizations of management and directors of the company; and (3) provide reasonable assurance regarding prevention or timely detection of unauthorized acquisition, use, or disposition of the company’s assets that could have a material effect on the financial statements.
Because of its inherent limitations, internal control over financial reporting may not prevent or detect misstatements. Also, projections of any evaluation of effectiveness to future periods are subject to the risk that controls may become inadequate because of changes in conditions, or that the degree of compliance with the policies or procedures may deteriorate.
In our opinion, KB Home maintained, in all material respects, effective internal control over financial reporting as of November 30, 2012,2015, based on the COSO criteria.
We also have audited, in accordance with the standards of the Public Company Accounting Oversight Board (United States), the consolidated balance sheets of KB Home as of November 30, 20122015 and 2011,2014, and the related consolidated statements of operations, comprehensive income, stockholders’ equity, and cash flows for each of the three years in the period ended November 30, 20122015 and our report dated January 18, 201322, 2016 expressed an unqualified opinion thereon.
/s/ Ernst & Young LLP
Los Angeles, California
January 18, 201322, 2016
| |
| (c) | Changes in Internal Control Over Financial Reporting |
There have been no changes in our internal control over financial reporting during the quarter ended November 30, 20122015 that have materially affected, or are reasonably likely to materially affect, our internal control over financial reporting.
| |
| Item 9B. | OTHER INFORMATION |
None.
PART III
| |
| Item 10. | DIRECTORS, EXECUTIVE OFFICERS AND CORPORATE GOVERNANCE |
The information required byfor this item for executive officers is set forth underprovided above in the “Executive Officers of the Registrant” section in Part I.this report. Except as set forthstated below, the other information called for by this item will be included underprovided in the captions “Corporate Governance and Board Matters” and “Proposal 1: Election“Election of Directors” sections in our Proxy Statement for the 2013our 2016 Annual Meeting of Stockholders (the “2013(“2016 Proxy Statement”), which will be filed with the SEC not later than March 30, 2013 (120 days after the end of our fiscal year), and is incorporated herein by this reference.
Ethics Policy
We have adopted an Ethics Policyethics policy for our directors, officers (including our principal executive officer, principal financial officer and principal accounting officer) and employees. The Ethics Policyethics policy is available on our investor relations website at www.investor.kbhome.com.http://investor.kbhome.com. Stockholders may request a free copy of the Ethics Policyethics policy from:
KB Home
Attention: Investor Relations
10990 Wilshire Boulevard
Los Angeles, California 90024
(310) 231-4000
investorrelations@kbhome.com
Within the time period required by the SEC and the New York Stock Exchange, we will post on our investor relations website any amendment to our Ethics Policyethics policy and any waiver applicable to our principal executive officer, principal financial officer or principal accounting officer, or persons performing similar functions, and our other executive officers or directors.
Corporate Governance Principles
We have adopted Corporate Governance Principles,corporate governance principles, which are available on our investor relations website. Stockholders may request a free copy of the Corporate Governance Principlescorporate governance principles from the address, phone number and emaile-mail address set forthstated above under “Ethics Policy.”
| |
| Item 11. | EXECUTIVE COMPENSATION |
The information required byfor this item will be included underprovided in the captions “Corporate Governance and Board Matters” and “Executive Compensation” sections in the 2013our 2016 Proxy Statement and is incorporated herein by this reference.
| |
| Item 12. | SECURITY OWNERSHIP OF CERTAIN BENEFICIAL OWNERS AND MANAGEMENT AND RELATED STOCKHOLDER MATTERS |
TheExcept as provided below, the information required byfor this item will be included under the caption “Ownershipprovided in the“Ownership of KB Home Securities” section in the 2013our 2016 Proxy Statement and is incorporated herein by reference, except for the information required by Item 201(d) of Regulation S-K, which is provided below.this reference.
The following table presents information as of November 30, 20122015 with respect to shares of our common stock that may be issued under our existing equity compensation plans:
| | | Equity Compensation Plan Information | Equity Compensation Plan Information | | Equity Compensation Plan Information | |
| Plan category | Number of common shares to be issued upon exercise of outstanding options, warrants and rights (a) | | Weighted-average exercise price of outstanding options, warrants and rights (b) | | Number of common shares remaining available for future issuance under equity compensation plans (excluding common shares reflected in column(a)) (c) | | | Number of common shares to be issued upon exercise of outstanding options, warrants and rights (a) | | Weighted-average exercise price of outstanding options, warrants and rights (b) | | Number of common shares remaining available for future issuance under equity compensation plans (excluding common shares reflected in column(a)) (c) | |
| Equity compensation plans approved by stockholders | 10,105,546 |
| | $ | 21.27 |
| | 1,721,847 |
| | | 12,635,644 |
| | $ | 19.39 |
| | 1,544,195 |
| |
| Equity compensation plans not approved by stockholders | — |
| | — |
| | — |
| (1 | ) | | — |
| | — |
| | — |
| (1 | ) |
| Total | 10,105,546 |
| | $ | 21.27 |
| | 1,721,847 |
| | | 12,635,644 |
| | $ | 19.39 |
| | 1,544,195 |
| |
| |
| (1) | Represents our currenta prior non-employee directors compensation plan forunder which our non-employee directors that provides for grants of deferred common stock units or stock options. These stock units and options are describedreceived Director Plan SARs, which were initially granted as cash-settled instruments. As discussed in Note 17. Stockholders’ Equity in the “Director Compensation” section of our 2013 Proxy Statement, which is incorporated herein. Although we may purchase shares of our common stock on the open marketNotes to satisfy the payment of these stock units and options, to date,Consolidated Financial Statements in this report, all of them have been settled in cash. Further, under the non-employee directors’ current compensation plan, our non-employee directors cannotserving on our board of directors have elected to receive shares of our common stock in satisfactionsettlement of their Director Plan SARs under the terms of the plan. In August 2014, our board of directors authorized the repurchase of shares of our common stock, units or options unless and until approved byalso authorized potential future grants of stock payment awards under the 2014 Plan, in each case solely as necessary for such non-employee director elections in respect of outstanding Director Plan SARs; however, as of the date of this report, no shares of our stockholders. Therefore, wecommon stock have been repurchased and no stock payment awards have been made pursuant to these authorizations. We consider thethis non-employee directorsdirector compensation plansplan as having no available capacity to issue shares of our common stock. |
| |
| Item 13. | CERTAIN RELATIONSHIPS AND RELATED TRANSACTIONS, AND DIRECTOR INDEPENDENCE |
The information required byfor this item will be included underprovided in the captions “Corporate Governance and Board Matters” and “Other Matters” sections in the 2013our 2016 Proxy Statement and is incorporated herein by this reference.
| |
| Item 14. | PRINCIPAL ACCOUNTING FEES AND SERVICES |
The information required byfor this item will be included underprovided in the caption “Independent Auditor Fees and Services” section in the 2013our 2016 Proxy Statement and is incorporated herein by this reference.
PART IV
| |
| Item 15. | EXHIBITS, FINANCIAL STATEMENT SCHEDULES |
(a) 1. Financial Statements
Reference is made to the index set forth on page 6053 of this Annual Report on Form 10-K.
2. Financial Statement Schedules
Financial statement schedules have been omitted because they are not applicable or the required information is provided in the consolidated financial statements or notes thereto.
3. Exhibits
|
| | |
Exhibit Number | | Description |
| | | |
| 3.1 | | Restated Certificate of Incorporation, as amended, filed as an exhibit to our Current Report on Form 8-K dated April 7, 2009 (File No. 001-09195), is incorporated by reference herein. |
| | |
| 3.2 | | Amended and Restated By-Laws as amended and restated on April 5, 2007,of KB Home, filed as an exhibit to our QuarterlyCurrent Report on Form 10-Q for the quarter ended February 28, 20078-K dated July 18, 2014 (File No. 001-09195), is incorporated by reference herein. |
| | |
| 4.1 | | Rights Agreement between us and Mellon Investor Services LLC, as rights agent, dated January 22, 2009, filed as an exhibit to our Current Report on Form 8-K/A dated January 28, 2009 (File No. 001-09195), is incorporated by reference herein. |
| | |
| 4.2 | | Indenture and Supplemental Indenture relating to 5 3/4%our Senior Notes due 2014 among us, the Guarantors party thereto and Sun Trust Bank, Atlanta, each dated January 28, 2004, filed as exhibitsan exhibit to our Registration Statement No. 333-114761 on Form S-4, areis incorporated by reference herein. |
| | |
| 4.3 | | Third Supplemental Indenture relating to our Senior Notes by and between us, the Guarantors named therein, the Subsidiary Guarantor named therein and SunTrust Bank, dated as of May 1, 2006, filed as an exhibit to our Current Report on Form 8-K dated May 3, 2006 (File No. 001-09195), is incorporated by reference herein. |
| |
4.4 | | Fourth Supplemental Indenture relating to our Senior Notes by and between us, the Guarantors named therein and U.S. Bank National Association, dated as of November 9, 2006, filed as an exhibit to our Current Report on Form 8-K dated November 13, 2006 (File No. 001-09195), is incorporated by reference herein. |
| |
4.5 | | Fifth Supplemental Indenture, dated August 17, 2007, relating to our Senior Notes by and between us, the Guarantors named therein, and the Trustee, filed as an exhibit to our Current Report on Form 8-K dated August 22, 2007 (File No. 001-09195), is incorporated by reference herein. |
| | |
4.64.4 | | Sixth Supplemental Indenture, dated as of January 30, 2012, relating to our Senior Notes by and between us, the Guarantors named therein, and the Trustee, filed as an exhibit to our Current Report on Form 8-K dated February 2, 2012 (File No. 001-09195), is incorporated by reference herein. |
| | | |
4.74.5 | | Seventh Supplemental Indenture, dated as of January 11, 2013, relating to our Senior Notes by and among us, the Guarantors named therein, and the Trustee, filed as an exhibit to our Current Report on Form 8-K dated January 11, 2013 (File No. 001-09195), is incorporated by reference herein. |
| | | |
4.8 | | Specimen of 5 3/4% Senior Notes due 2014, filed as an exhibit to our Registration Statement No. 333-114761 on Form S-4, is incorporated by reference herein. |
| |
4.9 | | Specimen of 5 7/8% Senior Notes due 2015, filed as an exhibit to our Current Report on Form 8-K dated December 15, 2004 (File No. 001-09195), is incorporated by reference herein. |
| |
4.10 | | Form of officers’ certificates and guarantors’ certificates establishing the terms of the 5 7/8% Senior Notes due 2015, filed as an exhibit to our Current Report on Form 8-K dated December 15, 2004 (File No. 001-09195), is incorporated by reference herein. |
| | |
4.114.6 | | Specimen of 6 1/4% Senior Notes due 2015, filed as an exhibit to our Current Report on Form 8-K dated June 2, 2005 (File No. 001-09195), is incorporated by reference herein. |
| | |
4.124.7 | | Form of officers’ certificates and guarantors’ certificates establishing the terms of the 6 1/4% Senior Notes due 2015, filed as an exhibit to our Current Report on Form 8-K dated June 2, 2005 (File No. 001-09195), is incorporated by reference herein. |
| | |
|
| | |
Exhibit
Number
| | Description |
4.134.8 | | Specimen of 6 1/4% Senior Notes due 2015, filed as an exhibit to our Current Report on Form 8-K dated June 27, 2005 (File No. 001-09195), is incorporated by reference herein. |
| | |
4.144.9 | | Form of officers’ certificates and guarantors’ certificates establishing the terms of the 6 1/4% Senior Notes due 2015, filed as an exhibit to our Current Report on Form 8-K dated June 27, 2005 (File No. 001-09195), is incorporated by reference herein. |
| | |
4.154.10 | | Specimen of 7 1/4% Senior Notes due 2018, filed as an exhibit to our Current Report on Form 8-K dated April 3, 2006 (File No. 001-09195), is incorporated by reference herein. |
| | |
4.164.11 | | Form of officers’ certificates and guarantors’ certificates establishing the terms of the 7 1/4% Senior Notes due 2018, filed as an exhibit to our Current Report on Form 8-K dated April 3, 2006 (File No. 001-09195), is incorporated by reference herein. |
| | |
4.17 |
| | |
Exhibit Number | | Description |
| | |
| 4.12 | | Specimen of 9.100% Senior Notes due 2017, filed as an exhibit to our Current Report on Form 8-K dated July 30, 2009 (File No. 001-09195), is incorporated by reference herein. |
| | |
4.184.13 | | Form of officers’ certificates and guarantors’ certificates establishing the terms of the 9.100% Senior Notes due 2017, filed as an exhibit to our Current Report on Form 8-K dated July 30, 2009 (File No. 001-09195), is incorporated by reference herein. |
| | | |
4.194.14 | | Specimen of 8.00% Senior Notes due 2020, filed as an exhibit to our Current Report on Form 8-K dated February 7, 2012 (File No. 001-09195), is incorporated by reference herein. |
| | |
4.204.15 | | Form of officers’ certificates and guarantors’ certificates establishing the terms of the 8.00% Senior Notes due 2020, filed as an exhibit to our Current Report on Form 8-K dated February 7, 2012 (File No. 001-09195), is incorporated by reference herein. |
| | | |
4.214.16 | | Specimen of 7.50% Senior Notes due 2022, filed as an exhibit to our Current Report on Form 8-K dated July 31, 2012 (File No. 001-09195), is incorporated by reference herein. |
| | | |
4.224.17 | | Form of officers’ certificates and guarantors’ certificates establishing the terms of the 7.50% Senior Notes due 2022, filed as an exhibit to our Current Report on Form 8-K dated July 31, 2012 (File No. 001-09195), is incorporated by reference herein. |
| | |
| 4.18 | | Form of officers’ certificate and guarantors’ officers’ certificates establishing the form and terms of the 1.375% Convertible Senior Notes due 2019, filed as an exhibit to our Current Report on Form 8-K dated January 29, 2013 (File No. 001-09195), is incorporated by reference herein. |
| | |
| 4.19 | | Form of 1.375% Convertible Senior Notes due 2019, filed as an exhibit to our Current Report on Form 8-K dated January 29, 2013 (File No. 001-09195), is incorporated by reference herein. |
| | |
| 4.20 | | Form of supplemental officers’ certificate and guarantors’ officers’ certificates establishing the form and terms of the 1.375% Convertible Senior Notes due 2019, filed as an exhibit to our Quarterly Report on Form 10-Q for the quarter ended February 28, 2013 (File No. 001-09195), is incorporated by reference herein. |
| | |
| 4.21 | | Eighth Supplemental Indenture, dated as of March 12, 2013, by and among us, the Guarantors party thereto, the Additional Guarantors named therein and U.S. Bank National Association, as Trustee, filed as an exhibit to our Quarterly Report on Form 10-Q for the quarter ended May 31, 2013 (File No. 001-09195), is incorporated by reference herein. |
| | |
| 4.22 | | Specimen of 7.00% Senior Notes due 2021, filed as an exhibit to our Current Report on Form 8-K dated October 29, 2013 (File No. 001-09195), is incorporated by reference herein. |
| | |
| 4.23 | | Form of officers’ certificates and guarantors’ certificates establishing the terms of the 7.00% Senior Notes due 2021, filed as an exhibit to our Current Report on Form 8-K dated October 29, 2013 (File No. 001-09195), is incorporated by reference herein. |
| | |
| 4.24 | | Ninth Supplemental Indenture, dated as of February 28, 2014, by and among us, the Guarantors party thereto, the Additional Guarantors named therein and U.S. Bank National Association, as Trustee, filed as an exhibit to our Post-Effective Amendment No. 4 to Form S-3 Registration Statement (No. 333-176930), is incorporated by reference herein. |
| | |
| 4.25 | | Specimen of 4.75% Senior Notes due 2019, filed as an exhibit to our Current Report on Form 8-K dated March 25, 2014 (File No. 001-09195), is incorporated by reference herein. |
| | |
| 4.26 | | Form of officers’ certificates and guarantors’ certificates establishing the terms of the 4.75% Senior Notes due 2019, filed as an exhibit to our Current Report on Form 8-K dated March 25, 2014 (File No. 001-09195), is incorporated by reference herein. |
| | |
| 4.27 | | Form of 7.625% Senior Notes due 2023, filed as an exhibit to our Current Report on Form 8-K dated February 17, 2015 (File No. 001-09195), is incorporated by reference herein. |
| | |
| 4.28 | | Form of officers’ certificates and guarantors’ certificates establishing the terms of the 7.625% Senior Notes due 2023, filed as an exhibit to our Current Report on Form 8-K dated February 17, 2015 (File No. 001-09195), is incorporated by reference herein. |
| | |
|
| | |
Exhibit Number | | Description |
| | | |
| 10.1* | | Kaufman and Broad, Inc. Executive Deferred Compensation Plan, effective as of July 11, 1985, filed as an exhibit to our 2007 Annual Report on Form 10-K (File No. 001-09195), is incorporated by reference herein. |
| | |
| 10.2* | | Amendment to Kaufman and Broad, Inc. Executive Deferred Compensation Plan for amounts earned or vested on or after January 1, 2005, effective January 1, 2009, filed as an exhibit to our 2008 Annual Report on Form 10-K (File No. 001-09195), is incorporated by reference herein. |
| | |
| 10.3* | | KB Home 1988 Employee Stock Plan, as amended and restated on October 2, 2008, filed as an exhibit to our 2008 Annual Report on Form 10-K (File No. 001-09195), is incorporated by reference herein. |
| | |
| 10.4* | | Kaufman and Broad Home Corporation Directors’ Deferred Compensation Plan established effective as of July 27, 1989, filed as an exhibit to our 2007 Annual Report on Form 10-K (File No. 001-09195), is incorporated by reference herein. |
| |
10.5* | | KB Home Performance-Based Incentive Plan for Senior Management, as amended and restated on October 2, 2008, filed as an exhibit to our 2008 Annual Report on Form 10-K (File No. 001-09195), is incorporated by reference herein. |
| | |
10.6*10.5* | | Form of Stock Option Agreement under KB Home Performance-Based Incentive Plan for Senior Management, filed as an exhibit to our 1995 Annual Report on Form 10-K (File No. 001-09195), is incorporated by reference herein. |
| | |
10.7* | | KB Home 1998 Stock Incentive Plan, as amended and restated on October 2, 2008, filed as an exhibit to our 2008 Annual Report on Form 10-K (File No. 001-09195), is incorporated by reference herein. |
| | |
10.810.6 | | KB Home Directors’ Legacy Program, as amended January 1, 1999, filed as an exhibit to our 1998 Annual Report on Form 10-K (File No. 001-09195), is incorporated by reference herein. |
| | |
10.910.7 | | Trust Agreement between Kaufman and Broad Home Corporation and Wachovia Bank, N.A. as Trustee, dated as of August 27, 1999, filed as an exhibit to our 1999 Annual Report on Form 10-K (File No. 001-09195), is incorporated by reference herein. |
| | | |
|
| | |
Exhibit
Number
| | Description |
10.10*10.8* | | Amended and Restated KB Home 1999 Incentive Plan, as amended and restated on October 2, 2008, filed as an exhibit to our 2008 Annual Report on Form 10-K (File No. 001-09195), is incorporated by reference herein. |
| | |
10.11*10.9* | | Form of Non-Qualified Stock Option Agreement under our Amended and Restated 1999 Incentive Plan, filed as an exhibit to our 2011 Annual Report on Form 10-K (File No. 001-09195), is incorporated by reference herein. |
| | |
10.12* | | Form of Restricted Stock Agreement under our Amended and Restated 1999 Incentive Plan, filed as an exhibit to our 2011 Annual Report on Form 10-K (File No. 001-09195), is incorporated by reference herein. |
| |
10.13*10.10* | | KB Home 2001 Stock Incentive Plan, as amended and restated on October 2, 2008, filed as an exhibit to our 2008 Annual Report on Form 10-K (File No. 001-09195), is incorporated by reference herein. |
| | |
10.14*10.11* | | Form of Stock Option Agreement under our 2001 Stock Incentive Plan, filed as an exhibit to our 2011 Annual Report on Form 10-K (File No. 001-09195), is incorporated by reference herein. |
| | |
10.15* | | Form of Stock Restriction Agreement under our 2001 Stock Incentive Plan, filed as an exhibit to our 2011 Annual Report on Form 10-K (File No. 001-09195), is incorporated by reference herein. |
| |
10.16*10.12* | | KB Home Nonqualified Deferred Compensation Plan with respect to deferrals prior to January 1, 2005, effective March 1, 2001, filed as an exhibit to our 2001 Annual Report on Form 10-K (File No. 001-09195), is incorporated by reference herein. |
| | |
10.17*10.13* | | KB Home Nonqualified Deferred Compensation Plan with respect to deferrals on and after January 1, 2005, effective January 1, 2009 (File No. 001-09195), filed as an exhibit to our 2008 Annual Report on Form 10-K, is incorporated by reference herein. |
| | |
10.18*10.14* | | KB Home Change in Control Severance Plan, as amended and restated effective January 1, 2009, filed as an exhibit to our 2008 Annual Report on Form 10-K (File No. 001-09195), is incorporated by reference herein. |
| | |
10.19*10.15* | | KB Home Death Benefit Only Plan, filed as an exhibit to our 2001 Annual Report on Form 10-K (File No. 001-09195), is incorporated by reference herein. |
| | |
10.20*10.16* | | Amendment No. 1 to the KB Home Death Benefit Only Plan, effective as of January 1, 2009, filed as an exhibit to our 2008 Annual Report on Form 10-K (File No. 001-09195), is incorporated by reference herein. |
| | |
10.21*10.17* | | KB Home Retirement Plan, as amended and restated effective January 1, 2009, filed as an exhibit to our 2008 Annual Report on Form 10-K (File No. 001-09195), is incorporated by reference herein. |
| | |
10.22*10.18* | | Employment Agreement of Jeffrey T. Mezger, dated February 28, 2007, filed as an exhibit to our Current Report on Form 8-K dated March 6, 2007 (File No. 001-09195), is incorporated by reference herein. |
| | |
10.23*10.19* | | Amendment to the Employment Agreement of Jeffrey T. Mezger, dated December 24, 2008, filed as an exhibit to our 2008 Annual Report on Form 10-K (File No. 001-09195), is incorporated by reference herein. |
| | |
10.24* |
| | |
Exhibit Number | | Description |
| | |
| 10.20* | | Form of Stock Option Agreement under the Employment Agreement between us and Jeffrey T. Mezger dated as of February 28, 2007, filed as an exhibit to our Current Report on Form 8-K dated July 18, 2007 (File No. 001-09195), is incorporated by reference herein. |
| | |
10.25*10.21* | | Form of Stock Option Agreement under the Amended and Restated 1999 Incentive Plan for stock option grant to Jeffrey T. Mezger, filed as an exhibit to our Quarterly Report on Form 10-Q for the quarter ended August 31, 2007 (File No. 001-09195), is incorporated by reference herein. |
| | |
10.26*10.22* | | Policy Regarding Stockholder Approval of Certain Severance Payments, adopted July 10, 2008, filed as an exhibit to our Current Report on Form 8-K dated July 15, 2008 (File No. 001-09195), is incorporated by reference herein. |
| | |
10.27*10.23* | | KB Home Executive Severance Plan, filed as an exhibit to our Quarterly Report on Form 10-Q for the quarter ended August 31, 2008 (File No. 001-09195), is incorporated by reference herein. |
| | |
10.28* | | Form of Fiscal Year 2009 Phantom Shares Agreement, filed as an exhibit to our Current Report on Form 8-K dated October 8, 2008 (File No. 001-09195), is incorporated by reference herein. |
| | |
10.29* | | KB Home Annual Incentive Plan for Executive Officers, filed as Attachment C to our Proxy Statement on Schedule 14A for the 2009 Annual Meeting of Stockholders (File No. 001-09195), is incorporated by reference herein. |
| |
10.3010.24 | | Amendment to Trust Agreement by and between KB Home and Wachovia Bank, N.A., dated August 24, 2009, filed as an exhibit to our Quarterly Report on Form 10-Q for the quarter ended August 31, 2009 (File No. 001-09195), is incorporated by reference herein. |
| | |
|
| | |
Exhibit
Number
| | Description |
10.31 | | Amended and Restated KB Home Non-Employee Directors Compensation Plan, effective as of July 9, 2009, filed as an exhibit to our 2009 Annual Report on Form 10-K (File No. 001-09195), is incorporated by reference herein. |
| |
10.3210.25 | | Form of Indemnification Agreement, filed as an exhibit to our Current Report on Form 8-K dated April 2, 2010 (File No. 001-09195), is incorporated by reference herein. |
| | |
10.33*10.26* | | KB Home 2010 Equity Incentive Plan, filed as an exhibit to our Quarterly Report on Form 10-Q for the quarter ended February 28, 2010 (File No. 001-09195), is incorporated by reference herein. |
| | |
10.34*10.27* | | Form of Stock Option Award Agreement under the KB Home 2010 Equity Incentive Plan, filed as an exhibit to our Current Report on Form 8-K dated July 20, 2010 (File No. 001-09195), is incorporated by reference herein. |
| | |
10.35*10.28* | | Form of Restricted Stock Award Agreement under the KB Home 2010 Equity Incentive Plan, filed as an exhibit to our Current Report on Form 8-K dated July 20, 2010 (File No. 001-09195), is incorporated by reference herein. |
| | |
10.36* | | Form of Fiscal Year 2011 Restricted Cash Award Agreement, filed as an exhibit to our Current Report on Form 8-K dated October 13, 2010 (File No. 001-09195), is incorporated by reference herein. |
| |
10.37*10.29* | | KB Home 2010 Equity Incentive Plan Stock Option Agreement for performance stock option grant to Jeffrey T. Mezger, filed as an exhibit to our 2010 Annual Report on Form 10-K (File No. 001-09195), is incorporated by reference herein. |
| | |
10.38*10.30* | | Amendment to the KB Home 2010 Equity Incentive Plan, filed as an exhibit to our Quarterly Report on Form 10-Q for the quarter ended February 28, 2011 (File No. 001-09195), is incorporated by reference herein. |
| | |
10.39*10.31* | | Executive Severance Benefit Decisions, filed as an exhibit to our Quarterly Report on Form 10-Q for the quarter ended February 28, 2011 (File No. 001-09195), is incorporated by reference herein. |
| | |
10.4010.32 | | Consensual agreement effective June 10, 2011, filed as an exhibit to our Quarterly Report on Form 10-Q for the quarter ended August 31, 2011 (File No. 001-09195), is incorporated by reference herein. |
| | |
10.41* | | Form of 2010 Equity Incentive Plan Performance Cash Award Agreement, filed as an exhibit to our Current Report on Form 8-K dated October 12, 2011 (File No. 001-09195), is incorporated by reference herein. |
| |
10.42*10.33* | | KB Home 2010 Equity Incentive Plan Stock Option Agreement for performance stock option grant to Jeffrey T. Mezger, filed as an exhibit to our 2011 Annual Report on Form 10-K (File No. 001-09195), is incorporated by reference herein. |
| | | |
10.43*†10.34* | | Form of KB Home 2010 Equity Incentive Plan Performance-Based Restricted Stock Unit Award Agreement.Agreement, filed as an exhibit to our 2012 Annual Report on Form 10-K (File No. 001-09195), is incorporated by reference herein. |
| | | |
10.44*†10.35* | | KB Home 2010 Equity Incentive Plan Performance-Based Restricted Stock Unit Award Agreement for performance-based restricted stock unit award to Jeffrey T. Mezger.Mezger, filed as an exhibit to our 2012 Annual Report on Form 10-K (File No. 001-09195), is incorporated by reference herein. |
| | |
10.45*†10.36* | | Form of KB Home 2010 Equity Incentive Plan Restricted Stock Unit Award Agreement.Agreement, filed as an exhibit to our 2012 Annual Report on Form 10-K (File No. 001-09195), is incorporated by reference herein. |
| | |
| 10.37* | | KB Home 2014 Equity Incentive Plan, filed as an exhibit to our Quarterly Report on Form 10-Q for the quarter ended February 28, 2014 (File No. 001-09195), is incorporated by reference herein. |
| | |
| 10.38* | | Amendment to Amended and Restated KB Home 1999 Incentive Plan Non-Qualified Stock Option Agreement, effective July 17, 2014, filed as an exhibit to our Quarterly Report on Form 10-Q for the quarter ended August 31, 2014 (File No. 001-09195), is incorporated by reference herein. |
| | |
|
| | |
Exhibit Number | | Description |
| | |
| 10.39* | | Amendment to KB Home 2001 Stock Incentive Plan Stock Option Agreement, effective July 17, 2014, filed as an exhibit to our Quarterly Report on Form 10-Q for the quarter ended August 31, 2014 (File No. 001-09195), is incorporated by reference herein. |
| | |
| 10.40* | | Amendment to KB Home Performance Based Incentive Plan for Senior Management Stock Option Agreement, effective July 17, 2014, filed as an exhibit to our Quarterly Report on Form 10-Q for the quarter ended August 31, 2014 (File No. 001-09195), is incorporated by reference herein. |
| | |
| 10.41* | | Form of Stock Option Agreement under the KB Home 2014 Equity Incentive Plan, filed as an exhibit to our Current Report on Form 8-K dated October 14, 2014 (File No. 001-09195), is incorporated by reference herein. |
| | |
| 10.42* | | Form of Performance-Based Restricted Stock Unit Award Agreement under the KB Home 2014 Equity Incentive Plan, filed as an exhibit to our Current Report on Form 8-K dated October 14, 2014 (File No. 001-09195), is incorporated by reference herein. |
| | |
| 10.43* | | Form of Performance Cash Award Agreement under the KB Home 2014 Equity Incentive Plan, filed as an exhibit to our Current Report on Form 8-K dated October 14, 2014 (File No. 001-09195), is incorporated by reference herein. |
| | |
| 10.44* | | Form of Restricted Cash Award Agreement under the KB Home 2014 Equity Incentive Plan, filed as an exhibit to our Current Report on Form 8-K dated October 14, 2014 (File No. 001-09195), is incorporated by reference herein. |
| | |
| 10.45 | | Fourth Amended and Restated KB Home Non-Employee Directors Compensation Plan, effective as of October 9, 2014, filed as an exhibit to our 2014 Annual Report on Form 10-K (File No. 001-09195), is incorporated by reference herein. |
| | |
| 10.46 | | Amended and Restated Revolving Loan Agreement, dated as of August 7, 2015, among us, the banks party thereto, and Citibank, N.A., as Administrative Agent, filed as an exhibit to our Quarterly Report on Form 10-Q for the quarter ended August 31, 2015 (File No. 001-09195), is incorporated by reference herein. |
| | |
| 10.47*† | | Form of Restricted Stock Agreement under the KB Home 2014 Equity Incentive Plan. |
| | | |
| 12.1† | | Computation of Ratio of Earnings to Fixed Charges. |
| | |
| 21† | | Subsidiaries of the Registrant. |
| | |
| 23† | | Consent of Independent Registered Public Accounting Firm. |
| | |
| 31.1† | | Certification of Jeffrey T. Mezger, President and Chief Executive Officer of KB Home Pursuant to Section 302 of the Sarbanes-Oxley Act of 2002. |
| | |
| 31.2† | | Certification of Jeff J. Kaminski, Executive Vice President and Chief Financial Officer of KB Home Pursuant to Section 302 of the Sarbanes-Oxley Act of 2002. |
| | | |
| 32.1† | | Certification of Jeffrey T. Mezger, President and Chief Executive Officer of KB Home Pursuant to 18 U.S.C. Section 1350, as Adopted Pursuant to Section 906 of the Sarbanes-Oxley Act of 2002. |
| | | |
| 32.2† | | Certification of Jeff J. Kaminski, Executive Vice President and Chief Financial Officer of KB Home Pursuant to 18 U.S.C. Section 1350, as Adopted Pursuant to Section 906 of the Sarbanes-Oxley Act of 2002. |
| | | |
|
| | |
Exhibit
Number
| | Description |
| 101† | | The following materials from KB Home’s Annual Report on Form 10-K for the year ended November 30, 2012,2015, formatted in eXtensible Business Reporting Language (XBRL): (i)(a) Consolidated Statements of Operations for the years ended November 30, 2012, 20112015, 2014 and 2010, (ii)2013, (b) Consolidated Statements of Comprehensive Income for the Years Ended November 30, 2015, 2014 and 2013, (c) Consolidated Balance Sheets as of November 30, 20122015 and 2011, (iii)2014, (d) Consolidated Statements of Stockholders’ Equity for the years ended November 30, 2012, 20112015, 2014 and 2010, (iv)2013, (e) Consolidated Statements of Cash Flows for the years ended November 30, 2012, 20112015, 2014 and 2010,2013, and (v)(f) the Notes to Consolidated Financial Statements. |
* Management contract or compensatory plan or arrangement in which executive officers are eligible to participate.
† Document filed with this Form 10-K.
SIGNATURES
Pursuant to the requirements of Section 13 or 15(d) of the Securities Exchange Act of 1934, the registrant has duly caused this report to be signed on its behalf by the undersigned, thereunto duly authorized.
|
| | |
| | KB Home |
| | | |
| | By: | /S/ JEFF J. KAMINSKI |
| | | Jeff J. Kaminski |
| | | Executive Vice President and Chief Financial Officer |
Date: January 18, 201322, 2016 | |
Pursuant to the requirements of the Securities Exchange Act of 1934, this report has been signed below by the following persons on behalf of the registrant and in the capacities and on the dates indicated:
|
| | | | |
| Signature | | Title | | Date |
/S/ JEFFREY T. MEZGER | | Director, President and Chief Executive Officer (Principal Executive Officer) | | January 18, 201322, 2016 |
| Jeffrey T. Mezger | | | |
| | | |
/S/ JEFF J. KAMINSKI | | Executive Vice President and Chief Financial Officer (Principal Financial Officer) | | January 18, 201322, 2016 |
| Jeff J. Kaminski | | | |
| | | |
/S/ WILLIAM R. HOLLINGER | | Senior Vice President and Chief Accounting Officer (Principal Accounting Officer) | | January 18, 201322, 2016 |
| William R. Hollinger | | | |
| | | |
/S/ STEPHEN F. BOLLENBACH | | Chairman of the Board and Director | | January 18, 201322, 2016 |
| Stephen F. Bollenbach | | | |
| | |
/S/ BARBARA T. ALEXANDER
| | Director | | January 18, 2013 |
Barbara T. Alexander | | | |
| | | |
/S/ TIMOTHY W. FINCHEM | | Director | | January 18, 201322, 2016 |
| Timothy W. Finchem | | | |
| | | | | |
/S/ THOMAS W. GILLIGAN | | Director | | January 18, 201322, 2016 |
| Thomas W. Gilligan | | | |
| | | |
/S/ KENNETH M. JASTROW, II | | Director | | January 18, 201322, 2016 |
| Kenneth M. Jastrow, II | | | |
| | | |
/S/ ROBERT L. JOHNSON | | Director | | January 18, 201322, 2016 |
| Robert L. Johnson | | | |
| | | |
/S/ MELISSA LORA | | Director | | January 18, 201322, 2016 |
| Melissa Lora | | | |
| | | |
/S/ MICHAEL G. MCCAFFERY s/ ROBERT L. PATTON JR. | | Director | | January 18, 201322, 2016 |
Michael G. McCafferyRobert L. Patton Jr. | | | |
| | | | |
/S/ LUIS G. NOGALESMICHAEL M. WOOD | | Director | | January 18, 201322, 2016 |
Luis G. NogalesMichael M. Wood | | | |
LIST OF EXHIBITS FILED
|
| | | | |
Exhibit Number | | Description |
| Sequential Page Number |
| | | | | |
| 3.1 | | Restated Certificate of Incorporation, as amended, filed as an exhibit to our Current Report on Form 8-K dated April 7, 2009 (File No. 001-09195), is incorporated by reference herein. | | |
| | | | |
| 3.2 | | Amended and Restated By-Laws as amended and restated on April 5, 2007,of KB Home, filed as an exhibit to our QuarterlyCurrent Report on Form 10-Q for the quarter ended February 28, 20078-K dated July 18, 2014 (File No. 001-09195), is incorporated by reference herein. | | |
| | | | |
| 4.1 | | Rights Agreement between us and Mellon Investor Services LLC, as rights agent, dated January 22, 2009, filed as an exhibit to our Current Report on Form 8-K/A dated January 28, 2009 (File No. 001-09195), is incorporated by reference herein. | | |
| | | | |
| 4.2 | | Indenture and Supplemental Indenture relating to 5 3/4%our Senior Notes due 2014 among us, the Guarantors party thereto and Sun Trust Bank, Atlanta, each dated January 28, 2004, filed as exhibitsan exhibit to our Registration Statement No. 333-114761 on Form S-4, areis incorporated by reference herein. | | |
| | | | |
| 4.3 | | Third Supplemental Indenture relating to our Senior Notes by and between us, the Guarantors named therein, the Subsidiary Guarantor named therein and SunTrust Bank, dated as of May 1, 2006, filed as an exhibit to our Current Report on Form 8-K dated May 3, 2006 (File No. 001-09195), is incorporated by reference herein. | | |
| | | |
4.4 | | Fourth Supplemental Indenture relating to our Senior Notes by and between us, the Guarantors named therein and U.S. Bank National Association, dated as of November 9, 2006, filed as an exhibit to our Current Report on Form 8-K dated November 13, 2006 (File No. 001-09195), is incorporated by reference herein. | | |
| | | |
4.5 | | Fifth Supplemental Indenture, dated August 17, 2007, relating to our Senior Notes by and between us, the Guarantors named therein, and the Trustee, filed as an exhibit to our Current Report on Form 8-K dated August 22, 2007 (File No. 001-09195), is incorporated by reference herein. | | |
| | | | |
4.64.4 | | Sixth Supplemental Indenture, dated as of January 30, 2012, relating to our Senior Notes by and between us, the Guarantors named therein, and the Trustee, filed as an exhibit to our Current Report on Form 8-K dated February 2, 2012 (File No. 001-09195), is incorporated by reference herein. | | |
| | | | | |
4.74.5 | | Seventh Supplemental Indenture, dated as of January 11, 2013, relating to our Senior Notes by and among us, the Guarantors named therein, and the Trustee, filed as an exhibit to our Current Report on Form 8-K dated January 11, 2013 (File No. 001-09195), is incorporated by reference herein. | | |
| | | | |
4.8 | | Specimen of 5 3/4% Senior Notes due 2014, filed as an exhibit to our Registration Statement No. 333-114761 on Form S-4, is incorporated by reference herein. | | |
| | | |
4.9 | | Specimen of 5 7/8% Senior Notes due 2015, filed as an exhibit to our Current Report on Form 8-K dated December 15, 2004 (File No. 001-09195), is incorporated by reference herein. | | |
| | | | |
4.10 | | Form of officers’ certificates and guarantors’ certificates establishing the terms of the 5 7/8% Senior Notes due 2015, filed as an exhibit to our Current Report on Form 8-K dated December 15, 2004 (File No. 001-09195), is incorporated by reference herein. | | |
| | | |
4.114.6 | | Specimen of 6 1/4% Senior Notes due 2015, filed as an exhibit to our Current Report on Form 8-K dated June 2, 2005 (File No. 001-09195), is incorporated by reference herein. | | |
| | | | |
4.124.7 | | Form of officers’ certificates and guarantors’ certificates establishing the terms of the 6 1/4% Senior Notes due 2015, filed as an exhibit to our Current Report on Form 8-K dated June 2, 2005 (File No. 001-09195), is incorporated by reference herein. | | |
| | | | |
4.134.8 | | Specimen of 6 1/4% Senior Notes due 2015, filed as an exhibit to our Current Report on Form 8-K dated June 27, 2005 (File No. 001-09195), is incorporated by reference herein. |
| |
| | | | |
4.144.9 | | Form of officers’ certificates and guarantors’ certificates establishing the terms of the 6 1/4% Senior Notes due 2015, filed as an exhibit to our Current Report on Form 8-K dated June 27, 2005 (File No. 001-09195), is incorporated by reference herein. |
| |
| | | | |
4.154.10 | | Specimen of 7 1/4% Senior Notes due 2018, filed as an exhibit to our Current Report on Form 8-K dated April 3, 2006 (File No. 001-09195), is incorporated by reference herein. |
| |
| | | | |
|
| | | | |
Exhibit
Number
| | Description |
| Sequential
Page
Number
|
4.164.11 | | Form of officers’ certificates and guarantors’ certificates establishing the terms of the 7 1/4% Senior Notes due 2018, filed as an exhibit to our Current Report on Form 8-K dated April 3, 2006 (File No. 001-09195), is incorporated by reference herein. |
| |
| | | | |
4.174.12 | | Specimen of 9.100% Senior Notes due 2017, filed as an exhibit to our Current Report on Form 8-K dated July 30, 2009 (File No. 001-09195), is incorporated by reference herein. |
| |
| | | | |
4.184.13 | | Form of officers’ certificates and guarantors’ certificates establishing the terms of the 9.100% Senior Notes due 2017, filed as an exhibit to our Current Report on Form 8-K dated July 30, 2009 (File No. 001-09195), is incorporated by reference herein. | | |
| | | | | |
4.194.14 | | Specimen of 8.00% Senior Notes due 2020, filed as an exhibit to our Current Report on Form 8-K dated February 7, 2012 (File No. 001-09195), is incorporated by reference herein. | | |
| | | | | |
4.204.15 | | Form of officers’ certificates and guarantors’ certificates establishing the terms of the 8.00% Senior Notes due 2020, filed as an exhibit to our Current Report on Form 8-K dated February 7, 2012 (File No. 001-09195), is incorporated by reference herein. | | |
| | | | | |
4.214.16 | | Specimen of 7.50% Senior Notes due 2022, filed as an exhibit to our Current Report on Form 8-K dated July 31, 2012 (File No. 001-09195), is incorporated by reference herein. | | |
| | | | | |
4.22 |
| | | | |
Exhibit Number | | Description | | Sequential Page Number |
| | | | |
| 4.17 | | Form of officers’ certificates and guarantors’ certificates establishing the terms of the 7.50% Senior Notes due 2022, filed as an exhibit to our Current Report on Form 8-K dated July 31, 2012 (File No. 001-09195), is incorporated by reference herein. | | |
| | | | |
| 4.18 | | Form of officers’ certificate and guarantors’ officers’ certificates establishing the form and terms of the 1.375% Convertible Senior Notes due 2019, filed as an exhibit to our Current Report on Form 8-K dated January 29, 2013 (File No. 001-09195), is incorporated by reference herein. | | |
| | | | |
| 4.19 | | Form of 1.375% Convertible Senior Notes due 2019, filed as an exhibit to our Current Report on Form 8-K dated January 29, 2013 (File No. 001-09195), is incorporated by reference herein. | | |
| | | | |
| 4.20 | | Form of supplemental officers’ certificate and guarantors’ officers’ certificates establishing the form and terms of the 1.375% Convertible Senior Notes due 2019, filed as an exhibit to our Quarterly Report on Form 10-Q for the quarter ended February 28, 2013 (File No. 001-09195), is incorporated by reference herein. | | |
| | | | |
| 4.21 | | Eighth Supplemental Indenture, dated as of March 12, 2013, by and among us, the Guarantors party thereto, the Additional Guarantors named therein and U.S. Bank National Association, as Trustee, filed as an exhibit to our Quarterly Report on Form 10-Q for the quarter ended May 31, 2013 (File No. 001-09195), is incorporated by reference herein. | | |
| | | | |
| 4.22 | | Specimen of 7.00% Senior Notes due 2021, filed as an exhibit to our Current Report on Form 8-K dated October 29, 2013 (File No. 001-09195), is incorporated by reference herein. | | |
| | | | |
| 4.23 | | Form of officers’ certificates and guarantors’ certificates establishing the terms of the 7.00% Senior Notes due 2021, filed as an exhibit to our Current Report on Form 8-K dated October 29, 2013 (File No. 001-09195), is incorporated by reference herein. | | |
| | | | |
| 4.24 | | Ninth Supplemental Indenture, dated as of February 28, 2014, by and among us, the Guarantors party thereto, the Additional Guarantors named therein and U.S. Bank National Association, as Trustee, filed as an exhibit to our Post-Effective Amendment No. 4 to Form S-3 Registration Statement (No. 333-176930), is incorporated by reference herein. | | |
| | | | |
| 4.25 | | Specimen of 4.75% Senior Notes due 2019, filed as an exhibit to our Current Report on Form 8-K dated March 25, 2014 (File No. 001-09195), is incorporated by reference herein. | | |
| | | | |
| 4.26 | | Form of officers’ certificates and guarantors’ certificates establishing the terms of the 4.75% Senior Notes due 2019, filed as an exhibit to our Current Report on Form 8-K dated March 25, 2014 (File No. 001-09195), is incorporated by reference herein. | | |
| | | | |
| 4.27 | | Form of 7.625% Senior Notes due 2023, filed as an exhibit to our Current Report on Form 8-K dated February 17, 2015 (File No. 001-09195), is incorporated by reference herein. | | |
| | | | |
| 4.28 | | Form of officers’ certificates and guarantors’ certificates establishing the terms of the 7.625% Senior Notes due 2023, filed as an exhibit to our Current Report on Form 8-K dated February 17, 2015 (File No. 001-09195), is incorporated by reference herein. | | |
| | | | | |
| 10.1* | | Kaufman and Broad, Inc. Executive Deferred Compensation Plan, effective as of July 11, 1985, filed as an exhibit to our 2007 Annual Report on Form 10-K (File No. 001-09195), is incorporated by reference herein. |
| |
| | | | |
| 10.2* | | Amendment to Kaufman and Broad, Inc. Executive Deferred Compensation Plan for amounts earned or vested on or after January 1, 2005, effective January 1, 2009, filed as an exhibit to our 2008 Annual Report on Form 10-K (File No. 001-09195), is incorporated by reference herein. |
| |
| | | | |
| 10.3* | | KB Home 1988 Employee Stock Plan, as amended and restated on October 2, 2008, filed as an exhibit to our 2008 Annual Report on Form 10-K (File No. 001-09195), is incorporated by reference herein. |
| |
| | | | |
| 10.4* | | Kaufman and Broad Home Corporation Directors’ Deferred Compensation Plan established effective as of July 27, 1989, filed as an exhibit to our 2007 Annual Report on Form 10-K (File No. 001-09195), is incorporated by reference herein. |
| |
| | | |
10.5* | | KB Home Performance-Based Incentive Plan for Senior Management, as amended and restated on October 2, 2008, filed as an exhibit to our 2008 Annual Report on Form 10-K (File No. 001-09195), is incorporated by reference herein. |
| |
| | | | |
10.6*10.5* | | Form of Stock Option Agreement under KB Home Performance-Based Incentive Plan for Senior Management, filed as an exhibit to our 1995 Annual Report on Form 10-K (File No. 001-09195), is incorporated by reference herein. |
| |
| | | | |
10.7* |
| | | | |
Exhibit Number | | KB Home 1998 Stock Incentive Plan, as amended and restated on October 2, 2008, filed as an exhibit to our 2008 Annual Report on Form 10-K (File No. 001-09195), is incorporated by reference herein. |
Description | | Sequential Page Number |
| | | | | |
10.810.6 | | KB Home Directors’ Legacy Program, as amended January 1, 1999, filed as an exhibit to our 1998 Annual Report on Form 10-K (File No. 001-09195), is incorporated by reference herein. |
| |
| | | | |
10.910.7 | | Trust Agreement between Kaufman and Broad Home Corporation and Wachovia Bank, N.A. as Trustee, dated as of August 27, 1999, filed as an exhibit to our 1999 Annual Report on Form 10-K (File No. 001-09195), is incorporated by reference herein. |
| |
| | | | | |
10.10*10.8* | | Amended and Restated KB Home 1999 Incentive Plan, as amended and restated on October 2, 2008, filed as an exhibit to our 2008 Annual Report on Form 10-K (File No. 001-09195), is incorporated by reference herein. |
| |
| | | | |
10.11*10.9* | | Form of Non-Qualified Stock Option Agreement under our Amended and Restated 1999 Incentive Plan, filed as an exhibit to our 2011 Annual Report on Form 10-K (File No. 001-09195), is incorporated by reference herein. |
| |
| | | |
|
| | | | |
Exhibit
Number
| | Description |
| Sequential
Page
Number
|
10.12* | | Form of Restricted Stock Agreement under our Amended and Restated 1999 Incentive Plan, filed as an exhibit to our 2011 Annual Report on Form 10-K (File No. 001-09195), is incorporated by reference herein. |
| |
| | | | |
10.13*10.10* | | KB Home 2001 Stock Incentive Plan, as amended and restated on October 2, 2008, filed as an exhibit to our 2008 Annual Report on Form 10-K (File No. 001-09195), is incorporated by reference herein. |
| |
| | | | |
10.14*10.11* | | Form of Stock Option Agreement under our 2001 Stock Incentive Plan, filed as an exhibit to our 2011 Annual Report on Form 10-K (File No. 001-09195), is incorporated by reference herein. |
| |
| | | | |
10.15* | | Form of Stock Restriction Agreement under our 2001 Stock Incentive Plan, filed as an exhibit to our 2011 Annual Report on Form 10-K (File No. 001-09195), is incorporated by reference herein. |
| |
| | | |
10.16*10.12* | | KB Home Nonqualified Deferred Compensation Plan with respect to deferrals prior to January 1, 2005, effective March 1, 2001, filed as an exhibit to our 2001 Annual Report on Form 10-K (File No. 001-09195), is incorporated by reference herein. |
| |
| | | | |
10.17*10.13* | | KB Home Nonqualified Deferred Compensation Plan with respect to deferrals on and after January 1, 2005, effective January 1, 2009 (File No. 001-09195), filed as an exhibit to our 2008 Annual Report on Form 10-K, is incorporated by reference herein. |
| |
| | | | |
10.18*10.14* | | KB Home Change in Control Severance Plan, as amended and restated effective January 1, 2009, filed as an exhibit to our 2008 Annual Report on Form 10-K (File No. 001-09195), is incorporated by reference herein. |
| |
| | | | |
10.19*10.15* | | KB Home Death Benefit Only Plan, filed as an exhibit to our 2001 Annual Report on Form 10-K (File No. 001-09195), is incorporated by reference herein. |
| |
| | | | |
10.20*10.16* | | Amendment No. 1 to the KB Home Death Benefit Only Plan, effective as of January 1, 2009, filed as an exhibit to our 2008 Annual Report on Form 10-K (File No. 001-09195), is incorporated by reference herein. |
| |
| | | | |
10.21*10.17* | | KB Home Retirement Plan, as amended and restated effective January 1, 2009, filed as an exhibit to our 2008 Annual Report on Form 10-K (File No. 001-09195), is incorporated by reference herein. |
| |
| | | | |
10.22*10.18* | | Employment Agreement of Jeffrey T. Mezger, dated February 28, 2007, filed as an exhibit to our Current Report on Form 8-K dated March 6, 2007 (File No. 001-09195), is incorporated by reference herein. |
| |
| | | | |
10.23*10.19* | | Amendment to the Employment Agreement of Jeffrey T. Mezger, dated December 24, 2008, filed as an exhibit to our 2008 Annual Report on Form 10-K (File No. 001-09195), is incorporated by reference herein. |
| |
| | | | |
10.24*10.20* | | Form of Stock Option Agreement under the Employment Agreement between us and Jeffrey T. Mezger dated as of February 28, 2007, filed as an exhibit to our Current Report on Form 8-K dated July 18, 2007 (File No. 001-09195), is incorporated by reference herein. |
| |
| | | | |
10.25*10.21* | | Form of Stock Option Agreement under the Amended and Restated 1999 Incentive Plan for stock option grant to Jeffrey T. Mezger, filed as an exhibit to our Quarterly Report on Form 10-Q for the quarter ended August 31, 2007 (File No. 001-09195), is incorporated by reference herein. |
| |
| | | | |
10.26*10.22* | | Policy Regarding Stockholder Approval of Certain Severance Payments, adopted July 10, 2008, filed as an exhibit to our Current Report on Form 8-K dated July 15, 2008 (File No. 001-09195), is incorporated by reference herein. |
| |
| | | | |
10.27*10.23* | | KB Home Executive Severance Plan, filed as an exhibit to our Quarterly Report on Form 10-Q for the quarter ended August 31, 2008 (File No. 001-09195), is incorporated by reference herein. |
| |
| | | | |
10.28* |
| | | | |
Exhibit Number | | Form of Fiscal Year 2009 Phantom Shares Agreement, filed as an exhibit to our Current Report on Form 8-K dated October 8, 2008 (File No. 001-09195), is incorporated by reference herein. |
Description | | Sequential Page Number |
| | | | | |
10.29* | | KB Home Annual Incentive Plan for Executive Officers, filed as Attachment C to our Proxy Statement on Schedule 14A for the 2009 Annual Meeting of Stockholders (File No. 001-09195), is incorporated by reference herein. |
| |
| | | |
10.3010.24 | | Amendment to Trust Agreement by and between KB Home and Wachovia Bank, N.A., dated August 24, 2009, filed as an exhibit to our Quarterly Report on Form 10-Q for the quarter ended August 31, 2009 (File No. 001-09195), is incorporated by reference herein. |
| |
| | | |
|
| | | | |
Exhibit
Number
| | Description |
| Sequential
Page
Number
|
10.31 | | Amended and Restated KB Home Non-Employee Directors Compensation Plan, effective as of July 9, 2009, filed as an exhibit to our 2009 Annual Report on Form 10-K (File No. 001-09195), is incorporated by reference herein. |
| |
| | | | |
10.3210.25 | | Form of Indemnification Agreement, filed as an exhibit to our Current Report on Form 8-K dated April 2, 2010 (File No. 001-09195), is incorporated by reference herein. |
| |
| | | | |
10.33*10.26* | | KB Home 2010 Equity Incentive Plan, filed as an exhibit to our Quarterly Report on Form 10-Q for the quarter ended February 28, 2010 (File No. 001-09195), is incorporated by reference herein. |
| |
| | | | |
10.34*10.27* | | Form of Stock Option Award Agreement under the KB Home 2010 Equity Incentive Plan, filed as an exhibit to our Current Report on Form 8-K dated July 20, 2010 (File No. 001-09195), is incorporated by reference herein. |
| |
| | | | |
10.35*10.28* | | Form of Restricted Stock Award Agreement under the KB Home 2010 Equity Incentive Plan, filed as an exhibit to our Current Report on Form 8-K dated July 20, 2010 (File No. 001-09195), is incorporated by reference herein. |
| |
| | | | |
10.36* | | Form of Fiscal Year 2011 Restricted Cash Award Agreement, filed as an exhibit to our Current Report on Form 8-K dated October 13, 2010 (File No. 001-09195), is incorporated by reference herein. |
| |
| | | |
10.37*10.29* | | KB Home 2010 Equity Incentive Plan Stock Option Agreement for performance stock option grant to Jeffrey T. Mezger, filed as an exhibit to our 2010 Annual Report on Form 10-K (File No. 001-09195), is incorporated by reference herein. |
| |
| | | | |
10.38*10.30* | | Amendment to the KB Home 2010 Equity Incentive Plan, filed as an exhibit to our Quarterly Report on Form 10-Q for the quarter ended February 28, 2011 (File No. 001-09195), is incorporated by reference herein. |
| |
| | | | |
10.39*10.31* | | Executive Severance Benefit Decisions, filed as an exhibit to our Quarterly Report on Form 10-Q for the quarter ended February 28, 2011 (File No. 001-09195), is incorporated by reference herein. |
| |
| | | | |
10.4010.32 | | Consensual agreement effective June 10, 2011, filed as an exhibit to our Quarterly Report on Form 10-Q for the quarter ended August 31, 2011 (File No. 001-09195), is incorporated by reference herein. |
| |
| | | | |
10.41* | | Form of 2010 Equity Incentive Plan Performance Cash Award Agreement, filed as an exhibit to our Current Report on Form 8-K dated October 12, 2011 (File No. 001-09195), is incorporated by reference herein. |
| |
| | | |
10.42*10.33* | | KB Home 2010 Equity Incentive Plan Stock Option Agreement for performance stock option grant to Jeffrey T. Mezger, filed as an exhibit to our 2011 Annual Report on Form 10-K (File No. 001-09195), is incorporated by reference herein. |
| |
| | | | | |
10.43*†10.34* | | Form of KB Home 2010 Equity Incentive Plan Performance-Based Restricted Stock Unit Award Agreement.Agreement, filed as an exhibit to our 2012 Annual Report on Form 10-K (File No. 001-09195), is incorporated by reference herein. | | |
| | | | | |
10.44*†10.35* | | KB Home 2010 Equity Incentive Plan Performance-Based Restricted Stock Unit Award Agreement for performance-based restricted stock unit award to Jeffrey T. Mezger.Mezger, filed as an exhibit to our 2012 Annual Report on Form 10-K (File No. 001-09195), is incorporated by reference herein. | | |
| | | | |
10.45*†10.36* | | Form of KB Home 2010 Equity Incentive Plan Restricted Stock Unit Award Agreement.Agreement, filed as an exhibit to our 2012 Annual Report on Form 10-K (File No. 001-09195), is incorporated by reference herein. | | |
| | | | |
| 10.37* | | KB Home 2014 Equity Incentive Plan, filed as an exhibit to our Quarterly Report on Form 10-Q for the quarter ended February 28, 2014 (File No. 001-09195), is incorporated by reference herein. | | |
| | | | |
| 10.38* | | Amendment to Amended and Restated KB Home 1999 Incentive Plan Non-Qualified Stock Option Agreement, effective July 17, 2014, filed as an exhibit to our Quarterly Report on Form 10-Q for the quarter ended August 31, 2014 (File No. 001-09195), is incorporated by reference herein. | | |
| | | | |
| 10.39* | | Amendment to KB Home 2001 Stock Incentive Plan Stock Option Agreement, effective July 17, 2014, filed as an exhibit to our Quarterly Report on Form 10-Q for the quarter ended August 31, 2014 (File No. 001-09195), is incorporated by reference herein. | | |
| | | | |
| 10.40* | | Amendment to KB Home Performance Based Incentive Plan for Senior Management Stock Option Agreement, effective July 17, 2014, filed as an exhibit to our Quarterly Report on Form 10-Q for the quarter ended August 31, 2014 (File No. 001-09195), is incorporated by reference herein. | | |
| | | | |
| 10.41* | | Form of Stock Option Agreement under the KB Home 2014 Equity Incentive Plan, filed as an exhibit to our Current Report on Form 8-K dated October 14, 2014 (File No. 001-09195), is incorporated by reference herein. | | |
| | | | |
|
| | | | |
Exhibit Number | | Description | | Sequential Page Number |
| | | | |
| 10.42* | | Form of Performance-Based Restricted Stock Unit Award Agreement under the KB Home 2014 Equity Incentive Plan, filed as an exhibit to our Current Report on Form 8-K dated October 14, 2014 (File No. 001-09195), is incorporated by reference herein. | | |
| | | | |
| 10.43* | | Form of Performance Cash Award Agreement under the KB Home 2014 Equity Incentive Plan, filed as an exhibit to our Current Report on Form 8-K dated October 14, 2014 (File No. 001-09195), is incorporated by reference herein. | | |
| | | | |
| 10.44* | | Form of Restricted Cash Award Agreement under the KB Home 2014 Equity Incentive Plan, filed as an exhibit to our Current Report on Form 8-K dated October 14, 2014 (File No. 001-09195), is incorporated by reference herein. | | |
| | | | |
| 10.45 | | Fourth Amended and Restated KB Home Non-Employee Directors Compensation Plan, effective as of October 9, 2014, filed as an exhibit to our 2014 Annual Report on Form 10-K (File No. 001-09195), is incorporated by reference herein. | | |
| | | | |
| 10.46 | | Amended and Restated Revolving Loan Agreement, dated as of August 7, 2015, among us, the banks party thereto, and Citibank, N.A., as Administrative Agent, filed as an exhibit to our Quarterly Report on Form 10-Q for the quarter ended August 31, 2015 (File No. 001-09195), is incorporated by reference herein. | | |
| | | | |
| 10.47*† | | Form of Restricted Stock Agreement under the KB Home 2014 Equity Incentive Plan. | | |
| | | | | |
| 12.1† | | Computation of Ratio of Earnings to Fixed Charges. |
| |
| | | | |
| 21† | | Subsidiaries of the Registrant. |
| |
| | | | |
| 23† | | Consent of Independent Registered Public Accounting Firm. |
| |
| | | | |
| 31.1† | | Certification of Jeffrey T. Mezger, President and Chief Executive Officer of KB Home Pursuant to Section 302 of the Sarbanes-Oxley Act of 2002. |
| |
| | | | |
| 31.2† | | Certification of Jeff J. Kaminski, Executive Vice President and Chief Financial Officer of KB Home Pursuant to Section 302 of the Sarbanes-Oxley Act of 2002. |
| |
| | | | | |
| 32.1† | | Certification of Jeffrey T. Mezger, President and Chief Executive Officer of KB Home Pursuant to 18 U.S.C. Section 1350, as Adopted Pursuant to Section 906 of the Sarbanes-Oxley Act of 2002. |
| |
| | | | |
| 32.2† | | Certification of Jeff J. Kaminski, Executive Vice President and Chief Financial Officer of KB Home Pursuant to 18 U.S.C. Section 1350, as Adopted Pursuant to Section 906 of the Sarbanes-Oxley Act of 2002. |
| |
| | | | |
|
| | | | |
Exhibit
Number
| | Description |
| Sequential
Page
Number
|
| 101† | | The following materials from KB Home’s Annual Report on Form 10-K for the year ended November 30, 2012,2015, formatted in eXtensible Business Reporting Language (XBRL): (i)(a) Consolidated Statements of Operations for the years ended November 30, 2012, 20112015, 2014 and 2010, (ii)2013, (b) Consolidated Statements of Comprehensive Income for the Years Ended November 30, 2015, 2014 and 2013, (c) Consolidated Balance Sheets as of November 30, 20122015 and 2011, (iii)2014, (d) Consolidated Statements of Stockholders’ Equity for the years ended November 30, 2012, 20112015, 2014 and 2010, (iv)2013, (e) Consolidated Statements of Cash Flows for the years ended November 30, 2012, 20112015, 2014 and 2010,2013, and (v)(f) the Notes to Consolidated Financial Statements. |
| |
* Management contract or compensatory plan or arrangement in which executive officers are eligible to participate.
† Document filed with this Form 10-K.