| Location | Approximate Square Footage | Use | |||||||
| North America: | |||||||||
345 Park Avenue San Jose, CA 95110, USA | 378,000 | Research, product development, sales and marketing, and administration | |||||||
321 Park Avenue San Jose, CA 95110, USA | 321,000 | Research, product development, sales and marketing | |||||||
151 Almaden Boulevard San Jose, CA 95110, USA | 267,000 | Product development, sales and administration | |||||||
601 and 625 Townsend Street San Francisco, CA 94103, USA | 272,000 | (1) | Research, product development, sales, marketing and administration | ||||||
801 N. 34th Street-Waterfront Seattle, WA 98103, USA | 182,000 | (2) | Product development, sales, technical support and administration | ||||||
550 East Timpanagos Circle Orem, UT 84097, USA | 148,000 | Research, product development, sales, marketing and administration | |||||||
10182 Telesis Court San Diego, CA 92121, USA | 61,000 | (3) | Product development, sales and marketing | ||||||
21 Hickory Drive Waltham, MA 02451, USA | 108,000 | (4) | Research, product development, sales and marketing | ||||||
250 Brannan Street San Francisco, CA 94107, USA | 35,000 | Product development, sales and marketing | |||||||
7930 Jones Branch Drive McLean, VA 22102, USA | 34,000 | Sales and marketing | |||||||
1540 Broadway New York, NY 10036, USA | 27,000 | Sales and marketing | |||||||
343 Preston Street Ottawa, Ontario K1S 5N4, Canada | 122,000 | Research, product development, sales, marketing and administration | |||||||
| India: | |||||||||
Adobe Towers, 1-1A, Sector 25A Noida, U.P. | 191,000 | Product development | |||||||
| Adobe Towers, Plot #6, Sector 127 Expressway, Noida, U.P. | 65,000 | Product development | |||||||
Salapuria Infinity, 3rd Floor #5, Bannerghatta Road Bangalore | 126,000 | Research and product development | |||||||
rates.
| Location | Approximate Square Footage | Use | ||||
| North America: | ||||||
| 345 Park Avenue San Jose, CA 95110, USA | 378,000 | Research, product development, sales, marketing and administration | ||||
| 321 Park Avenue San Jose, CA 95110, USA | 321,000 | Research, product development, sales, marketing and administration | ||||
| 151 Almaden Boulevard San Jose, CA 95110, USA | 267,000 | Product development, sales and administration | ||||
| 601 and 625 Townsend Street San Francisco, CA 94103, USA | 346,000 | Research, product development, sales, marketing and administration | ||||
| 801 N. 34th Street-Waterfront Seattle, WA 98103, USA | 182,000 | (2) | Product development, sales, technical support and administration | |||
410 Townsend Street | 47,000 | Research, product development, sales, marketing and administration | ||||
| 3900 Adobe Way Lehi, UT 84043, USA | 281,000 | (3) | Research, product development, sales, marketing and administration | |||
21 Hickory Drive Waltham, MA 02451, USA | 108,000 | (4) | Research, product development, sales and marketing | |||
29
| Location | Approximate Square Footage | Use | ||||
McLean, VA 22102, USA
(5)
| Sales and marketing | ||||||||||
| 1540 Broadway New York, NY 10036, USA | 37,000 | Sales and marketing | ||||||||
| 343 Preston Street Ottawa, Ontario K1S 5N4, Canada | 122,000 | (6) | Research, product development, sales, marketing and administration | |||||||
| India: | ||||||||||
| Adobe Towers, 1-1A, Sector 25A Noida, U.P. | 191,000 | Product development and administration | ||||||||
Adobe Towers, Plot #6, Sector 127 Expressway, Noida, U.P. | 80,000 | Product development and administration | ||||||||
Salapuria Infinity, Ground Floor, 1st Floor, 3rd Floor #5, Bannerghatta Road, Bangalore | 160,000 | Research and product development | ||||||||
| Japan: | ||||||||||
Gate City Osaki East Tower 1-11 Osaki Shinagawa-ku, Tokyo | 56,000 | Product development, sales and marketing | ||||||||
| China: | ||||||||||
Block A, SP Tower, 11th, 19th, 21st & 22nd Floors Block B, SP Tower, 19th Floor Block D, SP Tower, 10th Floor Tsinghua Science Park, Yard 1 Zhongguancun Donglu, Haidian District Beijing | 94,000 | |||||||||
| Research and product development | ||||||||||
| Romania: | ||||||||||
26 Z Timisoara Blvd, Anchor Plaza Lujerului, Sector 6 Bucharest | 71,000 | Research and product development | ||||||||
| UK: | ||||||||||
| 49,000 | Product development, sales, marketing and administration | |||||||||
| Germany: | ||||||||||
| Grosse Elbstrasse 27 Hamburg | 36,000 | Research and product development | ||||||||
_________________________________________
(1) | The total square footage is 346,000, of which we occupy 272,000 square feet, or approximately 79% of this facility; 74,000 square feet is unoccupied basement space. |
(2) | The total square footage is 182,000, of which we occupy 162,000 square feet, or approximately 89% of this facility. The remaining square footage is subleased. |
(3) | The total square footage is |
(4) | In May 2013, management approved a plan to sell the land, building and other assets located in Waltham, Massachusetts. We finalized its sale in September 2013. See Note 6 of our Notes to Consolidated Financial Statements for further information regarding the sale of the Waltham property. |
(5) | The total square footage is 34,000, of which we occupy 31,000 square feet, or approximately 91% of this facility. The remaining square footage is subleased. |
30
(6) | The total square footage is 122,000, of |
In general, all facilities are in good condition, suitable for the conduct of our business and are operating at an average capacity of approximately 82%87%.
In connection with disputes relating to the validity or alleged infringement of third-party intellectual property rights, including patent rights, we have been, are currently and may in the future be subject to claims, negotiations or complex, protracted litigation. Intellectual property disputes and litigation may be very costly and can be disruptive to our business operations by diverting the attention and energies of management and key technical personnel. Although we have successfully defended or resolved past litigation and disputes, we may not prevail in any ongoing or future litigation and disputes. Third-party intellectual property disputes could subject us to significant liabilities, require us to enter into royalty and licensing arrangements on unfavorable terms, prevent us from licensing certain of our products or offering certain of our services, subject us to injunctions restricting our sale of products or services, cause severe disruptions to our operations or the markets in which we compete, or require us to satisfy indemnification commitments with our customers including contractual provisions under various license arrangements and service agreements.
Between September 23, 2009May 4, 2011 and September 25, 2009, threeJuly 14, 2011, five putative class action lawsuits were filed in the Fourth Judicial DistrictSanta Clara Superior Court for Utah County, Provo Department, State of Utah, seeking to enjoin Adobe’s acquisition of Omniture, Inc. and to recover damagesAlameda Superior Court in California. On September 12, 2011, the event the transaction were to close. The cases were captioned Miner v. Omniture, Inc., et. al.consolidated into In Re High-Tech Employee Antitrust Litigation (“Miner”HTEAL”), Barrell v. Omniture, Inc. et. al., (“Barrell”), and Lodhia v. Omniture, Inc. et al., (“Lodhia”). At a hearing on October 20, 2009, the court consolidated the Miner, Barrell, and Lodhia cases into a single case under the Lodhia caption and denied the plaintiffs’ motion to preliminarily enjoin the closing of the transaction. On December 30, 2 009, the plaintiffs served the defendants with a consolidated amended complaint for damages arising out of the closing of the transaction. In the consolidated amended complaint, plaintiffs alleged that the members of Omniture’s board of directors breached their fiduciary duties to Omniture’s stockholders by failing to seek the highest possible price for Omniture and that both Adobe and Omniture induced or aided and abetted in the alleged breach. The plaintiffs also alleged that the Schedule 14D-9 Solicitation/Recommendation Statement filed by Omniture on September 24, 2009 in connection with the transaction contained inadequate disclosures and was materially misleading. Plaintiffs sought unspecified damages on behalf of the former public stockholders of Omniture. On March 8, 2010, Adobe and the other defendants moved to dismiss the complaint for failure to state a claim. The court heard oral argument on the motion in November 2010 and the court granted the defendants’ motion to dismiss the complaint with prejudice.
The trial is currently scheduled to be held in May 2014.
In connection with our anti-piracy efforts, conducted both internallyaddition to intellectual property disputes and through organizations such as the Business Software Alliance, from time to timeother litigation matters described above, we undertake litigation against alleged copyright infringers. Such lawsuits may lead to counter-claims alleging improper use of litigation or violation of other local laws. We believe we have valid defenses with respect to such counter-claims; however, it is possible that our consolidated financial position, cash flows or results of operations could be affected in any particular period by the resolution of one or more of these counter-claims.
We make a provision for a liability when it is both probable that a liability has been incurred and the amount of the loss can be reasonably estimated. These provisions are reviewed at least quarterly and adjusted to reflect the impacts of negotiations, settlements, rulings, advice of legal counsel and other information and events pertaining to a particular case. Unless otherwise specifically disclosed here or in our Notes to Consolidated Financial Statements , we have determined that no provision for liability nor disclosure is required related to any claim against us because: (a) there is not a reasonable possibility that a loss exceeding amounts already recognized (if any) may be incurred with respect to such claim; (b) a reasonably possible loss or range of loss cannot be estimated; or (c) such estimate is immaterial.
All legal costs associated with litigation are expensed as incurred. Litigation is inherently unpredictable. However, we believe that we have valid defenses with respect to the legal matters pending agains t Adobe.against us. It is possible, nevertheless, that our consolidated financial position, cash flows or results of operations could be negatively affected by an unfavorable resolution of one or more of such proceedings, claims or investigations.
In connection with our anti-piracy efforts, conducted both internally and through organizations such as the Business Software Alliance, from time to time we undertake litigation against alleged copyright infringers. Such lawsuits may lead to counter-claims alleging improper use of litigation or violation of other laws. We believe we have valid defenses with respect to such counter-claims; however, it is possible that our consolidated financial position, cash flows or results of operations could be affected in any particular period by the resolution of one or more of these counter-claims.
31
ITEM 4. (REMOVED AND RESERVED)MINE SAFETY DISCLOSURES
Not applicable.
PART II
Market Information for Common Stock
Our common stock is traded on the NASDAQ Global Select Market under the symbol “ADBE.” The following table sets forth the high and low sales price per share of our common stock for the periods indicated.
| Price Range | ||||||||||||||||
| High | Low | |||||||||||||||
| Fiscal 2010: | ||||||||||||||||
| Price Range | ||||||||||||||||
| High | Low | |||||||||||||||
| Fiscal 2013: | ||||||||||||||||
| First Quarter | $ | 37.86 | $ | 31.45 | $ | 39.83 | $ | 34.70 | ||||||||
| Second Quarter | $ | 36.51 | $ | 30.94 | $ | 47.01 | $ | 40.46 | ||||||||
| Third Quarter | $ | 33.52 | $ | 26.34 | $ | 48.39 | $ | 42.72 | ||||||||
| Fourth Quarter | $ | 33.11 | $ | 25.60 | $ | 57.55 | $ | 45.88 | ||||||||
| Fiscal Year | $ | 37.86 | $ | 25.60 | $ | 57.55 | $ | 34.70 | ||||||||
| Fiscal 2009: | ||||||||||||||||
| Fiscal 2012: | ||||||||||||||||
| First Quarter | $ | 24.29 | $ | 16.70 | $ | 33.73 | $ | 26.46 | ||||||||
| Second Quarter | $ | 28.18 | $ | 15.98 | $ | 34.70 | $ | 29.82 | ||||||||
| Third Quarter | $ | 33.43 | $ | 26.34 | $ | 33.92 | $ | 30.02 | ||||||||
| Fourth Quarter | $ | 36.90 | $ | 31.00 | $ | 34.61 | $ | 31.44 | ||||||||
| Fiscal Year | $ | 36.90 | $ | 15.98 | $ | 34.70 | $ | 26.46 | ||||||||
Stockholders
According to the records of our transfer agent, there were 1,6241,367 holders of record of our common stock on January 21, 2011.17, 2014. Because many of such shares are held by brokers and other institutions on behalf of stockholders, we are unable to estimate the total number of stockholders represented by these record holders.
Dividends
We did not declare or pay any cash dividends on our common stock during fiscal 20102013 or fiscal 2009.2012. Under the terms of our credit agreement and lease agreements, we are not prohibited from paying cash dividends unless payment would trigger an event of default or one currently exists. We do not anticipate paying any cash dividends in the foreseeable future.
Issuer Purchases of Equity Securities
Below is a summary of stock repurchases for the three months ended December 3, 2010. November 29, 2013. See Note 1413 of our Notes to Consolidated Financial Statements for information regarding our stock repurchase programs.
Period | Shares Repurchased | Average Price Per Share | Total Number of Shares Purchased as Part of Publicly Announced Plans | Approximate Dollar Value that May Yet be Purchased Under the Plan(1) | |||||||||||
(in thousands, except average price per share) | |||||||||||||||
| Beginning repurchase authority | 1,334,265 | ||||||||||||||
| August 31—September 27, 2013 | |||||||||||||||
| Shares repurchased | 2,826 | $ | 47.50 | 2,826 | $ | (134,265 | ) | ||||||||
| September 28—October 25, 2013 | |||||||||||||||
| Shares repurchased | 2,589 | $ | 51.51 | 2,589 | $ | (133,333 | ) | ||||||||
| October 26—November 29, 2013 | |||||||||||||||
| Shares repurchased | 2,513 | $ | 54.71 | 2,513 | $ | (137,456 | ) | (2) | |||||||
| Total | 7,928 | 7,928 | $ | 929,211 | |||||||||||
_________________________________________
Period | Shares Repurchased | Average Price Per Share | Total Number of Shares Purchased as Part of Publicly Announced Plans | Approximate Dollar Value that May Yet be Purchased Under the Plan(1) | ||||||||||||||
| (in thousands, except average price per share) | ||||||||||||||||||
Beginning repurchase authority | $ | 1,332,869 | ||||||||||||||||
| September 4—October 1, 2010 | ||||||||||||||||||
Shares repurchased | 4,734 | $ | 28.06 | 4,734 | $ | (132,869 | ) | |||||||||||
| October 2—October 29, 2010 | ||||||||||||||||||
Shares repurchased | 7,398 | $ | 27.04 | 7,398 | $ | (200,000 | ) | (2) | ||||||||||
| October 30—December 3, 2010 | ||||||||||||||||||
Shares repurchased | — | $ | — | — | $ | — | ||||||||||||
Total | 12,132 | 12,132 | $ | 1,000,000 | ||||||||||||||
(1) | We currently have authority granted by our Board of Directors |
(2) | In October |
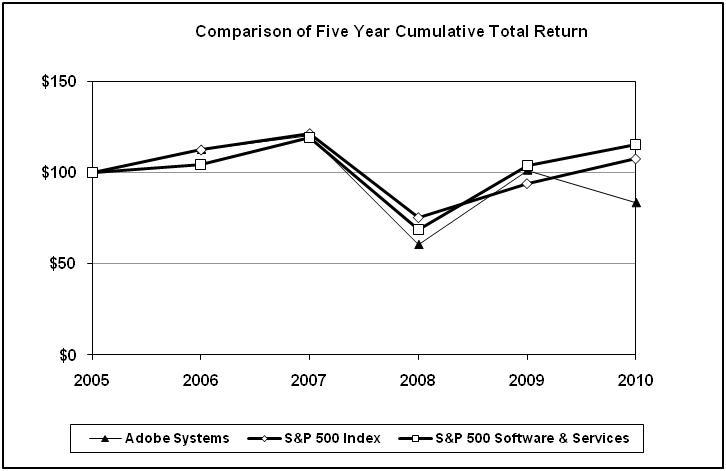
| 2005 | 2006 | 2007 | 2008 | 2009 | 2010 | |||||||||||||||||||
Adobe Systems | $ | 100.00 | $ | 112.53 | $ | 120.50 | $ | 60.28 | $ | 101.17 | $ | 83.33 | ||||||||||||
S&P 500 Index | $ | 100.00 | $ | 112.51 | $ | 121.53 | $ | 75.24 | $ | 93.97 | $ | 107.62 | ||||||||||||
| S&P 500 Software & Services Index | $ | 100.00 | $ | 104.44 | $ | 119.25 | $ | 68.41 | $ | 103.74 | $ | 115.44 |
The following selected consolidated financial data (presented in thousands, except per share amounts and employee data) is derived from our consolidated financial statements.Consolidated Financial Statements. As our operating results are not necessarily indicative of future operating results, this data should be read in conjunction with the consolidated financial statementsConsolidated Financial Statements and notes thereto, and with Item 7, Management’s Discussion and Analysis of Financial Condition and Results of Operations.
| Fiscal Years | Fiscal Years | |||||||||||||||||||||||||||||||||||||||
| 2010 | 2009(1) | 2008 | 2007 | 2006 | 2013 | 2012 | 2011 | 2010 | 2009 | |||||||||||||||||||||||||||||||
| Operations: | ||||||||||||||||||||||||||||||||||||||||
Revenue | $ | 3,800,000 | $ | 2,945,853 | $ | 3,579,889 | $ | 3,157,881 | $ | 2,575,300 | $ | 4,055,240 | $ | 4,403,677 | $ | 4,216,258 | $ | 3,800,000 | $ | 2,945,853 | ||||||||||||||||||||
Gross profit | $ | 3,396,498 | $ | 2,649,121 | $ | 3,217,259 | $ | 2,803,187 | $ | 2,282,843 | $ | 3,468,683 | $ | 3,919,895 | $ | 3,778,385 | $ | 3,396,498 | $ | 2,649,121 | ||||||||||||||||||||
Income before income taxes | $ | 943,151 | $ | 701,520 | $ | 1,078,508 | $ | 947,190 | $ | 679,727 | $ | 356,141 | $ | 1,118,794 | $ | 1,035,230 | $ | 943,151 | $ | 701,520 | ||||||||||||||||||||
Net income | $ | 774,680 | $ | 386,508 | $ | 871,814 | $ | 723,807 | $ | 505,809 | $ | 289,985 | $ | 832,775 | $ | 832,847 | $ | 774,680 | $ | 386,508 | ||||||||||||||||||||
| Net income per share: | ||||||||||||||||||||||||||||||||||||||||
Basic | $ | 1.49 | $ | 0.74 | $ | 1.62 | $ | 1.24 | $ | 0.85 | $ | 0.58 | $ | 1.68 | $ | 1.67 | $ | 1.49 | $ | 0.74 | ||||||||||||||||||||
Diluted | $ | 1.47 | $ | 0.73 | $ | 1.59 | $ | 1.21 | $ | 0.83 | $ | 0.56 | $ | 1.66 | $ | 1.65 | $ | 1.47 | $ | 0.73 | ||||||||||||||||||||
| Shares used to compute basic net income per share | 501,372 | 494,731 | 497,469 | 519,045 | 524,470 | |||||||||||||||||||||||||||||||||||
| Shares used to compute diluted net income per share | 513,476 | 502,721 | 503,921 | 525,824 | 530,610 | |||||||||||||||||||||||||||||||||||
Cash dividends declared per common share | $ | — | $ | — | $ | — | $ | — | $ | — | $ | — | $ | — | $ | — | $ | — | $ | — | ||||||||||||||||||||
Financial position:(2) | ||||||||||||||||||||||||||||||||||||||||
Financial position:(1) | ||||||||||||||||||||||||||||||||||||||||
Cash, cash equivalents and short-term investments | $ | 2,468,015 | $ | 1,904,473 | $ | 2,019,202 | $ | 1,993,854 | $ | 2,280,879 | $ | 3,173,752 | $ | 3,538,353 | $ | 2,911,692 | $ | 2,468,015 | $ | 1,904,473 | ||||||||||||||||||||
Working capital | $ | 2,147,962 | $ | 1,629,071 | $ | 1,972,504 | $ | 1,720,441 | $ | 2,208,688 | $ | 2,520,281 | $ | 3,125,314 | $ | 2,520,672 | $ | 2,147,962 | $ | 1,629,071 | ||||||||||||||||||||
Total assets | $ | 8,141,148 | $ | 7,282,237 | $ | 5,821,598 | $ | 5,713,679 | $ | 5,962,548 | $ | 10,380,298 | $ | 10,040,229 | $ | 8,991,183 | $ | 8,141,148 | $ | 7,282,237 | ||||||||||||||||||||
Debt and capital lease obligations, non- current | $ | 1,513,662 | $ | 1,000,000 | $ | 350,000 | $ | — | $ | — | ||||||||||||||||||||||||||||||
| Debt and capital lease obligations, non-current | $ | 1,499,297 | $ | 1,496,938 | $ | 1,505,096 | $ | 1,513,662 | $ | 1,000,000 | ||||||||||||||||||||||||||||||
Stockholders’ equity | $ | 5,192,387 | $ | 4,890,568 | $ | 4,410,354 | $ | 4,649,982 | $ | 5,151,876 | $ | 6,724,634 | $ | 6,665,182 | $ | 5,783,113 | $ | 5,192,387 | $ | 4,890,568 | ||||||||||||||||||||
| Additional data: | ||||||||||||||||||||||||||||||||||||||||
Worldwide employees | 9,117 | 8,660 | 7,544 | 6,794 | 6,068 | 11,847 | 11,144 | 9,925 | 9,117 | 8,660 | ||||||||||||||||||||||||||||||
_________________________________________
(1) |
| Information associated with our financial position is as of the Friday closest to November 30 for the five fiscal periods through |
The following discussion should be read in conjunction with our consolidated financial statementsConsolidated Financial Statements and notesNotes thereto.
ACQUISITIONS
During fiscal 2013, we completed our acquisitions of privately held Neolane, a leader in cross-channel campaign management technology for $616.7 million and privately held Behance, an online social media platform to showcase and discover creative work for $111.1 million. During fiscal 2013, we began integrating Neolane and Behance into our Digital Marketing and Digital Media reportable segments, respectively. The impact of these acquisitions were not material to our Consolidated Financial Statements.
During fiscal 2011, we completed six business combinations and two asset management and social collaboration solutions based in Basel, Switzerland and Boston, Massachusetts for approximately $248.3 million. Day’s Web solutions combinedacquisitions with our existing enterprise portfolio will enable customers to better integrate their global Web presence and business applications in support of acquiring, servicing and retaining customers.aggregate purchase prices totaling $328.3 million. We have included the financial results of Daythe business combinations in our consolidated results of operations beginning on the respective acquisition date however the impact of this acquisition was not material to our consolidated balance sheets and results of operations. Following the closing, we integrated Day as a product line within our Enterprise segment for financial reporting purposes.dates.
See Note 2 of our Notes to Consolidated Financial Statements for further information regarding these acquisitions.acquisitions.
CRITICAL ACCOUNTING POLICIES AND ESTIMATES
In preparing our consolidated financial statementsConsolidated Financial Statements in accordance with GAAP and pursuant to the rules and regulations of the SEC, we make assumptions, judgments and estimates that affect the reported amounts of assets, liabilities, revenue and expenses, and related disclosures of contingent assets and liabilities. We base our assumptions, judgments and estimates on historical experience and various other factors that we believe to be reasonable under the circumstances. Actual results could differ materially from these estimates under different assumptions or conditions. On a regular basis, we evaluate our assumptions, judgments and estimates. We also discuss our critical accounting policies and estimates with the Audit Committee of the Board of Directors.
We believe that the assumptions, judgments and estimates involved in the accounting for revenue recognition, stock-based compensation, business combinations, goodwill impairment and income taxes have the greatest potential impact on our consolidated financial statements.Consolidated Financial Statements. These areas are key components of our results of operations and are based on complex rules which requirerequiring us to make judgments and estimates, so we consider these to be our critical accounting policies.
Historically, our assumptions, judgments and estimates relative to our critical accounting policies have not differed materially from actual results.
Revenue Recognition
Our revenue is derived from the licensing of perpetual, time-based and subscription software products, associated software maintenance and support plans, custom software development and consulting services and training. To a lesser extent our revenue includes non-software related hosting services, custom hosting development and consulting services, training and technical support and training for hosting services.
support.
We recognize revenue when all four revenue recognition criteria have been met: persuasive evidence of an arrangement exists, we have delivered the product or performed the service, the fee is fixed or determinable and collection is probable. Determining whether and when some of these criteria have been satisfied often involves assumptions and judgments that can have a significant impact on the timing and amount of revenue we report.
We enter into multiple element revenue arrangements in which a customer may purchase a combination of software, upgrades, maintenance and support, hosting services and consulting.
For our software and software relatedsoftware-related multiple element arrangements, we must: (1) determine whether and when each element has been delivered; (2) determine whether undelivered products or services are essential to the functionality of the delivered products and services; (3) determine the fair value of each undelivered element using VSOE,vendor-specific objective evidence (“VSOE”), and (4) allocate the total price among the various elements. VSOE of fair value is used to allocate a portion of the price to the undelivered elements and the residual method is used to allocate the remaining portion to the delivered elements. Absent VSOE, revenue is deferred until the earlier of the point at which VSOE of fair value exists for any undelivered element or until all elements of the arrangement have been delivered. However, if the only undelivered element is maintenance and support, the entire arra ngementarrangement fee is recognized ratably over the performance period. Changes in assumptions or judgments or changes to the
35
elements in a software arrangement could cause a material increase or decrease in the amount of revenue that we report in a particular period.
We determine VSOE for each element based on historical stand-alone sales to third parties or from the stated renewal rate for the elements contained in the initial arrangement. In determining VSOE, we require that a substantial majority of the selling prices for a product or service fall within a reasonably narrow pricing range.
training.
For multiple elementmultiple-element arrangements containing our non-software services, we mustmust: (1) determine whether and when each element has been delivered; (2) determine fair value of each element using the selling price hierarchy of VSOE of fair value, TPEselling price, third-party evidence (“TPE”) of selling price or BESP,best-estimated selling price (“BESP”), as applicable,applicable; and (3) allocate the total price among the various elements based on the relative selling price method.
We determine BESP for a product or service by considering multiple factors including, but not limited to, major product groupings, geographies, market conditions, competitive landscape, internal costs, gross margin objectives and pricing practices. Significant pricingPricing practices taken into consideration include historic contractually stated prices, volume discounts where applicable and our price lists. The most common fact pattern that emerged through analyzing these factors supports a BESP closely tied to Adobe’s list prices. The determination of BESP is made through consultation with and formal approval by our management, taking into consideration our go-to-market strategy.
We regularly review VSOE and have established a review process for TPE and BESP and maintain internal controls over the establishment and updates of these estimates. There was no material impact to revenue during the year ended December 3, 2010 resulting from changes in VSOE, TPE or BESP, nor do we expect a material impact from such changes in the near term.
Product revenue is recognized when the above criteria are met. We reduce the revenue recognized for estimated future returns, price protection and rebates at the time the related revenue is recorded. In determining our estimate for returns and in accordance with our internal policy regarding global channel inventory which is used to determine the level of product held by our distributors on which we have recognized revenue, we rely upon historical data, the estimated amount of product inventory in our distribution channel, the rate at which our product sells through to the end user, product plans and other factors. Our estimated provisions for returns can vary from what actually occurs. Product returns may be more or less than what was estimated. The amount of inventory in the channel could be different than what is estimated. Our est imateestimate of the rate of sell throughsell-through for product in the channel could be different than what actually occurs. There could be a delay in the
release of our products. These factors and unanticipated changes in the economic and industry environment could make our return estimates differ from actual returns, thus materially impacting our financial position and results of operations.
In the future, actual returns and price protection may materially exceed our estimates as unsold products in the distribution channels are exposed to rapid changes in consumer preferences, market conditions or technological obsolescence due to new platforms, product updates or competing products. While we believe we can make reliable estimates regarding these matters, these estimates are inherently subjective. Accordingly, if our estimates change, our returns and price protection reserves would change, which would impact the total net revenue we report.
We recognize revenues for hosting services that are based on a committed number of transactions ratably beginning on the date the customer commences use of our services and continuing through the end of the customer term. Over-usage fees, and fees billed based on the actual number of transactions from which we capture data, are billed in accordance with contract terms as these fees are incurred. We record amounts that have been invoiced in accounts receivable and in deferred revenue or revenue, depending on whether the revenue recognition criteria have been met.
Our consulting revenue is recognized on a time and materials basis and is measured monthly based on input measures, such as on hours incurred to date compared to total estimated hours to complete, with consideration given to output measures, such as contract milestones, when applicable.
36
Business Combinations
We allocate the purchase price of acquired companies to the tangible and intangible assets acquired and liabilities assumed, assumed equity awards, as well as to in-process research and development based upon their estimated fair values at the acquisition date. The purchase price allocation process requires management to make significant estimates and assumptions, especially at the acquisition date with respect to intangible assets, deferred revenue obligations and equity assumed.
Although we believe the assumptions and estimates we have made are reasonable, they are based in part on historical experience and information obtained from the management of the acquired companies and are inherently uncertain. Examples of critical estimates in valuing certain of the intangible assets we have acquired or may acquire in the future include but are not limited to:
future expected cash flows from software license sales, subscriptions, support agreements, consulting contracts and acquired developed technologies and patents;
the acquired company’s trade name and trademarks as well as assumptions about the period of time the acquired trade name and trademarks will continue to be used in the combined company’s product portfolio; and
In connection with the purchase price allocations for our acquisitions, we estimate the fair value of the deferred revenue obligations assumed. The estimated fair value of the support obligations is determined utilizing a cost build-up approach. The cost build-up approach determines fair value by estimating the costs related to fulfilling the obligations plus a normal profit margin. The estimated costs to fulfill the obligations are based on the historical costs related to fulfilling the obligations.
In connection with the purchase price allocations for our acquisitions, we estimate the fair value of the equity awards assumed. The estimated fair value is determined utilizing a modified binomial option pricing model which assumes employees exercise their stock options when the share price exceeds the strike price by a certain dollar threshold. If the acquired company has significant historical data on their employee’s exercise behavior, then this threshold is determined based upon the acquired company’s history. Otherwise, our historical exercise experience is used to determine the exercise threshold. Zero coupon yields implied by U.S. Treasury issues,issuances, implied volatility for our common stock and our historical forfeiture rate are other inputs to the binomial model.
Unanticipated events and circumstances may occur which may affect the accuracy or validity of such assumptions, estimates or actual results.
Goodwill Impairment
We complete our goodwill impairment test on an annual basis, during the second quarter of our fiscal year, or more frequently, if changes in facts and circumstances indicate that an impairment in the value of goodwill recorded on our balance sheet may exist. In order to estimate the fair value of goodwill, we typically estimate future revenue, consider market factors and estimate our future cash flows. Based on these key assumptions, judgments and estimates, we determine whether we need to record an impairment charge to reduce the value of the asset carried on our balance sheet to its estimated fair value. Assumptions, judgments and estimates about future values are complex and often subjective. They can be affected by a variety of factors, including external factors such as industry and economic trends, and internal factors such as c hangeschanges in our business strategy or our internal forecasts. Although we believe the assumptions, judgmentsassumptions, judgments and estimates we have made in the past have been reasonable and appropriate, different assumptions, judgments and estimates could materially affect our reported financial results.
We completed our annual impairment test in the second quarter of fiscal 20102013 and determined there was no impairment. We currently believe thatThe results of our annual impairment test indicate there is no significant risk of future material goodwill impairment in any of our reporting units.
Accounting for Income Taxes
We use the asset and liability method of accounting for income taxes. Under this method, income tax expense is recognized for the amount of taxes payable or refundable for the current year. In addition, deferred tax assets and liabilities are recognized for the expected future tax consequences of temporary differences between the financial reporting and tax bases of assets and liabilities, and for operating losses and tax credit carryforwards. Management must make assumptions, judgments and estimates
37
to determine our current provision for income taxes and also our deferred tax assets and liabilities and any valuation allowance to be recorded against a deferred tax asset.
Our assumptions, judgments and estimates relative to the current provision for income taxes take into account current tax laws, our interpretation of current tax laws and possible outcomes of current and future audits conducted by foreign and domestic tax authorities. We have established reserves for income taxes to address potential exposures involving tax positions that could be challenged by tax authorities. In addition, we are subject to the continual examination of our income tax returns by the IRS and other domestic and foreign tax authorities, including a current examination by the IRS forof our
fiscal 20082010, 2011 and 20092012 tax returns. TheseWe expect future examinations are expected to focus on our intercompany transfer pricing practices as well as other matters. Although we believeWe regularly assess the likelihood of outcomes resulting from these examinations to determine the adequacy of our assumptions, judgmentsprovision for income taxes and estimates are reasonable, changes in tax laws or our interpretation of tax laws and the resolution ofhave reserved for potential adjustments that may result from the current andexaminations. We believe such estimates to be reasonable; however, the final determination of any future tax auditsof these examinations could significantly impact the amounts provided for income taxes in our consolidated financial statements.
Consolidated Financial Statements.
Our assumptions, judgments and estimates relative to the value of a deferred tax asset take into account predictions of the amount and category of future taxable income, such as income from operations or capital gains income. Actual operating results and the underlying amount and category of income in future years could render our current assumptions, judgments and estimates of recoverable net deferred taxes inaccurate. Any of the assumptions, judgments and estimates mentioned above could cause our actual income tax obligations to differ from our estimates, thus materially impacting our financial position and results of operations.
We are a United States-based multinational company subject to tax in multiple U.S. and foreign tax jurisdictions. A significant portion of our foreign earnings for the current fiscal year were earned by our Irish subsidiaries. In addition to providing for U.S. income taxes on earnings from the U.S., we provide for U.S. income taxes on the earnings of foreign subsidiaries unless the subsidiaries' earnings are considered permanently reinvested outside the U.S. While we do not anticipate changing our intention regarding permanently reinvested earnings, if certain foreign earnings previously treated as permanently reinvested are repatriated, the related U.S. tax liability may be reduced by any foreign income taxes paid on these earnings.
Our income tax expense has differed from the tax computed at the U.S. federal statutory income tax rate due primarily to discrete items and to earnings considered as permanently reinvested in foreign operations. Unanticipated changes in our tax rates could affect our future results of operations. Our future effective tax rates could be unfavorably affected by changes in the tax rates in jurisdictions where our income is earned, by changes in, or our interpretation of, tax rules and regulations in the jurisdictions in which we do business, by unanticipated decreases in the amount of earnings in countries with low statutory tax rates, by lapses of the availability of the U.S. research and development tax credit, or by changes in the valuation of our deferred tax assets and liabilities. The United States, countries in the European Union and other countries where we do business have been considering changes in relevant tax, accounting and other laws, regulations and interpretations, including changes to tax laws applicable to corporate multinationals such as Adobe. These potential changes could adversely affect our effective tax rates or result in other costs to us.
Recent Accounting Pronouncements
In December 2011, the FASB amended the accounting standards to increase the prominence of other comprehensive income (“OCI”) by eliminating the option to present components of OCI as part of the statement of changes in shareholders’ equity and requires the components of OCI to be presented either in a single continuous statement of comprehensive income or in two consecutive statements. We adopted the amended accounting standards at the beginning of our first quarter of fiscal 2013 by electing to present consolidated statements of comprehensive income separate from the consolidated statements of income.
The amended accounting standards only impact the financial statement presentation of OCI and do not change the components that are recognized in net income or OCI. The adoption had no impact on the Company’s financial position or results of operations.
38
Recent Accounting Pronouncements Not Yet Effective
There have been no new accounting pronouncements not yet effective that have significance, or potential significance, to our Consolidated Financial Statements.
RESULTS OF OPERATIONS
Overview of 2013
For fiscal 2013, we reported financial results consistent with the continued execution of our plans for our two strategic growth areas, Digital Media and Digital Marketing, while continuing to market and license a broad portfolio of products and solutions.
We are a market leader in the fast-growing category addressed by our Digital Marketing segment. Our Adobe Marketing Cloud offering includes six solutions addressing the expanding needs of marketers, the newest of which is Adobe Campaign—a cross-channel campaign management tool that we added to our portfolio with the acquisition of Neolane during our third quarter of fiscal 2013.
Revenue from Adobe Marketing Cloud increased 26% and 35% during fiscal 2013 and 2012, respectively, compared to the year ago periods. Helping to drive this performance was strong adoption of our Adobe Experience Manager (“AEM”) offering and the addition of Neolane in mid-third quarter of fiscal 2013.
AEM, our fastest growing digital marketing solution, has typically been licensed by our customers as an on-premise offering where license revenue is recognized at the time of the transaction. In the past year, we introduced a managed services offering of AEM for which revenue is recognized ratably. We expect continued adoption of the newer managed services offering, which will increasingly migrate AEM revenue to recurring revenue in this segment. Given the comparisons involving more new license revenue being recognized over time versus past license revenue being recognized up front, we anticipate this trend may impact overall Adobe Marketing Cloud revenue in the near term.
Within our Digital Media segment, in May 2012 we delivered Adobe Creative Cloud, our subscription-based offering for creating and publishing content and applications. Creative Cloud is our next-generation offering that supersedes our historical model of licensing our creative products with perpetual licenses. We continue to implement strategies that will accelerate awareness, consideration and purchase of subscriptions to the offering. Key aspects of the value Creative Cloud provides include more frequent product updates, storage and access to user files stored in the cloud with syncing of files across users' machines, community-based features and services through our acquisition of Behance in December 2012, digital publishing and app creation capabilities, and lower entry point pricing for cost-sensitive customers.
In May 2013 we announced we would exclusively deliver new creative product innovations and features to Creative Cloud subscribers, and that Adobe Creative Suite 6 (“CS6”), which was released in May 2012, would be the last major update we provide for perpetual licensees. While we continue to offer CS6 on a perpetual licensing basis moving forward, we expect revenue for it to sequentially decline as our customers increasingly migrate to Creative Cloud.
We offer Creative Cloud for individuals and for teams, and we enable larger enterprise customers to acquire Creative Cloud capabilities through Enterprise Term License Agreements (“ETLAs”). The three Creative Cloud offerings address the multiple routes to market we use to license our creative software to targeted customers. Adoption of Creative Cloud is transforming our business model and we expect this to drive higher long-term revenue growth through an expansion of our customer base by acquiring new users through a lower cost of entry and delivery of additional features and value, as well as keeping existing customers current on our latest release. This model will drive our revenue to be more recurring and predictable as revenue is recognized ratably.
We have implemented, and will continue to implement, strategies that accelerate adoption of our Creative Cloud subscription model, causing our traditional perpetual license revenue to decline. These strategies include increasing the value Creative Cloud users receive, as well as targeted promotions and offers that attract past customers and potential users to try out and ultimately subscribe to Creative Cloud.
During fiscal 2013, adoption of our Creative Cloud subscription offering continued to accelerate, which has and will continue to cause our traditional perpetual license revenue to decline and, in turn, has caused total net revenue in fiscal 2013 to decline compared with fiscal 2012. As anticipated, during this transition expenses did not and are not expected to decline in correlation to the decrease in revenue, which has adversely affected our net income and operating margin throughout fiscal 2013. However, over time we expect this business model transition will significantly increase our long-term revenue growth rate by attracting new
39
users, keeping our end user base current and thereby driving higher revenue. Additionally, our shift to a subscription model will increase the amount of recurring revenue that is ratably recognized, driven by broader Creative Cloud adoption over the next several years. We began to see the impact of this shift in fiscal 2013.
To assist with the understanding of this transition and the related shift in revenue described above, we are using certain performance metrics to assess the health and trajectory of our overall Digital Media segment.These metrics include the total number of current paid subscriptions and Annualized Recurring Revenue (“ARR”). We define ARR as the sum of:
the number of current paid subscriptions, multiplied by the average subscription price paid per user per month, multiplied by twelve months; plus,
twelve months of contract value of ETLAs where the revenue is ratably recognized over the life of the contract.
ARR should be viewed independently of revenue, deferred revenue and unbilled deferred revenue as ARR is a performance metric and is not intended to be combined with any of these items.
We exited fiscal 2013 with 1.4 million paid Creative Cloud subscriptions, up from 0.3 million at the end of fiscal 2012. Total Creative ARR exiting fiscal 2013 was $768.0 million, up from $155.0 million exiting fiscal 2012, demonstrating the progress we have made with our transformation in this business.
Our Digital Media business also includes our Document Services products and solutions, including Acrobat. In fiscal 2013 we continued to drive solid adoption of our Acrobat family of products primarily through license agreements with enterprise customers. During fiscal 2013, a higher percentage of these agreements were ETLAs, which like ETLAs with our creative customers, cause more revenue to be recognized over time rather than at the time of contract signing. This has caused reported Document Services revenue in fiscal 2013 to decline compared to revenue achieved in fiscal 2012, with the benefit of ETLAs improving our growth potential over time. In addition to Acrobat, we also drove strong adoption of subscription based services including Acrobat cloud services and our EchoSign e-signing solution. Combined, adoption of Acrobat through ETLAs and our Document Services subscription offerings helped grow Document Services ARR to $143.0 million exiting fiscal 2013, up from $49.0 million at the end of fiscal 2012.
Financial Performance Summary for Fiscal 2013
We continue to derive the majority of our revenue from perpetual licenses. However, consistent with our strategy, during fiscal 2013, our subscription revenue as a percentage of total revenue increased to 28% from 15% and 11% as compared to fiscal 2012 and 2011, respectively, as we transition more of our business to a subscription-based model.
Total Digital Media ARR of approximately $911.0 million as of November 29, 2013 increased by approximately $707.0 million, or 347%, from approximately $204.0 million as of November 30, 2012. The increase in our Digital Media ARR is primarily due to increases in the number of paid Creative Cloud individual and team subscriptions and adoption of our enterprise Creative Cloud offering through our ETLAs.
Our total deferred revenue of $828.8 million as of November 29, 2013 increased by $209.2 million, or 34% from November 30, 2012, primarily due to increases in ETLAs and renewals for our Adobe Marketing Cloud services.
Cost of revenue of $586.6 million increased by $102.8 million, or 21%, during fiscal 2013, from $483.8 million in fiscal 2012, and $45.9 million or 10% during fiscal 2012 from $437.9 million in fiscal 2011. These increases are primarily due to increases in costs associated with compensation and related benefits driven by additional headcount and increased hosting and server costs associated with our subscription and SaaS offerings.
Operating expenses of $3,046.0 million increased by $306.3 million or 11%, during fiscal 2013, from $2,739.7 million in fiscal 2012, and $60.6 million, or 2% in fiscal 2012 from $2,679.1 million in fiscal 2011. These increases are primarily due to increases in costs associated with compensation and related benefits driven by additional headcount.
Net income of $290.0 million decreased by $542.8 million, or 65%, during fiscal 2013 from $832.8 million in fiscal 2012. The decrease is primarily due to the revenue model becoming more ratable as well as the cost and expense increases stated above. Net income during fiscal 2012 remained stable compared to fiscal 2011.
40
Net cash flow from operations of $1,151.7 million during fiscal 2013 decreased by $347.9 million, or 23%, as compared to fiscal 2012 primarily due to lower net income as discussed above. Net cash flow from operations during fiscal 2012 remained stable compared to fiscal 2011.
Revenue (dollars in millions)
| Fiscal 2013 | Fiscal 2012 | Fiscal 2011 | % Change 2013-2012 | % Change 2012-2011 | ||||||||||||||
| Product | $ | 2,470.1 | $ | 3,342.8 | $ | 3,416.5 | (26 | )% | (2 | )% | ||||||||
| Percentage of total revenue | 61 | % | 76 | % | 81 | % | ||||||||||||
| Subscription | 1,137.9 | 673.2 | 458.6 | 69 | % | 47 | % | |||||||||||
| Percentage of total revenue | 28 | % | 15 | % | 11 | % | ||||||||||||
| Services and support | 447.2 | 387.7 | 341.2 | 15 | % | 14 | % | |||||||||||
| Percentage of total revenue | 11 | % | 9 | % | 8 | % | ||||||||||||
| Total revenue | $ | 4,055.2 | $ | 4,403.7 | $ | 4,216.3 | (8 | )% | 4 | % | ||||||||
As described in Note 118 of our Notes to Consolidated Financial Statements for information regarding, we have the effect of new accounting pronouncements on our financial statements.
Fiscal 2010 | Fiscal 2009 | Fiscal 2008 | % Change 2010-2009 | % Change 2009-2008 | ||||||||||||||
Product | $ | 3,159.2 | $ | 2,684.8 | $ | 3,354.6 | 18 | % | (20 | )% | ||||||||
Percentage of total revenue | 83 | % | 91 | % | 94 | % | ||||||||||||
Subscription | 386.8 | 74.6 | 41.9 | * | 78 | % | ||||||||||||
Percentage of total revenue | 10 | % | 3 | % | 1 | % | ||||||||||||
Services and support | 254.0 | 186.5 | 183.4 | 36 | % | 2 | % | |||||||||||
Percentage of total revenue | 7 | % | 6 | % | 5 | % | ||||||||||||
Total revenue | $ | 3,800.0 | $ | 2,945.9 | $ | 3,579.9 | 29 | % | (18 | )% | ||||||||
Our subscription revenue is comprised primarily of fees we charge for our subscription and hosted service offerings including certain of our hosted online business optimization services.Adobe Marketing Cloud services and Creative Cloud. We recognize subscription revenuesrevenue ratably over the term of agreements with our customers, beginning on the commencement of the service. We expect our subscription revenue will continue to increase as a result of our investments in new SaaS and subscription models. We also expect this to increase the amount of recurring revenue we generate as a percent of our total revenue. Of the $386.8$1,137.9 million, $673.2 million and $74.6$458.6 million in subscription revenue for the fiscal years 20102013, 2012 and 2009,2011, respectively, approximately $309.1$663.1 million, $553.2 million and $22.2$429.2 million, respectively, is from our OmnitureDigital Marketing segment, with the remaining amounts substantially representing our other businessDigital Media segment offerings.
Our services and support revenue is comprised of consulting, training and maintenance and support, primarily related to the licensing of our enterprise, developer and platform products and the sale of our hosted online business optimizationAdobe Marketing Cloud services. Our support revenue also includes technical support and developer support to partners and developer organizations related to our desktop products. Our maintenance and support offerings, which entitle customers to receive product upgrades and enhancements or technical support, depending on the offering, are generally recognized ratably over the term of the arrangement.
Segments
In fiscal 2010,2013, we categorized our products into the following segments: Creative Solutions, Knowledge Worker, Enterprise, Omniture, Platform,
Digital Media—Our Digital Media segment provides tools and solutions that enable individuals, small businesses and enterprises to create, publish, promote and monetize their digital content anywhere. Our customers include traditional content creators, web application developers and digital media professionals, as well as their management in marketing departments and agencies, companies and publishers.
Digital Marketing—Our Digital Marketing segment provides solutions and services for how digital advertising and marketing are created, managed, executed, measured and optimized. Our customers include digital marketers, advertisers, publishers, merchandisers, web analysts, chief marketing officers, chief information officers and chief revenue officers.
Print and Publishing—Our Print and Publishing products.
41
Segment Information (dollars in millions)
Fiscal 2010 | Fiscal 2009 | Fiscal 2008 | % Change 2010-2009 | % Change 2009-2008 | ||||||||||||||
Creative Solutions | $ | 2,056.5 | $ | 1,702.1 | $ | 2,072.8 | 21 | % | (18 | )% | ||||||||
Percentage of total revenue | 54 | % | 58 | % | 58 | % | ||||||||||||
Knowledge Worker | 654.4 | 557.6 | 757.7 | 17 | % | (26 | )% | |||||||||||
Percentage of total revenue | 18 | % | 19 | % | 21 | % | ||||||||||||
Enterprise | 355.0 | 300.9 | 306.2 | 18 | % | (2 | )% | |||||||||||
Percentage of total revenue | 9 | % | 10 | % | 9 | % | ||||||||||||
Omniture | 360.6 | 26.3 | — | * | * | |||||||||||||
Percentage of total revenue | 9 | % | 1 | % | — | % | ||||||||||||
Platform | 178.9 | 181.0 | 231.6 | (1 | )% | (22 | )% | |||||||||||
Percentage of total revenue | 5 | % | 6 | % | 6 | % | ||||||||||||
| Print and Publishing | 194.6 | 178.0 | 211.6 | 9 | % | (16 | )% | |||||||||||
Percentage of total revenue | 5 | % | 6 | % | 6 | % | ||||||||||||
Total revenue | $ | 3,800.0 | $ | 2,945.9 | $ | 3,579.9 | 29 | % | (18 | )% | ||||||||
| Fiscal 2013 | Fiscal 2012 | Fiscal 2011 | % Change 2013-2012 | % Change 2012-2011 | ||||||||||||||
| Digital Media | $ | 2,625.9 | $ | 3,101.9 | $ | 3,070.2 | (15 | )% | 1 | % | ||||||||
| Percentage of total revenue | 65 | % | 70 | % | 73 | % | ||||||||||||
| Digital Marketing | 1,228.8 | 1,085.0 | 927.8 | 13 | % | 17 | % | |||||||||||
| Percentage of total revenue | 30 | % | 25 | % | 22 | % | ||||||||||||
| Print and Publishing | 200.5 | 216.8 | 218.3 | (8 | )% | (1 | )% | |||||||||||
| Percentage of total revenue | 5 | % | 5 | % | 5 | % | ||||||||||||
| Total revenue | $ | 4,055.2 | $ | 4,403.7 | $ | 4,216.3 | (8 | )% | 4 | % | ||||||||
Fiscal 20102013 Revenue Compared to Fiscal 20092012 Revenue
Digital Media
Revenue from Creative Solutions increased $354.4Digital Media decreased $476.0 million during fiscal 2010year 2013 as compared to fiscal 20092012, primarily due to continued strong licensingadoption of CS4 during fiscal 2010 until the releaseCreative Cloud and ETLAs as we continue to transition more of CS5,our business to a subscription-based model.
Revenue related to our creative professional products, which include our Creative Suite editions and CS point products as well as strongCreative Cloud, decreased during fiscal 2013 as compared to fiscal 2012 due to continued customer adoption of CS5 beginningCreative Cloud subscription offerings, released in May 2012. We continue to anticipate accelerated adoption of Creative Cloud for individuals, teams and enterprises, for which revenue is recognized over time, and that this adoption has and will continue to cause our traditional perpetual license revenue to decline.
Revenue associated with our other creative products increased during fiscal2013 as compared to fiscal 2012, primarily due to increases associated with distribution of third-party software via Flash Player downloads and our Digital Publishing Suite. These increases were partially offset by decreases in revenue associated with our Photoshop Elements family of products.
For our creative offerings, the total number of perpetual units licensed decreased while the number of subscription units licensed increased during fiscal 2013 as compared to fiscal 2012. Unit average selling prices for our perpetual units licensed decreased during the year ended fiscal 2013 as compared to fiscal 2012.
Document Services revenue, which includes our Acrobat product family, decreased slightly during fiscal 2013 as compared to fiscal 2012, primarily due to the continued shift to ETLAs offset by increased Document Exchange Services revenue including revenue generated from our EchoSign e-signing service.
Within Document Services, excluding large enterprise license agreement deals, the number of units licensed decreased while the unit average selling prices increased during fiscal 2013 as compared to fiscal 2012.
Digital Marketing
Revenue from Digital Marketing increased $143.8 million during fiscal 2013 as compared to fiscal 2012. The increase was primarily due to continued revenue growth associated with our Adobe Marketing Cloud, which increased 26% during fiscal 2013, as compared to the year ago period and includes Adobe Campaign revenue from our recent acquisition of Neolane. The increase noted above was partially offset by expected declines in revenue associated with our legacy products during fiscal 2013.
Print and Publishing
Revenue from Print and Publishing decreased during fiscal 2013 as compared to fiscal 2012, primarily due to increased ETLAs for some products in this group.
Fiscal 2012 Revenue Compared to Fiscal 2011 Revenue
Digital Media
Revenue from Digital Media remained relatively stable during fiscal 2012 as compared to fiscal 2011, due to solid demand for our Acrobat family of products as well as the continued momentum of the CS6 launch in the second quarter of the fiscal year. The increase was driven largely2012, offset by a 23% increase in bothbetter than expected growth associated with our subscription offerings.
42
Revenue related to our creative professional products, which included our Creative SuitesSuite editions and PhotoshopCS point product revenueproducts as well as Creative Cloud, decreased slightly during fiscal 2012 as compared to fiscal 2011 due to higher than expected customer adoption of Creative Cloud and point product subscriptions. The decreases in revenue associated with our creative professional products were offset in part by growth associated with the prior year. The overallMay 2012 release of new Photoshop point products for which the previous release occurred in fiscal 2010.
Revenue associated with our other creative products increased during fiscal 2012 as compared to fiscal 2011 primarily due to increases associated with third-party toolbar distribution via Flash Player downloads as well as continued demand related to the May 2012 release of Adobe Lightroom 4.
For our creative offerings, the total number of perpetual units licensed remained relatively stable while the number of subscription units licensed increased 23% whenduring fiscal 2012 as compared to fiscal 2009.2011. Unit average selling prices excluding large enterprise license agreement (“ELA”) deals, remained relatively stablefor our perpetual units licensed decreased during fiscal 20102012 as compared to fiscal 2009.2011.
Digital Marketing
Revenue from Platform decreased $2.1Digital Marketing increased $157.2 million, or 17% during fiscal 2010 as2012when compared to fiscal 2009. The decrease was2011, primarily due to lower developer toolcontinued growth of our Adobe Marketing Cloud, which increased 35% year-over-year and includes revenue based ongenerated from products associated with our fiscal 2012 acquisition of Efficient Frontier. Also contributing to the inclusion of developer tools within some CS5 suites,growth in revenue was our Adobe Connect hosted offering. As expected, increases in these areas were offset in part by an increasea decrease in distribution revenue from OEM relationshipsassociated with companies suchAdobe LiveCycle product offerings as Google, where we offer their technologies as part of the download of Flash Player, Shockwave Playercontinued to shift our focus to our Adobe Marketing Cloud.
Print and Reader and generate revenue through successful installations of these technologies.Publishing
Revenue from Print and Publishing increased $16.6 millionremained relatively stable during fiscal 20102012 as compared to fiscal 20092011 primarily due to an improved economic environmentdecreases in certain markets and geographies, the launch of new products,legacy product revenue, offset by increases in fees received for engineeringconsulting services and royalties related to PostScript products.
Fiscal 2010 | Fiscal 2009 | Fiscal 2008 | % Change 2010-2009 | % Change 2009-2008 | Fiscal 2013 | Fiscal 2012 | Fiscal 2011 | % Change 2013-2012 | % Change 2012-2011 | |||||||||||||||||||||||||||
Americas | $ | 1,859.0 | $ | 1,382.6 | $ | 1,632.8 | 34 | % | (15 | )% | $ | 2,134.4 | $ | 2,196.4 | $ | 2,044.6 | (3 | )% | 7 | % | ||||||||||||||||
Percentage of total revenue | 49 | % | 46 | % | 46 | % | 53 | % | 50 | % | 49 | % | ||||||||||||||||||||||||
EMEA | 1,168.2 | 928.9 | 1,229.2 | 26 | % | (24 | )% | 1,129.2 | 1,294.6 | 1,317.4 | (13 | )% | (2 | )% | ||||||||||||||||||||||
Percentage of total revenue | 31 | % | 32 | % | 34 | % | 28 | % | 29 | % | 31 | % | ||||||||||||||||||||||||
Asia | 772.8 | 634.4 | 717.9 | 22 | % | (12 | )% | |||||||||||||||||||||||||||||
| APAC | 791.6 | 912.7 | 854.3 | (13 | )% | 7 | % | |||||||||||||||||||||||||||||
Percentage of total revenue | 20 | % | 22 | % | 20 | % | 19 | % | 21 | % | 20 | % | ||||||||||||||||||||||||
Total revenue | $ | 3,800.0 | $ | 2,945.9 | $ | 3,579.9 | 29 | % | (18 | )% | $ | 4,055.2 | $ | 4,403.7 | $ | 4,216.3 | (8 | )% | 4 | % | ||||||||||||||||
Fiscal 20102013 Revenue by Geography Compared to Fiscal 20092012 Revenue by Geography
Fiscal 2012 Revenue by Geography Compared to Fiscal 2011 Revenue by Geography
Overall revenue for fiscal 2012 increased in the Americas and APAC and declined slightly in EMEA when compared to fiscal 2011. Revenue in the Americas increased during fiscal 2012 primarily due to revenue increases in Digital Media and Digital Marketing, offset slightly by a decline in Print and Publishing revenue. Despite the launch of CS5CS6 in May 2012, the economic
43
conditions in Europe and the weakening of the Euro and British Pound against the U.S. Dollar caused revenue in EMEA to decline slightly during fiscal 2012 compared with fiscal 2011. Revenue in APAC increased across all reportable segments during fiscal 2012 as compared with fiscal 2011. Within each geographical region, the fluctuations in revenue by reportable segment were attributable to the factors noted in the second quarter of fiscal 2010 as well as additional revenue from Omniture which we acquired in the fourth quarter of fiscal 2009. Increased revenue in our Knowledge Worker and Enterprise business segments also contributed to the increase as well as an improved economy across all geographies.
segment information above.
Included in the overall increasechange in revenue for fiscal 2013 and fiscal 2012 were impacts associated with foreign currency. The U.S. dollar strengthened against both the Euro and British pound causing revenue in EMEA measured in U.S. dollars to decrease by approximately $18.4 million and $3.3 million, respectively,currency as compared to fiscal 2009. Revenue in Japan measured in U.S. dollars was favorably impacted by approximately $23.7 million due to the strength of the Yen against the U.S. dollar as compared to fiscal 2009. The Australian dollar also strengthened against the U.S. dollar resulting in a favorable impact to revenue of approximately $12.1 million during fiscal 2010. We had no comparable impact to revenue from the Australian dollar during fiscal 2009.shown below. Our currency hedging program is used to mitigate a portion of the foreign currency impact to rev enue. During revenue.
| (in millions) | Fiscal 2013 | Fiscal 2012 | |||||
| Revenue impact: | Increase/(Decrease) | ||||||
| EMEA: | |||||||
| Euro | $ | 9.1 | $ | (46.9 | ) | ||
| British Pound | (3.9 | ) | (1.8 | ) | |||
| Other currencies | 0.6 | (1.1 | ) | ||||
| Total EMEA | 5.8 | (49.8 | ) | ||||
| Japanese Yen | (63.6 | ) | 6.0 | ||||
| Other currencies | (5.6 | ) | 1.5 | ||||
| Total revenue impact | (63.4 | ) | (42.3 | ) | |||
| Hedging impact: | |||||||
| EMEA | 3.7 | 23.4 | |||||
| Japanese Yen | 32.3 | 7.3 | |||||
| Total hedging impact | 36.0 | 30.7 | |||||
| Total impact | $ | (27.4 | ) | $ | (11.6 | ) | |
During fiscal 2010, our2013, the U.S. Dollar generally strengthened against the Japanese Yen and other Asian currencies causing revenue in APAC measured in U.S. Dollar equivalents to decrease compared with the same reporting period last year. This decrease was partially offset by the favorable impact to revenue measured in EMEA currencies as the U.S. Dollar generally weakened against these currencies. Our EMEA and Yen currency hedging program related to EMEA and Japanprograms resulted in hedging gains of $19.5 million and $0.6 million, respectively.
During fiscal 2012, the U.S. Dollar strengthened against the Euro, British Pound and other EMEA currencies causing revenue were impacts associated with foreign currency. Revenue in EMEA measured in U.S. dollars decreased approximately $47.1 million, dueDollar equivalents to decrease compared with the strength ofsame reporting period last year. This decrease was offset in part by the favorable impact to revenue measured in Japanese Yen and other Asian currencies as the U.S. dollarDollar weakened against the Euro, as compared to fiscal 2008.these currencies. Our EMEA and Yen currency hedging program is used to mitigate a portion of the foreign currency impact to revenue. Revenue in Asia measured in U.S. dollars was favorably impacted by approximately $32.8 million due to the strength of the Yen against the U.S. dollar as compared to fiscal 2008. During fiscal 2009, our currency hedging program related to the Euro and Yenprograms resulted in hedging gains of $25.8 million and $1.2 million, respectively.
during fiscal 2012 as noted in the table above.
See Item 7A, Quantitative and Qualitative Disclosures About Market Risk regarding foreign currency risks.
Note 18 of our Notes to Consolidated Financial Statements for further geographic information.
Product Backlog
The actual amount of product backlog at any particular time may not be a meaningful indicator of future business prospects. Shippable backlog is comprised of unfulfilled orders, excluding those associated with new product releases, those pending credit review and those not shipped due to the application of our global inventory policy. OurWe had minimal shippable backlog at the end of the fourth quarter of fiscal 2010 was approximately 5% of fourth quarter2013 and fiscal 2010 revenue.2012. We had minimalexpect that our shippable backlog will continue to be insignificant in future periods.
The deferred revenue balance on our consolidated balance sheet does not represent the total contract value of annual or multi-year, non-cancellable subscription agreements. Unbilled deferred revenue represents expected future billings which are contractually committed under our existing subscription, SaaS and managed services agreements that have not been invoiced and are not recorded in deferred revenue within our financial statements. Our presentation of unbilled deferred revenue backlog may differ from that of other companies in the industry. As of November 29, 2013, we had unbilled deferred revenue backlog of approximately $1.0 billion.
We expect that the amount of unbilled deferred revenue backlog will change period over period due to certain factors, including the timing and duration of large customer subscription, SaaS and managed service agreements, varying billing cycles of these agreements, the timing of customer renewals, the timing of when unbilled deferred revenue backlog is to be billed, changes
44
in customer financial circumstances and foreign currency fluctuations. Additionally, the unbilled deferred revenue backlog for multi-year subscription agreements that are billed annually is typically higher at the endbeginning of the third quartercontract period, lower prior to renewal and increases when the agreement is renewed. Accordingly, fluctuations in unbilled deferred revenue backlog may not be a reliable indicator of fiscal 2010. Our shippable backlog atfuture business prospects and the end of the fourth quarter of fiscal 2009 was approximately 9% of fourth quarter fiscal 2009 revenue.related revenue associated with these contractual commitments.
Cost of Revenue (dollars in millions)
Fiscal 2010 | Fiscal 2009 | Fiscal 2008 | % Change 2010-2009 | % Change 2009-2008 | ||||||||||||||
Product | $ | 127.5 | $ | 180.6 | $ | 243.2 | (29 | )% | (26 | )% | ||||||||
Percentage of total revenue | 3 | % | 6 | % | 7 | % | ||||||||||||
Subscription | 195.6 | 48.3 | 23.2 | * | * | |||||||||||||
Percentage of total revenue | 5 | % | 2 | % | 1 | % | ||||||||||||
Services and support | 80.4 | 67.8 | 96.2 | 19 | % | (30 | )% | |||||||||||
Percentage of total revenue | 2 | % | 2 | % | 3 | % | ||||||||||||
Total cost of revenue | $ | 403.5 | $ | 296.7 | $ | 362.6 | 36 | % | (18 | )% | ||||||||
| Fiscal 2013 | Fiscal 2012 | Fiscal 2011 | % Change 2013-2012 | % Change 2012-2011 | ||||||||||||||
| Product | $ | 138.2 | $ | 121.7 | $ | 125.7 | 14 | % | (3 | )% | ||||||||
| Percentage of total revenue | 3 | % | 3 | % | 3 | % | ||||||||||||
| Subscription | 278.1 | 219.1 | 194.0 | 27 | % | 13 | % | |||||||||||
| Percentage of total revenue | 7 | % | 5 | % | 5 | % | ||||||||||||
| Services and support | 170.3 | 143.0 | 118.2 | 19 | % | 21 | % | |||||||||||
| Percentage of total revenue | 4 | % | 3 | % | 3 | % | ||||||||||||
| Total cost of revenue | $ | 586.6 | $ | 483.8 | $ | 437.9 | 21 | % | 10 | % | ||||||||
Product
Cost of product revenue includes product packaging, third-party royalties, excess and obsolete inventory, amortization related to localization costs, purchased intangibles and acquired rights to use technology and the costs associated with the manufacturing of our products.
% Change 2010-2009 | % Change 2009-2008 | |||||||
Amortization of purchased intangibles | (23 | )% | (12 | )% | ||||
Amortization of acquired rights to use technology | 1 | (8 | ) | |||||
Localization costs related to our product launches | (7 | ) | (1 | ) | ||||
Royalty cost | (5 | ) | (1 | ) | ||||
Cost of sales | 4 | (2 | ) | |||||
Various individually insignificant items | 1 | (2 | ) | |||||
Total change | (29 | )% | (26 | )% | ||||
% Change 2013-2012 | % Change 2012-2011 | ||||
| Amortization of purchased intangibles and technology license arrangements | 27 | % | (1 | )% | |
| Cost of sales | (8 | ) | (6 | ) | |
| Excess and obsolete inventory | (4 | ) | 2 | ||
| Various individually insignificant items | (1 | ) | 2 | ||
| Total change | 14 | % | (3 | )% | |
Cost of product revenue increased during fiscal 2013 as compared to fiscal 2012 primarily due to an increase in amortization of purchased intangibles and technology license arrangements offset by decreases in cost of sales and excess and obsolete inventory. Amortization of purchased intangibles decreased during fiscal 2010and technology license arrangements increased as compared to fiscal 2009 and decreased during fiscal 2009 as compared to fiscal 2008, due to decreases in amortization of $46.4 million and $80.0 million, respectively, associated with intangible assets purchased through the Macromedia acquisition which were fully amortized during fiscal 2009.
Cost of product revenue decreased during fiscal 20102012 as compared to fiscal 2009 was2011 primarily due to CS4 products becomingdecrease in cost of sales and amortization of purchase intangibles, offset by increases in excess and obsolete inventory. Cost of sales decreased primarily due to a decrease in packaging costs associated with our CS6 products. Amortization of purchased intangibles decreased primarily due to certain intangible assets purchased through our acquisitions in prior years that were fully amortized at the end ofin fiscal 2009, offset in part2012. Excess and obsolete inventory increased primarily due to increased reserve requirements for Adobe Creative Suite 5 and Adobe Creative Suite 5.5 products necessitated by the launch of CS5 products duringCS6 in the second quarter of fiscal 2010.
2012.
Subscription
Cost of subscription revenue consists of expenses related to operating our network infrastructure, including depreciation expenses and operating lease payments associated with computer equipment, data center costs, salaries and related expenses of network operations, implementation, account management and technical support personnel, amortization of intangible assets and allocated overhead. We enter into contracts with third-parties for the use of their data center facilities and our data center costs largely consist of the amounts we pay to these third-parties for rack space, power and similar items.
45
Cost of subscription revenue increased due to the following:
% Change 2013-2012 | % Change 2012-2011 | ||||
| Hosted server costs | 23 | % | 7 | % | |
| Amortization of purchased intangibles | 4 | 6 | |||
| Total change | 27 | % | 13 | % | |
Cost of subscription revenue increased induring fiscal 20102013 as compared to fiscal 2009 as a result2012 primarily due to increased hosted server costs and amortization of purchased intangibles. Hosted server costs increased primarily due to increases in data center costs related to higher transaction volumes in our Adobe Marketing Cloud and Creative Cloud services, depreciation expense from higher capital expenditures in prior years and compensation and related benefits driven by additional headcount, including from our acquisition of OmnitureNeolane in the fourth quarterfiscal 2013. Amortization of fiscal 2009 and the additionpurchased intangibles increased primarily due to increased amortization of its related data center costs. Also included in cost of subscription revenue for fiscal 2010 is $58.4 million of amortization expense related to intangible assets acquiredpurchased associated with our acquisitions of Behance and Neolane in conjunction with this acquisition.
fiscal 2013.
Cost of subscription revenue increased induring fiscal 20092012 as compared to fiscal 2008 as a result2011 primarily due to increased hosted server costs and amortization of purchased intangibles. Hosted server costs increased primarily due to increases in compensation and related benefits driven by additional headcount and hosting expenses associated with the launch of our Creative Cloud services in the second quarter of fiscal 2012. Also contributing to the increase in hosted server costs is the increase in depreciation expense from higher capital expenditures in prior years and data center costs related to higher transaction volumes in our Adobe Marketing Cloud and Creative Cloud services. Amortization of purchased intangibles increased primarily due to increased amortization of intangible assets associated with our acquisition of OmnitureEfficient Frontier in the fourthfirst quarter of fiscal 2009 and the addition of its related data center costs.
2012.
Services and Support
Cost of services and support revenue is primarily comprised of employee-related costs and associated costs incurred to provide consulting services, training and product support.
Cost of services and support revenue increased during fiscal 2013 as compared to fiscal 2012 primarily due to increases in third-party fees related to training and consulting services provided to our customers and compensation and related benefits driven by additional headcount, including headcount from our acquisition of Neolane in fiscal 2013.
Cost of services and support revenue increased during fiscal 20102012 as compared to fiscal 2009,2011 primarily due to increases in costs associated with compensation and related benefits driven by additional headcount, as a result ofincluding headcount from our acquisition of Omniture.Efficient Frontier.
Operating Expenses (dollars in millions)
Fiscal 2010 | Fiscal 2009 | Fiscal 2008 | % Change 2010-2009 | % Change 2009-2008 | ||||||||||||||
Research and development | $ | 680.3 | $ | 565.1 | $ | 662.1 | 20 | % | (15 | )% | ||||||||
Percentage of total revenue | 18 | % | 19 | % | 18 | % | ||||||||||||
Sales and marketing | $ | 1,244.2 | $ | 981.9 | $ | 1,089.3 | 27 | % | (10 | )% | ||||||||
Percentage of total revenue | 33 | % | 33 | % | 30 | % | ||||||||||||
General and administrative | $ | 383.5 | $ | 298.7 | $ | 337.3 | 28 | % | (11 | )% | ||||||||
Percentage of total revenue | 10 | % | 10 | % | 9 | % | ||||||||||||
Restructuring charges | $ | 23.3 | $ | 41.3 | $ | 32.1 | (44 | )% | 29 | % | ||||||||
Percentage of total revenue | 1 | % | 1 | % | 1 | % | ||||||||||||
| Amortization of purchased intangibles and incomplete technology | $ | 72.1 | $ | 71.6 | $ | 68.2 | 1 | % | 5 | % | ||||||||
Percentage of total revenue | 2 | % | 2 | % | 2 | % | ||||||||||||
Total operating expenses | $ | 2,403.4 | $ | 1,958.6 | $ | 2,189.0 | 23 | % | (11 | )% | ||||||||
| Fiscal 2013 | Fiscal 2012 | Fiscal 2011 | % Change 2013-2012 | % Change 2012-2011 | ||||||||||||||
| Research and development | $ | 826.6 | $ | 742.8 | $ | 738.1 | 11 | % | 1 | % | ||||||||
| Percentage of total revenue | 20 | % | 17 | % | 18 | % | ||||||||||||
| Sales and marketing | 1,620.5 | 1,516.1 | 1,385.8 | 7 | % | 9 | % | |||||||||||
| Percentage of total revenue | 40 | % | 34 | % | 33 | % | ||||||||||||
| General and administrative | 520.1 | 435.0 | 414.6 | 20 | % | 5 | % | |||||||||||
| Percentage of total revenue | 13 | % | 10 | % | 10 | % | ||||||||||||
| Restructuring and other related charges (credits) | 26.5 | (2.9 | ) | 97.8 | * | * | ||||||||||||
| Percentage of total revenue | 1 | % | — | % | 2 | % | ||||||||||||
| Amortization of purchased intangibles | 52.3 | 48.7 | 42.8 | 7 | % | 14 | % | |||||||||||
| Percentage of total revenue | 1 | % | 1 | % | 1 | % | ||||||||||||
| Total operating expenses | $ | 3,046.0 | $ | 2,739.7 | $ | 2,679.1 | 11 | % | 2 | % | ||||||||
_________________________________________
(*) | Percentage is greater than 100%. |
46
Research and Development, Sales and Marketing and General and Administrative Expenses
The increase in research and development, sales and marketing and general and administrative expenses during fiscal 20102013 as compared to fiscal 2009 was2012 is primarily driven bydue to higher incentive compensation program achievement in fiscal 2013, increases in stock-based compensation expense due to additional headcount as a result of our acquisition of Omniture and to higher employee compensation including bonuses based on company performance to date when compared toshare prices during fiscal 2009. The decrease in research and development, sales and marketing and general and administrative expenses in fiscal 20092013 as compared to fiscal 2008 was primarily driven by decreases in compensation expense and2012 as well as a decrease inshorter vesting term, which decreased from four years to three years, for stock awards granted as part of our annual review process during the costs associated with acquired rights to use technology. The decrease in compensation costs duringfirst quarter of fiscal 2009 as compared to fiscal 2008 wa s primarily due to lower profit sharing and employee bonuses based on company performance.
2013.
Research and Development
Research and development expenses consist primarily of salary and benefit expenses for software developers, contracted development efforts, related facilities costs and expenses associated with computer equipment used in software development.
Research and development expenses increased during fiscal 2013 as compared to fiscal 2012 due to the following:
% Change 2013-2012 | ||
| Compensation and related benefits associated with headcount | 3 | % |
| Compensation associated with incentive compensation and stock-based compensation | 7 | |
| Various individually insignificant items | 1 | |
| Total change | 11 | % |
Research and development expenses increased (decreased) dueremained relatively stable during fiscal 2012 as compared to the following:
% Change 2010-2009 | % Change 2009-2008 | |||||||
| Compensation associated with incentive compensation and stock-based compensation | 16 | % | (13 | )% | ||||
| Compensation and related benefits associated with headcount growth | 2 | 1 | ||||||
| Various individually insignificant items | 2 | (3 | ) | |||||
Total change | 20 | % | (15 | )% | ||||
fiscal 2011.
We believe that investments in research and development, including the recruiting and hiring of software developers, are critical to remain competitive in the marketplace and are directly related to continued timely development of new and enhanced products. We will continue to focus on long-term opportunities available in our end markets and make significant investments in the development of our application, tool and service offerings.
Sales and Marketing
Sales and marketing expenses consist primarily of salary and benefit expenses, sales commissions, travel expenses and related facilities costs for our sales, marketing, order management and global supply chain management personnel. Sales and marketing expenses also include the costs of programs aimed at increasing revenue, such as advertising, trade shows, public relations and other market development programs. Given the strength of our business during the first half of fiscal 2010, we made additional investments in sales and marketing which is reflected in the table below under marketing spending related to product launches and marketing efforts.
Sales and marketing expenses increased (decreased) due to the following:
% Change 2010-2009 | % Change 2009-2008 | ||||||||||||
% Change 2013-2012 | % Change 2012-2011 | ||||||||||||
| Compensation and related benefits associated with headcount | 4 | % | 2 | % | |||||||||
| Marketing spending related to product launches and overall marketing efforts to further increase revenue | — | 2 | |||||||||||
| Compensation associated with incentive compensation and stock-based compensation | 16 | % | (8 | )% | 4 | 3 | |||||||
| Compensation and related benefits associated with headcount growth | 3 | 2 | |||||||||||
Marketing spending related to product launches and overall marketing efforts to further increase revenue | 3 | (4 | ) | ||||||||||
| Various individually insignificant items | 5 | — | (1 | ) | 2 | ||||||||
Total change | 27 | % | (10 | )% | 7 | % | 9 | % | |||||
General and Administrative
General and administrative expenses consist primarily of compensation and benefit expenses, travel expenses and related facilities costs for our finance, facilities, human resources, legal, information services and executive personnel. General and administrative expenses also include outside legal and accounting fees, provision for bad debts, expenses associated with computer equipment and software used in the administration of the business, charitable contributions and various forms of insurance.
| General and administrative expenses increased |
% Change 2010-2009 | % Change 2009-2008 | |||||||
| Compensation associated with incentive compensation and stock-based compensation | 15 | % | (8 | )% | ||||
| Allocation of costs associated with acquired rights to use technology | — | (5 | ) | |||||
| Compensation and related benefits associated with headcount growth | 5 | 2 | ||||||
| Charitable contributions | — | (3 | ) | |||||
| Professional and consulting fees | 4 | 1 | ||||||
| Depreciation and amortization | 3 | 1 | ||||||
| Various individually insignificant items | 1 | 1 | ||||||
| Total change | 28 | % | (11 | )% | ||||
% Change 2013-2012 | % Change 2012-2011 | ||||
| Compensation and related benefits associated with headcount growth | 4 | % | 4 | % | |
| Professional and consulting fees | 7 | (3 | ) | ||
| Compensation associated with incentive compensation and stock-based compensation | 4 | 1 | |||
| Charitable contributions | 2 | (1 | ) | ||
| Various individually insignificant items | 3 | 4 | |||
| Total change | 20 | % | 5 | % | |
Professional and consulting fees increased during fiscal 20102013 as compared to fiscal 20092012 primarily due to increaseincreased professional and legal fees including those associated with the attacks on our network discovered in information technology servicesSeptember 2013. Professional and consulting fees decreased during fiscal 2012 as compared to support our business.
fiscal 2011 primarily due to decreased litigation expense.
Restructuring and Other Charges
During May 2013, we began to actively market the Waltham property assets and we expected to sell the property within one year from management's approval of the plan. We classified the Waltham property assets with a total carrying amount of $47.4 million as held for sale at $23.6 million representing their fair value, net of estimated costs to sell which was the lesser of the fair value less cost to sell or carrying amount of the assets. We recorded a write-down of $23.8 million during the second quarter of fiscal 2013. We ceased recognizing depreciation expense on the Waltham property assets upon reclassification which would have been minimal for fiscal 2013. In September 2013, we finalized the sale of the Waltham property assets for net proceeds of $24.3 million which approximated the carrying value of the assets at the time of sale.
SeeNote 1110 of our Notes to Consolidated Financial Statements for further information regarding our restructuring charges.
plans.
Amortization of Purchased Intangibles
During the last several years, we have completed a number of business combinations and Incomplete Technology
asset acquisitions including Omniture in fiscal 2009, Day in fiscal 2010, Efficient Frontier in fiscal 2012, and Behance and Neolane in fiscal 2013. As a result of our acquisition of Omniture in fiscal 2009,these acquisitions, we acquired purchased intangibles whichintangible assets that are being amortized over their estimated useful lives of ranging from one to twelvefourteen years. In addition, as a result of our acquisition of Macromedia in fiscal 2006, we acquired purchased intangibles which are amortized over their estimated useful lives of two to four years. During fiscal 2009, we completed one business combination, in addition to Omniture. In addition, during fiscal 2008 we completed one business combination. We acquired purchased intangibles through these acquisitions which are amortized over their estimated useful lives.
Amortization expense increased 1%7% during fiscal 20102013 as compared to fiscal 2009,2012 primarily due to amortization expense associated with intangible assets purchased through our acquisitions of Behance and Neolane in fiscal 2013.
Amortization expense increased 14% during fiscal 2012 as a result ofcompared to fiscal 2011 primarily due to amortization expense associated with intangible assets purchased through our acquisition of OmnitureEfficient Frontier in the fourth quarterfiscal 2012.
48
Non-Operating Income (Expense), Net (dollars in millions)
Fiscal 2010 | Fiscal 2009 | Fiscal 2008 | % Change 2010-2009 | % Change 2009-2008 | ||||||||||||||
| Interest and other income (expense), net | $ | 13.1 | $ | 31.4 | $ | 43.8 | (58 | )% | (28 | )% | ||||||||
Percentage of total revenue | * | 1 | % | 1 | % | |||||||||||||
Interest expense | (56.9 | ) | (3.4 | ) | (10.0 | ) | * | (66 | )% | |||||||||
Percentage of total revenue | (2 | )% | * | * | ||||||||||||||
Investment gains (losses), net | (6.1 | ) | (17.0 | ) | �� | 16.4 | (64 | )% | (204 | )% | ||||||||
Percentage of total revenue | * | (1 | )% | * | ||||||||||||||
| Total non-operating income (expense), net | $ | (49.9 | ) | $ | 11.0 | $ | 50.2 | (554 | )% | (78 | )% | |||||||
| Fiscal 2013 | Fiscal 2012 | Fiscal 2011 | % Change 2013-2012 | % Change 2012-2011 | ||||||||||||||
| Interest and other income (expense), net | $ | 4.9 | $ | (3.4 | ) | $ | (3.0 | ) | * | 13 | % | |||||||
| Percentage of total revenue | ** | ** | ** | |||||||||||||||
| Interest expense | (67.5 | ) | (67.5 | ) | (67.0 | ) | — | % | 1 | % | ||||||||
| Percentage of total revenue | (2 | )% | (2 | )% | (2 | )% | ||||||||||||
| Investment gains (losses), net | (4.0 | ) | 9.5 | 5.9 | (142 | )% | 61 | % | ||||||||||
| Percentage of total revenue | ** | ** | ** | |||||||||||||||
| Total non-operating income (expense), net | $ | (66.6 | ) | $ | (61.4 | ) | $ | (64.1 | ) | 8 | % | (4 | )% | |||||
(*) Percentage is not meaningful.
(**) Percentage is less than 1%.
Interest and Other Income (Expense), Net
Interest and other income (expense), net consists primarily of interest earned on cash, cash equivalents and short-term fixed income investments. Interest and other income (expense), net also includes foreign exchange gains and losses, including those from hedging revenue transactions primarily denominated in Euro and Yen currencies, and gains and losses on fixed income investments.
investments and foreign exchange gains and losses other than any gains recorded to revenue from hedging Euro, British Pounds and Yen currencies.
Interest and other income (expense), net decreased duringincreased in net income in fiscal 20102013 as compared to fiscal 20092012 primarily due to a reduction in interest earned of $12.8 million resulting from lower average interest rates on our investments and $5.8 million lower realized gains on our investments. During fiscal 2010, we also recorded a $20.8 million gain associated with a forward
losses.
Interest and other income (expense), net decreased duringincreased in net expense in fiscal 20092012 as compared to fiscal 20082011 primarily due to lower average interest rates partially offset by higher average invested balances, realized gains on sales of fixed income securities and lower foreign exchange losses.
our investments.
Interest Expense
Interest expense for fiscal 2009 and 2008, primarily represents interest associated with our credit facility.senior notes. Interest due under the credit facility is paid upon expiration of the London interbank offered rate (“LIBOR”) contract or at a minimum, quarterly. The declinepayable semi-annually, in interestarrears, on February 1 and August 1. Interest expense was primarily due to lower interest rates.
has remained relatively stable for all fiscal years presented.
Investment Gains (Losses), Net
Investment gains (losses), net consists principally of realized gains andor losses from the sale of marketable equity investments, other-than-temporary declines in the value of marketable and non-marketable equity securities and unrealized holding gains and losses associated with our deferred compensation plan assets (classified as trading securities), and gains and losses of Adobe Ventures.
associated with our direct and indirect investments in privately held companies.
Investment gains and (losses), net fluctuated due to the following (in millions):
| 2010 | 2009 | 2008 | ||||||||||||||||||||||
Net (losses) gains related to our investments in Adobe Ventures and cost method investments | $ | (11.3 | ) | $ | (18.7 | ) | $ | 15.9 | ||||||||||||||||
| Fiscal 2013 | Fiscal 2012 | Fiscal 2011 | ||||||||||||||||||||||
| Write-downs due to other-than-temporary declines in value of our marketable and non-marketable equity securities | $ | (7.0 | ) | $ | (0.1 | ) | $ | (0.2 | ) | |||||||||||||||
| Net gains related to our trading securities | 3.0 | 1.6 | — | |||||||||||||||||||||
| Net gains (losses) related to our direct and indirect investments in privately held companies | — | (0.2 | ) | 5.3 | ||||||||||||||||||||
| Gains from sale of marketable equity securities | 4.0 | — | 5.4 | — | 8.2 | 0.8 | ||||||||||||||||||
Write-downs due to other-than-temporary declines in value of our marketable equity securities | — | (0.3 | ) | (4.9 | ) | |||||||||||||||||||
| Net gains related to our trading securities | 1.2 | 2.0 | — | |||||||||||||||||||||
| Total investment gains (losses), net | $ | (6.1 | ) | $ | (17.0 | ) | $ | 16.4 | $ | (4.0 | ) | $ | 9.5 | $ | 5.9 | |||||||||
During fiscal 2010,2013, total investment gains (losses), net decreased to net losses on our investments improved primarily due to a decrease in net unrealized losses incurred on certainrealized gains from the sale of marketable equity securities and an increase in write-downs for other-than-temporary declines in value of our cost methoddirect investments duringin privately held companies.
During fiscal 2009 offset in part by2012, total investment gains (losses), net improved primarily due to an increase in net realized lossesgains from the sale of marketable equity securities. This was offset in part by a decrease in realized gains related to our Adobe Ventures portfolio ofdirect investments in privately held companies in fiscal 2010.
49
Provision for Income Taxes (dollars in millions)
Fiscal 2010 | Fiscal 2009 | Fiscal 2008 | % Change 2010-2009 | % Change 2009-2008 | Fiscal 2013 | Fiscal 2012 | Fiscal 2011 | % Change 2013-2012 | % Change 2012-2011 | |||||||||||||||||||||||||||
Provision | $ | 168.5 | $ | 315.0 | $ | 206.7 | (47 | )% | 52 | % | $ | 66.2 | $ | 286.0 | $ | 202.4 | (77 | )% | 41 | % | ||||||||||||||||
Percentage of total revenue | 4 | % | 11 | % | 6 | % | 2 | % | 6 | % | 5 | % | ||||||||||||||||||||||||
Effective tax rate | 18 | % | 45 | % | 19 | % | 19 | % | 26 | % | 20 | % | ||||||||||||||||||||||||
Our effective tax rate decreased by approximately 27seven percentage points during fiscal 20102013 as compared to fiscal 2009.2012. The decrease wasis primarily duerelated to tax benefits recognized as a resultthe retroactive reinstatement of the completion in the fourth quarter of fiscal 2010 of a U.S. income tax examination covering fiscal years 2005 through 2007 and stronger international profits, partially offset by the expiration of the research and development credit on December 31, 2009.
which resulted in the credits for both fiscal 2012 and 2013 being reflected in the fiscal 2013 results.
Our effective tax rate increased by approximately 26six percentage points during fiscal 20092012 as compared to fiscal 2008.2011. The rate increase in fiscal 2012 was primarily due to a one-time charge related to our acquisition of Omniture. The charge represented the tax cost of inter-company transactions necessary to license certain Omniture assets to Adobe’s trading companies so that Omniture’s services can be offered to customers from Adobe companies.
We are a United States-based multinational company subject to tax in multiple U.S. and foreign tax jurisdictions. A significant portion of our foreign earnings for the first quartercurrent fiscal year were earned by our Irish subsidiaries. In addition to providing for U.S. income taxes on earnings from the U.S., we provide for U.S. income taxes on the earnings of fiscal 2011 will includeforeign subsidiaries unless the subsidiaries' earnings are considered permanently reinvested outside the U.S. While we do not anticipate changing our intention regarding permanently reinvested earnings, if certain foreign earnings previously treated as permanently reinvested are repatriated, the related U.S. tax liability may be reduced by any foreign income taxes paid on these earnings. Currently, there are a discrete tax benefitsignificant amount of foreign earnings upon which will reduce our effective tax rate for the quarter and to a lesser extent the effective annual tax rate.U.S. income taxes have not been provided.
Accounting for Uncertainty in Income Taxes
The gross liability for unrecognized tax benefits at December 3, 2010November 29, 2013 was $156.9$136.1 million, exclusive of $15.4 million of interest and penalties.
As of November 29, 2013, the combined amount of accrued interest and penalties related to tax positions taken on our tax returns was $59approximately $11.4 million and was previously reported. This amount is included in long-termnon-current income taxes. We paid $20 million in conjunction with the aforementioned resolution. A net income statement tax benefit in the fourth quarter of fiscal 2010 of $39 million resulted.taxes payable.
The timing of the resolution of income tax examinations is highly uncertain as are the amounts and timing of tax payments that are part of any audit settlement process. These events could cause large fluctuations in the balance sheet classification of current and non-current assets and liabilities. We believe that beforewithin the end of fiscal 2011,next 12 months, it is reasonably possible that either certain audits will conclude or statutes of limitations on certain income tax examination periods will expire, or both. Given the uncertainties described above, we can only determine a range of estimated potential decreases in underlying unrecognized tax benefits ranging from $0$0 to approximately $5 million. $5 million.
In July 2013, a U.S. income tax examination covering our fiscal years 2008 and 2009 was completed. Our accrued tax and interest related to these years was $48.4 million and was previously reported in long-term income taxes payable. We settled the tax obligation resulting from this examination with cash and income tax assets totaling $41.2 million, and the resulting $7.2 million income tax benefit was recorded in the third quarter of fiscal 2013.
LIQUIDITY AND CAPITAL RESOURCES
This data should be read in conjunction with our Consolidated Statements of Cash Flows.
| As of | |||||||
| (in millions) | November 29, 2013 | November 30, 2012 | |||||
| Cash and cash equivalents | $ | 834.6 | $ | 1,425.1 | |||
| Short-term investments | $ | 2,339.2 | $ | 2,113.3 | |||
| Working capital | $ | 2,520.3 | $ | 3,125.3 | |||
| Stockholders’ equity | $ | 6,724.6 | $ | 6,665.2 | |||
| (in millions) | Fiscal 2010 | Fiscal 2009 | ||||||
Cash and cash equivalents | $ | 749.9 | $ | 999.5 | ||||
Short-term investments | $ | 1,718.1 | $ | 905.0 | ||||
Working capital | $ | 2,148.0 | $ | 1,629.1 | ||||
| Stockholders’ equity | $ | 5,192.4 | $ | 4,890.6 |
50
A summary of our cash flows is as follows:
| (in millions) | Fiscal 2013 | Fiscal 2012 | Fiscal 2011 | ||||||||
| Net cash provided by operating activities | $ | 1,151.7 | $ | 1,499.6 | $ | 1,543.3 | |||||
| Net cash used for investing activities | (1,177.8 | ) | (834.7 | ) | (757.4 | ) | |||||
| Net cash used for financing activities | (559.1 | ) | (234.7 | ) | (550.4 | ) | |||||
| Effect of foreign currency exchange rates on cash and cash equivalents | (5.2 | ) | 5.4 | 4.1 | |||||||
| Net increase (decrease) in cash and cash equivalents | $ | (590.4 | ) | $ | 435.6 | $ | 239.6 | ||||
| (in millions) | Fiscal 2010 | Fiscal 2009 | Fiscal 2008 | |||||||||
Net cash provided by operating activities | $ | 1,113.0 | $ | 1,117.8 | $ | 1,280.7 | ||||||
Net cash used for investing activities | (1,159.3 | ) | (1,497.1 | ) | (304.7 | ) | ||||||
Net cash (used for) provided by financing activities | (215.3 | ) | 477.6 | (1,021.6 | ) | |||||||
| Effect of foreign currency exchange rates on cash and cash equivalents | 12.0 | 14.7 | (14.4 | ) | ||||||||
Net (decrease) increase in cash and cash equivalents | $ | (249.6 | ) | $ | 113.0 | $ | (60.0 | ) |
Our primary source of cash is receipts from revenue. The primary uses of cash are payroll related expenses;expenses, general operating expenses including marketing, travel and office rent;rent, and cost of product revenue. Other sources of cash are proceeds from the exercise of employee options and participation in ESPP. Another usethe employee stock purchase plan. Other uses of cash isinclude our stock repurchase program, which is described below.
below, business acquisitions and purchases of property and equipment.
Cash flowsFlows from operating activities
Operating Activities
For fiscal 2010,2013, net cash provided by operating activities of $1.1 billion$1,151.7 million was primarily comprised of net income plus the net effect of non-cash items. The primary working capital sources of cash were net income coupled with increases in deferred revenue and accrued expenses and deferred revenue.decreases in trade receivables. Deferred revenue increased primarily due to increased subscription and ETLA activity for our Creative Cloud offering and increases in Digital Marketing hosted services, offset in part by decreases in billings for our maintenance and Creative product software upgrade plans which we discontinued in January 2013. Accrued expenses increased primarily due to amounts due under our fiscal 20102013 annual incentive plan and interest on our Notes both of which will be paid insales commission accruals associated with higher achievement levels. Trade receivables declined primarily due to lower perpetual license revenue levels and improved collections compared to the firstfourth quarter of fiscal 2011. During fiscal 2010, we made our first semi-annual interest payment associated with our Notes totaling $31.1 million. Increases in deferred revenue related primarily to activity from our acquisition of Omniture, the related renewal of calendar-year based contracts in addition to increases in maintenance and support orders and royalty revenue deferrals related to changes in cust omer billing terms.
2012.
The primary working capital uses of cash were increases in trade receivables, prepaid expenses and other current assets as well as decreases in taxes payable accrued restructuring and trade payables. Trade receivables increased as a result of products shipped and billed during the latter half of the fourth quarter of fiscal 2010 as a result of the launch of Acrobat X and slower receivable payments pertaining to Omniture services. Increasesincreases in prepaid expenses and other current assets
For fiscal 2009,2012, net cash provided by operating activities of $1.1 billion$1,499.6 million was primarily comprised of net income plus the net effect of non-cash expenses.items. The primary working capital sources of cash were net income coupled with increases in deferred revenue and decreases in trade receivables. Deferred revenue increased primarily due to an increase in activity for both upgrade plans with support and site and term licenses largely associated with our Digital Media and Digital Marketing enterprise license agreements. The decrease in trade receivables prepaid expensesis primarily related to an increase in revenue linearity and other current assets and increasesimproved collections in income taxes payable. Trade receivables decreased primarily from CS4our Digital Marketing portfolio offset in part by higher revenue that was shippedlevels due to the CS6 product release which occurred late in the latter half of the fourthsecond quarter of fiscal 2008 and collected during the first quarter of fiscal 2009, in addition to lower overall gross revenue and improved collections.
2012.
The primary working capital uses of cash were decreases in accrued expenses, deferred revenue,restructuring and trade payablespayables. Decreases in accrued restructuring primarily related to payments and accrued restructuring. Accrued expensesadjustments for employee terminations and facility exit costs associated with the Fiscal 2011 Restructuring Plan, a significant portion of which were paid and adjusted in the first and second quarters of fiscal 2012. Trade payables decreased primarily due to the timing of payments for employee bonuses and commissions relatedas a greater number of invoices were paid prior to the fiscal year end in fiscal 2012 as compared to fiscal 2008. Decreases in deferred revenue related primarily to deferred revenue that was recognized in the first quarter of fiscal 2009 associated with our free of charge upgrades for CS4 and Adobe Photoshop Lightroom products, as well as declines in maintenance and support orders. Accrued restructuring decreased primarily due to payments related to the 2008 restructuring program that was initiated in the fourth quarter of fiscal 2008, offset in part by new charges related to our 2009 restructuring program and acquisition of Omniture.
2011.
For fiscal 2008,2011, net cash provided by operating activities of $1.3 billion$1,543.3 million was primarily comprised of net income plus the net effect of non-cash expenses.items. The primary working capital sources of cash were net income coupled with increases in net income, deferred revenue and accrued restructuring and trade payables.restructuring. Increases in deferred revenue related primarily to an overall increase in billing activity for maintenance and supportsupport/upgrade plans, hosted and freeprofessional services and site and term licenses. Accrued restructuring increased primarily due to recognition of charge upgrade plan purchases which offset in part, decreases in deferred revenueliabilities related to royalties. Accrued restructuringemployee termination and facility exit costs increased due toassociated with the restructuring program initiatedFiscal 2011 Restructuring Plan which occurred in the fourth quarter of fiscal 2008 offset2011 for which a majority was paid and adjusted in part by paymentsthe first and second quarters of facility costs during fiscal 2008 associated with the Macromedia acquisition. See Note 11 of our Notes to Consolidated Financial Statements for information regarding our restruct uring charges.2012.
The primary working capital uses of cash for fiscal 2011 were increases in trade receivables and prepaid expenses and other current assets coupled with decreases in incomeaccrued expenses and taxes payable and accrued expenses.payable. Trade receivables increased primarily as a result of highoverall higher sales levels and billing occurring during the latter half of our CS4 family of products at the endfourth quarter of fiscal 2008. Income taxes payable decreased primarily due to payments made as the result of the completion of a U.S. income tax examination covering our fiscal years 2001 through 2004. Accrued expenses decreased primarily due to payments for employee bonuses and profit sharing2011, offset in part by an increased rate of collection for Digital Marketing services. Decreases in accrued expenses were primarily related to lower accrued bonus levels in fiscal 2011, coupled with payment of our second and third semi-annual interest payments associated with our Notes totaling $62.3 million. The resulting reduction in accrued interest was partially offset by additional interest accruals made during the period. Taxes payable decreased
51
primarily due to the resolution of a Canadian Tax audit offset in part by quarterly increases to the tax provision in royalty accruals and charitable contributions.
excess of taxes paid.
Cash flowsFlows from investing activities
Investing Activities
For fiscal 2010,2013, net cash used for investing activities of $1.2 billion$1,177.8 million was primarily due to our acquisitions of Neolane and Behance. Other uses of cash during fiscal 2013 represented purchases of short-term investments, purchases of property and equipment associated with our construction projects in Oregon and India and purchases of long-term technology licenses. These cash outflows were offset in part by sales and maturities of short-term investments and the sale of the Waltham Property. See Note 2 of our Notes to the Consolidated Financial Statements for further information regarding our acquisitions of Neolane and Behance.
For fiscal 2012, net cash used for investing activities of $834.7 million was primarily due to our acquisition of Efficient Frontier in the first quarter of fiscal 2012. Other uses of cash during fiscal 2012 represented purchases of short-term investments and property and equipment, offset in part by sales and maturities of short-term investments. See Note 2 of our Notes to the Consolidated Financial Statements for further information regarding our acquisition of Efficient Frontier.
For fiscal 2011, net cash used for investing activities of $757.4 million was primarily due to purchases of short-term investments and multiple business acquisitions, offset in part by maturities and sales of short-term investments. Other uses of cash during fiscal 20102011 represented purchases of property, plant and equipment and long-term investments, and other assets and the acquisition of Day. These uses of cash were offset in part by proceeds from the sale of equipment under our sale lease-back transaction and the sale of long-term investmentsintangibles and other assets.See Note 16 of our Notes to Consolidated Financial Statements for information regarding our sale lease-back transaction.
Cash Flows from Financing Activities
For fiscal 2009,2013, fiscal 2012 and fiscal 2011, net cash used for investingfinancing activities of $1.5 billion$559.1 million, $234.7 million and $550.4 million, respectively, was primarily due to the acquisition of Omniture, purchases of short-term investments and property and equipment, offset in part by maturities and sales of short-term investments. Purchases of long-term investments and other assets during fiscal 2009 were less than fiscal 2008 primarily due to $56.0 million paid in the third quarter of fiscal 2008 for future licensing rights acquired through certain technology licensing arrangements which did not recur in fiscal 2009.
We expect to continue our investing activities, including short-term and long-term investments, venture capital, facilities expansion and purchases of computer systems for research and development, sales and marketing, product support and administrative staff. Furthermore, cash reserves may be used to repurchase stock under our stock repurchase program and to strategically acquire companies, products or technologies that are complementary to our business.
Restructuring
During the past several years, we have initiated various restructuring plans. Currently, we have the following fourtwo active restructuring plans twothat were of which were the result of large acquisitions:significance to us:
Fiscal 2011 Restructuring Plan
Fiscal 2009 Restructuring Plan
As of November 30, 2012, we accrued total restructuring charges of $21.6 million of which $2.3 million related to ongoing termination benefits and contract terminations. The remaining accrued restructuring charges of $19.3 million related to the cost of closing redundant facilities.
During fiscal 2009, we accrued total restructuring charges of approximately $44.7 million of which approximately $31.0 million related to ongoing termination benefits and contract terminations which were substantially paid during fiscal 2010. The remaining $13.7 million related to the cost of closing redundant facilities that are expected to be paid through 2013. During fiscal 2009,2012, we made payments related to the above restructuring plans totaling approximately $49.7$63.1 million which consisted of approximately $37.6$50.5 million and $12.6 million in payments related to termination benefits and contract terminations and approximately $12.1 million relatedthe closing of redundant facilities, respectively.
We believe that our existing cash and cash equivalents, short-term investments and cash generated from operations will be sufficient to meet the costcash outlays for the restructuring actions described above.
See Note 10 of closing redundant facilities.
our Notes to Consolidated Financial Statements for additional information regarding our restructuring plans.
Other Liquidity and Capital Resources Considerations
Our existing cash, cash equivalents and investment balances may fluctuate during fiscal 20112014 due to changes in our planned cash outlay, including changes in incremental costs such as direct and integration costs related to our business acquisitions. Our cash and investments totaled $3.2 billion as of November 29, 2013. Of this amount, approximately 80% was held by our foreign
52
subsidiaries and subject to material repatriation tax effects. Our intent is to permanently reinvest a significant portion of our earnings from foreign operations, and current plans do not anticipate that we will need funds generated from foreign operations to fund our domestic operations. In the event funds from foreign operations are needed to fund operations in the United States and if U.S. tax has not already been previously provided, we would provide for and pay additional U.S. taxes in connection with repatriating these funds.
Cash from operations could also be affected by various risks and uncertainties, including, but not limited to the risks detailed in Part I, Item 1A titled “Risk Factors.”Factors”. However, based on our current business plan and revenue prospects, we believe that our existing balances, our anticipated cash flows from operations and our available credit facility will be sufficient to meet our working capital and operating resource expenditure requirements for the next twelve months.
As of December 3, 2010,November 29, 2013, the amount outstanding under the Notesour senior notes was $1.5 billion.$1.5 billion. On February 1, 2010,March 2, 2012, we usedentered into a five-year $1.0 billion senior unsecured revolving credit agreement (the “Credit Agreement”), providing for loans to us and certain of our subsidiaries. On March 1, 2013, we exercised our option under the Credit Agreement to extend the maturity date of the proceeds from this offeringCredit Agreement by one year to pay the outstanding balance on our credit facility. The remainderMarch 2, 2018. As of the proceeds from the Notes are available for general corporate purposes. There isNovember 29, 2013, there were no outstanding balanceborrowings under our credit facilitythis Credit Agreement and the entire $1.0 billion credit line remains available for borrowing.
We use professional investment management firms to manage a large portion of our invested cash. External investment firms managed, on average, 79%77% of our consolidated invested balances during the fourth quarter of fiscal 2010.2013. The fixed income portfolio is primarily invested in corporate bonds and commercial paper, U.S. agency securities and U.S. Treasury securities, U.S. agency securities, municipal securities corporate bonds and foreign government securities.
In September 2013, we finalized the sale of the Waltham property assets for net proceeds of $24.3 million. The sale price, net of costs to sell, approximated the carrying value of the assets at the time of sale. See Note 6 for further details regarding our assets held for sale.
Stock Repurchase Program I
During fiscal 2010, 20092013, 2012 and 20082011, we entered into several structured stock repurchase agreements with large financial institutions, whereupon we provided the financial institutionsthem with prepayments of $850.0totaling $1.1 billion, $405.0 million $350.0 and $695.0 million and $525.0 million,, respectively. The $1.1 billion prepayments during fiscal 2013 were under the $2.0 billion stock repurchase authority. Of the $850.0$405.0 million of prepayments during fiscal 2010, $250.02012, $100.0 million was were under the$2.0 billion stock repurchase program prior to the program amendment and the remaining $600.0$305.0 million was were under our previous $1.6 billion stock repurchase authority. The $695.0 million of prepayments during fiscal 2011 were under the amended $1.6$1.6 billion time-constrained dollar-based stock repurchase authority. We enteredenter into these agreements in order to take advantage of repurchasing shares at a guaranteed discount to the Volume Weighted Average Price (“VWAP”) of our common stock over a specified period of time. We only enter into such transactions when the discount that we receive is higher than the foregone return on our cas hcash prepayments to the financial institutions. There were no explicit commissions or fees on these structured repurchases. Under the terms of the agreements, there is no requirement for the financial institutions to return any portion of the prepayment to us.
The financial institutions agree to deliver shares to us at monthly intervals during the contract term. The parameters used to calculate the number of shares deliverable are: the total notional amount of the contract, the number of trading days in the contract, the number of trading days in the interval and the average VWAP of our stock during the interval less the agreed upon discount. During fiscal 2010,2013, we repurchased approximately 31.221.6 million shares at an average price of $29.19$46.47 through structured repurchase agreements entered into during fiscal 20092013 and fiscal 2010.2012. During fiscal 2009,2012, we repurchased approximately 15.211.5 million shares at an average price of $32.29 through structured repurchase agreements entered into during fiscal 2012. During fiscal 2011, we repurchased approximately 21.8 million shares at an average price per share of $27.89$31.81 through structured repurchase agreements entered into during fiscal 2008 and fiscal 2009. During fiscal 2008, we repurchased 22.4 million shares at an a verage price of $36.26 through structured repurchase agreements which included prepayments from fiscal 2007.2011.
For fiscal 2010, 20092013, 2012 and 2008,2011, the prepayments were classified as treasury stock on our Consolidated Balance Sheets at the payment date, though only shares physically delivered to us by November 29, 2013, November 30, 2012 and December 3, 2010, November 27, 2009 and November 28, 20082, 2011 were excluded from the computation of earnings per share. As of December 3, 2010, no prepayments remained under the agreements. As of November 27, 2009, approximately $59.929, 2013, $129.2 million of prepayments remained under the agreements.
agreement.
Subsequent to December 3, 2010,November 29, 2013, as part of our $1.6$2.0 billion stock repurchase program, we entered into a structured stock repurchase agreement with a large financial institution whereupon we provided them with a prepayment of $125.0 million.$200.0 million. This amount will be classified as treasury stock on our Consolidated Balance Sheets. Upon completion of the $125.0$200.0 million stock
53
repurchase agreement, $875.0$600.0 million remains under our time-constrained dollar-basedcurrent authority. See Note 14 and 2113 of our Notes to Consolidated Financial Statements for further discussion of our stock repurchase programs.
See Item 5, Market for Registrant’s Common Equity, Related Stockholder Matters and Issuer Purchases of Equity Securitiesfor share repurchases during the quarter ended December 3, 2010.November 29, 2013.
Summary of Stock Repurchases for fiscal 2010, 2009Fiscal 2013, 2012 and 20082011
(in thousands, except average amounts)
| Board Approval | Repurchases | 2010 | 2009 | 2008 | ||||||||||||||||||||||||||||||||||||||||||
| Date | Under the Plan | Shares | Average | Shares | Average | Shares | Average | |||||||||||||||||||||||||||||||||||||||
Board Approval Date | Repurchases Under the Plan | 2013 | 2012 | 2011 | ||||||||||||||||||||||||||||||||||||||||||
| Shares | Average | Shares | Average | Shares | Average | |||||||||||||||||||||||||||||||||||||||||
| December 1997 | From employees(1) | 1 | $ | 35.66 | 1 | $ | 24.00 | 5 | $ | 34.89 | From employees(1) | — | $ | — | 1 | $ | 33.57 | |||||||||||||||||||||||||||||
| Open market | — | $ | — | — | $ | — | 3,554 | $ | 36.41 | Structured repurchases(2) | — | $ | — | — | $ | — | — | $ | — | |||||||||||||||||||||||||||
Structured repurchases(2) | 9,358 | $ | 33.11 | 15,231 | $ | 27.89 | 22,418 | $ | 36.26 | |||||||||||||||||||||||||||||||||||||
| April 2007 | Structured repurchases(2) | — | $ | — | — | $ | — | 31,859 | $ | 37.15 | ||||||||||||||||||||||||||||||||||||
| Open market | — | $ | — | — | $ | — | 456 | $ | 39.79 | |||||||||||||||||||||||||||||||||||||
| June 2010 | Structured repurchases(2) | 21,807 | $ | 27.51 | — | $ | — | — | $ | — | Structured repurchases(2) | — | $ | — | 9,482 | $ | 32.17 | 21,849 | $ | 31.81 | ||||||||||||||||||||||||||
| April 2012 | Structured repurchases(2) | 21,603 | $ | 46.47 | 2,038 | $ | 32.87 | — | $ | — | ||||||||||||||||||||||||||||||||||||
| Total shares | 31,166 | $ | 29.19 | 15,232 | $ | 27.89 | 58,292 | $ | 36.79 | 21,603 | $ | 46.47 | 11,520 | $ | 32.29 | 21,850 | $ | 31.81 | ||||||||||||||||||||||||||||
| Total cost | $ | 909,900 | $ | 424,851 | $ | 2,144,400 | $ | 1,003,794 | $ | 371,995 | $ | 695,015 | ||||||||||||||||||||||||||||||||||
_________________________________________
(1) | The repurchases from employees represent shares |
(2) | Stock repurchase agreements executed with large financial institutions. See |
Off-Balance Sheet Arrangements and Aggregate Contractual Obligations
Our principal commitments as of December 3, 2010November 29, 2013 consist of obligations under operating leases, capital leases, royalty agreements and various service agreements. See Note 1615 of our Notes to Consolidated Financial Statements for additional information regarding our contractual commitments.
Contractual Obligations
The following table summarizes our contractual obligations as of December 3, 2010November 29, 2013 (in millions):
| Payment Due by Period | Payment Due by Period | |||||||||||||||||||||||||||||||||||||||
| Total | Less than 1 year | 1-3 years | 3-5 years | More than 5 years | Total | Less than 1 year | 1-3 years | 3-5 years | More than 5 years | |||||||||||||||||||||||||||||||
| Notes | $ | 1,993.9 | $ | 62.3 | $ | 124.5 | $ | 714.8 | $ | 1,092.3 | $ | 1,807.2 | $ | 62.3 | $ | 695.3 | $ | 85.5 | $ | 964.1 | ||||||||||||||||||||
| Operating leases | 273.8 | 61.7 | 85.6 | 45.5 | 81.0 | |||||||||||||||||||||||||||||||||||
| Operating lease obligations | 214.1 | 47.2 | 62.8 | 43.7 | 60.4 | |||||||||||||||||||||||||||||||||||
| Capital lease obligations | 30.6 | 9.9 | 19.9 | 0.8 | — | 18.2 | 14.9 | 3.3 | — | — | ||||||||||||||||||||||||||||||
| Purchase obligations | 214.5 | 175.1 | 16.0 | 8.3 | 15.1 | 498.3 | 390.8 | 80.8 | 16.7 | 10.0 | ||||||||||||||||||||||||||||||
| Total | $ | 2,512.8 | $ | 309.0 | $ | 246.0 | $ | 769.4 | $ | 1,188.4 | $ | 2,537.8 | $ | 515.2 | $ | 842.2 | $ | 145.9 | $ | 1,034.5 | ||||||||||||||||||||
Senior Notes
In February 2010, we issued $600.0$600.0 million of 3.25% senior notes due February 1, 2015 and $900.0$900.0 million of 4.75% senior notes due February 1, 2020. As of November 27, 2009, we had an outstanding credit facility of $1.0 billion which we repaid on February 1, 2010 using the proceeds from the Notes.2020. Interest on the Notes is payable semi-annually, in arrears on February 1 and August 1, commencing on August 1, 2010. During fiscal 2013 interest payments totaled $62.3 million. At November 29, 2013, our maximum commitment for interest payments under the Notes was $307.1 million.
Capital Lease Obligation
In August 2010, we made ourthe first semi-annual interestquarter of $31.1 million.
Covenants
Our credit facility contains a financial covenant requiring us not to exceed a certain maximum leverage ratio. Our leases for the East and West Towers and the Almaden Tower are both subject to standard covenants includinglease includes certain financial ratios as defined in the lease agreements that are reported to the lessors quarterly. As of December 3, 2010,November 29, 2013, we were in compliance with all of our covenants. Our Notes do not contain any financial covenants. We believe these covenants will not impact our credit or cash in the coming fiscal year or restrict our ability to execute our business plan. Our Notes do not contain any financial covenants.
54
Under the terms of our credit agreement and lease agreements, we are not prohibited from paying cash dividends unless payment would trigger an event of default or one currently exists. We do not anticipate paying any cash dividends in the foreseeable future.
Accounting for Uncertainty in Income Taxes
The gross liability for unrecognized tax benefits at December 3, 2010November 29, 2013 was $156.9$136.1 million, exclusive of interest and penalties.
The timing of the resolution of income tax examinations is highly uncertain as are the amounts and timing of tax payments that are part of any audit settlement process. These events could cause large fluctuations in the balance sheet classification of current and non-current assets and liabilities. We believe that beforewithin the end of fiscal 2011,next 12 months, it is reasonably possible that either certain audits will conclude or statutes of limitations on certain income tax examination periods will expire, or both. Given the uncertainties described above, we can only determine a range of estimated potential decreases in underlying unrecognized tax benefits ranging from $0$0 to approximately $5 million.
$5 million.
Royalties
We have certain royalty commitments associated with the shipment and licensing of certain products. Royalty expense is generally based on a dollar amount per unit shipped or a percentage of the underlying revenue.
Indemnifications
In the normal course of business, we provide indemnifications of varying scope to customers against claims of intellectual property infringement made by third parties arising from the use of our products.products and from time to time, we are subject to claims by our customers under these indemnification provisions. Historically, costs related to
these indemnification provisions have not been significant and we are unable to estimate the maximum potential impact of these indemnification provisions on our future results of operations.
To the extent permitted under Delaware law, we have agreements whereby we indemnify our directors and officers for certain events or occurrences while the director or officer is or was serving at our request in such capacity. The indemnification period covers all pertinent events and occurrences during the director’sdirector's or officer’sofficer's lifetime. The maximum potential amount of future payments we could be required to make under these indemnification agreements is unlimited; however, we have director and officer insurance coverage that limits our exposure and enables us to recover a portion of any future amounts paid. We believe the estimated fair value of these indemnification agreements in excess of applicable insurance coverage is minimal.
All market risk sensitive instruments were entered into for non-trading purposes.
Foreign Currency Risk
Foreign Currency Exposures and Hedging Instruments
In countries outside the U.S., we transact business in U.S. dollarsDollars and various other currencies. Transactions denominated in Euro, Yen and British Poundscurrencies which subject us to exposure from movements in exchange rates. We may use foreign exchange purchased options or forward contracts to hedge our foreign currency revenue denominated in Euro, British Pounds and Yen. Additionally, we hedge our net recognized foreign currency assets and liabilities with foreign exchange forward contractscontracts. We hedge these exposures to reduce the risk that our earnings and cash flows will be adversely affected by changes in exchange rates. We may use foreign exchange option or forward contracts for Euro- , Yen-, or British Pound-denominated revenue.
| Fiscal 2013 | Fiscal 2012 | Fiscal 2011 | |||||||||
| Euro | € | 434.7 | € | 530.7 | € | 557.6 | |||||
| Yen (in billions) | ¥ | 32.5 | ¥ | 34.8 | ¥ | 34.7 | |||||
| British Pounds | £ | 145.3 | £ | 145.1 | £ | 144.8 | |||||
55
As of December 3, 2010,November 29, 2013, the total absolute value of all outstanding foreign exchange contracts, including options and forwards, was $1,035.8$718.5 million which in cludedincluded the notional equivalent of $570.1$312.7 million in Euros, $104.2 million in Euro, $222.6British Pounds, $169.8 million in Yen and $243.1$131.8 million in other foreign currencies. These hedges are foreign currency forward exchange contracts which hedged our balance sheet exposures and purchased put option contracts which hedged our forecasted revenue. As of December 3, 2010,November 29, 2013, all contracts were set to expire at various timesdates through June 2011.2014. The bank counterparties in these contracts expose us to credit-related losses in the event of their nonperformance. However, to mitigate that risk, we only contract with counterparties who meet our minimum requirements under our counterparty risk assessment process. In addition, our hedging policy establishes maximum limits for each counterparty.
A sensitivity analysis was performed on all of our foreign exchange derivatives as of November 29, 2013. This sensitivity analysis measures the hypothetical market value resulting from a 10% shift in the value of exchange rates relative to the U.S. Dollar. For option contracts, the Black-Scholes option pricing model was used. A 10% increase in the value of the U.S. Dollar and a corresponding decrease in the value of the hedged foreign currency asset would lead to an increase in the fair value of our financial hedging instruments by $34.6 million. Conversely, a 10% decrease in the value of the U.S. Dollar would result in a decrease in the fair value of these financial instruments by $9.3 million.
We also have long-term investment exposures consisting of the capitalization and retained earnings in our non-USD functional currency foreign subsidiaries. As of December 3, 2010November 29, 2013 and November 27, 2009,30, 2012, this long-term investment exposure totaled a notional equivalent of $387.6$355.6 million and $228.8$419.6 million, respectively. At this time, we do not hedge these long-term investment exposures.
We do not use foreign exchange contracts for speculative trading purposes, nor do we hedge our foreign currency exposure in a manner that entirely offsets the effects of changes in foreign exchange rates. We regularly review our hedging program and assess the need to utilize financial instruments to hedge currency exposures on an ongoing basis.
Economic Hedging—Hedges of Forecasted Transactions
We may use foreign exchange option contractspurchased options or forward contracts to hedge certain operational (“foreign currency revenue denominated in Euros, British Pounds and Yen. We hedge these cash flow”)flow exposures resulting fromto reduce the risk that our earnings and cash flows will be adversely affected by changes in foreign currency exchange rates. These foreign exchange contracts, carried at fair value, may have maturities between one and twelve months. Such cash flow exposures result from portions of our forecasted
We record changes in the intrinsic value of these cash flow hedges in accumulated other comprehensive income, until the forecasted transaction occurs. When the forecasted transaction occurs, we reclassify the related gain or loss on the cash flow hedge to revenue. In the event the underlying forecasted transaction does not occur, or it becomes probable that it will not occur, we reclassify the gain or loss on the related cash flow hedge from accumulated other comprehensive income to interest and other income, net on our Consolidated Statements of Income at that time. For the fiscal year ended December 3, 2010, there were no suchNovember 29, 2013, net gains or losses recognized in other income relating to hedges of forecasted transactions that did not occur.
occur were insignificant.
See Note 5 of our Notes to Consolidated Financial Statements for information regarding our hedging activities.
Balance Sheet Hedging—Hedging of Foreign Currency Assets and Liabilities
We hedge exposures related to our net recognized foreign currency assets and liabilities with foreign exchange forward contracts to reduce the risk that our earnings and cash flows will be adversely affected by changes in foreign currency exchange rates. These derivative instruments hedge assets and liabilities that are denominated in foreign currencies andexchange contracts are carried at fair value with changes in the fair value recorded as interest and other income, net. These derivative instrumentsforeign exchange contracts do not subject us to material balance sheet risk due to exchange rate movements because gains and losses on these derivativescontracts are intended to offset gains and losses on the assets and liabilities being hedged. At December 3, 2010,November 29, 2013, the outstanding balance sheet hedging derivatives had maturities of 90180 days or less.
See Note 5 of our Notes to Consolidated Financial Statements for information regarding our hedging activities.
56
Interest Rate Risk
Short-Term Investments and Fixed Income Securities
At December 3, 2010,November 29, 2013, we had debt securities classified as short-term investments of $1,706.9 million.$2.3 billion. Changes in interest rates could adversely affect the market value of these investments. The following table separates these investments, based on stated maturities, to show the approximate exposure to interest rates (in millions):
| Due within one year | $ | 625.4 | $ | 509.4 | |||
| Due within two years | 523.2 | 908.8 | |||||
| Due within three years | 446.3 | 702.0 | |||||
| Due after three years | 112.0 | 218.3 | |||||
| Total | $ | 1,706.9 | $ | 2,338.5 | |||
A sensitivity analysis was performed on our investment portfolio as of December 3, 2010.November 29, 2013. The analysis is based on an estimate of the hypothetical changes in market value of the portfolio that would result from an immediate parallel shift in the yield curve of various magnitudes.
The following tables present the hypothetical fair values of our debt securities classified as short-term investments assuming immediate parallel shifts in the yield curve of 50 basis points (“BPS”), 100 BPS and 150 BPS. The analysis is shown as of December 3, 2010November 29, 2013 and November 27, 200930, 2012 (dollars in millions):
| -150 BPS | -100 BPS | -50 BPS | Fair Value 12/3/2010 | +50 BPS | +100 BPS | +150 BPS | |||||||||||||||||||
| 1,730.2 | 1,726.4 | 1,718.9 | 1,706.9 | 1,694.7 | 1,682.6 | 1,670.6 | |||||||||||||||||||
| -150 BPS | -100 BPS | -50 BPS | Fair Value 11/27/2009 | +50 BPS | +100 BPS | +150 BPS | -150 BPS | -100 BPS | -50 BPS | Fair Value 11/29/13 | +50 BPS | +100 BPS | +150 BPS | ||||||||||||
| 910.8 | 909.2 | 905.4 | 900.0 | 893.9 | 888.0 | 882.2 | |||||||||||||||||||
| 2,363.7 | 2,360.9 | 2,353.8 | 2,338.5 | 2,320.5 | 2,302.5 | 2,284.5 | |||||||||||||||||||
| -150 BPS | -150 BPS | -100 BPS | -50 BPS | Fair Value 11/30/12 | +50 BPS | +100 BPS | +150 BPS | ||||||||||||||||||
| 2,138.4 | 2,136.6 | 2,129.3 | 2,113.1 | 2,094.6 | 2,076.5 | 2,058.5 | |||||||||||||||||||
Other Market Risk
Privately Held Long-Term Investments
The privately held companies in which we invest can still be considered in the start-up or development stages which are inherently risky. The technologies or products these companies have under development are typically in the early stages and may never materialize, which could result in a loss of a substantial part of our initial investment in these companies. The evaluation of privately held companies is based on information that we request from these companies, which is not subject to the same disclosure regulations as U.S. publicly traded companies, and as such, the basis for these evaluations is subject to the timing and accuracy of the data received from these companies.
We are exposedhave minimal exposure to equity price risk on our portfolio of marketable equity securities. As of December 3, 2010,November 29, 2013 and November 30, 2012, our total equity holdings in publicly traded companies were valued at $11.2 million compared to $5.0 million at November 27, 2009. The increase was primarily due to the change in the fair value of our equity holdings during fiscal 2010.
| (in millions) | 50% | 35% | 15% | |||||||||
Marketable equity securities | $ | (5.6 | ) | $ | (3.9 | ) | $ | (1.7 | ) |
INDEX TO CONSOLIDATED FINANCIAL STATEMENTS
| Page No. | ||
| Consolidated Statements of Stockholders' Equity | ||
| Consolidated Statements of Cash Flows | ||
All financial statement schedules have been omitted, since the required information is not applicable or is not present in amounts sufficient to require submission of the schedule, or because the information required is included in the Consolidated Financial Statements and Notes thereto.
CONSOLIDATED BALANCE SHEETS
(In thousands, except par value)
| December 3, | November 27, | |||||||
| 2010 | 2009 | |||||||
| ASSETS | ||||||||
| Current assets: | ||||||||
| Cash and cash equivalents | $ | 749,891 | $ | 999,487 | ||||
| Short-term investments | 1,718,124 | 904,986 | ||||||
Trade receivables, net of allowances for doubtful accounts of $15,233 and $15,225, respectively | 554,328 | 410,879 | ||||||
| Deferred income taxes | 83,247 | 77,417 | ||||||
| Prepaid expenses and other current assets | 110,460 | 80,855 | ||||||
| Total current assets | 3,216,050 | 2,473,624 | ||||||
| Property and equipment, net | 448,881 | 388,132 | ||||||
| Goodwill | 3,641,844 | 3,494,589 | ||||||
| Purchased and other intangibles, net | 457,263 | 527,388 | ||||||
| Investment in lease receivable | 207,239 | 207,239 | ||||||
| Other assets | 169,871 | 191,265 | ||||||
| Total assets | $ | 8,141,148 | $ | 7,282,237 | ||||
| LIABILITIES AND STOCKHOLDERS’ EQUITY | ||||||||
| Current liabilities: | ||||||||
| Trade payables | $ | 52,432 | $ | 58,904 | ||||
| Accrued expenses | 564,275 | 419,646 | ||||||
| Capital lease obligations, current | 8,799 | — | ||||||
| Accrued restructuring | 8,119 | 37,793 | ||||||
| Income taxes payable | 53,715 | 46,634 | ||||||
| Deferred revenue | 380,748 | 281,576 | ||||||
| Total current liabilities | 1,068,088 | 844,553 | ||||||
| Long-term liabilities: | ||||||||
| Debt and capital lease obligations, non-current | 1,513,662 | 1,000,000 | ||||||
| Deferred revenue | 48,929 | 36,717 | ||||||
| Accrued restructuring | 8,254 | 6,921 | ||||||
| Income taxes payable | 164,713 | 223,528 | ||||||
| Deferred income taxes | 103,098 | 252,486 | ||||||
| Other liabilities | 42,017 | 27,464 | ||||||
| Total liabilities | 2,948,761 | 2,391,669 | ||||||
| Commitments and contingencies | ||||||||
| Stockholders’ equity: | ||||||||
| Preferred stock, $0.0001 par value; 2,000 shares authorized; none issued | — | — | ||||||
Common stock, $0.0001 par value; 900,000 shares authorized; 600,834 shares issued; 501,897 and 522,657 shares outstanding, respectively | 61 | 61 | ||||||
| Additional paid-in-capital | 2,458,278 | 2,390,061 | ||||||
| Retained earnings | 5,980,914 | 5,299,914 | ||||||
| Accumulated other comprehensive income | 17,428 | 24,446 | ||||||
| Treasury stock, at cost (98,937 and 78,177 shares, respectively), net of re-issuances | (3,264,294 | ) | (2,823,914 | ) | ||||
| Total stockholders’ equity | 5,192,387 | 4,890,568 | ||||||
| Total liabilities and stockholders’ equity | $ | 8,141,148 | $ | 7,282,237 | ||||
| November 29, 2013 | November 30, 2012 | ||||||
| ASSETS | |||||||
| Current assets: | |||||||
| Cash and cash equivalents | $ | 834,556 | $ | 1,425,052 | |||
| Short-term investments | 2,339,196 | 2,113,301 | |||||
| Trade receivables, net of allowances for doubtful accounts of $10,228 and $12,643, respectively | 599,820 | 617,233 | |||||
| Deferred income taxes | 102,247 | 125,243 | |||||
| Prepaid expenses and other current assets | 170,110 | 116,237 | |||||
| Total current assets | 4,045,929 | 4,397,066 | |||||
| Property and equipment, net | 659,774 | 664,302 | |||||
| Goodwill | 4,771,981 | 4,133,259 | |||||
| Purchased and other intangibles, net | 605,254 | 545,036 | |||||
| Investment in lease receivable | 207,239 | 207,239 | |||||
| Other assets | 90,121 | 93,327 | |||||
| Total assets | $ | 10,380,298 | $ | 10,040,229 | |||
| LIABILITIES AND STOCKHOLDERS’ EQUITY | |||||||
| Current liabilities: | |||||||
| Trade payables | $ | 62,096 | $ | 49,759 | |||
| Accrued expenses | 656,939 | 590,140 | |||||
| Capital lease obligations | 14,676 | 11,217 | |||||
| Accrued restructuring | 6,171 | 9,287 | |||||
| Income taxes payable | 10,222 | 49,886 | |||||
| Deferred revenue | 775,544 | 561,463 | |||||
| Total current liabilities | 1,525,648 | 1,271,752 | |||||
| Long-term liabilities: | |||||||
| Debt and capital lease obligations | 1,499,297 | 1,496,938 | |||||
| Deferred revenue | 53,268 | 58,102 | |||||
| Accrued restructuring | 7,717 | 12,263 | |||||
| Income taxes payable | 132,545 | 155,096 | |||||
| Deferred income taxes | 375,634 | 330,812 | |||||
| Other liabilities | 61,555 | 50,084 | |||||
| Total liabilities | 3,655,664 | 3,375,047 | |||||
| Commitments and contingencies | |||||||
| Stockholders’ equity: | |||||||
| Preferred stock, $0.0001 par value; 2,000 shares authorized; none issued | — | — | |||||
Common stock, $0.0001 par value; 900,000 shares authorized; 600,834 shares issued; 496,261 and 494,132 shares outstanding, respectively | 61 | 61 | |||||
| Additional paid-in-capital | 3,392,696 | 3,038,665 | |||||
| Retained earnings | 6,928,964 | 7,003,003 | |||||
| Accumulated other comprehensive income | 46,103 | 30,712 | |||||
| Treasury stock, at cost (104,573 and 106,702 shares, respectively), net of reissuances | (3,643,190 | ) | (3,407,259 | ) | |||
| Total stockholders’ equity | 6,724,634 | 6,665,182 | |||||
| Total liabilities and stockholders’ equity | $ | 10,380,298 | $ | 10,040,229 | |||
See accompanying Notes to Consolidated Financial Statements.
CONSOLIDATED STATEMENTS OF INCOME
(In thousands, except per share data)
| Years Ended | Years Ended | ||||||||||||||||||||||
December 3, 2010 | November 27, 2009 | November 28, 2008 | November 29, 2013 | November 30, 2012 | December 2, 2011 | ||||||||||||||||||
| Revenue: | |||||||||||||||||||||||
Products | $ | 3,159,161 | $ | 2,684,789 | $ | 3,354,554 | $ | 2,470,098 | $ | 3,342,843 | $ | 3,416,483 | |||||||||||
Subscription | 386,805 | 74,602 | 41,988 | 1,137,856 | 673,206 | 458,634 | |||||||||||||||||
Services and support | 254,034 | 186,462 | 183,347 | 447,286 | 387,628 | 341,141 | |||||||||||||||||
Total revenue | 3,800,000 | 2,945,853 | 3,579,889 | 4,055,240 | 4,403,677 | 4,216,258 | |||||||||||||||||
| Cost of revenue: | |||||||||||||||||||||||
Products | 127,453 | 180,611 | 243,180 | 138,154 | 121,663 | 125,640 | |||||||||||||||||
Subscription | 195,595 | 48,286 | 23,209 | 278,077 | 219,102 | 194,033 | |||||||||||||||||
Services and support | 80,454 | 67,835 | 96,241 | 170,326 | 143,017 | 118,200 | |||||||||||||||||
Total cost of revenue | 403,502 | 296,732 | 362,630 | 586,557 | 483,782 | 437,873 | |||||||||||||||||
Gross profit | 3,396,498 | 2,649,121 | 3,217,259 | 3,468,683 | 3,919,895 | 3,778,385 | |||||||||||||||||
| Operating expenses: | |||||||||||||||||||||||
Research and development | 680,332 | 565,141 | 662,057 | 826,631 | 742,823 | 738,053 | |||||||||||||||||
Sales and marketing | 1,244,197 | 981,903 | 1,089,341 | 1,620,454 | 1,516,159 | 1,385,822 | |||||||||||||||||
General and administrative | 383,499 | 298,749 | 337,291 | 520,124 | 434,982 | 414,605 | |||||||||||||||||
Restructuring charges | 23,266 | 41,260 | 32,053 | ||||||||||||||||||||
Amortization of purchased intangibles and incomplete technology | 72,130 | 71,555 | 68,246 | ||||||||||||||||||||
| Restructuring and other charges | 26,497 | (2,917 | ) | 97,773 | |||||||||||||||||||
| Amortization of purchased intangibles | 52,254 | 48,657 | 42,833 | ||||||||||||||||||||
Total operating expenses | 2,403,424 | 1,958,608 | 2,188,988 | 3,045,960 | 2,739,704 | 2,679,086 | |||||||||||||||||
Operating income | 993,074 | 690,513 | 1,028,271 | 422,723 | 1,180,191 | 1,099,299 | |||||||||||||||||
| Non-operating income (expense): | |||||||||||||||||||||||
Interest and other income (expense), net | 13,139 | 31,380 | 43,847 | 4,941 | (3,414 | ) | (2,974 | ) | |||||||||||||||
Interest expense | (56,952 | ) | (3,407 | ) | (10,019 | ) | (67,508 | ) | (67,487 | ) | (66,952 | ) | |||||||||||
Investment gains (losses), net | (6,110 | ) | (16,966 | ) | 16,409 | (4,015 | ) | 9,504 | 5,857 | ||||||||||||||
Total non-operating income (expense), net | (49,923 | ) | 11,007 | 50,237 | (66,582 | ) | (61,397 | ) | (64,069 | ) | |||||||||||||
Income before income taxes | 943,151 | 701,520 | 1,078,508 | 356,141 | 1,118,794 | 1,035,230 | |||||||||||||||||
Provision for income taxes | 168,471 | 315,012 | 206,694 | 66,156 | 286,019 | 202,383 | |||||||||||||||||
Net income | $ | 774,680 | $ | 386,508 | $ | 871,814 | $ | 289,985 | $ | 832,775 | $ | 832,847 | |||||||||||
Basic net income per share | $ | 1.49 | $ | 0.74 | $ | 1.62 | $ | 0.58 | $ | 1.68 | $ | 1.67 | |||||||||||
Shares used to compute basic income per share | 519,045 | 524,470 | 539,373 | ||||||||||||||||||||
| Shares used to compute basic net income per share | 501,372 | 494,731 | 497,469 | ||||||||||||||||||||
Diluted net income per share | $ | 1.47 | $ | 0.73 | $ | 1.59 | $ | 0.56 | $ | 1.66 | $ | 1.65 | |||||||||||
Shares used to compute diluted income per share | 525,824 | 530,610 | 548,553 | ||||||||||||||||||||
| Shares used to compute diluted net income per share | 513,476 | 502,721 | 503,921 | ||||||||||||||||||||
See accompanying Notes to Consolidated Financial Statements.
60
ADOBE SYSTEMS INCORPORATED
CONSOLIDATED STATEMENTS OF COMPREHENSIVE INCOME
(In thousands)
| Years Ended | |||||||||||
| November 29, 2013 | November 30, 2012 | December 2, 2011 | |||||||||
| Increase/(Decrease) | |||||||||||
| Net income | $ | 289,985 | $ | 832,775 | $ | 832,847 | |||||
| Other comprehensive income, net of taxes: | |||||||||||
| Available-for-sale securities: | |||||||||||
| Unrealized gains / losses on available-for-sale securities | (2,185 | ) | 11,297 | (1,795 | ) | ||||||
| Reclassification adjustment for gains / losses on available-for-sale securities recognized | (3,013 | ) | (2,874 | ) | (1,834 | ) | |||||
| Net increase (decrease) from available-for-sale securities | (5,198 | ) | 8,423 | (3,629 | ) | ||||||
| Derivatives designated as hedging instruments: | |||||||||||
| Unrealized gains / losses on derivative instruments | 34,677 | 23,922 | 16,952 | ||||||||
| Reclassification adjustment for gains / losses on derivative instruments recognized | (35,914 | ) | (30,672 | ) | (3,749 | ) | |||||
| Net increase (decrease) from derivatives designated as hedging instruments | (1,237 | ) | (6,750 | ) | 13,203 | ||||||
| Foreign currency translation adjustments | 21,826 | (911 | ) | 2,948 | |||||||
| Other comprehensive income, net of taxes | 15,391 | 762 | 12,522 | ||||||||
| Total comprehensive income, net of taxes | $ | 305,376 | $ | 833,537 | $ | 845,369 | |||||
See accompanying Notes to Consolidated Financial Statements.
CONSOLIDATED STATEMENTS OF STOCKHOLDERS’ EQUITY AND COMPREHENSIVE INCOME
| Common Stock | Additional Paid-In | Retained | Accumulated Other Comprehensive | Treasury Stock | ||||||||||||||||
| Shares | Amount | Capital | Earnings | Income | Shares | Amount | Total | |||||||||||||
| Balances at November 30, 2007 | 600,834 | $ | 61 | $ | 2,340,969 | $ | 4,041,592 | $ | 27,948 | (29,425 | ) | $ | (1,760,588 | ) | $ | 4,649,982 | ||||
| Comprehensive income: | ||||||||||||||||||||
Net income | — | — | — | 871,814 | — | — | — | 871,814 | ||||||||||||
Other comprehensive income (loss), net of taxes (Note 14) | — | — | — | — | 29,274 | — | — | 29,274 | ||||||||||||
Total comprehensive income, net of taxes | — | — | — | — | — | — | — | 901,088 | ||||||||||||
Re-issuance of treasury stock under stock compensation plans | — | — | (206,984 | ) | — | — | 12,994 | 526,149 | 319,165 | |||||||||||
Tax benefit from employee stock option plans | — | — | 90,360 | — | — | — | — | 90,360 | ||||||||||||
| Purchase of treasury stock | — | — | — | — | — | (58,292 | ) | (1,722,715 | ) | (1,722,715 | ) | |||||||||
| Stock-based compensation | — | — | 172,474 | — | — | — | — | 172,474 | ||||||||||||
| Balances at November 28, 2008 | 600,834 | $ | 61 | $ | 2,396,819 | $ | 4,913,406 | $ | 57,222 | (74,723 | ) | $ | (2,957,154 | ) | $ | 4,410,354 | ||||
| Comprehensive income: | ||||||||||||||||||||
Net income | — | — | — | 386,508 | — | — | — | 386,508 | ||||||||||||
Other comprehensive income (loss), net of taxes (Note 14) | — | — | — | — | (32,776 | ) | — | — | (32,776 | ) | ||||||||||
Total comprehensive income, net of taxes | — | — | — | — | — | — | — | 353,732 | ||||||||||||
Re-issuance of treasury stock under stock compensation plans | — | — | (303,688 | ) | — | — | 11,777 | 483,254 | 179,566 | |||||||||||
Tax benefit from employee stock option plans | — | — | 44,381 | — | — | — | — | 44,381 | ||||||||||||
| Purchase of treasury stock | — | — | — | — | — | (15,231 | ) | (350,014 | ) | (350,014 | ) | |||||||||
| Equity awards assumed for acquisition | — | — | 84,968 | — | — | — | — | 84,968 | ||||||||||||
| Stock-based compensation | — | — | 167,581 | — | — | — | — | 167,581 | ||||||||||||
| Balances at November 27, 2009 | 600,834 | $ | 61 | $ | 2,390,061 | $ | 5,299,914 | $ | 24,446 | (78,177 | ) | $ | (2,823,914 | ) | $ | 4,890,568 | ||||
| Comprehensive income: | ||||||||||||||||||||
Net income | — | — | — | 774,680 | — | — | — | 774,680 | ||||||||||||
Other comprehensive income (loss), net of taxes (Note 14) | — | — | — | — | (7,018 | ) | — | — | (7,018 | ) | ||||||||||
| Total comprehensive income, net of taxes | — | — | — | — | — | — | — | 767,662 | ||||||||||||
Re-issuance of treasury stock under stock compensation plans | — | — | (177,099 | ) | (93,680 | ) | — | 10,407 | 410,049 | 139,270 | ||||||||||
Tax benefit from employee stock option plans | — | — | 11,107 | — | — | — | — | 11,107 | ||||||||||||
| Purchase of treasury stock | — | — | — | — | — | (31,167 | ) | (850,020 | ) | (850,020 | ) | |||||||||
| Equity awards assumed for acquisition | — | — | 3,264 | — | — | — | — | 3,264 | ||||||||||||
| Stock-based compensation | — | — | 230,945 | — | — | — | — | 230,945 | ||||||||||||
Value of shares in deferred compensation plan | — | — | — | — | — | — | (409 | ) | (409 | ) | ||||||||||
| Balances at December 3, 2010 | 600,834 | $ | 61 | $ | 2,458,278 | $ | 5,980,914 | $ | 17,428 | (98,937 | ) | $ | (3,264,294 | ) | $ | 5,192,387 | ||||
Common Stock | Additional Paid-In Capital | Retained Earnings | Accumulated Other Comprehensive Income | Treasury Stock | ||||||||||||||||||||||||||
| Shares | Amount | Shares | Amount | Total | ||||||||||||||||||||||||||
| Balances at December 3, 2010 | 600,834 | $ | 61 | $ | 2,458,278 | $ | 5,980,914 | $ | 17,428 | (98,937 | ) | $ | (3,264,294 | ) | $ | 5,192,387 | ||||||||||||||
| Net income | — | — | — | 832,847 | — | — | — | 832,847 | ||||||||||||||||||||||
Other comprehensive income, net of taxes | — | — | — | — | 12,522 | — | — | 12,522 | ||||||||||||||||||||||
Re-issuance of treasury stock under stock compensation plans | — | — | — | (285,026 | ) | — | 11,492 | 429,780 | 144,754 | |||||||||||||||||||||
Tax benefit from employee stock plans | — | — | 9,568 | — | — | — | — | 9,568 | ||||||||||||||||||||||
| Purchase of treasury stock | — | — | — | — | — | (21,849 | ) | (695,015 | ) | (695,015 | ) | |||||||||||||||||||
| Stock-based compensation | — | — | 286,050 | — | — | — | — | 286,050 | ||||||||||||||||||||||
| Balances at December 2, 2011 | 600,834 | $ | 61 | $ | 2,753,896 | $ | 6,528,735 | $ | 29,950 | (109,294 | ) | $ | (3,529,529 | ) | $ | 5,783,113 | ||||||||||||||
| Net income | — | — | — | 832,775 | — | — | — | 832,775 | ||||||||||||||||||||||
Other comprehensive income, net of taxes | — | — | — | — | 762 | — | — | 762 | ||||||||||||||||||||||
Re-issuance of treasury stock under stock compensation plans | — | — | — | (358,507 | ) | — | 14,111 | 527,781 | 169,274 | |||||||||||||||||||||
Tax detriment from employee stock plans | — | — | (16,842 | ) | — | — | — | — | (16,842 | ) | ||||||||||||||||||||
| Purchase of treasury stock | — | — | — | — | — | (11,519 | ) | (405,000 | ) | (405,000 | ) | |||||||||||||||||||
Equity awards assumed for acquisition | — | — | 4,265 | — | — | — | — | 4,265 | ||||||||||||||||||||||
| Stock-based compensation | — | — | 297,346 | — | — | — | — | 297,346 | ||||||||||||||||||||||
Value of shares in deferred compensation plan | — | — | — | — | — | — | (511 | ) | (511 | ) | ||||||||||||||||||||
| Balances at November 30, 2012 | 600,834 | $ | 61 | $ | 3,038,665 | $ | 7,003,003 | $ | 30,712 | (106,702 | ) | $ | (3,407,259 | ) | $ | 6,665,182 | ||||||||||||||
| Net income | — | — | — | 289,985 | — | — | — | 289,985 | ||||||||||||||||||||||
Other comprehensive income, net of taxes | — | — | — | — | 15,391 | — | — | 15,391 | ||||||||||||||||||||||
Re-issuance of treasury stock under stock compensation plans | — | — | — | (364,024 | ) | — | 23,732 | 864,800 | 500,776 | |||||||||||||||||||||
Tax benefit from employee stock plans | — | — | 25,290 | — | — | — | — | 25,290 | ||||||||||||||||||||||
| Purchase of treasury stock | — | — | — | — | — | (21,603 | ) | (1,100,000 | ) | (1,100,000 | ) | |||||||||||||||||||
Equity awards assumed for acquisition | — | — | 1,160 | — | — | — | — | 1,160 | ||||||||||||||||||||||
| Stock-based compensation | — | — | 327,581 | — | — | — | — | 327,581 | ||||||||||||||||||||||
Value of shares in deferred compensation plan | — | — | — | — | — | — | (731 | ) | (731 | ) | ||||||||||||||||||||
| Balances at November 29, 2013 | 600,834 | $ | 61 | $ | 3,392,696 | $ | 6,928,964 | $ | 46,103 | (104,573 | ) | $ | (3,643,190 | ) | $ | 6,724,634 | ||||||||||||||
See accompanying Notes to Consolidated Financial Statements.
CONSOLIDATED STATEMENTS OF CASH FLOWS
(In thousands)
| Years Ended | Years Ended | ||||||||||||||||||||||
December 3, 2010 | November 27, 2009 | November 28, 2008 | November 29, 2013 | November 30, 2012 | December 2, 2011 | ||||||||||||||||||
| Cash flows from operating activities: | |||||||||||||||||||||||
Net income | $ | 774,680 | $ | 386,508 | $ | 871,814 | $ | 289,985 | $ | 832,775 | $ | 832,847 | |||||||||||
| Adjustments to reconcile net income to net cash provided by operating activities: | |||||||||||||||||||||||
Depreciation, amortization and accretion | 292,738 | 282,423 | 270,269 | 321,227 | 299,766 | 270,205 | |||||||||||||||||
Stock-based compensation | 231,086 | 167,581 | 172,474 | 328,987 | 298,502 | 286,103 | |||||||||||||||||
| Write-down of assets held for sale, net of gains on sale | 23,151 | — | — | ||||||||||||||||||||
Deferred income taxes | (172,329 | ) | 49,590 | 46,584 | 29,704 | 89,212 | 51,415 | ||||||||||||||||
Unrealized losses (gains) on investments | 11,517 | 11,623 | (17,377 | ) | |||||||||||||||||||
Tax benefit from employee stock option plans | 11,107 | 44,381 | 90,360 | ||||||||||||||||||||
| Unrealized (gains) losses on investments | 5,665 | (8,535 | ) | (4,349 | ) | ||||||||||||||||||
| Retirements and disposals of property and equipment | 2,759 | 1,113 | 14,772 | ||||||||||||||||||||
Other non-cash items | 3,262 | 3,315 | 4,784 | 28,185 | (13,658 | ) | 24,560 | ||||||||||||||||
Excess tax benefits from stock-based compensation | (16,430 | ) | (11,980 | ) | (31,983 | ) | (40,619 | ) | (10,003 | ) | (9,949 | ) | |||||||||||
| Changes in operating assets and liabilities, net of acquired assets and assumed liabilities: | |||||||||||||||||||||||
Trade receivables, net | (134,276 | ) | 172,287 | (153,386 | ) | 33,649 | 45,166 | (81,065 | ) | ||||||||||||||
Prepaid expenses and other current assets | (39,963 | ) | 21,814 | (5,584 | ) | (55,509 | ) | 4,552 | (5,100 | ) | |||||||||||||
Trade payables | (10,092 | ) | (13,601 | ) | 14,078 | 7,132 | (62,874 | ) | 32,203 | ||||||||||||||
Accrued expenses | 127,814 | (52,179 | ) | (13,904 | ) | 41,828 | (7,770 | ) | (24,708 | ) | |||||||||||||
Accrued restructuring | (26,811 | ) | (8,446 | ) | 24,330 | (6,949 | ) | (66,047 | ) | 71,932 | |||||||||||||
Income taxes payable | (48,656 | ) | 109,620 | (57,656 | ) | (58,875 | ) | 10,041 | (16,661 | ) | |||||||||||||
Deferred revenue | 109,348 | (45,142 | ) | 65,879 | 201,366 | 87,340 | 101,109 | ||||||||||||||||
Net cash provided by operating activities | 1,112,995 | 1,117,794 | 1,280,682 | 1,151,686 | 1,499,580 | 1,543,314 | |||||||||||||||||
| Cash flows from investing activities: | |||||||||||||||||||||||
Purchases of short-term investments | (2,600,787 | ) | (1,307,366 | ) | (2,381,533 | ) | (2,058,058 | ) | (1,776,485 | ) | (1,861,075 | ) | |||||||||||
Maturities of short-term investments | 643,614 | 464,031 | 1,568,874 | 360,485 | 439,878 | 486,050 | |||||||||||||||||
Proceeds from sales of short-term investments | 1,134,365 | 1,057,176 | 717,076 | 1,449,961 | 1,126,886 | 1,148,148 | |||||||||||||||||
| Acquisitions, net of cash acquired | (704,589 | ) | (353,195 | ) | (259,046 | ) | |||||||||||||||||
Purchases of property and equipment | (169,642 | ) | (119,592 | ) | (111,792 | ) | (188,358 | ) | (271,076 | ) | (210,294 | ) | |||||||||||
Proceeds from sale of property and equipment | 32,151 | — | — | 24,260 | — | — | |||||||||||||||||
Acquisitions, net of cash acquired | (193,281 | ) | (1,582,669 | ) | (3,584 | ) | |||||||||||||||||
Purchases of long-term investments and other assets | (28,216 | ) | (29,143 | ) | (124,469 | ) | |||||||||||||||||
| Purchases of long-term investments, intangibles and other assets | (67,737 | ) | (29,701 | ) | (65,600 | ) | |||||||||||||||||
Proceeds from sale of long-term investments | 20,351 | 17,696 | 30,747 | 6,233 | 29,031 | 4,415 | |||||||||||||||||
Other | 2,151 | 2,771 | — | ||||||||||||||||||||
Net cash used for investing activities | (1,159,294 | ) | (1,497,096 | ) | (304,681 | ) | (1,177,803 | ) | (834,662 | ) | (757,402 | ) | |||||||||||
| Cash flows from financing activities: | |||||||||||||||||||||||
Purchases of treasury stock | (850,020 | ) | (350,013 | ) | (1,722,715 | ) | (1,100,000 | ) | (405,000 | ) | (695,015 | ) | |||||||||||
Proceeds from issuance of treasury stock | 139,270 | 179,566 | 319,165 | ||||||||||||||||||||
| Net proceeds from issuance of treasury stock | 500,776 | 169,274 | 144,754 | ||||||||||||||||||||
Excess tax benefits from stock-based compensation | 16,430 | 11,980 | 31,983 | 40,619 | 10,003 | 9,949 | |||||||||||||||||
Proceeds from debt | 1,493,439 | 650,000 | 800,000 | ||||||||||||||||||||
| Proceeds from debt and capital lease obligations | 25,703 | 3,152 | — | ||||||||||||||||||||
Repayment of debt and capital lease obligations | (1,003,719 | ) | — | (450,000 | ) | (25,879 | ) | (9,855 | ) | (10,046 | ) | ||||||||||||
Repayment of acquired debt | — | (13,897 | ) | — | |||||||||||||||||||
Debt issuance costs | (10,662 | ) | — | — | (357 | ) | (2,297 | ) | — | ||||||||||||||
| Net cash (used for) provided by financing activities | (215,262 | ) | 477,636 | (1,021,567 | ) | ||||||||||||||||||
| Net cash used for financing activities | (559,138 | ) | (234,723 | ) | (550,358 | ) | |||||||||||||||||
| Effect of foreign currency exchange rates on cash and cash equivalents | 11,965 | 14,703 | (14,406 | ) | (5,241 | ) | 5,357 | 4,055 | |||||||||||||||
Net (decrease) increase in cash and cash equivalents | (249,596 | ) | 113,037 | (59,972 | ) | ||||||||||||||||||
| Net increase (decrease) in cash and cash equivalents | (590,496 | ) | 435,552 | 239,609 | |||||||||||||||||||
Cash and cash equivalents at beginning of year | 999,487 | 886,450 | 946,422 | 1,425,052 | 989,500 | 749,891 | |||||||||||||||||
Cash and cash equivalents at end of year | $ | 749,891 | $ | 999,487 | $ | 886,450 | $ | 834,556 | $ | 1,425,052 | $ | 989,500 | |||||||||||
| Supplemental disclosures: | |||||||||||||||||||||||
Cash paid for income taxes, net of refunds | $ | 389,114 | $ | 105,158 | $ | 126,299 | $ | 129,701 | $ | 201,125 | $ | 158,373 | |||||||||||
Cash paid for interest | $ | 34,632 | $ | 2,088 | $ | 9,604 | $ | 64,843 | $ | 66,265 | $ | 63,967 | |||||||||||
| Non-cash investing activities: | |||||||||||||||||||||||
| Issuance of common stock and stock awards assumed in business acquisitions | $ | 3,264 | $ | 84,968 | $ | — | $ | 1,160 | $ | 4,265 | $ | — | |||||||||||
Property and equipment acquired under capital leases | $ | 32,151 | $ | — | $ | — | |||||||||||||||||
See accompanying Notes to Consolidated Financial Statements.
63
NOTE 1. BASIS OF PRESENTATION AND SIGNIFICANT ACCOUNTING POLICIES
Operations
Founded in 1982, Adobe Systems Incorporated is one of the largest and most diversified software companies in the world. We offer a line of creative, business, Web and mobile softwareproducts and services used by creative professionals, marketers, knowledge workers, application developers, marketers, enterprises and consumers for creating, managing, delivering, measuring, optimizing and engaging with compelling content and experiences across multiple operating systems, devices and media. We market and license our products and services directly to enterprise customers through our sales force and to end-users through app stores and our own website at www.adobe.com. We also distribute our products and services through a network of distributors, value-added resellers (“VARs”), systems integrators, independent software vendors (“ISVs”), retailers and original equipment manufacturers (“OEMs”). We also market and license our software directly to enterprise customers through our sales force and to end users and through our own Website at www.adobe.com. In addition, we license our technology to hardware manufacturers, software developers and service providers for use in their products and providesolutions. We offer some of our solutionsproducts via Softwarea Software-as-a-Service (“SaaS”) model or a managed services model (both of which are referred to as a Service (“SaaS”), also known as hosted or “cloud-based” offerings.cloud-based model) as well as through term subscription and pay-per-use models. Our software runsproducts run on personal computers (“PC”) and server-based computers, as well as various non-PCon smartphones, tablets and mobileother devices, depending on the product. We have operations in the Americas, Europe, Middle East and Africa (“EMEA”) and Asia.
Asia-Pacific (“APAC”).
Basis of Presentation
The accompanying Consolidated Financial Statements include those of Adobe and its subsidiaries, after elimination of all intercompany accounts and transactions. We have prepared the accompanying Consolidated Financial Statements in accordance with accounting principles generally accepted in the United States of America (“GAAP”) and pursuant to the rules and regulations of the United States Securities and Exchange Commission (the “SEC”).
Use of Estimates
In preparation of consolidated financial statementspreparing Consolidated Financial Statements and related disclosures in conformity with GAAP and pursuant to the rules and regulations of the SEC, we must make estimates and judgments that affect the amounts reported in the Consolidated Financial Statements and accompanying notes. Estimates are used for, but not limited to sales allowances and programs, bad debts, stock-based compensation, determining the fair value of acquired assets and assumed liabilities, excess inventory and purchase commitments, restructuring costs,charges, facilities lease losses, impairment of goodwill and intangible assets, litigation, income taxes and investments. Actual results may differ materially from these estimates.
Fiscal Year
Our fiscal year is a 52- or 53-week year that ends on the Friday closest to November 30. Fiscal 2010 is a 53-week year compared with fiscal years 20092013, 2012 and 2008 which2011 were 52-week years.
Reclassification
Certain immaterial prior year amounts have been reclassified to conform to current year presentation in the Consolidated Statements of Cash Flows.
Balance Sheets.
Significant Accounting Policies
Revenue Recognition
Our revenue is derived from the licensing of perpetual, time-based, and subscription software products, associated software maintenance and support plans, custom software development and consulting services and training. To a lesser extent our revenue includes non-software related hosting services, custom hosting development and consulting services, training and technical support and training for hosting services.support.
We recognize revenue when all four revenue recognition criteria have been met: persuasive evidence of an arrangement exists, we have delivered the product or performed the service, the fee is fixed or determinable and collection is probable. Determining whether and when some of these criteria have been satisfied often involves assumptions and judgments that can have a significant impact on the timing and amount of revenue we report.
64
Multiple Element Arrangements
We enter into multiple element revenue arrangements in which a customer may purchase a combination of software, upgrades, maintenance and support, hosting services, and consulting.
For our software and software relatedsoftware-related multiple element arrangements, we must: (1) determine whether and when each element has been delivered; (2) determine whether undelivered products or services are essential to the functionality of the delivered products and services; (3) determine the fair value of each undelivered element using vendor-specific objective evidence (“VSOE”), and (4) allocate the total price among the various elements. VSOE of fair value is used to allocate a portion of the price to the undelivered elements and the residual method is used to allocate the remaining portion to the delivered elements.
Absent VSOE, revenue is deferred until the earlier of the point at which VSOE of fair value exists for any undelivered element or until all elements of the arrangement have been delivered. However, if the only undelivered element is maintenance and support, the entire arrangement fee is recognized ratably over the performance period. Changes in assumptions or judgments or changes to the elements in a software arrangement could cause a material increase or decrease in the amount of revenue that we report in a particular period.
We elected to early adopt this accounting guidance at the beginning of our fiscal quarter of 2010 on a prospective basis for applicable transactions originating or materially modified after November 27, 2009. Our revenue from sales containing non-software related hosting services, custom hosting development and consulting services, and related technical support and training are those impacted.
We have established VSOE for our software maintenance and support services, custom software development services, consulting services and training.
For multiple-element arrangements that contain both software and non-software elements, we allocate revenue to software or software-related elements as a group and any non-software elements separately based on the selling price hierarchy. We determine the selling price for each deliverable using VSOE of selling price, if it exists, or TPE of selling price. If neither VSOE nor TPE of selling price exist for a deliverable, we use BESP. Once revenue is allocated to software or software-related elements as a group, we recognize revenue in conformance with software revenue accounting guidance. Revenue is recognized when revenue recognition criteria are not ablemet for each element.
We are generally unable to establish VSOE for all deliverables in an arrangement with multiple elements. This may be due to infrequently selling each element separately, not pricing products or services within a narrow range, or only having a limited sales history. When VSOE cannot be established, we attempt to establish the selling price of each element based on TPE. TPE is determined based on competitor prices for similar deliverables when sold separately. Generally, our offerings contain significant differentiation such that the comparable pricing of products with similar functionality cannot be obtained. Furthermore, we are unable to reliably determine what similar competitor products’ selling prices are on a stand-alone basis. Therefore, we typically are not able to obtain TPE of selling price.
We determine BESP for a product or service by considering multiple factors including, but not limited to major product groupings, geographies, market conditions, competitive landscape, internal costs, gross margin objectives and pricing practices. Significant pricingPricing practices taken into consideration include historic contractually stated prices, volume discounts where applicable and our price lists. The most common fact pattern that emerged through analyzing these factors supports a BESP closely tied to Adobe’s list prices. The determination of BESP is made through consultation with and formal approval by our management, taking into consideration our go-to-market strategy.
We regularly review VSOE and have established a review process for TPE and BESP and maintain internal controls over the establishment and updates of these estimates. There was no material impact tomust estimate certain royalty revenue during the year ended December 3, 2010 resulting from changes in VSOE, TPE or BESP, nor do we expect a material impact from such changes in the near term.
Product Revenue
We recognize our product revenue upon shipment, provided all other revenue recognition criteria have been met. Our desktop application products’product revenue from distributors is subject to agreements allowing limited rights of return, rebates and price protection. Our direct sales and OEM sales are also subject to limited rights of return. Accordingly, we reduce revenue recognized for estimated future returns, price protection and rebates at the time the related revenue is recorded. The estimates for returns are adjusted periodically based upon historical rates of returns, inventory levels in the distribution channel and other related factors.
We record the estimated costs of providing free technical phone support to customers for our software products.
We recognize OEM licensing revenue, primarily royalties, when OEMs ship products incorporating our software, provided collection of such revenue is deemed probable. For certain OEM customers, we must estimate royalty revenue due to the timing
65
of securing customer information. This estimate is based on a combination of our generated forecasts and actual historical reporting by our OEM customers. To substantiate our ability to estimate revenue, we review license royalty revenue reports ultimately received from our significant OEM customers in comparison to the amounts estimated in the prior period.
Our product-related deferred revenue includes maintenance upgrade revenue and customer advances under OEM license agreements. Our maintenance upgrade revenue for our desktop application products is included in our product revenue line item as the maintenance primarily entitles customers to receive product upgrades. In cases where we provide a specified free upgrade to an existing product, we defer the fair value for the specified upgrade right until the future obligation is fulfilled or when the right to the specified free upgrade expires.
Subscription and Services and Support Revenue
We recognize revenue for hosting services that are based on a committed number of transactions, ratably beginning on the date the customer commences use of our services and continuing through the end of the customer term. Over-usage fees, and fees billed based on the actual number of transactions from which we capture data, are billed in accordance with contract terms as these fees are incurred. We record amounts that have been invoiced in accounts receivable and in deferred revenue or revenue, depending on whether theall revenue recognition criteria have been met.
Our consulting revenue is recognized using a time and materials basis and is measured monthly based on input measures, such as hours incurred to date, with consideration given to output measures, such as contract milestones when applicable.
Our maintenance and support offerings, which entitle customers to receive product upgrades and enhancements on a when and if available basis or technical support, depending on the offering, are recognized ratably over the performance period of the arrangement.
Our software subscription offerings, which may include product upgrades and enhancements on a when and if available basis, hosted services, and online storage are generally offered to our customers over a specified period of time and we recognize revenue associated with these arrangements ratably over the subscription period.
Rights of Return, Rebates and Price Protection
As discussed above, we offer limited rights of return, rebates and price protection of our products under various policies and programs with our distributors, resellers and/or end-user customers. We estimate and record reserves for these programs as an offset to revenue.revenue and accounts receivable. Below is a summary of each of the general provisions in our contracts:
Distributors are allowed limited rights of return of products purchased during the previous quarter. In addition, distributors are allowed to return products that have reached the end of their lives and products that are being replaced by new versions.
| From time to time, we may offer price protection to our distributors that allow for the right to a credit if we permanently reduce the price of a software product. The amount of revenue that is reduced for price protection is calculated as the difference between the old and new price of a software product on inventory held by the distributor prior to the effective date of the decrease. |
Although our subscription contracts are generally non-cancelable, a limited number of customers have the right to cancel their contracts by providing prior written notice to us of their intent to cancel the remainder of the contract term. In the event a customer cancels its contract, they are not entitled to a refund for prior services we have provided to them.
66
On a quarterly basis, the amount of revenue that is reserved for future returns is calculated based on our historical trends and data specific to each reporting period. We review the actual returns evidenced in prior quarters as a percent of revenue to determine a historical returns rate. We then apply the historical rate to the current period revenue as a basis for estimating future returns. When necessary, we also provide a specific returns reserve for product in the distribution channel in excess of estimated requirements. This estimate can be affected by the amount of a particular product in the channel, the rate of sell-through, product plans and other factors.
Revenue Reserve
Revenue reserve rollforward (in thousands):
| 2010 | 2009 | 2008 | ||||||||||
Beginning balance | $ | 34,401 | $ | 50,943 | $ | 43,532 | ||||||
Increase due to acquisition | — | 6,566 | — | |||||||||
Amount charged to revenue | 171,607 | 113,009 | 153,129 | |||||||||
Actual returns | (156,582 | ) | (136,117 | ) | (145,718 | ) | ||||||
Ending balance | $ | 49,426 | $ | 34,401 | $ | 50,943 |
| 2013 | 2012 | 2011 | ||||||||||
| Beginning balance | $ | 57,058 | $ | 60,887 | $ | 49,426 | ||||||
| Amount charged to revenue | 74,031 | 170,839 | 162,491 | |||||||||
| Actual returns | (102,425 | ) | (174,668 | ) | (151,030 | ) | ||||||
| Ending balance | $ | 28,664 | $ | 57,058 | $ | 60,887 | ||||||
Deferred Revenue
Deferred revenue consists substantially of payments received in advance of revenue recognition for our products and services described above. We recognize deferred revenue as revenue only when the revenue recognition criteria are met.
Allowance for Doubtful Accounts
We maintain an allowance for doubtful accounts which reflects our best estimate of potentially uncollectible trade receivables. The allowance is based on both specific and general reserves. We regularly review our trade receivables allowances by considering such factors as historical experience, credit-worthiness, the age of the trade receivable balances and current economic conditions that may affect a customer’s ability to pay and we specifically reserve for those deemed uncollectible.
| (in thousands) | 2013 | 2012 | 2011 | |||||||||
| Beginning balance | $ | 12,643 | $ | 15,080 | $ | 15,233 | ||||||
| Increase due to acquisition | 1,038 | 325 | 269 | |||||||||
| Charged to operating expenses | 933 | 3,356 | 6,271 | |||||||||
Deductions(1) | (4,386 | ) | (6,118 | ) | (6,693 | ) | ||||||
| Ending balance | $ | 10,228 | $ | 12,643 | $ | 15,080 | ||||||
(1)
| (in thousands) | 2010 | 2009 | 2008 | |||||||||
| Beginning balance | $ | 15,225 | $ | 4,128 | $ | 4,398 | ||||||
| Increase due to acquisition | — | 9,421 | — | |||||||||
| Charged to operating expenses | 3,134 | 2,841 | 4,414 | |||||||||
| Preference claim, charged (credited) to operating expense | 1,000 | (1,000 | ) | (2,000 | ) | |||||||
Deductions(*) | (4,126 | ) | (165 | ) | (2,684 | ) | ||||||
| Ending balance | $ | 15,233 | $ | 15,225 | $ | 4,128 |
| Deductions related to the allowance for doubtful accounts represent amounts written off against the allowance, less recoveries. |
Property and Equipment
We record property and equipment at cost less accumulated depreciation and amortization. Property and equipment are depreciated using the straight-line method over their estimated useful lives ranging from 1 to 5 years for computers and equipment as well as server hardware under capital leases, 1 to 6 years for furniture and fixtures and up to 35 years for buildings. Leasehold improvements are amortized using the straight-line method over the lesser of the remaining respective lease term or estimated useful lives.
lives ranging from 1 to 15 years.
Goodwill, Purchased Intangibles and Other Long-Lived Assets
Goodwill is assigned to one or more reporting segments on the date of acquisition. We evaluate goodwill for impairment by comparing the fair value of each of our reporting segments to its carrying value, including the associated goodwill. To determine the fair values, we use the market approach based on comparable publicly traded companies in similar lines of businesses and the income approach based on estimated discounted future cash flows. Our cash flow assumptions consider historical and forecasted revenue, operating costs and other relevant factors.
67
We review our goodwill for impairment annually, or more frequently, if facts and circumstances warrant a review. We completed our annual impairment test in the second quarter of fiscal 2013. We elected to use the Step 1 quantitative assessment for our three reporting units—Digital Media, Digital Marketing and Print and Publishing—and determined that there was no impairment of goodwill. There is no significant risk of material goodwill impairment in any of our reporting units, based upon the results of our annual goodwill impairment test.
We amortize intangible assets with finite lives over their estimated useful lives and review them for impairment whenever an impairment indicator exists. We continually monitor events and changes in circumstances that could indicate carrying amounts of our long-lived assets, including our intangible assets may not be recoverable. When such events or changes in circumstances occur, we assess recoverability by determining whether the carrying value of such assets will be recovered through the undiscounted expected future cash flows. If the future undiscounted cash flows are less than the carrying amount of these assets, we recognize an impairment loss based on theany excess of the carrying amount over the fair value of the assets. We did not recognize any intangible asset impairment charges in fiscal 2010, 20092013, 2012 or 2008.2011.
Our intangible assets are amortized over their estimated useful lives of 1 to 13 years as shown in the table below.14 years. Amortization is based on the pattern in which the economic benefits of the intangible asset will be consumed.consumed or on a straight-line basis when the consumption pattern is not apparent. The weighted average useful lives of our intangible assets were as follows:
Weighted Average Useful Life (years) | ||||
| Purchased technology | 6 | |||
| Customer contracts and relationships | 10 | |||
| Trademarks | 8 | |||
| Acquired rights to use technology | ||||
| Localization | 1 | |||
| Other intangibles | 3 | |||
Software Development Costs
Capitalization of software development costs for software to be sold, leased, or otherwise marketed begins upon the establishment of technological feasibility, which is generally the completion of a working prototype that has been certified as having no critical bugs and is a release candidate. Amortization begins once the software is ready for its intended use, generally based on the pattern in which the economic benefits will be consumed. To date, software development costs incurred between completion of a working prototype and general availability of the related product have not been material.
Internal Use Software
Income Taxes
We use the asset and liability method of accounting for income taxes. Under this method, income tax expense is recognized for the amount of taxes payable or refundable for the current year. In addition, deferred tax assets and liabilities are recognized for expected future tax consequences of temporary differences between the financial reporting and tax bases of assets and liabilities, and for operating losses and tax credit carryforwards. We record a valuation allowance to reduce deferred tax assets to an amount for which realization is more likely than not.
68
Taxes Collected from Customers
We net taxes collected from customers against those remitted to government authorities in our financial statements. Accordingly, taxes collected from customers are not reported as revenue.
Treasury Stock
We account for treasury stock under the cost method. When treasury stock is re-issued at a price higher than its cost, the difference is recorded as a component of additional paid-in-capital in our Consolidated Balance Sheets. When treasury stock is re-issued at a price lower than its cost, the difference is recorded as a component of additional paid-in-capital to the extent that there are previously recorded gains to offset the losses. If there are no treasury stock gains in additional paid-in-capital, the losses upon re-issuance of treasury stock are recorded as a component of retained earnings in our Consolidated Balance Sheets.
Advertising Expenses
Advertising costs are expensed as incurred. Advertising expenses for fiscal 2010, 20092013, 2012 and 20082011 were $65.9$88.5 million $67.0, $99.4 million and $67.1$75.1 million, respectively.
Foreign Currency Translation
We translate assets and liabilities of foreign subsidiaries, whose functional currency is their local currency, at exchange rates in effect at the balance sheet date. We translate revenue and expenses at the monthly average exchange rates. We include accumulated net translation adjustments in stockholders’ equity as a component of accumulated other comprehensive income.
Foreign Currency and Other Hedging Instruments
In countries outside the United States (“U.S.”), we transact business in U.S. dollarsDollars and in various other currencies. In Europe and Japan, transactions that are denominated in Euro, Yen and British Pounds are subject to exposure from movements in exchange rates. We hedge our net recognized foreign currency assets and liabilities with foreign exchange forward contracts to reduce the risk that our earnings and cash flows will be adversely affected by changes in exchange rates. We use foreign exchange option and forward contracts for revenue denominated in Euro,-Yen- British Pounds and British Pound-denominated revenue.
Yen.
We account for our derivativeforeign currency hedging instruments as either assets or liabilities on the balance sheet and measure them at fair value. Gains and losses resulting from changes in fair value are accounted for depending on the use of the derivative and whether it is designated and qualifies for hedge accounting. DerivativesContracts that do not qualify for hedge accounting are adjusted to fair value through earnings. See Note 5 for information regarding our hedging activities.
Gains and losses from foreign exchange forward contracts which hedge certain balance sheet positions, primarily non-functional currency denominated assets and liabilities (e.g., trade receivables and accounts payable) are recorded each period as a component of interest and other income, net in our Consolidated Statements of Income. Foreign exchange forward and option contracts hedging forecasted non-functionalforeign currency product licensing revenue are designated as cash flow hedges under accounting for derivative instruments and hedging activities, with gains and losses recorded net of tax, as a component of other comprehensive income (“OCI”) in stockholders’ equity and reclassified into revenue at the time the forecasted transactions occur.
Concentration of Risk
Financial instruments that potentially subject us to concentrations of credit risk are short-term fixed-income investments, structured repurchase transactions, derivativescontracts hedging foreign currency risk, and trade receivables.
Our investment portfolio consists of investment-grade securities diversified among security types, industries and issuers. Our cash and investments are held and managed by recognized financial institutions that follow our investment policy. Our policy limits the amount of credit exposure to any one security issue or issuer and we believe no significant concentration of credit risk exists with respect to these investments.
We mitigate concentration of risk related to foreign currency hedges through a policy that establishes counterparty limits. The bank counterparties in these contracts expose us to credit-related losses in the event of their nonperformance. However, to mitigate that risk, we only contract with counterparties who meet our minimum requirements under our counterparty risk assessment
69
process. In addition, our hedging policy establishes maximum limits for each counterparty. We monitor ratings, credit spreads and potential downgrades on at least a quarterly basis. Based on our on-going assessment of counterparty risk, we will adjust our exposure to various counterparties.
The aggregate fair value of derivative instrumentsforeign currency contracts in net asset positions as of December 3, 2010November 29, 2013 and November 27, 200930, 2012 was $18.8$11.9 million and $4.3$13.5 million, respectively. These amounts represent the maximum exposure to loss at the reporting date as a result of all of the counterparties failing to perform as contracted. These exposures could be reduced by up to $1.9$1.1 million and $1.6$1.0 million, respectively offrom liabilities included in master netting arrangements with those same counterparties.
Credit risk in receivables is limited to OEMs, dealers and distributors of hardware and software products to the retail market, and to customers to whom we license software directly.directly and our SaaS offerings. We are also experiencing elevated delinquency and bad debt write-offs related to our pre-acquisition receivables.receivables assumed in business combinations. A credit review is completed for our new distributors, dealers and OEMs. We also perform ongoing credit evaluations of our customers’ financial condition and require letters of credit or other guarantees, whenever deemed necessary. The credit limit given to the customer is based on our risk assessment of their ability to pay, country risk and other factors and is not contingent on the resale of the product or on the collection of payments from their customers. We also purchase credit insurance to mitigate credit risk in some foreign mark etsmarkets where we believe it is warranted. If we license our software or provide SaaS services to a customer where we have a reason to believe the customer’s ability to pay is not probable, due to country risk or credit risk, we will not recognize the revenue. We will revert to recognizing the revenue on a cash basis, assuming all other criteria for revenue recognition has been met.
See Note 1918 for information regarding our significant customers.
We derive a significant portion of our OEM PostScript and Other licensing revenue from a small number of OEMs. Our OEMs on occasion seek to renegotiate their royalty arrangements. We evaluate these requests on a case-by-case basis. If an agreement is not reached, a customer may decide to pursue other options, which could result in lower licensing revenue for us.
Recent Accounting Pronouncements
In January 2010,December 2011, the FASB issued newamended the accounting guidance expanding disclosures about fair value measurementsstandards to increase the prominence of OCI by adding disclosures abouteliminating the different classesoption to present components of assetsOCI as part of the statement of changes in shareholders’ equity and liabilities measured at fair value,requires the valuation techniques and inputs used, the activitycomponents of OCI to be presented either in Level 3 fair value measurements and the transfers between Levels 1, 2 and 3. The new disclosures and clarificationsa single continuous statement of existing disclosures were effective for interim and annual reporting periods beginning after December 15, 2009, except for the disclosure requirements related to the activitycomprehensive income or in Level 3 fair value measurements. Those disclosure requirements are effective for fiscal years beginning after December 15, 2010 and for interim periods within those fiscal years.two consecutive statements. We adopted the newamended accounting standards at the beginning of our first quarter of fiscal 2013 by electing to present consolidated statements of comprehensive income separate from the consolidated statements of income.
In February 2013, the FASB further amended the above accounting standards to improve the presentation of amounts reclassified out of accumulated other comprehensive income in its entirety and by component by presenting the reclassification adjustments on either the face of the statement where net income is presented or in a separate disclosure in the notes to the financial statements. Amounts that are not required to be reclassified in their entirety to net income are required to be cross referenced to related footnote disclosures inthat provide additional detail. We elected to early adopt the amended accounting standard at the beginning of our second quarter of fiscal 2010, which included changing2013 by electing to present the description of certain asset classesreclassification adjustments and other required disclosures in the tables in Notes 3 and 4 to conform with the requirements of the new guidance. We will adopt the Level 3 requirements in the first quarter of fiscal 2012. Since the adoption of the newa separate footnote.
The amended accounting standards only required additional disclosure,impact the financial statement presentation of OCI and do not change the components that are recognized in net income or OCI. The adoption did not have anhad no impact on our consolidatedthe Company’s financial position or results of operations or cash flows.operations.
NOTE 2. ACQUISITIONS
Fiscal 20102013 Acquisitions
Neolane
On October 28, 2010,July 22, 2013, we completed our acquisition of Day Software Holding AG (“Day”). Underprivately held Neolane, a leader in cross-channel campaign management technology. During the termsthird quarter of fiscal 2013, we began integrating Neolane into our Digital Marketing reportable segment. Neolane brings a platform for automation and execution of marketing campaigns across the agreement, we completed our public tender offer to acquire allweb, e-mail, social, mobile, call center,
70
ADOBE SYSTEMS INCORPORATED
NOTES TO CONSOLIDATED FINANCIAL STATEMENTS (Continued)
direct mail, point of Day for 139 Swiss Francs per share in cash in a transaction valued at approximately $248.3 million on a fully diluted equity-value basis. In order to hedge the economic exposure related to this acquisition, we entered into a forward contract to purchase 254.7 million Swiss Francs for $242.5 million U.S. dollars maturing near the expected closing date of the acquisition. Upon maturity of the forward contract, we recorded a $20.8 million gain to interestsale and other income (expense), net. This forward contract is accountedemerging channels which will drive consistent brand experiences and personalized campaigns for as a separate trans action apart from the acquisition.
customers.
Under the acquisition method of accounting, the total preliminary purchase price was allocated to Day’sNeolane's net tangible and intangible assets based upon their estimated fair values as of October 28, 2010. The excess purchase price over the value of the net tangible and identifiable intangible assets was recorded as goodwill. Goodwill represents the excess of the purchase price over the fair value of the underlying acquired net tangible and intangible assets. The factors that contributed to the recognition of goodwill included securing buyer-specific synergies to increase revenue and profits and are not otherwise available to a marketplace participant in addition to acquiring a talented workforce.
July 22, 2013. The total preliminary purchase price for DayNeolane was approximately $248.3$616.7 million of which approximately $159.9$515.2 million was allocated to goodwill $79.2(non-deductible for tax purposes), $115.0 million for substantially all of the to identifiable intangible assets and $6.1$13.5 million to net tangible assets.liabilities assumed. The impact of this acquisition was not material to our consolidated balance sheets and results of operations.Consolidated Financial Statements.
Behance
Acquisition of approximately 79 million shares of outstanding common stock of Omniture at $21.50 per share in cash | $ | 1,698,926 | ||
| Estimated fair value of earned stock options and restricted stock units assumed and converted | 84,968 | |||
Estimated direct transaction costs | 14,365 | |||
Total purchase price | $ | 1,798,259 |
Under the purchaseacquisition method of accounting, method, the total purchase price was allocated to Omniture’sBehance’s net tangible and intangible assets based upon their estimated fair values as of October 23, 2009.December 20, 2012. The excesstotal final purchase price over the valuefor Behance was approximately $111.1 million of the net tangible and identifiable intangible assets was recorded as goodwill.
| (in thousands) | Amount | Weighted Average Useful Life (years) | ||||||
| Net tangible assets | $ | 33,397 | ||||||
| Identifiable intangible assets: | ||||||||
| Existing technology | 176,200 | 6 | ||||||
| Customer contracts and relationships | 168,600 | 11 | ||||||
| Contract backlog | 44,800 | 2 | ||||||
| Non-competition agreements | 900 | 2 | ||||||
| Trademarks | 41,000 | 8 | ||||||
| In-process research and development | 4,600 | N/A | ||||||
| Goodwill | 1,340,021 | |||||||
| Restructuring liability | (11,259 | ) | ||||||
| Total purchase price allocation | $ | 1,798,259 |
| 2009 | 2008 | |||||||
Net revenues | $ | 3,168,731 | $ | 3,835,799 | ||||
Net income | $ | 308,904 | $ | 742,749 | ||||
Basic net income per share | $ | 0.59 | $ | 1.38 | ||||
| Shares used in computing basic net income per share | 524,470 | 539,373 | ||||||
| Diluted net income per share | $ | 0.58 | $ | 1.35 | ||||
| Shares used in computing diluted net income per share | 531,293 | 549,883 |
Fiscal 2012 Acquisition
Efficient Frontier
On January 13, 2012, we completed our acquisition of privately held Efficient Frontier, a multi-channel digital ad buying and optimization company. During the first quarter of fiscal 2012, we began integrating Efficient Frontier into our Digital Marketing segment. The Efficient Frontier business adds cross-channel digital ad campaign forecasting, execution and optimization capabilities to our Adobe Marketing Cloud, along with a social marketing engagement platform and social ad buying capabilities. We have included the financial results of operations.Efficient Frontier in our Consolidated Financial Statements beginning on the acquisition date.
Under the acquisition method of accounting, the total purchase price was allocated to Efficient Frontier’s net tangible and intangible assets based upon their estimated fair values as of January 13, 2012. During fiscal 2012, we made adjustments to the preliminary purchase price allocation. The total final purchase price for Efficient Frontier was $374.7 million of which $291.4 million was allocated to goodwill, $122.7 million to identifiable intangible assets and $39.4 million to net liabilities assumed. The impact of this acquisition was not material to our Consolidated Financial Statements.
Fiscal 2011 Acquisitions
During fiscal 2011, we completed six business combinations with aggregate purchase prices totaling approximately $281.0 million of which $213.3 million was allocated to goodwill, $87.5 million to identifiable intangible assets and $19.8 million to net liabilities assumed. We also completed two asset acquisitions with aggregate purchase prices totaling $47.3 million. We have included the financial results of the business combinations in our Consolidated Financial Statements beginning on the respective acquisition dates however the impact of these acquisitions was not material to our Consolidated Financial Statements.
NOTE 3. CASH, CASH EQUIVALENTS AND SHORT-TERM INVESTMENTS
Cash equivalents consist of instruments with remaining maturities of three months or less at the date of purchase. We classify all of our cash equivalents and short-term investments as “available-for-sale.” In general, these investments are free of trading restrictions. We carry these investments at fair value, based on quoted market prices or other readily available market information. Unrealized gains and losses, net of taxes, are included in accumulated other comprehensive income, which is reflected as a separate component of stockholders’ equity in our Consolidated Balance Sheets. Gains and losses are
recognized when realized in our Consolidated Statements of Income. When we have determined that an other-than-temporary decline in fair value has occurred,
71
the amount of the decline that is related to a credit loss is recognized in earnings.income. Gains and losses are determined using the specific identification method.
Amortized Cost | Unrealized Gains | Unrealized Losses | Estimated Fair Value | |||||||||||||
| Current assets: | ||||||||||||||||
| Cash | $ | 98,691 | $ | — | $ | — | $ | 98,691 | ||||||||
| Cash equivalents: | ||||||||||||||||
| Money market mutual funds | 477,259 | — | — | 477,259 | ||||||||||||
| Time deposits | 64,006 | — | — | 64,006 | ||||||||||||
| U.S. Treasury securities | 68,195 | 1 | — | 68,196 | ||||||||||||
| Municipal securities | 350 | — | — | 350 | ||||||||||||
| Corporate bonds | 41,389 | — | — | 41,389 | ||||||||||||
| Total cash equivalents | 651,199 | 1 | — | 651,200 | ||||||||||||
| Total cash and cash equivalents | 749,890 | 1 | — | 749,891 | ||||||||||||
| Short-term fixed income securities: | ||||||||||||||||
| U.S. Treasury securities | 336,441 | 2,828 | (209 | ) | 339,060 | |||||||||||
| U.S. agency securities | 229,772 | 778 | (179 | ) | 230,371 | |||||||||||
| Municipal securities | 119,608 | 29 | (32 | ) | 119,605 | |||||||||||
| Corporate bonds | 977,889 | 8,079 | (1,450 | ) | 984,518 | |||||||||||
| Foreign government securities | 33,079 | 309 | (2 | ) | 33,386 | |||||||||||
| Subtotal | 1,696,789 | 12,023 | (1,872 | ) | 1,706,940 | |||||||||||
| Marketable equity securities | 11,196 | — | (12 | ) | 11,184 | |||||||||||
| Total short-term investments | 1,707,985 | 12,023 | (1,884 | ) | 1,718,124 | |||||||||||
| Total cash, cash equivalents and short-term investments | $ | 2,457,875 | $ | 12,024 | $ | (1,884 | ) | $ | 2,468,015 |
Cash, cash equivalents and short-term investments consisted of the following as of November 27, 200929, 2013 (in thousands):
Amortized Cost | Unrealized Gains | Unrealized Losses | Estimated Fair Value | ||||||||||||
| Current assets: | |||||||||||||||
| Cash | $ | 286,221 | $ | — | $ | — | $ | 286,221 | |||||||
| Cash equivalents: | |||||||||||||||
| Money market mutual funds | 429,373 | — | — | 429,373 | |||||||||||
| Time deposits | 104,711 | — | — | 104,711 | |||||||||||
| U.S. Treasury securities | 14,251 | — | — | 14,251 | |||||||||||
| Total cash equivalents | 548,335 | — | — | 548,335 | |||||||||||
| Total cash and cash equivalents | 834,556 | — | — | 834,556 | |||||||||||
| Short-term fixed income securities: | |||||||||||||||
| Corporate bonds and commercial paper | 1,261,375 | 7,116 | (631 | ) | 1,267,860 | ||||||||||
| Foreign government securities | 11,213 | 56 | — | 11,269 | |||||||||||
| Municipal securities | 186,320 | 328 | (24 | ) | 186,624 | ||||||||||
| U.S. agency securities | 446,615 | 1,516 | (186 | ) | 447,945 | ||||||||||
| U.S. Treasury securities | 424,076 | 799 | (97 | ) | 424,778 | ||||||||||
| Subtotal | 2,329,599 | 9,815 | (938 | ) | 2,338,476 | ||||||||||
| Marketable equity securities | 177 | 543 | — | 720 | |||||||||||
| Total short-term investments | 2,329,776 | 10,358 | (938 | ) | 2,339,196 | ||||||||||
| Total cash, cash equivalents and short-term investments | $ | 3,164,332 | $ | 10,358 | $ | (938 | ) | $ | 3,173,752 | ||||||
72
Cash, cash equivalents and short-term investments consisted of the following as of November 30, 2012 (in thousands):
Amortized Cost | Unrealized Gains | Unrealized Losses | Estimated Fair Value | Amortized Cost | Unrealized Gains | Unrealized Losses | Estimated Fair Value | ||||||||||||||||||||||||
| Current assets: | |||||||||||||||||||||||||||||||
| Cash | $ | 75,110 | $ | — | $ | — | $ | 75,110 | $ | 200,771 | $ | — | $ | — | $ | 200,771 | |||||||||||||||
| Cash equivalents: | |||||||||||||||||||||||||||||||
| Money market mutual funds | 884,240 | — | — | 884,240 | |||||||||||||||||||||||||||
| Corporate bonds and commercial paper | 3,998 | — | — | 3,998 | |||||||||||||||||||||||||||
| Money market mutual funds and repurchase agreements | 1,171,270 | — | — | 1,171,270 | |||||||||||||||||||||||||||
| Municipal securities | 3,895 | — | — | 3,895 | |||||||||||||||||||||||||||
| Time deposits | 40,137 | — | — | 40,137 | 45,118 | — | — | 45,118 | |||||||||||||||||||||||
| Total cash equivalents | 924,377 | — | — | 924,377 | 1,224,281 | — | — | 1,224,281 | |||||||||||||||||||||||
| Total cash and cash equivalents | 999,487 | — | — | 999,487 | 1,425,052 | — | — | 1,425,052 | |||||||||||||||||||||||
| Short-term fixed income securities: | |||||||||||||||||||||||||||||||
| Corporate bonds and commercial paper | 1,059,158 | 11,415 | (133 | ) | 1,070,440 | ||||||||||||||||||||||||||
| Foreign government securities | 6,919 | 45 | (12 | ) | 6,952 | ||||||||||||||||||||||||||
| Municipal securities | 180,488 | 97 | (60 | ) | 180,525 | ||||||||||||||||||||||||||
| Time deposits | 20,113 | — | — | 20,113 | |||||||||||||||||||||||||||
| U.S. agency securities | 501,863 | 2,346 | (18 | ) | 504,191 | ||||||||||||||||||||||||||
| U.S. Treasury securities | 373,180 | 3,199 | (1 | ) | 376,378 | 330,072 | 801 | (37 | ) | 330,836 | |||||||||||||||||||||
| U.S. agency securities | 59,447 | 273 | — | 59,720 | |||||||||||||||||||||||||||
| Corporate bonds | 407,465 | 8,111 | (1 | ) | 415,575 | ||||||||||||||||||||||||||
| Foreign government securities | 47,620 | 666 | — | 48,286 | |||||||||||||||||||||||||||
| Subtotal | 887,712 | 12,249 | (2 | ) | 899,959 | 2,098,613 | 14,704 | (260 | ) | 2,113,057 | |||||||||||||||||||||
| Marketable equity securities | 2,527 | 2,500 | — | 5,027 | 237 | 7 | — | 244 | |||||||||||||||||||||||
| Total short-term investments | 890,239 | 14,749 | (2 | ) | 904,986 | 2,098,850 | 14,711 | (260 | ) | 2,113,301 | |||||||||||||||||||||
| Total cash, cash equivalents and short-term investments | $ | 1,889,726 | $ | 14,749 | $ | (2 | ) | $ | 1,904,473 | $ | 3,523,902 | $ | 14,711 | $ | (260 | ) | $ | 3,538,353 | |||||||||||||
See Note 4 for further information regarding the fair value of our financial instruments.
The following table summarizes the fair value and gross unrealized losses related to available-for-sale securities, aggregated by investment category, that have been in a continuous unrealized loss position for less than twelve months, as of December 3, 2010November 29, 2013 and November 27, 200930, 2012 (in thousands):
| 2013 | 2012 | ||||||||||||||
Fair Value | Gross Unrealized Losses | Fair Value | Gross Unrealized Losses | ||||||||||||
| Corporate bonds and commercial paper | $ | 225,759 | $ | (631 | ) | $ | 95,489 | $ | (132 | ) | |||||
| Foreign government securities | — | — | 2,105 | (12 | ) | ||||||||||
| Municipal securities | 13,522 | (24 | ) | 40,524 | (60 | ) | |||||||||
| U.S. Treasury and agency securities | 105,278 | (283 | ) | 48,203 | (55 | ) | |||||||||
| Total | $ | 344,559 | $ | (938 | ) | $ | 186,321 | $ | (259 | ) | |||||
| 2010 | 2009 | |||||||||||||||
Fair Value | Gross Unrealized Losses | Fair Value | Gross Unrealized Losses | |||||||||||||
U.S. Treasury and agency securities | $ | 192,702 | $ | (388 | ) | $ | 11,179 | $ | (1 | ) | ||||||
Corporate bonds | 257,615 | (1,450 | ) | 5,041 | (1 | ) | ||||||||||
Foreign government securities | 4,531 | (2 | ) | — | — | |||||||||||
Municipal securities | 43,028 | (32 | ) | — | — | |||||||||||
Total | $ | 497,876 | $ | (1,872 | ) | $ | 16,220 | $ | (2 | ) | ||||||
73
As of December 3, 2010 and November 27, 2009,29, 2013, there were no securities in an unrealized loss position for more than twelve months. As of November 30, 2012 there was one security in an unrealized loss position for more than twelve months. The following table summarizes the fair value and gross unrealized losses related to available-for-sale securities, aggregated by investment category, that were in a continuous unrealized loss position for more than twelve months. There were 168 securities and 4 securities that were in an unrealized loss position at December 3, 2010 and at months, as of November 27, 2009, respectively.30, 2012 (in thousands):
| 2012 | |||||||||||
Fair Value | Gross Unrealized Losses | ||||||||||
| Corporate bonds and commercial paper | $ | 2,999 | $ | (1 | ) | ||||||
| Total | $ | 2,999 | $ | (1 | ) | ||||||
The following table summarizes the cost and estimated fair value of short-term fixed income securities classified as short-term investments based on stated effective maturities as of December 3, 2010November 29, 2013 (in thousands):
Amortized Cost | Estimated Fair Value | Amortized Cost | Estimated Fair Value | ||||||||||||
Due within one year | $ | 624,260 | $ | 625,423 | $ | 508,359 | $ | 509,438 | |||||||
Due within two years | 518,262 | 523,168 | |||||||||||||
Due within three years | 443,965 | 446,342 | |||||||||||||
| Due between one and two years | 904,704 | 908,767 | |||||||||||||
| Due between two and three years | 698,679 | 702,035 | |||||||||||||
Due after three years | 110,302 | 112,007 | 217,857 | 218,236 | |||||||||||
Total | $ | 1,696,789 | $ | 1,706,940 | $ | 2,329,599 | $ | 2,338,476 | |||||||
We review our debt and marketable equity securities classified as short-term investments on a regular basis to evaluate whether or not any security has experienced an other-than-temporary decline in fair value. We consider factors such as the length of time and extent to which the market value has been less than the cost, the financial condition and near-term prospects of the issuer and our intent to sell, or whether it is more likely than not we will be required to sell the investment before recovery of the investment’sinvestment's amortized cost basis. If we believe that an other-than-temporary decline exists in one of these securities, we write down these investments to fair value. For debt securities, the portion of the write-down related to credit loss would be recorded to interest and other income, net in our Consolidated Statements of Income. Any portion not related to credit loss would be recorded to accumulated other comprehensive income, which is reflected as a separate component of stockholders’ equity in our Consolidated Balance Sheets. For equity securities, the write-down would be recorded to investment gains (losses), net in our Consolidated Statements of Income. As of December 3, 2010,During fiscal 2013, we dodid not consider any of our investments to be other-than-temporarily impaired. During fiscal 2012 and 2011, we recorded immaterial other-than-temporary impairment losses associated with our marketable equity securities and did not consider any of our debt securities to be other-than-temporarily impaired.
NOTE 4. FAIR VALUE MEASUREMENTS
Assets and Liabilities Measured and Recorded at Fair Value on a Recurring Basis
We measure certain financial assets and liabilities at fair value on a recurring basis. There have been no transfers between fair value measurement levels during the year ended November 29, 2013.
The fair value of our financial assets and liabilities at December 3, 2010November 29, 2013 was determined using the following inputs (in thousands):
| Fair Value Measurements at Reporting Date Using | ||||||||||||||||
Quoted Prices in Active Markets for Identical Assets | Significant Other Observable Inputs | Significant Unobservable Inputs | ||||||||||||||
| Total | (Level 1) | (Level 2) | (Level 3) | |||||||||||||
| Assets: | ||||||||||||||||
| Cash equivalents: | ||||||||||||||||
Money market mutual funds | $ | 477,259 | $ | 477,259 | $ | — | $ | — | ||||||||
Time deposits | 64,006 | 64,006 | — | — | ||||||||||||
U.S. Treasury securities | 68,196 | — | 68,196 | — | ||||||||||||
Municipal securities | 350 | — | 350 | — | ||||||||||||
Corporate bonds | 41,389 | — | 41,389 | — | ||||||||||||
| Short-term investments: | ||||||||||||||||
U.S. Treasury securities | 339,060 | — | 339,060 | — | ||||||||||||
U. S. agency securities | 230,371 | — | 230,371 | — | ||||||||||||
Municipal securities | 119,605 | — | 119,605 | — | ||||||||||||
Corporate bonds | 984,518 | — | 984,518 | — | ||||||||||||
Foreign government securities | 33,386 | — | 33,386 | — | ||||||||||||
Marketable equity securities | 11,184 | 11,184 | — | — | ||||||||||||
| Prepaid expenses and other current assets: | ||||||||||||||||
Foreign currency derivatives | 18,821 | — | 18,821 | — | ||||||||||||
| Other assets: | ||||||||||||||||
Deferred compensation plan assets | 11,071 | 617 | 10,454 | — | ||||||||||||
Total assets | $ | 2,399,216 | $ | 553,066 | $ | 1,846,150 | $ | — | ||||||||
| Liabilities: | ||||||||||||||||
| Accrued expenses: | ||||||||||||||||
Foreign currency derivatives | $ | 1,945 | $ | — | $ | 1,945 | $ | — | ||||||||
Total liabilities | $ | 1,945 | $ | — | $ | 1,945 | $ | — | ||||||||
| Fair Value Measurements at Reporting Date Using | |||||||||||||||
Quoted Prices in Active Markets for Identical Assets | Significant Other Observable Inputs | Significant Unobservable Inputs | |||||||||||||
| Total | (Level 1) | (Level 2) | (Level 3) | ||||||||||||
| Assets: | |||||||||||||||
| Cash equivalents: | |||||||||||||||
| Money market mutual funds | 429,373 | 429,373 | — | — | |||||||||||
| Time deposits | 104,711 | 104,711 | — | — | |||||||||||
| U.S. Treasury securities | 14,251 | — | 14,251 | — | |||||||||||
| Short-term investments: | |||||||||||||||
| Corporate bonds and commercial paper | 1,267,860 | — | 1,267,860 | — | |||||||||||
| Foreign government securities | 11,269 | — | 11,269 | — | |||||||||||
| Marketable equity securities | 720 | 720 | — | — | |||||||||||
| Municipal securities | 186,624 | — | 186,624 | — | |||||||||||
| U.S. agency securities | 447,945 | — | 447,945 | — | |||||||||||
| U.S. Treasury securities | 424,778 | — | 424,778 | — | |||||||||||
| Prepaid expenses and other current assets: | |||||||||||||||
| Foreign currency derivatives | 11,891 | — | 11,891 | — | |||||||||||
| Other assets: | |||||||||||||||
| Deferred compensation plan assets | 19,816 | 894 | 18,922 | — | |||||||||||
| Total assets | $ | 2,919,238 | $ | 535,698 | $ | 2,383,540 | $ | — | |||||||
| Liabilities: | |||||||||||||||
| Accrued expenses: | |||||||||||||||
| Foreign currency derivatives | $ | 1,067 | $ | — | $ | 1,067 | $ | — | |||||||
| Total liabilities | $ | 1,067 | $ | — | $ | 1,067 | $ | — | |||||||
75
The fair value of our financial assets and liabilities at November 27, 200930, 2012 was determined using the following inputs (in thousands):
| Fair Value Measurements at Reporting Date Using | Fair Value Measurements at Reporting Date Using | ||||||||||||||||||||||||||||||
Quoted Prices in Active Markets for Identical Assets | Significant Other Observable Inputs | Significant Unobservable Inputs | Quoted Prices in Active Markets for Identical Assets | Significant Other Observable Inputs | Significant Unobservable Inputs | ||||||||||||||||||||||||||
| Total | (Level 1) | (Level 2) | (Level 3) | Total | (Level 1) | (Level 2) | (Level 3) | ||||||||||||||||||||||||
| Assets: | |||||||||||||||||||||||||||||||
| Cash equivalents: | |||||||||||||||||||||||||||||||
Money market mutual funds | $ | 884,240 | $ | 884,240 | $ | — | $ | — | |||||||||||||||||||||||
| Corporate bonds and commercial paper | $ | 3,998 | $ | — | $ | 3,998 | $ | — | |||||||||||||||||||||||
Money market mutual funds and repurchase agreements | 1,171,270 | 1,171,270 | — | — | |||||||||||||||||||||||||||
| Municipal securities | 3,895 | — | 3,895 | — | |||||||||||||||||||||||||||
Time deposits | 40,137 | 40,137 | — | — | 45,118 | 45,118 | — | — | |||||||||||||||||||||||
| Short-term investments: | |||||||||||||||||||||||||||||||
| U.S. Treasury securities | 376,378 | — | 376,378 | — | |||||||||||||||||||||||||||
U.S. agency securities | 59,720 | — | 59,720 | — | |||||||||||||||||||||||||||
Municipal securities | — | — | — | — | |||||||||||||||||||||||||||
| Corporate bonds | 415,575 | — | 415,575 | — | |||||||||||||||||||||||||||
| Corporate bonds and commercial paper | 1,070,440 | — | 1,070,440 | — | |||||||||||||||||||||||||||
Foreign government securities | 48,286 | — | 48,286 | — | 6,952 | — | 6,952 | — | |||||||||||||||||||||||
Marketable equity securities | 5,027 | 5,027 | — | — | 244 | 244 | — | — | |||||||||||||||||||||||
| Municipal securities | 180,525 | — | 180,525 | — | |||||||||||||||||||||||||||
| Time deposits | 20,113 | — | 20,113 | — | |||||||||||||||||||||||||||
| U.S. agency securities | 504,191 | — | 504,191 | — | |||||||||||||||||||||||||||
| U.S. Treasury securities | 330,836 | — | 330,836 | — | |||||||||||||||||||||||||||
| Prepaid expenses and other current assets: | |||||||||||||||||||||||||||||||
Foreign currency derivatives | 4,307 | — | 4,307 | — | 13,513 | — | 13,513 | — | |||||||||||||||||||||||
| Other assets: | |||||||||||||||||||||||||||||||
Investments of limited partnership | 37,121 | — | — | 37,121 | |||||||||||||||||||||||||||
Deferred compensation plan assets | 9,045 | 717 | 8,328 | — | 15,094 | 436 | 14,658 | — | |||||||||||||||||||||||
Total assets | $ | 1,879,836 | $ | 930,121 | $ | 912,594 | $ | 37,121 | $ | 3,366,189 | $ | 1,217,068 | $ | 2,149,121 | $ | — | |||||||||||||||
| Liabilities: | |||||||||||||||||||||||||||||||
| Accrued expenses: | |||||||||||||||||||||||||||||||
Foreign currency derivatives | $ | 1,589 | $ | — | $ | 1,589 | $ | — | |||||||||||||||||||||||
Total liabilities | $ | 1,589 | $ | — | $ | 1,589 | $ | — | |||||||||||||||||||||||
| Liabilities: | |||||||||||||||
| Accrued expenses: | |||||||||||||||
| Foreign currency derivatives | $ | 998 | $ | — | $ | 998 | $ | — | |||||||
| Total liabilities | $ | 998 | $ | — | $ | 998 | $ | — | |||||||
See Note 3 for further information regarding the fair value of our financial instruments.
Our fixed income available-for-sale securities consist of high quality, investment grade securities from diverse issuers with a minimum credit rating of A-BBB and a weighted average credit rating of AA+.AA-. We value these securities based on pricing from pricing vendors who may use quoted prices in active markets for identical assets (Level 1 inputs) or inputs other than quoted prices that are observable either directly or indirectly (Level 2 inputs) in determining fair value. However, we classify all of our fixed income available-for-sale securities as having Level 2 inputs. The valuation techniques used to measure the fair value of our financial instruments having Level 2 inputs were derived from non-binding market consensus prices that are corroborated by observable market data, quoted market prices for similar instruments, o ror pricing models such as discounted cash flow techniques. Our procedures include controls to ensure that appropriate fair values are recorded such as comparing prices obtained from multiple independent sources.
Our deferred compensation plan assets consist of prime money market funds and mutual funds.
76
ADOBE SYSTEMS INCORPORATED
NOTES TO CONSOLIDATED FINANCIAL STATEMENTS (Continued)
Assets and Liabilities Measured at Fair Value on September 30, 2010. The Level 3 investments consisted of investments in privately-held companies. These investments were remeasured at fair value each period with any gains or losses recognized in investment gains (losses), net in our Consolidated Statements of Income. There was no impact to OCI related to our Level 3 investments. We estimated fair value of the Level 3 investments by considering available information such as pricing in recent rounds of financing, current cash positions, earnings and cash flow forecasts, recent operational performance and any other readily available market data. Subsequent to the termination of our limited partnership interest in Adobe Ventures, a portion of our investments were sold and the remaining amount was transferred to our cost method investments and marketable equity securities.Nonrecurring Basis
Balance as of November 28, 2008 | $ | 38,753 | ||
Purchases and sales of investments, net | 1,921 | |||
Unrealized net investment losses included in earnings | (3,553 | ) | ||
Balance as of November 27, 2009 | $ | 37,121 | ||
Purchases and sales of investments, net | (18,788 | ) | ||
Unrealized net investment losses included in earnings | (7,919 | ) | ||
Transfer to cost method investments | (8,480 | ) | ||
Transfer to marketable equity securities (Level 1) | (1,934 | ) | ||
Balance as of December 3, 2010 | $ | — |
We also have direct investments in privately-heldprivately held companies accounted for under the cost method, which are periodically assessed for other-than-temporary impairment. If we determine that an other-than-temporary impairment has occurred, we write-downwrite down the investment to its fair value. We estimate fair value of our cost method investments considering available information such as pricing in recent rounds of financing, current cash positions, earnings and cash flow forecasts, recent operational performance and any other readily available market data. During fiscal 2010 and 2009,2013, we determined thatthere were other-than-temporary impairments of $7.0 million on certain of our direct cost method investments and wrote down the investments to fair value. During fiscal 2012, we determined there were other-than-temporarily impaired which resulted in charges of $2.3 million and $13.9 million, respectively, which were included in investment gains (losses), net in our Consolidated Statements of Income.
As of November 29, 2013, the carrying value of our lease receivables approximated fair value, based on Level 2 valuation inputs which include Treasury rates, LIBOR rates and applicable credit spreads. See Note 15 for further details regarding our investment in lease receivables. The fair value of our long-term debt was approximately $1.6 billion as of November 29, 2013, based on Level 2 quoted prices in inactive markets. See Note 16 for further details regarding our debt.
NOTE 5. DERIVATIVEDERIVATIVES AND HEDGING ACTIVITIES
Hedge Accounting
We recognize derivative instruments and hedging activities as either assets or liabilities in our Consolidated Balance Sheets and measure them at fair value. Gains and losses resulting from changes in fair value are accounted for depending on the use of the derivative and whether it is designated and qualifies for hedge accounting.
Economic Hedging—Hedges of Forecasted Transactions
In countries outside the U.S., we transact business in U.S. dollarsDollars and in various other currencies. Therefore, we are subject to exposure from movements in foreign currency rates. We may use foreign exchange option contracts or forward contracts to hedge certain operational (“cash flow”)flow exposures resulting from changes in these foreign currency exchange rates. These foreign exchange contracts, carried at fair value, may have maturities between one and twelve months. The maximum original duration of any contract isup to twelve months. We enter into these foreign exchange contracts to hedge a portion of our forecasted foreign currency denominated revenue in the normal course of business and accordingly, they are not speculative in nature.
We recognize these contracts as derivative instruments from hedging activitiesand they are classified as either assets or liabilities on the balance sheet and measure themmeasured on a recurring basis at fair value. Gains and losses resulting from changes in fair value are accounted for depending on the use of the derivativecontract and whether it is designated and qualifies for hedge accounting. To receive hedge accounting treatment, all hedging relationships are formally documented at the inception of the hedge, and the hedges must be highly effective in offsetting changes to future cash flows on hedged transactions. We record changes in the intrinsic value of these cash flow hedges in accumulated other comprehensive income in our Consolidated Balance Sheets, until the forecasted transaction occurs. When the forecasted transaction occurs, we reclassify the related gain or loss on the cash flow hedge to revenue .revenue. In the event the underlying forecasted transaction does not occur, or it becomes probable that it will not occur, we reclassify the gain or loss on the related cash flow hedge from accumulated other comprehensive income to interest and other income (expense), net in our Consolidated Statements of Income at that time. If we do not elect hedge accounting, or the contract does not qualify for hedge accounting treatment, the changes in fair market value from period to period are recorded in interest and other income (expense), net in our Consolidated Statements of Income. For fiscal 2010, 20092012 and 20082011, there were no such gains or losses recognized in interest and other income, net relating to hedges of forecasted transactions that did not occur.
For fiscal 2013, net gains or losses recognized in other income relating to hedges of forecasted transactions that did not occur were insignificant.
We evaluate hedge effectiveness at the inception of the hedge prospectively as well as retrospectively and record any ineffective portion of the hedging instruments in interest and other income, net on our Consolidated Statements of Income. The net gain (loss) recognized in interest and other income, net for cash flow hedges due to hedge ineffectiveness was
insignificant for all fiscal 2010, 2009 and 2008.years presented. The time value of purchased derivative instrumentscontracts is recorded in interest and other income, net in our Consolidated Statements of Income.
77
Balance Sheet Hedging—Hedging of Foreign Currency Assets and Liabilities
We also hedge our net recognized foreign currency denominated assets and liabilities with foreign exchange forward contracts to reduce the risk that our earningsthe value of these assets and cash flowsliabilities will be adversely affected by changes in exchange rates. These derivative instrumentscontracts hedge assets and liabilities that are denominated in foreign currencies and are carried at fair value with changes in the fair value recorded to interest and other income (expense), net in our Consolidated Statements of Income. These derivative instrumentscontracts do not subject us to material balance sheet risk due to exchange rate movements because gains and losses on these derivatives are intended to offset gains and losses on the assets and liabilities being hedged. As of December 3, 2010,November 29, 2013, total notional amounts of outstanding contracts were $536.5$282.8 million which included the notional equivale ntequivalent of $305.1$99.0 million in Euro, $33.8 million in Euro, $52.0British Pounds and $150.0 million in Yen and $179.4 million in other foreign currencies. As of November 27, 2009,30, 2012, total notional amounts of outstanding contracts were $154.9$422.9 million which included the notional equivalent of $87.6$209.8 million in Euro, $22.9$44.2 million in Yen and $44.4$168.9 million in other foreign currencies. At December 3, 2010November 29, 2013 and November 27, 2009,30, 2012, the outstanding balance sheet hedging derivatives had maturities of 90180 days or less.
The fair value of derivative instruments on our Consolidated Balance Sheets as of December 3, 2010November 29, 2013 and November 27, 2009 were30, 2012 was as follows (in thousands):
| 2010 | 2009 | 2013 | 2012 | ||||||||||||||||||||||||||||
Fair Value Asset Derivatives(1) | Fair Value Liability Derivatives(2) | Fair Value Asset Derivatives(1) | Fair Value Liability Derivatives(2) | Fair Value Asset Derivatives(1) | Fair Value Liability Derivatives(2) | Fair Value Asset Derivatives(1) | Fair Value Liability Derivatives(2) | ||||||||||||||||||||||||
| Derivatives designated as hedging instruments: | |||||||||||||||||||||||||||||||
Foreign exchange option contracts(3) | $ | 6,092 | $ | — | $ | 4,175 | $ | — | $ | 8,913 | $ | — | $ | 10,897 | $ | — | |||||||||||||||
| Derivatives not designated as hedging instruments: | |||||||||||||||||||||||||||||||
Foreign exchange forward contracts | 12,729 | 1,945 | 132 | 1,589 | 2,978 | 1,067 | 2,616 | 998 | |||||||||||||||||||||||
Total derivatives | $ | 18,821 | $ | 1,945 | $ | 4,307 | $ | 1,589 | $ | 11,891 | $ | 1,067 | $ | 13,513 | $ | 998 | |||||||||||||||
_________________________________________
(1) | Included in prepaid expenses and other current assets on our Consolidated Balance Sheets. |
(2) | Included in accrued expenses on our Consolidated Balance Sheets. |
(3) | Hedging effectiveness expected to be recognized to income within the next twelve months. |
The effect of derivative instruments designated as cash flow hedges and of derivative instruments not designated as hedges in our Consolidated Statements of Income for fiscal 20102013, 2012 and 2009 was2011 were as follows (in thousands):
| 2010 | 2009 | 2013 | 2012 | 2011 | |||||||||||||||||||||||||||||||||||
Foreign Exchange Option Contracts | Foreign Exchange Forward Contracts | Foreign Exchange Option Contracts | Foreign Exchange Forward Contracts | Foreign Exchange Option Contracts | Foreign Exchange Forward Contracts | Foreign Exchange Option Contracts | Foreign Exchange Forward Contracts | Foreign Exchange Option Contracts | Foreign Exchange Forward Contracts | ||||||||||||||||||||||||||||||
| Derivatives in cash flow hedging relationships: | |||||||||||||||||||||||||||||||||||||||
Net gain (loss) recognized in OCI, net of tax(1) | $ | 20,325 | $ | — | $ | (14,618 | ) | $ | — | $ | 34,677 | $ | — | $ | 23,922 | $ | — | $ | 16,952 | $ | — | ||||||||||||||||||
Net gain (loss) reclassified from accumulated OCI into income, net of tax(2) | $ | 20,169 | $ | — | $ | 27,138 | $ | — | $ | 35,914 | $ | — | $ | 30,672 | $ | — | $ | 3,749 | $ | — | |||||||||||||||||||
Net gain (loss) recognized in income(3) | $ | (23,285 | ) | $ | — | $ | (18,027 | ) | $ | — | $ | (21,098 | ) | $ | — | $ | (29,554 | ) | $ | — | $ | (28,796 | ) | $ | — | ||||||||||||||
Derivatives not designated as hedging relationships: | |||||||||||||||||||||||||||||||||||||||
Net gain (loss) recognized in income(4) | $ | — | $ | (34,168 | ) | $ | — | $ | (14,407 | ) | $ | — | $ | 2,129 | $ | — | $ | 8,742 | $ | — | $ | (3,973 | ) | ||||||||||||||||
_________________________________________
(1) | Net change in the fair value of the effective portion classified in OCI. |
(2) | Effective portion classified as revenue. |
(3) | Ineffective portion and amount excluded from effectiveness testing classified in interest and other income (expense), net. |
(4) | Classified in interest and other income (expense), net. |
78
Net gains (losses) recognized in interest and other income (expense), net relating to balance sheet hedging for fiscal 2010, 20092013, 2012 and 20082011 were as follows (in thousands):
| 2010 | 2009 | 2008 | 2013 | 2012 | 2011 | |||||||||||||||||||
| Gain (loss) on foreign currency assets and liabilities: | ||||||||||||||||||||||||
| Net realized gain (loss) recognized in other income | $ | (11,470 | ) | $ | 25,384 | $ | (7,738 | ) | $ | (4,783 | ) | $ | (5,899 | ) | $ | 6,604 | ||||||||
Net unrealized (loss) gain recognized in other income related to instruments outstanding | (12,345 | ) | (6,390 | ) | 5,223 | |||||||||||||||||||
| Net unrealized gain (loss) recognized in other income | 2,751 | (4,720 | ) | (4,062 | ) | |||||||||||||||||||
| (23,815 | ) | 18,994 | (2,515 | ) | (2,032 | ) | (10,619 | ) | 2,542 | |||||||||||||||
| (Loss) gain on hedges of foreign currency assets and liabilities: | ||||||||||||||||||||||||
| Net realized gain (loss) recognized in other income | 21,921 | (11,872 | ) | (3,255 | ) | |||||||||||||||||||
| Gain (loss) on hedges of foreign currency assets and liabilities: | ||||||||||||||||||||||||
| Net realized gain recognized in other income | 1,835 | 9,312 | 4,633 | |||||||||||||||||||||
Net unrealized gain (loss) recognized in other income | 12,247 | (2,535 | ) | 3,920 | 294 | (570 | ) | (8,606 | ) | |||||||||||||||
| 34,168 | (14,407 | ) | 665 | 2,129 | 8,742 | (3,973 | ) | |||||||||||||||||
| Net gain (loss) recognized in interest and other income (expense), net | $ | 10,353 | $ | 4,587 | $ | (1,850 | ) | $ | 97 | $ | (1,877 | ) | $ | (1,431 | ) | |||||||||
NOTE 6. PROPERTY AND EQUIPMENT
Property and equipment, net consisted of the following as of December 3, 2010November 29, 2013 and November 27, 200930, 2012 (in thousands):
| 2010 | 2009 | 2013 | 2012 | |||||||||||||
Computers and equipment | $ | 454,351 | $ | 409,595 | $ | 731,767 | $ | 702,270 | ||||||||
Furniture and fixtures | 68,322 | 62,786 | 82,904 | 84,697 | ||||||||||||
Server hardware under capital lease | 32,151 | — | 61,007 | 35,303 | ||||||||||||
Capital projects in-progress | 20,805 | 19,931 | 54,593 | 63,980 | ||||||||||||
Leasehold improvements | 188,334 | 152,200 | 235,859 | 222,262 | ||||||||||||
Land | 110,160 | 86,493 | 106,283 | 114,941 | ||||||||||||
Buildings | 99,845 | 99,845 | 175,325 | 175,222 | ||||||||||||
Total | 973,968 | 830,850 | 1,447,738 | 1,398,675 | ||||||||||||
Less accumulated depreciation and amortization | (525,087 | ) | (442,718 | ) | (787,964 | ) | (734,373 | ) | ||||||||
Property and equipment, net | $ | 448,881 | $ | 388,132 | $ | 659,774 | $ | 664,302 | ||||||||
Depreciation and amortization expense of property and equipment for fiscal 2010, 20092013, 2012 and 20082011 was $107.5$144.7 million $95.9, $134.4 million and $83.3$117.5 million, respectively.
In May 2013, management approved a plan to sell land, building and other assets located in Waltham, Massachusetts (the "Waltham property assets") with a total carrying amount of $47.4 million. The decision to sell the Waltham property assets was largely based upon lack of operational needs for a facility of this size, in combination with recent improvements in market conditions for commercial real estate in the area. During May 2013, we began to actively market the Waltham property assets and we expected to sell the property within one year from management's approval of the plan and classified the Waltham property assets as held for sale at $23.6 million representing their fair value, net of estimated costs to sell which was the lesser of the fair value less cost to sell or carrying amount of the assets. The fair value, net of estimated cost to sell was measured with the assistance of third-party valuation models which used inputs such as market comparable data for similar properties to be purchased by other operating and investing entities and discounted cash flow techniques as part of the analysis. The fair value measurement was categorized as Level 3 as significant unobservable inputs were used in the valuation analysis. We ceased recognizing depreciation expense on the Waltham property assets upon reclassification. As a result, we recorded a write-down of $23.8 million during fiscal 2013. These charges are included in restructuring and other related charges in our Consolidated Statements of Income for fiscal 2013. In September 2013, we finalized the sale of the Waltham property assets for net proceeds of $24.3 million which approximated the carrying value of the assets at the time of sale.
79
NOTE 7. GOODWILL AND PURCHASED AND OTHER INTANGIBLES
During fiscal 2013, 2012 and 2011, we modified our segments due to changes in how we operate our business. See Note 18 for further information regarding our segment changes. Prior year information in the tables below has been reclassified to reflect these changes.
Goodwill by reportable segment and activity for the years ended November 27, 200929, 2013 and December 3, 2010November 30, 2012 was as follows (in thousands):
| 2008 | Acquisitions | Other(1) | 2009 | Acquisitions | Other(2) | 2010 | ||||||||||||||||||||||
Creative Solutions | $ | 956,011 | $ | 253,463 | $ | 1,126 | $ | 1,210,600 | $ | — | $ | (3,500 | ) | $ | 1,207,100 | |||||||||||||
Knowledge Worker | 408,318 | — | 2,255 | 410,573 | — | (1,969 | ) | 408,604 | ||||||||||||||||||||
Enterprise | 298,039 | — | (4,310 | ) | 293,729 | 159,924 | (5,981 | ) | 447,672 | |||||||||||||||||||
Omniture | — | 1,108,034 | — | 1,108,034 | — | (1,130 | ) | 1,106,904 | ||||||||||||||||||||
Platform | 265,518 | — | (398 | ) | 265,120 | — | (50 | ) | 265,070 | |||||||||||||||||||
Print and Publishing | 206,844 | — | (311 | ) | 206,533 | — | (39 | ) | 206,494 | |||||||||||||||||||
Goodwill | $ | 2,134,730 | $ | 1,361,497 | $ | (1,638 | ) | $ | 3,494,589 | $ | 159,924 | $ | (12,669 | ) | $ | 3,641,844 |
| 2011 | Acquisitions | Other(1) | 2012 | Acquisitions | Other(1) | 2013 | ||||||||||||||||||||||
| Digital Media | $ | 1,958,941 | $ | — | $ | (611 | ) | $ | 1,958,330 | $ | 91,355 | $ | 41 | $ | 2,049,726 | |||||||||||||
| Digital Marketing | 1,631,725 | 291,422 | (6,679 | ) | 1,916,468 | 526,739 | 20,621 | 2,463,828 | ||||||||||||||||||||
| Print and Publishing | 258,551 | — | (90 | ) | 258,461 | — | (34 | ) | 258,427 | |||||||||||||||||||
| Goodwill | $ | 3,849,217 | $ | 291,422 | $ | (7,380 | ) | $ | 4,133,259 | $ | 618,094 | $ | 20,628 | $ | 4,771,981 | |||||||||||||
_________________________________________
(1) | Amounts primarily consist of |
Purchased and other intangible assets, net by reportable segment as of December 3, 2010November 29, 2013 and November 27, 200930, 2012 were as follows (in thousands):
| 2010 | 2009 | |||||||
| Creative Solutions | $ | 20,617 | $ | 124,178 | ||||
| Knowledge Worker | 9,455 | 23,041 | ||||||
| Enterprise | 80,092 | 6,588 | ||||||
| Omniture | 344,059 | 358,204 | ||||||
| Platform | 1,208 | 9,159 | ||||||
| Print and Publishing | 1,832 | 6,218 | ||||||
| Purchased and other intangible assets, net | $ | 457,263 | $ | 527,388 |
| 2013 | 2012 | |||||||
| Digital Media | $ | 170,213 | $ | 148,215 | ||||
| Digital Marketing | 433,245 | 396,786 | ||||||
| Print and Publishing | 1,796 | 35 | ||||||
| Purchased and other intangible assets, net | $ | 605,254 | $ | 545,036 | ||||
Purchased and other intangible assets subject to amortization as of December 3, 2010November 29, 2013 and November 27, 200930, 2012 were as follows (in thousands):
| 2013 | 2012 | ||||||||||||||||||||||
| Cost | Accumulated Amortization | Net | Cost | Accumulated Amortization | Net | ||||||||||||||||||
| Purchased technology | $ | 423,237 | $ | (220,414 | ) | $ | 202,823 | $ | 366,574 | $ | (161,538 | ) | $ | 205,036 | |||||||||
| Customer contracts and relationships | $ | 389,800 | $ | (111,416 | ) | $ | 278,384 | $ | 318,027 | $ | (74,214 | ) | $ | 243,813 | |||||||||
| Trademarks | 67,546 | (27,933 | ) | 39,613 | 53,293 | (19,171 | ) | 34,122 | |||||||||||||||
| Acquired rights to use technology | 155,322 | (76,740 | ) | 78,582 | 104,402 | (56,782 | ) | 47,620 | |||||||||||||||
| Localization | 3,404 | (2,172 | ) | 1,232 | 8,586 | (4,654 | ) | 3,932 | |||||||||||||||
| Other intangibles | 16,447 | (11,827 | ) | 4,620 | 18,742 | (8,229 | ) | 10,513 | |||||||||||||||
| Total other intangible assets | $ | 632,519 | $ | (230,088 | ) | $ | 402,431 | $ | 503,050 | $ | (163,050 | ) | $ | 340,000 | |||||||||
Purchased and other intangible assets, net | $ | 1,055,756 | $ | (450,502 | ) | $ | 605,254 | $ | 869,624 | $ | (324,588 | ) | $ | 545,036 | |||||||||
| 2010 | 2009 | ||||||||||||||||||||||
| Cost | Accumulated Amortization | Net | Cost | Accumulated Amortization | Net | ||||||||||||||||||
Purchased technology | $ | 260,198 | $ | (61,987 | ) | $ | 198,211 | $ | 586,952 | $ | (387,731 | ) | $ | 199,221 | |||||||||
Localization | $ | 14,768 | $ | (9,355 | ) | $ | 5,413 | $ | 20,284 | $ | (15,222 | ) | $ | 5,062 | |||||||||
Trademarks | 172,019 | (136,480 | ) | 35,539 | 172,030 | (104,953 | ) | 67,077 | |||||||||||||||
| Customer contracts and relationships | 398,421 | (197,459 | ) | 200,962 | 363,922 | (159,450 | ) | 204,472 | |||||||||||||||
Other intangibles | 51,265 | (34,127 | ) | 17,138 | 54,535 | (2,979 | ) | 51,556 | |||||||||||||||
Total other intangible assets | $ | 636,473 | $ | (377,421 | ) | $ | 259,052 | $ | 610,771 | $ | (282,604 | ) | $ | 328,167 | |||||||||
| Purchased and other intangible assets | $ | 896,671 | $ | (439,408 | ) | $ | 457,263 | $ | 1,197,723 | $ | (670,335 | ) | $ | 527,388 | |||||||||
Purchased intangibles associated with certain of our prior year acquisitions primarily Macromedia, became fully amortized and were removed from the balance sheet. Amortizationsheet in the first quarter of fiscal 2013. Excluding the expense associated with historical use of the acquired rights to use the technology discussed in the paragraph above, amortization expense related to purchased and other intangible assets was $156.7$156.9 million $151.3, $146.2 million and $184.4$131.5 million for fiscal 2010, 20092013, 2012 and 2008,2011, respectively. Of these amounts, for fiscal 2010, 20092013, 2012 and 2008, $84.52011, $111.0 million $88.3, $98.3 million and $116.1$88.3 million, respectively, waswere included in cost of sales.
80
Purchased and other intangible assets are amortized over their estimated useful lives of 1 to 1314 years. As of December 3, 2010,November 29, 2013, we expect amortization expense in future periods to be as follows (in thousands):
Fiscal Year | Purchased Technology | Other Intangible Assets | |||||||
2011 | $ | 44,306 | $ | 57,980 | |||||
2012 | 42,699 | 29,374 | |||||||
2013 | 38,691 | 27,029 | |||||||
2014 | 35,801 | 26,191 | |||||||
2015 | 30,938 | 25,777 | |||||||
Thereafter | 5,776 | 92,701 | |||||||
Total expected amortization expense | $ | 198,211 | $ | 259,052 | |||||
| Fiscal Year | Purchased Technology | Other Intangible Assets | ||||||
| 2014 | $ | 74,811 | $ | 75,239 | ||||
| 2015 | 61,273 | 68,041 | ||||||
| 2016 | 22,808 | 62,061 | ||||||
| 2017 | 15,350 | 52,771 | ||||||
| 2018 | 8,961 | 41,779 | ||||||
| Thereafter | 19,620 | 102,540 | ||||||
| Total expected amortization expense | $ | 202,823 | $ | 402,431 | ||||
| 2010 | 2009 | |||||||
| Acquired rights to use technology | $ | 71,521 | $ | 84,313 | ||||
| Investments | 25,018 | 63,526 | ||||||
| Security and other deposits | 11,266 | 11,692 | ||||||
| Prepaid royalties | 7,726 | 12,059 | ||||||
| Debt issuance costs | 9,574 | — | ||||||
| Deferred compensation plan assets | 11,071 | 9,045 | ||||||
| Restricted cash | 2,499 | 4,650 | ||||||
| Prepaid land lease | 13,215 | 3,209 | ||||||
| Prepaid rent | 787 | 1,377 | ||||||
Other(*) | 17,194 | 1,394 | ||||||
| Other assets | $ | 169,871 | $ | 191,265 |
NOTE 9.8. ACCRUED EXPENSES
Accrued expenses as of December 3, 2010November 29, 2013 and November 27, 200930, 2012 consisted of the following (in thousands):
| 2010 | 2009 | 2013 | 2012 | ||||||||||||
| Accrued compensation and benefits | $ | 290,366 | $ | 164,352 | $ | 318,219 | $ | 242,887 | |||||||
| Sales and marketing allowances | 38,706 | 32,774 | 66,502 | 87,916 | |||||||||||
| Accrued marketing | 26,404 | 28,233 | |||||||||||||
| Accrued corporate marketing | 22,801 | 39,503 | |||||||||||||
| Taxes payable | 21,800 | 11,879 | 18,225 | 26,164 | |||||||||||
| Royalties payable | 14,778 | 10,040 | |||||||||||||
| Accrued interest expense | 21,203 | 1,355 | 20,613 | 20,796 | |||||||||||
| Other | 165,796 | 181,053 | 195,801 | 162,834 | |||||||||||
| Accrued expenses | $ | 564,275 | $ | 419,646 | $ | 656,939 | $ | 590,140 | |||||||
Other primarily includes general corporate accruals for local and regional expenses and technical support. Other is also comprised of deferred rent related to office locations with rent escalations accrued royalties and foreign currency liability derivatives.
NOTE 10.9. INCOME TAXES
Income before income taxes includes income from foreign operations of $659.3 million, $422.4 million and $740.3 million for fiscal 2010, 20092013, 2012 and 2008, respectively.2011 consisted of the following (in thousands):
| 2013 | 2012 | 2011 | ||||||||||
| Domestic | $ | 132,916 | $ | 512,987 | $ | 252,476 | ||||||
| Foreign | 223,225 | 605,807 | 782,754 | |||||||||
| Income before income taxes | $ | 356,141 | $ | 1,118,794 | $ | 1,035,230 | ||||||
Domestic income before taxes is significantly lower than foreign income before taxes due to certain accounting charges that our foreign subsidiaries are not required to bear under foreign accounting standards. These charges do not lower our domestic income subject to U.S. tax. Prior year amounts have been reclassified to conform to the current year presentation.
81
The provision for income taxes for fiscal 2010, 20092013, 2012 and 20082011 consisted of the following (in thousands):
| 2010 | 2009 | 2008 | 2013 | 2012 | 2011 | |||||||||||||||||||
| Current: | ||||||||||||||||||||||||
United States federal | $ | 260,118 | $ | 152,840 | $ | 24,179 | $ | (53,985 | ) | $ | 162,574 | $ | 104,587 | |||||||||||
Foreign | 44,869 | 36,794 | 27,680 | 65,609 | 59,255 | 41,724 | ||||||||||||||||||
State and local | 31,866 | 25,427 | 6,972 | 3,317 | (2,244 | ) | (8,769 | ) | ||||||||||||||||
Total current | 336,853 | 215,061 | 58,831 | 14,941 | 219,585 | 137,542 | ||||||||||||||||||
| Deferred: | ||||||||||||||||||||||||
United States federal | (158,350 | ) | 50,376 | 41,678 | 24,139 | 69,374 | 60,617 | |||||||||||||||||
Foreign | (6,475 | ) | 559 | (9,693 | ) | (6,215 | ) | (6,082 | ) | 8,262 | ||||||||||||||
State and local | (14,665 | ) | 4,635 | 25,518 | (7,328 | ) | 3,142 | (13,606 | ) | |||||||||||||||
Total deferred | (179,490 | ) | 55,570 | 57,503 | 10,596 | 66,434 | 55,273 | |||||||||||||||||
Tax expense attributable to employee stock plans | 11,108 | 44,381 | 90,360 | 40,619 | — | 9,568 | ||||||||||||||||||
Provision for income taxes | $ | 168,471 | $ | 315,012 | $ | 206,694 | $ | 66,156 | $ | 286,019 | $ | 202,383 | ||||||||||||
Total income tax expense differs from the expected tax expense (computed by multiplying the U.S. federal statutory rate of 35% by income before income taxes) as a result of the following (in thousands):
| 2010 | 2009 | 2008 | ||||||||||
Computed “expected” tax expense | $ | 330,103 | $ | 245,532 | $ | 377,478 | ||||||
State tax expense, net of federal benefit | 13,444 | 7,799 | 12,700 | |||||||||
Tax credits | (1,317 | ) | (14,127 | ) | (12,873 | ) | ||||||
| Differences between statutory rate and foreign effective tax rate | (129,063 | ) | (91,262 | ) | (132,470 | ) | ||||||
Change in deferred tax asset valuation allowance | 1,408 | 2,759 | (1,105 | ) | ||||||||
Stock-based compensation (net of tax deduction) | 4,181 | 6,085 | 5,457 | |||||||||
Resolution of U.S. income tax exams | (39,753 | ) | — | (20,712 | ) | |||||||
Foreign tax refund for fiscal 2000 - 2002 | — | — | (16,351 | ) | ||||||||
Domestic manufacturing deduction benefit | (14,630 | ) | (7,525 | ) | (6,300 | ) | ||||||
| Tax charge for licensing Omniture’s technology to foreign subsidiaries | — | 161,701 | — | |||||||||
Other, net | 4,098 | 4,050 | 870 | |||||||||
Provision for income taxes | $ | 168,471 | $ | 315,012 | $ | 206,694 |
| 2013 | 2012 | 2011 | ||||||||||
| Computed “expected” tax expense | $ | 124,649 | $ | 391,578 | $ | 362,331 | ||||||
| State tax expense, net of federal benefit | (6,304 | ) | 11,320 | 8,436 | ||||||||
| Tax credits | (29,087 | ) | (1,226 | ) | (30,283 | ) | ||||||
| Differences between statutory rate and foreign effective tax rate | (39,678 | ) | (122,999 | ) | (135,178 | ) | ||||||
| Change in deferred tax asset valuation allowance | 514 | (2,144 | ) | (493 | ) | |||||||
| Stock-based compensation (net of tax deduction) | 9,783 | 10,976 | 3,983 | |||||||||
| Resolution of income tax examinations | (8,421 | ) | (26,687 | ) | — | |||||||
| Domestic manufacturing deduction benefit | (2,929 | ) | (17,010 | ) | (14,350 | ) | ||||||
| U.S. tax benefits related to state income tax ruling | — | — | (22,320 | ) | ||||||||
| Tax charge for licensing acquired company technology to foreign subsidiaries | 18,935 | 38,849 | 31,298 | |||||||||
| Other, net | (1,306 | ) | 3,362 | (1,041 | ) | |||||||
| Provision for income taxes | $ | 66,156 | $ | 286,019 | $ | 202,383 | ||||||
82
Deferred Tax Assets and Liabilities
The tax effects of the temporary differences that gave rise to significant portions of the deferred tax assets and liabilities as of December 3, 2010November 29, 2013 and November 27, 200930, 2012 are presented below (in thousands):
| 2010 | 2009 | 2013 | 2012 | |||||||||||||
| Deferred tax assets: | ||||||||||||||||
Acquired technology | $ | 3,774 | $ | 937 | $ | 14,379 | $ | 3,890 | ||||||||
Reserves and accruals | 72,395 | 68,472 | 67,753 | 71,888 | ||||||||||||
Deferred revenue | 17,114 | 17,441 | 10,218 | 9,941 | ||||||||||||
Unrealized losses on investments | 6,263 | 15,263 | 9,793 | 17,482 | ||||||||||||
Stock-based compensation | 73,985 | 56,541 | 64,244 | 85,179 | ||||||||||||
Net operating loss of acquired companies | 24,284 | 56,138 | ||||||||||||||
Credits | 8,629 | 12,205 | ||||||||||||||
| Net operating loss carryforwards of acquired companies | 9,222 | 16,257 | ||||||||||||||
| Credit carryforwards | 43,175 | 31,172 | ||||||||||||||
Capitalized expenses | 9,188 | 5,701 | 188 | 4,023 | ||||||||||||
Other | 12,889 | 11,603 | 6,788 | 5,165 | ||||||||||||
Total gross deferred tax assets | 228,521 | 244,301 | 225,760 | 244,997 | ||||||||||||
Deferred tax asset valuation allowance | (5,691 | ) | (4,283 | ) | (21,493 | ) | (28,247 | ) | ||||||||
Total deferred tax assets | 222,830 | 240,018 | 204,267 | 216,750 | ||||||||||||
| Deferred tax liabilities: | ||||||||||||||||
Depreciation and amortization | (38,524 | ) | (11,975 | ) | (89,611 | ) | (81,034 | ) | ||||||||
Undistributed earnings of foreign subsidiaries | (55,841 | ) | (210,619 | ) | (211,417 | ) | (187,528 | ) | ||||||||
Acquired intangible assets | (148,316 | ) | (192,493 | ) | (176,626 | ) | (153,757 | ) | ||||||||
Total deferred tax liabilities | (242,681 | ) | (415,087 | ) | (477,654 | ) | (422,319 | ) | ||||||||
Net deferred tax (liabilities) assets | $ | (19,851 | ) | $ | (175,069 | ) | ||||||||||
| Net deferred tax liabilities | $ | (273,387 | ) | $ | (205,569 | ) | ||||||||||
The deferred tax assets and liabilities for fiscal 20102013 and fiscal 20092012 include amounts related to various acquisitions. The total change in deferred tax assets and liabilities in fiscal 20102013 includes changes that are recorded to OCI, additional paid-in capital, goodwill and retained earnings.
We provide for U.S. income taxes on the earnings of foreign subsidiaries unless the subsidiaries’ earnings are considered permanently reinvested outside the U.S. To the extent that the foreign earnings previously treated as permanently reinvested are repatriated, the related U.S. tax liability may be reduced by any foreign income taxes paid on these earnings. As of December 3, 2010,November 29, 2013, the cumulative amount of earnings upon which U.S. income taxes have not been provided is approximately $1.9 billion.$3.1 billion. The unrecognized deferred tax liability for these earnings is approximately $545.4 million.$0.8 billion.
As of December 3, 2010,November 29, 2013, we have U.S. net operating loss carryforward assetscarryforwards of approximately $68.3$10.8 million for federal, $30.4 million for state, and $10.8 million for federal and $7.7 million for state.foreign. We also have federal, state and stateforeign tax credit carryforwards of approximately $3.7$1.4 million, $30.2 million and $7.6$22.2 million, respectively. The net operating loss carryforward assets, federal tax credits and foreign tax credits will expire in various years from fiscal 20112014 through 2029.2033. The state tax credit carryforwards can be carried forward indefinitely. The net operating loss carryforward assets and certain credits are subject to an annual limitation under Internal Revenue Code Section 382, but are expected to be fully realized.
In addition, we have been trackingtrack certain deferred tax attributes of $50.2$47.0 million which have not been recorded in the financial statements pursuant to accounting standards related to stock-based compensation. These amounts are no longer included in our gross or net deferred tax assets. Pursuant to these standards, the benefit of these deferred tax assets will be recorded to equity if and when they reduce taxes payable.
83
Accounting for Uncertainty in Income Taxes
During fiscal 20102013 and 2009,2012, our aggregate changes in our total gross amount of unrecognized tax benefits are summarized as follows (in thousands):
| 2010 | 2009 | 2013 | 2012 | |||||||||||||
Beginning balance | $ | 218,040 | $ | 139,549 | $ | 160,468 | $ | 163,607 | ||||||||
Gross increases in unrecognized tax benefits – prior year tax positions | 9,580 | 44,696 | 20,244 | 1,038 | ||||||||||||
Gross decreases in unrecognized tax benefits – prior year tax positions | (7,104 | ) | (1,523 | ) | ||||||||||||
Gross increases in unrecognized tax benefits – current year tax positions | 15,108 | 42,422 | 16,777 | 23,771 | ||||||||||||
Settlements with taxing authorities | (70,484 | ) | (429 | ) | (55,851 | ) | (1,754 | ) | ||||||||
Lapse of statute of limitations | (7,896 | ) | (12,585 | ) | (4,066 | ) | (25,387 | ) | ||||||||
Foreign exchange gains and losses | (319 | ) | 5,910 | (1,474 | ) | (807 | ) | |||||||||
Ending balance | $ | 156,925 | $ | 218,040 | $ | 136,098 | $ | 160,468 | ||||||||
As of December 3, 2010,November 29, 2013, the combined amount of accrued interest and penalties related to tax positions taken on our tax returns and included in non-current income taxes payable was approximately $15.4 million.$11.4 million.
We file income tax returns in the U.S. on a federal basis and in many U.S. state and foreign jurisdictions. We are subject to the continual examination of our income tax returns by the IRS and other domestic and foreign tax authorities. Our major tax jurisdictions are the U.S., Ireland and California. For California, Ireland and the U.S., the earliest fiscal years open for examination are 2005 2004, 2006 and 2008,2010, respectively. We regularly assess the likelihood of outcomes resulting from these examinations to determine the adequacy of our provision for income taxes and have reserved for potential adjustments that may result from the current examination.examinations. We believe such estimates to be reasonable; however, there can be no assurance that the final determination of any of these examinations will not have an adverse effect on our operating re sultsresults and financial position.
In October 2010,July 2013, a U.S. income tax examination covering our fiscal years 2005 through 20072008 and 2009 was completed. Our accrued tax and interest related to these years was $59$48.4 million and was previously reported in long-term income taxes payable. We paid $20settled the tax obligation resulting from this examination with cash and income tax assets totaling $41.2 million in conjunction with, and the aforementioned resolution. A netresulting $7.2 million income statement tax benefit was recorded in the fourththird quarter of fiscal 2010 of $39 million resulted.
2013.
The timing of the resolution of income tax examinations is highly uncertain as are the amounts and timing of tax payments that are part of any audit settlement process. These events could cause large fluctuations in the balance sheet classification of current and non-current assets and liabilities. The Company believesWe believe that beforewithin the end of fiscal 2011,next 12 months, it is reasonably possible that either certain audits will conclude or statutes of limitations on certain income tax examination periods will expire, or both. Given the uncertainties described above, we can only determine a range of estimated potential decreases in underlying unrecognized tax benefits ranging from $0$0 to approximately $5 million. These amounts would decrease income tax expense$5 million.
NOTE 10. RESTRUCTURING
Fiscal 2011 Restructuring Plan
In the fourth quarter of fiscal 2011, we initiated a restructuring plan consisting of reductions in workforce and the consolidation of facilities in order to better align our resources around our Digital Media and Digital Marketing strategies.
During fiscal 2013, we continued to implement restructuring activities under current GAAP relatedthis plan. Total costs incurred to income taxesdate and expected to be incurred for closing redundant facilities are $12.2 millionas a resultall facilities under this plan have been exited as of November 29, 2013.
Other Restructuring Plans
Other restructuring plans include other Adobe plans and other plans associated with certain of our adoption of new account ing standards related to business combinations in fiscal 2010 (see Note 1). Adjustments to acquired income tax liabilities (including adjustments for acquisitions completed prior to the effective date) that are recorded subsequentsubstantially complete. We continue to make cash outlays to settle obligations under these plans, however the acquisition date will be recognized in income from continuing operations, with certain exceptions, if such changes occur aftercurrent impact to our Consolidated Financial Statements is not significant. Our other restructuring plans primarily consist of the measurement period.
84
ADOBE SYSTEMS INCORPORATED
NOTES TO CONSOLIDATED FINANCIAL STATEMENTS (Continued)
During fiscal 2010,2013 we continued to implement restructuring activities under this plan. We vacated approximately 50,00021,000 square feet of sales and or research and development facilities in Australia Canada, Denmark and the U.S. We accrued $7.0 million for the fair value of our future contractual obligations under these operating leases using our credit-
Summary of Restructuring Plans
The following table sets forth a summary of restructuring activities related to all of our restructuring plans described above during fiscal 20102013 (in thousands):
November 27, 2009 | Costs Incurred | Cash Payments | Other Adjustments | December 3, 2010 | |||||||||||||||||||||||||||||||||||
| Fiscal 2009 Plan: | |||||||||||||||||||||||||||||||||||||||
| November 30, 2012 | Costs Incurred | Cash Payments | Other Adjustments* | November 29, 2013 | |||||||||||||||||||||||||||||||||||
| Fiscal 2011 Plan: | |||||||||||||||||||||||||||||||||||||||
Termination benefits | $ | 22,984 | $ | 18,413 | $ | (35,980 | ) | $ | (3,844 | ) | $ | 1,573 | $ | 1,248 | $ | — | $ | (776 | ) | $ | (30 | ) | $ | 442 | |||||||||||||||
| Cost of closing redundant facilities | — | 7,047 | (1,398 | ) | 1,653 | 7,302 | 9,623 | — | (1,916 | ) | (2,348 | ) | 5,359 | ||||||||||||||||||||||||||
| Omniture Plan: | |||||||||||||||||||||||||||||||||||||||
| Other Restructuring Plans: | |||||||||||||||||||||||||||||||||||||||
Termination benefits | 6,712 | — | (5,674 | ) | (552 | ) | 486 | 991 | 1,291 | (484 | ) | (8 | ) | 1,790 | |||||||||||||||||||||||||
| Cost of closing redundant facilities | 5,323 | — | (2,481 | ) | (122 | ) | 2,720 | 9,688 | 5,021 | (7,109 | ) | (1,304 | ) | 6,296 | |||||||||||||||||||||||||
Contract termination | 242 | — | (165 | ) | 102 | 179 | |||||||||||||||||||||||||||||||||
| Fiscal 2008 Plan: | |||||||||||||||||||||||||||||||||||||||
Termination benefits | 1,057 | — | (435 | ) | (322 | ) | 300 | ||||||||||||||||||||||||||||||||
| Cost of closing redundant facilities | 3,382 | — | (924 | ) | (309 | ) | 2,149 | ||||||||||||||||||||||||||||||||
| Macromedia Plan: | |||||||||||||||||||||||||||||||||||||||
| Cost of closing redundant facilities | 5,006 | — | (2,834 | ) | (514 | ) | 1,658 | ||||||||||||||||||||||||||||||||
| Other | 8 | — | (2 | ) | — | 6 | |||||||||||||||||||||||||||||||||
Total restructuring plans | $ | 44,714 | $ | 25,460 | $ | (49,893 | ) | $ | (3,908 | ) | $ | 16,373 | $ | 21,550 | $ | 6,312 | $ | (10,285 | ) | $ | (3,690 | ) | $ | 13,887 | |||||||||||||||
_________________________________________
(*) | Included in Other Adjustments are foreign currency translation adjustments and goodwill adjustments of $0.5 million and $0.2 million, respectively. |
Accrued restructuring charges of approximately $16.4$13.9 million as of December 3, 2010 at November 29, 2013 includes $8.1$6.2 million recorded in accrued restructuring, current and $8.3$7.7 million related to long-term facilities obligations recorded in accrued restructuring, non-current on our Consolidated Balance Sheets. We expect to pay accrued termination benefits through the first quarter of fiscal 20112014 and facilities-related liabilities under contract through fiscal 2021 of which over 70%approximately 54% will be paid through 2013.2015.
NOTE 12.11. BENEFIT PLANS
Retirement Savings Plan
In 1987, we adopted an Employee Investment Plan, qualified under Section 401(k) of the Internal Revenue Code, which is a retirement savings plan covering substantially all of our U.S. employees, now referred to as the Adobe 401(k) Retirement Savings Plan. Under the plan, eligible employees may contribute up to 65% of their pretax or after-tax salary, subject to the Internal Revenue Service annual contribution limits. In fiscal 2010,2013, we matched 50% of the first 6% of the employee’s eligible compensation. We contributed $17.9$22.3 million $15.1, $19.4 million and $16.6$19.6 million in fiscal 2010, 20092013, 2012 and 2008,2011, respectively. We can terminateAdobe is under no obligation to continue matching future employee contributions and at our discretion.
any time.
Deferred Compensation Plan
On September 21, 2006, the Board of Directors approved the Adobe Systems Incorporated Deferred Compensation Plan, effective December 2, 2006 (the “Deferred Compensation Plan”). The Deferred Compensation Plan is an unfunded, non-qualified, deferred compensation arrangement under which certain executives and members of the Board of Directors are able to defer a portion of their annual compensation. Participants may elect to contribute up to 75% of their base salary and 100% of other specified compensation, including commissions, bonuses, performance-based and time-based restricted stock units, and directors’ fees. Participants are able to elect the payment of benefits to begin on a specified date at least three years after the end of the plan year in which the election is made in the form of a lump sum o ror annual installments over five, ten or
fifteen years. Upon termination of a participant’s employment with Adobe, such participant will receive a distribution in the form of a lump sum payment. All distributions will be made in cash, except for deferred performance-based and time-based restricted stock units which will be settled in stock. As of December 3, 2010November 29, 2013 and November 27, 2009,30, 2012, the invested amounts under the Deferred Compensation Plan total $11.1$19.8 million and $9.0$15.1 million, respectively and were recorded as other assets on our Consolidated Balance Sheets. As of December 3, 2010November 29, 2013 and November 27, 2009, $11.530, 2012, $22.0 million and $9.0$16.4 million, respectively, was recorded as long-term liabilities to recognize undistributed deferred compensation due to employees.
85
NOTE 13.12. STOCK-BASED COMPENSATION
Restricted Stock Plans
We grant options from therestricted stock units to all eligible employees under our 2003 Equity Incentive Plan, as amended (“(“2003 Plan”Plan”), and theour 2005 Equity Incentive Assumption Plan (“2005 Assumption Plan”). TheseRestricted stock units granted under these plans are collectively referred to inas part of our annual review process vest annually over three years. Other restricted stock units granted under these plans generally vest over four years, the following discussion as “the Plans.” Under the Plans, options can be granted to all employees, including executive officers, outside consultants and non-employee directors. The Plans will continue until the earliermajority of (i) terminationwhich vest 25% annually. Certain grants have other vesting periods approved by our Board of Directors or an authorized committee of the Board or (ii)of Directors.
We grant performance awards to officers and key employees under our 2003 Plan. Performance awards granted under these plans from fiscal 2009 to fiscal 2012 generally vest annually over three years with the date on which allexception of the shares available for issuance under the plan have been issued and restrictions on issued sh ares have lapsed. Option vesting periods are generallyperformance awards granted in fiscal 2013 which cliff-vest after three years. Performance awards granted prior to fiscal 2009 vest annually over four years for all of the Plans. Options granted under the Plans generally expire seven years from the effective date of grant.years.
As of December 3, 2010,November 29, 2013, we had reserved 124.5154.4 million and 4.45.7 million shares of common stock for issuance under our 2003 Plan and 2005 Assumption Plan, respectively. As of December 3, 2010, werespectively, and had 46.444.0 million and 3.90.6 million shares available for grant under our 2003 Plan and 2005 Assumption Plan, respectively.
Employee Stock Purchase Plan
Our 1997 Employee Stock Purchase Plan (“ESPP”) allows eligible employee participants to purchase shares of our common stock at a discount through payroll deductions. The ESPP consists of a twenty-four month offering period with four six-month purchase periods in each offering period. Employees purchase shares in each purchase period at 85% of the market value of our common stock at either the beginning of the offering period or the end of the purchase period, whichever price is lower. The ESPP will continue until the earlier of (i) termination by the Board or (ii) the date on which all of the shares available for issuance under the plan have been issued.
As of December 3, 2010,November 29, 2013, we had reserved 76.093.0 million shares of our common stock for issuance under the ESPP and approximately 9.015.8 million shares remain available for future issuance.
Stock Option Plans
The Executive Compensation Committee of Adobe's Board of Directors eliminated the use of stock option grants for all employees in fiscal 2012. Stock option grants to non-employee directors were minimal in fiscal 2013, and in December 2013 the Board of Directors eliminated the use of options for directors going forward.
Performance Share Programs
Effective January 25, 2010, the24, 2013, our Executive Compensation Committee adopted the 2010modified our Performance Share Program (the “2010 Program”"2013 Program"). by eliminating the use of qualitative performance objectives, with 100% of shares to be earned based on the achievement of an objective total stockholder return measure over a three-year performance period. Performance awards will be granted under the 2013 Program pursuant to the terms of our 2003 Equity Incentive Plan. The purpose of the 20102013 Program is to align key management and senior leadership with stockholders’ interests over the long term and to retain key employees. The measurement period for the 2010 Program is our fiscal 2010 year. All members of our executive management and other key senior leaders are participating in the 2010 Program. Awards granted under the 2010 Program were granted in the form of performance shares pursuant to the terms of our 2003 Equity Incentive Plan. If pre-determined performance goals are met, shares of stockPerformance share awards will be granted toawarded and fully vest upon the recipient, with one third vesting on the laterExecutive Compensation Committee's certification of the date of certificationlevel of achievement orfollowing the firstthree-year anniversary date of the grant and the rem aining two thirds vesting evenlydate on the following two annual anniversary dates of the grant, contingent upon the recipient’s continued service to
86
Issuance of Shares
Upon exercise of stock options, vesting of restricted stock and performance shares, and purchases of shares under the ESPP, we will issue treasury stock. If treasury stock is not available, common stock will be issued. In order to minimize the impact of on-going dilution from exercises of stock options and vesting of restricted stock and performance shares, we instituted a stock repurchase program. See Note 1413 for information regarding our stock repurchase programs.
Valuation of Stock-Based Compensation
Stock-based compensation cost is measured at the grant date based on the fair value of the award. We currently use the Black-Scholes option pricing model to determine the fair value of stock options and ESPP shares. The determination of the fair value of stock-based payment awards on the date of grant using an option pricing model is affected by our stock price as well as assumptions regarding a number of complex and subjective variables. These variables include our expected stock price volatility over the expected term of the awards, actual and projected employee stock option exercise behaviors, a risk-free interest rate and any expected dividends.
We estimate the expected term of options granted by calculating the average term from our historical stock option exercise experience. We estimate the volatility of our common stock by using implied volatility in market traded options. Our decision to use implied volatility was based upon the availability of actively traded options on our common stock and our assessment that implied volatility is more representative of future stock price trends than historical volatility. We base the risk-free interest rate that we use in the option valuation model on zero-coupon yields implied by U.S. Treasury issues with remaining terms similar to the expected term on the options. We do not anticipate paying any cash dividends in the foreseeable future and therefore use an expected dividend yield of zero in the option valuation model. We are require drequired to estimate forfeitures at the time of grant and revise those estimates in subsequent periods if actual forfeitures differ from those estimates. We use historical data to estimate pre-vesting option forfeitures and record stock-based compensation expense only for those awards that are expected to vest.
The assumptions used to value our option grants were as follows:
| Fiscal Years | ||||||||||||
| 2010 | 2009 | 2008 | ||||||||||
Expected term (in years) | 3.8 – 5.1 | 3.0 – 4.1 | 2.3 – 4.7 | |||||||||
Volatility | 29 – 36 | % | 34 – 57 | % | 32 – 60 | % | ||||||
Risk-free interest rate | 1.04 – 2.66 | % | 1.16 – 2.24 | % | 1.70 – 3.50 | % | ||||||
| Fiscal Years | ||||||
| 2013 | 2012 | 2011 | ||||
| Expected life (in years) | 3.2 | 3.9 - 4.2 | 3.8 - 4.2 | |||
| Volatility | 27 | % | 31 - 34% | 30 - 41% | ||
| Risk free interest rate | 0.36 | % | 0.54 - .71% | 0.64 - 1.92% | ||
The expected term of ESPP shares is the average of the remaining purchase periods under each offering period. The assumptions used to value employee stock purchase rights were as follows:
| Fiscal Years | |||||
| 2013 | 2012 | 2011 | |||
| Expected life (in years) | 0.5 - 2.0 | 0.5 - 2.0 | 0.5 - 2.0 | ||
| Volatility | 26 - 30% | 30 - 36% | 30 - 34% | ||
| Risk free interest rate | 0.09 - 0.34% | 0.06 - 0.30% | 0.10 - 0.61% | ||
| Fiscal Years | ||||||||||||
| 2010 | 2009 | 2008 | ||||||||||
| Expected term (in years) | 0.5 – 2.0 | 0.5 – 2.0 | 0.5 – 2.0 | |||||||||
| Volatility | 32 – 40 | % | 40 – 57 | % | 30 – 36 | % | ||||||
| Risk-free interest rate | 0.18 – 1.09 | % | 0.27 – 1.05 | % | 2.12 – 3.29 | % | ||||||
We recognize the estimated compensation cost of restricted stock awards and restricted stock units, net of estimated forfeitures, over the vesting term. The estimated compensation cost is based on the fair value of our common stock on the date of grant.
We recognize the estimated compensation cost of performance shares, net of estimated forfeitures. The fiscal 2013 awards are earned upon achievement of an objective total stockholder return measure at the end of the three-year performance period, as described above. The fair value of the awards was fixed at grant date and will be amortized over the longer of the remaining performance or service period. In previous years, the awards were earned upon attainment of identified performance goals, some of which containcontained discretionary metrics. As such, these awards are re-valuedwere measured based on our traded stock price at the end of each
87
reporting period. If the discretion is removed, the award will be classified as a fixed equity award.period until achieved. The fair value of the awards will bewere based on the measurementachievement date which is the date the award becomes fixed. The awards will be subsequentlyand amortized over the longer of the remaining performance or service period.
| Outstanding Options | ||||||||
Number of Shares | Weighted Average Exercise Price | |||||||
| November 30, 2007 | 47,742 | $ | 28.47 | |||||
| Granted | 5,462 | $ | 35.08 | |||||
| Exercised | (9,983 | ) | $ | 25.45 | ||||
| Cancelled | (2,517 | ) | $ | 35.34 | ||||
| November 28, 2008 | 40,704 | $ | 29.67 | |||||
| Granted | 5,758 | $ | 22.90 | |||||
| Exercised | (7,560 | ) | $ | 17.15 | ||||
| Cancelled | (3,160 | ) | $ | 33.57 | ||||
| Increase due to acquisition | 5,509 | $ | 20.15 | |||||
| November 27, 2009 | 41,251 | $ | 29.45 | |||||
| Granted | 3,198 | $ | 34.03 | |||||
| Exercised | (5,196 | ) | $ | 20.48 | ||||
| Cancelled | (2,908 | ) | $ | 33.94 | ||||
| Increase due to acquisition | 730 | $ | 8.24 | |||||
| December 3, 2010 | 37,075 | $ | 30.33 | |||||
Number of Shares (thousands) | Weighted Average Exercise Price | Weighted Average Remaining Contractual Life (years) | Aggregate Intrinsic Value(*) (millions) | |||||||||||||
| As of December 3, 2010 | ||||||||||||||||
| Options outstanding | 37,075 | $ | 30.33 | 3.62 | $ | 116.3 | ||||||||||
| Options vested and expected to vest | 35,961 | $ | 30.42 | 3.56 | $ | 111.0 | ||||||||||
| Options exercisable | 27,763 | $ | 31.17 | 3.06 | $ | 72.7 | ||||||||||
| As of November 27, 2009 | ||||||||||||||||
| Options outstanding | 41,251 | $ | 29.45 | 4.33 | $ | 295.8 | ||||||||||
| Options vested and expected to vest | 39,322 | $ | 29.54 | 4.24 | $ | 279.1 | ||||||||||
| Options exercisable | 26,677 | $ | 29.85 | 3.54 | $ | 181.7 | ||||||||||
| As of November 28, 2008 | ||||||||||||||||
| Options outstanding | 40,704 | $ | 29.67 | 4.00 | $ | 76.1 | ||||||||||
| Options vested and expected to vest | 38,975 | $ | 29.36 | 3.87 | $ | 76.1 | ||||||||||
| Options exercisable | 28,034 | $ | 26.61 | 3.28 | $ | 76.1 | ||||||||||
Non-vested Shares | Weighted Average Grant Date Fair Value | |||||||
| November 30, 2007 | 21 | $ | 36.41 | |||||
| Awarded | — | $ | — | |||||
| Released | (15 | ) | $ | 34.94 | ||||
| Forfeited | (2 | ) | $ | 39.95 | ||||
| November 28, 2008 | 4 | $ | 39.31 | |||||
| Awarded | — | $ | — | |||||
| Released | (1 | ) | $ | 38.22 | ||||
| Forfeited | — | $ | — | |||||
| November 27, 2009 | 3 | $ | 40.01 | |||||
| Awarded | — | $ | — | |||||
| Released | (2 | ) | $ | 40.06 | ||||
| Forfeited | — | $ | — | |||||
| December 3, 2010 | 1 | $ | 39.96 |
Summary of Restricted Stock Units
Restricted stock unit activity for fiscal years 2010, 20092013, 2012 and 20082011 was as follows (in thousands):
| 2013 | 2012 | 2011 | ||||||
| Beginning outstanding balance | 18,415 | 16,871 | 13,890 | |||||
| Awarded | 7,236 | 9,431 | 8,180 | |||||
| Released | (6,224 | ) | (5,854 | ) | (3,819 | ) | ||
| Forfeited | (1,479 | ) | (2,147 | ) | (1,587 | ) | ||
| Increase due to acquisition | — | 114 | 207 | |||||
| Ending outstanding balance | 17,948 | 18,415 | 16,871 | |||||
| 2010 | 2009 | 2008 | ||||||||||
Beginning outstanding balance | 10,433 | 4,261 | 1,701 | |||||||||
Awarded | 7,340 | 6,176 | 3,177 | |||||||||
Released | (2,589 | ) | (1,162 | ) | (422 | ) | ||||||
Forfeited | (1,294 | ) | (401 | ) | (195 | ) | ||||||
Increase due to acquisition | — | 1,559 | — | |||||||||
Ending outstanding balance | 13,890 | 10,433 | 4,261 |
The weighted average grant date fair values of restricted stock units granted during fiscal 2010, 20092013, 2012 and 20082011 were $33.47, $27.74$39.87, $31.36 and $33.55,$33.10, respectively. The total fair value of restricted stock units vested during fiscal 2010, 20092013, 2012 and 20082011 was $84.1$249.5 million $27.1, $180.1 million and $14.4$123.3 million, respectively.
Information regarding restricted stock units outstanding at the end of fiscal 2010, 2009November 29, 2013, November 30, 2012 and 2008December 2, 2011 is summarized below:
Number of Shares (thousands) | Weighted Average Remaining Contractual Life (years) | Aggregate Intrinsic Value(*) (millions) | ||||||||||||||||||
| 2010 | ||||||||||||||||||||
Number of Shares (thousands) | Weighted Average Remaining Contractual Life (years) | Aggregate Intrinsic Value(*) (millions) | ||||||||||||||||||
| 2013 | ||||||||||||||||||||
| Restricted stock units outstanding | 13,890 | 1.54 | $ | 404.8 | 17,948 | 1.09 | $ | 1,019.1 | ||||||||||||
| Restricted stock units vested and expected to vest | 11,185 | 1.38 | $ | 325.7 | 16,265 | 1.02 | $ | 920.5 | ||||||||||||
| 2009 | ||||||||||||||||||||
| 2012 | ||||||||||||||||||||
| Restricted stock units outstanding | 10,433 | 1.82 | $ | 369.1 | 18,415 | 1.37 | $ | 637.3 | ||||||||||||
| Restricted stock units vested and expected to vest | 8,078 | 1.63 | $ | 285.7 | 16,289 | 1.26 | $ | 562.8 | ||||||||||||
| 2008 | ||||||||||||||||||||
| 2011 | ||||||||||||||||||||
| Restricted stock units outstanding | 4,261 | 1.73 | $ | 98.7 | 16,871 | 1.35 | $ | 457.4 | ||||||||||||
| Restricted stock units vested and expected to vest | 3,351 | 1.52 | $ | 77.6 | 14,931 | 1.25 | $ | 404.3 | ||||||||||||
_________________________________________
(*) | The intrinsic value is calculated as the market value as of the end of the fiscal |
Summary of Performance Shares
The following table sets forth the summary of performance share activity under our 20102013 Program for the fiscal 2010year ended November 29, 2013 (in thousands):
Shares Granted | Maximum Shares Eligible to Receive | Shares Granted | Maximum Shares Eligible to Receive | ||||||||||
Beginning outstanding balance | — | — | — | — | |||||||||
Awarded | 263 | 394 | 946 | 1,891 | |||||||||
Forfeited | (13 | ) | (19 | ) | (92 | ) | (184 | ) | |||||
Ending outstanding balance | 250 | 375 | 854 | 1,707 | |||||||||
88
NOTES TO CONSOLIDATED FINANCIAL STATEMENTS (Continued)
In the first quarter of fiscal 2013, the Executive Compensation Committee certified the actual performance metrics underachievement of participants in the 20092012 Performance Share Program were not achieved(the “2012 Program”). Based upon the achievement of specific and/or market-based performance goals outlined in the 2012 Program, participants had the ability to receive up to 150% of the target number of shares originally granted. Actual performance resulted in participants achieving 116% of target or approximately 1.3 million shares for the 2012 Program. One third of the shares under the 2012 Program vested in the first quarter of fiscal 2013 and therefore nothe remaining two thirds vest evenly on the following two anniversaries of the grant, contingent upon the recipient's continued service to Adobe.
In the first quarter of fiscal 2012, the Executive Compensation Committee certified the actual performance achievement of participants in the 2011 Performance Share Program (the “2011 Program”). Based upon the achievement of goals outlined in the 2011 Program, participants had the ability to receive up to 150% of the target number of shares were awarded.
originally granted. Actual performance resulted in participants achieving 130% of target or approximately 0.5 million shares for the 2011 Program. One third of the shares under the 2011 Program vested in the first quarter of fiscal 2012 and the remaining two thirds vest evenly on the following two annual anniversary dates of the grant, contingent upon the recipient's continued service to Adobe.
In the first quarter of fiscal 2011, the Executive Compensation Committee certified the actual performance achievement of participants in the 2010 Performance Share Program (the “2010 Program”). Based upon the achievement of goals outlined in the 2010 Program, participants had the ability to receive up to 150% of the target number of shares originally granted. Actual performance resulted in participants achieving 135% of target or approximately 0.3 million million shares for the 2010 Program. One third of the shares under the 20102011 Program vested in the first quarter of fiscal 20112012 and the remaining two thirds vest evenly on the following two annual anniversary dates of the grant, contingent upon the recipient’srecipient's continued service to Adobe .Adobe.
The following table sets forth the summary of performance share activity under our 20072010, 2011 and 20082012 programs, based upon share awards actually achieved, for the fiscal 2010years ended November 29, 2013, November 30, 2012 and 2009December 2, 2011 (in thousands):
| 2013 | 2012 | 2011 | ||||||
| Beginning outstanding balance | 388 | 405 | 557 | |||||
| Achieved | 1,279 | 492 | 337 | |||||
| Released | (665 | ) | (464 | ) | (436 | ) | ||
| Forfeited | (141 | ) | (45 | ) | (53 | ) | ||
| Ending outstanding balance | 861 | 388 | 405 | |||||
| 2010 | 2009 | |||||||
Beginning outstanding balance | 950 | 383 | ||||||
Achieved | — | 1,022 | ||||||
Released | (350 | ) | (382 | ) | ||||
Forfeited | (43 | ) | (73 | ) | ||||
Ending outstanding balance | 557 | 950 |
The total fair value of performance awards vested during fiscal 2010, 20092013, 2012 and 20082011 was $12.0$25.4 million $7.7, $14.4 million and $16.7$14.8 million, respectively.
89
ADOBE SYSTEMS INCORPORATED
NOTES TO CONSOLIDATED FINANCIAL STATEMENTS (Continued)
Information regarding performance shares outstanding at November 29, 2013, November 30, 2012 and December 3, 2010 and November 27, 20092, 2011 is summarized below:
Number of Shares (thousands) | Weighted Average Remaining Contractual Life (years) | Aggregate Intrinsic Value(*) (millions) | ||||||||||||||||||
| 2010 | ||||||||||||||||||||
Number of Shares (thousands) | Weighted Average Remaining Contractual Life (years) | Aggregate Intrinsic Value(*) (millions) | ||||||||||||||||||
| 2013 | ||||||||||||||||||||
| Performance shares outstanding | 557 | 0.58 | $ | 16.2 | 861 | 0.58 | $ | 48.9 | ||||||||||||
| Performance shares vested and expected to vest | 514 | 0.53 | $ | 14.8 | 817 | 0.56 | $ | 46.3 | ||||||||||||
| 2009 | ||||||||||||||||||||
Performance shares outstanding | 950 | 1.05 | $ | 33.6 | ||||||||||||||||
| 2012 | ||||||||||||||||||||
| Performance shares units outstanding | 388 | 0.54 | $ | 13.4 | ||||||||||||||||
| Performance shares vested and expected to vest | 818 | 0.97 | $ | 28.8 | 369 | 0.51 | $ | 12.7 | ||||||||||||
| 2008 | ||||||||||||||||||||
Performance shares outstanding | 383 | 1.20 | $ | 8.9 | ||||||||||||||||
| 2011 | ||||||||||||||||||||
| Performance shares units outstanding | 405 | 0.41 | $ | 11.0 | ||||||||||||||||
| Performance shares vested and expected to vest | 323 | 1.10 | $ | 7.4 | 390 | 0.39 | $ | 10.4 | ||||||||||||
_________________________________________
(*) | The intrinsic value is calculated as the market value as of the end of the fiscal |
Summary of Employee Stock Purchase Plan Shares
The weighted average subscription date fair value of shares under the ESPP during fiscal 2013, 2012 and 2011 were $11.40, $9.09 and $9.01, respectively. Employees purchased 3.4 million shares at an average price of $25.71, 3.2 million shares at an average price of $23.81, and 3.7 million shares at an average price of $23.48, respectively, for fiscal 2013, 2012 and 2011. The intrinsic value of shares purchased during fiscal 2013, 2012 and 2011 was $58.5 million, $22.8 million and $28.9 million, respectively. The intrinsic value is calculated as the difference between the market value on the date of purchase and the purchase price of the shares.
90
Summary of Stock Options
Option activity under our stock option program for fiscal 2013, 2012 and 2011 was as follows (shares in thousands):
| Outstanding Options | ||||||
Number of Shares | Weighted Average Exercise Price | |||||
| December 3, 2010 | 37,075 | $ | 30.33 | |||
| Granted | 4,507 | $ | 33.60 | |||
| Exercised | (4,987 | ) | $ | 21.02 | ||
| Cancelled | (2,268 | ) | $ | 33.85 | ||
| Increase due to acquisition | 475 | $ | 2.25 | |||
| December 2, 2011 | 34,802 | $ | 31.47 | |||
| Granted | 57 | $ | 32.19 | |||
| Exercised | (6,754 | ) | $ | 23.61 | ||
| Cancelled | (4,692 | ) | $ | 33.07 | ||
| Increase due to acquisition | 1,104 | $ | 3.23 | |||
| November 30, 2012 | 24,517 | $ | 32.09 | |||
| Granted | 25 | $ | 45.03 | |||
| Exercised | (15,872 | ) | $ | 32.15 | ||
| Cancelled | (1,584 | ) | $ | 37.37 | ||
| Increase due to acquisition | 273 | $ | 6.82 | |||
| November 29, 2013 | 7,359 | $ | 29.93 | |||
The total intrinsic value of options exercised during fiscal 2013, 2012 and 2011 was $181.8 million, $62.6 million and $59.4 million, respectively. The intrinsic value is calculated as the difference between the market value on the date of exercise and the exercise price of the shares.
91
Information regarding stock options outstanding at November 29, 2013, November 30, 2012 and December 2, 2011 is summarized below:
Number of Shares (thousands) | Weighted Average Exercise Price | Weighted Average Remaining Contractual Life (years) | Aggregate Intrinsic Value(*) (millions) | |||||||||
| 2013 | ||||||||||||
| Options outstanding | 7,359 | $ | 29.93 | 3.22 | $ | 197.6 | ||||||
| Options vested and expected to vest | 7,242 | $ | 30.05 | 3.18 | $ | 193.6 | ||||||
| Options exercisable | 5,752 | $ | 31.28 | 2.65 | $ | 146.7 | ||||||
| 2012 | ||||||||||||
| Options outstanding | 24,517 | $ | 32.09 | 2.74 | $ | 103.3 | ||||||
| Options vested and expected to vest | 24,158 | $ | 32.15 | 2.70 | $ | 100.9 | ||||||
| Options exercisable | 20,668 | $ | 33.06 | 2.27 | $ | 73.6 | ||||||
| 2011 | ||||||||||||
| Options outstanding | 34,802 | $ | 31.47 | 3.24 | $ | 68.0 | ||||||
| Options vested and expected to vest | 33,856 | $ | 31.52 | 3.17 | $ | 65.6 | ||||||
| Options exercisable | 26,622 | $ | 32.31 | 2.56 | $ | 42.1 | ||||||
_________________________________________
(*) | The intrinsic value is calculated as the difference between the market value as of the end of the fiscal period and the exercise price of the shares. As reported by the NASDAQ Global Select Market, the market values as of November 29, 2013, November 30, 2012 and December 2, 2011 were $56.78, $34.61 and $27.11, respectively. |
All stock options granted to current executive officers are made after a review by and with the approval of the Executive Compensation Committee of the Board of Directors.
Grants to Non-Employee Directors
The Directors Plan (and starting in fiscal 2008, the 2003 Plan) provides for the granting of nonqualified stock options to non-employee directors. Options granted before November 29, 2008 vest over four years: 25% on the day preceding each of our next four annual meetings and have a ten-year term. Starting in fiscal 2009, the initialInitial equity grant to a new non-employee director is a restricted stock unit award having an aggregate value of $0.5$0.5 million based on the average stock price over the 30 calendar days ending on the day before the date of grant. The initial equity award vests over 2 years, 50% on the day preceding each of our next 2 annual meetings. For all periods presented, a non-employee director could elect to receive the annual equity grant a non-employee director can elect to receive as either 100% options, 100% restricted stock units or 50% of each and shall have an aggregate value of $0.2$0.2 million a s as based on the average stock price over the 30 calendar days ending on the day before the date of grant. The target grant value converted to stock options is based on a 1:3 conversion of restricted stock units to stock options will be based on a 3:1 conversion ratio.options. Annual equity awards granted on or after November 29, 2008 vest 100% on the day preceding the next annual meeting. Options granted on or after November 29, 2008 have a seven-yearseven-year term. The exercise price of the options that are issued is equal to the fair market value of our common stock on the date of grant.
Options granted to directors for fiscal 2010, 20092013, 2012 and 20082011 were as follows (shares in thousands):
| 2013 | 2012 | 2011 | |||||||||
| Options granted to existing directors | 25 | 43 | 85 | ||||||||
| Exercise price | $ | 45.03 | $ | 33.18 | $ | 33.23 | |||||
| 2010 | 2009 | 2008 | ||||||||||
| Options granted to existing directors | 18 | 175 | 250 | |||||||||
| Exercise price | $ | 33.82 | $ | 23.28 | $ | 37.09 |
Restricted stock units granted to directors for fiscal 20102013, 2012 and 20092011 were as follows (in thousands):
| 2010 | 2009 | 2013 | 2012 | 2011 | ||||||||||||
| Restricted stock units granted to existing directors | 48 | 27 | 36 | 42 | 28 | |||||||||||
| Restricted stock units granted to new directors | — | 20 | 14 | 41 | — | |||||||||||
92
Compensation Costs
With the exception of performance shares, stock-based compensation expense is recognized on a straight-line basis over the requisite service period of the entire award, which is generally the vesting period. For performance shares, expense is recognized on a straight-line basis over the requisite service period for each vesting tranche of the award.
As of December 3, 2010,November 29, 2013, there was $257.9$428.9 million of unrecognized compensation cost, adjusted for estimated forfeitures, related to non-vested stock-based awards which will be recognized over a weighted average period of 2.51.9 years. Total unrecognized compensation cost will be adjusted for future changes in estimated forfeitures.
Total stock-based compensation costs that have been included in our Consolidated Statements of Income for fiscal 2010, 20092013, 2012 and 20082011 were as follows (in thousands):
| Income Statement Classifications | ||||||||||||||||||||||||
Cost of Revenue– Subscription | Cost of Revenue– Services and Support | Research and Development | Sales and Marketing | General and Administrative | Total(1) | |||||||||||||||||||
Option Grants and Stock Purchase Rights(2) | ||||||||||||||||||||||||
Fiscal 2010 | $ | 1,265 | $ | 1,251 | $ | 37,221 | $ | 40,983 | $ | 21,111 | $ | 101,831 | ||||||||||||
Fiscal 2009 | $ | — | $ | 1,906 | $ | 45,535 | $ | 38,790 | $ | 24,595 | $ | 110,826 | ||||||||||||
Fiscal 2008 | $ | — | $ | 3,728 | $ | 55,653 | $ | 41,326 | $ | 24,521 | $ | 125,228 | ||||||||||||
Restricted Stock and Performance Share Awards(2) | ||||||||||||||||||||||||
Fiscal 2010 | $ | 1,422 | $ | 1,065 | $ | 51,387 | $ | 52,253 | $ | 23,128 | $ | 129,255 | ||||||||||||
Fiscal 2009 | $ | — | $ | 639 | $ | 27,931 | $ | 19,818 | $ | 9,274 | $ | 57,662 | ||||||||||||
Fiscal 2008 | $ | — | $ | 570 | $ | 20,835 | $ | 17,928 | $ | 10,810 | $ | 50,143 | ||||||||||||
Income Statement Classifications | |||||||||||||||||||||||
Cost of Revenue– Subscription | Cost of Revenue– Services and Support | Research and Development | Sales and Marketing | General and Administrative | Total(1) | ||||||||||||||||||
Option Grants and Stock Purchase Rights | |||||||||||||||||||||||
| 2013 | $ | 2,059 | $ | 3,413 | $ | 18,188 | $ | 21,283 | $ | 8,410 | $ | 53,353 | |||||||||||
| 2012 | $ | 2,840 | $ | 4,130 | $ | 24,823 | $ | 31,379 | $ | 15,455 | $ | 78,627 | |||||||||||
| 2011 | $ | 936 | $ | 4,716 | $ | 28,132 | $ | 31,754 | $ | 20,605 | $ | 86,143 | |||||||||||
Restricted Stock and Performance Share Awards | |||||||||||||||||||||||
| 2013 | $ | 5,052 | $ | 6,961 | $ | 102,464 | $ | 101,423 | $ | 59,734 | $ | 275,634 | |||||||||||
| 2012 | $ | 3,100 | $ | 9,461 | $ | 83,349 | $ | 76,359 | $ | 47,606 | $ | 219,875 | |||||||||||
| 2011 | $ | 1,521 | $ | 8,607 | $ | 79,427 | $ | 68,485 | $ | 41,920 | $ | 199,960 | |||||||||||
_________________________________________
(1) | During fiscal |
NOTE 14.13. STOCKHOLDERS’ EQUITY
Comprehensive Income (Loss)
The following table sets forth the activity for each componentcomponents of accumulated other comprehensive income and activity, net of related taxes, for fiscal 2010, 2009 and 20082013 (in thousands):
| 2010 | 2009 | 2008 | ||||||||||
Net income | $ | 774,680 | $ | 386,508 | $ | 871,814 | ||||||
| Other comprehensive income (loss): | ||||||||||||
| Available-for-sale securities: | ||||||||||||
| Unrealized gains (losses) on available-for-sale securities | (1,211 | ) | 6,661 | (3,102 | ) | |||||||
Reclassification adjustment for (gains) losses on available- for-sale securities recognized during the period | (2,959 | ) | (8,752 | ) | 1,559 | |||||||
Subtotal available-for-sale securities | (4,170 | ) | (2,091 | ) | (1,543 | ) | ||||||
| Derivatives designated as hedging instruments: | ||||||||||||
| Unrealized (losses) gains on derivative instruments | 20,325 | �� | (14,618 | ) | 54,967 | |||||||
Reclassification adjustment for gains on derivative instruments recognized during the period | (20,169 | ) | (27,138 | ) | (13,248 | ) | ||||||
| Subtotal derivative instruments | 156 | (41,756 | ) | 41,719 | ||||||||
Foreign currency translation adjustments | (3,004 | ) | 11,071 | (10,902 | ) | |||||||
Other comprehensive income (loss) | (7,018 | ) | (32,776 | ) | 29,274 | |||||||
Total comprehensive income, net of taxes | $ | 767,662 | $ | 353,732 | $ | 901,088 |
| November 30, 2012 | Increase / Decrease | Reclassification Adjustments | November 29, 2013 | |||||||||||||
| Net unrealized gains on available-for-sale securities: | ||||||||||||||||
| Unrealized gains on available-for-sale securities | $ | 14,698 | $ | (430 | ) | $ | (4,090 | ) | $ | 10,178 | ||||||
| Unrealized losses on available-for-sale securities | (259 | ) | (1,755 | ) | 1,077 | (937 | ) | |||||||||
| Total net unrealized gains on available-for-sale securities | 14,439 | (2,185 | ) | (3,013 | ) | (1 | ) | 9,241 | ||||||||
Net unrealized gains on derivative instruments designated as hedging instruments | 6,604 | 34,677 | (35,914 | ) | (2 | ) | 5,367 | |||||||||
| Cumulative foreign currency translation adjustments | 9,669 | 21,826 | — | 31,495 | ||||||||||||
| Total accumulated other comprehensive income, net of taxes | $ | 30,712 | $ | 54,318 | $ | (38,927 | ) | $ | 46,103 | |||||||
(1) | Classified in interest and other income (expense), net. |
(2) | Classified as revenue. |
93
The following table sets forth the taxes related to each component of OCI for fiscal 2010, 2009 and 2008 (in thousands):
| 2010 | 2009 | 2008 | ||||||||||
Available-for-sale securities | $ | 495 | $ | 931 | $ | (988 | ) | |||||
Foreign currency translation adjustments | $ | 275 | $ | 1,411 | $ | (4,860 | ) |
| 2010 | 2009 | |||||||
| Net unrealized gains on available-for-sale securities: | ||||||||
Unrealized gains on available-for-sale securities | $ | 12,138 | $ | 13,818 | ||||
Unrealized losses on available-for-sale securities | (2,493 | ) | (2 | ) | ||||
Total net unrealized gains on available-for-sale securities | 9,645 | 13,816 | ||||||
Net unrealized (losses) gains on derivative instruments | 151 | (5 | ) | |||||
Cumulative foreign currency translation adjustments | 7,632 | 10,635 | ||||||
Total accumulated other comprehensive income, net of taxes | $ | 17,428 | $ | 24,446 |
| 2013 | 2012 | 2011 | ||||||||||
| Available-for-sale securities: | ||||||||||||
| Unrealized gains / losses on available-for-sale securities | $ | 169 | $ | (686 | ) | $ | 20 | |||||
| Reclassification adjustments | (2 | ) | (1 | ) | 185 | |||||||
| Subtotal available-for-sale securities | 167 | (687 | ) | 205 | ||||||||
| Derivatives designated as hedging instruments: | ||||||||||||
| Unrealized gains on derivative instruments* | — | — | — | |||||||||
| Reclassification adjustments* | — | — | — | |||||||||
| Subtotal derivatives designated as hedging instruments | — | — | — | |||||||||
| Foreign currency translation adjustments | 2,789 | (1,314 | ) | 2,208 | ||||||||
| Total taxes, other comprehensive income | $ | 2,956 | $ | (2,001 | ) | $ | 2,413 | |||||
_________________________________________
(*) | Taxes related to derivative instruments were zero for all fiscal years based on the tax jurisdiction where the derivative instruments were executed. |
| 2010 | 2009 | 2008 | ||||||||||
| Beginning balance | $ | 10,640 | $ | (431 | ) | $ | 10,471 | |||||
| Foreign currency translation adjustments | (4,144 | ) | 17,343 | (19,461 | ) | |||||||
Income tax effect relating to translation adjustments for undistributed foreign earnings | 1,136 | (6,272 | ) | 8,559 | ||||||||
| Ending balance | $ | 7,632 | $ | 10,640 | $ | (431 | ) |
Stock Repurchase Program I
To facilitate our stock repurchase program, designed to return value to our stockholders and minimize dilution from stock issuances, we repurchase shares in the open market and also enter into structured repurchasesrepurchase agreements with third-parties.
During fiscal 2010, 20092013, 2012 and 20082011, we entered into several structured stock repurchase agreements with large financial institutions, whereupon we provided the financial institutionsthem with prepayments of $850.0totaling $1.1 billion, $405.0 million $350.0 and $695.0 million and $525.0 million,, respectively. The $1.1 billion prepayments during fiscal 2013 were under the $2.0 billion stock repurchase authority. Of the $850.0$405.0 million of prepayments during fiscal 2010, $250.02012, $100.0 million was were under the$2.0 billion stock repurchase program prior to the program amendment and the remaining $600.0$305.0 million was were under our previous $1.6 billion stock repurchase authority. The $695.0 million of prepayments during fiscal 2011 were under the amended $1.6$1.6 billion time-constrained dollar-based stock repurchase authority. We enteredenter into these agreements in order to take advantage of repurchasing shares at a guaranteed discount to the Volume Weighted Average Price (“VWAP”) of our common stock over a specified period of time. We only enter into such transactions when the discount that we receive is higher than the foregone return on our cas hcash prepayments to the financial institutions. There were no explicit commissions or fees on these structured repurchases. Under the terms of the agreements, there is no requirement for the financial institutions to return any portion of the prepayment to us.
The financial institutions agree to deliver shares to us at monthly intervals during the contract term. The parameters used to calculate the number of shares deliverable are: the total notional amount of the contract, the number of trading days in the contract, the number of trading days in the interval and the average VWAP of our stock during the interval less the agreed upon discount. During fiscal 2010,2013, we repurchased approximately 31.221.6 million shares at an average price of $29.19$46.47 through structured repurchase agreements entered into during fiscal 20092013 and fiscal 2010.2012. During fiscal 2009,2012, we repurchased approximately 15.211.5 million shares at an average price of $32.29 through structured repurchase agreements entered into during fiscal 2012. During fiscal 2011, we repurchased approximately 21.8 million shares at an average price per share of $27.89$31.81 through structured repurchase agreements entered into during fiscal 2008 and fiscal 2009. During fiscal 2008, we repurchased 22.4 million shares at an a verage price of $36.26 through structured repurchase agreements which included prepayments from fiscal 2007.2011.
For fiscal 2010, 20092013, 2012 and 2008,2011, the prepayments were classified as treasury stock on our Consolidated Balance Sheets at the payment date, though only shares physically delivered to us by November 29, 2013, November 30, 2012 and December 3, 2010, November 27, 2009 and November 28, 20082, 2011 were excluded from the computation of earnings per share. As of December 3, 2010 noNovember 29, 2013, $129.2 million of prepayments remained under the agreements. Asagreement.
94
ADOBE SYSTEMS INCORPORATED
NOTES TO CONSOLIDATED FINANCIAL STATEMENTS (Continued)
Subsequent to December 3, 2010,November 29, 2013, as part of our $1.6$2.0 billion stock repurchase program, we entered into a structured stock repurchase agreement with a large financial institution whereupon we provided them with a prepayment of $125.0 million.$200.0 million. This amount will be classified as treasury stock on our Consolidated Balance Sheets. Upon completion of the $125.0$200.0 million stock repurchase agreement, $875.0$600.0 million remains under our time-constrained dollar-basedcurrent authority.See Note 21 for further discussion of our stock repurchase program.
NOTE 15.14. NET INCOME PER SHARE
Basic net income per share is computed using the weighted average number of common shares outstanding for the period, excluding unvested restricted stock. Diluted net income per share is based upon the weighted average common shares outstanding for the period plus dilutive potential common shares, including unvested restricted stock and stock options using the treasury stock method.
The following table sets forth the computation of basic and diluted net income per share for fiscal 2010, 20092013, 2012 and 20082011 (in thousands, except per share data):
| 2010 | 2009 | 2008 | 2013 | 2012 | 2011 | |||||||||||||||||||
Net income | $ | 774,680 | $ | 386,508 | $ | 871,814 | $ | 289,985 | $ | 832,775 | $ | 832,847 | ||||||||||||
Shares used to compute basic net income per share | 519,045 | 524,470 | 539,373 | 501,372 | 494,731 | 497,469 | ||||||||||||||||||
| Dilutive potential common shares: | ||||||||||||||||||||||||
| Unvested restricted stock and performance share awards | 3,170 | 2,130 | 1,107 | 8,736 | 7,624 | 4,214 | ||||||||||||||||||
Stock options | 3,609 | 4,010 | 8,073 | 3,368 | 366 | 2,238 | ||||||||||||||||||
Shares used to compute diluted net income per share | 525,824 | 530,610 | 548,553 | 513,476 | 502,721 | 503,921 | ||||||||||||||||||
Basic net income per share | $ | 1.49 | $ | 0.74 | $ | 1.62 | $ | 0.58 | $ | 1.68 | $ | 1.67 | ||||||||||||
Diluted net income per share | $ | 1.47 | $ | 0.73 | $ | 1.59 | $ | 0.56 | $ | 1.66 | $ | 1.65 | ||||||||||||
For fiscal 2010, 20092013, options to purchase shares of common stock with exercise prices greater than the average fair market value of our stock of $45.08 were not included in the calculation because the effect would have been anti-dilutive. The number of shares of common stock under these options was immaterial. For fiscal 2012 and 2008,2011 options to purchase approximately 22.419.4 million 27.0 and 27.1 million and 16.5 million shares, respectively, of common stock with exercise prices greater than the annual average fair market value of our stock of $31.82, $27.30$31.98 and $37.07,$30.27, respectively, were not included in the calculation because the effect would have been anti-dilutive.
NOTE 16.15. COMMITMENTS AND CONTINGENCIES
Lease Commitments
We lease certain of our facilities and some of our equipment under non-cancellable operating lease arrangements that expire at various dates through 2028.2028. We also have one land lease that expires in 2091.2091. Rent expense includes base contractual rent and variable costs such as building expenses, utilities, taxes, insurance and equipment rental. Rent expense and sublease income for these leases for fiscal 2008 through fiscal 20102013, 2012 and 2011 were as follows (in thousands):
| 2010 | 2009 | 2008 | 2013 | 2012 | 2011 | |||||||||||||||||||
| Rent expense | $ | 109,114 | $ | 93,921 | $ | 101,202 | $ | 118,976 | $ | 105,809 | $ | 111,574 | ||||||||||||
| Less: sublease income | 3,929 | 5,563 | 11,421 | 3,057 | 2,330 | 3,211 | ||||||||||||||||||
| Net rent expense | $ | 105,185 | $ | 88,358 | $ | 89,781 | $ | 115,919 | $ | 103,479 | $ | 108,363 | ||||||||||||
We occupy three office buildings in San Jose, California where our corporate headquarters are located. We reference these office buildings as the Almaden Tower and the East and West Towers.
95
respectively. The residual value guarantees under the East and West Towers and the Almaden Tower obligations are $126.8 million and $89.4 million, respectively. If we submitted noticepurchase the properties, the investments in the lease receivables may be credited against the purchase price.
These two leases are both subject to standard covenants including certain financial ratios on the Almaden Tower lease that are reported to the lessor that we intended to exercise our option to renew this agreement for an additional five years effectivelessors quarterly. In August 2009. As stated in the original lease agreement, in conjunction with the lease renewal,2009, we were required to obtain a standby letter of credit on the East and West Tower lease for approximately $16.5$16.6 million which enabled us to secure a lower interest rate and reduce the number of covenants. As defined in the lease agreement, the standby letter of credit primarily represents the lease investment equity balance which is callable in the event of default. In March 2007, the Almaden Tower lease was extended for five years, wit h a renewal option for an additional five years solely at our election. As part of the lease extensions, we purchased the lease receivable from the lessor of the East and West Towers for $126.8 million and a portion of the lease receivable from the lessor of the Almaden Tower for $80.4 million, and are recorded as investments in lease receivables on our Consolidated Balance Sheets. As of December 3, 2010, the fair value of the lease receivables related to all three towers approximated carrying value. This purchase may be credited against the residual value guarantee if we purchase the properties or will be repaid from the sale proceeds if the properties are sold to third-parties. Under the agreement for the East and West Towers and the agreement for the Almaden Tower, we have the option to purchase the buildings at anytime during the lease term for approximately $143.2 million and $103.6 million, respectively. The residual value guarantees under the East and West Towers and the Almaden Tower obligations are $126.8 million and $89.4 million, respectively.
Unconditional Purchase Obligations
Our purchase obligations consist of agreements to purchase goods and services entered into in the ordinary course of business.
The following table summarizes our non-cancellable unconditional purchase obligations,operating leases and capital leases for each of the next five years and thereafter as of December 3, 2010November 29, 2013 (in thousands):
| Operating Leases | Capital Leases | Operating Leases | Capital Leases | |||||||||||||||||||||||||||||||
Fiscal Year | Purchase Obligations | Future Minimum Lease Payments | Future Minimum Sublease Income | Future Minimum Lease Payments | Purchase Obligations | Future Minimum Lease Payments | Future Minimum Sublease Income | Future Minimum Lease Payments | ||||||||||||||||||||||||||
2011 | $ | 175,131 | $ | 65,786 | $ | 4,040 | $ | 9,937 | ||||||||||||||||||||||||||
2012 | 10,241 | 50,146 | 2,870 | 9,925 | ||||||||||||||||||||||||||||||
2013 | 5,717 | 39,560 | 1,209 | 9,925 | ||||||||||||||||||||||||||||||
2014 | 2014 | 2,234 | 26,322 | 307 | 827 | 2014 | $ | 390,758 | $ | 48,360 | $ | 1,147 | $ | 14,892 | ||||||||||||||||||||
2015 | 2015 | 6,045 | 19,776 | 321 | — | 2015 | 45,654 | 36,270 | 1,345 | 3,280 | ||||||||||||||||||||||||
| 2016 | 2016 | 35,137 | 29,377 | 1,481 | — | |||||||||||||||||||||||||||||
| 2017 | 2017 | 2,030 | 23,991 | 1,441 | — | |||||||||||||||||||||||||||||
| 2018 | 2018 | 14,736 | 22,172 | 1,019 | — | |||||||||||||||||||||||||||||
Thereafter | Thereafter | 15,146 | 82,614 | 1,682 | — | Thereafter | 10,000 | 63,058 | 2,700 | — | ||||||||||||||||||||||||
Total | Total | $ | 214,514 | $ | 284,204 | $ | 10,429 | $ | 30,614 | Total | $ | 498,315 | $ | 223,228 | $ | 9,133 | $ | 18,172 | ||||||||||||||||
Less: interest | Less: interest | (2,122 | ) | Less: interest | (227 | ) | ||||||||||||||||||||||||||||
Total | Total | $ | 28,492 | Total | $ | 17,945 | ||||||||||||||||||||||||||||
The table above includes operating lease commitments related to our restructured facilities. See Note 1110 for information regarding our restructuring charges.
Guarantees
The lease agreements for our corporate headquarters provide for residual value guarantees as noted above. The fair value of a residual value guarantee in lease agreements entered into after December 31, 2002, must be recognized as a liability on our Consolidated Balance Sheets. As such, we recognized $5.2$5.2 million and $3.0$3.0 million in liabilities, related to the extended East and West Towers and Almaden Tower leases, respectively. These liabilities arewere recorded in other long-term liabilities with the offsetting entry recorded as prepaid rent in other assets. The balance will bewas amortized to the income statementour Consolidated Statements of Income over the life of the original leases. As of December 3, 2010 and November 27, 2009,29, 2013 there was no remaining balance of the unamortized portion of the fair value of the residual value guarantees, for both leases,either lease, remaining in other long-term liabilities and prepaid ren t was $0.7 million and $1.3 million, respectively.on our Consolidated Balance Sheets.
96
Royalties
We have royalty commitments associated with the shipment and licensing of certain products. Royalty expense is generally based on a dollar amount per unit shipped or a percentage of the underlying revenue. Royalty expense, which was recorded under our cost of products revenue on our Consolidated Statements of Income, was approximately $34.1$40.2 million $43.0, $29.6 million and $47.8$29.8 million in fiscal 2010, 20092013, 2012 and 2008,2011, respectively.
Indemnifications
In the ordinary course of business, we provide indemnifications of varying scope to customers against claims of intellectual property infringement made by third-partiesthird parties arising from the use of our products.products and from time to time, we are subject to claims by our customers under these indemnification provisions. Historically, costs related to these indemnification provisions have not been significant and we are unable to estimate the maximum potential impact of these indemnification provisions on our future results of operations.
To the extent permitted under Delaware law, we have agreements whereby we indemnify our officers and directors for certain events or occurrences while the officer or director is or was serving at our request in such capacity. The indemnification period covers all pertinent events and occurrences during the officer’sofficer's or director’sdirector's lifetime. The maximum potential amount of future payments we could be required to make under these indemnification agreements is unlimited; however, we have director and officer insurance coverage that reduces our exposure and enables us to recover a portion of any future amounts paid. We believe the estimated fair value of these indemnification agreements in excess of applicable insurance coverage is minimal.
Legal Proceedings
service agreements.
Between September 23, 2009May 4, 2011 and September 25, 2009, threeJuly 14, 2011, five putative class action lawsuits were filed in the Fourth Judicial DistrictSanta Clara Superior Court for Utah County, Provo Department, State of Utah, seeking to enjoin Adobe’s acquisition of Omniture, Inc. and to recover damagesAlameda Superior Court in California. On September 12, 2011, the event the transaction were to close. The cases were captioned Miner v. Omniture, Inc., et. al.consolidated into In Re High-Tech Employee Antitrust Litigation (“Miner”HTEAL”), Barrell v. Omniture, Inc. et. al., (“Barrell”), and Lodhia v. Omniture, Inc. et al., (“Lodhia”). At a hearing on October 20, 2009, the court consolidated the Miner, Barrell, and Lodhia cases into a single case under the Lodhia caption and denied the plaintiffs’ motion to preliminarily enjoin the closing of the transaction. On December 30, 2009, the plaintiffs served the defendants with a consolidated amended complai nt for damages arising out of the closing of the transaction. In the consolidated amended complaint, plaintiffs alleged that the members of Omniture’s board of directors breached their fiduciary duties to Omniture’s stockholders by failing to seek the highest possible price for Omniture and that both Adobe and Omniture induced or aided and abetted in the alleged breach. The plaintiffs also alleged that the Schedule 14D-9 Solicitation/Recommendation Statement filed by Omniture on September 24, 2009 in connection with the transaction contained inadequate disclosures and was materially misleading. Plaintiffs sought unspecified damages on behalf of the former public stockholders of Omniture. On March 8, 2010, Adobe and the other defendants moved to dismiss the complaint for failure to state a claim. The court heard oral argument on the motion in November 2010 and the court granted the defendants’ motion to dismiss the complaint with prejudice.
The trial is currently scheduled to be held in May 2014.
In connection with our anti-piracy efforts, conducted both internallyaddition to intellectual property disputes and through organizations such as the Business Software Alliance, from time to timeother litigation matters described above, we undertake litigation against alleged copyright infringers. Such lawsuits may lead to counter-claims alleging improper use of litigation or violation of other local laws. We believe we have valid defenses with respect to such counter-claims; however, it is possible that our consolidated financial position, cash flows or results of operations could be affected in any particular period by the resolution of one or more of these counter-claims.
97
requirements and whether to accrue for such claims in our financial statements. This determination is then reviewed and discussed with our Audit Committee and our independent registered public accounting firm.
We make a provision for a liability when it is both probable that a liability has been incurred and the amount of the loss can be reasonably estimated. These provisions are reviewed at least quarterly and adjusted to reflect the impacts of negotiations, settlements, rulings, advice of legal counsel and other information and events pertaining to a particular case. Unless otherwise specifically disclosed here or in our Notes to Consolidated Financial Statements, we have determined that no provision for liability nor disclosure is required related to any claim against us because: (a) there is not a reasonable possibility that a loss exceeding amounts already recognized (if any) may be incurred with respect to such claim; (b) a reasonably possible loss or range of loss cannot be estimated; or (c) such estimate is immaterial.
All legal costs associated with litigation are expensed as incurred. Litigation is inherently unpredictable. However, we believe that we have valid defenses with respect to the legal matters pending agains t Adobe.against us. It is possible, nevertheless, that our consolidated financial position, cash flows or results of operations could be negatively affected by an unfavorable resolution of one or more of such proceedings, claims or investigations.
In connection with our anti-piracy efforts, conducted both internally and through organizations such as the Business Software Alliance, from time to time we undertake litigation against alleged copyright infringers. Such lawsuits may lead to counter-claims alleging improper use of litigation or violation of other laws. We believe we have valid defenses with respect to such counter-claims; however, it is possible that our consolidated financial position, cash flows or results of operations could be affected in any particular period by the resolution of one or more of these counter-claims.
NOTE 17.16. DEBT
Our debt as of December 3, 2010November 29, 2013 and November 27, 200930, 2012 consisted of the following (in thousands):
| 2013 | 2012 | ||||||
| Notes | $ | 1,496,028 | $ | 1,495,312 | |||
| Capital lease obligations | 17,945 | 12,843 | |||||
| Total debt and capital lease obligations | 1,513,973 | 1,508,155 | |||||
| Less: current portion | 14,676 | 11,217 | |||||
| Debt and capital lease obligations | $ | 1,499,297 | $ | 1,496,938 | |||
| 2010 | 2009 | |||||||
Notes | $ | 1,493,969 | $ | — | ||||
Credit facility | — | 1,000,000 | ||||||
Capital lease obligations | 28,492 | — | ||||||
Total debt and capital lease obligations | 1,522,461 | 1,000,000 | ||||||
Less: current portion | 8,799 | — | ||||||
Total debt and capital lease obligations, non-current | $ | 1,513,662 | $ | 1,000,000 |
In February 2010, we issued $600.0$600.0 million of 3.25% senior notes due February 1, 2015 (the “2015 Notes”) and $900.0$900.0 million of 4.75% senior notes due February 1, 2020 (the “2020 Notes” and, together with the 2015 Notes, the “Notes”). Our proceeds were approximately $1.5$1.5 billion and were net of an issuance discount of $6.6 million.$6.6 million. The Notes rank equally with our other unsecured and unsubordinated indebtedness. In addition, we incurred issuance costs of approximately $10.7 million.$10.7 million. Both the discount and issuance costs are being amortized to interest expense over the respective terms of the Notes using the effective interest method. The effective interest rate including the discount and issuance costs is 3.45% for the 2015 Notes and 4.92% for the 2020 Notes. Interest is payable semi-annually, in arrea rs,arrears, on February 1 and August 1, commencing on August 1, 2010. In August 2010 we made our first semi-annual payment of $31.1 million. The proceeds from the Notes are available for general corporate purposes, including repayment of any balance outstanding. During fiscal 2013 interest payments on our credit facility.Notes totaled $62.3 million. Based on quoted market prices in inactive markets, the fair value of the Notes was approximately $1.6$1.6 billion as of December 3, 2010..
We may redeem the Notes at any time, subject to a make whole premium. In addition, upon the occurrence of certain change of control triggering events, we may be required to repurchase the Notes, at a price equal to 101% of their principal amount, plus accrued and unpaid interest to the date of repurchase. The Notes also include covenants that limit our ability to grant liens on assets and to enter into sale and leaseback transactions, subject to significant allowances. As of December 3, 2010,November 29, 2013, we were in compliance with all of the covenants.
Credit Agreement
98
subject to the agreement of the applicable lenders, request up to an additional $500.0 million in commitments, for general corporate purposes. At November 27, 2009, the amount outstandinga maximum aggregate commitment of $1.5 billion. Loans under the Credit Agreement will bear interest at either (i) the London Interbank Offered Rate (“LIBOR”) plus a margin, based on our debt ratings, ranging from 0.795% and 1.30% or (ii) the base rate, which is defined as the highest of (a) the agent’s prime rate, (b) the federal funds effective rate plus 0.50% or (c) LIBOR plus 1.00% plus a margin, based on our debt ratings, ranging from 0.00% to 0.30%. Commitment fees are payable quarterly at rates between 0.08% and 0.20% per year also based on our public debt ratings. Subject to certain conditions stated in the Credit Agreement, we and any of our subsidiaries designated as additional borrowers may borrow, prepay and re-borrow amounts under the revolving credit facility was $1.0 billion, which approximated fair value. at any time during the term of the Credit Agreement.
The Credit Agreement contains customary representations, warranties, affirmative and negative covenants, including a financial covenant, events of default and indemnification provisions in favor of the lenders. The negative covenants include restrictions regarding the incurrence of liens and indebtedness, certain merger and acquisition transactions, dispositions and other matters, all subject to certain exceptions. The financial covenant, based on a quarterly financial test, requires us not to exceed a maximum leverage ratio.
On FebruaryMarch 1, 2010,2013, we paidexercised an option under the outs tanding balanceCredit Agreement to extend the maturity date of the Credit Agreement by one year to March 2, 2018. The facility will terminate and all amounts owing thereunder will be due and payable on the maturity date unless (a) the commitments are terminated earlier upon the occurrence of certain events, including an event of default, or (b) the maturity date is further extended upon our credit facility andrequest, subject to the entire $1.0 billion credit lineagreement of the lenders.
As of November 29, 2013, there were no outstanding borrowings under this facility remains available for borrowing.
Credit Agreement and we were in compliance with all covenants.
Capital Lease Obligation
In June 2010,the first quarter of fiscal 2013, we entered into a sale-leaseback agreement to sell equipment totaling $32.2$25.7 million and leaseback the same equipment over a period of 4324 months. This transaction was classified as a capital lease obligation and was recorded at fair value. As of December 3, 2010,November 29, 2013, our capital lease obligations of $28.5$17.9 million includes $8.8$14.7 million of current debt.
NOTE 18.17. NON-OPERATING INCOME (EXPENSE)
Non-operating income (expense) for fiscal 2010, 20092013, 2012 and 20082011 included the following (in thousands):
| 2010 | 2009 | 2008 | ||||||||||
| Interest and other income (expense), net: | ||||||||||||
Interest income | $ | 21,923 | $ | 34,978 | $ | 57,588 | ||||||
Foreign exchange losses | (12,948 | ) | (13,420 | ) | (17,494 | ) | ||||||
Realized gains on fixed income investment | 2,953 | 8,753 | 3,161 | |||||||||
Realized losses on fixed income investment | — | (1 | ) | (1,501 | ) | |||||||
Other | 1,211 | 1,070 | 2,093 | |||||||||
Interest and other income (expense), net | $ | 13,139 | $ | 31,380 | $ | 43,847 | ||||||
Interest expense | $ | (56,952 | ) | $ | (3,407 | ) | $ | (10,019 | ) | |||
| Investment gains (losses), net: | ||||||||||||
Realized investment gains | $ | 9,819 | $ | 52 | $ | 18,398 | ||||||
Unrealized investment gains(*) | 1,008 | 10,826 | 7,803 | |||||||||
Realized investment losses | (9,619 | ) | (9,019 | ) | (1,417 | ) | ||||||
Unrealized investment losses | (7,318 | ) | (18,825 | ) | (8,375 | ) | ||||||
Investment gains (losses), net | $ | (6,110 | ) | $ | (16,966 | ) | $ | 16,409 | ||||
Non-operating income (expense), net | $ | (49,923 | ) | $ | 11,007 | $ | 50,237 |
| 2013 | 2012 | 2011 | ||||||||||
| Interest and other income (expense), net: | ||||||||||||
| Interest income | $ | 21,887 | $ | 24,549 | $ | 24,506 | ||||||
| Foreign exchange gains (losses) | (21,001 | ) | (31,431 | ) | (30,226 | ) | ||||||
| Realized gains on fixed income investment | 4,090 | 3,152 | 2,012 | |||||||||
| Realized losses on fixed income investment | (1,077 | ) | (278 | ) | (178 | ) | ||||||
| Other | 1,042 | 594 | 912 | |||||||||
| Interest and other income (expense), net | $ | 4,941 | $ | (3,414 | ) | $ | (2,974 | ) | ||||
| Interest expense | $ | (67,508 | ) | $ | (67,487 | ) | $ | (66,952 | ) | |||
| Investment gains (losses), net: | ||||||||||||
| Realized investment gains | $ | 1,783 | $ | 8,918 | $ | 7,159 | ||||||
| Unrealized investment gains | 1,251 | 940 | — | |||||||||
| Realized investment losses | (7,049 | ) | (104 | ) | (850 | ) | ||||||
| Unrealized investment losses | — | (250 | ) | (452 | ) | |||||||
| Investment gains (losses), net | $ | (4,015 | ) | $ | 9,504 | $ | 5,857 | |||||
| Non-operating income (expense), net | $ | (66,582 | ) | $ | (61,397 | ) | $ | (64,069 | ) | |||
99
NOTE 19.18. INDUSTRY SEGMENT, GEOGRAPHIC INFORMATION AND SIGNIFICANT CUSTOMERS
We report segment information based on the “management” approach. The management approach designates the internal reporting used by management for making decisions and assessing performance as the source of our reportable segments.
Our CEO, the chief operating decision maker, reviews revenue and gross margin information for each of our reportable segments. Operatingsegments, but does not review operating expenses are not reviewed on a segment by segment basis. In addition, with the exception of goodwill and intangible assets, we do not identify or allocate our assets by the reportable segments.
Effective in the first quarter of fiscal 2013, we moved our video server solutions products from our Digital Media segment to our Digital Marketing segment to better align the role of how Adobe can help its customers monetize their video assets with our Digital Marketing solutions. Prior year information in the table below has been updated to reflect this change.
We have the following reportable segments:
Digital Media—Our Digital Media segment provides tools and solutions that enable individuals, small businesses and enterprises to create, publish, promote and monetize their digital content anywhere. Our customers include traditional content creators, web application developers and digital media professionals, as well as their management in marketing departments and agencies, companies and publishers.
Digital Marketing—Our Digital Marketing segment provides solutions and services for how digital advertising and marketing are created, managed, executed, measured and optimized. Our customers include digital marketers, advertisers, publishers, merchandisers, web analysts, chief marketing officers, chief information officer and chief revenue officers.
Print and Publishing—Our Print and Publishing segment addresses market opportunities ranging from the diverse authoring and publishing needs of technical and business publishing to our legacy type and OEM printing businesses.
Our segment results for fiscal 2010, 20092013, 2012 and 20082011 were as follows (dollars in thousands):
Creative Solutions | Knowledge Worker | Enterprise | Omniture(1) | Platform(2) | Print and Publishing | Total | ||||||||||||||||||||||
| Fiscal 2010 | ||||||||||||||||||||||||||||
Revenue | $ | 2,056,546 | $ | 654,327 | $ | 355,046 | $ | 360,564 | $ | 178,906 | �� | $ | 194,611 | $ | 3,800,000 | |||||||||||||
Cost of revenue | 120,744 | 20,266 | 61,726 | 179,461 | 9,991 | 11,314 | 403,502 | |||||||||||||||||||||
Gross profit | $ | 1,935,802 | $ | 634,061 | $ | 293,320 | $ | 181,103 | $ | 168,915 | $ | 183,297 | $ | 3,396,498 | ||||||||||||||
| Gross profit as a percentage of revenue | 94 | % | 97 | % | 83 | % | 50 | % | 94 | % | 94 | % | 89 | % | ||||||||||||||
| Fiscal 2009 | ||||||||||||||||||||||||||||
Revenue | $ | 1,702,110 | $ | 557,598 | $ | 300,870 | $ | 26,272 | $ | 181,033 | $ | 177,970 | $ | 2,945,853 | ||||||||||||||
Cost of revenue | 152,909 | 29,221 | 58,925 | 15,829 | 21,174 | 18,674 | 296,732 | |||||||||||||||||||||
Gross profit | $ | 1,549,201 | $ | 528,377 | $ | 241,945 | $ | 10,443 | $ | 159,859 | $ | 159,296 | $ | 2,649,121 | ||||||||||||||
| Gross profit as a percentage of revenue | 91 | % | 95 | % | 80 | % | 40 | % | 88 | % | 90 | % | 90 | % | ||||||||||||||
| Fiscal 2008 | ||||||||||||||||||||||||||||
Revenue | $ | 2,072,835 | $ | 757,728 | $ | 306,131 | $ | — | $ | 231,558 | $ | 211,637 | $ | 3,579,889 | ||||||||||||||
Cost of revenue | 160,560 | 43,777 | 85,044 | — | 44,344 | 28,905 | 362,630 | |||||||||||||||||||||
Gross profit | $ | 1,912,275 | $ | 713,951 | $ | 221,087 | $ | — | $ | 187,214 | $ | 182,732 | $ | 3,217,259 | ||||||||||||||
| Gross profit as a percentage of revenue | 92 | % | 94 | % | 72 | % | — | 81 | % | 86 | % | 90 | % |
| Digital Media | Digital Marketing | Print and Publishing | Total | ||||||||||||
| Fiscal 2013 | |||||||||||||||
| Revenue | $ | 2,625,913 | $ | 1,228,868 | $ | 200,459 | $ | 4,055,240 | |||||||
| Cost of revenue | 170,788 | 404,804 | 10,965 | 586,557 | |||||||||||
| Gross profit | $ | 2,455,125 | $ | 824,064 | $ | 189,494 | $ | 3,468,683 | |||||||
| Gross profit as a percentage of revenue | 93 | % | 67 | % | 95 | % | 86 | % | |||||||
| Fiscal 2012 | |||||||||||||||
| Revenue | $ | 3,101,864 | $ | 1,085,042 | $ | 216,771 | $ | 4,403,677 | |||||||
| Cost of revenue | 130,178 | 342,764 | 10,840 | 483,782 | |||||||||||
| Gross profit | $ | 2,971,686 | $ | 742,278 | $ | 205,931 | $ | 3,919,895 | |||||||
| Gross profit as a percentage of revenue | 96 | % | 68 | % | 95 | % | 89 | % | |||||||
| Fiscal 2011 | |||||||||||||||
| Revenue | $ | 3,070,151 | $ | 927,787 | $ | 218,320 | $ | 4,216,258 | |||||||
| Cost of revenue | 125,591 | 304,542 | 7,740 | 437,873 | |||||||||||
| Gross profit | $ | 2,944,560 | $ | 623,245 | $ | 210,580 | $ | 3,778,385 | |||||||
| Gross profit as a percentage of revenue | 96 | % | 67 | % | 96 | % | 90 | % | |||||||
100
The tables below list our revenue and property and equipment, net, by geographic area for fiscal 2010, 20092013, 2012 and 20082011 (in thousands). With the exception of property and equipment, we do not identify or allocate our assets (including long-lived assets) by geographic area.
| Revenue | 2010 | 2009 | 2008 | 2013 | 2012 | 2011 | ||||||||||||||||||||
| Americas: | Americas: | Americas: | ||||||||||||||||||||||||
United States | United States | $ | 1,665,714 | $ | 1,244,631 | $ | 1,473,319 | United States | $ | 1,935,429 | $ | 1,969,924 | $ | 1,823,205 | ||||||||||||
Other | Other | 193,309 | 137,940 | 159,507 | Other | 198,953 | 226,430 | 221,399 | ||||||||||||||||||
Total Americas | Total Americas | 1,859,023 | 1,382,571 | 1,632,826 | Total Americas | 2,134,382 | 2,196,354 | 2,044,604 | ||||||||||||||||||
EMEA | EMEA | 1,168,217 | 928,857 | 1,229,161 | EMEA | 1,129,180 | 1,294,566 | 1,317,417 | ||||||||||||||||||
| Asia: | ||||||||||||||||||||||||||
| APAC: | APAC: | |||||||||||||||||||||||||
Japan | Japan | 477,462 | 410,055 | 450,799 | Japan | 472,110 | 531,028 | 517,378 | ||||||||||||||||||
Other | Other | 295,298 | 224,370 | 267,103 | Other | 319,568 | 381,729 | 336,859 | ||||||||||||||||||
Total Asia | 772,760 | 634,425 | 717,902 | |||||||||||||||||||||||
| Total APAC | Total APAC | 791,678 | 912,757 | 854,237 | ||||||||||||||||||||||
Revenue | Revenue | $ | 3,800,000 | $ | 2,945,853 | $ | 3,579,889 | Revenue | $ | 4,055,240 | $ | 4,403,677 | $ | 4,216,258 | ||||||||||||
| Property and Equipment | 2010 | 2009 | |||||||
| Americas: | |||||||||
| United States | $ | 388,863 | $ | 336,303 | |||||
| Other | 3,369 | 5,806 | |||||||
| Total Americas | 392,232 | 342,109 | |||||||
| EMEA | 35,263 | 23,729 | |||||||
| Asia: | |||||||||
| India | 13,468 | 14,625 | |||||||
| Other | 7,918 | 7,669 | |||||||
| Total Asia | 21,386 | 22,294 | |||||||
| Property and equipment, net | $ | 448,881 | $ | 388,132 | |||||
| Property and Equipment | 2013 | 2012 | |||||||
| Americas: | |||||||||
| United States | $ | 533,792 | $ | 552,634 | |||||
| Other | 1,270 | 1,426 | |||||||
| Total Americas | 535,062 | 554,060 | |||||||
| EMEA | 52,018 | 63,515 | |||||||
| APAC: | |||||||||
| India | 58,013 | 30,007 | |||||||
| Other | 14,681 | 16,720 | |||||||
| Total APAC | 72,694 | 46,727 | |||||||
| Property and equipment, net | $ | 659,774 | $ | 664,302 | |||||
Significant Customers
| 2012 | 2011 | |||||
| Ingram Micro | 11 | % | 14 | % | ||
| 2010 | 2009 | 2008 | ||||||||||
Ingram Micro | 15 | % | 15 | % | 18 | % |
101
| 2010 | 2009 | |||||||
Ingram Micro | 14 | % | 16 | % |
NOTE 20.19. SELECTED QUARTERLY FINANCIAL DATA (unaudited)
| 2010 | 2013 | |||||||||||||||||||||||||||||||
| (in thousands, except per share data) | Quarter Ended | Quarter Ended | ||||||||||||||||||||||||||||||
| March 5 | June 4 | September 3 | December 3 | March 1 | May 31 | August 30 | November 29 | |||||||||||||||||||||||||
| Revenue | $ | 858,700 | $ | 943,035 | $ | 990,319 | $ | 1,007,946 | $ | 1,007,873 | $ | 1,010,549 | $ | 995,119 | $ | 1,041,699 | ||||||||||||||||
| Gross profit | $ | 769,332 | $ | 835,202 | $ | 891,235 | $ | 900,729 | $ | 851,189 | $ | 875,268 | $ | 848,043 | $ | 894,183 | ||||||||||||||||
| Income before income taxes | $ | 166,215 | $ | 194,173 | $ | 296,752 | $ | 286,011 | $ | 83,484 | $ | 91,127 | $ | 93,260 | $ | 88,270 | ||||||||||||||||
| Net income | $ | 127,154 | $ | 148,611 | $ | 230,065 | $ | 268,850 | $ | 65,117 | $ | 76,546 | $ | 83,002 | $ | 65,320 | ||||||||||||||||
| Basic net income per share | $ | 0.24 | $ | 0.28 | $ | 0.44 | $ | 0.53 | $ | 0.13 | $ | 0.15 | $ | 0.16 | $ | 0.13 | ||||||||||||||||
| Diluted net income per share | $ | 0.24 | $ | 0.28 | $ | 0.44 | $ | 0.53 | $ | 0.13 | $ | 0.15 | $ | 0.16 | $ | 0.13 | ||||||||||||||||
| 2009 | 2012 | |||||||||||||||||||||||||||||||
| (in thousands, except per share data) | Quarter Ended | Quarter Ended | ||||||||||||||||||||||||||||||
| February 27 | May 29 | August 28 | November 27 | March 2 | June 1 | August 31 | November 30 | |||||||||||||||||||||||||
| Revenue | $ | 786,390 | $ | 704,673 | $ | 697,507 | $ | 757,283 | $ | 1,045,220 | $ | 1,124,449 | $ | 1,080,580 | $ | 1,153,428 | ||||||||||||||||
| Gross profit | $ | 709,037 | $ | 632,665 | $ | 632,460 | $ | 674,959 | $ | 936,955 | $ | 993,531 | $ | 960,959 | $ | 1,028,450 | ||||||||||||||||
| Income before income taxes | $ | 203,162 | $ | 163,730 | $ | 174,416 | $ | 160,212 | $ | 270,377 | $ | 294,574 | $ | 263,212 | $ | 290,631 | ||||||||||||||||
| Net income (loss) | $ | 156,435 | $ | 126,071 | $ | 136,045 | $ | (32,043 | ) | |||||||||||||||||||||||
| Basic net income (loss) per share | $ | 0.30 | $ | 0.24 | $ | 0.26 | $ | (0.06 | ) | |||||||||||||||||||||||
| Diluted net income (loss) per share | $ | 0.30 | $ | 0.24 | $ | 0.26 | $ | (0.06 | ) | |||||||||||||||||||||||
| Net income | $ | 185,209 | $ | 223,876 | $ | 201,357 | $ | 222,333 | ||||||||||||||||||||||||
| Basic net income per share | $ | 0.37 | $ | 0.45 | $ | 0.41 | $ | 0.45 | ||||||||||||||||||||||||
| Diluted net income per share | $ | 0.37 | $ | 0.45 | $ | 0.40 | $ | 0.44 | ||||||||||||||||||||||||
Our fiscal year is a 52- or 53-week year that ends on the Friday closest to November 30. Each of the fiscal quarters presented were comprised of 13 weeks with exceptionweeks.
102
The Board of Directors and Stockholders
Adobe Systems Incorporated:
We have audited the accompanying consolidatedbalance sheets of Adobe Systems Incorporated and subsidiaries (the “Company”) as of December 3, 2010November 29, 2013 and November 27, 2009,30, 2012, and the related consolidated statements of income, comprehensive income, stockholders’ equity, and comprehensive income, and cash flows for each of the years in the three-year period ended December 3, 2010.November 29, 2013. We also have audited Adobe Systems Incorporated’s internal control over financial reporting as of December 3, 2010,November 29, 2013, based on criteria established in Internal Control—Control - Integrated Framework (1992) issued by the Committee of Sponsoring Organizations of the Treadway Commission (COSO)(“COSO”). Adobe SystemSystems Incorporated’s management is responsible for these consolidated financial statements, for maintaining effective internal control over financial reporting, and for its assessment of the effectiveness of internal control over financial reporting, included in the accompanying Management’s Annual Report on Internal Control over Financial Reporting appearing under Item 9A. Our responsibility is to express an opinion on these consolidated financial statements and an opinion on the Company’s internal control over financial reporting based on our audits.
We conducted our audits in accordance with the standards of the Public Company Accounting Oversight Board (United States). Those standards require that we plan and perform the audits to obtain reasonable assurance about whether the financial statements are free of material misstatement and whether effective internal control over financial reporting was maintained in all material respects. Our audits of the consolidated financial statements included examining, on a test basis, evidence supporting the amounts and disclosures in the financial statements, assessing the accounting principles used and significant estimates made by management, and evaluating the overall financial statement presentation. Our audit of internal control over financial reporting included obtaining an understanding of internal control over financial reporting, ass essingassessing the risk that a material weakness exists, and testing and evaluating the design and operating effectiveness of internal control based on the assessed risk. Our audits also included performing such other procedures as we considered necessary in the circumstances. We believe that our audits provide a reasonable basis for our opinions.
A company’s internal control over financial reporting is a process designed to provide reasonable assurance regarding the reliability of financial reporting and the preparation of financial statements for external purposes in accordance with generally accepted accounting principles. A company’s internal control over financial reporting includes those policies and procedures that (1) pertain to the maintenance of records that, in reasonable detail, accurately and fairly reflect the transactions and dispositions of the assets of the company; (2) provide reasonable assurance that transactions are recorded as necessary to permit preparation of financial statements in accordance with generally accepted accounting principles, and that receipts and expenditures of the company are being made only in accordance with authorizations of management and directors of the company; and (3) provide reasonable assurance regarding prevention or timely detection of unauthorized acquisition, use, or disposition of the company’s assets that could have a material effect on the financial statements.
Because of its inherent limitations, internal control over financial reporting may not prevent or detect misstatements. Also, projections of any evaluation of effectiveness to future periods are subject to the risk that controls may become inadequate because of changes in conditions, or that the degree of compliance with the policies or procedures may deteriorate.
In our opinion, the consolidated financial statements referred to above present fairly, in all material respects, the financial position of Adobe Systems Incorporated and subsidiaries as of December 3, 2010November 29, 2013 and November 27, 2009,30, 2012, and the results of their operations and their cash flows for each of the years in the three-year period ended December 3, 2010,November 29, 2013, in conformity with U.S. generally accepted accounting principles. Also in our opinion, Adobe Systems Incorporated maintained, in all material respects, effective internal control over financial reporting as of December 3, 2010,November 29, 2013, based on criteria established in Internal Control—Control - Integrated Framework (1992) issued by the Committee of Sponsoring Organizations of the Treadway Commission (COSO).
January 27, 201121, 2014
None.
Disclosure Controls and Procedures
Our management has evaluated, under the supervision and with the participation of our Chief Executive Officer and Chief Financial Officer, the effectiveness of our disclosure controls and procedures as of December 3, 2010.November 29, 2013. Based on their evaluation as of December 3, 2010,November 29, 2013, our Chief Executive Officer and Chief Financial Officer have concluded that our disclosure controls and procedures (as defined in Rules 13a-15(e) and 15d-15(e) under the Securities Exchange Act of 1934, as amended) were effective at the reasonable assurance level to ensure that the information required to be disclosed by us in this Annual Report on Form 10-K was (i) recorded, processed, summarized and reported within the time periods specified in the SEC’s rules and regulations and (ii) accumulated and communicated to our management, including our Chi efChief Executive Officer and Chief Financial Officer, to allow timely decisions regarding required disclosure.
Our management, including our Chief Executive Officer and Chief Financial Officer, does not expect that our disclosure controls and procedures or our internal controls over financial reporting will prevent all error and all fraud. A control system, no matter how well conceived and operated, can provide only reasonable, not absolute, assurance that the objectives of the control system are met. Further, the design of a control system must reflect the fact that there are resource constraints and the benefits of controls must be considered relative to their costs. Because of the inherent limitations in all control systems, no evaluation of controls can provide absolute assurance that all control issues and instances of fraud, if any, within Adobe have been detected.
Management’s Annual Report on Internal Control over Financial Reporting
Our management is responsible for establishing and maintaining adequate internal control over financial reporting (as defined in Rule 13a-15(f) under the Securities Exchange Act of 1934, as amended). Our management assessed the effectiveness of our internal control over financial reporting as of December 3, 2010.November 29, 2013. In making this assessment, our management used the criteria set forth by the Committee of Sponsoring Organizations of the Treadway Commission (“COSO”) in Internal Control-Integrated Framework. Our management has concluded that, as of December 3, 2010,November 29, 2013, our internal control over financial reporting is effective based on these criteria.
KPMG LLP, the independent registered public accounting firm that audited our financial statements included in this Annual Report on Form 10-K, has issued an attestation report on our internal control over financial reporting, which is included herein.
Changes in Internal Control over Financial Reporting
There were no changes in our internal control over financial reporting during the quarter ended December 3, 2010November 29, 2013 that have materially affected, or are reasonably likely to materially affect our internal control over financial reporting.
None.
PART III
The information required by this Item 10 of Form 10-K that is found in our
The information required by this Item 11 of Form 10-K that is found in our 2011 Proxy Statement is incorporated by reference to our 20112014 Proxy Statement.
ITEM 12. SECURITY OWNERSHIP OF CERTAIN BENEFICIAL OWNERS AND MANAGEMENT AND RELATED STOCKHOLDER MATTERSMATTERS
The information required by this Item 12 of Form 10-K that is found in our 2011 Proxy Statement is incorporated by reference to our 20112014 Proxy Statement.
104
ITEM 13. CERTAIN RELATIONSHIPS AND RELATED TRANSACTIONS, AND DIRECTOR INDEPENDENCEINDEPENDENCE
The information required by this Item13 of Form 10-K that is found in our 2011 Proxy Statement is incorporated by reference to our 20112014 Proxy Statement.
The information required by this Item 14 of Form 10-K that is found in our 2011 Proxy Statement is incorporated by reference to our 20112014 Proxy Statement.
PART IV
| 1. | Financial Statements. See |
| 2. | Exhibits. The exhibits listed in the accompanying |
Pursuant to the requirements of Section 13 or 15(d) of the Securities Exchange Act of 1934, the registrant has duly caused this report to be signed on its behalf by the undersigned, thereunto duly authorized, on January 27, 2011.authorized.
| ADOBE SYSTEMS INCORPORATED | ||||
| By: | /s/ MARK GARRETT | |||
Executive Vice President and | ||||
| Chief Financial Officer | ||||
| (Principal Financial Officer) | ||||
Date: January 21, 2014
POWER OF ATTORNEY
KNOW ALL PERSONS BY THESE PRESENTS, that each person whose signature appears below constitutes and appoints Shantanu Narayen and Mark Garrett, and each or any one of them, his or her lawful attorneys-in-fact and agents, for such person in any and all capacities, to sign any and all amendments to this report and to file the same, with all exhibits thereto and other documents in connection therewith, with the Securities and Exchange Commission, hereby ratifying and confirming all that either of said attorneys-in-fact and agent, or substitute or substitutes, may do or cause to be done by virtue hereof.
Pursuant to the requirements of the Securities Exchange Act of 1934, this report has been signed below by the following persons on behalf of the registrant and in the capacities and on the dates indicated.
| Signature | Title | Date | ||
/s/ WARNOCK | January | |||
| John E. Warnock | Chairman of the Board of Directors | |||
/s/ GESCHKE | January | |||
| Charles M. Geschke | Chairman of the Board of Directors | |||
/s/ SHATANU NARAYEN | January | |||
Shantanu Narayen | Director, President and Chief Executive Officer (Principal Executive Officer) | |||
/s/ MARK GARRETT | January | |||
| Mark Garrett | Executive Vice President and Chief Financial Officer (Principal Financial Officer) | |||
/s/ ROWLEY | January | |||
| Richard T. Rowley | Vice President, Corporate Controller and Principal Accounting Officer | |||
/s/ AMY BANSE | January | |||
| Amy Banse | Director | |||
| /s/ KELLY BARLOW | January 21, 2014 | |||
| Kelly Barlow | Director | |||
106
| Signature | Title | Date | ||
| /s/ EDWARD W. BARNHOLT | January 21, 2014 | |||
| Edward W. Barnholt | Director | |||
/s/ BURGESS | January | |||
| Robert K. Burgess | Director | |||
| /s/ FRANK CALDERONI | January 21, 2014 | |||
| Frank Calderoni | Director | |||
/s/ CANNON | January | |||
| Michael R. Cannon | Director | |||
/s/ DALEY | January | |||
| James E. Daley | Director | |||
/ s/ LAURA DESMOND | January | |||
| Director | ||||
/s/ ROSENSWEIG | January | |||
| Daniel L. Rosensweig | Director | |||
/s/ ROBERT SEDGEWICK | January | |||
| Robert Sedgewick | Director | |||
107
The following trademarks of Adobe Systems Incorporated or its subsidiaries, which may be registered in the United States and/or other countries, are referenced in this Form 10-K:
Acrobat
Adobe
Adobe Connect
Adobe DataWarehouse
Adobe Premiere
After Effects
Creative Suite
Dreamweaver
Flash
Illustrator
InCopy
InDesign
Lightroom
LiveCycle
Omniture
Photoshop
PostScript
Reader
All other trademarks are the property of their respective owners.
INDEX TOEXHIBITS
| Exhibit | Incorporated by Reference** | Filed | ||||||||
| Number | Exhibit Description | Form | Date | Number | Herewith | |||||
| 3.1 | Amended and Restated Bylaws | 8-K | 1/13/09 | 3.1 | ||||||
| 3.2 | Restated Certificate of Incorporation of Adobe Systems Incorporated | 10-Q | 7/16/01 | 3.6 | ||||||
| 3.2.1 | Certificate of Correction of Restated Certificate of Incorporation of Adobe Systems Incorporated | 10-Q | 4/11/03 | 3.6.1 | ||||||
| 3.3 | Certificate of Designation of Series A Preferred Stock of Adobe Systems Incorporated | 10-Q | 7/08/03 | 3.3 | ||||||
| 4.2 | Specimen Common Stock Certificate | S-3 | 1/15/10 | 4.3 | ||||||
| 4.3 | Form of Indenture | S-3 | 1/15/10 | 4.1 | ||||||
| 4.4 | Forms of Global Note for Adobe Systems Incorporated’s 3.250% Notes due 2015 and 4.750% Notes due 2020, together with Form of Officer’s Certificate setting forth the terms of the Notes | 8-K | 1/26/10 | 4.1 | ||||||
| 10.1 | Amended 1994 Performance and Restricted Stock Plan* | 10-Q | 4/09/10 | 10.1 | ||||||
| 10.2 | Form of Restricted Stock Agreement used in connection with the Amended 1994 Performance and Restricted Stock Plan* | 10-K | 1/23/09 | 10.3 | ||||||
| 10.3 | 1997 Employee Stock Purchase Plan, as amended* | 10-Q | 10/08/10 | 10.3 | ||||||
| 10.4 | 1996 Outside Directors Stock Option Plan, as amended* | 10-Q | 4/12/06 | 10.6 | ||||||
| Incorporated by Reference** | ||||||||||||
Exhibit Number | Exhibit Description | Form | Date | Number | Filed Herewith | |||||||
| 3.1 | Restated Certificate of Incorporation of Adobe Systems Incorporated | 8-K | 4/26/11 | 3.3 | ||||||||
| 3.2 | Amended and Restated Bylaws | 8-K | 10/30/12 | 3.1 | ||||||||
| 4.1 | Specimen Common Stock Certificate | S-3 | 1/15/10 | 4.3 | ||||||||
| 4.2 | Form of Indenture | S-3 | 1/15/10 | 4.1 | ||||||||
| 4.3 | Forms of Global Note for Adobe Systems Incorporated’s 3.250% Notes due 2015 and 4.750% Notes due 2020, together with Form of Officer’s Certificate setting forth the terms of the Notes | 8-K | 1/26/10 | 4.1 | ||||||||
| 10.1 | Amended 1994 Performance and Restricted Stock Plan* | 10-Q | 4/9/10 | 10.1 | ||||||||
| 10.2 | Form of Restricted Stock Agreement used in connection with the Amended 1994 Performance and Restricted Stock Plan* | 10-K | 1/23/09 | 10.3 | ||||||||
| 10.3 | 1997 Employee Stock Purchase Plan, as amended* | 8-K | 4/26/11 | 10.1 | ||||||||
| 10.4 | 1996 Outside Directors Stock Option Plan, as amended* | 10-Q | 4/12/06 | 10.6 | ||||||||
| 10.5 | Forms of Stock Option Agreements used in connection with the 1996 Outside Directors Stock Option Plan* | S-8 | 6/16/00 | 4.8 | ||||||||
| 10.6 | 2003 Equity Incentive Plan, as amended and restated* | 8-K | 4/12/13 | 10.1 | ||||||||
| 10.7 | Form of Stock Option Agreement used in connection with the 2003 Equity Incentive Plan* | 8-K | 12/20/10 | 99.4 | ||||||||
| 10.8 | Form of Indemnity Agreement* | 10-Q | 6/26/09 | 10.12 | ||||||||
| 10.9 | Forms of Retention Agreement* | 10-K | 2/17/98 | 10.44 | ||||||||
| 10.10 | Second Amended and Restated Master Lease of Land and Improvements by and between SMBC Leasing and Finance, Inc. and Adobe Systems Incorporated | 10-Q | 10/7/04 | 10.14 | ||||||||
| 10.11 | Lease between Adobe Systems Incorporated and Selco Service Corporation, dated March 26, 2007 | 8-K | 3/28/07 | 10.1 | ||||||||
109
| Incorporated by Reference** | ||||||||||||
Exhibit Number | Exhibit Description | Form | Date | Number | Filed Herewith | |||||||
| 10.12 | Participation Agreement among Adobe Systems Incorporated, Selco Service Corporation, et al. dated March 26, 2007 | 8-K | 3/28/07 | 10.2 | ||||||||
| 10.13 | Master Amendment No. 2 among Adobe Systems Incorporated, Selco Service Corporation and KeyBank National Association dated October 31, 2011 | 10-K | 1/22/13 | 10.13 | ||||||||
| 10.14 | Form of Restricted Stock Unit Agreement used in connection with the Amended 1994 Performance and Restricted Stock Plan* | 10-K | 1/26/12 | 10.13 | ||||||||
| 10.15 | Form of RSU Grant Notice and Award Agreement pursuant to the 2003 Equity Incentive Plan* | 8-K | 1/28/13 | 10.6 | ||||||||
| 10.16 | Form of Restricted Stock Agreement used in connection with the 2003 Equity Incentive Plan* | 10-Q | 10/7/04 | 10.11 | ||||||||
| 10.17 | 2005 Equity Incentive Assumption Plan, as amended and restated* | 10-Q | 6/28/13 | 10.17 | ||||||||
| 10.18 | Form of Stock Option Agreement used in connection with the 2005 Equity Incentive Assumption Plan* | 8-K | 12/20/10 | 99.10 | ||||||||
| 10.19 | Allaire Corporation 1997 Stock Incentive Plan* | S-8 | 3/27/01 | 4.06 | ||||||||
| 10.20 | Allaire Corporation 1998 Stock Incentive Plan, as amended* | S-8 | 3/27/01 | 4.07 | ||||||||
| 10.21 | Allaire Corporation 2000 Stock Incentive Plan* | S-8 | 3/27/01 | 4.08 | ||||||||
| 10.22 | Andromedia, Inc. 1999 Stock Plan* | S-8 | 12/7/99 | 4.09 | ||||||||
| 10.23 | Blue Sky Software Corporation 1996 Stock Option Plan* | S-8 | 12/29/03 | 4.07 | ||||||||
| 10.24 | Macromedia, Inc. 1999 Stock Option Plan* | S-8 | 8/17/00 | 4.07 | ||||||||
| 10.25 | Macromedia, Inc. 2002 Equity Incentive Plan* | S-8 | 8/10/05 | 4.08 | ||||||||
| 10.26 | Form of Macromedia, Inc. Stock Option Agreement* | S-8 | 8/10/05 | 4.09 | ||||||||
| 10.27 | Form of Macromedia, Inc. Revised Non-Plan Stock Option Agreement* | S-8 | 11/23/04 | 4.10 | ||||||||
| 10.28 | Form of Macromedia, Inc. Restricted Stock Purchase Agreement* | 10-Q | 2/8/05 | 10.01 | ||||||||
110
| Incorporated by Reference** | ||||||||||||
Exhibit Number | Exhibit Description | Form | Date | Number | Filed Herewith | |||||||
| 10.29 | Form of Performance Share Program pursuant to the 2003 Equity Incentive Plan (applicable to each of the 2010 and 2011 Performance Share Programs)* | 8-K | 1/29/10 | 10.1 | ||||||||
| 10.30 | Form of Performance Share Program pursuant to the 2003 Equity Incentive Plan (applicable to the 2012 Performance Share Program)* | 8-K | 1/26/12 | 10.2 | ||||||||
| 10.31 | Adobe Systems Incorporated Deferred Compensation Plan* | 10-K | 1/24/08 | 10.52 | ||||||||
| 10.32 | Adobe Systems Incorporated Executive Cash Performance Bonus Plan* | DEF 14A | 2/24/06 | Appendix B | ||||||||
| 10.33 | Second Amendment to Retention Agreement between Adobe Systems Incorporated and Shantanu Narayen, effective as of December 17, 2010* | 10-K | 1/27/11 | 10.40 | ||||||||
| 10.34 | Employment offer letter between Adobe Systems Incorporated and Richard Rowley, dated October 30, 2006* | 8-K | 11/16/06 | 10.1 | ||||||||
| 10.35 | Employment offer letter between Adobe Systems Incorporated and Mark Garrett dated January 5, 2007* | 8-K | 1/26/07 | 10.1 | ||||||||
| 10.36 | Credit Agreement, dated as of March 2, 2012, among Adobe Systems Incorporated and certain subsidiaries as Borrowers, The Royal Bank of Scotland PLC and U.S. Bank National Association as Co-Documentation Agents, JPMorgan Chase Bank, N.A., as Syndication Agent, Bank of America, N.A. as Administrative Agent and Swing Line Lender, and the Other Lenders Party Thereto | 8-K | 3/7/12 | 10.1 | ||||||||
| 10.37 | Purchase and Sale Agreement, by and between NP Normandy Overlook, LLC, as Seller and Adobe Systems Incorporated as Buyer, effective as of May 12, 2008 | 8-K | 5/15/08 | 10.1 | ||||||||
| 10.38 | Form of Director Annual Grant Stock Option Agreement used in connection with the 2003 Equity Incentive Plan* | 8-K | 12/20/10 | 99.8 | ||||||||
| 10.39 | Form of Director Initial Grant Restricted Stock Unit Award Agreement used in connection with the 2003 Equity Incentive Plan* | 8-K | 12/20/10 | 99.6 | ||||||||
| 10.40 | Form of Director Annual Grant Restricted Stock Unit Award Agreement used in connection with the 2003 Equity Incentive Plan* | 8-K | 12/20/10 | 99.7 | ||||||||
111
| Incorporated by Reference** | ||||||||||||
Exhibit Number | Exhibit Description | Form | Date | Number | Filed Herewith | |||||||
| 10.41 | 2009 Executive Annual Incentive Plan* | 8-K | 1/29/09 | 10.4 | ||||||||
| 10.42 | Omniture, Inc. 1999 Equity Incentive Plan, as amended (the “Omniture 1999 Plan”)* | S-1 | 4/4/06 | 10.2A | ||||||||
| 10.43 | Forms of Stock Option Agreement under the Omniture 1999 Plan* | S-1 | 4/4/06 | 10.2B | ||||||||
| 10.44 | Form of Stock Option Agreement under the Omniture 1999 Plan used for Named Executive Officers and Non-Employee Directors* | S-1 | 6/9/06 | 10.2C | ||||||||
| 10.45 | Omniture, Inc. 2006 Equity Incentive Plan and related forms* | 10-Q | 8/6/09 | 10.3 | ||||||||
| 10.46 | Omniture, Inc. 2007 Equity Incentive Plan and related forms* | 10-K | 2/27/09 | 10.9 | ||||||||
| 10.47 | Omniture, Inc. 2008 Equity Incentive Plan and related forms* | 10-K | 2/27/09 | 10.10 | ||||||||
| 10.48 | Visual Sciences, Inc. (formerly, WebSideStory, Inc.) Amended and Restated 2000 Equity Incentive Plan* | 10-K | 2/29/08 | 10.5 | ||||||||
| 10.49 | Visual Sciences, Inc. (formerly, WebSideStory, Inc.) 2004 Equity Incentive Award Plan (the “VS 2004 Plan”) and Form of Option Grant Agreement* | 10-K | 2/29/08 | 10.6 | ||||||||
| 10.50 | Form of Restricted Stock Award Grant Notice and Restricted Stock Award Agreement under the VS 2004 Plan* | 10-K | 2/29/08 | 10.6A | ||||||||
| 10.51 | Visual Sciences, Inc. (formerly, WebSideStory, Inc.) 2006 Employment Commencement Equity Incentive Award Plan and Form of Option Grant Agreement* | 10-K | 2/29/08 | 10.8 | ||||||||
| 10.52 | Avivo Corporation 1999 Equity Incentive Plan and Form of Option Grant Agreement* | 10-K | 2/29/08 | 10.7 | ||||||||
| 10.53 | Form of Performance Share Award Grant Notice and Performance Share Award Agreement pursuant to the 2003 Equity Incentive Plan* | 8-K | 1/28/13 | 10.3 | ||||||||
| 10.54 | Award Calculation Methodology to the 2010 Performance Share Program pursuant to the 2003 Equity Incentive Plan* | 8-K | 1/29/10 | 10.3 | ||||||||
| 10.55 | Fiscal Year 2010 Executive Annual Incentive Plan* | 8-K | 1/29/10 | 10.4 | ||||||||
112
| Incorporated by Reference** | ||||||||||||
Exhibit Number | Exhibit Description | Form | Date | Number | Filed Herewith | |||||||
| 10.56 | Day Software Holding AG International Stock Option/Stock Issuance Plan* | S-8 | 11/1/10 | 99.1 | ||||||||
| 10.57 | Day Interactive Holding AG U.S. Stock Option/ Stock Issuance Plan* | S-8 | 11/1/10 | 99.2 | ||||||||
| 10.58 | Form of RSU Grant Notice and Award Agreement pursuant to the 2005 Equity Incentive Assumption Plan* | 8-K | 1/28/13 | 10.7 | ||||||||
| 10.59 | Demdex, Inc. 2008 Stock Plan, as amended* | S-8 | 1/27/11 | 99.1 | ||||||||
| 10.60 | Award Calculation Methodology to the 2011 Performance Share Program pursuant to the 2003 Equity Incentive Plan* | 8-K | 1/28/11 | 10.3 | ||||||||
| 10.61 | 2011 Executive Cash Performance Bonus Plan* | 8-K | 1/28/11 | 10.4 | ||||||||
| 10.62 | 2011 Executive Annual Incentive Plan* | 8-K | 1/28/11 | 10.5 | ||||||||
| 10.63 | EchoSign, Inc. 2005 Stock Plan, as amended* | S-8 | 7/29/11 | 99.1 | ||||||||
| 10.64 | TypeKit, Inc. 2009 Equity Incentive Plan, as amended* | S-8 | 10/7/11 | 99.1 | ||||||||
| 10.65 | Auditude, Inc. 2009 Equity Incentive Plan, as amended* | S-8 | 11/18/11 | 99.1 | ||||||||
| 10.66 | Auditude, Inc. Employee Stock Option Plan, as amended* | S-8 | 11/18/11 | 99.2 | ||||||||
| 10.67 | Description of 2012 Director Compensation* | 10-K | 1/26/12 | 10.76 | ||||||||
| 10.68 | Adobe Systems Incorporated 2011 Executive Severance Plan in the Event of a Change of Control for Prior Participants* | 8-K | 12/15/11 | 10.1 | ||||||||
| 10.69 | Adobe Systems Incorporated 2011 Executive Severance Plan in the Event of a Change of Control* | 8-K | 12/15/11 | 10.2 | ||||||||
| 10.70 | Award Calculation Methodology to the 2012 Performance Share Program pursuant to the 2003 Equity Incentive Plan* | 8-K | 1/26/12 | 10.3 | ||||||||
| 10.71 | 2012 Executive Annual Incentive Plan* | 8-K | 1/26/12 | 10.4 | ||||||||
| 10.72 | Efficient Frontier, Inc. 2003 Stock Option/Stock Issuance Plan, as Amended and Restated* | S-8 | 1/27/12 | 99.1 | ||||||||
113
| Incorporated by Reference** | ||||||||||||
Exhibit Number | Exhibit Description | Form | Date | Number | Filed Herewith | |||||||
| 10.73 | Nomination and Standstill Agreement between the Company and the ValueAct Group dated December 4, 2012 | 8-K | 12/5/12 | 99.1 | ||||||||
| 10.74 | Behance, Inc. 2012 Equity Incentive Plan* | S-8 | 1/23/13 | 99.1 | ||||||||
| 10.75 | Amendment No. 1 to the Behance, Inc. 2012 Equity Incentive Plan* | S-8 | 1/23/13 | 99.2 | ||||||||
| 10.76 | 2013 Performance Share Program pursuant to the 2003 Equity Incentive Plan* | 8-K | 1/28/13 | 10.2 | ||||||||
| 10.77 | 2013 Executive Annual Incentive Plan* | 8-K | 1/28/13 | 10.5 | ||||||||
| 10.78 | Neolane 2008 Stock Option Plan* | S-8 | 8/27/13 | 99.1 | ||||||||
| 10.79 | 2012 Neolane Stock Option Plan for The United States* | S-8 | 8/27/13 | 99.2 | ||||||||
| 10.80 | Description of 2013 Director Compensation* | X | ||||||||||
| 10.81 | Description of 2014 Director Compensation* | X | ||||||||||
12.1 | Ratio of Earnings to Fixed Charges | X | ||||||||||
21 | Subsidiaries of the Registrant | X | ||||||||||
23.1 | Consent of Independent Registered Public Accounting Firm, KPMG LLP | X | ||||||||||
24.1 | Power of Attorney (set forth on the signature page to this Annual Report on Form 10-K) | X | ||||||||||
| 31.1 | Certification of Chief Executive Officer, as required by Rule 13a-14(a) of the Securities Exchange Act of 1934 | X | ||||||||||
| 31.2 | Certification of Chief Financial Officer, as required by Rule 13a-14(a) of the Securities Exchange Act of 1934 | X | ||||||||||
| 32.1 | Certification of Chief Executive Officer, as required by Rule 13a-14(b) of the Securities Exchange Act of 1934† | X | ||||||||||
| 32.2 | Certification of Chief Financial Officer, as required by Rule 13a-14(b) of the Securities Exchange Act of 1934† | X | ||||||||||
| 101.INS | XBRL Instance | X | ||||||||||
114
| Incorporated by Reference** | ||||||||||||
Exhibit Number | Exhibit Description | Form | Date | Number | ||||||||
| 10.5 | Forms of Stock Option Agreements used in connection with the 1996 Outside Directors Stock Option Plan* | S-8 | 6/16/00 | 4.8 | ||||||
| 10.6 | 1999 Nonstatutory Stock Option Plan, as amended* | S-8 | 10/29/01 | 4.6 | ||||||
| 10.7 | 2003 Equity Incentive Plan, as amended and restated* | 8-K | 4/20/10 | 10.1 | ||||||
| 10.8 | Form of Stock Option Agreement used in connection with the 2003 Equity Incentive Plan* | 8-K | 12/20/10 | 99.4 | ||||||
| 10.9 | Form of Indemnity Agreement* | 10-Q | 6/26/09 | 10.12 | ||||||
| 10.10 | Forms of Retention Agreement* | 10-K | 11/28/97 | 10.44 | ||||||
| 10.11 | Second Amended and Restated Master Lease of Land and Improvements by and between SMBC Leasing and Finance, Inc. and Adobe Systems Incorporated | 10-Q | 10/07/04 | 10.14 | ||||||
| 10.12 | Lease between Adobe Systems Incorporated and Selco Service Corporation, dated March 26, 2007 | 8-K | 3/28/07 | 10.1 | ||||||
| 10.13 | Participation Agreement among Adobe Systems Incorporated, Selco Service Corporation, et al. dated March 26, 2007 | 8-K | 3/28/07 | 10.2 | ||||||
| 10.14 | Form of Restricted Stock Unit Agreement used in connection with the Amended 1994 Performance and Restricted Stock Plan* | 8-K | 12/20/10 | 99.2 | ||||||
Filed
| Herewith | ||||||||||
| 10.15 | Form of Restricted Stock Unit Agreement used in connection with the 2003 Equity Incentive Plan* | 8-K | 12/20/10 | 99.3 | ||||||
| 10.16 | Form of Restricted Stock Agreement used in connection with the 2003 Equity Incentive Plan* | 10-Q | 10/07/04 | 10.11 | ||||||
| 10.17 | 2008 Executive Officer Annual Incentive Plan* | 8-K | 1/30/08 | 10.4 | ||||||
| 10.18 | 2005 Equity Incentive Assumption Plan, as amended* | 10-Q | 4/09/10 | 10.19 | ||||||
| 10.19 | Form of Stock Option Agreement used in connection with the 2005 Equity Incentive Assumption Plan* | 8-K | 12/20/10 | 99.10 | ||||||
| 10.20 | Allaire Corporation 1997 Stock Incentive Plan* | S-8 | 3/27/01 | 4.06 | ||||||
| 10.21 | Allaire Corporation 1998 Stock Incentive Plan* | S-8 | 3/27/01 | 4.07 | ||||||
| 10.22 | Allaire Corporation 2000 Stock Incentive Plan* | S-8 | 3/27/01 | 4.08 | ||||||
| 10.23 | Andromedia, Inc. 1999 Stock Plan* | S-8 | 12/07/99 | 4.09 | ||||||
| 10.24 | Blue Sky Software Corporation 1996 Stock Option Plan* | S-8 | 12/29/03 | 4.07 | ||||||
| 10.25 | Macromedia, Inc. 1999 Stock Option Plan* | S-8 | 8/17/00 | 4.07 | ||||||
| 10.26 | Macromedia, Inc. 1992 Equity Incentive Plan* | 10-Q | 8/03/01 | 10.01 | ||||||
| 10.27 | Macromedia, Inc. 2002 Equity Incentive Plan* | S-8 | 8/10/05 | 4.08 | ||||||
| 10.28 | Form of Macromedia, Inc. Stock Option Agreement* | S-8 | 8/10/05 | 4.09 | ||||||
| 10.29 | Form of Macromedia, Inc. Revised Non-Plan Stock Option Agreement* | S-8 | 11/23/04 | 4.10 | ||||||
| 10.30 | Form of Macromedia, Inc. Restricted Stock Purchase Agreement* | 10-Q | 2/08/05 | 10.01 | ||||||
| 10.31 | Adobe Systems Incorporated Form of Performance Share Program pursuant to the 2003 Equity Incentive Plan* | 8-K | 1/29/10 | 10.1 | ||||||
| 10.32 | Form of Award Grant Notice and Performance Share Award Agreement used in connection with grants under the Adobe Systems Incorporated 2008 Performance Share Program pursuant to the 2003 Equity Incentive Plan* | 8-K | 1/30/08 | 10.2 | ||||||
| 10.33 | 2008 Award Calculation Methodology Exhibit A to the 2008 Performance Share Program pursuant to the 2003 Equity Incentive Plan* | 8-K | 1/30/08 | 10.3 | ||||||
| 10.34 | Adobe Systems Incorporated Deferred Compensation Plan* | 10-K | 1/24/08 | 10.52 | ||||||
| 10.35 | Adobe Systems Incorporated 2007 Performance Share Program pursuant to the 2003 Equity Incentive Plan* | 8-K | 1/30/07 | 10.1 | ||||||
| 10.36 | Form of Award Grant Notice and Performance Share Award Agreement used in connection with grants under the Adobe Systems Incorporated 2007 Performance Share Program pursuant to the 2003 Equity Incentive Plan* | 8-K | 1/30/07 | 10.2 | ||||||
| 10.37 | Adobe Systems Incorporated 2007 Performance Share Program pursuant to the Amended 1994 Performance and Restricted Stock Plan* | 8-K | 1/30/07 | 10.3 | ||||||
| 10.38 | Form of Award Grant Notice and Performance Share Award Agreement used in connection with grants under the Adobe Systems Incorporated 2007 Performance Share Program pursuant to the Amended 1994 Performance and Restricted Stock Plan* | 8-K | 1/30/07 | 10.4 | ||||||
| 10.39 | Adobe Systems Incorporated Executive Cash Bonus Plan* | DEF 14A | 2/24/06 | Appendix B | ||||||
| 10.40 | Second Amendment to Retention Agreement between Adobe Systems Incorporated and Shantanu Narayen, effective as of December 17, 2010* | X | ||||||||
| 10.41 | Adobe Systems Incorporated Executive Severance Plan in the Event of a Change of Control* | X | ||||||||
| 10.42 | Employment offer letter between Adobe Systems Incorporated and Richard Rowley, dated October 30, 2006* | 8-K | 11/16/06 | 10.1 | ||||||
| 10.43 | Employment offer letter between Adobe Systems Incorporated and Mark Garrett dated January 5, 2007* | 8-K | 1/26/07 | 10.1 | ||||||
| 10.44 | Credit Agreement, dated as of February 16, 2007, among Adobe Systems Incorporated and Certain Subsidiaries as Borrowers; BNP Paribas, Keybank National Association, and UBS Loan Finance LLC as Co-Documentation Agents; JPMorgan Chase Bank, N.A. as Syndication Agent; Bank of America, N.A. as Administrative Agent and Swing Line Lender; the Other Lenders Party Thereto; and Banc of America Securities LLC and J.P. Morgan Securities Inc. as Joint Lead Arrangers and Joint Book Managers | 8-K | 8/16/07 | 10.1 | ||||||
| 10.45 | Amendment to Credit Agreement, dated as of August 13, 2007, among Adobe Systems Incorporated, as Borrower; each Lender from time to time party to the Credit Agreement; and Bank of America, N.A. as Administrative Agent | 8-K | 8/16/07 | 10.2 | ||||||
| 10.46 | Second Amendment to Credit Agreement, dated as of February 26, 2008, among Adobe Systems Incorporated, as Borrower; each Lender from time to time party to the Credit Agreement; and Bank of America, N.A. as Administrative Agent | 8-K | 2/29/08 | 10.1 | ||||||
| 10.47 | Purchase and Sale Agreement, by and between NP Normandy Overlook, LLC, as Seller and Adobe Systems Incorporated as Buyer, effective as of May 12, 2008 | 8-K | 5/15/08 | 10.1 | ||||||
| 10.48 | Form of Director Annual Grant Stock Option Agreement used in connection with the 2003 Equity Incentive Plan* | 8-K | 12/20/10 | 99.8 | ||||||
| 10.49 | Form of Director Initial Grant Restricted Stock Unit Agreement in connection with the 2003 Equity Incentive Plan* | 8-K | 12/20/10 | 99.6 | ||||||
| 10.50 | Form of Director Annual Grant Restricted Stock Unit Agreement in connection with the 2003 Equity Incentive Plan* | 8-K | 12/20/10 | 99.7 | ||||||
| 10.51 | Description of 2009 Director Compensation* | 10-K | 1/23/09 | 10.63 | ||||||
| 10.52 | 2009 Executive Annual Incentive Plan* | 8-K | 1/29/09 | 10.4 | ||||||
| 10.53 | Omniture, Inc. 1999 Equity Incentive Plan, as amended (the “Omniture 1999 Plan”)* | S-1 | 4/04/06 | 10.2A | ||||||
| 10.54 | Forms of Stock Option Agreement under the Omniture 1999 Plan* | S-1 | 4/04/06 | 10.2B |
| 10.55 | Form of Stock Option Agreement under the Omniture 1999 Plan used for Named Executive Officers and Non-Employee Directors* | S-1 | 6/09/06 | 10.2C | ||||||
| 10.56 | Omniture, Inc. 2006 Equity Incentive Plan and related forms* | 10-Q | 08/06/09 | 10.3 | ||||||
| 10.57 | Omniture, Inc. 2007 Equity Incentive Plan and related forms* | 10-K | 2/27/09 | 10.9 | ||||||
| 10.58 | Omniture, Inc. 2008 Equity Incentive Plan and related forms* | 10-K | 2/27/09 | 10.10 | ||||||
| 10.59 | Visual Sciences, Inc. (formerly, WebSideStory, Inc.) Amended and Restated 2000 Equity Incentive Plan* | 10-K | 2/29/08 | 10.5 | ||||||
| 10.60 | Visual Sciences, Inc. (formerly, WebSideStory, Inc.) 2004 Equity Incentive Award Plan (the “VS 2004 Plan”) and Form of Option Grant Agreement* | 10-K | 2/29/08 | 10.6 | ||||||
| 10.61 | Form of Restricted Stock Award Grant Notice and Restricted Stock Award Agreement under the VS 2004 Plan* | 10-K | 2/29/08 | 10.6A | ||||||
| 10.62 | Visual Sciences, Inc. (formerly, WebSideStory, Inc.) 2006 Employment Commencement Equity Incentive Award Plan and Form of Option Grant Agreement* | 10-K | 2/29/08 | 10.8 | ||||||
| 10.63 | Avivo Corporation 1999 Equity Incentive Plan and Form of Option Grant Agreement* | 10-K | 2/29/08 | 10.7 | ||||||
| 10.64 | The Touch Clarity Limited Enterprise Management Incentives Share Option Plan 2002* | S-8 | 3/16/07 | 99.5 | ||||||
| 10.65 | Forms of Agreements under The Touch Clarity Limited Enterprise Management Incentives Share Option Plan 2002* | S-8 | 3/16/07 | 99.6 | ||||||
| 10.66 | Description of 2010 Director Compensation* | 10-K | 1/22/10 | 10.71 | ||||||
| 10.67 | Form of Performance Share Program Award Grant Notice and Performance Share Award Agreement pursuant to the 2003 Equity Incentive Plan* | 8-K | 12/20/10 | 99.5 | ||||||
| 10.68 | 2010 Performance Share Program Award Calculation Methodology pursuant to the 2003 Equity Incentive Plan* | 8-K | 1/29/10 | 10.3 | ||||||
| 10.69 | Fiscal Year 2010 Executive Annual Incentive Plan* | 8-K | 1/29/10 | 10.4 | ||||||
| 10.70 | Day Software Holding AG International Stock Option/Stock Issuance Plan* | S-8 | 11/01/10 | 99.1 | ||||||
| 10.71 | Day Interactive Holding AG U.S. Stock Option/ Stock Issuance Plan* | S-8 | 11/01/10 | 99.2 | ||||||
| 10.72 | Form of Restricted Stock Unit Award Agreement used in connection with the 2005 Equity Incentive Assumption Plan* | 8-K | 12/20/10 | 99.9 | ||||||
| 101.SCH | XBRL Taxonomy Extension | X | ||||||||||
| 101.CAL | XBRL Taxonomy Extension | X | ||||||||||
| 101.LAB | XBRL Taxonomy Extension | X | ||||||||||
| 101.PRE | XBRL Taxonomy Extension | X | ||||||||||
| 101.DEF | XBRL Taxonomy Extension | X | ||||||||||
| * | Compensatory plan or arrangement. | |
| ** | References to Exhibits |
| † | The certifications attached as Exhibits 32.1 and 32.2 that accompany this Annual Report on Form 10-K are not deemed filed with the Securities and Exchange Commission and are not to be incorporated by reference into any filing of Adobe Systems Incorporated under the Securities Act of 1933, as amended, or the Securities Exchange Act of 1934, as amended, whether made before or after the date of this Form 10-K, irrespective of any general incorporation language contained in such filing. |
115