--12-31FY2023
UNITED STATES
SECURITIES AND EXCHANGE COMMISSION
Washington, D.C. 20549
FORM 10-K10-K/A
(Amendment No. 1)
ý
☒Annual Report Pursuant to Section 13 or 15(d) of the Securities Exchange Act of 1934
For the Fiscal Year Ended December 31, 20062023
or
☐ Transition Report Pursuant to Section 13 or 15(d) of the Securities Exchange Act of 1934 |
oTransition Report Pursuant to Section 13 or 15(d) ofFor the Securities Exchange Act of 1934
Commission File No. 0-15057

P.A.M. TRANSPORTATION SERVICES, INC.
(Exact name of registrant as specified in its charter)
Delaware | 0-1507 | 71-0633135 |
(State or other jurisdiction of incorporation or organization) | (Commission File Number) | (I.R.S. Employer Identification No.) |
297 West Henri De Tonti Blvd, Tontitown, Arkansas 72770
(Address of principal executive offices) (Zip Code)
(479) 361-9111
Registrant'sRegistrant’s telephone number, including area codecode: (479) 361-9111
| N/A |
| (Former name, former address and former fiscal year, if changed since last report) |
Securities registered pursuant to section 12(b) of the Act:
| Securities registered pursuant to Section 12(b) of the Act: | | |
| Title of each class | Trading Symbol(s) | Name of each exchange on which registered |
Common Stock, $.01 par value | PTSI | The NASDAQ StockGlobal Market LLC
|
Securities registered pursuant to section 12(g) of the Act: None
Indicate by check mark if the registrant is a well-known seasoned issuer, as defined in Rule 405 of the Securities Act.
Indicate by check mark if the registrant is not required to file reports pursuant to Section 13 or Section 15(d) of the Act.
Indicate by check mark whether the registrant (1) has filed all reports required to be filed by Section 13 or 15(d) of the Securities Exchange Act of 1934 during the preceding 12 months (or for such shorter period that the registrant was required to file such reports), and (2) has been subject to such filing requirements for the past 90 days.
Indicate by check mark if disclosure of delinquent filerswhether the registrant has submitted electronically every Interactive Data File required to be submitted pursuant to ItemRule 405 of Regulation S-K (Section 229.405S-T (§232.405 of this chapter) is not contained herein, and will not be contained,during the preceding 12 months (or for such shorter period that the registrant was required to the best of the registrant’s knowledge, in definitive proxy or information statements incorporated by reference in Part III of this Form 10-K or any amendment to this Form 10-K. osubmit such files).
Yes ☑ No ☐
Indicate by check mark whether the registrant is a large accelerated filer, an accelerated filer, or a non-accelerated filer.filer, a smaller reporting company, or an emerging growth company. See definitionthe definitions of “large accelerated filer,” “accelerated filer,” “smaller reporting company,” and large accelerated filer”“emerging growth company” in Rule 12b-2 of the Exchange Act. (Check one):
Large accelerated filer o ☐ | | Accelerated filer ☑ | |
| Non-accelerated filer ☐ | | Accelerated filer þSmaller reporting company ☑
Emerging growth company ☐ | | Non-accelerated filer o
|
If an emerging growth company, indicate by check mark if the registrant has elected not to use the extended transition period for complying with any new or revised financial accounting standards provided pursuant to Section 13(a) of the Exchange Act. ☐
Indicate by check mark whether the registrant has filed a report on and attestation to its management’s assessment of the effectiveness of its internal control over financial reporting under Section 404(b) of the Sarbanes-Oxley Act (15 U.S.C. 7262(b)) by the registered public accounting firm that prepared or issued its audit report. ☑
If securities are registered pursuant to Section 12(b) of the Act, indicate by check mark whether the financial statements of the registrant included in the filing reflect the correction of an error to previously issued financial statements. ☐
Indicate by check mark whether any of those error corrections are restatements that required a recovery analysis of incentive-based compensation received by any of the registrant’s executive officers during the relevant recovery period pursuant to §240.10D-1(b) . ☐
Indicate by check mark whether the registrant is a shell company (as defined in Rule 12b-2 of the Exchange Act).
The aggregate market value of the common stock of the registrant held by non-affiliates of the registrant computed by reference to the average of the closing bid and askedask prices of the common stock as of the last business day of the registrant's most recently completed second quarter was$130,771,476.160,431,964. Solely for the purposes of this response, the registrant has assumed, without admitting for any purpose, that all executive officers directors and beneficial owners of more than five percentdirectors of the registrant’s common stockregistrant, and no other persons, are considered the affiliates of the registrant at that date.
The number of shares outstanding of the issuer’sregistrant’s common stock, as of March 5, 2007:10,307,607April 19, 2024: 22,034,762 shares of $.01 par value common stock.
AuditorName – Grant Thornton LLP
AuditorFirmID – PCAOB ID Number 248
AuditorLocation – Tulsa, OK
DOCUMENTS INCORPORATED BY REFERENCE
PortionsNone.
EXPLANATORY NOTE
P.A.M. Transportation Services, Inc. (“P.A.M.,” the registrant’s definitive Proxy Statement“Company,” “we,” “our,” or “us”) is filing this Amendment No. 1 on Form 10-K/A (this “Amendment”) to amend the Company’s Annual Report on Form 10-K for its Annual Meetingthe fiscal year ended December 31, 2023, originally filed with the Securities and Exchange Commission (the “SEC”) on March 13, 2024 (the “Original Report”), to include the information required by Items 10 through 14 of Stockholders to be held in 2007 are incorporated by reference in answer to Part III of Form 10-K. This information was previously omitted from the Original Report in reliance on General Instruction G(3) to Form 10-K, which permits the information in the above referenced items to be incorporated in the Form 10-K by reference from the Company’s definitive proxy statement if such statement is filed no later than 120 days after the Company’s fiscal year-end. We are filing this report, withAmendment to provide the exceptioninformation required in Part III of Form 10-K because a definitive proxy statement containing such information regarding executive officers required under Itemwill not be filed by the Company within 120 days after the end of the fiscal year covered by the Original Report.
This Amendment amends and restates in their entirety Items 10, 11, 12, 13, and 14 of Part III of the Original Report. The cover page of the Original Report is also amended to delete the reference to the incorporation by reference of the Company’s definitive proxy statement. In addition, Item 15(a)(3) of Part IV of the Original Report has also been amended and supplemented to include our Certificate of Amendment of our Amended and Restated Certificate of Incorporation, filed with the Secretary of State of the State of Delaware on May 10, 2022, which was inadvertently omitted from the exhibit index in the Original Report, and our 2024 Equity Incentive Plan.
Except as described above, no other changes have been made to the Original Report, and this Amendment does not modify, amend or update in any way any of the financial or other information iscontained in the Original Report. This Amendment does not reflect events occurring after the date of the filing of the Original Report. Accordingly, this Amendment should be read in conjunction with the Original Report and with our filings with the SEC subsequent to the filing of the Original Report. Capitalized terms used in this Amendment and not otherwise defined herein have the meaning ascribed to such terms in the Original Report.
Pursuant to Rule 12b-15 under the Securities Exchange Act of 1934, as amended (the “Exchange Act”), this Amendment also contains new certifications pursuant to Sections 302 of the Sarbanes-Oxley Act of 2002, which are attached hereto. Because no financial statements have been included in Part I, Item 1.
FORWARD-LOOKING STATEMENTS
This Report contains forward-looking statements, including statements about our operatingthis Amendment and growth strategies, our expected financial positionthis Amendment does not contain or amend any disclosure with respect to Items 307 and operating results, industry trends, our capital expenditure308 of Regulation S-K under the Exchange Act, paragraphs 3, 4 and financing plans and similar matters. Such forward-looking statements are found throughout this Report, including under Item 1, Business, Item 1A, Risk Factors, Item 7, Management’s Discussion and Analysis of Financial Condition and Results of Operations, and Item 7A, Quantitative and Qualitative Disclosures About Market Risk. In those and other portions of this Report, the words “believe,” “may,” “will,” “estimate,” “continue,” “anticipate,” “intend,” “expect,” “project” and similar expressions, as they relate to us, our management, and our industry are intended to identify forward-looking statements. We have based these forward-looking statements largely on our current expectations and projections about future events and financial trends affecting our business. Actual results may differ materially. Some5 of the risks, uncertainties and assumptions about P.A.M. that may cause actual results to differ from these forward-looking statements are described under the headings “Risk Factors,” “Management’s Discussion and Analysiscertifications have been omitted.
All forward-looking statements attributable to us, or to persons acting on our behalf, are expressly qualified in their entirety by this cautionary statement.
We undertake no obligation to publicly update or revise any forward-looking statements, whether as a result of new information, future events or otherwise. In light of these risks and uncertainties, the forward-looking events and circumstances discussed in this Report might not transpire.
P.A.M. TRANSPORTATION SERVICES, INC.
AMENDMENT NO. 1 ON FORM 10-K10-K/A
For the fiscal year ended December 31, 20062023
TABLE OF CONTENTS
PART III| Item 10 | | | | Item 11 | | | | Item 12 | | | | Item 13 | | | | Item 14 | | | | | PART I
| Page | | Item 115 | | | 1 | | | 8 | | | 11 | | | 11 | | | 11 | | | 11 | | | | | | | PART II
| | | | | 12
|
| | 14 |
| | 15
|
| | 26 |
| | 27 |
| | 54
|
| | 54 |
| | 55 |
| | |
| PART III
| |
| | 56 |
| | 56 |
| | 56
|
| | 57 |
| | 57 |
| | |
| PART IV
| |
| | 58 |
| | |
| | 61 |
| | |
| | 62 |
Item 10. Directors, Executive Officers and Corporate Governance.
PART I
Directors
Our Board of Directors currently consists of nine directors. Members of our Board are elected annually to serve until the next annual meeting of stockholders or until their successors are elected and qualified. The biography of each of our directors and executive officers below contains information regarding the person’s service as director, business experience, director positions held currently or at any time during the last five years, and the experiences, qualifications, attributes or skills that caused the Board to determine that the person should serve as a director.
Unless
Michael D. Bishop, age 56, has been a director and a member of the context otherwise requires, all references in this Annual Report on Form 10-KAudit Committee since 2019. Mr. Bishop is the President and Founder of American General Counsel PLC, a law firm providing general counsel services to “P.A.M.,”businesses. From 2018 to 2020, Mr. Bishop was Co-President of iPSE-US, the “Company,” “we,” “our,” or “us” mean P.A.M. Transportation Services, Inc. and its subsidiaries.
We areAssociation of Independent Workers, an association dedicated to advancing the freedom an interests of America’s independent workers. Mr. Bishop served as a truckload dry van carrier transporting general commodities throughoutmember of the continental United States as well asCongress from 2014 to 2018. During his tenure in Congress, Mr. Bishop was appointed to and served on the Canadian provinces of OntarioHouse Ways and Quebec. We also provide transportation services in Mexico under agreements with Mexican carriers. Our freight consists primarily of automotive parts, consumer goods, such as general retail store merchandise,Means Committee, the Judiciary Committee and manufactured goods, such as heating and air conditioning units.
P.A.M. Transportation Services, Inc. is a holding company organized under the laws of the State of Delaware in June 1986 which conducts operations through the following wholly owned subsidiaries: P.A.M. Transport, Inc., T.T.X., Inc., P.A.M. Dedicated Services, Inc., P.A.M. Logistics Services, Inc., Choctaw Express, Inc., Choctaw Brokerage, Inc., Transcend Logistics, Inc., Allen Freight Services, Inc., Decker Transport Co., Inc., East Coast Transport and Logistics, LLC, S & L Logistics, Inc., P.A.M. International, Inc., P.A.M. Canada, Inc. and McNeill Express, Inc. Our operating authorities are held by P.A.M. Transport, Inc., P.A.M. Dedicated Services, Inc., Choctaw Express, Inc., Choctaw Brokerage, Inc., Allen Freight Services, Inc., T.T.X., Inc., Decker Transport Co., Inc., East Coast Transport and Logistics, LLC, and McNeill Express, Inc.
We are headquartered and maintain our primary terminal and maintenance facilities and our corporate and administrative offices in Tontitown, Arkansas, which is located in northwest Arkansas, a major center for the trucking industry and where the support services (including warranty repair services) for most major tractor and trailer equipment manufacturers are readily available.
In order to conform to industry practice, the Company began to classify fuel surcharges charged to customers as revenue rather than as a reduction of operating supplies expense as had been presented in reports prior to the period ended June 30, 2004. During 2006, the Company began to separately display as a line item “Fuel expense” for amounts paid for fuel which previously had been aggregated with other operating supplies and included in the line item “Operating supplies”. These reclassifications have had no effect on operating income, net income or earnings per share. The Company has made corresponding reclassifications to comparative periods shown.
Segment Financial Information
The Company's operations are all in the motor carrier segment and are aggregated into a single operating segment in accordance with the aggregation criteria presented in SFAS 131.
Operations
Our operations can generally be classified into truckload services or brokerage and logistics services. Truckload services include those transportation services in which we utilize company owned tractors or owner-operator owned tractors for the pickup and delivery of freight. The brokerage and logistics services consists of services such as transportation scheduling, routing, mode selection, transloading and other value added services related to the transportation of freight which may or may not involve the usage of company owned or owner-operator owned equipment. Both our truckload operations and our brokerage and logistics operations have similar economic characteristics and are impacted by virtually the same economic factors as discussed elsewhere in this Report. Truckload services operating revenues, before fuel surcharges represented 87.8%, 88.0%, and 86.4% of total operating revenues for the years ended December 31, 2006, 2005, and 2004, respectively. The remaining operating revenues, before fuel surcharge for the same periods were generated by brokerage and logistics services, representing 12.2%, 12.0%, and 13.6%, respectively. Approximately 99% of the Company's revenues are generated by operations conductedHigher Education Committee. Preceding his service in the United States Congress, Mr. Bishop was the Chief Legal Officer and allGeneral Counsel of International Bancard Company, a nation-wide financial services technology company. Prior to his role at International Bancard, Mr. Bishop was a Senior Attorney with Clark Hill PLC, an international law firm, where he concentrated in the areas of Public Policy and Business Law. Before joining Clark Hill PLC, Mr. Bishop was elected to and served in the Michigan State legislature from 1998 to 2010. During his tenure in the Michigan State legislature, Mr. Bishop was chosen to serve as the Senate Majority Leader and also served on various committees including chairing the Senate Banking and Financial Institutions Committee and the Constitutional Law and Ethics Committee. Mr. Bishop is a licensed real estate broker and an attorney licensed to practice law in the state of Michigan, the District of Columbia, and before the U.S. Supreme Court. He also serves as an Adjunct Professor of Law at the Thomas M. Cooley Law School. His thorough understanding of legal matters, public policy, financial analytics, and budgeting qualify him for service on the Board of PTSI.
Frederick P. Calderone, age 73, has been a director since 1998. Mr. Calderone retired in 2016 after over 20 years of service as a Vice President of a diversified holding company headquartered in Warren, Michigan. During his career, Mr. Calderone was widely recognized for his expertise in corporate, partnership and individual income tax matters; estate planning; tax planning for multinational businesses; mergers, acquisitions and commercial transactions; tax controversies and litigation; and corporate accounting. Prior to this time, Mr. Calderone was a partner with Deloitte, Haskins, & Sells, a predecessor to Deloitte LLP. Mr. Calderone is a certified public accountant, attorney and tax specialist with a long history of advising and providing executive oversight to transportation companies. Mr. Calderone has served as a director of Universal Logistics Holdings, Inc. (NASDAQ: ULH) since 2009. With his thorough understanding of financial reporting, generally accepted accounting principles, financial analytics, taxation and budgeting, Mr. Calderone brings to the Board a unique combination of expertise in accounting, strategic planning and finance.
W. Scott Davis, age 61, is Director of Partner Relations of Circumference Group, LLC, an investment management partnership, where he is responsible for business development and client relations. Prior to that, he served as Vice Chairman and Chief Financial Officer of Clearview International, LLC, a data center business headquartered in Dallas, Texas, until the company was sold in April 2016. He had been an investor in Clearview since June 2009. Mr. Davis was a Partner and Senior Managing Director of Rock Financial Partners, LLC from April 2009 to December 2013. From August 2006 to April 2009, he served as the President and sole owner of WS Davis, Inc., the company through which he performed his consulting work. From 1987 to 2006, Mr. Davis worked for Stephens Inc., an investment banking firm, including serving as an Executive Vice President of Stephens Inc. from 2002 to 2006. Mr. Davis has served as a director of PTSI since August 2007. He has extensive experience in the investment banking industry. He currently serves as Chairman of our Audit Committee. His extensive experience in financial statement analysis and review qualifies him to serve on the Board and as Chairman of the Company's assets areAudit Committee of PTSI.
Edwin J. Lukas, age 56, is the founder of Vistula PLC, a business law firm located orin Saint Clair Shores, Michigan. He is also a Strategic Partner with Aquila Equity Partners, a private investment firm located in Bloomfield Hills, Michigan. From 2016 to March 2020, Mr. Lukas served in an executive-level capacity with a diversified holding company based in Warren, Michigan, including as its Executive Vice President and General Counsel. Prior to this time, Mr. Lukas was a partner at Bodman PLC in Detroit, Michigan. Mr. Lukas is a graduate of the University of Pennsylvania and the University of Detroit School of Law, where he served as Editor-in-Chief of the University of Detroit Law Review. He has served as a director of PTSI since 2018. Mr. Lukas brings to our Board extensive experience in representing both public and private companies in corporate law, mergers and acquisitions, and capital markets transactions. His expertise in organizations, processes, strategies, and risk management supports our goal of strong Board and management accountability, transparency, and protection of stakeholder interests.
Franklin H. McLarty, age 49, is the Chairman and CEO of McLarty Diversified Holdings, a diversified holding company with investments in professional services, transportation, real estate, and media. Mr. McLarty founded McLarty Diversified Holdings in 2020. He also leads Coastal Automotive Group, an automotive retail operation that focuses on dealerships in Southern California and South Florida. He was previously the Executive Chairman and Director of MDH Acquisition Corp (NYSE: MDH.U) prior to its liquidation in 2022. Mr. McLarty was the co-founder of McLarty Capital Partners, now named Firmament, a private markets investment manager founded in June 2012; CapRocq, a real estate investment firm founded in September 2012 with significant experience as an owner-operator of high-quality office, mixed-use properties and automotive retail properties located in secondary and tertiary markets across the Southeast, Southcentral and Midwest regions otherwise known as the Heartland; and Southern United Auto Group, a growing automotive retail platform founded in June 2016 focused on the southeastern U.S. In addition, he was a founding executive of RML Automotive, where he served a tenure as CEO. Earlier in his career, Mr. McLarty worked in hotel-related private equity with McKibbon Hotel Group and The Seaway Group. Mr. McLarty has served on numerous advisory boards and boards of directors including Tire Group International, Palo Verde Holdings, The McLarty Companies and The Seaway Group. He also served on the board of, and was lead investor in, XTR, a premium documentary production company in Los Angeles. In 2007, he was appointed by then Governor Mike Beebe to the Arkansas Economic Development Commission and served as its Chairman in 2009. Mr. McLarty has served as a director and member of the Audit Committee of PTSI since 2014. Mr. McLarty’s extensive financial and transportation-related experience as an executive in the automotive industry and his insight into the Company’s customer base qualify him to serve on the Board of PTSI.
H. Pete Montaño, age 64, retired in 2018 as Vice President of Sales of Contract Freighters, Inc. (“CFI”), a trucking and logistics company which formerly operated as a division of Con-way, Inc. and XPO Logistics, Inc. As Vice President of Sales and Revenue Management for CFI, he oversaw sales in the United States.States, Canada and Mexico and was responsible for the strategic sales planning, account growth and training for all sales in the United States, Mexico and Canada as well as the pricing and bid departments. Mr. Montaño served over 28 years in various capacities with CFI, starting as Director of Sales for Mexico. Mr. Montaño brings significant industry experience and cross-border expertise to our board. Prior to his time at CFI, Mr. Montaño worked for Roadway Express, where he was in charge of sales for regions of the United States and Mexico. He currently serves as an advisory director of The Hawthorne Group, parent company of Melton Truck Lines, Inc., a private flatbed and step-deck carrier serving the United States, Canada, and Mexico. Mr. Montaño has served as a director and a member of the Audit Committee of PTSI since 2019. He is a dual citizen of the United States and Mexico and brings extensive sales and operational experience to the board and particular knowledge and insight relating to the Company’s Mexico operations. Mr. Montaño’s comprehensive cross-border and transportation-related experience qualify him to serve on the Board of PTSI.
Matthew J. Moroun, age 24, has been a director since 2020. He is also employed in other Moroun family-owned businesses engaged in transportation and business services. Mr. Moroun obtained a Bachelor of Business Administration in Finance from the Mendoza College of Business at the University of Notre Dame in December 2021. Mr. Moroun has served as a director of Universal Logistics Holdings, Inc. (NASDAQ: ULH) since 2020. Matthew J. Moroun is the son of our Chairman, Matthew T. Moroun. We believe Mr. Moroun offers the Board a unique perspective on the Company’s strategic challenges and opportunities and will advance the long-term interests of our shareholders.
Matthew T. Moroun, age 50, is Chairman of our Board of Directors. He currently serves as Chairman and President of a diversified holding company based in Warren, Michigan. He is also Chairman of an insurance and real estate holding company based in Sterling Heights, Michigan. Mr. Moroun owns or controls other privately-held businesses engaged in transportation services and real estate acquisition, development, and management. Mr. Moroun has served as a director of the Company since 1992 and as our Chairman since 2007. He is currently Chairman of our Executive Committee and Chairman of our Compensation and Stock Option Committee and served as our interim President and Chief Executive Officer from May 2020 to August 2020. Mr. Moroun has served as a director and as Chairman of the Board of Universal Logistics Holdings, Inc. (NASDAQ: ULH) since 2004. Matthew T. Moroun is the father of Matthew J. Moroun, a member of our Board of Directors. Mr. Moroun’s long-term, substantive leadership experience allows him to provide operational, financial, business, capital markets, and strategic expertise to our Board. He possesses first-hand knowledge of the best practices and trends for our industry. His perspective and practical insight on transportation, automotive, real estate development, infrastructure, and government relations enhance the Board’s ability to oversee and direct our strategy, business planning, and execution.
Business
Joseph A. Vitiritto, age 53, has served as President and Growth StrategyChief Executive Officer since August 2020. Prior to his employment with the Company, Mr. Vitiritto served as Senior Vice President of Pricing and Network Design for Knight-Swift Transportation Holdings, Inc. (“Knight-Swift”) since May 2019. Prior to assuming that role, Mr. Vitiritto served in various managerial capacities for Knight-Swift and its predecessor, Knight Transportation, Inc., beginning in 2003, including most recently as Senior Vice President of Operations – Swift Transition Team and Senior Vice President of Human Resources. These experiences and his knowledge of the day-to-day operations and management of the Company qualify him to serve on the Board of PTSI.
Executive Officers
Our strategy focuses on the following elements:current executive officers are Joseph A. Vitiritto and Lance K. Stewart.
Maintaining Dedicated Fleets in High Density Lanes. We strive to maximize utilizationLance K. Stewart, age 55, has served as Vice President of Finance, Chief Financial Officer and increase revenue per tractor while minimizing our time and empty miles between loads. In this regard, we seek to provide dedicated equipment to our customers where possible and to concentrate our equipment in defined regions and disciplined traffic lanes. Dedicated fleets in high density lanes enable us to:
·maintain more consistent equipment capacity;
·provide a high level of service to our customers, including time-sensitive delivery schedules;
·attract and retain drivers; and
·maintain a sound safety record as drivers travel familiar routes.
Providing Superior and Flexible Customer Service. Our wide range of services includes dedicated fleet services, logistics services, “just-in-time” delivery, two-man driving teams, cross-docking and consolidation programs, specialized trailers, and Internet-based customer access to delivery status. These services, combined with a decentralized regional operating strategy, allow us to quickly and reliably respond to the diverse needs of our customers, and provide an advantage in securing new business. We also maintain ISO 9002 certification to ensure that we operate in accordance with approved quality assurance standards.
Many of our customers depend on us to make delivery on a “just-in-time” basis, meaning that parts or raw materials are scheduled for delivery as they are needed on the manufacturer’s production line. The need for this service is a product of modern manufacturing and assembly methods that are designed to drastically decrease inventory levels and handling costs. Such requirements place a premium on the freight carrier’s delivery performance and reliability.
Employing Stringent Cost Controls. We focus intently on controlling our costs while not sacrificing customer service. We maintain this balance by scrutinizing all expenditures, minimizing non-driver personnel, operating a late-model fleet of tractors and trailers to minimize maintenance costs, and adopting new technology only when proven and cost justified.
Making Strategic Acquisitions. We continually evaluate strategic acquisition opportunities, focusing on those that complement our existing business or that could profitably expand our business or services. Our operational integration strategy is to centralize administrative functions of acquired businesses at our headquarters, while maintaining the localized operations of acquired businesses. We believe that allowing acquired businesses to continue to operate under their pre-acquisition names and in their original regions allows such businesses to maintain driver loyalty and customer relationships.
Industry
The U.S. market for truck-based transportation services is estimated to be approximately $600 billion in annual revenue. The truckload industry is highly fragmented and is impacted by several economic and business factors, many of which are beyond the control of individual carriers. The stateTreasurer of the economy, coupled with equipment capacity levels, can impact freight rates. VolatilityCompany since April 2023. Mr. Stewart served as interim Chief Financial Officer and Treasurer in March 2023 and served as Vice President of various operating expenses, such as fuel and insurance, make the predictability of profit levels unclear. Availability, attraction, retention and compensation for drivers affect operating costs, as well as equipment utilization. In addition, the capital requirements for equipment, coupled with potential uncertainty of used equipment values, impact the ability of many carriers to expand their operations. The current operating environment is characterized by the following:
·Price increases by tractor and trailer equipment manufacturers, rising fuel costs, and intense competition for drivers.
·In the last few years, many less profitable or undercapitalized carriers have been forced to consolidate or to exit the industry.
Competition
The trucking industry is highly competitive and includes thousands of carriers, none of which dominates the market in which the Company operates. The Company's market share is less than 1% and we compete primarily with other irregular route medium- to long-haul truckload carriers, with private carriage conducted by our existing and potential customers, and, to a lesser extent, with the railroads. Increased competition has resulted from deregulation of the trucking industry. We compete on the basis of quality of service and delivery performance, as well as price. Many of the other irregular route long-haul truckload carriers have substantially greater financial resources, own more equipment or carry a larger total volume of freight.
Marketing and Significant Customers
Our marketing emphasis is directed to that portion of the truckload market which is generally service-sensitive, as opposed to being solely price competitive. We seek to become a “core carrier” for our customers in order to maintain high utilization and capitalize on recurring revenue opportunities. Our marketing efforts are diversified and designed to gain access to dedicated fleet services (including those in Mexico and Canada), domestic regional freight traffic, and cross-docking and consolidation programs.
Our marketing efforts are conducted by a sales staff of seven employees who are located in our major markets and supervised from our headquarters. These individuals work to improve profitability by maintaining an even flow of freight traffic (taking into account the balance between originations and destinations in a given geographical area) and high utilization, and minimizing movement of empty equipment.
Our five largest customers, for which we provide carrier services covering a number of geographic locations, accounted for approximately 59%, 57% and 62% of our total revenues in 2006, 2005 and 2004, respectively. General Motors Corporation accounted for approximately 41%, 39% and 44%of our revenues in 2006, 2005 and 2004, respectively.
We also provide transportation services to other manufacturers who are suppliers for automobile manufacturers. Approximately 52%, 52% and 56% of our revenues were derived from transportation services provided to the automobile industry during 2006, 2005 and 2004, respectively. This portion of our business, however, is spread over 19 assembly plants and over 60 suppliers/vendors located throughout North America, which we believe reduces the risk of a material loss of business.
Revenue Equipment
At December 31, 2006, we operated a fleet of 1,998 tractors and 4,540 trailers. We operate late-model, well-maintained premium tractors to help attract and retain drivers, promote safe operations, minimize maintenance and repair costs, and improve customer service by minimizing service interruptions caused by breakdowns. We evaluate our equipment decisions based on factors such as initial cost, useful life, warranty terms, expected maintenance costs, fuel economy, driver comfort, customer needs, manufacturer support, and resale value. Our current policy is to replace most of our tractors at 500,000 miles, which normally occurs 30 to 48 months after purchase.
We historically have contracted with owner-operators to provide and operate a small portion of our tractor fleet. Owner-operators provide their own tractors and are responsible for all associated expenses, including financing costs, fuel, maintenance, insurance, and taxes. We believe that a combined fleet complements our recruiting efforts and offers greater flexibility in responding to fluctuations in shipper demand. At December 31, 2006 the Company's tractor fleet included 49 owner-operator tractors.
During 1999, the U.S. Environmental Protection Agency (“EPA”) proposed a three-phase strategy to reduce engine emissions from heavy-duty vehicles through a combination of advanced emissions control technologies and diesel fuel with a reduced sulfur content. Each phase and its effect on the Company’s operations, if known, are described below.
The first phase mandated new engine emission standards for all model year 2004 heavy-duty trucks, however, through agreements with heavy-duty diesel engine manufacturers, the effective date was accelerated to October 1, 2002. Therefore, effective October 1, 2002, all newly manufactured truck engines had to comply with the new engine emission standards. All truck engines manufactured prior to October 1, 2002 were not subject to these new standards. As of December 31, 2006, substantially allof our Company-owned truck fleet consisted of trucks with engines that comply with these emission standards. The Company has experienced a reduction in fuel efficiency and increased depreciation expense due to the higher cost of tractors with these new engines.
In the second phase, effective January 1, 2007, the EPA mandated a new set of more stringent emissions standards for vehicles powered by diesel fuel engines manufactured in 2007 through 2009. These new engines have been designed for and require the use of a more costly type of fuel known as ultra-low-sulfur-diesel (“ULSD”) which, according to EPA estimates, will cost from $.04 to $.05 more per gallon due to increased refining costs. The EPA has also mandated that refiners and importers nationwide must ensure that at least 80% of the volume of the highway diesel fuel they produce or import is ULSD-compliant by June 1, 2006, however, the EPA does not require service stations and truck stops to sell ULSD fuel. Therefore, it is possible that ULSD fuel might not be available in a particular area in which the Company operates. The Company’s current tractor fleet can be fueled with either ULSD or low-sulfur diesel (“LSD”) but future purchases of tractors which contain 2007 or later diesel engines will require the use of ULSD fuel which may result in lower fuel economy as the process that removes sulfur can also reduce the energy content of the fuel. During 2007, the Company expects to take delivery of its remaining 2006 tractor orders of approximately 350 tractors which will contain the 2006 diesel engines and does not expect to purchase tractors with the 2007 diesel engines until the second half of 2007. Compared to our current tractor fleet, we expect that tractors powered by the 2007 diesel engines will have an increased purchase price of approximately 10% and as a result, we expect that depreciation expense will increase as we replace older tractors with tractors powered by the 2007 diesel engines. We also expect that these engines will result in higher maintenance costs and be less fuel efficient. To the extent we are unable to offset these anticipated increased costs with rate increases charged to customers or offsetting cost savings in other areas, our results of operations would be adversely affected.
During the third phase, effective in 2010, final emission standards become effective and LSD fuel will no longer be available for highway use. The EPA requires that by June 1, 2010 all diesel fuel imported or produced must be ULSD-compliant as it phases out low-sulfur-diesel fuel availability by December 1, 2010 when all highway diesel fuel must be ULSD fuel. We are unable at this time to determine the increase in acquisition and operating costs of the final 2010 EPA-compliant engines but we expect that the engines produced under the final standards will be less fuel-efficient and have higher acquisition and maintenance costs than either the 2002 or 2007 engines.
Technology
We have installed Qualcomm Omnitracs™ display units in all of our tractors. The Omnitracs system is a satellite-based global positioning and communications system that allows fleet managers to communicate directly with drivers. Drivers can provide location status and updates directly to our computer which increases productivity and convenience. The Omnitracs system provides us with accurate estimated time of arrival information, which optimizes load selection and service levels to our customers. In order to optimize our tractor-to-trailer ratio, we have also installed Qualcomm TrailerTracs™ tracking units in all of our trailers. The TrailerTracs system is a trailer tracking product that enables us to more efficiently track the location of trailers in our inventory. During 2006, the Company began replacing its current tethered TrailerTracs units, which were unable to transmit data unless connected to Qualcomm-equipped tractors, with more advanced untethered TrailerTracs units which are able to operate and transmit data independent of a tractor connection. At December 31, 2006, approximately one-halfOperations of the Company’s trailer fleet has been fitted with these new untethered devicesprimary operating subsidiary, P.A.M. Transport, Inc., from 2020 to April 2023. He served as Vice President of Accounting of P.A.M. Transport from 2016 until 2020. Mr. Stewart previously served as Vice President of Finance, Chief Financial Officer, Secretary and Treasurer of the Company intends to install these new devices on its remaining trailer fleet during 2007.from 2010 until 2013 and as Vice President of Accounting and Controller of P.A.M. Transport from 2002 until 2010. He began his career with P.A.M. Transport in 1989 and served in various capacities before becoming Vice President of Accounting in 2002.
Our computer system manages the information provided by the Qualcomm devices to provide us real-time information regarding the location, status and load assignment of all of our equipment, which permits us to better meet delivery schedules, respond to customer inquiries and match equipment with the next available load. Our system also provides electronically to our customers real-time information regarding the status of freight shipments and anticipated arrival times. This system provides our customers flexibility and convenience by extending supply chain visibility through electronic data interchange, the Internet and e-mail.Delinquent Section 16(a) Reports
Maintenance
We have a strictly enforced comprehensive preventive maintenance program for our tractors and trailers. Inspections and various levels of preventive maintenance are performed at set mileage intervals on both tractors and trailers. A maintenance and safety inspection is performed on all vehicles each time they return to a terminal.
Our tractors carry full warranty coverage for at least three years or 350,000 miles. Extended warranties are negotiated with the tractor manufacturer and manufacturers of major components, such as engine, transmission and differential manufacturers, for up to four years or 500,000 miles. Trailers carry full warranties by the manufacturer and major component manufacturers for up to five years.
Employees
At December 31, 2006, we employed 3,062 persons, of whom 2,550 were drivers, 136 were maintenance personnel, 224 were employed in operations, 17 were employed in marketing, 66 were employed in safety and personnel, and 69 were employed in general administration and accounting. None of our employees are represented by a collective bargaining unit and we believe that our employee relations are good.
Drivers
At December 31, 2006, we utilized 2,550 company drivers in our operations. We also had 49 owner-operators under contract compensated on a per mile basis. Our drivers are compensated on the basis of miles driven, loading and unloading, extra stops and layovers in transit. Drivers can earn bonuses by recruiting other qualified drivers who become employed by us and both cash and non-cash prizes are awarded for consecutive periods of safe, accident-free driving. All of our drivers are recruited, screened, drug tested and trained and are subject to the control and supervision of our operations and safety departments. Our driver training program stresses the importance of safety and reliable, on-time delivery. Drivers are required to report to their driver managers daily and at the earliest possible moment when any condition en route occurs that might delay their scheduled delivery time.
In addition to strict application screening and drug testing, before being permitted to operate a vehicle our drivers must undergo classroom instruction on our policies and procedures, safety techniques as taught by the Smith System of Defensive Driving, the proper operation of equipment, and must pass both written and road tests. Instruction in defensive driving and safety techniques continues after hiring, with seminars at several of our terminals. At December 31, 2006, we employed 66 persons on a full-time basis in our driver recruiting, training and safety instruction programs.
Intense competition in the trucking industry for qualified drivers over the last several years, along with difficulties and added expense in recruiting and retaining qualified drivers, has had a negative impact on the industry. Our operations have also been impacted and from time to time we have experienced under-utilization and increased expenses due to a shortage of qualified drivers. We place a high priority on the recruitment and retention of an adequate supply of qualified drivers.
Executive Officers of the Registrant
Our executive officers are as follows:
Name | Age | Position with Company | Years of Service With P.A.M. |
| Robert W. Weaver | 57 | President and Chief Executive Officer | 24 |
| W. Clif Lawson | 53 | Executive Vice President and Chief Operating Officer | 22 |
| Larry J. Goddard | 48 | Vice President - Finance, Chief Financial Officer, Secretary and Treasurer | 19 |
Each of our executive officers has held his present position with the Company for at least the last five years. The Company has entered into an employment agreement with Robert W. Weaver that expires on July 10, 2009. The Company has the option to extend the employment agreement for two consecutive years following the July 10, 2009 expiration date for an additional one year at a time. The Company has also entered into employment agreements with both W. Clif Lawson and Larry J. Goddard which each expire on June 1, 2010. The Company has the option to extend these employment agreements for one additional year following the June 1, 2010 expiration date.
Internet Web Site
The Company maintains a web site where additional information concerning its business can be found. The address of that web site is www.pamt.com. The Company makes available free of charge on its Internet web site its Annual Report on Form 10-K, quarterly reports on Form 10-Q, current reports on Form 8-K, and amendments to those reports filed or furnished pursuant to Section 13(a) or 15(d)16(a) of the Securities Exchange Act of 1934 (the “Exchange Act”) as soon as reasonably practicable after it electronically files or furnishes such materials to the Securitiesrequires our directors, executive officers and Exchange Commission.
Seasonality
Our revenues do not exhibit a significant seasonal pattern due primarily to our varied customer mix. Operating expenses can be somewhat higher in the winter months primarily due to decreased fuel efficiency and increased maintenance costs associated with inclement weather. In addition, the automobile plants for which we transport a large amount of freight typically utilize scheduled shutdowns of two weeks in July and one week in December and the volume of freight we ship is reduced during such scheduled plant shutdowns.
Regulation
We are a common and contract motor carrier regulated by various federal and state agencies. We are subject to safety requirements prescribed by the U.S. Department of Transportation (“DOT”). Such matters as weight and dimension of equipment are also subject to federal and state regulations. Allpersons who own more than 10% of our drivers are requiredoutstanding common stock to obtain national driver’s licenses pursuant to the regulations promulgated by the DOT. Also, DOT regulations impose mandatory drug and alcohol testing of drivers. We believe that we are in compliance in all material respects with applicable regulatory requirements relating to our trucking business and operate with a “satisfactory” rating (the highest of three grading categories) from the DOT.
Our motor carrier operations are also subject to environmental laws and regulations, including laws and regulations dealing with underground fuel storage tanks, the transportation of hazardous materials and other environmental matters, and our operations involve certain inherent environmental risks. We maintain four bulk fuel storage and fuel islands. Our operations involve the risks of fuel spillage or seepage, environmental damage, and hazardous waste disposal, among others. We have instituted programs to monitor and control environmental risks and assure compliance with applicable environmental laws. As part of our safety and risk management program, we periodically perform internal environmental reviews so that we can achieve environmental compliance and avoid environmental risk. We transport a minimum amount of environmentally hazardous substances and, to date, have experienced no significant claims for hazardous materials shipments. If we should fail to comply with applicable regulations, we could be subject to substantial fines or penalties and to civil and criminal liability.
Company operations conducted in industrial areas, where truck terminals and other industrial activities are conducted, and where groundwater or other forms of environmental contamination have occurred, potentially expose us to claims that we contributed to the environmental contamination.
We believe we are currently in material compliance with applicable laws and regulations and that the cost of compliance has not materially affected results of operations.
In addition to environmental regulations directly affecting our business, we are also subject to the effects of new tractor engine design requirements implemented by the EPA. See "Revenue Equipment", above.
The Federal Motor Carrier Safety Administration ("FMCSA") issued a final rule on April 24, 2003 that made several changes to the regulations that govern truck drivers' hours of service ("HOS"). These new federal regulations became effective on January 4, 2004. On July 16, 2004, the U.S. Circuit Court of Appeals for the District of Columbia rejected these new hours of service rules for truck drivers that had been in place since January 2004 because it said the FMCSA had failed to address the impact of the rules on the health of drivers as required by Congress. In addition, the judge's ruling noted other areas of concern including the increase in driving hours from 10 hours to 11 hours, the exception that allows drivers in trucks with sleeper berths to split their required rest periods, the new rule allowing drivers to reset their 70-hour clock to 0 hours after 34 consecutive hours off duty, and the decision by the FMCSA not to require the use of electronic onboard recorders to monitor driver compliance. On September 30, 2004, the extension of the Federal highway bill signed into law by the President of the United States extended the current hours of service rules for one year or until the FMCSA developed a new set of regulations, whichever came first. On January 24, 2005, the FMCSA re-proposed its April 2003 HOS rules, adding references to how the rules would affect driver
health, but making no changes to the regulations. The FMCSA sought public comments by March 10, 2005 on what changes to the rule, if any, were necessary to respond to the concerns raised by the court, and to provide data or studies that would support changes to, or continued use of, the 2003 rule. Effective October 1, 2005, the April 2003 HOS rules became effective with the most significant change requiring drivers that utilize the sleeper berth provision to take at least eight consecutive hours in the sleeper berth during their ten hours off-duty. Under previous regulations, drivers were allowed to split their ten hour off-duty time in the sleeper berth into two periods, provided neither period was less than two hours. This more restrictive sleeper berth provision may impact multiple-stop shipments and those shipments incurring delays in loading or unloading. Improper planning on such shipments could result in delivery delays and equipment utilization inefficiencies.
Set forth below and elsewhere in this Report and in other documents we file with the SEC initial reports of ownership and reports of changes in ownership of our common stock. Executive officers, directors and greater than 10% stockholders are risksalso required to furnish us with copies of the reports that they file. To our knowledge, based solely on a review of the copies of the reports furnished to us and uncertaintiesrepresentations received from our directors and executive officers, we believe that could causeall reports required to be filed under Section 16(a) for 2023 were timely filed, except that one Form 4 each for Joseph A. Vitiritto and Allen W. West were not filed timely, each reporting an award of restricted shares.
Code of Ethics
We have adopted a written code of ethics that applies to all our actual resultsdirectors, officers and employees, including our CEO and our chief financial and accounting officer. We have posted a copy of our Code of Ethics on our website at www.pamtransport.com under the caption “Investors.” In addition, we intend to differ materially from the results contemplated by the forward-looking statements contained in this Report.
Our business is subject to general economic and business factorspost on our website all disclosures that are largely outrequired by law or NASDAQ listing standards concerning any amendments to, or waivers from, any provision of our control, any of which could have a material adverse effect on our operating results.the code.
These factors include significant increases or rapid fluctuations in fuel prices, excess capacity in the trucking industry, surpluses in the market for used equipment, interest rates, fuel taxes, license and registration fees, insurance premiums, self-insurance levels, and difficulty in attracting and retaining qualified drivers and independent contractors.
We are also affected by recessionary economic cycles and downturns in customers’ business cycles, particularly in market segments and industries, such as the automotive industry, where we have a significant concentration of customers. Economic conditions may adversely affect our customers and their ability to pay for our services.
We operate in a highly competitive and fragmented industry, and our business may suffer if we are unable to adequately address downward pricing pressures and other factors that may adversely affect our ability to compete with other carriers.
Numerous competitive factors could impair our ability to maintain our current profitability. These factors include, but are not limited to, the following:
·we compete with many other truckload carriers of varying sizes and, to a lesser extent, with less-than-truckload carriers and railroads, some of which have more equipment and greater capital resources than we do;
·some of our competitors periodically reduce their freight rates to gain business, especially during times of reduced growth rates in the economy, which may limit our ability to maintain or increase freight rates, maintain our margins or maintain significant growth in our business;
·many customers reduce the number of carriers they use by selecting so-called “core carriers” as approved service providers, and in some instances we may not be selected;
·many customers periodically accept bids from multiple carriers for their shipping needs, and this process may depress freight rates or result in the loss of some of our business to competitors;
·the trend toward consolidation in the trucking industry may create other large carriers with greater financial resources and other competitive advantages relating to their size and with whom we may have difficulty competing;
·advances
Director Nominating Process
Our Board does not have a nominating committee that nominates candidates for election to our Board. That function is performed by our Board of Directors. Each member of our Board participates in technology require increased investmentsthe consideration of director nominees. Our Board of Directors believes that it can adequately fulfill the functions of a nominating committee without having to remain competitive,appoint an additional committee to perform that function. Our Board of Directors believes that not having a separate nominating committee saves the administrative expense that would be incurred in maintaining such a committee, and saves time for directors who would serve on a nominating committee if it were established. As there is no nominating committee, we do not have a nominating committee charter.
At least a majority of our customers may notindependent directors participate in the consideration of director nominees. These directors are independent, as independence for nominating committee members is defined in the NASDAQ listing standards. However, so long as the Company continues to be willing to accept higher freight rates to covera controlled company (within the costmeaning of these investments;
·competition from Internet-based and other logistics and freight brokerage companies may adversely affect our customer relationships and freight rates; and
·economiesNASDAQ Rule 5615(c)(1)), the Board of scale thatDirectors may be passed onguided by the recommendations of the Company’s controlling stockholders in its nominating process. After discussion and evaluation of potential nominees, the full Board of Directors selects the director nominees.
Our Board will consider as potential nominees persons recommended by stockholders. Recommendations should be submitted to smaller carriersour Board of Directors in care of our Secretary, Tyler Majors, at Post Office Box 188, Tontitown, Arkansas 72770. Each recommendation should include a personal biography of the suggested nominee, a description of the background or experience that qualifies the person for consideration, and a statement that the person has agreed to serve if nominated and elected. If a stockholder desires to nominate a director candidate for election at the Annual Meeting but does not intend to recommend the candidate for consideration as part of the Board’s slate of director nominees, such stockholder must comply with the procedural and informational requirements described in Section 1.11 of our Bylaws. A copy of our Bylaws may be obtained upon written request to our Secretary.
Our Board has used an informal process to identify potential candidates for nomination as directors. Candidates for nomination have been recommended by procurement aggregation providers may improve their abilityan executive officer or director, and considered by our Board of Directors. Generally, candidates have been known to compete with us.
We are highly dependent on our major customers, the loss of one or more of which could haveour Board members. Our Board of Directors has not adopted specific minimum qualifications that it believes must be met by a material adverse effect on our business.
A significant portion of our revenue is generated from our major customers. For 2006, our top five customers, based on revenue, accountedperson it recommends for approximately 59% of our revenue, and our largest customer, General Motors Corporation, accounted for approximately 41% of our revenue. We also provide transportation services to other manufacturers who are suppliers for automobile manufacturers. As a result, concentration of our business within the automobile industry is greater than the concentration in a single customer. Approximately 52% of our revenues for 2006 were derived from transportation services provided to the automobile industry.
Generally, we do not have long-term contractual relationships with our major customers, and we cannot assure that our customer relationships will continue as presently in effect. A reduction in or termination of our services by our major customers could have a material adverse effect on our business and operating results.
Ongoing insurance and claims expenses could significantly reduce our earnings.
Our future insurance and claims expenses might exceed historical levels, which could reduce our earnings. The Company is self insured for health and workers compensation insurance coverage up to certain limits. If medical costs continue to increase, or if the severity or number of claims increase, and if we are unable to offset the resulting increases in expenses with higher freight rates, our earnings could be materially and adversely affected.
We may be unable to successfully integrate businesses we acquire into our operations.
Integrating businesses we acquire may involve unanticipated delays, costs or other operational or financial problems. Successful integration of the businesses we acquire depends on a number of factors, including our ability to transition acquired companies to our management information systems. In integrating businesses we acquire, we may not achieve expected economies of scale or profitability or realize sufficient revenues to justify our investment. We also face the risk that an unexpected problem at one of the companies we acquire will require substantial time and attention from senior management, diverting management’s attention from other aspects of our business. We cannot be certain that our management and operational controls will be able to support us as we grow.
Difficulty in attracting drivers could affect our profitability and ability to grow.
Periodically, the transportation industry experiences difficulty in attracting and retaining qualified drivers, including independent contractors, resulting in intense competition for drivers. We have from time to time experienced under-utilization and increased expenses due to a shortage of qualified drivers. If we are unable to continue to attract drivers and contract with independent contractors, we could be required to further adjust our driver compensation package or let trucks sit idle, which could adversely affect our growth and profitability.
If we are unable to retain our key employees, our business, financial condition and results of operations could be harmed.
We are highly dependent upon the services of the following key employees: Robert W. Weaver, our President and Chief Executive Officer; W. Clif Lawson, our Executive Vice President and Chief Operating Officer; and Larry J. Goddard, our Vice President and Chief Financial Officer. We do not maintain key-man life insurance on any of these executives. The loss of any of their services could have a material adverse effect on our operations and future profitability. We must continue to develop and retain a core group of managers if we are to realize our goal of expanding our operations and continuing our growth. We cannot assure that we will be able to do so.
We have significant ongoing capital requirements that could affect our profitability if we are unable to generate sufficient cash from operations.
The trucking industry is very capital intensive. If we are unable to generate sufficient cash from operations in the future, we may have to limit our growth, enter into financing arrangements, or operate our revenue equipment for longer periods, any of which could have a material adverse affect on our profitability.
Our operations are subject to various environmental laws and regulations, the violation of which could result in substantial fines or penalties.
We are subject to various environmental laws and regulations dealing with the handling of hazardous materials, underground fuel storage tanks, and discharge and retention of stormwater. We operate in industrial areas, where truck terminals and other industrial activities are located, and where groundwater or other forms of environmental contamination could occur. We also maintain bulk fuel storage and fuel islands at four of our facilities. Our operations involve the risks of fuel spillage or seepage, environmental damage, and hazardous waste disposal, among others. If we are involved in a spill or other accident involving hazardous substances, or if we are found to be in violation of applicable laws or regulations, it could have a materially adverse effect on our business and operating results. If we should fail to comply with applicable environmental regulations, we could be subject to substantial fines or penalties and to civil and criminal liability.
We operate in a highly regulated industry and increased costs of compliance with, or liability for violation of, existing or future regulations could have a material adverse effect on our business.
The U.S. Department of Transportation and various state agencies exercise broad powers over our business, generally governing such activities as authorization to engage in motor carrier operations, safety, and financial reporting. We may also become subject to new or more restrictive regulations relating to fuel emissions, drivers’ hours in service, and ergonomics. Compliance with such regulations could substantially impair equipment productivity and increase our operating expenses.
The EPA adopted new emissions control regulations, which require progressive reductions in exhaust emissions from diesel engines through 2010, for engines manufactured in October 2002 and thereafter. In part to offset the costs of compliance with the new EPA engine design requirements, some manufacturers have significantly increased new equipment prices and eliminated or sharply reduced the price of repurchase or trade-in commitments. If new equipment prices were to increase, or if the price of repurchase commitments by equipment manufacturers were to decrease, more than anticipated, we may be required to increase our depreciation and financing costs and/or retain some of our equipment longer, with a resulting increase in maintenance expenses. To the extent we are unable to offset any such increases in expenses with rate increases or cost savings, our results of operations would be adversely affected. If our fuel or maintenance expenses were to increasenomination as a result of our use of the new, EPA-compliant engines, and we are unable to offset such increases with fuel surcharges or higher freight rates, our results of operations would be adversely affected. Further, our business and operations could be adversely impacted if we experience problems with the reliability of the new engines. We began operating tractors with engines meeting the EPA guidelines during 2003. Although we have not experienced any significant reliability issues with these engines to date, the expenses associated with the tractors containing these engines have been slightly elevated, primarily as a result of lower fuel efficiency and higher depreciation.
None.
Our executive offices and primary terminal facilities, which we own, are located in Tontitown, Arkansas. These facilities are located on approximately 49.3 acres and consist of 114,403 square feet of office space and maintenance and storage facilities.
Our subsidiaries lease facilities in Jacksonville, Florida; Breese and Effingham, Illinois; Parsippany and Paulsboro, New Jersey; North Jackson, Ohio; Oklahoma City, Oklahoma; and Laredo and El Paso, Texas. Our terminal facilities in Columbia, Mississippi; Irving, Texas; North Little Rock, Arkansas; and Willard, Ohio are owned. The leased facilities are leased primarily on contractual terms ranging from one to five years. The following provides a summary of the ownership and types of activities conducted at each location:
Location
| Own/
Lease
| Dispatch
Office
| Maintenance
Facility
| Safety
Training
|
Tontitown, Arkansas | Own | Yes | Yes | Yes |
North Little Rock, Arkansas | Own | Yes | Yes | No |
Jacksonville, Florida | Lease | Yes | Yes | Yes |
Breese, Illinois | Lease | Yes | No | No |
Effingham, Illinois | Lease | No | Yes | No |
Columbia, Mississippi | Own | No | No | No |
Parsippany, New Jersey | Lease | Yes | Yes | Yes |
Paulsboro, New Jersey | Lease | Yes | No | No |
North Jackson, Ohio | Lease | Yes | Yes | Yes |
Willard, Ohio | Own | Yes | Yes | Yes |
Oklahoma City, Oklahoma | Lease | Yes | Yes | Yes |
El Paso, Texas | Lease | Yes | Yes | No |
Irving, Texas | Own | Yes | Yes | Yes |
Laredo, Texas | Lease | Yes | Yes | No |
We also have access to trailer drop and relay stations in various other locations across the country. We lease certain of these facilities on a month-to-month basis from an affiliate of our largest shareholder.
We believe that all of the properties that we own or lease are suitabledirector. In evaluating candidates for their purposes and adequate to meet our needs.
The nature of our business routinely results in litigation, primarily involving claims for personal injuries and property damage incurred in the transportation of freight. We believe that all such routine litigation is adequately covered by insurance and that adverse results in one or more of those cases would not have a material adverse effect on our financial condition.
No matters were submitted to a vote of our security holders during the fourth quarter ended December 31, 2006.
PART II
Our common stock is traded on the NASDAQ Global Market under the symbol PTSI. The following table sets forth, for the quarters indicated, the range of the high and low sales prices per share for our common stock as reported on the NASDAQ Global Market.
Calendar Year Ended December 31, 2006
| | | High | | Low | |
| First Quarter | | $ | 25.18 | | $ | 17.51 | |
| Second Quarter | | | 28.96 | | | 23.24 | |
| Third Quarter | | | 31.50 | | | 23.78 | |
| Fourth Quarter | | | 26.68 | | | 20.90 | |
Calendar Year Ended December 31, 2005
| | | High | | Low | |
| First Quarter | | $ | 19.49 | | $ | 16.47 | |
| Second Quarter | | | 17.35 | | | 13.43 | |
| Third Quarter | | | 17.90 | | | 15.71 | |
| Fourth Quarter | | | 18.85 | | | 15.16 | |
As of March 5, 2007, there were approximately 178 holders of record of our common stock.
Dividends
We have not declared or paid any cash dividends on our common stock for the two most recent fiscal years. The policy ofnomination, our Board of Directors iswill consider the factors it believes to retain earnings forbe appropriate, which would generally include the expansioncandidate’s independence, personal and development of ourprofessional integrity, business judgment, relevant experience and the payment of our debt service obligations. Future dividend policyskills, including those related to transportation services, and the payment of dividends, if any, willpotential to be determined by the Board of Directors in light of circumstances then existing, including our earnings, financial condition and other factors deemed relevant by the Board of Directors.
Repurchases of Common Stock
On October 24, 2003, the Company announced the approval by the Board of Directors of a stock repurchase program in which the Company was authorized to purchase 300,000 shares of its common stock at prevailing market prices over a twelve month period. The stock repurchase program expired during the fourth quarter of 2004 with no purchases by the Company during the authorized twelve month period.
On April 11, 2005, the Company announced that the Board of Directors had authorized the Company to repurchase up to 600,000 shares of its common stock during the six month period ending October 11, 2005. These 600,000 shares were all repurchased by September 30, 2005. On September 6, 2005, the Company announced that its Board of Directors had authorized the Company to extend the stock repurchase program until September 6, 2006 and to include up to an additional 900,000 shares of its common stock. The Company repurchased 458,600 shares of these additional shares prior to the September 6, 2006 program expiration date. There were no repurchases during the fourth quarter of 2006.
See Part III, Item 12, “Security Ownership of Certain Beneficial Owners and Management and Related Stockholder Matters” of this Annual Report for a presentation of compensation plans under which equity securities of the Company are authorized for issuance.
Performance Graph
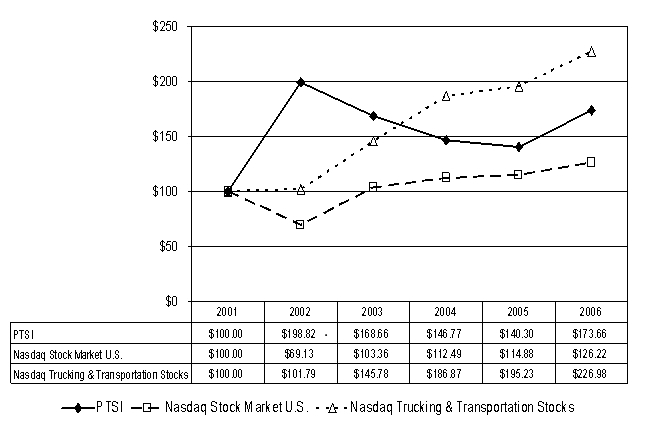
Set forth below is a line graph comparing the yearly percentage change in the cumulative total stockholder return on our common stock against the cumulative total return of the CRSP Total Return Index for the Nasdaq Stock Market (U.S. companies) and the CRSP Total Return Index for the Nasdaq Trucking and Transportation Stocks for the period of five years commencing December 31, 2001 and ending December 31, 2006. The graph assumes that the value of the investment in our common stock and in each index was $100 on December 31, 2001 and that all dividends were reinvested.
The following selected financial and operating data should be readeffective director in conjunction with the Consolidated Financial Statements and notes thereto included elsewhere in this Report.
| | | Year Ended December 31, | |
| | | 2006 | | 2005 | | 2004 | | 2003 | | 2002 | |
| | | (in thousands, except earnings per share amounts) | |
Statement of Operations Data: | | | | | | | | | | | |
| Operating revenues: | | | | | | | | | | | | | | | | |
| Operating revenues, before fuel surcharge | | $ | 351,373 | | $ | 326,353 | | $ | 309,475 | | $ | 293,547 | | $ | 264,012 | |
| Fuel surcharge (1) | | | 48,896 | | | 34,527 | | | 15,591 | | | 7,491 | | | 2,042 | |
| Total operating revenues | | | 400,269 | | | 360,880 | | | 325,066 | | | 301,038 | | | 266,054 | |
| | | | | | | | | | | | | | | | | |
| Operating expenses: | | | | | | | | | | | | | | | | |
| Salaries, wages and benefits | | | 127,539 | | | 122,005 | | | 119,519 | | | 119,350 | | | 115,432 | |
| Fuel expense (2) | | | 97,286 | | | 81,017 | | | 55,645 | | | 42,883 | | | 35,103 | |
| Rent and purchased transportation | | | 43,844 | | | 39,074 | | | 38,938 | | | 35,287 | | | 9,780 | |
| Depreciation and amortization | | | 33,929 | | | 31,376 | | | 30,016 | | | 26,601 | | | 24,715 | |
| Operating supplies (1)(2) | | | 25,682 | | | 23,114 | | | 21,718 | | | 20,358 | | | 18,100 | |
| Operating taxes and licenses | | | 16,421 | | | 15,776 | | | 15,488 | | | 14,710 | | | 13,467 | |
| Insurance and claims | | | 16,389 | | | 15,992 | | | 15,820 | | | 13,500 | | | 12,786 | |
| Communications and utilities | | | 2,642 | | | 2,648 | | | 2,690 | | | 2,540 | | | 2,284 | |
| Other | | | 5,426 | | | 6,205 | | | 5,131 | | | 4,755 | | | 4,620 | |
| Loss on sale or disposal of property | | | 47 | | | 147 | | | 915 | | | 368 | | | 127 | |
| Total operating expenses | | | 369,205 | | | 337,354 | | | 305,880 | | | 280,352 | | | 236,414 | |
| Operating income | | | 31,064 | | | 23,526 | | | 19,186 | | | 20,686 | | | 29,640 | |
| Non-operating income | | | 448 | | | 477 | | | 464 | | | 276 | | | - | |
| Interest expense | | | (1,475 | ) | | (1,881 | ) | | (1,758 | ) | | (1,667 | ) | | (1,985 | ) |
| Income before income taxes | | | 30,037 | | | 22,122 | | | 17,892 | | | 19,295 | | | 27,655 | |
| Income taxes | | | 12,073 | | | 8,983 | | | 7,304 | | | 7,805 | | | 11,062 | |
| Net income | | $ | 17,964 | | $ | 13,139 | | $ | 10,588 | | $ | 11,490 | | $ | 16,593 | |
| Earnings per common share: | | | | | | | | | | | | | | | | |
| Basic | | $ | 1.74 | | $ | 1.20 | | $ | 0.94 | | $ | 1.02 | | $ | 1.56 | |
| Diluted | | $ | 1.74 | | $ | 1.20 | | $ | 0.94 | | $ | 1.01 | | $ | 1.55 | |
| Average common shares outstanding - Basic | | | 10,296 | | | 10,966 | | | 11,298 | | | 11,291 | | | 10,669 | |
| Average common shares outstanding - Diluted(3) | | | 10,302 | | | 10,976 | | | 11,324 | | | 11,326 | | | 10,715 | |
__________
(1) | In order to conform to industry practice, during 2004 the Company began to classify fuel surcharges charged to customers as revenue rather than as a reduction of operating supplies expense. This reclassification has no effect on net operating income, net income or earnings per share. The Company has made corresponding reclassifications to comparative periods shown. |
(2) | Because of the increased impact of fuel costs on the Company’s results of operations in recent years, during 2006 the Company began to separately display as a line item “Fuel expense” for amounts paid for fuel which had previously been aggregated with other operating supplies and included in the line item “Operating supplies”. This reclassification has no effect on net operating income, net income or earnings per share. The Company has made corresponding reclassifications to comparative periods shown. |
(3) | Diluted income per share for 2006, 2005, 2004, 2003 and 2002 assumes the exercise of stock options to purchase an aggregate of 55,738, 22,297, 62,224, 77,758 and 87,984 shares of common stock, respectively. |
| | | At December 31, | |
| | | 2006 | | 2005 | | 2004 | | 2003 | | 2002 | |
Balance Sheet Data: | | (in thousands) | |
| Total assets | | $ | 314,246 | | $ | 293,441 | | $ | 285,349 | | $ | 264,849 | | $ | 228,320 | |
| Long-term debt, excluding current portion | | | 21,205 | | | 39,693 | | | 23,225 | | | 26,740 | | | 20,175 | |
| Stockholders' equity | | | 185,028 | | | 164,762 | | | 168,543 | | | 156,875 | | | 144,452 | |
| | | | | | | | | | | | | | | | | |
| | Year Ended December 31, |
| | | | 2006 | | | 2005 | | | 2004 | | | 2003 | | | 2002 | |
Operating Data: | | | | | | | | | | | | | | | | |
| Operating ratio (1) | | | 91.2 | % | | 92.8 | % | | 93.8 | % | | 92.9 | % | | 88.7 | % |
| Average number of truckloads per week | | | 7,200 | | | 6,946 | | | 7,278 | | | 7,105 | | | 6,463 | |
| Average miles per trip | | | 659 | | | 680 | | | 664 | | | 701 | | | 755 | |
| Total miles traveled (in thousands) | | | 229,810 | | | 228,624 | | | 235,894 | | | 242,890 | | | 238,256 | |
| Average miles per tractor | | | 123,156 | | | 125,479 | | | 127,124 | | | 131,934 | | | 136,772 | |
| Average revenue, before fuel surcharge per tractor per day | | $ | 778 | | $ | 740 | | $ | 684 | | $ | 653 | | $ | 621 | |
| Average revenue, before fuel surcharge per loaded mile | | $ | 1.43 | | $ | 1.33 | | $ | 1.19 | | $ | 1.13 | | $ | 1.15 | |
| Empty mile factor | | | 5.9 | % | | 5.5 | % | | 4.7 | % | | 4.5 | % | | 4.0 | % |
| | | | | | | | | | | | | | | | | |
At end of period: | | | | | | | | | | | | | | | | |
| Total company-owned/leased tractors | | | 1,998(2 | ) | | 1,792(3 | ) | | 1,857(4 | ) | | 1,913(5 | ) | | 1,781(6 | ) |
| Average age of tractors (in years) | | | 1.55 | | | 1.43 | | | 1.70 | | | 1.94 | | | 2.12 | |
| Total trailers | | | 4,540 | | | 4,406 | | | 4,257 | | | 4,175 | | | 3,973 | |
| Average age of trailers (in years) | | | 4.16 | | | 3.92 | | | 4.69 | | | 5.15 | | | 5.74 | |
| Number of employees | | | 3,062 | | | 3,035 | | | 2,736 | | | 2,765 | | | 2,538 | |
__________
(1) Total operating expenses, net of fuel surcharge as a percentage of operating revenues, before fuel surcharge.
(2) Includes 49 owner operator tractors; (3) Includes 50 owner operator tractors; (4) Includes 85 owner operator tractors.
(5) Includes 103 owner operator tractors; (6) Includes 130 owner operator tractors.
During 2002, the Company received approximately $54.8 million from a public offering of 2,621,250 shares of its common stock and used approximately $43.0 million of the proceeds to repay long-term debt obligations with the remaining proceeds used to fund capital expenditures and finance general working capital needs. As a result, the Company experienced an increase in total assets, a decrease in long-term debt, and an increase in stockholders’ equity as of December 31, 2002 when compared to December 31, 2001.
During 2003, the Company acquired a freight brokerage company and a truckload motor carrier which when combined, contributed approximately $40.7 million in additional revenues and $.07 in diluted earnings per share for the year ended December 31, 2003 when compared to revenues and diluted earnings per share for the year ended December 31, 2002. The acquisition of the truckload motor carrier also resulted in an increase in our fleet size of 122 tractors and 221 trailers during 2003 as compared to 2002.
The Company has not declared or paid any cash dividends during any of the periods presented above.
Business Overview
The Company's administrative headquarters are in Tontitown, Arkansas. From this location we manage operations conducted through wholly owned subsidiaries based in various locations around the United States and Canada. The operations of these subsidiaries can generally be classified into either truckload services or brokerage and logistics services. Truckload services include those transportation services in which we utilize company owned tractors or owner-operator owned tractors. Brokerage and logistics services consist of services such as transportation scheduling, routing, mode selection, transloading and other value added services related to the transportation of freight which may or may not involve the usage of company owned or owner-operator owned equipment. Both our truckload operations and our brokerage/logistics operations have similar economic characteristics and are impacted by virtually the same economic factors as discussed elsewhere in this Report. All of the Company's operations are in the motor carrier segment.
For both operations, substantially allrest of our revenue is generated by transporting freight for customers and is predominantly affected byBoard in collectively serving the rates per mile received from our customers, equipment utilization, and our percentage of non-compensated miles. These aspectslong-term interests of our business are carefully managed and efforts are continuously underway to achieve favorable results. Truckload services revenues, excluding fuel surcharges, represented 87.8%, 88.0%, and 86.4% of total revenues, excluding fuel surcharges for the twelve months ended December 31, 2006, 2005, and 2004, respectively.
The main factors that impactstockholders. Although our profitability on the expense side are costs incurred in transporting freight for our customers. Currently our most challenging costs include fuel, driver recruitment, training, wage and benefit costs, independent broker costs (which we record as purchased transportation), insurance, and maintenance and capital equipment costs.
In discussing our results of operations we use revenue, before fuel surcharge, (and fuel expense, net of surcharge), because management believes that eliminating the impact of this sometimes volatile source of revenue allows a more consistent basis for comparing our results of operations from period to period. During 2006, 2005 and 2004, approximately $48.9 million, $34.5 million and $15.6 million, respectively, of the Company's total revenue was generated from fuel surcharges. We also discuss certain changes in our expenses as a percentage of revenue, before fuel surcharge, rather than absolute dollar changes. We do this because we believe the high variable cost nature of certain expenses makes a comparison of changes in expenses as a percentage of revenue more meaningful than absolute dollar changes.
Results of Operations - Truckload Services
The following table sets forth, for truckload services, the percentage relationship of expense items to operating revenues, before fuel surcharges, for the periods indicated. Fuel costs are shown net of fuel surcharges.
| | | Years Ended December 31, | |
| | 2006 | | 2005 | | 2004 | |
Operating revenues, before fuel surcharge | | | 100.0 | % | | 100.0 | % | | 100.0 | % |
| Operating expenses: | | | | | | | | | | |
| Salaries, wages and benefits | | | 40.6 | | | 41.8 | | | 43.8 | |
| Fuel expense, net of fuel surcharge | | | 16.0 | | | 16.6 | | | 15.2 | |
| Rent and purchased transportation | | | 1.7 | | | 1.2 | | | 0.6 | |
| Depreciation and amortization | | | 11.0 | | | 10.9 | | | 11.2 | |
| Operating supplies | | | 8.3 | | | 8.0 | | | 8.1 | |
| Operating taxes and licenses | | | 5.3 | | | 5.5 | | | 5.8 | |
| Insurance and claims | | | 5.3 | | | 5.5 | | | 5.9 | |
| Communications and utilities | | | 0.8 | | | 0.9 | | | 0.9 | |
| Other | | | 1.6 | | | 1.8 | | | 1.7 | |
| Loss on sale or disposal of property | | | 0.0 | | | 0.1 | | | 0.3 | |
| Total operating expenses | | | 90.6 | | | 92.3 | | | 93.5 | |
| Operating income | | | 9.4 | | | 7.7 | | | 6.5 | |
| Non-operating income | | | 0.1 | | | 0.1 | | | 0.2 | |
| Interest expense | | | (0.4 | ) | | (0.5 | ) | | (0.5 | ) |
| Income before income taxes | | | 9.1 | % | | 7.3 | % | | 6.2 | % |
2006 Compared to 2005
For the year ended December 31, 2006, truckload services revenue, before fuel surcharges, increased 7.5% to $308.7 million as compared to $287.1 million for the year ended December 31, 2005. The increase was primarily due to a 6.9% increase in the average rate per total mile charged to customers from approximately $1.26 during 2005 to approximately $1.34 during 2006. Also contributing to the increase was a slight increase in the size of the Company’s tractor fleet from 1,822 units in 2005 to 1,866 units in 2006, however, a decrease in the average daily miles traveled per unit from 519 miles in 2005 to 509 miles in 2006 partially offset revenue growth attributable to our fleet growth.
Salaries, wages and benefits decreased from 41.8% of revenues, before fuel surcharges, in 2005 to 40.6% of revenues, before fuel surcharges, in 2006. The decrease relates primarily to a decrease in driver lease expense, which is a component of salaries, wages and benefits, as the average number of owner operators under contract decreased from 66 during 2005 to 45 during 2006. The decrease associated with driver lease expense was partially offset by an increase in amounts paid to the corresponding company driver replacement, and in other costs normally absorbed by the owner operator such as repairs and fuel. The settlement of claims for amounts less than the estimated reserve under the Company’s self-insured workers’ compensation plan also contributed to the decrease. Although to a lesser degree, the effect of higher revenues without a corresponding increase in those wages with fixed cost characteristics, such as general and administrative wages, also contributed to the decrease in salaries, wages and benefits as a percentage of revenues, before fuel surcharges. Partially offsetting the decreases discussed above was an increase in amounts accrued for employee bonus plans and an increase in driver pay as a result of the modified driver pay plans implemented in January 2006. Management anticipates that salaries, wages and benefits will increase to the extent the Company is unable to pass the additional costs to customers in the form of rate increases.
Fuel expense decreased from 16.6% of revenues, before fuel surcharges, in 2005 to 16.0% of revenues, before fuel surcharges, in 2006. Fuel costs, net of fuel surcharges, increased from $47.6 million during 2005 to $49.4 million during 2006 primarily due to higher fuel prices. During periods of rising fuel prices the Company is often able to recoup a portion of the increase through fuel surcharges passed along to its customers. The Company collected approximately $34.5 million in fuel surcharges during 2005 and $48.9 million during 2006. Fuel costs were also affected by the replacement of owner operators with Company drivers as discussed above.
Rent and purchased transportation increased from 1.2% of revenues, before fuel surcharges, in 2005 to 1.7% of revenues, before fuel surcharges, in 2006. The increase relates primarily to an increase in amounts paid to third party transportation service providers for intermodal services.
Depreciation and amortization increased from 10.9% of revenues, before fuel surcharges, in 2005 to 11.0% of revenues, before fuel surcharges, in 2006. Depreciation expense increased from $31.3 million during 2005 to $33.9 million during 2006 primarily due to an increase in the size of the Company-owned tractor fleet from 1,742 tractors in service at the end of 2005 to 1,949 tractors in service at the end of 2006. To a lesser extent, a larger trailer fleet and higher new trailer prices also contributed to the increase.
Operating supplies and expenses increased from 8.0% of revenues, before fuel surcharges, in 2005 to 8.3% of revenues, before fuel surcharges, in 2006. The increase relates to an increase in amounts paid to third party driver training schools and for tractor repairs expense. Tractor repairs expense increased in part as a result of the replacement of owner operators with Company drivers as discussed above.
Operating taxes and licenses decreased from 5.5% of revenues, before fuel surcharges, in 2005 to 5.3% of revenues, before fuel surcharges, in 2006. Operating taxes and licenses, which consists primarily of fuel taxes, increased slightly from $15.8 million during 2005 to $16.4 million during 2006. Fuel tax expense is primarily affected by both the number of miles traveled and the miles-per-gallon (mpg) achieved. During 2006 the Company experienced a lower mpg of 5.94 as compared to a mpg of 6.11 during 2005 as the Company continued the replacement of older tractors with new tractors containing the less efficient EPA-compliant engines originally mandated for all engines produced after October 1, 2002. Also contributing to the increase was an increase in the number of miles traveled from 228.6 million in 2005 to 229.8 million in 2006.
Insurance and claims expense decreased from 5.5% of revenues, before fuel surcharges, in 2005 to 5.3% of revenues, before fuel surcharges, in 2006. During the third quarter of 2005 the Company and one of its insurance providers renegotiated the method used in determining the Company’s auto liability insurance premiums which were previously based on a specified rate per one hundred dollars of revenue. This method had the unintended consequence of penalizing the Company with increased insurance costs solely from passing higher costs along to its customers in the form of rate increases. As a result of these renegotiations, the method of determining the Company’s auto liability
insurance premium was amended to use the number of miles traveled instead of revenue generated which allowed the Company to recognize a credit of approximately $600,000 against insurance expense during the third quarter of 2005. Excluding the effect of this credit, insurance and claims expense decreased from 5.8% of revenues, before fuel surcharges, during 2005 to 5.3% of revenues, before fuel surcharges, during 2006. This decrease, as a percentage of revenue, was due to the effect of an increase in Company revenues due to rate increases which dilutes the impact of mileage based expenses. During the third quarter of 2006 the Company’s auto liability insurance policy renewal negotiations resulted in a rate increase of approximately 4.4% and management expects insurance expense to increase to the extent the Company is unable to pass the additional insurance costs to customers in the form of rate increases.
Other expenses decreased from 1.8% of revenues, before fuel surcharges, in 2005 to 1.6% of revenues, before fuel surcharges, in 2006. The decrease relates primarily to a decrease in amounts considered as uncollectible revenue during 2006 as compared to 2005. This decrease was partially offset by an increase in amounts paid for advertising expense during 2006 as compared to 2005.
The truckload services division operating ratio, which measures the ratio of operating expenses, net of fuel surcharges, to operating revenues, before fuel surcharges, decreased to 90.6% for 2006 from 92.3% for 2005.
2005 Compared to 2004
For the year ended December 31, 2005, truckload services revenue, before fuel surcharges, increased 7.3% to $287.1 million as compared to $267.5 million for the year ended December 31, 2004. The increase was due to a 10.8% increase in the average rate per total mile charged to customers from $1.13 during 2004 to $1.26 during 2005. The revenue growth attributable to the increase in the average rate per total mile was partially offset by a 3.1% reduction in total miles traveled from 235.9 million during 2004 to 228.6 million during 2005.
Salaries, wages and benefits decreased from 43.8% of revenues, before fuel surcharges, in 2004 to 41.8% of revenues, before fuel surcharges, in 2005. The decrease relates primarily to a decrease in driver lease expense, which is a component of salaries, wages and benefits, as the average number of owner operators under contract decreased from 93 during 2004 to 66 during 2005. The decrease associated with driver lease expense was partially offset by an increase in amounts paid to the corresponding company driver replacement, and in other costs normally absorbed by the owner operator such as repairs and fuel. Although to a lesser degree, the effect of higher revenues without a corresponding increase in those wages with fixed cost characteristics, such as general and administrative wages, also contributed to the decrease in salaries, wages and benefits as a percentage of revenues, before fuel surcharges. During January 2006 the Company implemented a driver pay increase ranging from $.01 to $.03 per mile depending on individual driver qualifications and expect salaries, wages and benefits to increase as a result.
Fuel expense increased from 15.2% of revenues, before fuel surcharges, in 2004 to 16.6% of revenues, before fuel surcharges, in 2005. The increase was primarily due to higher fuel costs resulting from a 34.4% increase in the average price per gallon paid by the Company during 2005 as compared to 2004. During periods of rising fuel prices the Company is often able to recoup at least a portion of the increase through fuel surcharges passed along to its customers. Fuel costs, net of fuel surcharges, increased to $47.6 million in 2005 from $40.7 million in 2004. The Company collected approximately $34.5 million in fuel surcharges during 2005 and $15.6 million during 2004. Fuel costs were also affected by the replacement of owner operators with Company drivers as discussed above.
Rent and purchased transportation increased from 0.6% of revenues, before fuel surcharges, in 2004 to 1.2% of revenues, before fuel surcharges, in 2005. The increase relates primarily to an increase in amounts paid to third party transportation service providers for intermodal services.
Depreciation and amortization decreased from 11.2% of revenues, before fuel surcharges, in 2004 to 10.9% of revenues, before fuel surcharges, in 2005. Depreciation expense increased from $29.9 million during 2004 to $31.3 million during 2005 primarily due to higher new tractor and trailer prices coupled with decreased residual trade-in values guaranteed by the manufacturer, however as a percentage of revenues, before fuel surcharges, a decrease results from the interaction of increased revenues from an increased rate per mile charged to customers and the fixed cost nature of depreciation expense.
Operating taxes and licenses decreased from 5.8% of revenues, before fuel surcharges, in 2004 to 5.5% of revenues, before fuel surcharges, in 2005. Operating taxes and licenses which consist primarily of fuel taxes and tractor and trailer registration fees increased slightly from $15.5 million during 2004 to $15.8 million during 2005. Fuel tax expense is primarily affected by both the number of miles traveled and the miles-per-gallon (mpg) achieved. During 2005 the Company experienced a lower mpg of 6.11 as compared to a mpg of 6.31 during 2004, resulting primarily from the replacement of older tractors with new tractors containing engines which comply with the EPA mandated lower emissions standards. The increased costs associated with a lower mpg were offset by a decrease in the number of miles traveled during 2005 to 228.6 million from 235.9 million during 2004. Tractor and trailer registration fees, the majority of which are fixed on a per unit basis, did not change significantly as the number of units remained relatively the same, however the fixed cost nature of these expenses did decrease as a percentage of revenues, before fuel surcharges due to higher revenues during 2005 as compared to 2004.
Insurance and claims expense decreased from 5.9% of revenues, before fuel surcharges, in 2004 to 5.5% of revenues, before fuel surcharges, in 2005. The decrease was the result of renegotiations with one of the Company’s insurance providers to change the method of determining the Company’s auto liability insurance premiums. Previously, the Company’s auto liability premiums were determined using a specified rate per one hundred dollars of revenue. This method had the unintended consequence of penalizing the Company with increased insurance costs solely from passing higher costs along to its customers in the form of rate increases. The method of determining the Company’s auto liability premium is now based on the number of miles traveled instead of revenue generated.
Other expenses increased from 1.7% of revenues, before fuel surcharges, in 2004 to 1.8% of revenues, before fuel surcharges, in 2005. The increase relates to the combined net effect of an increase in current amounts written off as uncollectible truckload services revenues and a decrease in recoveries of prior year uncollectible truckload services revenue during 2005 as compared to 2004. During 2005 the Company expensed an additional $1.0 million of truckload services accounts receivable as uncollectible without any significant recoveries related to prior years. During 2004 $100,000 was expensed as uncollectible truckload services accounts receivable, however this amount was completely offset by the recovery of $635,000 during 2004 related to the settlement of a lawsuit which allowed the Company to recapture approximately $635,000 of previously reported expense. The increase in other expenses was partially offset by a decrease in amounts paid for advertising expense during 2005 as compared to 2004.
The truckload services division operating ratio, which measures the ratio of operating expenses, net of fuel surcharges, to operating revenues, before fuel surcharges, decreased to 92.3% for 2005 from 93.5% for 2004.
Results of Operations - Logistics and Brokerage Services
The following table sets forth, for logistics and brokerage services, the percentage relationship of expense items to operating revenues, before fuel surcharges, for the periods indicated. Brokerage service operations occur specifically in certain divisions; however, brokerage operations occur throughout the Company in similar operations having substantially similar economic characteristics. Rent and purchased transportation, which includes costs paid to third party carriers, are shown net of fuel surcharges.
| | | Years Ended December 31, | |
| | 2006 | | 2005 | | 2004 | |
Operating revenues, before fuel surcharge | | | 100.0 | % | | 100.0 | % | | 100.0 | % |
| Operating expenses: | | | | | | | | | | |
| Salaries, wages and benefits | | | 5.0 | | | 5.1 | | | 5.5 | |
| Fuel expense | | | 0.0 | | | 0.0 | | | 0.0 | |
| Rent and purchased transportation, net of fuel surcharge | | | 88.3 | | | 88.0 | | | 87.8 | |
| Depreciation and amortization | | | 0.0 | | | 0.2 | | | 0.3 | |
| Operating supplies | | | 0.0 | | | 0.0 | | | 0.0 | |
| Operating taxes and licenses | | | 0.0 | | | 0.0 | | | 0.0 | |
| Insurance and claims | | | 0.0 | | | 0.1 | | | 0.1 | |
| Communications and utilities | | | 0.3 | | | 0.4 | | | 0.4 | |
| Other | | | 1.4 | | | 2.5 | | | 1.6 | |
| Loss on sale or disposal of property | | | 0.0 | | | 0.0 | | | 0.0 | |
| Total operating expenses | | | 95.0 | | | 96.3 | | | 95.7 | |
| Operating income | | | 5.0 | | | 3.7 | | | 4.3 | |
| Non-operating income | | | 0.0 | | | 0.0 | | | 0.0 | |
| Interest expense | | | (0.4 | ) | | (0.6 | ) | | (0.6 | ) |
| Income before income taxes | | | 4.6 | % | | 3.1 | % | | 3.7 | % |
2006 Compared to 2005
Logistics and brokerage services revenues, before fuel surcharges, increased 8.9% to $42.7 million for the year ended December 31, 2006 as compared to $39.2 million for the year ended December 31, 2005. The increase was primarily the result of rate increases charged to customers to recover increases in amounts charged by third party logistics and brokerage service providers, and to a lesser extent, an increase in the number of loads brokered.
Rent and purchased transportation increased from 88.0% of revenues, before fuel surcharges, in 2005 to 88.3% of revenues, before fuel surcharges, in 2006. The increase relates to an increase in amounts charged by third party logistics and brokerage service providers primarily as a result of higher fuel costs.
Other expenses decreased from 2.5% of revenues, before fuel surcharges, in 2005 to 1.4% of revenues, before fuel surcharges, in 2006. The decrease relates primarily to a decrease in amounts considered as uncollectible revenue during 2006 as compared to 2005.
The logistics and brokerage services division operating ratio, which measures the ratio of operating expenses, net of fuel surcharges, to operating revenues, before fuel surcharges, decreased to 95.0% for 2006 from 96.3% for 2005.
2005 Compared to 2004
Logistics and brokerage services revenues, before fuel surcharges, decreased 6.6% to $39.2 million for the year ended December 31, 2005 as compared to $42.0 million for the year ended December 31, 2004. The decrease was primarily due to a 17.2% decrease in the number of loads serviced by the Company during 2005 as compared to 2004. This decrease was partially offset by an increase in the average revenue collected per load resulting from increased fees charged by the Company.
Salaries, wages and benefits decreased from 5.5% of revenues, before fuel surcharges, in 2004 to 5.1% of revenues, before fuel surcharges, in 2005. The decrease relates to a decrease in the number of employees employed by the logistics and brokerage services division.
Other expenses increased from 1.6% of revenues, before fuel surcharges, in 2004 to 2.5% of revenues, before fuel surcharges, in 2005. The increase relates to an increase in amounts written off as uncollectible logistics and brokerage services revenues during 2005 as compared to 2004.
The logistics and brokerage services division operating ratio, which measures the ratio of operating expenses, net of fuel surcharges, to operating revenues, before fuel surcharges, increased to 96.3% for 2005 from 95.7% for 2004.
Results of Operations - Combined Services
2006 Compared to 2005
Net income for all divisions was $18.0 million, or 5.1% of revenues, before fuel surcharge for 2006 as compared to $13.1 million or 4.0% of revenues, before fuel surcharge for 2005. The increase in net income combined with the effect of treasury stock repurchases resulted in an increase in diluted earnings per share to $1.74 for 2006 compared to $1.20 for 2005.
2005 Compared to 2004
Net income for all divisions was $13.1 million, or 4.0% of revenues, before fuel surcharge for 2005 as compared to $10.6 million or 3.4% of revenues, before fuel surcharge for 2004. The increase in net income combined with the effect of treasury stock repurchases resulted in an increase in diluted earnings per share to $1.20 for 2005 compared to $0.94 for 2004.
Quarterly Results of Operations
The following table presents selected consolidated financial information for each of our last eight fiscal quarters through December 31, 2006. The information has been derived from unaudited consolidated financial statements that, in the opinion of management, reflect all adjustments, consisting of normal recurring adjustments, necessary for a fair presentation of the quarterly information.
| | | Quarter Ended | |
| | | Mar. 31, 2006 | | June 30, 2006 | | Sept. 30, 2006 | | Dec. 31, 2006 | | Mar. 31, 2005 | | June 30, 2005 | | Sept. 30, 2005 | | Dec. 31, 2005 | |
| | | (unaudited) | |
| | | (in thousands, except earnings per share data) | |
| Operating revenues | | $ | 100,525 | | $ | 103,365 | | $ | 99,874 | | $ | 96,505 | | $ | 86,192 | | $ | 91,027 | | $ | 88,484 | | $ | 95,177 | |
| Total operating expenses | | | 91,473 | | | 94,375 | | | 94,202 | | | 89,154 | | | 81,034 | | | 84,479 | | | 84,471 | | | 87,370 | |
| Operating income | | | 9,052 | | | 8,990 | | | 5,672 | | | 7,351 | | | 5,158 | | | 6,548 | | | 4,013 | | | 7,807 | |
| Net income | | | 5,183 | | | 5,241 | | | 3,268 | | | 4,272 | | | 2,903 | | | 3,680 | | | 2,213 | | | 4,343 | |
| Earnings per common share: | | | | | | | | | | | | | | | | | | | | | | | | | |
| Basic | | $ | 0.50 | | $ | 0.51 | | $ | 0.32 | | $ | 0.41 | | $ | 0.26 | | $ | 0.33 | | $ | 0.20 | | $ | 0.41 | |
| Diluted | | $ | 0.50 | | $ | 0.51 | | $ | 0.32 | | $ | 0.41 | | $ | 0.26 | | $ | 0.33 | | $ | 0.20 | | $ | 0.41 | |
Liquidity and Capital Resources
The growth of our business has required, and will continue to require, a significant investment in new revenue equipment. Our primary sources of liquidity have been funds provided by operations, proceeds from the sales of revenue equipment, issuances of equity securities, and borrowings under our lines of credit.
During 2006, we generated $60.7 million in cash from operating activities compared to $23.7 million and $44.7 million in 2005 and 2004, respectively. Investing activities used $42.7 million in cash during 2006 compared to $41.0 million and $24.7 million in 2005 and 2004, respectively. The cash used in all three years related primarily to the purchase of revenue equipment (tractors and trailers) used in our operations. Financing activities used $18.1 million in cash during 2006 compared to $1.2 million and $3.4 million in 2005 and 2004, respectively. See Consolidated Statements of Cash Flows.
Our primary use of funds is for the purchase of revenue equipment. We typically use our existing lines of credit on an interim basis, in addition to cash flows from operations, to finance capital expenditures and repay long-term debt. During 2006 and 2005, we utilized cash on hand and our lines of credit to finance revenue equipment purchases for an aggregate of $50.7 million and $60.8 million, respectively.
Occasionally we finance the acquisition of revenue equipment through installment notes with fixed interest rates and terms ranging from 36 to 48 months, however as of December 31, 2006 and 2005, we had no outstanding indebtedness under such installment notes.
In order to maintain our tractor and trailer fleet count it is often necessary to purchase replacement units and place them in service before trade units are removed from service. The timing difference created during this process often requires the Company to pay for new units without any reduction in price for trade units. In this situation, the Company later receives payment for the trade units as they are delivered to the equipment vendor and have passed vendor inspection. During the twelve months ended December 31, 2006 and 2005, the Company received approximately $9.9 million and $17.4 million, respectively, for units delivered for trade.
We maintain a $20.0 million revolving line of credit and a $30.0 million revolving line of credit (Line A and Line B, respectively) with separate financial institutions. Amounts outstanding under Line A bear interest at LIBOR (determined as of the first day of each month) plus 1.25% (6.60% at December 31, 2006), are secured by our accounts receivable and mature on May 31, 2007, however the CompanyBoard has the intent and abilityauthority to extend the terms of this line of credit for an additional one year period until May 31, 2008. At December 31, 2006 outstanding advances on line A were approximately $14.7 million, including $310,000retain a search firm to assist it in letters of credit, with availabilityidentifying director candidates, there has to borrow $5.3 million. Amounts outstanding under Line B bear interest at LIBOR (determined on the last day of the previous month) plus 1.15% (6.50% at December 31, 2006), are secured by revenue equipment and mature on June 30, 2008. At December 31, 2006, $8.2 million, including $3.2 million in letters of credit were outstanding under Line B with availability to borrow $21.8 million. In an effort to reduce interest rate risk associated with these floating rate facilities, we had entered into interest rate swap agreements in an aggregate notional amount of $20.0 million. For additional information regarding the interest rate swap agreements, see Item 7A of this Report.
Marketable equity securities available for sale at December 31, 2006 increased approximately $3.4 million as compared to December 31, 2005. During the year ended December 31, 2006, the Company purchased approximately $1.3 million of equity securities with excess cash with the remaining increase attributable to an increase in the market value of the investments, net of sales and other-than-temporary write-downs. These securities, combined with equity securities purchased in prior periods, have a combined cost basis of approximately $9.2 million and a combined fair market value of approximately $14.4 million. The Company has developed a strategy to invest in securities from which it expects to receive dividends that qualify for favorable tax treatment, as well as, appreciate in value. The Company anticipates that increases in the market value of the investments combined with dividend payments will exceed interest rates paid on borrowings for the same period. During 2006 the Company had net unrealized pre-tax gains of approximately $2.3 million and received dividends of approximately $495,000. The holding term of these securities depends largely on the general economic environment, the equity markets, borrowing rates and the Company's cash requirements.
Revenue equipment, which generally consists of tractors, trailers, and revenue equipment accessories such as Qualcomm™ satellite tracking units, increased approximately $36.3 million as compared to December 31, 2005. Approximately $30.5 million of the increase is related to the net effect of purchasing approximately 620 tractors and 430 trailers during 2006 while only disposing of approximately 315 tractors and 290 trailers during 2006. Also contributing to the increase was an increase in the cost of new tractor and trailer units as compared to the units they replaced and to the acquisition of additional Qualcomm™ satellite tracking units. At December 31, 2006, approximately 100 tractors included in revenue equipment haddate been placed in inactive status as they were prepared for sale or trade. The sale or trade of these tractors in 2007 will reduce the carrying amount of the Company’s revenue equipment and accumulated depreciation at the time of sale or trade.
Accounts payable at December 31, 2006 increased approximately $16.5 million as compared to December 31, 2005. The increase is primarily related to $14.3 million in tractor and trailer purchases made during December 2006 for which payment is not due until January 2007. The Company increased its December tractor purchases in order to delay purchasing tractors with the 2007 model diesel engines which are required to meet the stricter EPA emission standards discussed in this report above in “Part I, Item 1, Revenue Equipment”. The net increase also reflects the increase of approximately $2.4 million in amounts accrued for employee bonuses.
Long-term debt at December 31, 2006 decreased approximately $18.5 million as compared to December 31, 2005. The decrease is related to the repayments in excess of borrowings on both of the Company’s lines of credit using excess operating cash flows.
For 2007, we expect to purchase approximately 775 new tractors and approximately 855 trailers while continuing to sell or trade older equipment, which we expect to result in net capital expenditures of approximately $64.2 million. Management believes we will be able to finance our near term needs for working capital over the next twelve months, as well as acquisitions of revenue equipment during such period, with cash balances, cash flows from operations, and borrowings believed to be available from financing sources. We will continue to have significant capital requirements over the long-term, which may require us to incur debt or seek additional equity capital. The availability of additional capital will depend upon prevailing market conditions, the market price of our common stock and several other factors over which we have limited control, as well as our financial condition and results of operations. Nevertheless, based on our recent operating results, current cash position, anticipated future cash flows, and sources of financing that we expect will be available to us, we do not expect that we will experience any significant liquidity constraints in the foreseeable future.
Contractual Obligations and Commercial Commitments
The following table sets forth the Company's contractual obligations and commercial commitments as of December 31, 2006:
| | | Payments due by period (in thousands) | |
| | | Total | | Less than 1 year | | 1 to 3 Years | | 4 to 5 Years | | More than 5 Years | |
| | | | | | | | | | | | |
| Long-term debt | | $ | 23,120 | | $ | 1,915 | | $ | 21,061 | | $ | 144 | | $ | - | |
| Operating leases (1) | | | 1,358 | | | 560 | | | 633 | | | 165 | | | - | |
| Total | | $ | 24,478 | | $ | 2,475 | | $ | 21,694 | | $ | 309 | | $ | - | |
| | | | | | | | | | | | | | | | | |
(1) Represents building, facilities, and drop yard operating leases.
Off-Balance Sheet Arrangements
The Company has no off-balance sheet arrangements as defined in Regulation S-K 303 (a)(4)(ii) issued by the Securities and Exchange Commission.
Insurance
With respect to physical damage for tractors, cargo loss and auto liability, the Company maintains insurance coverage to protect it from certain business risks. These policies are with various carriers and have per occurrence deductibles of $2,500, $10,000 and $2,500 respectively. Since 2002, the Company has elected to self insure for physical damage to trailers. The Company maintains workers’ compensation coverage in Arkansas, Ohio, Oklahoma, Mississippi, and Florida with a $500,000 self-insured retention and a $500,000 per occurrence excess policy. The Company has elected to opt out of workers' compensation coverage in Texas and is providing coverage through the P.A.M. Texas Injury Plan. The Company has reserved for estimated losses to pay such claims as well as claims incurred but not yet reported. The Company has not experienced any adverse trends involving differences in claims experienced versus claims estimates for workers’ compensation claims. Letters of credit aggregating $400,000 are held by a bank as security for workers’ compensation claims. The Company self insures for employee health claims with a stop loss of $200,000 per covered employee per year and estimates its liability for claims incurred but not reported.
Inflation
Inflation has an impact on most of our operating costs. Recently, the effect of inflation has been minimal.
Competition for drivers has increased in recent years, leading to increased labor costs. While increases in fuel and driver costs affect our operating costs, we do not believe that the effects of such increases are greater for us than for other trucking concerns.
Adoption of Accounting Policies
See “Item 8. Financial Statements and Supplementary Data, Note 1 to the Consolidated Financial Statements - Recent Accounting Pronouncements.”
Critical Accounting Policies
The Company's significant accounting policies are described in Note 1 to the Consolidated Financial Statements. The policies described below represent those that are broadly applicable to the Company's operations and involve additional management judgment due to the sensitivity of the methods, assumptions and estimates necessary in determining the related amounts.
Accounts Receivable. We continuously monitor collections and payments from our customers, third parties and vendors and maintain a provision for estimated credit losses based upon our historical experience and any specific collection issues that we have identified. While such credit losses have historically been within our expectations and the provisions established, we cannot guarantee that we will continue to experience the same credit loss rates that we have in the past.
Property and equipment. Management must use its judgment in the selection of estimated useful lives and salvage values for purposes of depreciating tractors and trailers which in some cases do not have guaranteed residual values. Estimates of salvage value at the expected date of trade-in or sale are based on the expected market values of equipment at the time of disposal which, in many cases include guaranteed residual values by the manufacturers.
Self Insurance. The Company is self-insured for health and workers' compensation benefits up to certain stop-loss limits. Such costs are accrued based on known claims and an estimate of incurred, but not reported (IBNR) claims. IBNR claims are estimated using historical lag information and other data either provided by outside claims administrators or developed internally. This estimation process is subjective, and to the extent that future actual results differ from original estimates, adjustments to recorded accruals may be necessary.
Revenue Recognition. Revenue is recognized in full upon completion of delivery to the receiver's location. For freight in transit at the end of a reporting period, the Company recognizes revenue prorata based on relative transit miles completed as a portion of the estimated total transit miles. Expenses are recognized as incurred.
Prepaid Tires. Tires purchased with revenue equipment are capitalized as a cost of the related equipment. Replacement tires are included in prepaid expenses and deposits and are amortized over a 24-month period. Costs related to tire recapping are expensed when incurred.
Income Taxes. Significant management judgment is required to determine the provision for income taxes and to determine whether deferred income tax assets will be realized in full or in part. Deferred income tax assets and liabilities are measured using enacted tax rates expected to apply to taxable income in the years in which those temporary differences are expected to be recovered or settled. When it is more likely that all or some portion of specific deferred income tax assets will not be realized, a valuation allowance must be established for the amount of deferred income tax assets that are determined not to be realizable. A valuation allowance for deferred income tax assets has not been deemed to be necessary due to the Company's profitable operations. Accordingly, if the facts or financial circumstances were to change, thereby impacting the likelihood of realizing the deferred income tax assets, judgment would need to be applied to determine the amount of valuation allowance required in any given period.
Business Combinations and Goodwill. Upon acquisition of an entity, the cost of the acquired entity must be allocated to assets and liabilities acquired. Identification of intangible assets, if any, that meet certain recognition criteria is necessary. This identification and subsequent valuation requires significant judgments. The carrying value of goodwill is tested annually and as of December 31, 2006 the Company determined that there was no impairment. The impairment testing requires an estimate of the value of the Company asemploy a whole, as the Company has determined it only has one reporting unit as defined in Statement of Financial Accounting Standards No. 142, “Goodwill and Other Intangible Assets.”
search firm. Our primary market risk exposures include equity price risk, interest rate risk, and commodity price risk (the price paid to obtain diesel fuel for our tractors). The potential adverse impact of these risks and the general strategies we employ to manage such risks are discussed below.
The following sensitivity analyses do not consider the effects that an adverse change may have on the overall economy nor do they consider additional actions we may take to mitigate our exposure to such changes. Actual results of changes in prices or rates may differ materially from the hypothetical results described below.
Equity Price Risk
We hold certain actively traded marketable equity securities which subjects the Company to fluctuations in the fair market value of its investment portfolio based on current market price. The recorded value of marketable equity securities increased to $14.4 million at December 31, 2006 from $11.0 million at December 31, 2005. The increase includes additional purchases, net of sales or write-downs, of approximately $1.1 million during 2006 and an increase in the fair market value of approximately $2.3 million during 2006. A 10% decrease in the market price of our marketable equity securities would cause a corresponding 10% decrease in the carrying amounts of these securities, or approximately $1.4 million. For additional information with respect to the marketable equity securities, see Note 3 to our consolidated financial statements.
Interest Rate Risk
Our two lines of credit each bear interest at a floating rate equal to LIBOR plus a fixed percentage. Accordingly, changes in LIBOR, which are effected by changes in interest rates, will affect the interest rate on, and therefore our costs under, the lines of credit. In an effort to manage the risks associated with changing interest rates, we entered into interest rate swap agreements effective February 28, 2001 and May 31, 2001, on notional amounts of $15,000,000 and $5,000,000, respectively. The “pay fixed rates” under the $15,000,000 and $5,000,000 swap agreements were 5.08% and 4.83%, respectively. The “receive floating rate” for both swap agreements was “1-month” LIBOR. These interest rate swap agreements terminated on March 2, 2006 and June 2, 2006, respectively. Assuming $20.0 million of variable rate debt was outstanding under Line “A” and not covered by a hedge agreement for a full fiscal year, a hypothetical 100 basis point increase in LIBOR would result in approximately $200,000 of additional interest expense. For additional information with respect to the interest rate swap agreements, see Note 17 to our consolidated financial statements.
Commodity Price Risk
Prices and availability of all petroleum products are subject to political, economic and market factors that are generally outside of our control. Accordingly, the price and availability of diesel fuel, as well as other petroleum products, can be unpredictable. Because our operations are dependent upon diesel fuel, significant increases in diesel fuel costs could materially and adversely affect our results of operations and financial condition. Based upon our 2006 fuel consumption, a 10% increase in the average annual price per gallon of diesel fuel would increase our annual fuel expenses by $9.7 million.
In July 2001, we entered into an agreement to obtain price protection and reduce a portion of our exposure to fuel price fluctuations. Under this agreement, we were obligated to purchase minimum amounts of diesel fuel per month, with a price protection component, for the six-month period ended February 28, 2002. The agreement also provided that if during the twelve-month period commencing January 2005, the price of heating oil on the New York Mercantile Exchange (“NY MX HO”) fell below $.58 per gallon, we would have been obligated to pay the contract holder the difference between $.58 per gallon and the NY MX HO average price, multiplied by 1,000,000 gallons. Accordingly, in any month in which the holder exercised such right, we would have been obligated to pay the holder $10,000 for each cent by which $.58 exceeded the average NY MX HO price for that month. For example, if the NY MX HO average price during March 2005 was approximately $.54, and if the holder were to exercise its payment right, we would have been obligated to pay the holder approximately $40,000. During the twelve-month period commencing January 2005 the average NY MX HO price remained well above the $.58 per gallon threshold and as of December 31, 2005 the agreement expired without any further obligation of either party. For the twelve-month period ended December 31, 2005 an adjustment of $500,000 was made to reflect the decline in fair value of the agreement which had the effect of reducing operating supplies expense and other current liabilities each by $500,000 in the accompanying consolidated financial statements. For the twelve-month period ended December 31, 2004 an adjustment of $250,000 was made to reflect the decline in fair value of the agreement which had the effect of reducing operating supplies expense and other current liabilities each by $250,000 in the accompanying consolidated financial statements, see Note 17 to our consolidated financial statements.
The following statements are filed with this report:
Report of Independent Registered Public Accounting Firm - Grant Thornton LLP
Report of Independent Registered Public Accounting Firm - Deloitte & Touche LLP
Consolidated Balance Sheets - December 31, 2006 and 2005
Consolidated Statements of Income - Years ended December 31, 2006, 2005 and 2004
Consolidated Statements of Shareholders’ Equity - Years ended December 31, 2006, 2005 and 2004
Consolidated Statements of Cash Flows - Years ended December 31, 2006, 2005 and 2004
Notes to Consolidated Financial Statements
Report of Independent Registered Public Accounting Firm
Board of Directors and
Shareholders of P.A.M. Transportation Services, Inc. and Subsidiaries
We have audited the accompanying consolidated balance sheets of P.A.M. Transportation Services, Inc. (a Delaware Corporation) and subsidiaries, (collectively, the Company) as of December 31, 2006 and 2005, and the related consolidated statements of income, stockholders’ equity and other comprehensive income, and cash flowsdoes not evaluate potential nominees for the years then ended. These financial statements are the responsibility of the Company’s management. Our responsibility is to express an opinion on these financial statementsdirector differently based on whether they are recommended to our audits.
We conducted our audits in accordance with the standards of the Public Company Accounting Oversight Board (United States). Those standards require that we plan and perform the audit to obtain reasonable assurance about whether the financial statements are free of material misstatement. An audit includes examining, onby a test basis, evidence supporting the amounts and disclosures in the financial statements. An audit also includes assessing the accounting principles used and significant estimates made by management, as well as evaluating the overall financial statement presentation. We believe that our audits provide a reasonable basis for our opinions.
In our opinion, the consolidated financial statements referred to above present fairly, in all material respects, the financial position of P.A.M. Transportation Services, Inc. and subsidiaries as of December 31, 2006 and 2005 and the results of their operations and their cash flows for the years then ended in conformity with accounting principles generally accepted in the United States of America.
We also have audited, in accordance with the standards of the Public Company Accounting Oversight Board (United States), the effectiveness of the P.A.M. Transportation Services, Inc.’s internal control over financial reporting as of December 31, 2006, based on criteria established in Internal Control-Integrated Framework issued by the Committee of Sponsoring Organizations of the Treadway Commission (COSO) and our report dated March 12, 2007 expressed unqualified opinions on the effectiveness of internal control over financial reporting and management’s evaluation thereof.
stockholder.
GRANT THORNTON LLPBoard Committees
Tulsa, Oklahoma
March 12, 2007
REPORT OF INDEPENDENT REGISTERED PUBLIC ACCOUNTING FIRM
Our Board of Directors has, and Stockholders
P.A.M. Transportation Services, Inc.appoints members to, three standing committees: the Audit Committee, the Compensation and SubsidiariesStock Option Committee (the “Compensation Committee”), and the Executive Committee. The membership of these committees, as of April 19, 2024, is as follows:
We have audited the accompanying consolidated statements of income, stockholders’ equity and other comprehensive income, and cash flows of P.A.M. Transportation Services, Inc. and subsidiaries (the “Company”) for the year ended December 31, 2004. These financial statements are the responsibility of the Company’s management. Our responsibility is to express an opinion on these financial statements based on our audit.
We conducted our audit in accordance with the standards of the Public Company Accounting Oversight Board (United States). Those standards require that we plan and perform the audit to obtain reasonable assurance about whether the financial statements are free of material misstatement. An audit includes examining, on a test basis, evidence supporting the amounts and disclosures in the financial statements. An audit also includes assessing the accounting principles used and significant estimates made by management, as well as evaluating the overall financial statement presentation. We believe that our audit provides a reasonable basis for our opinion.
In our opinion, such consolidated financial statements present fairly, in all material respects, the results of operations and cash flows of P.A.M. Transportation Services, Inc. and subsidiaries for the year ended December 31, 2004, in conformity with accounting principles generally accepted in the United States of America.
DELOITTE & TOUCHE LLP
Little Rock, Arkansas
March 8, 2005
P.A.M. TRANSPORTATION SERVICES, INC. AND SUBSIDIARIES CONSOLIDATED BALANCE SHEETS DECEMBER 31, 2006 AND 2005 (in thousands, except share and per share data) | |
| | | | | | |
| | | | | | | | |
ASSETS | | | 2006 | | | 2005 | |
| | | | | | | | |
| CURRENT ASSETS: | | | | | | | |
| Cash and cash equivalents | | $ | 1,040 | | $ | 1,129 | |
| Accounts receivable—net: | | | | | | | |
| Trade | | | 61,469 | | | 65,433 | |
| Other | | | 1,361 | | | 1,392 | |
| Inventories | | | 819 | | | 749 | |
| Prepaid expenses and deposits | | | 14,928 | | | 15,095 | |
| Marketable equity securities available-for-sale | | | 14,437 | | | 10,999 | |
| Income taxes refundable | | | 498 | | | 225 | |
| | | | | | | | |
| Total current assets | | | 94,552 | | | 95,022 | |
| | | | | | | | |
| PROPERTY AND EQUIPMENT: | | | | | | | |
| Land | | | 2,674 | | | 2,674 | |
| Structures and improvements | | | 9,383 | | | 9,319 | |
| Revenue equipment | | | 286,933 | | | 250,664 | |
| Office furniture and equipment | | | 6,890 | | | 6,692 | |
| | | | | | | | |
| Total property and equipment | | | 305,880 | | | 269,349 | |
| | | | | | | | |
| Accumulated depreciation | | | (102,566 | ) | | (87,854 | ) |
| | | | | | | | |
| Net property and equipment | | | 203,314 | | | 181,495 | |
| | | | | | | | |
| OTHER ASSETS: | | | | | | | |
| Goodwill | | | 15,413 | | | 15,413 | |
| Non-compete agreements, net | | | 217 | | | 417 | |
| Other | | | 750 | | | 1,094 | |
| | | | | | | | |
| Total other assets | | | 16,380 | | | 16,924 | |
| | | | | | | | |
| TOTAL ASSETS | | $ | 314,246 | | $ | 293,441 | |
| | | | | | | | |
| | | | | | | | |
| | | | | | (Continued) | |
CONSOLIDATED BALANCE SHEETS DECEMBER 31, 2006 AND 2005 (in thousands, except share and per share data) | |
| | | | | | |
| | | | | | | | |
LIABILITIES AND SHAREHOLDERS' EQUITY | | | 2006 | | | 2005 | |
| | | | | | | | |
| CURRENT LIABILITIES: | | | | | | | |
| Accounts payable | | $ | 38,510 | | $ | 22,055 | |
| Accrued expenses and other liabilities | | | 9,994 | | | 10,507 | |
| Current maturities of long-term debt | | | 1,915 | | | 1,859 | |
| Deferred income taxes—current | | | 5,658 | | | 7,134 | |
| | | | | | | | |
| Total current liabilities | | | 56,077 | | | 41,555 | |
| | | | | | | | |
| Long-term debt—less current portion | | | 21,205 | | | 39,693 | |
| Deferred income taxes—less current portion | | | 51,902 | | | 47,197 | |
| Other | | | 34 | | | 234 | |
| | | | | | | | |
| Total liabilities | | | 129,218 | | | 128,679 | |
| | | | | | | | |
| COMMITMENTS AND CONTINGENCIES | | | | | | | |
| | | | | | | | |
| SHAREHOLDERS' EQUITY | | | | | | | |
Preferred stock, $.01 par value, 10,000,000 shares authorized; none issued | | | - | | | - | |
Common stock, $.01 par value, 40,000,000 shares authorized; 11,362,207 and 11,344,207 shares issued; 10,303,607 and 10,285,607 shares outstanding at December 31, 2006 and December 31, 2005, respectively | | | 114 | | | 113 | |
| Additional paid-in capital | | | 77,309 | | | 76,429 | |
| Accumulated other comprehensive income | | | 3,142 | | | 1,721 | |
| Treasury stock, at cost; 1,058,600 shares | | | (17,869 | ) | | (17,869 | ) |
| Retained earnings | | | 122,332 | | | 104,368 | |
| | | | | | | | |
| Total shareholders’ equity | | | 185,028 | | | 164,762 | |
| | | | | | | | |
| TOTAL LIABILITIES AND SHAREHOLDERS' EQUITY | | $ | 314,246 | | $ | 293,441 | |
| | | | | | | | |
| | | | | | | | |
| | | | | | | (Concluded) | |
| See notes to consolidated financial statements. |
P.A.M. TRANSPORTATION SERVICES, INC. AND SUBSIDIARIES CONSOLIDATED STATEMENTS OF INCOME YEARS ENDED DECEMBER 31, 2006, 2005 AND 2004 (in thousands, except per share data) | |
| | | | | | | | |
| | | 2006 | | 2005 | | 2004 | |
| OPERATING REVENUES: | | | | | | | |
| Revenue, before fuel surcharge | | $ | 351,373 | | $ | 326,353 | | $ | 309,475 | |
| Fuel surcharge | | | 48,896 | | | 34,527 | | | 15,591 | |
| | | | | | | | | | | |
| Total operating revenues | | | 400,269 | | | 360,880 | | | 325,066 | |
| | | | | | | | | | | |
| OPERATING EXPENSES AND COSTS: | | | | | | | | | | |
| Salaries, wages and benefits | | | 127,539 | | | 122,005 | | | 119,519 | |
| Fuel expense | | | 97,286 | | | 81,017 | | | 55,645 | |
| Rents and purchased transportation | | | 43,844 | | | 39,074 | | | 38,938 | |
| Depreciation and amortization | | | 33,929 | | | 31,376 | | | 30,016 | |
| Operating supplies and expenses | | | 25,682 | | | 23,114 | | | 21,718 | |
| Operating taxes and licenses | | | 16,421 | | | 15,776 | | | 15,488 | |
| Insurance and claims | | | 16,389 | | | 15,992 | | | 15,820 | |
| Communications and utilities | | | 2,642 | | | 2,648 | | | 2,690 | |
| Other | | | 5,426 | | | 6,205 | | | 5,131 | |
| Loss on sale or disposal of equipment | | | 47 | | | 147 | | | 915 | |
| | | | | | | | | | | |
| Total operating expenses and costs | | | 369,205 | | | 337,354 | | | 305,880 | |
| | | | | | | | | | | |
| OPERATING INCOME | | | 31,064 | | | 23,526 | | | 19,186 | |
| | | | | | | | | | | |
| NON-OPERATING INCOME | | | 448 | | | 477 | | | 464 | |
| INTEREST EXPENSE | | | (1,475 | ) | | (1,881 | ) | | (1,758 | ) |
| | | | | | | | | | | |
| INCOME BEFORE INCOME TAXES | | | 30,037 | | | 22,122 | | | 17,892 | |
| | | | | | | | | | | |
| FEDERAL AND STATE INCOME TAXES: | | | | | | | | | | |
| Current | | | 9,768 | | | 7,572 | | | 479 | |
| Deferred | | | 2,305 | | | 1,411 | | | 6,825 | |
| | | | | | | | | | | |
| Total federal and state income taxes | | | 12,073 | | | 8,983 | | | 7,304 | |
| | | | | | | | | | | |
| NET INCOME | | $ | 17,964 | | $ | 13,139 | | $ | 10,588 | |
| | | | | | | | | | | |
| EARNINGS PER COMMON SHARE: | | | | | | | | | | |
| Basic | | $ | 1.74 | | $ | 1.20 | | $ | 0.94 | |
| | | | | | | | | | | |
| Diluted | | $ | 1.74 | | $ | 1.20 | | $ | 0.94 | |
| | | | | | | | | | | |
| AVERAGE COMMON SHARES OUTSTANDING: | | | | | | | | | | |
| Basic | | | 10,296 | | | 10,966 | | | 11,298 | |
| | | | | | | | | | | |
| Diluted | | | 10,302 | | | 10,976 | | | 11,324 | |
| | | | | | | | | | | |
| See notes to consolidated financial statements. |
P.A.M. TRANSPORTATION SERVICES, INC. AND SUBSIDIARIES CONSOLIDATED STATEMENTS OF STOCKHOLDERS’ EQUITY AND OTHER COMPREHENSIVE INCOME YEARS ENDED DECEMBER 31, 2006, 2005 AND 2004 (in thousands) | |
| | | Common Stock Shares / Amount | | Additional Paid-In Capital | | Other Comprehensive Income | | Accumulated Other Comprehensive Income | | Treasury Stock | | Retained Earnings | | Total | |
| BALANCE— January 1, 2004 | | | 11,294 | | $ | 113 | | $ | 75,957 | | | | | $ | 164 | | $ | - | | $ | 80,641 | | $ | 156,875 | |
| | | | | | | | | | | | | | | | | | | | | | | | | | |
| Components of comprehensive income: | | | | | | | | | | | | | | | | | | | | | | | | | |
| Net earnings | | | | | | | | | | | $ | 10,588 | | | | | | | | | 10,588 | | | 10,588 | |
| | | | | | | | | | | | | | | | | | | | | | | | | | |
| Other comprehensive gain: | | | | | | | | | | | | | | | | | | | | | | | | | |
| Unrealized gain on hedge, | | | | | | | | | | | | | | | | | | | | | | | | | |
| net of tax of $314 | | | | | | | | | | | | 481 | | | 481 | | | | | | | | | 481 | |
| Unrealized gain on marketable | | | | | | | | | | | | | | | | | | | | | | | | | |
| securities, net of tax of $371 | | | | | | | | | | | | 506 | | | 506 | | | | | | | | | 506 | |
| Total comprehensive income | | | | | | | | | | | $ | 11,575 | | | | | | | | | | | | | |
| | | | | | | | | | | | | | | | | | | | | | | | | | |
| Exercise of stock options-shares | | | | | | | | | | | | | | | | | | | | | | | | | |
| issued including tax benefits | | | 9 | | | | | | 93 | | | | | | | | | | | | | | | 93 | |
| | | | | | | | | | | | | | | | | | | | | | | | | | |
| BALANCE— December 31, 2004 | | | 11,303 | | | 113 | | | 76,050 | | | | | | 1,151 | | | - | | | 91,229 | | | 168,543 | |
| | | | | | | | | | | | | | | | | | | | | | | | | | |
| Components of comprehensive income: | | | | | | | | | | | | | | | | | | | | | | | | | |
| Net earnings | | | | | | | | | | | $ | 13,139 | | | | | | | | | 13,139 | | | 13,139 | |
| | | | | | | | | | | | | | | | | | | | | | | | | | |
| Other comprehensive gain: | | | | | | | | | | | | | | | | | | | | | | | | | |
| Unrealized gain on hedge, | | | | | | | | | | | | | | | | | | | | | | | | | |
| net of tax of $195 | | | | | | | | | | | | 282 | | | 282 | | | | | | | | | 282 | |
| Unrealized gain on marketable | | | | | | | | | | | | | | | | | | | | | | | | | |
| securities, net of tax of $189 | | | | | | | | | | | | 288 | | | 288 | | | | | | | | | 288 | |
| Total comprehensive income | | | | | | | | | | | $ | 13,709 | | | | | | | | | | | | | |
| | | | | | | | | | | | | | | | | | | | | | | | | | |
| Treasury stock repurchases | | | (1,059 | ) | | | | | | | | | | | | | | (17,869 | ) | | | | | (17,869 | ) |
| | | | | | | | | | | | | | | | | | | | | | | | | | |
| Exercise of stock options-shares | | | | | | | | | | | | | | | | | | | | | | | | | |
| issued including tax benefits | | | 41 | | | | | | 379 | | | | | | | | | | | | | | | 379 | |
| | | | | | | | | | | | | | | | | | | | | | | | | | |
| BALANCE— December 31, 2005 | | | 10,285 | | | 113 | | | 76,429 | | | | | | 1,721 | | | (17,869 | ) | | 104,368 | | | 164,762 | |
| | | | | | | | | | | | | | | | | | | | | | | | | | |
| Components of comprehensive income: | | | | | | | | | | | | | | | | | | | | | | | | | |
| Net earnings | | | | | | | | | | | $ | 17,964 | | | | | | | | | 17,964 | | | 17,964 | |
| | | | | | | | | | | | | | | | | | | | | | | | | | |
| Other comprehensive gain: | | | | | | | | | | | | | | | | | | | | | | | | | |
| Unrealized gain on hedge, | | | | | | | | | | | | | | | | | | | | | | | | | |
| net of tax of $13 | | | | | | | | | | | | 19 | | | 19 | | | | | | | | | 19 | |
| Unrealized gain on marketable | | | | | | | | | | | | | | | | | | | | | | | | | |
| securities, net of tax of $923 | | | | | | | | | | | | 1,402 | | | 1,402 | | | | | | | | | 1,402 | |
| Total comprehensive income | | | | | | | | | | | $ | 19,385 | | | | | | | | | | | | | |
| | | | | | | | | | | | | | | | | | | | | | | | | | |
| Exercise of stock options-shares | | | | | | | | | | | | | | | | | | | | | | | | | |
| issued including tax benefits | | | 18 | | | 1 | | | 369 | | | | | | | | | | | | | | | 370 | |
| | | | | | | | | | | | | | | | | | | | | | | | | | |
| Share-based compensation | | | | | | | | | 511 | | | | | | | | | | | | | | | 511 | |
| | | | | | | | | | | | | | | | | | | | | | | | | | |
| BALANCE— December 31, 2006 | | | 10,303 | | $ | 114 | | $ | 77,309 | | | | | $ | 3,142 | | $ | (17,869 | ) | $ | 122,332 | | $ | 185,028 | |
| | | | | | | | | | | | | | | | | | | | | | | | | | |
| See notes to consolidated financial statements. |
P.A.M. TRANSPORTATION SERVICES, INC. AND SUBSIDIARIES CONSOLIDATED STATEMENTS OF CASH FLOWS YEARS ENDED DECEMBER 31, 2006, 2005 AND 2004 (in thousands) | |
| | | 2006 | | 2005 | | 2004 | |
| OPERATING ACTIVITIES: | | | | | | | | | | |
| Net income | | $ | 17,964 | | $ | 13,139 | | $ | 10,588 | |
| Adjustments to reconcile net income to net cash provided by operating activities: | | | | | | | | | | |
| Depreciation and amortization | | | 33,929 | | | 31,376 | | | 30,016 | |
| Bad debt expense (recovery) | | | 310 | | | 1,428 | | | (410 | ) |
| Stock compensation—net of excess tax benefits | | | 441 | | | - | | | - | |
| Non-compete agreement amortization—net of payments | | | - | | | 37 | | | 88 | |
| Provision for deferred income taxes | | | 2,305 | | | 1,411 | | | 6,825 | |
| Reclassification of unrealized loss on marketable equity securities | | | 120 | | | 153 | | | - | |
| Gain on sale of marketable equity securities | | | (30 | ) | | - | | | - | |
| Loss on sale or disposal of equipment | | | 47 | | | 147 | | | 915 | |
| Changes in operating assets and liabilities: | | | | | | | | | | |
| Accounts receivable | | | 3,685 | | | (19,236 | ) | | (1,393 | ) |
| Prepaid expenses, inventories, and other assets | | | 440 | | | (40 | ) | | (8,279 | ) |
| Income taxes refundable | | | (202 | ) | | 528 | | | 502 | |
| Trade accounts payable | | | 2,219 | | | (5,881 | ) | | 7,202 | |
| Accrued expenses | | | (525 | ) | | 679 | | | (1,339 | ) |
| | | | | | | | | | | |
| Net cash provided by operating activities | | | 60,703 | | | 23,741 | | | 44,715 | |
| | | | | | | | | | | |
| INVESTING ACTIVITIES: | | | | | | | | | | |
| Purchases of property and equipment | | | (53,514 | ) | | (62,013 | ) | | (53,703 | ) |
| Proceeds from sale or disposal of equipment | | | 11,987 | | | 22,850 | | | 31,360 | |
| Net purchases of marketable equity securities | | | (1,203 | ) | | (1,884 | ) | | (2,423 | ) |
| Other | | | - | | | 20 | | | 36 | |
| | | | | | | | | | | |
| Net cash used in investing activities | | | (42,730 | ) | | (41,027 | ) | | (24,730 | ) |
| | | | | | | | | | | |
| FINANCING ACTIVITIES: | | | | | | | | | | |
| Borrowings under line of credit | | | 446,221 | | | 422,460 | | | 350,787 | |
| Repayments under line of credit | | | (463,967 | ) | | (405,277 | ) | | (353,656 | ) |
| Borrowings of long-term debt | | | 1,996 | | | 1,977 | | | 4,404 | |
| Repayments of long-term debt | | | (2,682 | ) | | (2,913 | ) | | (5,010 | ) |
| Repurchases of common stock | | | - | | | (17,869 | ) | | - | |
| Stock compensation excess tax benefits | | | 70 | | | - | | | - | |
| Exercise of stock options | | | 300 | | | 378 | | | 85 | |
| | | | | | | | | | | |
| Net cash used in financing activities | | | (18,062 | ) | | (1,244 | ) | | (3,390 | ) |
| | | | | | | | | | | |
| NET (DECREASE) INCREASE IN CASH AND CASH EQUIVALENTS | | | (89 | ) | | (18,530 | ) | | 16,595 | |
| | | | | | | | | | | |
| CASH AND CASH EQUIVALENTS—Beginning of year | | | 1,129 | | | 19,659 | | | 3,064 | |
| | | | | | | | | | | |
| CASH AND CASH EQUIVALENTS—End of year | | $ | 1,040 | | $ | 1,129 | | $ | 19,659 | |
| | | | | | | | | | | |
| SUPPLEMENTAL DISCLOSURES OF CASH FLOW INFORMATION— | | | | | | | | | | |
| Cash paid during the period for: | | | | | | | | | | |
| Interest | | $ | 1,481 | | $ | 1,928 | | $ | 1,774 | |
| Income taxes | | $ | 10,061 | | $ | 7,190 | | $ | 515 | |
| | | | | | | | | | | |
| NONCASH INVESTING AND FINANCING ACTIVITIES— | | | | | | | | | | |
| Purchases of revenue equipment included in accounts payable | | $ | 14,276 | | $ | - | | $ | - | |
| | | | | | | | | | | |
| See notes to consolidated financial statements. | | | | | | | | | | |
P.A.M. TRANSPORTATION SERVICES, INC. AND SUBSIDIARIES
NOTES TO CONSOLIDATED FINANCIAL STATEMENTS
YEARS ENDED DECEMBER 31, 2006, 2005, AND 2004
1.Audit Committee
| ACCOUNTING POLICIES
|
Description of Business and Principles of Consolidation-P.A.M. Transportation Services, Inc. (the “Company”), through its subsidiaries, operates as a truckload transportation and logistics company.
The consolidated financial statements include the accounts of the Company and its wholly owned operating subsidiaries: P.A.M. Transport, Inc., P.A.M. Dedicated Services, Inc., Choctaw Express, Inc., Allen Freight Services, Inc., Decker Transport Co., Inc., McNeill Express, Inc., T.T.X., Inc., Transcend Logistics, Inc., and East Coast Transport and Logistics, LLC. The following subsidiaries were inactive during all periods presented: P.A.M. International, Inc., P.A.M. Logistics Services, Inc., Choctaw Brokerage, Inc., P.A.M. Canada, Inc. and S & L Logistics, Inc. All significant intercompany accounts and transactions have been eliminated.
Use of Estimates-The preparation of financial statements in conformity with accounting principles generally accepted in the United States of America requires management to make estimates and assumptions that affect the reported amounts of assets and liabilities, disclosure of any contingent assets and liabilities at the financial statement date and reported amounts of revenue and expenses during the reporting period. The Company periodically reviews these estimates and assumptions. The Company's estimates were based on its historical experience and various other assumptions that the Company believes to be reasonable under the circumstances. Actual results could differ from those estimates.
Cash and Cash Equivalents-The Company considers all highly liquid investments with a maturity of three months or less when purchased to be cash equivalents.
Bank Overdrafts-The Company classifies bank overdrafts in current liabilities as an accounts payable and does not offset other positive bank account balances located at the same or other financial institutions. Bank overdrafts generally represent checks written that have not yet cleared the Company’s bank accounts. The majority of the Company’s bank accounts are zero balance accounts that are funded at the point items clear against the account by drawings against a line of credit, therefore the outstanding checks represent bank overdrafts. Because the recipients of these checks have generally not yet received payment, the Company continues to classify bank overdrafts as accounts payable. Bank overdrafts are classified as changes in accounts payable in the cash flows from operating activities section of the Company’s Consolidated Statement of Cash Flows. Bank overdrafts as of December 31, 2006, 2005, and 2004 were approximately $8,230,000, $7,455,000, and $16,451,000, respectively.
Accounts Receivable Other-The components of accounts receivable other consist primarily of company driver advances, owner operator advances and equipment manufacturer warranties. Advances receivable from company drivers as of December 31, 2006 and 2005, were approximately $503,000 and $484,000, respectively.
Accounts Receivable Allowance-An allowance is provided for accounts receivable based on historical collection experience. Additionally, management considers any accounts individually known to exhibit characteristics indicating a collection problem.
Marketable Equity Securities-Marketable equity securities, which are classified by the Company as available for sale, are carried at market value with unrealized gains and losses recognized in accumulated other comprehensive income in the statements of stockholders’ equity. Realized gains and losses are computed utilizing the specific identification method.
Impairment of Long-Lived Assets-The Company reviews its long-lived assets for impairment whenever events or changes in circumstances indicate that the carrying amount of a long-lived asset may not be recoverable. An impairment loss would be recognized if the carrying amount of the long-lived asset is not recoverable, and it exceeds its fair value. For long-lived assets classified as held and used, if the carrying value of the long-lived asset exceeds the sum of the future net cash flows, it is not recoverable. The Company does not separately identify assets by subsidiary, as tractors and trailers are routinely transferred from one division to another. As a result, none of the Company's long-lived assets have identifiable cash flows from use that are largely independent of the cash flows of other assets and liabilities. Thus, the asset group used to assess impairment would include all assets and liabilities of the Company.
Property and Equipment-Property and equipment is recorded at cost, less accumulated depreciation. For financial reporting purposes, the cost of such property is depreciated principally by the straight-line method. For tax reporting purposes, accelerated depreciation or applicable cost recovery methods are used. Depreciation is recognized over the estimated asset life, considering the estimated salvage value of the asset. Such salvage values are based on estimates using expected market values for used equipment and the estimated time of disposal which, in many cases include guaranteed residual values by the manufacturers. Gains and losses are reflected in the year of disposal. The following is a table reflecting estimated ranges of asset useful lives by major class of depreciable assets:
Asset ClassCompensation Committee
| Estimated Asset LifeExecutive Committee
|
| W. Scott Davis* | Matthew T. Moroun* | Matthew T. Moroun* |
| Franklin H. McLarty | Joseph A. Vitiritto | Joseph A. Vitiritto |
| H. Pete Montaño | | |
Service vehiclesMichael D. Bishop | 3-5 years | |
Office furniture and equipment | 3-7 years |
Revenue equipment | 3-10 years |
Structure and improvements | 5-30 years |
* Committee chairman
Prepaid Tires-Tires purchased with revenue equipment are capitalized as a cost of the related equipment. Replacement tires are included in prepaid expenses and deposits and are amortized over a 24-month period. Amounts paid for the recapping of tires are expensed when incurred.
Reclassifications-In order to conform to industry practice, the Company began to classify fuel surcharges charged to customers as revenue rather than as a reduction of operating supplies expense as had been presented in reports prior to the period ended June 30, 2004. During 2006, the Company began to separately display as a line item “Fuel expense” for amounts paid for fuel which previously had been aggregated with other operating supplies and included in the line item “Operating supplies”. These reclassifications have had no effect on operating income, net income or earnings per share. The Company has made corresponding reclassifications to comparative periods shown.
Advertising Expense-Advertising costs are expensed as incurred and totaled approximately $550,000, $350,000 and $1,100,000 for the years ended December 31, 2006, 2005, and 2004, respectively.
Repairs and Maintenance-Repairs and maintenance costs are expensed as incurred.
Goodwill-The Company follows the provisions of Statement of Financial Accounting Standards No. 142, Goodwill and Other Intangible Assets, (“SFAS No. 142”), which requires the Company to assess acquired goodwill for impairment at least annually in the absence of an indicator of possible impairment, and immediately upon an indicator of possible impairment. The Company has selected December 31 for its annual impairment testing and determined as of December 31, 2006 there was no impairment.
Self Insurance Liability—A liability is recognized for known health, workers’ compensation, cargo damage, property damage and auto liability damage. An estimate of the incurred but not reported claims for each type of liability is made based on historical claims made, estimated frequency of occurrence, and considering changing factors that contribute to the overall cost of insurance.
Income Taxes-The Company applies the provisions of Statement of Financial Accounting Standards No. 109, Accounting for Income Taxes (“SFAS No. 109”). Under this method, deferred tax liabilities and assets are determined based on the difference between the financial reporting basis and the tax reporting basis of assets and liabilities using enacted tax rates.
Revenue Recognition Policy-Revenue is recognized in full upon completion of delivery to the receiver’s location. For freight in transit at the end of a reporting period, the Company recognizes revenue pro rata based on relative transit miles completed as a portion of the estimated total transit miles. Expenses are recognized as incurred.
Share-Based Compensation-The Company adopted Statement of Financial Accounting Standards No. 123(R), Share-Based Payments, effective January 1, 2006, utilizing the “modified prospective” method as described in the standard. Under the “modified prospective” method, compensation cost is recognized for all share-based payments granted after the effective date and for all unvested awards granted prior to the effective date. Prior to adoption, the Company accounted for share-based payments under the recognition and measurement principles of Accounting Principles Board Opinion No. 25, Accounting for Stock Issued to Employees, and related interpretations. The Company uses historical volatility when estimating the expected volatility of its share price. For additional information with respect to share-based compensation, see Note 12 to our consolidated financial statements.
Earnings Per Share-The Company computes and presents earnings per share (“EPS”) in accordance with Statement of Financial Accounting Standards No. 128, Earnings per Share (“SFAS No. 128”). The difference between the Company's weighted-average shares outstanding and diluted shares outstanding is due to the dilutive effect of stock options for all periods presented. See Note 13 for computation of diluted EPS.
Business Segment and Concentrations of Credit Risk-The Company operates in one business segment, motor carrier operations. The Company provides truckload transportation services as well as brokerage and logistics services to customers throughout the United States and portions of Canada and Mexico. Truckload transportation services revenues, excluding fuel surcharges, represented 87.8%, 88.0%, and 86.4% of total revenues, excluding fuel surcharges, for the twelve months ended December 31, 2006, 2005, and 2004, respectively. Remaining revenues, excluding fuel surcharges, for each respective year were generated by brokerage and logistics services. The Company performs ongoing credit evaluations and generally does not require collateral from its customers. The Company maintains reserves for potential credit losses. In view of the concentration of the Company’s revenues and accounts receivable among a limited number of customers within the automobile industry, the financial health of this industry is a factor in the Company’s overall evaluation of accounts receivable.
Recent Accounting Pronouncements-In September 2006, the Financial Accounting Standards Board (“FASB”) issued Statement of Financial Accounting Standards No. 158, Employers’ Accounting for Defined Benefit Pension and Other Postretirement Plans — an amendment of FASB Statements No. 87, 88, 106, and 132(R) (“SFAS No. 158”). SFAS No. 158 requires recognition of a net liability or asset to report the funded status of defined benefit pension and other postretirement plans on the balance sheet and recognition (as a component of other comprehensive income) of changes in the funded status in the year in which the changes occur. Additionally, SFAS No. 158 requires measurement of a plan’s assets and obligations as of the balance sheet date and additional annual disclosures in the notes to the financial statements. The recognition and disclosure provisions of SFAS No. 158 are effective for fiscal years ending after December 15, 2006, while the requirement to measure a plan’s assets and obligations as of the balance sheet date is effective for fiscal years ending after December 15, 2008. Adoption of this statement did not have a material effect on the Company's consolidated financial statements.
In September 2006, the FASB issued Statement of Financial Accounting Standards No. 157, Fair Value Measurements (“SFAS No. 157”). SFAS No. 157 provides enhanced guidance for using fair value to measure assets and liabilities, establishes a common definition of fair value, provides a framework for measuring fair value under United States Generally Accepted Accounting Principles (“GAAP”) and expands disclosure requirements about fair value measurements. SFAS No. 157 is effective for financial statements issued in fiscal years beginning after November 15, 2007, and interim periods within those fiscal years. Management is currently evaluating the impact that adoption of SFAS No. 157 might have on the Company’s consolidated financial statements.
In September 2006, the Securities and Exchange Commission (“SEC”) issued Staff Accounting Bulletin No. 108, Considering the Effects of Prior Year Misstatements when Quantifying Misstatements in Current Year Financial Statements (“SAB 108”). Due to diversity in practice among registrants, SAB 108 expresses SEC staff views regarding the process by which misstatements in financial statements are evaluated for purposes of determining whether financial statement restatement is necessary. SAB 108 is effective for fiscal years ending after November 15, 2006, and early application is encouraged. The application of SAB 108 did not have a material effect on the Company’s consolidated financial statements.
In June 2006, the FASB issued Interpretation No. 48, Accounting for Uncertainty in Income Taxes (“FIN 48”). FIN 48 clarifies the accounting for uncertainty in income taxes recognized in an enterprise’s financial statements in accordance with Statement of Financial Accounting Standards No. 109, Accounting for Income Taxes. FIN 48 prescribes a recognition threshold and measurement attribute for the financial statement recognition and measurement of a tax position taken or expected to be taken in a tax return. In addition, FIN 48 provides guidance on derecognition, classification, interest and penalties, accounting in interim periods, disclosure, and transition and is effective for fiscal years beginning after December 15, 2006. Management is currently evaluating the impact that adoption of FIN 48 might have on the Company’s consolidated financial statements.
In May 2005, the Financial Accounting Standards Board (“FASB”) issued Statement of Financial Accounting Standards No. 154, Accounting Changes and Error Corrections, a replacement of APB Opinion No. 20 and FASB Statement No. 3 (“SFAS No. 154”). SFAS No. 154 requires retrospective application to prior periods' financial statements for changes in accounting principle, unless it is impracticable to determine either the period-specific effects or the cumulative effect of the change. This Statement applies to all voluntary changes in accounting principle as well as to changes required by an accounting pronouncement in the unusual instance that the pronouncement does not include specific transition provisions. SFAS No. 154 further requires a change in depreciation, amortization or depletion method for long-lived, non-financial assets to be accounted for as a change in accounting estimate effected by a change in accounting principle. Corrections of errors in the application of accounting principles will continue to be reported by retroactively restating the affected financial statements. The provisions of this statement are effective for accounting changes and correction of errors made in fiscal years beginning after December 15, 2005. Adoption of this statement did not have a material effect on the Company's consolidated financial statements.
In December 2004, the FASB issued Statement of Financial Accounting Standards No. 123(R), Share-Based Payment, (“SFAS No. 123(R)”) which replaces SFAS No. 123, Accounting for Stock-Based Compensation, and supersedes APB Opinion No. 25, Accounting for Stock Issued to Employees. SFAS No. 123(R) requires compensation costs relating to share-based payment transactions be recognized in financial statements. The pro forma disclosure previously permitted under SFAS No. 123 will no longer be an acceptable alternative to recognition of expenses in the financial statements. SFAS No. 123(R) was originally to be effective as of the beginning of the first interim or annual reporting period that begins after June 15, 2005, with early adoption encouraged. In April 2005, the Securities and Exchange Commission announced the adoption of a new rule that amends the effective date of SFAS No. 123(R). The Company adopted this standard on January 1, 2006 and now reports in its financial statements the share-based compensation expense for reporting periods beginning in 2006. See note 12 for additional information.
2.
| TRADE ACCOUNTS RECEIVABLE
|
The Company's receivables result primarily from the sale of transportation and logistics services. The Company performs ongoing credit evaluations of its customers and generally does not require collateral for accounts receivable. Accounts receivable which consist of both billed and unbilled receivables are recorded at their invoiced amount and are presented net of an allowance for doubtful accounts. Accounts outstanding longer than contractual payment terms are considered past due and are reviewed individually for collectibility. Accounts receivable balances consist of the following components as of December 31, 2006 and 2005:
| | | 2006 | | 2005 | |
| | | (in thousands) | |
| | | | | | |
| Billed | | $ | 55,132 | | $ | 56,953 | |
| Unbilled | | | 7,794 | | | 10,510 | |
| Allowance for doubtful accounts | | | (1,457 | ) | | (2,030 | ) |
| | | | | | | | |
| Total accounts receivable—net | | $ | 61,469 | | $ | 65,433 | |
An analysis of changes in the allowance for doubtful accounts for the years ended December 31, 2006, 2005, and 2004 follows:
| | | 2006 | | 2005 | | 2004 | |
| | | (in thousands) | |
| | | | | | | | |
| Balance—beginning of year | | $ | 2,030 | | $ | 768 | | $ | 834 | |
| Provision for bad debts | | | 354 | | | 1,490 | | | 430 | |
| Charge-offs | | | (960 | ) | | (228 | ) | | (701 | ) |
| Recoveries | | | 33 | | | - | | | 205 | |
| Balance—end of year | | $ | 1,457 | | $ | 2,030 | | $ | 768 | |
The December 31, 2004 charge-offs include $205,000 that was written off in prior periods and recovered during 2004. However, the December 31, 2004 charge-offs and recoveries do not include an amount representing an approximate $635,000 reduction in liability and bad debt expense resulting from the settlement of a lawsuit (see Note 15).
3.
| MARKETABLE EQUITY SECURITIES
|
The Company accounts for its marketable securities in accordance with Statement of Financial Accounting Standards No. 115, Accounting for Certain Investments in Debt and Equity Securities (“SFAS No. 115”). SFAS No. 115 requires companies to classify their investments as either trading, available-for-sale or held-to-maturity. The Company’s investments in marketable securities are classified as available-for-sale and consist of equity securities. Management determines the appropriate classification of these securities at the time of purchase and re-evaluates such designation as of each balance sheet date. During 2006, the Company received proceeds of approximately $85,000 for the sale of marketable equity securities with a combined cost of approximately $55,000, resulting in a realized gain of approximately $30,000. During 2006 and 2005, there were no reclassifications of marketable securities. Marketable equity securities are carried at fair value, with the unrealized gains and losses, net of tax, included as a component of accumulated other comprehensive income in shareholders’ equity. The cost of securities sold is based on the specific identification method. Interest and dividends on securities classified as available-for-sale are included in non-operating income. Realized gains and losses, and declines in value judged to be other-than-temporary on available-for-sale securities, if any, are included in the determination of net income as gains (losses) on the sale of securities.
As of December 31, 2006, these equity securities had a combined cost basis of approximately $9,189,000 and a combined fair market value of approximately $14,437,000. For the year ended December 31, 2006, the Company had net unrealized gains in market value of approximately $1,402,000, net of deferred income taxes. These securities had gross unrealized gains of approximately $5,260,000 and gross unrealized losses of approximately $12,000. As of December 31, 2006, the total unrealized gain, net of deferred income taxes, in accumulated other comprehensive income was approximately $3,142,000.
As of December 31, 2005, the Company’s equity securities had a combined original cost of approximately $8,291,000 and a combined fair market value of approximately $10,999,000. For the year ended December 31, 2005, the Company had net unrealized gains in market value of approximately $288,000, net of deferred income taxes. These securities had gross unrealized gains of approximately $3,150,000 and gross unrealized losses of approximately $219,000. As of December 31, 2005, the total unrealized gain, net of deferred income taxes, in accumulated other comprehensive income was approximately $1,740,000.
The following table shows the Company’s investments’ approximate gross unrealized losses and fair value at December 31, 2006 and 2005. These investments are all classified as available-for-sale and consist of equity securities. As of December 31, 2006 and 2005 there were no investments that had been in a continuous unrealized loss position for twelve months or longer.
| | | 2006 | | 2005 | |
| | | (in thousands) | |
| | | | | Unrealized | | | | Unrealized | |
| | | Fair Value | | Losses | | Fair Value | | Losses | |
| | | | | | | | | | |
| Equity securities | | $ | 417 | | $ | 12 | | $ | 1,283 | | $ | 219 | |
| | | | | | | | | | | | | | |
| Totals | | $ | 417 | | $ | 12 | | $ | 1,283 | | $ | 219 | |
The Company applies the provisions of Statement of Financial Accounting Standards No. 142, Goodwill and Other Intangible Assets (“SFAS No. 142”), which requires the Company to assess acquired goodwill for impairment at least annually in the absence of an indicator of possible impairment, and immediately upon an indicator of possible impairment. The annual assessment of impairment was completed on December 31, 2006 and the Company determined there was no impairment as of that date. Goodwill at December 31 is summarized as follows:
| | | 2006 | | 2005 | | 2004 | |
| | | (in thousands) | |
| | | | | | | | |
| Goodwill, beginning of year | | $ | 15,413 | | $ | 15,413 | | $ | 15,413 | |
| Goodwill acquired | | | - | | | - | | | - | |
| Goodwill impairment | | | - | | | - | | | - | |
| | | | | | | | | | | |
| Goodwill—end of year | | $ | 15,413 | | $ | 15,413 | | $ | 15,413 | |
Non-compete agreements are amortized on a straight-line basis over the contractual term of the related agreement. Amortization expense associated with non-compete agreements was approximately $200,000, $237,000 and $350,000, for the years ending December 31, 2006, 2005 and 2004. The Company's non-compete agreements at December 31 are summarized as follows:
| | | 2006 | | 2005 | |
| | | (in thousands) | |
| | | | | | |
| Non-compete agreements, original cost | | $ | 1,000 | | $ | 1,300 | |
| Accumulated amortization | | | (783 | ) | | (883 | ) |
| | | | | | | | |
| Non-compete agreements—net | | $ | 217 | | $ | 417 | |
Over the remaining life of the non-compete agreement currently held by the Company, approximately $200,000 of amortization expense will be recognized during 2007 and $17,000 will be recognized in 2008.
5.
| ACCRUED EXPENSES AND OTHER LIABILITIES
|
Accrued expenses and other liabilities at December 31 are summarized as follows:
| | | 2006 | | 2005 | |
| | | (in thousands) | |
| | | | | | |
| Payroll | | $ | 1,779 | | $ | 1,521 | |
| Accrued vacation | | | 1,827 | | | 1,632 | |
| Taxes—other than income | | | 2,591 | | | 2,337 | |
| Interest | | | 80 | | | 86 | |
| Driver escrows | | | 939 | | | 873 | |
| Self-insurance claims reserves | | | 2,778 | | | 4,058 | |
| | | | | | | | |
| Total accrued expenses and other liabilities | | $ | 9,994 | | $ | 10,507 | |
With respect to physical damage for tractors, cargo loss and auto liability, the Company maintains insurance coverage to protect it from certain business risks. These policies are with various carriers and have per occurrence deductibles of $2,500, $10,000 and $2,500 respectively. Since 2002, the Company has elected to self insure itself for physical damage to trailers. The Company maintains workers’ compensation coverage in Arkansas, Ohio, Oklahoma, Mississippi, and Florida with a $500,000 self-insured retention and a $500,000 per occurrence excess policy. The Company has elected to opt out of workers' compensation coverage in Texas and is providing coverage through the P.A.M. Texas Injury Plan. The Company has reserved for estimated losses to pay such claims as well as claims incurred but not yet reported. The Company has not experienced any adverse trends involving differences in claims experienced versus claims estimates for workers’ compensation claims. Letters of credit aggregating $400,000 are held by a bank as security for workers’ compensation claims. The Company self insures for employee health claims with a stop loss of $200,000 per covered employee per year and estimates its liability for claims incurred but not reported.
Long-term debt at December 31, consists of the following:
| | | 2006 | | 2005 | |
| | | (in thousands) | |
| Line of credit with a bank—due May 31, 2007, and | | | | | | | |
| collateralized by accounts receivable (1) | | $ | 14,437 | | $ | 17,183 | |
| Line of credit with a bank—due June 30, 2008, and | | | | | | | |
| collateralized by revenue equipment (2) | | | 5,000 | | | 20,000 | |
| Note payable (3) | | | 2,510 | | | 3,208 | |
| Other (4) | | | 1,173 | | | 1,161 | |
| Total long-term debt | | $ | 23,120 | | | 41,552 | |
| | | | | | | | |
| Less current maturities | | | (1,915 | ) | | (1,859 | ) |
| | | | | | | | |
| Long-term debt—net of current maturities | | $ | 21,205 | | $ | 39,693 | |
(1) | Line of credit agreement with a bank provides for maximum borrowings of $20.0 million and contains certain restrictive covenants that must be maintained by the Company on a consolidated basis. Borrowings on the line of credit are at an interest rate of LIBOR as of the first day of the month plus 1.25% (6.60% at December 31, 2006). Monthly payments of interest are required under this agreement. Also, under the terms of the agreement the Company must have (a) positive net income, (b) a debt to equity ratio of no more than 4:1, (c) a debt service coverage ratio of at least 1:1, and (d) maintain a tangible net worth of at least $40 million. The Company was in compliance with all provisions of the agreement at December 31, 2006. The Company has the intent and ability to extend the terms of this agreement for an additional one year period until May 31, 2008 and accordingly has classified the debt as long-term. |
(2) | Line of credit agreement with a bank provides for maximum borrowings of $30.0 million and contains certain restrictive covenants that must be maintained by the Company on a consolidated basis. Borrowings on the line of credit are at an interest rate of LIBOR as of the last day of the previous month plus 1.15% (6.50% at December 31, 2006). Monthly payments of interest are required under this agreement. Also, under the terms of the agreement the Company must have (a) positive net income, (b) a funded debt to EBITDA ratio of less than 3:1, (c) a leverage ratio of less than 3:1, and (d) maintain a tangible net worth of at least $42 million increased by (1) 50% of cumulative quarterly net income and (2) proceeds of any public stock offering. The Company was in compliance with all provisions of the agreement at December 31, 2006. |
(3) | 6.0% note to the former owner of an acquired entity with an original face amount of $4,974,612, payable in monthly installments of $72,672 through March 2010. |
(4) | 6.0% note to insurance premium finance company at December 31, 2006 with an original face amount of $1,995,916, payable in monthly installments of $170,927 through August 2007. |
The Company has provided letters of credit to third parties totaling approximately $3,504,000 at December 31, 2006. The letters are held by these third parties to assist such parties in collection of any amounts due by the Company should the Company default in its commitments to the parties.
Scheduled annual maturities on long-term debt outstanding at December 31, 2006, are:
| | | (in thousands) | |
| | | | |
| 2007 | | $ | 1,915 | |
| 2008 | | | 20,225 | |
| 2009 | | | 836 | |
| 2010 | | | 144 | |
| 2011 | | | - | |
| | | | | |
| Total | | $ | 23,120 | |
The Company's authorized capital stock consists of 40,000,000 shares of common stock, par value $.01 per share, and 10,000,000 shares of preferred stock, par value $.01 per share. At December 31, 2006, there were 11,362,207 shares of our common stock issued and 10,303,607 shares outstanding. No shares of our preferred stock were issued or outstanding at December 31, 2006.
Common Stock
The holders of our common stock, subject to such rights as may be granted to any preferred stockholders, elect all directors and are entitled to one vote per share. All shares of common stock participate equally in dividends when and as declared by the Board of Directors and in net assets on liquidation. The shares of common stock have no preference, conversion, exchange, preemptive or cumulative voting rights.
Preferred Stock
Preferred stock may be issued from time to time by our Board of Directors, without stockholder approval, in such series and with such preferences, conversion or other rights, voting powers, restrictions, limitations as to dividends, qualifications or other provisions, as may be fixed by the Board of Directors in the resolution authorizing their issuance. The issuance of preferred stock by the Board of Directors could adversely affect the rights of holders of shares of common stock; for example, the issuance of preferred stock could result in a class of securities outstanding that would have certain preferences with respect to dividends and in liquidation over the common stock, and that could result in a dilution of the voting rights, net income per share and net book value of the common stock. As of December 31, 2006, we have no agreements or understandings for the issuance of any shares of preferred stock.
Treasury Stock
During April 2005 our Board of Directors authorized the repurchase of up to 600,000 shares of our common stock during the six month period ending October 11, 2005. These 600,000 shares were all repurchased by September 30, 2005. On September 6, 2005 our Board of Directors authorized an extension of the stock repurchase program until September 2006 and the repurchase of up to an additional 900,000 shares of our common stock. The Company repurchased 458,600 of these additional shares prior to December 31, 2005 and made no additional purchases during 2006.
The company accounts for Treasury stock using the cost method and as of December 31, 2006, 1,058,600 shares were held in the treasury at an aggregate cost of approximately $17,869,000.
Comprehensive income was comprised of net income plus or minus market value adjustments related to fuel hedges, interest rate swap agreements and marketable securities. The components of comprehensive income were as follows:
| | | 2006 | | 2005 | | 2004 | |
| | | (in thousands) | |
| | | | | | | | |
| Net income | | $ | 17,964 | | $ | 13,139 | | $ | 10,588 | |
| | | | | | | | | | | |
| Other comprehensive income (loss): | | | | | | | | | | |
| Reclassification adjustment for losses on | | | | | | | | | | |
| derivative instruments included in net income | | | | | | | | | | |
| accounted for as hedges, net of income taxes | | | 18 | | | 227 | | | 444 | |
| Reclassification adjustment for unrealized | | | | | | | | | | |
| losses on marketable securities, included in | | | | | | | | | | |
| net income, net of income taxes | | | 53 | | | 91 | | | - | |
| Change in fair value of interest rate | | | | | | | | | | |
| swap agreements, net of income taxes | | | 1 | | | 55 | | | 37 | |
| Change in fair value of marketable | | | | | | | | | | |
| securities, net of income taxes | | | 1,349 | | | 197 | | | 506 | |
| | | | | | | | | | | |
| Total comprehensive income | | $ | 19,385 | | $ | 13,709 | | $ | 11,575 | |
10.
| SIGNIFICANT CUSTOMERS AND INDUSTRY CONCENTRATION
|
In 2006, 2005, and 2004, one customer, who is in the automobile manufacturing industry, accounted for 41%, 39%, and 44% of revenues, respectively. The Company also provides transportation services to other manufacturers who are suppliers for automobile manufacturers including suppliers for the Company’s largest customer. As a result, concentration of the Company’s business within the automobile industry is significant. Of the Company’s revenues for 2006, 2005, and 2004, 52%, 52%, and 56%, respectively, were derived from transportation services provided to the automobile manufacturing industry. Accounts receivable from the largest customer totaled approximately $30,042,830 and $36,075,000 at December 31, 2006 and 2005, respectively.
11.
| FEDERAL AND STATE INCOME TAXES
|
Under SFAS No. 109, deferred income taxes reflect the net tax effects of temporary differences between the carrying amounts of assets and liabilities for financial reporting purposes and for income tax reporting purposes.
Significant components of the Company’s deferred tax liabilities and assets at December 31 are as follows:
| | | 2006 | | 2005 | |
| | | (in thousands) | |
| | | Current | | Long-Term | | Current | | Long-Term | |
| | | | | | | | | | |
| Deferred tax liabilities: | | | | | | | | | | | | | |
| Property and equipment | | $ | - | | $ | 49,731 | | $ | - | | $ | 47,735 | |
| Unrealized gains on securities | | | 2,113 | | | - | | | 1,190 | | | - | |
| Prepaid expenses and other | | | 5,665 | | | 2,920 | | | 8,089 | | | 30 | |
| | | | | | | | | | | | | | |
| Total deferred tax liabilities | | | 7,778 | | | 52,651 | | | 9,279 | | | 47,765 | |
| | | | | | | | | | | | | | |
| Deferred tax assets: | | | | | | | | | | | | | |
| Allowance for doubtful accounts | | | 553 | | | - | | | 520 | | | - | |
| Compensated absences | | | 564 | | | - | | | 496 | | | - | |
| Self-insurance allowances | | | 664 | | | - | | | 1,022 | | | - | |
| Hedging derivative | | | - | | | - | | | 13 | | | - | |
| Share-based compensation | | | - | | | 242 | | | - | | | 48 | |
| Bonus compensation | | | 235 | | | - | | | 70 | | | - | |
| Non-competition agreement | | | - | | | 507 | | | - | | | 520 | |
| Other | | | 104 | | | - | | | 24 | | | - | |
| | | | | | | | | | | | | | |
| Total deferred tax assets | | | 2,120 | | | 749 | | | 2,145 | | | 568 | |
| | | | | | | | | | | | | | |
| Net deferred tax liability | | $ | 5,658 | | $ | 51,902 | | $ | 7,134 | | $ | 47,197 | |
The reconciliation between the effective income tax rate and the statutory Federal income tax rate for the years ended December 31, 2006, 2005 and 2004 is presented in the following table:
| | | 2006 | | 2005 | | 2004 | |
| | | (in thousands) | |
| | | Amount | | Percent | | Amount | | Percent | | Amount | | Percent | |
| | | | | | | | | | | | | | |
| Income tax at the | | | | | | | | | | | | | | | | | | | |
| statutory federal rate | | $ | 10,513 | | | 35.0 | | $ | 7,743 | | | 35.0 | | $ | 6,083 | | | 34.0 | |
| Nondeductible expense | | | 378 | | | 1.3 | | | 450 | | | 2.0 | | | 484 | | | 2.7 | |
| State income taxes—net | | | | | | | | | | | | | | | | | | | |
| of federal benefit | | | 1,182 | | | 3.9 | | | 790 | | | 3.6 | | | 737 | | | 4.1 | |
| Total income taxes | | $ | 12,073 | | | 40.2 | | $ | 8,983 | | | 40.6 | | $ | 7,304 | | | 40.8 | |
The provision for income taxes consisted of the following:
| | | 2006 | | 2005 | | 2004 | |
| | | (in thousands) | |
| | | | | | | | |
Current: | | | | | | | | | | |
| Federal | | $ | 8,397 | | $ | 6,422 | | $ | - | |
| State | | | 1,371 | | | 1,150 | | | 479 | |
| | | | 9,768 | | | 7,572 | | | 479 | |
Deferred: | | | | | | | | | | |
| Federal | | | 1,768 | | | 876 | | | 6,076 | |
| State | | | 537 | | | 535 | | | 749 | |
| | | | 2,305 | | | 1,411 | | | 6,825 | |
| | | | | | | | | | | |
| Total income tax expense | | $ | 12,073 | | $ | 8,983 | | $ | 7,304 | |
12.
| SHARE-BASED COMPENSATION
|
The Company maintains a stock option plan under which incentive stock options and nonqualified stock options may be granted. On March 2, 2006, the Company’s Board of Director’s adopted, and shareholders later approved, the 2006 Stock Option Plan (the “2006 Plan”). The 2006 Plan replaces the expired 1995 Stock Option Plan which had 263,500 options remaining which were never issued. Under the 2006 Plan 750,000 shares are reserved for the issuance of stock options to directors, officers, key employees and others. The option exercise price under the 2006 Plan is the fair market value of the stock on the date the option is granted. The fair market value is determined by the average of the highest and lowest sales prices for a share of the Company’s common stock, on its primary exchange, on the same date that the option is granted. During 2006, 16,000 options were issued under the 2006 Plan at an option exercise price of $26.73 and at December 31, 2006, 734,000 shares were available for granting future options.
Outstanding incentive stock options at December 31, 2006, must be exercised within six years from the date of grant and vest in increments of 20% each year. Outstanding nonqualified stock options at December 31, 2006, must be exercised within five to ten years from the date of grant.
In August 2002, the Company granted performance-based variable stock options for 300,000 shares to certain key executives. The exercise price for these awards was fixed at the grant date and was equal to the fair market value of the stock on that date. On the date of grant, options for 60,000 shares vested immediately and vesting of the options for the remaining 240,000 shares was scheduled to occur on a straight-line basis each year from March 15, 2003 through March 15, 2008 upon meeting performance criteria. In order to meet the performance criteria, net income for each fiscal year must be at least equal to 1.05 times net income for the preceding fiscal year, unless net income for the preceding fiscal year was zero or negative, in which case net income for the fiscal year must be at least 90% of net income for the most recent year with positive income. The number of shares for which options vest each fiscal year will not be known until the date the performance criteria is measured. As of December 31, 2006, options for 140,000 shares have vested under this 300,000 share option grant (including those options which immediately vested upon grant) while options for 80,000 shares have been forfeited as the performance criteria were not met for the fiscal years 2003 and 2004.
Transactions in stock options under these plans are summarized as follows:
| | | Shares Under Option | | Weighted- Average Exercise Price | |
| | | | | | |
| Outstanding—January 1, 2004: | | | 348,500 | | $ | 20.85 | |
| Granted | | | 14,000 | | | 16.99 | |
| Exercised | | | (9,000 | ) | | 9.39 | |
| Canceled | | | (40,000 | ) | | 23.22 | |
| | | | | | | | |
| Outstanding—December 31, 2004: | | | 313,500 | | $ | 20.70 | |
| Granted | | | 14,000 | | | 18.27 | |
| Exercised | | | (41,000 | ) | | 9.21 | |
| | | | | | | | |
| Outstanding—December 31, 2005: | | | 286,500 | | $ | 22.22 | |
| Granted | | | 16,000 | | | 26.73 | |
| Exercised | | | (18,000 | ) | | 16.67 | |
| | | | | | | | |
| Outstanding—December 31, 2006: | | | 284,500 | | $ | 22.83 | |
| | | | | | | | |
| Options exercisable—December 31, 2006: | | | 202,000 | | $ | 22.71 | |
Effective January 1, 2006, the Company adopted FASB Statement No. 123(R), Share-Based Payment, (“SFAS No. 123(R)”) utilizing the “modified prospective” method as described in SFAS No. 123(R). In the “modified prospective” method, compensation cost is recognized for all share-based payments granted after the effective date and for all unvested awards granted prior to the effective date. In accordance with SFAS No. 123(R), prior period amounts were not restated. As of December 31, 2006 all option awards are classified as equity awards.
Prior to January 1, 2006, the stock-based compensation plans were accounted for based on the intrinsic value method under Accounting Principles Board Opinion No. 25, Accounting for Stock Issued to Employees, (“APB Opinion No. 25”) and related interpretations. Pro-forma information regarding the impact of total stock-based compensation on net income and income per share for prior periods is required by SFAS No. 123(R). Such pro-forma information, determined as if the Company had accounted for its employee stock options under the fair value method during the years ending December 31, 2005 and 2004, is illustrated in the following table:
| | | 2005 | | 2004 | |
| | | (in thousands, except per share data) | |
| | | | | | |
| Net income—as reported | | $ | 13,139 | | $ | 10,588 | |
| Deduct total stock-based employee compensation expense | | | | | | | |
| determined under fair value based method for | | | | | | | |
| all awards—net of related tax effects | | | (296 | ) | | (292 | ) |
| | | | | | | | |
| Pro forma net income | | $ | 12,843 | | $ | 10,296 | |
| Earnings per share: | | | | | | | |
| Basic—as reported | | $ | 1.20 | | $ | 0.94 | |
| Basic—pro forma | | $ | 1.17 | | $ | 0.91 | |
| | | | | | | | |
| Diluted—as reported | | $ | 1.20 | | $ | 0.94 | |
| Diluted—pro forma | | $ | 1.17 | | $ | 0.91 | |
The fair value of the Company’s employee stock options was estimated at the date of grant using a Black-Scholes-Merton (“BSM”) option-pricing model using the following assumptions:
| | 2006 | 2005 | 2004 |
| | | | |
| Dividend yield | 0% | 0% | 0% |
| Volatility range | 33.34%—38.54% | 33.86%—38.54% | 35.37%—38.54% |
| Risk-free rate range | 4.38%—5.02% | 4.08%—4.38% | 2.70%—4.38% |
| Expected life | 2.5 years—5 years | 5 years | 5 years |
| Fair value of options | $6.93—$9.45 | $6.73—$9.45 | $6.62—$9.45 |
The Company has never paid any cash dividends on its common stock and we do not anticipate paying any cash dividends in the foreseeable future. The estimated volatility is based on the historical volatility of our stock. The risk free rate for the periods within the expected life of the option is based on the U.S. Treasury yield curve in effect at the time of grant. The expected life of the options are calculated using temporary guidance provided by the Securities and Exchange Commission which allows companies to elect a “simplified method” where the expected life is the average of the vesting period and the original contractual term. This simplified method is not available for share option grants after December 31, 2007.
Information related to the Company’s option activity as of December 31, 2006, and changes during the year then ended is presented below:
| | | Number of Options | | Weighted- Average Exercise Price | | Weighted- Average Remaining Contractual Term | | Aggregate Intrinsic Value* | |
| | | | | | | (in years) | | | |
| Outstanding at January 1, 2006 | | | 286,500 | | $ | 22.22 | | | | | | | |
| Granted | | | 16,000 | | | 26.73 | | | | | | | |
| Exercised | | | (18,000 | ) | | 16.67 | | | | | | | |
| Canceled/forfeited/expired | | | - | | | - | | | | | | | |
| Outstanding at December 31, 2006 | | | 284,500 | | $ | 22.83 | | | 5.0 | | $ | 116,910 | |
| | | | | | | | | | | | | | |
Fully vested and exercisable at December 31, 2006 | | | 202,000 | | $ | 22.71 | | | 4.8 | | $ | 111,560 | |
| ___________________________ | | | | | | | | | | | | | |
| * The intrinsic value of a stock option is the amount by which the market value of the underlying stock exceeds the exercise price of the option. The per share market value of our common stock, as determined by the closing price on December 31, 2006, was $22.02. |
The weighted-average grant-date fair value of options granted during the years 2006, 2005, and 2004 was $6.93, $6.73, and $6.62, respectively. The total intrinsic value of options exercised during the years ended December 31, 2006, 2005, and 2004, was approximately $175,000, $323,000, and $87,000, respectively.
A summary of the status of the Company’s nonvested options as of December 31, 2006 and changes during the year ended December 31, 2006, is presented below:
| | | Number of Options | | Weighted- Average Grant Date Fair Value | |
| | | | | | |
| Nonvested at January 1, 2006 | | | 125,000 | | $ | 9.43 | |
| Granted | | | 16,000 | | | 6.93 | |
| Vested | | | (58,500 | ) | | 8.74 | |
| Canceled/forfeited/expired | | | - | | | - | |
| | | | | | | | |
| Nonvested at December 31, 2006 | | | 82,500 | | $ | 9.43 | |
| | | | | | | | |
The total fair value of options vested during 2006, 2005, and 2004 was approximately $511,000, $494,000, and $493,000, respectively. As of December 31, 2006, the Company had stock-based compensation plans with total unvested stock-based compensation expense of approximately $800,000 which is being amortized on a straight-line basis over the remaining vesting period. As a result, the Company expects to recognize approximately $400,000 in additional compensation expense related to unvested option awards during each of the years 2007 and 2008. Total pre-tax stock-based compensation expense, recognized in Salaries, wages and benefits was approximately $511,000 during 2006 and includes approximately $111,000 recognized as a result of the annual grant of 2,000 shares to each non-employee director during the second quarter of 2006. The Company recognized a total income tax benefit of approximately $197,000 related to stock-based compensation expense during 2006. The recognition of stock-based compensation expense decreased diluted and basic earnings per common share by approximately $0.03 during 2006. No stock-based compensation expense or related tax benefits were recognized during 2005 or 2004.
The number, weighted average exercise price and weighted average remaining contractual life of options outstanding as of December 31, 2006 and the number and weighted average exercise price of options exercisable as of December 31, 2006 is as follows:
Exercise Price | | Options Outstanding | | Weighted-Average Remaining Contractual Term | | Options Exercisable |
| | | | | (in years) | | |
| $16.99 | | 8,000 | | 2.2 | | 8,000 |
| $18.27 | | 12,000 | | 3.2 | | 12,000 |
| $19.88 | | 12,500 | | 1.8 | | 10,000 |
| $20.79 | | 4,000 | | 0.2 | | 4,000 |
| $22.68 | | 12,000 | | 1.2 | | 12,000 |
| $23.22 | | 220,000 | | 5.7 | | 140,000 |
| $26.73 | | 16,000 | | 4.5 | | 16,000 |
| | | 284,500 | | 5.0 | | 202,000 |
Cash received from option exercises totaled approximately $300,000, $378,000, and $85,000 during the years ended December 31, 2006, 2005, and 2004, respectively. The Company issues new shares upon option exercise.
The Company applies SFAS No. 128 for computing and presenting earnings per share. Basic earnings per common share were computed by dividing net income by the weighted average number of shares outstanding during the period. Diluted earnings per common share were calculated as follows:
| | | For the Year Ended December 31, | |
| | | 2006 | | 2005 | | 2004 | |
| | | (in thousands, except per share data) | |
| | | | | | | | |
| Net income | | $ | 17,964 | | $ | 13,139 | | $ | 10,588 | |
| | | | | | | | | | | |
| Basic weighted average common shares outstanding | | | 10,296 | | | 10,966 | | | 11,298 | |
| Dilutive effect of common stock equivalents | | | 6 | | | 10 | | | 26 | |
| | | | | | | | | | | |
| Diluted weighted average common shares outstanding | | | 10,302 | | | 10,976 | | | 11,324 | |
| | | | | | | | | | | |
| Basic earnings per share | | $ | 1.74 | | $ | 1.20 | | $ | 0.94 | |
| | | | | | | | | | | |
| Diluted earnings per share | | $ | 1.74 | | $ | 1.20 | | $ | 0.94 | |
Options to purchase 229,337, 280,160, and 254,500 shares of common stock were outstanding as of December 31, 2006, 2005, and 2004, respectively, but were not included in the computation of diluted earnings per share because to do so would have an anti-dilutive effect.
The Company sponsors a profit sharing plan for the benefit of all eligible employees. The plan qualifies under Section 401(k) of the Internal Revenue Code thereby allowing eligible employees to make tax-deductible contributions to the plan. The plan provides for employer matching contributions of 50% of each participant’s voluntary contribution up to 3% of the participant’s compensation and vests at the rate of 20% each year until fully vested after five years. Total employer matching contributions to the plan totaled approximately $330,000, $300,000 and $280,000 in 2006, 2005 and 2004, respectively.
15.
| COMMITMENTS AND CONTINGENCIES
|
During 2004, a suit which was originally filed on October 10, 2002 against one of the Company's subsidiaries was settled in the amount of $25,000. The suit, which was filed in the United States Bankruptcy Court for the District of Delaware, alleged preferential transfers of $660,055 were made to the defendant, Allen Freight Services Co., within the 90 day period preceding the bankruptcy petition date of Bill's Dollar Stores, Inc. The Company had originally established a liability for the entire potential loss of $660,055; however, as a result of a settlement in the amount of $25,000 approximately $635,000 has been removed as a liability on the Company's financial statements and the related expense originally recorded as a bad debt expense has been reduced.
As to other matters, the Company is not a party to any pending legal proceedings which management believes to be material to the financial position or results of operations of the Company. The Company maintains liability insurance against risks arising out of the normal course of its business.
The Company leases certain premises under noncancelable operating lease agreements. Future minimum annual lease payments under these leases are as follows:
| 2007 | | $ | 559,815 | |
| 2008 | | | 377,675 | |
| 2009 | | | 255,761 | |
| 2010 | | | 165,000 | |
| 2011 | | | - | |
| | | | | |
| Total | | $ | 1,358,251 | |
Total rental expense, net of amounts reimbursed for the years ended December 31, 2006, 2005 and 2004 was approximately $2,369,000, $1,760,000, and $1,304,000, respectively.
16.
| FAIR VALUE OF FINANCIAL INSTRUMENTS
|
Statement of Financial Accounting Standards No. 107, Disclosure About Fair Value of Financial Instruments, (“SFAS No. 107”) requires disclosure of fair value information about financial instruments, whether or not recognized in the balance sheet, for which it is practicable to estimate that value. The estimated fair value amounts have been determined by the Company using available market information and appropriate valuation methodologies. However, considerable judgment is necessarily required to interpret market data to develop the estimates of fair value. Accordingly, the estimates presented herein are not necessarily indicative of the amounts the Company could realize in a current market exchange. The use of different market assumptions and/or estimation methodologies may have a material effect on the estimated fair value amounts.
The following methods and assumptions were used by the Company in estimating fair value disclosures for financial instruments:
For cash and cash equivalents, accounts receivable, and trade accounts payable, the carrying amount is a reasonable estimate of fair value as the assets are readily redeemable or short-term in nature and the liabilities are short-term in nature. Marketable equity securities are carried at their fair value.
For long-term debt other than the lines of credit, the fair values are estimated using discounted cash flow analyses, based on the Company’s current incremental borrowing rates for similar types of borrowing arrangements. The carrying value of this other long-term debt at December 31, 2006 and 2005, respectively, is $3,683,000 and $4,369,000. The fair value of this other long-term debt is estimated to be $3,661,000 and $4,401,000 at December 31, 2006 and 2005, respectively.
The carrying amount for the lines of credit approximates fair value because the lines of credit interest rates are adjusted frequently.
17.
| DERIVATIVES AND HEDGING ACTIVITIES
|
Effective February 28, 2001, the Company entered into an interest rate swap agreement on a notional amount of $15,000,000. The pay fixed rate under the swap is 5.08%, while the receive floating rate is “1-month” LIBOR. This interest rate swap agreement terminated on March 2, 2006. Effective May 31, 2001, the Company entered into an interest rate swap agreement on a notional amount of $5,000,000. The pay fixed rate under the swap is 4.83%, while the receive floating rate is “1-month” LIBOR. This interest rate swap agreement terminated on June 2, 2006.
The Company had designated both of these interest rate swaps as cash flow hedges of its exposure to variability in future cash flows resulting from interest payments indexed to “1-month” LIBOR. During the term of the interest rate swap agreements changes in cash flows from the interest rate swaps offset changes in interest rate payments on the first $20,000,000 of the Company’s revolving credit facility. The hedge locked the interest rate at 5.08% or 4.83% plus the pricing spread for the notional amounts of $15,000,000 and $5,000,000, respectively.
These interest rate swap agreements met the specific hedge accounting criteria. The measurement of hedge effectiveness was based upon a comparison of the floating-rate leg of the swap and the hedged floating-rate cash flows on the underlying liability. The effective portion of the cumulative gain or loss was reported as a component of accumulated other comprehensive income in shareholders’ equity and was reclassified into current earnings during 2006, the termination year for all swap agreements. The December 31, 2005 balance of the net after tax deferred hedging loss in accumulated other comprehensive income (“AOCI”) related to these swap agreements was approximately $19,000 which was the amount reclassified into current earnings during 2006. The change in AOCI related to these swap agreements during the current year was approximately $19,000. Ineffectiveness related to these hedges was not significant.
In July 2001, the Company entered into an agreement to obtain price protection and reduce a portion of our exposure to fuel price fluctuations. Under this agreement, we were obligated to purchase minimum amounts of diesel fuel per month, with a price protection component, for the six month period ended February 28, 2002. The agreement also provided that if during the twelve-month period commencing January 2005, the average NY MX HO was below $.58 per gallon, we would have been obligated to pay the contract holder the difference between $.58 and the average NY MX HO price for such month, multiplied by 1,000,000 gallons. During the twelve-month period commencing January 2005, the average NY MX HO remained well above the $.58 per gallon threshold and as of December 31, 2005 the agreement expired without any further obligation of either party. For the twelve-month period ended December 31, 2005 an adjustment of $500,000 was made to reflect the decline in fair value of the agreement which had the effect of reducing operating supplies expense and other current liabilities each by $500,000 in the accompanying consolidated financial statements. For the twelve-month period ended December 31, 2004 an adjustment of $250,000 was made to reflect the decline in fair value of the agreement which had the effect of reducing operating supplies expense and other current liabilities each by $250,000 in the accompanying consolidated financial statements.
18.
| RELATED PARTY TRANSACTIONS
|
In the normal course of business, the Company provides and receives transportation, repair and other services for and from companies affiliated with a major stockholder, and recognized $46,576, $111,510, and $269,553 in operating revenue and $1,558,371, $1,616,534, and $1,234,267 in operating expenses in 2006, 2005, and 2004, respectively. In addition the Company purchased physical damage insurance through an unaffiliated insurance broker which was written by an insurance company affiliated with a major stockholder. Annual premiums were $1,816,759, $1,667,928 and $1,686,587 for 2006, 2005 and 2004, respectively.
Amounts owed to the Company by these affiliates were $1,315,844 and $788,841 at December 31, 2006 and 2005 respectively. Of the accounts receivable at December 31, 2006, $904,694 represents revenue resulting from maintenance performed in the Company’s maintenance facilities and maintenance charges paid by the Company to third parties on behalf of their affiliate and charged back at the amount paid, and $411,150 represents a prepayment of physical damage insurance premiums. Amounts payable to affiliates at December 31, 2006 and 2005 was $223,420 and $158,400 respectively.
19.
| QUARTERLY RESULTS OF OPERATIONS (UNAUDITED)
|
The tables below present quarterly financial information for 2006 and 2005:
| | | 2006 | |
| | | Three Months Ended | |
| | | March 31 | | June 30 | | September 30 | | December 31 | |
| | | (in thousands, except per share data) | |
| | | | | | | | | | |
| Operating revenues | | $ | 100,525 | | $ | 103,365 | | $ | 99,874 | | $ | 96,505 | |
| Operating expenses | | | 91,473 | | | 94,375 | | | 94,202 | | | 89,154 | |
| | | | | | | | | | | | | | |
| Operating income | | | 9,052 | | | 8,990 | | | 5,672 | | | 7,351 | |
| Non-operating income | | | 57 | | | 116 | | | 140 | | | 135 | |
| Interest expense | | | 465 | | | 353 | | | 300 | | | 357 | |
| Income taxes | | | 3,461 | | | 3,512 | | | 2,244 | | | 2,857 | |
| | | | | | | | | | | | | | |
| Net income | | $ | 5,183 | | $ | 5,241 | | $ | 3,268 | | $ | 4,272 | |
| | | | | | | | | | | | | | |
| Net income per common share: | | | | | | | | | | | | | |
| Basic | | $ | 0.50 | | $ | 0.51 | | $ | 0.32 | | $ | 0.41 | |
| Diluted | | $ | 0.50 | | $ | 0.51 | | $ | 0.32 | | $ | 0.41 | |
| | | | | | | | | | | | | | |
| Average common shares outstanding: | | | | | | | | | | | | | |
| Basic | | | 10,288 | | | 10,293 | | | 10,301 | | | 10,303 | |
| Diluted | | | 10,288 | | | 10,301 | | | 10,309 | | | 10,308 | |
| | | 2005 | |
| | | Three Months Ended | |
| | | March 31 | | June 30 | | September 30 | | December 31 | |
| | | (in thousands, except per share data) | |
| | | | | | | | | | |
| Operating revenues | | $ | 86,192 | | $ | 91,027 | | $ | 88,484 | | $ | 95,177 | |
| Operating expenses | | | 81,034 | | | 84,479 | | | 84,471 | | | 87,370 | |
| | | | | | | | | | | | | | |
| Operating income | | | 5,158 | | | 6,548 | | | 4,013 | | | 7,807 | |
| Non-operating income | | | 191 | | | 108 | | | 155 | | | 23 | |
| Interest expense | | | 445 | | | 474 | | | 422 | | | 540 | |
| Income taxes | | | 2,001 | | | 2,502 | | | 1,533 | | | 2,947 | |
| | | | | | | | | | | | | | |
| Net income | | $ | 2,903 | | $ | 3,680 | | $ | 2,213 | | $ | 4,343 | |
| | | | | | | | | | | | | | |
| Net income per common share: | | | | | | | | | | | | | |
| Basic | | $ | 0.26 | | $ | 0.33 | | $ | 0.20 | | $ | 0.41 | |
| Diluted | | $ | 0.26 | | $ | 0.33 | | $ | 0.20 | | $ | 0.41 | |
| | | | | | | | | | | | | | |
| Average common shares outstanding: | | | | | | | | | | | | | |
| Basic | | | 11,305 | | | 11,114 | | | 10,818 | | | 10,634 | |
| Diluted | | | 11,327 | | | 11,130 | | | 10,821 | | | 10,636 | |
| | | | | | | | | | | | | | |
On June 16, 2005, the Company dismissed its independent auditors, Deloitte & Touche LLP, and on the same date engaged Grant Thornton LLP as its independent auditors for the fiscal year ending December 31, 2005. Each of these actions was approved by the Audit committee of the Company. Information with respect to this matter is included in the Company's current report on Form 8-K filed June 21, 2005.
Conclusion Regarding the Effectiveness of Disclosure Controls and Procedures
Under the supervision and with the participation of our management, including our principal executive officer and principal financial officer, we conducted an evaluation of our disclosure controls and procedures, as such term is defined under Rule 13a-15(e) promulgated under the Exchange Act, as amended. Based on this evaluation, our principal executive officer and our principal financial officer concluded that our disclosure controls and procedures are effective as of the end of the period covered by this Annual Report.
Management's Report on Internal Control Over Financial Reporting
Our management is responsible for establishing and maintaining adequate internal control over financial reporting, as such term is defined in Exchange Act Rules 13a-15(f). Under the supervision and with the participation of our management, including our principal executive officer and principal financial officer, we conducted an evaluation of the effectiveness of the Company's internal control over financial reporting based on the framework in Internal Control - Integrated Framework issued by the Committee of Sponsoring Organizations of the Treadway Commission. Based on our evaluation under the framework in Internal Control - Integrated Framework, our management concluded that our internal control over financial reporting is effective as of December 31, 2006.
Our management's assessment of the effectiveness of our internal control over financial reporting as of December 31, 2006 has been audited by Grant Thornton LLP, an independent registered public accounting firm, who has issued an attestation report on management’s assessment of the Company's internal control over financial reporting, as stated in their report which is included below.
Changes in Internal Control Over Financial Reporting
There were no changes in the Company's internal controls over financial reporting that occurred during the quarter ended December 31, 2006, that have materially affected, or are reasonably likely to materially affect, the Company's internal control over financial reporting.
Report of Independent Registered Public Accounting Firm
Board of Directors and
Shareholders of P.A.M. Transportation Services, Inc. and Subsidiaries
We have audited management’s assessment, included in the accompanying Management’s Report on Internal Control Over Financial Reporting (management’s assessment), that P.A.M. Transportation Services, Inc. (a Delaware Corporation) and subsidiaries, (collectively, the Company) maintained effective internal control over financial reporting as of December 31, 2006, based on the criteria established in Internal Control-Integrated Framework issued by the Committee of Sponsoring Organizations of the Treadway Commission (COSO). The Company’s management is responsible for maintaining effective internal control over financial reporting and for its assessment of the effectiveness of internal control over financial reporting. Our responsibility is to express an opinion on management’s assessment and an opinion on the effectiveness of the Company’s internal control over financial reporting based on our audit.
We conducted our audit in accordance with the standards of the Public Company Accounting Oversight Board (United States). Those standards require that we plan and perform the audit to obtain reasonable assurance about whether effective internal control over financial reporting was maintained in all material respects. Our audit included obtaining an understanding of internal control over financial reporting, evaluating management’s assessment, testing and evaluating the design and operating effectiveness of internal control, and performing such other procedures as we considered necessary in the circumstances. We believe that our audit provides a reasonable basis for our opinions.
A company’s internal control over financial reporting is a process designed to provide reasonable assurance regarding the reliability of financial reporting and the preparation of financial statements for external purposes in accordance with generally accepted accounting principles. A company’s internal control over financial reporting includes those policies and procedures that (1) pertain to the maintenance of records that, in reasonable detail, accurately and fairly reflect the transactions and dispositions of the assets of the company; (2) provide reasonable assurance that transactions are recorded as necessary to permit preparation of financial statements in accordance with generally accepted accounting principles, and that receipts and expenditures of the company are being made only in accordance with authorizations of management and directors of the company; and (3) provide reasonable assurance regarding prevention or timely detection of unauthorized acquisition, use, or disposition of the company’s assets that could have a material effect on the financial statements.
Because of inherent limitations, internal control over financial reporting may not prevent or detect misstatements. Also, projections of any evaluation of effectiveness to future periods are subject to the risk that controls may become inadequate because of changes in conditions, or that the degree of compliance with the policies or procedures may deteriorate.
In our opinion, management’s assessment that the Company maintained effective internal control over financial reporting as of December 31, 2006, is fairly stated, in all material respects, based on criteria established in Internal Control-Integrated Framework issued by COSO. Also in our opinion, the Company maintained, in all material respects, effective internal control over financial reporting as of December 31, 2006, based on criteria established in Internal Control-Integrated Framework issued by COSO.
We also have audited, in accordance with the standards of the Public Company Accounting Oversight Board (United States), the consolidated balance sheets of P.A.M. Transportation Services, Inc. and subsidiaries, as of December 31, 2006 and 2005, and the related consolidated statements of income, stockholders’ equity and other comprehensive income, and cash flows for the years then ended and our report dated March 12, 2007 expressed an unqualified opinion on those financial statements.
GRANT THORNTON LLP
Tulsa, Oklahoma
March 12, 2007
None.
PART III
Portions of the information required by Part III of Form 10-K are, pursuant to General Instruction G (3) of Form 10-K, incorporated by reference from our definitive proxy statement to be filed pursuant to Regulation 14A for our Annual Meeting of Stockholders to be held on May 24, 2007. We will, within 120 days of the end of our fiscal year, file with the Securities and Exchange Commission a definitive proxy statement pursuant to Regulation 14A.
Information concerning our executive officers is set forth in Item 1 of this Form 10-K under the caption “Executive Officers of the Registrant.”
The information presented under the captions “Election of Directors,” “Section 16(a) Beneficial Ownership Compliance,” “Corporate Governance - Code of Ethics” and “Corporate Governance-Audit Committee,” in the proxy statement is incorporated here by reference.
Committee.We have a separately designated standing audit committeeAudit Committee established in accordance with Section 3(a)(58)(A) of the Securities Exchange Act of 1934. The Audit Committee has four members. Each of the members of the Audit Committee consistis an independent director as independence for audit committee members is defined in the NASDAQ listing standards and the rules of Thomas H. Cooke, Christopher L. Ellis,the SEC. The Audit Committee has a charter that has been approved by our Board of Directors and Charles F. Wilkins.is available on our website, at www.pamtransport.com under the caption of “Investors.”
The Audit Committee met six times in 2023. The Audit Committee assists our Board of Directors in overseeing our accounting and financial reporting process, internal controls and audit functions, and is directly responsible for the appointment, retention and compensation of our registered public accounting firm. Our Board of Directors has determined that Messrs. Davis and McLarty are each qualified as an audit committee financial expert, as that term is defined in the rules of the Securities and Exchange Commission (“SEC”). More information about the Audit Committee is included below under the heading “Audit Committee Report.”
Compensation Committee. Our Board of Directors has elected to appoint our Chairman of the Board and our CEO as the two members of our Compensation Committee based on our status as a “controlled company” under the NASDAQ Listing Rules. The Compensation Committee met two times in 2023. The Compensation Committee assists our Board of Directors in carrying out its responsibilities relating to compensation and benefits for our executive officers. The Compensation Committee has the authority to retain compensation consultants but does not currently use compensation consultants. The Compensation Committee operates without a written charter.
Executive Committee. The Executive Committee exercises the authority of our Board of Directors in accordance with the Bylaws between regular meetings of our Board. The Executive Committee met three times during 2023.
Item 11. Executive Compensation.
Compensation Discussion and Analysis
Overview
Our primary goal for the compensation of our executive officers is to create long-term value for our stockholders. Our compensation program is intended to attract, motivate, reward and retain the management talent required to achieve our corporate objectives and create long-term value for our stockholders, while at the same time making efficient use of our resources. The compensation of our executive officers is designed to reward financial and operating performance, to align their interests with those of our stockholders, and to encourage them to remain with us.
Named Executive Officers for 2023
Our “named executive officers” for 2023 consisted of our President and Chief Executive Officer, Joseph A. Vitiritto, our Vice President of Finance, Chief Financial Officer and Treasurer, Lance K. Stewart, and our former Vice President of Finance, Chief Financial Officer, Secretary and Treasurer, Allen W. West.
Elements of Compensation
We have three key elements of compensation: annual base salary, cash incentive compensation, and long-term equity incentives. Annual base salary is intended to attract and retain talented executives, and reward them for annual achievement. Cash incentive compensation is intended to motivate our executive officers to achieve specified financial results or superior performance. Long-term equity incentives are intended to align the interests of our executive officers with those of our stockholders by linking compensation to stock price appreciation. In addition, when the criteria for vesting of equity awards includes achieving specified financial results, the equity awards also serve the purpose of motivating our executive officers to achieve those results.
Determining Compensation
The Board of Directors has appointed our Chairman, Mr. Matthew T. Moroun, and our CEO, Mr. Joseph A. Vitiritto, to the Compensation Committee in accordance with the exemption from the compensation committee independence requirements for controlled companies under NASDAQ Rule 5615(c). Currently, the Compensation Committee determines the compensation for our officers and key employees other than the CEO, while the Board of Directors makes all decisions regarding the CEO’s compensation and approves the equity awards to the named executive officers.
In determining compensation for our executive officers, the Compensation Committee and the Board consider competitive market compensation paid by other companies, including truckload dry van carriers and other trucking companies, but do not attempt to maintain a specified target percentile within a peer group or otherwise rely on compensation paid by other companies to determine our executive compensation. The Compensation Committee and the Board review and evaluate many factors, including:
| ● | PTSI’s performance and growth; |
| ● | financial measurements such as revenue, revenue growth, net operating income and operating ratio, and trends in those measurements; |
| ● | ability to achieve strategic objectives; |
| ● | scope and performance of business responsibilities; |
| ● | management experience and effectiveness; |
| ● | individual performance and performance as a management team; |
| ● | current compensation arrangements; and |
| ● | long-term potential to maintain and enhance value for our stockholders. |
The Board members generally do not adhere to rigid formulas or react to short-term changes in business performance in determining the amount and mix of compensation elements but strive to achieve an appropriate mix between annual base salary, cash incentive compensation and long-term equity incentives to meet our objectives.
The Board members receive regular updates on our business results from management and review the quarterly financial statements and projections to assess whether executive compensation continues to be properly balanced with and supportive of our business objectives. The Board members may also review information, presentedsuch as reported revenue, profit levels, market capitalization and disclosed governance practices, regarding comparably-sized companies in our industry to assess our comparative performance and organizational structure. The Board members use management updates and peer information as tools to evaluate the connection between executive compensation and our performance as a business. This information is reviewed in a subjective manner. There is no implied direct or formulaic linkage between peer information and our compensation decisions. The Board members take the view that a close connection between compensation and performance objectives encourages our executive officers to make decisions that will result in significant positive short-term and long-term returns for our business and our stockholders without providing an incentive either to take unnecessary risks or to avoid opportunities to achieve long-term benefits even though they may reduce short-term benefits for the executive officers, the business or our stockholders.
Based on this information, the Board members regularly evaluate both the short-term and long-term performance compensation for the executive officers to ensure alignment with our business objectives. The committee also works closely with management regarding long-term equity incentives, which emphasize stockholder returns while providing enhanced retention value for key executives.
Annual Cash Compensation
Base Salary. Each of our named executive officers receives an annual base salary as compensation for services performed during the year. The base salary for each named executive is established based on the scope of responsibilities, level of experience and expertise, and the ability to lead and direct the Company and achieve various financial and operational objectives. Our general compensation philosophy is to pay executive base salaries that are competitive with the salaries of executives in similar positions, with similar responsibilities, at comparable companies. We have not benchmarked our named executive officer base salaries against the base salaries at any particular company or group of companies. The base salaries of Messrs. Vitiritto, Stewart and West were established in accordance with their respective employment agreements subject to review and adjustment by the Compensation Committee or the Board, as applicable, on an annual basis after taking into account individual responsibilities, performance and expectations. The base salaries paid to our named executive officers in 2023 are set forth below in the “Summary Compensation Table” and the accompanying narrative disclosure.
Cash Incentive Compensation. The Compensation Committee’s and the Board’s practice is to award an annual cash bonus to each of the named executive officers as part of his annual compensation. Bonuses are intended to provide executives with an opportunity to receive additional cash compensation, and are based on individual performance and the Company’s performance. The Committee and the Board believe this practice provides an incentive for strong financial and operating performance and aligns the interests of management with the interests of our stockholders. Bonuses may be awarded on a discretionary basis or according to pre-determined performance metrics, goals and payout formulas.
Due to the challenging and uncertain operating environment that began in the latter half of 2022, the Board did not adopt or utilize an annual cash incentive plan for our executive officers based on predetermined performance metrics for 2023. For 2023, our Board awarded discretionary cash bonuses to Mr. Vitiritto and Mr. Stewart of $150,000 and $80,000, respectively, based on their efforts and leadership in achieving profitable operating results for fiscal year 2023 while navigating an extended freight recession and significant business disruptions from key customers due to the labor strikes at several automotive production facilities in the fourth quarter of 2023 and completing the integration of the former Metropolitan Trucking business acquired in 2022. The terms of these bonuses provided that 50.0% of the bonus was to be paid immediately, while the remaining 50.0% of the bonus will be paid in equal installments during each of the next two succeeding years, subject to continued employment with the company. The immediate portion of the bonus was paid in February 2024.
For 2022 and 2021, the annual cash bonuses awarded to our named executive officers and certain other key employees were determined based on an annual cash incentive plan approved by the Board in March 2021. This plan provided for cash bonuses and equity incentive awards to be determined based on the attainment of certain consolidated operating income performance targets. The potential overall incentive payments for 2022 varied from zero to 175% of base salary for Mr. Vitiritto and from zero to 130% of base salary for our former CFO, Mr. West, depending on the actual level of consolidated operating income achieved. A portion of the executive’s overall incentive award earned, if any, would be paid as a cash bonus and a portion would be paid in restricted shares of our common stock. Under the terms of the incentive plans, the cash bonus and restricted share amounts would increase incrementally based on the Company’s actual consolidated operating income level achieved, assuming a minimum operating income level was attained. For purposes of the plan, consolidated operating income was modified to exclude the impact of any cash bonus or stock compensation expense.
If the Company’s 2022 operating income exceeded the minimum threshold of $105 million, Mr. Vitiritto would receive a cash bonus representing 75%, 90% or 105% of his base salary, and Mr. West would receive a cash bonus representing 60%, 70% or 80% of his base salary, based on the actual operating income level achieved, with the maximum cash bonus amount being paid at an operating income of $135 million or higher. At the target operating income performance level of $125 million, Mr. Vitiritto and Mr. West would receive cash bonuses equal to 90% and 70%, respectively, of the executive’s base salary. The 2022 operating income performance target levels reflected a range of performance that the Board believed was attainable but uncertain, with the target and maximum operating income levels reflecting a significant achievement of a 25% to 35% increase over 2021 actual consolidated operating income.
In addition, if the Company achieved the target and maximum operating income performance levels for 2022, Mr. Vitiritto and Mr. West were eligible to receive additional discretionary “kicker” cash bonuses in amounts of up to approximately 35.2% and 17.6%, respectively, of an additional aggregate bonus pool for each such performance level under the captions “Executiveincentive plan. The additional aggregate bonus pools for the target and maximum operating income performance levels were $400,000 and $800,000, respectively.
Notwithstanding the terms of Mr. Vitiritto’s employment agreement, the Board designated that the cash bonus amount earned, if any, under the incentive plan would be paid immediately following certification of the Company’s achievement of consolidated operating income exceeding the minimum performance level. For purposes of this incentive plan, the applicable base salary was the named executive officer’s base salary in effect as of December 31, 2022 of $610,220 for Mr. Vitiritto and $414,700 for Mr. West.
For 2022, the Company achieved consolidated operating income of $123.8 million, a 23.5% increase over 2021 consolidated operating income of $100.2 million. Excluding cash bonus and stock compensation expense, the Company’s consolidated operating income, as adjusted, for 2022 was $127.5 million. As a result of the Company exceeding the target operating income performance level under the plan, Mr. Vitiritto earned a cash bonus of $549,198 and Mr. West earned a cash bonus of $290,290 for 2022 under the incentive plan for 2022. In addition, based on their leadership in achieving the target operating income performance level despite challenging operating conditions during 2022, Mr. Vitiritto and Mr. West were awarded discretionary kicker bonuses of $140,625 and $70,311, respectively. These bonuses were paid in February 2023.
Under the Company’s annual cash and equity incentive plan for our named executive officers and certain other key employees for 2021, Mr. Vitiritto and Mr. West were eligible to receive overall incentive payments ranging from zero to 150% of base salary for Mr. Vitiritto and from zero to 90% of base salary for Mr. West, depending on the actual level of consolidated operating income achieved. The executive’s overall incentive award earned, if any, would be paid 60% as a cash bonus and 40% in restricted shares of our common stock.
If the Company’s 2021 operating income exceeded the minimum threshold of $35 million, Mr. Vitiritto would receive a cash bonus representing 30%, 45%, 60%, 75% or 90% of his base salary, and Mr. West would receive a cash bonus representing 18%, 30%, 39%, 48% or 54% of his base salary, based on the actual operating income level achieved, with the maximum cash bonus amount being paid at an operating income of $55 million or higher. At the target operating income performance level of $45 million, Mr. Vitiritto and Mr. West would receive cash bonuses equal to 60% and 39%, respectively, of the executive’s base salary.
For 2021, the Company achieved consolidated operating income of $100.2 million, a 295% increase over 2020 consolidated operating income of $33.9 million. Based on these results, Mr. Vitiritto earned a cash bonus of $505,674 and Mr. West earned a cash bonus of $217,339 under the incentive plan as a result of the Company exceeding the maximum operating income performance level under the plan. These bonuses were paid in January 2022.
In addition, during November 2021, in light of the Company’s record financial performance through the first three quarters of 2021, our Board awarded additional discretionary cash bonuses to Mr. Vitiritto and Mr. West in amounts that were to be determined following certification of the Company’s final full year results for 2021. Based on the 2021 year-end results, Mr. Vitiritto and Mr. West were awarded discretionary cash bonuses of $450,000 and $225,000, which were paid in January 2022.
Other Compensation” “Corporate Governance-Compensation
Long-Term Equity Incentives. Long-term equity incentives are awarded to our named executive officers as part of our overall compensation package. These awards are granted under our Amended and Restated Stock Option and Incentive Plan (the “Plan”), which was adopted by the Board of Directors in March 2014 and approved by our stockholders in May 2014. The Plan authorizes grants to our employees, directors, and consultants of awards of stock options, restricted stock, restricted stock units, stock appreciation rights, phantom stock units, and unrestricted common stock. A total of 3,000,000 shares of our common stock (as adjusted for the Company’s August 2021 and March 2022 2-for-1 forward stock splits), subject to adjustments, were reserved for the issuance of stock awards under the Plan. This Plan expired on March 13, 2024, and no further grants may be made under the Plan.
On February 15, 2024, the Board approved our 2024 Equity Incentive Plan (the “2024 Plan”), subject to the approval of our stockholders at our Annual Meeting. The 2024 Plan authorizes us to grant awards of incentive stock options, nonstatutory stock options, stock appreciation rights, restricted stock, restricted stock units, performance units, performance shares and unrestricted shares of common stock to our employees, officers and directors, as well as consultants and advisors. A total of 1,600,000 shares of our common stock, subject to adjustments, are reserved for the issuance of stock awards under the 2024 Plan. The 2024 Plan will be administered by our Board, which, at its discretion or as legally required, may delegate such administration to our Compensation Committee Interlocksor one or more additional committees. If approved by our stockholders at the Annual Meeting, the 2024 Plan will expire on August 1, 2034.
The Compensation Committee and Insider Participation,”the Board believe that long-term equity incentives, such as stock options and “Compensationrestricted stock, are consistent with the Company’s philosophy and represent an additional vehicle for aligning management’s interests with the interests of our stockholders. The Compensation Committee Report”and the Board currently believe that restricted shares are more effective than stock options in achieving the Company’s compensation objectives, as these grants are subject to less market volatility and are less dilutive to stockholders.
When determining the amount of long-term incentive grants to be awarded to our named executive officers, the Board members consider, among other factors, the business performance of the Company, the responsibilities and performance of the executive, and the performance of our stock price. The Board has historically granted long-term equity incentives to our named executive officers on a discretionary basis or in connection with an executive’s hiring or promotion. During 2021, the Board adopted a cash and equity incentive plan under which our named executive officers are eligible to receive cash bonuses and restricted shares representing a percentage of the executive’s base salary based on the attainment of consolidated operating income performance targets, assuming a minimum operating income level is attained. The Board believes this plan provides an enhanced long-term incentive for our executive officers, is consistent with a pay-for-performance approach and similar to incentive programs utilized by certain Company peers, and further aligns our management’s interests with those of our stockholders. Once the fiscal year is completed, the Board grants the restricted shares, if any, determined based on our actual performance for the fiscal year with such shares being subject to addition time-based vesting conditions. The Board did not adopt or utilize such an incentive plan for 2023; however, the Board did grant restricted shares to our named executive officers in February 2023 based on our fiscal year 2022 performance.
Under the terms of the plan for 2022, if the Company’s 2022 operating income exceeded the minimum threshold of $105 million, Mr. Vitiritto would receive restricted shares representing 25%, 50%, 60% or 70% of his base salary, and Mr. West would receive restricted shares representing 15%, 30%, 40% or 50% of his base salary, based on the actual operating income level achieved, with the maximum grant amount being issued at an operating income of $135 million or higher. At the target operating income performance level of $125 million, Mr. Vitiritto and Mr. West would receive restricted shares representing 60% and 40%, respectively, of the executive’s base salary. The restricted shares earned, if any, would be granted following completion of the 2022 performance year and vest in equal annual installments over a four-year period, subject to the employee’s continued service with the Company. For purposes of the plan, consolidated operating income excludes the impact of any cash bonus or stock compensation expense. Additional information regarding this plan is described above under “Annual Cash Compensation – Cash Incentive Compensation.”
The Company’s 2022 actual consolidated operating income was $127.5 million, excluding cash and stock bonus compensation expense of $3.7 million. In February 2023, as a result of the Company exceeding the target operating income performance level under the plan for fiscal year 2022, the Board granted 12,938, 5,862, and 2,420 restricted shares of our common stock to Messrs. Vitiritto, West and Stewart, respectively. These shares vest in four equal annual installments beginning on the first anniversary of the grant date.
Under the terms of the plan for 2021, if the Company’s 2021 operating income exceeded the minimum threshold of $35 million, Mr. Vitiritto would receive restricted shares representing 20%, 30%, 40%, 50% or 60% of his base salary, and Mr. West would receive restricted shares representing 12%, 20%, 26%, 32% or 36% of his base salary, based on the actual operating income level achieved, with the maximum grant amount being issued at an operating income of $55 million or higher. At the target operating income performance level of $45 million, Mr. Vitiritto and Mr. West would have received restricted shares representing 40% and 26%, respectively, of the executive’s base salary. The restricted shares earned, if any, would vest in equal annual installments over the four-year period following completion of the 2021 performance year, subject to the employee’s continued service with the Company.
Based on the Company’s 2021 consolidated operating income of $100.2 million, under the terms of the incentive plan, Mr. Vitiritto was awarded 8,690 restricted shares of our common stock and Mr. West was awarded 3,734 restricted shares of our common stock, which represented achievement of the maximum operating income performance level under the plan. These restricted shares were granted to our officers in February 2022 and vest in equal annual installments over the four-year period following the grant date.
We did not grant any stock options to our executive officers in 2023, 2022 or 2021.
All share amounts set forth above reflect the Company’s August 2021 and March 2022 2-for-1 forward splits of its common stock paid in the form of 100% stock dividends. All unvested restricted shares granted to Mr. West were forfeited upon his resignation from the Company effective in June 2023.
Retirement and Health Benefits. We sponsor a retirement savings plan for all of our eligible employees, including our executive officers. The plan qualifies under section 401(k) of the Internal Revenue Code, as amended. This plan allows eligible employees to make tax deductible contributions to the plan. We make employer matching contributions to the plan for each eligible employee. The matching contributions are 50% of each participating employee’s voluntary contribution up to 3% of the participant’s compensation. These matching contributions vest at the rate of 20% each year until fully vested after five years.
We offer health, vision and dental insurance to our executive officers.
Perquisites. Our policy is to provide minimal, if any, perquisites to our executive officers. This helps set an example for all employees that personal expenses are not payable from company funds and helps to control expenses. We did not provide any perquisites to our executive officers in 2023.
Post-Employment Compensation. We do not provide a defined benefit pension plan or post-retirement health insurance coverage for our executive officers or any of our other employees. We do not offer deferred compensation plans, and do not have agreements that provide compensation to our executive officers based upon the occurrence of a change in control of PTSI. However, our executive officers would be entitled to receive certain compensation if we terminate employment based on a determination that such termination would be in our best interest. See “Payments Upon Termination or Change In Control – Payments Upon Termination Based on Our Best Interest” below for more information regarding such payments.
On July 10, 2023, we entered into a separation and consulting agreement, dated as of July 7, 2023, with Mr. West, who resigned from the Company effective June 8, 2023. Under the terms of the agreement, Mr. West agreed to make himself available to advise senior management and consult with us as we may reasonably request from time to time for a one-year period for a monthly consulting fee of $35,771.67. We also agreed to provide health insurance coverage under the Consolidated Omnibus Budget Reconciliation Act of 1986 (“COBRA”) during his consulting period, unless he becomes eligible for executive benefits from a subsequent employer. In recognition of his contributions to the Company, and in consideration of the covenants contained in the agreement and the accompanying release, we agreed to pay Mr. West a cash bonus in the aggregate amount of $1,250,000, payable in five equal semi-annual installments beginning six months after the agreement becomes effective. In addition, we agreed to repurchase the shares of our common stock owned by Mr. West (excluding his unvested restricted shares of common stock which were forfeited upon his resignation) at the closing market price per share of our common stock on the effective date of the agreement. These payments and benefits are subject to Mr. West having not revoked a customary release of claims in favor of the Company and his compliance with terms and conditions of the separation and consulting agreement. Mr. West is also subject to restrictive covenants with respect to the confidentiality of our proprietary information and the non-solicitation of employees or business that is competitive with our business or that of certain affiliated companies under common ownership with us for a 12-month period following the effective date of his resignation from the Company. The agreement also contains customary cooperation and mutual non-disparagement provisions.
Tax Deductibility of Compensation
Section 162(m) of the Internal Revenue Code, as amended, imposes a $1 million limit on the amount that a public company may deduct for compensation paid to the company’s chief executive officer, chief financial officer or certain of the company’s other most highly compensated executive officers. Historically, there was an exception to this $1 million limitation for compensation that meets the requirements under Section 162(m) for “qualifying performance-based” compensation (compensation paid only if the individual’s or the company’s performance meets pre-established objective goals based on performance criteria approved by the stockholders), and compensation paid to the chief financial officer was excluded from the $1 million limit. Effective January 1, 2018, the Tax Cuts and Jobs Act eliminated the exception for performance-based compensation, and the chief financial officer’s compensation is no longer excluded. The amendments to Section 162(m) include a grandfather clause applicable to compensation paid pursuant to a written binding contract in effect on November 2, 2017 that is not materially modified after such date. We periodically review the potential consequences of Section 162(m) but do not have a specific policy to structure the compensation for our executive officers so that it will not be subject to the deduction limitations of Section 162(m).
Share Ownership Guidelines
We do not have stock ownership requirements for our executive officers.
Role of Executive Officers in the Compensation Process
The elements of executive compensation are discussed at meetings of the Compensation Committee and the Board, with significant input from our Chairman of the Board and our CEO. Annual base salary is generally determined annually but may be determined for a multi-year period at the time that employment agreements are negotiated with our executive officers, if applicable. Cash incentive compensation and other bonuses and forms of stock-based compensation are discussed from time to time, but there is no set schedule for making determinations regarding these types of compensation. The committee and the Board retain considerable flexibility in deciding when to address these matters. In making its compensation decisions, the Board members will usually seek input from the executive officers. However, the Board makes the final decisions on compensation of our CEO and on equity awards to our executive officers, and the committee makes the final decisions on other compensation to our executive officers. The committee is authorized to utilize compensation consultants. Neither the committee nor the Board utilized a compensation consultant regarding 2022 executive compensation.
Stockholder Approval of the Company’s Compensation Programs
At our 2023 Annual Meeting of Stockholders, we held an advisory vote on the compensation of our named executive officers, commonly referred to as “say on pay.” Our stockholders overwhelmingly approved the “say on pay” resolution presented with more than 90% of the shares represented in person or by proxy statementat the meeting and more than 99% of votes cast voting to approve our executive compensation. The Compensation Committee and the Board reviewed and considered these voting results in determining the Company’s compensation policies and decisions and, given the strong level of support, determined that these policies and decisions are appropriate and in the best interests of the Company and its stockholders at this time. At our 2023 Annual Meeting of Stockholders, over 85% of the shares voted (excludes abstentions and broker non-votes) were in favor of our recommendation to hold the “say on pay” vote every three years. The next stockholder vote on the frequency of future “say on pay” votes is incorporated herescheduled for 2029.
Summary Compensation Table
The following table provides information regarding the compensation earned by reference.the Company’s named executive officers for the three years ended December 31, 2023.
SUMMARY COMPENSATION TABLE |
| Name and Principal Position | Year | Salary | Bonus | Stock Awards | Option Awards | Non-Equity Incentive Plan Compensation | All Other Compensation | Total |
| | | ($) | ($) (1) | ($) (2) | ($) (2) | ($) (3) | ($) (4) | ($) |
Joesph A. Vitiritto | 2023 | 616,085 | 150,000 | 366,145 | - | - | - | 1,132,230 |
President and Chief Executive Officer | 2022 | 577,670 | 140,625 | 337,116 | - | 549,198 | - | 1,604,609 |
| | 2021 | 540,440 | 450,000 | - | - | 505,674 | - | 1,496,114 |
Lance K. Stewart | 2023 | 344,840 | 80,000 | 68,486 | - | - | - | 493,326 |
Vice President of Finance, Chief Financial Officer and Treasurer | | | | | | | | |
| | | | | | | | | |
Allen W. West | 2023 | 205,255 | - | 165,895 | - | - | 219,961 | 591,111 |
Former Vice President of Finance, Chief Financial Officer, Secretary and Treasurer | 2022 | 414,230 | 70,311 | 144,879 | - | 290,290 | - | 919,710 |
| | 2021 | 389,934 | 225,000 | - | - | 217,339 | - | 832,273 |
| (1) | The amounts shown for 2023 represent discretionary cash bonuses that were awarded and paid at the rate of 50% during February 2024 with the remaining 50% being paid at the rate of 25% of the bonus amount awarded during each of the next two years. The amounts shown for 2022 represent discretionary cash bonuses paid in February 2023. The amounts shown for 2021 represent discretionary cash bonuses paid in January 2022. |
| (2) | Amounts shown do not reflect compensation actually received by the named executive officer. Instead, the amounts shown are the aggregate grant date fair value computed in accordance with the provisions of FASB ASC Topic 718. The stock awards granted to Mr. West during 2023 and all unvested shares from prior stock awards granted to Mr. West were forfeited upon his resignation from the Company effective June 8, 2023. |
| (3) | Amounts shown for 2022 and 2021 represent cash bonuses earned under a short-term incentive plan that were paid in February 2023 and January 2022, respectively. |
| (4) | The amount shown for Mr. West for 2023 includes $214,630 in consulting fees and $5,331 for COBRA benefits paid following his resignation from the Company. |
Employment Agreements
Joseph A. Vitiritto. On August 4, 2020, we entered into an employment agreement with our President and CEO, Mr. Vitiritto. Pursuant to the agreement, the Company agreed to pay Mr. Vitiritto an initial annual salary of $530,036 and a cash bonus for fiscal year 2020 of $328,500, payable in December 2020 or January 2021. In addition, he received a grant of 160,000 (split-adjusted) restricted shares of common stock of the Company which vest in installments of 20,000 shares each in 2022, 2023, 2024 and 2027 and 40,000 shares each in 2025 and 2026, subject to his continued employment or retirement after reaching age 65. Under the terms of the agreement, Mr. Vitiritto’s performance will be reviewed annually for changes in base salary. Mr. Vitiritto currently earns an annual salary of $628,160. In addition, the agreement provides that Mr. Vitiritto is eligible to earn an annual cash bonus as determined by the Board. The terms of the agreement provide that such bonus will be paid in five annual installments of 20% each beginning in the year following the year in which the bonus is earned, subject to his continued employment or retirement after reaching age 65.
Notwithstanding the terms of Mr. Vitiritto’s employment agreement, our Board has elected to pay Mr. Vitiritto’s bonus amounts earned since fiscal year 2021 either in full following completion of the performance period or in larger installments than prescribed by the employment agreement. See “Annual Cash Compensation – Cash Incentive Compensation” above for more information regarding Mr. Vitiritto’s bonus awards.
The employment agreement includes provisions regarding termination of employment and his non-compete, non-solicitation and confidentiality obligations to the Company.
Lance K. Stewart. On July 7, 2023, we entered into an employment agreement with our Vice President of Finance, Chief Financial Officer and Treasurer, Mr. Stewart, effective as of March 13, 2023. Pursuant to the agreement, the Company agreed to pay Mr. Stewart an initial annual salary of $378,560. Mr. Stewart currently earns an annual salary of $391,560. Under the terms of the agreement, Mr. Stewart’s performance will be reviewed annually for changes in base compensation and bonus. The employment agreement includes provisions regarding termination of employment and his non-compete, non-solicitation and confidentiality obligations to the Company.
Our executive officers may participate in bonus and other incentive plans that are approved from time to time by our Board of Directors or Compensation Committee. The executive officers are also entitled to any fringe benefits that we may provide for our employees in the normal course of our business.
Allen W. West. On March 7, 2019, we entered into an employment agreement with our former Vice President of Finance, Chief Financial Officer, Secretary and Treasurer, Mr. West, effective as of January 1, 2019. Pursuant to the agreement, the Company agreed to pay Mr. West an initial annual salary of $335,140. Under the terms of the agreement, Mr. West’s performance was reviewed annually for changes in base compensation and bonus. Mr. West’s annual base salary for 2023 was $429,260. The employment agreement includes provisions regarding termination of employment and his non-compete, non-solicitation and confidentiality obligations to the Company.
On July 10, 2023, we entered into a separation and consulting agreement with Mr. West, dated as of July 7, 2023. Pursuant to the agreement, Mr. West agreed to make himself available to advise senior management and consult with us as we may reasonably request from time to time for a one-year period for a monthly consulting fee of $35,771.67. We also agreed to provide health insurance coverage under COBRA during the consulting period, unless he becomes eligible for executive benefits from a subsequent employer. In recognition of his contributions to the Company, and in consideration of the covenants contained in the agreement and the accompanying release, we agreed to pay Mr. West a cash bonus in the aggregate amount of $1,250,000, payable in five equal semi-annual installments beginning six months after the agreement became effective. The initial bonus installment payment was made in February 2024. These payments and benefits are subject to Mr. West having not revoked a customary release of claims in favor of the Company and his compliance with terms and conditions of the agreement. In addition, pursuant to the agreement, in July 2023 we repurchased all of Mr. West’s vested and outstanding shares of our common stock at the closing market price per share of our common stock on the effective date of the agreement. See “Transactions with Related Persons” in Part III, Item 13 of this Amendment for additional information regarding this stock purchase.
The separation and consulting agreement requires Mr. West to comply with certain restrictive covenants with respect to the confidentiality of our proprietary information and the non-solicitation of employees or business that is competitive with our business or that of certain affiliated companies under common ownership with us for a 12-month period following the effective date of his resignation from the Company. The agreement also contains customary cooperation and mutual non-disparagement provisions.
Additional information regarding the non-compete, non-solicitation and confidentiality obligations of our named executive officers is discussed below under the heading “Payments Upon Termination or Change in Control.”
Grants of Plan-Based Awards
The following table shows all plan-based awards granted to the named executive officers during fiscal year 2023. No stock options were granted to our executive officers during 2023. Our 2014 Amended and Restated Stock Option and Incentive Plan expired on March 13, 2024, and no further grants may be made under the Plan. Subject to the approval of our stockholders at the Annual Meeting, a total of 1,600,000 shares of our common stock are reserved for the issuance of stock awards under the 2024 Equity Incentive Plan.
| | | | | | | | | | | | | |
| | | Estimated Possible Payouts Under Non-Equity Incentive Plan Awards | | Estimated Future Payouts Under Equity Incentive Plan Awards | | | | |
| Name | Grant Date | Threshold | Target | Maximum | | Threshold | Target | Maximum | All Other Stock Awards: Number of Shares of Stock or Units | All Other Option Awards: Number of Securities Under-lying Options | Exercise or Base Price of Option Awards | Grant Date Fair Value of Stock and Option Awards |
| | | ($) | ($) | ($) | | (#) | (#) | (#) | (#) (1) | (#) | ($/Sh) | ($) (2) |
| Joseph A. Vitiritto | 2/9/2023 | - | - | - | | - | - | - | 12,938 | - | - | 366,145 |
| | | | | | | | | | | | | |
| Lance K. Stewart | 2/9/2023 | - | - | - | | - | - | - | 2,420 | - | - | 68,486 |
| | | | | | | | | | | | | |
| Allen W. West | 2/9/2023 | - | - | - | | - | - | - | 5,862 (3) | - | - | 165,895 |
| (1) | These awards represent restricted shares of common stock granted according to our cash and equity incentive plan based on actual 2022 operating income performance, as discussed above under “Compensation Discussion and Analysis – Annual Cash Compensation” on page 7 of this Amendment. These restricted shares vest in four equal annual installments beginning on February 9, 2024. |
| (2) | Amounts shown do not reflect compensation actually received by the named executive officer. Instead, the amounts shown are the aggregate grant date fair value computed in accordance with the provisions of FASB ASC Topic 718. |
| (3) | These shares were forfeited by Mr. West upon his resignation from the Company in June 2023. |
[The remainder of this page is intentionally left blank.]
Outstanding Equity Awards at Fiscal Year-End
The following table provides information as of December 31, 2023, regarding equity awards for each of the named executive officers.
| | Option Awards | Stock Awards |
| | | | | | | | | | | | | |
| Name | Number of Securities Underlying Unexercised Options Exercisable | Number of Securities Underlying Unexercised Options Unexercisable | Equity Incentive Plan Awards: Number of Securities Underlying Unexercised Unearned Options (#) | Option Exercise Price | Option Expiration Date | Number of Shares or Units of Stock That Have Not Vested | | Market Value of Shares or Units of Stock That Have Not Vested | | Equity Incentive Plan Awards: Number of Unearned Shares, Units or Other Rights That Have Not Vested | | Equity Incentive Plan Awards: Market or Payout Value of Unearned Shares, Units or Other Rights That Have Not Vested |
| | (#) | (#) | | ($) | | (#) | | ($) (1) | | (#) | | ($) |
| Joseph A. Vitiritto | - | - | - | - | - | 120,000 | (2) | 2,493,600 | | - | | - |
| | - | - | - | - | - | 6,517 | (3) | 135,423 | | - | | - |
| | - | - | - | - | - | 12,938 | (4) | 268,852 | | - | | - |
| Lance K. Stewart | - | - | - | - | - | 1,428 | (5) | 29,674 | | - | | - |
| | - | - | - | - | - | 13,332 | (6) | 277,039 | | - | | - |
| | - | - | - | - | - | 1,948 | (7) | 40,479 | | - | | - |
| | - | - | - | - | - | 2,420 | (4) | 50,288 | | - | | - |
| Allen W. West | - | - | - | - | - | - | | - | | - | | - |
| (1) | Based on the closing market price of $20.78 per share of PTSI’s common stock as reported on the NASDAQ Global Market on December 31, 2023. |
| (2) | These shares will vest in installments of 20,000 shares each on August 18 in 2024 and 2027 and 40,000 shares each on August 18 in 2025 and 2026. |
| (3) | These shares will vest in installments of 2,173 on February 9, 2024 and 2,172 shares each on February 9, 2025 and 2026. |
| (4) | These shares will vest in four equal installments of 25% each beginning on February 9, 2024. |
| (5) | These shares vested in their entirety on January 3, 2024. |
| (6) | These shares will vest in their entirety on August 4, 2024. |
| (7) | These shares will vest in installments of 650 shares on February 9, 2024 and 649 shares each on February 9, 2025 and 2026. |
Options Exercised and Stock Vested
The following table contains information about stock options exercised and restricted stock awards vested by each of our named executive officers during 2023.
| | Option Awards | Stock Awards |
| Name | Number of shares acquired on exercise | Value realized on exercise ($) | Number of shares acquired on vesting | Value realized on vesting ($) |
| Joseph A. Vitiritto | - | - | 22,173 | 506,096 |
| Lance K. Stewart | - | - | 650 | 18,395 |
| Allen W. West | - | - | 934 | 26,432 |
Payments Upon Termination or Change In Control
Generally, employment agreements and certain of our stock award agreements that we enter into with any of our executive officers provide for payments that may be made to the executive officers following termination of their employment. The potential payments under our employment agreements with our executive officers and other payments to which our executive officers are entitled upon termination are discussed below and quantified in the tables that follow. We do not have any agreements or plans that provide for payments to any of our executive officers based on the occurrence of a change in control of the Company.
No Payments If There Is a Termination for Just Cause
In the event that one of our executive officers is terminated for just cause, including conviction of a crime, moral turpitude, gross negligence in the performance of duties, intentional failure to perform duties, insubordination, or dishonesty, we would have no obligation to pay base salary or benefits beyond the last day worked.
Payments Upon Death
In the event of the death of one of our executive officers, we would pay the executive officer his base salary through the date of death. Upon death, Mr. Vitiritto would be entitled to receive any deferred bonus earned but not yet paid.
Payments Upon Disability
In the event that an executive officer becomes disabled and is unable to perform his duties, we may terminate his employment. If the executive officer’s employment is terminated due to disability, the employment agreements provide that he would be entitled to receive his base salary and benefits for three months following the date of disability and any deferred bonus earned but not yet paid.
Payments Upon Termination Based on Our Best Interest
In the event that an executive officer is terminated by our Board of Directors based upon a determination that such action would serve the Company’s best interest, we would generally have no obligation to pay base salary or benefits beyond the last day worked. However, Mr. Vitiritto would be entitled to receive base salary and COBRA benefits for a period of 60 weeks. Mr. Stewart would be entitled to receive base salary for a period of four months following the termination of employment in the Company’s best interest. If the Board of Directors elects to extend Mr. Stewart’s covenant not to compete for one year, Mr. Stewart would be entitled to receive base salary for a period of 12 months.
Payments Upon Resignation, Including Retirement
Our executive officers have the right to resign by providing written notice of the intent to resign. Mr. Vitiritto must provide six months’ written notice, and Mr. Stewart must provide four months’ written notice. Following such notice, we may terminate the executive’s employment before the end of the notice period.In the event an officer resigns with the required notice or is terminated following such notice, the executive officer is entitled to receive base salary through the end of the notice period. Mr. West was required under his employment agreement to provide three months’ written notice. He notified the Company on March 8, 2023 of his intention to resign from his positions with the Company. On March 13, 2023, our Board of Directors appointed Mr. Stewart as interim Chief Financial Officer and Treasurer, and on April 3, 2023, the Board appointed him Vice President of Finance, Chief Financial Officer and Treasurer. Mr. West remained in an advisory role with the Company until June 8, 2023. We entered into a separation and consulting agreement with Mr. West on July 10, 2022. Information regarding the terms of this agreement and the payments to which Mr. West was entitled under the agreement is discussed below under “Separation and Consulting Agreement with Mr. West.”
Obligations of Executive Officers
Under our existing employment agreements and certain restricted stock award agreements, our executive officers have agreed not to compete with, or solicit or retain business that is competitive with, our business, or that of specified affiliates under common ownership with us for a specified period after employment with us terminates. The duration of the non-compete period is one year for Mr. Vitiritto and six months for Mr. Stewart. We have the right to extend the non-compete period for Mr. Stewart for an additional 12 months, in which case Mr. Stewart will be entitled to receive his monthly base salary for the full extended period. In addition, Mr. Stewart has agreed not to solicit or accept business that is competitive with us or certain of our affiliates for two years after his employment with us terminates. In the event that Mr. Stewart were terminated because such termination is in the best interest of the Company, his employment agreement provides that the duration of his covenant not to solicit or accept competitive business will be for a period of four months and can be extended for one year, in which case Mr. Stewart will be entitled to receive base salary for a period of 12 months. Mr. Vitiritto and Mr. Stewart have also agreed that they will not, for a period of 24 months after termination, encourage, solicit or otherwise attempt to persuade any of our employees or any employees of the specified affiliates to leave our employment or employment with the specified affiliates. If an executive officer were to hire an employee from us or a specified affiliate during the restricted period, the executive officer has agreed to pay us or our affiliate 30% of the employee’s first year’s gross compensation. Under the employment agreements, our executive officers have also agreed to maintain the confidentiality of our proprietary information.
Stock Awards
The terms of the award agreements for the restricted shares granted to Messrs. Vitiritto and Stewart provide that all unvested shares will be forfeited at the time of termination. However, upon termination of the executive’s continuous service due to the executive’s voluntary retirement after reaching age 65, the Compensation Committee or the Board may, in its discretion, accelerate the vesting of any unvested shares of restricted stock. The terms of both the February 2022 and February 2023 awards to Messrs. Vitiritto and Stewart also provide that the Company will be entitled to recover an amount equal to 60% of the value realized under the award if the executive violates the non-compete and non-solicitation covenants in his employment agreement.
Separation and Consulting Agreement with Mr. West
Under the terms of the separation and consulting agreement we entered into with Mr. West in July 2023, Mr. West agreed to make himself available to advise senior management and consult with us as we may reasonably request from time to time for a one-year period for a monthly consulting fee of $35,771.67. We also agreed to provide health insurance coverage under COBRA during the consulting period, unless he becomes eligible for executive benefits from a subsequent employer. In recognition of his contributions to the Company, and in consideration of the covenants contained in the agreement and the accompanying release, we agreed to pay Mr. West a cash bonus in the aggregate amount of $1,250,000, payable in five equal semi-annual installments beginning six months after the agreement becomes effective. We also agreed to repurchase the shares of our common stock owned by Mr. West (excluding his unvested restricted shares of common stock which were forfeited upon his resignation) at the closing market price per share of our common stock on the effective date of the agreement. These payments and benefits are subject to Mr. West having not revoked a customary release of claims in favor of the Company and his compliance with terms and conditions of the agreement.
Mr. West is also subject to restrictive covenants with respect to the confidentiality of our proprietary information and the non-solicitation of employees or business that is competitive with our business or that of certain affiliated companies under common ownership with us for a 12-month period following the effective date of his resignation from the Company. The separation and consulting agreement also contains customary cooperation and mutual non-disparagement provisions.
Director Compensation for 2023
The following table provides information about the compensation of our directors for the year ended December 31, 2023.
| Name | Fees Earned or Paid in Cash | Stock Awards | Option Awards | Non-Equity Incentive Plan Compensation | Change in Pension Value and Nonqualified Deferred Compensation Earnings | All Other Compensation | Total |
| (1) | ($) | ($) (2) | ($) | ($) | ($) | ($) | ($) (2) |
| | | | | | | | |
| Michael D. Bishop | 55,000 | - | - | - | - | - | 55,000 |
| Frederick P. Calderone | 50,000 | - | - | - | - | - | 50,000 |
| W. Scott Davis | 65,000 | - | - | - | - | - | 65,000 |
| Edwin J. Lukas | 50,000 | - | - | - | - | - | 50,000 |
| Franklin H. McLarty | 40,000 | 14,993 | - | - | - | - | 54,993 |
| H. Pete Montaño | 45,000 | 9,987 | - | - | - | - | 54,987 |
| Matthew J. Moroun | 35,000 | 14,993 | - | - | - | - | 49,993 |
| Matthew T. Moroun | 90,000 | 14,993 | - | - | - | - | 104,993 |
| (1) | Our CEO and President, Mr. Vitiritto, who is also a director, has been omitted from this table because he receives no additional compensation for serving on our Board of Directors. Mr. Vitiritto’s compensation is included in the Summary Compensation Table. |
| (2) | The amounts shown represent the compensation expense that we recognized in 2023, determined in accordance with FASB ASC Topic 718 for shares of our common stock issued to our non-employee directors, who have the option to elect stock in lieu of cash for a portion of their compensation. The grant date fair value of $23.95 for these shares was determined based on the closing price on May 8, 2023. |
Compensation Arrangements for Non-employee Directors
Director compensation is determined by our Board of Directors. For 2023, we paid our non-employee directors an annual retainer of $50,000, paid in two equal semiannual installments, with the option to elect to receive up to $15,000 of the first annual retainer installment in unrestricted shares of common stock in lieu of cash, valued based on the closing price of our common stock on May 8, 2023, the date of issuance. The Chairman of the Board, which is a non-officer position, was paid an annual retainer of $100,000, and the chairmen of our Audit Committee and Compensation Committee were paid additional annual retainers of $15,000 and $5,000, respectively. Members of our Audit Committee, other than the chairman, were paid an additional annual retainer of $5,000. We reimburse our directors for expenses that they incur in attending Board and committee meetings, including expenses for food, lodging and transportation.
Item 12. Security Ownership of Certain Beneficial Owners and Management and Related Stockholder Matters.
The information presented under the caption “SecuritySecurity Ownership of Certain Beneficial Owners and Management”Management
The following table sets forth certain information as of April 19, 2024, regarding beneficial ownership of our common stock by: (i) each person who is known to us to own beneficially more than 5% of our common stock; (ii) each of our directors; (iii) each of the named executive officers in the proxy statement is incorporated here by reference.Summary Compensation Table of this annual report; and (iv) the total for our current directors and executive officers as a group.
| Name or Group of Beneficial Owner | Shares Owned | Shares Held in Trust | Shares Vesting Within 60 Days | Shares Beneficially Owned (1) | Percent of Class (2) |
5% Stockholders: | | | | | |
| Dimensional Fund Advisors LP (3) | 1,351,428 | - | - | 1,351,428 | 6.13% |
Directors and Named Executive Officers: | | | | | |
| Michael D. Bishop | 2,808 | - | - | 2,808 | * |
| Frederick P. Calderone (4) | 10,352 | - | - | 10,352 | * |
| W. Scott Davis | 56,196 | - | - | 56,196 | * |
| Edwin J. Lukas | 5,082 | - | - | 5,082 | * |
| Franklin H. McLarty | 8,962 | - | - | 8,962 | * |
| H. Pete Montaño | 3,530 | - | - | 3,530 | * |
| Matthew J. Moroun (5) | 2,752 | - | - | 2,752 | * |
| Matthew T. Moroun (6) | - | 15,928,196 | - | 15,930,948 | 72.30% |
| Lance K. Stewart | 3,333 | - | - | 3,333 | * |
| Joseph A. Vitiritto | 27,215 | - | - | 27,215 | * |
| Allen W. West | - | - | - | - | - |
| Directors and executive officers as a group | 118,430 | 15,928,196 | - | 16,048,426 | 72.83% |
Total Outstanding Shares as of April 19, 2024 | | | | | 22,034,762 |
| | |
| * | Denotes less than one percent. |
| (1) | The number of shares beneficially owned includes any shares over which the person has sole or shared voting power or investment power and also any shares that the person can acquire within 60 days of April 19, 2024, through the exercise of any stock option or other right, as well as any unvested shares pursuant to restricted stock awards that vest within 60 days of April 19, 2024. Unless otherwise indicated, each person has sole investment and voting power (or shares such power with his spouse) over the shares set forth in the table. |
| (2) | The percentages shown are based on the 22,034,762 shares of our common stock outstanding as of April 19, 2024, plus the number of shares that the named person or group has the right to acquire within 60 days of April 19, 2024. For purposes of computing the percentage of outstanding shares of common stock held by each person or group, any shares the person or group has the right to acquire within 60 days of April 19, 2024 are deemed to be outstanding with respect to such person or group, but are not deemed to be outstanding for the purpose of computing the percentage of ownership of any other person or group. |
| (3) | Based upon a Schedule 13G/A, filed on February 9, 2024, by Dimensional Fund Advisors LP, a Delaware limited partnership, which indicates that as of December 29, 2023, Dimensional Fund Advisors LP had sole voting power with respect to 1,326,909 shares and sole dispositive power with respect to 1,351,428 shares as an investment advisor or manager to investment companies, trusts and separate accounts that own the reported shares. Dimensional Fund Advisors LP had no shared voting or dispositive power with respect to the reported shares. The address of Dimensional Fund Advisors LP is 6300 Bee Cave Road, Building One, Austin, Texas 78746. We make no representation as to the accuracy or completeness of the information reported. |
| (4) | Does not include the 6,354,148 shares beneficially owned by the 2020 Irrevocable Lindsay S. Moroun Trust (the “2020 Lindsay Moroun Trust”) or the 306,048 shares beneficially owned by the 2020 Irrevocable Agnes Anne Moroun Trust (the “2020 AAM Trust”). Mr. Calderone serves as special trustee of these trusts with sole voting power over the shares held by each trust, and Matthew T. Moroun serves as trustee of each of these trusts with investment power over the shares held by each trust. Mr. Calderone disclaims beneficial ownership of the shares held by these trusts, and this disclosure shall not be deemed an admission that Mr. Calderone is the beneficial owner of such shares. |
| (4) | Does not include the 9,268,000 shares beneficially owned by the Grantor Trust for Matthew T. Moroun and DuraRock Underwriters, Ltd. (the “Moroun Grantor Trust”), the 6,354,148 shares beneficially owned by the 2020 Lindsay Moroun Trust, or the 306,048 shares beneficially owned by the 2020 AAM Trust.. |
| (5) | Includes the 2,752 shares owned by Mr. Moroun’s son, Matthew J. Moroun, 9,268,000 shares held by the Moroun Grantor Trust, of which Matthew T. Moroun is trustee and a beneficiary, 6,354,148 shares held by the 2020 Lindsay Moroun Trust, of which Matthew T. Moroun is trustee, and 306,048 shares held by the 2020 AAM Trust, of which Matthew T. Moroun is trustee. The business address of Matthew T. Moroun is 12225 Stephens Road, Warren, Michigan 48089. |
Equity Compensation Plan Information
The following table summarizes, as of December 31, 2006,2023, information about compensation plans under which equity securities of the Company are authorized for issuance:
| Plan Category | Number of securities to be issued upon exercise of outstanding options, warrants and rights(1) (a) | Weighted-average exercise price of outstanding options, warrants and rights(1) (b) | Number of securities remaining available for future issuance under equity compensation plans (excluding securities reflected in column (a)) (c) |
| Equity Compensation Plans approved by Security Holders | 198,859 | - | 1,401,821 |
| | | | |
| Equity Compensation Plans not approved by Security Holders | - | - | - |
| | | | |
| Total | 198,859 | - | 1,401,821 |
Plan Category | | Number of securities to be issued upon exercise of outstanding options, warrants and rights | | Weighted-average exercise price of outstanding options, warrants and rights | | Number of securities remaining available for future issuance under equity compensation plans | |
| Equity Compensation Plans approved by Security Holders | | | 284,500 | | $ | 22.83 | | | 734,000 | |
| | | | | | | | | | | |
| Equity Compensation Plans not approved by Security Holders | | | -0- | | | -0- | | | -0- | |
| | | | | | | | | | | |
| Total | | | 284,500 | | $ | 22.83 | | | 734,000 | |
The information presented under the captions (i) “TransactionsTransactions with Related Persons
We have a written policy requiring that our Audit Committee review and approve related person transactions that involve us and are of the type that are required to be disclosed in our proxy statement by SEC rules. A transaction may be a related person transaction if any of our directors, executive officers, owners of more than 5% of our common stock, or their immediate family have a material interest in the transaction and the amount involved exceeds $120,000. The policy authorizes the Audit Committee to approve a related person transaction if it determines that the transaction is at least as favorable to us as could have been obtained if the transaction had been with a person who is not related to us or is in our best interest.
Mr. Matthew T. Moroun is Chairman of our Board of Directors and Chairman of the Compensation Committee and the Executive Committee of our Board of Directors. His son, Mr. Matthew J. Moroun, is also a member of our Board of Directors. Although neither of them is an officer of the Company, certain Moroun family trusts beneficially own a majority of our outstanding shares. Mr. Matthew T. Moroun is trustee of these trusts with investment authority over the shares in the trusts. Messrs. Matthew T. and Matthew J. Moroun also exercise significant influence over the management and operating policies of other family-owned businesses engaged in transportation, insurance, business services, and real estate development and management. Subject to our Audit Committee’s review and approval, through our various subsidiaries we transact business with these affiliates in the ordinary course of business.
During 2023, Moroun-affiliated companies paid us a total of $8,120,949. These payments represent insurance claims payments of $885,108, freight transportation charges of $5,884,627, equipment leases payments of $333,189, reimbursement for Mexico operational expenses provided by a shared third-party service provider of $768,011, real estate rent and upkeep of $239,021, payments for the purchase of used company vehicles of $10,817 and payments for parts and repairs of $176.
During 2023, we made payments to certain Moroun-affiliated companies in the aggregate amount of $29,448,284. These payments are described below.
We made payments of $1,137,583 for purchases of trailing equipment and $8,063,600 for equipment parts and maintenance services to Moroun-affiliated companies during 2023.
Payments of $1,540,102 were made for real estate leases during 2023 which include maintenance facilities in one state and trailer drop yards in multiple states. The leases are generally month-to-month leases with automatic monthly renewal provisions.
Payments of $26,232 were made for bulk fuel purchases during 2023. Payments in the amount of $865,858 were made for management and payroll services and software during 2023.
We made payments to a Moroun-affiliated insurance company during 2023 in the amount of $1,992,515 for insurance premiums paid pursuant to agreements to provide insurance coverage to certain of our independent contractors. The underlying agreements are made directly with the independent contractors. The full amount of these payments are recouped by us from the independent contractors. We also purchased physical damage insurance coverage on our tractors and trailers through an unaffiliated insurance broker, which is written by a subsidiary of a Moroun-affiliated insurance company. During 2023, we received $885,108 in payments for claims filed. We secure coverage for commercial auto and general liability insurance through a Moroun-affiliated company. We also purchase workers compensation insurance coverage written by a subsidiary of a Moroun-affiliated insurance company. In 2023, we made premium payments of $15,822,394 for commercial auto liability, general liability and workers’ compensation coverage under these policies.
In July 2023, we repurchased 24,934 shares of our common stock from our former Chief Financial Officer, Allen W. West, for a total purchase price of $641,552.
During 2022, Moroun-affiliated companies paid us a total of $1,945,414. These payments represent insurance claims payments of $669,851, freight transportation charges of $554,055, equipment lease payments of $487,870, real estate rent and upkeep of $227,829, payments for the purchase of used company vehicles of $4,770, and payments for parts and repairs of $1,039.
During 2022, we made payments to certain Moroun-affiliated companies in the aggregate amount of $26,356,766. These payments are described below.
We made payments of $4,794,386 for purchases of trailing equipment and $4,304,508 for equipment parts and maintenance services to Moroun-affiliated companies during 2022.
Payments of $1,780,813 were made for real estate leases during 2022 which include maintenance facilities in one state and trailer drop yards in multiple states. The leases are generally month-to-month leases with automatic monthly renewal provisions.
Payments of $111,899 were made for bulk fuel purchases during 2022. Payments in the amount of $366,740 were made for management and payroll services and software during 2022.
We made payments to a Moroun-affiliated insurance company during 2022 in the amount of $2,166,046 for insurance premiums paid pursuant to agreements to provide insurance coverage to certain of our independent contractors. Because the underlying agreements are made directly with the independent contractors, the full amount of these payments were recouped by us from the independent contractors. We also purchased physical damage insurance coverage on our tractors and trailers through an unaffiliated insurance broker, which is written by a subsidiary of a Moroun-affiliated insurance company. During 2022, we received $669,851 in payments for claims filed. We secure coverage for commercial auto and general liability insurance through a Moroun-affiliated company. We also purchase workers compensation insurance coverage written by a subsidiary of a Moroun-affiliated insurance company. In 2022, we made premium payments of $12,832,375 for commercial auto liability, general liability and workers’ compensation coverage under these policies.
We believe that substantially all of the above transactions were entered into on terms at least as favorable to us as could have been obtained from persons who were not related to us, and each of the transactions was in our best interest. Our operating subsidiaries continue to enter into transactions with Moroun-affiliated entities in 2024 that are similar to those described above.
Director Independence
NASDAQ listing standards generally require that, unless a listed company qualifies as a “controlled company,” a majority of the members of the company’s Board of Directors must be independent. The listing standards define a “controlled company” as a company of which more than 50% of the voting power for the election of directors is held by an individual, a group or another company. More than 50% of the voting power of our company is held by a group of family trusts established for the benefit of members of the Moroun family. Mr. Matthew T. Moroun, the Chairman of our Board of Directors, is the trustee of these family trusts and holds investment authority over the shares of our common stock held by the trusts. Frederick P. Calderone, a member of our Board of Directors, is the special trustee of certain of these family trusts, and in that capacity, he exercises voting power over the shares held by such trusts, while Mr. Moroun exercises voting power over the shares held by the other family trust of which he is trustee. The special trustee serves at the discretion of the trustee of the trusts, and members of the Moroun family are the beneficiaries of the family trusts. Messrs. Moroun and Calderone have entered into a voting agreement under which Mr. Moroun agreed to vote the shares of our common stock held by the family trust over which he exercises voting power in accordance with and in the same manner as Mr. Calderone votes the shares of our common stock held by the family trusts over which the special trustee exercises voting power. Therefore, votes cast on behalf of the family trusts control any action requiring the general approval of our shareholders, including the information referenced thereelection of our board of directors, the adoption of amendments to our certificate of incorporation and bylaws, and the approval of any merger or sale of substantially all of our assets. As a result, we have elected to be treated as a “controlled company” in accordance with Rule 5615(c) of the NASDAQ Listing Rules. Accordingly, we are not subject to the NASDAQ rules that is set forth underwould otherwise require us to have (i) a majority of independent directors on the caption “Corporate Governance - Compensation Committee Interlocksboard; (ii) a compensation committee composed solely of independent directors; and Insider Participation”(iii) a nominating committee composed solely of independent directors.
Our Board of Directors has reviewed the independence of director nominees and (ii) “Corporate Governance - Director Independence”determined that four of our director nominees, Messrs. Bishop, Davis, McLarty and Montaño, meet the standards for independence required by applicable NASDAQ listing standards. In making this determination, our Board has concluded that none of the independent directors has a relationship that, in the proxy statement is incorporated here by reference.opinion of our Board, would interfere with the exercise of independent judgment in carrying out the responsibilities of a director.
The information presented under the caption “Independent Public Accountants - Principal Accountant Fees and Services” in the proxy statement is incorporated here by reference.
The principal independent registered public accounting firm utilized by us during 2023 and 2022 was Grant Thornton LLP (“Grant Thornton”).
The following table sets forth Grant Thornton’s fees for the years ended December 31, 2023 and December 31, 2022, respectively.
| | 2023 | | 2022 |
| Audit Fees (1) | $389,703 | | $381,344 |
| Audit-Related Fees | - | | - |
| Tax Fees | - | | - |
| All Other Fees | - | | - |
| Total Fees | $389,703 | | $381,344 |
| (1) | Includes the aggregate fees billed for professional services rendered for 2023 and 2022 for the audit of our annual financial statements and review of financial statements included in our quarterly reports on Form 10-Q. |
Audit Committee Pre-Approval Policies and Procedures
The Audit Committee pre-approves audit services and non-audit services that are to be performed for us by our independent auditor. The Audit Committee has delegated authority to its chairman, or any two of its other members acting together, to approve, between meetings of the Audit Committee, audit services and permissible non-audit services. Approvals between meetings are required to be reported to the Audit Committee at its next meeting. In addition to there being engagement letters for audit services, the Audit Committee has determined that there should be an engagement letter for any non-audit services that are to be performed by the independent auditor. All of the services described in the table above were pre-approved by the Audit Committee or by the chairman of the Audit Committee under the authority delegated by the Audit Committee.
PART IV
(a)Financial Statements and Schedules.
(1)Financial Statements: See Part II, Item 8 hereof.
Report of Independent Registered Public Accounting Firm - Grant Thornton LLP
Report of Independent Registered Public Accounting Firm - Deloitte & Touche LLP
Consolidated Balance Sheets - December 31, 2006 and 2005
Consolidated Statements of Income - Years ended December 31, 2006, 2005 and 2004
Consolidated Statements of Shareholders’ Equity - Years ended December 31, 2006, 2005 and 2004
Consolidated Statements of Cash Flows - Years ended December 31, 2006, 2005 and 2004
Notes to Consolidated Financial Statements
(2)Financial Statement Schedules.
All schedules for which provision is made in the applicable accounting regulations of the SEC are omitted as the required information is inapplicable, or because the information is presented in the consolidated financial statements or related notes.
(3)Exhibits.
The following exhibits are filed with or incorporated by reference into this Report. The exhibits which are denominated by an asterisk (*) were previously filed as a part of, and are hereby incorporated by reference from either (i) the Form S-1 Registration Statement under the Securities Act of 1933, as filed with the Securities and Exchange Commission on July 30, 1986, Registration No. 33-7618, as amended on August 8, 1986, September 3, 1986 and September 10, 1986 (“1986 S-1”); (ii) the Quarterly Report on Form 10-Q for the quarter ended June 30, 1994 (“6/30/94 10-Q”); (iii) the Quarterly Report on Form 10-Q for the quarter ended June 30, 1995 (“6/30/95 10-Q”); (iv) the Quarterly Report on Form 10-Q for the quarter ended September 30, 1996 (“9/30/96 10-Q”); (v) the Form S-8 Registration Statement filed on June 11, 1999 (“6/11/99 S-8”); (vi) the Annual Report on Form 10-K for the year ended December 31, 2001 (“2001 10-K”); (vii) the Quarterly Report on Form 10-Q for the quarter ended March 31, 2002 (“3/31/02 10-Q”); (viii) the Quarterly Report on Form 10-Q for the quarter ended September 30, 2004 (“9/30/2004 10-Q”); (ix) the Annual Report on Form 10-K for the year ended December 31, 2004 (“2004 10-K”); (x) the Form 8-K filed on January 25, 2005 (“1/25/2005 8-K”); (xi) Form 8-K filed on March 7, 2005 (“3/07/2005 8-K”); (xii) Form 8-K filed on May 31, 2006 (“5/31/2006 8-K”); (xiii) Form 8-K filed on July 28, 2006 (“7/28/2006 8-K”); (xiv) the Form 8-K filed on January 22, 2007 (“1/22/2007 8-K”); (xv) the Annual Report on Form 10-K for the year ended December 31, 2005 (“2005 10-K”); or (xvi) the Quarterly Report on Form 10-Q for the quarter ended June 30, 2006 (“6/30/06 10-Q”).
| (a) | Financial Statements and Schedules. |
Exhibit #
| Description of Exhibit
| *3.1 | | Amended and Restated Certificate of Incorporation of the Registrant (Exh. 3.1, 3/31/02 10-Q) |
| | (1) | |
*3.2 | | AmendedFinancial Statements. No financial statements or supplemental data are filed with this Amendment. The consolidated financial statements and Restated By-Lawsrelated notes are included in Part II, Item 8 of the Registrant (Exh. 3.2, 1/22/07 8-K)Original Report. |
| | (2) | Financial Statement Schedules. All schedules for which provision is made in the applicable accounting regulations of the SEC are omitted as the required information is inapplicable, or because the information is presented in the consolidated financial statements or related notes. |
*4.1 | | Specimen Stock Certificate (Exh. 4.1, 1986 S-1) |
| | (3) | Exhibits. Except as amended and supplemented by the following documents, the exhibits required to be filed by Item 15 are set forth in, and filed with or incorporated by reference in, Item 15(a)(3) of the Original Report: |
*4.2 | | Loan Agreement dated July 26, 1994 among First Tennessee Bank National Association, Registrant and P.A.M. Transport, Inc. together with Promissory Note (Exh. 4.1, 6/30/94 10-Q) |
| | |
*4.2.1 | | Security Agreement dated July 26, 1994 between First Tennessee Bank National Association and P.A.M. Transport, Inc. (Exh. 4.2, 6/30/94 10-Q) |
Exhibit # | | Description of Exhibit |
| 3.4 | | |
| | | |
| 10.12 | (1) | |
| | | |
| 31.3 | | |
| | | |
| 31.4 | | |
| | | |
| 104 | | Cover Page Interactive Data File (formatted as Inline XBRL and contained in Exhibit 101) |
| | | |
| (1) Management contract or compensatory plan or arrangement. |
| | |
*4.3 | | First Amendment to Loan Agreement dated June 27, 1995 by and among P.A.M. Transport, Inc., First Tennessee Bank National Association and P.A.M. Transportation Services, Inc., together with Promissory Note in the principal amount of $2,500,000 (Exh. 4.1.1, 6/30/95 10-Q) |
| | |
*4.3.1 | | First Amendment to Security Agreement dated June 28, 1995 by and between P.A.M. Transport, Inc. and First Tennessee Bank National Association (Exh. 4.2.2, 6/30/95 10-Q) |
| | |
*4.3.2 | | Security Agreement dated June 27, 1995 by and between Choctaw Express, Inc. and First Tennessee Bank National Association (Exh. 4.1.3, 6/30/95 10-Q) |
| | |
*4.3.3 | | Guaranty Agreement of P.A.M. Transportation Services, Inc. dated June 27, 1995 in favor of First Tennessee Bank National Association respecting $10,000,000 line of credit (Exh. 4.1.4, 6/30/95 10-Q) |
| | |
*4.4 | | Second Amendment to Loan Agreement dated July 3, 1996 by P.A.M. Transport, Inc., First Tennessee Bank National Association and P.A.M. Transportation Services, Inc., together with Promissory Note in the principal amount of $5,000,000 (Exh. 4.1.1, 9/30/96 10-Q) |
| | |
*4.4.1 | | Second Amendment to Security Agreement dated July 3, 1996 by and between P.A.M. Transport, Inc. and First Tennessee National Bank Association (Exh. 4.1.2, 9/30/96 10-Q) |
| | |
*4.4.2 | | First Amendment to Security Agreement dated July 3, 1996 by and between Choctaw Express, Inc. and First Tennessee Bank National Association (Exh. 4.1.3, 9/30/96 10-Q) |
| | |
*4.4.3 | | Security Agreement dated July 3, 1996 by and between Allen Freight Services, Inc. and First Tennessee Bank National Association (Exh. 4.1.4, 9/30/96 10-Q) |
| | |
*4.5.1 | | Loan Agreement dated as of November 22, 2000 by and between P.A.M. Transport, Inc. and SunTrust Bank (Exh. 4.5.1, 2001 10-K) |
| | |
*4.5.2 | | Revolving Credit Note dated November 22, 2000 (Exh. 4.5.2, 2001 10-K) |
| | |
*4.5.3 | | Security Agreement by and between P.A.M. Transport, Inc. and SunTrust Bank (Exh. 4.5.3, 2001 10-K) |
| | |
*4.5.4 | | First Amendment to Loan Agreement, Revolving Credit Note and Security Deposit (Exh. 4.5.4, 2001 10-K) |
| | |
*10.1 | (1) | Employment Agreement between the Registrant and Robert W. Weaver, effective July 1, 2002 (Exh. 10.1.1, 2001 10-K) |
| | |
*10.1.1 | (1) | Employment Agreement between the Registrant and Robert W. Weaver, effective July 1, 2004 (Exh. 10.1, 1/25/2005 8-K) |
| | |
*10.1.2 | (1) | New Employment Agreement between the Registrant and Robert W. Weaver, dated July 10, 2006 (Exh. 10.1, 7/28/2006 8-K) |
| | |
*10.2 | (1) | Employment Agreement between the Registrant and W. Clif Lawson, dated January 1, 2002 (Exh. 10.2, 2001 10-K) |
| | |
*10.2.1 | (1) | Memo exercising the Company's option to extend W. Clif Lawson's Employment Agreement by one year (Exh. 10.2.1, 2004 10-K) |
| | |
*10.2.2 | (1) | New Employment Agreement between the Registrant and W. Clif Lawson, dated June 1, 2006 (Exh. 10.2, 7/28/2006 8-K) |
| | |
*10.3 | (1) | Employment Agreement between the Registrant and Larry J. Goddard, dated January 1, 2002 (Exh. 10.3, 2001 10-K) |
| | |
*10.3.1 | (1) | Memo exercising the Company's option to extend Larry J. Goddard's Employment Agreement by one year (Exh. 10.3.1, 2004 10-K) |
| | |
*10.3.2 | (1) | New Employment Agreement between the Registrant and Larry J. Goddard, dated June 1, 2006 (Exh. 10.3, 7/28/2006 8-K) |
| | |
*10.4 | (1) | 1995 Stock Option Plan, as Amended and Restated (Exh. 4.1, 6/11/99 S-8) |
| | |
*10.4.1 | (1) | Amendment to 1995 Stock Option Plan (Exh. 10.1, 3/07/2005 8-K) |
| | |
*10.4.2 | (1) | 2006 Stock Option Plan (Exh. 10.1, 5/31/2006 8-K) |
| | |
*10.5 | | Interest rate swap agreement, dated March 1, 2001 (Exh. 10.5, 2001 10-K) |
| | |
*10.6 | | Interest rate swap agreement dated June 1, 2001 (Exh. 10.6, 2001 10-K) |
| | |
*10.7 | (1) | Employee Non-Qualified Stock Option Agreement (Exh. 10.1, 9/30/2004 10-Q) |
| | |
*10.8 | (1) | Director Non-Qualified Stock Option Agreement (Exh. 10.2, 9/30/2004 10-Q) |
| | |
*10.8.1 | (1) | Form of Non-Qualified Stock option Agreement for Non-Employee Director stock options that are granted under the 2006 Stock Option Plan (Exh. 10.2, 5/31/2006 8-K) |
| | |
*10.9 | (1) | Executive Officers and Certain Other Employees Incentive Compensation Plan, as amended (Exh. 10.3, 9/30/2004 10-Q) |
| | |
*10.10 | (1) | Extension of Executive Officers and Certain Other Employees Incentive Compensation Plan, as amended (Exh. 10.10, 2005 10-K) |
| | |
*10.11 | (1) | Executive Incentive Plan (Exh. 10.2, 6/30/2006 10-Q) |
| | |
21.1 | | |
| | |
23.1 | | |
| | |
23.2 | | |
| | |
31.1 | | |
| | |
31.2 | | |
| | |
32.1 | | |
| | |
32.2 | | |
| | |
(1) Management contract or compensatory plan or arrangement. |
Pursuant to the requirements of Section 13 or 15(d) of the Securities Exchange Act of 1934, the registrant has duly caused this report to be signed on its behalf by the undersigned, thereunto duly authorized.
| | | P.A.M. TRANSPORTATION SERVICES, INC. | |
| | | | |
Dated: March 14, 2007April 29, 2024 | By: | /s/ Robert W. WeaverJoseph. A. Vitiritto | |
| | | ROBERTJOSEPH A. VITIRITTO | |
| | President and Chief Executive Officer | |
| | (principal executive officer) | |
| | | |
| Pursuant to the requirements of the Securities Exchange Act of 1934, this report has been signed below by the following persons on behalf of the registrant and in the capacities and on the dates indicated. | |
| | | |
| | | |
| Dated: April 29, 2024 | By: | /s/ Michael D. Bishop | |
| | MICHAEL D. BISHOP, Director | |
| | | |
| Dated: April 29, 2024 | By: | /s/ Frederick P. Calderone | |
| | FREDERICK P. CALDERONE, Director | |
| | | |
| Dated: April 29, 2024 | By: | /s/ W. WEAVERScott Davis | |
| | W. SCOTT DAVIS, Director | |
| | | |
| Dated: April 29, 2024 | By: | /s/ Edwin J. Lukas | |
| | EDWIN J. LUKAS, Director | |
| | | |
| Dated: April 29, 2024 | By: | /s/ Franklin H. McLarty | |
| | FRANKLIN H. MCLARTY, Director | |
| | | |
| Dated: April 29, 2024 | By: | /s/ H. Pete Montaño | |
| | H. PETE MONTAÑO, Director | |
| | | |
| Dated: April 29, 2024 | By: | /s/ Matthew J. Moroun | |
| | MATTHEW J. MOROUN, Director | |
| | | |
| Dated: April 29, 2024 | By: | /s/ Matthew T. Moroun | |
| | MATTHEW T. MOROUN, Director and Chairman of the Board | |
| | | |
| Dated: April 29, 2024 | By: | /s/ Joseph. A. Vitiritto | |
| | JOSEPH A. VITIRITTO | |
| | | President and Chief Executive Officer | |
| | | (principal executive officer) | |
| | | | |
Dated: March 14, 2007April 29, 2024 | By: | /s/ Larry J. GoddardLance K. Stewart | |
| | | LARRY J. GODDARDLANCE K. STEWART | |
| | | Vice President-Finance, Chief Financial Officer | |
| | Secretary and Treasurer | |
| | | (principal financial and accounting officer) | |
| | | |
Pursuant to the requirements of the Securities Exchange Act of 1934, this report has been signed by the following persons on behalf of the registrant and in the capacities and on the dates indicated: | |
| | | |
| | | |
Dated: March 14, 2007 | By: | /s/ Frederick P. Calderone | |
| | FREDERICK P. CALDERONE, Director | |
| | | |
Dated: March 14, 2007 | By: | /s/ Frank L. Conner | |
| | FRANK L. CONNER, Director | |
| | | |
Dated: March 14, 2007 | By: | /s/ Thomas H. Cooke | |
| | THOMAS H. COOKE, Director | |
| | | |
Dated: March 14, 2007 | By: | /s/ Christopher L. Ellis | |
| | CHRISTOPHER L. ELLIS, Director | |
| | | |
Dated: March 14, 2007 | By: | /s/ Manuel J. Moroun | |
| | MANUEL J. MOROUN, Director | |
| | | |
Dated: March 14, 2007 | By: | /s/ Matthew T. Moroun | |
| | MATTHEW T. MOROUN, Director | |
| | | |
Dated: March 14, 2007 | By: | /s/ Daniel C. Sullivan | |
| | DANIEL C. SULLIVAN, Director | |
| | | |
Dated: March 14, 2007 | By: | /s/ Robert W. Weaver | |
| | ROBERT W. WEAVER, | |
| | President and Chief Executive Officer, Director | |
| | | |
Dated: March 14, 2007 | By: | /s/ Charles F. Wilkins | |
| | CHARLES F. WILKINS, Director | |
The following exhibits are filed with or incorporated by reference into this Report. The exhibits which are denominated by an asterisk (*) were previously filed as a part of, and are hereby incorporated by reference from either (i) the Form S-1 Registration Statement under the Securities Act of 1933, as filed with the Securities and Exchange Commission on July 30, 1986, Registration No. 33-7618, as amended on August 8, 1986, September 3, 1986 and September 10, 1986 (“1986 S-1”); (ii) the Quarterly Report on Form 10-Q for the quarter ended June 30, 1994 (“6/30/94 10-Q”); (iii) the Quarterly Report on Form 10-Q for the quarter ended June 30, 1995 (“6/30/95 10-Q”); (iv) the Quarterly Report on Form 10-Q for the quarter ended September 30, 1996 (“9/30/96 10-Q”); (v) the Form S-8 Registration Statement filed on June 11, 1999 (“6/11/99 S-8”); (vi) the Annual Report on Form 10-K for the year ended December 31, 2001 (“2001 10-K”); (vii) the Quarterly Report on Form 10-Q for the quarter ended March 31, 2002 (“3/31/02 10-Q”); (viii) the Quarterly Report on Form 10-Q for the quarter ended September 30, 2004 (“9/30/2004 10-Q”); (ix) the Annual Report on Form 10-K for the year ended December 31, 2004 (“2004 10-K”); (x) the Form 8-K filed on January 25, 2005 (“1/25/2005 8-K”); (xi) Form 8-K filed on March 7, 2005 (“3/07/2005 8-K”); (xii) Form 8-K filed on May 31, 2006 (“5/31/2006 8-K”); (xiii) Form 8-K filed on July 28, 2006 (“7/28/2006 8-K”); (xiv) the Form 8-K filed on January 22, 2007 (“1/22/2007 8-K”); or (xv) the Annual Report on Form 10-K for the year ended December 31, 2005 (“2005 10-K”); (xvi) the Quarterly Report on Form 10-Q for the quarter ended June 30, 2006 (“6/30/06 10-Q”).
Exhibit #
| | Description of Exhibit
|
| | |
*3.1 | | Amended and Restated Certificate of Incorporation of the Registrant (Exh. 3.1, 3/31/02 10-Q) |
| | |
*3.2 | | Amended and Restated By-Laws of the Registrant (Exh. 3.2, 1/22/07 8-K) |
| | |
*4.1 | | Specimen Stock Certificate (Exh. 4.1, 1986 S-1) |
| | |
*4.2 | | Loan Agreement dated July 26, 1994 among First Tennessee Bank National Association, Registrant and P.A.M. Transport, Inc. together with Promissory Note (Exh. 4.1, 6/30/94 10-Q) |
| | |
*4.2.1 | | Security Agreement dated July 26, 1994 between First Tennessee Bank National Association and P.A.M. Transport, Inc. (Exh. 4.2, 6/30/94 10-Q) |
| | |
*4.3 | | First Amendment to Loan Agreement dated June 27, 1995 by and among P.A.M. Transport, Inc., First Tennessee Bank National Association and P.A.M. Transportation Services, Inc., together with Promissory Note in the principal amount of $2,500,000 (Exh. 4.1.1, 6/30/95 10-Q) |
| | |
*4.3.1 | | First Amendment to Security Agreement dated June 28, 1995 by and between P.A.M. Transport, Inc. and First Tennessee Bank National Association (Exh. 4.2.2, 6/30/95 10-Q) |
| | |
*4.3.2 | | Security Agreement dated June 27, 1995 by and between Choctaw Express, Inc. and First Tennessee Bank National Association (Exh. 4.1.3, 6/30/95 10-Q) |
| | |
*4.3.3 | | Guaranty Agreement of P.A.M. Transportation Services, Inc. dated June 27, 1995 in favor of First Tennessee Bank National Association respecting $10,000,000 line of credit
(Exh. 4.1.4, 6/30/95 10-Q)
|
| | |
*4.4 | | Second Amendment to Loan Agreement dated July 3, 1996 by P.A.M. Transport, Inc., First Tennessee Bank National Association and P.A.M. Transportation Services, Inc., together with Promissory Note in the principal amount of $5,000,000 (Exh. 4.1.1, 9/30/96 10-Q) |
| | |
*4.4.1 | | Second Amendment to Security Agreement dated July 3, 1996 by and between P.A.M. Transport, Inc. and First Tennessee National Bank Association (Exh. 4.1.2, 9/30/96 10-Q) |
| | |
*4.4.2 | | First Amendment to Security Agreement dated July 3, 1996 by and between Choctaw Express, Inc. and First Tennessee Bank National Association (Exh. 4.1.3, 9/30/96 10-Q) |
| | |
*4.4.3 | | Security Agreement dated July 3, 1996 by and between Allen Freight Services, Inc. and First Tennessee Bank National Association (Exh. 4.1.4, 9/30/96 10-Q)
|
| | |
*4.5.1 | | Loan Agreement dated as of November 22, 2000 by and between P.A.M. Transport, Inc. and SunTrust Bank (Exh. 4.5.1, 2001 10-K) |
| | |
*4.5.2 | | Revolving Credit Note dated November 22, 2000 (Exh. 4.5.2, 2001 10-K) |
| | |
*4.5.3 | | Security Agreement by and between P.A.M. Transport, Inc. and SunTrust Bank (Exh. 4.5.3, 2001 10-K) |
| | |
*4.5.4 | | First Amendment to Loan Agreement, Revolving Credit Note and Security Deposit (Exh. 4.5.4, 2001 10-K) |
| | |
*10.1 | (1) | Employment Agreement between the Registrant and Robert W. Weaver, effective July 1, 2002 (Exh. 10.1.1, 2001 10-K) |
| | |
*10.1.1 | (1) | Employment Agreement between the Registrant and Robert W. Weaver, effective July 1, 2004 (Exh. 10.1, 1/25/2005 8-K) |
| | |
*10.1.2 | (1) | New Employment Agreement between the Registrant and Robert W. Weaver, dated July 10, 2006 (Exh. 10.1, 7/28/2006 8-K) |
| | |
*10.2 | (1) | Employment Agreement between the Registrant and W. Clif Lawson, dated January 1, 2002 (Exh. 10.2, 2001 10-K) |
| | |
*10.2.1 | (1) | Memo exercising the Company's option to extend W. Clif Lawson's Employment Agreement by one year (Exh. 10.2.1, 2004 10-K) |
| | |
*10.2.2 | (1) | New Employment Agreement between the Registrant and W. Clif Lawson, dated June 1, 2006 (Exh. 10.2, 7/28/2006 8-K) |
| | |
*10.3 | (1) | Employment Agreement between the Registrant and Larry J. Goddard, dated January 1, 2002 (Exh. 10.3, 2001 10-K) |
| | |
*10.3.1 | (1) | Memo exercising the Company's option to extend Larry J. Goddard's Employment Agreement by one year (Exh. 10.3.1, 2004 10-K) |
| | |
*10.3.2 | (1) | New Employment Agreement between the Registrant and Larry J. Goddard, dated June 1, 2006 (Exh. 10.3, 7/28/2006 8-K) |
| | |
*10.4 | (1) | 1995 Stock Option Plan, as Amended and Restated (Exh. 4.1, 6/11/99 S-8) |
| | |
*10.4.1 | (1) | Amendment to 1995 Stock Option Plan (Exh. 10.1, 3/07/2005 8-K) |
| | |
*10.4.2 | (1) | 2006 Stock Option Plan (Exh. 10.1, 5/31/2006 8-K) |
| | |
*10.5 | | Interest rate swap agreement, dated March 1, 2001 (Exh. 10.5, 2001 10-K) |
| | |
*10.6 | | Interest rate swap agreement dated June 1, 2001 (Exh. 10.6, 2001 10-K) |
| | |
*10.7 | (1) | Employee Non-Qualified Stock Option Agreement (Exh. 10.1, 9/30/2004 10-Q) |
| | |
*10.8 | (1) | Director Non-Qualified Stock Option Agreement (Exh. 10.2, 9/30/2004 10-Q) |
| | |
*10.8.1 | (1) | Form of Non-Qualified Stock option Agreement for Non-Employee Director stock options that are granted under the 2006 Stock Option Plan (Exh. 10.2, 5/31/2006 8-K) |
| | |
*10.9 | (1) | Executive Officers and Certain Other Employees Incentive Compensation Plan, as amended (Exh. 10.3, 9/30/2004 10-Q) |
| | |
*10.10 | (1) | Extension of Executive Officers and Certain Other Employees Incentive Compensation Plan, as amended (Exh. 10.10, 2005 10-K) |
| | |
*10.11 | (1) | Executive Incentive Plan (Exh. 10.2, 6/30/2006 10-Q) |
| | |
21.1 | | |
| | |
23.1 | | |
| | |
23.2 | | |
| | |
31.1 | | |
| | |
31.2 | | |
| | |
32.1 | | |
| | |
32.2 | | |
| | |
(1) Management contract or compensatory plan or arrangement. |