UNITED STATES
SECURITIES AND EXCHANGE COMMISSION
Washington, D.C. 20549
FORM 10-K
|
| |
| þ | ANNUAL REPORT PURSUANT TO SECTION 13 OR 15(d) OF THE SECURITIES EXCHANGE ACT OF 1934 |
FOR THE FISCAL YEAR ENDED OCTOBER 2, 20161, 2017
COMMISSION FILE NUMBER 1-9390
|
| | |
| Delaware | | 95-2698708 |
| (State of Incorporation) | | (I.R.S. Employer Identification No.) |
| | |
| 9330 Balboa Avenue, San Diego, CA | | 92123 |
| (Address of principal executive offices) | | (Zip Code) |
Registrant’s telephone number, including area code (858) 571-2121
Securities registered pursuant to Section 12(b) of the Act:
|
| | |
| Title of each class | | Name of each exchange on which registered |
| Common Stock, $0.01 par value | | The NASDAQ Stock Market LLC (NASDAQ Global Select Market) |
Securities registered pursuant to Section 12(g) of the Act: None
Indicate by check mark whether the registrant is a well-known seasoned issuer, as defined in Rule 405 of the Securities Act.
Yes þ No ¨
Indicate by check mark if the registrant is not required to file reports pursuant to Section 13 or 15(d) of the Act.
Yes ¨ No þ
Indicate by check mark if the registrant (1) has filed all reports required to be filed by Section 13 or 15(d) of the Securities Exchange Act of 1934 during the preceding 12 months (or for such shorter period that the registrant was required to file such reports), and (2) has been subject to such filing requirements for the past 90 days.
Yes þ No ¨
Indicate by check mark whether the registrant has submitted electronically and posted on its corporate Website, if any, every Interactive Data File required to be submitted and posted pursuant to Rule 405 of Regulations S-T (§232.405 of this chapter) during the preceding 12 months (or for such shorter period that the registrant was required to submit and post such files).
Yes þ No ¨
Indicate by check mark if disclosure of delinquent filers pursuant to Item 405 of Regulation S-K (§229.405 of this chapter) is not contained herein, and will not be contained, to the best of registrant’s knowledge, in definitive proxy or information statements incorporated by reference in Part III of this Form 10-K or any amendment to this Form 10-K. ¨
Indicate by check mark whether the registrant is a large accelerated filer, an accelerated filer, a non-accelerated filer, or a smaller reporting company. See the definitions of “large accelerated filer,” “accelerated filer” and “smaller reporting company” in Rule 12b-2 of the Exchange Act.
Large accelerated filer þ Accelerated filer ¨ Non-accelerated filer ¨ Smaller reporting company ¨
Indicate by check mark whether the registrant is a shell company (as defined in Rule 12b-2 of the Exchange Act).
Yes ¨ No þ
The aggregate market value of the common stock held by non-affiliates of the registrant as of the last business day of the registrant’s most recently completed second fiscal quarter, computed by reference to the closing price reported on the NASDAQ Global Select Market — Composite Transactions as of April 8, 2016,13, 2017, was approximately $2.2$2.9 billion.
Number of shares of common stock, $0.01 par value, outstanding as of the close of business on November 18, 201624, 2017 — 32,334,732.29,433,478.
DOCUMENTS INCORPORATED BY REFERENCE
Portions of the Proxy Statement to be filed with the Securities and Exchange Commission in connection with the 20172018 Annual Meeting of Stockholders are incorporated by reference into Part III hereof.
JACK IN THE BOX INC.
TABLE OF CONTENTS
|
| | |
| | | Page |
| | PART I | |
| Item 1. | Business | |
| Item 1A. | Risk Factors | |
| Item 1B. | Unresolved Staff Comments | |
| Item 2. | Properties | |
| Item 3. | Legal Proceedings | |
| Item 4. | Mine Safety Disclosures | |
| | PART II | |
| Item 5. | Market for Registrant’s Common Equity, Related Stockholder Matters and Issuer Purchases of Equity Securities | |
| Item 6. | Selected Financial Data | |
| Item 7. | Management’s Discussion and Analysis of Financial Condition and Results of Operations | |
| Item 7A. | Quantitative and Qualitative Disclosures About Market Risk | |
| Item 8. | Financial Statements and Supplementary Data | |
| Item 9. | Changes in and Disagreements With Accountants on Accounting and Financial Disclosure | |
| Item 9A. | Controls and Procedures | |
| Item 9B. | Other Information | |
| | PART III | |
| Item 10. | Directors, Executive Officers and Corporate Governance | |
| Item 11. | Executive Compensation | |
| Item 12. | Security Ownership of Certain Beneficial Owners and Management and Related Stockholder Matters | |
| Item 13. | Certain Relationships and Related Transactions, and Director Independence | |
| Item 14. | Principal Accounting Fees and Services | |
| | PART IV | |
| Item 15. | Exhibits, Financial Statement Schedules | |
FORWARD-LOOKING STATEMENTS
From time to time, we make oral and written forward-looking statements that reflect our current expectations regarding future results of operations, economic performance, financial condition and achievements of Jack in the Box Inc. (the “Company”). A forward-looking statement is neither a prediction nor a guarantee of future events or results. In some cases, forward-looking statements can be identified by words such as “anticipate,” “assume,” “believe,” “estimate,” “expect,” “forecast,” “goals,” “guidance,” “intend,” “plan,” “project,” “may,” “should,” “will,” “would,” and similar expressions. Certain forward-looking statements are included in this Form 10-K, principally in the sections captioned “Business,” “Legal Proceedings,” “Consolidated Financial Statements” and “Management’s Discussion and Analysis of Financial Condition and Results of Operations,” including statements regarding our strategic plans and operating strategies. Although we believe that the expectations reflected in our forward-looking statements are based on reasonable assumptions, such expectations and forward-looking statements may prove to be materially incorrect due to known and unknown risks and uncertainties.
In some cases, information regarding certain important factors that could cause our actual results to differ materially from any forward-looking statement appears together with such statement. In addition, the factors described under “Risk Factors” and “Discussion of Critical Accounting Estimates” in this Form 10-K, as well as other possible factors not listed, could cause our actual results, economic performance, financial condition or achievements to differ materially from those expressed in any forward-looking statements. As a result, investors should not place undue reliance on such forward-looking statements, which speak only as of the date of this report. The Company is under no obligation to update forward-looking statements, whether as a result of new information or otherwise.
PART I
The Company
Overview. Jack in the Box Inc., based in San Diego, California, operates and franchises 2,9542,977 Jack in the Box® quick-service restaurants (“QSRs”) and Qdoba Mexican Eats® ("Qdoba") fast-casual restaurants. References to the Company throughout this Annual Report on Form 10-K are made using the first person notations of “we,” “us” and “our.”
Jack in the Box. Jack in the Box opened its first restaurant in 1951, and has since become one of the nation’s largest hamburger chains. Based on number of restaurants, our top 10 major markets comprise approximately 70% of the total system, and Jack in the Box is the second largest QSR hamburger chain in eightnine of those major markets. As of the end of our fiscal year on October 2, 2016,1, 2017, the Jack in the Box system included 2,2552,251 restaurants in 21 states and Guam, of which 417276 were company-operated and 1,8381,975 were franchise-operated.
Qdoba. To supplement our core growth and balance the risk associated with growing solely in the highly competitive hamburger segment of the QSR industry, in 2003 we acquired Qdoba Restaurant Corporation, operator and franchisor of Qdoba Mexican Eats. Qdoba is the second largest fast-casual Mexican food brand in the United States. As of October 2, 2016, the Qdoba system included 699 restaurants in 47 states, the District of Columbia and Canada, of which 367 were company-operated and 332 were franchise-operated.
Strategic Plan. Our long-term strategic plan focuses on continued growth, increasing average unit volumes (“AUVs”), improving restaurant profitability and returns on invested capital, and returning cash to shareholders.
Through the execution of our refranchising strategy over the last five years, we have increased franchise ownership of the Jack in the Box system from 72%76% at the end of fiscal 20112012 to 82%88% at the end of fiscal 2016.2017. We plan to increase franchise ownership of the Jack in the Box system to over 90%approximately 95%. In fiscal 2016,2017, our Jack in the Box franchisees independently developed 1218 new franchise restaurants, and we expect the majority of Jack in the Box new unit growth will be through franchise restaurants.
Qdoba. In 2003, we expanded our competitive footprint beyond the hamburger segment of the QSR industry by acquiring Qdoba Restaurant Corporation, operator and franchisor of the fast-casual concept now known as Qdoba Mexican Eats. Qdoba is the second largest fast-casual Mexican food brand in the United States. As of October 1, 2017, the Qdoba system included 726 restaurants in 47 states, the District of Columbia and Canada, of which 385 were company-operated and 341 were franchise-operated.
Through new unit growth, acquisitions of franchised Qdoba restaurants in select markets, and the refranchising of Jack in the Box restaurants, Qdoba has become a more prominent part of our company restaurant operations. As of the end of fiscal 20162017, Qdoba comprised approximately 47%58% of our total company-operated units as compared with approximately 28%37% at the end of fiscal 2011. We plan2012.
During 2017, we retained Morgan Stanley & Co. LLC to continueassist our Board of Directors in its evaluation of potential alternatives with respect to build outQdoba, as well as other ways to enhance shareholder value. While substantial progress has been made on the numberevaluation, there can be no assurance that the evaluation process will result in any transaction or other specific course of Qdoba company locations at an accelerated pace over the next several years. Accelerating the growth of our Qdoba brand by increasing market penetration is anticipated to generate heightened brand awareness.action.
Restaurant Concepts
Jack in the Box. Jack in the Box restaurants offer a broad selection of distinctive products including classic burgers like our Jumbo Jack® burgers, and innovative new product lines such as Buttery Jack™® burgers and our Brunchfast™® menu. We also offer quality products such as breakfast sandwiches with freshly cracked eggs, and craveble favorites such as tacos regular and curly fries, along with specialty sandwiches, salads and real ice cream shakes, among other items. We allow our guests to customize their meals to their tastes and order any product when they want it, including breakfast items any time of day (or night). We are known for variety and innovation which has led to the development of four strong dayparts: breakfast, lunch, dinner and late-night.
The Jack in the Box restaurant chain was the first major hamburger chain to develop and expand the concept of drive-thru restaurants. In addition to drive-thru windows, most of our restaurants have seating capacities ranging from 20 to 100 people and are open 18-24 hours a day. Drive-thru sales currently account for approximately 75%73% of sales at company-operated restaurants. The average check in fiscal year 20162017 was $7.38$7.71 for company-operated restaurants.
With a presence in only 21 states and one territory, we believe Jack in the Box is a brand with significant growth opportunities. In fiscal 2016,2017, we continued to expand in existing markets. We opened fourtwo company-operated restaurants and franchisees opened 1218 Jack in the Box restaurants during the year. In fiscal 2017, we expect to open approximately 20-25 new Jack in the Box restaurants system-wide.
The following table summarizes the changes in the number of company-operated and franchise Jack in the Box restaurants over the past five years:
| | | | | Fiscal Year | | Fiscal Year |
| | | 2016 | | 2015 | | 2014 | | 2013 | | 2012 | | 2017 | | 2016 | | 2015 | | 2014 | | 2013 |
| Company-operated restaurants: | | | | | | | | | | | | | | | | | | | | |
| Beginning of period | | 413 |
| | 431 |
| | 465 |
| | 547 |
| | 629 |
| | 417 |
| | 413 |
| | 431 |
| | 465 |
| | 547 |
|
| New | | 4 |
| | 2 |
| | 1 |
| | 6 |
| | 19 |
| | 2 |
| | 4 |
| | 2 |
| | 1 |
| | 6 |
|
| Refranchised | | (1 | ) | | (21 | ) | | (37 | ) | | (78 | ) | | (97 | ) | | (178 | ) | | (1 | ) | | (21 | ) | | (37 | ) | | (78 | ) |
| Closed | | — |
| | (6 | ) | | (2 | ) | | (11 | ) | | (4 | ) | | (15 | ) | | — |
| | (6 | ) | | (2 | ) | | (11 | ) |
| Acquired from franchisees | | 1 |
| | 7 |
| | 4 |
| | 1 |
| | — |
| | 50 |
| | 1 |
| | 7 |
| | 4 |
| | 1 |
|
| End of period total | | 417 |
| | 413 |
| | 431 |
| | 465 |
| | 547 |
| | 276 |
| | 417 |
| | 413 |
| | 431 |
| | 465 |
|
| % of system | | 18 | % | | 18 | % | | 19 | % | | 21 | % | | 24 | % | | 12 | % | | 18 | % | | 18 | % | | 19 | % | | 21 | % |
| Franchise restaurants: | | | | | | | | | | | | | | | | | | | | |
| Beginning of period | | 1,836 |
| | 1,819 |
| | 1,786 |
| | 1,703 |
| | 1,592 |
| | 1,838 |
| | 1,836 |
| | 1,819 |
| | 1,786 |
| | 1,703 |
|
| New | | 12 |
| | 16 |
| | 11 |
| | 11 |
| | 18 |
| | 18 |
| | 12 |
| | 16 |
| | 11 |
| | 11 |
|
| Refranchised | | 1 |
| | 21 |
| | 37 |
| | 78 |
| | 97 |
| | 178 |
| | 1 |
| | 21 |
| | 37 |
| | 78 |
|
| Closed | | (10 | ) | | (13 | ) | | (11 | ) | | (5 | ) | | (4 | ) | | (9 | ) | | (10 | ) | | (13 | ) | | (11 | ) | | (5 | ) |
| Sold to company | | (1 | ) | | (7 | ) | | (4 | ) | | (1 | ) | | — |
| | (50 | ) | | (1 | ) | | (7 | ) | | (4 | ) | | (1 | ) |
| End of period total | | 1,838 |
| | 1,836 |
| | 1,819 |
| | 1,786 |
| | 1,703 |
| | 1,975 |
| | 1,838 |
| | 1,836 |
| | 1,819 |
| | 1,786 |
|
| % of system | | 82 | % | | 82 | % | | 81 | % | | 79 | % | | 76 | % | | 88 | % | | 82 | % | | 82 | % | | 81 | % | | 79 | % |
| System end of period total | | 2,255 |
| | 2,249 |
| | 2,250 |
| | 2,251 |
| | 2,250 |
| | 2,251 |
| | 2,255 |
| | 2,249 |
| | 2,250 |
| | 2,251 |
|
Qdoba. Qdoba’s menu features Mexican-themed food items including burritos, tacos, salads, and quesadillas. Guests can customize their meals by adding 3-cheese queso, guacamole, and a variety of sauces and salsas without paying an extra charge. Our new logobrand name and logos that debuted in fiscal 2016 modifiesmodify the full name of our brand from Qdoba Mexican Grill® to Qdoba Mexican Eats to better reflect the flavors and variety our menu offers.
Our restaurants also offer a variety of catering options that can be tailored to feed groups of ten to several hundred.hundred people. While some of our restaurants serve breakfast, the majority generally operate from 10:30 a.m. to 10:00 p.m. Qdoba restaurants have a seating capacity that ranges from 60 to 80 people, and many locations include outdoor patio seating. In fiscal 2016,2017, the average check for company-operated restaurants was $11.75,$11.86, which excludes catering sales.
We currently estimate the long-term growth potential for Qdoba to be approximately 2,000 units across the United States. Our company-operated restaurants are generally located in larger market areas. Franchise development is more weighted towards traditional sites, but are also developed in non-traditional sites (airports, college campuses, etc.) or areas where local franchisees can operate more efficiently. During fiscal 2016,2017, we opened 3523 company-operated restaurants and franchisees opened 1819 Qdoba restaurants, including six14 non-traditional sites. In fiscal 2017, we expect to open 60-70 new Qdoba restaurants system-wide, of which we expect approximately 40 to be company-operated locations.
The following table summarizes the changes in the number of company-operated and franchise Qdoba restaurants over the past five years:
| | | | | Fiscal Year | | Fiscal Year |
| | | 2016 | | 2015 | | 2014 | | 2013 | | 2012 | | 2017 | | 2016 | | 2015 | | 2014 | | 2013 |
| Company-operated restaurants: | | | | | | | | | | | | | | | | | | | | |
| Beginning of period | | 322 |
| | 310 |
| | 296 |
| | 316 |
| | 245 |
| | 367 |
| | 322 |
| | 310 |
| | 296 |
| | 316 |
|
| New | | 35 |
| | 17 |
| | 16 |
| | 34 |
| | 26 |
| | 23 |
| | 35 |
| | 17 |
| | 16 |
| | 34 |
|
| Refranchised | | — |
| | — |
| | — |
| | (3 | ) | | — |
| | — |
| | — |
| | — |
| | — |
| | (3 | ) |
| Closed | | (4 | ) | | (5 | ) | | (2 | ) | | (64 | ) | | (1 | ) | | (5 | ) | | (4 | ) | | (5 | ) | | (2 | ) | | (64 | ) |
| Acquired from franchisees | | 14 |
| | — |
| | — |
| | 13 |
| | 46 |
| | — |
| | 14 |
| | — |
| | — |
| | 13 |
|
| End of period total | | 367 |
| | 322 |
| | 310 |
| | 296 |
| | 316 |
| | 385 |
| | 367 |
| | 322 |
| | 310 |
| | 296 |
|
| % of system | | 53 | % | | 49 | % | | 49 | % | | 48 | % | | 50 | % | | 53 | % | | 53 | % | | 49 | % | | 49 | % | | 48 | % |
| Franchise restaurants: | | | | | | | | | | | | | | | | | | | | |
| Beginning of period | | 339 |
| | 328 |
| | 319 |
| | 311 |
| | 338 |
| | 332 |
| | 339 |
| | 328 |
| | 319 |
| | 311 |
|
| New | | 18 |
| | 22 |
| | 22 |
| | 34 |
| | 32 |
| | 19 |
| | 18 |
| | 22 |
| | 22 |
| | 34 |
|
| Refranchised | | — |
| | — |
| | — |
| | 3 |
| | — |
| | — |
| | — |
| | — |
| | — |
| | 3 |
|
| Closed | | (11 | ) | | (11 | ) | | (13 | ) | | (16 | ) | | (13 | ) | | (10 | ) | | (11 | ) | | (11 | ) | | (13 | ) | | (16 | ) |
| Sold to company | | (14 | ) | | — |
| | — |
| | (13 | ) | | (46 | ) | | — |
| | (14 | ) | | — |
| | — |
| | (13 | ) |
| End of period total | | 332 |
| | 339 |
| | 328 |
| | 319 |
| | 311 |
| | 341 |
| | 332 |
| | 339 |
| | 328 |
| | 319 |
|
| % of system | | 47 | % | | 51 | % | | 51 | % | | 52 | % | | 50 | % | | 47 | % | | 47 | % | | 51 | % | | 51 | % | | 52 | % |
| System end of period total | | 699 |
| | 661 |
| | 638 |
| | 615 |
| | 627 |
| | 726 |
| | 699 |
| | 661 |
| | 638 |
| | 615 |
|
Site Selection and Design
Site selections for all new company-operated Jack in the Box and Qdoba restaurants are made after an economic analysis and a review of demographic data and other information relating to population density, traffic, competition, restaurant visibility and access, available parking, surrounding businesses and opportunities for market penetration. Restaurants developed by franchisees are built to brand specifications on sites we have reviewed.
Each of our brands have multiple restaurant models with different seating capacities to improve our flexibility in selecting locations for our restaurants. Management believes that this flexibility enables the Company to match the restaurant configuration with the specific economic, demographic, geographic or physical characteristics of a particular site.
Typical costs to develop a traditional Jack in the Box restaurant, excluding the land value, range from $1.2approximately $1.3 million to $2.0$2.4 million. The majority of our Jack in the Box restaurants are constructed on leased land or on land that we purchase and subsequently sell, along with the improvements, in sale and leaseback transactions. Upon completion of a sale and leaseback transaction, the Company’s initial cash investment is reduced to the cost of equipment, which ranges from approximately $0.3 million to $0.5 million.
The majority of Qdoba restaurants are located in leased spaces ranging from conventional large-scale retail projects to smaller neighborhood retail strip centers as well as non-traditional locations such as airports, college campuses and food courts. Qdoba restaurant development costs generally range from approximately $0.8 million to $1.5$1.1 million depending on the type, square footage, geographic region, and if the location includes an expanded alcohol offering. In fiscal 2015, we began testing new restaurant design elements as part of our brand evolution, and in fiscal 2016, we finalized our new restaurant design and approved remodel designs for existing restaurants. In fiscal 2017, we began rolling out the new designs for remodels system-wide.
Franchising Program
Jack in the Box. The Jack in the Box franchise agreement generally provides for an initial franchise fee of $50,000 per restaurant for a 20-year term, royalty payments, and marketing fees at 5%5.0% of gross sales. Royalty rates, typically 5%5.0% of gross sales, can range from 1%2.5% to as high as 15%10.0% of gross sales, and some existing agreements provide for variable rates and/or royalty holidays. We may offer development agreements to franchisees for construction of one or more new restaurants over a defined period of time and in a defined geographic area. Developers may be required to pay fees for certain company-sourced new sites. Developers may lose their rights to future development if they do not maintain the required opening schedule. To stimulate growth we have offered a waiver of development fees for new sites, in addition to lower royalty rates or a development loan, to franchisees who openedopen restaurants within a specified time frames.frame.
In connection with the sale of a company-operated restaurant to a franchisee, we sell to the franchisee the restaurant equipment and the right to do business at that location for a specified term. The aggregate price is negotiated based upon the value of the restaurant as a going concern, which depends on various factors, including the sales and cash flows of the restaurant, as well as its location and history. In addition, the land and building are generally leased or subleased to the franchisee at a negotiated rent, typically equal to the greater of a minimum base rent or a percentage of gross sales. The franchisee is usually required to pay property taxes, insurance and ancillary costs, and is responsible for maintaining the restaurant.
Qdoba. ��Qdoba franchisees are generally charged an initial franchise fee of $30,000 per restaurant for a 10-year franchise term with a 10-year option to extend at a fee of $5,000, royalty payments, and marketing fees of 1.25%approximately 1.3% of gross sales. We also require franchisees to spend a minimum of 2%approximately 1.8% of gross sales on local marketing for their restaurants. Royalty rates are typically 5%5.0% of gross sales. We offer development agreements to franchisees for the construction of one or more new restaurants over a defined period of time and in a defined geographic area for a development fee, a portion of which may be credited against franchise fees due for restaurants when they are opened. If the developer does not maintain the required schedule of openings, they may forfeit such fees and lose their rights to future development. To enhance our traditional growth, we have offered agreements that provide lower royalty rates or a development loan to franchisees who open restaurants within a specified time frame. We continue to pursue non-traditional locations both through multi-location commitments and single unit franchise agreements. Currently, the non-traditional franchise agreements we offer provide for a $15,000an initial franchise fee between $15,000 to $30,000, and a 6%6.0% royalty rate. To enhance our multi unit non-traditional growth, we may offer agreements that provide for lower fees.
Restaurant Management and Operations
Jack in the Box and Qdoba restaurants are operated by a company manager or franchise operator who is directly responsible for the operations of the restaurant, including product quality, service, food safety, cleanliness, inventory, cash control and the conduct and appearance of employees. We focus on attracting, selecting, engaging and retaining employees and franchisees who share our passion for creating long-lasting, successful restaurants.
At both brands, company-operated restaurant managers are supervised by district managers, who are overseen by directors of operations, who report to vice presidents of operations. Under our performance system, vice presidents and directors are eligible for an annual incentive based on achievement of goals related to brand earnings and margin, and company-wide performance. Directors are eligible for an annual incentive based on achievement of goals related to brand region level sales, profit, and company-wide performance. District managers and restaurant managers are eligible for quarterly incentives based on growth in restaurant sales and profit and/or certain other operational performance standards.
Jack in the Box. Company restaurant managers are required to attendcomplete an extensive management training classesprogram involving a combination of classroomin-restaurant instruction and on-the-job training in specially designated training restaurants. Restaurant managers and supervisory personnel train other restaurant employees in accordance with detailed procedures and guidelines using training aids available at each location.
Qdoba. The Qdoba Training System is used to provide employees with detailed training by position, from entry level to restaurant manager. Restaurant management are certified to train and develop team members through a series ofin-restaurant instruction and on the job and workshop training that focus on knowledge, skills and behaviors. The Qdoba Training System certifies achievement for our cooks and line servers who showcase excellence in their positions. Team members must have, or acquire, specific technical and behavioral skills to become certified in all positions.
Customer Satisfaction
Company-operated and franchise-operated restaurants devote significant resources toward offering quality food and excellent service at all of our restaurants. One tool we use to help us maintain a high level of customer satisfaction is our Voice of Guest program, which provides restaurant managers, district managers, and franchise operators with ongoing feedback from guests who complete a short guest satisfaction survey via an invitation typically provided on the register receipt. In these surveys, guests rate their satisfaction with key elements of their restaurant experience, including friendliness, food quality, cleanliness, speed of service and order accuracy. In 2016,2017, the Jack in the Box and Qdoba systems received approximately 2.11.9 million and 0.20.3 million guest survey responses, respectively. Our Guest Relations Department receives feedback that guests provide via our website, and communicates that feedback to restaurant managers and franchise operators. We also collect guest feedback through social media and other resources.
Food Safety and Quality
Our “farm-to-fork” food safety and quality assurance programs are designed to maintain high standards for the food products and food preparation procedures used by our vendors and in our restaurants. We maintain product specifications for our ingredients and our Food Safety and Regulatory Compliance Department must approve all suppliers of food products to our restaurants. We use third-party and internal audits to review the food safety management programs of our vendors. We manage food safety in our restaurants through a comprehensive food safety management program that is based on the Food and Drug Administration (“FDA”) Food Code requirements. The food safety management program includes employee training, ingredient testing, documented restaurant practices and attention to product safety at each stage of the food preparation cycle. In addition, our food safety management program uses American National Standards Institute certified food safety training programs to train our company and franchise restaurant management employees on food safety practices for our restaurants.
Supply Chain
Historically, we provided purchasing and distribution services for our company-operated restaurants and most of our franchise-operated restaurants. Our remaining franchisees purchased product from approved suppliers and distributors. In fiscal 2012, all of our company-operated Qdoba restaurants and approximately 90% of our Qdoba franchisees began utilizing the distribution services of a third-party distributor under a long-term contract, ending February 2017. Since December 2014, the remaining 10% of our Qdoba franchisees have utilized the same third-party distributor under the same long-term contract. We expect to enter into a new long-term agreement with a third-party distributor for all company and franchise Qdoba restaurants in the United States upon expiration of our current contract.
In July 2012, all of our Jack in the Box company-operated restaurants and approximately 90% of our Jack in the Box franchisees entered into a long-term contract with anothera third-party distributor. Under this contract, the distributor towill provide distribution services through seven distribution centers in the continental United States to our Jack in the Box restaurants through August 2022. Beginning in June 2015, the remaining 10% of our Jack in the Box franchisees decided to use the services of the same third-party distributor under the same long-term contract.
In fiscal 2012, all of our Qdoba company-operated restaurants and approximately 90% of our Qdoba franchisees began utilizing the distribution services of another third-party distributor under a long-term contract, which ended in February 2017. Since December 2014, the remaining 10% of our Qdoba franchisees have utilized the same third-party distributor under the same long-term contract. In March 2017, all company-operated and franchise-operated restaurants entered into a five year distribution services agreement, which ends in February of 2022, with a consortium of four Qdoba regional distributors comprising 18 distribution centers in the United States and two distribution centers in Canada.
The primary commodities purchased by our restaurants are beef, poultry, pork, cheese and produce. Shrimp, avocados, rice, beans and tortillas are additional commodities purchased by Qdoba. We monitor the primaryand purchase commodities we purchase in order to minimize the impact of fluctuations in price and availability,supply. Contracts are entered into and wecommodity market positions may enter into purchasing contracts and pricing arrangementsbe secured when we consider them to be advantageous. However, certain commodities remain subject to price fluctuations. We believeMost, if not all essential food and beverage products are available, or can be made available, upon short notice from alternative qualified suppliers.
Information Systems
At our shared services corporate support center, we have centralized financial accounting systems, human resources and payroll systems, and a communications and network infrastructure that supports both Jack in the Box and Qdoba corporate functions. Our restaurant software allows for daily polling of sales, inventory and other data from the restaurants directly. Our company restaurants and traditional site franchise restaurants use standardized Windows-based touch screen point-of-sale (“POS”) platforms. These platforms allow the restaurants to accept cash, credit cards and our re-loadable gift cards. Our Qdoba POS system is also enhanced with an integrated guest loyalty program as well as a takeout and delivery interface. The takeout and delivery interface is used to manage online and catering orders whichthat are distributed to sites via a hosted online ordering website. Both brands offer distinct mobile applications that support order-ahead functionality and payment. Jack in the Box now offers mobile ordering in select locations. Qdoba allows for mobile and web ordering at all of its U.S. restaurants.
We have business intelligence systems that provide visibility to the key metrics in the operation of company and franchise restaurants. These systems play an integral role in accumulating and analyzing market information. Our company restaurants use labor scheduling systems to assist managers in managing labor hours based on forecasted sales volumes. We also have inventory management systems which enable timely and accurate deliveries of food and packaging to our restaurants. To support order accuracy and speed of service, our drive-thru Jack in the Box restaurants use color order confirmation screens. We have plans to consolidate our restaurant level technologies at Jack in the Box and Qdoba restaurants.
Advertising and Promotion
Jack in the Box. At Jack in the Box, we build brand awareness through our marketing and advertising programs and activities. These activities are supported primarily by financial contributions to a marketing fund from all company and franchise restaurants based on a percentage of gross sales. Activities to advertise restaurant products, promote brand awareness and attract customers include, but are not limited to, system and regional campaigns on television, radio and print media, as well as digital and social media.
Qdoba. At Qdoba, our marketing and advertising programs are designed to build brand awareness, lift restaurant traffic, and increase brand advocacy. All company and franchise restaurants financially contribute a percentage of gross sales to fund the production and development of advertising assets, including but not limited to national and regional radio, print, and digital and social media. Advertising is created at the brand level and the system operators can utilize these assets, or tap into our in-house creative services group to create custom advertising that meets their particular communication objectives while adhering to brand standards. Additionally, the brand is pilotinghas launched an affinity and mobile platform designed to inspire, motivate and reward increased frequency among Qdoba guests.
Employees
At October 2, 2016,1, 2017, we had approximately 22,20016,600 employees, of whom 21,50015,900 were restaurant employees, 500 were corporate personnel, and 200 were field management or administrative personnel. Employees are paid on an hourly basis, except certain restaurant management, operations and corporate management, and administrative personnel. We employ both full- and part-time restaurant employees in order to provide the flexibility necessary during peak periods of restaurant operations. We have not experienced any significant work stoppages, and we support our employees, including part-time workers, by offering industry competitive wages and benefits.
Executive Officers
The following table sets forth the name, age, position and years with the Company of each person who is an executive officer of Jack in the Box Inc. as of October 2, 2016:1, 2017:
| | | Name | | Age | | Positions | | Years with the Company | | Age | | Positions | | Years with the Company |
| Leonard A. Comma | | 47 | | Chairman of the Board and Chief Executive Officer | | 15 | | 48 | | Chairman of the Board and Chief Executive Officer | | 16 |
| Mark H. Blankenship, Ph.D. | | 55 | | Executive Vice President, Chief People, Culture and Corporate Strategy Officer | | 19 | | 56 | | Executive Vice President, Chief People, Culture and Corporate Strategy Officer | | 20 |
| Jerry P. Rebel | | 59 | | Executive Vice President and Chief Financial Officer | | 13 | | 60 | | Executive Vice President and Chief Financial Officer | | 14 |
| Phillip H. Rudolph | | 58 | | Executive Vice President, Chief Legal and Risk Officer and Corporate Secretary | | 9 | | 59 | | Executive Vice President, Chief Legal and Risk Officer and Corporate Secretary | | 10 |
| Frances L. Allen | | 54 | | President, Jack in the Box Brand | | 2 | | 55 | | President, Jack in the Box Brand | | 3 |
| Keith M. Guilbault | | 53 | | President, Qdoba Brand | | 12 | | 54 | | President, Qdoba Brand | | 13 |
| Paul D. Melancon | | 60 | | Senior Vice President of Finance, Controller and Treasurer | | 11 | | 61 | | Senior Vice President of Finance, Controller and Treasurer | | 12 |
| Carol A. DiRaimo | | | 56 | | Vice President, Chief Investor Relations and Corporate Communications Officer | | 9 |
| Vanessa C. Fox | | 43 | | Vice President, Chief Development Officer | | 19 | | 44 | | Vice President, Chief Development Officer | | 20 |
| Carol A. DiRaimo | | 55 | | Vice President of Investor Relations and Corporate Communications | | 8 | |
| Dean C. Gordon | | 54 | | Vice President of Supply Chain | | 7 | | 55 | | Vice President, Chief Supply Chain Officer | | 8 |
| Raymond Pepper | | 55 | | Vice President and General Counsel | | 19 | | 56 | | Vice President and General Counsel | | 20 |
| Iwona Alter | | | 48 | | Vice President and Chief Marketing Officer, Jack in the Box Brand | | 11 |
The following sets forth the business experience of each executive officer for at least the last five years:
Mr. Comma has been Chairman of the Board and Chief Executive Officer since January 2014. From May 2012 until October 2014, he served as President, and from November 2010 through January 2014, as Chief Operating Officer. Mr. Comma served as Senior Vice President and Chief Operating Officer from February 2010 to November 2010, Vice President Operations Division II from February 2007 to February 2010, Regional Vice President of the Company’s Southern California region from May 2006 to February 2007 and Director of Convenience-Store & Fuel Operations for the Company’s proprietary chain of Quick Stuff convenience stores from August 2001 to May 2006. Mr. Comma has 2425 years of retail and franchise experience.
Dr. Blankenship has been Executive Vice President, Chief People, Culture and Corporate Strategy Officer since November 2013. He was previously Senior Vice President and Chief Administrative Officer from October 2010 to November 2013, Vice President, Human Resources and Operational Services from October 2005 to October 2010 and Division Vice President, Human Resources from October 2001 to September 2005. Dr. Blankenship has 1920 years of experience with the Company in various human resource and training positions.
Mr. Rebel has been Executive Vice President and Chief Financial Officer since October 2005. He was previously Senior Vice President and Chief Financial Officer from January 2005 to October 2005 and Vice President and Controller of the Company from September 2003 to January 2005. Prior to joining the Company in 2003, Mr. Rebel held senior level positions with Fleming Companies and CVS Corporation. He has more than 35 years of corporate finance experience. As the Company announced in April 2017, Mr. Rebel plans to retire as its Executive Vice President and Chief Financial Officer in 2018.
Mr. Rudolph has been Chief Legal and Risk Officer since October 2014, Executive Vice President since February 2010, and Corporate Secretary since November 2007. Before becoming Chief Legal and Risk Officer, he was General Counsel since November 2007. Prior to joining the Company, Mr. Rudolph was Vice President and General Counsel for Ethical Leadership Group. He was previously a partner in the Washington, D.C. office of Foley Hoag, LLP, and a Vice President at McDonald’s Corporation where,
among other roles, he served as U.S. and International General Counsel. Before joining McDonald’s, Mr. Rudolph spent 15 years with the law firm of Gibson, Dunn & Crutcher, LLP, the last six of which he spent as a litigation partner in the firm’s Washington, D.C. office. Mr. Rudolph has more than 30 years of legal experience.
Ms. Allen has served as President of the Jack in the Box brand since October 2014. She joined the Company with more than 30 years of branding and marketing experience, including senior leadership roles at such major organizations as Denny’s, Dunkin’ Brands, Sony Ericsson Mobile Communications, PepsiCo and Frito-Lay. From July 2010 to October 2014, Ms. Allen worked for Denny’s Corp., most recently as its Chief Brand Officer and, previously, as its Chief Marketing Officer. From 2007 to 2009, she was Chief Marketing Officer of Dunkin’ Donuts, from 2004 to 2007, she was Vice President of Marketing, North America at Sony Ericsson Mobile Communications, and from 1998 to 2004, she held several positions at PepsiCo, most recently as Vice President of Marketing. Prior to that, Ms. Allen served at Frito-Lay as Director of International Advertising, and worked for several advertising agencies.
Mr. Guilbault has served as President of Qdoba brand since June 2016.2016 and Chief Executive Officer of Qdoba Restaurant Corporation since September 2017. From March 2016 to June 2016, he served as Chief Operating Officer of Qdoba. Prior to that, Mr. Guilbault held several positions with the Jack in the Box brand, including: Senior Vice President and Chief Marketing Officer from November 2013 to March 2016; Vice President of Menu & Innovation from October 2012 to November 2013; Vice President of Franchising from October 2010 to October 2012; Division Vice President of Operations Initiatives from February 2010 to October 2010; and Division Vice President of Brand Innovation & Regional Marketing from February 2006 to February 2010. He joined the Company in 2004 as a Regional Vice President in Central California. Including his service with Jack in the Box Inc., Mr. Guilbault has more than 16 years of experience in management positions with several companies, including Mobil Oil Corporation, Priceline WebHouse Club and Freemarkets, Inc.
Mr. Melancon has been Senior Vice President of Finance, Controller and Treasurer since November 2013. He was previously Vice President of Finance, Controller and Treasurer from September 2008 to November 2013 and Vice President and Controller from July 2005 to September 2008. Before joining the Company, Mr. Melancon held senior financial positions at several major companies, including Guess?, Inc., Hyper Entertainment, Inc. (a subsidiary of Sony Corporation of America) and Sears, Roebuck and Company. Mr. Melancon has more than 35 years of experience in accounting and finance, including 11 years with Price Waterhouse.
Ms. DiRaimo has been Vice President and Chief Investor Relations and Corporate Communications Officer since April 2017. She served as Vice President of Investor Relations and Corporate Communications from July 2008 to April 2017. Ms. DiRaimo previously spent 14 years at Applebee’s International, Inc. where she held various positions including Vice President of Investor Relations from February 2004 to November 2007. Ms. DiRaimo has more than 30 years of corporate finance and public accounting experience, including positions with Gilbert/Robinson Restaurants, Inc. and Deloitte.
Ms. Fox has been Vice President and Chief Development Officer overseeing development for the Jack in the Box and Qdoba brands since June 2016, and the Jack in the Box brand since March 2014. Previously, she held numerous positions for the Jack in the Box brand, including: Division Vice President of Franchise Business Development since September 2013 and Division Vice President of Franchise Sales & Development since June 2011. From February 2011 to June 2011, she was Director of Franchise Business Development, and she previously had the same title in Franchise Sales since October 2010. Ms. Fox served in other capacities since joining the Company in 1997. Before joining Jack in the Box Inc., she was a licensed real estate agent and worked for several companies in the residential real estate industry. Ms. Fox has 2425 years of real estate and development experience.
Ms. DiRaimo has been Vice President of Investor Relations and Corporate Communications since July 2008. She previously spent 14 years at Applebee’s International, Inc. where she held various positions including Vice President of Investor Relations from February 2004 to November 2007. Ms. DiRaimo has more than 30 years of corporate finance and public accounting experience, including positions with Gilbert/Robinson Restaurants, Inc. and Deloitte.
Mr. Gordon has been Vice President and Chief Supply Chain Officer since July 2017. He was previously Vice President of Supply Chain Services since October 2012. He was previously2012, and Division Vice President of Purchasing from February 2009 to October 2012. Prior to joining the Company in February 2009, Mr. Gordon was Vice President of Supply Chain Management for Potbelly Sandwich Works from December 2005 to February 2009, and he held various positions with Applebee’s International from August 2000 to December 2005, most recently as Executive Director of Procurement. Mr. Gordon also held a number of positions at Prandium, Inc., an operator of multiple restaurant concepts, from October 1994 to August 2000. Mr. Gordon has over 20 years of Supply Chain Management experience.
Mr. Pepper has been Vice President and General Counsel since September 2014. He was previously Vice President, Deputy General Counsel since September 2013, and Division Vice President, Deputy General Counsel from July 2009 to September 2013. Prior to that, Mr. Pepper held the positions of Division Vice President, Corporate Counsel from 2003 to 2009 and Director, Corporate Counsel from 1997 to 2003. Before joining the Company, Mr. Pepper spent 11 years with the law firm of Miller, Boyko and Bell, both as an associate and partner. Mr. Pepper has over 30 years of legal experience.
Ms. Alter has been Vice President and Chief Marketing Officer for the Jack in the Box brand since October 2016. From January 2014 to October 2016, she served as Vice President of Menu Strategy and Innovation. Ms. Alter was previously Division Vice President of Operations from 2011 to 2014, Director of Innovation from 2009 to 2011, and a Marketing Manager from 2005 to 2009. Ms. Alter has more than 20 years of experience in a variety of advertising, marketing and brand-management roles, both domestically and internationally.
Trademarks and Service Marks
The Jack in the Box, Qdoba Mexican Eats, Qdoba Mexican GrillJACK IN THE BOX®, QDOBA MEXICAN EATS®, QDOBA MEXICAN GRILL® and QdobaQDOBA® names are of material importance to us, and each is a registered trademark and service mark in the United States and elsewhere. In addition, we have registered or applied to register numerous service marks and trade names for use in our businesses, including the Jack in the Box, logo, Qdoba, logos,and Qdoba Mexican Grill markEats logos and design marks and various product names and designs.
Seasonality
Restaurant sales and profitability are subject to seasonal fluctuations because of factors such as vacation and holiday travel, and events, seasonal weather conditions, and weather crises, all of which affect the public’s dining habits.
Competition and Markets
The restaurant business is highly competitive and is affected by local and national economic conditions, including unemployment levels, population and socioeconomic trends, traffic patterns, local and national competitive changes, changes in consumer dining habits and preferences, and new information regarding diet, nutrition and health, all of which may affect consumer spending habits. Key elements of competition in the industry are the quality and innovation in the food products offered, price and perceived value, quality of service experience (including technological and other innovations), speed of service, personnel, advertising and other marketing efforts, name identification, restaurant location, and image and attractiveness of the facilities.
Each Jack in the Box and Qdoba restaurant competes directly and indirectly with a large number of national and regional restaurant chains, some of which have significantly greater financial resources, as well as with locally-owned and/or independent restaurants in the quick-service and the fast-casual segments, and other consumer options including grocery and specialty stores, catering and delivery services. In selling franchises, we compete with many other restaurant franchisors, some of whom have substantially greater financial resources.
Available Information
The Company’s primary website can be found at www.jackinthebox.com. We make available free of charge at this website (under the caption “Investors — SEC Filings”) all of our reports filed or furnished pursuant to Section 13(a) or 15(d) of the Securities Exchange Act of 1934, including our Annual Report on Form 10-K, our Quarterly Reports on Form 10-Q, our Current Reports on Form 8-K, and amendments to those reports. These reports are made available on the website as soon as reasonably practicable after their filing with, or furnishing to, the Securities and Exchange Commission (“SEC”). You may read and copy any materials we file with the SEC at the SEC’s Public Reference Room at 100 F Street, NE, Washington, DC 20549. You may obtain information on the operation of the Public Reference Room by calling the SEC at 1-800-SEC-0330. The SEC also maintains an Internet site (www.sec.gov) that contains our reports, proxy and information statements, and other information.
Regulation
Each restaurant is subject to regulation by federal agencies, as well as licensing and regulation by state and local health, sanitation, safety, fire, zoning, building, consumer protection, taxing and other agencies and departments. Restaurants are also subject to rules and regulations imposed by owners and/or operators of shopping centers, college campuses, airports, military bases or other locations where a restaurant is located. Difficulties or failures in obtaining and maintaining any required permits, licenses or approvals, or difficulties in complying with applicable rules and regulations, could result in restricted operations, closures of existing restaurants, delays or cancellations in the opening of new restaurants, increased cost of operations or the imposition of fines and other penalties.
We are subject to federal, state and local laws governing restaurant menu labeling, as well as to laws restricting the use of, or requiring disclosures about, certain ingredients used in food sold at our restaurants.
We are also subject to federal, state and international laws regulating the offer and sale of franchises, as well as judicial and administrative interpretations of such laws. Such laws impose registration and disclosure requirements on franchisors in the offer and sale of franchises, and may also apply substantive standards to the relationship between franchisor and franchisee, including limitations on the ability of franchisors to terminate franchises and alter franchise arrangements.
We are subject to the federal Fair Labor Standards Act and various state laws governing such matters as minimum wages, exempt status classification, overtime, breaks and other working conditions for company employees. Our franchisees are subject to these same laws. Many of our food service personnel are paid at rates set in relation to the federal and state minimum wage laws and, accordingly, changes in the minimum wage requirements may increase labor costs for us and our franchisees. Federal and state laws may also require us to provide paid and unpaid leave to our employees, or healthcare or other employee benefits, which could result in significant additional expense to us and our franchisees. We are also subject to federal immigration laws requiring compliance with work authorization documentation and verification procedures.
We are subject to certain guidelines under the Americans with Disabilities Act of 1990 and various state codes and regulations, which require restaurants to provide full and equal access to persons with physical disabilities.
We are also subject to various federal, state and local laws regulating the discharge of materials into the environment. The cost of complying with these laws increases the cost of operating existing restaurants and developing new restaurants. Additional costs relate primarily to the necessity of obtaining more land, landscaping, storm drainage control and the cost of more expensive equipment necessary to decrease the amount of effluent emitted into the air, ground and surface waters.
Some of our Qdoba restaurants sell alcoholic beverages, which require licensing. The regulations governing licensing may impose requirements on licensees including minimum age of employees, hours of operation, and advertising and handling of alcoholic beverages. The failure
In addition to laws and regulations governing restaurant businesses directly, there are also regulations, such as the Food Safety Modernization Act, that govern the practices of a Qdoba restaurant to obtain or retain a license could adversely affect the store’s results of operations.food manufacturers and distributors, including our suppliers.
We have processes in place to monitor compliance with applicable laws and regulations governing our company operations.
We caution you that our business and operations are subject to a number of risks and uncertainties. The factors listed below are important factors that could cause our actual results to differ materially from our historical results and from projections in the forward-looking statements contained in this report, in our other filings with the SEC, in our news releases and in oral statements by our representatives. However, other factors that we do not anticipate or that we do not consider significant based on currently available information may also have an adverse effect on our results.
Risks Related to Operating in the Food Service Industry. Food service businesses such as ours may be materially and adversely affected by changesRestaurant Industry
Changes in consumer preferences, national and regional economic, political and socioeconomic conditions, attitudes and changes in consumer dining habits (whether or not based on new information regarding diet, nutrition or health), as well as by the cost of food at home compared to food away from home, technological and other innovations, health-based regulations or other factors. Adverse economic conditions, such as higher levels of unemployment, lower levels of consumer confidence and decreased discretionary spending, may reduce restaurant traffic and sales and impose practical limits on pricing. If adverse or uncertaindeclines in general economic conditions persist forcould negatively impact our financial results.
The restaurant industry depends on consumer discretionary spending. We are impacted by consumer confidence, which is, in turn, influenced by general economic conditions and discretionary income levels. A material decline in consumer confidence or a decline in family “food away from home” spending could cause our financial results to decline. If economic conditions worsen, customer traffic could be adversely impacted if our customers choose to dine out less frequently or reduce the amount they spend on meals while dining out which could cause our average restaurant sales to decline. An economic downturn may be caused by a variety of factors, such as macro-economic shocks, increased unemployment rates, increased taxes, interest rates or other changes in government fiscal policy. High gasoline prices, increased healthcare costs, declining home prices, and political unrest, foreign or domestic, may potentially contribute to an extended period of time, consumerseconomic downturn, as may make long-lasting changes to their spending behavior.regional or local events, including natural disasters or local regulation. The impact of these factors may be exacerbated by the geographic profile of our Jack in the Box brand. Specifically, nearly 70% of the restaurants in our Jack in the Box system are located in the states of California and Texas. Economic conditions, state and local laws, or government regulations weather conditions or natural disasters affecting those states may therefore more greatly impact our results than would similar occurrences in other locations.
The performance of our business may also be adversely affected by factors such as:
seasonal sales fluctuations;
severe weather and other natural disasters;
unfavorable trends or developments concerning operating costs such as inflation, increased costs of food, fuel, utilities, technology, labor (including due to minimum wage increases or new administrative interpretations of regulations impacting labor costs), insurance, or employee benefits (including healthcare, workers’ compensation and other insurance costs and premiums);
the impact of initiatives by competitors and increased competition generally;
lack of customer acceptance of new menu items, service initiatives or potential price increases necessary to cover higher input costs;
customers trading down to lower priced items and/or shifting to competitive offerings with lower priced products;
labor disruptions, unionization, labor shortages or other labor or employee relations issues, and the availability of qualified, experienced management and hourly employees at company and franchise locations; and
failure to anticipate or respond quickly to relevant market trends or to implement successful advertising and marketing programs, including technology-based programs.
In addition, if economic conditions deteriorate or are uncertain for a prolonged period of time, or if our operating results decline unexpectedly, we may be required to record impairment charges, which will negatively impact our results of operations for the periods in which they are recorded. Due to the foregoing or other factors, results for any one quarter are not necessarily indicative of results to be expected for any other quarter or for a full fiscal year. These fluctuations may cause our operating results to be below the expectations of public market analysts and investors, and may adversely impact our stock price.
Risks Related
We face significant competition in the food service industry and our inability to Foodcompete may adversely affect our business.
The food service industry is highly competitive with respect to price, service, location, product offering, image and Commodity Costsattractiveness of the facilities, personnel, advertising, brand identification, and Availabilityfood quality. Our competition includes a large number of national and regional restaurant chains, as well as locally owned and/or independent businesses. In particular, we operate in the quick service and fast-casual restaurant chain segments, in both of which we face a number of established competitors, as well as frequent new entrants to the segment nationally and in regional markets. Some of our competitors have significantly greater financial, marketing, personnel, and other resources than we do. In addition, many of our competitors have greater name recognition nationally or in some of the local or regional markets in which we have restaurants.
Additionally, the trend toward convergence in grocery, deli, and restaurant services is increasing the number of our competitors. For example, competitive pressures can come from deli sections and in-store cafes of major grocery store chains, including those targeted at customers who desire high-quality food and convenience, as well as from convenience stores and other dining outlets. These competitors may have, among other things, a more diverse menu, lower operating costs and prices, better locations, better facilities, better management, more effective marketing, and more efficient operations than we do. Such increased competition could decrease the demand for our products and negatively affect our sales, operating results, profits, business and financial position, and prospects (collectively, our “financial results”).
While we continue to make improvements to our facilities, to implement new service and training initiatives, and to introduce new products, there can be no assurance that such efforts will generate increased sales or sufficient customer interest. Many of our competitors have introduced a variety of new products and service offerings, and advertise that their ingredients are more healthful or locally-sourced. Such competing products and health- or environmental-focused claims may hurt our competitive positioning as existing or potential customers could seek out other dining options.
Changes in demographic trends and in customer tastes and preferences could cause sales to decline.
Changes in customer preferences, demographic trends, and the number, type, and location of competing restaurants have great impact in the restaurant industry. Our sales could be impacted by changes in customer preferences in response to dietary concerns, such as preferences regarding calories, sodium content, carbohydrates, and fat. Such preference changes could result in customers favoring other foods to the exclusion of our menu items. Some customers also may choose to avoid freshly prepared foods, like those we serve, due to food safety concerns. Many of our restaurants, particularly our Qdoba restaurants, are located in or adjacent to shopping malls or similar retail districts; a consumer trend toward online shopping and delivery could reduce foot traffic and sales at these locations. If we fail to adapt to changes in customer preferences and trends, we may lose customers and our sales may deteriorate.
Increases in food and commodity costs could decrease our profit margins or result in a modified menu, which could adversely affect our financial results.
We and our franchisees are subject to volatility in food and commodity costs and availability. Accordingly, our profitability depends in part on our ability to anticipate and react to changes in food costs and availability. For example,As is true of all companies in the restaurant industry, we are susceptible to increases in food costs that are outside of feed ingredients used to produce beef, pork and chicken could be adversely affected by changes in worldwide supply or demand, or by regulatory or societal mandates, leading to higher prices for our products. In past years,control. Factors that can impact food and commodity costs include general economic conditions, seasonal fluctuations, weather and climate conditions, global demand, trade protections and subsidies, food safety issues, infectious diseases, possible terrorist activity, currency fluctuations, product recalls and government regulatory schemes. Additionally, some of our produce, meats and restaurant supplies are sourced from outside the United States. Any new or increased significantly, out-pacing general inflationimport duties, tariffs or taxes, or other changes in U.S. trade or tax policy, could result in higher food and industry expectations. Looking forward,commodity costs that would adversely impact our financial results.
Weather and climate related issues, such as freezes or drought, may lead to temporary or even longer-term spikes in the prices of some ingredients such as produce and meats, or of livestock feed. Increasing weather volatility or other long-term changes in global weather patterns, including any changes associated with global climate change, could have a significant impact on the price or availability of some of our ingredients. Any increase in the prices of the ingredients most critical to our menu, such as beef, chicken, pork, tomatoes, lettuce and potatoes for Jack in the Box, and chicken, beef, cheese, avocados, beans, rice, lettuce, tomatoes, and pork for Qdoba, could adversely affect our financial results. In the event of cost increases with respect to one or more of our raw ingredients, we anticipate volatilemay choose to change our pricing or uncertain price conditionssuspend serving a menu item, rather than paying the increased cost for the particular ingredient. Any such changes to continue.our currently available menu may negatively impact our restaurant traffic and comparable restaurant sales, and could have an adverse impact on our brand and financial results.
We seek to manage food and commodity costs, including through extended fixed price contracts, strong category and commodity management, and purchasing fundamentals. However, certain commodities such as beef and pork, which currently represent approximately 20% and 7%, respectively, of our consolidated commodity spend, do not lend themselves to fixed price contracts.
We cannot assure you that we will successfully enter into fixed price contracts on a timely basis or on commercially favorable pricing terms. In addition, although we have fixedour produce contracts contain pre-determined price contracts for produce,limits, we are subject to force majeure clauses resulting from weather or acts of God that may result in temporary spikes in costs.
Further, we cannot assure you that we or our franchisees will be able to successfully anticipate and react effectively to changing food and commodity costs by adjusting purchasing practices or menu offerings. We and our franchisees also may not be able to pass along price increases to our customers as a result of adverse economic conditions, competitive pricing or other factors. Therefore, variability of food and other commodity costs could adversely affect our profitability and results of operations.
Risk RelatedFailure to Our Brands and Reputation. Multi-unit food service businesses such as ours can be materially and adversely affected by widespread negative publicityreceive scheduled deliveries of any type, particularly regarding foodhigh quality food safety, nutritional content, safety or public health issues (such as epidemics or the prospect of a pandemic), obesity or other health concerns, and employee relations issues, among other things. Adverse publicity in these areas could damage the trust customers place in our brands. The increasingly widespread use of mobile communications and social media applications has amplified the speed and scope of adverse publicity and could hamper our ability to promptly correct misrepresentations or otherwise respond effectively to negative publicity. To minimize the risk of food safety issues arising in our restaurants and at our vendors, we have restaurant Food Safety programs that include a daily restaurant Food Safety Checklist, and we use third-party and internal audits to review the Food Safety programs of our vendors. Nevertheless, food safety risks cannot be completely eliminated. Any outbreak of illness attributed to company or franchised restaurants, or within the food service industry, or any widespread negative publicity regarding our brands or the restaurant industry in general could cause a decline in company and franchise restaurant sales, and could have a material adverse effect on our financial condition and results of operations.
In addition, the success of our business strategy depends on the value and relevance of our brands and reputation, including implementation and success of brand strategies. If customers perceive that we and our franchisees fail to deliver a consistently positive and relevant experience, our brands could suffer. This could have a material adverse effect on our business. Moreover, while we devote considerable efforts and resources to protecting our trademarksingredients and other intellectual property, if these efforts are not successful, the value ofsupplies could harm our brands may be harmed. This could also have a material adverse effect on our business.operations.
Supply and Distribution Risks. Dependence on frequent deliveries of fresh produce and other food products subjects food service businesses such as ours to the risk that shortages or interruptions in supply could adversely affect the availability, quality or cost of ingredients or require us to incur additional costs to obtain adequate supplies. Deliveries of supplies may be affected by adverse weather conditions, natural disasters, distributor or supplier financial or solvency issues of our distributors or suppliers, product recalls, or other issues. Further, increases in fuel prices could result in increased distribution costs. In addition, if any of our distributors, suppliers, vendors or other contractors fail to meet our quality or safety standards or otherwise do not perform adequately, or if any one or more of such entitiesthem seeks to terminate its agreement or fails to perform as anticipated, or if there is any disruption in any of our distribution or supply relationships or operations for any reason, our business, financial condition and results of operations may be materially affected.
Risks AssociatedWe have a limited number of suppliers for our major products and rely on a distribution network with Severe Weather, Natural Disastersa limited number of distribution partners for the majority of our national distribution program in the United States. If our suppliers or Civil Unrest. distributors are unable to fulfill their obligations under their contracts, it could harm our operations.
We contract with a distribution network with a limited number of distribution partners located throughout the nation to provide the majority of our food distribution services in the United States. Through these arrangements, our food supplies are largely distributed through several primary distributors. If any of these relationships are interrupted or terminated, or if one or more supply or distribution partners are unable or unwilling to fulfill their obligations for whatever reasons, product availability to our restaurants may be interrupted, and business and financial results may be negatively impacted. Although we believe that alternative supply and distribution sources are available, there can be no assurance that we will be able to identify or negotiate with such sources on terms that are commercially reasonable to us.
Food safety and food-borne illness concerns may have an adverse effect on our business by reducing demand and increasing costs.
Food safety is a top priority for our company, and we expend significant resources on food safety programs to ensure that our customers are able to enjoy safe and high quality food products. These include a daily, structured food safety assessment and documentation process at our restaurants, and periodic third-party and internal audits to review the food safety performance of our vendors, distributors and restaurants. Nonetheless, food safety risks cannot be completely eliminated, and food safety and food-borne illness issues do occur in the food service industry. Any report or publicity linking us to instances of food-borne illness or other food safety issues, including issues involving food tampering, natural or foreign objects, or other contaminants or adulterants in our food, could adversely affect our reputation, as well as our financial results. Furthermore, our reliance on food suppliers and distributors increases the risk that food-borne illness incidents could be introduced by third-party vendors outside our direct control. Although we test and audit these activities, we cannot guarantee that all food items are safely and properly maintained during transport or distribution throughout the supply chain.
Additionally, past reports linking nationwide or regional incidents of food-borne illnesses such as salmonella, E. coli, and listeria to certain products such as produce and proteins, or human-influenced illness such as hepatitis A or norovirus have resulted in consumers avoiding certain products and restaurant concepts for a period of time. Similarly, reaction to media-influenced reports of avian flu, incidents of “mad cow” disease, or similar concerns have also caused consumers to avoid any products that are, or are suspected of being, affected and could have an adverse effect on the price and availability of affected ingredients. Further, if we react to these problems by changing our menu or other key aspects of the brand experience, we may lose customers who do not accept those changes, and we may not be able to attract enough new customers to generate sufficient revenue to make our restaurants profitable.
Our restaurants currently have an ingredient mix that can be exposed to one or more food allergens, such as eggs, wheat, milk, fish, shellfish, tree nuts, peanuts, and soy. We employ precautionary allergen training steps for food handlers in order to minimize risk of allergen cross contamination. Even with such precautionary measures, the potential risk of allergen cross contamination exists in a restaurant environment. A potentially serious allergic reaction by a guest may result in adverse public communication, media coverage, a decline in restaurant sales, and a material decline in our financial results.
Negative publicity relating to our business or industry could adversely impact our reputation.
Our business can be materially and adversely affected by widespread negative publicity of any type, particularly regarding food quality, food safety, nutritional content, safety or public health issues (such as outbreaks, epidemics, or the prospect of a pandemic), obesity or other health concerns, animal welfare issues, and employee relations issues, among other things. Adverse publicity in these areas could damage the trust customers place in our brand. The increasingly widespread use of mobile communications and social media platforms has amplified the speed and scope of adverse publicity and could hamper our ability to promptly correct misrepresentations or otherwise respond effectively to negative publicity. Any widespread negative publicity regarding the company, our brands, our vendors and suppliers, or the restaurant industry in general could cause a decline in restaurant sales, and could have a material adverse effect on our financial results.
Additionally, employee or customer claims against us or our franchisees based on, among other things, wage and hour violations, discrimination, harassment or wrongful termination may also create negative publicity that could adversely affect us and divert financial and management resources that would otherwise be focused on the future performance of our operations. Consumer demand for our products could decrease significantly if any such incidents or other matters create negative publicity or otherwise erode consumer confidence in us, our brand or our products, or in the restaurant industry in general.
We are also subject to the risk of negative publicity associated with animal welfare regulations and campaigns. Our restaurants utilize ingredients manufactured from beef, poultry, and pork. Our policies require that our approved food suppliers and their raw material providers engage in proper animal welfare practices. Despite our policies and efforts, media reports and portrayals of inhumane acts toward animals by participants in the food supply chain, whether by our suppliers or not, can create a negative opinion or perception of the food industry’s animal welfare efforts. Such media reports and negative publicity could impact guest perception of our brand or industry, and can have a material adverse effect on our financial results.
Our business could be adversely affected by increased labor costs or difficulties in finding and retaining top-performing personnel.
Labor is a primary component of our operating costs, and we believe good managers and crew are a key part of our success. We devote significant resources to recruiting and training our restaurant managers and crew. Increased labor costs due to factors such as competition for workers, labor market pressures, increased minimum wage requirements, paid sick leave or vacation accrual mandates, or other legal or regulatory changes, such as predictive scheduling, may adversely impact operating costs for us and our franchisees. Additional taxes or requirements to incur additional employee benefit costs, including the requirements of the Patient Protection and Affordable Care Act (the “Affordable Care Act”) or any new or replacement healthcare requirements, could also adversely impact our operating costs. Moreover, if restaurant managers do not schedule our restaurant crews efficiently, our restaurants may be overstaffed at some times, which adversely impacts our labor costs as a percentage of revenue, decreasing our operating margins.
We believe that our continued success will depend, in part, on our ability to attract and retain the services of skilled personnel, from our senior management to our in-store employees. The loss of the services of, or our inability to attract and retain, such personnel could have a material adverse effect on our business. We aim to reduce turnover among our restaurant crews and managers in an effort to retain top performing employees and better realize our investment in training new employees. Any failure to do so may adversely impact our operating results by increasing training costs and making it more difficult to deliver outstanding customer service, which could have a material adverse effect on our financial results.
We may not have the same resources as our competitors for advertising and promotion.
Some of our competitors have greater financial resources, which enable them to invest significantly more than us in advertising, particularly television and radio ads, as well as endorsements and sponsorships; have a presence across more media channels; and support multiple system and regional product launches at one time. Should our competitors increase spending on advertising and promotion, or should the cost of advertising increase or our advertising funds decrease for any reason (including reduced sales, implementation of reduced spending strategies or a decrease in the percentage contribution to the marketing funds for any reason), our results of operations and financial condition may be materially impacted. The growing prevalence and importance of social media platforms, behavioral advertising and mobile technology also pose challenges and risks for our marketing, advertising and promotional strategies; and failure to effectively use and gain traction on these platforms or technologies could cause our advertising to be less effective than our competitors. Our financial results may be harmed if our advertising and promotion are less effective than our competitors for any of these reasons. Moreover, improper or damaging use of social media or mobile technology, including by our employees, franchisees, or guests could increase our costs, lead to litigation or result in negative publicity, all of which could materially impact our results.
We may be adversely impacted by severe weather conditions, natural disasters, terrorist acts or civil unrest that could result in property damage, injury to employees and staff, and lost restaurant sales.
Food service businesses such as ours can be materially and adversely affected by severe weather conditions, such as severe storms, hurricanes, flooding, prolonged drought or protracted heat or cold waves, and by natural disasters, such as earthquakes and wild fires, or “man-made” calamities such as terrorist incidents or civil unrest, and their aftermath. Any of these, or civil disturbances or unrest,Such occurrences could result in:
in lost restaurant sales, when consumers stay home or are physically prevented from reaching the restaurants;
property damage, loss of product, and resulting lost sales when locations are forced to close for extended periods of time;
products, interruptions in supply, when distributors or vendors suffer damages or transportation is negatively affected; and
increased costs if agricultural capacity is diminished or if insurance recoveries do not cover all of our losses.costs.
If systemic or widespread adverse changes in climate or weather patterns occur, we could experience more of these losses, and such losses could have a material adverse effect on our financial results. The impact of these factors may be exacerbated by the geographic profile of our Jack in the Box brand, as nearly 70% of the restaurants in our Jack in the Box system are located in the states of California and Texas.
Our business is subject to seasonal fluctuations.
As a result of certain seasonal factors, our financial results for any quarter may not be indicative of operations and financial condition.the results that may be achieved for a full fiscal year. For example, historically, average weekly sales for our restaurants system-wide are lowest in the first quarter of the year.
Growth and Development Risks. Related to Our Business Strategy
We may not achieve our development goals.
We intend to grow both Qdoba and Jack in the Box byeither through developing additional company-owned restaurants and throughor new restaurant development by franchisees, both in existing markets and in new markets. Development involves substantial risks, including the risk of:
the inability to identify suitable franchisees;
limited availability of financing for the Company and for franchisees at acceptable rates and terms;
development costs exceeding budgeted or contracted amounts;
delays in completion of construction;
the inability to identify, or the unavailability of suitable sites at acceptable cost and other leasing or purchase terms;
developed properties not achieving desired revenue or cash flow levels once opened;
the negative impact of a new restaurant upon sales at nearby existing restaurants;
the challenge of developing in areas where competitors are more established or have greater penetration or access to suitable development sites;
incurring substantial unrecoverable costs in the event a development project is abandoned prior to completion;
impairment charges resulting from underperforming restaurants or decisions to curtail or cease investment in certain locations or markets;
in new geographic markets where we have limited or no existing locations, the inability to successfully expand or acquire critical market presence for our brands, acquire name recognition, successfully market our products or attract new customers;
operating cost levels that reduce the demand for, or raise the cost of, developing new restaurants;
unique regulations or challenges applicable to operating in non-traditional locations, such as airports, college campuses, military or government facilities;
the challenge of identifying, recruiting and training qualified restaurant management;
the inability to obtain all required permits;
changes in laws, regulations and interpretations, including interpretations of the requirements of the Americans with Disabilities Act; and
general economic and business conditions.
Although we manage our growth and development activities to help reduce such risks, we cannot assure that our present or future growth and development activities will perform in accordance with our expectations. Our inability to expand in accordance with our plans or to manage the risks associated with our growth could have a material adverse effect on our results of operations and financial condition.
Risks Related
The failure of our franchisees to Franchisee Financialoperate successful and Business Operations. profitable restaurants could negatively impact our business.
The opening and continued success of franchisefranchise-operated restaurants depends on various factors, including the demand for our franchises, the selection of appropriate franchisee candidates, the identification and availability of suitable sites, the negotiation of acceptable lease or purchase terms for new locations, permitting and regulatory compliance, the ability to meet construction schedules, the availability of financing, and the financial and other capabilities of our franchisees and developers. See “Growth and Development Risks” above. Despite ourthe due diligence performedwe perform during the recruiting process, we cannot assure you that the franchisees and developers planning the opening of franchisefranchise-operated restaurants will have the business abilities or sufficient access to financial resources necessary to open the restaurants as required by their agreements, oragreements. Nor can we assure that they will prove to be effective operators and remain aligned with us onwith respect to operations, pricing, promotional or capital-intensive initiatives.
Our franchisees are contractually obligated to operate their restaurants in accordance with all applicable laws and regulations, as well as the standards set forth in our agreements with them. However, franchisees are independent third parties whom we cannot and do not control beyond the terms of our agreements with them. If franchisees do not successfully operate restaurants in an effective or profitable manner or consistent with applicable laws and required standards, the royalty, and in some cases rent, payments to usthat we receive from the franchisees may be adversely affected. If customers have negative perceptions or experiences with the operational execution,operations, food quality or safety at our franchised locations, the image and reputation of our brands could be harmed, which in turn could negatively impact our business and operatingfinancial results. Also, if franchisee employees have negative experiences and stage work stoppages or otherwise producegenerate bad publicity, this could negatively impact our brand equity.equity and financial results, even though franchise employees are not Company employees.
With an increase in the proportion of Jack in the Box franchised restaurants, the percentage of our revenues derived from royalties and rents at Jack in the Box franchise restaurants has increased and is anticipated to continue to increase, as has the risk that earnings could be negatively impacted by defaults in the payment of royalties and rents. As small businesses, some of our franchise operators may be negatively and disproportionately impacted by strategic initiatives, capital requirements, inflation, labor costs, employee relations issues or other causes. In addition, franchisees’ business obligations may not be limited to the operation of Jack in the Box or Qdoba restaurants, making them subject to business and financial risks unrelated to the operation of our restaurants. These unrelated risks could adversely affect a franchisee’s ability to make payments to us or to make payments on a timely basis. We cannot assure you that our franchisees will successfully participate in our strategic or marketing initiatives or operate their restaurants in a manner consistent with our concepts and standards. As compared to some of our competitors, our Jack in the Box brand has relatively fewer franchisees who, on average, operate more restaurants per franchisee. There are significant risks to our business if a franchisee, particularly one who operates a large number of restaurants, encounters financial difficulties, including bankruptcy, or fails to adhere to our standards, and projectsprojecting an image inconsistent with our brands.brands or negatively impacting our financial results.
Risk Relating to Competition, Menu Innovation and Successful Execution of our Operational Strategies and Initiatives. As part of our long term business plan, in addition to growth through development of new restaurants, we are focused on increasing same-store sales and average unit volumes. These plans are subject to a number of risks and uncertainties, including risks related to competition, menu innovation and identification and execution of successful operational strategies and initiatives. The restaurant industry is highly competitive with respect to price, service, location, personnel, advertising, brand identification and the type, quality and appeal of menu items and new and differentiated service offerings. There are many well-established competitors. Each of our restaurants competes directly and indirectly with a large number of national and regional restaurant chains, as well as with locally-owned and/or independent quick-service restaurants, fast-casual restaurants, casual dining restaurants, sandwich shops and similar types of businesses. The trend toward convergence in grocery, deli and restaurant services has and may continue to increase the number of our competitors. Such increased competition could decrease the demand for our products and negatively affect our sales and profitability. Some of our competitors have substantially greater financial, marketing, operating and other resources than we have, which may give them a competitive advantage. Certain of our competitors have introduced a variety of new products and service offerings and engaged in substantial price discounting, and may adopt similar strategies in the future. In an effort to increase same-store sales and AUVs, we continue to make improvements to our facilities, to implement new service and training initiatives, and to introduce new products and discontinue other menu items. However, there can be no assurance that our facility improvements will foster increases in sales and yield the desired return on investment, that our service initiatives or our overall strategies will be successful, that our menu offerings and promotions will generate sufficient customer interest or acceptance to increase sales, or that competitive product offerings, pricing and promotions will not have an adverse effect upon our margins, sales results and financial condition. In addition, the success of our strategy depends on, among other factors, our ability to motivate restaurant personnel and franchisees to execute our initiatives and achieve sustained high service levels.
Advertising and Promotion Risks. Some of our competitors have greater financial resources, which enable them to purchase significantly more advertising, particularly television and radio ads, than we are able to purchase. Should our competitors increase spending on advertising and promotion, or should the cost of advertising increase or our advertising funds decrease for any reason, including reduced sales or implementation of reduced spending strategies, or should our advertising and promotion be less effective than our competitors, there could be a material adverse effect on our results of operations and financial condition. The growing prevalence and importance of social media platforms, behavioral advertising and mobile technology also pose challenges and risks for our marketing, advertising and promotional strategies. Failure to effectively use these platforms or technology could cause our advertising to be less effective than our competitors. Moreover, improper or damaging use of social media or mobile technology, including by our employees, franchisees, or guests could increase the Company’s costs, lead to litigation or result in negative publicity that could also have a materially adverse effect on our results.
Taxes. Our income tax provision is sensitive to expected earnings and, as those expectations change, our income tax provisions may vary from quarter-to-quarter and year-to-year. In addition, from time to time, we may take positions for filing our tax returns that differ from the treatment for financial reporting purposes. The ultimate outcome of such positions could have an adverse impact on our effective tax rate.
Risks Related to Reducing Operating Costs. During the current and recent years, we have identified strategies and taken steps to reduce operating costs to align with increased Jack in the Box franchise ownership and to further integrate Jack in the Box and Qdoba brand restaurant systems. These strategies include outsourcing certain functions, reducing headcount, relocating the Qdoba corporate support center to San Diego and integrating restaurant information systems between our brands. The ability to reduce our operating costs through these initiatives is subject to risks and uncertainties, and we cannot assure that these activities, or any other activities that we may undertake in the future, will achieve the desired cost savings and efficiencies. Failure to achieve such desired savings, or business disruption resulting from these strategies, could adversely affect our results of operations and financial condition.
Risks Related to Loss of Key Personnel. We believe that our success will depend, in part, on our ability to attract and retain the services of skilled personnel, including key executives. The loss of services of any such personnel could have a material adverse effect on our business.
Risks Related to Government Regulations, Including Regulations Increasing Labor Costs. The restaurant industry is subject to extensive federal, state and local governmental regulations as described in Item 1 under “Regulation.” We are subject to rulesland risks and regulations including but not limited to those related to:
the preparation, ingredients, labeling, packaging, advertising and sale of food and beverages;
building and zoning requirements;
sanitation and safety standards;
employee healthcare, including the implementation and legal, regulatory and cost implications of the Affordable Care Act;
labor and employment, including minimum wage adjustments, overtime, working conditions, employment eligibility and documentation, sick leave, and other employee benefit and fringe benefit requirements, Service Contract Act requirements for restaurants located on military bases, and changing judicial, administrative or regulatory interpretations of federal or state labor laws;
the registration, offer, sale, termination and renewal of franchises;
truth-in-advertising, consumer protection and the security of information;
Americans with Disabilities Act;
payment cards;
alcohol sales; and
climate change, including regulations related to the potential impact of greenhouse gases, water consumption, or a tax on carbon emissions.
The increasing amount and complexity of regulations and their interpretation may increase the costs to us and our franchisees of labor and compliance, and increase our exposure to legal and regulatory claims which, in turn, could have a material adverse effect on our business. While we strive to comply with all applicable existing statutory and administrative rules, we cannot predict the effect on operations from issuance of additional requirements in the future.
Risks Related to Computer Systems, Information Technology and Cyber Security. We and our franchisees rely on computer systems and information technology to conduct our business. A material failure or interruption of service, or a breach in security of our computer systems caused by malware or other attack, could cause reduced efficiency in operations, loss or misappropriation of data, or business interruptions, or could impact delivery of food to restaurants or financial functions such as vendor payment or employee payroll. We have business continuity plans that attempt to anticipate and mitigate such failures, but it is possible that significant capital investment could be required to rectify these problems, or more likely that cash flows could be impacted.
We have instituted controls intended to protect our computer systems, our point of sale (“POS”) systems, and our information technology systems, to adhere to payment card industry data security standards and to limit third party access for vendors that require accessrespect to our restaurant networks. However, we cannot control every security risk, particularly those affecting our franchise locations which are independent businesses. Our security architecture is decentralized, such that payment card information is primarily confined to the restaurant where the specific transaction took place. However, a security breach involving our POS, personnel, franchise operations reporting or other systems could result in disclosure or theft of confidential customer or employee or other proprietary data,owned and potentially cause loss of consumer confidence or potential costs, finesleased properties and litigation, including costs associated with reputational damage, consumer fraud or privacy breach. These risks may be magnified by the increased use of mobile communications and other new technologies, and are subject to increased and changing regulations. The costs of compliance and risk mitigation planning, including increased investment in technology or personnel in order to protect valuable business or consumer information, may negatively impact our results of operations.real estate development projects.
Risks Related to the Failure of Internal Controls Over Financial Reporting. We maintain a documented system of internal controls over financial reporting, which is reviewed and monitored by an Internal Controls Committee and tested by the Company’s full-time Internal Audit Department. The Internal Audit Department reports to the Audit Committee of the Board of Directors. We believe we have a well-designed system to maintain adequate internal controls over financial reporting; however, we cannot be certain that our controls will be adequate in the future or that adequate controls will be effective in preventing or detecting all error and all fraud. A control system, no matter how well designed and operated, can provide only reasonable, not absolute, assurance that the control system’s objectives will be met. The design of any system of controls is based in part on certain assumptions about the likelihood of future events, and there can be no assurance that any design will succeed in achieving its stated goals under all potential future conditions. If our internal controls are ineffective, we may not be able to accurately report our financial results or prevent fraud. Any failures in the effectiveness of our internal controls could have a material adverse effect on our operating results or cause us to fail to meet reporting obligations.
Environmental and Land Risks and Regulations. We own or lease the real properties on which ourmost Jack in the Box system and our Qdoba company-operated restaurants are located, and we either own or lease (and subsequently lease/sublease to the franchisee) a majority of our Jack in the Box franchised restaurant sites. We also own or lease the real properties upon which our company-operated Qdoba restaurants are located,sites and lease (and subsequently sublease to the franchisee) one of our Qdoba franchised restaurant sites. Further, we own our principal executive offices, our Innovation Center and approximately four acres of undeveloped land directly adjacent to the Innovation Center, and lease the Qdoba corporate support center and some regional office space.Center. We have engaged and continue to engage in real estate development projects. As is the case with any owner or operator of real property, we are subject to eminent domain proceedings that can impact the value of investments we have made in real property, and we are subject to other potential liabilities and damages arising out of owning, operating, leasing or otherwise having interests in real property.
Estimated values of our property, fixtures, and equipment or operating results that are lower than our current estimates at certain restaurant locations may cause us to incur impairment charges on certain long-lived assets; such charges may adversely affect our results of operations.
In addition, we are subject to a variety of federal, state and local governmental regulations relatingaccordance with accounting guidance as it relates to the impairment of long-lived assets, we make certain estimates and projections with regard to individual restaurant operations, as well as our overall performance, in connection with our impairment analyses for long-lived assets. We evaluate our long-lived assets, such as property and equipment, for impairment on an annual basis or whenever events or changes in circumstances indicate that their carrying value may not be recoverable. Impairment evaluations for individual restaurants take into consideration a restaurant’s operating cash flows, the period of time since a restaurant has been opened or remodeled, and the maturity of the related market. The projections of future cash flows used in these analyses require the use storage, discharge, emissionof judgment and disposala number of hazardous materials. Failure to comply with environmental laws could resultestimates and projections of future operating results. If actual results differ from our estimates, additional charges for asset impairments may be required in the imposition by governmental agencies or courts of law of severe penalties or restrictions onfuture. If future impairment charges are significant, our operations. We are unaware of any significant hfinancial results would be adversely affected.
azards
Our tax provision may fluctuate due to changes in expected earnings.
Our income tax provision is sensitive to expected earnings and, as those expectations change, our income tax provisions may vary from quarter-to-quarter and year-to-year. In addition, we may occasionally take positions on our tax returns that differ from their treatment for financial reporting purposes. The difference in treatment of such positions could have an adverse impact on our effective tax rate.
We may incur costs as a result of certain restructuring activities which may negatively impact our financial results.
We are continuously seeking the most cost-effective means and structure to serve our customers, protect our shareholders and respond to changes in our markets. Since the beginning of 2012, as part of our ongoing effort to drive efficiencies throughout our organization, we have engaged in an ongoing and, at times, comprehensive review of our organizational structure. In connection with these restructuring activities, our business has occasionally incurred restructuring costs. From time to time, we may continue to engage in restructuring activities in an effort to improve cost competitiveness and profitability. As a result, restructuring costs are responsibleexpected to be a recurring component of our operating costs and may vary significantly from year to year depending on propertiesthe scope of such activities. Such restructuring costs and expenses could adversely impact our financial results.
General Business Risks
We may experience cyber security breaches or other incidents.
We and our franchisees rely on computer systems and information technology to conduct our business. We have instituted controls, including information security governance controls, intended to: protect our computer systems, our point of sale (“POS”) systems, and our information technology systems and networks; and adhere to payment card industry data security standards and limit third party access for vendors that require access to our restaurant networks. We also have business continuity plans that attempt to anticipate and mitigate failures. However, we owncannot control or prevent every cyber security risk.
A material failure or interruption of service, or a breach in the security of our computer systems caused by malware or other attack, could cause: reduced efficiency in operations, loss or misappropriation of data, or other business interruptions; or could negatively impact: delivery of food to restaurants, or financial functions such as vendor payment, employee payroll, franchise operations reporting, or our ability to receive customer payments through our POS or other systems. Such events could negatively impact cash flows or require significant capital investment to rectify; result in damage to our business or reputation or loss of consumer confidence; and lead to potential costs, fines and litigation. These risks may be magnified by increased and changing regulations. The costs of compliance and risk mitigation planning, including increased investment in technology or personnel in order to protect valuable business or consumer information, may also negatively impact our financial results.
Restaurants and other retailers have owned, or operate or have operated. Accordingly,faced, and we do not have environmental liability insurancecould in the future become subject to, claims for our restaurants, nor do we maintain a reserve to cover such events. In the eventpurportedly fraudulent transactions arising out of the determinationactual or alleged theft of contaminationcredit or debit card information or the loss of personally identifiable information, and we may also be subject to lawsuits or other proceedings in the future relating to these types of incidents. Any such proceedings could distract our management from running our business and cause us to incur significant unplanned losses and expenses. Consumer perception of our brand could also be negatively affected by these events, which could further adversely affect our financial results.
We collect and maintain personal information about our employees and our guests. The collection and use of such information is regulated at the federal and state levels. We increasingly rely on such properties, the Company, as owner or operator, could be held liable for severe penaltiescloud computing and costs of remediation, and this couldother technologies that result in third parties holding significant amounts of customer or employee information on our behalf. There has been an increase over the past several years in the frequency and sophistication of attempts to compromise the security of these types of systems. If the security and information systems that we or our outsourced third-party providers use to store or process such information are compromised or if we, or such third parties, otherwise fail to comply with applicable laws and regulations, we could face litigation and the imposition of penalties that could adversely affect our financial performance. Our reputation as a brand or as an employer could also be adversely affected by these types of security breaches or regulatory violations, which could impair our ability to attract and keep qualified employees.
We may not be able to adequately protect our intellectual property, which could harm the value of our brands and adversely affect our business.
Our ability to successfully implement our business strategy depends, in part, on our ability to further build brand recognition using our trademarks, service marks, trade dress, and other proprietary intellectual property, including our name and logos, our strategy and the ambiance of our restaurants. If our efforts to protect our intellectual property are inadequate, or if any third party misappropriates or infringes our intellectual property, either in print, or on the Internet or a social media platform, the value of our brand may be harmed, which could have a material liability.adverse effect on our business and might prevent our brand from achieving or maintaining market acceptance.
Risks RelatedWe adjust our capital structure from time to Leverage. time and we may increase our debt leverage which would make us more sensitive to the effects of economic downturns.
As of October 2, 2016,1, 2017, the Company has a credit facility comprised of a $900.0 million revolving credit agreement and a $700.0 million term loan. We may also request the issuance of up to $75.0 million in letters of credit, the outstanding amount of which reduces our net borrowing capacity under the credit agreement. For additional information related to our credit facility, refer to Note 7, Indebtedness,, of the notes to the consolidated financial statements. Increased leverage resulting from borrowings under our credit facility could have certain material adverse effects on the Company, including but not limited to the following:
our ability to obtain additional financing in the future for working capital, capital expenditures, acquisitions and general corporate or other purposes could be impaired, or any such financing may not be available on terms favorable to us;
a substantial portion of our cash flows could be required for debt service and, as a result, might not be available for our operations or other purposes;
any substantial decrease in net operating cash flows or any substantial increase in expenses could make it difficult for us to meet our debt service requirements or could force us to modify our operations or sell assets;
our ability to operate our business and our ability to repurchase stock or pay cash dividends to our stockholders may be restricted by the financial and other covenants set forth in the credit facility;
our ability to withstand competitive pressures may be decreased; and
our level of indebtedness may make us more vulnerable to economic downturns and reduce our flexibility in responding to changing business, regulatory and economic conditions.
Our ability to repay expected borrowings under our credit facility and to meet our other debt or contractual obligations (including compliance with applicable financial covenants) will depend upon our future performance and our cash flows from operations, both of which are subject to prevailing economic conditions and financial, business and other known and unknown risks and uncertainties, certain of which are beyond our control. In addition, to the extent that banks in our revolving credit facility become insolvent, our ability to borrow to the full level of our facility could be limited.
RisksThe trading volatility and price of Market Volatility. our common stock may be affected by many factors.
Many factors affect the trading price of our stock, including factors over which we have no control, such as reports on the economy, the industry or the price of commodities, as well as negative or positive announcements by competitors, regardless of whether the report relates directly to our business. In addition to investor expectations about our prospects, trading activity in our stock can reflect the portfolio strategies and investment allocation changes of institutional holders and non-operating initiatives such as a share repurchase program. Any failure to meet market expectations whether for sales, growth rates, refranchising goals, earnings per share or other metrics could cause our share price to drop.
Risks of Changes in Accounting Policies and Assumptions.accounting standards may negatively impact our results of operations.
Changes in accounting standards, policies or related interpretations by accountants or regulatory entities may negatively impact our financial results. Many accounting standards require management to make subjective assumptions and estimates, such as those required for long-lived assets, retirement benefits, self-insurance, restaurant closing costs, goodwill and other intangibles, legal accruals, and income taxes. Changes in those underlying assumptions and estimates could significantly change our results.
Litigation.
We may be subject to claims or litigation that are costly and could result in our payment of substantial damages or settlement costs.
We are subject to complaints or litigation brought by former, current or prospective employees, customers, franchisees, vendors, landlords, shareholders, government regulations, or others. We assess contingencies to determine the degree of probability and range of possible losslosses for potential accrual in our financial statements. An estimated loss contingency is accrued if it is probable that a liability has been incurred and the amount of loss can be reasonably estimated. Because lawsuits are inherently unpredictable and unfavorable resolutions could occur, assessing contingencies is highly subjective and requires judgments about future events. We regularly review contingencies to determine the adequacy of the accruals and related disclosures. However, the amount of ultimate loss may differ from these estimates. A judgment that is not covered by insurance or that is significantly in excess of our insurance coverage for any claims could materially adversely affect our financial condition or results of operations.results. In addition, regardless of whether any claims against us are valid or whether we are found to be liable, claims may be expensive to defend, and may divert management’s attention away from our operations and hurt our performance. Further, adverse publicity resulting from claims against us or our franchisees may harm our business or that of our franchisees.
Unionization activities or labor disputes may disrupt our operations and affect our profitability.
Some or all of our employees or our franchisees’ employees may elect to be represented by labor unions in the future. If a significant number of these employees were to become unionized and collective bargaining agreement terms were significantly different from current compensation arrangements, this could adversely affect our business and financial results or the business and financial results of our franchisees. In addition, a labor dispute or organizing effort involving some or all of our employees or our franchisees’ employees may harm our brand and reputation. Resolution of such disputes may be costly and time-consuming, and thus increase our costs and distract management resources.
Our insurance may not provide adequate levels of coverage against claims.
We believe that we maintain insurance policies customary for businesses of our size and type. Historically, through the use of deductibles or self-insurance retentions, we retained a portion of expected losses for our workers’ compensation, general liability, certain employee medical and dental, employment, property and other claims. However, there are types of losses that we may incur that cannot be insured against or that we believe are not economically reasonable to insure. Such losses could have a material adverse effect on our business and results of operations.
Our bylaws contain an exclusive forum provision that may discourage lawsuits against us and our directors and officers.
Our bylaws provide that unless our Board of Directors otherwise determines, the state courts in the State of Delaware (or, if no state court located within the State of Delaware has jurisdiction, the federal court for the District of Delaware), will be the sole and exclusive forum for any derivative action or proceeding brought on our behalf, asserting a claim of breach of a fiduciary duty owed by any directors or officers to the Company or our stockholders, or any action asserting a claim as to which the Delaware General Corporate Law confers jurisdiction on the Delaware Court of Chancery. This exclusive forum provision may limit the ability of our stockholders to bring a claim in a judicial forum that such stockholders find favorable for disputes with us or our directors or officers, which may discourage such lawsuits against us and our directors and officers. Alternatively, if a court outside of Delaware were to find this exclusive forum provision inapplicable to, or unenforceable in respect of, one or more of the specified types of actions or proceedings described above, we may incur additional costs associated with resolving such matters in multiple jurisdictions, which could materially and adversely affect our financial results.
Risks Related to Government Regulations
Governmental regulation, including in one or more of the following areas, may adversely affect our existing and future operations and results, including by harming our ability to profitably operate our restaurants.
Americans with Disabilities Act and Similar State Laws
We are subject to the Americans with Disabilities Act and similar state laws that give civil rights protections to individuals with disabilities in the context of employment, public accommodations and other areas. The expenses associated with any modifications we may be required to undertake with respect to our restaurants or services, or any damages, legal fees, and costs associated with litigating or resolving claims under the ADA or similar state laws, could be material.
Food Regulation
The Food Safety Modernization Act signed into law in January 2011, granted the FDA new authority regarding the safety of the entire food system, including through increased inspections and mandatory food recalls. Although restaurants are not directly implicated by some of these new requirements, our suppliers may initiate or otherwise be subject to food recalls or other consequences impacting the availability of certain products, which could result in adverse publicity, or require us to take actions that could be costly for us or otherwise impact our business and financial results.
Local Licensure, Zoning and Other Regulation
Each of our restaurants is subject to state and local licensing and regulation by health, alcoholic beverage, sanitation, food and workplace safety and other agencies. We may experience material difficulties or failures in obtaining the necessary licenses or approvals for new restaurants, which could delay planned restaurant openings. In addition, stringent and varied requirements of local regulators with respect to zoning, land use and environmental factors could delay or prevent development of new restaurants in particular locations. More specifically, some of our Qdoba restaurants sell alcoholic beverages, which require additional licensing. The regulations governing such licensing may impose requirements on licensees including minimum age of employees, hours of operation, and advertising and handling of alcoholic beverages. The failure of a restaurant to obtain or retain a license could adversely affect the store’s financial results.
Environmental Laws
We are subject to federal, state and local environmental laws and regulations concerning the discharge, storage, handling, release and disposal of hazardous or toxic substances, as well as local ordinances restricting the types of packaging we can use in our restaurants. If and to the extent any hazardous or toxic substances are present on or adjacent to any of our restaurant locations, we believe any such contamination would be the responsibility of one or more third parties, and would have been or should be addressed by the responsible party. If the relevant third parties have not or do not address the identified contamination properly or completely, then under certain environmental laws, we could be held liable as an owner or operator to address any remaining contamination, sometimes without regard to whether we knew of, or were responsible for, the release or presence of hazardous or toxic substances. Any such liability could be material. Further, we may not have identified all of the potential environmental liabilities at our properties, and any such liabilities could have a material adverse effect on our financial results. We also cannot predict what environmental laws or laws regarding packaging will be enacted in the future, how existing or future environmental or packaging laws will be administered or interpreted, or the amount of future expenditures that we may need to make to comply with, or to satisfy claims relating to, such laws.
Employment and Immigration Laws
We and our franchisees are subject to the federal labor laws, including the Fair Labor Standards Act, as well as various state and local laws governing such matters as minimum wages, exempt status classification, overtime, breaks, and other working conditions for employees. Federal, state and local laws may also require us to provide paid and unpaid leave, healthcare, or other benefits to our employees. Changes in the law, or penalties associated with any failure on our part to comply with legal requirements, could increase our labor costs or result in significant additional expense to us and our franchisees.
Various states in which we operate are considering or have already adopted new immigration laws or enforcement programs, and the U.S. Congress and the Department of Homeland Security from time to time consider and may implement changes to federal immigration laws, regulations or enforcement programs. Immigration laws have recently been an area of considerable focus by the Department of Homeland Security, with enforcement operations taking place across the country, resulting in arrests and detentions of unauthorized workers. Some of these changes and enforcement programs may increase our obligations for compliance and oversight, which could subject us to additional costs and make our hiring process more cumbersome. Although we require all
workers to provide us with government-specified documentation evidencing their employment eligibility, some of our employees may, without our knowledge, be unauthorized workers. All of our Company restaurants, as well as our corporate support center, currently participate in the “E-Verify” program, an Internet-based, free program run by the United States government to verify employment eligibility. However, use of the “E-Verify” program does not guarantee that we will successfully identify all applicants who are ineligible for employment. Unauthorized workers are subject to deportation and may subject us to fines or penalties, and if any of our employees or our franchisees’ employees are found to be unauthorized we could experience adverse publicity that negatively impacts our brand and may make it more difficult to hire and keep qualified employees. Termination of a significant number of employees who are found to be unauthorized workers may disrupt operations, cause temporary increases in labor costs to train new employees, and result in additional adverse publicity. We could also become subject to fines, penalties, and other costs related to claims that we did not fully comply with all record keeping obligations of federal and state immigration compliance laws. These factors could materially adversely affect our financial results.
Franchising Activities
Our domestic franchising activities are subject to federal regulations administered by the U.S. Federal Trade Commission, laws enacted by a number of states, and with respect to Qdoba, certain rules and requirements regulating franchising activities in Canada, where we have some franchise-operated Qdoba restaurants. In particular, we are subject to federal, state, and Canadian laws regulating the offer and sale of franchises, as well as judicial and administrative interpretations of such laws. Such laws impose registration and disclosure requirements on franchisors in the offer and sale of franchises, and may also apply substantive standards to the relationship between franchisor and franchisee, including limitations on the ability of franchisors to terminate franchises and alter franchise arrangements. Failure to comply with new or existing franchise laws, rules, and regulations in any jurisdiction or to obtain required government approvals could negatively affect our ability to grow or expand our franchise business and sell franchises.
The proliferation of federal, state, and local regulations increases our compliance risks, which in turn could adversely affect our business.
The restaurant industry is subject to extensive federal, state, and local laws and regulations. The increasing amount and complexity of regulations and their interpretation may increase the costs to us and our franchisees of labor and compliance, and increase our exposure to legal and regulatory claims which, in turn, could have a material adverse effect on our business. While we strive to comply with all applicable existing rules and regulations, we cannot predict the effect on our operations from modifications to the language or interpretations of existing requirements, or to the issuance of new or additional requirements in the future.
Changes to healthcare laws in the United States or the repeal of existing healthcare laws may negatively impact our financial results in future periods.
The Affordable Care Act requires health care coverage for many previously uninsured individuals and expands coverage for those already insured. If we fail to offer such benefits, or the benefits we elect to offer do not meet the applicable requirements, we may incur penalties. Since the Affordable Care Act also requires individuals to obtain coverage or face individual penalties, employees who are currently eligible for but elect not to participate in our healthcare plans may find it advantageous to do so in the future, particularly as the level of individual penalties increases over time. It is also possible that by making changes or failing to make changes in the healthcare plans we offer, we will become less competitive in the market for our labor. Finally, continuing to implement the requirements of the Affordable Care Act is likely to impose additional administrative costs. The future costs and other effects of these or other new healthcare requirements cannot be determined with certainty, but they may continue to significantly increase our healthcare coverage costs and could materially adversely affect our financial results.
It is possible that legislation will be passed by the U.S. Congress and signed into law that repeals the Affordable Care Act, in whole or in part, and/or introduces a new form of health care reform. It is unclear at this point what the scope of such legislation would be and when it would become effective. Because of the uncertainty surrounding possible replacement health care reform legislation, we cannot predict with any certainty the likely impact of the Affordable Care Act’s repeal or the adoption of any other health care reform legislation on our business, financial condition or results of operations. Whether or not there is alternative health care legislation enacted in the United States, there is likely to be significant disruption to the health care market in the coming months and years and the costs of our health care expenditures may increase.
Legislation and regulations regarding our products and ingredients, including the nutritional content of our products, could impact customer preferences and negatively impact our financial results.
Changes in government regulation and consumer eating habits may impact the ingredients and nutritional content of our menu offerings, or require us to disclose the nutritional content of our menu offerings. For example, a number of states, counties and cities have enacted menu labeling laws requiring multi-unit restaurant operators to disclose certain nutritional information to customers, or have enacted legislation restricting the use of certain types of ingredients in restaurants. Furthermore the Affordable Care Act requires chain restaurants to publish calorie information on their menus and menu boards effective May 7, 2018. These and other requirements may increase our expenses, slow customers as they move through the line, or negatively influence the demand for our offerings; all of which can impact sales and profitability.
Compliance with current and future laws and regulations in a number of areas, including with respect to ingredients and nutritional content of our products, may be costly and time-consuming. Additionally, if consumer health regulations change significantly, we may be required to modify our menu offerings, and as a result, may experience higher costs or reduced demand associated with such changes. As some government authorities are increasing regulations regarding trans-fats and sodium, we may be required to limit or eliminate trans-fats from our menu offerings or reduce their sodium content. We may also be required to switch to higher cost ingredients, which may hinder our ability to operate in some markets or to offer our full menu in these markets, which could have a material adverse effect on our business. If we fail to comply with such laws and regulations, our business could also experience a material adverse effect.
Failure to obtain and maintain required licenses and permits or to comply with food control regulations could lead to the loss of our food service licenses and, thereby, harm our business.
We are required, as a restaurant business, under state, and local government regulations to obtain and maintain licenses, permits, and approvals to operate our businesses. Such regulations are subject to change from time to time. Any failure by us or our franchisees to obtain and maintain these licenses, permits, and approvals could adversely affect our financial results.
| |
| ITEM 1B. | UNRESOLVED STAFF COMMENTS |
None.
The following table sets forth information regarding our operating Jack in the Box and Qdoba restaurant properties as of October 2, 20161, 2017:
| | | | | Company- Operated | | Franchise | | Total | | Company- Operated | | Franchise | | Total |
| Company-owned restaurant buildings: | | | | | | | | | | | | |
| On company-owned land | | 44 |
| | 182 |
| | 226 |
| | 20 |
| | 197 |
| | 217 |
|
| On leased land | | 135 |
| | 506 |
| | 641 |
| | 96 |
| | 546 |
| | 642 |
|
| Subtotal | | 179 |
| | 688 |
| | 867 |
| | 116 |
| | 743 |
| | 859 |
|
| Company-leased restaurant buildings on leased land | | 605 |
| | 924 |
| | 1,529 |
| | 545 |
| | 990 |
| | 1,535 |
|
| Franchise directly-owned or directly-leased restaurant buildings | | — |
| | 558 |
| | 558 |
| | — |
| | 583 |
| | 583 |
|
| Total restaurant buildings | | 784 |
| | 2,170 |
| | 2,954 |
| | 661 |
| | 2,316 |
| | 2,977 |
|
Our restaurant leases generally provide for fixed rental payments (with cost-of-living index adjustments) plus real estate taxes, insurance and other expenses. In addition, approximately 15%14% of our leases provide for contingent rental payments between 1% and 15%20% of the restaurant’s gross sales once certain thresholds are met. We have generally been able to renew our restaurant leases as they expire at then-current market rates. The remaining terms of ground leases range from approximately less than one year to 5251 years, including optional renewal periods. The remaining lease terms of our other leases range from approximately less than one year to 4140 years, including optional renewal periods. As of October 2, 2016,1, 2017, our restaurant leases had initial terms expiring as follows:
|
| | | | | | |
| | | Number of Restaurants |
| Fiscal Year | | Ground Leases | | Land and Building Leases |
| 2017 – 2021 | | 295 |
| | 758 |
|
| 2022 – 2026 | | 219 |
| | 542 |
|
| 2027 – 2031 | | 111 |
| | 166 |
|
| 2032 and later | | 16 |
| | 63 |
|
|
| | | | | | |
| | | Number of Restaurants |
| Fiscal Year | | Ground Leases | | Land and Building Leases |
| 2018 – 2022 | | 332 |
| | 905 |
|
| 2023 – 2027 | | 216 |
| | 429 |
|
| 2028 – 2032 | | 76 |
| | 157 |
|
| 2033 and later | | 18 |
| | 44 |
|
Our principal executive offices are located in San Diego, California in an owned facility of approximately 150,000 square feet. We also own our 70,000 square foot Innovation Center and approximately four acres of undeveloped land directly adjacent to it. Qdoba’s corporate support center iswas located in a leased facility in Lakewood, Colorado, thatwhich we plan to exitexited during the firstsecond quarter of 2017, relocating all2017; with operations relocated to San Diego. We believe our principal executive offices and Innovation Center are suitable and adequate for our present purposes.
| |
| ITEM 3. | LEGAL PROCEEDINGS |
See Note 15, Commitments, Contingencies and Legal Matters, of the notes to the consolidated financial statements for a discussion of our legal proceedings.
| |
| ITEM 4. | MINE SAFETY DISCLOSURES |
Not applicable.
PART II
| |
| ITEM 5. | MARKET FOR REGISTRANT’S COMMON EQUITY, RELATED STOCKHOLDER MATTERS AND ISSUER PURCHASES OF EQUITY SECURITIES |
Market Information. Our common stock is traded on the Nasdaq Global Select Market under the symbol “JACK.” The following table sets forth the high and low sales prices for our common stock during the fiscal quarters indicated, as reported on the NASDAQ — Composite Transactions:
| | | | | 13 Weeks Ended | | 12 Weeks Ended | | 16 Weeks
Ended | | 12 Weeks Ended | | 16 Weeks
Ended |
| | | October 2,
2016 | | July 3,
2016 | | April 10,
2016 | | January 17,
2016 | | October 1,
2017 | | July 9,
2017 | | April 16,
2017 | | January 22,
2017 |
| High | | $ | 102.68 |
| | $ | 88.65 |
| | $ | 78.87 |
| | $ | 82.20 |
| | $ | 104.13 |
| | $ | 113.00 |
| | $ | 112.86 |
| | $ | 113.30 |
|
| Low | | $ | 83.64 |
| | $ | 64.30 |
| | $ | 61.78 |
| | $ | 69.60 |
| | $ | 90.89 |
| | $ | 95.76 |
| | $ | 93.04 |
| | $ | 91.02 |
|
| | | 12 Weeks Ended | | 16 Weeks
Ended | | 13 Weeks Ended | | 12 Weeks Ended | | 16 Weeks
Ended |
| | | September 27,
2015 | | July 5,
2015 | | April 12,
2015 | | January 18,
2015 | | October 2,
2016 | | July 3,
2016 | | April 10,
2016 | | January 17,
2016 |
| High | | $ | 98.26 |
| | $ | 96.40 |
| | $ | 99.99 |
| | $ | 87.50 |
| | $ | 102.68 |
| | $ | 88.65 |
| | $ | 78.87 |
| | $ | 82.20 |
|
| Low | | $ | 63.94 |
| | $ | 85.30 |
| | $ | 81.56 |
| | $ | 63.84 |
| | $ | 83.64 |
| | $ | 64.30 |
| | $ | 61.78 |
| | $ | 69.60 |
|
Dividends. During the third quarter of fiscal 2014, the Board of Directors approved the initiation of a regular quarterly cash dividend. In fiscal 2016,2017, the Board of Directors declared four cash dividends of $0.30$0.40 per share each. In fiscal 2016, we declared four cash dividends of $0.30 per share each, and in fiscal 2015, we declared two cash dividends of $0.20 per share each, and two cash dividends of $0.30 per share each. In fiscal 2014, we declared two cash dividends of $0.20 per share each. Our dividend is subject to the discretion and approval of our Board of Directors and our compliance with applicable law, and depends upon, among other things, our results of operations, financial condition, level of indebtedness, capital requirements, contractual restrictions, restrictions in our credit agreement and other factors that our Board of Directors may deem relevant.
Stock Repurchases. The following table summarizesThere were no shares repurchased during the quarter ended October 2, 20161, 2017.. The average price paid per share in column (b) below does not include the cost of brokerage fees:
|
| | | | | | | | | | | | | | |
| | | (a)
Total Number
of Shares
Purchased | | (b)
Average
Price Paid
Per Share | | (c)
Total Number of Shares Purchased as Part of Publicly
Announced Programs | | (d)
Maximum Dollar Value That May Yet Be Purchased Under These Programs |
| | | | | | | | | $ | 150,025,646 |
|
| July 4, 2016 - July 31, 2016 | | — |
| | $ | — |
| | — |
| | $ | 150,025,646 |
|
| August 1, 2016 - August 28, 2016 | | — |
| | $ | — |
| | — |
| | $ | 150,025,646 |
|
| August 29, 2016 - October 2, 2016 | | 425,254 |
| | $ | 98.42 |
| | 425,254 |
| | $ | 408,172,440 |
|
| Total | | 425,254 |
| | $ | — |
| | 425,254 |
| | |
Stockholders. As of November 18, 2016,24, 2017, there were 493477 stockholders of record.
Securities Authorized for Issuance Under Equity Compensation Plans. The following table summarizes the equity compensation plans under which Company common stock may be issued as of October 2, 20161, 2017. Stockholders of the Company have approved all plans requiring such approval.
|
| | | | | | |
| | | (a) Number of securities to be issued upon exercise of outstanding options, warrants and rights (1) | | (b) Weighted-average exercise price of outstanding options (1) | | (c) Number of securities remaining for future issuance under equity compensation plans (excluding securities reflected in column (a)) |
| Equity compensation plans approved by security holders (2) | | 965,160 | | $61.73 | | 2,465,612 |
|
| | | | | | |
| | | (a) Number of securities to be issued upon exercise of outstanding options, warrants and rights (1) | | (b) Weighted-average exercise price of outstanding options (1) | | (c) Number of securities remaining for future issuance under equity compensation plans (excluding securities reflected in column (a)) |
| Equity compensation plans approved by security holders (2) | | 893,056 | | $80.15 | | 2,222,717 |
____________________________
| |
| (1) | Includes shares issuable in connection with our outstanding stock options, performance share awards, nonvested stock awards and units, and non-management director deferred stock equivalents. The weighted-average exercise price in column (b) includes the weighted-average exercise price of stock options. |
| |
| (2) | For a description of our equity compensation plans, refer to Note 12, Share-Based Employee Compensation, of the notes to the consolidated financial statements. |
Performance Graph. The following graph compares the cumulative return to holders of the Company’s common stock at September 30th of each year to the yearly weighted cumulative return of a Peer Group Index and to the Standard & Poor’s (“S&P”) 500 Index for the same period. As it does every year, the Compensation Committee of the Board of Directors (the “Committee”) reviews the make-up of the Peer Group as part of its process of setting the compensation of our executive officers. Working closely with its independent compensation consultant, and considering anticipated Company revenues, the Committee approved changes to the Peer Group to remove Ruby Tuesday, Inc. due to its size being relatively smaller than other members of the Peer Group based on defined criteria (i.e., revenue, market capitalization, and system-wide sales), and added Papa John's International, Inc, which more closely meets the established criteria for our Peer Group. The below comparison assumes $100 was invested on September 30, 20112012 in the Company’s common stock and in the comparison groups and assumes reinvestment of dividends. The Company paid dividends beginning in fiscal 2014.

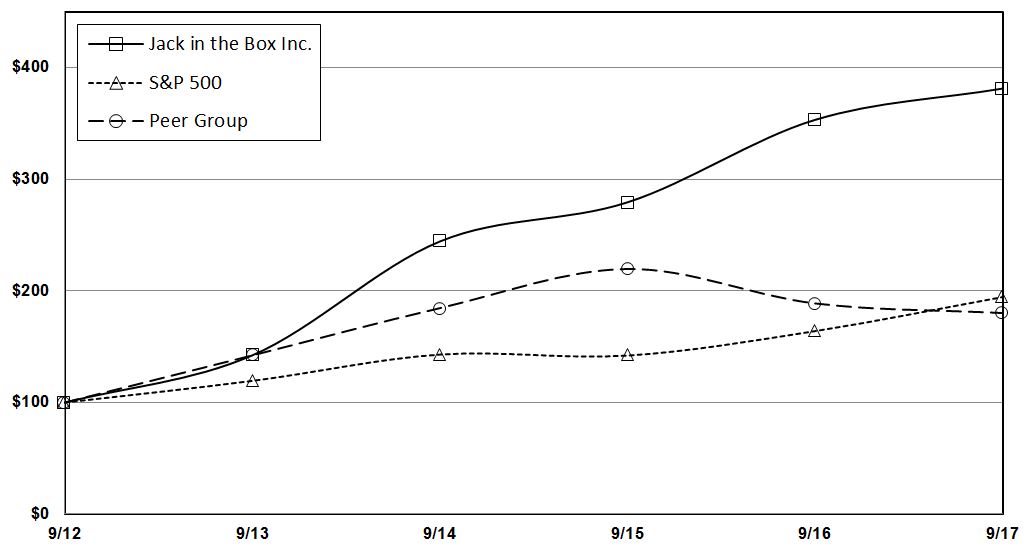
| | | | 2011 | 2012 | 2013 | 2014 | 2015 | 2016 | 2012 | 2013 | 2014 | 2015 | 2016 | 2017 |
| Jack in the Box Inc. | $100 | $141 | $201 | $345 | $394 | $498 | $100 | $142 | $244 | $279 | $353 | $381 |
| S&P 500 Index | $100 | $130 | $155 | $186 | $185 | $213 | $100 | $119 | $143 | $142 | $164 | $194 |
| Old Peer Group (1) | $100 | $130 | $174 | $219 | $257 | $219 | |
| New Peer Group (2) | $100 | $132 | $177 | $224 | $266 | $232 | |
| Peer Group (1) | | $100 | $142 | $185 | $220 | $189 | $180 |
____________________________
| |
| (1) | The Old Peer Group Index comprises the following companies: Brinker International, Inc.; Buffalo Wild Wings, Inc.; Chipotle Mexican Grill Inc.; Cracker Barrel Old Country Store, Inc.; DineEquity, Inc.; Domino’s Pizza, Inc.; Panera Bread Company; Ruby Tuesday, Inc.; Sonic Corp.; The Cheesecake Factory Inc.; and The Wendy’s Company. |
| |
(2) | The New Peer Group Index comprises the following companies: Brinker International, Inc.; Buffalo Wild Wings, Inc.; Chipotle Mexican Grill Inc.; Cracker Barrel Old Country Store, Inc.; DineEquity, Inc.; Domino’s Pizza, Inc.; Panera Bread Company; Papa John's Int'l, Inc.; Sonic Corp.; The Cheesecake Factory Inc.; and The Wendy’s Company. |
| |
| ITEM 6. | SELECTED FINANCIAL DATA |
Our fiscal year is 52 or 53 weeks, ending the Sunday closest to September 30. All years presented below include 52 weeks,-weeks, except for 2016 which includes 53 weeks.53-weeks. The selected financial data reflects, as discontinued operations, 62 closed Qdoba stores and our distribution business for all years presented. This selected financial data should be read in conjunction with our audited consolidated financial statements and accompanying notes and Management’s Discussion and Analysis of Financial Condition and Results of Operations included elsewhere in this Annual Report on Form 10-K. Our consolidated financial information may not be indicative of our future performance.
| | | | | Fiscal Year | | Fiscal Year |
| | | 2016 | | 2015 | | 2014 | | 2013 | | 2012 | | 2017 | | 2016 | | 2015 | | 2014 | | 2013 |
| | | (dollars in thousands, except per share data) | | (dollars and shares in thousands, except per share data) |
| Statements of Earnings Data (1): | | | | | | | | | | | | | | | | | | | | |
| Total revenues | | $ | 1,599,331 |
| | $ | 1,540,317 |
| | $ | 1,484,131 |
| | $ | 1,489,867 |
| | $ | 1,509,295 |
| | $ | 1,553,914 |
| | $ | 1,599,331 |
| | $ | 1,540,317 |
| | $ | 1,484,131 |
| | $ | 1,489,867 |
|
| | | | | | | | | | | | | | | | | | | | | |
| Operating costs and expenses | | $ | 1,370,646 |
| | $ | 1,340,005 |
| | $ | 1,318,275 |
| | $ | 1,356,302 |
| | $ | 1,417,624 |
| | $ | 1,325,807 |
| | $ | 1,370,646 |
| | $ | 1,340,005 |
| | $ | 1,318,275 |
| | $ | 1,356,302 |
|
| (Gains) losses on the sale of company-operated restaurants | | (1,230 | ) | | 3,139 |
| | 3,548 |
| | (4,640 | ) | | (29,145 | ) | | (38,034 | ) | | (1,230 | ) | | 3,139 |
| | 3,548 |
| | (4,640 | ) |
| Total operating costs and expenses, net | | $ | 1,369,416 |
| | $ | 1,343,144 |
| | $ | 1,321,823 |
| | $ | 1,351,662 |
| | $ | 1,388,479 |
| | $ | 1,287,773 |
| | $ | 1,369,416 |
| | $ | 1,343,144 |
| | $ | 1,321,823 |
| | $ | 1,351,662 |
|
| | | | | | | | | | | | | | | | | | | | | |
| Earnings from continuing operations | | $ | 126,270 |
| | $ | 112,601 |
| | $ | 94,844 |
| | $ | 82,608 |
| | $ | 68,104 |
| | $ | 138,308 |
| | $ | 126,270 |
| | $ | 112,601 |
| | $ | 94,844 |
| | $ | 82,608 |
|
| | | | | | | | | | | | | | | | | | | | | |
| Earnings per Share and Share Data: | | | | | | | | | | | | | | | | | | | | |
| Earnings per share from continuing operations (1): | | | | | | | | | | | | | | | | | | | | |
| Basic | | $ | 3.74 |
| | $ | 3.00 |
| | $ | 2.33 |
| | $ | 1.91 |
| | $ | 1.55 |
| | $ | 4.52 |
| | $ | 3.74 |
| | $ | 3.00 |
| | $ | 2.33 |
| | $ | 1.91 |
|
| Diluted | | $ | 3.70 |
| | $ | 2.95 |
| | $ | 2.26 |
| | $ | 1.84 |
| | $ | 1.52 |
| | $ | 4.47 |
| | $ | 3.70 |
| | $ | 2.95 |
| | $ | 2.26 |
| | $ | 1.84 |
|
| Cash dividends declared per common share (1) | | $ | 1.20 |
| | $ | 1.00 |
| | $ | 0.40 |
| | $ | — |
| | $ | — |
| | $ | 1.60 |
| | $ | 1.20 |
| | $ | 1.00 |
| | $ | 0.40 |
| | $ | — |
|
| Weighted-average shares outstanding — Basic (1)(2) | | 33,735 |
| | 37,587 |
| | 40,781 |
| | 43,351 |
| | 43,999 |
| | 30,630 |
| | 33,735 |
| | 37,587 |
| | 40,781 |
| | 43,351 |
|
| Weighted-average shares outstanding — Diluted (1)(2) | | 34,146 |
| | 38,215 |
| | 41,973 |
| | 44,899 |
| | 44,948 |
| | 30,914 |
| | 34,146 |
| | 38,215 |
| | 41,973 |
| | 44,899 |
|
| Market price at year-end | | $ | 95.94 |
| | $ | 79.71 |
| | $ | 65.73 |
| | $ | 40.10 |
| | $ | 28.11 |
| | $ | 101.92 |
| | $ | 95.94 |
| | $ | 79.71 |
| | $ | 65.73 |
| | $ | 40.10 |
|
| | | | | | | | | | | | |
| Other Operating Data: | | | | | | | | | | | | | | | | | | | | |
| Jack in the Box restaurants: | | | | | | | | | | | | | | | | | | | | |
| Company-operated average unit volume (4) | | $ | 1,870 |
| | $ | 1,858 |
| | $ | 1,708 |
| | $ | 1,606 |
| | $ | 1,557 |
| | $ | 1,874 |
| | $ | 1,870 |
| | $ | 1,858 |
| | $ | 1,708 |
| | $ | 1,606 |
|
| Franchise-operated average unit volume (3)(4) | | $ | 1,454 |
| | $ | 1,429 |
| | $ | 1,337 |
| | $ | 1,312 |
| | $ | 1,313 |
| | $ | 1,475 |
| | $ | 1,454 |
| | $ | 1,429 |
| | $ | 1,337 |
| | $ | 1,312 |
|
| System average unit volume (3)(4) | | $ | 1,530 |
| | $ | 1,510 |
| | $ | 1,412 |
| | $ | 1,381 |
| | $ | 1,379 |
| | $ | 1,543 |
| | $ | 1,530 |
| | $ | 1,510 |
| | $ | 1,412 |
| | $ | 1,381 |
|
| Change in company-operated same-store sales | | 0.0 | % | | 5.1 | % | | 2.0 | % | | 1.0 | % | | 4.6 | % | |
| Change in franchise-operated same-store sales (3) | | 1.6 | % | | 7.0 | % | | 2.0 | % | | 0.1 | % | | 3.0 | % | |
| Change in system same-store sales (3) | | 1.2 | % | | 6.5 | % | | 2.0 | % | | 0.3 | % | | 3.4 | % | |
| Change in fiscal basis company-operated same-store sales (3) | | | (1.3 | )% | | 0.0 | % | | 5.1 | % | | 2.0 | % | | 1.0 | % |
| Change in fiscal basis franchise-operated same-store sales (3) | | | 0.9 | % | | 1.6 | % | | 7.0 | % | | 2.0 | % | | 0.1 | % |
| Change in fiscal basis system same-store sales (3) | | | 0.5 | % | | 1.2 | % | | 6.5 | % | | 2.0 | % | | 0.3 | % |
| Qdoba restaurants: | | | | | | | | | | | | | | | | | | | | |
| Company-operated average unit volume (4) | | $ | 1,209 |
| | $ | 1,199 |
| | $ | 1,114 |
| | $ | 1,080 |
| | $ | 1,060 |
| | $ | 1,164 |
| | $ | 1,209 |
| | $ | 1,199 |
| | $ | 1,114 |
| | $ | 1,080 |
|
| Franchise-operated average unit volume (3)(4) | | $ | 1,150 |
| | $ | 1,140 |
| | $ | 1,028 |
| | $ | 961 |
| | $ | 958 |
| | $ | 1,146 |
| | $ | 1,150 |
| | $ | 1,140 |
| | $ | 1,028 |
| | $ | 961 |
|
| System average unit volume (3)(4) | | $ | 1,179 |
| | $ | 1,169 |
| | $ | 1,070 |
| | $ | 1,017 |
| | $ | 1,000 |
| | $ | 1,156 |
| | $ | 1,179 |
| | $ | 1,169 |
| | $ | 1,070 |
| | $ | 1,017 |
|
| Change in company-operated same-store sales | | 1.7 | % | | 8.3 | % | | 5.7 | % | | 0.5 | % | | 3.2 | % | |
| Change in franchise-operated same-store sales (3) | | 1.1 | % | | 10.4 | % | | 6.3 | % | | 1.1 | % | | 1.9 | % | |
| Change in system same-store sales (3) | | 1.4 | % | | 9.3 | % | | 6.0 | % | | 0.8 | % | | 2.5 | % | |
| Capital expenditures | | $ | 96,615 |
| | $ | 86,226 |
| | $ | 60,525 |
| | $ | 84,690 |
| | $ | 80,200 |
| |
| Change in fiscal basis company-operated same-store sales (3) | | | (3.0 | )% | | 1.7 | % | | 8.3 | % | | 5.7 | % | | 0.5 | % |
| Change in fiscal basis franchise-operated same-store sales (3) | | | 0.3 | % | | 1.1 | % | | 10.4 | % | | 6.3 | % | | 1.1 | % |
| Change in fiscal basis system same-store sales (3) | | | (1.5 | )% | | 1.4 | % | | 9.3 | % | | 6.0 | % | | 0.8 | % |
| Capital expenditures (1) | | | $ | 67,453 |
| | $ | 96,615 |
| | $ | 86,226 |
| | $ | 60,525 |
| | $ | 84,690 |
|
| Balance Sheet Data (at end of period) (1): | | | | | | | | | | | | | | | | | | | | |
| Total assets | | $ | 1,348,791 |
| | $ | 1,303,979 |
| | $ | 1,270,665 |
| | $ | 1,319,209 |
| | $ | 1,463,725 |
| | $ | 1,228,421 |
| | $ | 1,345,012 |
| | $ | 1,303,979 |
| | $ | 1,270,665 |
| | $ | 1,319,209 |
|
| Long-term debt, excluding current maturities | | $ | 937,512 |
| | $ | 688,579 |
| | $ | 497,012 |
| | $ | 349,393 |
| | $ | 405,276 |
| |
| Stockholders’ (deficit) equity (5) | | $ | (217,206 | ) | | $ | 15,953 |
| | $ | 257,911 |
| | $ | 472,018 |
| | $ | 411,945 |
| |
| Long-term debt, net of current maturities (5) | | | $ | 1,080,932 |
| | $ | 935,372 |
| | $ | 688,579 |
| | $ | 497,012 |
| | $ | 349,393 |
|
| Stockholders’ (deficit) equity (6) | | | $ | (388,032 | ) | | $ | (217,206 | ) | | $ | 15,953 |
| | $ | 257,911 |
| | $ | 472,018 |
|
____________________________
| |
| (1) | Financial data was extracted or derived from our audited consolidated financial statements. |
| |
| (2) | Weighted-average shares reflect the impact of common stock repurchases under Board-approved programs. |
| |
| (3) | Changes in same-store sales and average unit volumes are presented for franchise restaurants and on a system-wide basis, which includes company and franchise restaurants. Franchise sales represent sales at franchise restaurants and are revenues of our franchisees. We do not record franchise sales as revenues; however, our royalty revenues and percentage rent revenues are calculated based on a percentage of franchise sales. We believe franchise and system sales growth and average unit volume information is useful to investors as a significant indicator of the overall strength of our business as it incorporates our significant revenue drivers which are company and franchise same-store sales as well as net unit development. Company, franchise and system changes in same-store sales include the results of all restaurants that have been open more than one year. |
| |
| (4) | 2016 average unit volume is adjusted to exclude the 53rd week for the purpose of comparison to prior years.purposes. |
| |
| (5) | Amounts in 2017 and 2016 are net of $639 and $2,140 of term loan debt issuance costs, respectively, due to the adoption of new authoritative accounting guidance on the presentation of debt issuance costs. For additional information, refer to Note 1, Nature of Operations and Summary of Significant Accounting Policies, of the notes to the consolidated financial statements. |
| |
| (6) | In 2016, the Company began to accumulate a stockholders’ deficit related to the execution of our share repurchase programs authorized by our Board of Directors. |
| |
ITEM 7. | MANAGEMENT’S DISCUSSION AND ANALYSIS OF FINANCIAL CONDITION AND RESULTS OF OPERATIONS |
GENERAL
For an understanding of the significant factors that influenced our performance during the past three fiscal years, we believe our Management’s Discussion and Analysis of Financial Condition and Results of Operations (“MD&A”) should be read in conjunction with the consolidated financial statements and related notes included in this annual report as indexed on page F-1.
Comparisons under this heading refer to the 5352-week period ended October 1, 2017, the 53-week period ended October 2, 2016, and the 52-week periodsperiod ended September 27, 2015 and September 28, 2014for fiscal years 20162017, 20152016 and 20142015, respectively, unless otherwise indicated.
Our MD&A consists of the following sections:
Overview — a general description of our business and fiscal 20162017 highlights.
Financial reporting — a discussion of changes in presentation, if any.
Results of operations — an analysis of our consolidated statements of earnings for the three years presented in our consolidated financial statements.
Liquidity and capital resources — an analysis of our cash flows including pension and postretirement health contributions, capital expenditures, sale of company-operated restaurants, our credit facility, share repurchase activity, dividends, aggregate contractual obligations, known trends that may impact liquidity and the impact of inflation, if applicable.
Discussion of critical accounting estimates — a discussion of accounting policies that require critical judgments and estimates.
New accounting pronouncements — a discussion of new accounting pronouncements, dates of implementation and the impact on our consolidated financial position or results of operations, if any.
We have included in our MD&A certain performance metrics that management uses to assess company performance and which we believe will be useful in analyzing and understanding our results of operations. These metrics include the following:
Changeschanges in sales at restaurants open more than one year (“same-store sales”) and average unit volumes (“AUVs”). Same-store sales and AUVs are presented for franchised restaurants and on a system-wide basis, which includes company and franchise restaurants. Franchise sales represent sales at franchise restaurants and are revenues of our franchisees. We do not record franchise sales as revenues; however, our royalty revenues and percentage rent revenues are calculated based on a percentage of franchise sales. We believe franchise and system same-store sales and AUV information is useful to investors as a significant indicator of the overall strength of our business.
Company restaurant margin (“restaurant margin”)Due to the transition from a 53-week year in fiscal 2016 to a 52-week year in fiscal 2017, year-over-year same-store sales comparisons are off by one week. As such, we have included changes in same-store sales on a calendar basis to provide a clearer comparison. Same-store sales data that matches the periods presented in our financial statements is definedreferred to as company restaurant sales less expenses incurred directly by our restaurants in generating those sales (food and packaging costs, payroll and employee benefits costs, and occupancy and other costs). We also present restaurant margin as a percentage of company restaurantfiscal basis same-store sales.
Franchise margin is defined as franchise rental revenues and franchise royalties and other, less franchise occupancy expenses, and franchise support and other costs, and is also presented as a percentage of franchise revenues.
Same-store sales AUVs, restaurant margin, and franchise marginAUVs are not measurements determined in accordance with generally accepted accounting principles (“GAAP”) and should not be considered in isolation, or as an alternative to income from operations, or other similarly titled measures of other companies.
OVERVIEW
As of October 2, 2016,1, 2017, we operated and franchised 2,2552,251 Jack in the Box quick-service restaurants, primarily in the western and southern United States, including one in Guam, and 699726 Qdoba fast-casual restaurants operating primarily throughout the United States as well as the District of Columbia and Canada.
Our primary source of revenue is from retail sales at Jack in the Box and Qdoba company-operated restaurants. We also derive revenue from Jack in the Box and Qdoba franchise restaurants, including rental revenue, royalties (based upon a percent of sales) and franchise fees. In addition, we recognize gains or losses from the sale of company-operated restaurants to franchisees, which are included as a line item within operating costs and expenses, net in the accompanying consolidated statements of earnings.
The following summarizes the most significant events occurring in fiscal 20162017, and certain trends compared to prior years:year:
Calendar Basis Same-Store Sales —Same-store Calendar basis same-store sales were flatincreased 0.5% at company-operated Jack in the Box system restaurants as the impact of menu price increases offset a decline in transactions. Qdoba’s same-store sales increase of 1.7% at company-operated restaurants was driven primarily by transaction growth, menu price increases and catering.
Commodity Costs— Commodity costs decreased approximately 3.0% and 4.4% in 2016 at our Jack in the Box and Qdoba restaurants, respectively, compared with a year ago. Beef represents the largest portion, or approximately 20%, of the Company’s overall commodity spend. We typically do not enter into fixed price contracts for our beef needs. In 2017, we currently expect our beef costs to be slightly deflationary asago primarily driven by an increase in franchise restaurant AUVs. Qdoba’s calendar basis same-store sales decreased 3.0% at company-operated restaurants compared to fiscal 2016. We expect our overall commodity costswith a year ago driven primarily by declines in fiscal 2017 to be approximately flat to down 1% at both our Jacktraffic, partially offset by an increase in the Boxaverage check and Qdoba restaurants.growth in catering sales.
Company Restaurant MarginsOperations — Our consolidated company-operatedcompany restaurant margin decreasedcosts as a percentage of company restaurant sales increased to 82.4% from 79.8% in 2016 to 20.2% from 20.4% in 2015.the prior year. Jack in the Box’s company-operatedcompany restaurant margin improvedcosts as a percentage of company restaurant sales increased to 79.9% from 78.8% in 2016 to 21.2% from 20.7% in 2015the prior year due primarily to lowersales deleverage, higher labor costs for foodrelated to wage inflation, and packaginghigher maintenance and repair costs, partially offset by the benefits of refranchising partially offset by minimum wage increasescompleted in California that went into effect2017. Qdoba company restaurant costs as a percentage of company restaurant sales increased to 86.4% from 81.9% in January 2016, and by higher costs for equipment upgrades. Restaurant margins at our Qdoba company-operated restaurants decreased in 2016 to 18.1% from 19.7% in 2015the prior year primarily reflecting sales deleverage, an increase in food costs, and an increase in labor costs primarily related to the impact of new restaurant activity, unfavorable product mix including higher levelsopenings and wage inflation.
Jack in the Box Franchise Operations — Franchise costs as a percent of discounting,franchise revenues decreased to 47.3%, from 48.5% in the prior year, primarily driven by an increase in franchise fees resulting from the sale of 178 company-operated restaurants to franchisees, and highera decrease in franchise support costs for equipment upgrades.primarily due to savings realized in connection with our restructuring plan.
Jack in the Box Franchising Program — In 2016,Jack in the Box franchisees opened a total of 1218 restaurants. As part of our refranchising strategy, we sold 178 company-operated restaurants to franchisees in several different markets during 2017 generating proceeds of $99.4 million. Our Jack in the Box system was 82%88% franchised at the end of fiscal 2016.2017. We plan to increase franchise ownership of the system to over 90%approximately 95%. InSubsequent to the end of fiscal 2017, we expectsigned non-binding letters of intent with franchisees to open approximately 20-25 newsell 32 company-operated restaurants in several markets with estimated pre-tax gross proceeds of $17.5 million to $18.0 million.
Jack in the Box Acquisition of Franchise-Operated Restaurants — We acquired 50 franchise-operated Jack in the Box restaurants the majorityfrom two franchisees for total consideration of $15.9 million, of which will be franchise locations.$13.8 million was non-cash. In the third quarter of 2017, we took back 31 restaurants as the result of an agreement with an underperforming franchisee who voluntarily agreed to turn over the restaurants. The additional 19 restaurants acquired in 2017 were the result of a legal action filed in September 2013 against a franchisee in which we obtained a judgment in January 2017 granting the Company possession of the restaurants.
Qdoba New Unit Growth —In 2016 we We opened 3523 company-operated restaurants and franchisees opened 1819 restaurants, of which six14 were in non-traditional locations such as airportsmilitary bases and college campuses. In fiscal 2017, 60-70 new Qdoba restaurants are expected to open system-wide, of which approximately 40 are expected to be company-operated locations
Restructuring Costs (including costs related to the Qdoba Evaluation) — In 2016, we announced a plan to reduce our general and administrative costs. Furthermore, during 2017, we retained Morgan Stanley & Co. LLC to assist our Board of Directors in its evaluation of potential alternatives with respect to Qdoba (the “Qdoba Evaluation”), as well as other ways to enhance shareholder value. In connection with this plan,these activities, we have recorded $10.1$8.8 million of restructuring charges, including $5.3 million related to the Qdoba Evaluation, which are included in impairment and other charges, net in the accompanying consolidated statements of earnings.
Pension Contribution — In September 2016, we made an $80.0 million tax-deductible accelerated contribution to our qualified defined benefit pension plan to reduce future pension costs including our exposure to Pension Benefit Guaranty Corporation (“PBGC”) variable-rate premiums that are paid on the unfunded portion of our pension liability, and to improve the funded status of the plan.
Credit Facility— In September 2016, we amended our existing credit facility to increase our overall borrowing capacity by $400.0 million to $1.6 billion, consisting of a $900.0 million revolving credit agreement and a $700.0 million term loan, both maturing in March 2019.
Return of Cash to Shareholders — During 2016, we continued to returnWe returned cash to shareholders in the form of share repurchases and quarterly cash dividends. We repurchased 3.93.2 million shares of our common stock at an average price of $75.29$101.59 per share, totaling $291.9$327.2 million, including the cost of brokerage fees. We also declared dividends of $1.20$1.60 per share totaling $40.5$49.2 million.
FINANCIAL REPORTING
During fiscal 2012, we entered into an agreement to outsource our Jack in the Box distribution business. In fiscal 2013, we closed 62 Qdoba restaurants (the “2013 Qdoba Closures”) as part of a comprehensive Qdoba market performance review. All charges related to our distribution business and the 2013 Qdoba Closures are reported as discontinued operations for all periods presented. Refer to Note 2, Discontinued Operations, in the notes to consolidated financial statements for additional information. Unless otherwise noted, amounts and disclosures throughout our MD&A relate to our continuing operations.
In 2016,fiscal 2017, we adopted an Accounting Standards Update (“ASU”) which simplifieschanges the presentation of deferred income taxes and requires deferred tax liabilities and assetsdebt issuance costs on the balance sheet. Under this ASU, debt issuance costs are to be classifiedpresented on the balance sheet as non-current in a classified statement of financial position. Upon adoption, wedirect deduction from the related debt liability rather than as an asset. We retrospectively applied the new standardadopted this guidance which resulted in a $40.0 millionthe reclassification of current deferred income taxes to$3.8 million in debt issuance costs from other assets, net onto current maturities of long-term debt and long-term debt, net of current maturities in the amount of $1.6 million and $2.2 million, respectively, in our September 27, 2015October 2, 2016 consolidated balance sheet. Refer to Note 1, Nature of Operations and Summary of Significant Accounting Policies, in the notes to consolidated financial statements for more information.
RESULTS OF OPERATIONS
The following table presents certain income and expense items included in our consolidated statements of earnings as a percentage of total revenues, unless otherwise indicated. Percentages may not add due to rounding.
CONSOLIDATED STATEMENTS OF EARNINGS DATA
| | | | | Fiscal Year | | Fiscal Year |
| | | 2016 | | 2015 | | 2014 | | 2017 | | 2016 | | 2015 |
| Revenues: | | | | | | | | | | | | |
| Company restaurant sales | | 75.3 | % | | 75.1 | % | | 75.5 | % | | 74.2 | % | | 75.3 | % | | 75.1 | % |
| Franchise rental revenues | | 14.6 | % | | 14.7 | % | | 14.6 | % | | 14.9 | % | | 14.6 | % | | 14.7 | % |
| Franchise royalties and other | | 10.1 | % | | 10.2 | % | | 9.8 | % | | 10.9 | % | | 10.1 | % | | 10.2 | % |
| Total revenues | | 100.0 | % | | 100.0 | % | | 100.0 | % | | 100.0 | % | | 100.0 | % | | 100.0 | % |
| Operating costs and expenses, net: | | | | | | | | | | | | |
| Company restaurant costs: | | | | | | | | | | | | |
| Food and packaging (1) | | 30.1 | % | | 31.3 | % | | 31.9 | % | | 30.1 | % | | 30.1 | % | | 31.3 | % |
| Payroll and employee benefits (1) | | 27.8 | % | | 27.1 | % | | 27.5 | % | | 28.9 | % | | 27.8 | % | | 27.1 | % |
| Occupancy and other (1) | | 21.9 | % | | 21.3 | % | | 22.1 | % | | 23.3 | % | | 21.9 | % | | 21.3 | % |
| Total company restaurant costs (1) | | 79.8 | % | | 79.6 | % | | 81.5 | % | | 82.4 | % | | 79.8 | % | | 79.6 | % |
| Franchise occupancy expenses (2) | | 73.1 | % | | 75.0 | % | | 77.8 | % | | 74.1 | % | | 73.1 | % | | 75.0 | % |
| Franchise support and other costs (3) | | 9.9 | % | | 10.0 | % | | 9.5 | % | | 8.4 | % | | 9.9 | % | | 10.0 | % |
| Selling, general and administrative expenses | | 12.7 | % | | 14.4 | % | | 13.9 | % | | 10.7 | % | | 12.7 | % | | 14.4 | % |
| Impairment and other charges, net | | 1.2 | % | | 0.8 | % | | 1.0 | % | | 1.6 | % | | 1.2 | % | | 0.8 | % |
| (Gains) losses on the sale of company-operated restaurants | | (0.1 | )% | | 0.2 | % | | 0.2 | % | | (2.4 | )% | | (0.1 | )% | | 0.2 | % |
| Earnings from operations | | 14.4 | % | | 12.8 | % | | 10.9 | % | | 17.1 | % | | 14.4 | % | | 12.8 | % |
| Income tax rate (4) | | 36.5 | % | | 36.9 | % | | 35.3 | % | | 37.0 | % | | 36.5 | % | | 36.9 | % |
____________________________
| |
| (1) | As a percentage of company restaurant sales. |
| |
| (2) | As a percentage of franchise rental revenues. |
| |
| (3) | As a percentage of franchise royalties and other. |
| |
| (4) | As a percentage of earnings from continuing operations and before income taxes. |
CHANGES IN SAME-STORE SALES
| | | | | | | | | | Fiscal Year |
| | | Fiscal Year | | Calendar Basis | | Fiscal Basis |
| | | 2016 | | 2015 | | 2014 | | 2017 | | 2017 | | 2016 | | 2015 |
| Jack in the Box: | | | | | | | | | |
| Company | | 0.0% | | 5.1% | | 2.0% | | (1.1 | )% | | (1.3 | )% | | 0.0 | % | | 5.1 | % |
| Franchise | | 1.6% | | 7.0% | | 2.0% | | 0.9 | % | | 0.9 | % | | 1.6 | % | | 7.0 | % |
| System | | 1.2% | | 6.5% | | 2.0% | | 0.5 | % | | 0.5 | % | | 1.2 | % | | 6.5 | % |
| Qdoba: | | | | | | | | | |
| Company | | 1.7% | | 8.3% | | 5.7% | | (3.0 | )% | | (3.0 | )% | | 1.7 | % | | 8.3 | % |
| Franchise | | 1.1% | | 10.4% | | 6.3% | | 0.4 | % | | 0.3 | % | | 1.1 | % | | 10.4 | % |
| System | | 1.4% | | 9.3% | | 6.0% | | (1.4 | )% | | (1.5 | )% | | 1.4 | % | | 9.3 | % |
The following table summarizes the changes in Jack in the Box and Qdoba company-operated same-store sales:
|
| | | | | | | | | | | | |
| | | Fiscal Year |
| | | Calendar Basis | | Fiscal Basis |
| | | 2017 | | 2017 | | 2016 | | 2015 |
| Jack in the Box: | | | | | | | | |
| Transactions | | (5.2 | )% | | (5.5 | )% | | (2.9 | )% | | 0.9 | % |
| Average check (1) | | 4.1 | % | | 4.2 | % | | 2.9 | % | | 4.2 | % |
| Change in same-store sales | | (1.1 | )% | | (1.3 | )% | | 0.0 | % | | 5.1 | % |
| Qdoba: | | | | | | | | |
| Transactions | | (4.8 | )% | | (4.8 | )% | | 1.5 | % | | (0.1 | )% |
| Average Check (2) | | 1.1 | % | | 1.1 | % | | (0.4 | )% | | 7.3 | % |
| Catering | | 0.7 | % | | 0.7 | % | | 0.6 | % | | 1.1 | % |
| Change in same-store sales | | (3.0 | )% | | (3.0 | )% | | 1.7 | % | | 8.3 | % |
____________________________
| |
| (1) | Amounts in 2017 on a calendar and fiscal basis include price increases of approximately 2.2%. Amounts in 2016 and 2015 include price increases of approximately 3.0% and 2.2%, respectively. |
| |
| (2) | Amounts in 2017 on a calendar and fiscal basis include price increases of 0.3%. Amounts in 2016 and 2015 include price increases of approximately 1.0% and 0.2%, respectively. |
The following table summarizes the changes in the number and mix of Jack in the Box (“JIB”) and Qdoba company and franchise restaurants in each fiscal year:
| | | | | 2016 | | 2015 | | 2014 | | 2017 | | 2016 | | 2015 |
| | | Company | | Franchise | | Total | | Company | | Franchise | | Total | | Company | | Franchise | | Total | | Company | | Franchise | | Total | | Company | | Franchise | | Total | | Company | | Franchise | | Total |
| Jack in the Box: | | | | | | | | | | | | | | | | | | | | | | | | | | | | | | | | | | | | |
| Beginning of year | | 413 |
| | 1,836 |
| | 2,249 |
| | 431 |
| | 1,819 |
| | 2,250 |
| | 465 |
| | 1,786 |
| | 2,251 |
| | 417 |
| | 1,838 |
| | 2,255 |
| | 413 |
| | 1,836 |
| | 2,249 |
| | 431 |
| | 1,819 |
| | 2,250 |
|
| New | | 4 |
| | 12 |
| | 16 |
| | 2 |
| | 16 |
| | 18 |
| | 1 |
| | 11 |
| | 12 |
| | 2 |
| | 18 |
| | 20 |
| | 4 |
| | 12 |
| | 16 |
| | 2 |
| | 16 |
| | 18 |
|
| Refranchised | | (1 | ) | | 1 |
| | — |
| | (21 | ) | | 21 |
| | — |
| | (37 | ) | | 37 |
| | — |
| | (178 | ) | | 178 |
| | — |
| | (1 | ) | | 1 |
| | — |
| | (21 | ) | | 21 |
| | — |
|
| Acquired from franchisees | | 1 |
| | (1 | ) | | — |
| | 7 |
| | (7 | ) | | — |
| | 4 |
| | (4 | ) | | — |
| | 50 |
| | (50 | ) | | — |
| | 1 |
| | (1 | ) | | — |
| | 7 |
| | (7 | ) | | — |
|
| Closed | | — |
| | (10 | ) | | (10 | ) | | (6 | ) | | (13 | ) | | (19 | ) | | (2 | ) | | (11 | ) | | (13 | ) | | (15 | ) | | (9 | ) | | (24 | ) | | — |
| | (10 | ) | | (10 | ) | | (6 | ) | | (13 | ) | | (19 | ) |
| End of year | | 417 |
| | 1,838 |
| | 2,255 |
| | 413 |
| | 1,836 |
| | 2,249 |
| | 431 |
| | 1,819 |
| | 2,250 |
| | 276 |
| | 1,975 |
| | 2,251 |
| | 417 |
| | 1,838 |
| | 2,255 |
| | 413 |
| | 1,836 |
| | 2,249 |
|
| % of JIB system | | 18 | % | | 82 | % | | 100 | % | | 18 | % | | 82 | % | | 100 | % | | 19 | % | | 81 | % | | 100 | % | | 12 | % | | 88 | % | | 100 | % | | 18 | % | | 82 | % | | 100 | % | | 18 | % | | 82 | % | | 100 | % |
| Qdoba: | | | | | | | | | | | | | | | | | | | | | | | | | | | | | | | | | | | | |
| Beginning of year | | 322 |
| | 339 |
| | 661 |
| | 310 |
| | 328 |
| | 638 |
| | 296 |
| | 319 |
| | 615 |
| | 367 |
| | 332 |
| | 699 |
| | 322 |
| | 339 |
| | 661 |
| | 310 |
| | 328 |
| | 638 |
|
| New | | 35 |
| | 18 |
| | 53 |
| | 17 |
| | 22 |
| | 39 |
| | 16 |
| | 22 |
| | 38 |
| | 23 |
| | 19 |
| | 42 |
| | 35 |
| | 18 |
| | 53 |
| | 17 |
| | 22 |
| | 39 |
|
| Acquired from franchisees | | 14 |
| | (14 | ) | | — |
| | — |
| | — |
| | — |
| | — |
| | — |
| | — |
| | — |
| | — |
| | — |
| | 14 |
| | (14 | ) | | — |
| | — |
| | — |
| | — |
|
| Closed | | (4 | ) | | (11 | ) | | (15 | ) | | (5 | ) | | (11 | ) | | (16 | ) | | (2 | ) | | (13 | ) | | (15 | ) | | (5 | ) | | (10 | ) | | (15 | ) | | (4 | ) | | (11 | ) | | (15 | ) | | (5 | ) | | (11 | ) | | (16 | ) |
| End of year | | 367 |
| | 332 |
| | 699 |
| | 322 |
| | 339 |
| | 661 |
| | 310 |
| | 328 |
| | 638 |
| | 385 |
| | 341 |
| | 726 |
| | 367 |
| | 332 |
| | 699 |
| | 322 |
| | 339 |
| | 661 |
|
| % of Qdoba system | | 53 | % | | 47 | % | | 100 | % | | 49 | % | | 51 | % | | 100 | % | | 49 | % | | 51 | % | | 100 | % | | 53 | % | | 47 | % | | 100 | % | | 53 | % | | 47 | % | | 100 | % | | 49 | % | | 51 | % | | 100 | % |
| Consolidated: | | | | | | | | | | | | | | | | | |
| | | | | | | | | | | | | | | | | |
|
| Total system | | 784 |
| | 2,170 |
| | 2,954 |
| | 735 |
| | 2,175 |
| | 2,910 |
| | 741 |
| | 2,147 |
| | 2,888 |
| | 661 |
| | 2,316 |
| | 2,977 |
| | 784 |
| | 2,170 |
| | 2,954 |
| | 735 |
| | 2,175 |
| | 2,910 |
|
| % of consolidated system | | 27 | % | | 73 | % | | 100 | % | | 25 | % | | 75 | % | | 100 | % | | 26 | % | | 74 | % | | 100 | % | | 22 | % | | 78 | % | | 100 | % | | 27 | % | | 73 | % | | 100 | % | | 25 | % | | 75 | % | | 100 | % |
Jack in the Box Brand
Company Restaurant Operations
The following table presents Jack in the Box company restaurant sales, costs, and margin, and restaurant costs and margin as a percentage of the related sales.sales in each fiscal year. Percentages may not add due to rounding (dollars in thousands):
| | | | | 2016 | | 2015 | | 2014 | | 2017 | | 2016 | | 2015 |
| Company restaurant sales | | $ | 789,040 |
| | | | $ | 782,525 |
| | | | $ | 782,461 |
| | | | $ | 715,921 |
| | | | $ | 789,040 |
| | | | $ | 782,525 |
| | |
| Company restaurant costs: | | | | | | | | | | | | | | | | | | | | | | | | |
| Food and packaging | | 235,538 |
| | 29.9 | % | | 247,931 |
| | 31.7 | % | | 254,891 |
| | 32.6 | % | | 206,653 |
| | 28.9 | % | | 235,538 |
| | 29.9 | % | | 247,931 |
| | 31.7 | % |
| Payroll and employee benefits | | 223,019 |
| | 28.3 | % | | 215,598 |
| | 27.6 | % | | 218,000 |
| | 27.9 | % | | 211,611 |
| | 29.6 | % | | 223,019 |
| | 28.3 | % | | 215,598 |
| | 27.6 | % |
| Occupancy and other | | 162,869 |
| | 20.6 | % | | 157,281 |
| | 20.1 | % | | 164,433 |
| | 21.0 | % | | 153,451 |
| | 21.4 | % | | 162,869 |
| | 20.6 | % | | 157,281 |
| | 20.1 | % |
| Total company restaurant costs | | 621,426 |
| | 78.8 | % | | 620,810 |
| | 79.3 | % | | 637,324 |
| | 81.5 | % | | $ | 571,715 |
| | 79.9 | % | | $ | 621,426 |
| | 78.8 | % | | $ | 620,810 |
| | 79.3 | % |
| Restaurant margin | | $ | 167,614 |
| | 21.2 | % | | $ | 161,715 |
| | 20.7 | % | | $ | 145,137 |
| | 18.5 | % | |
Company restaurant sales decreased $73.1 million in 2017 and increased $6.5 million in 2016 and $0.1 million in 2015 as compared with the respective prior year. In 2017, the decrease was primarily driven by a decrease in the average number of restaurants resulting from the execution of our refranchising strategy, additional sales in 2016 higher AUVsfrom a 53rd week and, to a lesser extent, a decrease in traffic, partially offset by menu price increases and favorable product mix. In 2016, the increase was primarily driven by additional sales from a 53rd week in 2016 wereand higher AUVs, partially offset by a decrease in sales attributable to the execution of our refranchising strategy which includes the sale of restaurants to franchisees. In 2015, higher AUV growth was offset by a decrease in the average number of company-operated restaurants relatedattributable to the execution of our refranchising strategy.refranchising. The following table presents the approximate impact of these (decreases) increases (decreases) on Jack in the Box company restaurant sales (in millions):
| | | | | 2016 vs. 2015 | | 2015 vs. 2014 | | 2017 vs. 2016 | | 2016 vs. 2015 |
| Decrease in the average number of restaurants | | $ | (13.9 | ) | | $ | (68.7 | ) | | $ | (59.5 | ) | | $ | (13.9 | ) |
| 53rd week | | | (15.1 | ) | | 15.1 |
|
| AUV increase | | 5.3 |
| | 68.8 |
| | 1.5 |
| | 5.3 |
|
| 53rd week | | 15.1 |
| | — |
| |
| Total increase in company restaurant sales | | $ | 6.5 |
| | $ | 0.1 |
| |
| Total (decrease) increase in company restaurant sales | | | $ | (73.1 | ) | | $ | 6.5 |
|
Same-storeFiscal basis same-store sales at Jack in the Box company-operated restaurants were flatdecreased 1.3% in 20162017 compared with 20152016 as a decline in transactions was partially offset by menu price increases and favorable mix. In 2016, menu price increases were offset by a decline in transactions. In 2015, menu price increases, favorable product mix changes and an increasetransactions resulting in transactions drove same-store sales 5.1% higher thanflat same store sames as compared to the prior year. The following table summarizes the change in company-operated fiscal basis same-store sales:
| | | | | Increase/(Decrease) | | Increase/(Decrease) |
| | | 2016 vs. 2015 | | 2015 vs. 2014 | | 2017 vs. 2016 | | 2016 vs. 2015 |
| Transactions | | | (5.5 | )% | | (2.9 | )% |
| Average check (1) | | 2.9 | % | | 4.2 | % | | 4.2 | % | | 2.9 | % |
| Transactions | | (2.9 | )% | | 0.9 | % | |
| Change in same-store sales | | 0.0 | % | | 5.1 | % | | (1.3 | )% | | 0.0 | % |
____________________________
| |
| (1) | Includes price increases of approximately 2.2% and 3.0% in 2017 and 2.2% in 2016, and 2015, respectively. |
Food and packaging costs as a percentage of company restaurant sales decreased to 28.9% in 2017 from 29.9% in 2016, fromand 31.7% in 2015,2015. In 2017, the decrease was driven by menu price increases and 32.6% in 2014.favorable product mix changes. In 2016, the decrease was driven by lower commodity costs, favorable product mix, and menu price increases.
In 2015,2017, commodity costs decreased approximately 0.3% as lower costs for eggs, produce and cheese were partially offset by higher costs for beverages, beef, potatoes and poultry. Beef, our most significant commodity, increased by approximately 1.8% in 2017 compared with a decrease of 18% in 2016 versus the benefits of menu price increases and product mix changes more than offset higher commodity costs.
prior year. In 2016, commodity costs decreased 3.0% as lower costs for beef were partially offset by higher costs for pork, poultry and produce. Beef decreased most significantly by approximately18% in 2016 compared with a 10% increase in 2015 versus the prior year. In 2015, commodity costs increased 1.3% as higher costs for beef, eggs and produce were partially offset by lower costs for pork and shortening. For fiscal 2017, we currently expect commodity costs to be approximately flat to down 1% at Jack in the Box restaurants as compared with fiscal 2016.
Payroll and employee benefit costs as a percentage of company restaurant sales increased to 29.6% in 2017 from 28.3% in 2016, fromand 27.6% in 2015, which decreased2015. In 2017, the increase was primarily due to wage inflation resulting from 27.9%an increase in 2014.the minimum wage in certain markets, highly competitive labor markets, and labor management, and an increase in worker’s compensation costs during the year. In 2016, higher wages from minimum wage increases were partially offset by lower levels of incentive compensation driven by operating results, and by the benefits of refranchising.
Occupancy and other costs decreased $9.4 million in 2017 compared to 2016 and increased $5.6 million in 2016 as compared to 2015. In 2015, sales leverage,2017 the benefitsdecrease was primarily the result of refranchising and lower costs for group insurance driven by favorable claim trends were partially offset by higher wages from minimum wage increases, unfavorable development trends associated with workers’ compensation claims, and an increasea decrease in incentive compensation driven by strong operating performance.
As a percentagethe average number of company restaurant sales,restaurants, impacting occupancy and other costs increased to 20.6%by approximately $12.8 million, and additional costs of approximately $3.2 million in 2016 from 20.1% in 2015, which decreased from 21.0% in 2014.a 53rd week, partially offset by approximately $4.2 million of higher maintenance and repair expenses and, to a lesser extent, higher utility costs. In 2016, the increase is related to higher costs for equipment upgrades of approximately $3.7 million, additional costs resulting from a 53rd week, and to a lesser extent higher costs for maintenance and repair expenses were partially offset by a decrease in the number of company operated restaurants of approximately $2.9 million and lower costs for utilities and the benefits of refranchising. The decrease in 2015 was related to sales leverage and the benefits of refranchising, partially offset by higher costs for credit card fees, maintenance and repair expenses and equipment costs due to beverage and technology upgrades at our restaurants.
utilities.
Jack in the Box Franchise Operations
The following table presents Jack in the Box franchise revenues costs, and margincosts in each fiscal year and other information we believe is useful in analyzing the change in franchise operating results (dollars in thousands):
| | | | | 2016 | | 2015 | | 2014 | | 2017 | | 2016 | | 2015 |
| Franchise rental revenues | | $ | 232,794 |
| | $ | 226,494 |
| | $ | 216,944 |
| | $ | 231,578 |
| | $ | 232,794 |
| | $ | 226,494 |
|
| | | | | | | | | | | | | |
| Royalties | | 138,424 |
| | 133,726 |
| | 124,538 |
| | 141,457 |
| | 138,424 |
| | 133,726 |
|
| Re-image contributions to franchisees | | — |
| | — |
| | (22 | ) | |
| Franchise fees and other | | 2,000 |
| | 2,431 |
| | 3,323 |
| | 8,334 |
| | 2,000 |
| | 2,431 |
|
| Franchise royalties and other | | 140,424 |
| | 136,157 |
| | 127,839 |
| | 149,791 |
| | 140,424 |
| | 136,157 |
|
| Total franchise revenues | | 373,218 |
| | 362,651 |
| | 344,783 |
| | 381,369 |
| | 373,218 |
| | 362,651 |
|
| | | | | | | | | | | | | |
| Rental expense | | 137,706 |
| | 136,782 |
| | 134,975 |
| | 140,623 |
| | 137,706 |
| | 136,782 |
|
| Depreciation and amortization | | 32,344 |
| | 33,128 |
| | 33,844 |
| | 30,860 |
| | 32,344 |
| | 33,128 |
|
| Franchise occupancy expenses | | 170,050 |
| | 169,910 |
| | 168,819 |
| | 171,483 |
| | 170,050 |
| | 169,910 |
|
| Franchise support and other costs | | 11,107 |
| | 11,726 |
| | 10,052 |
| | 8,811 |
| | 11,107 |
| | 11,726 |
|
| Total franchise costs | | 181,157 |
| | 181,636 |
| | 178,871 |
| | $ | 180,294 |
| | $ | 181,157 |
| | $ | 181,636 |
|
| Franchise margin | | $ | 192,061 |
| | $ | 181,015 |
| | $ | 165,912 |
| |
| Franchise margin as a % of franchise revenue | | 51.5 | % | | 49.9 | % | | 48.1 | % | |
| Franchise costs as a % of total franchise revenues | | | 47.3 | % | | 48.5 | % | | 50.1 | % |
| | | | | | | | | | | | | |
| Average number of franchise restaurants | | 1,838 |
| | 1,828 |
| | 1,794 |
| | 1,867 |
| | 1,838 |
| | 1,828 |
|
| % increase | | 0.5 | % | | 1.9 | % | | 4.2 | % | | 1.6 | % | | 0.5 | % | | |
| Franchise restaurant AUV (1) | | $ | 1,454 |
| | $ | 1,429 |
| | $ | 1,337 |
| | $ | 1,475 |
| | $ | 1,454 |
| | $ | 1,429 |
|
| Increase in franchise-operated same-store sales | | 1.6 | % | | 7.0 | % | | 2.0 | % | | 0.9 | % | | 1.6 | % | | 7.0 | % |
| Royalties as a percentage of franchise restaurant sales | | 5.1 | % | | 5.1 | % | | 5.2 | % | |
| Royalties as a percentage of total franchise restaurant sales | | | 5.1 | % | | 5.1 | % | | 5.1 | % |
____________________________
(1) 2016 AUV is adjusted to exclude the 53rd week for the purpose of comparison to prior years.purposes.
Franchise rental revenues decreased $1.2 million, or 0.5%, in 2017, and increased $6.3 million, or 2.8%, in 2016 and $9.6 million, or 4.4%, in 2015 as compared with the respective prior year,year. In 2017, the decrease is primarily reflectingdue to an additional $4.4 million of rental revenues in 2016 from a 53rd week, partially offset by additional rental revenues of approximately $1.6 million in 2017 resulting from the net increase in the average number of restaurants leased or subleased from the Company due to our refranchising strategy, and, to a lesser extent, an increase in AUVs on a comparable 52 week basis. In 2016, the increase primarily reflected additional rent revenue from a 53rd week, higher AUVs resulting in an increase in revenues from percentage rent, and increased rental income due to routine rent increases. In 2016, additional rent revenue of approximately $4.4 million from a 53rd week also contributed to the increase.
Franchise royalties and other increased $9.4 million, or 6.7%, in 2017, and $4.3 million, or 3.1%, in 2016 and $8.3 million, or 6.5%, in 2015 versus the respective prior year,year. In 2017, the increase primarily reflectingreflects additional franchise fees of $6.6 million related to the sale of 178 company-operated restaurants to franchisees during 2017, an increase in royalties of $3.1 million driven by an increase in the average number of franchise restaurants, and, to a lesser extent, an increase in AUVs on a comparable 52 week basis. These increases were offset by additional royalties in 2016 of approximately $2.6 million from a 53rd week. The increase in 2016 is primarily reflects additional royalties from the 53rd week and an increase in royalties driven by higher AUVs, and, in 2016, additional royalties of approximately $2.6 million from a 53rd week. These increases were partially offset by a reduction in franchise fees of $0.1 million and $0.7 million in 2016 and 2015, respectively.fees.
Franchise occupancy expenses, principally rents and depreciation on properties subleased or leased to franchisees, increased $1.4 million in 2017 and $0.1 million in 2016 as compared with the respective prior year. In 2017, the increase was primarily driven by an increase in the average number of company-operated restaurants, contributing additional costs of approximately $3.9 million, and $1.1a decrease of $2.4 million in 2015.favorable lease commitment adjustments related to previously refranchised markets based on sales performance over the prior year. These increases were partially offset by decreases related to additional costs of approximately $3.2 million in 2016 for a 53rd week, and a decrease in depreciation expense as our building assets become fully depreciated. In 2016, the increase relates to routine rent increases contributing to higher rental expense, and additional expenses of approximately $3.2 million
from a 53rd week. These increases were partially offset by lower depreciation expense as our building assets become fully depreciated and favorable lease commitment adjustments of $1.9 million related to previously refranchised markets based on sales performance over the first year resulting in higher rent. In 2015, the increase was due to higher rental expense related to customary rent increases partially offset by a decrease in depreciation expense related to building assets becoming fully depreciated, which more than offset the additional depreciation expense driven by our refranchising strategy.
Franchise support and other costs decreased $2.3 million in 2017 and $0.6 million in 2016 and increased $1.7 million in 2015 as compared with the respective prior year. In 2017, costs decreased primarily due to savings realized from our restructuring plan. In 2016, costs decreased due to a decrease in bad debt expense and incentive compensation. In 2015, costs increased due to an increase in the average number of franchise restaurants and the recognition of bad debt expense of $0.8 million.
Qdoba Brand
Company Restaurant Operations
The following table presents Qdoba company restaurant sales, costs, and margin, and restaurant costs and margin as a percentage of the related sales.sales in each fiscal year. Percentages may not add due to rounding (dollars in thousands):
| | | | | 2016 | | 2015 | | 2014 | | 2017 | | 2016 | | 2015 |
| Company restaurant sales | | $ | 415,495 |
| | | | $ | 374,338 |
| | | | $ | 338,451 |
| | | | $ | 436,558 |
| | | | $ | 415,495 |
| | | | $ | 374,338 |
| | |
| Company restaurant costs: | | | | | | | | | | | | | | | | | | | | | | | | |
| Food and packaging | | 127,464 |
| | 30.7 | % | | 114,057 |
| | 30.5 | % | | 102,447 |
| | 30.3 | % | | 140,291 |
| | 32.1 | % | | 127,464 |
| | 30.7 | % | | 114,057 |
| | 30.5 | % |
| Payroll and employee benefits | | 111,451 |
| | 26.8 | % | | 97,704 |
| | 26.1 | % | | 90,494 |
| | 26.7 | % | | 122,000 |
| | 27.9 | % | | 111,451 |
| | 26.8 | % | | 97,704 |
| | 26.1 | % |
| Occupancy and other | | 101,289 |
| | 24.4 | % | | 88,742 |
| | 23.7 | % | | 83,428 |
| | 24.6 | % | | 115,095 |
| | 26.4 | % | | 101,289 |
| | 24.4 | % | | 88,742 |
| | 23.7 | % |
| Total company restaurant costs | | 340,204 |
| | 81.9 | % | | 300,503 |
| | 80.3 | % | | 276,369 |
| | 81.7 | % | | $ | 377,386 |
| | 86.4 | % | | $ | 340,204 |
| | 81.9 | % | | $ | 300,503 |
| | 80.3 | % |
| Restaurant margin | | $ | 75,291 |
| | 18.1 | % | | $ | 73,835 |
| | 19.7 | % | | $ | 62,082 |
| | 18.3 | % | |
Company restaurant sales increased $21.1 million in 2017 and $41.2 million in 2016 and $35.9 million in 2015 as compared with the respective prior year. The increase in 2017 is primarily related to the net addition of 18 Qdoba company-operated restaurants since a year ago, partially offset by a decrease in traffic and additional sales in 2016 isfrom a 53rd week. In 2016, the increase primarily related to an increase in the average number of Qdoba company-operated restaurants, and to a lesser extent, growth in AUVs, and additional sales from a 53rd week. In 2015, the increase was driven byweek and growth in AUVs, and to a lesser extent, to an increase in the average number of restaurants.AUVs. The following table presents the approximate impact of these increases on company restaurant sales (in millions):
| | | | | 2016 vs. 2015 | | 2015 vs. 2014 | | 2017 vs. 2016 | | 2016 vs. 2015 |
| Increase in the average number of restaurants | | $ | 29.6 |
| | $ | 10.0 |
| | $ | 44.6 |
| | $ | 29.6 |
|
| AUV increase | | 3.4 |
| | 25.9 |
| |
| AUV (decrease) increase | | | (15.3 | ) | | 3.4 |
|
| 53rd week | | 8.2 |
| | — |
| | (8.2 | ) | | 8.2 |
|
| Total increase in company restaurant sales | | $ | 41.2 |
| | $ | 35.9 |
| | $ | 21.1 |
| | $ | 41.2 |
|
Same-storeFiscal basis same-store sales at Qdoba company-operated restaurants decreased 3.0% in 2017 and increased 1.7% in 20162016. In 2017, the decrease was driven by a decline in traffic, partially offset by catering growth and 8.3% in 2015.menu price increases. In 2016, the increase in same-store sales was primarily driven by transaction growth resulting from increased discounting, menu price increases and catering. In 2015, the increase in same-store sales was primarily driven by the new simplified menu pricing structure, and growth in catering sales. The following table summarizes the change in company-operated same-store sales:
| | | | | Increase/(Decrease) | | Increase/(Decrease) |
| | | 2016 vs. 2015 | | 2015 vs. 2014 | | 2017 vs. 2016 | | 2016 vs. 2015 |
| Transactions | | 1.5 | % | | (0.1 | )% | | (4.8 | )% | | 1.5 | % |
| Average check (1) | | (0.4 | )% | | 7.3 | % | | 1.1 | % | | (0.4 | )% |
| Catering | | 0.6 | % | | 1.1 | % | | 0.7 | % | | 0.6 | % |
| Increase in same-store sales | | 1.7 | % | | 8.3 | % | |
| Change in same-store sales | | | (3.0 | )% | | 1.7 | % |
____________________________
| |
| (1) | Includes price increases of approximately 0.3% and 1.0% in 2017 and 0.2% in 2016, and 2015, respectively. |
Food and packaging costs as a percentage of company restaurant sales increased to 32.1% in 2017 from 30.7% in 2016, fromand 30.5% in 2015,2015. In 2017, the increase was primarily driven by unfavorable product mix, operational inefficiencies and 30.3%higher commodity costs, partially offset by a decrease in 2014.discounting and menu price increases. In 2016, unfavorable product mix and higher discounting were partially offset by the benefit of lower commodity costs.
In 2015, higher2017, commodity costs were partially offset by the benefits from the new pricing structure.
In 2016, commodity costs decreased 4.4%increased approximately 0.5% at our Qdoba company-operated restaurants primarily due to lower costs for beef and poultry. Beef costs decreased most significantly by approximately 12% in 2016 compared with a 12% increase in 2015 versus the respective prior year. In 2015, commodity costs increased 1.4% due to higher costs for beef,avocados and produce, partially offset by lower costs for produce, porkbeef, tortillas and beans. For fiscalcheese. Costs for avocados increased most significantly by approximately 42% in 2017 we currently expect Qdobacompared with the prior year. In 2016, commodity costs decreased 4.4% primarily due to be approximately flat to down 1% compared with fiscal 2016.lower costs for beef and poultry.
Payroll and employee benefit costs as a percentage of company restaurant sales increased to 27.9% in 2017 from 26.8% in 2016, fromand 26.1% in 2015, which decreased from 26.7% in 2014.2015. The increase in 20162017 is driven primarily by the impact of new restaurant openings, wage inflation due to highly competitive labor markets, deleverage from a decrease in fiscal basis same-store sales and labor inefficiencies during the first half of the year. These increases were partially offset by lower insurance costs and lower levels of incentive compensation driven by operating results. Restaurants opened since fiscal 2015 negatively impacted payroll and employee benefit costs as a percentage of company restaurant sales by approximately 80 basis points in 2017. In 2016, the increase primarily relates to an increase in new restaurant openings and higher costs for workers’ compensation insurance as well as increases in labor staffing. InRestaurants opened since fiscal 2015 the decline primarily relates to leverage from same-store sales increasesnegatively impacted payroll and lower levels of incentive compensation, partially offset by increases in labor staffing.
Asemployee benefit costs as a percentage of company restaurant sales by approximately 50 basis points in 2016.
Occupancy and other costs increased $13.8 million in 2017 and $12.5 million in 2016 as compared with the respective prior year. In 2017, the higher costs were primarily driven by an increase in the number of company-operated restaurants, impacting occupancy and other costs increasedby approximately $11.8 million. To a lesser extent, the increase was driven by an increase of approximately $1.8 million in property rent due to 24.4%routine rent increases and higher average rent for new locations, as well as higher maintenance and repair expenses. These increases were partially offset by additional costs of approximately $2.1 million in 2016 from 23.7% in 2015, which decreased from 24.6% in 2014.a 53rd week. In 2016, the increase is related to higherin costs for equipment upgrades,were primarily driven by an increase in the number of company-operated restaurants, impacting occupancy and other costs by approximately $6.9 million, additional costs from a 53rd week, and higher per store average property rents primarily associated with new restaurants of approximately $1.6 million. To a lesser extent, the increase was driven by higher maintenance and repair costs, and higher costs for uniforms, whichequipment upgrades. These increases were partially offset by lower costs for utilities. In 2015, the decrease was primarily due to sales leverage, partially offset by higher costs for credit card fees, property rent,supplies and start up costs associated with a new catering call center.utilities.
Qdoba Franchise Operations
The following table presents Qdoba franchise revenues costs, and margincosts in each fiscal year and other information we believe is useful in analyzing the change in franchise operating results (dollars in thousands):
| | | | | 2016 | | 2015 | | 2014 | | 2017 | | 2016 | | 2015 |
| Franchise rental revenues | | $ | 113 |
| | $ | 208 |
| | $ | 238 |
| | $ | 109 |
| | $ | 113 |
| | $ | 208 |
|
| | | | | | | | | | | | | |
| Royalties | | 20,090 |
| | 19,033 |
| | 16,448 |
| | 18,545 |
| | 20,090 |
| | 19,033 |
|
| Franchise fees and other | | 1,375 |
| | 1,562 |
| | 1,750 |
| | 1,412 |
| | 1,375 |
| | 1,562 |
|
| Franchise royalties and other | | 21,465 |
| | 20,595 |
| | 18,198 |
| | 19,957 |
| | 21,465 |
| | 20,595 |
|
| Total franchise revenues | | 21,578 |
| | 20,803 |
| | 18,436 |
| | 20,066 |
| | 21,578 |
| | 20,803 |
|
| | | | | | | | | | | | | |
| Rental expense (1) | | 102 |
| | 192 |
| | 215 |
| | 108 |
| | 102 |
| | 192 |
|
| Franchise support and other costs | | 4,884 |
| | 3,962 |
| | 3,800 |
| | 5,411 |
| | 4,884 |
| | 3,962 |
|
| Total franchise costs | | 4,986 |
| | 4,154 |
| | 4,015 |
| | $ | 5,519 |
| | $ | 4,986 |
| | $ | 4,154 |
|
| Franchise margin | | $ | 16,592 |
| | $ | 16,649 |
| | $ | 14,421 |
| |
| Franchise margin as a % of franchise revenue | | 76.9 | % | | 80.0 | % | | 78.2 | % | |
| Franchise costs as a % of franchise revenue | | | 27.5 | % | | 23.1 | % | | 20.0 | % |
| | | | | | | | | | | | | |
| Average number of franchise restaurants | | 343 |
| | 333 |
| | 322 |
| | 336 |
| | 343 |
| | 333 |
|
| % increase | | 3.0 | % | | 3.4 | % | | 3.5 | % | |
| % (decrease) increase | | | (2.0 | )% | | 3.0 | % | | |
| Franchise restaurant AUV (2) | | $ | 1,150 |
| | $ | 1,140 |
| | $ | 1,028 |
| | $ | 1,146 |
| | $ | 1,150 |
| | $ | 1,140 |
|
| Increase in franchise-operated same-store sales | | 1.1 | % | | 10.4 | % | | 6.3 | % | | 0.3 | % | | 1.1 | % | | 10.4 | % |
| Royalties as a percentage of franchise restaurant sales | | 5.0 | % | | 5.0 | % | | 5.0 | % | | 4.8 | % | | 5.0 | % | | 5.0 | % |
____________________________
| |
| (1) | Included in franchise occupancy expenses in the accompanying consolidated statements of earnings. |
| |
| (2) | 2016 AUV is adjusted to exclude the 53rd week for the purpose of comparison to prior years.purposes. |
Franchise royalties and other decreased $1.5 million, or 7.0%, in 2017 and increased $0.9 million, or 4.2%, in 2016 and $2.4 million, or 13.2%, in 2015 as compared with the respective prior year. IncreasesThe decrease in both years2017 primarily relaterelates to approximately $1.0 million of lower royalty revenue resulting from the acquisition of 14 franchise restaurants in the fourth quarter of 2016, and approximately $0.4 million of additional royalties in 2016 from a 53rd week. The increase in 2016 primarily relates to an increase in the average number of franchise restaurants, the impact of the 53rd week, and to a lesser extent, higher AUVs resulting in an increase in revenue from royalties. In 2016, additional revenues of approximately $0.4 million from a 53rd week also contributed to the increase.
Franchise support and other
Total franchise costs increased $0.9$0.5 million in 20162017 and $0.2$0.8 million in 20152016 in comparison with the respective prior year. In 2016, the increase isyear primarily due to bad debt expense of $0.2 million and an increase in franchise support costs.
Selling, general and administrative (“SG&A”) expenses
The following table presents the change in SG&A expenses in each fiscal year compared with the prior year (in thousands):
| | | | | (Decrease)/Increase | | (Decrease)/Increase |
| | | 2016 vs. 2015 | | 2015 vs. 2014 | | 2017 vs. 2016 | | 2016 vs. 2015 |
| Incentive compensation (including share-based compensation and related payroll taxes) | | $ | (5,839 | ) | | $ | 3,851 |
| | $ | (14,950 | ) | | $ | (5,839 | ) |
| Pension and postretirement benefits | | (5,265 | ) | | 4,989 |
| | (9,270 | ) | | (5,265 | ) |
| Insurance | | | (3,509 | ) | | 3,423 |
|
| 53rd week | | | (2,970 | ) | | 2,970 |
|
| Advertising | | | (2,269 | ) | | 886 |
|
| Region administration | | | (1,902 | ) | | (2,081 | ) |
| Consulting | | | (1,418 | ) | | (531 | ) |
| Pre-opening costs | | | 319 |
| | 1,926 |
|
| Employee relocation | | | 682 |
| | (1,402 | ) |
| Cash surrender value of COLI policies, net | | (3,486 | ) | | 3,833 |
| | 854 |
| | (3,486 | ) |
| Legal settlement | | (2,543 | ) | | — |
| | 2,543 |
| | (2,543 | ) |
| Region administration | | (2,081 | ) | | (275 | ) | |
| Employee relocation | | (1,402 | ) | | (463 | ) | |
| Insurance | | 3,423 |
| | (1,163 | ) | |
| Advertising | | 886 |
| | (982 | ) | |
| 53rd week | | 2,970 |
| | — |
| |
| Other | | (3,992 | ) | | 4,567 |
| | (6,174 | ) | | (5,387 | ) |
| | | $ | (17,329 | ) | | $ | 14,357 |
| | $ | (38,064 | ) | | $ | (17,329 | ) |
In 2017, incentive compensation decreased due primarily to lower levels of performance at both brands as compared to target bonus levels. In 2016, incentive compensation decreased due primarily to forfeitures related to workforce reductions associated with our restructuring plan, and, to a lesser extent, lower levels of performance at both brands as compared to target bonus levels. In 2015,
Pension and postretirement benefit costs decreased in 2017 primarily due to $80.0 million of accelerated contributions made to our qualified pension plan in 2016 which resulted in a higher return on plan assets in fiscal 2017, and a decrease in our fiscal 2017 Pension Benefit Guaranty Corporation (“PBGC”) premiums, which is a component of our pension expense. To a lesser extent, the higher levelssunsetting of incentive compensation reflects improvementsour qualified pension plan during fiscal 2016 resulted in a decrease in the Company’s results compared with performance goals. Higher incentive compensationservice cost component of our expense in 2015 also relates to an increase in share-based compensation due to our annual grant of nonvested restricted stock units which vest over five years. As 2015 was our fifth year of offering such grants, we expensed one additional year of grants compared with the respective prior year.
Pension2017. In 2016, pension and postretirement benefit costs decreased primarily due to the sunsetting of our qualified pension plan, on December 31, 2015, resulting in a decrease in the service cost component of our expense and a change in the amortization period for actuarial gains and losses from the average remaining service period to the average future lifetime of all participants. To a lesser extent, an increase in our discount rate in 2016 also contributed to the decrease. These decreases were partially offset by an increase in PBGC premiums for 2016.
Insurance costs in 2017 decreased due to a decrease in workers’ compensation and general liability claim developments compared with a year ago, and a decrease in costs for group insurance related to lower claim payments. Insurance costs in 2016 increased primarily due to unfavorable workers’ compensation and general liability claim developments compared with the previous year.
Jack in the Box brand advertising costs decreased $3.9 million in 2017 compared with a year ago primarily due to a decrease in the number of company-operated restaurants, and a decrease in discretionary marketing fund contributions. In 2017, advertising costs associated with our Qdoba brand increased $1.6 million versus a year ago due primarily to an increase in the number of company-operated restaurants. In 2016, advertising costs associated with our Qdoba brand increased $2.4 million versus 2015 primarily driven by an increase in restaurant sales which resulted in additional advertising contributions. This increase in 2016 compared to 2015 was partially offset by a decrease in Jack in the Box brand advertising costs primarily due to a reduction in discretionary marketing fund contributions.
In 2017 and 2016, region administration costs decreased due primarily to a decrease in incentive compensation related to lower performance levels as compared to target bonus levels for our region administration personnel, and to a lesser extent, workforce reductions related to our refranchising efforts.
Pre-opening costs in 2017 increased versus the prior year primarily due to the acquisition of Jack in the Box restaurants in the third quarter of 2017, resulting in $2.4 million in costs that were incurred while the restaurants were closed. Higher pre-opening costs related to the acquisition were partially offset by a decrease of $1.7 million in Qdoba brand pre-opening costs due to a decrease in the number of Qdoba restaurants opened and under construction during 2017. In 2016, the increase in pre-opening costs versus the prior year was primarily due to a $1.2 million increase in Qdoba brand pre-opening costs due to the number of restaurants opened and under construction.
The cash surrender value of our Company-owned life insurance (“COLI”) policies, net of changes in our non-qualified deferred compensation obligation supported by these policies, are subject to market fluctuations. The changes in market values had a positive impact of $2.0 million in 2017, a positive impact of $2.9 million in 2016 and a negative impact of $0.6 million in 2015 and a positive impact of $3.2 million in 2014.2015.
In 2016, we received notice that a claim we made in connection with the Deepwater Horizon Court Supervised Settlement Program was approved by the United States District Court for the Eastern District of Louisiana, resulting in a recovery of $2.5 million. The program compensatescompensated businesses for economic damages they incurred in connection with the 2010 oil rig spill in the Gulf of Mexico. Our claim related to certain Jack in the Box restaurants in Louisiana and Texas.
Region administration costs decreased $2.1 million in 2016 primarily related to a decrease in incentive compensation related to lower performance levels as compared to target bonus levels for our region administration personnel and to a lesser extent, workforce reductionsOther includes savings related to our refranchising efforts.
Insurance costsrestructuring plan announced in 2016 increased primarily due to unfavorable workers’ compensationthat includes workforce reductions and general liability claim developments compared with a year ago. Insurance costs in 2015 decreased primarily due to an unfavorable $1.0 million general liability legal settlement recognized in the prior year and favorable group insurance trends versus 2014.
In 2016, advertising costs associated withrelocation of our Qdoba brand increased $2.4 million versus 2015 primarily relatedcorporate support center to an increase in televisionreduce our corporate general and digital advertising, and was partially offset by a decrease in Jack in the Box brand advertising costs primarily due to a reduction in discretionary marketing fund contributions. Advertising costs in 2015 were impacted by our refranchising strategy at Jack in the Box, which resulted in a decrease in company-operated restaurants and the related overhead expenses to manage and support those restaurants, including advertising costs, which are primarily contributions to our marketing funds determined as a percentage of gross restaurant sales. As such, in 2015, advertising costs decreased at Jack in the Box and were partially offset by same-store sales growth at Jack in the Box and Qdoba restaurants.administrative costs.
Impairment and other charges, net
The following table presents the components of impairment and other charges, net in each fiscal year (in thousands):
| | | | | 2016 | | 2015 | | 2014 | | 2017 | | 2016 | | 2015 |
| Restructuring costs | | $ | 10,067 |
| | $ | 29 |
| | $ | 8,621 |
| | $ | 8,837 |
| | $ | 10,067 |
| | $ | 29 |
|
| Costs of closed restaurants (primarily lease obligations) and other | | 3,431 |
| | 3,592 |
| | 2,841 |
| |
| Costs of closed restaurants and other | | | 7,237 |
| | 3,431 |
| | 3,592 |
|
| Losses on the disposition of property and equipment, net | | 2,801 |
| | 1,319 |
| | 1,674 |
| | 3,635 |
| | 2,801 |
| | 1,319 |
|
| Restaurant impairment charges | | | 3,096 |
| | 544 |
| | 557 |
|
| Accelerated depreciation | | 2,214 |
| | 6,260 |
| | 1,202 |
| | 2,336 |
| | 2,214 |
| | 6,260 |
|
| Restaurant impairment charges | | 544 |
| | 557 |
| | 570 |
| |
| | | $ | 19,057 |
| | $ | 11,757 |
| | $ | 14,908 |
| | $ | 25,141 |
| | $ | 19,057 |
| | $ | 11,757 |
|
Impairment and other charges, net increased $7.3$6.1 million in 2017 as compared to 2016 versus 2015.primarily driven by a $3.8 million increase in costs associated with closed restaurant properties, which includes an increase of $1.1 million in costs related to canceled capital projects and an increase of $1.1 million related to the closure of four Jack in the Box restaurants acquired in fiscal 2017 and one Qdoba restaurant. The increase was primarilyfurther driven by $10.1impairment charges in 2017 of $2.4 million offor three under-performing Qdoba restaurants and $0.7 million in charges for Qdoba furniture and equipment resulting from design changes. These increases were partially offset by a $1.2 million decrease in restructuring charges recorded in 2017 compared with 2016 relatedprimarily due to a reduction in severance and retention costs of approximately $6.8 million, partially offset by $5.3 million of Qdoba Evaluation costs in 2017. The severance and retention costs are a result of a plan announcedthat management initiated in fiscal 2016 to reduce our corporate general and administrative costs. These increases were
In 2016, impairment and other charges, net increased $7.3 million as compared to 2015 primarily due to $10.1 million in costs associated with our restructuring plan announced in 2016. This increase was partially offset by decreases in accelerated depreciation primarily resulting from a decrease in charges related to beverage equipment, outdoor lighting, and certain technology upgrades at our Jack in the Box restaurants. Restructuring costs in 2016 included $7.6 million of severance and related costs, $2.0 million in accelerated depreciation related to the relocation of our Qdoba corporate support center in 2017, and $0.5 million of other costs. Approximately $2.0 million and $6.3 million of the 2016 restructuring costs are related to our Jack in the Box and Qdoba restaurant operating segments, respectively, and approximately $1.8 million is related to shared services functions.
In 2015, impairment and other charges, net decreased $3.2 million as compared to 2014 due to a decrease in restructuring activities, partially offset by an increase in accelerated depreciation recognized in connection with various initiatives at our company-operated Jack in the Box restaurants. In 2015, accelerated depreciation included $3.6 million recognized in connection with beverage equipment upgrades and $1.5 million related to projects designed to upgrade outdoor lighting and certain technology at our restaurants.
In 2015, losses on the disposition of property and equipment, net included income of $0.9 million in gains from the resolution of an eminent domain matter involving one Jack in the Box restaurant. For additional detail, refer to Note 9, Impairment and Other Charges, Net, of the notes to the consolidated financial statements.
Gains (losses) on the sale of company-operated restaurants
GainsThe following table presents the gains (losses) on the sale of company-operated restaurants to franchisees, net are detailed in the following tableeach fiscal year (dollars in thousands):
|
| | | | | | | | | | | | |
| | | 2016 | | 2015 | | 2014 |
| Number of restaurants sold to franchisees | | 1 |
| | 21 |
| | 37 |
|
| Gains (losses) on the sale of company-operated restaurants | | $ | 1,230 |
| | $ | (3,139 | ) | | $ | (1,692 | ) |
| Loss on the anticipated sale of a Jack in the Box market | | — |
| | — |
| | (1,856 | ) |
| Total gains (losses) on the sale of company-operated restaurants | | $ | 1,230 |
| | $ | (3,139 | ) | | $ | (3,548 | ) |
|
| | | | | | | | | | | | |
| | | 2017 | | 2016 | | 2015 |
| Number of restaurants sold to Jack in the Box franchisees | | 178 |
| | 1 |
| | 21 |
|
| | | | | | | |
| Gains (losses) on the sale of company-operated restaurants | | $ | 38,034 |
| | $ | 1,230 |
| | $ | (3,139 | ) |
Gains and losses are impacted by the number of restaurants sold and changes in average gains or losses recognized, which relate to specific sales and cash flows of those restaurants. In 2016, 2015 and 2014,2017, gains (losses) on the sale of company-operated restaurants include additional proceeds of $0.2 million related to Jack in the Box restaurants sold in previous years, and gains of(losses) in 2016 and 2015 include $1.4 million and $1.5 million, and $2.1 million, respectively, of additional proceeds recognized upon the extension of the underlying franchise and lease agreements related to Jack in the Box restaurants sold in previous years. In 2014, the loss on the anticipated sale of a Jack in the Box market relates to 25 company-operated restaurants of which we sold 20, and closed the remaining five in fiscal 2015. For additional detail, refer to Note 3, Summary of Refranchisings, Franchisee Development and Acquisitions, of the notes to the consolidated financial statements.
Interest Expense, Net
Interest expense, net is comprised of the following in each fiscal year (in thousands):
| | | | | 2016 | | 2015 | | 2014 | | 2017 | | 2016 | | 2015 |
| Interest expense | | $ | 31,426 |
| | $ | 19,180 |
| | $ | 16,531 |
| | $ | 46,601 |
| | $ | 31,426 |
| | $ | 19,180 |
|
| Interest income | | (345 | ) | | (377 | ) | | (853 | ) | | (83 | ) | | (345 | ) | | (377 | ) |
| Interest expense, net | | $ | 31,081 |
| | $ | 18,803 |
| | $ | 15,678 |
| | $ | 46,518 |
| | $ | 31,081 |
| | $ | 18,803 |
|
Interest expense, net increased $15.4 million in 2017 as compared to a year ago primarily due to higher average borrowings, which contributed additional interest expense of approximately $7.5 million, and higher average interest rates, which contributed additional interest expense of approximately $5.1 million. Interest expense, net increased $12.3 million in 2016 as compared to aprior year agoprimarily due to higher average borrowings, which contributed additional interest expense of approximately $6.2 million, and to a lesser extent, higher average interest rates. In 2015,rates, which contributed additional interest expense increased due to higher average borrowings that were partially offset by a charge of $0.8 million in 2014 to write-off deferred financing fees in connection with the refinancing of our credit facility.approximately $2.0 million.
Income Taxes
The income tax provisions reflect effective tax rates of 36.5%37.0%, 36.9%36.5% and 35.3%36.9% of pretax earnings from continuing operations in 2017, 2016 2015 and 2014,2015, respectively. In 2016,2017, the major components of the year-over-year change in tax rates were an increase in operating earnings before income taxes, a decrease in current year tax credits, and a decrease in gains from the market performance of insurance products used to fund certain non-qualified retirement plans, which are excluded from taxable income, the impact of which was partiallyincome. These were partly offset by an increase in the Company’sa partial release of valuation allowance against state tax rate.credits. The tax rate change from 20152016 versus 20142015 was primarily related to a decreasean increase in gains from the market performance of insurance products used to fund certain non-qualified retirement plans which are excluded from taxable income.partially offset by an increase in the Company’s state tax rate.
Earnings from Continuing Operations
Earnings from continuing operations were $138.3 million, or $4.47 per diluted share, in 2017; $126.3 million, or $3.70 per diluted share, in 2016; and $112.6 million, or $2.95 per diluted share, in 2015; and $94.8 million, or $2.26 per diluted share, in 2014.2015. We estimate that the extra 53rd week in fiscal 2016 benefited net earnings by approximately $3.1 million, or $0.09 per diluted share in fiscal 2016.
Losses from Discontinued Operations, Net
The losses from our distribution business and the 2013 Qdoba Closures have been reported as discontinued operations for all periods presented. In fiscal years 2017, 2016 and 2015, the losses from our distribution business were immaterial to our consolidated results of operations. Losses from discontinued operations, net of income tax benefit, related to our 2013 Qdoba Closures were $2.3 million in fiscal 2017, $2.0 million in fiscal 2016, and $3.4 million in fiscal 2015, and reduced diluted earnings per share by $(0.08), $(0.06) and $(0.09), respectively. Refer to Note 2, Discontinued Operations, in the notes to our consolidated financial statements for further information regarding our discontinued operations.
Losses from discontinued operations, net of income tax benefit, are as follows for each discontinued operation in each fiscal year (in thousands): |
| | | | | | | | | | | | |
| | | 2016 | | 2015 | | 2014 |
| Distribution business | | $ | (235 | ) | | $ | (430 | ) | | $ | (790 | ) |
| 2013 Qdoba Closures | | (1,962 | ) | | (3,359 | ) | | (5,104 | ) |
| | | $ | (2,197 | ) | | $ | (3,789 | ) | | $ | (5,894 | ) |
These losses from discontinued operations reduced diluted earnings per share by the following in each fiscal year (amounts may not add due to rounding): |
| | | | | | | | | | | | |
| | | 2016 | | 2015 | | 2014 |
| Distribution business | | $ | (0.01 | ) | | $ | (0.01 | ) | | $ | (0.02 | ) |
| 2013 Qdoba Closures | | (0.06 | ) | | (0.09 | ) | | (0.012 | ) |
| | | $ | (0.06 | ) | | $ | (0.10 | ) | | $ | (0.14 | ) |
LIQUIDITY AND CAPITAL RESOURCES
General
Our primary sources of short-term and long-term liquidity are expected to be cash flows from operations and our revolving credit facility.
We generally reinvest available cash flows from operations to develop new restaurants or enhance existing restaurants, to reduce debt, to repurchase shares of our common stock, and to pay cash dividends. Our cash requirements consist principally of:
working capital;
capital expenditures for new restaurant construction and restaurant renovations;
income tax payments;
debt service requirements; and
obligations related to our benefit plans.
Based upon current levels of operations and anticipated growth, we expect that cash flows from operations, combined with other financing alternatives in place or available, will be sufficient to meet our capital expenditure, working capital and debt service requirements for at least the next twelve months and the foreseeable future.
As is common in the restaurant industry, we maintain relatively low levels of accounts receivable and inventories, and our vendors grant trade credit for purchases such as food and supplies. We also continually invest in our business through the addition of new units and refurbishment of existing units, which are reflected as long-term assets and not as part of working capital. As a result, we may at times maintain current liabilities in excess of current assets, which results in a working capital deficit.
Cash Flows
The table below summarizes our cash flows from operating, investing and financing activities for each of the past three fiscal years (in thousands):
| | | | | 2016 | | 2015 | | 2014 | | 2017 | | 2016 | | 2015 |
| Total cash provided by (used in): | | | | | | | | | | | | |
| Operating activities | | $ | 134,182 |
| | $ | 226,875 |
| | $ | 201,022 |
| | $ | 171,837 |
| | $ | 134,182 |
| | $ | 226,875 |
|
| Investing activities | | (104,398 | ) | | (84,473 | ) | | (42,979 | ) | | 33,339 |
| | (104,398 | ) | | (84,473 | ) |
| Financing activities | | (30,454 | ) | | (135,208 | ) | | (157,116 | ) | | (214,542 | ) | | (30,454 | ) | | (135,208 | ) |
| Effect of exchange rate changes | | (43 | ) | | (29 | ) | | 7 |
| | (22 | ) | | (43 | ) | | (29 | ) |
| Net (decrease) increase in cash | | $ | (713 | ) | | $ | 7,165 |
| | $ | 934 |
| | $ | (9,388 | ) | | $ | (713 | ) | | $ | 7,165 |
|
Operating Activities. Operating cash flows increased $37.7 million in 2017 compared with 2016 primarily due to a $95.0 million decrease in contributions to our qualified pension plan, approximately $40.8 million related to the timing of October rent payments, and an increase in net earnings in 2017. These increases in operating cash flows in 2017 were partially offset by a $59.3 million and $14.3 million increase in tax and interest payments, respectively, made in 2017 compared to 2016, and a decrease of $17.5 million related to the timing of October minimum rent billings.
In 2016, operating cash flows decreased $92.7 million in 2016 compared with 2015 due primarily to an $80.0 million accelerated contribution to our qualified defined benefit pension plan, as well as, higher interest expense and income tax payments of $12.3 million and $4.7 million, respectively, and the timing of working capital receipts and expenditures, partially offset by an increase in deferred tax asset utilization primarily related to additional pension contributions in 2016 and an increase in net earnings in 2016.
In 2015, operating cash flows increased $25.9 million compared with 2014 due primarily to an increase in net earnings in fiscal 2015 and a reduction in prepaid income taxes of $20.3 million, offset by an income tax refund of $20.5 million received in the fourth quarter of 2014 as a result of a fixed asset cost segregation study.
Pension and Postretirement Contributions — Our policy is to fund our pension plans at or above the minimum required by law. As of January 1, 2016,2017, the date of our last actuarial funding valuation for our qualified pension plan, there was no minimum contribution funding requirement. In 2016,2017, we contributed $101.1$5.4 million to our pension and postretirement plansplans. In 2016, we contributed $101.1 million which includesincluded an $80.0 million accelerated contribution to our qualified defined benefit pension plan. The accelerated contribution was made to reduce future pension costs including our exposure to PBGC variable-rate premiums that are paid on the unfunded portion of our pension liability, and improve the funded status of the plan. We do not anticipate making any contributions to our qualified defined benefit pension plan in fiscal 2017.2018. For additional information, refer to Note 11, Retirement Plans, of the notes to the consolidated financial statements.
Investing Activities. Cash flows provided by (used in) investing activities changed from a use of $104.4 million in 2016 to a source of $33.3 million in 2017. This change primarily resulted from $99.4 million in proceeds from the sale of 178 company-operated Jack in the Box restaurants to franchisees in 2017, a decrease in cash used to purchase purchase of property and equipment, and a decrease in cash used to acquire franchise-operated restaurants, partially offset by a decrease in proceeds from the sale and leaseback of assets. In 2016, cash flows used in investing activities increased $19.9 million in 2016 compared with 2015 due primarily dueto cash used to acquire 14 Qdoba franchise restaurants and an increase in capital expenditures, partially offset by an increase in proceeds from assets held for sale and leaseback. In 2015, cash flows used in investing activities increased $41.5 million compared with 2014 due primarily to an increase in capital expenditures, cash used to acquire assets held for sale and leaseback, a decrease in proceeds from assets held for sale and leaseback and the sale of company-operated restaurants.
Capital Expenditures — The composition of capital expenditures in each fiscal year is summarized in the table below (in thousands):
| | | | | 2016 | | 2015 | | 2014 | | 2017 | | 2016 | | 2015 |
| Jack in the Box: | | | | | | | | | | | | |
| Restaurant facility expenditures | | $ | 25,985 |
| | $ | 36,062 |
| | $ | 22,680 |
| | $ | 24,573 |
| | $ | 25,985 |
| | $ | 36,062 |
|
| New restaurants | | 11,526 |
| | 2,402 |
| | 3,533 |
| | 1,279 |
| | 11,526 |
| | 2,402 |
|
| Other, including information technology | | 1,096 |
| | 3,464 |
| | 4,645 |
| | 3,574 |
| | 1,096 |
| | 3,464 |
|
| | | 38,607 |
| | 41,928 |
| | 30,858 |
| | 29,426 |
| | 38,607 |
| | 41,928 |
|
| Qdoba: | | | | | | | | | | | | |
| New restaurants | | | 19,962 |
| | 40,235 |
| | 26,686 |
|
| Restaurant facility expenditures | | 8,341 |
| | 3,762 |
| | 4,477 |
| | 13,083 |
| | 8,341 |
| | 3,762 |
|
| New restaurants | | 40,235 |
| | 26,686 |
| | 13,189 |
| |
| Other, including information technology | | 4,740 |
| | 3,623 |
| | 301 |
| | 1,118 |
| | 4,740 |
| | 3,623 |
|
| | | 53,316 |
| | 34,071 |
| | 17,967 |
| | 34,163 |
| | 53,316 |
| | 34,071 |
|
| Shared Services: | | | | | | | | | | | | |
| Information technology | | 4,413 |
| | 7,315 |
| | 5,786 |
| | 3,759 |
| | 4,413 |
| | 7,315 |
|
| Other, including facility improvements | | 279 |
| | 2,912 |
| | 5,914 |
| | 105 |
| | 279 |
| | 2,912 |
|
| | | 4,692 |
| | 10,227 |
| | 11,700 |
| | 3,864 |
| | 4,692 |
| | 10,227 |
|
| | | | | | | | | | | | | |
| Consolidated capital expenditures | | $ | 96,615 |
| | $ | 86,226 |
| | $ | 60,525 |
| | $ | 67,453 |
| | $ | 96,615 |
| | $ | 86,226 |
|
Our capital expenditure program includes, among other things, investments in new locations and equipment, restaurant remodeling, and information technology enhancements. In 2017, capital expenditures decreased $29.2 million primarily resulting from a decrease in spending related to building new Qdoba and Jack in the Box restaurants, partially offset by remodels at our Qdoba restaurants as we continue to roll out our new restaurant designs. In 2016, capital expenditures increased $10.4 million compared with 2015 due primarily resulting fromto an increase in spending related to building new Qdoba and Jack in the Box restaurants, and remodels at our Qdoba restaurants as we rollbegan rolling out our new restaurant designs. These increases were partially offset by a decrease in spending related to site enhancements at our Jack in the Box restaurants, as well as a decrease in spending related to Jack in the Box and Shared Services information technology. In 2015, capital expenditures increased $25.7 million compared with 2014 due primarily to an increase in spending related to building new Qdoba restaurants, exterior lighting enhancements at our Jack in the Box restaurants, and information technology infrastructure at both brands, partially offset by a decrease in spending related to Qdoba’s corporate support center.
In fiscal 2017, capital expenditures are expected to be approximately $105-$115 million. Increased spending in fiscal 2017 will primarily be related to remodels at Qdoba and Jack in the Box company-operated restaurants, as well as building new Qdoba company-operated restaurants, partially offset by decreases in spending for Jack in the Box company-operated restaurants. In 2017, we plan to open approximately four new Jack in the Box company-operated locations, and approximately 40 new Qdoba company-operated locations.
Assets Held for Sale and Leaseback — We use sale and leaseback financing to lower the initial cash investment in our restaurants to the cost of the equipment, whenever possible. During both2017 and 2016, and 2015, we exercised our right of first refusal related to three and five leased properties, respectively, which we intend to sell and leaseback within the next 12 months. The following table summarizes the cash flow activity related to sale and leaseback transactions in each fiscal year (dollars in thousands):
| | | | | 2016 | | 2015 | | 2014 | | 2017 | | 2016 | | 2015 |
| Number of restaurants sold and leased back | | 8 |
| | — |
| | 3 |
| | 3 |
| | 8 |
| | — |
|
| Proceeds from sale and leaseback of assets | | $ | 17,123 |
| | $ | — |
| | $ | 5,698 |
| | $ | 6,057 |
| | $ | 17,123 |
| | $ | — |
|
| Purchases of assets intended for sale and leaseback | | $ | (9,785 | ) | | $ | (10,396 | ) | | $ | (2,801 | ) | | $ | (5,769 | ) | | $ | (9,785 | ) | | $ | (10,396 | ) |
As of October 2, 2016,1, 2017, we had investments of approximately $14.3$15.8 million relating to sixseven restaurant properties that we expect to sell and leaseback during fiscal 2017.2018.
Sale of Company-Operated Restaurants — We have continued to expand franchise ownership in the Jack in the Box system primarily through the sale of company-operated restaurants to franchisees. The following table details proceeds received in connection with our refranchising activities in each fiscal year (dollars in thousands):
| | | | | 2016 | | 2015 | | 2014 | | 2017 | | 2016 | | 2015 |
| Number of restaurants sold to franchisees | | 1 |
| | 21 |
| | 37 |
| | 178 |
| | 1 |
| | 21 |
|
| Total proceeds | | $ | 1,439 |
| | $ | 3,951 |
| | $ | 10,536 |
| | $ | 99,591 |
| | $ | 1,439 |
| | $ | 3,951 |
|
In 2017, 2016 2015 and 2014,2015, proceeds include $0.2 million, $1.4 million and $1.5 million, and $2.1 million, respectively, recognized upon the extension of the underlying franchise and lease agreements related to Jack in the Box restaurants sold in previous years. For additional information, refer to Note 3, Summary of Refranchisings, Franchisee Development and Acquisitions, of the notes to the consolidated financial statements.
Acquisition of Franchise-Operated Restaurants — In 2017, 2016 2015 and 2014,2015, we acquired 50, one seven and fourseven Jack in the Box franchise restaurants, respectively. In 2017, we acquired 31 restaurants as the result of an agreement with an underperforming franchisee that was in violation of franchise and lease agreements with the Company. Under this agreement, the franchisee voluntarily agreed to turn over the restaurants. The acquisition of the additional 19 restaurants in 2017 was the result of a legal action filed in September 2013 against a franchisee in which we obtained a judgment in January 2017 granting us possession of the restaurants. In 2016, we also acquired 14 Qdoba franchise restaurants.
Of the 50 restaurants acquired in 2017, we sold 18 of the restaurants to a franchisee and closed four. We plan to sell the remaining restaurants acquired in 2017 as part of our refranchising strategy. For additional information, refer to Note 3, Summary of Refranchisings, Franchisee Development and Acquisitions, and Note 9, Impairment and Other Charges, Net, of the notes to the consolidated financial statements.
The following table details franchise-operated restaurant acquisition activity in each fiscal year (dollars in thousands):
| | | | | 2016 | | 2015 | | 2014 | | 2017 | | 2016 | | 2015 |
| Number of restaurants acquired from franchisees | | 15 |
| | 7 |
| | 4 |
| | 50 |
| | 15 |
| | 7 |
|
| Cash used to acquire franchise-operated restaurants | | $ | 19,816 |
| | $ | — |
| | $ | 1,750 |
| |
| Total consideration (1) | | | $ | 15,862 |
| | $ | 19,816 |
| | $ | — |
|
____________________________
(1) Consideration of $13.8 million in 2017 is non-cash.
The purchase priceIn 2017, total consideration was primarily allocated to goodwill, property and equipment acquired, intangible assets acquired, and liabilities assumed in 2015, andassumed. In 2016, total consideration was primarily allocated to goodwill and property and equipment acquired in 2016 and 2014.acquired. For additional information, refer to Note 3, Summary of Refranchisings, Franchisee Development and Acquisitions, of the notes to the consolidated financial statements.
Financing Activities. Cash used in financing activities increased $184.1 million in 2017 and decreased $104.8 million in 2016 and $21.9 million in 2015 as compared with the respective prior year. The increase in 2017 is primarily due to a net increase in payments under our credit facility, and an increase in cash used to repurchase our common stock. The decrease in 2016 is due primarily due to a net increase in borrowings under our credit facility and a decrease in cash used to repurchase our common stock, partially offset by a decrease in excess tax benefits from share-based compensation arrangements, a decrease in proceeds from the issuance of our common stock, and an increase in cash used to pay dividends. The decrease in 2015 is due primarily to an increase in borrowings under our credit facility, partially offset by an increase in cash used to pay dividends and a decrease in proceeds from the issuance of common stock.
Credit Facility — On September 16, 2016, the Company amended its credit facility to increase its overall borrowing capacity by $400.0 million. The amended credit facility was increased to $1.6 billion, consisting of (i) a $900.0 million revolving credit agreement and (ii) a $700.0 million term loan. Upon amendment, the Company borrowed $417.6 million under the amended term loan and used the full amount to pay down our revolving credit agreement.
We are subject to a number of customary covenants under our credit facility, including limitations on additional borrowings, acquisitions, loans to franchisees, lease commitments, stock repurchases, dividend payments and requirements to maintain certain financial ratios. We were in compliance with all covenants as of October 2, 2016.1, 2017.
At October 2, 2016,1, 2017, we had $694.1$639.4 million outstanding under the term loan, borrowings under the revolving credit agreement of $282.4$497.0 million and letters of credit outstanding of $25.1$31.4 million. For additional information related to our credit facility, refer to Note 7, Indebtedness, of the notes to the consolidated financial statements.
Interest Rate Swaps — To reduce our exposure to rising interest rates under our credit facility, we consider and have entered into interest rate swaps. In April 2014, we entered into nine forward-starting interest rate swap agreements that effectively convert $300.0 million of our variable rate borrowings to a fixed rate basis from October 2014 through October 2018. In June 2015, we entered into eleven forward-starting interest rate swap agreements that effectively convert an additional $200.0 million of our variable rate borrowings and future expected variable rate borrowings to a fixed rate from October 2015 through October 2018, and $500.0 million from October 2018 through October 2022. For additional information, refer to Note 6, Derivative Instruments, of the notes to the consolidated financial statements and Item 7A, Quantitative and Qualitative Disclosures about Market Risk, of this Report.
Repurchases of Common Stock — During fiscal 2016,2017, we repurchased 3.93.2 million shares at an aggregate cost of $291.9$327.2 million. As of October 2, 2016,1, 2017, there was approximately $408.2$181.0 million remaining under the stock buyback programs, of which $108.2 million expires in November 2017 and $300.0 million expiresexpire in November 2018.
Repurchases of common stock included in our consolidated statements of cash flows for 2016fiscal 2017 and 2015 include $7.2 million related to repurchase transactions traded in the current fiscal year that will settle in the subsequent year. Repurchases of common stock included in our statements of cash flows for 2015 and 2014 include $3.1 million and $7.3 million, respectively, related to repurchase transactions traded in the prior fiscal year that settled in 2017 and 2015, respectively. Repurchases of common stock included in our consolidated statement of cash flows for fiscal 2016 exclude $7.2 million related to repurchase transactions traded in 2016 that settled in the subsequent year. For additional information, refer to Note 13, Stockholders’ Equity, of the notes to the consolidated financial statements and Item 5, Market for Registrant’s Common Equity, Related Stockholder Matters and Issuer Purchases of Equity Securities, of this Report.
Dividends — On May 9, 2014,In fiscal 2017, the Board of Directors approved the initiationdeclared four cash dividends of a regular quarterly cash dividend. Two quarterly cash dividend payments of $0.20$0.40 cents per share each, weretotaling $49.2 million. In fiscal 2016, the Board of Directors declared four cash dividends of $0.30 cents per share each, totaling $15.9$40.5 million, and in fiscal 2014. In fiscal 2015, the Board of Directors declared two cash dividends of $0.20 per share each, and two cash dividends of $0.30 per share each, totaling $37.6 million. In 2016, the Board of Directors declared four cash dividends of $0.30 cents per share each, totaling $40.5 million. Future dividends are subject to approval by our Board of Directors.
Off-Balance Sheet Arrangements
We have entered into certain off-balance sheet contractual obligations and commitments in the ordinary course of business, which are recognized in our consolidated financial statements in accordance with U.S. generally accepted accounting principles. The off-balance sheet arrangements that will have a material impact on our future results from operations are disclosed in the Contractual Obligations and Commitments table below. We are not a party to any other off-balance sheet arrangements that have, or are reasonably likely to have, a current or future material effect on our financial condition, changes in financial condition, results of operations, liquidity, capital expenditures or capital resources.
Contractual Obligations and Commitments
The following is a summary of our contractual obligations and commercial commitments as of October 2, 20161, 2017 (in thousands):
| | | | | Payments Due by Fiscal Year | | Payments Due by Fiscal Year |
| | | Total | | Less than 1 year | | 1-3 years | | 3-5 years | | After 5 years | | Total | | Less than 1 year | | 1-3 years | | 3-5 years | | After 5 years |
| Contractual Obligations: | | | | | | | | | | | | | | | | | | | | |
| Credit facility term loan (1) | | $ | 733,912 |
| | $ | 71,771 |
| | $ | 662,141 |
| | $ | — |
| | $ | — |
| | $ | 668,549 |
| | $ | 83,879 |
| | $ | 584,670 |
| | $ | — |
| | $ | — |
|
| Revolving credit agreement (1) | | 300,237 |
| | 7,126 |
| | 293,111 |
| | — |
| | — |
| | 521,899 |
| | 16,585 |
| | 505,314 |
| | — |
| | — |
|
| Capital lease obligations | | 22,354 |
| | 3,423 |
| | 6,206 |
| | 5,618 |
| | 7,107 |
| | 12,840 |
| | 2,263 |
| | 3,833 |
| | 3,699 |
| | 3,045 |
|
| Operating lease obligations | | 1,494,313 |
| | 235,048 |
| | 404,213 |
| | 324,910 |
| | 530,142 |
| | 1,414,746 |
| | 235,424 |
| | 398,317 |
| | 296,328 |
| | 484,677 |
|
| Purchase commitments (2) | | 3,633,400 |
| | 993,500 |
| | 1,010,100 |
| | 728,500 |
| | 901,300 |
| | 3,074,400 |
| | 880,800 |
| | 885,400 |
| | 641,400 |
| | 666,800 |
|
| Benefit obligations (3) | | 68,644 |
| | 10,168 |
| | 12,339 |
| | 12,781 |
| | 33,356 |
| | 67,138 |
| | 9,054 |
| | 12,244 |
| | 12,740 |
| | 33,100 |
|
| Total contractual obligations | | $ | 6,252,860 |
| | $ | 1,321,036 |
| | $ | 2,388,110 |
| | $ | 1,071,809 |
| | $ | 1,471,905 |
| | $ | 5,759,572 |
| | $ | 1,228,005 |
| | $ | 2,389,778 |
| | $ | 954,167 |
| | $ | 1,187,622 |
|
| Other Commercial Commitments: | | | | | | | | | | | | | | | | | | | | |
| Stand-by letters of credit (4) | | $ | 25,100 |
| | $ | 25,100 |
| | $ | — |
| | $ | — |
| | $ | — |
| | $ | 31,400 |
| | $ | 31,400 |
| | $ | — |
| | $ | — |
| | $ | — |
|
____________________________
| |
| (1) | Includes estimated interest expense based on rates in effect on October 2, 2016.1, 2017. |
| |
| (2) | Includes purchase commitments for food, beverage, and packaging items to support system-wide restaurant operations. |
| |
| (3) | Includes expected payments associated with our non-qualified defined benefit plan, postretirement healthcare plans and our non-qualified deferred compensation plan through fiscal 2026.2027. |
| |
| (4) | Consists primarily of letters of credit for workers’ compensation and general liability insurance. |
We maintain a noncontributory defined benefit pension plan (“Qualified Plan”) covering substantially all full-time employees hired before January 1, 2011. Our policy is to fund our Qualified Plan at amounts necessary to satisfy the minimum amount required by law, plus additional amounts as determined by management to improve the plan’s funded status. Contributions beyond fiscal 20162017 will depend on pension asset performance, future interest rates, future tax law changes, and future changes in regulatory funding requirements. Based on the funding status of our Qualified Plan as of our last measurement date, there was no minimum contribution required. For additional information related to our pension plans, refer to Note 11, Retirement Plans, of the notes to the consolidated financial statements.
DISCUSSION OF CRITICAL ACCOUNTING ESTIMATES
We have identified the following as our most critical accounting estimates, which are those that are most important to the portrayal of the Company’s financial condition and results, and that require management’s most subjective and complex judgments. Information regarding our other significant accounting estimates and policies are disclosed in Note 1, Nature of Operations and Summary of Significant Accounting Policies, of the notes to the consolidated financial statements.
Long-lived Assets — Property, equipment and certain other assets, including amortized intangible assets, are reviewed for impairment on an annual basis or whenever events or changes in circumstances indicate that their carrying value may not be recoverable. This review generally includes a restaurant-level analysis, except when we are actively selling a group of restaurants, in which case we perform our impairment evaluations at the group level. Impairment evaluations for individual restaurants take into consideration a restaurant’s operating cash flows, the period of time since a restaurant has been opened or remodeled, refranchising expectations, and the maturity of the related market. Impairment evaluations for a group of restaurants take into consideration the group’s expected future cash flows and sales proceeds from bids received, if any, or fair market value based on, among other considerations, the specific sales and cash flows of those restaurants. If the assets of a restaurant or group of restaurants subject to our impairment evaluation are not recoverable based upon the forecasted, undiscounted cash flows, we recognize an impairment loss as the amount by which the carrying value of the assets exceeds fair value. Our estimates of cash flows used to assess impairment are subject to a high degree of judgment and may differ from actual cash flows due to, among other things, economic conditions or changes in operating performance. During fiscal year 2016,2017, we recorded impairment charges totaling $0.5of $2.4 million related to write down onethree underperforming Qdoba restaurant to its estimated fair value.
Retirement Benefits — Our defined benefitrestaurants which are currently held for use, and other postretirement plans’ costs and liabilities are determined using several statistical and other actuarial factors, which attempt to anticipate future events, including assumptions about discount rates, expected return on plan assets, health care cost trend rates and mortality rates. The assumed discount rate and expected return on plan assets are the assumptions that generally have the most significant impact on our benefit costs and retirement obligations.
Our discount rate is set annually by us, with assistance from our actuaries, and is determined by considering the average of pension yield curves constructed of a population of high-quality bonds with a Moody’s or Standard and Poor’s rating of “AA” or better meeting certain other criteria. As of October 2, 2016, our discount rates were 3.85% for our Qualified Plan, 3.60% for our non-qualified defined benefit plan, and 3.64% for our postretirement health plans.
Our expected long-term rate of return on assets is determined taking into consideration our projected asset allocation and economic forecasts prepared with the assistance of our actuarial consultants. As of October 2, 2016, our assumed expected long-term rate of return was 6.50% for our Qualified Plan.
The actuarial assumptions used may differ materially from actual results due to changing market and economic conditions, higher or lower turnover and retirement rates or longer or shorter life spans of participants. These differences may affect the amount of expense we record. A hypothetical 25 basis point reduction in the assumed discount rate and expected long-term rate of return on plan assets would have resulted in an estimated increase of $0.5 million and $0.8 million, respectively, in our fiscal 2016 pension and postretirement expense.
We expect our pension and postretirement expense to decrease $9.3$0.7 million in fiscal 2017 principally due to an increase in fiscal 2016 contributions to our Qualified Plan which are expected to result in a higher return on plan assets in fiscal 2017,charges for Qdoba furniture and aequipment resulting decrease in our fiscal 2017 PBGC premiums, which is a component of our pension expense. To a lesser extent, the sunsetting of our Qualified Plan on December 31, 2015, at which time participants stopped accruing benefits, will result in a reduction of the service cost component of our expense.from new restaurant design changes.
Self-Insurance — We are self-insured for a portion of our losses related to workers’ compensation, general liability and other legal claims and health benefits. In estimating our self-insurance accruals, we utilize independent actuarial estimates of expected losses, which are based on statistical analysis of historical data. These assumptions are closely monitored and adjusted when warranted by changing circumstances. Should a greater amount of claims occur compared to what was estimated, or should medical costs increase beyond what was expected, accruals might not be sufficient, and additional expense may be recorded.
Restaurant Closing Costs — Restaurant closing costs include future lease commitments, net of anticipated sublease rentals and expected ancillary costs. We record a liability for the net present value of any remaining lease obligations, net of estimated sublease income, at the date we cease using a property. Subsequent adjustments to the liability as a result of changes in estimates of sublease income or lease cancellations are recorded in the period incurred. The estimates we make related to sublease income are subject to a high degree of judgment and may differ from actual sublease income due to changes in economic conditions, desirability of the sites and other factors. During fiscal year 2016, we recorded charges of $0.9 million related to revised sublease assumptions and adjustments for lease terminations.
Goodwill and Other Intangibles — We evaluate goodwill and non-amortizing intangible assets annually, or more frequently if indicators of impairment are present. Our impairment analyses first include a qualitative assessment to determine whether events or circumstances indicate the carrying amount may not be recoverable. If this assessment results in a less-than 50% likelihood that impairment exists, then further analysis is not required. If the results of these analyses indicate otherwise, then we compare the fair value of the reporting unit for goodwill and the fair value of the intangible asset to their respective carrying values. If the determined fair values of the respective assets are less than the related carrying amounts, an impairment loss is recognized. The methods we use to estimate fair value include future cash flow assumptions, which may differ from actual cash flows due to, among other things, economic conditions or changes in operating performance. We performed our annual assessment of overall impairment of our goodwill and other intangibles assets during the fourth quarter of 2016, and qualitatively determined that no impairment existed as of October 2, 2016. As of the impairment testing date, the fair value of our reporting units significantly exceeded their carrying values.
Legal Accruals — The Company is subject to claims and lawsuits in the ordinary course of its business. A determination of the amount accrued, if any, for these contingencies is made after analysis of each matter. We continually evaluate such accruals and may increase or decrease accrued amounts as we deem appropriate. Because lawsuits are inherently unpredictable, and unfavorable resolutions could occur, assessing contingencies is highly subjective and requires judgment about future events. As a result, the amount of ultimate loss may differ from those estimates.
Income Taxes — We estimate certain components of our provision for income taxes. These estimates include, among other items, depreciation and amortization expense allowable for tax purposes, allowable tax credits, effective rates for state and local income taxes, and the tax deductibility of certain other items. We adjust our effective income tax rate as additional information on outcomes or events becomes available. Our estimates are based on the best available information at the time that we prepare the income tax provision. We generally file our annual income tax returns several months after our fiscal year-end. Income tax returns are subject to audit by federal, state and local governments, generally years after the returns are filed. These returns could be subject to material adjustments or differing interpretations of the tax laws.
NEW ACCOUNTING PRONOUNCEMENTS
See Note 1, Nature of Operations and Summary of Significant Accounting Policies, of the notes to the consolidated financial statements for a discussion of the impact of new accounting pronouncements on our consolidated financial statements.
| |
| ITEM 7A. | QUANTITATIVE AND QUALITATIVE DISCLOSURES ABOUT MARKET RISK |
Our primary exposure to risks relating to financial instruments is changes in interest rates. Our credit facility is comprised of a revolving credit facility and a term loan, bearing interest at an annual rate equal to the prime rate or LIBOR plus an applicable margin based on a financial leverage ratio, with a 0% floor on the LIBOR. As of October 2, 2016,1, 2017, the applicable margin for the LIBOR-based revolving loans and term loan was set at 2.00%.
We use interest rate swap agreements to reduce exposure to interest rate fluctuations. In April 2014, we entered into nine forward-starting interest rate swap agreements that effectively convert $300.0 million of our variable rate borrowings to a fixed rate basis from October 2014 through October 2018. In June 2015, we entered into eleven forward-starting interest rate swap agreements that effectively convert an additional $200.0 million of our variable rate borrowings to a fixed rate from October 2015 through October 2018, and $500.0 million from October 2018 through October 2022. Based on the applicable margin in effect as of October 2, 2016,1, 2017, these twenty interest rate swaps would yield average fixed rates of 3.90%, 4.41%, 4.62%, 4.89%, 5.07% and 5.17% in
fiscal years 20172018 through 2022, respectively. For additional information related to our interest rate swaps, refer to Note 6, Derivative Instruments, of the notes to the consolidated financial statements.
A hypothetical 100 basis point increase in short-term interest rates, based on the outstanding unhedged balance of our revolving credit facility and term loan at October 2, 2016,1, 2017, would result in an estimated increase of $4.8$6.4 million in annual interest expense.
We are also exposed to the impact of commodity and utility price fluctuations. Many of the ingredients we use are commodities or ingredients that are affected by the price of other commodities, weather, seasonality, production, availability and various other factors outside our control. In order to minimize the impact of fluctuations in price and availability, we monitor the primary commodities we purchase and may enter into purchasing contracts and pricing arrangements when considered to be advantageous. However, certain commodities remain subject to price fluctuations. We are exposed to the impact of utility price fluctuations related to unpredictable factors such as weather and various other market conditions outside our control. Our ability to recover increased costs for commodities and utilities through higher prices is limited by the competitive environment in which we operate. From time to time, we enter into futures and option contracts to manage these fluctuations. At October 2, 2016,1, 2017, we had no such contracts in place.
| |
| ITEM 8. | FINANCIAL STATEMENTS AND SUPPLEMENTARY DATA |
The consolidated financial statements, related financial information, and the Report of Independent Registered Public Accounting Firm required to be filed are indexed on page F-1 and are incorporated herein.
| |
| ITEM 9. | CHANGES IN AND DISAGREEMENTS WITH ACCOUNTANTS ON ACCOUNTING AND FINANCIAL DISCLOSURE |
None.
| |
| ITEM 9A. | CONTROLS AND PROCEDURES |
Conclusion Regarding the Effectiveness of Disclosure Controls and Procedures
Based on an evaluation of the Company’s disclosure controls and procedures (as defined in Rule 13(a)-15(e) of the Securities Exchange Act of 1934, as amended), as of the end of the Company’s fiscal year ended October 2, 20161, 2017, the Company’s Chief Executive Officer and Chief Financial Officer (its principal executive officer and principal financial officer, respectively) have concluded that the Company’s disclosure controls and procedures were effective.
Changes in Internal Control Over Financial Reporting
There have been no significant changes in the Company’s internal control over financial reporting that occurred during the Company’s fiscal quarter ended October 2, 20161, 2017 that have materially affected, or are reasonably likely to materially affect, the Company’s internal control over financial reporting.
Management’s Report on Internal Control Over Financial Reporting
Management, including our principal executive officer and principal financial officer, is responsible for establishing and maintaining adequate internal control over financial reporting (as defined in Rule 13a-15(f) under the Exchange Act). The Company’s internal control over financial reporting is designed to provide reasonable assurance to the Company’s management and Board of Directors regarding the preparation and fair presentation of published financial statements.
Because of its inherent limitations, internal control over financial reporting may not prevent or detect misstatements. Therefore, even those systems determined to be effective can provide only reasonable assurance with respect to financial statement preparation and presentation.
Management assessed the effectiveness of the Company’s internal control over financial reporting as of October 2, 20161, 2017. In making this assessment, our management used the criteria set forth in 2013 by the Committee of Sponsoring Organizations of the Treadway Commission (“COSO”) in Internal Control-Integrated Framework. Management has concluded that, as of October 2, 20161, 2017, the Company’s internal control over financial reporting was effective, at a reasonable assurance level, based on these criteria.
The Company’s independent registered public accounting firm, KPMG LLP, has issued an audit report on the effectiveness of our internal control over financial reporting, which follows.
Report of Independent Registered Public Accounting Firm
The Board of Directors and Stockholders
Jack in the Box Inc.:
We have audited the internal control over financial reporting of Jack in the Box Inc. (the Company) as of October 2, 20161, 2017, based on criteria established in Internal Control — Integrated Framework (2013), issued by the Committee of Sponsoring Organizations of the Treadway Commission (“COSO”). The Company’s management is responsible for maintaining effective internal control over financial reporting and for its assessment of the effectiveness of internal control over financial reporting, included in the accompanying Management’s Report on Internal Control Over Financial Reporting. Our responsibility is to express an opinion on the Company’s internal control over financial reporting based on our audit.
We conducted our audit in accordance with the standards of the Public Company Accounting Oversight Board (United States). Those standards require that we plan and perform the audit to obtain reasonable assurance about whether effective internal control over financial reporting was maintained in all material respects. Our audit included obtaining an understanding of internal control over financial reporting, assessing the risk that a material weakness exists, and testing and evaluating the design and operating effectiveness of internal control based on the assessed risk. Our audit also included performing such other procedures as we considered necessary in the circumstances. We believe that our audit provides a reasonable basis for our opinion.
A company’s internal control over financial reporting is a process designed to provide reasonable assurance regarding the reliability of financial reporting and the preparation of financial statements for external purposes in accordance with generally accepted accounting principles. A company’s internal control over financial reporting includes those policies and procedures that (1) pertain to the maintenance of records that, in reasonable detail, accurately and fairly reflect the transactions and dispositions of the assets of the company; (2) provide reasonable assurance that transactions are recorded as necessary to permit preparation of financial statements in accordance with generally accepted accounting principles, and that receipts and expenditures of the company are being made only in accordance with authorizations of management and directors of the company; and (3) provide reasonable assurance regarding prevention or timely detection of unauthorized acquisition, use, or disposition of the company’s assets that could have a material effect on the financial statements.
Because of its inherent limitations, internal control over financial reporting may not prevent or detect misstatements. Also, projections of any evaluation of effectiveness to future periods are subject to the risk that controls may become inadequate because of changes in conditions, or that the degree of compliance with the policies or procedures may deteriorate.
In our opinion, the Company maintained, in all material respects, effective internal control over financial reporting as of October 2, 20161, 2017, based on criteria established in Internal Control — Integrated Framework (2013) issued by COSO.
We also have audited, in accordance with the standards of the Public Company Accounting Oversight Board (United States), the consolidated balance sheets of Jack in the Box Inc. and subsidiaries as of October 2, 20161, 2017 and September 27, 2015October 2, 2016, and the related consolidated statements of earnings, comprehensive income, cash flows, and stockholders’ (deficit) equity for the fifty-threefifty-two weeks ended October 1, 2017, the fifty-three weeks ended October 2, 2016, and the fifty-two weeks ended September 27, 2015 and September 28, 2014, and our report dated November 22, 201629, 2017, expressed an unqualified opinion on those consolidated financial statements.
/s/ KPMG LLP
San Diego, California
November 22, 201629, 2017
| |
| ITEM 9B. | OTHER INFORMATION |
None.
PART III
| |
| ITEM 10. | DIRECTORS, EXECUTIVE OFFICERS AND CORPORATE GOVERNANCE |
That portion of our definitive Proxy Statement appearing under the captions “Election of Directors,” “Directors“Director Qualifications and Biographical Information,” “Committees of the Board” and “Section 16(a) Beneficial Ownership Reporting Compliance” to be filed with the Commission pursuant to Regulation 14A within 120 days after October 2, 20161, 2017 and to be used in connection with our 20172018 Annual Meeting of Stockholders is hereby incorporated by reference.
Information regarding our executive officers is set forth in Item 1 of Part I of this Report under the caption “Executive Officers.”
That portion of our definitive Proxy Statement appearing under the caption “Committees of the Board - Audit Committee,” relating to the members of the Company’s Audit Committee and the members of the Audit Committee who qualify as financial experts, is also incorporated herein by reference.
That portion of our definitive Proxy Statement appearing under the caption “Stockholder Proposals for the 2017 Annual Meeting,Recommendations and Board Nominations,” relating to the procedures by which stockholders may recommend candidates for director to the Nominating and Governance Committee of the Board of Directors, is also incorporated herein by reference.
We have adopted a Code of Ethics, which applies to all Jack in the Box Inc. directors, officers and employees, including the Chief Executive Officer, Chief Financial Officer, Controller and all of the financial team. The Code of Ethics is posted on the Company’s website, www.jackinthebox.com (under the “Investors — Corporate Governance — Code of Conduct” caption) and is available in print free of charge to any stockholder upon request. We intend to satisfy the disclosure requirement regarding any amendment to, or waiver of, a provision of the Code of Ethics for the Chief Executive Officer, Chief Financial Officer and Controller or persons performing similar functions, by posting such information on our website. No such waivers have been issued during fiscal 20162017.
We have also adopted a set of Corporate Governance Principles and Practices for our Board of Directors and charters for all of our Board Committees, including the Audit, Compensation, and Nominating and Governance Committees. The Corporate Governance Principles and Practices and committee charters are available on our website at www.jackinthebox.com and in print free of charge to any shareholder who requests them. Written requests for our Code of Business Conduct and Ethics, Corporate Governance Principles and Practices and committee charters should be addressed to Jack in the Box Inc., 9330 Balboa Avenue, San Diego, California 92123, Attention: Corporate Secretary.
| |
| ITEM 11. | EXECUTIVE COMPENSATION |
That portion of our definitive Proxy Statement appearing under the caption “Executive Compensation,” “Director Compensation,” “Compensation Committee Interlocks and Insider Participation” and “Compensation Committee Report” to be filed with the Commission pursuant to Regulation 14A within 120 days after October 2, 20161, 2017 and to be used in connection with our 20172018 Annual Meeting of Stockholders is hereby incorporated by reference.
| |
| ITEM 12. | SECURITY OWNERSHIP OF CERTAIN BENEFICIAL OWNERS AND MANAGEMENT AND RELATED STOCKHOLDER MATTERS |
That portion of our definitive Proxy Statement appearing under the caption “Security Ownership of Certain Beneficial Owners and Management” to be filed with the Commission pursuant to Regulation 14A within 120 days after October 2, 20161, 2017 and to be used in connection with our 20172018 Annual Meeting of Stockholders is hereby incorporated by reference. Information regarding equity compensation plans under which Company common stock may be issued as of October 2, 20161, 2017 is set forth in Item 5 of this Report.
| |
| ITEM 13. | CERTAIN RELATIONSHIPS AND RELATED TRANSACTIONS, AND DIRECTOR INDEPENDENCE |
That portion of our definitive Proxy Statement appearing under the caption “Certain Relationships and Related Transactions” and “Director“Directors’ Independence,” if any, to be filed with the Commission pursuant to Regulation 14A within 120 days after October 2, 20161, 2017 and to be used in connection with our 20172018 Annual Meeting of Stockholders is hereby incorporated by reference.
| |
| ITEM 14. | PRINCIPAL ACCOUNTING FEES AND SERVICES |
That portion of our definitive Proxy Statement appearing under the caption “Independent Registered Public Accounting Fees and Services” to be filed with the Commission pursuant to Regulation 14A within 120 days after October 2, 20161, 2017 and to be used in connection with our 20172018 Annual Meeting of Stockholders is hereby incorporated by reference.
PART IV
| |
| ITEM 15. | EXHIBITS, FINANCIAL STATEMENT SCHEDULES |
| |
| ITEM 15(a) (1) | Financial Statements. See Index to Consolidated Financial Statements on page F-1 of this Report. |
| |
| ITEM 15(a) (2) | Financial Statement Schedules. None. |
ITEM 15(a) (3) Exhibits.
|
| | | | | | |
| Number | | Description | | Form | | Filed with SEC |
| 3.1 | | Restated Certificate of Incorporation, as amended, dated September 21, 2007 | | 10-K | | 11/20/2009 |
| | | |
3.1.1 | | | | 8-K | | 9/24/2007 |
| | | | |
| 3.2 | | | | 10-Q | | 8/8/201310/2017 |
| | | | |
| | | | | | | |
| 10.1.1 | | | | 8-K | | 7/1/2010 |
| | | | | | | |
| 10.1.2 | | | | 8-K | | 7/1/2010 |
| | | | | | | |
| 10.1.3 | | | | 8-K | | 7/1/2010 |
| | | | | | | |
| 10.1.4 | | | | 10-Q | | 2/23/2012 |
| | | | | | | |
| 10.1.7 | | | | 8-K | | 3/20/2014 |
| | | | | | | |
| 10.1.8 | | | | 8-K | | 3/20/2014 |
| | | | | | | |
| 10.1.9 | | | | 8-K | | 3/20/2014 |
| 10.1.10 | | | | 8-K | | 7/7/2015 |
| | | | | | |
|
| | | | | | |
| Number | | Description | | Form | | Filed with SEC |
| | | | | | |
| 10.1.11 | | | | 8-K | | 9/22/2016 |
| | | | | | |
| 10.1.12 | | | | 8-K | | 9/22/2016 |
| | | | | | | |
| 10.2* | | | | 10-Q | | 2/20/2008 |
| | | | |
| 10.2.1* | | | | 10-Q | | 5/17/2012 |
| | | | | | | |
| 10.2.2* | | | | 10-K | | 11/21/2014 |
| | | | | | | |
| 10.2.3* | | | | _____ | | Filed herewith |
| | | |
| 10.2.4* | | | | _____ | | Filed herewith |
| | | | | | |
| 10.3* | | | | 10-Q | | 2/18/2009 |
| | | | | | | |
| 10.3.1 * | | | | 8-K | | 9/22/2015 |
| | | | |
| 10.4* | | | | 10-Q | | 2/18/2009 |
| | | | |
| 10.4.1 * | | | | 8-K | | 9/22/2015 |
| | | | | | | |
| 10.5* | | | | 10-K | | 11/22/2006 |
| | | | |
| 10.8* | | Amended and Restated | | DEF 14A | | 1/12/201225/2017 |
| | | | |
| 10.8.1* | | | | 10-Q | | 8/5/2009 |
| | | | | | | |
10.8.3* | | Jack in the Box Inc. Non-Employee Director Stock Option Award Agreement under the 2004 Stock Incentive Plan | | 8-K | | 11/15/2005 |
| | | | | | |
| 10.8.4* | | | | 10-K | | 11/20/2009 |
| | | | | | | |
| 10.8.5* | | | | 10-K | | 11/24/2010 |
| | | | |
| 10.8.6* | | | | 10-Q | | 5/14/2015 |
| | | | | | | |
10.8.7*10.8.9* | | Form of Stock Option and Performance Unit Awards Agreement under the 2004 Stock Incentive Plan | | 10-K | | 11/20/2009 |
| | | | | | |
10.8.8* | | | | 10-Q | | 2/23/2012 |
| | | |
10.8.9* | | Form of Stock Option and Performance Share Awards Agreement under the 2004 Stock Incentive Plan | | 10-K | | 11/22/2013 |
| | | | | | | |
| 10.8.10* | | | | 10-K | | 11/22/2013 |
| | | | | | | |
10.8.11* | | Form of Time-Vesting Restricted Stock Unit Award Agreement under the 2004 Stock Incentive Plan | | 10-Q | | 2/19/2015 |
| | | | | | |
10.8.12* | | Form of Stock Option and Performance Share Award Agreement under the 2004 Stock Incentive Plan | | 10-Q | | 2/19/2015 |
|
| | | | | | |
| Number | | Description | | Form | | Filed with SEC |
10.8.13*10.8.11* | | | | 10-Q | | 2/19/2015 |
| | | | | | |
| 10.8.12* | | | | 10-Q | | 2/19/2015 |
| | | | | | |
| 10.8.13* | | | | 10-Q | | 2/18/2016 |
| | | | | | | |
| 10.8.14* | | | | 10-Q | | 2/18/2016 |
| | | | | | | |
| 10.8.15* | | | | 10-Q | | 5/12/2016 |
| | | | | | | |
10.10.1* | | Amended and Restated Performance Bonus Incentive Plan effective October 4, 2010 | | DEF 14A | | 1/13/2011 |
| | | |
| 10.10.2* | | | | DEF 14A | | 1/11/2016 |
| | | | | | | |
| 10.10.3* | | | | _____ | | Filed herewith |
| | | | | | |
| 10.11* | | | | 10-Q | | 8/10/2012 |
| | | | |
| 21.1 | | | | _____ | | Filed herewith |
| | | | | | |
| 23.1 | | | | _____ | | Filed herewith |
| | | | |
| 31.1 | | | | _____ | | Filed herewith |
| | | | |
| 31.2 | | | | _____ | | Filed herewith |
| | | | |
| 32.1 | | | | _____ | | Filed herewith |
| | | | |
| 32.2 | | | | _____ | | Filed herewith |
| | | | |
| 101.INS | | XBRL Instance Document | | | | |
| | | | |
| 101.SCH | | XBRL Taxonomy Extension Schema Document | | | | |
| | | | |
| 101.CAL | | XBRL Taxonomy Extension Calculation Linkbase Document | | | | |
| | | | |
| 101.DEF | | XBRL Taxonomy Extension Definition Linkbase Document | | | | |
| | | | |
| 101.LAB | | XBRL Taxonomy Extension Label Linkbase Document | | | | |
| | | | |
| 101.PRE | | XBRL Taxonomy Extension Presentation Linkbase Document | | | | |
* Management contract or compensatory plan.
ITEM 15(b) All required exhibits are filed herein or incorporated by reference as described in Item 15(a)(3).
ITEM 15(c) All schedules have been omitted as the required information is inapplicable, immaterial or the information is presented in the consolidated financial statements or related notes.
SIGNATURES
Pursuant to the requirements of Section 13 or 15(d) of the Securities Exchange Act of 1934, the registrant has duly caused this report to be signed on its behalf by the undersigned, thereunto duly authorized.
|
| | |
| | JACK IN THE BOX INC. |
| | By: | /s/ JERRY P. REBEL |
| | | Jerry P. Rebel Executive Vice President and Chief Financial Officer (principal financial officer) (Duly Authorized Signatory) |
| | | November 22, 201629, 2017 |
Pursuant to the requirements of the Securities Exchange Act of 1934, this report has been signed below by the following persons on behalf of the registrant and in the capacities and on the dates indicated.
Each person whose signature appears below constitutes and appoints Leonard A. Comma and Jerry P. Rebel, jointly and severally, his attorneys-in-fact, each with the power of substitution, for him or her in any and all capacities, to sign any amendments to this report, and to file the same, with exhibits thereto and other documents in connection therewith with the Securities and Exchange Commission, hereby ratifying and confirming all that each of said attorneys-in-fact, or his substitute or substitutes may do or cause to be done by virtue hereof.
|
| | | | |
| Signature | | Title | | Date |
| | | |
| /s/ LEONARD A. COMMA | | Chairman of the Board and Chief Executive Officer (principal executive officer) | | November 22, 201629, 2017 |
| Leonard A. Comma | | | | |
| | | |
| /s/ JERRY P. REBEL | | Executive Vice President and Chief Financial Officer (principal financial officer and principal accounting officer) | | November 22, 201629, 2017 |
| Jerry P. Rebel | | | | |
| | | |
| /s/ DAVID L. GOEBEL | | Director | | November 22, 201629, 2017 |
| David L. Goebel | | | | |
| | | |
| /s/ SHARON P. JOHN | | Director | | November 22, 201629, 2017 |
| Sharon P. John | | | | |
| | | | | |
| /s/ MADELEINE A. KLEINER | | Director | | November 22, 201629, 2017 |
| Madeleine A. Kleiner | | | | |
| | | |
| /s/ MICHAEL W. MURPHY | | Director | | November 22, 201629, 2017 |
| Michael W. Murphy | | | | |
| | | |
| /s/ JAMES M. MYERS | | Director | | November 22, 201629, 2017 |
| James M. Myers | | | | |
| | | | | |
| /s/ DAVID M. TEHLE | | Director | | November 22, 201629, 2017 |
| David M. Tehle | | | | |
| | | |
| /s/ JOHN T. WYATT | | Director | | November 22, 201629, 2017 |
| John T. Wyatt | | | | |
| | | | |
| /s/ VIVIEN M. YEUNG | | Director | | November 29, 2017 |
| Vivien M. Yeung | | | | |
INDEX TO CONSOLIDATED FINANCIAL STATEMENTS
|
| | |
| | | |
| | | Page |
| Report of Independent Registered Public Accounting Firm | | |
| Consolidated Balance Sheets | | |
| Consolidated Statements of Earnings | | |
| Consolidated Statements of Comprehensive Income | | |
| Consolidated Statements of Cash Flows | | |
| Consolidated Statements of Stockholders’ (Deficit) Equity | | |
| Notes to Consolidated Financial Statements | | |
Schedules not filed: All schedules have been omitted as the required information is inapplicable, immaterial or the information is presented in the consolidated financial statements or related notes.
Report of Independent Registered Public Accounting Firm
The Board of Directors and Stockholders
Jack in the Box Inc.:
We have audited the accompanying consolidated balance sheets of Jack in the Box Inc. and subsidiaries (the Company) as of October 2, 20161, 2017 and September 27, 2015,October 2, 2016, and the related consolidated statements of earnings, comprehensive income, cash flows, and stockholders’ (deficit) equity for the fifty-two weeks ended October 1, 2017, the fifty-three weeks ended October 2, 2016, and the fifty-two weeks ended September 27, 2015 and September 28, 2014. These consolidated financial statements are the responsibility of the Company’s management. Our responsibility is to express an opinion on these consolidated financial statements based on our audits.
We conducted our audits in accordance with the standards of the Public Company Accounting Oversight Board (United States). Those standards require that we plan and perform the audit to obtain reasonable assurance about whether the financial statements are free of material misstatement. An audit includes examining, on a test basis, evidence supporting the amounts and disclosures in the financial statements. An audit also includes assessing the accounting principles used and significant estimates made by management, as well as evaluating the overall financial statement presentation. We believe that our audits provide a reasonable basis for our opinion.
In our opinion, the consolidated financial statements referred to above present fairly, in all material respects, the financial position of Jack in the Box Inc. and subsidiaries as of October 2, 20161, 2017 and September 27, 2015October 2, 2016, and the results of their operations and their cash flows for the fifty-threefifty-two weeks ended October 1, 2017, the fifty-three weeks ended October 2, 2016, and the fifty-two weeks ended September 27, 2015 and September 28, 2014, in conformity with U.S. generally accepted accounting principles.
We also have audited, in accordance with the standards of the Public Company Accounting Oversight Board (United States), the internal control over financial reporting of Jack in the Box Inc. as of October 2, 20161, 2017, based on criteria established in Internal Control - Integrated Framework (2013) issued by the Committee of Sponsoring Organizations of the Treadway Commission (COSO), and our report dated November 22, 2016,29, 2017, expressed an unqualified opinion on the effectiveness of the Company’s internal control over financial reporting.
/s/ KPMG LLP
San Diego, California
November 22, 201629, 2017
JACK IN THE BOX INC. AND SUBSIDIARIES
CONSOLIDATED BALANCE SHEETS
(In thousands, except share and per share data)
| | | | | October 2,
2016 | | September 27,
2015 | | October 1,
2017 | | October 2,
2016 |
ASSETS | | Current assets: | | | | | | | | |
| Cash | | $ | 17,030 |
| | $ | 17,743 |
| | $ | 7,642 |
| | $ | 17,030 |
|
| Accounts and other receivables, net | | 73,360 |
| | 47,975 |
| | 68,694 |
| | 73,360 |
|
| Inventories | | 8,229 |
| | 7,376 |
| | 6,647 |
| | 8,229 |
|
| Prepaid expenses | | 40,398 |
| | 16,240 |
| | 29,148 |
| | 40,398 |
|
| Assets held for sale | | 14,259 |
| | 15,516 |
| | 24,107 |
| | 14,259 |
|
| Other current assets | | 2,129 |
| | 3,106 |
| | 3,039 |
| | 2,129 |
|
| Total current assets | | 155,405 |
| | 107,956 |
| | 139,277 |
| | 155,405 |
|
| Property and equipment, at cost: | | | | | | | | |
| Land | | 117,166 |
| | 112,991 |
| | 112,509 |
| | 117,166 |
|
| Buildings | | 1,116,244 |
| | 1,091,237 |
| | 1,112,763 |
| | 1,116,244 |
|
| Restaurant and other equipment | | 331,644 |
| | 315,235 |
| | 265,791 |
| | 331,644 |
|
| Construction in progress | | 40,522 |
| | 43,914 |
| | 31,558 |
| | 40,522 |
|
| | | 1,605,576 |
| | 1,563,377 |
| | 1,522,621 |
| | 1,605,576 |
|
| Less accumulated depreciation and amortization | | (886,526 | ) | | (835,114 | ) | | (889,630 | ) | | (886,526 | ) |
| Property and equipment, net | | 719,050 |
| | 728,263 |
| | 632,991 |
| | 719,050 |
|
| Intangible assets, net | | 14,042 |
| | 14,765 |
| | 14,072 |
| | 14,042 |
|
| Goodwill | | 166,046 |
| | 149,027 |
| | 169,049 |
| | 166,046 |
|
| Other assets, net | | 294,248 |
| | 303,968 |
| | 273,032 |
| | 290,469 |
|
| | | $ | 1,348,791 |
| | $ | 1,303,979 |
| | $ | 1,228,421 |
| | $ | 1,345,012 |
|
| LIABILITIES AND STOCKHOLDERS’ (DEFICIT) EQUITY | |
| LIABILITIES AND STOCKHOLDERS’ DEFICIT | | LIABILITIES AND STOCKHOLDERS’ DEFICIT |
| Current liabilities: | | | | | | | | |
| Current maturities of long-term debt | | $ | 57,574 |
| | $ | 26,677 |
| | $ | 64,383 |
| | $ | 55,935 |
|
| Accounts payable | | 40,736 |
| | 32,137 |
| | 37,302 |
| | 40,736 |
|
| Accrued liabilities | | 181,250 |
| | 170,575 |
| | 160,305 |
| | 181,250 |
|
| Total current liabilities | | 279,560 |
| | 229,389 |
| | 261,990 |
| | 277,921 |
|
| Long-term debt, net of current maturities | | 937,512 |
| | 688,579 |
| | 1,080,932 |
| | 935,372 |
|
| Other long-term liabilities | | 348,925 |
| | 370,058 |
| | 273,531 |
| | 348,925 |
|
| Stockholders’ (deficit) equity: | | | | | |
| Stockholders’ deficit: | | | | | |
| Preferred stock $0.01 par value, 15,000,000 shares authorized, none issued | | — |
| | — |
| | — |
| | — |
|
| Common stock $0.01 par value, 175,000,000 shares authorized, 81,598,524 and 81,096,156 issued, respectively | | 816 |
| | 811 |
| |
| Common stock $0.01 par value, 175,000,000 shares authorized, 81,843,483 and 81,598,524 issued, respectively | | | 818 |
| | 816 |
|
| Capital in excess of par value | | 432,564 |
| | 402,986 |
| | 453,530 |
| | 432,564 |
|
| Retained earnings | | 1,399,721 |
| | 1,316,119 |
| | 1,485,820 |
| | 1,399,721 |
|
| Accumulated other comprehensive loss | | (187,021 | ) | | (132,530 | ) | | (137,761 | ) | | (187,021 | ) |
| Treasury stock, at cost, 49,190,992 and 45,314,529 shares, respectively | | (1,863,286 | ) | | (1,571,433 | ) | |
| Total stockholders’ (deficit) equity | | (217,206 | ) | | 15,953 |
| |
| Treasury stock, at cost, 52,411,407 and 49,190,992 shares, respectively | | | (2,190,439 | ) | | (1,863,286 | ) |
| Total stockholders’ deficit | | | (388,032 | ) | | (217,206 | ) |
| | | $ | 1,348,791 |
| | $ | 1,303,979 |
| | $ | 1,228,421 |
| | $ | 1,345,012 |
|
See accompanying notes to consolidated financial statements.
JACK IN THE BOX INC. AND SUBSIDIARIES
CONSOLIDATED STATEMENTS OF EARNINGS
(In thousands, except per share data)
| | | | | Fiscal Year | | Fiscal Year |
| | | 2016 | | 2015 | | 2014 | | 2017 | | 2016 | | 2015 |
| Revenues: | | | | | | | | | | | | |
| Company restaurant sales | | $ | 1,204,535 |
| | $ | 1,156,863 |
| | $ | 1,120,912 |
| | $ | 1,152,479 |
| | $ | 1,204,535 |
| | $ | 1,156,863 |
|
| Franchise rental revenues | | 232,907 |
| | 226,702 |
| | 217,182 |
| | 231,687 |
| | 232,907 |
| | 226,702 |
|
| Franchise royalties and other | | 161,889 |
| | 156,752 |
| | 146,037 |
| | 169,748 |
| | 161,889 |
| | 156,752 |
|
| | | 1,599,331 |
| | 1,540,317 |
| | 1,484,131 |
| | 1,553,914 |
| | 1,599,331 |
| | 1,540,317 |
|
| Operating costs and expenses, net: | | | | | | | | | | | | |
| Company restaurant costs: | | | | | | | | | | | | |
| Food and packaging | | 363,002 |
| | 361,988 |
| | 357,338 |
| | 346,944 |
| | 363,002 |
| | 361,988 |
|
| Payroll and employee benefits | | 334,470 |
| | 313,302 |
| | 308,494 |
| | 333,611 |
| | 334,470 |
| | 313,302 |
|
| Occupancy and other | | 264,158 |
| | 246,023 |
| | 247,861 |
| | 268,546 |
| | 264,158 |
| | 246,023 |
|
| Total company restaurant costs | | 961,630 |
| | 921,313 |
| | 913,693 |
| | 949,101 |
| | 961,630 |
| | 921,313 |
|
| Franchise occupancy expenses | | 170,152 |
| | 170,102 |
| | 169,034 |
| | 171,591 |
| | 170,152 |
| | 170,102 |
|
| Franchise support and other costs | | 15,991 |
| | 15,688 |
| | 13,852 |
| | 14,222 |
| | 15,991 |
| | 15,688 |
|
| Selling, general and administrative expenses | | 203,816 |
| | 221,145 |
| | 206,788 |
| | 165,752 |
| | 203,816 |
| | 221,145 |
|
| Impairment and other charges, net | | 19,057 |
| | 11,757 |
| | 14,908 |
| | 25,141 |
| | 19,057 |
| | 11,757 |
|
(Gains) losses on the sale of company-operated restaurants | | (1,230 | ) | | 3,139 |
| | 3,548 |
| | (38,034 | ) | | (1,230 | ) | | 3,139 |
|
| | | 1,369,416 |
| | 1,343,144 |
| | 1,321,823 |
| | 1,287,773 |
| | 1,369,416 |
| | 1,343,144 |
|
| Earnings from operations | | 229,915 |
| | 197,173 |
| | 162,308 |
| | 266,141 |
| | 229,915 |
| | 197,173 |
|
| Interest expense, net | | 31,081 |
| | 18,803 |
| | 15,678 |
| | 46,518 |
| | 31,081 |
| | 18,803 |
|
| Earnings from continuing operations and before income taxes | | 198,834 |
| | 178,370 |
| | 146,630 |
| | 219,623 |
| | 198,834 |
| | 178,370 |
|
| Income taxes | | 72,564 |
| | 65,769 |
| | 51,786 |
| | 81,315 |
| | 72,564 |
| | 65,769 |
|
| Earnings from continuing operations | | 126,270 |
| | 112,601 |
| | 94,844 |
| | 138,308 |
| | 126,270 |
| | 112,601 |
|
| Losses from discontinued operations, net of income tax benefit | | (2,197 | ) | | (3,789 | ) | | (5,894 | ) | | (2,976 | ) | | (2,197 | ) | | (3,789 | ) |
| Net earnings | | $ | 124,073 |
| | $ | 108,812 |
| | $ | 88,950 |
| | $ | 135,332 |
| | $ | 124,073 |
| | $ | 108,812 |
|
| | | | | | | | | | | | | |
| Net earnings per share — basic: | | | | | | | | | | | | |
| Earnings from continuing operations | | $ | 3.74 |
| | $ | 3.00 |
| | $ | 2.33 |
| | $ | 4.52 |
| | $ | 3.74 |
| | $ | 3.00 |
|
| Losses from discontinued operations | | (0.07 | ) | | (0.10 | ) | | (0.14 | ) | | (0.10 | ) | | (0.07 | ) | | (0.10 | ) |
| Net earnings per share (1) | | $ | 3.68 |
| | $ | 2.89 |
| | $ | 2.18 |
| | $ | 4.42 |
| | $ | 3.68 |
| | $ | 2.89 |
|
| Net earnings per share — diluted: | | | | | | | | | | | | |
| Earnings from continuing operations | | $ | 3.70 |
| | $ | 2.95 |
| | $ | 2.26 |
| | $ | 4.47 |
| | $ | 3.70 |
| | $ | 2.95 |
|
| Losses from discontinued operations | | (0.06 | ) | | (0.10 | ) | | (0.14 | ) | | (0.10 | ) | | (0.06 | ) | | (0.10 | ) |
| Net earnings per share (1) | | $ | 3.63 |
| | $ | 2.85 |
| | $ | 2.12 |
| | $ | 4.38 |
| | $ | 3.63 |
| | $ | 2.85 |
|
| | | | | | | | | | | | | |
| Weighted-average shares outstanding: | | | | | | | | | | | | |
| Basic | | 33,735 |
| | 37,587 |
| | 40,781 |
| | 30,630 |
| | 33,735 |
| | 37,587 |
|
| Diluted | | 34,146 |
| | 38,215 |
| | 41,973 |
| | 30,914 |
| | 34,146 |
| | 38,215 |
|
| | | | | | | | | | | | | |
| Cash dividends declared per common share | | $ | 1.20 |
| | $ | 1.00 |
| | $ | 0.40 |
| | $ | 1.60 |
| | $ | 1.20 |
| | $ | 1.00 |
|
________________________
(1) Earnings per share may not add due to rounding.
See accompanying notes to consolidated financial statements.
JACK IN THE BOX INC. AND SUBSIDIARIES
CONSOLIDATED STATEMENTS OF COMPREHENSIVE INCOME
(In thousands)
| | | | | Fiscal Year | | Fiscal Year |
| | | 2016 | | 2015 | | 2014 | | 2017 | | 2016 | | 2015 |
| | | | | | | | | | | | | |
| Net earnings | | $ | 124,073 |
| | $ | 108,812 |
| | $ | 88,950 |
| | $ | 135,332 |
| | $ | 124,073 |
| | $ | 108,812 |
|
| Cash flow hedges: | | | | | | | | | | | | |
| Net change in fair value of derivatives | | (25,439 | ) | | (26,596 | ) | | (1,890 | ) | | 19,768 |
| | (25,439 | ) | | (26,596 | ) |
| Net loss reclassified to earnings | | 4,048 |
| | 2,011 |
| | 1,291 |
| | 5,070 |
| | 4,048 |
| | 2,011 |
|
| | | (21,391 | ) | | (24,585 | ) | | (599 | ) | | 24,838 |
| | (21,391 | ) | | (24,585 | ) |
| Tax effect | | 8,281 |
| | 9,517 |
| | 229 |
| | (9,592 | ) | | 8,281 |
| | 9,517 |
|
| | | (13,110 | ) | | (15,068 | ) | | (370 | ) | | 15,246 |
| | (13,110 | ) | | (15,068 | ) |
| Unrecognized periodic benefit costs: | | | | | | | | | | | | |
| Actuarial losses arising during the period | | (71,971 | ) | | (54,407 | ) | | (49,173 | ) | |
| Actuarial gains (losses) arising during the period | | | 49,025 |
| | (71,971 | ) | | (54,407 | ) |
| Actuarial losses and prior service cost reclassified to earnings | | 4,546 |
| | 9,863 |
| | 5,245 |
| | 6,429 |
| | 4,546 |
| | 9,863 |
|
| | | (67,425 | ) | | (44,544 | ) | | (43,928 | ) | | 55,454 |
| | (67,425 | ) | | (44,544 | ) |
| Tax effect | | 26,087 |
| | 17,243 |
| | 16,821 |
| | (21,418 | ) | | 26,087 |
| | 17,243 |
|
| | | (41,338 | ) | | (27,301 | ) | | (27,107 | ) | | 34,036 |
| | (41,338 | ) | | (27,301 | ) |
| Other: | | | | | | | | | | | | |
| Foreign currency translation adjustments | | (70 | ) | | (45 | ) | | 10 |
| | (35 | ) | | (70 | ) | | (45 | ) |
| Tax effect | | 27 |
| | 16 |
| | (3 | ) | | 13 |
| | 27 |
| | 16 |
|
| | | (43 | ) | | (29 | ) | | 7 |
| | (22 | ) | | (43 | ) | | (29 | ) |
| | | | | | | | | | | | | |
| Other comprehensive loss, net of tax | | (54,491 | ) | | (42,398 | ) | | (27,470 | ) | |
| Other comprehensive income (loss), net of tax | | | 49,260 |
| | (54,491 | ) | | (42,398 | ) |
| | | | | | | | | | | | | |
| Comprehensive income | | $ | 69,582 |
| | $ | 66,414 |
| | $ | 61,480 |
| | $ | 184,592 |
| | $ | 69,582 |
| | $ | 66,414 |
|
See accompanying notes to consolidated financial statements.
JACK IN THE BOX INC. AND SUBSIDIARIES
CONSOLIDATED STATEMENTS OF CASH FLOWS
(In thousands)
| | | | | Fiscal Year | | Fiscal Year |
| | | 2016 | | 2015 | | 2014 | | 2017 | | 2016 | | 2015 |
| Cash flows from operating activities: | | | | | | | | | | | | |
| Net earnings | | $ | 124,073 |
| | $ | 108,812 |
| | $ | 88,950 |
| | $ | 135,332 |
| | $ | 124,073 |
| | $ | 108,812 |
|
| Adjustments to reconcile net earnings to net cash provided by operating activities: | | | | | | | | | | | | |
| Depreciation and amortization | | 92,844 |
| | 89,468 |
| | 91,384 |
| | 88,939 |
| | 92,844 |
| | 89,468 |
|
| Deferred finance cost amortization | | 2,736 |
| | 2,309 |
| | 2,175 |
| | 3,487 |
| | 2,736 |
| | 2,309 |
|
| Excess tax benefits from share-based compensation arrangements | | (7,461 | ) | | (18,602 | ) | | (17,664 | ) | | (4,232 | ) | | (7,461 | ) | | (18,602 | ) |
| Deferred income taxes | | 34,973 |
| | (3,191 | ) | | 4,152 |
| | (12,208 | ) | | 34,973 |
| | (3,191 | ) |
| Share-based compensation expense | | 11,455 |
| | 12,420 |
| | 10,358 |
| | 11,416 |
| | 11,455 |
| | 12,420 |
|
| Pension and postretirement expense | | 13,484 |
| | 18,749 |
| | 13,760 |
| | 4,215 |
| | 13,484 |
| | 18,749 |
|
(Gains) losses on cash surrender value of company-owned life insurance | | (5,365 | ) | | 1,240 |
| | (6,049 | ) | | (2,424 | ) | | (5,365 | ) | | 1,240 |
|
(Gains) losses on the sale of company-operated restaurants | | (1,230 | ) | | 3,139 |
| | 3,548 |
| | (38,034 | ) | | (1,230 | ) | | 3,139 |
|
| Losses on the disposition of property and equipment | | 2,654 |
| | 1,847 |
| | 1,680 |
| | 3,635 |
| | 2,654 |
| | 1,847 |
|
| Impairment charges and other | | 4,759 |
| | 6,815 |
| | 10,434 |
| | 7,940 |
| | 4,759 |
| | 6,815 |
|
| Loss on early retirement of debt | | — |
| | — |
| | 789 |
| |
| Changes in assets and liabilities: | | | | | | | |
| Changes in assets and liabilities, excluding acquisitions and dispositions: | | | | | | | |
| Accounts and other receivables | | (28,181 | ) | | (82 | ) | | 19,589 |
| | (5,774 | ) | | (28,181 | ) | | (82 | ) |
| Inventories | | (713 | ) | | 105 |
| | (300 | ) | | 1,771 |
| | (713 | ) | | 105 |
|
| Prepaid expenses and other current assets | | (15,367 | ) | | 35,255 |
| | 14,051 |
| | 14,831 |
| | (15,367 | ) | | 35,255 |
|
| Accounts payable | | 2,225 |
| | 2,281 |
| | (627 | ) | | 480 |
| | 2,225 |
| | 2,281 |
|
| Accrued liabilities | | 8,662 |
| | 798 |
| | 7,140 |
| | (20,704 | ) | | 8,662 |
| | 798 |
|
| Pension and postretirement contributions | | (101,052 | ) | | (25,374 | ) | | (25,349 | ) | | (5,363 | ) | | (101,052 | ) | | (25,374 | ) |
| Other | | (4,314 | ) | | (9,114 | ) | | (16,999 | ) | | (11,470 | ) | | (4,314 | ) | | (9,114 | ) |
| Cash flows provided by operating activities | | 134,182 |
| | 226,875 |
| | 201,022 |
| | 171,837 |
| | 134,182 |
| | 226,875 |
|
| Cash flows from investing activities: | | | | | | | | | | | | |
| Purchases of property and equipment | | (96,615 | ) | | (86,226 | ) | | (60,525 | ) | | (67,453 | ) | | (96,615 | ) | | (86,226 | ) |
| Purchases of assets intended for sale and leaseback | | (9,785 | ) | | (10,396 | ) | | (2,801 | ) | | (5,769 | ) | | (9,785 | ) | | (10,396 | ) |
| Proceeds from sale and leaseback of assets | | 17,123 |
| | — |
| | 5,698 |
| |
| Proceeds from the sale and leaseback of assets | | | 6,057 |
| | 17,123 |
| | — |
|
| Proceeds from the sale of company-operated restaurants | | 1,439 |
| | 3,951 |
| | 10,536 |
| | 99,591 |
| | 1,439 |
| | 3,951 |
|
| Collections on notes receivable | | 3,555 |
| | 5,917 |
| | 2,974 |
| | 1,715 |
| | 3,555 |
| | 5,917 |
|
| Acquisition of franchise-operated restaurants | | (19,816 | ) | | — |
| | (1,750 | ) | | (2,053 | ) | | (19,816 | ) | | — |
|
| Other | | (299 | ) | | 2,281 |
| | 2,889 |
| | 1,251 |
| | (299 | ) | | 2,281 |
|
| Cash flows used in investing activities | | (104,398 | ) | | (84,473 | ) | | (42,979 | ) | |
| Cash flows provided by (used in) investing activities | | | 33,339 |
| | (104,398 | ) | | (84,473 | ) |
| Cash flows from financing activities: | | | | | | | | | | | | |
| Borrowings on revolving credit facilities | | 705,000 |
| | 857,000 |
| | 652,000 |
| | 747,900 |
| | 705,000 |
| | 857,000 |
|
| Repayments of borrowings on revolving credit facilities | | (817,578 | ) | | (768,000 | ) | | (521,000 | ) | | (533,300 | ) | | (817,578 | ) | | (768,000 | ) |
| Proceeds from issuance of debt | | 417,578 |
| | 300,000 |
| | 200,000 |
| | — |
| | 417,578 |
| | 300,000 |
|
| Principal repayments on debt | | (26,154 | ) | | (198,397 | ) | | (193,399 | ) | | (57,404 | ) | | (26,154 | ) | | (198,397 | ) |
| Debt issuance costs | | (2,385 | ) | | (2,030 | ) | | (3,607 | ) | | — |
| | (2,385 | ) | | (2,030 | ) |
| Dividends paid on common stock | | (40,295 | ) | | (37,390 | ) | | (15,808 | ) | | (48,925 | ) | | (40,295 | ) | | (37,390 | ) |
| Proceeds from issuance of common stock | | 10,564 |
| | 15,170 |
| | 31,748 |
| | 5,165 |
| | 10,564 |
| | 15,170 |
|
| Repurchases of common stock | | (284,645 | ) | | (320,163 | ) | | (323,866 | ) | | (334,361 | ) | | (284,645 | ) | | (320,163 | ) |
| Excess tax benefits from share-based compensation arrangements | | 7,461 |
| | 18,602 |
| | 17,664 |
| | 4,232 |
| | 7,461 |
| | 18,602 |
|
| Change in book overdraft | | — |
| | — |
| | (848 | ) | | 2,151 |
| | — |
| | — |
|
| Cash flows used in financing activities | | (30,454 | ) | | (135,208 | ) | | (157,116 | ) | | (214,542 | ) | | (30,454 | ) | | (135,208 | ) |
| Effect of exchange rate changes on cash | | (43 | ) | | (29 | ) | | 7 |
| | (22 | ) | | (43 | ) | | (29 | ) |
| Net (decrease) increase in cash | | (713 | ) | | 7,165 |
| | 934 |
| | (9,388 | ) | | (713 | ) | | 7,165 |
|
| Cash at beginning of year | | 17,743 |
| | 10,578 |
| | 9,644 |
| | 17,030 |
| | 17,743 |
| | 10,578 |
|
| Cash at end of year | | $ | 17,030 |
| | $ | 17,743 |
| | $ | 10,578 |
| | $ | 7,642 |
| | $ | 17,030 |
| | $ | 17,743 |
|
See accompanying notes to consolidated financial statements.
JACK IN THE BOX INC. AND SUBSIDIARIES
CONSOLIDATED STATEMENTS OF STOCKHOLDERS’ (DEFICIT) EQUITY
(Dollars in thousands)
| | | | | Number of Shares | | Amount | | Capital in Excess of Par Value | | Retained Earnings | | Accumulated Other Comprehensive Loss | | Treasury Stock | | Total | | Number of Shares | | Amount | | Capital in Excess of Par Value | | Retained Earnings | | Accumulated Other Comprehensive Loss | | Treasury Stock | | Total |
| Balance at September 29, 2013 | | 78,515,171 |
| | $ | 785 |
| | $ | 296,764 |
| | $ | 1,171,823 |
| | $ | (62,662 | ) | | $ | (934,692 | ) | | $ | 472,018 |
| |
| Shares issued under stock plans, including tax benefit | | 1,612,216 |
| | 16 |
| | 49,605 |
| | — |
| | — |
| | — |
| | 49,621 |
| |
| Share-based compensation | | — |
| | — |
| | 10,358 |
| | — |
| | — |
| | — |
| | 10,358 |
| |
| Dividends declared | | — |
| | — |
| | — |
| | (15,876 | ) | | — |
| | — |
| | (15,876 | ) | |
| Purchases of treasury stock | | — |
| | — |
| | — |
| | — |
| | — |
| | (319,690 | ) | | (319,690 | ) | |
| Net earnings | | — |
| | — |
| | — |
| | 88,950 |
| | — |
| | — |
| | 88,950 |
| |
| Foreign currency translation adjustment | | — |
| | — |
| | — |
| | — |
| | 7 |
| | — |
| | 7 |
| |
| Effect of interest rate swaps, net | | — |
| | — |
| | — |
| | — |
| | (370 | ) | | — |
| | (370 | ) | |
| Effect of actuarial losses and prior service cost, net | | — |
| | — |
| | — |
| | — |
| | (27,107 | ) | | — |
| | (27,107 | ) | |
| Balance at September 28, 2014 | | 80,127,387 |
| | 801 |
| | 356,727 |
| | 1,244,897 |
| | (90,132 | ) | | (1,254,382 | ) | | 257,911 |
| | 80,127,387 |
| | $ | 801 |
| | $ | 356,727 |
| | $ | 1,244,897 |
| | $ | (90,132 | ) | | $ | (1,254,382 | ) | | $ | 257,911 |
|
| Shares issued under stock plans, including tax benefit | | 968,769 |
| | 10 |
| | 33,762 |
| | — |
| | — |
| | — |
| | 33,772 |
| | 968,769 |
| | 10 |
| | 33,762 |
| | — |
| | — |
| | — |
| | 33,772 |
|
| Share-based compensation | | — |
| | — |
| | 12,420 |
| | — |
| | — |
| | — |
| | 12,420 |
| | — |
| | — |
| | 12,420 |
| | — |
| | — |
| | — |
| | 12,420 |
|
| Dividends declared | | — |
| | — |
| | 77 |
| | (37,590 | ) | | — |
| | — |
| | (37,513 | ) | | — |
| | — |
| | 77 |
| | (37,590 | ) | | — |
| | — |
| | (37,513 | ) |
| Purchases of treasury stock | | — |
| | — |
| | — |
| | — |
| | — |
| | (317,051 | ) | | (317,051 | ) | | — |
| | — |
| | — |
| | — |
| | — |
| | (317,051 | ) | | (317,051 | ) |
| Net earnings | | — |
| | — |
| | — |
| | 108,812 |
| | — |
| | — |
| | 108,812 |
| | — |
| | — |
| | — |
| | 108,812 |
| | — |
| | — |
| | 108,812 |
|
| Foreign currency translation adjustment | | — |
| | — |
| | — |
| | — |
| | (29 | ) | | — |
| | (29 | ) | | — |
| | — |
| | — |
| | — |
| | (29 | ) | | — |
| | (29 | ) |
| Effect of interest rate swaps, net | | — |
| | — |
| | — |
| | — |
| | (15,068 | ) | | — |
| | (15,068 | ) | | — |
| | — |
| | — |
| | — |
| | (15,068 | ) | | — |
| | (15,068 | ) |
| Effect of actuarial losses and prior service cost, net | | — |
| | — |
| | — |
| | — |
| | (27,301 | ) | | — |
| | (27,301 | ) | | — |
| | — |
| | — |
| | — |
| | (27,301 | ) | | — |
| | (27,301 | ) |
| Balance at September 27, 2015 | | 81,096,156 |
| | 811 |
| | 402,986 |
| | 1,316,119 |
| | (132,530 | ) | | (1,571,433 | ) | | 15,953 |
| | 81,096,156 |
| | 811 |
| | 402,986 |
| | 1,316,119 |
| | (132,530 | ) | | (1,571,433 | ) | | 15,953 |
|
| Shares issued under stock plans, including tax benefit | | 502,368 |
| | 5 |
| | 18,020 |
| | — |
| | — |
| | — |
| | 18,025 |
| | 502,368 |
| | 5 |
| | 18,020 |
| | — |
| | — |
| | — |
| | 18,025 |
|
| Share-based compensation | | — |
| | — |
| | 11,455 |
| | — |
| | — |
| | — |
| | 11,455 |
| | — |
| | — |
| | 11,455 |
| | — |
| | — |
| | — |
| | 11,455 |
|
| Dividends declared | | — |
| | — |
| | 103 |
| | (40,471 | ) | | — |
| | — |
| | (40,368 | ) | | — |
| | — |
| | 103 |
| | (40,471 | ) | | — |
| | — |
| | (40,368 | ) |
| Purchases of treasury stock | | — |
| | — |
| | — |
| | — |
| | — |
| | (291,853 | ) | | (291,853 | ) | | — |
| | — |
| | — |
| | — |
| | — |
| | (291,853 | ) | | (291,853 | ) |
| Net earnings | | — |
| | — |
| | — |
| | 124,073 |
| | — |
| | — |
| | 124,073 |
| | — |
| | — |
| | — |
| | 124,073 |
| | — |
| | — |
| | 124,073 |
|
| Foreign currency translation adjustment | | — |
| | — |
| | — |
| | — |
| | (43 | ) | | — |
| | (43 | ) | | — |
| | — |
| | — |
| | — |
| | (43 | ) | | — |
| | (43 | ) |
| Effect of interest rate swaps, net | | — |
| | — |
| | — |
| | — |
| | (13,110 | ) | | — |
| | (13,110 | ) | | — |
| | — |
| | — |
| | — |
| | (13,110 | ) | | — |
| | (13,110 | ) |
| Effect of actuarial losses and prior service cost, net | | — |
| | — |
| | — |
| | — |
| | (41,338 | ) | | — |
| | (41,338 | ) | | — |
| | — |
| | — |
| | — |
| | (41,338 | ) | | — |
| | (41,338 | ) |
| Balance at October 2, 2016 | | 81,598,524 |
| | $ | 816 |
| | $ | 432,564 |
| | $ | 1,399,721 |
| | $ | (187,021 | ) | | $ | (1,863,286 | ) | | $ | (217,206 | ) | | 81,598,524 |
| | 816 |
| | 432,564 |
| | 1,399,721 |
| | (187,021 | ) | | (1,863,286 | ) | | (217,206 | ) |
| Shares issued under stock plans, including tax benefit | | | 244,959 |
| | 2 |
| | 9,395 |
| | — |
| | — |
| | — |
| | 9,397 |
|
| Share-based compensation | | | — |
| | — |
| | 11,416 |
| | — |
| | — |
| | — |
| | 11,416 |
|
| Dividends declared | | | — |
| | — |
| | 155 |
| | (49,233 | ) | | — |
| | — |
| | (49,078 | ) |
| Purchases of treasury stock | | | — |
| | — |
| | — |
| | — |
| | — |
| | (327,153 | ) | | (327,153 | ) |
| Net earnings | | | — |
| | — |
| | — |
| | 135,332 |
| | — |
| | — |
| | 135,332 |
|
| Foreign currency translation adjustment | | | — |
| | — |
| | — |
| | — |
| | (22 | ) | | — |
| | (22 | ) |
| Effect of interest rate swaps, net | | | — |
| | — |
| | — |
| | — |
| | 15,246 |
| | — |
| | 15,246 |
|
| Effect of actuarial gains and prior service cost, net | | | — |
| | — |
| | — |
| | — |
| | 34,036 |
| | — |
| | 34,036 |
|
| Balance at October 1, 2017 | | | 81,843,483 |
| | $ | 818 |
| | $ | 453,530 |
| | $ | 1,485,820 |
| | $ | (137,761 | ) | | $ | (2,190,439 | ) | | $ | (388,032 | ) |
See accompanying notes to consolidated financial statements.
JACK IN THE BOX INC. AND SUBSIDIARIES
NOTES TO CONSOLIDATED FINANCIAL STATEMENTS
1. NATURE OF OPERATIONS AND SUMMARY OF SIGNIFICANT ACCOUNTING POLICIES
Nature of operations — Founded in 1951, Jack in the Box Inc. (the “Company”) operates and franchises Jack in the Box® quick-service restaurants and Qdoba Mexican Eats® (“Qdoba”) fast-casual restaurants. The following table summarizes the number of restaurants as of the end of each fiscal year:
| | | | | 2016 | | 2015 | | 2014 | | 2017 | | 2016 | | 2015 |
| Jack in the Box: | | |
| Company-operated | | 417 | | 413 | | 431 | | 276 | | 417 | | 413 |
| Franchise | | 1,838 | | 1,836 | | 1,819 | | 1,975 | | 1,838 | | 1,836 |
| Total system | | 2,255 | | 2,249 | | 2,250 | | 2,251 | | 2,255 | | 2,249 |
| Qdoba: | | | | |
| Company-operated | | 367 | | 322 | | 310 | | 385 | | 367 | | 322 |
| Franchise | | 332 | | 339 | | 328 | | 341 | | 332 | | 339 |
| Total system | | 699 | | 661 | | 638 | | 726 | | 699 | | 661 |
References to the Company throughout these notes to the consolidated financial statements are made using the first person notations of “we,” “us” and “our.”
Basis of presentation — The accompanying consolidated financial statements have been prepared in accordance with U.S. generally accepted accounting principles (“U.S. GAAP”) and the rules and regulations of the Securities and Exchange Commission (“SEC”). During fiscal 2012, we entered into an agreement to outsource our Jack in the Box distribution business. In fiscal 2013, we closed 62 Qdoba restaurants (the “2013 Qdoba Closures”) as part of a comprehensive Qdoba market performance review. The results of operations for our distribution business and for the 2013 Qdoba Closures are reported as discontinued operations for all periods presented. Refer to Note 2, Discontinued Operations, for additional information. Unless otherwise noted, amounts and disclosures throughout these notes to the consolidated financial statements relate to our continuing operations.
Reclassifications and adjustments — Certain prior year amounts in the consolidated balance sheets have been reclassified in the table disclosing the fair values of our defined benefit pension plan’s assets within Note 11, Retirement Plans, to conformdue to the fiscal 2016 presentation.adoption of a new accounting pronouncement. See discussion below.
Fiscal year — Our fiscal year is 5352 or 5253 weeks ending the Sunday closest to September 30. Comparisons throughout these notes to the consolidated financial statements refer to the 52-week period ended October 1, 2017 for the fiscal year 2017, 53-week period ended October 2, 2016 for the fiscal year 2016 and 52-week periodsperiod ended September 27, 2015 and September 28, 2014 for fiscal years 20152016 and 2014,2015, respectively.
Principles of consolidation — The consolidated financial statements include the accounts of the Company, its wholly-owned subsidiaries and the accounts of any variable interest entities (“VIEs”) where we are deemed the primary beneficiary. All significant intercompany accounts and transactions are eliminated.
The Financial Accounting Standards Board (“FASB”) authoritative guidance on consolidation requires the primary beneficiary of a VIE to consolidate that entity. The primary beneficiary of a VIE is an enterprise that has a controlling financial interest in the VIE. Controlling financial interest exists when an enterprise has both the power to direct the activities that most significantly impact the VIE’s economic performance and the obligation to absorb losses or the right to receive benefits of the VIE that could potentially be significant to the VIE.
The primary entities in which we possess a variable interest are franchise entities, which operate our franchise restaurants. We do not possess any ownership interests in franchise entities. We have reviewed these franchise entities and determined that we are not the primary beneficiary of the entities and therefore, these entities have not been consolidated. We hold and consolidate a variable interest in a subsidiary formed for the purpose of operating a franchisee lending program. The financial results and position of our VIE are immaterial to our consolidated financial statements.
Use of estimates — In preparing the consolidated financial statements in conformity with U.S. GAAP, management is required to make certain assumptions and estimates that affect reported amounts of assets, liabilities, revenues, expenses and the disclosure of contingencies. In making these assumptions and estimates, management may from time to time seek advice and consider information provided by actuaries and other experts in a particular area. Actual amounts could differ materially from these estimates.
JACK IN THE BOX INC. AND SUBSIDIARIES
NOTES TO CONSOLIDATED FINANCIAL STATEMENTS
Accounts and other receivables, net is primarily comprised of receivables from franchisees, tenants and credit card processors. Franchisee receivables primarily include rents, royalties, and marketing fees associated with lease and franchise agreements. Tenant receivables relate to subleased properties where we are on the master lease agreement. We accrue interest on notes receivable based on the contractual terms. The allowance for doubtful accounts is based on historical experience and a review of existing receivables. Changes in accounts and other receivables are classified as an operating activity in the consolidated statements of cash flows.
Inventories consist principally of food, packaging and supplies, and are valued at the lower of cost or market on a first-in, first-out basis. Changes in inventories are classified as an operating activity in the consolidated statements of cash flows.
Assets held for sale typically represent the costs for new sites and existing sites that we plan to sell and lease back within the next year. Gains or losses realized on sale-leaseback transactions are deferred and amortized over the lease terms. Assets held for sale also periodically includes the net book value of property and/or equipment we plan to sell within the next year. If the determination is made that we no longer expect to sell an asset within the next year, the asset is reclassified out of assets held for sale. Assets held for sale also periodically includes the net book value of property and/or equipment we plan to sell within the next year. Assets held for sale consisted of the following at each fiscal year-end (in thousands):
| | | | | 2016 | | 2015 | | 2017 | | 2016 |
| Assets held for sale and leaseback | | $ | 14,259 |
| | $ | 15,216 |
| | $ | 15,792 |
| | $ | 14,259 |
|
| Other property and equipment held for sale | | — |
| | 300 |
| | 8,315 |
| | — |
|
| Assets held for sale | | $ | 14,259 |
| | $ | 15,516 |
| | $ | 24,107 |
| | $ | 14,259 |
|
Property and equipment, net — Expenditures for new facilities and equipment, and those that substantially increase the useful lives of the property, are capitalized. Facilities leased under capital leases are stated at the present value of minimum lease payments at the beginning of the lease term, not to exceed fair value. Maintenance and repairs are expensed as incurred. When property and equipment are retired or otherwise disposed of, the related cost and accumulated depreciation are removed from the accounts, and gains or losses on the dispositions are reflected in results of operations.
Buildings, equipment and leasehold improvements are generally depreciated using the straight-line method based on the estimated useful lives of the assets, over the initial lease term for certain assets acquired in conjunction with the lease commencement for leased properties, or the remaining lease term for certain assets acquired after the commencement of the lease for leased properties. In certain situations, one or more option periods may be used in determining the depreciable life of assets related to leased properties if we deem that an economic penalty would be incurred otherwise. In either circumstance, our policy requires lease term consistency when calculating the depreciation period, in classifying the lease and in computing straight-line rent expense. Building, leasehold improvement assets and equipment are assigned lives that range from 1 to 35 years. Depreciation expense related to property and equipment was $88.2 million, $92.1 million and $88.8 million and $90.7 million in fiscal year 2017, 2016, 2015, and 20142015, respectively.
Impairment of long-lived assets — We evaluate our long-lived assets, such as property and equipment, for impairment on an annual basis or whenever events or changes in circumstances indicate that their carrying value may not be recoverable. This review generally includes a restaurant-level analysis, except when we are actively selling a group of restaurants in which case we perform our impairment evaluations at the group level. Impairment evaluations for individual restaurants take into consideration a restaurant’s operating cash flows, the period of time since a restaurant has been opened or remodeled, refranchising expectations, if any, and the maturity of the related market, which are all significant unobservable inputs (“Level 3 Inputs”). Impairment evaluations for a group of restaurants take into consideration the group’s expected future cash flows and sales proceeds from bids received, if any, or fair market value based on, among other considerations, the specific sales and cash flows of those restaurants. If the assets of a restaurant or group of restaurants subject to our impairment evaluation are not recoverable based upon the forecasted, undiscounted cash flows, we recognize an impairment loss by the amount which the carrying value of the assets exceeds fair value. Refer to Note 9, Impairment and Other Charges, Net, for additional information. Long-lived assets that meet the held for sale criteria, which excludes assets intended to be sold and leased back, are held for sale and reported at the lower of their carrying value or fair value, less estimated costs to sell.
JACK IN THE BOX INC. AND SUBSIDIARIES
NOTES TO CONSOLIDATED FINANCIAL STATEMENTS
Goodwill and intangible assets — Goodwill is the excess of the purchase price over the fair value of identifiable net assets acquired, if any. We generally record goodwill in connection with the acquisition of restaurants from franchisees. Likewise, upon the sale of restaurants to franchisees, goodwill is decremented. The amount of goodwill written-off is determined as the fair value of the reporting unitbusiness disposed of as a percentage of the fair value of the reporting unit retained. If the business disposed of was never fully integrated into the reporting unit after its acquisition, and thus the benefits of the acquired goodwill were never realized, the current carrying amount of the acquired goodwill is written off. Goodwill is evaluated for impairment annually, or more frequently if indicators of impairment are present. We first assess qualitative factors to determine whether the existence of events or circumstances leadslead to a determination that it is more likely than not that the fair value of a reporting unit is less than its carrying amount. If the qualitative factors indicate that it is more likely than not that the fair value of a reporting unit is less than its carrying amount, we perform a two-stepsingle-step impairment test of goodwill. In the first step,To perform our impairment analysis, we estimate the fair value of the reporting unit using Level 3 Inputs and compare it to the carrying value of the reporting unit. If the carrying value exceeds the fair value of the reporting unit, the second step is performed to measure the amount of the impairment loss, if any. In the second step, the amount of thean impairment loss is recognized equal to the excess of the carrying amount of the goodwill over its implied fair value.excess.
Intangible assets, net is comprised primarily of our Qdoba trademark, acquired franchise contract costs, lease acquisition costs and reacquired franchise rights. Our Qdoba trademark and acquired franchise contract costs were recorded in connection with our acquisition of Qdoba Restaurant Corporation in fiscal 2003. Our Qdoba trademark asset has an indefinite life and is not amortized. Acquired franchise contract costs represent the acquired value of franchise contracts, which are amortized over the term of the franchise agreements plus options based on the projected royalty revenue stream. Our Qdoba trademark asset has an indefinite life and is not amortized. Lease acquisition costs primarily represent the fair values of acquired lease contracts having contractual rents lower than fair market rents and are amortized on a straight-line basis over the remaining initial lease term. Reacquired franchise rights are recorded in connection with our acquisition of franchised restaurants and are amortized over the remaining contractual period of the franchise contract in which the right was granted.
Our non-amortizing intangible asset is evaluated for impairment annually, or more frequently if indicators of impairment are present. We first assess qualitative factors to determine whether the existence of events or circumstances leads to a determination that it is more likely than not that the fair value of the intangible asset is less than its carrying amount. If the qualitative factors indicate that it is more likely than not that the fair value of the intangible asset is less than its carrying amount, we compare the fair value of the non-amortizing intangible asset, established using Level 3 Inputs, with its carrying amount. If the carrying amount of an intangible asset exceeds its fair value, an impairment loss is recognized equal to the excess.
Refer to Note 4, Goodwill and Intangible Assets, Net, for additional information.
Company-owned life insurance — We have purchased company-owned life insurance (“COLI”) policies to support our non-qualified benefit plans. The cash surrender values of these policies were $106.0$110.1 million and $99.5$106.0 million as of October 1, 2017 and October 2, 2016, and September 27, 2015, respectively, and are included in other assets, net in the accompanying consolidated balance sheets. Changes in cash surrender values are included in selling, general and administrative expenses in the accompanying consolidated statements of earnings. These policies reside in an umbrella trust for use only to pay plan benefits to participants or to pay creditors if the Company becomes insolvent.
Leases — We review all leases for capital or operating classification at their inception under the FASB authoritative guidance for leases. Our operations are primarily conducted under operating leases. Within the provisions of certain leases, there are rent holidays and escalations in payments over the base lease term, as well as renewal periods. The effects of the holidays and escalations have been reflected in rent expense on a straight-line basis over the expected lease term. Differences between amounts paid and amounts expensed are recorded as deferred rent. Certain leases also provide for tenant incentives used to fund leasehold improvements. Tenant incentives are recorded as deferred tenant improvement allowances in our consolidated balance sheets based on their short-term or long-term nature, and are amortized as reductions of rent expense over the term of the corresponding lease. The lease term commences on the date when we have the right to control the use of the leased property. Certain leases also include contingent rent provisions based on sales levels, which are accrued at the point in time we determine that it is probable such sales levels will be achieved. Refer to Note 8, Leases, for additional information.
Revenue recognition — Revenue from company restaurant sales is recognized when the food and beverage products are sold and are presented net of sales taxes.
Our franchise arrangements generally provide for franchise fees and continuing fees based upon a percentage of sales (“royalties”). In order to renew a franchise agreement upon expiration, a franchisee must obtain the Company’s approval and pay then current fees. Franchise development and license fees are recorded as deferred revenue until we have substantially performed all of our contractual obligations and the restaurant has opened for business. Franchise royalties are recorded in revenues on an accrual basis. Among other things, a franchisee may be provided the use of land and building, generally for a period of 20 years, and is required to pay negotiated rent, property taxes, insurance and maintenance. Franchise rents based on fixed rental payments are recognized
JACK IN THE BOX INC. AND SUBSIDIARIES
NOTES TO CONSOLIDATED FINANCIAL STATEMENTS
as revenue over the term of the lease. Certain franchise rents, which are contingent upon sales levels, are recognized in the period in which the contingency is met.
JACK IN THE BOX INC. AND SUBSIDIARIES
NOTES TO CONSOLIDATED FINANCIAL STATEMENTS
Gift cards — We sell gift cards to our customers in our restaurants and through selected third parties. The gift cards sold to our customers have no stated expiration dates and are subject to actual and/or potential escheatment rights in several of the jurisdictions in which we operate. We recognize income from gift cards when redeemed by the customer.
While we will continue to honor all gift cards presented for payment, we may determine the likelihood of redemption to be remote for certain card balances due to, among other things, long periods of inactivity. In these circumstances, to the extent we determine there is no requirement for remitting balances to government agencies under unclaimed property laws, card balances may be recognized as a reduction to selling, general and administrative expenses in the accompanying consolidated statements of earnings.
IncomeAmounts recognized on unredeemed gift card balances was $1.0$1.2 million, $1.0 million and $0.8$1.0 million in fiscal 2017, 2016 2015 and 2014,2015, respectively.
Pre-opening costs associated with the opening of a new restaurant consist primarily of property rent and employee training costs. Pre-opening costs associated with the opening of a restaurant that was closed upon acquisition consist primarily of labor costs, maintenance and repair costs, and property rent. Pre-opening costs are expensed as incurred in selling, general and administrative expenses in the accompanying consolidated statements of earnings.
Restaurant closure costs — All costs associated with exit or disposal activities are recognized when they are incurred. Restaurant closure costs, which are included in impairment and other charges, net and (gains) losses on the sale of company-operated restaurants in the accompanying consolidated statements of earnings, primarily consist of future lease commitments, net of anticipated sublease rentals, and expected ancillary costs.
Self-insurance — We are self-insured for a portion of our workers’ compensation, general liability, employee medical and dental, and automotive claims. We utilize a paid-loss plan for our workers’ compensation, general liability and automotive programs, which have predetermined loss limits per occurrence and in the aggregate. We establish our insurance liability (undiscounted) and reserves using independent actuarial estimates of expected losses for determining reported claims and as the basis for estimating claims incurred, but not reported. As of October 1, 2017 and October 2, 2016, and September 27, 2015, our estimated liability for general liability and workers’ compensation claims exceeded our self-insurance retention limits by $8.6$3.9 million and $25.8$8.6 million, respectively, which we expect our insurance providers to pay on our behalf in accordance with the contractual terms of our insurance policies.
Advertising costs — We administer marketing funds which include contractual contributions. In fiscal 2016 and 2015,2017 the marketing funds at franchise and company-operated restaurants were generally 5%approximately 5.0% and 2%1.3% of gross revenues at Jack in the Box and Qdoba restaurants, respectively. In fiscal 20142016 and 2015, the marketing funds at franchise and company-operated restaurants were approximately 5%generally 5.0% and 1%2.0% of gross revenues at Jack in the Box and Qdoba restaurants, respectively. We record contributions from franchisees as a liability included in accrued liabilities in the accompanying consolidated balance sheets until such funds are expended. The contributions to the marketing funds are designated for sales driving and marketing-related initiatives and advertising, and we act as an agent for the franchisees with regard to these contributions. Therefore, we do not reflect franchisee contributions to the funds in our consolidated statements of earnings.
Production costs of commercials, programming and other marketing activities are charged to the marketing funds when the advertising is first used for its intended purpose, and the costs of advertising are charged to operations as incurred. Total contributions and other marketing expenses are included in selling, general, and administrative expenses in the accompanying consolidated statements of earnings. The following table provides a summary of advertising costs in each fiscal year (in thousands):
| | | | | 2016 | | 2015 | | 2014 | | 2017 | | 2016 | | 2015 |
| Jack in the Box | | $ | 41,189 |
| | $ | 41,895 |
| | $ | 42,349 |
| | $ | 36,489 |
| | $ | 41,189 |
| | $ | 41,895 |
|
| Qdoba | | 20,488 |
| | 17,687 |
| | 18,215 |
| | 21,721 |
| | 20,488 |
| | 17,687 |
|
| Total | | $ | 61,677 |
| | $ | 59,582 |
| | $ | 60,564 |
| | $ | 58,210 |
| | $ | 61,677 |
| | $ | 59,582 |
|
Share-based compensation — We account for our share-based compensation under the FASB authoritative guidance on stock compensation, which generally requires, among other things, that all employee share-based compensation be measured using a fair value method and that the resulting compensation cost be recognized in the financial statements. Compensation expense for our share-based compensation awards is generally recognized on a straight-line basis over the shorter of the vesting period or the period from the date of grant to the date the employee becomes eligible to retire. Refer to Note 12, Share-based Employee Compensation, for additional information.
JACK IN THE BOX INC. AND SUBSIDIARIES
NOTES TO CONSOLIDATED FINANCIAL STATEMENTS
Income taxes — Deferred tax assets and liabilities are recognized for the future tax consequences attributable to differences between the financial statement carrying amounts of existing assets and liabilities and their respective tax bases, as well as tax loss and credit carryforwards. Deferred tax assets and liabilities are measured using enacted tax rates expected to apply to taxable income in the years in which those temporary differences are expected to be recovered or settled. We recognize interest and, when applicable, penalties related to unrecognized tax benefits as a component of our income tax provision.
JACK IN THE BOX INC. AND SUBSIDIARIES
NOTES TO CONSOLIDATED FINANCIAL STATEMENTS
Authoritative guidance issued by the FASB prescribes a minimum probability threshold that a tax position must meet before a financial statement benefit is recognized. The minimum threshold is defined as a tax position that is more likely than not to be sustained upon examination by the applicable taxing authority, including resolution of any related appeals or litigation processes, based on the technical merits of the position. Refer to Note 10, Income Taxes, for additional information.
Derivative instruments — From time to time, we use interest rate swap agreements to manage interest rate exposure. We do not speculate using derivative instruments. We purchase derivative instruments only for the purpose of risk management.
All derivatives are recognized on the consolidated balance sheets at fair value based upon quoted market prices. Changes in the fair values of derivatives are recorded in earnings or other comprehensive income (“OCI”), based on whether or not the instrument is designated as a hedge transaction. Gains or losses on derivative instruments that qualify for hedge designation are reported in OCI and are reclassified to earnings in the period the hedged item affects earnings. If the underlying hedge transaction ceases to exist, any associated amounts reported in OCI are reclassified to earnings at that time. Any ineffectiveness is recognized in earnings in the current period. Refer to Note 5, Fair Value Measurements, and Note 6, Derivative Instruments, for additional information regarding our derivative instruments.
Contingencies — We recognize liabilities for contingencies when we have an exposure that indicates it is probable that an asset has been impaired or that a liability has been incurred and the amount of impairment or loss can be reasonably estimated. Our ultimate legal and financial liability with respect to such matters cannot be estimated with certainty and requires the use of estimates. When the reasonable estimate is a range, the recorded loss will be the best estimate within the range. We record legal settlement costs when those costs are probable and reasonably estimable. Refer to Note 15, Commitments, Contingencies and Legal Matters, for additional information.
Segment reporting — An operating segment is defined as a component of an enterprise that engages in business activities from which it may earn revenues and incur expenses, and about which separate financial information is regularly evaluated by our chief operating decision makers in deciding how to allocate resources. Similar operating segments can be aggregated into a single operating segment if the businesses are similar. We operate our business in two operating segments, Jack in the Box and Qdoba restaurant operations. Refer to Note 16, Segment Reporting, for additional discussioninformation regarding our segments.
Effect of new accounting pronouncementpronouncements adopted in fiscal 2016 — In November 2015, the FASB issued ASU No. 2015-17, Income Taxes (Topic 740): Balance Sheet Classification of Deferred Taxes, which simplifies the presentation of deferred income taxes. This standard requires deferred tax liabilities and assets to be classified as noncurrent in a classified statement of financial position. This standard is effective prospectively or retrospectively for all periods presented for annual and interim periods beginning after December 15, 2017 with early adoption permitted. We early adopted this standard in 2016 and the prior period was retrospectively adjusted, resulting in a $40.0 million reclassification of current deferred income taxes to other assets, net on our September 27, 2015 consolidated balance sheet.
Effect of new accounting pronouncements to be adopted in future periods — In April 2015, the FASB issued Accounting Standards Update (“ASU”) No. 2015-03, Simplifying the Presentation of Debt Issuance Costs, which changes the presentation of debt issuance costs in financial statements. Under this ASU, an entity presents such costs on the balance sheet as a direct deduction from the related debt liability rather than as an asset. This new standard is effective for annual reporting periods beginning after December 15, 2015, including interim periods within that reporting period. As such, we will be required to adoptWe adopted this standard in the first quarter of fiscal 2017 and will reclassifythe prior period was retrospectively adjusted. The adjustment resulted in a reclassification of $3.8 million in debt issuance costs from other assets, net to current maturities of long-term debt withinand long-term debt, net of current maturities in the amount of $1.6 million and $2.2 million, respectively, in our consolidated balance sheets. As of October 2, 2016 consolidated balance sheet.
In May 2015, the carrying amount of unamortized debt issuance costs totaled $8.2 million. Other thanFASB issued ASU No. 2015-07, Fair Value Measurement (Topic 820): Disclosures for Investments in Certain Entities That Calculate Net Asset Value per Share (or Its Equivalent), which removes the requirement to categorize within the fair value hierarchy investments for which the fair values are measured using the net asset value per share practical expedient. It also limits certain disclosures for investments for which the entity has elected to measure the fair value using the practical expedient. This new standard is effective for fiscal years, and interim periods within those years, beginning after December 15, 2015, with early adoption permitted. We adopted this reclassification,standard in fiscal 2017 and the prior year disclosure was retrospectively adjusted; refer to Note 11, Retirement Plans. The adoption of this ASU willstandard did not have an impact on our consolidated financial statements.
In August 2015, the FASB issued ASU No. 2015-15, Interest-Imputation of Interest: Presentation and Subsequent Measurement of Debt Issuance Costs Associated with Line-of-Credit Arrangements, which addresses line-of-credit arrangements that were omitted from ASU No. 2015-03. This ASU states that the SEC staff would not object to an entity deferring and presenting debt issuance costs related to a line-of-credit arrangement as an asset and subsequently amortizing those costs ratably over the term of the arrangement, regardless of whether there are any outstanding borrowings on the line-of-credit arrangement. This new standard is effective for annual reporting periods beginning after December 15, 2015, including interim periods within that reporting period.
JACK IN THE BOX INC. AND SUBSIDIARIES
NOTES TO CONSOLIDATED FINANCIAL STATEMENTS
We adopted this standard in fiscal 2017 and there was no impact on our consolidated financial statements as we continue to present debt issuance costs associated with our line-of-credit arrangement as an asset on our consolidated balance sheets.
In January 2017, the FASB issued ASU No. 2017-04, Intangibles - Goodwill and Other (Topic 350): Simplifying the Test for Goodwill Impairment. The standard simplifies the subsequent measurement of goodwill, requiring only a single-step quantitative test to identify and measure impairment based on the excess of a reporting unit's carrying amount over its fair value. A qualitative assessment may still be completed first for an entity to determine if a quantitative impairment test is necessary. This standard is effective for fiscal years beginning after December 15, 2019, with early adoption permitted for interim or annual goodwill impairment tests performed on testing dates after January 1, 2017. The standard requires adoption on a prospective basis. We adopted this standard in fiscal 2017 and the adoption of this standard did not have an impact on our consolidated financial statements.
Effect of new accounting pronouncements to be adopted in future periods — In May 2014, the FASB issued ASU No. 2014-09, Revenue Recognition - Revenue from Contracts with Customers (Topic 606), which provides a comprehensive new revenue recognition model that requires an entity to recognize revenue in an amount that reflects the consideration the entity expects to receive for the transfer of promised goods or services to its customers. The standard also requires additional disclosure regarding the nature, amount, timing and uncertainty of revenue and cash flows arising from contracts with customers. Further, in March 2016, the FASB issued ASU No. 2016-08, Revenue from Contracts with Customers (Topic 606): Principal versus Agent Considerations (Reporting Revenue Gross versus Net), which clarifies the guidance in ASU No. 2014-09 when evaluating when another party, along with the entity, is involved in providing a good or service to a customer. In April 2016, the FASB issued ASU No. 2016-10, Revenue from Contracts with Customers (Topic 606): Identifying Performance Obligations and Licensing, which clarifies the guidance in ASU No. 2014-09 regarding assessing whether promises to transfer goods or services are distinct, and whether an entity's promise to grant a license provides a customer with a right to use, or right to access the entity's intellectual property. In December 2016, the FASB issued ASU No. 2016-20,Technical Corrections and Improvements to Revenue from Contracts with Customers (Topic 606). This ASU clarifies the guidance in ASU 2014-09, providing technical corrections and improvements to clarify guidance and correct unintended applications of the guidance. All standards are effective for annual periods beginning after December 15, 2017, and interim periods within that reporting period. As such, we will be required to adopt these standards in the first quarter of fiscal 2019.
JACK IN THE BOX INC. AND SUBSIDIARIES
NOTES TO CONSOLIDATED FINANCIAL STATEMENTS
These standards are to be applied retrospectively or using a cumulative effect transition method, and early adoption is not permitted. We do not believe the new revenue recognition standard will impact our recognition of restaurant sales, rental revenues or royalty fees from franchisees. However, we are still evaluating the impact that this pronouncement will have on the recognition of certain transactions on our consolidated financial statements, including the initial franchise fees currently recognized upon the opening of a franchise restaurant and our advertising arrangements with franchisees currently reported on a net versus gross basis in our consolidated statements of earnings, and the effect it will have on our disclosures. We have not yet selected a transition method.
In August 2015, the FASB issued ASU No. 2015-15, “Interest-Imputation of Interest: Presentation and Subsequent Measurement of Debt Issuance Costs Associated with Line-of-Credit Arrangements,” which addresses line-of-credit arrangements that were omitted from ASU No. 2015-03 (see below). This ASU states that the SEC staff would not object to an entity deferring and presenting debt issuance costs related to a line-of-credit arrangement as an asset and subsequently amortizing those costs ratably over the term of the arrangement, regardless of whether there are any outstanding borrowings on the line-of-credit arrangement. This new standard is effective for annual reporting periods beginning after December 15, 2015, including interim periods within that reporting period, with early adoption permitted. We do not expect that this standard will have a material impact on our consolidated financial statements or disclosures upon adoption in fiscal 2017.
In February 2016, the FASB issued ASU No. 2016-02, Leases (Topic 842), which requires a lessee to recognize assets and liabilities on the balance sheet for those leases classified as operating leases under previous guidance. This standard is effective for fiscal years beginning after December 15, 2018, including interim periods within those fiscal years. As such, we will be required to adopt this standard in the first quarter of fiscal 2020. This standard requires adoption based upon a modified retrospective transition approach, with early adoption permitted. Based on a preliminary assessment, we expect that most of our operating lease commitments will be subject to the new guidance and recognized as operating lease liabilities and right-of-use assets upon adoption, resulting in a significant increase in the assets and liabilities on our consolidated balance sheets. We are continuing our evaluation, which may identify additional impacts this standard will have on our consolidated financial statements and related disclosures.
In March 2016, the FASB issued ASU No. 2016-04, Liabilities-Extinguishment of Liabilities (Subtopic 405-20): Recognition of Breakage for Certain Prepaid Stored-Value Products, which is designed to provide guidance and eliminate diversity in the accounting for the derecognition of financial liabilities related to certain prepaid stored-value products using a revenue-like breakage model. This standard is effective for fiscal years beginning after December 15, 2017, and interim periods within those fiscal years, with early adoption permitted. As such, we will be required to adopt this standard in the first quarter of fiscal 2019. This standard is to be applied retrospectively or using a cumulative effect transition method as of the date of adoption. We are currently evaluating which transition method to use, but believe the impact this standard will have on our consolidated financial statements and related disclosures will be immaterial upon adoption.
In March 2016, the FASB issued ASU No. 2016-09, Compensation-Stock Compensation (Topic 718): Improvements to Employee Share-Based Payment Accounting. This standard is intended to simplify various aspects of accounting for share-based compensation arrangements, including the income tax impact, classification on the statement of cash flows and forfeitures. This standard is effective for annual reporting periods beginning after December 15, 2016, and interim periods within that reporting period, with early adoption permitted. As such, we will be required to adopt this standard in the first quarter of fiscal 2018 and will classify the excess tax benefits from share-based compensation arrangements, which were $7.5$4.2 million in fiscal 2016,2017, as a discrete item within income tax expense on the consolidated statements of earnings, rather than recognizing such excess income tax benefits in capital
JACK IN THE BOX INC. AND SUBSIDIARIES
NOTES TO CONSOLIDATED FINANCIAL STATEMENTS
in excess of par value on the consolidated statements of stockholders’ (deficit) equity.deficit. This reclassification will be made on a prospective basis and will also impact the related classification on our consolidated statements of cash flows as excess tax benefits from share-based compensation arrangements arewill only be reported in cash flows from operating activities rather than as currently reported in cash flows from operating activities and cash flows used in investing activities. Other than these reclassifications, we do not believe the adoption of this ASU will materially impact our consolidated financial statements.
In August 2016, the FASB issued ASU 2016-15, Statement of Cash Flows ( Topic(Topic 230): Classification of Certain Cash Receipts and Cash Payments. This standard is intended to address eight classification issues related to the statement of cash flows to reduce diversity in practice in how certain transactions are classified. This standard is effective for fiscal years beginning after December 15, 2017, and interim periods within those fiscal years, with early adoption permitted. As such, we will be required to adopt this standard in the first quarter of fiscal 2019. This standard requires adoption based upon a retrospective transition method. We are currently evaluating this standard, but do not believe it will have a material impact on the classification of cash flows within our statement of cash flows.
In October 2016, the FASB issued ASU No. 2016-16, Income Taxes (Topic 740): Intra-Entity Transfers of Assets Other Than Inventory. This standard requires that an entity recognize the income tax consequences of an intra-entity transfer of an asset other than inventory when the transfer occurs, rather than deferring the recognition until the asset has been sold to an outside party. This standard is effective for fiscal years beginning after December 15, 2017, and interim periods within those fiscal years, with early adoption permitted. As such, we will be required to adopt this standard in the first quarter of fiscal 2019. The standard requires adoption on a modified retrospective basis through a cumulative-effect adjustment to retained earnings. We are currently evaluating this standard, but do not believe it will have a material impact on our consolidated financial statements. In December 2016, the FASB issued ASU 2016-19, Technical Corrections and Improvements. This standard contains amendments that affect a wide variety of topics in the Accounting Standards Codification. The amendments include differences between original FASB guidance and the Accounting Standards Codification, guidance clarification and reference corrections, simplification and minor improvements. This standard is effective for annual reporting periods beginning after December 15, 2016, and interim periods within that reporting period, with early adoption permitted. As such, we will be required to adopt this standard in the first quarter of fiscal 2018. This standard is not expected have a significant effect on our accounting policies or on our consolidated financial statements and related disclosures.
In February 2017, the FASB issued ASU 2017-05, Other Income - Gains and Losses from the Derecognition of Nonfinancial Assets (Subtopic 610-20): Clarifying the Scope of Asset Derecognition Guidance and Accounting for Partial Sales of Nonfinancial Assets. The standard provides clarification about the term “in substance nonfinancial asset” and guidance for recognizing gains and losses from the transfer of nonfinancial assets and for partial sales of nonfinancial assets. The standard is required to be adopted retrospectively, in conjunction with ASU 2014-09. As such, we will be required to adopt this standard in the first quarter of fiscal 2019. This standard is not expected to have a material impact on our consolidated financial statements.
In March 2017, the FASB issued ASU 2017-07, Compensation - Retirement Benefits (Topic 715): Improving the Presentation of Net Periodic Pension Cost and Net Periodic Postretirement Benefit Cost. This standard requires the presentation of the service cost component of net benefit cost to be in the same line item as other compensation costs arising from services rendered by the pertinent employees during the period. All other components of net benefit cost should be presented separately from the service cost component and outside of a subtotal of earnings from operations, or separately disclosed. The standard is effective for annual and interim periods beginning after December 15, 2017 and must be adopted retrospectively. Early adoption is permitted as of the beginning of an annual period, but we plan to adopt this standard in the first quarter of fiscal 2019. Upon adoption of this standard, we will separately present the components of net periodic benefit cost, excluding the service cost component, outside of earnings from operations. Net periodic benefit cost, excluding the service cost component, was $2.0 million and $8.2 million in fiscal 2017 and 2016, respectively.
In May 2017, the FASB issued ASU 2017-09, Compensation - Stock Compensation (Topic 718): Scope of Modification Accounting. This standard provides guidance that clarifies when changes to the terms or conditions of a share-based payment award require the application of modification accounting under ASC 718. This new guidance will allow for certain changes to be made to awards without accounting for them as modifications. The standard is effective for fiscal years beginning after December 15, 2017, and interim periods within those fiscal years, with early adoption permitted. The standard is required to be applied prospectively to awards modified on or after the adoption date. We will be required to adopt this standard in the first quarter of fiscal 2019. This standard is not expected to have a significant effect on our accounting policies or on our consolidated financial statements and related disclosures.
JACK IN THE BOX INC. AND SUBSIDIARIES
NOTES TO CONSOLIDATED FINANCIAL STATEMENTS
2. DISCONTINUED OPERATIONS
Distribution business — During fiscal 2012, we entered into an agreement with a third party distribution service provider pursuant to a plan approved by our board of directors to sell our Jack in the Box distribution business. During fiscal 2013, we completed the transition of our distribution centers. The operations and cash flows of the business have been eliminated and in accordance with the provisions of the FASB authoritative guidance on the presentation of financial statements, the results are reported as discontinued operations for all periods presented.
In fiscal years 2017, 2016 2015 and 2014,2015, results of discontinued operations were immaterial to our consolidated results of operations. Our liability for lease commitments related to our distribution centers is immaterial to our consolidated balance sheetssheet as of October 2, 2016 and September 27, 2015.2016. The lease commitment balance relates to one distribution center lease that expiresexpired in fiscal 2017 and is currently subleased at a loss. The future minimum lease payments and receipts for the next fiscal year are included in the amounts disclosed in Note 8, Leases.July 2017.
2013 Qdoba Closures — During fiscal 2013, we closed 62 Qdoba restaurants. The decision to close these restaurants was based on a comprehensive analysis that took into consideration levels of return on investment and other key operating performance metrics. Since the closed restaurants were not predominantly located near those remaining in operation, we did not expect the majority of cash flows and sales lost from these closures to be recovered. In addition, we did not anticipate any ongoing involvement or significant direct cash flows from the closed stores. Therefore, in accordance with the provisions of the FASB authoritative guidance on the presentation of financial statements, the results of operations for these restaurants are reported as discontinued operations for all periods presented.
The following table summarizes the results related to the 2013 Qdoba Closures for each fiscal year (in thousands):
| | | | | 2016 | | 2015 | | 2014 | | 2017 | | 2016 | | 2015 |
| Asset impairments | | $ | — |
| | $ | — |
| | $ | (2,170 | ) | |
| Unfavorable lease commitment adjustments | | (2,818 | ) | | (4,594 | ) | | (4,536 | ) | | $ | (3,502 | ) | | $ | (2,818 | ) | | $ | (4,594 | ) |
| Ongoing facility related and other costs | | | (172 | ) | | (71 | ) | | (302 | ) |
| Brokers commissions | | | (72 | ) | | (58 | ) | | (234 | ) |
| Bad debt expense related to subtenants | | (234 | ) | | (366 | ) | | — |
| | (49 | ) | | (234 | ) | | (366 | ) |
| Brokers commissions | | (58 | ) | | (234 | ) | | (652 | ) | |
| Ongoing facility related and other costs | | (71 | ) | | (302 | ) | | (889 | ) | |
| Loss before income tax benefit | | $ | (3,181 | ) | | $ | (5,496 | ) | | $ | (8,247 | ) | | $ | (3,795 | ) | | $ | (3,181 | ) | | $ | (5,496 | ) |
We do not expect the remaining costs to be incurred related to the closures to be material; however, the estimates we make related to our future lease obligations, primarily sublease income, are subject to a high degree of judgment and may differ from actual sublease income due to changes in economic conditions, desirability of the sites and other factors.
Our liability for lease commitments related to the 2013 Qdoba closuresClosures is included in accrued liabilities and other long-term liabilities in the accompanying consolidated balance sheets and has changed as follows during fiscal year 20162017 (in thousands):
| | | Balance at September 27, 2015 | | $ | 4,256 |
| |
| Balance at October 2, 2016 | | | $ | 2,943 |
|
| Adjustments (1) | | 2,818 |
| | 3,502 |
|
| Cash payments | | (4,131 | ) | | (4,000 | ) |
| Balance at October 2, 2016 (2) | | $ | 2,943 |
| |
| Balance at October 1, 2017 (2) | | | $ | 2,445 |
|
| |
| (1) | Adjustments relate to revisions to certain sublease and cost assumptions due to changes in market conditions, as well as a chargecharges to terminate threeseven lease agreements, and includes interest expense. |
| |
| (2) | The weighted average remaining lease term related to these commitments is approximately threetwo years. |
The balance at October 2, 20161, 2017 relates to sixfive locations subleased at a loss and 1610 locations we are marketing for sublease. The future minimum lease payments and receipts for the next five fiscal years and thereafter are included in the amounts disclosed in Note 8, Leases.
JACK IN THE BOX INC. AND SUBSIDIARIES
NOTES TO CONSOLIDATED FINANCIAL STATEMENTS
3. SUMMARY OF REFRANCHISINGS, FRANCHISEE DEVELOPMENT AND ACQUISITIONS
Refranchisings and franchisee development — The following table summarizes the number of restaurants sold to franchisees, the number of restaurants developed by franchisees, and the related fees and gains (losses) recognized in each fiscal year (dollars in thousands):
| | | | | 2016 | | 2015 | | 2014 | | 2017 | | 2016 | | 2015 |
| Restaurants sold to franchisees | | 1 |
| | 21 |
| | 37 |
| |
| Restaurants sold to Jack in the Box franchisees | | | 178 |
| | 1 |
| | 21 |
|
| New restaurants opened by franchisees: | | | | | | | | | | | | |
| Jack in the Box | | 12 |
| | 16 |
| | 11 |
| | 18 |
| | 12 |
| | 16 |
|
| Qdoba | | 18 |
| | 22 |
| | 22 |
| | 19 |
| | 18 |
| | 22 |
|
| | | | | | | | | | | | | |
| Initial franchise fees | | $ | 955 |
| | $ | 1,453 |
| | $ | 1,886 |
| | $ | 8,078 |
| | $ | 955 |
| | $ | 1,453 |
|
| | | | | | | | | | | | | |
| Proceeds from the sale of company-operated restaurants (1) | | $ | 1,439 |
| | $ | 3,951 |
| | $ | 10,536 |
| | $ | 99,591 |
| | $ | 1,439 |
| | $ | 3,951 |
|
| Net assets sold (primarily property and equipment) | | (195 | ) | | (4,283 | ) | | (5,558 | ) | | (30,597 | ) | | (195 | ) | | (4,283 | ) |
| Lease commitment charges (2) | | | (11,737 | ) | | — |
| | (2,542 | ) |
| Goodwill related to the sale of company-operated restaurants | | (15 | ) | | (47 | ) | | (170 | ) | | (10,056 | ) | | (15 | ) | | (47 | ) |
| Other (2) | | 1 |
| | (2,760 | ) | | (6,500 | ) | |
| Other (3) | | | (9,167 | ) | | 1 |
| | (218 | ) |
| Gains (losses) on the sale of company-operated restaurants | | 1,230 |
| | (3,139 | ) | | (1,692 | ) | | $ | 38,034 |
| | $ | 1,230 |
| | $ | (3,139 | ) |
| Loss on anticipated sale of a Jack in the Box company-operated market (3) | | — |
| | — |
| | (1,856 | ) | |
| Gains (losses) on the sale of company-operated restaurants | | $ | 1,230 |
| | $ | (3,139 | ) | | $ | (3,548 | ) | |
____________________________
| |
| (1) | Amounts in 2017 include additional proceeds of $0.2 million related to restaurants sold in a prior year. Amounts in 2016 2015 and 20142015 include additional proceeds of $1.4 million and $1.5 million, and $2.1 million, respectively, recognized uponrelated to the extension of the underlying franchise and lease agreements related tofrom the sale of restaurants sold in a prior year.years. |
| |
| (2) | Amounts in 2015 and 2014 primarily represent impairment and lease commitment charges related to restaurants closed in connection with the sale of the related markets, and chargesCharges are for operating restaurant leases with lease commitments in excess of our sublease rental income. |
| |
| (3) | In 2014,Amounts in 2017 represent impairment of $4.6 million and equipment write-offs of $1.4 million related to restaurants closed in connection with the loss on the anticipated sale of a Jackthe related markets, maintenance and repair charges, and other miscellaneous non-capital charges. Amounts in 2015 primarily represent impairment charges related to restaurants closed in connection with the Box market relates to 25 company-operated restaurantssale of which we sold 20, and closed the remaining five, in fiscal 2015.related markets. |
Prior to the end of fiscal 2017, we signed non-binding letters of intent with franchisees to sell 11 company-operated Jack in the Box restaurants. Pre-tax gross proceeds related to these sales are estimated at $5.0 million to $6.0 million. Equipment of $0.9 million related to these sales has been classified as assets held for sale in our October 1, 2017 consolidated balance sheet.
Franchise acquisitions — We acquired fifty, one seven and fourseven Jack in the Box franchise restaurants in fiscal 2017, 2016 and 2015, respectively. Of the 50 Jack in the Box restaurants acquired in 2017, we took over 31 restaurants as a result of an agreement with an underperforming franchisee who was in violation of franchise and 2014, respectively.lease agreements with the Company. Under this agreement, the franchisee voluntarily agreed to turn over the restaurants. The acquisition of the additional 19 restaurants in 2017 was the result of a legal action filed in September 2013 against a franchisee, from which legal action we obtained a judgment in January 2017 granting us possession of the restaurants. Of the 50 restaurants acquired in 2017, we sold 18 of the restaurants to franchisees and closed four. We plan to sell the remaining restaurants acquired in 2017 as part of our refranchising strategy. In 2016, we also acquired 14 Qdoba franchise restaurants. Refer to Note 6, Impairment and Other Charges, Net, for additional information regarding impairment charges related to the restaurants closed subsequent to acquisition.
We account for the acquisition of franchised restaurants using the acquisition method of accounting for business combinations. The purchase price allocations were based on fair value estimates determined using significant unobservable inputs (Level 3). The goodwill recorded primarily relates to the sales growth potential of the markets acquired and is expected to be deductible for income tax purposes.
JACK IN THE BOX INC. AND SUBSIDIARIES
NOTES TO CONSOLIDATED FINANCIAL STATEMENTS
The following table provides detail of the combined acquisitions in each fiscal year (dollars in thousands):
| | | | | 2016 | | 2015 | | 2014 | | 2017 | | 2016 | | 2015 |
| Restaurants acquired from franchisees | | 15 |
| | 7 |
| | 4 |
| | 50 |
| | 15 |
| | 7 |
|
| | | | | | | | | | | | | |
| Goodwill | | $ | 17,034 |
| | $ | — |
| | $ | 256 |
| | $ | 13,059 |
| | $ | 17,034 |
| | $ | — |
|
| Property and equipment | | 2,954 |
| | 646 |
| | 1,398 |
| | 2,470 |
| | 2,954 |
| | 646 |
|
| Intangible assets | | | 1,260 |
| | 91 |
| | — |
|
| Inventory | | | 189 |
| | — |
| | — |
|
| Liabilities assumed | | | (1,116 | ) | | (114 | ) | | (613 | ) |
| Gains on the acquisition of franchise-operated restaurants | | (289 | ) | | (33 | ) | | — |
| | — |
| | (289 | ) | | (33 | ) |
| Liabilities assumed | | (114 | ) | | (613 | ) | | — |
| |
| Other | | 231 |
| | — |
| | 96 |
| | — |
| | 140 |
| | — |
|
| Total consideration | | $ | 19,816 |
| | $ | — |
| | $ | 1,750 |
| | $ | 15,862 |
| | $ | 19,816 |
| | $ | — |
|
Of the 2017 total consideration, $13.8 million is non-cash consideration and is comprised of $9.9 million of receivables that were eliminated in acquisition accounting and $3.9 million of accounts payable that was recorded in acquisition accounting. The accounts payable recorded is primarily due to third parties to waive their liens and security interests on certain assets acquired.
4. GOODWILL AND INTANGIBLE ASSETS, NET
The changes in the carrying amount of goodwill during fiscal 20162017 and 20152016 by reportable segment were as follows (in thousands):
|
| | | | | | | | | | | | |
| | | Jack in the Box | | Qdoba | | Total |
| Balance at September 28, 2014 | | $ | 48,477 |
| | $ | 100,597 |
| | $ | 149,074 |
|
| Sale of company-operated restaurants to franchisees | | (47 | ) | | — |
| | (47 | ) |
| Balance at September 27, 2015 | | 48,430 |
| | 100,597 |
| | 149,027 |
|
| Acquisition of franchise-operated restaurants | | — |
| | 17,034 |
| | 17,034 |
|
| Sale of company-operated restaurants to franchisees | | (15 | ) | | — |
| | (15 | ) |
| Balance at October 2, 2016 | | $ | 48,415 |
| | $ | 117,631 |
| | $ | 166,046 |
|
JACK IN THE BOX INC. AND SUBSIDIARIES
NOTES TO CONSOLIDATED FINANCIAL STATEMENTS
|
| | | | | | | | | | | | |
| | | Jack in the Box | | Qdoba | | Total |
| Balance at September 27, 2015 | | $ | 48,430 |
| | $ | 100,597 |
| | $ | 149,027 |
|
| Acquisition of franchise-operated restaurants | | — |
| | 17,034 |
| | 17,034 |
|
| Sale of company-operated restaurants to franchisees | | (15 | ) | | — |
| | (15 | ) |
| Balance at October 2, 2016 | | 48,415 |
| | 117,631 |
| | 166,046 |
|
| Acquisition of franchise-operated restaurants | | 13,059 |
| | — |
| | 13,059 |
|
| Sale of company-operated restaurants to franchisees | | (10,056 | ) | | — |
| | (10,056 | ) |
| Balance at October 1, 2017 | | $ | 51,418 |
| | $ | 117,631 |
| | $ | 169,049 |
|
Intangible assets, net consist of the following as of the end of each fiscal year (in thousands):
| | | | | 2016 | | 2015 | | 2017 | | 2016 |
| Amortized intangible assets: | | | | | | | | |
| Gross carrying amount | | $ | 17,205 |
| | $ | 17,267 |
| | $ | 17,993 |
| | $ | 17,205 |
|
| Less accumulated amortization | | (11,963 | ) | | (11,302 | ) | | (12,721 | ) | | (11,963 | ) |
| Net carrying amount | | 5,242 |
| | 5,965 |
| | 5,272 |
| | 5,242 |
|
| Non-amortized intangible assets: | | | | | | | | |
| Trademark | | 8,800 |
| | 8,800 |
| | 8,800 |
| | 8,800 |
|
| Net carrying amount | | $ | 14,042 |
| | $ | 14,765 |
| | $ | 14,072 |
| | $ | 14,042 |
|
Amortized intangible assets include acquired franchise contracts recorded in connection with our acquisition of Qdoba in 2003, lease acquisition costs and reacquired franchise rights. The weighted-average life of these amortized intangible assets is approximately 2724 years. Total amortization expense related to intangible assets was $0.8 million $0.8 million and $0.9 million in fiscal 2017, 2016 2015 and 2014, respectively.2015.
The following table summarizes, as of October 2, 20161, 2017, the estimated amortization expense for each of the next five fiscal years (in thousands):
| | | 2017 | $ | 777 |
| |
| 2018 | $ | 732 |
| $ | 820 |
|
| 2019 | $ | 671 |
| $ | 760 |
|
| 2020 | $ | 633 |
| $ | 723 |
|
| 2021 | $ | 592 |
| $ | 680 |
|
| 2022 | | $ | 599 |
|
JACK IN THE BOX INC. AND SUBSIDIARIES NOTES TO CONSOLIDATED FINANCIAL STATEMENTS
5. FAIR VALUE MEASUREMENTS
Financial assets and liabilities — The following table presents the financial assets and liabilities measured at fair value on a recurring basis (in thousands):
| | | | Total | | Quoted Prices in Active Markets for Identical Assets (3) (Level 1) | | Significant Other Observable Inputs (3) (Level 2) | | Significant Unobservable Inputs (3) (Level 3) | | Total | | Quoted Prices in Active Markets for Identical Assets (3) (Level 1) | | Significant Other Observable Inputs (3) (Level 2) | | Significant Unobservable Inputs (3) (Level 3) |
| Fair value measurements as of October 1, 2017: | | | | | | | | | |
| Non-qualified deferred compensation plan (1) | | | $ | (37,575 | ) | | $ | (37,575 | ) | | $ | — |
| | $ | — |
|
| Interest rate swaps (Note 6) (2) | | | (22,927 | ) | | — |
| | (22,927 | ) | | — |
|
| Total liabilities at fair value | | | $ | (60,502 | ) | | $ | (37,575 | ) | | $ | (22,927 | ) | | $ | — |
|
| Fair value measurements as of October 2, 2016: | | | | | | | | | | | | | | | | |
| Non-qualified deferred compensation plan (1) | | $ | (36,933 | ) | | $ | (36,933 | ) | | $ | — |
| | $ | — |
| | $ | (36,933 | ) | | $ | (36,933 | ) | | $ | — |
| | $ | — |
|
| Interest rate swaps (Note 6) (2) | | (47,765 | ) | | — |
| | (47,765 | ) | | — |
| | (47,765 | ) | | — |
| | (47,765 | ) | | — |
|
| Total liabilities at fair value | | $ | (84,698 | ) | | $ | (36,933 | ) | | $ | (47,765 | ) | | $ | — |
| | $ | (84,698 | ) | | $ | (36,933 | ) | | $ | (47,765 | ) | | $ | — |
|
| Fair value measurements as of September 27, 2015: | | | | | | | | | |
| Non-qualified deferred compensation plan (1) | | $ | (35,003 | ) | | $ | (35,003 | ) | | $ | — |
| | $ | — |
| |
| Interest rate swaps (Note 6) (2) | | (26,374 | ) | | — |
| | (26,374 | ) | | — |
| |
| Total liabilities at fair value | | $ | (61,377 | ) | | $ | (35,003 | ) | | $ | (26,374 | ) | | $ | — |
| |
____________________________
| |
| (1) | We maintain an unfunded defined contribution plan for key executives and other members of management. The fair value of this obligation is based on the closing market prices of the participants’ elected investments. |
| |
| (2) | We entered into interest rate swaps to reduce our exposure to rising interest rates on our variable rate debt. The fair values of our interest rate swaps are based upon Level 2 inputs which include valuation models as reported by our counterparties. The key inputs for the valuation models are quoted market prices, discount rates and forward yield curves. |
| |
| (3) | We did not have any transfers in or out of Level 1, 2 or 3. |
The fair values of the Company’s debt instruments are based on the amount of future cash flows associated with each instrument discounted using the Company’s borrowing rate. At October 2, 2016,1, 2017, the carrying value of all financial instruments was not materially different from fair value, as the borrowings are prepayable without penalty. The estimated fair values of our capital lease obligations approximated their carrying values as of October 2, 2016.
JACK IN THE BOX INC. AND SUBSIDIARIES
NOTES TO CONSOLIDATED FINANCIAL STATEMENTS
1, 2017.
Non-financial assets and liabilities — Our non-financial instruments, which primarily consist of property and equipment, goodwill and intangible assets, are reported at carrying value and are not required to be measured at fair value on a recurring basis. However, on an annual basis or whenever events or changes in circumstances indicate that their carrying value may not be recoverable, non-financial instruments are assessed for impairment. If the carrying values are not fully recoverable, they are written down to fair value.
In connection with our impairment reviews performed during fiscal 2016,2017, we recorded an impairment charge of $0.5$2.4 million related to anthree underperforming Qdoba restaurantrestaurants which isare currently held for use. No other fair value adjustments were required.use, and $0.7 million in charges for Qdoba furniture and equipment resulting from new restaurant design changes. Refer to Note 9, Impairment and Other Charges, Net, for additional information regarding impairment charges.
During fiscal 2017, we closed nine Jack in the Box company-operated restaurants in connection with the sale of the related markets to franchisees, and recorded an impairment charge of $4.6 million against the gain on sale of company-operated restaurants. Refer to Note 3, Summary of Refranchisings, Franchisee Development and Acquisitions, for additional information regarding these sales.
No other fair value adjustments were required.
6. DERIVATIVE INSTRUMENTS
Objectives and strategies — We are exposed to interest rate volatility with regard to our variable rate debt. In April 2014, to reduce our exposure to rising interest rates, we entered into nine forward-starting interest rate swap agreements that effectively converted $300.0 million of our variable rate borrowings to a fixed-rate basis from October 2014 through October 2018. Additionally, in June 2015, we entered into eleven forward-starting interest rate swap agreements that effectively convert an additional $200.0 million of our variable rate borrowings to a fixed rate from October 2015 through October 2018, and $500.0 million from October 2018 through October 2022.
JACK IN THE BOX INC. AND SUBSIDIARIES
NOTES TO CONSOLIDATED FINANCIAL STATEMENTS
These agreements have been designated as cash flow hedges under the terms of the FASB authoritative guidance for derivatives and hedging. To the extent that they are effective in offsetting the variability of the hedged cash flows, changes in the fair values of the derivatives are not included in earnings, but are included in OCI. These changes in fair value are subsequently reclassified into net earnings as a component of interest expense as the hedged interest payments are made on our variable rate debt.
Financial position — The following derivative instruments were outstanding as of the end of each fiscal year (in thousands):
|
| | | | | | | | | | |
| | | Balance Sheet Location | | Fair Value |
| | | October 2, 2016 | | September 27, 2015 |
| Derivatives designated as hedging instruments: | | | | | | |
| Interest rate swaps (Note 5) | | Accrued
liabilities | | $ | (5,857 | ) | | $ | (3,379 | ) |
| Interest rate swaps (Note 5) | | Other long-term liabilities | | (41,908 | ) | | (22,995 | ) |
| Total derivatives | | | | $ | (47,765 | ) | | $ | (26,374 | ) |
|
| | | | | | | | | | |
| | | Balance Sheet Location | | Fair Value |
| | | 2017 | | 2016 |
| Derivatives designated as hedging instruments: | | | | | | |
| Interest rate swaps | | Accrued
liabilities | | $ | (4,777 | ) | | $ | (5,857 | ) |
| Interest rate swaps | | Other long-term liabilities | | (18,150 | ) | | (41,908 | ) |
| Total derivatives (Note 5) | | | | $ | (22,927 | ) | | $ | (47,765 | ) |
Financial performance — The following table summarizes the accumulated OCI activity related to our interest rate swap derivative instruments in each fiscal year (in thousands):
| | | | | Location of Loss in Income | | 2016 | | 2015 | | 2014 | | Location of Loss in Income | | 2017 | | 2016 | | 2015 |
| Loss recognized in OCI | | N/A | | $ | (25,439 | ) | | $ | (26,596 | ) | | $ | (1,890 | ) | |
| Gain (loss) recognized in OCI | | | N/A | | $ | 19,768 |
| | $ | (25,439 | ) | | $ | (26,596 | ) |
| Loss reclassified from accumulated OCI into net earnings | | Interest expense, net | | $ | 4,048 |
| | $ | 2,011 |
| | $ | 1,291 |
| | Interest expense, net | | $ | 5,070 |
| | $ | 4,048 |
| | $ | 2,011 |
|
Amounts reclassified from accumulated OCI into interest expense represent payments made to the counterparty for the effective portions of the interest rate swaps. During the fiscal years presented, our interest rate swaps had no hedge ineffectiveness.
7. INDEBTEDNESS
The detail of our long-term debt at the end of each fiscal year is as follows (in thousands):
|
| | | | | | | | |
| | | 2016 | | 2015 |
| Revolver, variable interest rate based on an applicable margin plus LIBOR, 2.52% at October 2, 2016 | | $ | 282,422 |
| | $ | 395,000 |
|
| Term loan, variable interest rate based on an applicable margin plus LIBOR, 2.53% at October 2, 2016 | | 694,141 |
| | 300,000 |
|
Capital lease obligations, 3.6% weighted average interest rate at October 2, 2016 | | 18,523 |
| | 20,256 |
|
| | | 995,086 |
| | 715,256 |
|
| Less current portion | | (57,574 | ) | | (26,677 | ) |
| | | $ | 937,512 |
| | $ | 688,579 |
|
JACK IN THE BOX INC. AND SUBSIDIARIES
NOTES TO CONSOLIDATED FINANCIAL STATEMENTS
|
| | | | | | | | |
| | | 2017 | | 2016 |
| Revolver, variable interest rate based on an applicable margin plus LIBOR, 3.34% at October 1, 2017 | | $ | 497,022 |
| | $ | 282,422 |
|
| Term loan, variable interest rate based on an applicable margin plus LIBOR, 3.24% at October 1, 2017 | | 639,385 |
| | 694,141 |
|
| Capital lease obligations, 3.50% weighted average interest rate at October 1, 2017 | | 11,049 |
| | 18,523 |
|
| | | 1,147,456 |
| | 995,086 |
|
| Less current maturities of long-term debt, net of $1,502 and $1,639 of term loan debt issuance costs, respectively | | (64,383 | ) | | (55,935 | ) |
| Less term loan debt issuance costs | | (2,141 | ) | | (3,779 | ) |
| | | $ | 1,080,932 |
| | $ | 935,372 |
|
New creditCredit facility — On September 16, 2016, the Company amended its credit facility to increase its overall borrowing capacity. The amendedAt October 1, 2017, our credit facility was increased to $1.6 billion, consistingcomprised of (i) a $900.0 million revolving credit agreement and (ii) a $700.0 million term loan. The interest rate on the amended credit facility is based on the Company’s leverage ratio and can range from the London Interbank Offered Rate (“LIBOR”) plus 1.25% to 2.25% with a 0% floor on the LIBOR. The amendment also, among other things, amended certain covenants already contained in the credit agreement. Both the revolving credit agreement and the term loan have maturity dates of March 19, 2019 which did not change as part of the amendment.2019. As part of the existing credit agreement, we may also request the issuance of up to $75.0 million in letters of credit, the outstanding amount of which reduces our net borrowing capacity under the agreement. As of October 2, 2016,1, 2017, our unused borrowing capacity was $592.5$371.6 million.
Use of proceeds — Upon amendment, the Company borrowed $417.6 million under the amended term loan and used the full amount to pay down our revolving credit agreement.
Collateral — The Company’s obligations under the credit facility are secured by (i) first priority liens and security interests in the capital stock, partnership and membership interests owned by the Company and/or its subsidiaries, and any proceeds thereof, and (ii) the grant by the Company and the guarantors of first priority liens and security interests in substantially all of their tangible and intangible property, and all proceeds thereof, all of which are subject to certain restrictions set forth in the credit agreement. Additionally, there is a negative pledge on all tangible and intangible assets (including all real and personal property) with customary exceptions as reflected in the credit agreement.
Covenants — We are subject to a number of customary covenants under our credit facility, including limitations on additional borrowings, acquisitions, loans to franchisees, lease commitments, stock repurchases and dividend payments, and requirements to maintain certain financial ratios as defined in the credit agreement.
JACK IN THE BOX INC. AND SUBSIDIARIES
NOTES TO CONSOLIDATED FINANCIAL STATEMENTS
Future cash payments — Scheduled principal payments on our long-term debt outstanding at October 2, 20161, 2017 for each of the next five fiscal years and thereafter are as follows (in thousands):
| | | 2017 | | $ | 57,574 |
| |
| 2018 | | 66,633 |
| | $ | 65,885 |
|
| 2019 | | 860,353 |
| | 1,074,211 |
|
| 2020 | | 2,371 |
| | 1,608 |
|
| 2021 | | 2,440 |
| | 1,655 |
|
| 2022 | | | 1,704 |
|
| Thereafter | | 5,715 |
| | 2,393 |
|
| | | $ | 995,086 |
| | $ | 1,147,456 |
|
We may make voluntary prepayments of the loans under the revolving credit agreement and term loan at any time without premium or penalty. Specific events such as asset sales, certain issuances of debt, and insurance and condemnation recoveries, may trigger a mandatory prepayment.
8. LEASES
As lessee — We lease restaurants and other facilities, which generally have renewal clauses of 1 to 20 years exercisable at our option. In some instances, these leases have provisions for contingent rentals based upon a percentage of defined revenues. Many of our restaurant and other facility leases also have rent escalation clauses and require the payment of property taxes, insurance and maintenance costs. We also lease certain restaurant and office equipment. Minimum rental obligations are accounted for on a straight-line basis over the term of the initial lease, plus lease option terms for certain locations.
The components of rent expense were as follows in each fiscal year (in thousands):
|
| | | | | | | | | | | | |
| | | 2016 | | 2015 | | 2014 |
| Minimum rentals | | $ | 222,437 |
| | $ | 212,722 |
| | $ | 213,082 |
|
| Contingent rentals | | 2,943 |
| | 2,549 |
| | 1,986 |
|
| Total rent expense | | 225,380 |
| | 215,271 |
| | 215,068 |
|
| Less rental expense on subleased properties | | (145,173 | ) | | (141,946 | ) | | (139,976 | ) |
| Net rent expense | | $ | 80,207 |
| | $ | 73,325 |
| | $ | 75,092 |
|
JACK IN THE BOX INC. AND SUBSIDIARIES
NOTES TO CONSOLIDATED FINANCIAL STATEMENTS
|
| | | | | | | | | | | | |
| | | 2017 | | 2016 | | 2015 |
| Minimum rentals | | $ | 223,628 |
| | $ | 222,437 |
| | $ | 212,722 |
|
| Contingent rentals | | 3,126 |
| | 2,943 |
| | 2,549 |
|
| Total rent expense | | 226,754 |
| | 225,380 |
| | 215,271 |
|
| Less rental expense on subleased properties | | (145,834 | ) | | (145,173 | ) | | (141,946 | ) |
| Net rent expense | | $ | 80,920 |
| | $ | 80,207 |
| | $ | 73,325 |
|
The following table presents as of October 2, 20161, 2017, future minimum lease payments under capital and operating leases, including leases recorded as lease obligations relating to continuing and discontinued operations (in thousands):
| | | Fiscal Year | | Capital Leases | | Operating
Leases | | Capital Leases | | Operating
Leases |
| 2017 | | $ | 3,423 |
| | $ | 235,048 |
| |
| 2018 | | 3,295 |
| | 206,170 |
| | $ | 2,263 |
| | $ | 235,424 |
|
| 2019 | | 2,911 |
| | 198,043 |
| | 1,968 |
| | 212,500 |
|
| 2020 | | 2,808 |
| | 171,101 |
| | 1,865 |
| | 185,817 |
|
| 2021 | | 2,810 |
| | 153,809 |
| | 1,867 |
| | 170,119 |
|
| 2022 | | | 1,832 |
| | 126,209 |
|
| Thereafter | | 7,107 |
| | 530,142 |
| | 3,045 |
| | 484,677 |
|
| Total minimum lease payments | | 22,354 |
| | $ | 1,494,313 |
| | 12,840 |
| | $ | 1,414,746 |
|
| Less amount representing interest, 3.6% weighted average interest rate | | (3,831 | ) | | | |
| Less amount representing interest, 3.50% weighted average interest rate | | | (1,791 | ) | | |
| Present value of obligations under capital leases | | 18,523 |
| | | | 11,049 |
| | |
| Less current portion | | (2,818 | ) | | | | (2,003 | ) | | |
| Long-term capital lease obligations | | $ | 15,705 |
| | | | $ | 9,046 |
| | |
Total future minimum lease payments of approximately $1.0$1.3 billion included in the table above are expected to be recovered under our non-cancelable operating subleases.
JACK IN THE BOX INC. AND SUBSIDIARIES
NOTES TO CONSOLIDATED FINANCIAL STATEMENTS
Assets recorded under capital leases are included in property and equipment, and consisted of the following at each fiscal year-end (in thousands):
| | | | | 2016 | | 2015 | | 2017 | | 2016 |
| Buildings | | $ | 9,716 |
| | $ | 10,716 |
| | $ | 7,301 |
| | $ | 9,716 |
|
| Equipment | | 17,855 |
| | 16,770 |
| | 11,909 |
| | 17,855 |
|
| Less accumulated amortization | | (10,325 | ) | | (8,453 | ) | | (8,952 | ) | | (10,325 | ) |
| | | $ | 17,246 |
| | $ | 19,033 |
| | $ | 10,258 |
| | $ | 17,246 |
|
Amortization of assets under capital leases is included in depreciation and amortization expense in the consolidated statements of earnings.
As lessor — We lease or sublease restaurants to certain franchisees and others under agreements that generally provide for the payment of percentage rentals in excess of stipulated minimum rentals, usually for a period up to 20 years. Most of our leases have rent escalation clauses and renewal clauses of 5 to 20 years. The following table summarizes rents received under these agreements in each fiscal year (in thousands):
| | | | | 2016 | | 2015 | | 2014 | | 2017 | | 2016 | | 2015 |
| Total rental income (1) | | $ | 238,375 |
| | $ | 232,264 |
| | $ | 222,443 |
| | $ | 237,171 |
| | $ | 238,375 |
| | $ | 232,264 |
|
| Contingent rentals | | $ | 31,632 |
| | $ | 28,348 |
| | $ | 19,551 |
| | $ | 33,168 |
| | $ | 31,632 |
| | $ | 28,348 |
|
| |
| (1) | Includes contingent rentals. |
The minimum rents receivable expected to be received under these non-cancelable operating leases and subleases, including leases recorded as lease obligations relating to continuing and discontinuing operations, and excluding contingent rentals, as of October 2, 20161, 2017 are as follows (in thousands):
|
| | | |
| Fiscal Year | |
| 2017 | $ | 207,754 |
|
| 2018 | 187,029 |
|
| 2019 | 202,471 |
|
| 2020 | 199,072 |
|
| 2021 | 210,909 |
|
| Thereafter | 1,200,831 |
|
| Total minimum future rent receivable | $ | 2,208,066 |
|
JACK IN THE BOX INC. AND SUBSIDIARIES
NOTES TO CONSOLIDATED FINANCIAL STATEMENTS
|
| | | |
| Fiscal Year | |
| 2018 | $ | 204,162 |
|
| 2019 | 219,358 |
|
| 2020 | 215,921 |
|
| 2021 | 229,382 |
|
| 2022 | 206,554 |
|
| Thereafter | 1,248,289 |
|
| Total minimum future rent receivable | $ | 2,323,666 |
|
Assets held for lease and included in property and equipment consisted of the following at each fiscal year-end (in thousands):
| | | | | 2016 | | 2015 | | 2017 | | 2016 |
| Land | | $ | 73,527 |
| | $ | 72,248 |
| | $ | 88,647 |
| | $ | 73,527 |
|
| Buildings | | 674,690 |
| | 678,044 |
| | 759,003 |
| | 674,690 |
|
| Equipment | | 4,382 |
| | 4,374 |
| | 342 |
| | 4,382 |
|
| | | 752,599 |
| | 754,666 |
| | 847,992 |
| | 752,599 |
|
| Less accumulated depreciation | | (480,600 | ) | | (453,056 | ) | | (540,851 | ) | | (480,600 | ) |
| | | $ | 271,999 |
| | $ | 301,610 |
| | $ | 307,141 |
| | $ | 271,999 |
|
JACK IN THE BOX INC. AND SUBSIDIARIES NOTES TO CONSOLIDATED FINANCIAL STATEMENTS
9. IMPAIRMENT AND OTHER CHARGES, NET
Impairment and other charges, net in the accompanying consolidated statements of earnings is comprised of the following in each fiscal year (in thousands):
| | | | | 2016 | | 2015 | | 2014 | | 2017 | | 2016 | | 2015 |
| Restructuring costs | | $ | 10,067 |
| | $ | 29 |
| | $ | 8,621 |
| | $ | 8,837 |
| | $ | 10,067 |
| | $ | 29 |
|
| Costs of closed restaurants (primarily lease obligations) and other | | 3,431 |
| | 3,592 |
| | 2,841 |
| |
| Costs of closed restaurants and other | | | 7,237 |
| | 3,431 |
| | 3,592 |
|
Losses on disposition of property and equipment, net | | 2,801 |
| | 1,319 |
| | 1,674 |
| | 3,635 |
| | 2,801 |
| | 1,319 |
|
| Restaurant impairment charges | | | 3,096 |
| | 544 |
| | 557 |
|
| Accelerated depreciation | | 2,214 |
| | 6,260 |
| | 1,202 |
| | 2,336 |
| | 2,214 |
| | 6,260 |
|
| Restaurant impairment charges | | 544 |
| | 557 |
| | 570 |
| |
| | | $ | 19,057 |
| | $ | 11,757 |
| | $ | 14,908 |
| | $ | 25,141 |
| | $ | 19,057 |
| | $ | 11,757 |
|
| |
| (1) | In 2015, losses on the disposition of property and equipment were offset by $0.9 million in gains from the resolution of one eminent domain matter involving a Jack in the Box restaurant. |
Restructuring costs — SinceRestructuring charges in fiscal years 2017 and 2016 are the beginningresult of 2012, we have been engageda plan that management initiated in a comprehensive review offiscal 2016 to reduce our organization structure, including evaluating opportunities to decrease general and administrative expenses, as well as improve profitability across both brands. In 2016, management initiated acosts. This plan that includes cost saving initiatives from workforce reductions, the relocation and consolidation of our Qdoba corporate support center, refranchising initiatives, and the consolidation of information technology across both brands. Further, during 2017, we retained Morgan Stanley & Co. LLC to assist our Board of Directors in its evaluation of potential alternatives with respect to Qdoba (the “Qdoba Evaluation”), as well as other ways to enhance shareholder value, and these costs are also included in 2017 restructuring charges.
The following is a summary of the costs incurred in connection with these activities during each fiscal year (in thousands):
| | | | | 2016 | | 2015 | | 2014 | | 2017 | | 2016 | | 2015 |
| Qdoba Evaluation costs (1) | | | $ | 5,285 |
| | $ | — |
| | $ | — |
|
Facility closing costs | | | 2,052 |
| | 2,004 |
| | — |
|
| Employee severance and related costs | | $ | 7,583 |
| | $ | 29 |
| | $ | 2,141 |
| | 731 |
| | 7,583 |
| | 29 |
|
Facility closing costs | | 2,004 |
| | — |
| | — |
| |
| Other (1) | | 480 |
| | — |
| | 6,480 |
| |
| Other (3) | | | 769 |
| | 480 |
| | — |
|
| | | $ | 10,067 |
| | $ | 29 |
| | $ | 8,621 |
| | $ | 8,837 |
| | $ | 10,067 |
| | $ | 29 |
|
| |
| (1) | OtherQdoba Evaluation costs are primarily comprised of legal services, third party consulting and audit fees. |
| |
| (2) | In 2017, facility closing costs include $2.0 million in costs related to the exit and early lease termination of the Qdoba corporate support center, which was offset by $0.9 million due to the reversal of the related tenant improvement allowance, and $0.3 million due to the reversal of the related straight-line rent expense. In 2017, facility closing costs also includes $1.2 million of accelerated depreciation related to the relocation of our Qdoba corporate support center. |
| |
| (3) | In 2017, other primarily represents employee relocation costs in 2016, and in 2014, an impairment chargemoving expenses related to a restaurant software asset we no longer planned to place in service.the relocation of our Qdoba corporate support center. In 2016, other primarily represents employee relocation costs. |
In 2016, approximately $2.0 million and $6.3 million
The following is a summary of theour restructuring costs are related to our Jackby operating segment in the Box and Qdoba restaurant operating segments, respectively, and approximately $1.8 million is related to shared services functions. each fiscal year (in thousands):
|
| | | | | | | | | | | | |
| | | 2017 | | 2016 | | 2015 |
| Qdoba restaurant operations (1) | | $ | 5,206 |
| | $ | 1,991 |
| | $ | — |
|
| Shared services (2) | | 3,423 |
| | 1,764 |
| | 29 |
|
| Jack in the Box restaurant operations | | 208 |
| | 6,312 |
| | — |
|
| | | $ | 8,837 |
| | $ | 10,067 |
| | $ | 29 |
|
| |
| (1) | In 2017, Qdoba restaurant operations includes $2.3 million of Qdoba Evaluation costs. |
| |
| (2) | Shared service functions consist primarily of accounting/finance, information technology, human resources, audit services, legal, tax and treasury. In 2017, costs include $3.0 million of Qdoba Evaluation costs. |
At this time, we are unable to estimate additional charges to be incurred subsequent to fiscal 2016.incurred.
JACK IN THE BOX INC. AND SUBSIDIARIES
NOTES TO CONSOLIDATED FINANCIAL STATEMENTS
Total accrued severance costs related to our restructuring activities are included in accrued liabilities and changed as follows during fiscal 20162017 (in thousands):
|
| | | | |
| Balance as of September 27, 2015 | | $ | — |
|
| Additions | | 7,583 |
|
| Cash payments | | (3,385 | ) |
| Balance as of October 2, 2016 | | $ | 4,198 |
|
JACK IN THE BOX INC. AND SUBSIDIARIES
NOTES TO CONSOLIDATED FINANCIAL STATEMENTS
|
| | | | |
| Balance as of October 2, 2016 | | $ | 4,198 |
|
| Additions | | 731 |
|
| Cash payments | | (4,281 | ) |
| Balance as of October 1, 2017 | | $ | 648 |
|
Restaurant closing costs — Costs of closed restaurants in 2017 primarily include costs related to canceled capital projects, primarily new site development, and future lease commitments and expected ancillary cost, net of anticipated sublease rentals. Cost of closed restaurants in 2016 and 2015 primarily consist of future lease commitmentscommitment charges and expected ancillary costs, net of anticipated sublease rentals.
Accrued restaurant closing costs included in accrued liabilities and other long-term liabilities, changed as follows during fiscal 20162017 (in thousands):
| | | Balance as of September 27, 2015 | | $ | 9,707 |
| |
| Balance as of October 2, 2016 | | | $ | 7,231 |
|
| Interest expense | | | 1,594 |
|
| Adjustments (1) | | | 959 |
|
| Additions | | 464 |
| | 549 |
|
| Adjustments (1) | | 946 |
| |
| Interest expense | | 1,442 |
| |
| Cash payments | | (5,328 | ) | | (4,130 | ) |
| Balance as of October 2, 2016 (2) | | $ | 7,231 |
| |
| Balance as of October 1, 2017 (2) (3) | | | $ | 6,203 |
|
| |
| (1) | Adjustments relate primarily to revisions of certain sublease and cost assumptions. Our estimates related to our future lease obligations, primarily the sublease income we anticipate, are subject to a high degree of judgment and may differ from actual sublease income due to changes in economic conditions, desirability of the sites and other factors. |
| |
| (2) | The weighted average remaining lease term related to these commitments is approximately fivefour years. |
| |
| (3) | This balance excludes $2.9 million of restaurant closing costs that are included in accrued liabilities and other long-term liabilities, which were initially recorded as losses on the sale of company-operated restaurants upon sale to Jack in the Box franchisees in prior years. |
The future minimum lease payments and receipts for the next five fiscal years and thereafter are included in the amounts disclosed in Note 8, Leases. Our obligations under the leases included in the above table expire at various dates between fiscal 20172018 and 2029.
Disposition of property and equipmentRestaurant Impairment Charges — In 2015, losses on the disposition of property and equipment were offset by $0.9 million in gains from the resolution of one eminent domain matter involving a Jack in the Box restaurant.
Accelerated depreciation — When a long-lived asset will be replaced or otherwise disposed of prior to the end of its estimated useful life, the useful life of the asset is adjusted based on the estimated disposal date and accelerated depreciation is recognized. In 2016 and 2015, accelerated depreciation primarily relates to expenses at our Jack in the Box company-operated restaurants for exterior facility enhancements and the replacement of technology equipment, and in 2015 it also includes a $3.6 million charge related to the replacement of beverage equipment. In 2014, accelerated depreciation primarily relates to restaurant facility enhancements.
Restaurant impairment charges— When events and circumstances indicate that our long-lived assets might be impaired and their carrying amount is greater than the undiscounted cash flows we expect to generate from such assets, we recognize an impairment loss as the amount by which the carrying value exceeds the fair value of the assets. In 2017, restaurant impairment charges included $2.4 million related to the impairment of three underperforming Qdoba restaurants which are currently held for use, and $0.7 million in charges for Qdoba furniture and equipment resulting from new restaurant design changes. Impairment charges in all years presented2016 and 2015 were not material to our consolidated financial statements.
Accelerated depreciation — When a long-lived asset will be replaced or otherwise disposed of prior to the end of its estimated useful life, the useful life of the asset is adjusted based on the estimated disposal date and accelerated depreciation is recognized. In fiscal 2017, accelerated depreciation primarily relates to Qdoba and Jack in the Box restaurant remodels, as well as the anticipated closure of three Jack in the Box and three Qdoba company-operated restaurants. In fiscal 2016 and 2015, accelerated depreciation primarily relates to expenses at our Jack in the Box company-operated restaurants for exterior facility enhancements and the replacement of technology equipment, and in fiscal 2015 it also includes the replacement of beverage equipment.
JACK IN THE BOX INC. AND SUBSIDIARIES
NOTES TO CONSOLIDATED FINANCIAL STATEMENTS
10. INCOME TAXES
Income taxes consist of the following in each fiscal year (in thousands):
|
| | | | | | | | | | | | |
| | | 2016 | | 2015 | | 2014 |
| Current: | | | | | | |
| Federal | | $ | 32,276 |
| | $ | 59,362 |
| | $ | 43,864 |
|
| State | | 5,315 |
| | 9,598 |
| | 3,770 |
|
| | | 37,591 |
| | 68,960 |
| | 47,634 |
|
| Deferred: | | | | | | |
| Federal | | 29,975 |
| | (2,018 | ) | | 3,700 |
|
| State | | 4,998 |
| | (1,173 | ) | | 452 |
|
| | | 34,973 |
| | (3,191 | ) | | 4,152 |
|
| Income tax expense from continuing operations | | $ | 72,564 |
| | $ | 65,769 |
| | $ | 51,786 |
|
| | | | | | | |
| Income tax benefit from discontinued operations | | $ | (1,365 | ) | | $ | (2,410 | ) | | $ | (3,629 | ) |
JACK IN THE BOX INC. AND SUBSIDIARIES
NOTES TO CONSOLIDATED FINANCIAL STATEMENTS
|
| | | | | | | | | | | | |
| | | 2017 | | 2016 | | 2015 |
| Current: | | | | | | |
| Federal | | $ | 80,787 |
| | $ | 32,276 |
| | $ | 59,362 |
|
| State | | 12,736 |
| | 5,315 |
| | 9,598 |
|
| | | 93,523 |
| | 37,591 |
| | 68,960 |
|
| Deferred: | | | | | | |
| Federal | | (9,816 | ) | | 29,975 |
| | (2,018 | ) |
| State | | (2,392 | ) | | 4,998 |
| | (1,173 | ) |
| | | (12,208 | ) | | 34,973 |
| | (3,191 | ) |
| Income tax expense from continuing operations | | $ | 81,315 |
| | $ | 72,564 |
| | $ | 65,769 |
|
| | | | | | | |
| Income tax benefit from discontinued operations | | $ | (1,868 | ) | | $ | (1,365 | ) | | $ | (2,410 | ) |
A reconciliation of the federal statutory income tax rate to our effective tax rate for continuing operations is as follows:
| | | | | 2016 | | 2015 | | 2014 | | 2017 | | 2016 | | 2015 |
| Computed at federal statutory rate | | 35.0 | % | | 35.0 | % | | 35.0 | % | | 35.0 | % | | 35.0 | % | | 35.0 | % |
| State income taxes, net of federal tax benefit | | 3.7 |
| | 3.7 |
| | 3.3 |
| | 3.8 |
| | 3.7 |
| | 3.7 |
|
| Benefit of jobs tax credits, net of valuation allowance | | (1.0 | ) | | (1.1 | ) | | (1.2 | ) | | (0.4 | ) | | (1.0 | ) | | (1.1 | ) |
| (Benefit) expense related to COLIs | | (1.3 | ) | | 0.3 |
| | (1.6 | ) | | (1.0 | ) | | (1.3 | ) | | 0.3 |
|
| Other, net | | 0.1 |
| | (1.0 | ) | | (0.2 | ) | | (0.4 | ) | | 0.1 |
| | (1.0 | ) |
| | | 36.5 | % | | 36.9 | % | | 35.3 | % | | 37.0 | % | | 36.5 | % | | 36.9 | % |
The tax effects of temporary differences that give rise to significant portions of deferred tax assets and deferred tax liabilities at each fiscal year-end are presented below (in thousands):
| | | | | 2016 | | 2015 | | 2017 | | 2016 |
| Deferred tax assets: | | | | | | | | |
| Accrued defined benefit pension and postretirement benefits | | $ | 89,253 |
| | $ | 92,456 |
| | $ | 67,471 |
| | $ | 89,253 |
|
| Impairment | | 21,904 |
| | 23,982 |
| | 23,986 |
| | 21,904 |
|
| Interest rate swaps | | 18,483 |
| | 10,208 |
| |
| Accrued insurance | | 14,378 |
| | 13,245 |
| | 14,708 |
| | 14,378 |
|
| Tax loss and tax credit carryforwards | | 13,624 |
| | 14,081 |
| | 11,860 |
| | 13,624 |
|
| Lease commitments related to closed or refranchised locations | | | 10,337 |
| | 7,440 |
|
| Share-based compensation | | | 9,715 |
| | 9,091 |
|
| Interest rate swaps | | | 8,855 |
| | 18,483 |
|
| Leasing transactions | | 11,144 |
| | 11,442 |
| | 7,532 |
| | 11,144 |
|
| Share-based compensation | | 9,091 |
| | 9,331 |
| |
| Lease commitments related to closed or refranchised locations | | 7,440 |
| | 11,471 |
| |
| Accrued incentive compensation | | 5,536 |
| | 6,412 |
| |
| Accrued vacation pay expense | | 2,137 |
| | 2,193 |
| |
| Other reserves and allowances | | 1,935 |
| | 1,584 |
| | 2,843 |
| | 1,935 |
|
| Deferred income | | 1,887 |
| | 1,417 |
| | 1,898 |
| | 1,887 |
|
| Accrued vacation pay expense | | | 1,835 |
| | 2,137 |
|
| Accrued incentive compensation | | | 1,021 |
| | 5,536 |
|
| Other, net | | 3,876 |
| | 2,030 |
| | 5,185 |
| | 3,876 |
|
| Total gross deferred tax assets | | 200,688 |
| | 199,852 |
| | 167,246 |
| | 200,688 |
|
| Valuation allowance | | (11,365 | ) | | (11,563 | ) | | (8,507 | ) | | (11,365 | ) |
| Total net deferred tax assets | | 189,323 |
| | 188,289 |
| | 158,739 |
| | 189,323 |
|
| Deferred tax liabilities: | | | | | | | | |
| Intangible assets | | | (33,448 | ) | | (31,827 | ) |
| Property and equipment, principally due to differences in depreciation | | (38,859 | ) | | (38,403 | ) | | (25,077 | ) | | (38,859 | ) |
| Intangible assets | | (31,827 | ) | | (30,132 | ) | |
| Other | | (1,050 | ) | | (1,568 | ) | | (1,519 | ) | | (1,050 | ) |
| Total gross deferred tax liabilities | | (71,736 | ) | | (70,103 | ) | | (60,044 | ) | | (71,736 | ) |
| Net deferred tax assets | | $ | 117,587 |
| | $ | 118,186 |
| | $ | 98,695 |
| | $ | 117,587 |
|
JACK IN THE BOX INC. AND SUBSIDIARIES
NOTES TO CONSOLIDATED FINANCIAL STATEMENTS
Deferred tax assets as of October 2, 20161, 2017 include state net operating loss carry-forwards of approximately $72.5$66.5 million expiring at various times between 20172018 and 2036.2037. At October 2, 2016 and September 27, 2015,1, 2017 we recorded a valuation allowance of $8.5 million related to losses and state tax credits, ofwhich decreased from the $11.4 million and $11.6 million, respectively.at October 2, 2016 primarily due to the release of the valuation allowance on state tax credits. We believe that it is more likely than not that these net operating loss and credit carry-forwards will not be realized and that the remaining deferred tax assets will be realized through future taxable income or alternative tax strategies.
Our gross unrecognized tax benefits associated with uncertain income tax positions decreased during fiscal 2015 due to the conclusion of an audit regarding a specific claim with California. A reconciliation of the beginning and ending amounts of unrecognized tax benefits follows (in thousands):
|
| | | | | | | | |
| | | 2016 | | 2015 |
| Balance beginning of year | | $ | — |
| | $ | 374 |
|
| Change related to tax positions | | — |
| | (374 | ) |
| Balance at end of year | | $ | — |
| | $ | — |
|
From time to time, we may take positions for filing our tax returns which may differ from the treatment of the same item for financial reporting purposes. The ultimate outcome of these items will not be known until the Internal Revenue Service or state has completed its examination or until the statute of limitations has expired.
JACK IN THE BOX INC. AND SUBSIDIARIES
NOTES TO CONSOLIDATED FINANCIAL STATEMENTS
The major jurisdictions in which the Company files income tax returns include the United States and states in which we operate that impose an income tax. The federal statutes of limitations have not expired for fiscal years 20132014 and forward. The statutes of limitations for California and Texas, which constitute the Company’s major state tax jurisdictions, have not expired for fiscal years 20122013 and forward and 20112012 and forward, respectively.
11. RETIREMENT PLANS
We sponsor programs that provide retirement benefits to our employees. These programs include defined contribution plans, defined benefit pension plans and postretirement healthcare plans.
Defined contribution plans — We maintain a qualified savings plan pursuant to Section 401(k) of the Internal Revenue Code (“IRC”). Effective January 1, 2016, the plan was amended and restated to incorporate Safe Harbor Plan design features which include changes to participant eligibility and company contribution amounts and vesting. The plan allows all employees who have satisfied the service requirements and reached age 21 to defer a percentage of their pay on a pre-tax basis. Beginning January 1, 2016, we match 100% of the first 4% of compensation deferred by the participant. Prior to January 1, 2016, we matched 50% of the first 4% of compensation deferred by the participant. Our contributions under this plan were $2.4 million in fiscal 2017, and $3.8 million and $1.2 million in fiscal 2016 and $1.2 million and $1.0 million in 2015, and 2014, respectively.
We also maintain an unfunded, non-qualified deferred compensation plan for key executives and other members of management whose compensation deferrals or company matching contributions to the qualified savings plan are limited due to IRC rules. Effective January 1, 2016, this non-qualified plan was amended to replace the company matching contribution with an annual restoration match that is intended to “restore” up to the full 4% match for participants whose elective deferrals (and related company matching contributions) to the qualified savings plan were limited due to IRC rules. A participant’s right to the Company restoration match vests immediately. Prior to January 1, 2016, we matched 100% of the first 3% contributed by the participant. This plan allows participants to defer up to 50% of their salary and 85% of their bonus, on a pre-tax basis. In addition, to compensate executives who were hired or promoted into an eligible position prior to May 7, 2015 and who may no longer participate in our supplemental defined benefit pension plan, we also contribute a supplemental amount equal to 4% of an eligible employee’s salary and bonus for a period of 10 years in such eligible position. Our contributions under the non-qualified deferred compensation plan were $0.5 million in fiscal 2017, and $0.3 million and $1.3 million in fiscal 2016 and $1.3 million and $1.1 million in fiscal 2015, and 2014, respectively. A participant’s right to Company contributions in the qualified plan vests immediately, and in the non-qualified plan vests at a rate of 25% per year of service.
Defined benefit pension plans — We sponsor two defined benefit pension plans, a “Qualified Plan” covering substantially all full-time employees hired prior to January 1, 2011, and an unfunded supplemental executive retirement plan (“SERP”) which provides certain employees additional pension benefits and was closed to new participants effective January 1, 2007. In fiscal 2011, the Board of Directors approved changes to our Qualified Plan whereby participants will no longer accrue benefits effective December 31, 2015. This change was accounted for as a plan “curtailment” in accordance with FASB authoritative guidance. Benefits under both plans are based on the employees’ years of service and compensation over defined periods of employment.
Postretirement healthcare plans — We also sponsor two healthcare plans, closed to new participants, that provide postretirement medical benefits to certain employees who have met minimum age and service requirements. The plans are contributory; with retiree contributions adjusted annually, and contain other cost-sharing features such as deductibles and coinsurance.
JACK IN THE BOX INC. AND SUBSIDIARIES
NOTES TO CONSOLIDATED FINANCIAL STATEMENTS
Obligations and funded status — The following table provides a reconciliation of the changes in benefit obligations, plan assets and funded status of our retirement plans for each fiscal year (in thousands):
| | | | | Qualified Plan | | SERP | | Postretirement Health Plans | | Qualified Plan | | SERP | | Postretirement Health Plans |
| | | 2016 | | 2015 | | 2016 | | 2015 | | 2016 | | 2015 | | 2017 | | 2016 | | 2017 | | 2016 | | 2017 | | 2016 |
| Change in benefit obligation: | | | | | | | | | | | | | | | | | | | | | | | | |
| Obligation at beginning of year | | $ | 442,264 |
| | $ | 434,896 |
| | $ | 75,346 |
| | $ | 69,733 |
| | $ | 28,911 |
| | $ | 27,626 |
| | $ | 522,459 |
| | $ | 442,264 |
| | $ | 81,450 |
| | $ | 75,346 |
| | $ | 28,214 |
| | $ | 28,911 |
|
| Service cost | | 4,479 |
| | 7,592 |
| | 773 |
| | 676 |
| | — |
| | — |
| | 1,331 |
| | 4,479 |
| | 855 |
| | 773 |
| | — |
| | — |
|
| Interest cost | | 20,926 |
| | 19,750 |
| | 3,253 |
| | 2,945 |
| | 1,263 |
| | 1,196 |
| | 19,889 |
| | 20,926 |
| | 2,850 |
| | 3,253 |
| | 1,003 |
| | 1,263 |
|
| Participant contributions | | — |
| | — |
| | — |
| | — |
| | 127 |
| | 114 |
| | — |
| | — |
| | — |
| | — |
| | 118 |
| | 127 |
|
| Actuarial loss (gain) | | 75,456 |
| | 16,757 |
| | 6,938 |
| | 6,447 |
| | (768 | ) | | 1,008 |
| |
| Actuarial (gain) loss | | | (20,081 | ) | | 75,456 |
| | (2,296 | ) | | 6,938 |
| | (2,652 | ) | | (768 | ) |
| Benefits paid | | (9,791 | ) | | (10,261 | ) | | (4,860 | ) | | (4,455 | ) | | (1,161 | ) | | (1,184 | ) | | (10,425 | ) | | (9,791 | ) | | (4,458 | ) | | (4,860 | ) | | (1,168 | ) | | (1,161 | ) |
| Settlements | | (10,875 | ) | | (26,470 | ) | | — |
| | — |
| | — |
| | — |
| | (19,406 | ) | | (10,875 | ) | | — |
| | — |
| | — |
| | — |
|
| Other | | — |
| | — |
| | — |
| | — |
| | (158 | ) | | 151 |
| | — |
| | — |
| | — |
| | — |
| | 145 |
| | (158 | ) |
| Obligation at end of year | | $ | 522,459 |
| | $ | 442,264 |
| | $ | 81,450 |
| | $ | 75,346 |
| | $ | 28,214 |
| | $ | 28,911 |
| | $ | 493,767 |
| | $ | 522,459 |
| | $ | 78,401 |
| | $ | 81,450 |
| | $ | 25,660 |
| | $ | 28,214 |
|
| Change in plan assets: | | | | | | | | | | | | | | | | | | | | | | | | |
| Fair value at beginning of year | | $ | 332,657 |
| | $ | 356,312 |
| | $ | — |
| | $ | — |
| | $ | — |
| | $ | — |
| | $ | 438,402 |
| | $ | 332,657 |
| | $ | — |
| | $ | — |
| | $ | — |
| | $ | — |
|
| Actual return on plan assets | | 31,411 |
| | (6,924 | ) | | — |
| | — |
| | — |
| | — |
| | 52,138 |
| | 31,411 |
| | — |
| | — |
| | — |
| | — |
|
| Participant contributions | | — |
| | — |
| | — |
| | — |
| | 127 |
| | 114 |
| | — |
| | — |
| | — |
| | — |
| | 118 |
| | 127 |
|
| Employer contributions | | 95,000 |
| | 20,000 |
| | 4,860 |
| | 4,455 |
| | 1,192 |
| | 919 |
| | — |
| | 95,000 |
| | 4,458 |
| | 4,860 |
| | 905 |
| | 1,192 |
|
| Benefits paid | | (9,791 | ) | | (10,261 | ) | | (4,860 | ) | | (4,455 | ) | | (1,161 | ) | | (1,184 | ) | | (10,425 | ) | | (9,791 | ) | | (4,458 | ) | | (4,860 | ) | | (1,168 | ) | | (1,161 | ) |
| Settlements | | (10,875 | ) | | (26,470 | ) | | — |
| | — |
| | — |
| | — |
| | (19,406 | ) | | (10,875 | ) | | — |
| | — |
| | — |
| | — |
|
| Other | | — |
| | — |
| | — |
| | — |
| | (158 | ) | | 151 |
| | — |
| | — |
| | — |
| | — |
| | 145 |
| | (158 | ) |
| Fair value at end of year | | $ | 438,402 |
| | $ | 332,657 |
| | $ | — |
| | $ | — |
| | $ | — |
| | $ | — |
| | $ | 460,709 |
| | $ | 438,402 |
| | $ | — |
| | $ | — |
| | $ | — |
| | $ | — |
|
| Funded status at end of year | | $ | (84,057 | ) | | $ | (109,607 | ) | | $ | (81,450 | ) | | $ | (75,346 | ) | | $ | (28,214 | ) | | $ | (28,911 | ) | | $ | (33,058 | ) | | $ | (84,057 | ) | | $ | (78,401 | ) | | $ | (81,450 | ) | | $ | (25,660 | ) | | $ | (28,214 | ) |
| Amounts recognized on the balance sheet: | | | | | | | | | | | | | | | | | | | | | | | | |
| Current liabilities | | $ | — |
| | $ | — |
| | $ | (4,504 | ) | | $ | (4,477 | ) | | $ | (1,325 | ) | | $ | (1,294 | ) | | $ | — |
| | $ | — |
| | $ | (4,448 | ) | | $ | (4,504 | ) | | $ | (1,308 | ) | | $ | (1,325 | ) |
| Noncurrent liabilities | | (84,057 | ) | | (109,607 | ) | | (76,946 | ) | | (70,869 | ) | | (26,889 | ) | | (27,617 | ) | | (33,058 | ) | | (84,057 | ) | | (73,953 | ) | | (76,946 | ) | | (24,352 | ) | | (26,889 | ) |
| Total liability recognized | | $ | (84,057 | ) | | $ | (109,607 | ) | | $ | (81,450 | ) | | $ | (75,346 | ) | | $ | (28,214 | ) | | $ | (28,911 | ) | | $ | (33,058 | ) | | $ | (84,057 | ) | | $ | (78,401 | ) | | $ | (81,450 | ) | | $ | (25,660 | ) | | $ | (28,214 | ) |
| Amounts in AOCI not yet reflected in net periodic benefit cost: | | | | | | | | | | | | | | | | | | | | | | | | |
| Unamortized actuarial loss, net | | $ | 216,129 |
| | $ | 153,156 |
| | $ | 37,417 |
| | $ | 31,738 |
| | $ | 2,239 |
| | $ | 3,226 |
| |
| Unamortized actuarial loss (gain), net | | | $ | 167,598 |
| | $ | 216,129 |
| | $ | 33,462 |
| | $ | 37,417 |
| | $ | (574 | ) | | $ | 2,239 |
|
| Unamortized prior service cost | | — |
| | — |
| | 571 |
| | 811 |
| | — |
| | — |
| | — |
| | — |
| | 418 |
| | 571 |
| | — |
| | — |
|
| Total | | $ | 216,129 |
| | $ | 153,156 |
| | $ | 37,988 |
| | $ | 32,549 |
| | $ | 2,239 |
| | $ | 3,226 |
| | $ | 167,598 |
| | $ | 216,129 |
| | $ | 33,880 |
| | $ | 37,988 |
| | $ | (574 | ) | | $ | 2,239 |
|
| Other changes in plan assets and benefit obligations recognized in OCI: | | | | | | | | | | | | | | | | | | | | | | | | |
| Net actuarial loss (gain) | | $ | 65,801 |
| | $ | 46,952 |
| | $ | 6,938 |
| | $ | 6,447 |
| | $ | (768 | ) | | $ | 1,008 |
| |
| Net actuarial (gain) loss | | | $ | (44,077 | ) | | $ | 65,801 |
| | $ | (2,296 | ) | | $ | 6,938 |
| | $ | (2,652 | ) | | $ | (768 | ) |
| Amortization of actuarial loss | | (2,828 | ) | | (8,278 | ) | | (1,259 | ) | | (1,134 | ) | | (219 | ) | | (182 | ) | | (4,455 | ) | | (2,828 | ) | | (1,659 | ) | | (1,259 | ) | | (162 | ) | | (219 | ) |
| Amortization of prior service cost | | — |
| | — |
| | (240 | ) | | (269 | ) | | — |
| | — |
| | — |
| | — |
| | (153 | ) | | (240 | ) | | — |
| | — |
|
| Total recognized in OCI | | 62,973 |
| | 38,674 |
| | 5,439 |
| | 5,044 |
| | (987 | ) | | 826 |
| | (48,532 | ) | | 62,973 |
| | (4,108 | ) | | 5,439 |
| | (2,814 | ) | | (987 | ) |
| Net periodic benefit cost and other losses | | 6,477 |
| | 12,347 |
| | 5,525 |
| | 5,024 |
| | 1,482 |
| | 1,378 |
| |
| Net periodic benefit (credit) cost and other losses | | | (2,467 | ) | | 6,477 |
| | 5,517 |
| | 5,525 |
| | 1,165 |
| | 1,482 |
|
| Total recognized in comprehensive income | | $ | 69,450 |
| | $ | 51,021 |
| | $ | 10,964 |
| | $ | 10,068 |
| | $ | 495 |
| | $ | 2,204 |
| | $ | (50,999 | ) | | $ | 69,450 |
| | $ | 1,409 |
| | $ | 10,964 |
| | $ | (1,649 | ) | | $ | 495 |
|
| Amounts in AOCI expected to be amortized in fiscal 2017 net periodic benefit cost: | | | | | | | | | | | | | |
| Net actuarial loss | | $ | 4,455 |
| | | | $ | 1,658 |
| | | | $ | 161 |
| | | |
| Amounts in AOCI expected to be amortized in fiscal 2018 net periodic benefit cost: | | | | | | | | | | | | | |
| Net actuarial loss (gain) | | | $ | 3,330 |
| | | | $ | 1,538 |
| | | | $ | (27 | ) | | |
| Prior service cost | | — |
| | | | 153 |
| | | | — |
| | | | — |
| | | | 146 |
| | | | — |
| | |
| Total | | $ | 4,455 |
| | | | $ | 1,811 |
| | | | $ | 161 |
| | | | $ | 3,330 |
| | | | $ | 1,684 |
| | | | $ | (27 | ) | | |
Additional year-end pension plan information — The projected benefit obligation (“PBO”) is the actuarial present value of benefits attributable to employee service rendered to date, including the effects of estimated future pay increases. The accumulated benefit obligation (“ABO”) also reflects the actuarial present value of benefits attributable to employee service rendered to date but does not include the effects of estimated future pay increases. Therefore, the ABO as compared to plan assets is an indication of the assets currently available to fund vested and nonvested benefits accrued through the end of the fiscal year. The funded status is measured as the difference between the fair value of a plan’s assets and its PBO.
JACK IN THE BOX INC. AND SUBSIDIARIES
NOTES TO CONSOLIDATED FINANCIAL STATEMENTS
As of October 2, 20161, 2017 and September 27, 2015October 2, 2016, the Qualified Plan’s ABO exceeded the fair value of its plan assets. The SERP is an unfunded plan and, as such, had no plan assets as of October 2, 20161, 2017 and September 27, 2015October 2, 2016. The following sets forth the PBO, ABO and fair value of plan assets of our pension plans as of the measurement date in each fiscal year (in thousands):
| | | | | 2016 | | 2015 | | 2017 | | 2016 |
| Qualified Plan: | | | | | | | | |
| Projected benefit obligation | | $ | 522,459 |
| | $ | 442,264 |
| | $ | 493,767 |
| | $ | 522,459 |
|
| Accumulated benefit obligation | | $ | 522,459 |
| | $ | 441,451 |
| | $ | 493,767 |
| | $ | 522,459 |
|
| Fair value of plan assets | | $ | 438,402 |
| | $ | 332,657 |
| | $ | 460,709 |
| | $ | 438,402 |
|
| SERP: | | | | | | | | |
| Projected benefit obligation | | $ | 81,450 |
| | $ | 75,346 |
| | $ | 78,401 |
| | $ | 81,450 |
|
| Accumulated benefit obligation | | $ | 80,815 |
| | $ | 74,388 |
| | $ | 78,401 |
| | $ | 80,815 |
|
| Fair value of plan assets | | $ | — |
| | $ | — |
| | $ | — |
| | $ | — |
|
Net periodic benefit cost — The components of the fiscal year net periodic benefit cost were as follows (in thousands):
| | | | | 2016 | | 2015 | | 2014 | | 2017 | | 2016 | | 2015 |
| Qualified Plan: | | | | | | | | | | | | |
| Service cost | | $ | 4,479 |
| | $ | 7,592 |
| | $ | 7,633 |
| | $ | 1,331 |
| | $ | 4,479 |
| | $ | 7,592 |
|
| Interest cost | | 20,926 |
| | 19,750 |
| | 20,196 |
| | 19,889 |
| | 20,926 |
| | 19,750 |
|
| Expected return on plan assets | | (21,756 | ) | | (23,273 | ) | | (24,492 | ) | | (28,142 | ) | | (21,756 | ) | | (23,273 | ) |
| Actuarial loss | | 2,828 |
| | 8,278 |
| | 3,575 |
| | 4,455 |
| | 2,828 |
| | 8,278 |
|
| Net periodic benefit cost | | $ | 6,477 |
| | $ | 12,347 |
| | $ | 6,912 |
| |
| Net periodic benefit (credit) cost | | | $ | (2,467 | ) | | $ | 6,477 |
| | $ | 12,347 |
|
| SERP: | | | | | | | | | | | | |
| Service cost | | $ | 773 |
| | $ | 676 |
| | $ | 490 |
| | $ | 855 |
| | $ | 773 |
| | $ | 676 |
|
| Interest cost | | 3,253 |
| | 2,945 |
| | 3,049 |
| | 2,850 |
| | 3,253 |
| | 2,945 |
|
| Actuarial loss | | 1,259 |
| | 1,134 |
| | 859 |
| | 1,659 |
| | 1,259 |
| | 1,134 |
|
| Amortization of unrecognized prior service cost | | 240 |
| | 269 |
| | 269 |
| | 153 |
| | 240 |
| | 269 |
|
| Net periodic benefit cost | | $ | 5,525 |
| | $ | 5,024 |
| | $ | 4,667 |
| | $ | 5,517 |
| | $ | 5,525 |
| | $ | 5,024 |
|
| Postretirement health plans: | | | | | | | | | | | | |
| Interest cost | | $ | 1,263 |
| | $ | 1,196 |
| | $ | 1,639 |
| | $ | 1,003 |
| | $ | 1,263 |
| | $ | 1,196 |
|
| Actuarial loss | | 219 |
| | 182 |
| | 542 |
| | 162 |
| | 219 |
| | 182 |
|
| Net periodic benefit cost | | $ | 1,482 |
| | $ | 1,378 |
| | $ | 2,181 |
| | $ | 1,165 |
| | $ | 1,482 |
| | $ | 1,378 |
|
Prior service costs are amortized on a straight-line basis from date of participation to full eligibility. Unrecognized gains or losses are amortized using the “corridor approach” under which the net gain or loss in excess of 10% of the greater of the PBO or the market-related value of the assets, if applicable, is amortized. For our Qualified Plan in fiscal year 2017 and 2016, actuarial losses were amortized over the average future expected lifetime of all participants expected to receive benefits, and in 2015, and 2014, actuarial losses were amortized on a straight-line basis over the expected remaining service period of plan participants. For our SERP, actuarial losses are amortized over the expected remaining future lifetime for inactive participants, and for our postretirement health plans, actuarial losses are amortized over the expected remaining future lifetime of inactive participants expected to receive benefits.
JACK IN THE BOX INC. AND SUBSIDIARIES
NOTES TO CONSOLIDATED FINANCIAL STATEMENTS
Assumptions — We determine our actuarial assumptions on an annual basis. In determining the present values of our benefit obligations and net periodic benefit costs as of and for the fiscal years ended October 2, 20161, 2017, September 27, 2015October 2, 2016 and September 28, 201427, 2015, we used the following weighted-average assumptions:
| | | | | 2016 | | 2015 | | 2014 | | 2017 | | 2016 | | 2015 |
| Assumptions used to determine benefit obligations (1): | | | | | | | | | | | | |
| Qualified Plan: | | | | | | | | | | | | |
| Discount rate | | 3.85 | % | | 4.79 | % | | 4.60 | % | | 3.99 | % | | 3.85 | % | | 4.79 | % |
| Rate of future pay increases | | — | % | | 3.50 | % | | 3.50 | % | | — | % | | — | % | | 3.50 | % |
| SERP: | | | | | | | | | | | | |
| Discount rate | | 3.60 | % | | 4.45 | % | | 4.36 | % | | 3.80 | % | | 3.60 | % | | 4.45 | % |
| Rate of future pay increases | | 3.50 | % | | 3.50 | % | | 3.50 | % | | 3.50 | % | | 3.50 | % | | 3.50 | % |
| Postretirement health plans: | | | | | | | | | | | | |
| Discount rate | | 3.64 | % | | 4.47 | % | | 4.43 | % | | 3.82 | % | | 3.64 | % | | 4.47 | % |
| Assumptions used to determine net periodic benefit cost (2): | | | | | | | | | | | | |
| Qualified Plan: | | | | | | | | | | | | |
| Discount rate | | 4.79 | % | | 4.60 | % | | 5.37 | % | | 3.85 | % | | 4.79 | % | | 4.60 | % |
| Long-term rate of return on assets | | 6.50 | % | | 6.50 | % | | 7.25 | % | | 6.50 | % | | 6.50 | % | | 6.50 | % |
| Rate of future pay increases | | 3.50 | % | | 3.50 | % | | 3.50 | % | | — | % | | 3.50 | % | | 3.50 | % |
| SERP: | | | | | | | | | | | | |
| Discount rate | | 4.45 | % | | 4.36 | % | | 4.88 | % | | 3.60 | % | | 4.45 | % | | 4.36 | % |
| Rate of future pay increases | | 3.50 | % | | 3.50 | % | | 3.50 | % | | 3.50 | % | | 3.50 | % | | 3.50 | % |
| Postretirement health plans: | | | | | | | | | | | | |
| Discount rate | | 4.47 | % | | 4.43 | % | | 5.04 | % | | 3.64 | % | | 4.47 | % | | 4.43 | % |
____________________________
| |
| (1) | Determined as of end of year. |
| |
| (2) | Determined as of beginning of year. |
The assumed discount rates were determined by considering the average of pension yield curves constructed of a population of high-quality bonds with a Moody’s or Standard and Poor’s rating of “AA” or better whose cash flow from coupons and maturities match the year-by-year projected benefit payments from the plans. As benefit payments typically extend beyond the date of the longest maturing bond, cash flows beyond 30 years were discounted back to the 30th year and then matched like any other payment.
The assumed expected long-term rate of return on assets is the weighted-average rate of earnings expected on the funds invested or to be invested to provide for the pension obligations. The long-term rate of return on assets was determined taking into consideration our projected asset allocation and economic forecasts prepared with the assistance of our actuarial consultants.
The assumed discount rate and expected long-term rate of return on assets have a significant effect on amounts reported for our pension and postretirement plans. A quarter percentage point decrease in the discount rate and long-term rate of return used would have decreased fiscal 20162017 earnings before income taxes by $0.5$0.3 million and $0.8$1.1 million, respectively.
The assumed average rate of compensation increase is the average annual compensation increase expected over the remaining employment periods for the participating employees. For determining our Qualified Plan’s projected benefit obligation as of October 1, 2017 and October 2, 2016, and the net periodic benefit cost in fiscal 2017, no future pay increases were included in our assumptions as our plan participants no longer accrue benefits effective December 31, 2015.
JACK IN THE BOX INC. AND SUBSIDIARIES
NOTES TO CONSOLIDATED FINANCIAL STATEMENTS
For measurement purposes, the weighted-average assumed health care cost trend rates for our postretirement health plans were as follows for each fiscal year:
| | | | | 2016 | | 2015 | | 2014 | | 2017 | | 2016 | | 2015 |
| Healthcare cost trend rate for next year: | | | | | | | | | | | | |
| Participants under age 65 | | 7.75 | % | | 8.00 | % | | 8.25 | % | | 7.50 | % | | 7.75 | % | | 8.00 | % |
| Participants age 65 or older | | 7.25 | % | | 7.50 | % | | 7.75 | % | | 7.00 | % | | 7.25 | % | | 7.50 | % |
| Rate to which the cost trend rate is assumed to decline: | | | | | | | | | | | | |
| Participants under age 65 | | 4.50 | % | | 4.50 | % | | 4.50 | % | | 4.50 | % | | 4.50 | % | | 4.50 | % |
| Participants age 65 or older | | 4.50 | % | | 4.50 | % | | 4.50 | % | | 4.50 | % | | 4.50 | % | | 4.50 | % |
| Year the rate reaches the ultimate trend rate: | | | | | | | | | | | | |
| Participants under age 65 | | 2030 |
| | 2030 |
| | 2030 |
| | 2030 |
| | 2030 |
| | 2030 |
|
| Participants age 65 or older | | 2028 |
| | 2028 |
| | 2028 |
| | 2028 |
| | 2028 |
| | 2028 |
|
The assumed healthcare cost trend rate represents our estimate of the annual rates of change in the costs of the healthcare benefits currently provided by our postretirement plans. The healthcare cost trend rate implicitly considers estimates of healthcare inflation, changes in healthcare utilization and delivery patterns, technological advances and changes in the health status of the plan participants. The healthcare cost trend rate assumption has a significant effect on the amounts reported. For example, a 1.0% change in the assumed healthcare cost trend rate would have the following effect on the 2016fiscal 2017 net periodic benefit cost and end of year PBO (in thousands):
| | | | | 1% Point Increase | | 1% Point Decrease | | 1% Point Increase | | 1% Point Decrease |
| Total interest and service cost | | $ | 156 |
| | $ | (132 | ) | | $ | 123 |
| | $ | (105 | ) |
| Postretirement benefit obligation | | $ | 3,373 |
| | $ | (2,875 | ) | | $ | 2,892 |
| | $ | (2,482 | ) |
Plan assets — Our investment philosophy is to (1) protect the corpus of the fund; (2) establish investment objectives that will allow the market value to exceed the present value of the vested and unvested liabilities over time; while (3) obtaining adequate investment returns to protect benefits promised to the participants and their beneficiaries. Our asset allocation strategy utilizes multiple investment managers in order to maximize the plan’s return while minimizing risk. We regularly monitor our asset allocation, and senior financial management and the Finance Committee of the Board of Directors review performance results quarterly. We continually review our target asset allocation for our Qualified Plan and when changes are made, we reallocate our plan assets over a period of time, as deemed appropriate by senior financial management, to achieve our target asset allocation. Our plan asset allocation at the end of fiscal 20162017 and target allocations were as follows:
| | | | | 2016 | | Target | | Minimum | | Maximum | | 2017 | | Target | | Minimum | | Maximum |
| Cash and cash equivalents | | 1 | % | | — | % | | — | % | | — | % | | 1 | % | | — | % | | — | % | | — | % |
| Domestic equity | | 23 |
| | 25 |
| | 15 | % | | 35 | % | | 23 |
| | 25 |
| | 15 | % | | 35 | % |
| International equity | | 28 |
| | 25 |
| | 15 | % | | 35 | % | | 26 |
| | 25 |
| | 15 | % | | 35 | % |
| Core fixed funds | | 27 |
| | 25 |
| | 20 | % | | 30 | % | | 29 |
| | 25 |
| | 20 | % | | 30 | % |
| High yield | | 6 |
| | 5 |
| | — | % | | 10 | % | | 4 |
| | 5 |
| | — | % | | 10 | % |
| Alternative investments | | 6 |
| | 9 |
| | — | % | | 20 | % | | 9 |
| | 9 |
| | 4 | % | | 14 | % |
| Real estate | | 9 |
| | 8 |
| | — | % | | 10 | % | | 8 |
| | 8 |
| | 3 | % | | 13 | % |
| Real return bonds | | — |
| | 3 |
| | — | % | | 10 | % | | — |
| | 3 |
| | — | % | | 6 | % |
| | | 100 | % | | 100 | % | | | | | | 100 | % | | 100 | % | | | | |
JACK IN THE BOX INC. AND SUBSIDIARIES
NOTES TO CONSOLIDATED FINANCIAL STATEMENTS
The Company measures its defined benefit plan assets and obligations as of the month-end date closest to its fiscal year end, which is a practical expedient under FASB authoritative guidance. The fair values of the Qualified Plan’s assets by asset category are as follows (in thousands):
| | | | | | | Total | | Quoted Prices in Active Markets for Identical (Level 1) | | Significant Other Observable Inputs (Level 2) | | Significant Unobservable Inputs (Level 3) |
| Items Measured at Fair Value at September 30, 2017: | | | | | | | | | | | |
| Asset Category: | | | | | | | | | | | |
| Cash and cash equivalents | | | (1 | ) | | $ | 3,245 |
| | $ | — |
| | $ | 3,245 |
| | $ | — |
|
| Equity: | | | | | | | | | | | |
| U.S | | | (2 | ) | | 108,241 |
| | 108,241 |
| | — |
| | — |
|
| International | | | (3), (4) |
| | 121,130 |
| | 52,013 |
| | — |
| | — |
|
| Fixed income: | | | | | | | | | | | |
| Investment grade | | | (5 | ) | | 133,737 |
| | — |
| | 133,737 |
| | — |
|
| High yield | | | (6 | ) | | 19,889 |
| | 19,889 |
| | — |
| | — |
|
| Alternatives | | | (4),(7) |
| | 38,933 |
| | — |
| | — |
| | — |
|
| Real estate | | | (4),(8) |
| | 35,534 |
| | — |
| | — |
| | — |
|
| | | | Total | | Quoted Prices in Active Markets for Identical (Level 1) | | Significant Other Observable Inputs (Level 2) | | Significant Unobservable Inputs (Level 3) | | | | $ | 460,709 |
| | $ | 180,143 |
| | $ | 136,982 |
| | $ | — |
|
| Items Measured at Fair Value at September 30, 2016: | | | | | | | | | | | | | | | | | | | | |
| Asset Category: | | | | | | | | | | | | | | | | | | | | |
| Cash and cash equivalents | | (1 | ) | | $ | 5,479 |
| | $ | — |
| | $ | 5,479 |
| | $ | — |
| | (1 | ) | | $ | 5,479 |
| | $ | — |
| | $ | 5,479 |
| | $ | — |
|
| Equity: | | | | | | | | | | | | | | | | | | | | |
| U.S | | (3 | ) | | 101,174 |
| | 101,174 |
| | — |
| | — |
| | (2 | ) | | 101,174 |
| | 101,174 |
| | — |
| | — |
|
| International | | (4 | ) | | 121,884 |
| | 118,960 |
| | 2,924 |
| | — |
| | (3), (4) |
| | 121,884 |
| | 61,097 |
| | — |
| | — |
|
| Fixed income: | | | | | | | | | | | | | | | | | | | | |
| Investment grade | | (5 | ) | | 120,439 |
| | 46,152 |
| | 74,287 |
| | — |
| | (5 | ) | | 120,439 |
| | — |
| | 120,439 |
| | — |
|
| High yield | | (6 | ) | | 24,638 |
| | 24,638 |
| | — |
| | — |
| | (6 | ) | | 24,638 |
| | 24,638 |
| | — |
| | — |
|
| Alternatives | | (7 | ) | | 24,642 |
| | 24,642 |
| | — |
| | — |
| | (7 | ) | | 24,642 |
| | 24,642 |
| | — |
| | — |
|
| Real estate | | (8 | ) | | 40,146 |
| | — |
| | — |
| | 40,146 |
| | (4),(8) |
| | 40,146 |
| | — |
| | — |
| | — |
|
| | | | | $ | 438,402 |
| | $ | 315,566 |
| | $ | 82,690 |
| | $ | 40,146 |
| | | | $ | 438,402 |
| | $ | 211,551 |
| | $ | 125,918 |
| | $ | — |
|
| Items Measured at Fair Value at September 30, 2015: | | | | | | | | | | | |
| Asset Category: | | | | | | | | | | | |
| Cash and cash equivalents | | (2 | ) | | $ | 3,629 |
| | $ | 3,629 |
| | $ | — |
| | $ | — |
| |
| Equity: | | | | | | | | | | | |
| U.S | | (3 | ) | | 83,034 |
| | 83,034 |
| | — |
| | — |
| |
| International | | (4 | ) | | 88,827 |
| | 88,827 |
| | — |
| | — |
| |
| Fixed income: | | | | | | | | | | | |
| Investment grade | | (5 | ) | | 88,621 |
| | 29,054 |
| | 59,567 |
| | — |
| |
| High yield | | (6 | ) | | 7,243 |
| | 7,243 |
| | — |
| | — |
| |
| Alternatives | | (7 | ) | | 24,336 |
| | 24,336 |
| | — |
| | — |
| |
| Real estate | | (8 | ) | | 36,967 |
| | — |
| | — |
| | 36,967 |
| |
| | | | | $ | 332,657 |
| | $ | 236,123 |
| | $ | 59,567 |
| | $ | 36,967 |
| |
| |
| (1) | Cash and cash equivalents are comprised of commercial paper, short-term bills and notes, and short-term investment funds, which are valued at quoted prices in active markets for similar securities. |
| |
| (2) | Cash and cash equivalents are comprised of commercial paper, short-term bills and notes, and short-term investment funds, which are valued at unadjusted quoted market prices. |
| |
(3) | U.S. equity securities are comprised of investments in common stock of U.S. companies for total return purposes. These investments are valued by the trustee at closing prices from national exchanges on the valuation date. |
| |
(4)(3) | International equity securities are comprised of investments in common stock of companies located outside of the U.S for total return purposes. These investments are valued by the trustee at closing prices from national exchanges on the valuation date, or the values are adjusted as a result of market movements following the close of local trading using inputs to models that are observable either directly or indirectly. The portion of these investments that are measured at fair value using the net asset value per share practical expedient (see note 4 below) can be redeemed on a monthly basis. |
| |
| (4) | Certain investments that are measured at fair value using the net asset value per share (or its equivalent) practical expedient have not been categorized in the fair value hierarchy. The fair value amounts presented in this table are intended to permit reconciliation of the fair value hierarchy to the amounts presented in the statement of financial position. |
| |
| (5) | Investment grade fixed income consists of debt obligations either issued by the US government or have a rating of BBB- / Baa or higher assigned by a major credit rating agency. These investments are valued based on unadjusted quoted market prices (Level 1), or based on quoted prices in inactive markets, or whose values are based on models, but the inputs to those models are observable either directly or indirectly (Level 2). |
| |
| (6) | High yield fixed income consists primarily of debt obligations that have a rating of below BBB- / Baa or lower assigned by a major credit rating agency. These investments are valued based on unadjusted quoted market prices. |
| |
| (7) | Alternative investments consists primarily of an investment in asset classes other than stocks, bonds, and cash. Alternative investments can include commodities, hedge funds, private equity, managed futures, and derivatives. These investments are valued based on unadjusted quoted market prices.prices and can be redeemed on a bi-monthly basis. |
| |
| (8) | Real estate is investments in a real estate collective trust for purposes of total return. These investments are valued based on prices or valuation techniques that require inputs that are both unobservable and significant to the overall fair value measurement. These investments can be redeemed on a quarterly basis. |
JACK IN THE BOX INC. AND SUBSIDIARIES
NOTES TO CONSOLIDATED FINANCIAL STATEMENTS
The following table presents the changes in Level 3 investments for the Qualified Plan during 2015 and 2016 (in thousands):
|
| | | |
| Real Estate |
| Balance at September 30, 2014 | $ | 32,593 |
|
| Actual return on plan assets: | |
| Relating to assets still held at the reporting date | 4,665 |
|
| Relating to assets sold during the period | 40 |
|
| Purchases, sales and settlements | (331 | ) |
| Balance at September 30, 2015 | $ | 36,967 |
|
| Actual return on plan assets: | |
| Relating to assets still held at the reporting date | $ | 3,486 |
|
| Relating to assets sold during the period | 67 |
|
| Purchases, sales and settlements | (374 | ) |
| Balance at September 30, 2016 | $ | 40,146 |
|
Future cash flows — Our policy is to fund our plans at or above the minimum required by law. As of the date of our last actuarial funding valuation, there was no minimum requirement. We do not anticipate making any contributions to our Qualified Plan in fiscal 2017.2018. Contributions expected to be paid in the next fiscal year, the projected benefit payments for each of the next five fiscal years, and the total aggregate amount for the subsequent five fiscal years are as follows (in thousands):
| | | | | Defined Benefit Pension Plans | | Postretirement Health Plans | | Defined Benefit Pension Plans | | Postretirement Health Plans |
| Estimated net contributions during fiscal 2017 | | $ | 4,504 |
| | $ | 1,349 |
| |
| Estimated net contributions during fiscal 2018 | | | $ | 4,448 |
| | $ | 1,333 |
|
| Estimated future year benefit payments during fiscal years: | | | | | | | | |
| 2017 | | $ | 15,413 |
| | $ | 1,349 |
| |
| 2018 | | $ | 15,708 |
| | $ | 1,411 |
| | $ | 15,889 |
| | $ | 1,333 |
|
| 2019 | | $ | 16,455 |
| | $ | 1,471 |
| | $ | 16,454 |
| | $ | 1,391 |
|
| 2020 | | $ | 17,125 |
| | $ | 1,524 |
| | $ | 17,315 |
| | $ | 1,440 |
|
| 2021 | | $ | 17,651 |
| | $ | 1,625 |
| | $ | 18,046 |
| | $ | 1,534 |
|
| 2022-2026 | | $ | 106,805 |
| | $ | 8,564 |
| |
| 2022 | | | $ | 18,969 |
| | $ | 1,579 |
|
| 2023-2027 | | | $ | 115,960 |
| | $ | 8,194 |
|
We will continue to evaluate contributions to our Qualified Plan based on changes in pension assets as a result of asset performance in the current market and economic environment. Expected benefit payments are based on the same assumptions used to measure our benefit obligations at October 2, 20161, 2017 and include estimated future employee service, if applicable.
12. SHARE-BASED EMPLOYEE COMPENSATION
Stock incentive plans — We offer share-based compensation plans to attract, retain and motivate key officers, employees and non-employee directors to work toward the financial success of the Company.
Our stock incentive plans are administered by the Compensation Committee of the Board of Directors and have been approved by the stockholders of the Company. The terms and conditions of our share-based awards are determined by the Compensation Committee for each award date and may include provisions for the exercise price, expirations, vesting, restriction on sales, and forfeitures, as applicable. We issue new shares to satisfy stock issuances under our stock incentive plans.
Our Amended and Restated 2004 Stock Incentive Plan authorizes the issuance of up to 11,600,000 common shares in connection with the granting of stock options, stock appreciation rights, restricted stock purchase rights, restricted stock bonuses, restricted stock units or performance units to key employees, directors, and other designated employees. As of October 2, 20161, 2017, 2,322,4902,079,595 shares of common stock were available for future issuance under this plan.
We also maintain a deferred compensation plan for non-management directors under which those who are eligible to receive fees or retainers may choose to defer receipt of their compensation. The deferred amounts are converted to stock equivalents. The plan requires settlement in shares of our common stock based on the number of stock equivalents and dividend equivalents at the time of a participant’s separation from the Board of Directors. This plan provides for the issuance of up to 350,000 shares of common stock in connection with the crediting of stock equivalents. As of October 2, 2016,1, 2017, 143,122 shares of common stock were available for future issuance under this plan.
JACK IN THE BOX INC. AND SUBSIDIARIES
NOTES TO CONSOLIDATED FINANCIAL STATEMENTS
We terminated our employee stock purchase plan (“ESPP”) on February 26, 2015. The ESPP plan was available for all eligible employees to purchase shares of common stock at 95% of the fair market value on the date of purchase. Employees could authorize us to withhold up to 15% of their base compensation during any offering period, subject to certain limitations.
Compensation expense — The components of share-based compensation expense recognized in each fiscal year are as follows (in thousands):
| | | | | 2016 | | 2015 | | 2014 | | 2017 | | 2016 | | 2015 |
| Nonvested stock units | | $ | 5,520 |
| | $ | 4,989 |
| | $ | 3,247 |
| | $ | 6,470 |
| | $ | 5,520 |
| | $ | 4,989 |
|
| Performance share awards | | 3,068 |
| | 4,229 |
| | 3,923 |
| | 2,674 |
| | 3,068 |
| | 4,229 |
|
| Stock options | | 2,509 |
| | 2,782 |
| | 2,660 |
| | 1,914 |
| | 2,509 |
| | 2,782 |
|
| Nonvested restricted stock awards | | 88 |
| | 156 |
| | 310 |
| | 88 |
| | 88 |
| | 156 |
|
| Deferred compensation for directors | | 270 |
| | 264 |
| | 218 |
| |
| Non-management directors’ deferred compensation | | | 270 |
| | 270 |
| | 264 |
|
| Total share-based compensation expense | | $ | 11,455 |
| | $ | 12,420 |
| | $ | 10,358 |
| | $ | 11,416 |
| | $ | 11,455 |
| | $ | 12,420 |
|
JACK IN THE BOX INC. AND SUBSIDIARIES
NOTES TO CONSOLIDATED FINANCIAL STATEMENTS
Nonvested restricted stock units — Nonvested restricted stock units (“RSUs”) are generally issued to executives, non-management directors and certain other members of management and employees. Prior to fiscal 2011, RSUs were granted to certain Executive and Senior Vice Presidents pursuant to our share ownership guidelines. These awards vest upon retirement or termination based on years of service. As of October 2, 2016,1, 2017, 60,272 of such RSUs were outstanding.
Beginning fiscal 2011, we replaced the ownership share grants with time-vested RSUs for certain Vice Presidents and Officers that vest ratably over four to five years and have a 50% or 100% holding requirement on settled shares, which must be held until termination. As of October 2, 2016, 146,0631, 2017, 142,041 of such RSUs were outstanding. RSUs issued to non-management directors vest 12 months from the date of grant, or upon termination of board service if the director elects to defer receipt, and totaled 48,45652,343 units outstanding as of October 2, 2016.1, 2017. RSUs issued to certain other employees either cliff vest or vest ratably over three years and totaled 74,11449,576 units outstanding as of October 2, 2016.1, 2017. These awards are amortized to compensation expense over the estimated vesting period based upon the fair value of our common stock on the award date discounted by the present value of the expected dividend stream over the vesting period.
The following is a summary of RSU activity for fiscal 20162017:
| | | | | Shares | | Weighted- Average Grant Date Fair Value | | Shares | | Weighted- Average Grant Date Fair Value |
| RSUs outstanding at September 27, 2015 | | 332,973 |
| | $ | 44.34 |
| |
| RSUs outstanding at October 2, 2016 | | | 328,905 |
| | $ | 54.05 |
|
| Granted | | 140,794 |
| | $ | 72.06 |
| | 65,947 |
| | $ | 102.42 |
|
| Released | | (105,254 | ) | | $ | 42.65 |
| | (75,604 | ) | | $ | 58.47 |
|
| Forfeited | | (39,608 | ) | | $ | 64.30 |
| | (15,016 | ) | | $ | 80.57 |
|
| RSUs outstanding at October 2, 2016 | | 328,905 |
| | $ | 54.05 |
| |
| RSUs outstanding at October 1, 2017 | | | 304,232 |
| | $ | 62.14 |
|
As of October 2, 2016,1, 2017, there was approximately $8.7$8.0 million of total unrecognized compensation cost related to RSUs, which is expected to be recognized over a weighted-average period of 2.92.5 years. The weighted-average grant date fair value of awards granted was $102.42, $72.06 and $75.07 in fiscal years 2017, 2016 and $49.79 in 2016, 2015, and 2014, respectively. In fiscal years 2017, 2016 2015 and 2014,2015, the total fair value of RSUs that vested and were released was $4.4 million, $4.5 million $2.4 million and $3.5$2.4 million, respectively.
Performance share awards — Performance share awards, granted in the form of stock units, represent a right to receive a certain number of shares of common stock based on the achievement of corporate performance goals and continued employment during the vesting period. Performance share awards issued to executives vest at the end of a three-year period and vested amounts may range from 0% to a maximum of 150% of targeted amounts depending on the achievement of performance measures at the end of a three-year period. The expected cost of the shares is based on the fair value of our stock on the date of grant and is reflected over the vesting period with a reduction for estimated forfeitures. These awards may be settled in cash or shares of common stock at the election of the Company on the date of grant. It is our intent to settle these awards with shares of common stock.
JACK IN THE BOX INC. AND SUBSIDIARIES
NOTES TO CONSOLIDATED FINANCIAL STATEMENTS
The following is a summary of performance share award activity for fiscal 20162017:
| | | | | Shares | | Weighted- Average Grant Date Fair Value | | Shares | | Weighted- Average Grant Date Fair Value |
| Performance share awards outstanding at September 27, 2015 | | 162,914 |
| | $ | 59.37 |
| |
| Performance share awards outstanding at October 2, 2016 | | | 117,619 |
| | $ | 62.13 |
|
| Granted | | 20,685 |
| | $ | 75.25 |
| | 24,599 |
| | $ | 95.33 |
|
| Issued | | (63,708 | ) | | $ | 49.44 |
| | (55,022 | ) | | $ | 65.36 |
|
| Forfeited | | (11,632 | ) | | $ | 69.16 |
| | (1,539 | ) | | $ | 84.04 |
|
| Performance adjustments | | 9,360 |
| | $ | 62.87 |
| | 6,478 |
| | $ | 78.27 |
|
| Performance share awards outstanding at October 2, 2016 | | 117,619 |
| | $ | 62.13 |
| |
| Performance share awards outstanding at October 1, 2017 | | | 92,135 |
| | $ | 78.67 |
|
As of October 2, 2016,1, 2017, there was approximately $1.7 million of total unrecognized compensation cost related to performance share awards which is expected to be recognized over a weighted-average period of 1.51.7 years. The weighted-average grant date fair value of awards granted was $95.33, $75.25 and $73.53 in fiscal years 2017, 2016 and $47.29 in 2016, 2015, and 2014, respectively. The total fair value of awards that became fully vested during fiscal years 2017, 2016 and 2015 and 2014 was $3.5$3.2 million, $3.5 million and $3.6$3.5 million, respectively.
JACK IN THE BOX INC. AND SUBSIDIARIES
NOTES TO CONSOLIDATED FINANCIAL STATEMENTS
Stock options — Prior to fiscal 2007, options granted had contractual terms of 10 or 11 years and employee options generally vested over a four-year period. Beginning fiscal 2007, optionOption grants have contractual terms of seven years and employee options vest over a three-year period. Options may vest sooner for employees meeting certain age and years of service thresholds. All option grants provide for an option exercise price equal to the closing market value of the common stock on the date of grant.
The following is a summary of stock option activity for fiscal 20162017:
| | | | | Shares | | Weighted Average Exercise Price | | Weighted Average Remaining Contractual Term (Years) | | Aggregate Intrinsic Value (in thousands) | | Shares | | Weighted Average Exercise Price | | Weighted Average Remaining Contractual Term (Years) | | Aggregate Intrinsic Value (in thousands) |
| Options outstanding at September 27, 2015 | | 594,348 |
| | $ | 42.72 |
| | | | |
| Options outstanding at October 2, 2016 | | | 338,457 |
| | $ | 61.73 |
| | | |
| Granted | | 99,923 |
| | $ | 75.24 |
| | | | 89,792 |
| | $ | 104.95 |
| | |
| Exercised | | (333,406 | ) | | $ | 31.68 |
| | | | (114,333 | ) | | $ | 45.18 |
| | |
| Forfeited | | (22,408 | ) | | $ | 64.96 |
| | | | (1,557 | ) | | $ | 73.53 |
| | |
| Options outstanding at October 2, 2016 | | 338,457 |
| | $ | 61.73 |
| | 5.23 | | $ | 11,579 |
| |
| Options exercisable at October 2, 2016 | | 113,880 |
| | $ | 50.25 |
| | 4.20 | | $ | 5,203 |
| |
| Options exercisable and expected to vest at October 2, 2016 | | 338,457 |
| | $ | 61.73 |
| | 5.23 | | $ | 11,579 |
| |
| Options outstanding at October 1, 2017 | | | 312,359 |
| | $ | 80.15 |
| | 4.91 | | $ | 7,072 |
|
| Options exercisable at October 1, 2017 | | | 124,824 |
| | $ | 66.64 |
| | 4.11 | | $ | 4,404 |
|
| Options exercisable and expected to vest at October 1, 2017 | | | 312,359 |
| | $ | 80.15 |
| | 4.91 | | $ | 7,072 |
|
The aggregate intrinsic value in the table above is the amount by which the current market price of our stock on October 2, 20161, 2017 exceeds the weighted average exercise price.
We use a valuation model to determine the fair value of options granted which requires the input of highly subjective assumptions, including the expected volatility of the stock price. The following table presents the weighted-average assumptions used for stock option grants in each fiscal year, along with the related weighted-average grant date fair value:
| | | | | 2016 | | 2015 | | 2014 | | 2017 | | 2016 | | 2015 |
| Risk-free interest rate | | 1.66 | % | | 1.78 | % | | 2.05 | % | | 1.37 | % | | 1.66 | % | | 1.78 | % |
| Expected dividends yield | | 1.59 | % | | 1.09 | % | | — | % | | 1.52 | % | | 1.59 | % | | 1.09 | % |
| Expected stock price volatility | | 26.68 | % | | 32.09 | % | | 39.18 | % | | 28.98 | % | | 26.68 | % | | 32.09 | % |
| Expected life of options (in years) | | 4.90 |
| | 6.00 |
| | 6.50 |
| | 3.50 |
| | 4.90 |
| | 6.00 |
|
| Weighted-average grant date fair value | | $ | 16.21 |
| | $ | 22.04 |
| | $ | 20.04 |
| | $ | 20.92 |
| | $ | 16.21 |
| | $ | 22.04 |
|
The risk-free interest rate was determined by a yield curve of risk-free rates based on published U.S. Treasury spot rates in effect at the time of grant and has a term equal to the expected life of the related options. The dividend yield assumption is based on the Company’s history and expectations of dividend payouts at the grant date. We declared our first dividend on May 9, 2014. The expected stock price volatility in all years represents the Company’s historical volatility. The expected life of the options represents the period of time the options are expected to be outstanding and is based on historical trends.
JACK IN THE BOX INC. AND SUBSIDIARIES
NOTES TO CONSOLIDATED FINANCIAL STATEMENTS
As of October 2, 20161, 2017, there was approximately $1.8$1.5 million of total unrecognized compensation cost, net of estimated forfeitures, related to stock options grants which is expected to be recognized over a weighted-average period of 1.31.2 years. The total intrinsic value of stock options exercised was $6.9 million, $18.6 million and $41.8 million in fiscal years 2017, 2016 and $42.4 million in 2016, 2015, and 2014, respectively.
Nonvested stock awards — We previously issued nonvested stock awards (“RSAs”) to certain executives under our share ownership guidelines. Effective fiscal 2009, we no longer issue RSA awards and have replaced them with grants of RSUs. The RSAs vest, subject to the discretion of our Board of Directors in certain circumstances, upon retirement or termination based upon years of service. These awards are amortized to compensation expense over the estimated vesting period based upon the fair value of our common stock on the award date. As of October 2, 2016,1, 2017, RSAs outstanding totaled 95,815 shares with a weighted average grant date fair value of $20.56 per share.
In fiscal 2016,2017, there was no activity related to RSAs. As of October 2, 2016,1, 2017, there was approximatelyless than $0.1 million of total unrecognized compensation cost related to RSAs, which is expected to be recognized over a weighted-average period of 1.5 years.fully in fiscal 2018.
Non-management directors’ deferred compensation — All awards outstanding under our directors’ deferred compensation plan are accounted for as equity-based awards and deferred amounts are converted into stock equivalents atbased on a per share price equal to the then-current marketaverage of the closing price of our common stock.stock for the 10 trading days immediately preceding the date the deferred compensation is credited to the director’s account. During fiscal years 2017, 2016 and 2015 no common stock was issued in connection with director retirements. In 2014, 10,616 shares of common stock were issued in connection with a director’s retirement with a fair value of $0.6 million.
JACK IN THE BOX INC. AND SUBSIDIARIES
NOTES TO CONSOLIDATED FINANCIAL STATEMENTS
The following is a summary of the stock equivalent activity for fiscal 20162017:
| | | | | Stock Equivalents | | Weighted- Average Grant Date Fair Value | | Stock Equivalents | | Weighted- Average Grant Date Fair Value |
| Stock equivalents outstanding at September 27, 2015 | | 79,158 |
| | $ | 26.64 |
| |
| Stock equivalents outstanding at October 2, 2016 | | | 84,364 |
| | $ | 29.43 |
|
| Deferred directors’ compensation | | 3,924 |
| | $ | 68.81 |
| | 2,632 |
| | $ | 102.58 |
|
| Dividend equivalents | | 1,282 |
| | $ | 80.57 |
| | 1,519 |
| | $ | 101.94 |
|
| Stock equivalents outstanding at October 2, 2016 | | 84,364 |
| | $ | 29.43 |
| |
| Stock equivalents outstanding at October 1, 2017 | | | 88,515 |
| | $ | 32.85 |
|
Employee stock purchase plan — The ESPP plan was terminated during fiscal 2015. The following is a summary2015; therefore, no stock was issued in fiscal 2017 and 2016. During fiscal year 2015, 1,371 shares of sharescommon stock were issued pursuant to our ESPP in fiscal 2015 and 2014:with a fair value of $70.78.
|
| | | | | | | | |
| | | 2015 | | 2014 |
| Common stock issued | | 1,371 |
| | 4,055 |
|
| Fair value of common stock issued | | $ | 70.78 |
| | $ | 49.25 |
|
13. STOCKHOLDERS’ EQUITY
Repurchases of common stock — In February and May 2016, the Board of Directors approved two stock buyback programs which provided repurchase authorizations for up to $100.0 million each, in shares of our common stock, expiring November 2017. In September 2016, the Board of Directors approved an additionala stock buyback program for up to $300.0 million in shares of our common stock, expiring in November 2018. In May 2017, the Board of Directors approved an additional stock buyback program for up to $100.0 million in shares of our common stock, also expiring in November 2018. During fiscal 2016,2017, we repurchased 3.93.2 million shares at an aggregate cost of $291.9$327.2 million. As of October 2, 2016,1, 2017, there was approximately $408.2$181.0 million remaining under theBoard-authorized stock buyback programs of which $108.2 million expiresexpire in November 2018. In our consolidated statements of cash flows for fiscal years 2017 and $300.02015, repurchases of common stock includes $7.2 million expiresand $3.1 million, respectively, related to repurchase transactions traded in November 2018.the prior fiscal years that settled in fiscal years 2017 and 2015, respectively. Repurchases of common stock included in our consolidated statement of cash flows for fiscal 2016 exclude $7.2 million related to repurchase transactions traded in 2016 that settled in the subsequent year.
Dividends — In fiscal 2016,2017, the Board of Directors declared four cash dividends of $0.30$0.40 per share totaling $40.5$49.2 million. Future dividends are subject to approval by our Board of Directors.
JACK IN THE BOX INC. AND SUBSIDIARIES
NOTES TO CONSOLIDATED FINANCIAL STATEMENTS
14. AVERAGE SHARES OUTSTANDING
Our basic earnings per share calculation is computed based on the weighted-average number of common shares outstanding. Our diluted earnings per share calculation is computed based on the weighted-average number of common shares outstanding adjusted by the number of additional shares that would have been outstanding had the potentially dilutive common shares been issued. Potentially dilutive common shares include stock options, nonvested stock awards and units, stock options, and non-management director stock equivalents. Performance share awards are included in the average diluted shares outstanding each period if the performance criteria have been met at the end of the respective periods.
The following table reconciles basic weighted-average shares outstanding to diluted weighted-average shares outstanding in each fiscal year (in thousands):
| | | | | 2016 | | 2015 | | 2014 | | 2017 | | 2016 | | 2015 |
| Weighted-average shares outstanding — basic | | 33,735 |
| | 37,587 |
| | 40,781 |
| | 30,630 |
| | 33,735 |
| | 37,587 |
|
| Effect of potentially dilutive securities: | | | | | | | | | | | | |
| Nonvested stock awards and units | | | 182 |
| | 188 |
| | 199 |
|
| Stock options | | 150 |
| | 274 |
| | 641 |
| | 59 |
| | 150 |
| | 274 |
|
| Nonvested stock awards and units | | 188 |
| | 199 |
| | 281 |
| |
| Performance share awards | | 73 |
| | 155 |
| | 270 |
| | 43 |
| | 73 |
| | 155 |
|
| Weighted-average shares outstanding — diluted | | 34,146 |
| | 38,215 |
| | 41,973 |
| | 30,914 |
| | 34,146 |
| | 38,215 |
|
| Excluded from diluted weighted-average shares outstanding: | | | | | | | | | | | | |
| Antidilutive | | 147 |
| | 84 |
| | 153 |
| | 76 |
| | 147 |
| | 84 |
|
| Performance conditions not satisfied at the end of the period | | 38 |
| | 15 |
| | 20 |
| | 53 |
| | 38 |
| | 15 |
|
JACK IN THE BOX INC. AND SUBSIDIARIES
NOTES TO CONSOLIDATED FINANCIAL STATEMENTS
15. COMMITMENTS, CONTINGENCIES AND LEGAL MATTERS
Commitments — As of October 2, 20161, 2017, we had unconditional purchase obligations during the next five fiscal years as follows (in thousands):
| | | 2017 | | $ | 993,500 |
| |
| 2018 | | 554,900 |
| | $ | 880,800 |
|
| 2019 | | 455,200 |
| | 499,200 |
|
| 2020 | | 369,600 |
| | 386,200 |
|
| 2021 | | 358,900 |
| | 380,100 |
|
| 2022 | | | 261,300 |
|
| Total | | $ | 2,732,100 |
| | $ | 2,407,600 |
|
These obligations primarily represent amounts payable under purchase contracts for goods related to system-wide restaurant operations.
Legal matters — The Company assessesWe assess contingencies, including litigation contingencies, to determine the degree of probability and range of possible loss for potential accrual in itsour financial statements. An estimated loss contingency is accrued in the financial statements if it is probable that a liability has been incurred and the amount of the loss can be reasonably estimated. Because litigation is inherently unpredictable, assessing contingencies is highly subjective and requires judgments about future events. When evaluating litigation contingencies, we may be unable to provide a meaningful estimate due to a number of factors, including the procedural status of the matter in question, the availability of appellate remedies, insurance coverage related to the claim or claims in question, the presence of complex or novel legal theories, and/or the ongoing discovery and development of information important to the matter. In addition, damage amounts claimed in litigation against us may be unsupported, exaggerated or unrelated to possible outcomes, and as such are not meaningful indicators of our potential liability or financial exposure. The CompanyWe regularly reviewsreview contingencies to determine the adequacy of the accruals and related disclosures. The ultimate amount of loss may differ from these estimates.
JACK IN THE BOX INC. AND SUBSIDIARIES
NOTES TO CONSOLIDATED FINANCIAL STATEMENTS
Gessele v. Jack in the Box Inc. — In August 2010, five former employees instituted litigation in federal court in Oregon alleging claims under the federal Fair Labor Standards Act and Oregon wage and hour laws. The plaintiffs alleged that the Company failed to pay non-exempt employees for certain state-mandatedmeal breaks and improperly made payroll deductions for shoe purchases and for workers’ compensation expenses, and later added additional claims relating to timing of final pay and related wage and hour claims involving employees of a franchisee. The most recent complaint seeks damagesIn 2016, the court dismissed the federal claims and those relating to franchise employees. In June 2017, the court granted class certification with respect to state law claims of $45.0 million but does not provide a basis for that amount.improper deductions and late payment of final wages. In fiscal 2012, we accrued for a single claim for which we believe a loss is both probable and estimable; this accrued loss contingency did not have a material effect on our results of operations. We have not establishedcontinue to believe that no additional losses are probable beyond this accrual, and we cannot estimate a possible loss contingency accrual for those claims as to which we believe liability is not probable or estimable, and werange of reasonably possible loss contingencies beyond the accrual. We plan to vigorously defend against this lawsuit. Nonetheless, an unfavorable resolution of this matter in excess of our current accrued loss contingencies could have a material adverse effect on our business, results of operations, liquidity or financial condition.
Other legal matters — In addition to the matter described above, the Company iswe are subject to normal and routine litigation brought by former, current or prospective employees, customers, franchisees, vendors, landlords, shareholders or others. We intend to defend ourselves in any such matters. Some of these matters may be covered, at least in part, by insurance. Our insurance liability (undiscounted) and reserves are established in part by using independent actuarial estimates of expected losses for reported claims and expected losses for estimating claims incurred but not reported. Our estimated liability for general liability and workers’ compensation claims, which exceeded our self-insurance retention limits by $25.8 million as of September 27, 2015, was reduced by $21.7 million in 2016 due to a judgment paid by our insurance providers. We currently expect to be fully covered by our insurance providers for any amounts that may exceed our self-insurance retention limits. We believe that the ultimate determination of liability in connection with legal claims pending against us, if any, in excess of amounts already provided for such matters in the consolidated financial statements, will not have a material adverse effect on our business, our annual results of operations, liquidity or financial position; however, it is possible that our business, results of operations, liquidity, or financial condition could be materially affected in a particular future reporting period by the unfavorable resolution of one or more matters or contingencies during such period.
Lease guarantees —In connection with the sale of the distribution business, we have assigned the lease at one of our distribution centers to a third party. Under this agreement, which expires in 2017, the Company remains secondarily liable for the lease payments for which we were responsible under the original lease. As of October 2, 2016, the amount remaining under this lease guarantee totaled $0.7 million. We have not recorded a liability for this guarantee as the likelihood of the third party defaulting on the assignment agreements was deemed to be less than probable.
JACK IN THE BOX INC. AND SUBSIDIARIES
NOTES TO CONSOLIDATED FINANCIAL STATEMENTS
16. SEGMENT REPORTING
Our principal business consists of developing, operating and franchising our Jack in the Box and Qdoba restaurant concepts, each of which we consider a reportable operating segments.segment. This segment reporting structure reflects the Company’sour current management structure, internal reporting method and financial information used in deciding how to allocate the Company’sour resources. Based upon certain quantitative thresholds, each operating segment is considered a reportable segment.
We measure and evaluate our segments based on segment revenues and earnings from operations. The reportable segments do not include an allocation of the costs related to shared service functions, such as accounting/finance, human resources, audit services, legal, tax and treasury;functions; nor do they include unallocated costs such as pension expense, share-based compensation and restructuring expense. These costs are reflected in the caption “Shared services and unallocated costs.” The following table provides information related to our operating segments in each fiscal year (in thousands (in thousands)):
| | | | 2016 | | 2015 | | 2014 | 2017 | | 2016 | | 2015 |
| Revenues by segment: | | | | | | | | | | |
| Jack in the Box restaurant operations | $ | 1,162,258 |
| | $ | 1,145,176 |
| | $ | 1,127,243 |
| $ | 1,097,291 |
| | $ | 1,162,258 |
| | $ | 1,145,176 |
|
| Qdoba restaurant operations | 437,073 |
| | 395,141 |
| | 356,888 |
| 456,623 |
| | 437,073 |
| | 395,141 |
|
| Consolidated revenues | $ | 1,599,331 |
| | $ | 1,540,317 |
| | $ | 1,484,131 |
| $ | 1,553,914 |
| | $ | 1,599,331 |
| | $ | 1,540,317 |
|
| Earnings from operations by segment: | | | | | | | | | | |
| Jack in the Box restaurant operations | $ | 290,346 |
| | $ | 265,230 |
| | $ | 235,574 |
| $ | 280,097 |
| | $ | 290,346 |
| | $ | 265,230 |
|
| Qdoba restaurant operations | 47,250 |
| | 47,264 |
| | 34,287 |
| 31,031 |
| | 47,250 |
| | 47,264 |
|
| Shared services and unallocated costs | (108,911 | ) | | (112,182 | ) | | (104,005 | ) | (83,021 | ) | | (108,911 | ) | | (112,182 | ) |
| Gains (losses) on the sale of company-operated restaurants | 1,230 |
| | (3,139 | ) | | (3,548 | ) | 38,034 |
| | 1,230 |
| | (3,139 | ) |
| Consolidated earnings from operations | 229,915 |
| | 197,173 |
| | 162,308 |
| 266,141 |
| | 229,915 |
| | 197,173 |
|
| Interest expense, net | 31,081 |
| | 18,803 |
| | 15,678 |
| 46,518 |
| | 31,081 |
| | 18,803 |
|
| Consolidated earnings from continuing operations and before income taxes | $ | 198,834 |
| | $ | 178,370 |
| | $ | 146,630 |
| $ | 219,623 |
| | $ | 198,834 |
| | $ | 178,370 |
|
| Total expenditures for long-lived assets by segment (including discontinued operations): | | | | | | |
| Total expenditures for long-lived assets by segment: | | | | | | |
| Jack in the Box restaurant operations | $ | 38,607 |
| | $ | 41,928 |
| | $ | 30,858 |
| $ | 29,426 |
| | $ | 38,607 |
| | $ | 41,928 |
|
| Qdoba restaurant operations | 53,316 |
| | 34,071 |
| | 17,967 |
| 34,163 |
| | 53,316 |
| | 34,071 |
|
| Shared services and unallocated costs | 4,692 |
| | 10,227 |
| | 11,700 |
| 3,864 |
| | 4,692 |
| | 10,227 |
|
| Consolidated expenditures for long-lived assets | $ | 96,615 |
| | $ | 86,226 |
| | $ | 60,525 |
| $ | 67,453 |
| | $ | 96,615 |
| | $ | 86,226 |
|
| Total depreciation expense by segment: | | | | | | | | | | |
| Jack in the Box restaurant operations | $ | 66,287 |
| | $ | 64,597 |
| | $ | 66,409 |
| $ | 60,595 |
| | $ | 66,287 |
| | $ | 64,597 |
|
| Qdoba restaurant operations | 19,306 |
| | 17,103 |
| | 16,992 |
| 20,854 |
| | 19,306 |
| | 17,103 |
|
| Shared services and unallocated costs | 6,489 |
| | 7,078 |
| | 7,254 |
| 6,761 |
| | 6,489 |
| | 7,078 |
|
| Consolidated depreciation expense | $ | 92,082 |
| | $ | 88,778 |
| | $ | 90,655 |
| $ | 88,210 |
| | $ | 92,082 |
| | $ | 88,778 |
|
We do not evaluate, manage or measure performance of segments using asset, interest income and expense, or income tax information; accordingly, this information by segment is not prepared or disclosed.
17. SUPPLEMENTAL CONSOLIDATED CASH FLOW INFORMATION (in thousands)
| | | | | 2016 | | 2015 | | 2014 | | 2017 | | 2016 | | 2015 |
| Cash paid during the year for: | | | | | | | | | | | | |
| Income tax payments | | | $ | 92,721 |
| | $ | 33,454 |
| | $ | 28,764 |
|
| Interest, net of amounts capitalized | | $ | 28,576 |
| | $ | 16,233 |
| | $ | 13,754 |
| | $ | 42,893 |
| | $ | 28,576 |
| | $ | 16,233 |
|
| Income tax payments | | $ | 33,454 |
| | $ | 28,764 |
| | $ | 29,145 |
| |
| (Decrease) increase in obligations for purchases of property and equipment | | | $ | (1,848 | ) | | $ | (3,122 | ) | | $ | 5,388 |
|
| (Decrease) increase in obligations for treasury stock repurchases | | | $ | (7,208 | ) | | $ | 7,208 |
| | $ | (3,112 | ) |
| Non cash transactions: | | | | | | | | | | | | |
| Consideration for franchise acquisitions | | | $ | 13,809 |
| | $ | — |
| | $ | — |
|
| Decrease in equipment capital lease obligations from the sale of company-operated restaurants | | | $ | 5,631 |
| | $ | — |
| | $ | — |
|
| Equipment capital lease obligations incurred | | $ | 1,085 |
| | $ | 16,770 |
| | $ | — |
| | $ | 1,364 |
| | $ | 1,124 |
| | $ | 16,770 |
|
| Increase (decrease) in accrued stock repurchases | | $ | 7,208 |
| | $ | (3,112 | ) | | $ | (4,176 | ) | |
| Increase in dividends accrued or converted to common stock equivalents | | $ | 176 |
| | $ | 174 |
| | $ | 68 |
| | $ | 308 |
| | $ | 176 |
| | $ | 174 |
|
| (Decrease) increase in obligations for purchases of property and equipment | | $ | (3,122 | ) | | $ | 5,388 |
| | $ | (1,187 | ) | |
JACK IN THE BOX INC. AND SUBSIDIARIES
NOTES TO CONSOLIDATED FINANCIAL STATEMENTS
18. SUPPLEMENTAL CONSOLIDATED FINANCIAL STATEMENT INFORMATION (in thousands)
| | | | | October 2,
2016 | | September 27,
2015 | | October 1,
2017 | | October 2,
2016 |
| Accounts and other receivables, net: | | | | | | | | |
| Trade | | $ | 66,837 |
| | $ | 36,990 |
| | $ | 64,576 |
| | $ | 66,837 |
|
| Notes receivable | | 1,603 |
| | 1,726 |
| | 1,276 |
| | 1,603 |
|
| Other | | 7,680 |
| | 10,814 |
| | 7,403 |
| | 7,680 |
|
| Allowance for doubtful accounts | | (2,760 | ) | | (1,555 | ) | | (4,561 | ) | | (2,760 | ) |
| | | $ | 73,360 |
| | $ | 47,975 |
| | $ | 68,694 |
| | $ | 73,360 |
|
| Prepaid expenses: | | | | | | | | |
| Prepaid income taxes | | | $ | 18,185 |
| | $ | 12,113 |
|
| Prepaid rent | | $ | 18,613 |
| | $ | 318 |
| | — |
| | 18,613 |
|
| Prepaid income taxes | | 12,113 |
| | 7,645 |
| |
| Other | | 9,672 |
| | 8,277 |
| | 10,963 |
| | 9,672 |
|
| | | $ | 40,398 |
| | $ | 16,240 |
| | $ | 29,148 |
| | $ | 40,398 |
|
| Other assets, net: | | | | | | | | |
| Company-owned life insurance policies | | $ | 105,957 |
| | $ | 99,513 |
| | $ | 110,057 |
| | $ | 105,957 |
|
| Deferred tax assets | | 117,587 |
| | 118,186 |
| | 98,695 |
| | 117,587 |
|
| Deferred rent receivable | | 47,485 |
| | 45,330 |
| | 47,033 |
| | 47,485 |
|
| Other | | 23,219 |
| | 40,939 |
| | 17,247 |
| | 19,440 |
|
| | | $ | 294,248 |
| | $ | 303,968 |
| | $ | 273,032 |
| | $ | 290,469 |
|
| Accrued liabilities: | | | | | | | | |
| Insurance | | | $ | 39,031 |
| | $ | 38,368 |
|
| Payroll and related taxes | | $ | 44,627 |
| | $ | 56,223 |
| | 26,249 |
| | 44,627 |
|
| Insurance | | 38,368 |
| | 35,370 |
| |
| Advertising | | 21,827 |
| | 20,692 |
| | 20,112 |
| | 21,827 |
|
| Deferred rent income | | 15,909 |
|
| 1,806 |
| | 17,918 |
| | 15,909 |
|
| Sales and property taxes | | 14,311 |
| | 11,574 |
| | 9,695 |
| | 14,311 |
|
| Gift card liability | | 5,183 |
| | 4,608 |
| | 5,052 |
| | 5,183 |
|
| Deferred franchise fees | | 929 |
| | 1,198 |
| | 1,199 |
| | 929 |
|
| Other | | 40,096 |
| | 39,104 |
| | 41,049 |
| | 40,096 |
|
| | | $ | 181,250 |
| | $ | 170,575 |
| | $ | 160,305 |
| | $ | 181,250 |
|
| Other long-term liabilities: | | | | | | | | |
| Defined benefit pension plans | | $ | 161,003 |
| | $ | 180,476 |
| | $ | 107,011 |
| | $ | 161,003 |
|
| Straight-line rent accrual | | 47,070 |
| | 46,807 |
| | 47,096 |
| | 47,070 |
|
| Other | | 140,852 |
| | 142,775 |
| | 119,424 |
| | 140,852 |
|
| | | $ | 348,925 |
| | $ | 370,058 |
| | $ | 273,531 |
| | $ | 348,925 |
|
JACK IN THE BOX INC. AND SUBSIDIARIES
NOTES TO CONSOLIDATED FINANCIAL STATEMENTS
19. UNAUDITED QUARTERLY RESULTS OF OPERATIONS (in thousands, except per share data)
| | | | | | 16 Weeks Ended | | 12 Weeks Ended |
| Fiscal Year 2017 | | | January 22,
2017 | | April 16,
2017 | | July 9,
2017 | | October 1,
2017 |
| Revenues | | | $ | 487,933 |
| | $ | 369,389 |
| | $ | 357,846 |
| | $ | 338,746 |
|
| Earnings from operations | | | $ | 73,117 |
| | $ | 65,650 |
| | $ | 66,981 |
| | $ | 60,393 |
|
| Net earnings | | | $ | 35,929 |
| | $ | 33,094 |
| | $ | 36,351 |
| | $ | 29,958 |
|
| Net earnings per share: | | | | | | | | | |
| Basic | | | $ | 1.12 |
| | $ | 1.07 |
| | $ | 1.23 |
| | $ | 1.02 |
|
| Diluted | | | $ | 1.11 |
| | $ | 1.06 |
| | $ | 1.22 |
| | $ | 1.01 |
|
| | | 16 Weeks Ended | | 12 Weeks Ended | | 13 Weeks Ended | | 16 Weeks
Ended | | 12 Weeks Ended | | 13 Weeks Ended |
| Fiscal Year 2016 | | January 17,
2016 | | April 10,
2016 | | July 3,
2016 | | October 2,
2016 | | January 17,
2016 | | April 10,
2016 | | July 3,
2016 | | October 2,
2016 |
| Revenues | | $ | 470,823 |
| | $ | 361,151 |
| | $ | 368,938 |
| | $ | 398,419 |
| | $ | 470,823 |
| | $ | 361,151 |
| | $ | 368,938 |
| | $ | 398,419 |
|
| Earnings from operations | | $ | 62,514 |
| | $ | 52,786 |
| | $ | 55,705 |
| | $ | 58,910 |
| | $ | 62,514 |
| | $ | 52,786 |
| | $ | 55,705 |
| | $ | 58,910 |
|
| Net earnings | | $ | 33,221 |
| | $ | 28,682 |
| | $ | 30,189 |
| | $ | 31,981 |
| | $ | 33,221 |
| | $ | 28,682 |
| | $ | 30,189 |
| | $ | 31,981 |
|
| Net earnings per share: | | | | | | | | | | | | | | | | |
| Basic | | $ | 0.94 |
| | $ | 0.85 |
| | $ | 0.92 |
| | $ | 0.98 |
| | $ | 0.94 |
| | $ | 0.85 |
| | $ | 0.92 |
| | $ | 0.98 |
|
| Diluted | | $ | 0.92 |
| | $ | 0.84 |
| | $ | 0.91 |
| | $ | 0.97 |
| | $ | 0.92 |
| | $ | 0.84 |
| | $ | 0.91 |
| | $ | 0.97 |
|
| | | 16 Weeks
Ended | | 12 Weeks Ended | |
| Fiscal Year 2015 | | January 18,
2015 | | April 12,
2015 | | July 5,
2015 | | September 27,
2015 | |
| Revenues | | $ | 468,621 |
| | $ | 358,122 |
| | $ | 359,506 |
| | $ | 354,068 |
| |
| Earnings from operations | | $ | 63,236 |
| | $ | 41,868 |
| | $ | 50,395 |
| | $ | 41,674 |
| |
| Net earnings | | $ | 35,835 |
| | $ | 23,005 |
| | $ | 26,831 |
| | $ | 23,141 |
| |
| Net earnings per share: | | | | | | | | | |
| Basic | | $ | 0.93 |
| | $ | 0.61 |
| | $ | 0.72 |
| | $ | 0.64 |
| |
| Diluted | | $ | 0.91 |
| | $ | 0.60 |
| | $ | 0.71 |
| | $ | 0.63 |
| |
20. SUBSEQUENT EVENTS
Declaration of dividend— On November 17, 2016,2017, the Board of Directors declared a cash dividend of $0.40 per share, to be paid on December 16, 201615, 2017 to shareholders of record as of the close of business on December 5, 2016.4, 2017. Future dividends will be subject to approval by our Board of Directors.
Subsequent to the end of fiscal 2017, we signed non-binding letters of intent with franchisees to sell 21 Jack in the Box company-operated restaurants in several markets. Pre-tax gross proceeds related to these sales are estimated at $12.0 million to $13.0 million.