UNITED STATES
SECURITIES AND EXCHANGE COMMISSION
Washington, D.C. 20549
—————————
FORM 10-K
| | | | | |
x☑ | ANNUAL REPORT PURSUANT TO SECTION 13 OR 15(d) OF THE SECURITIES EXCHANGE ACT OF 1934 |
For the fiscal year ended September 30, 20192021
or
| | | | | |
¨☐ | TRANSITION REPORT PURSUANT TO SECTION 13 OR 15(d) OF THE SECURITIES EXCHANGE ACT OF 1934 |
For the transition period from ___ to ___
Commission File Number 001-36632
EMCORE Corporation
(Exact name of registrant as specified in its charter)
|
| | | | |
New Jersey | 22-2746503 |
| (State or other jurisdiction of incorporation or organization) | 22-2746503
(I.R.S. Employer Identification No.) |
| |
2015 W. Chestnut Street, Alhambra, California, 91803
(Address of principal executive offices) (Zip Code)
|
2015 W. Chestnut Street, Alhambra, California, 91803
Registrant's(Address of principal executive offices) (Zip Code)
Registrant’s telephone number, including area code: (626) 293-3400
Securities registered pursuant to Section 12(b) of the Act:
| | | | | | | | | | | | | | |
| | | | |
| Title of Each Class | | Trading Symbol | | Name of Each Exchange on Which Registered |
| Common stock, no par value | | EMKR | | The Nasdaq Stock Market LLC (Nasdaq Global Market) |
Securities registered pursuant to Section 12(g) of the Act: None
Indicate by check mark if the registrant is a well-known seasoned issuer, as defined in Rule 405 of the Securities Act ¨☐ Yesþ ☑ No
Indicate by check mark if the registrant is not required to file reports pursuant to Section 13 or 15(d) of the Act. ¨☐ Yesþ ☑ No
Indicate by check mark whether the registrant (1) has filed all reports required to be filed by Section 13 or 15(d) of the Securities Exchange Act of 1934 during the preceding 12 months (or for such shorter period that the registrant was required to file such reports), and (2) has been subject to such filing requirements for the past 90 days. þ☑ Yes ¨☐ No
Indicate by check mark whether the registrant has submitted electronically every Interactive Data File required to be submitted pursuant to Rule 405 of Regulation S-T during the preceding 12 months (or for such shorter period that the registrant was required to submit such files). þ☑ Yes ¨☐ No
Indicate by check mark whether the registrant is a large accelerated filer, an accelerated filer, a non-accelerated filer, a smaller reporting company or an emerging growth company. See the definitiondefinitions of “large accelerated filer”, “accelerated filer”, “smaller reporting company” and “emerging growth company” in Rule 12b-2 of the Exchange Act. ¨☐ Large accelerated filer þ☑ Accelerated filer ¨☐ Non-accelerated filer þ☑ Smaller reporting company¨☐ Emerging growth company
If an emerging growth company, indicate by check mark if the registrant has elected not to use the extended transition period for complying with any new or revised financial accounting standards provided pursuant to Section 13(a) of the Exchange Act. ¨☐
Indicate by check mark whether the registrant has filed a report on and attestation to its management’s assessment of the effectiveness of its internal control over financial reporting under Section 404(b) of the Sarbanes-Oxley Act (15 U.S.C. 7262(b)) by the registered public accounting firm that prepared or issued its audit report. ☐
Indicate by check mark whether the registrant is a shell company (as defined in Rule 12b-2 of the Exchange Act). ¨☐ Yes þ☑ No
The aggregate market value of our common stock held by non-affiliates as of March 29, 201931, 2021 (the last business day of ourthe most recently completed second fiscal quarter) was approximately $98.4$199.0 million, based on the closing sale price of $3.65$5.46 per share of common stock as reported on the Nasdaq Global Market. For purposes of this disclosure, shares of common stock held by officers and directors and by each person known by us to own 10% or more of our outstanding common stock have been excluded. This determination of affiliate status is not necessarily a conclusive determination for any other purpose.
As of December 6, 2019,November 29, 2021, the number of shares outstanding of our no par value common stock totaled 28,904,853.36,990,099.
DOCUMENTS INCORPORATED BY REFERENCE
In accordance with General Instruction G(3) of Form 10-K, certain information required by Part III hereof will either be incorporated into this Annual Report on Form 10-K by reference to ourthe Definitive Proxy Statement for ourthe Annual Meeting of Shareholders filed within 120 days of the fiscal year ended September 30, 20192021 or will be included in an amendment to this Annual Report on Form 10-K filed within 120 days of September 30, 2019.2021.
EMCORE Corporation
FORM 10-K
For the Fiscal Year ended September 30, 2021
TABLE OF CONTENTS
CAUTIONARY STATEMENTNOTE
REGARDING FORWARD-LOOKING STATEMENTS
This Annual Report on Form 10-K includes forward-looking statements within the meaning of Section 27A of the Securities Act of 1933, as amended, and Section 21E of the Securities Exchange Act of 1934, as amended (the “Exchange Act”). These forward-looking statements are made pursuant to the safe harbor provisions of the Private Securities Litigation Reform Act of 1995. These forward-looking statements are based on our current expectations and projections about future events and financial trends affecting the financial condition of our business. Such forward-looking statements include, in particular, projections about our future results included in our Exchange Act reports and statements about our plans, strategies, business prospects, changes and trends in our business and the markets in which we operate. These forward-looking statements may be identified by the use of terms and phrases such as “anticipates,” “believes,” “can,” “could,” “estimates,” “expects,” “forecasts,” “intends,” “may,” “plans,” “projects,” “should,” “targets,” “will,” “would,” and similar expressions or variations of these terms and similar phrases. Additionally, statements concerning future matters such as our expected liquidity, development of new products, enhancements or technologies, sales levels, expense levels, expectations regarding the outcome of legal proceedings,
and other statements regarding matters that are not historical are forward-looking statements. Management cautions that these forward-looking statements relate to future events or
our future financial performance and are subject to business, economic, and other risks and uncertainties, both known and unknown, that may cause actual results, levels of activity, performance, or achievements of our business or
our industrythe industries in which we operate to be materially different from those expressed or implied by any forward-looking statements.
Factors that could cause or contributeYou are urged to
such differences in results and outcomes include without limitationcarefully review the
following: (a) the rapidly evolving markets for the Company's products and uncertainty regarding the development of these markets; (b) the Company's historical dependence on sales to a limited number of customers and fluctuations in the mix of products and customers in any period; (c) delaysdisclosures we make concerning risks and other
difficultiesfactors that may affect our business and future financial performance, including those made below under “Summary Risk Factors” and in
commercializing new products; (d) the failure of new products: (i) to perform as expected without material defects, (ii) to be manufactured at acceptable volumes, yields, and cost, (iii) to be qualified and accepted by our customers, and (iv) to successfully compete with products offered by our competitors; (e) uncertainties concerning the availability and cost of commodity materials and specialized product components that we do not make internally; (f) actions by competitors; (g) risks and uncertainties related to applicable laws and regulations, including the impact of changes to applicable tax laws and tariff regulations; (h) acquisition-related risks, including that (i) the revenues and net operating results obtained from the Systron Donner Inertial, Inc. ("SDI") business may not meet our expectations, (ii) the costs and cash expenditures for integration of the SDI business operations may be higher than expected, (iii) there could be losses and liabilities arising from the acquisition of SDI that we will not be able to recover from any source, and (iv) we may not realize sufficient scale in our navigation systems product line from the SDI acquisition and will need to take additional steps, including making additional acquisitions, to achieve our growth objectives for this product line; (i) risks related to our ability to obtain capital; (j) risks related to the transition of certain of our manufacturing operations from our Beijing facility to a contract manufacturer’s facility; and (k) other risks and uncertainties discussed in Part I, Item 1A, Risk Factors in"Risk Factors" of this Annual Report as well as those discussed elsewhere in this Annual Report,on Form 10-K, as such riskrisks and other factors may be amended, supplemented, or superseded from time to time by our subsequent periodic reports we file with the Securities and Exchange Commission (“SEC”). These cautionary statements apply to all forward-looking statements wherever they appear in this Annual Report.
Forward-looking statements are based on certain assumptions and analysis made in light of our experience and perception of historical trends, current conditions, and expected future developments as well as other factors that we believe are appropriate under the circumstances. While these statements represent our judgment on what the future may hold, and we believe these judgments are reasonable, these statements are not guarantees of any events or financial results. All forward-looking statements in this Annual Report are made as of the date hereof, based on information available to us as of the date hereof, and subsequent facts or circumstances may contradict, obviate, undermine, or otherwise fail to support or substantiate such statements. We caution youdo not to rely on these statements without also considering the risks and uncertainties associated with these statements and our business that are addressed in this Annual Report on Form 10-K. Certain information included in this Annual Report may supersede or supplement forward-looking statements in our other reports filed with the SEC. We assume no obligationintend to update any forward-looking statement to conform such statements to actual results or to changes in our expectations, except as required by applicable law or regulation.
SUMMARY RISK FACTORS
EMCORE Corporation
FORM 10-KOur business is subject to varying degrees of risk and uncertainty. Investors should consider the risks and uncertainties summarized below, as well as the risks and uncertainties discussed in Part I, Item 1A, “Risk Factors” of this Annual Report on Form 10-K. Additional risks not presently known to us or that we currently deem immaterial may also affect us. If any of these risks occur, our business, financial condition or results of operations could be materially and adversely affected.For
Our business is subject to the Fiscal Year ended September 30, 2019following principal risks and uncertainties:
TABLE OF CONTENTS•the effects of the COVID-19 pandemic and other potential future public health crises, epidemics, pandemics or similar events are uncertain and could have a material and adverse effect on our business, financial condition, operating results and cash flows;
•our small size results in volatility in our cash flow, results of operations and growth prospects, and we could experience revenue fluctuations due to our dependence on a few products for our success;
•we are substantially dependent on revenues from a small number of customers and may experience fluctuations in the mix of products and customers in any period;
•we are subject to the cyclical nature of the markets in which we compete and any future downturn or decline in spending for Cable TV (“CATV”) and optical communications networks may reduce demand for our products and revenue;
•customer demand is difficult to forecast and if we are unable to match production with customer demand, our results of operations could be negatively impacted;
•we are subject to risks related to our acquisitions, including that (a) the revenues and net operating results obtained from the Systron Donner Inertial, Inc. ("SDI") business or any other acquired business may not meet our expectations, (b) the costs and cash expenditures for integration of the SDI business operations or any other acquired business may be higher than expected, (c) there could be losses and liabilities arising from the acquisition of SDI or any other acquired business that we will not be able to recover from any source, and (d) we may not realize sufficient scale from
any acquisition and will need to take additional steps, including making additional acquisitions, to achieve our growth objectives;
•our failure to successfully manage the transition of certain of our manufacturing operations from our Beijing facility to a contract manufacturer’s ("CM") facility could harm our business, financial condition or results of operations;
•changes in United States ("U.S.") and international trade policies, particularly with regard to China, may adversely impact our business and operating results;
•our operations in China and significant international sales may expose us to risks inherent in doing business in these geographies;
•we face lengthy sales and qualification cycles for our new products due to the complexity of our products, and, in many cases, must invest a substantial amount of time and money before we receive orders;
•our production could be disrupted and our results of operations and cash flows could suffer if our production yields are low as a result of manufacturing difficulties;
•if we do not keep pace with rapid technological change, our products may not be competitive, and increased spending to develop and improve our technology may adversely impact our financial results;
•pressure from competitors may result in price reductions and periods of reduced demand for our products;
•a failure to attract and retain managerial, technical and other key personnel could reduce our revenue and operational effectiveness;
•our ability to achieve operational and material costs reductions and realize production efficiencies is critical to our ability to achieve long-term profitability;
•our operating results could be harmed if we are unable to obtain timely delivery of sufficient materials or components or if the prices of such materials or components increase;
•the failure of our CM to timely deliver qualified products at reasonable prices could adversely affect our business;
•our vendor-managed inventory programs could result in increased inventory levels and/or decreased visibility into the timing of sales, and shifts in industry demand and inventories could result in significant inventory write-downs;
•any defects in our products may cause us to incur significant costs, divert management’s attention or result in a loss of customers or product liability claims;
•our government contracts are subject to risks of budgetary constraints or spending reductions and may subject us to governmental audits, investigations or other scrutiny that could adversely affect our business;
•our business may be materially harmed if we fail to protect our intellectual property and other proprietary rights or are unable to successfully defend against claims of infringement of the rights of others;
•we could be subject to legal consequences if we fail to comply with the Modified Partial Award issued in connection with the proceedings commenced against us by Phoenix Navigation Components, LLC ("Phoenix");
•a cyberattack or other failure or security breach of our information technology infrastructure, or the theft, loss or misuse of personal data, could adversely affect our business and operations;
•our costs of compliance, or failure to comply, with applicable state, federal and international legal and regulatory requirements could increase our operating costs and adversely affect our business;
•we may not be able to obtain capital when desired on favorable terms, if at all, or without dilution to our shareholders; and
•we may undergo an “ownership change” within the meaning of Section 382 of the Internal Revenue Code, which could affect our ability to offset U.S. federal income tax against our net operating losses and certain of our tax credit carryovers.
PART I.
ItemITEM 1. Business
Company Overview
EMCORE Corporation, together with its subsidiaries (referred to herein as the “Company,” “we,” “our,” or “EMCORE”), was established in 1984 as a New Jersey corporation. The CompanyWe became publicly traded in 1997 and isare listed on the Nasdaq Stock Exchange under the ticker symbol EMKR. EMCORE isWe are a leading provider of sensors for navigation in the Aerospaceaerospace and Defensedefense market as well as a manufacturer of lasers and optical subsystems for use in the cableCable TV ("CATV") industry.
EMCOREWe pioneered the linear fiber optic transmission technology that enabled the world’s first delivery of Cable TVCATV directly on fiber, and today isare a leading provider of advanced Mixed-Signal Opticsmixed-signal products serving the aerospace and defense and broadband communications and Aerospace and Defense markets. The Mixed-Signal Opticsmixed-signal technology, at the heart of our broadband communications products, is shared with our fiber optic gyros ("FOGs") and inertial sensors to provide the aerospace and defense markets with state-of-the-art navigationsnavigation systems technology. With the acquisition of Systron Donner Inertial, Inc. (“SDI”("SDI"), a navigation systems provider with aof scalable, chip-based platformplatforms for higher volume gyro applications utilizing Quartz MEMSquartz micro-electromechanical system ("QMEMS") technology, in June of 2019, EMCOREwe further expanded itsour portfolio of gyros and inertial sensors with SDI’s quartz MEMSQMEMS gyro and accelerometer technology.
EMCORE hasWe have fully vertically-integrated manufacturing capability through our Indium Phosphide (“InP”indium phosphide ("InP") compound semiconductor wafer fabrication facility at our headquarters in Alhambra, CA, and through our quartz processing and sensor manufacturing facility in Concord, CA. These facilities support EMCORE’sour vertically-integrated manufacturing strategy for quartz and fiber optic gyroFOG products for Navigationnavigation systems, and for our chip, laser, transmitter, and receiver products for broadband applications.
For the fiscal year ended September 30, 2019, we had one reporting segment, comprised of three product lines: Navigation Systems, Broadband and Chip Devices. Please see our consolidated financial statements and notes included in this Annual Report for financial information regarding this segment.
For the fiscal year ending September 30, 2020,as a result of the acquisition of SDI and the increased size and growth expectations of our aerospace and defense business, we expect that we willWe have two reporting segments,segments: (a) Aerospace and Defense and (b) Broadband. Aerospace and Defense will beis comprised of two product lines: (i) Navigation and Inertial Sensing, and (ii) Defense Optoelectronics. The Broadband segment will beis comprised of three product lines: (i) Cable TVCATV Lasers and Transmitters, (ii) Chip Devices, and (iii) Other. Due to a shift in customer base, the previously existing Satellite/Microwave Communications product line has been renamed “Defense Optoelectronics”.Other Optical Products.
This reporting change, detailing information for these two segments, will go into effect when EMCORE releases our results of operations for the period ending December 31, 2019.
EMCORE’sOur headquarters and principal executive offices are located at 2015 W. Chestnut Avenue,Street, Alhambra, California, 91803 and ourthe main telephone number is (626) 293-3400. For specific information about us, our products or the markets we serve,served please visit our website at http:https://www.emcore.com. The information contained in or linked to our website is not a part of, nor incorporated by reference into, this Annual Report on Form 10-K or a part of any other report or filing with the SecuritiesSEC.
Industries and Exchange Commission (the “SEC”).
We are subject to the information requirements of the Securities Exchange Act of 1934 (the “Exchange Act”). We file periodic reports, current reports, proxy statements, and other information with the SEC. The SEC maintains a website at http://www.sec.gov that contains all of our information that has been filed or furnished electronically with the SEC. We make available free of charge on our website a link to our Annual Reports on Form 10-K, Quarterly Reports on Form 10-Q, Current Reports on Form 8-K, and amendments to those reports filed or furnished pursuant to Section 13(a) or 15(d) of the Exchange Act, as soon as reasonably practicable, after such material is electronically filed with, or furnished to, the SEC.
Overview of Our Industry and Markets We Serve
We design and manufacture industry-leading QMEMS, lithium niobate and InP compound semiconductor-basedchip-level technology to deliver state-of-the-art component and system-level products provide the foundation ofacross our end-market applications. Our best-in-class components subsystems, and systems used insupport a broad rangearray of technology markets. Compound semiconductor materials can provide electrical or electro-optical functions, such as emittingapplications including navigation and inertial sensing, defense optoelectronics, broadband communications, optical communications signalssensing, and detecting optical communications signals.specialty chips for telecom and data center applications.
Specifically, within our Fiber Optics reporting segment, our Broadband products serve the Cable TV (“CATV”), Satellite CommunicationsOur Aerospace and Wireless markets; our Chip products serve the Telecommunications, Fiber-To-The-Premises (“FTTP”), Long-Term Evolution (“LTE”) and Data Center markets; and our Navigation SystemsDefense products primarily serve the navigation and defense optoelectronics markets. Our Broadband products primarily serve the CATV, optical sensing, telecom and data center markets.
Aerospace and Defense markets.
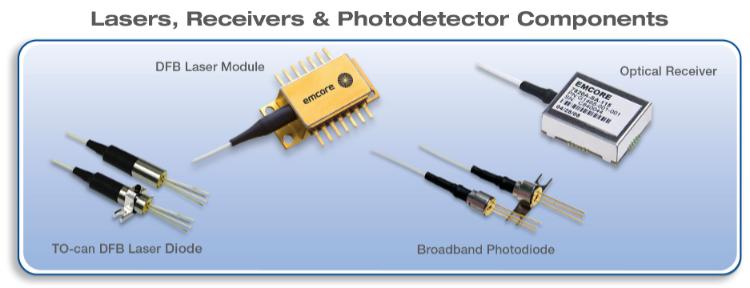
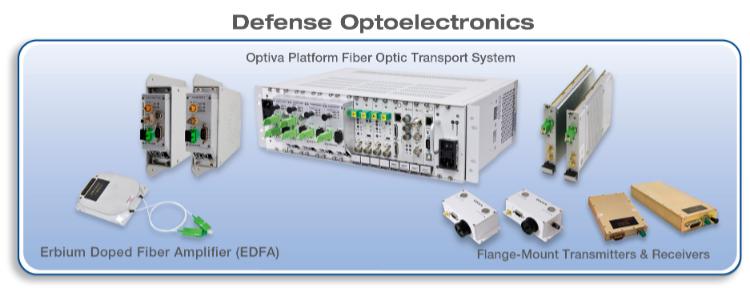
Navigation and Inertial Sensing Product Line

EMCORE, through ourThrough vertically-integrated infrastructure, has been able to adaptwe have adapted the same technologies, chip designs, and production assets applicable to our CATV products to the development of state-of-the-art Fiber Optic Gyroscopes (“FOG”)FOG products that have broad application within the aerospace and defense markets for land, sea, air, and space navigation. This gives EMCORE the ability toWe leverage our high-volume infrastructure for lower volume, higher value-added product. EMCORE has expanded itsOur FOG-based product line has been expanded to include Inertial Measurement Unitsinertial measurement units (“IMU or IMUs”IMU”) and Inertial Navigation Systemsinertial navigation systems (“INS”) that provide superior Size, Weightcompelling size, weight, and Powerpower (“SWaP”) compared to competing or legacy systems. In June of 2019, EMCORE addedwe expanded our Navigation and Inertial Sensing product portfolio adding the SDI series of Quartz MEMS (“QMEMS”)QMEMS gyros, accelerometers, IMUs and IMUINS products to our portfolio, expanding EMCORE’s portfolio to better addresstarget high volume markets and takingtake advantage of EMCORE’sour core wafer fabrication and processing capabilities to further improve upon SDI’s base technology platforms.
To the extent salescapabilities. Sales of our navigation systemNavigation and Inertial Sensing products are related to U.S. government contracts or subcontracts this portion of the business may be subject to renegotiation of profits or termination of contracts or subcontracts at the election of the U.S. government or an agency thereof.
Fiber Optic•FOG Gyroscope, IMU, and INS Products- EMCORE’sOur FOG program hastechnologies have received multiple U.S. patents and hasour FOG products have been qualified for several key military programs for applications including Unmanned Aerial Systems (“UAS”),unmanned aerial systems, line-of-site stabilization, aviation, and aeronautics. All EMCORE FOGsFOG products feature advanced optics with only three components for simplified assembly along with Digital Signal Processing (“DSP”) or Field Programmable Gate Array (“FPGA”) forand higher accuracy, lower noise, and greater efficiency. The integrated DSP or FGPA also improves optical drift stability and enables higher linearity and greater environmental flexibility. EMCORE’sOur FOG products range from tactical to navigational grade gyros, IMU and INS where the critical specifications for fiber length, Angle Random Walk (“ARW”)angle random walk, and drift rate improves throughimprove, giving customers flexibility to choose the product line to provide customers greater flexibility in choosing theand performance level that best meets theirthe customer's application.
Our FOG-based IMUs and INS provide compelling SWaP performance compared to competing systems and deliver high-precision with up to ten-times better performance than competing units in compact, portable form-factors.
Quartz MEMS•QMEMS Gyroscope, Accelerometer, IMU, and INS Products- EMCORE’s Systron Donner Inertial brand supplies the world’s highest performance MEMS Inertial Sensors & Systems. Our quartz MEMS Gyroscopes, Accelerometers, Inertial Measurement UnitsQMEMS gyroscopes, accelerometers, IMUs, and GPS/INS products deliver a clear, continuously improving Size, Weight, Power,SWaP performance and Cost (“SWaPC”)cost advantages over alternative technologies. With SDI's more than 50 years of extensive experience EMCORE is continuouslyin these technologies, we are developing leading-edge disciplines with new innovative breakthrough products, which are enabling advanced performance capabilities in mission critical applications worldwide.
Systron Donner InertialOur QMEMS products have no moving parts, no friction, no known modes of wear out, and require no recalibration or rebuilding. They deliver industry-leading reliability under the most demanding conditions through dedicated engineering technology and manufacturing operations excellence, andincluding AS9100 Aerospace Quality System Certification. EMCORE’sOur QMEMS products provide precision system solutions and establish higherhigh standards for price/price and/or performance characteristics across guidance, navigation, control, pointing, and stabilization applications in commercial and military aircraft, unmanned autonomous vehicles, land vehicles, precision guided weapons, and industrial and marine platforms.
FOG-Based Inertial Measurement Units and Navigation Systems Products - EMCORE’s FOG-based MU and INS systems provide superior SWaP compared to competing systems. Our products provide customers the flexibility to choose options from straightforward IMU operation to full navigation and are higher performance form, fit and function replacements for other IMUs and legacy systems. EMCORE’s FOG-based IMUs and INS products deliver high-precision with up to five-times better performance than competing units in compact, portable form-factors that provide standalone aircraft grade navigator performance at one-third the size of competing systems.
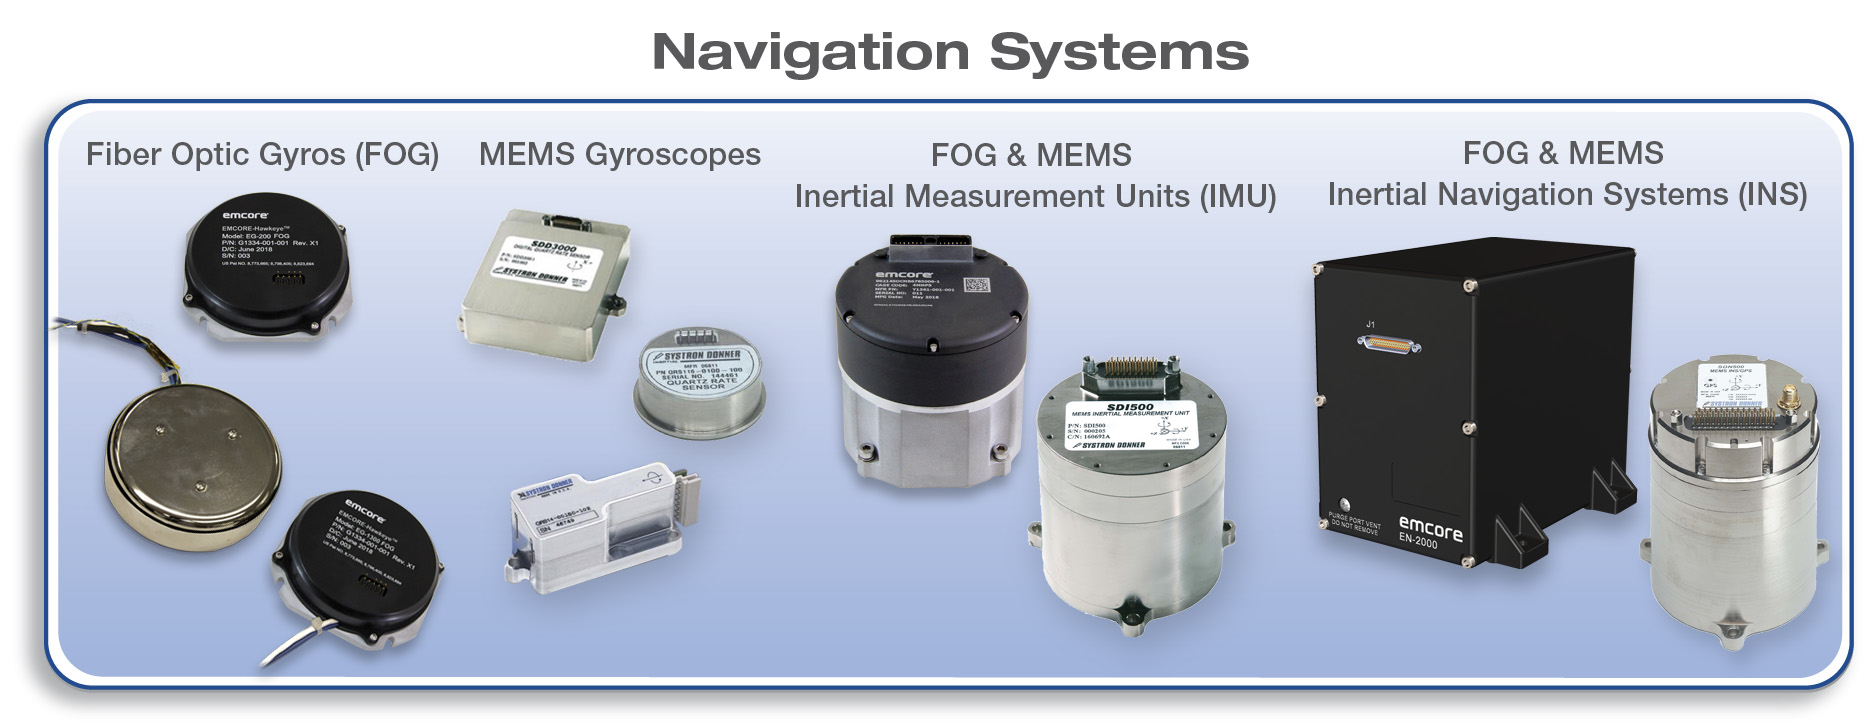
Defense Optoelectronics Product Line (Formerly Satellite/Microwave Communications Products)
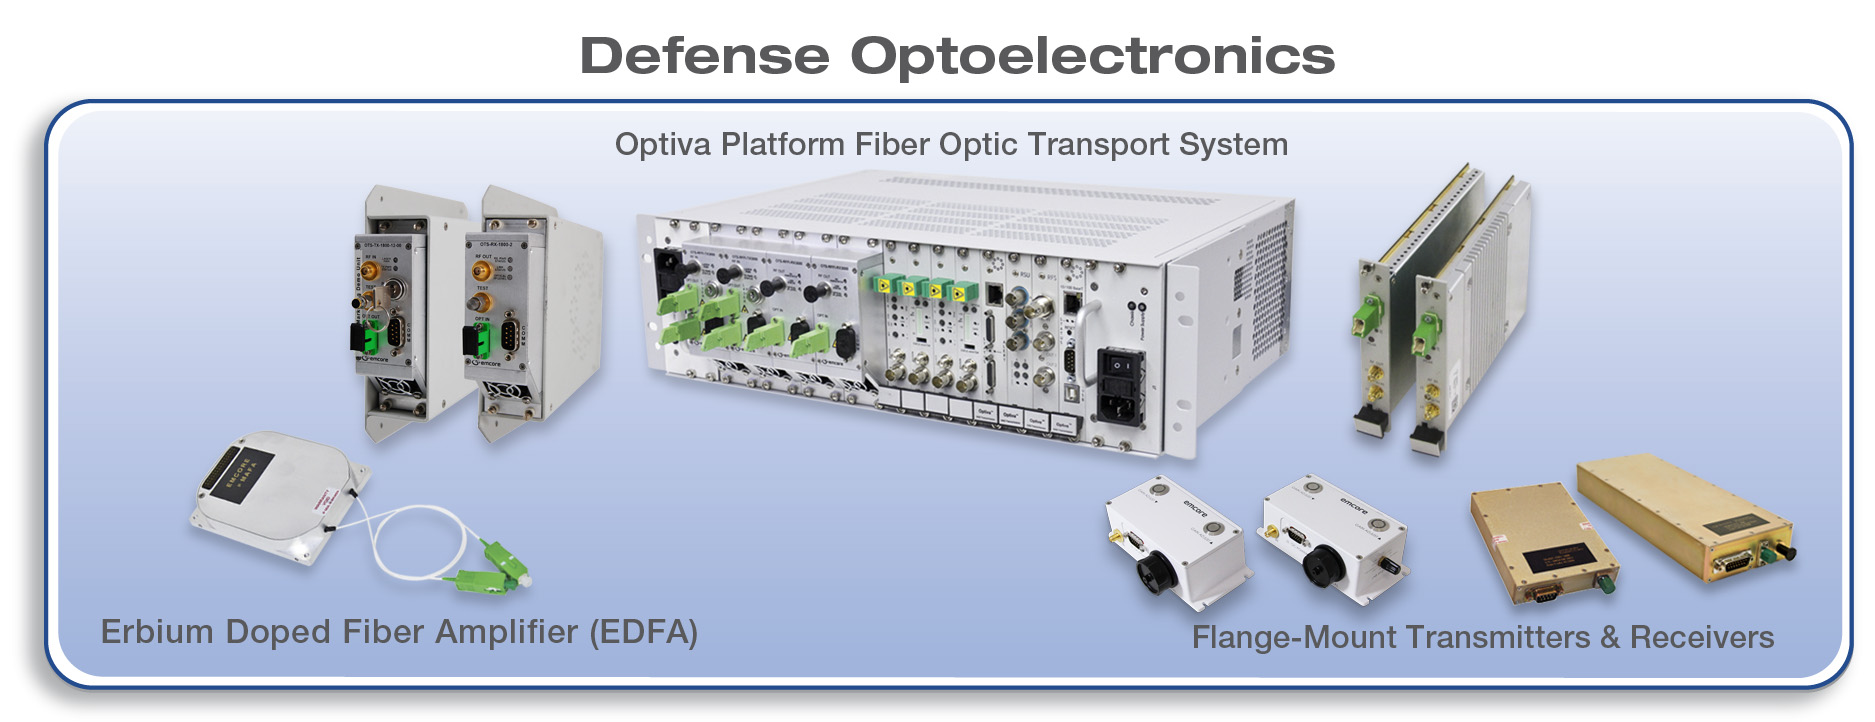
Satellite/Microwave Communications Products - EMCORE hasWe have an established history as a pioneer of innovative Radio Frequenceyradio frequency (“RF”) over fiber solutions for high-performance fiber optic links in the terrestrial portion of satellite communications networks. EMCORE’s satellite/Satellite/microwave band components and complete systems transport an ultra-broadband frequency range including IF, L, S, C, X, DBS, Ku, K, Ka, Q/V and Ultra-Widebandultra-wideband signal transport. A wide rangenumber of high-dynamic-range applications are supported, including satellite antenna remoting and signal distribution, inter- and intra-facility links, site diversity systems, high-performance supertrunking links, electronic warfare systems, and radar testing. EMCORE’sThe complete line of satellite and microwave components, subassemblies and systems eliminateeliminates the distance limitationslimitation of copper-based coaxial systems. OurThe rack-mount Optiva Platformplatform RF & Microwave Fiber Optic Transport Systemand microwave fiber optic transport system features a wide range of Simple Network Management Protocol (“SNMP”)simple network management protocol managed fiber optic transmitters, receivers, optical amplifiers, RF and optical switches, passive devices, and Ethernetethernet products that provide high-performance fiber optic transmission between satellite hub equipment and antenna dishes. EMCORE
We also offersoffer a series of ruggedized microwave flange-mount transmitters, receivers, and optical delay line products that meet the reliability and durability requirements of the U.S. government and defense markets. These products are tailored to the
requirements of higher frequency applications such as microwave antenna signal distribution, electronic warfare systems, and radar system calibration and testing. They provide our customers with high frequency, dynamic range, compact form-factors, and extreme temperature, shock, and vibration tolerance. To the extent salesSales of our satellite/microwave communicationsDefense Optoelectronics products are related to U.S. government contracts or subcontracts this portion of the business may be subject to renegotiation of profits or termination of contracts or subcontracts at the election of the U.S. government or an agency thereof.
Cable TVBroadband
CATV Lasers and Transmitters Product Line
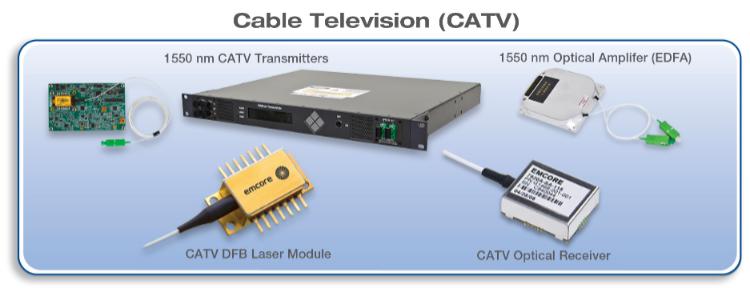
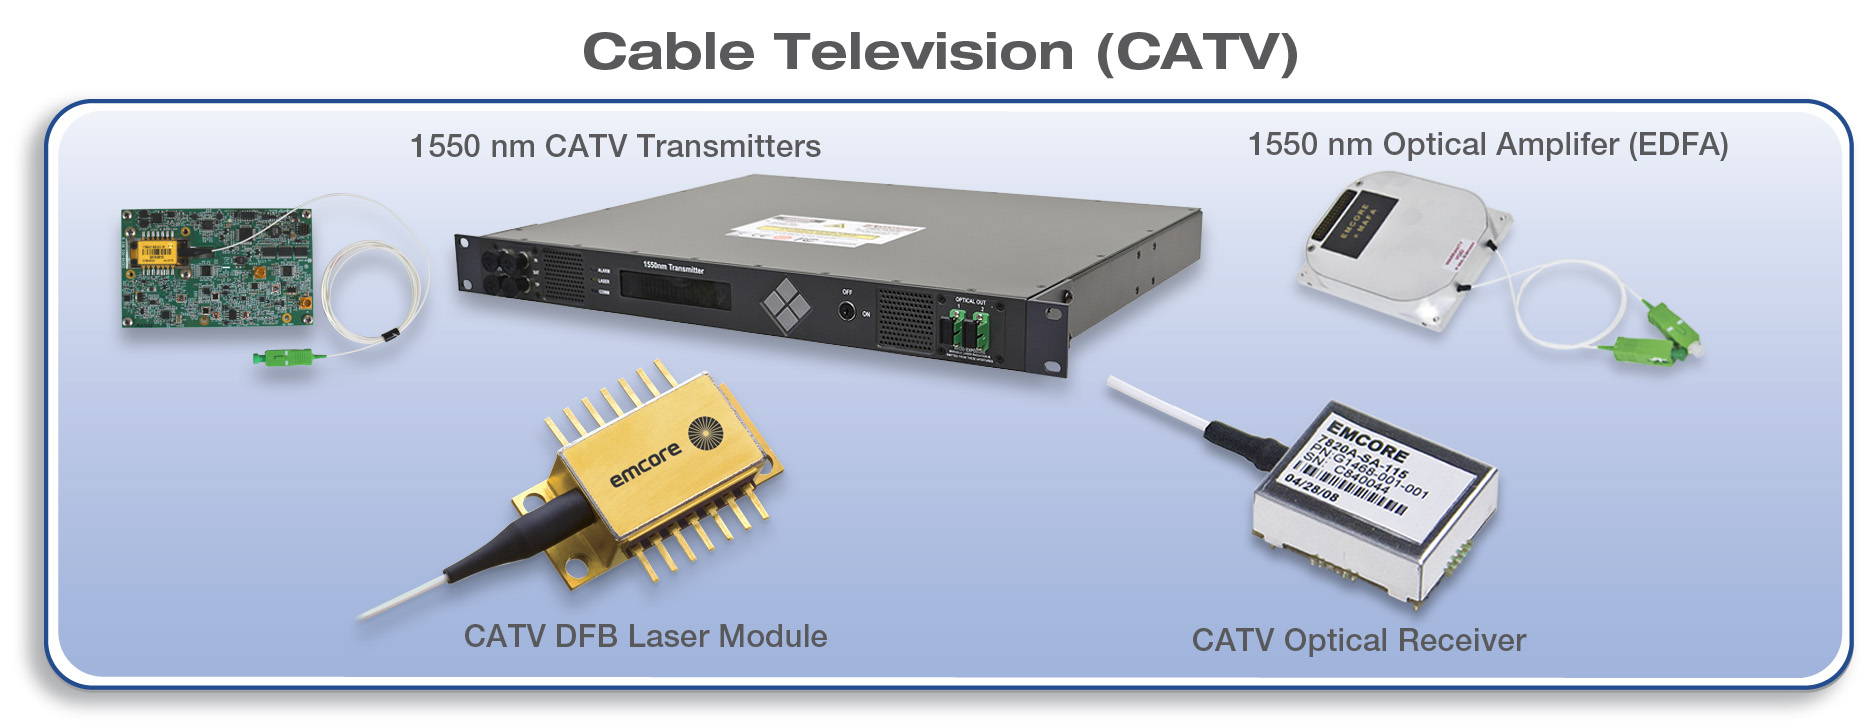
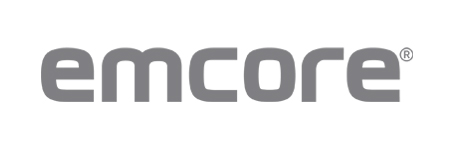
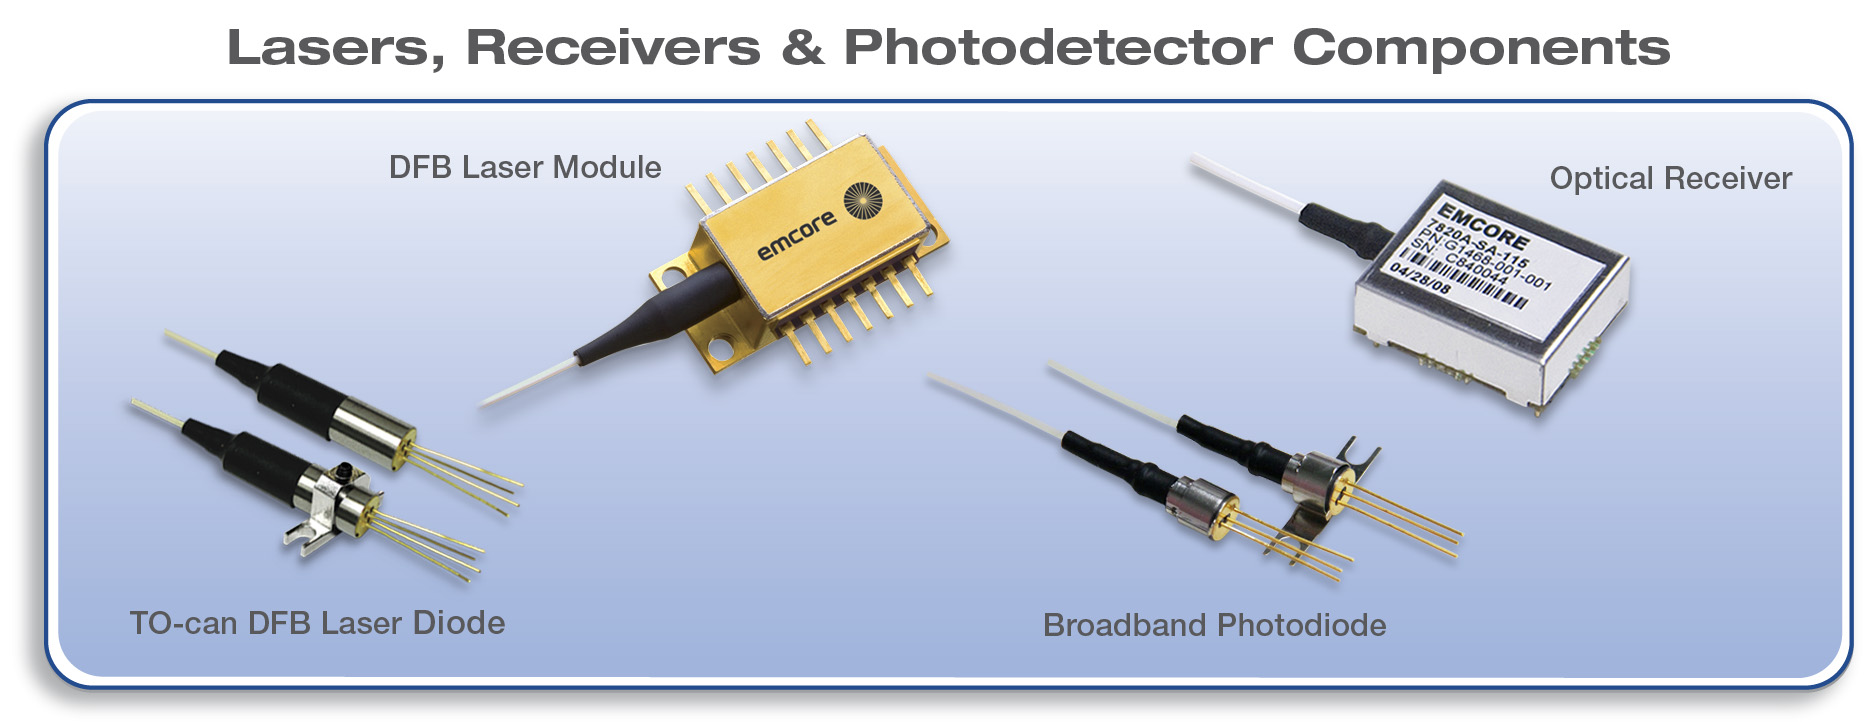
EMCORE is an established marketWe are a leader in providing RF over fiber products for the CATV industry. Our products enable cable systems providers to increase data transmission distance, speed, and bandwidth in Hybrid Fiber Coaxial (“HFC”)hybrid fiber coaxial networks, with lowerless noise and power consumption. This empowers cable service operators to meet the growing demand for high-speed Internet,internet, HDTV, Ultraultra HDTV, 4K, video streaming, and other advanced services. Our CATV products include forward and return-path 1310 nm and 1550 nm distributed feedback ("DFB") analog lasers, optical receivers photodetectorsoptimized for CATV, data over cable service interface specification ("DOCSIS") 3.1 and wireless, broadband photodiodes used in forward-and return-path broadband, subassembly components;components, analog and digital fiber-optic transmitters, Quadrature Amplitude Modulation (“QAM”)quadrature amplitude modulation transmitters, optical switches and CATV fiber amplifiers.
EMCORE’sOur latest series of CATV transmitters feature the Company’s breakthrough Linear Externally Modulated Laserlinear externally modulated laser (“L-EML”) technology that enables long distance optical link performance, approaching traditional lithium niobate-based externally-modulated transmitters, butand is more cost-effective and far exceeds the performance of Distributed Feedback (“DFB”)DFB laser-based systems. EMCORE’s CATV transmitter products are offered on an OEMoriginal equipment manufacturing and ODMoriginal design manufacturing basis for integration into complete CATV transmission systems. The CompanyWe also offers itsoffer our own branded line of EMCORE Medallion series rack-mount CATV transmitters, optical switches and fiber amplifiers. EMCORE’sOur Medallion series products include DOCSIS3.1, 1550 nm externally-modulated transmitters and 1550 nm directly-modulated transmitters, optical A/B switches, and 1RU and 2RU rack-mount CATV fiber amplifiers. EMCORE’s Medallion series transmitters, optical switches and fiber amplifiers, in conjunction with EMCORE’s components and Radio Frequency over Glass (“RFoG”) products, comprise a complete end-to-end CATV system.transmitters.
Chip Devices Product Line
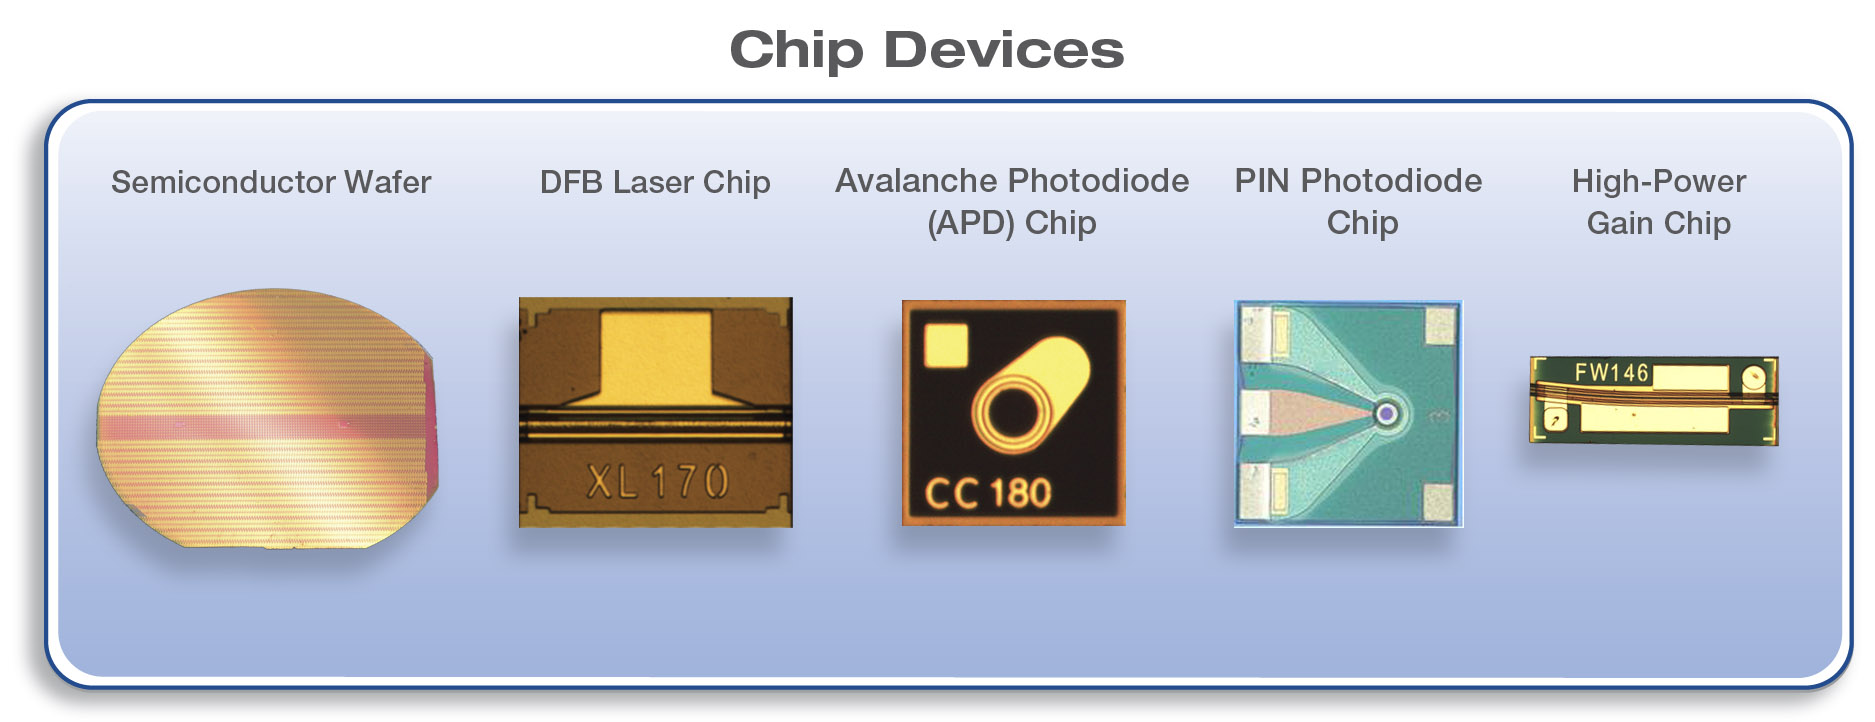
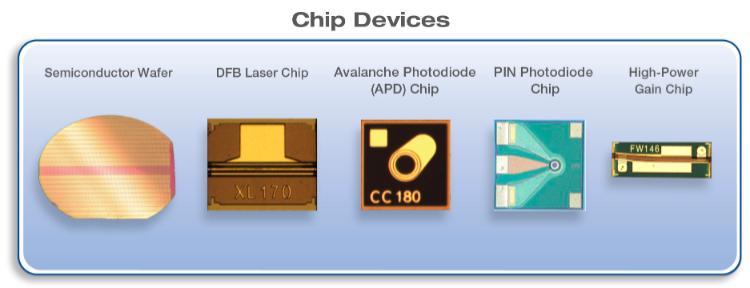
Telecommunications companies throughout the world have been extending their Passive Optical Networkpassive optical network (“PON”) infrastructure to business, enterprise, and residential customers for several years. Since the sale of the Company’s telecom module products in 2015, EMCORE hascustomers. We have supported this market through commercialization of products developed in our InP wafer fab to become a merchant supplier of high-performance chip devices to the Telecomtelecom industry. EMCORE’sWe also develop other specialty chips for the telecom and data center markets. Our semiconductor wafer fabrication facility features Metal-Organic Chemical Vapor Depositionmetal-organic chemical vapor deposition (“MOCVD”) reactors for 2" or 3" wafer processing for InP-based devices including high-power gain chips, laser chips, Avalanche Photodiodeavalanche photodiode (“APD”) and P-type Intrinsic N-typep-type intrinsic n-type (“PIN”) photodetector chips. Our technical team has expertise in device design, epitaxial growth, wafer processing, device characterization, and Chip-On-Blockchip-on-block (“COB”), TO-CanTO-can, and Optical Sub-Assembly (“OSA”)optical sub-assembly from development through manufacturing.
•High-Power Gain Chips Products- EMCORE, through our previousThrough experience in the Telecomtelecom tunable module market, haswe have design and engineering expertise in the development and manufacturing of high-power gain chips for tunable lasers and transceivers utilized in coherent DWDM optical transmission systems.
•Photodiode Products- In addition to EMCORE’s offering of GPONgigabit passive optical network (“GPON”) and gain chip products, the Companywe also has an extensive offering ofoffer photodiodes for use in Telecommunicationstelecommunications and Datacenterdata center applications. These products include, (butbut are not limited to)to, 2.5G and 10G APD top and bottom illuminated chips, and COB, along with 10G PIN photodiode chips, with additional products in development.
In addition, we offer receiver arrays for light detecting and ranging ("LiDAR") applications on a customized basis.
•GPON Fiber-To-The-Premises (FTTP)FTTP and Data Center Chip Products- EMCORE’sOur chip devicesdevice's portfolio is continually developing to support the latest advances in PON including GPON, 10G-EPON, XG-PON, XGS-PON, along with 4G LTE, and data center applications. The Company’sOur laser chip devices offering includes 2.5G and 10G PON DFB and 10G Fabry-Perot laser chips. Wavelengths supported include 1270, 1290, 1310, 1330, 1490, 1550 and 1610 nm.
Other Optical Product LineProducts
The Other Optical Product Line is comprised of lasers
Lasers and subsystems are sold into a variety of applications including wireless, distributed sensing, LiDAR, and Light Detectingwireless.
•LiDAR and Ranging. (“LiDAR”Distributed Sensing Products - We offer narrow linewidth 1310 and 1550 nm DFB lasers optimized for LiDAR and distributed sensing applications. With the development of autonomous vehicles advancing rapidly, we have designed a continuous wavelength, coherent optical source laser for frequency modulation continuous wavelength ("FMCW"). sensing LiDAR applications that delivers low linewidths and high power, ideal for integrating into autonomous driving applications.
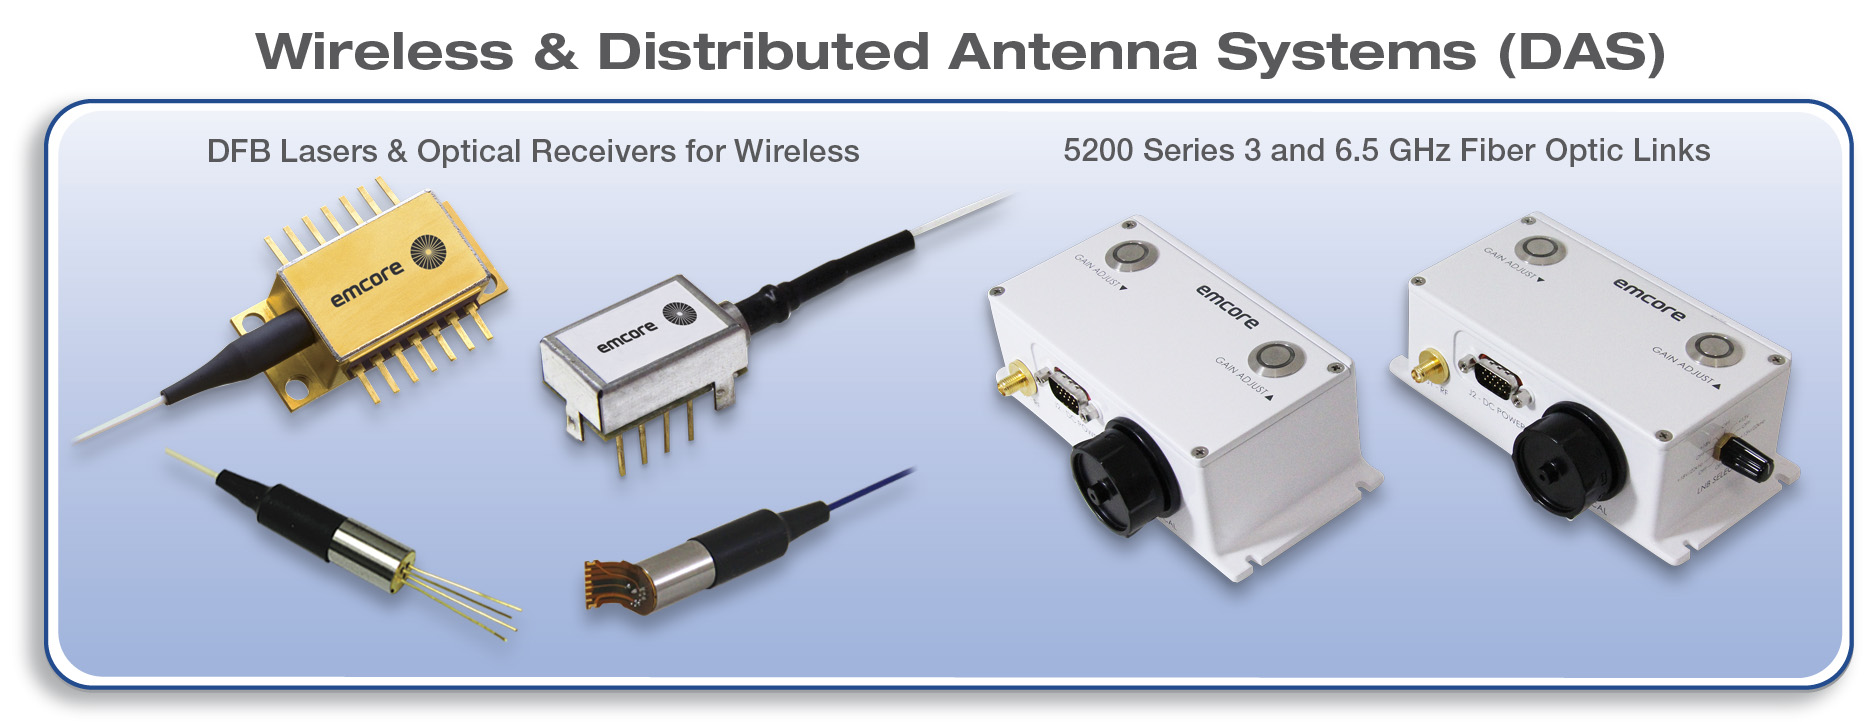
•Wireless Communications Products - The increasing dependence on wireless access for social media, text, email, uploading and downloading of apps, music, videos and photos has created greater demand for deployment of cost-effective, high-performance, integrated wireless Distributed Antenna System (“DAS”) networks. Wireless systems providers are building systemshigh-performance, integrated wireless distributed antenna system (“DAS”) networks in subway tunnels, stadiums, hotels, high-speed trains, and cruise ships. EMCORE hasWe have developed highly linear fiber optic products that are optimized for wireless applications, which we believe integrate extremely well into these systems. They enhance bandwidth and linearity to enable the delivery of consistent, reliable signals in areas where interference is high or signals are weak. EMCORE’sOur products for wireless applications include DFB lasers and optical receivers specifically designed for wireless networks, 3 GHz and 6.5 GHz fiber optic links for cellular backhaul, 4G LTE and DAS.
Laser, ReceiverOur strategy is to continue pioneering development of sensing and Photodetector Component Products -linear optical systems serving aerospace and defense and broadband communications markets. We aim to design and build innovative products that are a leading providervalued by our customers with the intention to grow our sensing and linear product lines using innovative technology, either organically or through future acquisitions. We seek solutions that maximize performance in transformative aerospace and defense systems and high-speed communications networks. Our manufacturing approach is focused on the highest standards of optical components including lasers, receiversprecision that enable us to deliver leading-edge products.
Customers
We have an increasingly global customer base that spans applications across telecommunications and photodetectors (also called “photodiodes”). Our products include CWDM (“Coarse Wavelength Division Multiplexing”)CATV network infrastructure, satellite communications, defense, and DWDM (“Dense Wavelength Division Multiplexing”), 1310 nm and 1550 nm DFB lasers and optical receivers optimized for CATV, DOCSIS (Data Over Cable Service Interface Specification) 3.1 and wireless applications. In addition, we offer narrow linewidth 1310 and 1550 nm DFB lasers optimized for LiDAR and distributed sensing applications. Form-factors for laser products include 14-pin butterfly and coaxial TO-Can. In addition, we offer broadband photodiodes used in forward-and return-path broadband and FTTP applications. EMCORE’s component products to the global fiber optics industry leverage the benefits of our vertically-integrated infrastructure, low-cost manufacturing and early access to newly developed internally-produced components.
Customers
Our majoraerospace. Major customers include: Cisco Systems Inc., Commscope Holding Company, Inc. and Raytheon Company and their respective affiliates. In the fiscal year ended September 30, 2019, Cisco Systems Inc., Commscope Holding Company, Inc. and Raytheon Company and their respective affiliates, each of whom represented greater than 10% of our consolidated revenue. See Note 15 - Geographical Informationrevenue in the notes to our consolidated financial statements for additional information about our significant customers.
Strategic Plan
Strategy and Alternatives Committee of the Board of Directors
In addition to organic growth and development of our existing Fiber Optics business, we intend to pursue other strategies to enhance shareholder value. The Strategy and Alternatives Committee of the Company's Board of Directors (the "Strategy Committee"), which was established in December 2013, is charged with overseeing the Company’s strategic plan and evaluating strategic opportunities and alternatives available to the Company, including potential mergers, acquisitions, divestitures and other key strategic transactions outside the ordinary course of the Company’s business. Accordingly, the Strategy Committee may from time to time consider strategic opportunities to enhance shareholder value, which may include, at various times depending on the circumstances, acquisitions, investments in joint ventures, partnerships, and other strategic alternatives, such as dispositions, reorganizations, recapitalizations or other similar transactions, the repurchase of shares of our outstanding common stock or payment of dividends to our shareholders. The Strategy Committee may engage financial and other advisors to assist it in doing so. Accordingly, the Strategy Committee and our management may from time to time be engaged in evaluating potential strategic opportunities and may enter into definitive agreements with respect to such transactions or other strategic alternatives. However, there is no assurance that the Strategy Committee will identify further strategic opportunities that the Company will determine to pursue, or that the consideration of any such opportunity would result in the completion of a strategic transaction. The Strategy Committee met five (5) times during the fiscal year ended September 30,
2019.2021. See Note 13 – Segment and Revenue Information in the Notes to Consolidated Financial Statements for additional information about significant customers.
Acquisition
Sales and Marketing
We sell products worldwide through multiple channels made up of Systron Donner Inertial, Inc.our direct sales force, application engineers, third party sales representatives, and distributors. Our sales force is aligned according to product line to maximize expertise. We communicate with customers’ engineering, manufacturing, and purchasing personnel throughout the sales cycle to provide optimized customer solutions through product design, qualifications, performance, and price. As a result, we develop strategic and long-lasting customer relationships with tailored products and services. Marketing efforts are focused on increasing brand awareness, communicating our technological advantages, and generating leads. We use a variety of marketing methods, including our website, participation at trade shows, and selective advertising to achieve these goals.
On June 7, 2019,Manufacturing
We utilize MOCVD systems capable of processing a wide range of compound semiconductor-based materials. Operations include wafer fabrication, device design and production, fiber optic module, subsystem and system design and manufacture, and QMEMS gyroscope, accelerometer, and IMU and INS design and manufacture. Operations beyond wafer fabrication are already largely and increasingly manufactured with our electronics manufacturing services ("EMS") partners. We are to a large extent vertically integrated in the Company acquired SDI, a private-equity backedmanufacture of QMEMS gyroscopes, accelerometers, inertial measurement units and inertial navigation systems providerdesign and manufacture within our own facilities. Many of our manufacturing operations are computer monitored or controlled to enhance production output and statistical control.
We seek to minimize ongoing capital investments, while maximizing the variable nature of our cost structure. Where cost advantages can be gained, we continue to outsource the production of certain products, subsystems, components, and subassemblies to contract manufacturers ("CMs") located domestically or overseas. For example, we are in the process of transitioning our CATV Lasers and Transmitters product line from in-house manufacturing in Beijing, China, to a variable cost, EMS model as described in Part II, Item 7 Recent Developments, "Hytera and Fastrain Transactions".
Our manufacturing processes involve extensive quality assurance systems and performance testing. Our CMs also maintain comprehensive quality assurance and delivery systems that are monitored for compliance. Our facilities have achieved and continue to maintain certification status for quality management systems. Manufacturing facilities located in Alhambra, California and Beijing, China are registered to ISO 9001 standards and the Concord, California facility is registered to AS 9100 standards.
Research and Development
Our industry is characterized by rapid changes in process technologies with a scalable, chip-based platform for higher volume gyro applications utilizing QMEMS technology. The total purchase price was approximately $25.0 million, consistingincreasing levels of (i) approximately $22.0 millionfunctional integration. To that end, research and development efforts focus on maintaining our technological competitive edge to improve the quality and features of existing products. We strive to design new proprietary production technologies and products, improving the performance of existing materials, components, and subsystems, and reducing costs in cash after working capital adjutments and (ii) the issuanceproduct manufacturing process.
Many projects have focused on developing lower cost versions of 811 thousand shares of common stock with an aggregate value of approximately $3.0 million asour existing products. In view of the closing date.high cost of development, we solicit research contracts that provide opportunities to enhance our core technology base and promote the commercialization of targeted products.
Following the closing, we began integrating SDI into our Navigation and Inertial Sensing product line and have included the financial results of SDI in our condensed consolidated financial statements beginning on the acquisition date. Net revenue and net loss of SDI from the acquisition date through September 30, 2019 of $9.8 million and $0.6 million, respectively, is included in our consolidated statements of operations and comprehensive (loss) income for the fiscal year ended September 30, 2019.Supplier Relationships
Sources of Raw Materials
We depend on a limited number of suppliers for certain raw materials, components, and equipment used in our products, though no single supplier of raw materials or components accounts for more than 10% of our aggregate consolidated cost of goods sold. We continually review our supplierequipment. Supplier relationships are reviewed to mitigate risks and lower costs, especially where we depend on one or twoa few suppliers for critical components or raw materials. While maintaining inventories that we believeCommunications with suppliers are sufficient to meet our near-term needs, we strive not to carry significant inventories of raw materials. Accordingly, we maintain ongoing communications with our suppliers in order to prevent any interruptions in supply, and have implemented aour supply-chain management program to maintainis focused on maintaining quality and lowerwhile lowering purchase prices through standardized purchasing efficiencies and design requirements. To date, we generally have been ableWe strive to obtainlimit inventories to levels sufficient quantities of critical supplies in a timely manner.to meet near-term needs.
We are subject to rules promulgated by the SEC pursuant to the Dodd-Frank Wall Street Reform and Consumer Protection Act regarding the use of "conflict minerals". These rules have imposed and will continue to impose additional costs and may introduce new risks related to ourthe ability to verify the origin of any "conflict minerals" used in our products.
ManufacturingCompetition
The markets we serve are extremely competitive, characterized by rapid technological change. Primary competitive factors are product cost, yield, throughput, performance, reliability, breadth of product line, product heritage, customer satisfaction, and customer loyalty to competitors’ technologies. Certain product lines are subject to frequent introduction of new products, short product life cycles, and significant price erosion. We face competition from numerous domestic and international companies, who may have significant engineering, manufacturing, marketing, and financial resources. In addition, competitors may develop enhancements to, or future generations of, products that offer superior price and performance characteristics.
Although our markets are competitive, there are substantial barriers to entry. These barriers include significant dependence on existing patents, the time and costs required to develop products, the technical difficulty in manufacturing semiconductor-based products, the lengthy sales and qualification cycles, and the difficulties in hiring and retaining skilled employees with the required scientific and technical backgrounds.
We utilize MOCVD (metal-organic chemical vapor deposition) systems thatsell products to current and future potential competitors. As the markets for our products grow, new competitors are capablelikely to emerge and current competitors may increase their market share. In the European Union ("EU") and certain countries throughout the world, political and legal arrangements encourage the purchase of processing virtually all compound semiconductor-based materials. Our operations include wafer fabrication, device design and production and fiber optic module, subsystem and system design and manufacture. Many of our manufacturing operations are computer monitoreddomestically produced goods, which places us at a disadvantage in those regions or controlled to enhance production output and statistical control. We employ a strategy of minimizing ongoing capital investments, while maximizing the variable nature of our cost structure. We maintain supply agreements with key suppliers. Where we can gain cost advantages while maintaining quality and intellectual property control, we outsource the production of certain products, subsystems, components, and subassemblies to contract manufacturers located overseas. Our contract manufacturers maintain comprehensive quality assurance and delivery systems, and we continuously monitor them for compliance.countries.
Order Backlog
Our various manufacturing processes involve extensive quality assurance systemsproduct sales are made pursuant to purchase orders, in some cases with short lead times. These orders are typically subject to revision or cancellation and performance testing. Our facilities have acquired and maintain certification statuscan be made without deposits. Historically, for their quality management systems. Our manufacturing facilities located in Alhambra, California; and Beijing, China are registered to ISO 9001 standards. Our manufacturing facility located in Concord, California is registered to AS 9100 standards.
As part of the effort to better streamline operations and move to a variable cost model with respect to our Cable TVCATV Lasers and Transmitters product line, on October 25, 2019,products have typically shipped within the Company entered intosame quarter in which a purchase order is received, and therefore order backlog at any particular date is not necessarily indicative of actual revenue or the level of orders for any succeeding period and may not be comparable to prior periods.
Seasonality
In certain previous fiscal years, we have experienced an Asset Purchase Agreement (the “Purchase Agreement”) with Hytera Communications (Hong Kong) Company Limited, a limited liability company incorporatedincrease in Hong Kong (“Hytera HK”), and Shenzhen Hytera Communications Co., Ltd., a corporation formed under the laws of the P.R.C. (“Shenzhen Hytera”, and together with Hytera HK, the “Buyers”), pursuant to which the Buyers agreed to purchase from EMCORE certain Cable TV Laser and Transmitter catv module and transmitter manufacturing equipment (the “Equipment”) owned by EMCORE and currently located at the manufacturing facility of EMCORE’s wholly-owned subsidiary, EMCORE Optoelectronics (Beijing) Co, Ltd., a corporation formed under the laws of the P.R.C., for an aggregate purchase price of approximately $5.54 million. The Equipment will be transferred to the Buyers in multiple closings, the last of which is expected to occur during the quarter ending March 31, 2020. Concurrently with entry into the Purchase Agreement, EMCORE entered into a Contract Manufacturing Agreement (the “Manufacturing Agreement”), dated as of October 25, 2019, with the Buyers pursuant to which the Buyers agreed to manufacture certain catv module and transmitter products for EMCORE from a manufacturing facility located in Thailand for an initial five year term at product prices agreed to between the parties. These manufacturing activities are expected to commence during the fiscal year ending September 30, 2020.
Sales and Marketing
We sell our products worldwide through our direct sales force, application engineers, third party sales representatives and distributors. Our sales force communicates with our customers' engineering, manufacturing, and purchasing personnel to provide optimized customer solutions through product design, qualifications, performance, and price. Our strategy is to use our direct sales force to sell to original equipment manufacturers and key accounts and to expand our use of distribution partners for increased coverage in both international markets and certain domestic segments.
Throughout our sales cycle, we work closely with our customers to qualify our products into their product lines and platforms. As a result, we develop strategic and long-lasting customer relationships with products and services that are tailored to our customers' requirements. We focus our marketing communication efforts on increasing brand awareness, communicating our technologies' advantages, and generating leads for our sales force. We use a variety of marketing methods, including our website, participation at trade shows, and selective advertising to achieve these goals.
Externally, our marketing group works with customers to define requirements, characterize market trends, define new product development activities, identify cost reduction initiatives, and manage new product introductions. Internally, our marketing group communicates and manages customer requirements with the goal of ensuring that our product development activities are aligned with our customers' needs. These product development activities allow our marketing group to manage new product introductions and market trends. See Note 15 - Geographical Informationrevenues in the notesthird and fourth fiscal quarters due to the consolidated financial statements for disclosures related to geographic revenue and significant customers.
Research and Development
Our research and development efforts have been focused on maintaining our technological competitive edge by working to improve the quality and featuresincreased sales of our CATV Lasers and Transmitters product lines. We are also making investments to expand our existing technology and infrastructure inline resulting from an effort to develop new products and production technology that we can use to expand into new markets. Our industry is characterized by rapid changes in process technologiesincreased build of cable networks during seasons with increasing levels of functional integration. Our efforts are focused on designing new proprietary processes and products, on improving the performance of our existing materials, components, and subsystems, and on reducing costs in the product manufacturing process.warmer weather.
As part of the ongoing effort to cut costs, many of our projects have focused on developing lower cost versions of our existing products. In view of the high cost of development, we solicit research contracts that provide opportunities to enhance our core technology base and promote the commercialization of targeted products. Generally, internal research and development funding is used for the development of products that will be released within twelve months and external funding is used for long-term research and development efforts.
We believe that in order to remain competitive, we must invest significant financial resources in developing new product features and enhancements and in maintaining customer satisfaction worldwide. Research and development expense was $19.4 million, $15.4 million and $12.5 million for the fiscal years ended September 30, 2019, 2018 and 2017, respectively. As a percentage of revenue, research and development expenses were 22.3%, 18.0% and 10.2% for the fiscal years ended September 30, 2019, 2018 and 2017, respectively. Our research and development expense consists primarily of compensation expense including non-cash stock-based compensation expense, as well as engineering and prototype costs, depreciation expense, and other overhead expenses, as they relate to the design, development, and testing of our products. These costs are expensed as incurred.
Intellectual Property and Licensing
We protect our proprietary technology by applying for patents where appropriate, and in other cases by preservingto preserve the technology, related know-how, and information as trade secrets. The success and competitive advantage enjoyed by ourof certain product lines depends heavily on ourthe ability to obtain intellectual property protection for our proprietary technologies. We also rely on other intellectual property rights such as trademarks and copyrights where appropriate and acquire, through license grants or assignments, the rights to patents on inventions originally developed by others. We do not believe financial obligations under any of these agreements adversely affects our business, financial condition, or results of operations.
As of September 30, 2019,2021, we held approximately 7656 U.S. patents and approximately 6466 foreign patents and had over 9approximately four additional patent applications pending. The issued patents cover various products in the major markets we serve. Our U.S. patents will expire on varying dates between 20202021 and 2035.2038. These patents and patent applications claim protection for various aspects of current or planned commercial versions of our materials, components, subsystems, and systems.
We also have entered into license agreements with other organizations, under which we have obtained exclusive or non-exclusive rights to practice inventions claimed in various patents and applications issued or pending in the U.S. or other foreign jurisdictions. We do not believe our financial obligations under any of these agreements adversely affects our business, financial condition, or results of operations.
We rely on trade secrets to protect our intellectual property when we believe that publishing patents would make it easier for others to reverse engineer our proprietary processes. We also rely on other intellectual property rights such as trademarks and copyrights where appropriate.
Environmental Regulations
We are subject to U.S. federal, state, and local laws and regulations concerning the use, storage, handling, generation, treatment, emission, release, discharge, and disposal of certain materials used in our research and development and production operations, as well as laws and regulations concerning environmental remediation, homeland security, and employee health and safety. The production of wafers and devices involves the use of certain hazardous raw materials, including, but not limited to, ammonia, phosphine, and arsine. We have in-house professionals to address compliance with applicable environmental, homeland security, and health and safety laws and regulations. We believe that we are currently in compliance with all applicable federal, state, and local environmental protection laws and regulations.
Human Capital
Competition
The markets for our products are extremely competitive and are characterized by rapid technological change, frequent introduction of new products, short product life cycles, and with respect to certain of our product lines, significant price erosion. We face actual and potential competition from numerous domestic and international companies. Many of these companies have significant engineering, manufacturing, marketing, and financial resources.
We also sell our products to current competitors and companies with the capability of becoming competitors. As the markets for our products grow, new competitors are likely to emerge and current competitors may increase their market share. In the European Union (“EU”) and certain countries throughout the world, political and legal arrangements encourage the purchase of domestically produced goods, which places us at a disadvantage in those regions or countries.
There are substantial barriers to entry by new competitors across our product lines. These barriers include the large number of existing patents, the time and costs required to develop products, the technical difficulty in manufacturing semiconductor-based products, the lengthy sales and qualification cycles, and the difficulties in hiring and retaining skilled employees with the required scientific and technical backgrounds. We believe that the primary competitive factors within our current markets are product cost, yield, throughput, performance and reliability, breadth of product line, product heritage, customer satisfaction, and customer commitment to competing technologies. Competitors may develop enhancements to or future generations of competitive products that offer superior price and performance characteristics. We believe that in order to remain competitive, we must invest significant financial resources in developing new product features and enhancements and in maintaining customer satisfaction worldwide.
Order Backlog
EMCORE's product sales are made pursuant to purchase orders, often with short lead times. These orders are subject to revision or cancellation and often are made without deposits. For certain of our product categories, products typically ship within the same quarter in which a purchase order is received; therefore, our order backlog at any particular date is not necessarily indicative of actual revenue or the level of orders for any succeeding period and may not be comparable to prior periods.
Seasonality
In certain of our previous fiscal years, we have experienced an increase in revenues in our third and fourth fiscal quarters due to increased sales of our CATV products resulting from an increased build of cable networks during seasons with warmer weather.
Employees
As of September 30, 2019, we had approximately 420 employees, including approximately 101 international employees that are located primarily in China. This represents an increase of approximately 29 employees when compared to September 30, 2018, primarily as a result of the purchase of SDI in June 2019, partially offset by a reduction of headcount in China and the U.S. during the fiscal year ended September 30, 2019. None of our employees are covered by a collective bargaining agreement. We have never experienced any labor-related work stoppage and believe that our employee relations are good.
Competition is intense in the recruiting of personnel in the semiconductor industry and fiber optics industries. Our ability to attract and retain qualified personnel is essential to our continued success. Competition is intense in recruiting personnel within the semiconductor and fiber optics industries. We are focused on retaining key contributors, developing our staff,
and cultivating their commitmentcontinued commitment. As of September 30, 2021, we had approximately 365 employees, including approximately 75 international employees that are located primarily in China. This represents a decrease of approximately 22 employees when compared to September 30, 2020. We believe that employee relations are good. Our employees are not covered by a collective bargaining agreement, and we have never experienced any labor-related work stoppage.
Availability of Information
We are subject to the information requirements of the Exchange Act. We file periodic reports, current reports, proxy statements, and other information with the SEC. The SEC maintains a website at https://www.sec.gov that contains all of our Company.information that has been filed or furnished electronically with the SEC. Available free of charge on the website is a link to the Annual Reports on Form 10-K, Quarterly Reports on Form 10-Q, Current Reports on Form 8-K, and amendments to those reports filed or furnished pursuant to Section 13(a) or 15(d) of the Exchange Act, as soon as reasonably practicable, after such material is electronically filed with, or furnished to, the SEC.
ITEM 1A. Risk Factors
You should carefully consider the risks described below, some of which have manifested and any of which may occur in the future, in addition to the other information contained in this report before making an investment decision with respect to any of our securities. Our business, results of operations, and financial condition could be materially and adversely impacted by any of these risks, which could in turn adversely affect our stock price. Additional risks not currently known to us or other factors not perceived by us as material risks could also present significant risks to our business.
Risks Related to the Effects of COVID-19 and Other Potential Future Public Health Crises, Epidemics, Pandemics or Similar Events.
The full effects of COVID-19 and other potential future public health crises, epidemics, pandemics or similar events are uncertain and could have a material and adverse effect on our business, financial condition, operating results, and cash flows.
The ongoing COVID-19 pandemic has negatively affected the U.S. and global economy, disrupted global supply chains, significantly restricted travel and transportation, resulted in mandated closures and orders to “shelter-in-place,” and created significant disruption of the financial markets. The full extent of the COVID-19 impact on our operational and financial performance will depend on future developments, including the duration and spread of the pandemic, the emergence of new strains of the virus, the impact of vaccination efforts and related actions taken by the U.S. government, state and local government officials, and international governments to prevent disease spread, all of which are uncertain, out of our control and cannot be predicted.
Facility closures or further work slowdowns or temporary stoppages could occur, which could have a longer-term impact and could delay our development efforts and our deliveries to customers, and other countries have different practices and policies that can affect our international operations and the operations of our suppliers and customers. If significant portions of our workforce are unable to work effectively, including because of illness, quarantines, absenteeism, government actions, facility closures, travel restrictions or other restrictions in connection with the COVID-19 pandemic, our operations will be negatively impacted. For example, COVID-19 related staffing shortages at the Thailand facility of our CM have negatively affected production levels of our CATV module and transmitter products by the manufacturer. We may be unable to perform fully on our contracts and our costs may increase as a result of the COVID-19 outbreak. The impact of COVID-19 could worsen if there is an extended duration of any COVID-19 outbreak or a resurgence of COVID-19 infection in affected regions after they have begun to experience improvement.
In addition, the COVID-19 pandemic has negatively affected, and could have further negative effects on, the timing of the sale and transfer of certain CATV module and transmitter manufacturing equipment that we have agreed, as part of our efforts to streamline operations and move to a variable cost model in our CATV Lasers and Transmitters product line, to sell to Shenzhen Fastrain Technology Co., Ltd. and Hong Kong Fastrain Company Limited (collectively, “Fastrain”), for use by Fastrain in connection with the manufacturing of certain CATV module and transmitter products for us from a manufacturing facility located in Thailand. The sale and transfer of the equipment that remains in our possession is now expected to be completed during the quarter ending March 31, 2022. The timing and completion of these transfers may be further disrupted as a result of COVID-19, which could delay our recognition of the anticipated benefits of transferring this equipment and could disrupt our manufacturing activities for these products.
As described elsewhere in Item 1A, Risk Factors of this Annual Report on Form 10-K for the fiscal year ended September 30, 2021, we rely on other companies to provide materials, major components and products, and to perform a portion of the services that are provided to our customers under the terms of most of our contracts where we rely on these third parties. Many of our suppliers have at times temporarily ceased or limited their operations as a result of COVID-19 and failed to deliver parts
or components to us. For example, COVID-19 driven component shortages and delays have required us to spend significant time sourcing critical components from alternative sources and, in some cases, forced us to design in alternative parts and qualify them with customers on short schedules. These or similar actions may continue in the future, and an extended period of global supply chain disruption caused by the response to COVID-19 could impact our ability to perform on our contracts and, if we are not able to implement alternatives or other mitigations, product deliveries could be adversely impacted.
As a result of COVID-19, we could see reduced customer orders in certain of our product lines, which could adversely affect our revenues, financial performance and cash flows, and could result in inventory write-downs and impairment losses. Significant delays in inspection, acceptance and payment by our customers, many of whom are teleworking, could also affect our revenues and cash flows, and current limitations on access to customer facilities could impact orders. For example, qualification testing for certain of our products continues to be delayed due to customer engineering shortages and limitations on their ability to access their facilities. In addition, limitations on government operations can also impact regulatory approvals such as export licenses that are needed for international sales and deliveries for certain of our products. Government funding priorities may change as a result of the costs of COVID-19, which could adversely affect our revenues arising from government contracts or subcontracts, and with respect to such contracts, we could experience delays in new program starts or awards of future work or in timelines for current programs, as well as the uncertain impact of contract modifications to respond to the national emergency.
The continued spread of COVID-19 has also led to disruption and volatility in the global capital markets, which, depending on future developments, could impact our capital resources and liquidity in the future. If we need to raise additional capital to support operations in the future, we may be unable to access capital markets and additional capital may only be available to us on terms that could be significantly detrimental to our existing stockholders and to our business as a result of COVID-19. We are also monitoring the impacts of COVID-19 on the fair value of our assets. While we do not currently anticipate any material impairments on our assets as a result of COVID-19, future changes in expectations for sales, earnings and cash flows related to intangible assets and goodwill below our current projections could cause these assets to be impaired.
Risks Related to Demand, Competition, Product Development and Manufacture, and Operations
We have incurred losses from continuing operations and our future profitability is not certain.
ForWhile we achieved income from operations of $25.6 million in the fiscal year ended September 30, 2021, for the fiscal years ended September 30, 2020 and 2019, and 2018,we incurred a loss from continuing operations wasof $7.0 million and $36.0 million, and $17.5 million, respectively. For the fiscal year ended September 30, 2017, income from continuing operations was $8.2 million. Our operating results for future periods are subject to numerous uncertainties and we cannot be certain that we will be profitable or that we will not experience substantial losses in the future. If we are not able to increase revenue and reduce our costs, we may not be able to achieve profitability in future periods and our business, financial condition, results of operations and cash flows may be adversely affected.
We are a small company and dependent on a few products for our success.
We are a small company with a narrow, focused portfolio of products. Our small size could cause our cash flow, results of operations and growth prospects to be more volatile and makes us more vulnerable to actions by our competitors.focused competition. As a small company, we will be subject to greater revenue fluctuations if our older product lines’ sales were to decline faster than we anticipate or if we are unable to grow our revenue inour newer product lines in the manner we anticipate. In addition, we may not be able to appropriately restructure or maintain our supporting functions to fit the needs of a small company, which could adversely affect our business, financial condition, results of operations, and cash flows.
We may not be able to obtain capital when desired on favorable terms, if at all, or without dilution to our shareholders.
We believe that our existing cash and cash equivalents, and cash flows from our operating activities and funds available under our credit facilities, will be sufficient to meet our anticipated cash needs for at least the next 12 months. We operate in an industry, however, that makes our prospects difficult to evaluate. It is possible that we may not generate sufficient cash flow from operations or otherwise have the capital resources to meet our future capital needs. If this occurs, we may need additional financing to continue operations or execute on our current or future business strategies, including to:
invest in our research and development efforts, including by hiring additional technical and other personnel;
maintain and expand our operating or manufacturing infrastructure;
acquire complementary businesses, products, services or technologies; or
otherwise pursue our strategic plans and respond to competitive pressures.
If we raise additional funds through the issuance of equity or convertible debt securities, the percentage ownership of our shareholders could be significantly diluted, and these newly-issued securities may have rights, preferences or privileges senior to those of existing shareholders. We cannot be certain that additional financing will be available on terms favorable to us, or at all. In addition, as described in Note 11 - Credit Facilities in the notes to the consolidated financial statements, our Credit and Security Agreement with Wells Fargo Bank, N.A. (i) is subject to a borrowing base formula based on the Company's eligible accounts receivable, inventory, and machinery and equipment accounts and (ii) requires that for certain specific uses, the Company have liquidity of at least $25.0 million after such use. If adequate funds are not available or are not available on acceptable terms, if and when needed, our ability to fund our operations, take advantage of unanticipated opportunities, develop or enhance our products, or otherwise respond to competitive pressures could be significantly limited. Furthermore, in the event adequate capital is not available to us as required, or is not available on favorable terms, our business, financial condition, results of operations, and cash flows may be adversely affected.
We are substantially dependent on revenues from a small number of customers. The loss of or decrease in sales from any one of these customers could adversely affect our business, financial condition, results of operations, and cash flows.
A small number of customers account for a significant portion of our revenue, and our dependence on orders from a relatively small number of customers makes our relationship with each customer critically important to our business. For example, for the fiscal year ended September 30, 2021, sales to three customers accounted for an aggregate of 70% of total consolidated revenues, for the fiscal year ended September 30, 2020, sales to three customers accounted for an aggregate of 57% of total consolidated revenues, and for the fiscal year ended September 30, 2019, sales to three customers accounted for an aggregate of 55% of our total consolidated
revenues, for the fiscal year ended September 30, 2018, sales to two customers accounted for an aggregate of 60.3% of our total consolidated revenues, and for the fiscal year ended September 30, 2017, sales to three customers accounted for an aggregate of 71% of our total consolidated revenues. SalesRevenue from any of our major customerscustomer may decline or fluctuate significantly in the future. We may not be able to offset any decline in sales from our existing major customers with sales from new customers or other existing customers. Because of our reliance on a limited number of customers, any decrease in sales from, or loss of, one or more of these customers without a corresponding increase in sales from other customers would harm our business, operating results, financial condition, and cash flows.
In addition, any negative developments in the business of existing significant customers could result in significantly decreased sales to these customers, which could seriously harm our business, operating results, financial condition, and cash flows, and if there is consolidation among our customer base, our customers may be able to command increased leverage in negotiating prices and other terms of sale, which could adversely affect our profitability. If we are required to reduce our pricing, our revenue and gross margins would be adversely impacted. Consolidation among our customer base may also lead to reduced demand for our products, replacement of our products by the combined entity with those of our competitors, and cancellations of orders, each of which could adversely affect our business, financial condition, results of operations, and cash flows.
Although we are attempting to expand our customer base, the markets in which we sell our products are dominated by a relatively small number of companies, thereby limiting the number of potential customers. Accordingly, our success will depend on ourthe continued ability to develop and manage relationships with significant customers, and we expect that the majority of our sales will continue to depend on sales of our products to a limited number of customers for the foreseeable future.
Our futureFuture revenue is inherently unpredictable. As a result, our operating results are likely to fluctuate from period to period, and we may fail to meet the expectations of our analysts and/or investors, which may cause volatility in our stock price and may cause ourthe stock price to decline.
Our quarterly and annual operating results have fluctuated substantially in the past and are likely to fluctuate significantly in the future due to a variety of factors, some of which are outside of our control. Factors that could cause our quarterly or annual operating results to fluctuate include:
a downturn•increases or decreases in the markets for our customers’ products;
•discontinuation by our vendors of, or unavailability of, components or services used in our products;
•disruptions or delays in our manufacturing processes or in our supply of raw materials or product components;
•a failure to anticipate changing customer product requirements;
•market acceptance of our products;
•cancellations or postponements of previously placed orders;
•increased financing costs or any inability to obtain necessary financing;
•the impact on our business of current or future cost reduction measures;
•a loss of key personnel or the shortage of available skilled workers;
•economic conditions in various geographic areas where we or our customers do business;
•the impact of political uncertainties, such as government sequestration and uncertainties surrounding the federal budget, customer spending, and demand for our products;
•significant warranty claims, including those not covered by our suppliers;
•product liability claims;
•other conditions affecting the timing of customer orders;
•reductions in prices for our products or increases in the costs of our raw materials;
•effects of competitive pricing pressures, including decreases in average selling prices of our products;
•fluctuations in manufacturing yields;
•obsolescence of products;
•research and development expenses incurred associated with new product introductions;
•natural disasters, such as hurricanes, earthquakes, fires, and floods;
•pandemics, including COVID-19;
•the emergence of new industry standards;
•the loss or gain of significant customers;
•the introduction of new products and manufacturing processes;
•changes in technology;
•intellectual property disputes;
•customs (including tariffs imposed on our products or raw materials, equipment, or components used in the production of our products), import/export, and other regulations of the countries in which we do business;
•the occurrence of M&Amerger and acquisition activities; and
•acts of terrorism or violence and international conflicts or crises.
In addition, the limited lead times with which several of ourmany customers order our products restrict ourthe ability to forecast
revenue. We may also experience a delay in generating or recognizing revenue for a number of reasons. For example, in certain of our product lines, orders at the beginning of each quarter typically represent a small percentage of expected revenue for that quarter. We depend on obtaining orders during each quarter for shipment in that quarter to achieve our revenue objectives. Failure to ship these products by the end of a quarter may adversely affect our results of operations and cash flows.
As a result of the foregoing factors, we believe that period-to-period comparisons of our results of operations should not be solely relied upon as indicators of future performance.
We are subject to the cyclical nature of the markets in which we compete and any future downturn may reduce demand for our products and revenue.
In the past, the markets in which we compete have experienced significant downturns, often connected with, or in anticipation of, the maturation of product cycles, for both manufacturers’ and their customers’ products, and declining general economic conditions. These downturns have been characterized by diminished product demand, production overcapacity, high inventory levels, and accelerated erosion of average selling prices. These markets are impacted by the aggregate capital expenditures of service providers and enterprises as they build out and upgrade their network infrastructure. These markets are highly cyclical and characterized by constant and rapid technological change, pricing pressures, evolving standards, and wide fluctuations in product supply and demand.
We may experience substantial period-to-period fluctuations in future results of operations. Any future downturn in the markets in which we compete, or changes in demand for our products from our customers, could result in a significant reduction in our revenue and may also increase the volatility of the price of our common stock.
In addition, the communication networks industry from time to time has experienced and may again experience a pronounced downturn. To respond to a downturn, many service providers and enterprises may slow their capital expenditures, cancel or delay new developments, reduce their workforcesworkforce and inventories, and take a cautious approach to acquiring new equipment and technologies, any of which could cause our results of operations to fluctuate from period to period and harm our business.
Customer demand is difficult to forecast and, as a result, we may be unable to optimally match production with customer demand.
We make planning and spending decisions, including determining the levels of business that we will seek and accept, production schedules, component procurement commitments, personnel needs and other resource requirements, based on our estimates of customer demand. While our customers generally provide us with their demand forecasts, they are typically not contractually committed to buy any quantity of products beyond firm purchase orders. The short-term nature of our customer commitments and the possibility of unexpected changes in demand for their products limit ourthe ability to accurately predict future customer demand. On occasion, customers have required rapid increases in production, which has strained our resources. We may not have sufficient capacity at any given time to meet the volume demands of our customers, or one or more of our suppliers may not have sufficient capacity at any given time to meet our volume demands. Conversely, a downturn in the markets in which our customers compete can cause, and in the past has caused, our customers to significantly reduce the amount of products ordered from us or to cancel existing orders, leading to lower utilization of our facilities. Because many of our costs and operating expenses are relatively fixed, reduction in customer demand would have an adverse effect on our gross margin, results of operations, and cash flow. During an industry downturn, there is also a higher risk that a larger portion of our trade receivables would be uncollectible. In addition, certain of our arrangements with component vendors require us to purchase minimum quantities of components within specific time periods, which could cause us to hold excess inventories of these components during periods concurrent with a decrease in customer demand for our products.
OurThe acquisition of Systron Donner Inertial, Inc.,SDI and acquisitions of other companies or investments in joint ventures with other companies could adversely affect our operating results, dilute our shareholders' equity, or cause us to incur additional debt or assume contingent liabilities.
To increase our business, maintain our competitive position, or for other business or strategic reasons, we may acquire other companies or engage in joint ventures or similar transactions in the future. For example, in June 2019, we acquired SDI, a navigation systems provider with a scalable, chip-based platform for higher volume gyro applications utilizing Quartz MEMSQMEMS technology. OurThe acquisition of SDI, and any other acquisitions, joint ventures and similar transactions that we may enter into from time to time, involve a number of risks that could harm our business and result in SDI or any other acquired business or joint venture not performing as expected, including:
•problems integrating the acquired operations, personnel, technologies, or products with the existing business and products;
•failure to achieve cost savings or other financial or operating objectives with respect to an acquisition;
•possible adverse short-term effects on our cash flows or operating results, and the use of cash and other resources for the acquisition that might affect our liquidity, and that could have been used for other purposes;
•diversion of management's time and attention from our core business to the acquired business or joint venture;
•potential failure to retain key technical, management, sales, and other personnel of the acquired business or joint venture;
•difficulties in retaining relationships with suppliers and customers of the acquired business, particularly where such customers or suppliers compete with us;
•difficulties in the integration of financial reporting systems, which could cause a delay in the issuance of, or impact the reliability of ourthe consolidated financial statements;
•failure to comply with Section 404 of the Sarbanes-Oxley Act of 2002, including a delay in or failure to successfully integrate these businesses into our internal control over financial reporting;
•insufficient experience with technologies and markets in which the acquired business is involved, which may be necessary to successfully operate and integrate the business;
•reliance upon joint ventures which we do not control;
•subsequent impairment of goodwill and acquired long-lived assets, including intangible assets; and
•assumption of liabilities including, but not limited to, lawsuits, environmental liabilities, regulatory liabilities, tax examinations, and warranty issues.
We may decide that it is in our best interests to enter into acquisitions, joint ventures or similar transactions that are dilutive to earnings per share ("EPS") or that adversely impact margins as a whole. In addition, acquisitions or joint ventures could require investment of significant financial resources and require us to obtain additional equity financing, which may dilute our shareholders' equity, or require us to incur indebtedness.
We expect to consider from time to time further strategic opportunities that may involve acquisitions, dispositions, investments in joint ventures, partnerships, and other strategic alternatives that may enhance shareholder value, any of which may result in the use of a significant amount of our management resources or significant costs, and we may not be able to fully realize the potential benefit of such transactions.
We expect to continue to consider acquisitions, dispositions, investments in joint ventures, partnerships, and other strategic alternatives that may enhance shareholder value. The Strategy and Alternatives Committee of the Board of Directors and our management may from time to time be engaged in evaluating potential transactions and other strategic alternatives. In addition, from time to time, we may engage financial advisors, enter into non-disclosure agreements, conduct discussions, and undertake other actions that may result in one or more transactions. Although there would be uncertainty that any of these activities or discussions would result in definitive agreements or the completion of any transaction, we may devote a significant amount of our management resources to analyzing and pursuing such a transaction, which could negatively impact our operations. In addition, we may incur significant costs in connection with seeking such transactions or other strategic alternatives regardless of whether the transaction is completed. In the event that we consummate an acquisition, disposition, partnership, or other or strategic alternative in the future, we cannot be certain that we would fully realize the potential benefit of such a transaction and cannot predict the impact that such strategic transaction might have on our operations or stock price. We do not undertakeintend to provide updates or make further comments regarding the evaluation of strategic alternatives, unless otherwise required by law.
Our failureIf we are unable to successfully manage the transition of certain of our manufacturing operations from our Beijing facility to a contract manufacturer’sCM’s facility, could harm our business, financial condition, results of operations, and cash flows.flows could be harmed.
In October 2019, we entered into (i)(a) an agreement with Hytera Communications (Hong Kong) Company Limited and Shenzhen Hytera Communications Co., Ltd. (collectively, “Hytera”"Hytera") to transfer and sell to Hytera the equipment that was being used by us to manufacture certain of our CATV modules and transmitters (the "Hytera Asset Purchase Agreement") and (ii)(b) an agreement pursuant to which Hytera agreed to manufacture such CATV modules and transmitters for sale to us, and in August 2021, we entered into agreements with Fastrain pursuant to which (a) we and Hytera agreed to terminate the existing agreements described above, (b) Hytera agreed to transfer to Fastrain the equipment previously sold by us to Hytera, (c) we agreed to transfer and sell to Fastrain the equipment that remained to be transferred pursuant to the Hytera Asset Purchase Agreement along with additional manufacturing equipment owned by us and not covered by the Hytera Asset Purchase Agreement (d) Fastrain agreed to manufacture such CATV modules and transmitters for sale to us. In connection with these agreements, the manufacture of our product lines and sub-assemblies previously manufactured at our Beijing facility is in the process of being relocated to Hytera’sa facility located in Thailand.
This transition has involved and could continue to involve the re-acceptance and requalification of certain of our products by customers, potentially creating a competitive disadvantage for our products. These initiatives can be time-consuming, disruptive to our operations, and costly in the short-term. In addition, restrictions related to the COVID-19 pandemic have negatively
affected the timing of the sale and transfer of certain CATV module and transmitter manufacturing equipment to Hytera and Fastrain, as applicable. Travel into Thailand by our manufacturing engineers to support the transfer has at times been difficult, and customer product qualification processes for products being manufactured in Thailand have been delayed at times due to our customers’ inability to access their facilities to perform testing. The timing and completion of these transfers may be further disrupted as a result of COVID-19, which could delay our recognition of the anticipated benefits of transferring this equipment and could disrupt our manufacturing activities for these products. This transition has also and will continue to cause us to incur costs associated with the shipment of complex manufacturing equipment. If we are unable to manage this transfer smoothly and comprehensively, we could suffer delays, resulting in harm to our reputation with our customers and potentially loss of customers. If we are unable to successfully manage the relocation or initiation of the manufacture of these products by our contract manufacturer,CM, our business, financial condition, results of operations and cash flows could be harmed.
Changes in U.S. and international trade policies, particularly with regard to China, may adversely impact our business and operating results.
The U.S. government has recently taken certain actions with respect to its trade policies, including recently imposed tariffs affecting certain products manufactured in China, and may take further actions with respect to these policies in the future. For example, the U.S. and China have applied tariffs to certain of each other’s exports and announced additional tariffs to be applied in the future to certain of each other’s exports. Certain of our broadband products manufactured by our Chinese affiliate have been included in the tariffs imposed on imports into the U.S. from China, and these products manufactured by our Chinese affiliate may be subject to tariff increases that may be implemented in the future. China has imposed retaliatory tariffs affecting certain products manufactured in the U.S. and imported into China, including our chip products manufactured in the U.S., and other products manufactured by us in the U.S. may be included on lists of products to be targeted by proposed tariff increases that may be implemented by China in the future. The implementation of these tariffs could result in decreased sales of our products manufactured in China and shipped to the U.S. and sales of our products manufactured in the U.S. and shipped to China, which would negatively impact our business.
In addition, it is unknown whether and to what extent new tariffs (or other new laws or regulations) will be adopted that increase the cost of importing products into the U.S., or that might trigger retaliatory action by U.S. trading partners. Further, it is unknown what effect any such new tariffs or retaliatory actions would have on us or our industry and customers. For example, there are risks that the Chinese government may, among other things, require the use of local suppliers, compel companies that do business in China to partner with local companies to conduct business and provide incentives to government-backed local customers to buy from local suppliers. If any new tariffs, legislation and/or regulations are implemented, or if existing trade agreements are renegotiated or if China or other affected countries take retaliatory trade actions, such changes could have a material adverse effect on our business, financial condition, results of operations and cash flows.
We currently have substantial operations in China, which exposes us to risks inherent in doing business in China.
In an effort to keep manufacturing costs down, we currently operate a manufacturing facility and certain operations logistics functions in China. Our China-based activities are subject to greater political, legal, and economic risks than those faced by our other operations. In particular, the political, legal, and economic climate in China (both at the national and regional levels) is extremely volatile and unpredictable. Our ability to operate in China may be adversely affected by changes in, or our failure to comply with, Chinese laws and regulations, such as those relating to taxation, import and export tariffs, environmental regulations, land use rights, intellectual property, labor and employment laws and other matters, which laws and regulations remain underdeveloped and subject to change for political or other reasons, with little or no prior notice. Moreover, the enforceability of applicable existing Chinese laws and regulations is uncertain. For example, since Chinese administrative and court authorities have significant discretion in interpreting and implementing statutory and contract terms, it may be more difficult to evaluate the outcome of administrative and court proceedings and the level of legal protection we would receive. These uncertainties may impede our ability to enforce the contracts we have entered into with our distributors, business partners, customers and suppliers. In addition, protections of intellectual property rights and confidentiality in China may not be as effective as in the U.S. or other countries or regions. All of these uncertainties could limit the legal protections available to us and could materially and adversely affect our business, financial condition, cash flows and results of operations.
Also, if we are found to be, or to have been, in violation of Chinese laws or regulations governing technology import and export, the relevant regulatory authorities have broad discretion in dealing with such violations, including, but not limited to, issuing a warning, levying fines, restricting us from benefiting from these technologies inside or outside of China, confiscating our earnings generated from the import or export of such technology or even restricting our future import and export of any technology.
In addition, we may not obtain the requisite legal permits to continue to operate in China and costs or operational limitations may be imposed in connection with obtaining and complying with such permits. Our business could be adversely harmed by any changes in the political, legal, or economic climate in China, our failure to comply with applicable laws and regulations or our inability to enforce applicable Chinese laws and regulations.
While under certain circumstances we previously were not subject to certain Chinese taxes and were exempt from customs duty assessment on imported components or materials when our finished products were exported from China, we are no longer eligible for such exemptions due to our current Beijing facility being located in a non-economic zone. In addition, we are required to pay income taxes in China subject to certain tax relief. We may become subject to other forms of taxation and duty assessments in China, including import tariffs as described in more detail above, or may be required to pay for export license fees in the future. In the event that we become subject to any increased taxes or new forms of taxation imposed by authorities in China, our results of operations and cash flows could be adversely affected.
Retention of employees in China is a challenge as compared to companies headquartered in China. If our China employee turnover rates are higher than we expect, or we otherwise fail to adequately manage these rates, then our business and results of operations could be adversely affected.
We may have difficulty maintaining adequate management and financial controls over our China operations.
Businesses in China have historically not adopted a western style of management and financial reporting concepts and practices, which includes strong corporate governance, internal controls and computer, financial and other control systems. Moreover, familiarity with accounting principles generally accepted in the United States of America (“U.S. GAAP”) principles and reporting procedures is less common in China. As a consequence and due to our current operations in China, we may have difficulty employing accounting personnel experienced with U.S. GAAP, and we may have difficulty integrating our China-based accounting staff with our U.S.-based finance organization. As a result of these factors, we may experience difficulty in maintaining adequate management and financial controls over our China operations. These difficulties include collecting financial data and preparing financial statements, books of account and corporate records and instituting business practices that meet U.S. public-company reporting requirements. We may, in turn, experience difficulties in implementing and maintaining adequate internal controls as required under Section 404 of the Sarbanes-Oxley Act. If we cannot provide reliable and timely financial reports, our brand, operating results, and the market value of our equity securities could be harmed.
We have a large amount of intercompany balances with our China entities, which may be subject to taxes and penalties when we try to pay them down or collect them.
Payments for goods and services into and out of China are subject to numerous and over-lapping government regulation with respect to foreign exchange controls, banking controls, import and export controls, and taxes. We have been operating in China for an extended period of time and have accumulated significant intercompany balances with our related entities. Our ability to repay or collect these balances may be restricted by Chinese laws and, as a result, we may be unable to successfully pay down or collect on these balances. As a consequence, we may be assessed additional taxes in China if we are unable to claim bad debt deductions or incur debt forgiveness income from the cancellation of these intercompany balances. Additionally, if we are found not to have complied with the various local laws surrounding cross border payments, we may incur penalties and fines for non-compliance. Any such taxes, penalties and/or fines could be significant in amount and, as a result, could have an adverse effect on our financial condition and results of operations, including our cash and cash equivalent balances.
Our products are complex and may take longer to develop and qualify than anticipated and we face lengthy sales and qualification cycles for our new products and, in many cases, must invest a substantial amount of time and money before we receive orders.
We are constantly developing new products and using new technologies in these products. These products often take substantial time to develop because of theirthe complexity, rigorous testing, and qualification requirements and because customer and market requirements can change during the product development or qualification process. Most of our products are tested by current and potential customers to determine whether they meet customer or industry specifications. The length of the qualification process, which can span a year or more, varies substantially by product and customer and, thus, can cause our results of operations and cash flows to be unpredictable. During a given qualification period, we invest significant resources and allocate substantial production capacity to manufacture these new products prior to any commitment to purchase by customers. In addition, it is difficult to obtain new customers during the qualification period as customers are reluctant to expend the resources necessary to qualify a new supplier if they have one or more existing qualified sources. If we are unable to meet applicable specifications or do not receive sufficient orders to profitably use our allocated production capacity, our business, financial condition, results of operations, and cash flows may be adversely affected.
Our historicalHistorical and future budgets for operating expenses, capital expenditures, operating leases, and service contracts are based upon our assumptions as to the future market acceptance of our products. Because of the lengthy lead times required for product development and the changes in technology that typically occur while a product is being developed, it is difficult to accurately estimate customer demand for any given product. If our products do not achieve an adequate level of customer demand, our business, financial condition, results of operations, and cash flows may be adversely affected.
Our products are difficult to manufacture. Our productionProduction could be disrupted and our results of operations and cash flows could suffer if our production yields are low as a result of manufacturing difficulties.
We manufacture many of our wafers and products in our own production facilities. Difficulties in the production process, such as contamination, raw material quality issues, human error, or equipment failure, could cause a substantial percentage of wafers and devices to be nonfunctional. These problems may be difficult to detect at an early stage of the manufacturing process and are often are time-consuming and expensive to correct. Lower-than-expected production yields may delay shipments or result in unexpected levels of warranty claims, either of which could adversely affect our results of operations and cash flows. We have experienced difficulties in achieving planned yields in the past, particularly in pre-production and upon initial commencement of full production volumes, which have adversely affected our gross margins. Because the majority of our manufacturing costs are fixed, achieving planned production yields is critical to our results of operations and cash flows. Changes in manufacturing processes required as a result of changes in product specifications, changing customer needs, and the introduction of new product lines could significantly reduce our manufacturing yields, resulting in low or negative margins on those products. In addition, transitioning to automation in certain manufacturing processes could result in manufacturing delays or significantly reduce our manufacturing yields.
Manufacturing yields depend on a number of factors, including the stability and manufacturability of the product design, manufacturing improvements gained over cumulative production volumes, the quality and consistency of component parts, and the nature and extent of customization requirements by customers. Higher volume demand for more mature designs requiring less customization generally results in higher manufacturing yields than products with lower volumes, less mature designs and requiring extensive customization. Capacity constraints, raw materials shortages, logistics issues, the introduction of new product lines and changes in our customer requirements, manufacturing facilities, or processes or those of our third-party contract manufacturersCMs and component suppliers have historically caused, and may in the future cause, significantly reduced manufacturing yields, negatively impacting the gross margins on, and our production capacity for, those products. Our abilityAbility to maintain sufficient manufacturing yields is particularly important with respect to certain products we manufacture, as a result of the long manufacturing process. Moreover, an increase in the rejection and rework rate of products during the quality control process
before, during, or after manufacture would result in lower yields, gross margins, and production capacity. Finally, manufacturing yields and margins can also be lower if we receive and inadvertently use defective or contaminated materials from our suppliers.
Also, weWe also have substantial risk of interruption in manufacturing resulting from fire, natural disaster, equipment failures, acts of government, or similar events, because we manufacture most of our products using a few facilities, and do not have back-up facilities available for manufacturing these products. We could also incur significant costs to repair and/or replace products that are defective and, in some cases, costly product redesigns and/or rework may be required to correct a defect. Additionally, any defect could adversely affect our reputation and result in the loss of future orders.
Some of the capital equipment used in the manufacture of our products have been developed and made specifically for us, may not be readily available from multiple vendors, and would be difficult to repair or replace if they were to become damaged or stop working. If any of these suppliers were to experience financial difficulties or go out of business, or if there were any damage to, or a breakdown of our manufacturing equipment at a time when we are manufacturing commercial quantities of our products, our business, financial condition, results of operations, and cash flows could be adversely affected.
If we do not keep pace with rapid technological change, our products may not be competitive.
We compete in markets that are characterized by rapid technological change, frequent new product introductions, changes in customer requirements, evolving industry standards, continuous improvement in products, and the use of our existing products in new applications. We may not be able to develop the underlying core technologies necessary to create new products and enhancements to our existing products at the same rate as or faster than our competitors, to develop products that effectively compete with competitors’ products used in new applications, such as remote physical layer, (“remote PHY”), or to license the technology from third parties that is necessary for our products. Product development delays may result from numerous factors, including:
•changing product specifications and customer requirements;
•unanticipated engineering complexities;
•expense reduction measures we have implemented and others we may implement;
•difficulties in hiring and retaining necessary technical personnel; and
•difficulties in allocating engineering resources and overcoming resource limitations.
We cannot be certain that we will be able to identify, develop, manufacture, market, or support new or enhanced products successfully, if at all, or on a timely, cost effective, or repeatable basis. Our futureFuture performance will depend on our successful development and introduction of, as well as market acceptance of, new and enhanced products that address market changes, as well as current and potential customer requirements and our ability to respond effectively to product announcements by competitors, technological changes, or emerging industry standards. Because it is generally not possible to predict the amount of time required and the costs involved in achieving certain research, development, and engineering objectives, actual development costs may exceed budgeted amounts and estimated product development schedules may be extended. If we are unable to develop, manufacture, market, or support new or enhanced products successfully, or incur budget overruns or delays in our research and development efforts, our business, financial condition, results of operations, and cash flows may be adversely affected.
Spending to develop and improve our technology may adversely impact our financial results.
We intend to increase our capital expenditures compared to recent periods, subject to generation of sufficient cash from operations. In addition, we may need to increase our research and development and/or capital expenditures and expenses above our historical run-rate model in order to attempt to improve our existing technology and develop new technology. Increasing ourcapital expenditures or investments in research and development of technology could cause our cost structure to fall out of alignment with demand for our products, which would have a negative impact on our financial results. If we are unable to fund these types of expenditures, we may be unable to improve our technology or develop new technologies, which may adversely affect our business, financial condition, results of operations, and cash flows. Further, our research and development programs may not produce successful results, and our new products and services may not achieve market acceptance, create additional revenue, or become profitable, which could materially harm our business, prospects, financial results, and liquidity.
The competitive and rapidly evolving nature of our industries and pressure from competitors with greater resources has in the past resulted in and is likely in the future to result in reductions in our product prices and periods of reduced demand for our products.
We face substantial competition from a number of companies, many of which have greater financial, marketing, manufacturing, and technical resources than we do. Larger-sized competitors often spend more on research and development, which could give those competitors an advantage in meeting customer demands and introducing technologically innovative products before we do. We expect that existing and new competitors will continue to improve the design of their existing products and will introduce new products with enhanced performance characteristics.
The introduction of new products and more efficient production of existing products by our competitors have resulted, and are likely in the future to result in, price reductions, increases in expenses, and reduced demand for our products. In addition, some of our competitors may be willing to provide their products at lower prices, accept a lower profit margin, or spend more capital in order to obtain or retain business. Competitive pressures have required us to reduce the prices of some of our products. These competitive forces could diminish our market share and gross margins, resulting in an adverse effect on our business, financial condition, results of operations, and cash flows.
New competitors may also enter our markets, including some of our current and potential customers who may attempt to integrate their operations by producing their own components and subsystems or acquiring one of our competitors,a competitor, thereby reducing demand for our products. In addition, rapid product development cycles, increasing price competition due to maturation of technologies, the emergence of new competitors in Asia with lower cost structures, and industry consolidation resulting in competitors with greater financial, marketing and technical resources could result in lower prices or reduced demand for our products, which could have an adverse effect on our business, financial condition, results of operations, and cash flows.
Expected and actual introductions of new and enhanced products may cause our customers to defer or cancel orders for existing products and may cause our products to become obsolete. A slowdown in demand for existing products ahead of a new product introduction could result in a write-down in the value of inventory on hand related to existing products. We have in the past experienced a slowdown in demand for existing products and delays in new product development and such delays may occur in the future. To the extent customers defer or cancel orders for existing products due to a slowdown in demand or in anticipation of a new product release, or if there is any delay in development or introduction of our new products or enhancements of our products, our business, financial condition, results of operations, and cash flows could be adversely affected.
A failure to attract and retain managerial, technical, and other key personnel could reduce our revenue and our operational effectiveness.
Our futureFuture success depends, in part, on ourthe ability to attract and retain certain key personnel, including scientific, operational, financial, and managerial personnel. In addition, our technical personnel represent a significant asset and serve as the source of our technological and product innovations. The competition for attracting and retaining key employees (especially scientists, technical personnel, and senior managers, and executives) is intense. Because of this competition for skilled employees, we may be unable to retain our existing personnel or attract additional qualified employees in the future to keep up with our business demands and changes, and our business, financial condition, results of operations, and cash flows could be adversely affected. The risks involved in recruiting and retaining these key personnel may be increased by our historical lack of profitability, the volatility of our stock price, and the perceived effect of previously implemented reductions in forceworkforce and other cost reduction efforts.
If spending for CATV and optical communications networks declines, our revenues and financial performance may decline.
A material portion of our revenues depend on continued capital investment in CATV and global communications networks infrastructure and on continued demand for high-bandwidth, high-speed communications networks, and the ability of original equipment manufacturers to meet this demand. Spending on CATV and communications networks is limited by several factors, including limited investment resources, uncertainty regarding the long-term evolution and sustainability of service provider business models, and a changing regulatory environment. We cannot be certain that demand for bandwidth-intensive content will continue to grow at the same pace in the future or that communications service providers will continue to increase spending to meet such demand. If expectations for growth of CATV and communications networks and bandwidth consumption are not realized and investment in CATV and communications networks does not grow as anticipated, our revenues, results of operations, and gross margins could be harmed.
Our abilityAbility to achieve operational and material cost reductions and to realize production efficiencies for our operations is critical to our ability to achieve long-term profitability.
We have implemented a number of operational and material cost reductions and productivity improvement initiatives, which are intended to reduce our cost structure at both the cost of revenue and the operating expense levels. Cost reduction initiatives often involve the re-design of our products, which requires our customers to accept and qualify the new designs, potentially creating
a competitive disadvantage for our products. These initiatives can be time-consuming, disruptive to our operations, and costly in the short-term. Successfully implementing these and other cost-reduction initiatives throughout our operations is critical to our future competitiveness and ability to achieve long-term profitability. However, we cannot be certain that these initiatives will be successful in creating profit margins sufficient to sustain our current operating structure and business.
Our operatingOperating results could be harmed if we are unable to obtain timely deliveries of sufficient materials, components, or services of acceptable quality from sole or limited sources, of materials, components, or services, or if the prices of materials, components, or services for which we do not have alternative sources increase.
We currently obtain materials, components, and services used in our products from limited or sole sources. We generally do not carry significant inventories of any raw materials. The reliance on a sole supplier, single qualified vendor, or limited number of suppliers could result in delivery or quality problems or reduced control over product pricing, reliability, and performance. For example, during the fiscal year ended September 30, 2021, COVID-19 driven component shortages and delays required us to source critical components from alternative sources and, in some cases, to design in alternative parts and qualify them with customers on short schedules, and COVID-19 related staffing shortages at the Thailand facility of our CM negatively affected production levels of our CATV Laser and Transmitter products by the manufacturer. Because we often do not account for a significant part of our suppliers’ businesses, we may not have access to sufficient capacity from these suppliers in periods of high demand. In addition, since we generally do not have guaranteed supply arrangements with our suppliers, we risk serious disruption to our operations if an important supplier terminates product lines, changes business focus, or goes out of business, and we may need large end of life purchases when a sole source supplier is ceasing manufacturing of required components. Because some of these suppliers are located overseas, we may be faced with higher costs of purchasing these materials if the U.S. dollar weakens against other currencies, or if import tariffs are imposed on these materials. If we were to change any of our limited or sole source suppliers, we would be required to re-qualify each new supplier. Re-qualification could prevent or delay product shipments that could adversely affect our results of operations and cash flows. In addition, our reliance on these suppliers may adversely affect our production if the components vary in quality or quantity. If we are unable to obtain timely deliveries of sufficient components of acceptable quality or if the prices of components for which we do not have alternative sources increase, our business, financial condition, results of operations, and cash flows could be materially adversely affected.
If our contract manufacturersCMs fail to deliver qualified products at reasonable prices and on a timely basis, our business, financial condition, results of operations, and cash flows could be adversely affected.
We use contract manufacturersCMs as a less-expensive alternative to our manufacturing ofmanufacture certain products. Contract manufacturersCMs in Asia currently manufacture a significant portion of our CATV fiber opticsLaser and Transmitter products and components and a CM in the U.S. currently manufactures a significant portion of our Defense Optoelectronics products. WeIn some cases, we supply inventory to our contract manufacturers,CMs, and we bear the risk of loss, theft, or damage to our inventory while it is held in their facilities.
If these contract manufacturersCMs do not fulfill their obligations to us, or if we do not properly manage these relationships and the transition of production to these contract manufacturers, ourCMs, existing customer relationships may suffer. In addition, by undertaking these activities, we run the risk that the reputation and competitiveness of our products and services may deteriorate as a result of the reduction of our ability to oversee and control the assembly process, quality, and delivery schedules. If we fail to manage our relationship with our contract manufacturers,CMs, or if any of the contract manufacturersCMs experience financial difficulty, delays, disruptions, capacity constraints, or quality control problems in their operations, ourthe ability to ship products to our customers could be impaired and our competitive position and reputation could be harmed.
The use of contract manufacturersCMs located outside of the U.S. also subjects us to the following additional risks that could significantly impair ourthe ability to source our contract manufacturing requirements internationally, including:
•unexpected changes in regulatory requirements;
•legal uncertainties regarding liability, tariffs, and other trade barriers;
•inadequate protection of intellectual property in some countries;
•greater incidence of shipping delays;
•greater difficulty in overseeing manufacturing operations;
•greater difficulty in hiring talent needed to oversee manufacturing operations;
•potential political and economic instability and natural disasters;
•potential adverse actions by the U.S. government pursuant to its stated intention to reduce the loss of U.S. jobs;
•trade and travel restrictions; and
•the outbreak of infectious diseases which could result in travel restrictions or the closure of the facilities of our contract manufacturers.CMs.
Any of these factors could significantly impair ourthe ability to source our contract manufacturing requirements internationally. PriorIn some cases, prior to our customers accepting products manufactured at our contract manufacturers,CMs, they must qualify the product and manufacturing processes. The qualification process determines whether the product manufactured at our CM achieves our customers' quality,
performance, and reliability standards. The qualification process can be lengthy and expensive, with no guarantee that any particular product qualification process will lead to profitable product sales. The qualification process determines whether the product manufactured at our contract manufacturer achieves our customers' quality, performance,sales, and reliability standards. Our expectations as to the time periods required to qualify a product line and ship products in volumes to our customers may be erroneous. Delays in qualification can impair our expected timing of the transfer of a product line to our contract manufacturerCM and may impair our expected amount of sales of the affectedeffected products. Any of these uncertainties or delays could adversely affect our operating results and customer relationships. For example, during the fiscal year ended September 30, 2020, customer product qualification processes for our CATV Laser and Transmitter products that were beginning to be manufactured at a CM’s facility in Thailand were delayed due to our customers’ inability to access their facilities to perform testing due to COVID-19, causing delays in the ability to have such products manufactured from this location and increasing costs to produce these products.
In addition, our contract manufacturerscertain CMs may terminate our agreements with them upon prior notice to us or immediately for reasons such as if we become insolvent or if we fail to perform a material obligation under the agreements. If we are required to change contract manufacturersCMs or assume internal manufacturing operations for any reason, including the termination of one of our contracts, we will likely suffer manufacturing and shipping delays, lost revenue, increased costs, and damage to our customer relationships, any of which could harm our business, financial condition, results of operations, and cash flows.
We participate in vendor managed inventoryVMI programs for the benefit of certain of our customers, which could result in increased inventory levels and/or decreased visibility into the timing of sales.
Certain of our significant customers have implemented a supply chain management tool called vendor managed inventory (“VMI”("VMI") that requires us to assume responsibility for maintaining an agreed upon level of consigned inventory at the customer’s location or at a third-party logistics provider, based on the customer’s demand forecast. Notwithstanding the fact that the supplierwe or our CM builds and ships the inventory, the customer does not purchase the consigned inventory until the inventory is drawn or pulled from the customer or third-party location to be used in the manufacture of the customer’s product. Though the consigned inventory may be at the customer’s or third-party logistics provider’s physical location, it remains inventory owned by the supplierus until the inventory is drawn or pulled, which is the time at which the sale takes place. In addition, certain of our customers require us to maintain agreed levels of product inventory at our own locations. Our participationParticipation in VMI programs and our commitment to other product inventory requirements at our own locations has resulted in our experiencing higher levels of inventory than we might otherwise and has decreased our visibility into the timing of when our finished goods will ultimately result in revenue-generating sales.
Such VMI programs and other inventory requirements increase the likelihood that estimates of our customers’ requirements that prove to be greater than our customers’ actual purchases could result in surplus inventory, and we could be required to record charges for obsolete or excess inventories. If we are unable to effectively manage our customers’ VMI programs or other inventory requirements, our business, financial condition, results of operations, and cash flows may be adversely affected.
It could be discovered that our products contain defects that may cause us to incur significant costs, divert management's attention, result in a loss of customers, and result in product liability claims.
Our products are complex and undergo quality testing and formal qualification by our customers and us. However, defects may occur from time to time. Our customers'Customers' testing procedures involve evaluating our products under likely and foreseeable failure scenarios and over varying amounts of time. For various reasons, such as the occurrence of performance problems that are unforeseeable in testing or that are detected only when products age or are operated under peak stress conditions, our products may fail to perform as expected long after customer acceptance. Failures could result from faulty components or design, problems in manufacturing, or other unforeseen reasons. For the majority of our products, we provide a product warranty of one year or less from date of shipment. For select customers, we provide extended warranties beyond our normal product warranty period for specified failures on a case-by-case basis. As a result, we could incur significant costs to repair or replace defective products under warranty, particularly when such failures occur in installed systems. We have experienced failures in the past and will continue to face this risk going forward, as our products are widely deployed throughout the world in multiple demanding environments and applications. In addition, we may in certain circumstances, honor warranty claims after the warranty has expired or for problems not covered by warranty in order to maintain customer relationships. Any significant product failure could result in product recalls, product liability claims, lost future sales of the affected product, and other products, as well as customer relations problems, litigation, and damage to our reputation.
In addition, our products are typically embedded in, or deployed in conjunction with, our customers' products, which incorporate a variety of components, modules, and subsystems and may be expected to interpolate with modules and subsystems produced by third parties. As a result, not all defects are immediately detectable and when problems occur, it may
be difficult to identify the source of the problem. These problems may cause us to incur significant damages or warranty and repair costs, divert the attention of our engineering personnel from our product development efforts, and cause significant customer relations problems or loss
of customers, all of which would harm our business. The occurrence of any defects in our products could also give rise to liability for damages caused by such defects. Although we carry product liability insurance to mitigate this risk, insurance may not adequately or entirely cover costs that may arise from defects in our products or otherwise, nor will it protect us from reputational harm that may result from such defects. Costs incurred in connection with product recalls or warranty or product liability claims may adversely affect our business, financial condition, results of operations, and cash flows.
Shifts in industry-wide demands and inventories could result in significant inventory write-downs.
The life cycles of some of our products depend heavily upon the life cycles of the end products into which our products are designed. Products with short life cycles require us to manage production and inventory levels closely. We evaluate our ending inventories on a quarterly basis for excess quantities, impairment of value, and obsolescence. This evaluation includes analysis of sales levels by product and projections of future demand based upon input received from our customers, sales team, and management. If inventories on hand are in excess of demand, or if they are generally greater than 12-months old, appropriate write-downs may be recorded. In addition, we write off inventories that are considered obsolete based upon changes in customer demand, manufacturing process changes that result in existing inventory obsolescence, or new product introductions which eliminate demand for existing products. Remaining inventory balances are adjusted to approximate the lower of our manufacturing cost or net realizable market value.
If future demand or market conditions are less favorable than our estimates, inventory write-downs may be required. We cannot be certain that obsolete or excess inventories, which may result from unanticipated changes in the estimated total demand for our products and/or the estimated life cycles of the end products into which our products are designed, will not affect us beyond the inventory charges that we have already taken.
The types of sales contracts we use in the markets we serve subject us to unique risks in each of those markets.
We generally do not have long-term supply contracts with our customers, we typically sell our products pursuant to purchase orders with short lead times, and even where we do have long-term supply contracts, our customers are typically not obligated to purchase any minimum amount of our products. As a result, in most cases our customers could stop purchasing our products at any time, and we must fulfill orders in a timely manner to keep our customersthem satisfied.
Risks associated with an absence of long-term purchase commitments with our customers include the following:
our •customers can stop purchasing our products at any time without penalty;
our •customers may purchase products from our competitors; and
our •customers are not required to make minimum purchases.
These risks are increased by the fact that our customers in this market areinclude large, sophisticated companies whichthat have considerable purchasing power and control over their suppliers. If we are unable to fulfill these orders in a timely manner, it is likely that we will lose sales and customers.
Fixed-priceThe majority of development contracts are for a fixed price, and fixed-price development work inherently has more uncertainty than production contracts and, therefore, entails more variability in estimates of the cost to complete the work. Many of these development programs have very complex designs. As technical or quality issues arise, we may experience schedule delays and adverse cost impacts, which could increase our estimated cost to perform the work, either of which could adversely affect our results of operations. Some fixed-price development contracts include initial production units in their scope of work. Successful performance of these contracts depends on ourthe ability to meet production specifications and delivery rates. If we are unable to perform and deliver tomeet these contract requirements, our contract pricerevenue from these contracts could be reduced through the incorporation of liquidated damages, termination of the contract could be terminated for default, orand we could be subject to other financially significant consequences. Management uses itsWe use our best judgment to estimate the cost to perform the work and the price we will eventually be paid on fixed-price development programs. While we believe the cost and price estimates incorporated inused to prepare the consolidated financial statements are appropriate, future events could result in either favorable or unfavorable adjustments to those estimates.estimates which in turn would adversely affect results of operations.
We are subject to risks associated with the availability and coverage of insurance.
For certain risks, we do not maintain insurance coverage because of cost or availability. Because we retain some portion of our insurable risks, and in some cases self-insure completely, unforeseen or catastrophic losses in excess of insured limits may have an adverse effect on our business, financial condition, results of operations, and cash flows.
Risks Related to International Sales and Operations
Changes in U.S. and international trade policies, particularly with regard to China, may adversely impact our business and operating results.
The U.S. government has recently taken certain actions with respect to its trade policies, including recently imposed tariffs affecting certain products manufactured in China, and may take further actions with respect to these policies in the future. For example, the U.S. and China have applied tariffs to certain of each other’s exports. Certain of our Broadband products manufactured by our Chinese subsidiary have been included in the tariffs imposed on imports into the U.S. from China, and these products manufactured by our Chinese subsidiary may be subject to tariff increases that may be implemented in the future. China has imposed retaliatory tariffs affecting certain products manufactured in the U.S. and imported into China, including our chip products manufactured in the U.S., and other products manufactured by us in the U.S. may be included on lists of products to be targeted by proposed tariff increases that may be implemented by China in the future. The implementation of these tariffs could result in decreased sales of our products manufactured in China and shipped to the U.S. and sales of our products manufactured in the U.S. and shipped to China, which would negatively impact our business.
In addition, it is unknown whether and to what extent new tariffs (or other new laws or regulations) will be adopted that increase the cost of importing products into the U.S., or that might trigger retaliatory action by U.S. trading partners. Further, it is unknown what effect any such new tariffs or retaliatory actions would have on us or our industries and customers. For example, there are risks that the Chinese government may, among other things, require the use of local suppliers, compel companies that do business in China to partner with local companies to conduct business and provide incentives to government-backed local customers to buy from local suppliers. If any new tariffs, legislation, and/or regulations are implemented, or if existing trade agreements are renegotiated or if China or other effected countries take retaliatory trade actions, such changes could have a material adverse effect on our business, financial condition, results of operations, and cash flows.
We currently have substantial operations in China, which exposes us to risks inherent in doing business in China.
In an effort to keep manufacturing costs down, we currently operate a manufacturing facility and certain operations logistics functions in China. Our China-based activities are subject to greater political, legal, and economic risks than those faced by our other operations. In particular, the political, legal, and economic climate in China (both at the national and regional levels) is extremely volatile and unpredictable. Our ability to operate in China may be adversely affected by changes in, or failure to comply with, Chinese laws and regulations, such as those relating to taxation, import and export tariffs, environmental regulations, land use rights, intellectual property, labor and employment laws, and other matters, which laws and regulations remain underdeveloped and subject to change for political or other reasons, with little or no prior notice. Moreover, the enforceability of applicable existing Chinese laws and regulations is uncertain. For example, since Chinese administrative and court authorities have significant discretion in interpreting and implementing statutory and contract terms, it may be more difficult to evaluate the outcome of administrative and court proceedings and the level of legal protection we would receive. These uncertainties may impede the ability to enforce the contracts we have entered into with distributors, business partners, customers, and suppliers. In addition, protections of intellectual property rights and confidentiality in China may not be as effective as in the U.S. or other countries or regions. All of these uncertainties could limit the legal protections available to us and could materially and adversely affect our business, financial condition, cash flows, and results of operations.
Also, if we are found to be, or to have been, in violation of Chinese laws or regulations governing technology import and export, the relevant regulatory authorities have broad discretion in dealing with such violations, including, but not limited to, issuing a warning, levying fines, restricting us from benefiting from these technologies inside or outside of China, confiscating our earnings generated from the import or export of such technology or even restricting our future import and export of any technology.
In addition, we may not obtain the requisite legal permits to continue to operate in China and costs or operational limitations may be imposed in connection with obtaining and complying with such permits. Our business could be adversely harmed by any changes in the political, legal, or economic climate in China, failure to comply with applicable laws and regulations or inability to enforce applicable Chinese laws and regulations.
While under certain circumstances we previously were not subject to certain Chinese taxes and were exempt from customs duty assessment on imported components or materials when our finished products were exported from China, we are no longer eligible for such exemptions due to our current Beijing facility being located in a non-economic zone. In addition, we are required to pay income taxes in China subject to certain tax relief. We may become subject to other forms of taxation and duty
assessments in China, including import tariffs as described in more detail above, or may be required to pay for export license fees in the future. In the event that we become subject to any increased taxes or new forms of taxation imposed by authorities in China, results of operations and cash flows could be adversely affected.
Retention of employees in China is a challenge as compared to companies headquartered in China. If our China employee turnover rates are higher than we expect, or we otherwise fail to adequately manage these rates, then our business and results of operations could be adversely affected.
We may have difficulty maintaining adequate management and financial controls over our China operations.
Businesses in China have historically not adopted a western style of management and financial reporting concepts and practices, which includes strong corporate governance, internal controls, and computer, financial, and other control systems. Moreover, familiarity with accounting principles generally accepted in the United States of America (“U.S. GAAP”) and reporting procedures is less common in China. As a consequence, and due to our current operations in China, we may have difficulty employing accounting personnel experienced with U.S. GAAP, and we may have difficulty integrating our China-based accounting staff with our U.S.-based finance organization. As a result of these factors, we may experience difficulty in maintaining adequate management and financial controls over our China operations. These difficulties include collecting financial data and preparing financial statements, books of account, and corporate records and instituting business practices that meet U.S. public-company reporting requirements. We may, in turn, experience difficulties in implementing and maintaining adequate internal controls as required under Section 404 of the Sarbanes-Oxley Act. If we cannot provide reliable and timely financial reports, our brand, operating results, and the market value of our equity securities could be harmed.
We have a large amount of intercompany balances with our China entities, which may be subject to taxes and penalties when we try to pay them down or collect them.
Payments for goods and services into and out of China are subject to numerous and over-lapping government regulation with respect to foreign exchange controls, banking controls, import and export controls, and taxes. We have been operating in China for an extended period of time and have accumulated significant intercompany balances with related entities. Ability to repay or collect these balances may be restricted by Chinese laws and, as a result, we may be unable to successfully pay down or collect on these balances. As a consequence, we may be assessed additional taxes in China if we are unable to claim bad debt deductions or incur debt forgiveness income from the cancellation of these intercompany balances. Additionally, if we are found not to have complied with the various local laws surrounding cross border payments, we may incur penalties and fines for non-compliance. Any such taxes, penalties, and/or fines could be significant in amount and, as a result, could have an adverse effect on our financial condition and results of operations, including cash and cash equivalent balances.
We have significant international sales, which expose us to additional risks and uncertainties.
For the fiscal years ended September 30, 2019, 20182021, 2020 and 2017,2019, sales to customers located outside the U.S. accounted for approximately 21%12%, 19%17%, and 20%21%, respectively, of our annual consolidated revenue, with revenue assigned to geographic regions based on our customers'customers’ billing address. Sales to customers in Asia represent the majority of our international sales. We believe that international sales will continue to account for a significant percentage of our revenue as we seek international expansion opportunities. In addition, certain of our sales to customers with a U.S. billing address may be physically shipped to a location outside of the U.S. Our internationalInternational sales and operations are subject to a number of material risks, including, but not limited to:
•political and economic instability or changes in U.S. government policy with respect to thesethe foreign countries where customers are located may inhibit export of our products and limit potential customers’ access to U.S. dollars in a country or region in which those potential customers are located;
•we may experience difficulties in enforcing our legal contracts or the collecting of foreign accounts receivable in a timely manner and we may be forced to write off these receivables;
•tariffs and other barriers may make our products less cost competitive;competitive or may reduce gross margin on these products;
•the laws of certain foreign countries may not adequately protect our trade secrets and intellectual property or may be burdensome to comply with;
•potentially adverse tax consequences to our customers may damage our cost competitiveness;
•customs, import/export, and other regulations of the countries in which we do business may adversely affect our business;
•different technical standards or requirements, such as country or region-specific requirements to eliminate the use of lead, which we may incorporate into certain products, could prevent us from selling these products in these regions;
•currency fluctuations may make our products less cost competitive, affecting overseas demand for our products or otherwise adversely affecting our business; and
•language and other cultural barriers may require us to expend additional resources competing in foreign markets or hinder ourthe ability to effectively compete.
Negative developments in one or more countries or regions in which we operate or sell our products could result in a reduction in demand for our products, the cancellation or delay of orders already placed, difficulties in producing and delivering our products, threats to our intellectual property, difficulty in collecting receivables, or a higher cost of doing business, any of which could negatively impact our business, financial condition, cash flows, and results of operations. In addition, we may be exposed to legal risks under the laws of the countries outside the U.S. in which we do business, as well as the laws of the U.S. governing our business activities in those other countries, such as the U. S.U.S. Foreign Corrupt Practices Act ("FCPA").
Risks Related to Intellectual Property Rights, Litigation, and Cybersecurity
Failure to obtain or maintain the right to use certain intellectual property may adversely affect our business, financial condition, results of operations, and cash flows.
Our industries are characterized by frequent litigation regarding patent and other intellectual property rights. From time to time we have received, and may receive in the future, notice of claims of infringement of other parties’ proprietary rights and licensing offers to commercialize third party patent rights. Numerous patents in our industries are held by others, including competitors and certain academic institutions. Competitors may seek to gain a competitive advantage, or other third parties may seek an economic return on their intellectual property portfolios, by making infringement claims against us. We cannot be certain that:
•infringement claims (or claims for indemnification resulting from infringement claims) will not be asserted against us or that such claims will not be successful;
•future assertions will not result in an injunction against the sale of infringing products, which could require us to cease the manufacture, use or sale of the infringing products, processes, or technology and expend significant resources to develop non-infringing technology, adversely affecting our business, results of operations, and cash flows;
•any patent owned or licensed by us will not be invalidated, circumvented, or challenged; or
•we will not be required to obtain licenses or pay substantial damages for past, present, and future use of the infringing technology, the expense of which may adversely affect results of operations and cash flows.
For example, in June 2018, Phoenix commenced an arbitration against us with the American Arbitration Association ("AAA") in New York and a special proceeding against us in the New York Supreme Court, Commercial Division. Please see the disclosures in Note 11 - Commitments and Contingencies in the Notes to Consolidated Financial Statements for additional information regarding these proceedings.
In addition, effective copyright and trade secret protection may be unavailable or limited in certain foreign jurisdictions. Litigation, which could result in substantial cost and diversion of resources, may be necessary to defend our rights or defend us against claimed infringement of the rights of others. In certain circumstances, our intellectual property rights associated with government contracts may be limited.
If we fail to protect, or incur significant costs in defending, our intellectual property and other proprietary rights, our business and results of operations could be materially harmed.
Success depends to a significant degree on the ability to protect our intellectual property and other proprietary rights. We rely on a combination of patent, trademark, trade secret, and unfair competition laws, as well as license agreements and other contractual provisions, to establish and protect our intellectual property and other proprietary rights. We have applied for patent registrations in the U.S. and selected international jurisdictions, most of which have been issued. We cannot guarantee that pending applications will be approved by the applicable governmental authorities. Moreover, existing and future patents and trademarks may not be sufficiently broad to protect our proprietary rights or may be held invalid or unenforceable in court. Failure to obtain patent registrations or a successful challenge to our registrations in the U.S. or other foreign countries may limit the ability to protect the intellectual property rights that these applications and registrations are intended to cover.
We also attempt to protect our intellectual property, including our trade secrets and know-how, through the use of trade secret and other intellectual property laws, as well as contractual provisions. We enter into confidentiality and invention assignment agreements with employees and independent consultants. We also use non-disclosure agreements with other third parties who
may have access to our proprietary technologies and information. Such measures, however, provide only limited protection, and we cannot be certain that our confidentiality and non-disclosure agreements will not be breached, especially after employees or those of our CMs end their employment or engagement with us or with them, and that our trade secrets will not otherwise become known by competitors or that we will have adequate remedies in the event of unauthorized use or disclosure of proprietary information. Unauthorized third parties may try to copy or reverse engineer our products or portions of our products, otherwise obtain and use our intellectual property, or may independently develop similar or equivalent trade secrets or know-how. If we fail to protect our intellectual property and other proprietary rights, or if such intellectual property and proprietary rights are infringed or misappropriated, we could lose our competitive advantage and our business, results of operations, financial condition, and cash flows could be materially harmed.
Policing unauthorized use of our technology is difficult, and we cannot be certain that the steps we have taken will prevent the misappropriation, unauthorized use, or other infringement of our intellectual property rights. Further, we may not be able to effectively protect our intellectual property rights from misappropriation or other infringement in foreign countries where we have not applied for patent protections, and where effective patent, trademark, trade secret, and other intellectual property laws may be unavailable, or may not protect our proprietary rights as fully as U.S. law.
In the future, we may need to take legal actions to prevent third parties from infringing upon or misappropriating our intellectual property or from otherwise gaining access to our technology. Protecting and enforcing our intellectual property rights and determining their validity and scope could result in significant litigation costs and require significant time and attention from our technical and management personnel, which could significantly harm our business. The availability of financial resources may limit the ability to commence or defend such litigation. In addition, we may not prevail in such proceedings. An adverse outcome of such proceedings may reduce our competitive advantage or otherwise harm our business, financial condition, results of operations, and cash flows.
We may be obligated to indemnify customers and vendors for claims that our intellectual property infringes the rights of others, which may result in substantial expense to us.
We may be required to indemnify customers or vendors for intellectual property claims made against them for products incorporating our technology. As such, claims against customers and vendors may require us to incur substantial expenses, such as legal expenses, damages for past infringement, or royalties for future use. Future indemnity claims could adversely affect business relationships and result in substantial costs to us.
We face certain litigation risks that could harm our business.
We may become subject to various legal proceedings and claims that arise in or outside the ordinary course of business. The results of legal proceedings are difficult to predict. Moreover, complaints that may be filed against us may not specify the amount of damages that plaintiffs seek, and we therefore may be unable to estimate the possible range of damages that might be incurred should these lawsuits be resolved against us. If any litigation is resolved against us, we could be subject to substantial damages. Thus, an unfavorable outcome or settlement of one or more lawsuits may have an adverse effect on our business, financial condition, results of operations, and cash flows. Even if litigation is not resolved against us, the uncertainty and expense associated with unresolved lawsuits could seriously harm our business, financial condition, and reputation. Litigation is costly, time-consuming and disruptive to normal business operations.
Costs of defending litigation have been significant in the past, may continue, and may not be covered by our insurance policies. The defense of litigation could also result in diversion of management's time and attention away from business operations, which could harm our business.
We could be subject to legal consequences if we fail to comply with the Modified Partial Final Award issued in connection with the Phoenix legal proceedings.
In the Interim Award incorporated by reference into the Modified Partial Final Award (in each case as defined in the disclosures in Note 11 – Commitments and Contingencies in the Notes to Consolidated Financial Statements), the arbitrator determined and ordered that we are required to pay Phoenix a royalty of 7.5% of the sale price on (a) future customer payments for certain of our product contracts previously entered into at the time the Interim Award was issued and (b) customer payments for future sales of any product using any Deemed Trade Secret (as defined in the disclosures in Note 11 – Commitments and Contingencies in the Notes to Consolidated Financial Statements), in each case payable in a single lump sum within one month of completion of the calendar quarter in which payment has been received from the customer, and we are required to concurrently submit to Phoenix a written report that sets forth the calculation of the amount of the royalty payment in a form
similar to previous royalty reports, provided that following the first $1.0 million of royalty payments on our EMP-1 product only, inclusive of payments made to date, we are required to pay to Phoenix a royalty of 2.25% of the sale price (net of any warranty work, returns, rebates, discounts, or credits) with respect to subsequent sales of our EMP-1 product. We are required to continue to make royalty payments in this manner until such time as we have in good faith determined, and can so document, that we have completely ceased use of the Deemed Trade Secrets, and must provide notice of this determination to Phoenix. It is possible that additional legal proceedings will follow if we attempt to provide this notice to Phoenix, which would require us to incur additional costs and divert management’s attention. If we fail to comply with these obligations, we could be subject to additional claims, penalties, or judgments, which could harm our business, financial condition, results of operations, and cash flows. In addition, we could be subject to significant legal costs and expenses in connection with the interpretation of certain of the obligations pursuant to the Interim Award, which could harm our business, financial condition, results of operations, and cash flows.
Our business and operations could be adversely impacted in the event of a failure or security breach of our information technology infrastructure.
We rely upon the capacity, reliability, and security of our information technology hardware and software infrastructure and the ability to expand and update this infrastructure in response to changing needs. We are constantly updating our information technology infrastructure. Although we have a disaster recovery plan, any failure to manage, expand, and update our information technology infrastructure or any failure in the operation of this infrastructure could harm our business.
The secure maintenance of this information is critical to our business and reputation. Despite implementation of security measures, systems are vulnerable to damages from computer viruses, computer denial-of-service attacks, worms, and other malicious software programs or other attacks, covert introduction of malware to computers and networks, unauthorized access, including impersonation of unauthorized users, efforts to discover and exploit any security vulnerabilities or securities weaknesses, and other similar disruptions. These types of attacks have increased, in general, as more businesses implement remote working environments. Our business is also subject to break-ins, sabotage, and intentional acts of vandalism by third parties as well as intentional and unintentional acts by employees or other insiders with access privileges. Customers’ network and storage applications may be subject to similar disruptions. It is often difficult to anticipate or immediately detect such incidents and the damage caused by such incidents. Data breaches and any unauthorized access or disclosure of information, employee information, or intellectual property could compromise our intellectual property, trade secrets, and other sensitive business information, any of which could result in legal action against us, exposure of our intellectual property to competitors, damages, fines, and other adverse effects. A data security breach could also lead to public exposure of personal information of employees, customers, and others. Any such theft, loss, or misuse of personal data collected, used, stored, or transferred by us to run our business could result in significantly increased security costs or costs related to defending legal claims.
Cyber-attacks, such as computer viruses, or other forms of cyber terrorism, may disrupt access to our network or storage applications. Such disruptions could result in delays or cancellations of customer orders or delays or interruptions in the production or shipment of products. Data security breaches involving data center customers could affect their financial condition and ability to continue to purchase our products. In addition, cyber-attacks may cause us to incur significant remediation costs, result in product development delays, disrupt key business operations, and divert attention of management and key information technology resources. These incidents could also subject us to liability, expose us to significant expense, and cause significant harm to our reputation and our business.
In addition, our technology infrastructure and systems are vulnerable to damage or interruption from natural disasters, power loss, and telecommunications failures. Our products contain sophisticated hardware and operating system software and applications that may contain security problems, security vulnerabilities, or defects in design or manufacture, including “bugs” and other problems that could interfere with the intended operation of our products. To the extent that any disruption or security breach results in a loss or damage to our technology infrastructure, systems, or data or inappropriate disclosure of confidential information or sensitive or personal information, it could harm relationships with customers and other third parties and damage our brand and reputation and our business. In addition, we may be required to incur significant costs to protect against damage caused by these disruptions or security breaches in the future.
We may be subject to theft, loss, or misuse of personal data about employees, customers, or other third parties, which could increase expenses, damage our reputation, or result in legal or regulatory proceedings.
The theft, loss, or misuse of personal data collected, used, stored, or transferred by us to run our business could result in significantly increased security costs or costs related to defending legal claims. Global privacy legislation, enforcement, and policy activity in this area are rapidly expanding and creating a complex compliance regulatory environment. Costs to comply
with and implement these privacy-related and data protection measures could be significant. In addition, inadvertent failure to comply with federal, state, or international privacy-related or data protection laws and regulations could result in proceedings against us by governmental entities or others or cause us to incur penalties or other significant legal liability or change business practices.
Risks Related to Governmental Regulation
We could be subject to legal and regulatory consequences if we fail to comply with applicable export control laws and regulations.
Exports of certain of our products are subject to export controls imposed by the U.S. government and administered by the United StatesU.S. Departments of State and Commerce. In certain instances, these regulations may require pre-shipment authorization from the administering department. For products subject to the Export Administration Regulations or EAR,("EAR") administered by the Department of Commerce’s Bureau of Industry and Security, the requirement for a license is dependent on the type and end use of the product, the final destination, the identity of the end user, and whether a license exception might apply. Virtually all exports of products subject to the International Traffic in Arms Regulations or ITAR,("ITAR") administered by the Department of State’s Directorate of Defense Trade Controls, require a license.
Obtaining necessary export licenses can be difficult and time-consuming. Failure to obtain necessary export licenses could significantly reduce our revenue and adversely affect our business, financial condition, results of operations, and cash flows. We could be subject to investigation and potential regulatory consequences, including, but not limited to, a no-action letter, monetary penalties, debarment from government contracting, or denial of export privileges and criminal sanctions, any of which would adversely affect our business, financial condition, results of operations, and cash flows. Compliance with U.S. government regulations may also subject us to significant fees and expenses, including legal expenses, and require us to expend significant time and resources. Finally, the absence of comparable restrictions on competitors in other countries may adversely affect our competitive position.
For a portion of our business, we are subject to extensive government regulation, and our failure to comply with applicable regulations could subject us to penalties that may restrict ourthe ability to conduct our business.
As a contractor and/or subcontractor to the U.S. government, we are subject to and must comply with various government regulations that impact our revenue, operating costs, profit margins, and the internal organization and operation of our business. The most significant regulations and regulatory authorities affecting the portion of our business related to U.S. government contracts include the following:
•the Federal Acquisition Regulations, Defense Federal Acquisition Regulation Supplement and other supplemental agency regulations, which comprehensively regulate the formation and administration of, and performance under, U.S. government contracts;
•the Truth in Negotiations Act, which requires certification and disclosure of all factual cost and pricing data in connection with contract negotiations;
•the False Claims Act and the False Statements Act, which impose penalties for payments made on the basis of false facts provided to the government and on the basis of false statements made to the government, respectively; and
•the Foreign Corrupt Practices Act,FCPA, which prohibits U.S. companies from providing anything of value to a foreign official to help obtain, retain, or direct business, or obtain any unfair advantage.
Our failureFailure to comply with applicable regulations, rules and approvals, or misconduct by any of our employeesemployee, could result in the imposition of fines and penalties, the loss of our government contracts, or our suspension or debarment from contracting with the U.S. government generally, any of which could harm our business, financial condition, results of operations, and cash flows. We are also subject to certain regulations of comparable government agencies in other countries, and our failure to comply with these non-U.S. regulations could also harm our business, financial condition, results of operations, and cash flows.
Our business related to government contracts subjects us to additional risks.
We believe that for the foreseeable future the growth of our navigation business for the foreseeable futureNavigation and Inertial Sensing product line will depend, to a certain degree, on ourthe ability to win government contracts and subcontracts, in particular from the Department of Defense. Many of our government customers are subject to budgetary constraints and our continued performance under these contracts or subcontracts, or award of additional contracts or subcontracts from these agencies, could be jeopardized by spending reductions, including constraints on government spending imposed by the Budget Control Act of 2011 and its subsequent
amendments, or budget cutbacks at these agencies.agencies, or government shutdowns. The funding of U.S. government programs is uncertain and dependent on continued congressional appropriations and administrative allotment of funds based on an annual budgeting process. We cannot be certain that current levels of congressional funding for our products and services will continue and that our business related to these products will not decline or increase at currently anticipated levels, or that we will not be subject to delays in the negotiation of contracts or increased costs due to changes in the funding of U.S. government programs.programs or government shutdowns. A significant decline in government expenditures generally, or with respect to programs for which we provide products, could adversely affect our business and prospects.
In addition, our business could be adversely affected by a negative audit or investigation by the U.S. government. U.S. government agencies, primarily the Defense Contract Audit Agency and the Defense Contract Management Agency, routinely audit and investigate government contractors. These agencies review a contractor’s performance under its contracts, cost structure, and compliance with applicable laws, regulations, and standards. These agencies also may review the adequacy of, and a contractor’s compliance with, its internal control systems and policies, including the contractor’s purchasing, quality, accounting, property, estimating, compensation, and management information systems. Any costs found to be improperly allocated to a specific cost reimbursement contract will not be reimbursed, while such costs already reimbursed must be refunded. If an audit or investigation of our business were to uncover improper or illegal activities, then we could be subject to civil and criminal penalties and administrative sanctions, including termination of contracts, suspension of payments, fines, and suspension or debarment from doing business with the U.S. government. We could experience serious harm to our reputation if allegations of impropriety or illegal acts were made against us, even if the allegations were inaccurate. In addition, responding to governmental audits or investigations may involve significant expense and divert management attention. Moreover, if any of our administrative processes and business systems are found not to comply with the applicable requirements, we may be subjected to increased government scrutiny or required to obtain additional governmental approvals that could delay or otherwise adversely affect ourthe ability to compete for or perform contracts. If any of the foregoing were to occur, our business, financial condition, operating results, and cash flows may be adversely affected.
Our failure to obtain or maintain the right to use certain intellectual property may adversely affect our business, financial condition, results of operations, and cash flows.
Our industries are characterized by frequent litigation regarding patent and other intellectual property rights. From time to time we have received, and may receive in the future, notice of claims of infringement of other parties’ proprietary rights and licensing offers to commercialize third party patent rights. Numerous patents in our industry are held by others, including our competitors and certain academic institutions. Our competitors may seek to gain a competitive advantage or other third parties may seek an economic return on their intellectual property portfolios by making infringement claims against us. We cannot be certain that:
infringement claims (or claims for indemnification resulting from infringement claims) will not be asserted against us or that such claims will not be successful;
future assertions will not result in an injunction against the sale of infringing products, which could require us to cease the manufacture, use or sale of the infringing products, processes or technology and expend significant resources to develop non-infringing technology, adversely affecting our business, results of operations, and cash flows;
any patent owned or licensed by us will not be invalidated, circumvented, or challenged; or
we will not be required to obtain licenses or pay substantial damages for past, present and future use of the infringing technology, the expense of which may adversely affect our results of operations, and cash flows.
For example, on June 12, 2018, Phoenix Navigation Components, LLC (“Phoenix”) commenced an arbitration against EMCORE with the American Arbitration Association (“AAA”) in New York and on June 21, 2018, Phoenix commenced a special proceeding against EMCORE in the New York Supreme Court, Commercial Division, Index No. 653128/2018. Please see the disclosures under the caption “Legal Proceedings” in Note 13 - Commitments and Contingencies in the notes to our condensed consolidated financial statements for additional information regarding these proceedings.
In addition, effective copyright and trade secret protection may be unavailable or limited in certain foreign jurisdictions. Litigation, which could result in substantial cost and diversion of our resources, may be necessary to defend our rights or defend us against claimed infringement of the rights of others. In certain circumstances, our intellectual property rights associated with government contracts may be limited.
If we fail to protect, or incur significant costs in defending, our intellectual property and other proprietary rights, our business and results of operations could be materially harmed.
Our success depends to a significant degree on our ability to protect our intellectual property and other proprietary rights. We rely on a combination of patent, trademark, trade secret and unfair competition laws, as well as license agreements and other contractual provisions, to establish and protect our intellectual property and other proprietary rights. We have applied for patent registrations in the United States and selected international jurisdictions, most of which have been issued. We cannot guarantee that our pending applications will be approved by the applicable governmental authorities. Moreover, our existing and future patents and trademarks may not be sufficiently broad to protect our proprietary rights or may be held invalid or unenforceable in court. Failure to obtain patent registrations or a successful challenge to our registrations in the United States or other foreign countries may limit our ability to protect the intellectual property rights that these applications and registrations are intended to cover.
We also attempt to protect our intellectual property, including our trade secrets and know-how, through the use of trade secret and other intellectual property laws, and contractual provisions. We enter into confidentiality and invention assignment agreements with our employees and independent consultants. We also use non-disclosure agreements with other third parties who may have access to our proprietary technologies and information. Such measures, however, provide only limited protection, and we cannot be certain that our confidentiality and non-disclosure agreements will not be breached, especially after our employees or those of our third-party contract manufacturers end their employment or engagement, and that our trade secrets will not otherwise become known by competitors or that we will have adequate remedies in the event of unauthorized use or disclosure of proprietary information. Unauthorized third parties may try to copy or reverse engineer our products or portions of our products, otherwise obtain and use our intellectual property, or may independently develop similar or equivalent trade secrets or know-how. If we fail to protect our intellectual property and other proprietary rights, or if such intellectual property and proprietary rights are infringed or misappropriated, we could lose our competitive advantage and our business, results of operations, financial condition and cash flows could be materially harmed.
Policing unauthorized use of our technology is difficult, and we cannot be certain that the steps we have taken will prevent the misappropriation, unauthorized use, or other infringement of our intellectual property rights. Further, we may not be able to effectively protect our intellectual property rights from misappropriation or other infringement in foreign countries where we have not applied for patent protections, and where effective patent, trademark, trade secret, and other intellectual property laws may be unavailable, or may not protect our proprietary rights as fully as U.S. law.
In the future, we may need to take legal actions to prevent third parties from infringing upon or misappropriating our intellectual property or from otherwise gaining access to our technology. Protecting and enforcing our intellectual property rights and determining their validity and scope could result in significant litigation costs and require significant time and attention from our technical and management personnel, which could significantly harm our business. The availability of financial resources may limit our ability to commence or defend such litigation. In addition, we may not prevail in such proceedings. An adverse outcome of such proceedings may reduce our competitive advantage or otherwise harm our business, financial condition, results of operations and cash flows.
We may be obligated to indemnify our customers and vendors for claims that our intellectual property infringes the rights of others, which may result in substantial expenses to us.
We may be required to indemnify our customers or vendors for intellectual property claims made against them for products incorporating our technology. As such, claims against our customers and vendors may require us to incur substantial expenses, such as legal expenses, damages for past infringement or royalties for future use. Future indemnity claims could adversely affect our business relationships and result in substantial costs to us.
We face certain litigation risks that could harm our business.
We are and may become subject to various legal proceedings and claims that arise in or outside the ordinary course of business. The results of complex legal proceedings are difficult to predict. Moreover, many of the complaints filed against us do not specify the amount of damages that plaintiffs seek, and we therefore are unable to estimate the possible range of damages that might be incurred should these lawsuits be resolved against us. However, certain of these lawsuits assert types of claims that, if resolved against us, could give rise to substantial damages. Thus, an unfavorable outcome or settlement of one or more of these lawsuits may have an adverse effect on our business, financial condition, results of operations and cash flows. Even if these lawsuits are not resolved against us, the uncertainty and expense associated with unresolved lawsuits could seriously harm our business, financial condition, and reputation. Litigation is costly, time-consuming and disruptive to normal business operations. The costs of defending these lawsuits have been significant, will continue to be costly, and may not be covered by our insurance policies. The defense of these lawsuits could also result in continued diversion of our management's time and attention away from business operations, which could harm our business. For additional discussion regarding litigation in which we are involved, see Note 13 - Commitments and Contingenciesin the notes to our consolidated financial statements.
We could be subject to legal consequences if we fail to comply with the Modified Partial Final Award issued in connection with the Phoenix legal proceedings.
In the Interim Award incorporated by reference into the Modified Partial Final Award (in each case as defined in the disclosures under the caption “Legal Proceedings” in Note 13 - Commitments and Contingencies in the notes to our condensed consolidated financial statements), the arbitrator determined and ordered that we are required to pay Phoenix a royalty of 7.5% of the sale price on (i) future customer payments for certain EMCORE product contracts previously entered into at the time the Interim Award was issued and (ii) customer payments for future sales of any product using any Deemed Trade Secret (as defined in the disclosures under the caption “Legal Proceedings” in Note 13 - Commitments and Contingencies in the notes to our condensed consolidated financial statements), in each case payable in a single lump sum within one month of completion of the calendar quarter in which payment has been received from the customer, and that we are required to concurrently submit to Phoenix a written report that sets forth the calculation of the amount of the royalty payment in a form similar to previous royalty reports, provided that following the first $1.0 million of royalty payments on the EMP-1 product only, inclusive of payments made prior to the Interim Award, we must pay to Phoenix a royalty of 2.25% of the sale price (net of any warranty work, returns, rebates, discounts or credits) with respect to subsequent sales of the EMP-1 product. We must continue to make royalty payments in this manner until such time as we have in good faith determined, and can so document, that it has completely ceased use of the Deemed Trade Secrets, and at such time, we must provide Phoenix written notice of same by certified letter, return receipt requested. If we fail to comply with these obligations, it could be subject to additional claims, penalties or judgments, which could harm our business, financial condition, results of operations and cash flows. In addition, we could be subject to significant legal costs and expenses in connection with the interpretation of certain of the obligations pursuant to the Interim Award, which could harm our business, financial condition, results of operations and cash flows.
Our business and operations could be adversely impacted in the event of a failure or security breach of our information technology infrastructure.
We rely upon the capacity, reliability, and security of our information technology hardware and software infrastructure and our ability to expand and update this infrastructure in response to our changing needs. We are constantly updating our information technology infrastructure. Although we have a disaster recovery plan, any failure to manage, expand, and update our information technology infrastructure or any failure in the operation of this infrastructure could harm our business.
The secure maintenance of this information is critical to our business and reputation. Despite our implementation of security measures, our systems are vulnerable to damages from computer viruses, computer denial-of-service attacks, worms, and other malicious software programs or other attacks, covert introduction of malware to computers and networks, unauthorized access, including impersonation of unauthorized users, efforts to discover and exploit any security vulnerabilities or securities weaknesses, and other similar disruptions. Our business is also subject to break-ins, sabotage, and intentional acts of vandalism by third parties as well as intentional and unintentional acts by employees or other insiders with access privileges. Our customers’ network and storage applications may be subject to similar disruptions. It is often difficult to anticipate or immediately detect such incidents and the damage caused by such incidents. Data breaches and any unauthorized access or disclosure of our information, employee information or intellectual property could compromise our intellectual property, trade secrets and other sensitive business information, any of which could result in legal action against us, exposure of our intellectual property to our competitors, damages, fines and other adverse effects. A data security breach could also lead to public exposure of personal information of our employees, customers and others. Any such theft, loss or misuse of personal data collected, used, stored or transferred by us to run our business could result in significantly increased security costs or costs related to defending legal claims. Cyber attacks, such as computer viruses or other forms of cyber terrorism, may disrupt access to our network or storage applications. Such disruptions could result in delays or cancellations of customer orders or delays or interruptions in the production or shipment of our products. Data security breaches involving our data center customers could affect their financial condition and ability to continue to purchase our products. In addition, cyber attacks may cause us to incur significant remediation costs, result in product development delays, disrupt key business operations and divert attention of management and key information technology resources. These incidents could also subject us to liability, expose us to significant expense and cause significant harm to our reputation and business.
In addition, our technology infrastructure and systems are vulnerable to damage or interruption from natural disasters, power loss and telecommunications failures. Further, our products contain sophisticated hardware and operating system software and applications that may contain security problems, security vulnerabilities, or defects in design or manufacture, including “bugs” and other problems that could interfere with the intended operation of our products. To the extent that any disruption or security breach results in a loss or damage to our technology infrastructure, systems or data or inappropriate disclosure of confidential information or sensitive or personal information, it could harm our relationships with customers and other third parties and damage our brand and reputation and our business. In addition, we may be required to incur significant costs to protect against damage caused by these disruptions or security breaches in the future.
We may be subject to theft, loss, or misuse of personal data about our employees, customers, or other third parties, which could increase our expenses, damage our reputation, or result in legal or regulatory proceedings.
The theft, loss, or misuse of personal data collected, used, stored, or transferred by us to run our business could result in significantly increased security costs or costs related to defending legal claims. Global privacy legislation, enforcement, and policy activity in this area are rapidly expanding and creating a complex compliance regulatory environment. Costs to comply with and implement these privacy-related and data protection measures could be significant. In addition, our even inadvertent failure to comply with federal, state, or international privacy-related or data protection laws and regulations could result in proceedings against us by governmental entities or others or cause us to incur penalties or other significant legal liability or change our business practices.
The costs of compliance with state, federal, and international legal and regulatory requirements, such as environmental, labor, trade, and tax regulations, and customers' standards of corporate citizenship could cause an increase in our operating costs.
We are subject to environmental and health and safety laws and regulations and must obtain certain permits and licenses relating to the use of hazardous materials in our production activities. If our control systems are unsuccessful in preventing a release of these materials into the environment or other adverse environmental conditions or human exposure occurs, we could experience interruptions in our operations and incur substantial remediation and other costs or liabilities. We are also subject to a number of federal and state laws and regulations related to safety, including OSHAthe Occupational Safety and Health Administration (“OSHA”) and comparable state statutes, the purpose of which are to protect the health and safety of workers. Failure to comply with OSHA requirements and other related state regulations, including general industry standards, record keeping requirements, and monitoring and control of occupational exposure to regulated substances, could have a material adverse effect on our results of operations and financial condition if we are subjected to significant penalties, fines, or compliance costs. In addition, certain foreign laws and regulations place restrictions on the concentration of certain hazardous materials, including, but not limited to, lead, mercury, and cadmium, in our products. Failure to comply with such laws and regulations could subject us to future liabilities or result in the limitation or suspension of the sale or production of our products. These regulations include the European Union's (EU)EU's Restrictions on Hazardous Substances and Directive on Waste Electrical and Electronic Equipment. Failure to comply with environmental and health and safety laws and regulations may limit ourthe ability to export products to the EU and could adversely affect our business, financial condition, results of operations, and cash flows. In addition, we purchase certain chemicals from Europe and Asia that are unique, nearing the end of life, and could be subject to future changes to environmental regulations in the country of origin and/or the U.S. In the event new restrictions are placed on any such chemicals, they may be difficult to replace, and may require us to re-design or re-validate existing products that use such chemicals in their production.
In connection with our compliance with such environmental laws and regulations, as well as our compliance with industry environmental initiatives, the standards of business conduct required by some of our customers, and our commitment to sound corporate citizenship in all aspects of our business, we could incur substantial compliance and operating costs and be subject to disruptions to our operations. In addition, in the last fewrecent years, there has been increased media scrutiny and associated reports focusing on a potential link between working in semiconductor manufacturing clean room environments and certain illnesses, primarily different types of cancers. Regulatory agencies and industry associations have begun to study the issue to see if any actual correlation exists. Because we utilize clean rooms, we may become subject to liability claims. These reports may also affect ourthe ability to recruit and retain employees. If we were found to be in violation of environmental and safety regulations laws or noncompliance with industry initiatives or standards of conduct, we could be subject to government fines or liabilities owed to our customers, which could have an adverse effect on our business, financial condition, results of operations, and cash flows.
In addition, climate change is a significant topic of discussion and potential regulatory activity and has generated and may continue to generate federal or other regulatory responses in the near future. If we or our component suppliers fail to timely comply with applicable legislation, our customers may refuse to purchase our products or we may face increased operating costs as a result of taxes, fines, or penalties, which may have an adverse effect on our business, financial condition, results of operations, and cash flows.
The Department of Homeland Security has commenced a program to evaluate the security of certain chemicals which may be of interest to terrorists, including chemicals utilized by us. This evaluation may lead to regulations or restrictions affecting ourthe ability to utilize these chemicals or the costs of doing so.
In connection with our compliance with such environmental laws and regulations, as well as our compliance with industry environmental initiatives, the standards of business conduct required by some of our customers, and our commitment to sound corporate citizenship in all aspects of our business, we could incur substantial compliance and operating costs and be subject to disruptions to our operations and logistics. In addition, if we were found to be in violation of these laws or noncompliant with these initiatives or standards of conduct, we could be subject to governmental fines, liability to our customers and damage to our reputation and corporate brand which could cause our business, financial condition, results of operations and cash flows to suffer.
We are subject to anti-corruption laws in the jurisdictions in which we operate, including the FCPA. Our failureFailure to comply with these laws could result in penalties which could harm our reputation and have an adverse effect on our business, results of operations, and financial condition.
We are subject to the FCPA, which generally prohibits companies and their intermediaries from making improper payments to foreign officials for the purpose of obtaining or keeping business and/or other benefits, along with various other anticorruptionanti-corruption laws. Although we have implemented policies and procedures designed to ensure that we, our employees, and other intermediaries comply with the FCPA and other anticorruptionanti-corruption laws to which we are subject, we cannot be certain that such policies or procedures will work effectively all of the time or protect us against liability under the FCPA or other laws for actions taken by our employees and other intermediaries with respect to our business or any businesses that we may acquire.
We have manufacturing operations in China and other jurisdictions, many of which pose elevated risks of anti-corruption violations, and we export our products for sale internationally. This puts us in frequent contact with persons who may be considered “foreign officials” under the FCPA, resulting in an elevated risk of potential FCPA violations. If we are not in compliance with the FCPA and other laws governing the conduct of business with government entities (including local laws), we may be subject to criminal and civil penalties and other remedial measures, which could have an adverse impact on our business, financial condition, results of operations, and cash flows. Any investigation of any potential violations of the FCPA or other anticorruptionanti-corruption laws by U.S. or foreign authorities could harm our reputation and have an adverse impact on our business, financial condition, results of operations, and cash flows.
If we identify deficiencies in our current system of internal controls or fail to remediate them, we may not be able to accurately report our financial results or prevent fraud. As a result, our business could be harmed and current and potential investors could lose confidence in our financial reporting, which could have an adverse effect on the trading price of our equity securities.
We are subject to the ongoing internal control provisions of Section 404 of the Sarbanes-Oxley Act of 2002. These provisions provide for the identification of material weaknesses or other lesser deficiencies in internal control over financial reporting, which is a process to provide reasonable assurance regarding the reliability of financial reporting for external purposes in accordance with U.S. GAAP. If we cannot provide reliable and timely financial reports, our brand, operating results, and the market value of our equity securities could be harmed. We have in the past discovered, and may in the future discover, areas of our internal controls that need improvement.
We have devoted significant resources to remediate and improve our internal controls. We have also been monitoring the effectiveness of these remediated measures. We cannot be certain that these measures will ensure adequate controls over our financial processes and reporting in the future. Any failure to implement required, new, or improved controls, or difficulties encountered in their implementation, could harm our operating results or cause us to fail to meet our reporting obligations.
Inadequate internal controls could also cause investors to lose confidence in our reported financial information, which could have an adverse effect on the trading price of our equity securities. Further, the impact of these events could also make it more difficult for us to attract and retain qualified persons to serve on ourthe Board of Directors or as executive officers, which could harm our business.
We could be required to record an impairment charge as a result of changes to assumptions used in our impairment testing.
We have substantial long-lived assets recorded on ourthe balance sheet. As of September 30, 2019,2021, we had $37.2$22.5 million of property, plant and equipment, net, on ourthe consolidated balance sheet. If we make changes in our business strategy or if market or other conditions adversely affect our business operations, we may be forced to record an impairment charge related to these assets, which would adversely impact our results of operations. Impairment assessment inherently involves judgment as to assumptions about expected future cash flows and the impact of market conditions on those assumptions. Future events and
changes in market conditions, underlying business operations, competition, or technologies may impact our assumptions as to prices, costs, holding periods, or other factors that may result in changes in our estimates of future cash flows. Although we believe the assumptions we used in testing for impairment are reasonable, we will continue to evaluate the recoverability of the carrying amount of our property, plant and equipment on an ongoing basis, and significant changes in any one of our assumptionsassumption could produce a significantly different result. In such a circumstance, we may incur substantial impairment charges, which would adversely affect our financial results. In any period where our stock price, as determined by our market capitalization, is less than our book value, this too could indicate a potential impairment and we may be required to record an impairment charge in that period.
Changes in accounting standards issued by the Financial Accounting Standards Board (“FASB”) could have a material effect on our balance sheet, revenue and result of operations, and could require a significant expenditure of time, attention and resources, especially by senior management.
Our accounting and financial reporting policies conform to U.S. GAAP, which are periodically revised and/or expanded. The application of accounting principles is also subject to varying interpretations over time. Accordingly, we are required to adopt new or revised accounting standards or comply with revised interpretations that are issued from time to time by various parties, including accounting standard setters and those who interpret the standards, such as the FASB and the SEC and our independent registered public accounting firm. Such new financial accounting standards may result in significant changes that could adversely affect our financial condition and results of operations.
Compliance with regulations related to conflict minerals and other regulations with respect to our supply chains
could increase costs and affect the manufacturing and sale of our products.
Public companies are required to disclose the use of tin, tantalum, tungsten and gold (collectively, “conflict minerals”) mined from the Democratic Republic of the Congo and adjoining countries (the “covered countries”) if a conflict mineral(s) is necessary to the functionality of a product manufactured, or contracted to be manufactured, by the company.us. We may determine, as part of our compliance efforts, that certain products or components we obtain from our suppliers contain conflict minerals. If we are unable to conclude that all our products are free from conflict minerals originating from covered countries, this could have a negative impact on our business, reputation and/or results of operations. We may also encounter challenges to satisfy customers who require that our products be certified as conflict free, which could place us at a competitive disadvantage if we are unable to substantiate such a claim.disadvantage. Compliance with these rules could also affect the sourcing and availability of some of the minerals used in the manufacture of products or components we obtain from our suppliers, including ourthe ability to obtain products or components in sufficient quantities and/or at competitive prices. Certain of our customers are requiring additional information from us regarding the origin of our raw materials and complying with these customer requirements may cause us to incur additional costs, such as costs related to determining the origin of any minerals used in our products.costs. Our supply chain is complex and we may be unable to verify the origins for all metals used in our products.
In addition, the U.S. federal government has issued new policies for federal procurement focused on eradicating the practice of forced labor and human trafficking, and the United Kingdom and the State of California have issued laws that require us to disclose our policy and practices for identifying and eliminating forced labor and human trafficking in our supply chain. Several customers, as well as the Electronic Industry Citizenship Coalition, (EICC) have also issued expectations to eliminate these practices that may impact us. While we have a policy and management systems to identify and avoid these practices in our supply chain, we cannot guarantee that our suppliers will always be in conformance to these laws and expectations. We may face enforcement liability and reputational challenges if we are unable to sufficiently meet these expectations. Moreover, we are likely to encounter challenges with customers if we cannot satisfy their forced and trafficked labor polices and they may choose a competitor’s product.
Our business and results of operations may continue to be negatively impacted by general economic and financial market conditions and market conditions in the industries in which we operate, and such conditions may increase the other risks that affect our business.
In recent years, the world’s financial markets have experienced significant turmoil, resulting in reductions in available credit, increased costs of credit, extreme volatility in security prices, potential changes to existing credit terms, and rating downgrades of investments. These conditions materially and adversely affected the market conditions in the industries in which we operate and caused many of our customers to reduce their spending plans, leading them to draw down their existing inventory and reduce orders for our products, which, in turn, had an adverse impact on our revenues. We cannot predict the timing, strength or duration of any economic slowdown or subsequent economic recovery, worldwide or within our industry. It is possible that economic conditions could result in further setbacks, and that these customers, or others, could as a result significantly reduce their capital expenditures, draw down their inventories, reduce production levels of existing products, defer introduction of new products or place orders and accept delivery for products for which they do not pay us due to their economic difficulties or other reasons. If any of these events occur, our business, financial condition, results of operations and cash flows may be adversely affected.
Natural disasters or other catastrophic events could have an adverse effect on our business.
Natural disasters, such as hurricanes, earthquakes, fires, and floods, could adversely affect our operations and financial performance. Such events could result in physical damage to one or more of our facilities, the temporary closure of one or more of our facilities or those of our suppliers, a temporary lack of an adequate work force in a market, a temporary or long-term disruption in the supply of products from some local and overseas suppliers, a temporary disruption in the transport of goods from overseas, and delays in the delivery of goods. Public health issues, whether occurring in the United States or abroad, could disrupt our operations, disrupt the operations of suppliers or customers, or have an adverse impact on customer demand. As a result of any of these events, we may be required to suspend operations in some or all of our locations, which could have an adverse effect on our business, financial condition, results of operations, and cash flows. These events could also reduce demand for our products or make it difficult or impossible to receive products from suppliers. Although we maintain business interruption insurance and other insurance intended to cover some or all of these risks, such insurance may be inadequate, whether because of coverage amount, policy limitations, the financial viability of the insurance companies issuing such policies, or other reasons.
We are subject to risks associated with the availability and coverage of insurance.
For certain risks, we do not maintain insurance coverage because of cost or availability. Because we retain some portion of our insurable risks, and in some cases self-insure completely, unforeseen or catastrophic losses in excess of insured limits may have an adverse effect on our business, financial condition, results of operations and cash flows.
The market price for our common stock has experienced significant price and volume volatility and is likely to continue to experience significant volatility in the future. This volatility may impair our ability to finance strategic transactions with our stock and otherwise harm our business.
Our stock price has experienced significant price and volume volatility for the past several years, and our stock price is likely to experience significant volatility in the future. The trading price of our common stock may be influenced by factors beyond our control, such as the volatility of the financial markets, uncertainty surrounding domestic and foreign economies, conditions and trends in the markets we serve, changes in the estimation of the future size and growth rate of our markets, publication of research reports and recommendations by financial analysts relating to our business, the business of our competitors or the industry in which we operate and compete, changes in market valuation or earnings of our competitors, legislation or regulatory policies, practices, or actions, sales of our common stock by our principal shareholders, and the trading volume of our common stock. The historical market prices of our common stock may not be indicative of future market prices and we may be unable to sustain or increase the value of our common stock. We have historically used equity incentive compensation as part of our overall compensation arrangements. The effectiveness of equity incentive compensation in retaining key employees may be adversely impacted by volatility in our stock price. Significant declines in our stock price may also interfere with our ability, if needed, to raise additional funds through equity financing or to finance strategic transactions with our stock. In addition, there may be increased risk of securities litigation following periods of fluctuations in our stock price. Securities class action lawsuits
are often brought against companies after periods of volatility in the market price of their securities. These and other consequences of volatility in our stock price which could be exacerbated by macroeconomic conditions that affect the market generally, or our industry in particular could have the effect of diverting management's attention and could materially harm our business.
We may not pay additional dividends on our common stock and, consequently, your only opportunity to achieve a return on your investment may be an increase in the price of our common stock.
Although we paid a special dividend in 2016, we cannot guarantee that that we will pay additional dividends in the future. In addition, the terms of our loan and security agreement with our financial institution restrict our ability to pay dividends. Consequently, your only opportunity to achieve a return on any shares of our common stock may be for you to sell your shares at a profit. There is no guarantee that the market price of our common stock will increase or ever exceed the price that you paid for the shares.
We may undergo an "ownership change" within the meaning of Section 382 of the Code, which could affect our ability to offset U.S. federal income tax against our net operating losses and certain of our tax credit carryovers.
Section 382 of the Internal Revenue Code, as amended (the “Code”) contains rules that limit the ability of a company that undergoes an ownership change to utilize its net operating losses and tax credits (the “Tax Benefits”) existing as of the date of such ownership change. Under the rules, such an ownership change is generally any change in ownership of more than 50% of a company's stock within a rolling three-year period. The rules generally operate by focusing on changes in ownership among shareholders considered by the rules as owning, directly or indirectly, 5% or more of the stock of a company and any change in ownership arising from new issuances of stock by the company.Company.
If we were to undergo one or more "ownership changes" within the meaning of Section 382 of the Code, our net operating losses and certain of our tax credits existing as of the date of each ownership change may be unavailable, in whole or in part, to offset U.S. federal income tax resulting from our operations or any gains from the disposition of any of our assets and/or business, which could result in increased U.S. federal income tax liability.
Certain provisions of New Jersey law and our governing documents may make a takeover of our Company difficult even if such takeover could be beneficial to some of our shareholders.
Certain provisions of our organizational documents and New Jersey law could discourage potential acquisition proposals, delay, or prevent a change in control of the Company, or limit the price that investors may be willing to pay in the future for shares of our common stock. For example, our amended and restated certificate of incorporation and amended and restated bylaws:
provided for the classification
•provide that directors may be removed at any time, but only for cause and only by the affirmative vote of the holders of at least a majority of our outstanding shares of capital stock entitled to vote generally in the election of directors cast at a meeting of shareholders called for that purpose;
•provide that a supermajoritysuper majority vote of our shareholders is required to amend some portions of our amended and restated certificate of incorporation and amended and restated bylaws, including requiring approval by the holders of 80% or more of the outstanding shares of our capital stock entitled to vote generally in the election of directors for certain business combinations unless these transactions meet certain fair price criteria and procedural requirements or are approved by two-thirds of our continuing directors;
•authorize the issuance of preferred stock, without any requirement of vote or class vote of shareholders, commonly referred to as “blank check” preferred stock, which shares of preferred stock may have rights senior to those of our common stock;
•limit the persons who can call special shareholder meetings; shareholders do not have authority to call a special meeting of shareholders;
•establish advance notice requirements that must be complied with by shareholders to nominate persons for election to ourthe Board of Directors or to propose matters that can be acted on by shareholders at shareholder meetings;
•do not provide for cumulative voting in the election of directors; and
•provide for the filling of vacancies on ourthe Board of Directors by action of 66 2/3% of the directors and not by the shareholders.
These and other provisions in our organizational documents could allow ourthe Board of Directors to affect the rights of our shareholders in a number of ways, including making it difficult for shareholders to replace members of the Board of Directors. Because ourthe Board of Directors is responsible for approving the appointment of members of ourthe management team, these provisions could in turn affect any attempt to replace the current management team. These provisions could also limit the price that investors would be willing to pay in the future for shares of our common stock. We may in the future adopt other measures that may have the effect of delaying or discouraging an unsolicited takeover, even if the takeover were at a premium price or favored by a majority of unaffiliated shareholders. Certain of these measures may be adopted without any further vote or action by our shareholders and this could depress the price of our common stock.
General Risk Factors
Our business and results of operations may continue to be negatively impacted by general economic and financial market conditions and market conditions in the industries in which we operate, and such conditions may increase the other risks that affect our business.
In recent years, and particularly in 2020 and 2021 with the impact of the COVID-19 pandemic, the world’s financial markets have experienced significant turmoil, resulting in reductions in available credit, increased costs of credit, extreme volatility in security prices, potential changes to existing credit terms, and rating downgrades of investments. These conditions materially and adversely affected the market conditions in the industries in which we operate and caused many customers to reduce their spending plans, leading them to draw down their existing inventory, and reduce orders for our products, which, in turn, had an adverse impact on revenues. We cannot predict the timing, strength, or duration of any economic slowdown or subsequent economic recovery, worldwide or within our industries. It is possible that economic conditions could result in further setbacks, and that these customers, or others, could as a result, significantly reduce their capital expenditures, draw down their inventories, reduce production levels of existing products, defer introduction of new products, or place orders and accept delivery for products for which they do not pay us due to their economic difficulties or other reasons. If any of these events occur, our business, financial condition, results of operations, and cash flows may be adversely affected.
Natural disasters or other catastrophic events could have an adverse effect on our business.
Natural disasters, such as hurricanes, earthquakes, fires, and floods, could adversely affect operations and financial performance. Such events could result in physical damage to one or more facilities, the temporary closure of one or more facilities or those of our suppliers, a temporary lack of an adequate work force in a market, a temporary or long-term disruption in the supply of products from some local and overseas suppliers, a temporary disruption in the transport of goods from overseas, and delays in the delivery of goods. Public health issues, such as the COVID-19 pandemic, whether occurring in the U.S. or abroad, could disrupt our operations, disrupt the operations of suppliers or customers, or have an adverse impact on customer demand. As a result of any of these events, we may be required to suspend operations in some or all locations, which could have an adverse effect on our business, financial condition, results of operations, and cash flows. These events could also reduce demand for our products or make it difficult or impossible to receive products from suppliers. Although we maintain business interruption insurance and other insurance intended to cover some of these risks, such insurance may be inadequate,
whether because of coverage amount, policy limitations, the financial viability of the insurance companies issuing such policies, or other reasons.
We may not be able to obtain capital when desired on favorable terms, if at all, or without dilution to shareholders.
We believe that our existing cash and cash equivalents, and cash flows from our operating activities and funds available under our credit facilities, will be sufficient to meet our anticipated cash needs for at least the next 12 months. However, we operate in industries that makes our prospects difficult to evaluate. It is possible that we may not generate sufficient cash flow from operations or otherwise have the capital resources to meet our future capital needs. If this occurs, we may need additional financing to continue operations or execute on our current or future business strategies, including to:
•invest in research and development efforts, including by hiring additional technical and other personnel;
•maintain and expand operating or manufacturing infrastructure;
•acquire complementary businesses, products, services or technologies; or
•otherwise pursue strategic plans and respond to competitive pressures.
If we raise additional funds through the issuance of equity or convertible debt securities, the percentage ownership of our shareholders could be significantly diluted, and these newly-issued securities may have rights, preferences or privileges senior to those of existing shareholders. We cannot be certain that additional financing will be available on terms favorable to us, or at all. If adequate funds are not available or are not available on acceptable terms, if and when needed, our ability to fund our operations, take advantage of unanticipated opportunities, develop or enhance our products, or otherwise respond to competitive pressures could be significantly limited. Furthermore, in the event adequate capital is not available to us as required, or is not available on favorable terms, our business, financial condition, results of operations, and cash flows may be adversely affected.
The market price for our common stock has experienced significant price and volume volatility and is likely to continue to experience significant volatility in the future. This volatility may impair the ability to finance strategic transactions with our stock and otherwise harm our business.
Our stock price has experienced significant price and volume volatility for the past several years, and our stock price is likely to experience significant volatility in the future. The trading price of our common stock may be influenced by factors beyond our control, such as the volatility of the financial markets, uncertainty surrounding domestic and foreign economies, conditions and trends in the markets we serve, changes in the estimation of the future size and growth rate of our markets, publication of research reports, and recommendations by financial analysts relating to our business, the business of competitors, or the industries in which we operate and compete, changes in market valuation or earnings of competitors, legislation or regulatory policies, practices, or actions, sales of our common stock by principal shareholders, and the trading volume of our common stock. The historical market prices of our common stock may not be indicative of future market prices and we may be unable to sustain or increase the value of our common stock. We have historically used equity incentive compensation as part of our overall compensation arrangements. The effectiveness of equity incentive compensation in retaining key employees may be adversely impacted by volatility in our stock price. Significant declines in our stock price may also interfere with the ability, if needed, to raise additional funds through equity financing or to finance strategic transactions with our stock. In addition, there may be increased risk of securities litigation following periods of fluctuations in our stock price. Securities class action lawsuits are often brought against companies after periods of volatility in the market price of their securities. These and other consequences of volatility in our stock price which could be exacerbated by macroeconomic conditions that affect the market generally, or our industries in particular, could have the effect of diverting management's attention and could materially harm our business.
We may not pay additional dividends on our common stock and, consequently, the only opportunity to achieve a return on an investment in our common stock may be an increase in the price of our common stock.
Although we paid a special dividend in 2016, we may not pay additional dividends in the future. The terms of our loan and security agreement with our financial institution restrict our ability to pay dividends. Consequently, the only opportunity to achieve a return on an investment in our common stock may be through an increase in the market price of our common stock over the price paid, of which there is no guarantee.
***
The risks above are not the only risks we face. If any of the events described in our risk factors actually occur, or if additional risks and uncertainties not presently known to us or that we currently deem immaterial, materialize, then our business, financial condition, results of operations, and cash flows could be materially affected.
ITEM 1B. Unresolved Staff Comments
Not Applicable.applicable.
ITEM 2. Properties
We lease building space consisting of corporate, manufacturing, research and development, and other facilities. We lease principal facilities in Alhambra and Concord, California, and Beijing, China. The facility in Alhambra, California, with approximately 66,000 square feet, is leased through 2031 with respect to four of the five buildings (totaling 50,000 square feet) with an option to extend, and is utilized as the corporate headquarters as well as for manufacturing and research and development for our Aerospace and Defense and Broadband segments. The facility in Concord, California, with approximately 110,000 square feet, is leased through 2035 with an option to extend and is utilized as manufacturing and research and development for our Aerospace and Defense segment. One facility in Beijing, China, with approximately 23,000 square feet, is leased through April 2022 and is utilized for manufacturing for our Broadband segment and another facility in Beijing, China with approximately 5,000 square feet, is leased through January 2025 and is utilized for research and development for our Broadband segment.
The following chart contains certain information regarding each of our principal facilities.
|
| | | |
Location | Function | Approximate
Square Footage
| Term
(in calendar year)
|
| | | |
Alhambra, California | Corporate Headquarters
Manufacturing and research and development facilities | 75,000 | Lease covering one of six buildings expired in 2011; other leases covering five of six buildings expire in 2023 (1) and (2)
|
| | | |
Langfang, China | Warehouse facility | 1,100 | Lease expired in 2019 (2)
|
| | | |
Beijing, China | Manufacturing facility | 23,200 | Lease expires in 2021 (1)
|
| | | |
Concord, California | Manufacturing and research and development facility | 110,000 | N/A - Owned property |
Footnotes
| |
(1) | Leases have the option to be renewed by us at fixed terms. |
| |
(2) | Certain facility leases which have expired are being maintained on a month-to-month basis. |
ITEM 3. Legal Proceedings
See the disclosures under the caption “Legal Proceedings” in Note 13-11 - Commitments and Contingencies in the notesNotes to our consolidated financial statementsConsolidated Financial Statements for disclosures related to our legal proceedings, which disclosures are incorporated herein by reference.
ITEM 4. Mine Safety Disclosures
Not Applicable.applicable.
ITEM 5. Market for Registrant'sRegistrant’s Common Equity, Related Stockholder Matters, and Issuer Purchases of Equity Securities
Securities
Market Information
Our common stock is traded on the Nasdaq Global Market and is quoted under the symbol "EMKR". As of December 6, 2019,November 29, 2021, we had approximately 8160 shareholders of record. Many of our shares of common stock are held by brokers and other institutions on behalf of shareholders, and we are unable to estimate the number of these shareholders.
Dividend Policy
No dividends have been declared duringWe expect to retain all earnings to finance the two most recent fiscal years. Under the termsexpansion and development of our credit facility with Wells Fargo Bank, N. A.,business, and we are restricted from payingdo not currently intend to pay any cash dividends that resulton capital stock in the liquidity of the Company being less than $25.0 million after paying the dividend if any amounts are outstanding under our credit facility. The payment of dividends, if any, in the future is at the discretion of the Board of Directors.foreseeable future.
ITEM 6. Selected Financial Data
In the tables below, we have provided you with consolidated financial data. We derived the statement of operations data for the fiscal years ended September 30, 2019, 2018, and 2017 and the balance sheet dataPart II, Item 6 is no longer required as of September 30, 2019 and 2018 from our audited consolidated financial statements included in Financial Statements and Supplementary Data under Item 8 within this Annual Report.
We derived the statement of operations data for the years ended September 30, 2016 and 2015 and the selected balance sheet data as of September 30, 2017, 2016, and 2015 from audited consolidated financial statements that are not included in this Annual Report after giving effect to the discontinued operations of the Photovoltaics and Digital Products Businesses. You should read this financial data together with our Management's Discussion and Analysis of Financial Condition and Results of Operations under Item 7 and Financial Statements and Supplementary Data under Item 8 within this Annual Report. Our historic results are not necessarily indicative of the results that may be expected in the future.
Selected Financial Data
|
| | | | | | | | | | | | | | | | | | | |
Statements of Operations Data (in thousands, except loss per share) | For the Fiscal Years ended September 30, |
| | 2019 | | 2018 | | 2017 | | 2016 | | 2015 |
| Revenue | $ | 87,265 |
| | $ | 85,617 |
| | $ | 122,895 |
| | $ | 91,998 |
| | $ | 81,685 |
|
| Gross profit | 15,089 |
| | 18,487 |
| | 42,534 |
| | 30,954 |
| | 28,691 |
|
| Operating (loss) income | (36,132 | ) | | (18,311 | ) | | 7,741 |
| | 2,939 |
| | (4,522 | ) |
| (Loss) income from continuing operations | (35,984 | ) | | (17,453 | ) | | 8,221 |
| | 2,619 |
| | (2,272 | ) |
| Income from discontinued operations | — |
| | — |
| | 14 |
| | 5,647 |
| | 65,372 |
|
| Net (loss) income | (35,984 | ) | | (17,453 | ) | | 8,235 |
| | 8,266 |
| | 63,100 |
|
| Net (loss) income per basic share | | | | | | | | | |
| Continuing operations | $ | (1.29 | ) | | $ | (0.64 | ) | | $ | 0.31 |
| | $ | 0.10 |
| | $ | (0.08 | ) |
| Discontinued operations | — |
| | — |
| | — |
| | 0.22 |
| | 2.18 |
|
| Net (loss) income per basic share | $ | (1.29 | ) | | $ | (0.64 | ) | | $ | 0.31 |
| | $ | 0.32 |
| | $ | 2.10 |
|
Net (loss) income per diluted share
| | | | | | | | | |
Continuing operations
| $ | (1.29 | ) | | $ | (0.64 | ) | | $ | 0.30 |
| | $ | 0.10 |
| | $ | (0.08 | ) |
| Discontinued operations | — |
| | — |
| | — |
| | 0.21 |
| | 2.18 |
|
| Net (loss) income per diluted share | $ | (1.29 | ) | | $ | (0.64 | ) | | $ | 0.30 |
| | $ | 0.31 |
| | $ | 2.10 |
|
|
| | | | | | | | | | | | | | | | | | | | |
Balance Sheet Data (in thousands) | | As of September 30, |
| | | 2019 | | 2018 | | 2017 | | 2016 | | 2015 |
| Cash, cash equivalents and restricted cash | | $ | 21,977 |
| | $ | 63,195 |
| | $ | 68,754 |
| | $ | 64,870 |
| | $ | 112,260 |
|
| Working capital | | 41,250 |
| | 88,848 |
| | 103,042 |
| | 92,957 |
| | 127,994 |
|
| Total assets | | 109,562 |
| | 135,898 |
| | 144,084 |
| | 127,211 |
| | 160,907 |
|
| Long-term liabilities | | 2,097 |
| | 1,891 |
| | 1,667 |
| | 1,635 |
| | 1,774 |
|
| Shareholders' equity | | 76,746 |
| | 106,805 |
| | 120,774 |
| | 107,317 |
| | 135,442 |
|
Working capital, calculated as current assets minus current liabilities, is a financial metric we use that represents available operating liquidity.
Significant Transactions
Significant transactions that affect the comparability of our operating results and financial condition include:
Fiscal 2019
Continuing Operations:
On June 7, 2019, we completed the acquisition of Systron Donner Inertial, Inc. (“SDI”), a private-equity backed navigation systems provider with a scalable, chip-based platform for higher volume gyro applications utilizing Quartz MEMS technology. The total purchase price was approximately $25.0 million, consisting of (i) approximately $22.8 million in cash, subject to certain working capital adjustments and (ii) the issuance of 810,698 shares of common stock with an aggregate value of approximately $3.0 million as of the closing date. Subsequent to the closing, we calculated the working capital adjustment and determined that our aggregate purchase price should be reduced by approximately $0.7 million, which was paid in the three months ended September 30, 2019. Following the closing, we began integrating SDI into our Navigation Systems product line and have included the financial results of SDI in our condensed consolidated financial statements beginning on the acquisition date. Net revenue and net loss of SDI from the acquisition date through September 30, 2019 of $9.8 million and $0.6 million, respectively, is included in our consolidated statements of operations and comprehensive (loss) income for the fiscal year ended September 30, 2019. Acquired assets of SDI comprise 25% of the total consolidated assets as of September 30, 2019.
We recorded a $4.7 million inventory write-down on CATV products and a $1.3 million write-downe on non-current inventory in the fiscal year ended September 30, 2019 due to the decline in sales and future demand of the inventory.
We incurred approximately $0.8 million of merger and acquisition costs in the fiscal year ended September 30, 2019 in conjunction with the acquisition of SDI.
We recorded an award to Phoenix Navigation Components, LLC (“Phoenix”) of attorneys’ fees and costs in the amount of approximately $3.8 million. In connection with the litigation proceedings involving Phoenix, we incurred approximately $5.7 million of legal expenses.
Fiscal 2018
Continuing Operations:
We recorded a $1.0 million write-down on non-current inventory in the fiscal year ended September 30, 2018 due to the decline in sales and future demand of the inventory.
As a result of the revision in the estimated amount and timing of cash flows for Asset Retirement Obligations (“ARO” or “AROs”) during the fiscal year ended September 30, 2018, the Company increasedhas adopted certain provisions within the ARO liability by $0.1 million and recorded a loss from change in estimate on ARO liability.amendments to Regulation S-K that eliminate Item 301.
Fiscal 2017
Continuing Operations:
| |
• | We recorded a charge to impairments of approximately $0.5 million in the fiscal year ended September 30, 2017 in connection with the transition of our manufacturing operations in China to a new manufacturing facility. See Note 9 - Property, Plant, and Equipment, net for additional information. |
| |
• | During the fiscal year ended September 30, 2017, the Company recorded charges of $2.0 million related to various reductions in workforce primarily related to the outsourcing of our wafer fabrication lab and operations assembly and the opening of our new manufacturing facility in China. See Note 10 - Accrued Expenses and Other Current Liabilities for additional information. |
Fiscal 2016
Continuing Operations:
On July 5, 2016, the Company declared a special cash dividend of $1.50 per share of the Company's common stock, for a total of $39.2 million. The dividend was paid on July 29, 2016 to shareholders of record as of the close of business on July 18, 2016.
On September 23, 2014, Sumitomo Electric Industries, Ltd. ("SEI") filed for arbitration against EMCORE, in accordance with the terms of the Master Purchase Agreement between the parties. SEI was seeking $47.5 million from EMCORE, relating to numerous claims. On April 12, 2016, the International Court of Arbitration tribunal rejected SEI's claims. The panel ruled that EMCORE owed SEI none of the amounts SEI sought in the arbitration and that the Company was entitled to collect the $1.9 million held in escrow, which was received in June 2016 and was included in cash at September 30, 2016. The Company was also entitled to recover $2.6 million in legal fees and costs from SEI, which was received in June 2016 and has been recorded by EMCORE within operating income.
In September 2016, the Company paid $2.9 million previously accrued related to a termination fee for terminating a prior joint venture agreement.
During fiscal year 2016, the Company paid $6.1 million for the purchase of long-term inventory as a result of the vendor announcing it would cease manufacturing a part.
Discontinued Operations:
As a result of the SEI arbitration tribunal ruling above, during the fiscal year ended September 30, 2016, we recognized a gain associated with the release of $3.4 million of previously deferred gain associated with the sale of assets and reversal of other liabilities of $0.4 million, resulting in a credit of $3.8 million to recognition of previously deferred gain on sale of assets within discontinued operations of the Digital Products Business.
Fiscal 2015
Continuing Operations:
Common Stock Repurchase: In April 2015, EMCORE's Board of Directors authorized the Company to repurchase $45.0 million of shares of its common stock. On May 15, 2015, we announced the commencement of a modified "Dutch auction" tender offer to purchase for cash shares of our common stock (the "Tender Offer"). On June 15, 2015, we completed the Tender Offer and purchased 6.9 million shares of our common stock at a purchase price of $6.55 per share, for an aggregate cost of $45.0 million excluding fees and expenses. Repurchased common stock was recorded to treasury stock. The Company incurred costs of $0.7 million in connection with the Tender Offer, which were recorded to treasury stock.
AROs: As a result of the revision in the estimated amount and timing of cash flows for AROs during the fiscal year ended September 30, 2015, the Company reduced ARO liability by $2.9 million with an offsetting reduction
to property, plant, and equipment, net of $2.1 million, and recorded a gain from change in estimate on ARO of $0.8 million. The Company first reduced the net leasehold improvement asset to the extent of the carrying amount of the related asset initially recorded when the ARO was established. The amount of the remaining reduction to the ARO liability was recorded as a reduction to operating expenses.
Discontinued Operations:
Photovoltaic and Digital Products Asset Sales: On December 10, 2014, SolAero Technologies Corporation (“SolAero”) purchased substantially all of the assets, and assumed substantially all of the liabilities, related to or used in connection with the Company’s photovoltaics business, including EMCORE’s subsidiaries EMCORE Solar Power, Inc. and EMCORE IRB Company, LLC (collectively, the “Photovoltaics Business”), for $149.9 million in cash, after giving effect to a $0.1 million working capital adjustment finalized and paid during the fiscal year ended September 30, 2015. On January 2, 2015, NeoPhotonics Corporation acquired certain assets, and assumed certain liabilities, of the Company’s telecommunications business (the “Digital Products Business”), for $17.0 million in cash and a notes receivable that was paid in April 2015. These asset sales are reported as discontinued operations, which require retrospective restatement of prior periods to classify the results of operations for the businesses sold as discontinued operations. No assets or liabilities that were sold from either the Photovoltaic Business or Digital Products Business remain on the consolidated balance sheet as of September 30, 2019, 2018, 2017 and 2016.
ITEM 7. Management’s Discussion and Analysis of Financial Condition and Results of Operations
Business Overview
EMCORE Corporation (referred to herein, together with its subsidiaries, as the “Company,” “we,” “our,” or “EMCORE”) was establishedis a leading provider of sensors for navigation in 1984the aerospace and defense market as well as a New Jersey corporation. The Company became publicly tradedmanufacturer of lasers and optical subsystems for use in 1997 and is listed on the Nasdaq Stock Exchange under the ticker symbol EMKR. EMCORECable TV ("CATV") industry.
We pioneered the linear fiber optic transmission technology that enabled the world’s first delivery of Cable TVCATV directly on fiber, and today is a leading provider of advanced Mixed-Signal Opticsmixed-signal products that enableserving the aerospace and defense and broadband communications systems and service providers to meet growing demand for increased bandwidth and connectivity.markets. The Mixed-Signal Opticsmixed-signal technology, at the heart of our broadband communications products, is shared with our fiber optic gyrosgyroscopes ("FOG") and inertial sensors to provide the aerospace and defense markets with state-of-the-art navigationsnavigation systems technology. With both analogWe have fully vertically-integrated manufacturing capability through our indium phosphide ("InP") compound semiconductor wafer fabrication facility at our headquarters in Alhambra, CA, and digital circuits on multiple chips, or even a singlethrough our quartz processing and sensor manufacturing facility in Concord, CA. These facilities support our vertically-integrated manufacturing strategy for quartz and FOG products for navigation systems, and for our chip, the valuelaser, transmitter, and receiver products for broadband applications.
We have two reporting segments: (a) Aerospace and Defense and (b) Broadband. Aerospace and Defense is comprised of Mixed-Signal device solutions two product lines: (i) Navigation and Inertial Sensing, and (ii) Defense Optoelectronics. Broadband is often far greater than traditional digital applicationscomprised of three product lines: (i) CATV Lasers and requires a specialized expertise held by EMCORE which is unique in the optics industry.Transmitters, (ii) Chip Devices, and (iii) Other Optical Products.
Recent Developments
On June 7, 2019,
COVID-19
We are subject to ongoing risks and uncertainties as a result of the COVID-19 pandemic. The full extent of the COVID-19 impact on operational and financial performance is highly uncertain, out of our control, and cannot be predicted.
Each region we completedand our supply chain partners operate in has been affected by COVID-19 at varying times and magnitudes, often creating unforeseen challenges associated with logistics, raw material supply and labor shortages. Many of our suppliers have at times temporarily ceased or limited operations as a result of COVID-19 and failed to deliver parts or components to us.
For example, at various times during the acquisitionfiscal year ended September 30, 2021, unexpected delays and cancellations of SDI, a private-equity backed navigation systems providerkey component deliveries required us to source critical components from alternative sources and, in some cases, forced us to design in alternative parts and qualify them with a scalable, chip-based platform for higher volume gyro applications utilizing Quartz MEMS technology. See Note 4 - Acquisitioncustomers on short schedules, and COVID-19 transmission in Thailand negatively affected production levels of our CATV Lasers and Transmitters products by our contract manufacturer located there. These and other actions resulting from the effects of COVID-19 may continue in the notesfuture and cause additional challenges to and disruptions of our business, inventory levels, operating results, and cash flows.
In addition, restrictions related to the COVID-19 pandemic have negatively affected the timing of the sale and transfer of certain CATV module and transmitter manufacturing equipment to Hytera and Fastrain (each as defined below), as described in more detail below under “Hytera and Fastrain Transactions”. Travel into Thailand by manufacturing engineers to support the transfer has at times been difficult. While we are taking actions within our supply chain and manufacturing operations to mitigate the effects of these delays and now expect the transfer to be completed during the quarter ending March 31, 2022, the timing and completion of these transfers may be further disrupted as a result of COVID-19, which could delay recognition of the anticipated benefits of transferring this equipment and could disrupt manufacturing activities for these products.
Our customer orders to date have generally remained stable with our pre-COVID-19 outlook, except with respect to customer orders related to the CATV Lasers and Transmitters product line, which have increased compared to our consolidated financial statementspre-COVID-19 outlook. However, qualification testing for additional information regarding this acquisition. Following the closing,certain of our products has been delayed due to customer engineering shortages and limitations on their ability to access their facilities, and development timelines for certain programs have been extended. We continue to analyze on an ongoing basis how COVID-19 related actions could affect our product development efforts, future customer demand, timing of orders, recognized revenues, and cash flows.
Equity Offering
On February 16, 2021, we began integrating SDI intoclosed an offering of 6,655,093 shares of our current navigation product line and havecommon stock, which included the financial resultsfull exercise of SDIthe underwriters’ option to purchase 868,056 additional shares of common stock, at a price to the public of $5.40 per share, resulting in our consolidated financial statements beginning onnet proceeds to us from the acquisition date.offering, after deducting the underwriting discounts and commissions and other offering expenses, of approximately $33.1 million. The shares were sold by us pursuant to an underwriting agreement with Cowen and Company, LLC, dated February 10, 2021.
Hytera and Fastrain Transactions
As part of the effort to streamline operations and move to a variable cost model in our Cable TVCATV Lasers and Transmitters product lines,line, on October 25, 2019, we entered into an Asset Purchase Agreement (the “Purchase“Hytera Asset Purchase Agreement”) with Hytera Communications (Hong Kong) Company Limited, a limited liability company incorporated in Hong Kong (“Hytera HK”), and Shenzhen Hytera Communications Co., Ltd., a corporation formed under the laws of the P.R.C. (“Shenzhen Hytera”, and together with Hytera HK, the “Buyers”“Hytera”), pursuant to which the BuyersHytera agreed to purchase from EMCOREus certain CATV module and transmitter manufacturing equipment (the “Equipment”) that we owned by EMCORE and currentlythat was located at the manufacturing facility of EMCORE’sour wholly-owned subsidiary, EMCORE Optoelectronics (Beijing) Co, Ltd., a corporation formed under the laws of the P.R.C..
On August 9, 2021, we entered into an Asset Purchase Agreement (the “Fastrain Asset Purchase Agreement”) with each of Shenzhen Fastrain Technology Co., Ltd., a corporation formed under the laws of the P.R.C. (“Shenzhen Fastrain”), and Hong Kong Fastrain Company Limited, a limited liability company incorporated in Hong Kong (“HK Fastrain”, and together with Shenzhen Fastrain, collectively, “Fastrain”), pursuant to which, among other items, Fastrain agreed to purchase all of the Equipment subject to the Hytera Asset Purchase Agreement, along with certain other equipment owned by us, for an aggregate purchase price of approximately $5.54 million.
The$6.2 million, of which (a) $3.8 million had been paid to us as of September 30, 2021 and (b) $2.4 million remains to be paid to us in connection with Equipment willcurrently located at our Beijing facility and to be transferred pursuant to the Buyers in three separateone or more closings which are expected to occur during the quarters ending December 31, 2019on dates mutually agreed between us and March 31, 2020, with payment for each portion of the equipment to be made following such transfer in an amount equal to (i) 80% of the applicable sale price within three months following the closing of the applicable sale and transfer and (ii) 20% of the applicable sale price within six months following the closing of the applicable sale and transfer. In October 2019, we received the first such payment in an amount equal to approximately $1.9 million.Fastrain.
Concurrently with entry into the execution of the Fastrain Asset Purchase Agreement, we and Fastrain entered into a Contract Manufacturing Supply Agreement, dated August 9, 2021 (the “Manufacturing“Fastrain Manufacturing Agreement”), dated as of October 25, 2019, with the Buyers pursuant to which the BuyersFastrain agreed to manufacture certain CATV module and transmitter products for EMCOREus, from a manufacturing facility located in Thailand and for an initial five year term at product prices agreed to betweenending on December 31, 2025, the parties.CATV Laser and Transmitter products set forth in the Fastrain Manufacturing Agreement. In the Fastrain Manufacturing Agreement, (a) we agreed to pay certain shortfall penalties in the event that orders for manufactured products are below certain thresholds which penalties shall not exceed $660,000beginning in anycalendar year 2021 and continuing through calendar year 2025, and (b) Fastrain agreed to pay certain surplus bonuses to EMCORE in the event that deliveries for manufactured products in either of the first24 month periods beginning on January 1, 2021 and ending on December 31, 2022 or beginning on January 1, 2023 and ending on December 31, 2024 exceed certain thresholds.
As described under “COVID-19” above, travel restrictions related to the COVID-19 pandemic have negatively affected the timing of the sale and transfer of some of the Equipment to Hytera and Fastrain. The transfer of the Equipment currently remaining at our Beijing facility is now expected to occur during the fiscal year ending September 30, 2022, with corresponding payments totaling $2.4 million expected to be received during the fiscal year ending September 30, 2022.
PPP Loan
In May 3, 2020, we entered into a Paycheck Protection Program Promissory Note and Agreement (the “PPP Loan Agreement”) with Wells Fargo Bank, N.A. (“Wells Fargo”) under the Paycheck Protection Program established under the Coronavirus Aid, Relief and Economic Security Act and administered by the U.S. Small Business Administration (the “SBA”) to receive loan proceeds of approximately $6.5 million (the “PPP Loan”), which we received on May 6, 2020. On July 12, months periods,2021, we received a notification from Wells Fargo that the SBA approved our PPP Loan forgiveness application for the entire PPP Loan balance of approximately $6.5 million, including all accrued interest thereon, and which will not exceed approximately US$5.54that the remaining PPP Loan balance is zero. The forgiveness of the PPP Loan was recognized during our fiscal quarter ended June 30, 2021.
Other Significant Actions that Affect the Comparability of Our Operating Results and Financial Condition
Customer Settlement Agreement
On November 17, 2020, we entered into an agreement with a customer to resolve certain potential product claims (the “Customer Settlement Agreement”). In exchange for a release of any and all potential claims the customer may have related to the applicable product, we have agreed to provide up to $1.5 million of product discounts on future purchases from us by the customer. We recorded the full potential expense of $1.5 million in the aggregate followingfiscal year ended September 30, 2020 within Research and Development expense.
Systron Donner Inertial, Inc. Acquisition
On June 7, 2019, we completed the fifth suchacquisition of Systron Donner Inertial, Inc. ("SDI"), a navigation systems provider with a scalable, chip-based platform for higher volume gyro applications utilizing QMEMS technology. Following the closing, we began integrating SDI into our current Navigation and Inertial Sensing product line and have included the financial results of SDI in the consolidated financial statements beginning on the acquisition date. We incurred approximately $0.8 million of merger and acquisition costs in the fiscal year ended September 30, 2019 in conjunction with the acquisition of SDI.
Concord Sale/Leaseback Transaction
In February 2020, SDI sold its property located in Concord, California (the "Concord Real Property") to Eagle Rock Holdings, LP ("Eagle Rock"), an affiliate of Parkview Management Group, Inc. for a total purchase price of $13.2 million pursuant to a Standard Offer, Agreement and Escrow Instructions for Purchase of Real Estate (Non-Residential), dated December 31, 2019, by and between SDI and Eagle Rock, as amended by that certain First Amendment to Standard Offer, Agreement and Escrow Instructions for Purchase of Real Estate (Non-Residential), dated January 13, 2020, by and between SDI and Eagle Rock (as amended, the "Concord Purchase Agreement"). SDI received net proceeds of $12.8 million after transaction commissions and expenses incurred in connection with the sale of the Concord real Property.
At the consummation of the sale of the Concord Real Property, SDI entered into a Single-Tenant Triple Net Lease (the “Concord Lease Agreement”) with Eagle Rock pursuant to which SDI leased back from Eagle Rock the Concord Real Property for a term commencing in February 2020 and ending in February 2035, unless earlier terminated or extended in accordance with the terms of the Concord Lease Agreement. Under the Concord Lease Agreement, SDI’s financial obligations include base monthly rent of $0.75 per square foot, or approximately $77,500 per month, during the initial 12 month period.period of February 2020 through February 2021, which increases on an annual basis at 3.0% over the life of the lease. SDI is also responsible for all monthly expenses related to the Concord Real Property, including insurance premiums, taxes and other expenses, such as utilities. In connection with the execution of the Concord Lease Agreement, we executed a Lease Guaranty with Eagle Rock under which we guaranteed the payment when due of the monthly rent, and all other additional rent, interest and charges to be paid by SDI under the Concord Lease Agreement.
Additionally, we completed two other actions
Other Actions Related to CATV Lasers and Transmitters Business
We recorded a $4.7 million inventory write-down on CATV Lasers and Transmitters products and a $1.3 million write-down on non-current inventory in the fiscal year ended September 30, 2019 due to the decline, at such time, in sales and future demand of the inventory. In the quarter ended September 30, 2019, by reducingwe also reduced the size of our CATV-relatedCATV Lasers and Transmitters -related employee headcount and reducingreduced the capacity of our wafer fab to one shift.shift, and in January 2020, we further reduced the
size of our employee headcount. These actions incurred one-time costs of $0.4 million in the quarter ended September 30, 2019 and are expected to result in annual cash savings of approximately $3.0$0.4 million beginning in the December 2019 quarter. These operational changesquarter ended March 31, 2020 and, together with previously-disclosed headcount reductions at our Beijing, China facility and the continuing shift to a variable cost model in our CATV alsoLasers and Transmitters product line as described under “Hytera and Fastrain Transactions” above, fulfill a strategic objective of better positioning the CATV Lasers and Transmitters product linesline to generate positive cash flow to help fund the other growth areas of EMCORE inincluding Aerospace and Defense.Defense Chip Devices, and Other Optical Products.
During the fiscal year ended September 30, 2019, we recorded an award to Phoenix of attorneys’ fees and costs in the amount of approximately $3.8 million. In connection with the litigation proceedings involving Phoenix, we incurred approximately $5.7 million of legal expenses in aggregate during the fiscal years ended September 30, 2018 and 2019.
Critical Accounting Policies
The discussion and analysis of our financial condition and results of operations are based upon our consolidated financial statements, which have been prepared in accordance with U.S. GAAP. The preparation of consolidatedthese financial statements in conformity with U.S. GAAP requiresrequire us to make estimates and assumptionsjudgements in applying our most critical accounting policies that affectcan have a significant impact on the reported amounts of assets and liabilities and disclosure of contingent assets and liabilities, as of the date of theresults we report in our financial statements, and the reported amounts of revenue and expenses during the reported period.
statements. We develop estimates based on historical experience and on various assumptions about the future that are believed to be reasonable based on the best information available to us. OurThe reported financial position or results of operations may be materially different under changed conditions or when using different estimates and assumptions, particularly with respect to significant accounting policies. In the event that estimates or assumptions prove to differ from actual results, adjustments are made in subsequent periods to reflect more current information. A listing and description of our
The SEC has defined critical accounting policies includesas those that are most important to the following:portrayal of our financial condition and results and which require our most difficult, complex, or subjective judgments or estimates. Based on this definition, our most critical accounting policies include revenue recognition, which impacts the recording of revenue; inventory valuation, which impacts the cost of goods sold and gross margin; assessment of goodwill and long-lived assets, which impacts the impairment of the respective assets; share-based compensation, which impacts costs of goods sold and operating expenses; loss contingencies, which impacts operating expenses; and income taxes, which impacts the income tax provision. These policies and significant judgments involved are discussed further below. We have other significant accounting policies that do not generally require subjective estimates or judgments or would not have a material impact on our results of operations. Our significant accounting policies are described in Item 8, Note 2 - Summary of Significant Accounting Policies.
Revenue Recognition
We recognize revenue in accordance with the Financial Accounting Standards Board ("FASB") Accounting Standards Codification (“ASC”) 606 Revenue from Contracts with Customers. The majority of our products have shipping terms that are free on board or free carrier alongside shipping point, which means that we fulfill our delivery obligation and control has transferred to the customer when the goods are handed over to the freight carrier at our shipping dock. In those instances where inventory is maintained at a consigned location, revenue is recognized only when our customer pulls product for use and control has transferred to the customer. Any warranty cost and remaining obligations that are inconsequential or perfunctory are accrued when the corresponding revenue is recognized.
Income Taxes
In accordance with the authoritative guidance on accounting for income taxes, we recognize income taxes using an asset and liability approach. This approach requires the recognition of taxes payable or refundable for the current year and deferred tax liabilities and assets for the future tax consequences of events that have been recognized in the consolidated financial statements or tax returns. The measurement of current and deferred taxes is based on provisions of the enacted tax law. The effects of future changes in tax laws or rates are not anticipated.
The authoritative guidance provides for recognition of deferred tax assets if the realization of such deferred tax assets is more likely than not to occur based on an evaluation of all available evidence, both positive and negative, and the relative weight of the evidence. We have determined that at this time it is more likely than not that deferred tax assets attributable to all other items will not be realized, primarily due to uncertainties related to the ability to utilize net operating loss carryforwards before they expire. Accordingly, we have established a valuation allowance for such deferred tax assets which we do not expect to realize. If there is a change in the ability to realize deferred tax assets for which a valuation allowance has been established, then the tax valuation allowance may decrease in the period in which we determine that realization is more likely than not.
Likewise, if we determine that it is not more likely than not that deferred tax assets will be realized, then a valuation allowance may be established for such deferred tax assets and the tax provision may increase in the period in which we make the determination. See Note 10 - Income and Other Taxes in the Notes to Consolidated Financial Statements for additional information related to income taxes.
Inventory
Inventory is stated at the lower of cost or net realizable value (first-in, first-out). Inventory that is expected to be used within the next 12twelve months is classified as current inventory. We write-down inventory once it has been determined that conditions exist that may not allow the inventory to be sold for its intended purpose or the inventory is determined to be excess or obsolete based on assumptions about future demand and market conditions. The charge related to inventory write-downs is recorded as a cost of revenue. We evaluate inventory levels at least quarterly against sales forecasts on a significant part-by-part basis, in addition to determining its overall inventory risk. We have incurred, and may in the future incur, charges to write-down our inventory. See Note 86 - Inventory in the notesNotes to the consolidated financial statementsConsolidated Financial Statements for additional information related to our inventory.
Income Taxes
In accordance with the authoritative guidance on accounting for income taxes, we recognize income taxes using an asset and liability approach. This approach requires the recognition of taxes payable or refundable for the current year and deferred tax liabilities and assets for the future tax consequences of events that have been recognized in our consolidated financial statements or tax returns. The measurement of current and deferred taxes is based on provisions of the enacted tax law and the effects of future changes in tax laws or rates are not anticipated.
The authoritative guidance provides for recognition of deferred tax assets if the realization of such deferred tax assets is more likely than not to occur based on an evaluation of all available evidence, both positive and negative, and the relative weight of the evidence. We have determined that at this time it is more likely than not that deferred tax assets attributable to all other items will not be realized, primarily due to uncertainties related to our ability to utilize our net operating loss carryforwards
before they expire. Accordingly, we have established a valuation allowance for such deferred tax assets which we do not expect to realize. If there is a change in our ability to realize our deferred tax assets for which a valuation allowance has been established, then our tax valuation allowance may decrease in the period in which we determine that realization is more likely than not. Likewise, if we determine that it is not more likely than not that deferred tax assets will be realized, then a valuation allowance may be established for such deferred tax assets and our tax provision may increase in the period in which we make the determination. See Note 12 - Income and other Taxes in the notes to the consolidated financial statements for additional information related to our income taxes.
Business Combinations
We apply significant estimates and judgments in order to determine the fair value of the identified tangible and intangible assets acquired, liabilities assumed and goodwill recognized in business combinations. The value of all assets and liabilities are recognized at fair value as of the acquisition date using a market participant approach. In measuring the fair value, we utilize a number of valuation techniques consistent with the market, income or cost approaches. To estimate fair value, we are required to make certain estimates and assumptions, including future economic and market conditions.
Revenue Recognition
We recognize revenue in accordance with the Financial Accounting Standards Board’s (“FASB”) Accounting
Standards Codification (“ASC”) 606 Revenue from Contracts with Customers. The majority of our products have shipping terms that are free on board or free carrier alongside (“FCA”) shipping point, which means that we fulfill our delivery obligation and control has transferred to the customer when the goods are handed over to the freight carrier at our shipping dock. In those instances where inventory is maintained at a consigned location, revenue is recognized only when our customer pulls product for use and control has transferred to the customer. Any warranty cost and remaining obligations that are inconsequential or perfunctory are accrued when the corresponding revenue is recognized.
***
The above listing is not intended to be a comprehensive list of all of our accounting policies. In many cases, U.S. GAAP specifically dictates the accounting treatment of a particular transaction. There are also areas in which management'smanagement’s judgment in selecting any available alternative would not produce a materially different result. For a complete discussion of our accounting policies, recently adopted accounting pronouncements, and other required U.S. GAAP disclosures, we refer you to the accompanying notesNotes to our consolidated financial statementsConsolidated Financial Statements in this Annual Report.
Results of Operations
The following table sets forth our consolidated statementsCondensed Consolidated Statements of operations data expressedOperations and Comprehensive Income (Loss) as a percentage of revenue:
| | | | | | | | | | | | | | | | | |
| For the Fiscal Year Ended September 30, |
| 2021 | | 2020 | | 2019 |
| Revenue | 100.0 | % | | 100.0 | % | | 100.0 | % |
| Cost of revenue | 61.2 | | | 67.7 | | | 82.7 | |
| Gross profit | 38.8 | | | 32.3 | | | 17.3 | |
| Operating expense: | | | | | |
| Selling, general, and administrative | 15.5 | | | 22.4 | | | 36.8 | |
| Research and development | 11.0 | | | 18.4 | | | 22.3 | |
| Loss (gain) on sale of assets | 0.3 | | | (2.1) | | | (0.3) | |
| Total operating expense | 26.8 | | | 38.7 | | | 58.8 | |
| Operating income (loss) | 12.0 | | | (6.4) | | | (41.5) | |
| Other income: | | | | | |
| Gain on extinguishment of debt | 4.1 | | | — | | | — | |
| Interest income (expense), net | 0.3 | | | (0.1) | | | 0.7 | |
| Foreign exchange gain (loss) | 0.1 | | | 0.2 | | | (0.5) | |
| Total other income | 4.6 | | | 0.1 | | | 0.2 | |
| Income (loss) before income tax expense | 16.5 | | | (6.3) | | | (41.3) | |
| Income tax expense | (0.4) | | | (0.1) | | | (0.1) | |
| Net income (loss) | 16.2 | % | | (6.4) | % | | (41.2) | % |
| Foreign exchange translation adjustment | (0.1) | | | — | | | — | |
| Comprehensive income (loss) | 16.0 | % | | (6.4) | % | | (41.2) | % |
|
| | | | | | | | |
| | For the Fiscal Years ended September 30, |
| | 2019 | | 2018 | | 2017 |
| Revenue | 100.0 | % | | 100.0 | % | | 100.0 | % |
| Cost of revenue | 82.7 |
| | 78.4 |
| | 65.4 |
|
| Gross profit | 17.3 |
| | 21.6 |
| | 34.6 |
|
| Operating expense: | | | | | |
| Selling, general, and administrative | 36.8 |
| | 24.8 |
| | 18.1 |
|
| Research and development | 22.3 |
| | 18.0 |
| | 10.2 |
|
| Impairments | — |
| | — |
| | 0.4 |
|
| Gain from change in estimate on ARO | — |
| | 0.2 |
| | — |
|
| (Gain) loss on sale of assets | (0.3 | ) | | — |
| | (0.4 | ) |
| Total operating expense | 58.8 |
| | 43.0 |
| | 28.3 |
|
| Operating (loss) income | (41.5 | ) | | (21.4 | ) | | 6.3 |
|
| Other income: | | | | | |
| Interest income, net | 0.7 |
| | 0.9 |
| | 0.2 |
|
| Foreign exchange (loss) gain | (0.5 | ) | | (0.5 | ) | | 0.1 |
|
| Other income | — |
| | 0.1 |
| | 0.2 |
|
| Total other income | 0.2 |
| | 0.5 |
| | 0.5 |
|
| (Loss) income before income tax (expense) benefit | (41.3 | ) | | (20.9 | ) | | 6.8 |
|
| Income tax (expense) benefit | (0.1 | ) | | 0.5 |
| | (0.1 | ) |
| Net (loss) income | (41.2 | )% | | (20.4 | )% | | 6.7 | % |
Comparison of Financial Results for the Fiscal Years ended September 30, 2019 and 2018of Operations
| | | | | | | | | | | | | | | | | | | | | | | |
| For the Fiscal Year Ended September 30, | | | | |
| (in thousands, except percentages) | 2021 | | 2020 | | Change |
| Revenue | $ | 158,444 | | | $ | 110,128 | | | $ | 48,316 | | | 43.9 | % |
| Cost of revenue | 96,956 | | | 74,546 | | | 22,410 | | | 30.1 | |
| Gross profit | 61,488 | | | 35,582 | | | 25,906 | | | 72.8 | |
| Operating expense: | | | | | | | |
| Selling, general, and administrative | 24,544 | | | 24,631 | | | (87) | | | (0.4) | |
| Research and development | 17,448 | | | 20,269 | | | (2,821) | | | (13.9) | |
| Loss (gain) on sale of assets | 515 | | | (2,284) | | | 2,799 | | | 122.5 | |
| Total operating expense | 42,507 | | | 42,616 | | | (109) | | | (0.3) | |
| Operating income (loss) | 18,981 | | | (7,034) | | | 26,015 | | | 369.8 | |
| Other income: | | | | | | | |
| Gain on extinguishment of debt | 6,561 | | | — | | | 6,561 | | | 100.0 | |
| Interest income (expense), net | 466 | | | (104) | | | 570 | | | 548.1 | |
| Foreign exchange gain | 207 | | | 198 | | | 9 | | | 4.5 | |
| Total other income | 7,234 | | | 94 | | | 7,140 | | | 7595.7 | |
| Income (loss) before income tax expense | 26,215 | | | (6,940) | | | 33,155 | | | 477.7 | |
| Income tax expense | (572) | | | (60) | | | (512) | | | (853.3) | |
| Net income (loss) | $ | 25,643 | | | $ | (7,000) | | | $ | 32,643 | | | 466.3 | % |
| Foreign exchange translation adjustment | (231) | | | (32) | | | (199) | | | (621.9) | |
| Comprehensive income (loss) | $ | 25,412 | | | $ | (7,032) | | | $ | 32,444 | | | 461.4 | % |
|
| | | | | | | | | | | | | |
| (in thousands, except percentages) | For the Fiscal Years ended September 30, |
| | 2019 | | 2018 | | $ Change | | % Change |
| Revenue | $ | 87,265 |
| | $ | 85,617 |
| | $ | 1,648 |
| | 1.9% |
| Cost of revenue | 72,176 |
| | 67,130 |
| | 5,046 |
| | 7.5% |
| Gross profit | 15,089 |
| | 18,487 |
| | (3,398 | ) | | (18.4)% |
| Operating expense: | | | | | | | |
| Selling, general, and administrative | 32,094 |
| | 21,232 |
| | 10,862 |
| | 51.2% |
| Research and development | 19,443 |
| | 15,387 |
| | 4,056 |
| | 26.4% |
| Gain from change in estimate on ARO | (14 | ) | | 145 |
| | (159 | ) | | (109.7)% |
| Loss on sale of assets | (302 | ) | | 34 |
| | (336 | ) | | (988.2)% |
| Total operating expense | 51,221 |
| | 36,798 |
| | 14,423 |
| | 39.2% |
| Operating loss | (36,132 | ) | | (18,311 | ) | | (17,821 | ) | | (97.3)% |
| Other income (expense): | | | | | | | |
| Interest income, net | 629 |
| | 733 |
| | (104 | ) | | (14.2)% |
| Foreign exchange gain | (427 | ) | | (434 | ) | | 7 |
| | 1.6% |
| Total other income | 202 |
| | 409 |
| | (207 | ) | | (50.6)% |
| Loss before income tax (expense) benefit | (35,930 | ) | | (17,902 | ) | | (18,028 | ) | | (100.7)% |
| Income tax (expense) benefit | (54 | ) | | 449 |
| | (503 | ) | | (112.0)% |
| Net loss | $ | (35,984 | ) | | $ | (17,453 | ) | | $ | (18,531 | ) | | (106.2)% |
Comparison of Revenue
| | | | | | | | | | | | | | | | | | | | | | | |
| For the Fiscal Year Ended September 30, | | | | |
| (in thousands, except percentages) | 2021 | | 2020 | | Change |
| Aerospace and Defense | $ | 50,838 | | | $ | 55,240 | | | $ | (4,402) | | | (8.0) | % |
| Broadband | 107,606 | | | 54,888 | | | 52,718 | | | 96.0 | |
| Total revenue | $ | 158,444 | | | $ | 110,128 | | | $ | 48,316 | | | 43.9 | % |
Aerospace and Defense
For the fiscal year ended September 30, 2019,2021, revenue increased 1.9%decreased $4.4 million, or 8.0%, compared to the same period in the prior year, due to lower Navigation and Inertial Sensing and Defense Optoelectronics revenue. The Navigation and Inertial Sensing revenue decrease was due primarily driven by an increase in sales volume within our Chip Devicesto lower FOG revenue, where customer demand under a large single-axis gyro program fluctuated down during the first half of fiscal 2021 and Navigation Systems product linewhere non-recurring engineering contract revenue partially offset by lower sales volume of our CATV systems portion of our Broadband product category. Included in Navigation Systems product linedecreased. Lower QMEMS revenue, is $9.8 million of revenue from SDI for the period of June 7, 2019 through September 30, 2019. The increase in the Chip Devices and Navigation Systems product line revenue aredue primarily the result of increased sales to two significant customers in the year ended September 30, 2019 compared to the prior year. The decrease in CATV sales is primarily the result of a decline in market demandrevenue from pandemic-impacted commercial aviation programs, also contributed to the decrease in Navigation and Inertial Sensing revenue. The Defense Optoelectronics revenue decrease was caused by a drop in product shipments during the second half of fiscal 2021 due primarily to the delay in orders on one large program as well as supply chain interruptions associated with a contract manufacturer transition.
Broadband
For the fiscal year ended September 30, 2019 and a significant customer purchasing a large inventory accumulation2021, revenue increased $52.7 million, or 96.0%, compared to the same period in the fiscalprior year, ended September 30, 2018.driven by increased customer demand. Increased customer demand arose in part from an increase in investment by CATV multiple-system operators (“MSO”) in their networks to address the bottlenecks created by bandwidth demands from both work-from-home initiatives and “stay at home” entertainment.
Gross Profit
| | | | | | | | | | | | | | | | | | | | | | | |
| For the Fiscal Year Ended September 30, | | | | |
| (in thousands, except percentages) | 2021 | | 2020 | | Change |
| Aerospace and Defense | $ | 13,705 | | | $ | 16,729 | | | $ | (3,024) | | | (18.1) | % |
| Broadband | 47,783 | | | 18,853 | | | 28,930 | | | 153.5 | |
| Total gross profit | $ | 61,488 | | | $ | 35,582 | | | $ | 25,906 | | | 72.8 | % |
Our cost
Cost of revenue consists of raw materials, compensation expense including non-cash stock-based compensation expense, depreciation expense and other manufacturing overhead costs, expenses associated with excess and obsolete inventories, and product warranty costs. Historically, our cost of revenue as a percentage of revenue, which we refer to as our gross margin, has fluctuated significantly due to product mix, manufacturing yields, and sales volumes, and inventory and specific product warranty charges.charges, as well as the amount of our revenue relative to fixed manufacturing costs.
Consolidated gross margins were 17.3%38.8% and 21.6%32.3% for the fiscal years ended September 30, 20192021 and 2018,2020, respectively.
Stock-based compensation expense within cost of revenue totaled approximately $0.5$0.8 million during each ofand $0.7 million for the fiscal years ended September 30, 20192021 and 2018.2020, respectively.
Aerospace and Defense
For the fiscal year ended September 30, 2019,2021, Aerospace and Defense gross profit decreased by 18.4% when$3.0 million, or 18.1%, compared to the same period in the prior year. The decreaseyear, primarily due to lower revenue. For the fiscal years ended September 30, 2021 and 2020, Aerospace and Defense gross margin was 27.0% and 30.3%, respectively. Gross margin in gross profit for the fiscal year ended September 30, 2019 was primarily2021 decreased due to an increaselower product sales resulting from decreased customer program demand, which resulted in product costs and inventory related charges related to excess and obsolete inventory. The decrease in gross margin forlower absorption of fixed costs. During the fiscal year ended September 30, 20192021, there was primarily duea shift of product mix to products requiring a higher level of technical performance, which resulted in lower revenuesyields and higher product costs.
Broadband
For the fiscal year ended September 30, 2021, Broadband gross profit increased $28.9 million, or 153.5%, compared to the same period in the prior year, primarily driven by higher product revenue. For the fiscal years ended fiscal years ended September 30, 2021 and 2020, Broadband gross margin was 44.4% and 34.3%, respectively. The gross margin in the fiscal year ended September 30, 2021 increased driven by higher levels of product revenue and factory utilization.
Selling, General and Administrative (“SG&A”)
Selling, general, and administrative ("SG&A&A") consists primarily of compensation expense including non-cash stock-based compensation expense related to executive, finance, and human resources personnel, as well as sales and marketing expenses, professional fees, legal and patent-related costs, and other corporate-related expenses.
Stock-based compensation expense within SG&A totaled approximately $1.5$2.6 million and $2.6$2.1 million for the fiscal years ended September 30, 20192021 and 2018,2020, respectively.
SG&A expense for the fiscal year ended September 30, 2019 was higher than2021 decreased from the amount reported in the same period in the prior year, primarily due to lower consulting fees, facility and travel expenses, and partially offset by an increase in expense for professional services of $5.7 million, primarily as a result of the litigation proceedings with Phoenix the recording of $3.8 million of attorneys feescompensation and costs arising from the arbitrator's modified partial final award in the litigation proceedings with Phoenix, the inclusion of $1.8 million of expense at SDI for the period of June 7, 2019 through September 30, 2019 and costs related to the acquisition of SDI of $0.8 million partially offset by a decrease in compensation expenses and an allowance for bad debtinsurance expenses.
As a percentage of revenue, SG&A expenses were 36.8%15.5% and 24.8%22.4% for the fiscal years ended September 30, 20192021 and 2018,2020, respectively.
Research and Development (“R&D”)
Research and development ("R&D&D") consists primarily of compensation expense including non-cash stock-based compensation expense, as well as engineering and prototype costs, depreciation expense, and other overhead expenses, as they relate to the design, development, and testing of our products. Our R&D costs are expensed as incurred. We believe that in order to remain competitive, we must invest significant financial resources in developing new product features and enhancements and in maintaining customer satisfaction worldwide.
Stock-based compensation expense within R&D totaled approximately $0.6$0.8 million duringand $0.7 million for the fiscal years ended September 30, 2021 and 2020, respectively. For the fiscal years ended September 30, 2021 and 2020, Aerospace and Defense R&D expense was $14.6 million and $17.5 million, respectively. For each of the fiscal years ended September 30, 20192021 and 2018.
2020, Broadband R&D expense was $2.8 million. R&D expense for the fiscal year ended September 30, 2019 was higher than2021 decreased from the amounts reported in the same period in the prior year primarily due to an increasethe expense incurred in compensation costs and project spending, primarily in navigation systems and the inclusionfiscal year ended September 30, 2020 from the Customer Settlement Agreement of $1.5 million of R&D expense at SDI for the period of June 7, 2019 through September 30, 2019.
and a decrease in compensation, supplies, and consulting costs. As a percentage of revenue, R&D expenses were 22.3%11.0% and 18.0%18.4% for the fiscal years ended September 30, 20192021 and 2018,2020, respectively.
(Gain) Loss from Change in Estimate on ARO
As a result of the revision in the estimated amount and timing of cash flows for ARO during the fiscal year ended September 30, 2019, the Company reduced the ARO liability by $14,000 and recorded a gain from change in estimate on ARO liability of $14,000. As a result of the revision in the estimated amount and timing of cash flows for ARO during the fiscal year ended September 30, 2018, the Company increased the ARO liability by $0.1 million and recorded a loss from change in estimate on ARO liability of $0.1 million.
Operating Loss
Operating lossIncome (Loss)
Operating income (loss) represents revenue less the cost of revenue and direct operating expenses incurred. Operating lossincome (loss) is a measure that executive management uses to assess performance and make decisions.
As a percentage of revenue, our operating lossincome (loss) was (41.4)%12.0% and (21.5)(6.4)% for the fiscal years ended September 30, 20192021 and 2018,2020, respectively. The increase in operating loss as a percentage of revenueOperating income increased by $26.0 million in the fiscal year ended September 30, 20192021 compared to the same period in the prior year is primarily due to a decreasedriven by the increase in revenue which resulted in higher gross profit and an increasewhile operating expenses remained flat.
Other Income
Gain on Extinguishment of Debt
Gain on extinguishment of debt is related to the forgiveness in SG&A and R&D expense infull of our PPP Loan, including accrued interest. During the fiscal year ended September 30, 2019.2021, we recorded a gain on extinguishment of debt of $6.6 million.
Other Income
Interest Income (Expense), net
Interest expense is related to our Credit Facility and interest income is earned on cash and cash equivalent balances. During the fiscal years ended September 30, 20192021 and 2018,2020, we recorded $1.0$0.5 million and $0.7$(0.1) million respectively, of interest income (expense), respectively. The interest income earned on cash and cash equivalents balances, which was partially offset by interest expense and letter of credit fees related to our Credit Facility (as defined below).Facility. Interest income for the fiscal year ended September 30, 2019 was higherlower than the amount reported in the same period in the prior year due to higherthe impact of COVID-19 on U.S. financial markets. Lower interest income earned on cash and cash equivalents balances.expense was the result of the reversal of previously recorded sales tax interest expense.
Foreign Exchange Gain
Gains or losses from foreign currency transactions denominated in currencies other than the U.S. dollar, both realized and unrealized, are recorded as foreign exchange gain (loss) on ourthe consolidated statements of operations and comprehensive (loss) income.loss. The gain (losses) recorded relate to the change in value of the Yuan Renminbi relative to the U.S. dollar. For each of the fiscal years ended September 30, 2021 and 2020, we recorded foreign exchange gain of approximately $0.2 million.
Income Tax Benefit (Expense)Expense
For the fiscal years ended September 30, 2021 and 2020, we recorded income tax expense of approximately $0.6 million and $0.1 million. Income tax expense for the fiscal years ended September 30, 2021 and 2020 is composed primarily of state minimum tax expense.
Comparison of Financial Results
| | | | | | | | | | | | | | | | | | | | | | | |
| (in thousands, except percentages) | For the Fiscal Year Ended September 30, | | | |
| 2020 | | 2019 | | Change |
| Revenue | $ | 110,128 | | | $ | 87,265 | | | $ | 22,863 | | | 26.2 | % |
| Cost of revenue | 74,546 | | | 72,176 | | | 2,370 | | | 3.3 | |
| Gross profit | 35,582 | | | 15,089 | | | 20,493 | | | 135.8 | |
| Operating expense: | | | | | | | |
| Selling, general, and administrative | 24,631 | | | 32,080 | | | (7,449) | | | (23.2) | |
| Research and development | 20,269 | | | 19,443 | | | 826 | | | 4.2 | |
| Gain on sale of assets | (2,284) | | | (302) | | | (1,982) | | | (656.3) | |
| Total operating expense | 42,616 | | | 51,221 | | | (8,605) | | | (16.8) | |
| Operating loss | (7,034) | | | (36,132) | | | 29,098 | | | 80.5 | |
| Other income: | | | | | | | |
| Interest (expense) income, net | (104) | | | 629 | | | (733) | | | (116.5) | |
| Foreign exchange gain (loss) | 198 | | | (427) | | | 625 | | | 146.4 | |
| Total other income | 94 | | | 202 | | | (108) | | | (53.5) | |
| Loss before income tax expense | (6,940) | | | (35,930) | | | 28,990 | | | 80.7 | |
| Income tax expense | (60) | | | (54) | | | (6) | | | (11.1) | |
| Net loss | $ | (7,000) | | | $ | (35,984) | | | $ | 28,984 | | | 80.5 | % |
| Foreign exchange translation adjustment | (32) | | | 65 | | | (97) | | | (149.2) | |
| Comprehensive loss | $ | (7,032) | | | $ | (35,919) | | | $ | 28,887 | | | 80.4 | % |
Revenue
| | | | | | | | | | | | | | | | | | | | | | | |
| For the Fiscal Year Ended September 30, | | | | |
| (in thousands, except percentages) | 2020 | | 2019 | | Change |
| Aerospace and Defense | $ | 55,240 | | | $ | 33,086 | | | $ | 22,154 | | | 67.0 | % |
| Broadband | 54,888 | | | 54,179 | | | 709 | | | 1.3 | |
| Total revenue | $ | 110,128 | | | $ | 87,265 | | | $ | 22,863 | | | 26.2 | % |
Aerospace and Defense
For the fiscal year ended September 30, 2020, Aerospace and Defense revenue increased $22.2 million, or 67.0%, compared to the same period in the prior year. Included in Aerospace and Defense revenue is $30.3 million and $9.8 million of revenue from SDI for the fiscal years ended September 30, 2020 and 2019, respectively partially offset by a decrease in our other Aerospace and Defense revenue of $4.7 million. For the Companyfiscal year ended September 30, 2020, Navigation and Inertial Sensing product line revenue increased $15.8 million compared to the same period in the prior year, driven by inclusion of SDI revenue, of $20.5 million, for the full 2020 fiscal year, and an increase in revenue from our Defense Optoelectronics product line of $6.4 million compared to the same period in the prior year partially offset by a decrease in our other Aerospace and Defense revenue of $4.7 million. For the fiscal year ended September 30, 2020, our Defense Optoelectronics product line revenue increase was primarily due to an increase in products sold arising from increased customer demand.
Broadband
For the fiscal year ended September 30, 2020, Broadband revenue increased $0.7 million or 1.3%, compared to the same period in the prior year driven by higher customer demand in the CATV Lasers and Transmitters and Sensing product lines partially offset by a decrease in demand of the Chips product line.
Gross Profit
| | | | | | | | | | | | | | | | | | | | | | | |
| For the Fiscal Year Ended September 30, | | | | |
| (in thousands, except percentages) | 2020 | | 2019 | | Change |
| Aerospace and Defense | $ | 16,729 | | | $ | 9,207 | | | $ | 7,522 | | | 81.7 | % |
| Broadband | 18,853 | | | 5,882 | | | 12,971 | | | 220.5 | |
| Total gross profit | $ | 35,582 | | | $ | 15,089 | | | $ | 20,493 | | | 135.8 | % |
Consolidated gross margins were 32.3% and 17.3% for the fiscal years ended September 30, 2020 and 2019, respectively. Stock-based compensation expense within cost of revenue totaled approximately $0.7 million and $0.5 million during each of the fiscal years ended September 30, 2020 and 2019, respectively.
Aerospace and Defense
For the fiscal year ended September 30, 2020, Aerospace and Defense gross profit increased $7.5 million, or 81.7%, compared to the same period in the prior year, driven by higher revenue, of which $9.3 million results from the inclusion of SDI gross profit in the fiscal year ended September 30, 2020, compared to a $2.6 million inclusion of SDI gross profit in the fiscal year ended September 30, 2019. For the fiscal years ended September 30, 2020 and 2019, Aerospace and Defense gross margin was 30.3% and 27.8%, respectively. The increased gross margin in the fiscal year ended September 30, 2020 was driven by improved product mix.
Broadband
For the fiscal year ended September 30, 2020, Broadband gross profit increased $13.0 million, or 220.5%, compared to the same period in the prior year, driven by improved product mix in the fiscal year ended September 30, 2020 and product costs and inventory charges related to excess and obsolete inventory in the fiscal year ended September 30, 2019. For the fiscal years ended September 30, 2020 and 2019, Broadband gross margin was 34.3% and 10.9%, respectively. The increased gross margin in the fiscal year ended September 30, 2020 was driven by improved product mix and lower product costs and inventory related charges.
Selling, General and Administrative
Stock-based compensation expense within SG&A totaled approximately $2.2 million and $1.5 million for the fiscal years ended September 30, 2020 and 2019. SG&A expense for the fiscal year ended September 30, 2020 decreased from the amount reported in the prior year by $7.4 million due to lower attorneys’ fees and costs arising from litigation proceedings, partially offset by an increase in compensation, insurance and bad debt expenses. As a percentage of revenue, SG&A expenses were 22.4% and 36.8% for the fiscal years ended September 30, 2020 and 2019, respectively.
Research and Development
Stock-based compensation expense within R&D totaled approximately $0.6 million for each of the fiscal years ended September 30, 2020 and 2019. For the fiscal years ended September 30, 2020 and 2019, Aerospace and Defense R&D expense was $17.5 million and $10.4 million, respectively. For the fiscal years ended September 30, 2020 and 2019, Broadband R&D expense was $2.8 million and $9.0 million, respectively. Total R&D expense for the fiscal year ended September 30, 2020 increased from the amounts reported in the same period in the prior year by $0.8 million driven by the expense arising from the Customer Settlement Agreement of $1.5 million partially offset by lower project spending. As a percentage of revenue, R&D expenses were 18.4% and 22.3% for the fiscal years ended September 30, 2020 and 2019, respectively.
Operating Loss
As a percentage of revenue, operating loss was 6.4% and 41.5% for the fiscal years ended September 30, 2020 and 2019, respectively. Operating loss improved by $29.1 million in the fiscal year ended September 30, 2020 compared to the same period in the prior year primarily due to the increased gross profit of $20.5 million, the decreased SG&A expense of $7.4 million, the gain on sale of assets of $2.0 million, offset by increased R&D expense of $0.8 million.
Other Income
Interest (Expense) Income, net
During the fiscal years ended September 30, 2020 and 2019, we recorded $(0.1) million and $0.6 million, respectively. Interest expense was due to letter of credit fees related to our Credit Facility. Interest income for the fiscal year ended September 30, 2020 was lower than the amount reported in the same period in the prior year due to the impact of COVID-19 on U.S. financial markets and lower cash and cash equivalents balances.
Foreign Exchange Gain (Loss)
During the fiscal years ended September 30, 2020 and 2019, we recorded foreign exchange gain (loss) of $0.2 million and a $(0.4) million, respectively.
Income Tax Expense
During each of the fiscal years ended September 30, 2020 and 2019, we recorded income tax expense of approximately $0.1 million. For the nine months ended September 30, 2018, the Company recorded income tax benefit of approximately $0.4 million. Income tax expense for the nine monthsfiscal year ended September 30, 2020 is composed primarily of state minimum tax expense partially offset by the reversal of a deferred tax liability related to the Concord Real Property. Income tax expense for the fiscal year ended September 30, 2019 is primarily comprised of state minimum tax expense. Income tax benefit for the nine months ended September 30, 2018 is primarily comprised of the effect of the Tax Act which eliminated Alternative Minimum Taxes and resulted in a refund to the Company of amounts paid in prior fiscal years.
Comparison of Financial Results for the Fiscal Years Ended September 30, 2018 and 2017
|
| | | | | | | | | | | | | |
| (in thousands, except percentages) | For the Fiscal Years ended September 30, |
| | 2018 | | 2017 | | $ Change | | % Change |
| Revenue | $ | 85,617 |
| | $ | 122,895 |
| | $ | (37,278 | ) | | (30.3)% |
| Cost of revenue | 67,130 |
| | 80,361 |
| | (13,231 | ) | | (16.5)% |
| Gross profit | 18,487 |
| | 42,534 |
| | (24,047 | ) | | (56.5)% |
| Operating expense (income): | | | | | | | |
| Selling, general, and administrative | 21,232 |
| | 22,246 |
| | (1,014 | ) | | (4.6)% |
| Research and development | 15,387 |
| | 12,542 |
| | 2,845 |
| | 22.7% |
| Impairments | — |
| | 506 |
| | (506 | ) | | (100.0)% |
| Loss (gain) from change in estimate on ARO | 145 |
| | (45 | ) | | 190 |
| | 422.2% |
| Loss (gain) on sale of assets | 34 |
| | (456 | ) | | 490 |
| | 107.5% |
| Total operating expense | 36,798 |
| | 34,793 |
| | 2,005 |
| | 5.8% |
| Operating (loss) income | (18,311 | ) | | 7,741 |
| | (26,052 | ) | | (336.5)% |
| Other income (expense): | | | | | | | |
| Interest income, net | 733 |
| | 245 |
| | 488 |
| | 199.2% |
| Foreign exchange (loss) gain | (434 | ) | | 82 |
| | (516 | ) | | (629.3)% |
| Other income | 110 |
| | 316 |
| | (206 | ) | | (65.2)% |
| Total other income | 409 |
| | 643 |
| | (234 | ) | | (36.4)% |
| (Loss) income from continuing operations before income tax benefit (expense) | (17,902 | ) | | 8,384 |
| | (26,286 | ) | | (313.5)% |
| Income tax benefit (expense) | 449 |
| | (163 | ) | | 612 |
| | 375.5% |
| (Loss) income from continuing operations | (17,453 | ) | | 8,221 |
| | (25,674 | ) | | (312.3)% |
| Income from discontinued operations, net of tax | — |
| | 14 |
| | (14 | ) | | (100.0)% |
| Net (loss) income | $ | (17,453 | ) | | $ | 8,235 |
| | $ | (25,688 | ) | | (311.9)% |
Revenue
For the fiscal year ended September 30, 2018, revenue decreased 30.3% compared to the prior year driven by lower sales volume of our CATV components and RFoG, products primarily to U.S. customers, partially offset by increases in revenue from our Chip Devices and Navigation Systems product lines. The decrease in CATV components was primarily the result of a significant customer experiencing a large inventory accumulation due to the consolidation of contract manufacturers' inventory in the U.S.
Gross Profit
Our cost of revenue consists of raw materials, compensation expense including non-cash stock-based compensation expense, depreciation expense and other manufacturing overhead costs, expenses associated with excess and obsolete inventories, and product warranty costs. Historically, our cost of revenue as a percentage of revenue, which we refer to as our gross margin, has fluctuated significantly due to product mix, manufacturing yields and sales volumes, and inventory and specific product warranty charges.
Consolidated gross margins were 21.6% and 34.6% for the fiscal years ended September 30, 2018 and 2017, respectively.
Stock-based compensation expense within cost of revenue totaled approximately $0.5 million during each of the fiscal years ended September 30, 2018 and 2017.
For the fiscal year ended September 30, 2018, gross profit decreased by 56.5% when compared to the prior year. The decrease in gross profit for the fiscal year ended September 30, 2018 was primarily due to lower sales and production volumes, resulting in lower operating leverage due to higher fixed manufacturing labor and expenses and higher wafer fabrication expenses. The decrease in gross margin for the fiscal year ended September 30, 2018 was primarily due to lower revenue. During the fiscal year ended September 30, 2018, we experienced higher inventory related charges related to excess and obsolete inventory.
Selling, General and Administrative (“SG&A”)
SG&A consists primarily of compensation expense including non-cash stock-based compensation expense related to executive, finance, and human resources personnel, as well as sales and marketing expenses, professional fees, legal and patent-related costs, and other corporate-related expenses.
Stock-based compensation expense within SG&A totaled approximately $2.6 million during each of the fiscal years ended September 30, 2018 and 2017.
SG&A expense for the fiscal year ended September 30, 2018 was slightly lower than the amount reported in the prior year primarily due to lower compensation costs and severance expenses partially offset by an increase in expense for professional services, an increase in the allowance for bad debts and the costs incurred in connection with the closing of our Pennsylvania facility.
As a percentage of revenue, SG&A expenses were 24.8% and 18.1% for fiscal years ended September 30, 2018 and 2017, respectively. The increase in SG&A expense as a percentage of revenue in the fiscal year ended September 30, 2018 compared to the prior year is due to the decrease in revenues in the fiscal year ended September 30, 2018.
Research and Development (“R&D”)
R&D consists primarily of compensation expense including non-cash stock-based compensation expense, as well as engineering and prototype costs, depreciation expense, and other overhead expenses, as they related to the design, development, and testing of our products. Our R&D costs are expensed as incurred. We believe that in order to remain competitive, we must invest significant financial resources in developing new product features and enhancements and in maintaining customer satisfaction worldwide.
Stock-based compensation expense within R&D totaled approximately $0.6 million and $0.5 million during the fiscal years ended September 30, 2018 and 2017, respectively.
R&D expense for the fiscal year ended September 30, 2018 was higher than the amounts reported in the same period in 2017 primarily due to an increase in compensation costs and project spending, primarily in navigation systems.
As a percentage of revenue, R&D expenses were 18.0% and 10.2% for the fiscal years ended September 30, 2018 and 2017, respectively. The increase in R&D expense as a percentage of revenue in the fiscal year ended September 30, 2018 compared to the prior year is due to the decrease in revenues and higher R&D expense in the fiscal year ended September 30, 2018.
Impairments
In March 2017, in connection with our opening of a new manufacturing facility in China, we identified equipment with a net book value of approximately $0.6 million that would no longer be utilized after the planned move later in fiscal year 2017. After taking into consideration the costs of disposal and estimated net funds from the sale of the equipment of approximately $0.1 million, we recorded a charge to impairments of approximately $0.5 million in the fiscal year ended September 30, 2017. See Note 9 - Property, Plant and Equipment, net in the notes to the consolidated financial statements for additional information.
Loss (Gain) from Change in Estimate on ARO
As a result of the revision in the estimated amount and timing of cash flows for ARO during the fiscal year ended September 30, 2018, the Company increased the ARO liability by $0.1 million and recorded a loss from change in estimate on ARO liability of $0.1 million. As a result of the revision in the estimated amount and timing of cash flows for ARO during the fiscal year ended September 30, 2017, the Company reduced the ARO liability by $45,000 and recorded a gain from change in estimate on ARO liability of $45,000. See Note 13 - Commitments and Contingencies in the notes to the consolidated financial statements for additional information.
Operating (Loss) Income
Operating (loss) income represents revenue less the cost of revenue and direct operating expenses incurred. Operating (loss) income is a measure of profit and loss that executive management uses to assess performance and make decisions. As a percentage of revenue, our operating (loss) income was (21.5)% and 6.3% for the fiscal years ended September 30, 2018 and 2017, respectively. The decrease in operating income as a percentage of revenue in the fiscal year ended September 30, 2018 compared to the prior year is primarily due to the decline in gross profit in the fiscal year ended September 30, 2018.
Other Income (Expense)
Interest Income, net
During the fiscal years ended September 30, 2018 and 2017, we recorded $0.7 million and $0.4 million, respectively, of interest income earned on cash and cash equivalents balances, which was partially offset by interest expense and letter of credit fees related to our Credit Facility (as defined below). Interest income for the fiscal year ended September 30, 2018 was higher than the amount reported in the prior year due to higher interest income earned on cash and cash equivalents balances.
Foreign Exchange
Gains or losses from foreign currency transactions denominated in currencies other than the U.S. dollar, both realized and unrealized, are recorded as foreign exchange gain (loss) on our consolidated statements of operations and comprehensive (loss) income. The gain (losses) recorded relate to the change in value of the Yuan Renminbi relative to the U.S. dollar.
Income Tax Benefit (Expense)
For the fiscal year ended September 30, 2018, the Company recorded income tax benefit from continuing operations of approximately $0.4 million, and $0 of income tax benefit within income from discontinued operations. The income tax benefit is primarily comprised of the effect of recent changes in tax laws in December 2017 that eliminates the Alternative Minimum Tax (“AMT”) and will result in a refund to the Company of amounts paid in prior fiscal years and the fiscal year 2018 operating loss. See Note 12 - Income and other Taxes in the notes to the consolidated financial statements for additional disclosures. For the fiscal year ended September 30, 2017, the Company recorded income tax expense from continuing operations of approximately $0.2 million.
Liquidity and Capital Resources
Other than the fiscal years ended September 30, 2018 and 2017, in recent years weWe have historically consumed cash from operations, and in most periods, we have incurred operating losses from continuing operations. We have managed our liquidity position through the sale of assets and cost reduction initiatives, as well as from time to time in prior periods, borrowings from our Credit Facility (defined below) and capital markets transactions.
As of September 30, 2019,2021, cash and cash equivalents totaled $21.6$71.7 million and net working capital totaled approximately $41.3$116.5 million. Net working capital, calculated as current assets (including inventory) minus current liabilities, is a financial metric we use which represents available operating liquidity. With respect
We have taken a number of actions to measures relatedcontinue to liquidity:support our operations and meet our obligations:
| |
• | Credit Facility: On November 11, 2010, we entered into a Credit and Security Agreement (as amended to date, th“Credit Facility”) with Wells Fargo Bank, N.A. (“Wells Fargo”). The Credit Facility currently provides us with a revolving credit line of up to $15.0 million that can be used for working capital requirements, letters of credit, acquisitions, and other general corporate purposes subject to requirements, (a) that the Company have (i) liquidity of at least $7.5 million, and (ii) for certain specific uses, liquidity of at least $25.0 million after such use and (b) that the Company maintain excess availability of at least $1.0 million. The Credit Facility has a maturity date expiring in November 2021 and is secured by the Company's assets and is subject to a borrowing base formula based on the Company's eligible accounts receivable, inventory, and machinery and equipment accounts. See Note 11 - Credit Facilities in the notes to the consolidated financial statements for additional disclosures. As of December 6, 2019, there was an outstanding balance under this Credit Facility of $3.2 million, $0.5 million reserved for one outstanding stand-by letter of credit and $1.3 million available for borrowing. |
•We maintain a credit facility with Wells Fargo that provides us with a revolving credit line of up to $15.0 million that can be used as required for operations, subject to certain liquidity and availability requirements (the "Credit Facility"). The Company hasCredit Facility had $13.4 million available for borrowing as of September 30, 2021. See Note 9 - Credit Facility and Debt in the Notes to Consolidated Financial Statements for additional information regarding the Credit Facility. •In October 2019, we entered into the Hytera Asset Purchase Agreement pursuant to which we agreed to sell certain of our CATV Lasers and Transmitters manufacturing equipment for purposes of outsourcing manufacturing of our CATV Lasers and Transmitters product lines to Hytera. In August 2021, we entered into the Fastrain Asset Purchase Agreement, pursuant to which, among other items, Fastrain agreed to purchase the same equipment subject to the Hytera Asset Purchase Agreement, along with additional equipment, for aggregate consideration of $6.2 million. See Management’s Discussion and Analysis of Financial Condition and Results of Operations Recent Developments under the heading "Hytera and Fastrain Transactions" for additional information regarding the transactions with Hytera and Fastrain.
•In May 2020, we received PPP Loan proceeds of approximately $6.5 million under the PPP Loan Agreement. In July 2021, we received a historynotification from Wells Fargo that the SBA approved our PPP Loan forgiveness application for the entire PPP Loan balance of operating lossesapproximately $6.5 million, including all accrued interest thereon, and negative cash flowsthat the remaining PPP Loan balance is zero. The forgiveness of the PPP Loan was recognized during our fiscal quarter ended June 30, 2021.
•In February 2020, SDI sold the Concord Real Property to Eagle Rock for a total purchase price of $13.2 million, netting proceeds of $12.8 million after transaction commissions and expenses incurred in connection with the sale. See Management’s Discussion and Analysis of Financial Condition and Results of Operations Recent Developments for additional information regarding the sale of the Concord Real Property and Concord Lease Agreement.
•On February 16, 2021, we closed our offering of 6,655,093 shares of our common stock at a price of $5.40 per share, resulting in net proceeds to us from operations. the offering of $33.1 million. See Management’s Discussion and Analysis of Financial Condition and Results of Operations Recent Developments under the heading "Equity Offering" for additional information regarding the equity offering.
We believe that our existing balances of cash and cash equivalents, cash flows from operations and amounts expected to be available under our Credit Facility (or a replacement facility, to the extent the expiration of the Credit Facility occurs in February 2022)will provide us with sufficient financial resources to meet our cash requirements for operations, working capital, and capital expenditures for at least the next twelve months from the issuance date of these financial statements. We have taken a number
Should we require more capital than what is generated by our operations, we could engage in additional sales or other monetization of certain fixed assets and real estate, additional cost reductions, or elect to raise capital in the U.S. through debt or additional equity issuances. These alternatives may not be available to us on reasonable terms or at all, and could result in higher effective tax rates, increased interest expense, and/or dilution of our earnings.
The continued spread of COVID-19 has led to disruption and volatility in the global capital markets, which, depending on future developments, could impact our capital resources in the future. If we need to raise additional capital to support operations, we may be unable to access capital markets and additional capital may only be available to us on terms that could be significantly detrimental to our existing stockholders and to our business.
Cash Flow
Net Cash (Used In) Provided By Operating Activities
| | | | | | | | | | | | | | | | | | | | | | | | | | | | | | | | | | | | | | | | | |
| For the Fiscal Year Ended September 30, | | | | |
| (in thousands, except percentages) | 2021 | | 2020 | | 2019 | | Change 2021 vs 2020 | | Change 2020 vs 2019 |
| Net cash provided by (used in) operating activities (net of acquired assets and assumed liabilities) | $ | 11,153 | | | $ | (3,892) | | | $ | (15,151) | | | $ | 15,045 | | | 386.6 | % | | $ | 11,259 | | | 74.3 | % |
|
| | | | | | | | | | | | | | | | | | | | | | | |
Operating Activities (in thousands, except percentages) | For the Fiscal Years ended September 30, | | Fiscal 2019 vs Fiscal 2018 | | Fiscal 2018 vs Fiscal 2017 |
| | 2019 | | 2018 | | 2017 | | $ Change | | % Change | | $ Change | | % Change |
| Net cash (used in) provided by operating activities (net of acquired assets and assumed liabilities) | $ | (15,151 | ) | | $ | 1,470 |
| | $ | 11,701 |
| | $ | (16,621 | ) | | (1,130.7)% | | $ | (10,231 | ) | | (87.4)% |
Fiscal 2019:
For the fiscal year ended September 30, 2019, our2021, operating activities usedprovided cash of $15.2$11.2 million, primarily due to our net lossincome of $36.0$25.6 million partiallyand adjustments for non-cash charges, including depreciation and amortization expense of $4.1 million and stock-based compensation expense of $4.2 million, offset by a gain on disposal of equipment of $0.3 million, changes in our operating assets and liabilities (or working capital components, which includes non-current inventory) of $10.7$22.9 million depreciation and amortization expense of $7.1 million, stock-based compensation expense of $2.6 million, warranty provision of $0.2 million and bad debt provision of $0.1 million.. The change in our operating assets and liabilities was primarily the result of a decrease in accounts receivable of $4.0 million and an increase in accrued expenses and other liabilities of $5.0 million, partially offset by a decrease in inventory of $6.5 million and other assets of $0.2 million and a decrease in accounts payable of $4.5 million.
Fiscal 2018:
For the fiscal year ended September 30, 2018, our operating activities provided cash of $1.5 million primarily due to changes in our operating assets and liabilities (or working capital components, which includes non-current inventory) of $8.2 million, depreciation and amortization expense of $5.6 million, stock-based compensation expense of $3.6 million, provision for doubtful accounts of $0.6 million, warranty provision of $0.4 million and loss on disposal of equipment of $34,000 partially offset by our net loss of $17.5 million. The change in our operating assets and liabilities was primarily the result of a decrease in accounts receivable of $2.4 million, inventory of $5.1 million, other assets of $0.6 million and an increase in accounts payable of $0.5 million partially offset by a decrease in accrued expenses and other liabilities of $0.4 million.
Fiscal 2017:
For the fiscal year ended September 30, 2017, our operating activities provided cash of $11.7 million primarily due to our net income of $8.2 million, depreciation, amortization and accretion expense of $3.8 million, stock-based compensation expense of $3.6 million, impairment charge of $0.5 million and warranty provision of $0.6 million, partially offset by a change in our operating assets and liabilities (or working capital components, which includes non-current inventory) of $4.5 million. The change in our operating assets and liabilities was primarily the result of an increase in accounts receivable and contract assets of $3.9$5.3 million, inventory of $0.1$6.3 million and other assets of $4.5$1.5 million, and a decrease in accounts payable of $0.4 million and accrued expenses and other liabilities of $9.3 million.
For the fiscal year ended September 30, 2020, operating activities used cash of $3.9 million, primarily due to net loss of $7.0 million, changes in operating assets and liabilities (or working capital components) of $3.8 million and gain on disposal of assets of $2.3 million, partially offset by adjustments for non-cash charges, including depreciation and amortization expense of $5.5 million, stock-based compensation expense of $3.5 million, issuance of restricted stock units of $0.4 million, product warranty provision of $0.4 million and bad debt provision of $0.2 million. The change in operating assets and liabilities was primarily the result of an increase in accounts receivable and contract assets of $7.5 million, inventory of $1.2 million and other assets of $13.5 million, partially offset by an increase in accounts payable of approximately $2.1$6.1 million and accrued expenses and other liabilities of $12.2 million.
Working Capital Components:
Accounts Receivable:Receivable We generally expect the level of accounts receivable at any given quarter end to reflect the level of sales in that quarter. Our accountsAccounts receivable balances have fluctuated historically due to the timing of account collections, timing of product shipments, and/or change in customer credit terms.
Inventory:Inventory We generally expect the level of inventory at any given quarter end to reflect the change in our expectations of forecasted sales during the quarter. Our inventoryInventory balances have fluctuated historically due to the timing of customer orders and product shipments, changes in our internal forecasts related to customer demand, as well as adjustments related to excess and obsolete inventory and the purchase of non-current inventory.
Accounts Payable:Payable The fluctuation of our accounts payable balances is primarily driven by changes in inventory purchases as well as changes related to the timing of actual payments to vendors.
Accrued Expenses: OurExpenses The largest accrued expense typically relates to compensation. Historically, fluctuations of our accrued expense accounts have primarily related to changes in the timing of actual compensation payments, receipt or application of advanced payments, adjustments to our warranty accrual, and accruals related to professional fees.
Net Cash Used In Investing Activities
|
| | | | | | | | | | | | | | | | | | | | | | | |
Investing Activities (in thousands, except percentages) | For the Fiscal Years ended September 30, | | Fiscal 2019 vs Fiscal 2018 | | Fiscal 2018 vs Fiscal 2017 |
| | 2019 | | 2018 | | 2017 | | $ Change | | % Change | | $ Change | | % Change |
| Net cash used in investing activities | $ | (31,803 | ) | | $ | (6,501 | ) | | $ | (9,126 | ) | | $ | (25,302 | ) | | (389.2)% | | $ | 2,625 |
| | 28.8% |
| | | | | | | | | | | | | | | | | | | | | | | | | | | | | | | | | | | | | | | | | |
| For the Fiscal Year Ended September 30, | | | | |
| (in thousands, except percentages) | 2021 | | 2020 | | 2019 | | Change 2021 vs 2020 | | Change 2020 vs 2019 |
| Net cash (used) in provided by investing activities | $ | (3,837) | | | $ | 10,887 | | | $ | (31,803) | | | $ | (14,724) | | | (135.2) | % | | $ | 42,690 | | | 134.2 | % |
Fiscal 2019:For the fiscal year ended September 30, 2021, investing activities used cash of $3.8 million primarily from capital-related expenditures of $5.4 million partially offset by cash proceeds from the future sale of assets of $0.8 million and cash proceeds from the disposal of property, plant and equipment of $0.7 million.
For the fiscal year ended September 30, 2019, our2020, investing activities used $31.8 millionprovided cash of cash, incuding $21.5 million for the acquisition of SDI, net of cash acquired, and capital-related expenditures of $10.8$10.9 million primarily related to investment in our wafer fabrication facility partially offset byfrom cash proceeds from the disposal of property, plant and equipment of $0.5 million.$15.4 million partially offset by capital-related expenditures of $4.5 million. The $15.4 million of cash proceeds from the disposal of property, plant and equipment primarily consisted of net proceeds of $12.8 million in connection with the sale and leaseback of the Concord Real Property.
Financing Activities
Fiscal 2018: | | | | | | | | | | | | | | | | | | | | | | | | | | | | | | | | | | | | | | | | | |
| For the Fiscal Year Ended September 30, | | | | |
| (in thousands, except percentages) | 2021 | | 2020 | | 2019 | | Change 2021 vs 2020 | | Change 2020 vs 2019 |
| Net cash provided by financing activities | 33,725 | | | 1,499 | | | 5,799 | | | $ | 32,226 | | | 2,149.8 | % | | $ | (4,300) | | | (74.2) | % |
For the fiscal year ended September 30, 2018, our investing2021, financing activities used $6.5 millionprovided cash of cash for capital related expenditures of $6.6$33.7 million, primarily relateddue to investment in our wafer fabrication facility, partiallyproceeds from issuance of employee stock purchase plan and equity awards of $0.8 million, proceeds from sale of common stock of $35.9 million offset by the receiptissuance costs of proceeds from the disposal of equipment of $0.1$2.8 million.
Fiscal 2017:
For the fiscal year ended September 30, 2017, our investing activities used $9.1 million of cash primarily for capital related expenditures of $9.6 million, partially offset by the receipt of proceeds from the disposal of equipment of $0.5 million.
Net Cash Provided By (Used In) Financing Activities
|
| | | | | | | | | | | | | | | | | | | | | | | |
Financing Activities (in thousands, except percentages) | For the Fiscal Years ended September 30, | | Fiscal 2018 vs Fiscal 2017 |
| | 2019 | | 2018 | | 2017 | | $ Change | | % Change | | $ Change | | % Change |
| Net cash provided by (used in) financing activities | $ | 5,799 |
| | $ | (487 | ) | | $ | 1,306 |
| | $ | 6,286 |
| | 1,290.8% | | $ | (1,793 | ) | | (137.3)% |
Fiscal 2019:
For the fiscal year ended September 30, 2019, our2020, financing activities provided cash of $5.8$1.5 million, primarily from $5.5due to $6.5 million of borrowings from the PPP Loan and proceeds from stock plan transactions of $0.6 million, partially offset by net payments related to borrowings from our bank credit facilityCredit Facility of $5.5 million and stock plan transactions of $0.5 million, partially offset by tax withholding paid on behalf of employees for stock-based awards of $0.2$0.1 million.
Fiscal2018:
For the fiscal year ended September 30, 2018, our financing activities used cash of $0.5 million, primarily for tax withholding paid on behalf of employees for stock-based awards of $1.3 million, partially offset by proceeds from stock plan transactions of $0.8 million.
Fiscal 2017:
For the fiscal year ended September 30, 2017, our financing activities provided cash of $1.3 million from proceeds from stock transactions.
Contractual Obligations and Commitments
Our contractualContractual obligations and commitments for the remainder of fiscal 2019 and over the next five fiscal years are summarized in the table below (andand are presented as of September 30, 2019):2021:
| | | | | | | | | | | | | | | | | | | | | | | | | | | | | |
| (in thousands) | Total | | Less Than a Year | | 1 to 3 Years | | 4 to 5 Years | | Over 5 Years |
| Purchase obligations | $ | 21,536 | | | $ | 20,715 | | | $ | 821 | | | $ | — | | | $ | — | |
| Asset retirement obligations | 2,262 | | | 58 | | | — | | | 2,066 | | | 138 | |
| Operating lease obligations | 19,594 | | | 1,955 | | | 3,542 | | | 3,505 | | | 10,592 | |
| Total contractual obligations and commitments | $ | 43,392 | | | $ | 22,728 | | | $ | 4,363 | | | $ | 5,571 | | | $ | 10,730 | |
|
| | | | | | | | | | | | | | | | | | | |
| (in thousands) | | | |
| | Total | | Less than a year | | 1 to 3 years | | 4 to 5 years | | Over 5 years |
| Purchase obligations | $ | 19,532 |
| | $ | 9,636 |
| | $ | 9,816 |
| | $ | 80 |
| | $ | — |
|
| Asset retirement obligations | 2,125 |
| | — |
| | — |
| | 59 |
| | 2,066 |
|
| Operating lease obligations | 5,509 |
| | 988 |
| | 1,663 |
| | 1,508 |
| | 1,350 |
|
| Total contractual obligations and commitments | $ | 27,166 |
| | $ | 10,624 |
| | $ | 11,479 |
| | $ | 1,647 |
| | $ | 3,416 |
|
Interest payments are not included in the contractual obligations and commitments table above since they are insignificant to our consolidated results of operations.
The contractual obligations and commitments table above also excludes unrecognized tax benefits, because we are unable to reasonably estimate the period during which this obligation may be incurred, if at all. As of September 30, 2019,2021, we had no unrecognized tax benefits of $0.4 million.benefits.
Purchase Obligations
Our purchase
Purchase obligations represent an estimate of all open purchase orders and contractual obligations in the ordinary course of business for which we have not received the goods or services as of September 30, 2019.2021. Although open purchase orders are considered enforceable and legally binding, the terms generally allow us the option to cancel, reschedule and adjust our requirements based on our business needs prior to the delivery of goods or performance of services.
The purchase obligations of $19.5
$21.5 million set forth above include, as of September 30, 2019, $1.0 million that the Company has committed for the2021, set forth above primarily relates to open purchase orders to our contract manufacturers, component suppliers, service partners, and installation ofother vendors, including capital equipment. In addition, we expectexpenditures related to incur, during the fiscal year ending September 30, 2020, an additional $1.0 million to complete the purchase and installation of capital equipment, which we expect to fund via cash on hand.facility renovations.
Asset Retirement Obligations
We have known conditional AROAsset Retirement Obligation ("ARO") conditions, such as certain asset decommissioning and restoration of rented facilities to be performed in the future. Our ARO includes assumptions related to renewal option periods where we expect to extend facility lease terms. Revisions in estimated liabilities can result from revisions of estimated inflation rates, escalating retirement costs, and changes in the estimated timing of settling the ARO. See Note 1311 - Commitments and Contingencies in the notesNotes to the consolidated financial statementsConsolidated Financial Statements for additional information related to our AROs.
Operating LeasesLease Obligations
Operating leases include non-cancelable terms and exclude renewal option periods, property taxes, insurance and maintenance expenses on leased properties. See Note 1311 - Commitments and Contingencies in the notesNotes to the consolidated financial statementsConsolidated Financial Statements for additional information related to our operating lease obligations.
Off-Balance Sheet Arrangements
We do not have any off-balance sheet arrangements other than our operating leases described above that have or are reasonably likely to have a current or future material effect on our consolidated financial condition, results of operations, liquidity, capital expenditures or capital resources.
ITEM 7A. Quantitative and Qualitative Disclosures aboutAbout Market Risks
We are exposed to financial market risks, including changes in currency exchange rates and interest rates. We do not use derivative financial instruments for speculative purposes.
Foreign Currency Exchange Risks
The United States dollar is the reporting currency for ourthe consolidated financial statements. The functional currency for our China subsidiary is the Yuan Renminbi.
We recognize translation adjustments due to the effect of changes in the value of the Yuan Renminbi relative to the U.S. dollar associated with our operations in China. The assets and liabilities of our foreign operations are translated from their respective functional currenciescurrency into U.S. dollars at the rates in effect at the consolidated balance sheet dates, and the revenue and expense amounts are translated at the average rate during the applicable periods reflected on the consolidated statements of operations and comprehensive income (loss) income.. Foreign currency translation adjustments are recorded as accumulated other comprehensive (loss) income.
Gains and losses from foreign currency transactions denominated in currencies other than the U.S. dollar, both realized and unrealized, are recorded as foreign exchange gain (loss) on ourthe consolidated statements of operations and comprehensive income (loss) income..
During the normal course of business, we are exposed to market risks associated with fluctuations in foreign currency exchange rates due to the Yuan Renminbi. To reduce the impact of these risks on our earnings and to increase the predictability of cash flows, we use natural offsets in receipts and disbursements within the applicable currency as the primary means of reducing the risk.
Some of our foreign suppliers may adjust their prices (in U.S. dollars) from time to time to reflect currency exchange fluctuations, and suchfluctuations. Such price changes could impact our future financial condition or results of operations. We do not currently hedge our foreign currency exposure.
Interest Rate Risks
We monitor our interest rate risk on cash balances primarily through cash flow forecasting. Cash that is surplus to immediate requirements is invested in short-term deposits with banks accessible with short notice and invested in money market accounts. We believe our current interest rate risk is immaterial.
On November 11, 2010, we entered into a Credit and Security Agreement (as amended, the “Credit Facility”) with Wells Fargo Bank, N.A. The Credit Facility is secured by the Company's assets and is subject to a borrowing base formula based on the Company's eligible accounts receivable, inventory, and machinery and equipment accounts.
On July 27, 2017, we entered into a Ninth Amendment of the Credit Facility which adjusted A hypothetical reduction in the interest raterates on our cash and cash equivalents to LIBOR plus 1.75%. On November 7, 2018, we entered into a Tenth Amendmentzero would result in an immaterial reduction of the Credit Facility which extended the maturity date of the facility to November 2021. The Credit Facility currently provides usinterest income with a revolving credit linede minimis impact on income before taxes.
Based on the LIBOR rate loans outstanding under our credit facility during the fiscal year ended September 30, 2019,Credit Facility a hypothetical 50 basis points increase in interest rates would have resulted in an insignificant amount of additional interest expense.
Given the low interest rate environment, the relatively low interest income generated from our cash and cash equivalents, and interest expense incurred related to our unused line of credit, we do not believe that interest rate risks currently pose material exposures to our business or results of operations.
Inflation Risks
Inflationary factors, such as increases in material costs and operating expenses, may adversely affect our results of operations and cash flows. Although we do not believe that inflation has had a material impact on our financial position or results of operations to date, an increase in the rate of inflation in the future may have an adverse effect on the levels of gross profit and operating expenses as a percentage of revenue if the sales prices for our products do not proportionately increase with these increases in expenses.
Credit Market Conditions
The U.S. and global capital markets periodically experience turbulent conditions, particularly in the credit markets, which can result in tightening of lending standards, reduced availability of credit, and reductions in certain asset values. This could impact ourthe ability to obtain additional funding through financing or asset sales.
ITEM 8. Financial Statements and Supplementary Data
EMCORE CORPORATION
Consolidated Statements of Operations and Comprehensive Income (Loss) Income
For the Fiscal Years endedEnded September 30, 2019, 20182021, 2020 and 20172019
(in thousands, except per share data)
|
| | | | | | | | | | | | |
| | For the Fiscal Year ended September 30, |
| | | 2019 | | 2018 | | 2017 |
| Revenue | | $ | 87,265 |
| | $ | 85,617 |
| | $ | 122,895 |
|
| Cost of revenue | | 72,176 |
| | 67,130 |
| | 80,361 |
|
| Gross profit | | 15,089 |
| | 18,487 |
| | 42,534 |
|
| Operating expense: | | | | | | |
| Selling, general, and administrative | | 32,094 |
| | 21,232 |
| | 22,246 |
|
| Research and development | | 19,443 |
| | 15,387 |
| | 12,542 |
|
| Impairments | | — |
| | — |
| | 506 |
|
| (Gain) loss from change in estimate on ARO obligation | | (14 | ) | | 145 |
| | (45 | ) |
| (Gain) loss on sale of assets | | (302 | ) | | 34 |
| | (456 | ) |
| Total operating expense | | 51,221 |
| | 36,798 |
| | 34,793 |
|
| Operating loss | | (36,132 | ) | | (18,311 | ) | | 7,741 |
|
| Other income: | | | | | | |
| Interest income, net | | 629 |
| | 733 |
| | 245 |
|
| Foreign exchange (loss) gain | | (427 | ) | | (434 | ) | | 82 |
|
| Other income | | — |
| | 110 |
| | 316 |
|
| Total other (loss) income | | 202 |
| | 409 |
| | 643 |
|
| Loss before income tax (expense) benefit | | (35,930 | ) | | (17,902 | ) | | 8,384 |
|
| Income tax (expense) benefit | | (54 | ) | | 449 |
| | (163 | ) |
| (Loss) income from continuing operations | | (35,984 | ) | | (17,453 | ) | | 8,221 |
|
| Income from discontinued operations, net of tax | | — |
| | — |
| | 14 |
|
| Net loss | | $ | (35,984 | ) | | $ | (17,453 | ) | | $ | 8,235 |
|
| Foreign exchange translation adjustment | | 65 |
| | 324 |
| | (18 | ) |
| Comprehensive (loss) income | | $ | (35,919 | ) | | $ | (17,129 | ) | | $ | 8,217 |
|
| Per share data: | | | | | | |
| Net (loss) income per basic share: | | | | | | |
| Continuing operations | | $ | (1.29 | ) | | $ | (0.64 | ) | | $ | 0.31 |
|
| Discontinued operations | | — |
| | — |
| | 0.00 |
|
| Net loss per basic share | | $ | (1.29 | ) | | $ | (0.64 | ) | | $ | 0.31 |
|
| Net (loss) income per diluted share: | | | | | | |
| Continuing operations | | $ | (1.29 | ) | | $ | (0.64 | ) | | $ | 0.30 |
|
| Discontinued operations | | — |
| | — |
| | 0.00 |
|
| Net (loss) income per diluted share | | $ | (1.29 | ) | | $ | (0.64 | ) | | $ | 0.30 |
|
| Weighted-average number of basic and diluted shares outstanding | | 27,983 |
| | 27,266 |
| | 26,659 |
|
| Weighted-average number of diluted shares outstanding | | 27,983 |
| | 27,266 |
| | 27,544 |
|
| | | | | | | | | | | | | | | | | |
| For the Fiscal Year Ended September 30, |
| 2021 | | 2020 | | 2019 |
| Revenue | $ | 158,444 | | | $ | 110,128 | | | $ | 87,265 | |
| Cost of revenue | 96,956 | | | 74,546 | | | 72,176 | |
| Gross profit | 61,488 | | | 35,582 | | | 15,089 | |
| Operating expense: | | | | | |
| Selling, general, and administrative | 24,544 | | | 24,631 | | | 32,080 | |
| Research and development | 17,448 | | | 20,269 | | | 19,443 | |
| Loss (gain) on sale of assets | 515 | | | (2,284) | | | (302) | |
| Total operating expense | 42,507 | | | 42,616 | | | 51,221 | |
| Operating income (loss) | 18,981 | | | (7,034) | | | (36,132) | |
| Other income: | | | | | |
| Gain on extinguishment of debt | 6,561 | | | — | | | — | |
| Interest income (expense), net | 466 | | | (104) | | | 629 | |
| Foreign exchange gain (loss) | 207 | | | 198 | | | (427) | |
| Total other income | 7,234 | | | 94 | | | 202 | |
| Income (loss) before income tax expense | 26,215 | | | (6,940) | | | (35,930) | |
| Income tax expense | (572) | | | (60) | | | (54) | |
| Net income (loss) | $ | 25,643 | | | $ | (7,000) | | | $ | (35,984) | |
| Foreign exchange translation adjustment | (231) | | | (32) | | | 65 | |
| Comprehensive income (loss) | $ | 25,412 | | | $ | (7,032) | | | $ | (35,919) | |
| Per share data: | | | | | |
| Net income (loss) income per basic share: | $ | 0.75 | | | $ | (0.24) | | | $ | (1.29) | |
| Weighted-average number of basic shares outstanding | 34,020 | | | 29,136 | | | 27,983 | |
| Net income (loss) per basic and diluted share | $ | 0.72 | | | $ | (0.24) | | | $ | (1.29) | |
| Weighted-average number of diluted shares outstanding | 35,789 | | | 29,136 | | | 27,983 | |
The accompanying notes are an integral part of these consolidated financial statements.
EMCORE CORPORATION
Consolidated Balance Sheets
As of September 30, 20192021 and 20182020
(in thousands)
| | | | As of September 30, | | As of September 30, |
| | 2019 | | 2018 | | 2021 | | 2020 |
| ASSETS | | | | ASSETS | | | |
| Current assets: | | | | Current assets: | |
| Cash and cash equivalents | $ | 21,574 |
| | $ | 63,117 |
| Cash and cash equivalents | $ | 71,621 | | | $ | 30,390 | |
| Restricted cash | 403 |
| | 78 |
| Restricted cash | 61 | | | 148 | |
| Accounts receivable, net of allowance of $148 and $548, respectively | 18,497 |
| | 19,275 |
| |
| Accounts receivable, net of allowance of $260 and $227, respectively | | Accounts receivable, net of allowance of $260 and $227, respectively | 31,849 | | | 25,324 | |
| Contract assets | 1,055 |
| | — |
| Contract assets | 361 | | | 1,566 | |
| Inventory | 24,051 |
| | 20,850 |
| Inventory | 32,309 | | | 25,525 | |
| Prepaid expenses and other current assets | 6,389 |
| | 6,098 |
| Prepaid expenses and other current assets | 6,877 | | | 5,589 | |
| Assets held for sale | | Assets held for sale | 1,241 | | | 1,568 | |
| Total current assets | 71,969 |
| | 109,418 |
| Total current assets | 144,319 | | | 90,110 | |
| Property, plant, and equipment, net | 37,223 |
| | 18,216 |
| Property, plant, and equipment, net | 22,544 | | | 21,052 | |
| Goodwill | 69 |
| | — |
| Goodwill | 69 | | | 69 | |
| Intangible assets, net | 239 |
| | — |
| |
| Non-current inventory | — |
| | 1,433 |
| |
| Operating lease right-of-use assets | | Operating lease right-of-use assets | 13,489 | | | 14,566 | |
| Other intangible assets, net | | Other intangible assets, net | 167 | | | 202 | |
| Other non-current assets | 62 |
| | 199 |
| Other non-current assets | 225 | | | 242 | |
| Total assets | $ | 109,562 |
| | $ | 129,266 |
| Total assets | $ | 180,813 | | | $ | 126,241 | |
| LIABILITIES and SHAREHOLDERS’ EQUITY | | | | LIABILITIES and SHAREHOLDERS’ EQUITY | | | |
| Current liabilities: | | | | Current liabilities: | |
| Borrowings from credit facility | $ | 5,497 |
| | $ | — |
| |
| Accounts payable | 10,701 |
| | 12,997 |
| Accounts payable | $ | 16,686 | | | $ | 16,484 | |
| Accrued expenses and other current liabilities | 14,521 |
| | 7,573 |
| Accrued expenses and other current liabilities | 9,936 | | | 11,577 | |
| Operating lease liabilities - current | | Operating lease liabilities - current | 1,198 | | | 992 | |
| Total current liabilities | 30,719 |
| | 20,570 |
| Total current liabilities | 27,820 | | | 29,053 | |
| PPP Loan liability - non-current | | PPP Loan liability - non-current | — | | | 6,488 | |
| Operating lease liabilities - non-current | | Operating lease liabilities - non-current | 12,684 | | | 13,735 | |
| Asset retirement obligations | 1,890 |
| | 1,809 |
| Asset retirement obligations | 2,049 | | | 2,022 | |
| Other long-term liabilities | 207 |
| | 82 |
| Other long-term liabilities | 794 | | | 794 | |
| Total liabilities | 32,816 |
| | 22,461 |
| Total liabilities | 43,347 | | | 52,092 | |
| Commitments and contingencies (Note 13) |
|
| |
|
| |
| Commitments and contingencies (Note 11) | | Commitments and contingencies (Note 11) | 0 | | 0 |
| Shareholders’ equity: | | | | Shareholders’ equity: | |
| Common stock, no par value, 50,000 shares authorized; 35,803 shares issued and 28,893 shares outstanding as of September 30, 2019; 34,487 shares issued and 27,577 shares outstanding as of September 30, 2018 | 739,926 |
| | 734,066 |
| |
| Treasury stock at cost; 6,910 shares | (47,721 | ) | | (47,721 | ) | |
| Common stock, no par value, 50,000 shares authorized; 43,890 shares issued and 36,984 shares outstanding as of September 30, 2021; 36,461 shares issued and 29,551 shares outstanding as of September 30, 2020 | | Common stock, no par value, 50,000 shares authorized; 43,890 shares issued and 36,984 shares outstanding as of September 30, 2021; 36,461 shares issued and 29,551 shares outstanding as of September 30, 2020 | 782,266 | | | 744,361 | |
| Treasury stock at cost; 6,906 shares | | Treasury stock at cost; 6,906 shares | (47,721) | | | (47,721) | |
| Accumulated other comprehensive income | 950 |
| | 885 |
| Accumulated other comprehensive income | 687 | | | 918 | |
| Accumulated deficit | (616,409 | ) | | (580,425 | ) | Accumulated deficit | (597,766) | | | (623,409) | |
| Total shareholders’ equity | 76,746 |
| | 106,805 |
| Total shareholders’ equity | 137,466 | | | 74,149 | |
| Total liabilities and shareholders’ equity | $ | 109,562 |
| | $ | 129,266 |
| Total liabilities and shareholders’ equity | $ | 180,813 | | | $ | 126,241 | |
The accompanying notes are an integral part of these consolidated financial statements.
EMCORE CORPORATION
Consolidated Statements of Shareholders'Shareholders’ Equity
For the Fiscal Yearsended September 30, 2019, 2018 and 2017
(in thousands)
|
| | | | | | | | | | | | |
| | | For the Fiscal Year ended September 30, |
| | | 2019 | | 2018 | | 2017 |
| Shares of Common Stock | | | | | | |
| Balance, beginning of period | | 27,577 |
| | 27,028 |
| | 26,244 |
|
| Stock-based compensation | | 307 |
| | 372 |
| | 432 |
|
| Stock option exercises | | 1 |
| | 6 |
| | 158 |
|
| Issuance of common stock for acquisition | | 811 |
| | — |
| | — |
|
| Issuance of common stock - Board of Directors | | — |
| | — |
| | 61 |
|
| Issuance of common stock - ESPP | | 197 |
| | 171 |
| | 133 |
|
| Balance, end of period | | 28,893 |
| | 27,577 |
| | 27,028 |
|
| Value of Common Stock | | | | | | |
| Balance, beginning of period | | $ | 734,066 |
| | $ | 730,906 |
| | 725,666 |
|
| Stock-based compensation | | 2,607 |
| | 3,648 |
| | 3,602 |
|
| Stock option exercises | | 1 |
| | 28 |
| | 534 |
|
| Tax withholding paid on behalf of employees for stock-based awards | | (203 | ) | | (1,257 | ) | | — |
|
| Issuance of common stock for acquisition | | 2,951 |
| | — |
| | — |
|
| Issuance of common stock - Board of Directors | | — |
| | — |
| | 331 |
|
| Issuance of common stock - ESPP | | 504 |
| | 741 |
| | 773 |
|
| Balance, end of period | | 739,926 |
| | 734,066 |
| | 730,906 |
|
| Treasury stock, beginning and ending of period | | (47,721 | ) | | (47,721 | ) | | (47,721 | ) |
| Accumulated Other Comprehensive Income | | | | | | |
| Balance, beginning of period | | 885 |
| | 561 |
| | 579 |
|
| Translation adjustment | | 65 |
| | 324 |
| | (18 | ) |
| Balance, end of period | | 950 |
| | 885 |
| | 561 |
|
| Accumulated Deficit | | | | | | — |
|
| Balance, beginning of period | | (580,425 | ) | | (562,972 | ) | | (571,207 | ) |
| Net loss | | (35,984 | ) | | (17,453 | ) | | 8,235 |
|
| Balance, end of period | | (616,409 | ) | | (580,425 | ) | | (562,972 | ) |
| Total Shareholders' Equity | | $ | 76,746 |
| | $ | 106,805 |
| | $ | 120,774 |
|
The accompanying notes are an integral part of these consolidated financial statements..
EMCORE CORPORATION
Consolidated Statements of Cash Flows
For the Fiscal Years endedEnded September 30, 2019, 20182021, 2020 and 20172019
(in thousands)
|
| | | | | | | | | | | |
| | For the Fiscal Year ended September 30, |
| | 2019 | | 2018 | | 2017 |
| Cash flows from operating activities: | | | | | |
| Net loss | $ | (35,984 | ) | | $ | (17,453 | ) | | $ | 8,235 |
|
| Adjustments to reconcile net loss to net cash provided by operating activities: | | | | | |
| Depreciation and amortization expense | 7,142 |
| | 5,617 |
| | 3,757 |
|
| Stock-based compensation expense | 2,607 |
| | 3,648 |
| | 3,602 |
|
| Provision adjustments related to doubtful accounts | 62 |
| | 599 |
| | 23 |
|
| Provision adjustments related to product warranty | 186 |
| | 431 |
| | 573 |
|
| Impairments of equipment | — |
| | — |
| | 506 |
|
| Net (gain) loss on disposal of equipment | (302 | ) | | 34 |
| | (456 | ) |
| Other | 464 |
| | 412 |
| | (50 | ) |
| Total non-cash adjustments | 10,159 |
| | 10,741 |
| | 7,955 |
|
| Changes in operating assets and liabilities, net of acquired assets and assumed liabilities: | | | | | |
| Accounts receivable and contract assets | 3,980 |
| | 2,372 |
| | (3,859 | ) |
| Inventory | 6,486 |
| | 5,067 |
| | (140 | ) |
| Prepaid expenses and other assets | (238 | ) | | 784 |
| | (2,397 | ) |
| Accounts payable | (4,539 | ) | | 477 |
| | 2,095 |
|
| Accrued expenses and other current liabilities | 4,985 |
| | (518 | ) | | (188 | ) |
| Total change in operating assets and liabilities | 10,674 |
| | 8,182 |
| | (4,489 | ) |
| Net cash (used in) provided by operating activities | (15,151 | ) | | 1,470 |
| | 11,701 |
|
| Cash flows from investing activities: | | | | | |
| Purchases of equipment | (10,790 | ) | | (6,583 | ) | | (9,600 | ) |
| Acquisition of business, net of cash acquired | (21,483 | ) | | — |
| | — |
|
| Proceeds from disposal of property, plant and equipment | 470 |
| | 82 |
| | 474 |
|
| Net cash used in investing activities | (31,803 | ) | | (6,501 | ) | | (9,126 | ) |
| Cash flows from financing activities: | | | | | |
| Proceeds from borrowings of credit facilities | 5,497 |
| | — |
| | — |
|
| Proceeds from exercise of equity awards | 505 |
| | 770 |
| | 1,306 |
|
Taxes paid related to net share settlement of equity awards
| (203 | ) | | (1,257 | ) | | — |
|
| Net cash provided by (used in) financing activities | 5,799 |
| | (487 | ) | | 1,306 |
|
| Effect of exchange rate changes provided by foreign currency | (63 | ) | | (41 | ) | | 3 |
|
| Net (decrease) increase in cash, cash equivalents and restricted cash | (41,218 | ) | | (5,559 | ) | | 3,884 |
|
| Cash, cash equivalents and restricted cash at beginning of period | 63,195 |
| | 68,754 |
| | 64,870 |
|
| Cash, cash equivalents and restricted cash at end of period | $ | 21,977 |
| | $ | 63,195 |
| | $ | 68,754 |
|
| | | | | | |
| SUPPLEMENTAL DISCLOSURE OF CASH FLOW INFORMATION | | | | | |
| Cash paid during the period for interest | $ | 126 |
| | $ | 63 |
| | $ | 71 |
|
| Cash paid during the period for income taxes | $ | 68 |
| | $ | 131 |
| | $ | 114 |
|
| NON-CASH INVESTING AND FINANCING ACTIVITIES | | | | | |
| Changes in accounts payable related to purchases of equipment | $ | (180 | ) | | $ | 755 |
| | $ | (861 | ) |
| Issuance of common stock to Board of Directors | $ | — |
| | $ | — |
| | $ | 331 |
|
| | | | | | | | | | | | | | | | | |
| For the Fiscal Year Ended September 30, |
| 2021 | | 2020 | | 2019 |
| Shares of common stock | | | | | |
| Balance, beginning of period | 29,550 | | | 28,893 | | | 27,577 | |
| Stock-based compensation | 572 | | | 309 | | | 307 | |
| Stock option exercises | 15 | | | 1 | | | 1 | |
| Issuance of common stock for acquisition | — | | | — | | | 811 | |
| Issuance of restricted stock units | — | | | 116 | | | — | |
| Issuance of common stock - ESPP | 192 | | | 231 | | | 197 | |
| Sale of common stock | 6,655 | | | — | | | — | |
| Balance, end of period | 36,984 | | | 29,550 | | | 28,893 | |
| Value of common stock | | | | | |
| Balance, beginning of period | $ | 744,361 | | | $ | 739,926 | | | $ | 734,066 | |
| Stock-based compensation | 4,180 | | | 3,517 | | | 2,607 | |
| Stock option exercises | 77 | | | 2 | | | 1 | |
| Tax withholding paid on behalf of employees for stock-based awards | (260) | | | (111) | | | (203) | |
| Issuance of common stock for acquisition | — | | | — | | | 2,951 | |
| Issuance of restricted stock units | — | | | 410 | | | — | |
| Issuance of common stock - ESPP | 767 | | | 617 | | | 504 | |
| Sale of common stock, net of offering costs | 33,141 | | | — | | | — | |
| Balance, end of period | 782,266 | | | 744,361 | | | 739,926 | |
| Treasury stock, beginning and ending of period | (47,721) | | | (47,721) | | | (47,721) | |
| Accumulated other comprehensive income | | | | | |
| Balance, beginning of period | 918 | | | 950 | | | 885 | |
| Translation adjustment | (231) | | | (32) | | | 65 | |
| Balance, end of period | 687 | | | 918 | | | 950 | |
| Accumulated deficit | | | | | |
| Balance, beginning of period | (623,409) | | | (616,409) | | | (580,425) | |
| Net income (loss) | 25,643 | | | (7,000) | | | (35,984) | |
| Balance, end of period | (597,766) | | | (623,409) | | | (616,409) | |
| Total shareholders’ equity | $ | 137,466 | | | $ | 74,149 | | | $ | 76,746 | |
The accompanying notes are an integral part of these consolidated financial statements.
EMCORE CORPORATION
Consolidated Statements of Cash Flows
For the Fiscal Years Ended September 30, 2021, 2020 and 2019
(in thousands)
| | | | | | | | | | | | | | | | | |
| For the Fiscal Year Ended September 30, |
| 2021 | | 2020 | | 2019 |
| Cash flows from operating activities: | | | | | |
| Net income (loss) | $ | 25,643 | | | $ | (7,000) | | | $ | (35,984) | |
| Adjustments to reconcile net loss to net cash provided by operating activities: | | | | | |
| Depreciation and amortization expense | 4,061 | | | 5,484 | | | 7,142 | |
| Stock-based compensation expense | 4,180 | | | 3,517 | | | 2,607 | |
| Provision adjustments related to doubtful accounts | 33 | | | 188 | | | 62 | |
| Provision adjustments related to product warranty | 322 | | | 373 | | | 186 | |
| Loss (gain) on disposal of property, plant and equipment | 515 | | | (2,284) | | | (302) | |
| Other | (658) | | | (342) | | | 464 | |
| Total non-cash adjustments | 8,453 | | | 6,936 | | | 10,159 | |
| Changes in operating assets and liabilities: | | | | | |
| Accounts receivable and contract assets | (5,348) | | | (7,518) | | | 3,980 | |
| Inventory | (6,326) | | | (1,226) | | | 6,486 | |
| Other assets | (1,500) | | | (13,465) | | | (238) | |
| Accounts payable | (420) | | | 6,171 | | | (4,539) | |
| Accrued expenses and other current liabilities | (9,349) | | | 12,210 | | | 4,985 | |
| Total change in operating assets and liabilities | (22,943) | | | (3,828) | | | 10,674 | |
| Net cash provided by (used) in operating activities | 11,153 | | | (3,892) | | | (15,151) | |
| Cash flows from investing activities: | | | | | |
| Purchase of equipment | (5,358) | | | (4,516) | | | (10,790) | |
| Acquisition of business, net of cash acquired | — | | | — | | | (21,483) | |
| Proceeds from future sale of assets | 834 | | | — | | | — | |
| Proceeds from disposal of property, plant and equipment | 687 | | | 15,403 | | | 470 | |
| Net cash (used in) provided by investing activities | (3,837) | | | 10,887 | | | (31,803) | |
| Cash flows from financing activities: | | | | | |
| Proceeds from PPP Loan | — | | | 6,488 | | | — | |
| Net (payments) proceeds from borrowings of credit facilities | — | | | (5,497) | | | 5,497 | |
| Proceeds from employee stock purchase plans and exercise of equity awards | 844 | | | 619 | | | 505 | |
| Proceeds from sale of common stock | 35,937 | | | — | | | — | |
| Issuance cost associated with sale of common stock | (2,796) | | | — | | | — | |
| Taxes paid related to net share settlement of equity awards | (260) | | | (111) | | | (203) | |
| Net cash provided by financing activities | 33,725 | | | 1,499 | | | 5,799 | |
| Effect of exchange rate changes provided by foreign currency | 103 | | | 67 | | | (63) | |
| Net increase (decrease) in cash, cash equivalents and restricted cash | 41,144 | | | 8,561 | | | (41,218) | |
| Cash, cash equivalents and restricted cash at beginning of period | 30,538 | | | 21,977 | | | 63,195 | |
| Cash, cash equivalents and restricted cash at end of period | $ | 71,682 | | | $ | 30,538 | | | $ | 21,977 | |
| | | | | |
| SUPPLEMENTAL DISCLOSURE OF CASH FLOW INFORMATION | | | | | |
| Cash paid during the period for interest | $ | 61 | | | $ | 113 | | | $ | 126 | |
| Cash paid during the period for income taxes | $ | 975 | | | $ | 63 | | | $ | 68 | |
| NON-CASH INVESTING AND FINANCING ACTIVITIES | | | | | |
| Changes in accounts payable related to purchases of equipment | $ | 360 | | | $ | (520) | | | $ | (180) | |
| Restricted stock units issued in settlement of bonus | $ | — | | | $ | 410 | | | $ | — | |
The accompanying notes are an integral part of these consolidated financial statements.
EMCORE Corporation
Notes to our Consolidated Financial Statements
| |
NOTE 1. | NOTE 1. Description of Business |
Business Overview
EMCORE Corporation (referred to herein, together with its subsidiaries, as the “Company,” “we,” “our,” or “EMCORE”) was establishedis a leading provider of sensors for navigation in 1984the aerospace and defense market as well as a New Jersey corporation. The Company became publicly tradedmanufacturer of lasers and optical subsystems for use in 1997 and is listed on the Nasdaq stock exchange under the ticker symbol EMKR.Cable TV ("CATV") industry. EMCORE pioneered the linear fiber optic transmission technology that enabled the world’s first delivery of Cable TVCATV directly on fiber, and today is a leading provider of advancedMixed-Signal Optics products that enable communications systems and service providers to meet growing demand for increased bandwidth and connectivity. The Mixed-Signal Opticstechnology at the heart of our broadband communications products is shared with our fiber optic gyrosgyroscope (“FOG”) and inertial sensors to provide the aerospace and defense markets with state-of-the-art navigation systems technology. With the acquisition of Systron Donner Inertial, Inc. ("SDI"), a navigation systems provider with a scalable, chip-based platform for higher volume gyro applications utilizing quartz micro-electromechanical system ("QMEMS") technology, in June 2019, EMCORE further expanded its portfolio of gyros and inertial sensors with SDI’s QMEMS gyro and accelerometer technology. EMCORE has fully vertically-integrated manufacturing capability through our indium phosphide ("InP") compound semiconductor wafer fabrication facility at our headquarters in Alhambra, CA, and through our quartz processing and sensor manufacturing facility in Concord, CA. These facilities support EMCORE’s vertically-integrated manufacturing strategy for quartz and FOG products, for navigation systems, and for our chip, laser, transmitter, and receiver products for broadband applications. With both analog and digital circuits on multiple chips, or even a single chip, the value of Mixed-Signal device solutions areis often farsubstantially greater than traditional digital applications and requires a specialized expertise held by EMCORE which is unique in the optics industry.
We currently have one reporting segment: Fiber Optics. This segment is comprised of three product lines: Broadband (which includes Cable TV (“CATV”) systems and components, radio frequency over glass products, satellite/microwave communications products and wireless communication products), Chip Devices and Navigation Systems.
| |
NOTE 2. | NOTE 2. Summary of Significant Accounting Policies |
Principles of Consolidation: Our
The consolidated financial statements have been prepared in accordance with U.S. GAAP and include the assets, liabilities, shareholders'shareholders’ equity, and operating results of the Company and its wholly owned subsidiaries. All significant intercompany accounts and transactions have been eliminated in consolidation. We areThe Company is not the primary beneficiary of, nor do we hold a significant variable interest in, any variable interest entity.
The Company has a history of operating losses and negative cash flows from operations. The Company has taken a number of actions to continue to support its operations and meet its obligations, including headcount reductions and cost reductions. In addition, we expect to generate additional liquidity through the monetization of certain fixed assets and real estate. The Company believes that its existing liquidity will be sufficient to meet anticipated cash needs for at least the next 12 months from the issuance date of these financial statements.Going Concern Basis
The consolidated financial statements included herein have been prepared on a going concern basis, which contemplates continuity of operations and the realization of assets and the repayment of liabilities in the ordinary course of business. Management evaluated the significance of the Company’s recent operating losslosses and determined that the Company’s current cash on hand, operating plan, and sources of capital wouldwill be sufficient to alleviate concerns aboutfor the Company’s abilityCompany to continue as a going concern.
The Company recorded adjustmentshas taken a number of actions to decrease “prepaid expensescontinue to support its operations and other current assets”meet its obligations, including headcount and “accrued expenses and other current liabilities” by $6.6 million ascost reductions, monetization of September 30, 2018. The adjustments also impacted the changes in operatingcertain fixed assets and liabilities inreal estate, and entering into financing activities. The Company believes that its existing liquidity will be sufficient to meet anticipated cash needs for at least the consolidated statementsnext 12 months from the issuance date of cash flows. The adjustments were made to appropriately derecognize receivables and payables for value added tax that had settled. These adjustments had no impact on net loss or cash provided by operating activities.these financial statements.
Use of Estimates:
The preparation of consolidated financial statements in conformity with U.S. GAAP requires us to make estimates and assumptions that affect the reported amounts of assets and liabilities and disclosure of contingent assets and liabilities, as of the date of the financial statements, and the reported amounts of revenue and expenses during the reported period. Such estimates include accounts receivable; inventories; goodwill; long-lived assets; product warranty liabilities; legal contingencies; and income taxes.
We develop estimates based on historical experience and on various assumptions about the future that are believed to be reasonable based on the best information available to us. Our reported financial position or results of operations may be materially different under changed conditions or when using different estimates and assumptions, particularly with respect to significant accounting policies. In the event that estimates or assumptions prove to differ from actual results, adjustments are made in subsequent periods to reflect more current information.
Concentration of Credit Risk:
Financial instruments that may subject us to concentrations of credit risk consist primarily of cash and cash equivalents and accounts receivable. Our cash and cash equivalents are held in safekeeping primarily with Wells Fargo. When necessary, we perform credit evaluations on our customers'customers’ financial condition and occasionally we request deposits in advance of shipping product to our customers. These financial evaluations require significant judgment and are based on a variety of factors including, but not limited to, current economic trends, historical payment patterns, bad debt write-off experience, and financial review of the particular customer.
Cash and Cash Equivalents:
Cash and cash equivalents consists primarily of bank deposits and highly liquid short-term investments with a maturity of three months or less at the time of purchase.
Restricted Cash:
Restricted cash represents recently deposited cash that is temporarily restricted by our bank in accordance with the terms of the outstanding credit facility.
Accounts Receivable:
We regularly evaluate the collectability of our accounts receivable and maintain allowances for doubtful accounts for estimated losses resulting from the inability of our customers to meet their financial obligations to us. The allowance is based on the age of receivables and a specific identification of receivables considered at risk of collection. We classify charges associated with the allowance for doubtful accounts as selling, general, and administrative expense.
Inventory:
Inventory is stated at the lower of cost or net realizable value (first-in, first-out). Inventory that is expected to be used within the next 12 months is classified as current inventory. We write-down inventory once it has been determined that conditions exist that may not allow the inventory to be sold for its intended purpose or the inventory is determined to be excess or obsolete based on assumptions about future demand and market conditions. The charge related to inventory write-downs is recorded as a cost of revenue. We evaluate inventory levels at least quarterly against sales forecastsan estimate of future demand on a significant part-by-part basis, in addition to determining its overall inventory risk. We have incurred, and may in the future incur, charges to write-down our inventory. See Note 86 - Inventory in the notesNotes to the consolidated financial statementsConsolidated Financial Statements for additional information related to our inventory.
Property, Plant, and Equipment: Our property,
Property, plant, and equipment are recorded at cost. Plant and equipment are depreciated on a straight-line basis over the following estimated useful lives of the assets:
|
| | |
Description | | Estimated Useful Life
|
Building | | twenty years |
Equipment | | three to ten years |
Furniture and fixtures | | five years |
Computer hardware and software | | five to seven years |
Leasehold improvements | | three to six years |
assets. We depreciate equipment over three to ten years, furniture and fixtures over five years, computer hardware and software over five to seven years. Leasehold improvements are amortized over the lesser of the asset life or the lease term. Expenditures for repairs and maintenance are charged to expense as incurred. The costs for major renewals and improvements are capitalized and depreciated over their estimated useful lives of the related asset. The cost and related accumulated depreciation of the assets are removed from the accounts upon disposition and any resulting gain or loss is reflected in the consolidated statement of operations and comprehensive income (loss) income..
Valuation of Long-lived Assets:
Long-lived assets consist primarily of property, plant, and equipment, net. Since our long-lived assets are subject to amortization,depreciation, we review these assets for impairment in accordance with the provisions of Accounting Standards Codification ("ASC")ASC 360, Property, Plant, and Equipment.We review long-lived assets for impairment whenever events or changes in circumstances indicate that its carrying amount may not be recoverable. Our impairmentImpairment testing of long-lived assets consists of determining whether the carrying amount of the long-lived asset (asset group) is recoverable, in other words, whether the sum of the future undiscounted cash flows expected to result from the use and eventual disposition of the asset (asset group) exceeds its carrying amount. The determination of the existence of impairment involves judgments that are subjective in nature and may require the use of estimates in forecasting future results and cash flows related to an asset or group of assets. In making this determination, we use certain assumptions, including estimates of future cash flows expected to be generated by these assets, which are based on additional assumptions such as asset utilization, the length of service that assets will be used in our operations, and estimated salvage values.
Asset Retirement and Environmental Obligations:
Pursuant to ASC 410, Asset Retirement and Environmental Obligations, an asset retirement obligation (“ARO” or “AROs”)ARO is recorded when there is a legal obligation associated with the retirement of a tangible long-lived asset and the fair value of the liability can reasonably be estimated. Upon initial recognition of an ARO, a company increases the carrying amount of the long-lived asset by the same amount as the liability. Over time, the liabilities are accreted for the change in their present value through charges to operations costs. The initial capitalized costs are depleted over the useful lives of the related assets through charges to depreciation, and/or amortization. If the fair value of the estimated ARO changes, an adjustment is recorded to both the ARO and the asset retirement cost. Revisions in estimated liabilities can result from revisions of estimated inflation rates, escalating retirement costs, and changes in the estimated timing of settling ARO liabilities.
We have known asset retirement conditions, such as certain asset decommissioning and restoration of rented facilities to be performed in the future.
Business Combinations
The Company uses the acquisition method of accounting for business combinations and recognizes assets acquired and liabilities assumed at their fair values on the date acquired. Goodwill represents the excess of the purchase price over the fair value of the net assets. The fair values of the assets and liabilities acquired are determined based upon the Company’s valuation using a combination of market, income or cost approaches. In certain circumstances, the allocations of the purchase price are based upon preliminary estimates and assumptions and subject to revision when we receive final information, including appraisals and other analysis. Accordingly, the measurement period for such purchase price allocations will end when the information, or the facts and circumstances, becomes available, but will not exceed twelve months. We will recognize measurement-period adjustments during the period of resolution, including the effect on earnings of any amounts that would have been recorded in previous periods if the accounting had been completed at the acquisition date.
Fair Value of Financial Instruments:
We determine the fair value of our financial instruments in accordance with ASC 820, Fair Value Measurements and Disclosures.ASC Topic 820 (“ASC 820”), Fair Value Measurements, establishes a valuation hierarchy for disclosure of the inputs to valuation techniques used to measure fair value. This standard describes a fair value hierarchy based on three levels of inputs, of which the first two are considered observable and the last unobservable, that may be used to measure fair value:
•Level 1 inputs are unadjusted quoted prices in active markets for identical assets or liabilities.
•Level 2 inputs are quoted prices for similar assets and liabilities in active markets or inputs that are observable for the assets or liabilities, either directly or indirectly, through market corroboration, for substantially the full term of the financial instrument.
•Level 3 inputs are unobservable inputs based on assumptions used to measure assets or liabilities at fair value.
Classification of an asset or liability within this hierarchy is determined based on the lowest level input that is significant to the fair value measurement. Valuation techniques used to measure fair value under ASC 820 must maximize the use of observable inputs and minimize the use of unobservable inputs.
Cash and cash equivalents consists primarily of bank deposits or highly liquid short-term investments with a maturity of three months or less at the time of purchase. Restricted cash represents temporarily restricted deposits held as compensating balances against short-term borrowing arrangements. Cash, cash equivalents and restricted cash are based on Level 1 measurements. The carrying amounts of cash and cash equivalents, restricted cash, accounts receivable, other current assets, and accounts payable approximate fair value because of the short maturity of these instruments.
Revenue Recognition
To determine the proper revenue recognition, we perform the following five steps: (i)(a) identify the contract(s) with a customer; (ii)(b) identify the performance obligations in the contract; (iii)(c) determine the transaction price; (iv)(d) allocate the transaction price to the performance obligations in the contract; and (v)(e) recognize revenue when (or as) we satisfy a performance obligation. We only apply the five-step model to contracts when it is probable that we will collect the consideration we are entitled to in exchange for the goods or services we transfer to the customer.
The vast majority of our revenues are from product sales to our customers, pursuant to purchase orders with short lead times. Revenues from product sales are recognized when the customer obtains control of our product, which occurs at a point in time. The Company has elected to account for shipping and handling activities as a fulfillment cost as permitted by the standard. When we perform shipping and handling activities after the transfer of control to the customer (e.g. when control transfers prior to delivery), they are considered fulfillment activities, and accordingly, the costs are accrued when the related revenue is recognized. We expense incremental costs of obtaining a contract as and when incurred if the expected amortization period of the asset that we would have recognized is one year or less.
In certain instances, inventory is maintained by our customers at consigned locations. Revenues from consigned sales are recognized when the customer obtains control of our product, which occurs at a point in time. This is typically when the customer pulls product for use.
We use a number of wholesale distributors around the world and recognize revenue when the wholesale distributor obtains control of our product, which occurs at a point in time, typically upon shipment. Our wholesaleWholesale distributors are contractually obligated to pay us on standard commercial terms, consistent with our end-use customers. We do not sell to wholesale distributors on consignment and do not give wholesale distributors a right of return.
In certain instances, prior to customers accepting product that is manufactured at one of our contract manufacturers,CMs, these customers require that they first qualify the product and manufacturing processes at our contract manufacturerCM (e.g. customer acceptance clause). The customers’ qualification process determines whether the product manufactured at our contract manufacturerCM achieves their quality, performance, and reliability standards. After a customer completes the initial qualification process, we receive approval to ship qualified product to that customer. Revenues are recognized when the customer obtains control of the qualified product, which occurs at a point in time, typically upon shipment.
To a lesser extent, we enter into other types of contracts including non-recurring engineering contracts. We recognize revenue for these arrangements over time or at a point in time depending on our evaluation of when the customer obtains control of the promised goods or services. For contracts that include multiple performance obligations, we allocate revenue to each performance obligation based on estimates of the relative standalone selling price that we would charge the customer for each promised product or service. Revenue from products and services transferred to customers over time accounted for 4%1%, 1%5%, and 1%4% of the Company’s revenue for the years ended September 30, 2019, 2018,2021, 2020, and 2017,2019, respectively.
Receivables, Net-
Receivables, net, include amounts billed and currently due from customers. The amounts due are stated at their net estimated realizable value. Payments are generally due within 90 days or less of invoicing and do not include a significant financing component. We maintain an allowance for doubtful accountscredit loss to provide for the estimated amount of receivables that will not be collected. The allowance is based upon an assessment of customer creditworthiness, historical payment experience, the age of outstanding receivables and collateral to the extent applicable. Receivables, net, totaled $18.5 million and $19.3 million at September 30, 2019 and September 30, 2018, respectively.
A contract asset is recognized when the Company has recognized revenue, but not issued an invoice for payment. Contract assets are classified as current assets and transferred to receivables when the entitlement to payment becomes unconditional. The Company’s contract assets are generally converted to trade account receivables within 90 days, at which time the Company is entitled to payment of the fixed price upon delivery of the finished product subject to customer payment terms.
Remaining Performance Obligations -
Remaining performance obligations represent the transaction price of firm orders for long-term contracts which control has not transferred to the customer. As of September 30, 2019,2021, the aggregate amount of the transaction price allocated to remaining performance obligations was $1.7$1.2 million. The Company expects to recognize revenue on approximately 100% of the remaining performance obligations over the next twelve12 months.
Product Warranty Reserves -
We provide our customers with warranty claims for certain products and warranty-related services are not considered a separate performance obligation. Pursuant to ASC 450, Contingencies, we make estimates of product warranty expense using historical experience rates and accrue estimated warranty expense as a cost of revenue. We estimate the costs of our warranty obligations based on historical experience of known product failure rates and anticipated rates of warranty claims, use of materials to repair or replace defective products, and service delivery costs incurred in correcting the product issues. In addition, from time to time, specific warranty accruals may be made if unforeseen technical problems arise.
Disaggregation of Revenue -
Revenue is classified based onwithin the product line of business.Company’s segments. For additional information on the disaggregated revenues by geographical region and major product category, see Note 15 - Geographical13 – Segment Data and Revenue Information in the notesNotes to Consolidated Financial Statements.
Leases
The Company adopted the new lease standard as of October 1, 2019 under the modified retrospective approach. Therefore, the consolidated financial statements.
Revenuestatements for the year ended September 30, 2019 have not been adjusted and continued to be reported under previous U.S. GAAP guidance. Under the new lease standard, the Company determines if an arrangement is also classified by major product categorya lease at its inception. Right of use (ROU) assets and operating lease liabilities are recognized at the lease commencement date based on the present value of lease payments over the lease term. The Company uses its estimated incremental borrowing rate in determining the present value of lease payments considering the term of the lease, which is presented below:
derived from information available at the lease commencement date. The lease term includes renewal options when it is reasonably certain that the option will be exercised,
|
| | | | | | | | | | | | | | | | | | | | | |
| | | For the Fiscal Years ended September 30, |
| (in thousands) | | 2019 | | % of Revenue | | 2018 | | % of Revenue | | 2017 | | % of Revenue |
| Broadband | | $ | 53,233 |
| | 61 | % | | $ | 68,418 |
| | 80 | % | | $ | 109,633 |
| | 89 | % |
| Chips | | 10,828 |
| | 12 | % | | 10,050 |
| | 12 | % | | 9,170 |
| | 8 | % |
| Navigation | | 23,204 |
| | 27 | % | | 7,149 |
| | 8 | % | | 4,092 |
| | 3 | % |
| Total revenue | | $ | 87,265 |
| | 100 | % | | $ | 85,617 |
| | 100 | % | | $ | 122,895 |
| | 100 | % |
| |
NOTE 3. | NOTE 3. Recent Accounting Pronouncements |
(a) New Accounting Updates Recently Adopted
In May 2014, the Financial Accounting Standards Board (“FASB”) issued Accounting Standards Update (“ASU”) 2014-09, Revenue from Contracts with Customers (Topic 606), which replaces numerous requirements in U.S. GAAP, including industry-specific requirements, and provides companies with a single revenue recognition model for recognizing revenue from contracts with customers. Under the new standard, recognition of revenue occurs when the seller satisfies a performance obligation by transferring to the customer promised goods or services in an amount that reflects the consideration the entity expects to receive for those goods or services. Effective October 1, 2018, we adopted the requirements of Topic 606using the modified retrospective method. The adoption of Topic 606 did not have a material impact on the Company’s consolidated financial statements and related disclosures.
In May 2017, the FASB issued ASU 2017-09, Compensation — Stock Compensation (Topic 718): Scope of Modification Accounting. ASU 2017-09 clarifies when changes to the terms or conditions of a share-based payment award must be accounted for as modifications. The new guidance is intended to reduce diversity in practice and result in fewer changes to the terms of an award being accounted for as a modification. Under ASU 2017-09, an entity will not apply modification accounting to a share-based payment award if the award’s fair value, vesting conditions and classification as an equity or liability instrument are the same immediately before and after the change. ASU 2017-09 will be applied prospectively to awards modified on or after the adoption date. The new standard was effective for our fiscal year beginning October 1, 2018. The adoption of ASU 2017-09 did not have an impact on the Company’s consolidated financial statements and related disclosures.
In January 2016, the FASB issued ASU 2016-01, Financial Instruments-Overall (Subtopic 825-10):Recognition and Measurement of Financial Assets and Financial Liabilities. This ASU amends certain aspects of recognition, measurement, presentation and disclosure of financial instruments, and supersedes the guidance to classify equity securities with readily determinable fair values into different categories (that is, trading or available-for-sale) and requires equity securities to be measured at fair value with changes in the fair value recognized through net income. This new standard was effective for our fiscal year beginning October 1, 2018. The adoption of ASU 2016-01 did not have an impact on our consolidated financial statements and related disclosures.
(b) Recent Accounting Standards or Updates Not Yet Effective
In December 2019, the FASB issued Accounting Standards Update ("ASU") 2019-12, Income Taxes (Topic 740): Simplifying the Accounting for Income Taxes, which simplifies the accounting for income taxes by removing various exceptions, such as the exception to the incremental approach for intra-period tax allocation when there is a loss from continuing operations and income or a gain from other items. The amendments in this update also simplify the accounting for income taxes related to income-based franchise taxes and require that an entity reflect enacted tax laws or rates in the annual effective tax rate computation in the interim period that includes the enactment date. The new standard is effective for annual periods beginning after December 15, 2020, including interim periods within those annual periods. This accounting standard is effective in the first quarter of the Company's fiscal year ended September 30, 2022. The Company does not expect the adoption of this new guidance to have a material impact on the condensed consolidated financial statements.
Recently Adopted Accounting Pronouncements
In June 2016, the FASB issued ASU 2016-13 Financial Instruments - Credit Losses (Topic 326): Measurement of Credit Losses on Financial Instruments,, which changes the way entities measure credit losses for most financial assets and certain other instruments that are not measured at fair value through net earnings. The new standard is effective for annual periods beginning after December 15, 2019, including interim periods within those annual periods. The new standard will bewas effective for our fiscal year beginning October 1, 2020 and early adoption is permitted.2020. The Company is currently evaluating the new guidance to determine the impact it may have on its consolidated financial statements and related disclosures.
In February 2016, the FASB issued ASU 2016-02, Leases (Topic 842). ASU 2016-02 introduces a lessee model that requires recognition of assets and liabilities arising from qualified leases on the consolidated balance sheets and disclosure of qualitative and quantitative information about lease transactions. This guidance is effective for fiscal years beginning after December 15, 2018 and interim periods within those years. We are in the process of implementing changes to our systems and processes in conjunction with our review of lease agreements. Topic 842 will be effective for our fiscal year beginning October 1, 2019 and we expect to elect certain available transitional practical expedients.
The Company will utilize the modified retrospective method and will recognize any cumulative effect adjustment in accumulated deficit at the beginning of the period of adoption. The Company is in the process of gathering lease data, reviewing its lease portfolio, and completing an impact assessment with respect to the adoption of the provisions of the new standard. The Company does not expect the adoption of this new guidance tostandard did not have a significantmaterial impact on its consolidated statements of operations or its consolidated statements of cash flows.
On June 7, 2019, we completed the acquisition of Systron Donner Inertial, Inc. (“SDI”), a private-equity backed navigation systems provider with a scalable, chip-based platform for higher volume gyro applications utilizing Quartz MEMS technology. The total purchase price was approximately $25.0 million, consisting of (i) approximately $22.0 million in cash after working capital adjustments and (ii) the issuance of approximately 811 thousand shares of common stock with an aggregate value of approximately $3.0 million as of the closing date.
Following the closing, we began integrating SDI into our current navigation product line and have included the financial results of SDI in ourcondensed consolidated financial statements beginning on the acquisition date. Net revenue and net loss of SDI from the acquisition date of $9.8 million and $0.6 million, respectively, is included in our consolidated statements of operations and comprehensive (loss) income for the fiscal year ended September 30, 2019.statements.
Preliminary Purchase Price Allocation
The total purchase price was allocated to the assets acquired and liabilities assumed based on their estimated fair values as of the acquisition date.
As the Company finalizes the fair value of assets acquired and liabilities assumed, additional purchase price adjustments may be recorded during the measurement period (a period not to exceed 12 months from the date of acquisition). As of September 30, 2019, the Company had not finalized the determination of fair values allocated to equipment, deferred taxes and goodwill. Any changes in the fair values of the assets acquired and liabilities assumed during the measurement period may result in a material adjustment to goodwill.
The table below represents the purchase price allocation to the assets acquired and liabilities assumed of SDI based on their estimated fair values as of the acquisition date. The fair values assigned to assets acquired and liabilities assumed are based on management’s best estimates and assumptions at the acquisition date.
|
| | | | | | |
| (in thousands) | | Amount | | Weighted Average Useful Life (years) |
| Purchase Price | | $ | 24,978 |
| | |
| Developed technology | | 250 |
| | 7 |
| Cash acquired | | 541 |
| | |
| Inventories | | 8,522 |
| | |
| Accounts receivable | | 4,291 |
| | |
| Other assets | | 355 |
| | |
| Land and building | | 12,890 |
| | |
| Equipment | | 2,913 |
| | |
| Net liabilities assumed | | (4,853 | ) | | |
| | | | | |
| Goodwill | | $ | 69 |
| | |
Identifiable intangible assets - The estimated fair value of the developed technology was determined based on the expected future cost savings resulting from ownership of the asset. The present value of the expected future cash flows for the developed technology intangible asset was determined based on discount rates which incorporate a risk premium to take into account the risks inherent in those expected cash flows. The expected cash flows were estimated using available historical data adjusted based on the expectations of market participants.
Tangible assets acquired:
Inventories
Finished goods were valued at estimated selling price less costs of disposal and a reasonable profit allowance for the selling effort. Raw materials were valued at estimated replacement cost.
Property, plant and equipment
The property, plant and equipment acquired were valued using either the replacement cost or market approach, as appropriate, as of the acquisition date.
Goodwill
Goodwill represents the excess of the preliminary purchase price over the fair value of the assets acquired and liabilities assumed. The goodwill recognized is primarily attributable to the benefits the Company expects to derive from deepening the Company's expertise in navigation systems products.
For the fiscal year ended September 30, 2019, the Company incurred transaction costs of approximately $0.8 million, in connection with the SDI acquisition, which were expensed as incurred and included in selling, general and administrative expenses within the consolidated statements of operations.
Unaudited Pro Forma Financial Information
The following unaudited pro forma financial information presented for the fiscal years ended September 30, 2019 and 2018 does not purport to be indicative of the results of operations that would have been achieved had the acquisition been consummated on October 1, 2017, nor of the results which may occur in the future. The pro forma amounts are based upon available information and certain assumptions that the Company believes are reasonable.
|
| | | | | | | | |
| (in thousands, except per share data) | | For the Fiscal Years ended September 30, |
| | | 2019 | | 2018 |
| Revenue | | $ | 107,199 |
| | $ | 113,398 |
|
| Net loss | | $ | (42,013 | ) | | $ | (18,136 | ) |
| Net loss per basic and diluted share | | $ | (1.50 | ) | | $ | (0.67 | ) |
| Weighted-average number of basic and diluted shares outstanding | | 27,983 |
| | 27,266 |
|
| |
NOTE 5. | Cash, Cash Equivalents and Restricted Cash |
NOTE 4. Cash, Cash Equivalents, and Restricted Cash
The following table provides a reconciliation of cash, cash equivalents and restricted cash reported within the consolidated balance sheets that sum to the total of the same amounts shown in the consolidated statements of consolidated cash flows:
| | | | | | | | | | | | | | | | | |
| As of September 30, |
| (in thousands) | 2021 | | 2020 | | 2019 |
| Cash | $ | 16,547 | | | $ | 11,325 | | | $ | 4,338 | |
| Cash equivalents | 55,074 | | | 19,065 | | | 17,236 | |
| Restricted cash | 61 | | | 148 | | | 403 | |
| Total cash, cash equivalents and restricted cash | $ | 71,682 | | | $ | 30,538 | | | $ | 21,977 | |
|
| | | | | | | | | | | |
| | As of September 30, |
| (in thousands) | 2019 | | 2018 | | 2017 |
| Cash | $ | 4,338 |
| | $ | 2,965 |
| | $ | 8,054 |
|
| Cash equivalents | $ | 17,236 |
| | $ | 60,152 |
| | $ | 60,279 |
|
| Restricted cash | 403 |
| | 78 |
| | 421 |
|
| Total cash, cash equivalents and restricted cash | $ | 21,977 |
| | 63,195 |
| | 68,754 |
|
The Company's restricted cash includes cash balances which are legally or contractually restricted to use. The Company's restricted cash is included in current assets as of September 30, 2019, 2018 and 2017.
| |
NOTE 6. | Fair Value Accounting |
ASC Topic 820 (“ASC 820”), Fair Value Measurements, establishes a valuation hierarchy for disclosure of the inputs to valuation techniques used to measure fair value. This standard describes a fair value hierarchy based on three levels of inputs, of which the first two are considered observable and the last unobservable, that may be used to measure fair value:
Level 1 inputs are unadjusted quoted prices in active markets for identical assets or liabilities.
Level 2 inputs are quoted prices for similar assets and liabilities in active markets or inputs that are observable for the assets or liabilities, either directly or indirectly, through market corroboration, for substantially the full term of the financial instrument.
Level 3 inputs are unobservable inputs based on our own assumptions used to measure assets or liabilities at fair value.
Classification of an asset or liability within this hierarchy is determined based on the lowest level input that is significant to the fair value measurement.
Valuation techniques used to measure fair value under ASC 820 must maximize the use of observable inputs and minimize the use of unobservable inputs.
Cash consists primarily of bank deposits or highly liquid short-term investments with a maturity of three months or less at the time of purchase. Restricted cash represents temporarily restricted deposits held as compensating balances against short-term borrowing arrangements. Cash, cash equivalents and restricted cash are based on Level 1 measurements.
The carrying amounts of cash and cash equivalents, restricted cash, accounts receivable, other current assets, and accounts payable approximate fair value because of the short maturity of these instruments. See Note 4 Acquisition for discussion of the fair value measurement of assets acquired and liabilities assumed in the SDI acquisition.
| |
NOTE 7. | Accounts Receivable |
NOTE 5. Accounts Receivable
The components of accounts receivable consisted of the following:
| | | | | | | | | | | |
| | | |
| As of September 30, |
| (in thousands) | 2021 | | 2020 |
| Accounts receivable, gross | $ | 32,109 | | | $ | 25,551 | |
| Allowance for credit loss | (260) | | | (227) | |
| Accounts receivable, net | $ | 31,849 | | | $ | 25,324 | |
|
| | | | | | | | |
| | As of |
| (in thousands) | | September 30, 2019 |
| September 30, 2018 |
| Accounts receivable, gross | | $ | 18,645 |
| | $ | 19,823 |
|
| Allowance for doubtful accounts | | (148 | ) | | (548 | ) |
| Accounts receivable, net | | $ | 18,497 |
| | $ | 19,275 |
|
The allowance for doubtful accounts is based on the age of receivables and a specific identification of receivables considered at risk of collection.
The following table summarizes changes in the allowance for doubtful accounts for the fiscal years ended September 30, 2019, 2018 and 2017.
credit loss:
| | | | | | | | | | For the Fiscal Year Ended September 30, |
Allowance for Doubtful Accounts (in thousands) | | For the Fiscal Years ended September 30, | |
| | | 2019 | | 2018 | | 2017 | |
| (in thousands) | | (in thousands) | 2021 | | 2020 | | 2019 |
| Balance at beginning of period | | $ | 548 |
| | $ | 22 |
| | $ | 36 |
| Balance at beginning of period | $ | 227 | | | $ | 148 | | | $ | 548 | |
| Provision adjustment - expense, net of recoveries | | 62 |
| | 599 |
| | 23 |
| Provision adjustment - expense, net of recoveries | 90 | | | 188 | | | 62 | |
| Write-offs and other adjustments - deductions to receivable balances | | (462 | ) | | (73 | ) | | (37 | ) | |
| Write-offs and other deductions | | Write-offs and other deductions | (57) | | | (109) | | | (462) | |
| Balance at end of period | | $ | 148 |
| | $ | 548 |
| | $ | 22 |
| Balance at end of period | $ | 260 | | | $ | 227 | | | $ | 148 | |
NOTE 6. Inventory
The components of inventory consisted of the following:
| | | | | | | | | | | |
| As of September 30, |
| (in thousands) | 2021 | | 2020 |
| Raw materials | $ | 16,146 | | | $ | 13,354 | |
| Work in-process | 11,410 | | 8,381 |
| Finished goods | 4,753 | | 3,790 |
| Inventory balance at end of period | $ | 32,309 | | | $ | 25,525 | |
|
| | | | | | | |
| | As of |
| (in thousands) | September 30, 2019 | | September 30, 2018 |
| Raw materials | $ | 11,510 |
| | $ | 11,857 |
|
| Work in-process | 8,176 |
| | 5,402 |
|
| Finished goods | 4,365 |
| | 5,024 |
|
| Inventory balance at end of period | $ | 24,051 |
| | $ | 22,283 |
|
| Current portion | $ | 24,051 |
| | $ | 20,850 |
|
| Non-Current portion | $ | — |
| | $ | 1,433 |
|
The non-current inventory balance of $0 and $1.4 million as of September 30, 2019 and 2018, respectively, is comprised entirely of raw materials which we acquired as part of a last time purchase as a result of the vendor announcing it would cease manufacturing a part. During the fiscal years ended September 30, 2019 and 2018, we recorded a $1.3 million and $1.0 million, write-down, respectively, on non-current inventory due to the decline in sales and future demand of the inventory. There was no write-down recorded on non-current inventory in the fiscal year ended September 30, 2017.
| |
NOTE 9. | Property, Plant, and Equipment, net |
NOTE 7. Property, Plant, and Equipment, net
The components of property, plant, and equipment, net consisted of the following:
| | | | | | | | | | | |
| As of September 30, |
| (in thousands) | 2021 | | 2020 |
| Equipment | $ | 37,985 | | | $ | 35,218 | |
| Furniture and fixtures | 1,125 | | | 1,125 | |
| Computer hardware and software | 3,575 | | | 3,473 | |
| Leasehold improvements | 6,663 | | | 3,169 | |
| Construction in progress | 9,247 | | | 10,301 | |
| Property, plant, and equipment, gross | $ | 58,595 | | | $ | 53,286 | |
| Accumulated depreciation | (36,051) | | | (32,234) | |
| Property, plant, and equipment, net | $ | 22,544 | | | $ | 21,052 | |
|
| | | | | | | |
| | As of |
| (in thousands) | September 30, 2019 | | September 30, 2018 |
| Land | $ | 3,484 |
| | $ | — |
|
| Building and improvements | 9,405 |
| | — |
|
| Equipment | 42,308 |
| | 36,625 |
|
| Furniture and fixtures | 1,109 |
| | 1,109 |
|
| Computer hardware and software | 3,554 |
| | 2,928 |
|
| Leasehold improvements | 2,676 |
| | 2,049 |
|
| Construction in progress | 9,330 |
| | 3,648 |
|
| Property, plant, and equipment, gross | $ | 71,866 |
| | $ | 46,359 |
|
| Accumulated depreciation | (34,643 | ) | | (28,143 | ) |
| Property, plant, and equipment, net | $ | 37,223 |
| | $ | 18,216 |
|
Depreciation expense totaled $7.1$4.0 million, $5.6$5.5 million and $3.7$7.1 million during the fiscal years ended September 30, 2021, 2020 and 2019, 2018respectively. During the fiscal year ended September 30, 2021 and 2017,2020 the Company sold certain equipment and recognized a (loss) gain on sale of assets of $(0.5) million and $2.3 million, respectively. In addition, in the fiscal year ended September 30, 2020, the Company entered into agreements to sell additional equipment and these assets were reclassified to assets held for sale. The balance as of September 30, 2021 and 2020 was $1.2 million and $1.6 million, respectively.
In February 2020, SDI sold its property located in Concord, California (the "Concord Real Property") to Eagle Rock Holdings, LP ("Eagle Rock"), an affiliate of Parkview Management Group, Inc., for a total purchase price of $13.2 million. The Company received net proceeds of $12.8 million after reducing for transaction commissions and expenses incurred in connection with the sale. The Company recorded a gain on the sale of assets of approximately $0.3 million in the fiscal year ended September 30, 2020 related to this transaction. At the consummation of the sale of the Concord Real Property, SDI entered into a Single-Tenant Triple Net Lease (the “Concord Lease Agreement”) pursuant to which SDI leased back from Eagle Rock the Concord Real Property for a term commencing in February 2020 and ending February 2035, unless earlier terminated or extended in accordance with the terms of the Lease Agreement. As a result of the Concord Lease Agreement, the Company recorded net operating lease ROU assets and operating lease liabilities of $10.8 million during the fiscal year ended September 30, 2020.
Geographical Concentrations
Long-lived assets consist of land, building, and property, plant, and equipment. As of September 30, 2021 and 2020, approximately 96% and 97%, respectively, of long-lived assets were located in the United States. The remaining long-lived assets are primarily located in China.
| |
NOTE 10. | Accrued Expenses and Other Current Liabilities |
NOTE 8. Accrued Expenses and Other Current Liabilities
The components of accrued expenses and other current liabilities consisted of the following:
| | | | | | | | | | | |
| As of September 30, |
| (in thousands) | 2021 | | 2020 |
| Compensation | $ | 7,192 | | | $ | 6,916 | |
| Warranty | 1,125 | | 803 |
| Legal expenses and other professional fees | 152 | | 211 |
| Contract liabilities | 364 | | 502 |
| Income and other taxes | 104 | | 1,265 |
| Severance and restructuring accruals | — | | 17 |
| Other | 999 | | 1,863 |
| Accrued expenses and other current liabilities | $ | 9,936 | | | $ | 11,577 | |
|
| | | | | | | |
| As of |
| (in thousands) | September 30, 2019 |
| September 30, 2018 |
| Compensation | $ | 5,185 |
| | $ | 3,065 |
|
| Warranty | 654 |
| | 642 |
|
| Legal expenses and other professional fees | 4,407 |
| | 604 |
|
| Contract liabilities | 541 |
| | 390 |
|
| Income and other taxes | 1,135 |
| | 961 |
|
| Severance and restructuring accruals | 172 |
| | 82 |
|
| Other | 2,427 |
| | 1,829 |
|
| Accrued expenses and other current liabilities | $ | 14,521 |
| | $ | 7,573 |
|
Warranty: The following table summarizesSeverance and restructuring-related accruals specifically relate to the changesreductions in our product warranty accrual accounts:
|
| | | | | | | | | | | |
| Product Warranty Accruals | For the fiscal year ended September 30, |
| (in thousands) | 2019 | | 2018 | | 2018 |
| Balance at beginning of period | $ | 642 |
| | $ | 684 |
| | $ | 871 |
|
| Provision for product warranty - expense | 186 |
| | 431 |
| | 573 |
|
| Warranty liability assumed in acquisition liability | 80 |
| | — |
| | — |
|
| Utilization of warranty accrual | (254 | ) | | (473 | ) | | (760 | ) |
| Balance at end of period | $ | 654 |
| | $ | 642 |
| | $ | 684 |
|
Severanceforce. Expense related to severance and restructuring accruals: On December 4, 2018, is included in SG&A expense on the Companyconsolidated statements of operations and Jikun Kim, the Company's former Chief Financial Officer, entered into a Separation and General Release Agreement (the “Separation Agreement”) pursuant to which the Company and Mr. Kim agreed that he would cease service with the Company effective as of December 31, 2018 (the “Separation Date”)comprehensive income (loss). The Separation Agreement provided for, among other things, the continuation of his base salary for a period of two months following the Separation Date and a lump sum payment of $22,875 in lieu of any cash bonus payment under the Company’s Fiscal Year 2018 Bonus Plan, in each case subject to his execution and non-revocation of a general release agreement releasing the Company from any liability or obligation to him and compliance with certain confidentiality, non-solicitation and other restrictive covenants as provided in the Separation Agreement. Mr. Kim’s outstanding equity awards that remained unvested as of the Separation Date were cancelled and terminated. The Company recorded a charge of approximately $0.1 million in the fiscal year ended September 30, 2019 related to this Separation Agreement.
In an effort to better align our current and future business operations related to our CATV product lines, in August 2019 the Company reduced its workforce by approximately 40 individuals and recorded a charge for$0.5 million in severance for the affected employees in the amount of $0.5 millionexpense in the fiscal year ended September 30, 2019. In January 2020, we further reduced our workforce and recorded $0.6 million in severance expense in the fiscal year ended September 30, 2020. There was $0.1 million in severance expense recorded in the fiscal year ended September 30, 2021. As of September 30, 2021 and 2020 there was $0 and $17.0 thousand accrued.
Our severance and restructuring-related accruals specifically relate to the Separation Agreement described above, the reduction in force and non-cancelable obligations associated with an abandoned leased facility. Expense related to severance and restructuring accruals is included in selling, general, and administrative expense on our consolidated statements of operations and comprehensive (loss) income. The following table summarizes the changes in the severanceproduct warranty accrual accounts:
| | | | | | | | | | | | | | | | | |
| For the Fiscal Year Ended September 30, |
| (in thousands) | 2021 | | 2020 | | 2019 |
| Balance at beginning of period | $ | 803 | | | $ | 654 | | | $ | 642 | |
| Provision for product warranty expense | 505 | | | 626 | | | 186 | |
| Warranty liability assumed in acquisition liability | — | | | — | | | 80 | |
| Adjustments and utilization of warranty accrual | (183) | | | (477) | | | (254) | |
| Balance at end of period | $ | 1,125 | | | $ | 803 | | | $ | 654 | |
NOTE 9. Credit Facility and restructuring accrual account:Debt
|
| | | | | | | | | | | |
| (in thousands) | Severance-related accruals | | Restructuring- related accruals | | Total |
| Balance as of September 30, 2018 | $ | 7 |
| | $ | 75 |
| | $ | 82 |
|
| Expense - charged to accrual | 531 |
| | — |
| | 531 |
|
| Payments and accrual adjustments | (366 | ) | | (75 | ) | | (441 | ) |
| Balance as of September 30, 2019 | $ | 172 |
| | $ | — |
| | $ | 172 |
|
| |
NOTE 11. | Credit Facilities |
On November 11, 2010, we entered into a Credit and Security Agreement (as amended to date, the “Credit Facility”) with Wells Fargo Bank, N.A. (“Wells Fargo”). The Credit Facility is secured by the Company'sCompany’s assets and is subject to a borrowing base formula based on the Company'sCompany’s eligible accounts receivable, inventory, and machinery and equipment accounts.
The Credit Facility matures in November 2021February 2022 and currently provides us with a revolving credit line of up to $15.0 million at an interest rate equal to LIBOR plus 1.75%, subject to a borrowing base formula, that can be used for working capital requirements, letters of credit, acquisitions, and other general corporate purpose subject to a requirement, for certain specific uses, that the Company have liquidity of at least $25.0 million after such use. The Credit Facility requires us to maintain (a) liquidity of at least $7.5$10.0 million and (b) excess availability of at least $1.0 million.
As of September 30, 2019,2021, there was $5.5 millionwere no amounts outstanding under this Credit Facility with an interest rate of 3.8% and the Company was in compliance with all financial covenants. Also, as of September 30, 2019,2021, the Credit Facility had approximately $0.5 million reserved for one1 outstanding stand-by letter of credit and $0 available for borrowing. As of December 6, 2019, there was an outstanding balance under this Credit Facility of $3.2 million, $0.5 million reserved for one outstanding stand-by letter of credit and $1.3approximately $13.4 million available for borrowing.
Debt
On May 3, 2020, the Company entered into a Paycheck Protection Program Promissory Note and Agreement (the “PPP Loan Agreement”) with Wells Fargo under the Paycheck Protection Program established under the Coronavirus Aid, Relief and Economic Security Act and administered by the U.S. Small Business Administration (the "SBA") to receive loan proceeds of approximately $6.5 million, which the Company received on May 6, 2020.
During 2021 the Company received a notification from Wells Fargo that the SBA approved the Company’s PPP Loan forgiveness application for the entire PPP Loan balance of approximately $6.5 million, including all accrued interest thereon, and that the remaining PPP Loan balance is zero. The forgiveness of the PPP Loan was recognized during the Company’s fiscal
quarter ended June 30, 2021. The Company recorded the gain on debt extinguishment in other income (expense) in the statements of operations and comprehensive income (loss).
| |
NOTE 12. | Income and Other Taxes |
NOTE 10. Income and Other Taxes
The Company'sCompany’s income (loss) from continuing operations before income taxes consisted of the following:
| | | | | | | | | | | | | | | | | |
| For the Fiscal Year Ended September 30, |
| (in thousands) | 2021 | | 2020 | | 2019 |
| Domestic | $ | 25,744 | | | $ | (7,159) | | | $ | (35,100) | |
| Foreign | 471 | | | 219 | | | (830) | |
| Loss before income taxes | $ | 26,215 | | | $ | (6,940) | | | $ | (35,930) | |
|
| | | | | | | | | | | |
| Income (loss) from continuing operations before income taxes | For the Fiscal Years ended September 30, |
| (in thousands) | 2019 | | 2018 | | 2017 |
| Domestic | $ | (35,100 | ) | | $ | (16,752 | ) | | $ | 10,632 |
|
| Foreign | (830 | ) | | (1,150 | ) | | (2,248 | ) |
| Income (loss) from continuing operations before income taxes | $ | (35,930 | ) | | $ | (17,902 | ) | | $ | 8,384 |
|
The Company'sCompany’s income tax expense (benefit) consisted of the following:
| | | | | | | | | | | | | | | | | |
| For the Fiscal Year Ended September 30, |
| (in thousands) | 2021 | | 2020 | | 2019 |
| Federal: | | | | | |
| Current | $ | — | | | $ | 30 | | | $ | — | |
| Deferred | — | | | (43) | | | — | |
| — | | | (13) | | | — | |
| State: | | | | | |
| Current | 990 | | | 98 | | | 54 | |
| Deferred | — | | | (25) | | | — | |
| 990 | | | 73 | | | 54 | |
| Foreign: | | | | | |
| Current | (418) | | | — | | | — | |
| Deferred | — | | | — | | | — | |
| (418) | | | — | | | — | |
| Total income tax expense | $ | 572 | | | $ | 60 | | | $ | 54 | |
|
| | | | | | | | | | | |
| Income tax (benefit) expense | For the Fiscal Years Ended September 30, |
| (in thousands) | 2019 | | 2018 | | 2017 |
| Federal: | | | | | |
| Current | $ | — |
| | $ | (502 | ) | | $ | 135 |
|
| Deferred | — |
| | — |
| | — |
|
| | — |
| | (502 | ) | | 135 |
|
| State: | | | | | |
| Current | 54 |
| | 53 |
| | 28 |
|
| Deferred | — |
| | — |
| | — |
|
| | 54 |
| | 53 |
| | 28 |
|
| Foreign: | | | | | |
| Current | — |
| | — |
| | — |
|
| Deferred | — |
| | — |
| | — |
|
| | — |
| | — |
| | — |
|
| Total income tax (benefit) expense | $ | 54 |
| | $ | (449 | ) | | $ | 163 |
|
EMCORE Corporation is incorporated in the state of New Jersey. A reconciliation of the provision for income taxes, with the amount computed by applying the statutory U.S. federal and state income tax rates to continuing operations income before provision for income taxes is as follows:
| | | | | | | | | | | | | | | | | |
| | | | | |
| For the Fiscal Year Ended September 30, |
| (in thousands) | 2021 | | 2020 | | 2019 |
| Income tax expense (benefit) computed at U.S. federal statutory rate | $ | 5,506 | | | $ | (1,457) | | | $ | (7,540) | |
| State tax expense (benefit), net of U.S. federal effect | 990 | | | (156) | | | (906) | |
| Foreign tax rate differential | 24 | | | 13 | | | (28) | |
| Effect due to change in tax rate | — | | | (137) | | | (183) | |
| Shortfall from stock based compensation | (122) | | | 432 | | | 248 | |
| Other | 103 | | | 94 | | | 223 | |
| Federal benefit on PPP loan forgiveness | (1,363) | | | — | | | — | |
| Change in uncertain tax positions | (419) | | | — | | | — | |
| State net operating loss carryforward adjustment | 454 | | | 533 | | | 139 | |
| Change in valuation allowance | (4,601) | | | 738 | | | 8,101 | |
| Income tax expense | $ | 572 | | | $ | 60 | | | $ | 54 | |
| Effective tax rate | 2.2 | % | | 0.9 | % | | 0.2 | % |
|
| | | | | | | | | | | |
| Provision for Income Taxes | For the Fiscal Years Ended September 30, |
| (in thousands) | 2019 | | 2018 | | 2017 |
| Income tax (benefit) expense computed at U.S. federal statutory rate | $ | (7,540 | ) | | $ | (4,346 | ) | | $ | 2,841 |
|
| State tax expense benefit, net of U.S. federal effect | (906 | ) | | (168 | ) | | 414 |
|
| Foreign tax rate differential | (28 | ) | | 36 |
| | 229 |
|
| Effect due to change in tax rate | (183 | ) | | 57,988 |
| | 2,528 |
|
| Shortfall (windfall) from stock based compensation | 248 |
| | 681 |
| | (150 | ) |
| Other | 223 |
| | 216 |
| | 126 |
|
| State net operating loss carryforward adjustment | 139 |
| | (305 | ) | | 933 |
|
| Change in valuation allowance | 8,101 |
| | (54,551 | ) | | (6,758 | ) |
| Income tax expense (benefit) | $ | 54 |
| | $ | (449 | ) | | $ | 163 |
|
| Effective tax rate | 0.2 | % | | (2.5 | )% | | 1.9 | % |
Significant components of our deferred tax assets are as follows:
| | | | | | | | As of September 30, |
| Deferred Tax Assets | | As of September 30 | |
| (in thousands) | | 2019 | | 2018 | (in thousands) | 2021 | | 2020 |
| Deferred tax assets: | | | | | |
| Federal net operating loss carryforwards | | $ | 99,298 |
| | $ | 91,639 |
| Federal net operating loss carryforwards | $ | 96,289 | | | $ | 100,363 | |
| Foreign net operating loss carryforwards | | 1,271 |
| | 1,301 |
| Foreign net operating loss carryforwards | 1,372 | | | 1,680 | |
| Income tax credit carryforwards | | 2,671 |
| | 2,671 |
| Income tax credit carryforwards | 2,510 | | | 2,671 | |
| Inventory reserves | | 3,535 |
| | 2,065 |
| Inventory reserves | 2,229 | | | 2,320 | |
| Accounts receivable reserves | | 50 |
| | 123 |
| Accounts receivable reserves | 62 | | | 55 | |
| Accrued warranty reserve | | 153 |
| | 144 |
| Accrued warranty reserve | 269 | | | 193 | |
| State net operating loss carryforwards | | 6,174 |
| | 4,624 |
| State net operating loss carryforwards | 6,356 | | | 5,970 | |
| Stock compensation | | 704 |
| | 728 |
| Stock compensation | 979 | | | 806 | |
| Deferred compensation | | 404 |
| | 200 |
| Deferred compensation | 476 | | | 443 | |
| Fixed assets and intangibles | | (2,693 | ) | | (33 | ) | Fixed assets and intangibles | (497) | | | (348) | |
| ROU lease liability | | ROU lease liability | 3,289 | | | 3,529 | |
| ROU lease assets | | ROU lease assets | (3,195) | | | (3,467) | |
| Other | | 2,255 |
| | 838 |
| Other | 1,372 | | | 1,322 | |
| Total deferred tax assets | | 113,822 |
| | 104,300 |
| Total deferred tax assets | 111,511 | | | 115,537 | |
| Valuation allowance | | (113,891 | ) | | (104,300 | ) | Valuation allowance | (111,511) | | | (115,537) | |
| Net deferred tax liabilities | | $ | (69 | ) | | $ | — |
| Net deferred tax liabilities | $ | — | | | $ | — | |
For the fiscal years ended September 30, 2019, 20182021, 2020 and 2017,2019, the Company recorded income tax (expense) benefitexpense of approximately $0.6 million, $0.1 million $(0.4) million and $0.2$0.1 million, respectively. Income tax expense for the fiscal yearsyear ended September 30, 2021 is comprised primarily of California state income tax due to temporary suspension of net operating loss credits and other state minimum tax expense, partially offset by the release of a reserve on uncertain tax benefits due to statutory limitation expiration. Income tax expense for the fiscal year ended September 30, 2020 is comprised primarily of state minimum tax expense partially offset by the reversal of a deferred tax liability related to the Concord Real Property. Income tax expense for the fiscal year ended September 30, 2019 is primarily comprised of state minimum tax expense. Income tax benefit for the fiscal year ended September 30, 2018 is primarily comprised of the effect of the December 22, 2017 “Tax Act” which eliminated AMT and resulted in a refund to the Company of amounts paid in prior fiscal years, state minimum taxes, and foreign tax expense. for the fiscal year ended September 30, 2017, income tax expense is primarily comprised of estimated alternative minimum tax.
For the fiscal years ended September 30, 2019, 20182021, 2020 and 2017,2019, the effective tax rate on operations was 2.2%, 0.9% and 0.2%, (2.5)%respectively. The higher tax rate for the fiscal year ended September 30, 2021 is primarily due to the higher California state income tax due to temporary suspension of net operating loss credits. The lower tax rate for the fiscal year ended September 30, 2020 was primarily due to the operating loss and 1.9%, respectively.state minimum tax expense. The lower tax rate for the fiscal year ended September 30, 2019 is primarily due to the operating loss and state minimum tax expense. The higher beneficial tax rate for the fiscal year ended September 30, 2018 was primarily due to the effect of the Tax Cuts and Jobs Act of 2017, which resulted in a credit to the Company on future tax payments for past AMT amounts paid and the current period operating loss. The higher tax rate for fiscal year 2017 was primarily due to higher alternative minimum tax as a result of the increase in net income. Income tax expense is comprised of estimated alternative minimum tax and foreign tax expense. The Company uses some estimates to forecast permanent differences between book and tax accounting.
We have not provided for income taxes on non-U.S. subsidiaries'subsidiaries’ undistributed earnings as of September 30, 20192021 because we plan to indefinitely reinvest the unremitted earnings of ourthe non-U.S. subsidiaries and all of ourthe non-U.S. subsidiaries historically have negative earnings and profits.
All deferred tax assets have a full valuation allowance at September 30, 2019. However, on2021. On a quarterly basis, the Company will evaluateevaluates the positive and negative evidence to assess whether the more likely than not criteria, has been satisfied in determining whether there will be further adjustments to the valuation allowance.
During the fiscal years ended September 30, 2019 and 2018,2021, the Company released the ASC 740-10 reserve on uncertain tax benefits due to statutory limitation expiration. During the fiscal year ended September 30, 2020, there were no material increases or decreases in unrecognized tax benefits.
As of September 30, 2019,2021, the Company had net operating loss carryforwards for U.S. federal income tax purposes of approximately $472.8$458.5 million which begin to expire in 2022. As of September 30, 2019,2021, the Company had foreign net operating loss carryforwards of $5.1$5.5 million which begin to expire in 2021,2022 as well as state net operating loss carryforwards of approximately $71.2$72.8 million which begin to expire in 2021.2022. As of September 30, 2019,2021, the Company also had tax credits (primarily foreign income and U.S. research and development tax credits) of approximately $2.7$2.5 million. The research credits will begin to expire in 2020.2022. Utilization of net operating loss and tax credit carryforwards are subject to a substantial annual limitation due to the ownership change limitations set forth in Internal Revenue Code Section 382 of the Code and similar state provisions. The Company prepared an Internal Revenue Code 382 analysis to determine the annual limitations on the Company'sCompany’s consolidated net operating loss carryforwards. As a result of the $472.8$458.5 million of U.S. net operating loss carryforwards, approximately $230.5
$230.2 million is subject to an annual limitation and $242.3$228.3 million of the net operating losses are not subject to an annual limitation. Such annual limitations could result in the expiration of the net operating loss and tax credit carryforwards before utilization.
A reconciliation of the beginning and ending amount of unrecognized gross tax benefits is as follows:
|
| | | | |
Unrecognized Gross Tax Benefit
(in thousands) | | Amount |
Balance as of September 30, 20172019 | $ | $419 | 419 |
|
| Adjustments based on tax positions related to the current year | — | — |
|
| Adjustments based on tax positions of prior years | — | — |
|
Balance as of September 30, 20182020 | 419 | 419 |
|
| Adjustments based on tax positions related to the current year | — | — |
|
| Adjustments based on tax positions of prior years | (419) | — |
|
Balance as of September 30, 20192021 | $ | $— | 419 |
|
As of September 30, 20192021 and September 30, 2018,2020, we had approximately $0.5$0 million and $0.4$0.6 million, respectively, of interest and penalties accrued as tax liabilities on ourthe balance sheet. We believe that itAs we released the entire unrecognized tax benefits, as well as the associated interest and penalties as of September 30, 2021, there is reasonably possible that none of theno uncertain tax positions that will be paid or settled within the next 12 months.months . Interest that is accrued on tax liabilities is recorded within interest expense on the condensed consolidated statements of operations.
| |
NOTE 13. | NOTE 11. Commitments and Contingencies |
Leases: Estimated future minimum lease payments under non-cancelable operating leases with an initial or remaining term of one year or more are $1.0 million, $0.8 million, $0.8 million, $0.9 million, $0.7 million and $1.4 million for the fiscal years ended September 30, 2020, 2021, 2022, 2023, 2024, and 2025 and beyond, respectively.
Leases
Operating Lease Obligations:
We lease certain facilities and equipment under non-cancelable operating leases. Operating lease amounts exclude property taxes, insurance, and maintenance expenses on leased properties. Our facilityAs of September 30, 2021, our operating leases typically provide for rental adjustments for increases in base rent (uphad remaining lease terms of 0.6 years to specific limits), property taxes, insurance, and general property maintenance that would be recorded as rent expense. Option periods have been13.4 years, some of which included in the computation of rent expense where such options are likely to be exercised due to significant economic incentive. Rent expense was approximately $1.3 million, $1.2 million and $1.4 million forextend 5 additional years. During the fiscal years ended September 30, 2019, 20182021 and 2017,2020, the Company recorded $2.2 million and $1.8 million of operating lease expense, respectively. ThereThe Company's finance leases and short term leases are no off-balance sheet arrangements other than ourimmaterial.
Maturities of operating leases.lease liabilities as of September 30, 2021 were as follows:
| | | | | |
| (in thousands) | Amount |
| 2022 | $ | 1,955 | |
| 2023 | 1,856 | |
| 2024 | 1,686 | |
| 2025 | 1,730 | |
| 2026 | 1,775 | |
| Thereafter | 10,592 | |
| Total lease payments | $ | 19,594 | |
| Less imputed interest | (5,712) | |
| Total | $ | 13,882 | |
Weighted-average remaining lease term and discount rate related to operating leases are as follows:
| | | | | | | | | | | |
| As of September 30, |
| 2021 | | 2020 |
| Weighted average remaining lease term (years) | 11.9 | | 14.4 |
| Weighted average discount rate | 6.1 | % | | 6.1 | % |
Supplemental cash information and non-cash activities related to operating leases are as follows:
| | | | | | | | | | | |
| As of September 30, |
| (in thousands) | 2021 | | 2020 |
| Operating cash outflows from operating leases | $ | 1,975 | | | $ | 1,592 | |
| Right-of-use assets obtained in exchange for operating lease liabilities | $ | 10,358 | | | $ | 10,791 | |
Asset Retirement Obligation: We have known conditional AROs such as certain asset decommissioning andObligations
The Company’s ARO consists of legal requirements to decommission assets, restoration of rentedthe existing leased facilities to their original state, and certain environmental work to be performed indue to the future. Ourpresence of a manufacturing fabrication operation. ARO includes assumptions related to renewal option periods for those facilities where we expect to extend lease terms. The Company recognizes its estimate of the fair value of its ARO in the period incurred in long-term liabilities. The fair value of the ARO is also capitalized as property, plant and equipment.
In future periods,connection with the Company's lease agreements, we have recorded an ARO is accreted for the change in its present valueliability of $2.0 million and capitalized costs are depreciated over the useful life of the related assets. If the fair value of the estimated ARO changes, an adjustment will be recorded to both the ARO$2.0 million at September 30, 2021 and the asset retirement capitalized cost. Revisions in estimated liabilities can result from revisions of estimated inflation rates, changes in estimated retirement costs, and changes in the estimated timing of settling the ARO.September 30, 2020, respectively. The fair value of our ARO was estimated by discounting projected cash flows over the estimated life of the related assets using credit adjusted risk-free rates which ranged from 1.20%0.06% to 4.20%1.73%.
During the fiscal year ended September 30, 2019, in connection with the Company extending the lease term of the Alhambra facility, the lease and related obligations, including ARO, were revised, resulting in an increase of the estimated ARO obligation by the Company. As a result of the lease extension, the Company increased its ARO associated with the Alhambra facility by $0.1 million.
During the fiscal year ended September 30, 2018, in connection with the Company extending the lease term of the Alhambra facility, the lease and related obligations, including ARO, were revised, resulting in an increase of the estimated ARO obligation by the Company. As a result of the lease extension, the Company increased its ARO associated with the Alhambra facility by $0.1 million.
During the fiscal year ended September 30, 2017, in connection with the Company moving to a new manufacturing facility in China, the lease and related obligations, including ARO, at the former China facility was terminated, resulting in no payment by the Company. As a result of this agreement, the Company reduced its ARO associated with the former China facility by $45,000.
Accretion expense of $0.1 million$47.6 thousand, $31.9 thousand and $54.2 thousand was recorded during the fiscal years ended September 30, 2021, 2020 and 2019, 2018 and 2017.respectively.
EMCORE leases its primary facility in Alhambra, California covering six buildings where manufacturing, research and development, and general and administrative work is performed. In March 2019, amendments to leases for five of the six buildings were signed, extending the terms of the leases for these buildings for an additional three years through September 2023, plus a three year EMCORE option to extend the leases through September 2026. Management has determined that there is a significant economic incentive to exercise the options and the lease period will include the option periods for accounting purposes. In connection with the lease agreement, the Company has recorded an ARO liability of $1.9 million and $1.8 million at September 30, 2019 and September 30, 2018, respectively. The lease related to the sixth building expired in 2011, and this building is being occupied on a month-to-month basis.
The Company’s ARO consists of legal requirements to return the existing leased facilities to their original state and certain environmental work to be performed due to the presence of a manufacturing fabrication operation and significant changes to the facilities over the past thirty years.
In May 2016 (and retroactively effective on February 1, 2016), the Company entered into a five year lease agreement for facilities in Beijing, China where certain manufacturing and administrative work is currently being performed. In connection with the lease agreement, the Company has recorded an ARO liability in the amount of $0.1 million at September 30, 2019 and September 30, 2018.
In February 2019, the lease and related obligations, including ARO, at our former facility in Ivyland, Pennsylvania was terminated, resulting in no payment by the Company. As a result of this termination, the Company reduced its ARO associated with the former Pennsylvania facility by $40,000 and recorded a gain on the termination in the three and nine months ended September 30, 2019.
The following table summarizes ARO activity:
| | | | | |
| (in thousands) | Amount |
| Balance at September 30, 2020 | $ | 2,022 | |
| Accretion expense | 48 | |
| Revision in estimated cash flows | (21) | |
| Balance at September 30, 2021 | $ | 2,049 | |
|
| | | |
| Asset Retirement Obligations | September 30, |
| (in thousands) | 2019 |
| Balance at September 30, 2018 | $ | 1,809 |
|
Accretion expense
| 55 |
|
Revision in estimated cash flows
| 26 |
|
| Balance at September 30, 2019 | $ | 1,890 |
|
Indemnifications: We have agreed to indemnify certain customers against claims of infringement of intellectual property rights of others in our sales contracts with these customers. Historically, we have not paid any claims under these customer indemnification obligations. We enter into indemnification agreements with each of our directorsdirector and executive officersofficer pursuant to which we agree to indemnify them for certain potential expenses and liabilities arising from their status as a director or executive officer of the Company. We maintain director and officer insurance, which may cover certain liabilities arising from ourthe obligation to indemnify our directors and executive officers in certain circumstances. It is not possible to determine the aggregate maximum potential loss under these indemnification agreements due to the limited history of prior indemnification claims and the unique facts and
circumstances involved in each particular claim.
Legal Proceedings:
We are subject to various legal proceedings, claims, and litigation, either asserted or unasserted, that arise in the ordinary course of business. Except as described below, the outcome of these matters is currently not determinable and we are unable to estimate a range of loss, should a loss occur, from these proceedings. The ultimate outcome of legal proceedings involves judgments, estimates and inherent uncertainties and the results of these matters cannot be predicted with certainty. Professional legal fees are expensed when incurred. We accrue for contingent losses when such losses are probable and reasonably estimable. In the event that estimates or assumptions prove to differ from actual results, adjustments are made in subsequent periods to reflect more current information. Should we fail to prevail in any legal matter or should several legal matters be resolved against the Company in the same reporting period, then the financial results of that particular reporting period could be materially affected.
a) Intellectual Property Lawsuits
We protect our proprietary technology by applying for patents where appropriate and, in other cases, by preserving the technology, related know-how and information as trade secrets. The success and competitive position of our product lines are impacted by ourthe ability to obtain intellectual property protection for our research and development efforts. We have, from time to time, exchanged correspondence with third parties regarding the assertion of patent or other intellectual property rights in connection with certain of our products and processes.
b) Phoenix Navigation Components, LLC Legal Proceedings
On June 12, 2018, Phoenix commenced an arbitration against EMCORE with the American Arbitration Association (“AAA”)AAA in New York. On August 31, 2018, Phoenix filed a First Amended Demand for Arbitration, asserting the following claims: breach of contract, breach of the covenant of good faith and fair dealing, misappropriation of trade secrets (under the Defend Trade Secrets Act, 18 U.S.C. § 1836, and New York law), conversion, unjust enrichment, correction of inventorship relating to U.S. Patent No. 8,773,665, and
declaratory relief, relating to EMCORE’s termination of certain agreements entered into between EMCORE and Phoenix related to the purported license of certain intellectual property related to fiber optic gyroscopeFOG technology and disputed royalty payments related thereto. On September 14, 2018, EMCORE filed an Answering Statement and Counterclaim, denying all of Phoenix’s claims and asserting counterclaims for breach of the implied covenant of good faith and fair dealing and declaratory relief.
On June 21, 2019, an interim award (the “Interim Award”) was issued in connection with all claims in the AAA proceeding other than the claims related to correction of inventorship and declaratory relief relating to U.S. Patent No. 8,773,665 (the “Patent Claims”). While Phoenix ultimately sought $21.2 million in total damages, plus attorneys’ fees and costs, in the Interim Award, the arbitrator found in the Interim Award that (i) Phoenix's(a) Phoenix’s claim for breach of the covenant of good faith and fair dealing was denied; (ii) Phoenix's(b) Phoenix’s claim for breach of the agreements entered with EMCORE for failure to provide funding for non-recurring engineering was denied; (iii) Phoenix's(c) Phoenix’s claim for unjust enrichment was denied; (iv) Phoenix's(d) Phoenix’s claim for conversion was granted, but damages for that claim duplicate the damages on the breach of contract and misappropriation of trade secret claims described below and no incremental damages were awarded based on the granting of this claim; (v) EMCORE'sand (e) EMCORE’s request for a declaration that, as between EMCORE and Phoenix, EMCORE owns its proprietary IOC and transceiver was granted.
The arbitrator also found in the Interim Award that (i)(a) EMCORE breached certain license agreements entered into with Phoenix by failing to make royalty payments due and failing to provide required accountings, (ii)accounting, (b) Phoenix and its members are no longer subject to prior exclusivity restrictions; (iii) EMCORE's(c) EMCORE’s claim for breach of the covenant of good faith and fair dealing was denied; and (iv)(d) the proceedings for the Patent Claims and EMCORE'sEMCORE’s counterclaim with respect thereto would be established by a future proceeding.
Further, out of the original 97 trade secret subpart claims by Phoenix, the arbitrator found in the Interim Award that EMCORE had misappropriated a total of five5 trade secret subparts (the “Deemed Trade Secrets”), and found that at least one1 Deemed Trade Secret was being used in seven7 EMCORE products (the “EMCORE Products”). The arbitrator found that as a result of the foregoing, royalties of 7.5% of the sale price are owed, to the extent not previously paid, on (i)(a) sales through July 16, 2018 on all fiber optic gyroscopesFOGs sold by EMCORE, and (ii)(b) sales from July 16, 2018 through May 31, 2019 of the EMCORE Products whether standalone or incorporated into a larger product, in each case together with interest at the New York statutory rate of 9% simple interest. In addition, the arbitrator found in the Interim Award that Phoenix was the prevailing party, and Phoenix was awarded attorneys'attorneys’ fees and costs in the amount of approximately $3.7 million, which amount was reduced 10% from Phoenix’s attorneys’ fees request.
In the Interim Award, the arbitrator further determined that EMCORE shall pay Phoenix a royalty of 7.5% of the sale price on (i)(a) future customer payments for certain EMCORE product contracts previously entered into and (ii)(b) customer payments for future sales of any product using any Deemed Trade Secret, in each case payable in a single lump sum within one month of completion of the calendar quarter in which payment has been received from the customer, and shall concurrently submit to Phoenix a written report that sets forth the calculation of the amount of the royalty payment in a form similar to previous royalty reports, provided that following the first $1 million of royalty payments on the EMP-1 product only, inclusive of payments made to date, EMCORE will pay to Phoenix a royalty of 2.25% of the sale price (net of any warranty work, returns, rebates, discounts or credits). EMCORE is required to continue to make royalty payments in this manner until such time as it has in good faith determined, and can so document, that it has completely ceased use of the Deemed Trade Secrets, and at such time, EMCORE shall provide Phoenix written notice of same by certified letter, return receipt requested.same.
On October 1, 2019, the arbitrator issued a Modified Partial Final Award, which incorporated by reference the terms of the Interim Award and ordered and awarded, among other items, (i)(a) an award to Phoenix of attorneys’ fees and costs in the amount of approximately $3.8 million, (ii)(b) an award to Phoenix of $1.0 million in damages owing for unpaid royalties through June 30, 2019, of which $0.6 million remained to be paid as of the issuance of the Modified Partial Final Award; (iii)Award, (c) an award to Phoenix of $0.1 million in pre-judgment interest, calculated at the New York statutory rate of 9% simple interest, and (iv)(d) an order that EMCORE make the payments in the foregoing items (i)(a), (ii)(b) and (iii)(c) on or before October 14, 2019. On October 10, 2019, EMCORE made the foregoing payments to Phoenix in an aggregate amount equal to approximately $4.5 million. This amount was accrued as of September 30, 2019.2019 and paid during the fiscal year ended September 30, 2020.
The Patent Claims were not determined in the Interim Award or the Modified Partial Final Award and remain pending. We believe that the Patent Claims are without merit and we intend to vigorously defend ourselves against them.
During the fiscal year ended September 30, 2019, we recorded the award and settlement to Phoenix of attorneys’ fees and costs in the amount of approximately $3.8 million, and our legal expenses of approximately $5.7 million within selling, general and administrative expense on the consolidated statement of operations and comprehensive (loss) income.
The Patent Claims were not determined in the Interim Award or the Modified Partial Final Award. In December 2019, EMCORE and Phoenix entered into a settlement agreement with respect to the Patent Claims pursuant to which EMCORE (a)
granted Phoenix a fully paid, perpetual nonexclusive license to the disputed patent and (b) agreed to pay Phoenix a total of $0.4 million, of which $0.2 million was paid in January 2020, $0.1 million was paid in April 2020 and $0.1 million was paid in July 2020.
During the fiscal year ended September 30, 2020, the Company recorded the settlement of the Patent Claims in the amount of approximately $0.4 million within selling, general and administrative expense on the consolidated statement of operations and comprehensive loss.
On June 21, 2018, Phoenix Navigation Components, LLC commenced a special proceeding against EMCORE in the New York Supreme Court, Commercial Division, Index No. 653128/2018.Division. As part of the special proceeding, Phoenix filed an application for a preliminary injunction in aid of arbitration pursuant to CLPR 7502(c), in connection with the AAA arbitration proceeding in New York. On August 6, 2018, Phoenix’sThe application was resolved pursuant toresulted in a stipulationso-ordered stipulated injunction between EMCORE and Phoenix. ThisPhoenix, which was entered in August 2018. In January 2020, the court granted a motion to confirm the Modified Partial Final Award, vacated the so-ordered stipulated injunction entered in August 2018, and disposed of the special proceeding remains open pending entryproceeding.
Resilience Litigation
In February 2021, Resilience Capital (“Resilience”) filed a complaint against us with the Delaware Chancery Court containing claims arising from the February 2020 sale of SDI’s real property (the “Concord Property Sale”) located in Concord, California (the “Concord Real Property”) to Eagle Rock and that certain Single-Tenant Triple Net Lease, dated as of February 10, 2020, entered into by and between SDI and Eagle Rock, pursuant to which SDI leased from Eagle Rock the Concord Real Property for a 15 year term. The Resilience complaint seeks, among other items, (a) a declaration that the Concord Property Sale included a non-cash component; (b) a decree requiring us and Resilience to follow the appraisal requirements set forth in that certain Purchase and Sale Agreement (the "SDI Purchase Agreement"), dated as of June 7, 2019, by and among the Company, The Resilience Fund IV, L.P., The Resilience Fund IV-A, L.P., Aerospace Newco Holdings, Inc. and Ember Acquisition Sub, Inc.; (c) recovery of Resilience’s costs and expenses; and (d) pre- and post-judgment interest.
In April 2021, we filed with the Delaware Chancery Court our answer to the Resilience complaint and counterclaims against Resilience, in which we are seeking, among other items, (a) dismissal of the Resilience complaint and/or granting of judgment pursuantin favor of EMCORE with respect to the AAA arbitration.Resilience complaint, (b) entering final judgment against Resilience awarding damages to us for Resilience’s fraud and breaches of the SDI Purchase Agreement in an amount to be proven at trial and not less than $1,565,000, (c) a judicial determination of the respective rights and duties of us and Resilience under the SDI Purchase Agreement, (d) an award to us of costs and expenses and (e) pre- and post-judgment interest. We believe that the claims made by Resilience in its complaint are without merit and we intend to vigorously defend ourselves against them.
NOTE 12. Equity
Equity Plans
We provide long-term incentives to eligible officers, directors, and employees in the form of equity-based awards. We maintain four3 equity incentive compensation plans, collectively described below as our “Equity Plans”:
the 2000 Stock Option Plan,
including the 2010 Equity Incentive Plan (“("2010 Plan”Plan"),
the 2012 Equity Incentive Plan (“("2012 Plan”Plan"), and
the 2019 Equity Incentive Plan (“("2019 Plan”Plan").
We issue new shares of common stock to satisfy awards issued under our Equity Plans. In March 2021, our shareholders approved the Amended and Restated EMCORE Corporation 2019 Equity Incentive Plan, which was adopted by the Company’s Board of Directors in December 2020 and increased the maximum number of shares of the Company’s common stock that may be issued or transferred pursuant to awards under the 2019 Equity Incentive Plan by an additional 2,138,000 shares.
Stock Options
Most of our stock options vest and become exercisable over a four to five year period years and have a contractual life of 10 years. Certain stock options awarded are intended to qualify as incentive stock options pursuant to Section 422A of the Internal Revenue Code.
The following table summarizes stock option activity under the Equity Plans for the fiscal year ended September 30, 2019:
2021:
| | | | | | | | | | | Number of
Shares | | Weighted
Average
Exercise
Price | | Weighted
Average
Remaining
Contractual Life
(in years) | | Aggregate
Intrinsic
Value (*)
(in thousands) |
| Number of Shares | | Weighted Average Exercise Price | | Weighted Average Remaining Contractual Life (in years) | | Aggregate Intrinsic Value (*) (in thousands) | |
| Outstanding as of September 30, 2018 | 69,980 |
| | $4.74 | | | |
| Outstanding as of September 30, 2020 | | Outstanding as of September 30, 2020 | 44,065 | | | $ | 5.14 | | | | | |
| Granted | — |
| | — |
| | | Granted | — | | | — | | |
| Exercised | (208 | ) | | $3.97 | | — |
| Exercised | (15,025) | | | 5.13 | | |
| Forfeited | (2,199 | ) | | $4.16 | | | Forfeited | — | | | — | | |
| Expired | (15,719 | ) | | $3.97 | | | Expired | (9,171) | | | 6.35 | | |
| Outstanding as of September 30, 2019 | 51,854 |
| | $5.00 | | 4.79 | | $ | 0 |
| |
| Exercisable as of September 30, 2019 | 41,200 |
| | $5.07 | | 4.43 | | $ | 0 |
| |
| Vested and expected to vest as of September 30, 2019 | 51,854 |
| | $5.00 | | 4.79 | | $ | 0 |
| |
| Outstanding as of September 30, 2021 | | Outstanding as of September 30, 2021 | 19,869 | | | $ | 4.59 | | | 3.75 | | $ | 57 | |
| Exercisable as of September 30, 2021 | | Exercisable as of September 30, 2021 | 19,869 | | | $ | 4.59 | | | 3.75 | | $ | 57 | |
| Vested and expected to vest as of September 30, 2021 | | Vested and expected to vest as of September 30, 2021 | 19,869 | | | $ | 4.59 | | | 3.75 | | $ | 57 | |
(*) Intrinsic value for stock options represents the “in-the-money” portion or the positive variance between a stock option'soption’s exercise price and the underlying stock price. For the fiscal year ended September 30, 2018,2020, the intrinsic value of options exercised was $23,000.$0.
As of September 30, 2019,2021, there was approximately $20,000 ofno unrecognized stock-based compensation expense related to non-vested stock options granted under the Equity Plans which is expected to be recognized over an estimated weighted average life of 1.1 years.Plans.
Valuation Assumptions
There were no stock option grants for the fiscal years ended September 30, 20192021 and 2018.2020.
Time-Based Restricted Stock
Time-based restricted stock units (“RSUs”RSU”) and restricted stock awards (“RSAs”RSA”) granted to employees under the 2010 Plan, 2012 Plan or 2019 Plan typically vest over 3 to 4 years and are subject to forfeiture if employment terminates prior to the vesting or lapse of the restrictions, as applicable. RSUs are not considered issued or outstanding common stock until they vest. RSAs are considered issued and outstanding on the grant date and are subject to forfeiture if specified vesting conditions are not satisfied.
The following table summarizes the activity related to RSUs and RSAs subject to time-based vesting requirements for the fiscal year ended September 30, 2019:2021:
| | | | | | | | | | | | | | | | | | | | | | | |
| RSUs | | RSAs |
| Number of Shares | | Weighted
Average Grant
Date Fair Value | | Number of
Shares | | Weighted
Average Grant
Date Fair Value |
| Non-vested as of September 30, 2020 | 1,548,045 | | | $ | 3.41 | | | 8,154 | | | $ | 8.20 | |
| Granted | 1,045,673 | | | 5.55 | | | — | | | — | |
| Vested | (598,986) | | | 3.43 | | | (8,154) | | | 8.20 | |
| Forfeited | (189,878) | | | 3.70 | | | — | | | — | |
| Non-vested as of September 30, 2021 | 1,804,854 | | | $ | 4.61 | | | — | | | $ | — | |
|
| | | | | | | | | | |
| Restricted Stock Activity | | Restricted Stock Units | | Restricted Stock Awards |
| | Number of Shares | | Weighted Average Grant Date Fair Value | | Number of Shares | | Weighted Average Grant Date Fair Value |
| Non-vested as of September 30, 2018 | | 1,011,621 |
| | $6.04 | | 8,154 |
| | $8.20 |
| Granted | | 752,416 |
| | $3.68 | | — |
| | $0.00 |
| Vested | | (321,335 | ) | | $5.94 | | — |
| | $0.00 |
| Forfeited | | (443,455 | ) | | $5.22 | | — |
| | $0.00 |
| Non-vested as of September 30, 2019 | | 999,247 |
| | $4.66 | | 8,154 |
| | $8.20 |
As of September 30, 2019,2021, there was approximately $3.7$6.7 million of remaining unamortized stock-based compensation expense associated with RSUs, which will be expensed over a weighted average remaining service period of approximately 2.92.7 years. The 1.01.8 million outstanding non-vested and expected to vest RSUs have an aggregate intrinsic value of approximately $3.1$13.5 million and a weighted average remaining contractual term of 2.92.7 years. For the fiscal years ended September 30, 2019, 2018,2021, 2020, and 2017,2019, the intrinsic value of RSUs vested was approximately $1.4$3.6 million, $2.3$1.3 million and $3.4$1.4 million, respectively. For the fiscal yearyears ended September 30, 20182020 and 2017,2019, the weighted average grant date fair value of RSUs granted was $5.80$3.41 and $8.20$3.68 per share.share, respectively.
For the fiscal year ended September 30, 2021, $27.3 thousand of RSAs vested. As of September 30, 2019,2021, there was approximately $23,000 ofno remaining unamortized stock-based compensation expense associated with RSAs, which will be expensed over a weighted average remaining service periodRSAs.
Performance Stock
Performance based restricted stock units (“PSUs”PSU”) and performance based shares of restricted stock (“PRSAs”PRSA”) granted to employees under the 2012 Plan or 2019 Plan typically vest over 1 to 3 years and are subject to forfeiture in whole, if employment terminates, or in whole or in part, if specified vesting conditions are not satisfied, in each case prior to vesting. PSUs are not considered issued or outstanding common stock until they vest. PRSAs are considered issued and outstanding on the grant date (at 200% of the target number of shares) and are subject to forfeiture if specified vesting conditions are not satisfied. PSUs and PRSAs that are granted to our executive officers and key employees are provided as long-term incentive compensation that is based on relative total shareholder return, which measures our performance against the Russell Microcap Index.
The following table summarizes the activity related to PSUs and PRSAs for the fiscal year ended September 30, 2019:2021:
| | | | | | | | | | | |
| PSUs |
Number of Shares
(at Target) | | Weighted Average Grant Date Fair Value |
| Non-vested as of September 30, 2020 | 868,500 | | | $ | 4.79 | |
| Granted | 231,000 | | | 7.39 | |
| Vested | (6,086) | | | 7.91 | |
| Forfeited | (126,414) | | | 7.70 | |
| Non-vested as of September 30, 2021 | 967,000 | | | $ | 5.01 | |
|
| | | | | | | | | | |
| Performance Stock Activity | | Performance Stock Units | | Performance Stock Awards |
| | Number of Shares (at Target) | | Weighted Average Grant Date Fair Value | | Number of Shares (at Target) | | Weighted Average Grant Date Fair Value |
| Non-vested as of September 30, 2018 | | 397,777 |
| | $8.48 | | 33,333 |
| | $12.25 |
| Granted | | 280,000 |
| | $5.19 | | — |
| | $0.00 |
| Vested | | (30,874 | ) | | $7.14 | | — |
| | $0.00 |
| Forfeited | | (175,079 | ) | | $7.36 | | — |
| | $0.00 |
| Non-vested as of September 30, 2019 | | 471,824 |
| | $7.03 | | 33,333 |
| | $12.25 |
As of September 30, 2019,2021, there was approximately $1.7$2.4 million of remaining unamortized stock-based compensation expense associated with PSUs, which will be expensed over a weighted average remaining service period of approximately 1.91.3 years. The 0.51.0 million outstanding non-vested and expected to vest PSUs have an aggregate intrinsic value of approximately $1.4$7.2 million and a weighted average remaining contractual term of 1.81.3 years. For the fiscal years ended September 30, 20192021, 2020 and 2018,2019, the intrinsic value of PSUs vested was approximately$34.4 thousand, $0.0 million and $0.2 million, and $1.4 million, respectively. There were no PSUs vested inFor the fiscal yearyears ended September 30, 2017. For the fiscal year ended September 30, 2018,2020 and 2019, the weighted average grant date fair value of PSUs granted was $7.62.$3.81 and $5.19 per share, respectively.
As of September 30, 2019,2020, there was approximately $9,000 ofno remaining unamortized stock-based compensation expense associated with PRSAs, which will be expensed over a weighted average remaining service period of approximately 0.05 years.PRSAs.
Stock-based compensationCompensation
The effect of recordingfollowing table set forth stock-based compensation expense was as follows:by award type:
| | | | | | | | | | | | | | | | | |
| For the Fiscal Year Ended September 30, |
| (in thousands) | 2021 | | 2020 | | 2019 |
| Employee stock options | $ | 2 | | | $ | 13 | | | $ | 25 | |
| RSUs and RSAs | 2,093 | | | 1,755 | | | 1,495 | |
| PSUs and PRSAs | 1,396 | | | 1,243 | | | 685 | |
| ESPP | 307 | | | 214 | | | 180 | |
| Outside director equity awards and fees in common stock | 382 | | | 291 | | | 221 | |
| Total stock-based compensation expense | $ | 4,180 | | | $ | 3,516 | | | $ | 2,606 | |
|
| | | | | | | | | | | |
| Stock-based Compensation Expense - by award type | For the Fiscal Years ended September 30, |
| (in thousands) | 2019 | | 2018 | | 2017 |
| Employee stock options | $ | 25 |
| | $ | 32 |
| | $ | 45 |
|
| Restricted stock units and awards | 1,495 |
| | 1,742 |
| | 1,643 |
|
| Performance stock units and awards | 685 |
| | 1,343 |
| | 1,367 |
|
| Employee stock purchase plan | 180 |
| | 276 |
| | 300 |
|
| Outside director equity awards and fees in common stock | 221 |
| | 255 |
| | 247 |
|
| Total stock-based compensation expense | $ | 2,606 |
| | $ | 3,648 |
| | $ | 3,602 |
|
| | | | | | | | | | | | | | | | | |
| For the Fiscal Year Ended September 30, |
| (in thousands) | 2021 | | 2020 | | 2019 |
| Cost of revenue | $ | 767 | | | $ | 692 | | | $ | 482 | |
| Selling, general, and administrative | 2,590 | | | 2,155 | | | 1,478 | |
| Research and development | 823 | | | 669 | | | 646 | |
| Total stock-based compensation expense | $ | 4,180 | | | $ | 3,516 | | | $ | 2,606 | |
|
| | | | | | | | | | | |
| Stock-based Compensation Expense - by expense type | For the Fiscal Years ended September 30, |
| (in thousands) | 2019 | | 2018 | | 2017 |
| Cost of revenue | $ | 482 |
| | $ | 450 |
| | $ | 492 |
|
| Selling, general, and administrative | 1,478 |
| | 2,584 |
| | 2,605 |
|
| Research and development | 646 |
| | 614 |
| | 505 |
|
| Total stock-based compensation expense | $ | 2,606 |
| | $ | 3,648 |
| | $ | 3,602 |
|
Stock-based compensation within selling, general and administrativeSG&A expense was lower for the fiscal year ended September 30, 2019 due to the reversal of previously recognized expense associated with the forfeiture of unvested RSUs and PSUs of ourthe former CFO Jikun Kim.CFO.
Capital Stock
Authorized capital stock consists of 50 million shares of common stock, no par value, and 5,882,352 shares of preferred stock, $0.0001 par value.
On February 16, 2021, the Company closed our offering of 6,655,093 shares of our common stock, which included the full exercise of the underwriters’ option to purchase 868,056 additional shares of common stock, at a price to the public of $5.40 per share, resulting in net proceeds to us from the offering, after deducting the underwriting discounts and commissions and other offering expenses, of approximately $33.1 million. The shares were sold by us pursuant to an underwriting agreement with Cowen and Company, LLC, dated as of February 10, 2021. As of September 30, 2019,2021 and 2020, we had 35.843.9 million and 28.936.5 million shares of common stock issued and outstanding, respectively. There were no shares of preferred stock issued or outstanding as of September 30, 20192021 and 2018.2020.
401(k) Plan
We have
The Company has a savings plan that qualifies as a deferred salary arrangement under Section 401(k) of the Internal Revenue Code. Under this savings plan, participating employees may defer a portion of their pretax earnings, up to the Internal Revenue Service annual contribution limit. Since June 2015, all employer contributions are made in cash. Our matching contribution in cash for each of the fiscal years ended September 30, 2019, 20182021, 2020 and 20172019 was approximately $0.6$1.1 million, $0.5$1.0 million, and $0.5$0.6 million, respectively.
Earnings (Loss) Income Perper Share
The following table sets forth the computation of basic and diluted net lossearnings (loss) per share:
| | | | | | | | | | | | | | | | | |
| For the Fiscal Year Ended September 30, |
| (in thousands, except per share) | 2021 | | 2020 | | 2019 |
| Numerator | | | | | |
| Net income (loss) | $ | 25,643 | | | $ | (7,000) | | | $ | (35,984) | |
| Denominator | | | | | |
| Weighted average number of shares outstanding - basic | 34,020 | | | 29,136 | | | 27,983 | |
| Effect of dilutive securities | | | | | |
| Stock options | 7 | | | — | | | — | |
| PSUs, RSUs, and restricted stock | 1,762 | | | — | | | — | |
| Weighted average number of shares outstanding - diluted | 35,789 | | | 29,136 | | | 27,983 | |
| Earnings (loss) per share - basic | $ | 0.75 | | | $ | (0.24) | | | $ | (1.29) | |
| Earnings (loss) per share - diluted | $ | 0.72 | | | $ | (0.24) | | | $ | (1.29) | |
| Weighted average antidilutive options, unvested RSUs and RSAs, unvested PSUs and ESPP shares excluded from the computation | 195 | | 1,109 | | 810 |
|
| | | | | | | | | | | | |
| Basic and Diluted Net Loss Per Share | | For the Fiscal Years ended September 30, |
| (in thousands, except per share) | | 2019 | | 2018 | | 2017 |
| Numerator: | | | | | | |
| (Loss) income from continuing operations | | $ | (35,984 | ) | | $ | (17,453 | ) | | $ | 8,221 |
|
| Undistributed (loss) earnings allocated to common shareholders for basic and diluted net (loss) income per share | | (35,984 | ) | | (17,453 | ) | | 8,235 |
|
| Denominator: | | | | | | |
| Denominator for basic and fully diluted net (loss) income per share - weighted average shares outstanding | | 27,983 |
| | 27,266 |
| | 26,659 |
|
| Dilutive options outstanding, unvested stock units, unvested stock awards and ESPP | | — |
| | — |
| | 885 |
|
| Denominator for diluted net (loss) income per share - adjusted weighted average shares outstanding | | 27,983 |
| | 27,266 |
| | 27,544 |
|
| | | | | | | |
| Net (loss) income per basic and fully diluted share | | $ | (1.29 | ) | | $ | (0.64 | ) | | $ | 0.31 |
|
| | | | | | | |
| Weighted average antidilutive options, unvested restricted stock units and awards, unvested performance stock units and ESPP shares excluded from the computation | | 810 |
| | 949 |
| | 398 |
|
| | | | | | | |
| Average market price of common stock | | $ | 3.91 |
| | $ | 5.87 |
| | $ | 8.92 |
|
For dilutedBasic EPS is computed by dividing net income (loss) for the period by the weighted-average number of common stock outstanding during the period. Diluted EPS is computed by dividing net income per share,(loss) for the denominator includes allperiod by the weighted average number of common stock outstanding commonduring the period, plus the dilutive effect of outstanding RSUs and RSAs, PSUs, stock options, and shares and all potentialissuable under the Employee Stock Purchase Plan ("ESPP") as applicable pursuant to the treasury stock method. Certain of the Company's outstanding share-based awards, noted in the table above, were excluded because they were anti-dilutive, but they could become dilutive common shares to be issued.in the future. The anti-dilutivedilutive stock options and unvested stock were excluded from the computation of diluted net loss per share for the fiscal years ended September 30, 20192020 and 20182019 due to the Company incurring a net loss for the period. For
ESPP
Until September 2021, we maintained the fiscal year ended September 30, 2017, we excluded 0.4 million of weighted average outstanding stock options, RSUs and PSUs from the calculation of diluted net income per share because their effect would have been anti-dilutive.
Employee Stock Purchase Plan
We maintain an Employee Stock Purchase Plan (“ESPP”) that providesESPP, which provided employees an opportunity to purchase common stock through payroll deductions. The ESPP iswas a 6-month duration plan with new participation periods beginning on approximately February 25 and August 26 of each year. Theyear, with the purchase price is set at 85% of the average high and low market price of our common stock on either the first or last trading day of the participation period, whichever iswas lower, and annual contributions arewere limited to the lower of 10% of an employee'semployee’s compensation or $25,000.
Per$25.0 thousand. In September 2021, the amended ESPP and after giving effect toCompensation Committee of our Board Directors approved the special dividend paid in July 2016, the total numbertermination of shares of common stock on which options may be granted under the ESPP, were 3,515,574 shares. We issueeffective immediately.
Prior to termination of the ESPP, we issued new shares of common stock to satisfy the issuance of shares under this stock-based compensation plan. Common stock issued under the ESPP during the fiscal years ended September 30, 2021, 2020 and 2019 2018totaled approximately 192.0 thousand, 231.0 thousand and 2017 totaled 197,000, 171,000 and 133,000197.0 thousand shares, respectively. As of September 30, 2019,2021, the total amount of common stock issued under the ESPP totaled 2,971,8433,395,090 shares and the total shares remaining available for issuance under the ESPP totaled 543,731.0.
Future Issuances
As of September 30, 2019,2021, we had common stock reserved for the following future issuances:
|
| | | | |
Future Issuances | Number of Common
Stock Shares Available for
Future Issuances |
| Exercise of outstanding stock options | 51,85419,869 |
|
| Unvested RSUs and RSAs | 1,804,854 | |
Unvested restricted stock unitsPSUs and awards | 1,007,401 |
|
Unvested performance stock units and awardsPRSAs (at 200% maximum payout) | 1,010,3141,934,000 |
|
Purchases under the employee stock purchase plan | 543,731 |
|
| Issuance of stock-based awards under the Equity Plans | 2,753,8291,751,234 |
|
| Purchases under the officer and director share purchase plan | 88,741 |
|
Total reserved | 5,455,870 |
|
| |
NOTE 15.Total reserved | Geographical Information5,598,698 | |
We evaluate our reportable segment pursuant to ASC 280,
NOTE 13. Segment Reporting. The Company's Chief Executive Officerand Revenue Information
Reportable Segments
Reported below are the Company’s segments for which separate financial information is available and upon which operating results are evaluated by the chief operating decision maker, the Chief Executive Officer, to assess performance and he assessesto allocate resources. We do not allocate sales and marketing or general and administrative expenses, or interest expense and interest income to our segments, because management does not include the information in its measurement of the performance of the operating segments. Also, a measure of segment assets and allocates resourcesliabilities has not been provided to the segment basedCompany's chief operating decision maker and therefore is not shown below.
Information on its business prospects, competitive factors, net revenue,reportable segments utilized by the chief operating results,decision maker is as follows:
| | | | | | | | | | | | | | | | | |
| (in thousands) | For the Fiscal Year Ended September 30, |
| 2021 | | 2020 | | 2019 |
| Revenue | | | | | |
| Aerospace and Defense | $ | 50,838 | | | $ | 55,240 | | | $ | 33,086 | |
| Broadband | 107,606 | | | 54,888 | | | 54,179 | |
| Total revenue | $ | 158,444 | | | $ | 110,128 | | | $ | 87,265 | |
| Segment income (loss) | | | | | |
| Aerospace and Defense gross profit | $ | 13,705 | | | $ | 16,729 | | | $ | 9,207 | |
| Aerospace and Defense research and development expense | 14,616 | | | 17,469 | | | 10,448 | |
| Aerospace and Defense segment loss | $ | (911) | | | $ | (740) | | | $ | (1,241) | |
| Broadband gross profit | $ | 47,783 | | | $ | 18,853 | | | $ | 5,882 | |
| Broadband research and development expense | 2,832 | | | 2,800 | | | 8,995 | |
| Broadband segment income (loss) | $ | 44,951 | | | $ | 16,053 | | | $ | (3,113) | |
| Consolidated segment income (loss) | $ | 44,040 | | | $ | 15,313 | | | $ | (4,354) | |
| Unallocated operating expense | | | | | |
| Selling, general, and administrative | $ | 24,544 | | | $ | 24,631 | | | $ | 32,080 | |
| Loss (gain) on sale of assets | 515 | | | (2,284) | | | (302) | |
| Total unallocated operating expense | $ | 25,059 | | | $ | 22,347 | | | $ | 31,778 | |
| Operating income (loss) | $ | 18,981 | | | $ | (7,034) | | | $ | (36,132) | |
Product Categories
Revenue is also classified by major product category and other non-U.S. GAAP financial ratios. Based on this evaluation, the Company operates as a single reportable segment, Fiber Optics.is presented below:
| | | | | | | | | | | | | | | | | |
| For the Fiscal Year Ended September 30, |
| (in thousands) | 2021 | | 2020 | | 2019 |
| Aerospace and Defense | | | | | |
| Navigation and Inertial Sensing | $ | 36,539 | | | $ | 38,983 | | | $ | 23,203 | |
| Defense Optoelectronics | 14,299 | | | 16,257 | | | 9,883 | |
| Broadband | | | | | |
| CATV Lasers and Transmitters | 95,255 | | | 44,457 | | | 41,150 | |
| Chip Devices | 3,106 | | | 4,873 | | | 10,828 | |
| Other Optical Products | 9,245 | | | 5,558 | | | 2,201 | |
| Total revenue | $ | 158,444 | | | $ | 110,128 | | | $ | 87,265 | |
Geographical Concentration
The following tables settable sets forth revenue by geographic region with revenue assigned to geographic regionsarea based on our customers’ billing address.address:
| | | | | | | | | | | | | | | | | |
| For the Fiscal Year Ended September 30, |
| (in thousands) | 2021 | | 2020 | | 2019 |
| United States and Canada | $ | 139,443 | | | $ | 91,205 | | | $ | 68,607 | |
| Asia | 11,836 | | | 9,397 | | | 11,637 | |
| Europe | 4,802 | | | 5,559 | | | 6,209 | |
| Other | 2,363 | | | 3,967 | | | 812 | |
| Total revenue | $ | 158,444 | | | $ | 110,128 | | | $ | 87,265 | |
|
| | | | | | | | | | | | |
| Revenue by Geographic Region | | For the Fiscal Years ended September 30, |
| (in thousands) | | 2019 | | 2018 | | 2017 |
| United States and Canada | | $ | 68,607 |
| | $ | 69,543 |
| | $ | 98,520 |
|
| Asia | | 11,637 |
| | 10,386 |
| | 16,713 |
|
| Europe | | 6,209 |
| | 5,422 |
| | 7,015 |
|
| Other | | 812 |
| | 266 |
| | 647 |
|
| Total revenue | | $ | 87,265 |
| | $ | 85,617 |
| | $ | 122,895 |
|
Significant Customers:
Significant customers are defined as customers representing greater than 10% of our consolidated revenue. Revenue from three, twothree and three of our significant customers represented an aggregate of 55%70%, 60%57% and 71%55% of our consolidated revenue for the fiscal years ended September 30, 2021, 2020 and 2019, 2018respectively. The percentage from significant customers increased driven by higher Broadband revenue.
Significant portions of the Company’s sales are concentrated among a limited number of customers. The duration, severity, and 2017, respectively.future impact of the COVID-19 pandemic are highly uncertain and could result in significant disruptions to the business operations of the Company’s customers. If one or more of these significant customers significantly decreases their orders for the Company’s products, or if we are unable to deliver finished products to the customer in connection with such orders, the Company’s business could be materially and adversely affected.
Long-lived Assets: Long-lived assets consist of land, building and property, plant, and equipment. As of September 30, 2019 and September 30, 2018, approximately 85% and 49%, respectively, of our long-lived assets were located in the United States. The remaining long-lived assets are primarily located in China.
NOTE 16. 14. Subsequent EventEvents
As part of the effort to streamline operations and move to a variable cost model in our Cable TV Lasers and Transmitters product line, on October 25, 2019,On November 1, 2021, we entered into an Asset Purchase AgreementAmendment to Lease (the “Purchase Agreement”“New Alhambra Lease Amendment”) with Hytera Communications (Hong Kong)to that certain Standard Industrial/Commercial Single-Tenant Lease – Net, dated as of October 1, 2017, by and between the Company Limited, a limited liability company incorporated in Hong Kong (“Hytera HK”and CHESTNUT2015 LLC (the “Alhambra Lease”), and Shenzhen Hytera Communications Co., Ltd., a corporation formed underas previously amended by that certain Amendment to Lease, dated as of March 31, 2019 (the “Original Alhambra Lease Amendment”). Pursuant to the lawsterms of the P.R.C. (“Shenzhen Hytera”, and together with Hytera HK, the “Buyers”), pursuant to which the BuyersNew Alhambra Lease Amendment, we agreed to purchase from us certain CATV module and transmitter manufacturing equipment (the “Equipment”) owned by us and currently located atextend the manufacturing facility of our wholly-owned subsidiary, EMCORE Optoelectronics (Beijing) Co, Ltd., a corporation formed under the lawsterm of the P.R.C.,lease for an aggregate purchase priceour corporate headquarters, manufacturing and research and development facilities located in Alhambra, California (the “Leased Facilities”) through September 30, 2031, with a five-year Company option to extend beyond such expiration date. Under the terms of approximately $5.54 million.
The Equipmentthe New Alhambra Lease Amendment, base rent for the Leased Facilities will remain unchanged from the rates of $51,500 per month during the fiscal year ending September 30, 2022 and $53,500 per month during the fiscal year ending September 30, 2023, in each case as previously agreed in the Original Alhambra Lease Amendment, and we continue to be responsible for certain other monthly expenses related to the Leased Facilities, including taxes and utilities. Base rent for the fiscal year ending September 30, 2024 will be transferredbased on a mutually determined fair market value, subject to the Buyersappraisal process set forth in three separate closings,New Alhambra Lease Amendment, which are expected to occuramount shall be at least 2% greater than the monthly rent paid during the quartersfiscal year ending December 31, 2019September 30, 2023. Monthly base rent for the fiscal year ending September 30, 2025 and March 31, 2020, with payment for each portionfiscal year thereafter during the term of the equipment to be made following such transferlease shall increase from the monthly rent payable in the immediately preceding fiscal year in an amount equal to (i) 80%the percentage increase, from the immediately preceding fiscal year, in the most recently published Consumer Price Index for All Urban Consumers, Los Angeles-Long Beach-Anaheim area, published by the Bureau of Labor Statistics of the applicable sale price within three months following the closingU.S. Department of the applicable sale and transfer and (ii) 20%Labor.
Concurrently with entry into the Purchase Agreement, we entered into a Contract Manufacturing Agreement (the “Manufacturing Agreement”), dated as of October 25, 2019, with the Buyers pursuant to which the Buyers agreed to manufacture certain CATV module and transmitter products for us from a manufacturing facility located in Thailand for an initial five year term at product prices agreed to between the parties. In the Manufacturing Agreement, we agreed to pay certain shortfall penalties in the event that orders for manufactured products are below certain thresholds, which penalties shall not exceed $660,000 in any of the first of four specified 12 months periods, and which will not exceed approximately $5.54 million in the aggregate following the fifth such 12 month period.
| |
NOTE 17. | Selected Quarterly Financial Information (unaudited) |
The following tables present our unaudited consolidated results of operations for the eight most recently ended quarters. We believe that all necessary adjustments, consisting only of normal recurring adjustments, have been included in the amounts below to present fairly the selected quarterly information when read in conjunction with the consolidated financial statements and notes included elsewhere in this Annual Report. Our results from operations vary substantially from quarter to quarter. Accordingly, the operating results for a quarter are not necessarily indicative of results for any subsequent quarter or for the full year. We have experienced and expect to continue to experience significant fluctuations in quarterly results.
EMCORE CORPORATION
Quarterly Consolidated Statements of Operations
For the Fiscal Year ended September 30, 2019
(in thousands, except income per share)
|
| | | | | | | | | | | | | | | |
| | For the Three Months ended |
| | December 31, | | March 31, | | June 30, | | September 30, |
| | 2018 | | 2019 | | 2019 | | 2019 |
| Revenue | $ | 24,001 |
| | $ | 21,745 |
| | $ | 17,219 |
| | $ | 24,300 |
|
| Cost of revenue | 18,193 |
| | 15,936 |
| | 13,515 |
| | 24,532 |
|
| Gross profit | 5,808 |
| | 5,809 |
| | 3,704 |
| | (232 | ) |
| Operating expense (income): | | | | | | | |
| Selling, general, and administrative | 7,593 |
| | 6,996 |
| | 9,288 |
| | 8,217 |
|
| Research and development | 4,019 |
| | 4,360 |
| | 4,629 |
| | 6,435 |
|
Gain from change in estimate on ARO obligation
| — |
| | (40 | ) | | — |
| | 26 |
|
| Gain on sale of assets | — |
| | — |
| | — |
| | (302 | ) |
| Total operating expense | 11,612 |
| | 11,316 |
| | 13,917 |
| | 14,376 |
|
| Operating loss | (5,804 | ) | | (5,507 | ) | | (10,213 | ) | | (14,608 | ) |
| Other income (expense): | | | | | | | |
| Interest income, net | 267 |
| | 224 |
| | 99 |
| | 39 |
|
| Foreign exchange gain (loss) | 14 |
| | 304 |
| | (349 | ) | | (396 | ) |
| Other income | — |
| | — |
| | — |
| | — |
|
| Total other income (expense) | 281 |
| | 528 |
| | (250 | ) | | (357 | ) |
| Loss from operations before income tax expense | (5,523 | ) | | (4,979 | ) | | (10,463 | ) | | (14,965 | ) |
| Income tax expense | (15 | ) | | (15 | ) | | (14 | ) | | (10 | ) |
| Net loss | $ | (5,538 | ) | | $ | (4,994 | ) | | $ | (10,477 | ) | | $ | (14,975 | ) |
| Per share data: | | | | | | | |
| Net loss per basic and diluted share | $ | (0.20 | ) | | $ | (0.18 | ) | | $ | (0.37 | ) | | $ | (0.52 | ) |
| Weighted-average number of basic and diluted shares outstanding | 27,534 |
| | 27,652 |
| | 28,005 |
| | 28,734 |
|
EMCORE CORPORATION
Quarterly Consolidated Statements of Operations
For the Fiscal Year ended September 30, 2018
(in thousands, except income per share)
|
| | | | | | | | | | | | | | | |
| | For the Three Months ended |
| | December 31, | | March 31, | | June 30, | | September 30, |
| | 2017 | | 2018 | | 2018 | | 2018 |
| Revenue | $ | 24,036 |
| | $ | 18,623 |
| | $ | 17,717 |
| | $ | 25,241 |
|
| Cost of revenue | 16,122 |
| | 13,676 |
| | 16,519 |
| | 20,813 |
|
| Gross profit | 7,914 |
| | 4,947 |
| | 1,198 |
| | 4,428 |
|
| Operating expense (income): | | | | | | | |
| Selling, general, and administrative | 4,819 |
| | 5,644 |
| | 5,237 |
| | 5,532 |
|
| Research and development | 3,800 |
| | 3,300 |
| | 3,915 |
| | 4,372 |
|
Loss from change in estimate on ARO obligation
| — |
| | — |
| | — |
| | 145 |
|
| Loss (gain) on sale of assets | 107 |
| | (68 | ) | | — |
| | (5 | ) |
| Total operating expense | 8,726 |
| | 8,876 |
| | 9,152 |
| | 10,044 |
|
| Operating loss | (812 | ) | | (3,929 | ) | | (7,954 | ) | | (5,616 | ) |
| Other income (expense): | | | | | | | |
| Interest income, net | 111 |
| | 163 |
| | 216 |
| | 243 |
|
| Foreign exchange gain (loss) | 286 |
| | 526 |
| | (676 | ) | | (570 | ) |
| Other income | — |
| | — |
| | — |
| | 110 |
|
| Total other income (expense) | 397 |
| | 689 |
| | (460 | ) | | (217 | ) |
| Loss from operations before income tax benefit (expense) | (415 | ) | | (3,240 | ) | | (8,414 | ) | | (5,833 | ) |
| Income tax benefit (expense) | 333 |
| | 169 |
| | — |
| | (53 | ) |
| Net loss | $ | (82 | ) | | $ | (3,071 | ) | | $ | (8,414 | ) | | $ | (5,886 | ) |
| Per share data: | | | | | | | |
| Net loss per basic and diluted share | $ | (0.00 | ) | | $ | (0.11 | ) | | $ | (0.31 | ) | | $ | (0.21 | ) |
| Weighted-average number of basic and diluted shares outstanding | 27,032 |
| | 27,197 |
| | 27,387 |
| | 27,424 |
|
Report of Independent Registered Public Accounting Firm
To the Shareholders and Board of Directors
EMCORE Corporation:
OpinionOpinions on the Consolidated Financial Statements and Internal Control Over Financial Reporting
We have audited the accompanying consolidated balance sheets of EMCORE Corporation and subsidiaries (the Company) as of September 30, 20192021 and 2018,2020, the related consolidated statements of operations and comprehensive (loss) income shareholders'(loss), shareholders’ equity, and cash flows for each of the years in the three–yearthree-year period ended September 30, 2019,2021, and the related notes (collectively, the consolidated financial statements). We also have audited the Company’s internal control over financial reporting as of September 30, 2021, based on criteria established in Internal Control – Integrated Framework(2013) issued by the Committee of Sponsoring Organizations of the Treadway Commission.
In ouropinion, the consolidated financial statements referred to above present fairly, in all material respects, the financial position of the Company as of September 30, 20192021 and 2018,2020, and the results of theirits operations and theirits cash flows for each of the years in the three–yearthree-year period ended September 30, 2019,2021, in conformity with U.S. generally accepted accounting principles.
We also have audited, Also in accordance withour opinion, the standards of the Public Company Accounting Oversight Board (United States) (PCAOB), the Company'smaintained, in all material respects, effective internal control over financial reporting as of September 30, 2019,2021 based on criteria established in Internal Control -– Integrated Framework (2013) issued by the Committee of Sponsoring Organizations of the Treadway Commission, and our report dated December 10,Commission.
Change in Accounting Principle
As discussed in Note 2 to the consolidated financial statements, the Company changed its method of accounting for leases as of October 1, 2019 expressed an unqualified opinion ondue to the effectivenessadoption of the Company'sFASB's ASC Topic 842, Leases.
Basis for Opinions
The Company’s management is responsible for these consolidated financial statements, for maintaining effective internal control over financial reporting.
Basisreporting, and for Opinion
These consolidated financial statements are the responsibilityits assessment of the Company’s management.effectiveness of internal control over financial reporting, included in the accompanying Management’s Annual Report on Internal Control over Financial Reporting. Our responsibility is to express an opinion on thesethe Company’s consolidated financial statements and an opinion on the Company’s internal control over financial reporting based on our audits. We are a public accounting firm registered with the PCAOBPublic Company Accounting Oversight Board (United States) (PCAOB) and are required to be independent with respect to the Company in accordance with the U.S. federal securities laws and the applicable rules and regulations of the Securities and Exchange Commission and the PCAOB.
We conducted our audits in accordance with the standards of the PCAOB. Those standards require that we plan and perform the auditaudits to obtain reasonable assurance about whether the consolidated financial statements are free of material misstatement, whether due to error or fraud. fraud, and whether effective internal control over financial reporting was maintained in all material respects.
Our audits of the consolidated financial statements included performing procedures to assess the risks of material misstatement of the consolidated financial statements, whether due to error or fraud, and performing procedures that respond to those risks. Such procedures included examining, on a test basis, evidence regarding the amounts and disclosures in the consolidated financial statements. Our audits also included evaluating the accounting principles used and significant estimates made by management, as well as evaluating the overall presentation of the consolidated financial statements. Our audit of internal control over financial reporting included obtaining an understanding of internal control over financial reporting, assessing the risk that a material weakness exists, and testing and evaluating the design and operating effectiveness of internal control based on the assessed risk. Our audits also included performing such other procedures as we considered necessary in the circumstances. We believe that our audits provide a reasonable basis for our opinion.opinions.
Definition and Limitations of Internal Control Over Financial Reporting
A company’s internal control over financial reporting is a process designed to provide reasonable assurance regarding the reliability of financial reporting and the preparation of financial statements for external purposes in accordance with generally accepted accounting principles. A company’s internal control over financial reporting includes those policies and procedures that (1) pertain to the maintenance of records that, in reasonable detail, accurately and fairly reflect the transactions and
dispositions of the assets of the company; (2) provide reasonable assurance that transactions are recorded as necessary to permit preparation of financial statements in accordance with generally accepted accounting principles, and that receipts and expenditures of the company are being made only in accordance with authorizations of management and directors of the company; and (3) provide reasonable assurance regarding prevention or timely detection of unauthorized acquisition, use, or disposition of the company’s assets that could have a material effect on the financial statements.
Because of its inherent limitations, internal control over financial reporting may not prevent or detect misstatements. Also, projections of any evaluation of effectiveness to future periods are subject to the risk that controls may become inadequate because of changes in conditions, or that the degree of compliance with the policies or procedures may deteriorate.
Critical Audit Matter
The critical audit matter communicated below is a matter arising from the current period audit of the consolidated financial statements that was communicated or required to be communicated to the audit committee and that: (1) relates to accounts or disclosures that are material to the consolidated financial statements and (2) involved our especially challenging, subjective, or complex judgments. The communication of a critical audit matter does not alter in any way our opinion on the consolidated financial statements, taken as a whole, and we are not, by communicating the critical audit matter below, providing a separate opinion on the critical audit matter or on the accounts or disclosures to which it relates.
Net realizable value of inventory
As discussed in Note 2 and Note 6 to the consolidated financial statements, the Company has inventory of $32.3 million as of September 30, 2021, which is stated at the lower of cost or net realizable value. The Company writes-down inventory once it has been determined that conditions exist that may not allow the inventory to be sold for its intended purpose or the inventory is determined to be excess or obsolete. The determination of the excess and obsolete inventory requires management to make assumptions related to estimates of future inventory demand and market conditions.
We identified the evaluation of net realizable value of inventory as a critical audit matter. Subjective auditor judgment was required to evaluate future inventory demand and market conditions, including whether past consumption and recent purchases used in the Company’s model were indicative of future inventory demand.
The following are the primary procedures we performed to address this critical audit matter. We evaluated the design and tested the operating effectiveness of certain internal controls related to the inventory process, including controls over the assumptions described above. We evaluated historical write down trends, historical sales of older inventory, and relevant changes in the overall business environment, including changes in key customers, product lines, and competitors, in order to assess the Company’s model. For a sample of products within inventory, we compared the Company’s determination of past consumption and recent purchases used to estimate future inventory demand of the product to supporting documentation.
/s/ KPMG LLP
We have served as the Company'sCompany’s auditor since 2010.
Irvine, California
December 10, 20193, 2021
ITEM 9.Changes in and Disagreements with Accountants on Accounting and Financial Disclosure
None.Not applicable.
ITEM 9A.Controls and Procedures
On June 7, 2019, we completed the acquisition of SDI. The acquired business constituted approximately 25% of the total assets and 11% of the total revenue included in the consolidated financial statements of the Company as of and for the year ended September 30, 2019. We are in the process of evaluating the existing controls and procedures of the acquired business and integrating the acquired business into our system of internal control over financial reporting. In accordance with SEC staff guidance permitting a company to exclude an acquired business from management’s assessment of the effectiveness of internal control over financial reporting for the year in which the acquisition is completed, we have excluded the below assessment of our disclosure controls and procedures the disclosure controls and procedures of the acquired business that are subsumed by internal control over financial reporting and we have excluded the acquired business from our assessment of the effectiveness of our internal control over financial reporting as of September 30, 2019.
a. Evaluation of Disclosure Controls and Procedures
Our management,a.Evaluation of Disclosure Control and Procedures
Management, with the participation of its Chief Executive Officer (Principal Executive Officer) and Chief Financial Officer (Principal Financial Officer and Accounting Officer), evaluated the effectiveness of the Company'sCompany’s disclosure controls and procedures (as defined in Rules 13a-15(e) and 15d-15(e) promulgated under the Securities Exchange Act of 1934, as amended) (the “Exchange Act”))Act) as of the end of the period covered by this Annual Report on Form 10-K. Based upon this evaluation, ourthe Chief Executive Officer and ourthe Chief Financial Officer concluded that our disclosure controls and procedures were effective as of the end of the period covered by this report.
b. Management'sManagement’s Annual Report on Internal ControlsControl over Financial Reporting
Our management
Management is responsible for establishing and maintaining adequate internal control over financial reporting, as such is defined in Rules 13a-15(f) and 15d-15(f) promulgated under the Exchange Act. Under the supervision of ourthe Chief Executive Officer and Chief Financial Officer and with the participation of our management, we conducted an evaluation of the effectiveness of our internal control over financial reporting as of September 30, 20192021 based on the framework in Internal Control - Integrated Framework (2013)issued by the Committee of Sponsoring Organizations of the Treadway Commission (“COSO”).Commission. Based on that evaluation, our management concluded that our internal control over financial reporting was effective as of September 30, 2019.2021.
As indicated above, the evaluation ofThe Company’s independent registered public accounting firm has issued an audit report on the effectiveness of ourthe Company’s internal control over financial reporting as of September 30, 2019 excluded the business of SDI that we acquired in June 2019. SDI accounted for approximately 25% of the total assets and 11% of the total revenue included in the consolidated financial statements of the Company as of and for the year ended September 30, 2019.stated within their report which appears herein.
We acquired SDI on June 7, 2019. Management excluded from its evaluation of the effectiveness of our internal control over financial reporting as of September 30, 2019 the acquired entity’s internal control over financial reporting associated with 25% of total assets and 11% of total revenue included in our consolidated financial statements as of and for the year ended September 30, 2019.
c.Changes in Internal Control over Financial Reporting
There were no changes in the Company'sCompany’s internal control over financial reporting (as defined in Rule 13a-15(f) and 15d-15(f) promulgated under the Exchange Act) during the quarter ended September 30, 20192021 that have materially affected, or are reasonably likely to materially affect, the Company'sCompany’s internal control over financial reporting. Due to the ongoing COVID-19 pandemic, a significant number of employees are now working from home. The design of processes, systems, and controls allows for remote execution with accessibility to secure data.
d.Limitations on Effectiveness of Controls and Procedures
Our management,Management, including ourthe Chief Executive Officer and Chief Financial Officer, does not expect that our disclosure controls or our internal controls over financial reporting will prevent or detect all errors and all fraud. A control system, no matter how well designed and operated, can provide only reasonable, not absolute, assurance that the control system'ssystem’s objectives will be met. Further, the design of a control system must reflect the fact that there are resource constraints and the benefits of controls must be considered relative to their costs. Because of the inherent limitations in all control systems, no evaluation of controls can provide absolute assurance that all control issues and
instances of fraud, if any, within the Company have been detected. These inherent limitations include the realities that judgments in decision-making can be faulty, and that breakdowns can occur because of simple error or mistake. Controls can also be circumvented by individual acts, by collusion of two or more people, or by management override of the controls. The design of any system of controls is based, in part, upon certain assumptions about the likelihood of future events, and there can be no assurance that any design will succeed in achieving its stated goals under all potential future conditions. Over time, controls may become inadequate because of changes in conditions or deterioration in the degree of compliance with associated policies or procedures. Because of the inherent limitations in a cost-effective control system, misstatements due to error or fraud may occur and not be detected.
The effectiveness of our internal control over financial reporting as of September 30, 2019 has been audited by KPMG LLP, our independent registered public accounting firm, as stated in their report which is included as follows.
ITEM 9B.Other Information
Not Applicable.applicable.
ReportTable of Independent Registered Public Accounting FirmContents
To the Shareholders and Board of Directors
EMCORE Corporation:
Opinion on Internal Control Over Financial Reporting
We have audited EMCORE Corporation and subsidiaries’ (the Company) internal control over financial reporting as of September 30, 2019, based on criteria established in Internal Control - Integrated Framework (2013) issued by the Committee of Sponsoring Organizations of the Treadway Commission. In our opinion, the Company maintained, in all material respects, effective internal control over financial reporting as of September 30, 2019, based on criteria established in Internal Control - Integrated Framework (2013) issued by the Committee of Sponsoring Organizations of the Treadway Commission.
The Company acquired Systron Donner Inertial, Inc. (SDI) during 2019, and management excluded from its assessment of the effectiveness of the Company’s internal control over financial reporting as of September 30, 2019, SDI’s internal control over financial reporting associated with 25% of total assets and 11% of total revenue included in the consolidated financial statements of the Company as of and for the year ended September 30, 2019. Our audit of internal control over financial reporting of the Company also excluded an evaluation of the internal control over financial reporting of SDI.
We also have audited, in accordance with the standards of the Public Company Accounting Oversight Board (United States) (PCAOB), the consolidated balance sheets of the Company as of September 30, 2019 and 2018, the related consolidated statements of operations and comprehensive (loss) income, shareholders’ equity, and cash flows for each of the years in the three-year period ended September 30, 2019, and the related notes (collectively, the consolidated financial statements), and our report dated December 10, 2019 expressed an unqualified opinion on those consolidated financial statements.
Basis for Opinion
The Company’s management is responsible for maintaining effective internal control over financial reporting and for its assessment of the effectiveness of internal control over financial reporting, included in the accompanying Management’s Annual Report on Internal Control over Financial Reporting. Our responsibility is to express an opinion on the Company’s internal control over financial reporting based on our audit. We are a public accounting firm registered with the PCAOB and are required to be independent with respect to the Company in accordance with the U.S. federal securities laws and the applicable rules and regulations of the Securities and Exchange Commission and the PCAOB.
We conducted our audit in accordance with the standards of the PCAOB. Those standards require that we plan and perform the audit to obtain reasonable assurance about whether effective internal control over financial reporting was maintained in all material respects. Our audit of internal control over financial reporting included obtaining an understanding of internal control over financial reporting, assessing the risk that a material weakness exists, and testing and evaluating the design and operating effectiveness of internal control based on the assessed risk. Our audit also included performing such other procedures as we considered necessary in the circumstances. We believe that our audit provides a reasonable basis for our opinion.
Definition and Limitations of Internal Control Over Financial Reporting
A company’s internal control over financial reporting is a process designed to provide reasonable assurance regarding the reliability of financial reporting and the preparation of financial statements for external purposes in accordance with generally accepted accounting principles. A company’s internal control over financial reporting includes those policies and procedures that (1) pertain to the maintenance of records that, in reasonable detail, accurately and fairly reflect the transactions and dispositions of the assets of the company; (2) provide reasonable assurance that transactions are recorded as necessary to permit preparation of financial statements in accordance with generally accepted accounting principles, and that receipts and expenditures of the company are being made only in accordance with authorizations of management and directors of the company; and (3) provide reasonable assurance regarding prevention or timely detection of unauthorized acquisition, use, or disposition of the company’s assets that could have a material effect on the financial statements.
Because of its inherent limitations, internal control over financial reporting may not prevent or detect misstatements. Also, projections of any evaluation of effectiveness to future periods are subject to the risk that controls may become inadequate because of changes in conditions, or that the degree of compliance with the policies or procedures may deteriorate.
/s/ KPMG LLP
Irvine, California
December 10, 2019
PART III.
ITEM 10. Directors, Executive Officers, and Corporate Governance
Information regarding our executive officers and directors required by this Item is incorporated by reference to the section entitled “Proposal I: Election of Directors - Directors and Executive Officers” that will be included in ourthe Definitive Proxy Statement in connection with ourthe Annual Meeting of Stockholders (Proxy Statement)(the “Proxy Statement”), which will be filed with the SEC within 120 days after the fiscal year ended September 30, 2019. Information required by Item 405 of Regulation S-K is incorporated by reference to the section entitled “Ownership of Securities - Section 16(a) Beneficial Ownership Reporting Compliance” in the Proxy Statement referenced above.2021. Information required by Items 407(c)(3), (d)(4), and (d)(5) of Regulation S-K is incorporated by reference to the Section entitled “Proposal 1: Election of Directors - Governanceinformation under the caption “Governance of the Company - Board Committees” in the Proxy Statement.
We have adopted a code of ethics entitled the “EMCORE Corporation Code of Business Conduct and Ethics,” which is applicable to all employees, officers, and directors of the Company. The full text of ourthe Code of Business Conduct and Ethics is included with the Corporate Governance information available on our website (www.emcore.com). We intend to disclose any changes in or waivers from ourthe code of ethics for our directors and executive officers to the extent disclosure is required by the applicable rules of the SEC and Nasdaq Stock Market LLC by posting such information on our website or by filing a Current Report on Form 8-K.
ITEM 11.Executive Compensation
Information required by this Item is incorporated by reference to the sections entitled “Proposal I: Election of Directors - Directorinformation under the captions “Director Compensation for Fiscal Year 2019,2021,” “Compensation Discussion and Analysis,” “Executive Compensation,” “Executive Compensation - Compensation“Compensation Committee Report”, and “Executive Compensation - Compensation“Compensation Committee Interlocks and Insider Participation” in the Proxy Statement.
ITEM 12. Security Ownership of Certain Beneficial Owners and Management and Related Stockholder Matters
Information regarding security ownership of certain beneficial owners and management is incorporated by reference to the section entitledinformation under the caption “Ownership of Securities - Security Ownership of Certain Beneficial Owners and Management” in the Proxy Statement.
Information regarding our equity compensation plans is incorporated by reference to the section entitledinformation under caption “Ownership of Securities - Equity Compensation Plan Information” in the Proxy Statement.
ITEM 13. Certain Relationships, Related Transactions, and Director Independence
Information required by this Item is incorporated by reference to information under the sectionscaptions entitled “Proposal I: Election of Directors - Governance“Governance of the Company - Related Person Transaction Approval Policy” and “Proposal I -: Election of Directors - Governance“Governance of the Company - Director Independence” in the Proxy Statement.
ITEM 14. Principal Accounting Fees and Services
Information required by this Item is incorporated by reference to the section entitled “Proposal II: Ratificationinformation under the caption “Ratification of the Appointment of Independent Registered Public Accounting Firm - Fiscal Years 2019 & 2018 Auditor Fees and Services”Firm” in the Proxy Statement.
PartPART IV.
| |
(a)(1) | Financial Statements |
(a)(1) Financial Statements
| |
(a)(2) | Financial Statement Schedules |
(a)(2) Financial Statement Schedules
The applicable financial statement schedules required under this Item 15(a)(2) are presented in ourthe consolidated financial statements and notes thereto under Part II, Item 8 of this Annual Report on Form 10-K.
(a)(3) Exhibits
See Item 15(b) below. Each management contract or compensatory plan or arrangement required to be filed has been identified.
(b) Exhibits
|
| | | | |
| 2.1 | Purchase and Sale Agreement, dated as of June 7, 2019 by and among EMCORE Corporation, The Resilience Fund IV, L.P., The Resilience Fund IV-A, L.P., Aerospace Newco Holdings, Inc. and Ember Acquisition Sub, Inc. (incorporated by reference to Exhibit 2.1 to the Company’s Current Report on Form 8-K filed on June 10, 2019).
|
| 2.2 |
|
3.12.3 | |
| 2.4 | |
| 2.5 | |
| 3(i).1 |
|
3.23(i).2 |
|
3.33(i).3 | |
3.43(i).4 | Certificate of Designation Establishing the Series A Junior Participating Preferred Stock and Fixing the Powers, Designations, Preferences and Relative, Participating, Optional and Other Special Rights, and the Qualifications, Limitations and Restrictions, of the Series A Junior Participating Preferred Stock, dated September 18, 2014 (incorporated by reference to Exhibit 3.1 to the Company'sCompany’s Current Report on Form 8-K filed on September 18, 2014). |
| | | | | |
3.53(i).5 | |
3.63(i).6 | |
4.13(ii).7 | |
| 4.1 |
|
4.2**
| |
| 10.1 |
|
| 10.2† |
|
| 10.3† |
|
| 10.4† |
|
| 10.5† |
|
|
| |
10.6† |
|
10.7†10.6† |
|
10.8†10.7† |
|
10.9†10.8† |
|
10.10†10.9† |
|
10.11†10.10† |
|
10.12†10.11† |
|
10.13†10.12† |
|
10.14†10.13† |
|
10.15†10.14† |
|
10.16†
10.15†** | |
10.17†
|
|
10.18†
10.16† |
|
10.19†
10.17† | |
| | | | | |
10.20
10.18† |
|
10.21†
10.19† | |
| 10.20† |
|
10.22
10.21 |
|
21.1**10.22 | Termination Agreement, dated as of August 9, 2021, by and among EMCORE Corporation, EMCORE Optoelectronics (Beijing) Co., Ltd., Shenzhen Fastrain Technology Co., Ltd. and Hong Kong Fastrain Company Limited, Hytera Communications (Hong Kong) Company Limited and Shenzhen Hytera Communications Co., Ltd. (incorporated by reference to Exhibit 10.1 to the Company’s Current Report on Form 8-K filed on August 11, 2021). |
| 10.23 | |
| 10.24† | |
| 10.25 | |
| 10.26 | |
| 10.27 | |
| 10.28 | |
| 10.29 | |
| 10.30 | |
| 10.31 | |
| 10.32 | |
| 10.33 | |
| 10.34 | |
| 10.35 | |
| | | | | |
| 10.36 | |
| 10.37 | |
| 10.38** | |
| 10.39** | |
| 10.40** | |
| 10.41** | |
| 10.42** | |
| 10.43** | |
| 10.44** | |
| 21.1** | |
| 23.1** | |
| 24.1 | Power of Attorney (see the signature page of this Annual Report on Form 10-K). |
| 31.1** | |
| 31.2** | |
| 32.1*** | |
| 32.2*** | |
|
| 101.INS** | |
101.INS** | Inline XBRL Instance Document. |
| 101.SCH** | Inline XBRL Taxonomy Extension Schema Document. |
| 101.CAL** | Inline XBRL Taxonomy Extension Calculation Linkbase Document. |
| 101.LAB** | Inline XBRL Taxonomy Extension Label Linkbase Document. |
| 101.PRE** | Inline XBRL Taxonomy Extension Presentation Linkbase Document. |
| 101.DEF** | Inline XBRL Taxonomy Extension Definition Linkbase Document. |
| 104 | Cover Page Interactive Data File - formatted in Inline XBRL and contained in Exhibit 101. |
| |
| |
_________
† Management contract or compensatory plan
** Filed herewith
*** Furnished herewith
ITEM 16. Form 10-K Summary
None.Not applicable.
SIGNATURES
Pursuant to the requirements of the Securities Exchange Act of 1934, the registrant has duly caused this report to be signed on its behalf by the undersigned thereunto duly authorized.
| | | | | | | | | | | | | | |
| | | EMCORE CORPORATION |
| | EMCORE CORPORATION | | |
| Date: | December 3, 2021 | |
Date:By: | December 10, 2019 | By: | /s/ Jeffrey Rittichier |
| | | | Jeffrey Rittichier |
| | | | Chief Executive Officer
(Principal Executive Officer)
|
| | | | |
| Date: | December 3, 2021 | |
Date:By: | December 10, 2019 | By: | /s/ Tom Minichiello |
| | | | Tom Minichiello |
| | | | Chief Financial Officer
(Principal Financial and Accounting Officer)
|
Each person whose signature appears below constitutes and appoints and hereby authorizes Jeffrey Rittichier such person'sperson’s true and lawful attorney-in-fact, with full power of substitution or resubstitution, for such person and in his name, place and stead, in any and all capacities, to sign on such person'sperson’s behalf, individually and in each capacity stated below, any and all amendments to this Form 10-K, and to file the same, with all exhibits thereto, and other documents in connection therewith, with the Securities and Exchange Commission granting unto said attorney-in-fact, full power and authority to do and perform each and every act and thing requisite or necessary to be done in and about the premises, as fully to all intents and purposes as such person might or could do in person, hereby ratifying and confirming all that said attorneys-in-fact, or their substitute or substitutes, may lawfully do or cause to be done by virtue hereof.
Pursuant to the requirements of the Securities Exchange Act of 1934, this report has been signed below by the following persons on behalf of the Registrant in the capacities indicated, on December 10, 2019.
| | | | | | | | | | | |
| Signature | | Title |
| | | |
| /s/ Jeffrey Rittichier | | Chief Executive Officer and Director |
| Jeffrey Rittichier | | (Principal Executive Officer) |
| | | |
| /s/ Tom Minichiello | | Chief Financial Officer |
| Tom Minichiello | | (Principal Financial and Accounting Officer) |
| | | |
| /s/ Stephen L. Domenik | | Chairman of the Board |
| Stephen L. Domenik | | |
| | |
| Signature | Title |
| | |
| /s/ Jeffrey Rittichier | Chief Executive Officer and Director |
| Jeffrey Rittichier | (Principal Executive Officer) |
| | |
| /s/ Tom Minichiello | Chief Financial Officer |
| Tom Minichiello | (Principal Financial and Accounting Officer) |
| | |
| /s/ Stephen L. Domenik | Director |
| Stephen L. Domenik | |
| | |
| /s/ Gerald J. Fine, Ph.D. | Chairman of the Board |
| Gerald J. Fine, Ph.D. | |
| | |
| /s/ Bruce E. Grooms | | Director |
| Bruce E. Grooms | | |
| | | |
| /s/ Noel Heiks | | Director |
| Noel Heiks | | |
| | | |
| /s/ Rex S. Jackson | | Director |
| Rex S. Jackson | |
| | |